Embed Size (px)
Citation preview
8/16/2019 Final Word 1st Phase
http://slidepdf.com/reader/full/final-word-1st-phase 1/24
1
CONTENTS
Contents page no
List of figures ……………………………………………………………………. 2
List of tables ……………………………………………………………………...3
1. INTRODUCTION ……………………………………………………………..4
2 TYPES OF PILES ……………………………………………………………... 4
3 LITERATURE REVIEW…………………………………………….................5
4 OBJECTIVE …………………………………………………………………… 14
5 ESTIMATION OF LOADS ON THE STRUCTURE………………………….14
5.1 Model of building and various parameters considered
5.2 Seismic Loads as per IS1893
5.2.1 Calculating Base shear
5.3 Seismic Loads as per EN1998
5.3.1 Calculating Base Shear
5.3.2 Distribution of Base Shear
6 SUMMARY AND CONCLUSION…………………………………………….21
7 REFERENCES………………………………………………………………….23
8/16/2019 Final Word 1st Phase
http://slidepdf.com/reader/full/final-word-1st-phase 2/24
2
List of Figures
Fig no Page no
Fig3.1: Plan of the Building showing the Column bearing the maximum Loads ……………....5
Fig: 3.2 Effect of Es on pile Head Response in 2*2 Pile Foundation System…………………..6
Fig: 3.3 Effect of Es on pile Head Response in 3*3 Pile Foundation System………………......6
Fig 3.4. Effects of S/D on Pile Head Response in 2*2 Pile Foundation Systems……………....7
Fig3.5: Effects of S/D on Pile Head Response in 3*3 Pile Foundation Systems ……………....7
Fig3.6 Pile Head Acceleration and Displacement of 2*2 Pile Groups …………………………7
Fig 3.7: Pile Head Acceleration and Displacement of 3*3 Pile Groups ……………………….8
Fig3.8 presents the pile layout commonly used for circular tanks …………………………......8
Fig3.9: Load-Settlement Response of Piled Raft with Various Pile Configurations ………......9
Fig 3.10: Model Test Setup ……………………………………………………………………10
Fig 3.11: Instrumented pile ………………………………………………………………….. ..10
Fig 3.12: Influence of number of piles on load settlement curves of piled raft (t=10mm) ……11
Fig. 3.13. Schematic illustration of the simplified decoupled methodology for estimation
Of pile ultimate resistance ………………………………………………………......12
Fig. 3.14. Comparison of load transfer mechanism ……………………………………………13
Fig5.1 (a): Plan of Building ………………………………………………………………........15
Fig5.1 (b). Elevation in X Direction ……………………………………………………….......16
Fig5.1 (c). Elevation in Y Direction ……………………………………………………….......16
Fig 5.2. Response Spectra for Rock and Soil sites as per IS 1893 for 5% Damping ………….18
Fig5.3 (a) Response Spectrum by IS1893 and EN8 ……………………………………….......20
Fig5.3 (b). Elastic Response Spectra (Type I) for Ground Types A to E for 5% Damping(EN 1998). ……………………………………………………………………….. 19

8/16/2019 Final Word 1st Phase
http://slidepdf.com/reader/full/final-word-1st-phase 3/24
3
List of Tables
Page no.
Table 1: Size of Column and Beams ………………………………………….15
Table: 2 Shear Wave Velocity……………………………………………….20
Table 3: Response Spectrum Acceleration ……………………………………20
8/16/2019 Final Word 1st Phase
http://slidepdf.com/reader/full/final-word-1st-phase 4/24
4
1. INTRODUCTION
Piles are the most commonly adopted deep foundations to support massive superstructures like
multistoried buildings, bridges, towers, dams, etc., when the founding soil is weak and result
bearing capacity and settlement problems. In addition to carrying the vertical compressive loads,
piles must also resist the uplift loads (loads due to wind or hydrostatic pressure) and the dynamiclateral loads which are common in the offshore structures, retaining walls and the structures in the
earthquake prone regions. With increasing infrastructure growth and seismic activities, and the
devastation witnessed, designing pile foundations for seismic conditions is of considerable
importance. Several studies were conducted by various researchers on the seismic analysis and the
design of pile foundations and evolved different theories on the same. Codes of practice available
in different countries suggest some procedures for seismic design of pile foundations. In the design
process, ground condition plays an important role in selecting the design parameters and also to
consider various failure mechanisms. The estimation of the loads that act on a structure during an
earthquake depends on the seismicity of its location (zone) and the subsurface conditions of the
site. Different codes of practice around the world have suggested different methods to estimate theseismic action on a structure. Indian standard (IS 1893: Criteria for Earthquake Resistant Design
of Structures (2002)) and Eurocode (EN 1998: Design of Structures for Earthquake Resistance
(2004)) recommend different ground conditions based on the nature of the engineering hard
stratum in selecting design acceleration level.
2. Types of Piles
Piles can by classified on the basis of following characteristics:
1. Mechanism of Load Transfer
2. Method of Installation
3. Type of Materials
Classification of Piles on the basis of load transfer
A) End/Point Bearing Piles
If a bedrock or rocklike material is present at a site within a reasonable depth, piles can be extended
to the rock surface. In this case, the ultimate bearing capacity of the pile depends entirely on the
underlying material, thus the piles are called end or point bearing piles. In most of these cases the
necessary length of the pile can be fairly well established. Instead of bedrock, if a fairly compact
and hard stratum of soil is encountered at a reasonable depth, piles can be extended a few meters
into the hard stratum.
8/16/2019 Final Word 1st Phase
http://slidepdf.com/reader/full/final-word-1st-phase 5/24
5
B) Friction piles
In these types of piles, the load on pile is resisted mainly by skin/friction resistance along the side
of the pile (pile shaft). Pure friction piles tend to be quite long, since the load-carrying. Capacity
is a function of the shaft area in contact with the soil. In cohesion less soils, such as sands of
medium to low density, friction piles are often used to increase the density and thus the shearstrength. When no layer of rock or rocklike material is present at a reasonable depth at a site,
point/end bearing piles become very long and uneconomical. For this type of subsoil condition,
piles ate driven through the softer material to specified depth.
3 LITERATURE REVIEW:
Various papers have been studied related to the Seismic Design of Pile Foundation for Different
Sites and Different Seismic Zones
A Murali Krishna and A Phani Teja carried out “Seismic Design of pile foundation” the
objective of this research program is to Piles are the most commonly adopted deep foundations tosupport massive superstructures like multistoried buildings, bridges, towers, dams, etc., when the
founding soil is weak and result bearing capacity and settlement problems. In addition to carrying
the vertical compressive loads, piles must also resist the uplift loads (loads due to wind orhydrostatic pressure) and the dynamic lateral loads which are common in the offshore structures,
retaining walls and the structures in the earthquake prone regions.
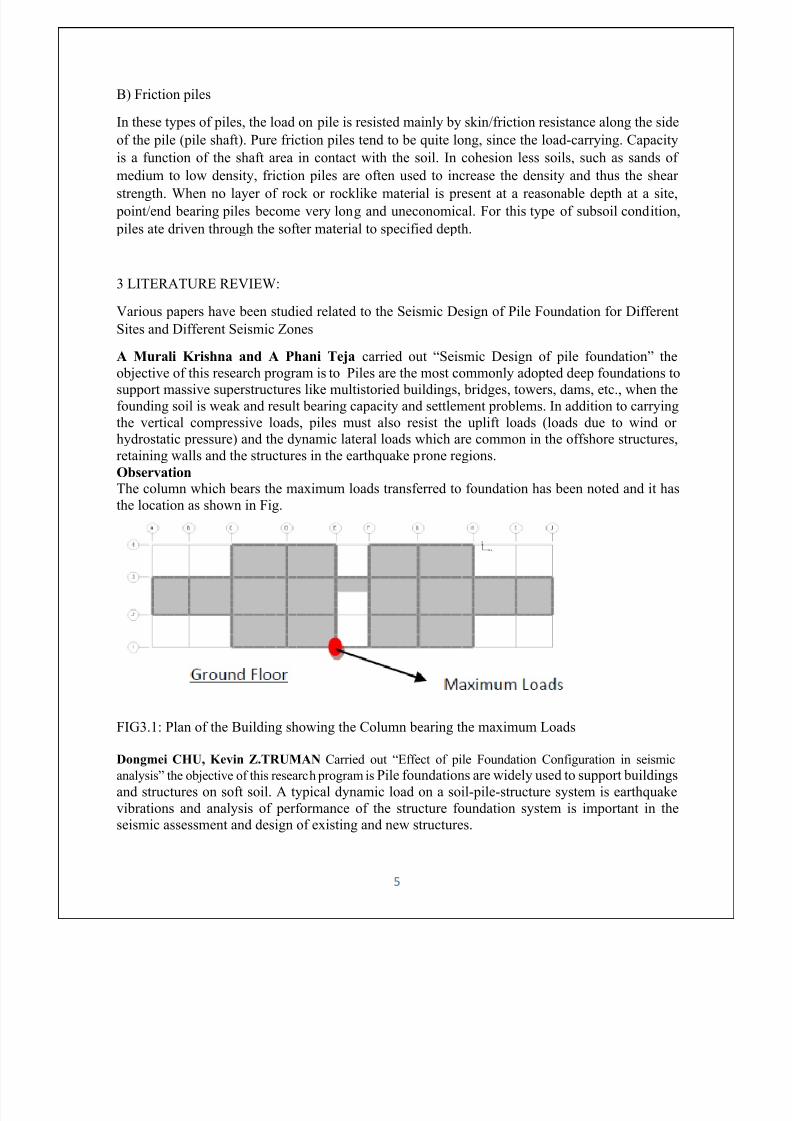
ObservationThe column which bears the maximum loads transferred to foundation has been noted and it has
the location as shown in Fig.
FIG3.1: Plan of the Building showing the Column bearing the maximum Loads
Dongmei CHU, Kevin Z.TRUMAN Carried out “Effect of pile Foundation Configuration in seismic
analysis” the objective of this research program is Pile foundations are widely used to support buildings
and structures on soft soil. A typical dynamic load on a soil-pile-structure system is earthquake
vibrations and analysis of performance of the structure foundation system is important in theseismic assessment and design of existing and new structures.
8/16/2019 Final Word 1st Phase
http://slidepdf.com/reader/full/final-word-1st-phase 6/24
6
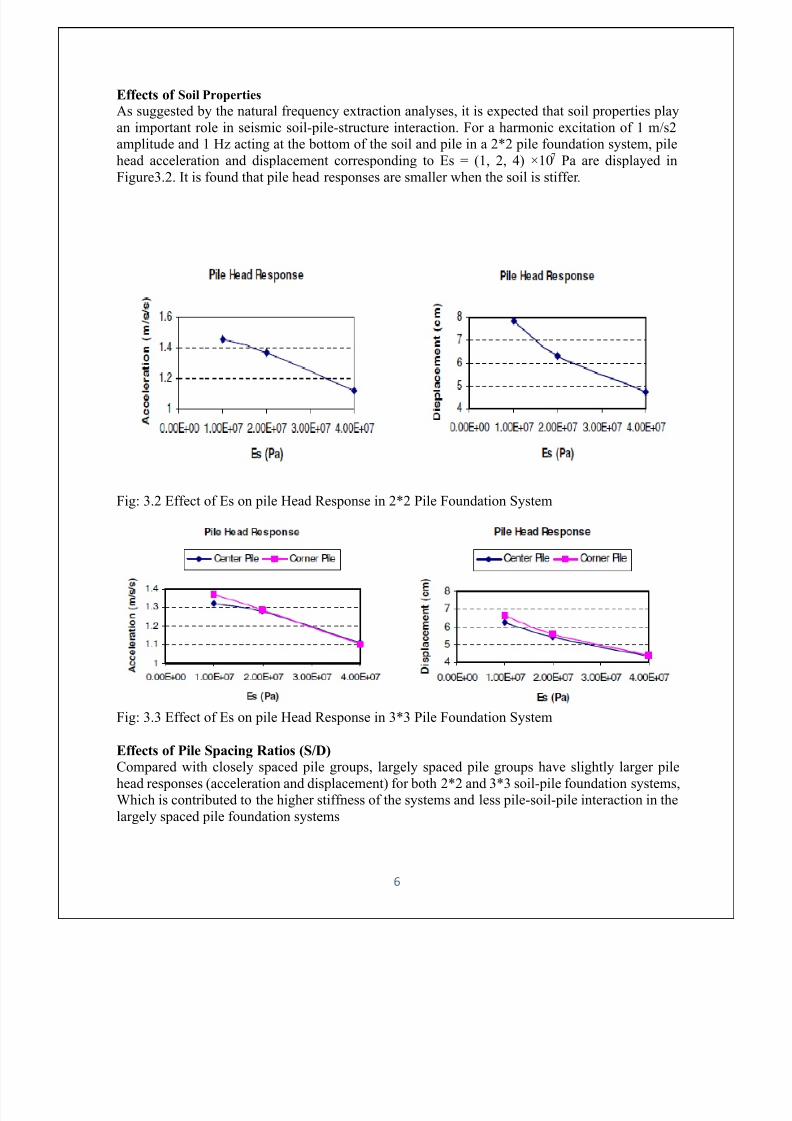
Effects of Soil Properties
As suggested by the natural frequency extraction analyses, it is expected that soil properties play
an important role in seismic soil-pile-structure interaction. For a harmonic excitation of 1 m/s2amplitude and 1 Hz acting at the bottom of the soil and pile in a 2*2 pile foundation system, pile
head acceleration and displacement corresponding to Es = (1, 2, 4) ×107 Pa are displayed in
Figure3.2. It is found that pile head responses are smaller when the soil is stiffer .
Fig: 3.2 Effect of Es on pile Head Response in 2*2 Pile Foundation System
Fig: 3.3 Effect of Es on pile Head Response in 3*3 Pile Foundation System
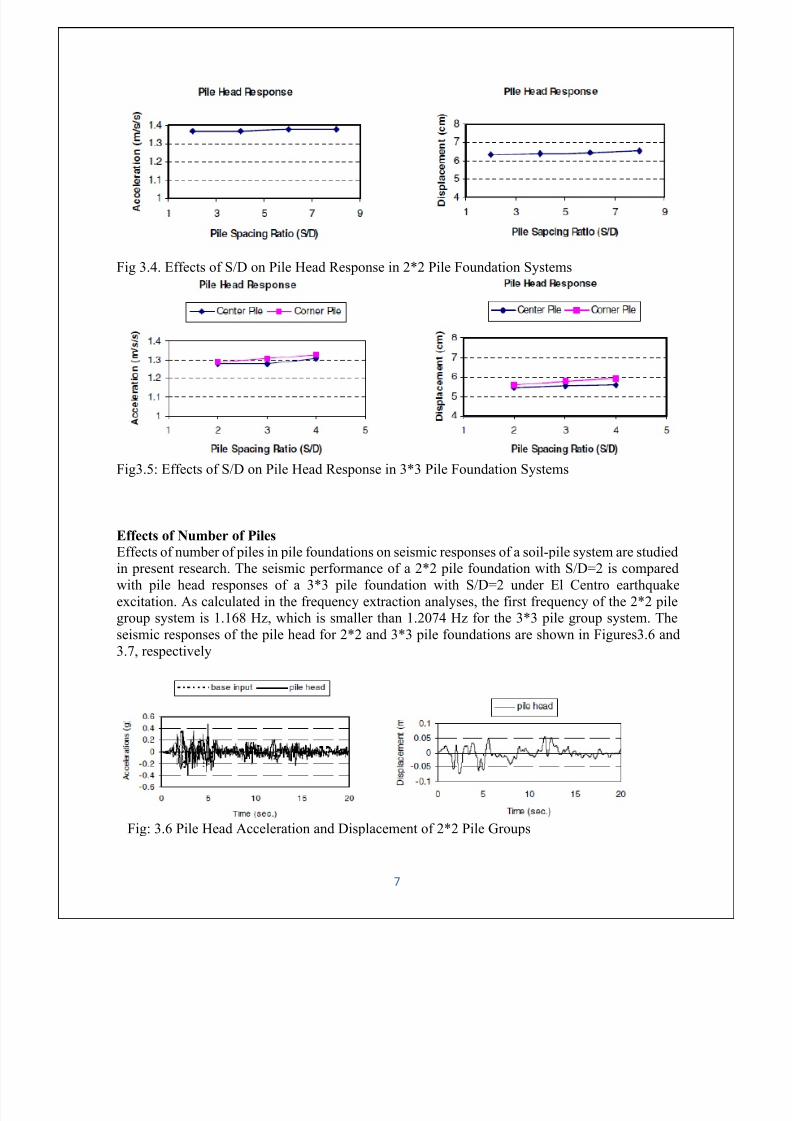
Effects of Pile Spacing Ratios (S/D)
Compared with closely spaced pile groups, largely spaced pile groups have slightly larger pile
head responses (acceleration and displacement) for both 2*2 and 3*3 soil-pile foundation systems,Which is contributed to the higher stiffness of the systems and less pile-soil-pile interaction in the
largely spaced pile foundation systems
8/16/2019 Final Word 1st Phase
http://slidepdf.com/reader/full/final-word-1st-phase 7/24
7
Fig 3.4. Effects of S/D on Pile Head Response in 2*2 Pile Foundation Systems
Fig3.5: Effects of S/D on Pile Head Response in 3*3 Pile Foundation Systems
Effects of Number of Piles
Effects of number of piles in pile foundations on seismic responses of a soil-pile system are studiedin present research. The seismic performance of a 2*2 pile foundation with S/D=2 is compared
with pile head responses of a 3*3 pile foundation with S/D=2 under El Centro earthquake
excitation. As calculated in the frequency extraction analyses, the first frequency of the 2*2 pilegroup system is 1.168 Hz, which is smaller than 1.2074 Hz for the 3*3 pile group system. The
seismic responses of the pile head for 2*2 and 3*3 pile foundations are shown in Figures3.6 and
3.7, respectively
Fig: 3.6 Pile Head Acceleration and Displacement of 2*2 Pile Groups
8/16/2019 Final Word 1st Phase
http://slidepdf.com/reader/full/final-word-1st-phase 8/24
8
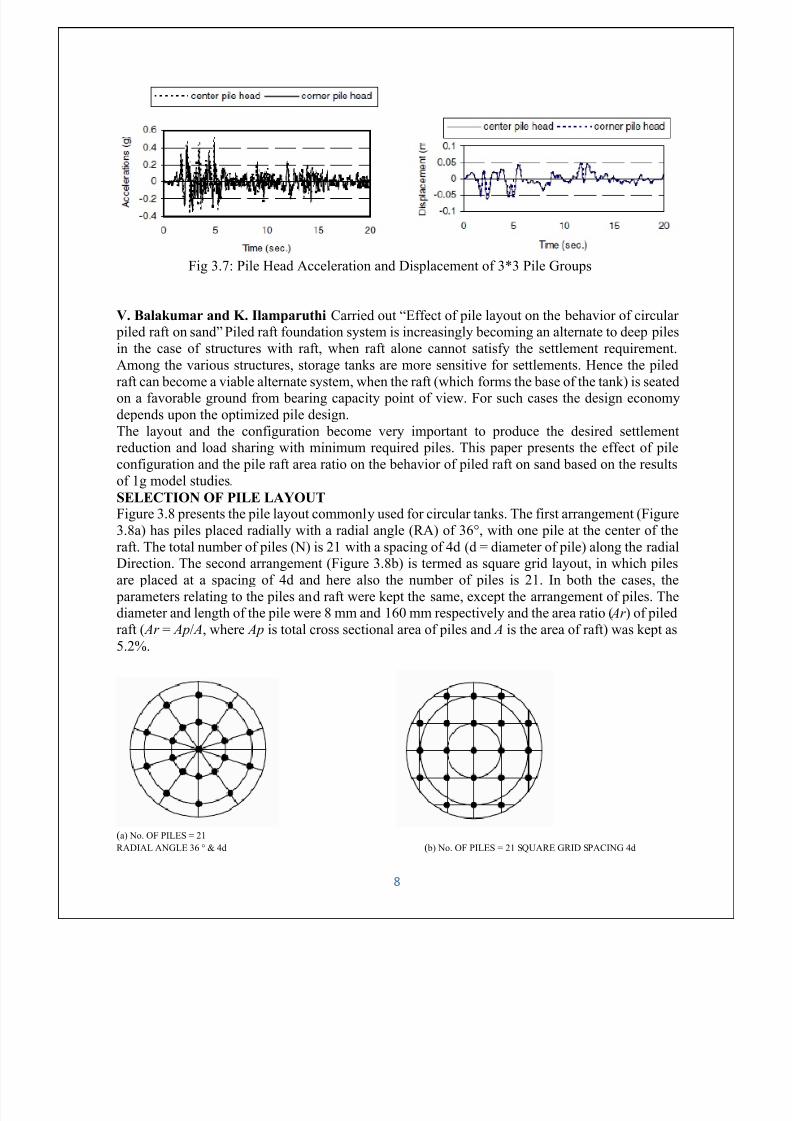
Fig 3.7: Pile Head Acceleration and Displacement of 3*3 Pile Groups
V. Balakumar and K. Ilamparuthi Carried out “Effect of pile layout on the behavior of circular piled raft on sand” Piled raft foundation system is increasingly becoming an alternate to deep piles
in the case of structures with raft, when raft alone cannot satisfy the settlement requirement.
Among the various structures, storage tanks are more sensitive for settlements. Hence the piledraft can become a viable alternate system, when the raft (which forms the base of the tank) is seatedon a favorable ground from bearing capacity point of view. For such cases the design economy
depends upon the optimized pile design.
The layout and the configuration become very important to produce the desired settlementreduction and load sharing with minimum required piles. This paper presents the effect of pile
configuration and the pile raft area ratio on the behavior of piled raft on sand based on the results
of 1g model studies.
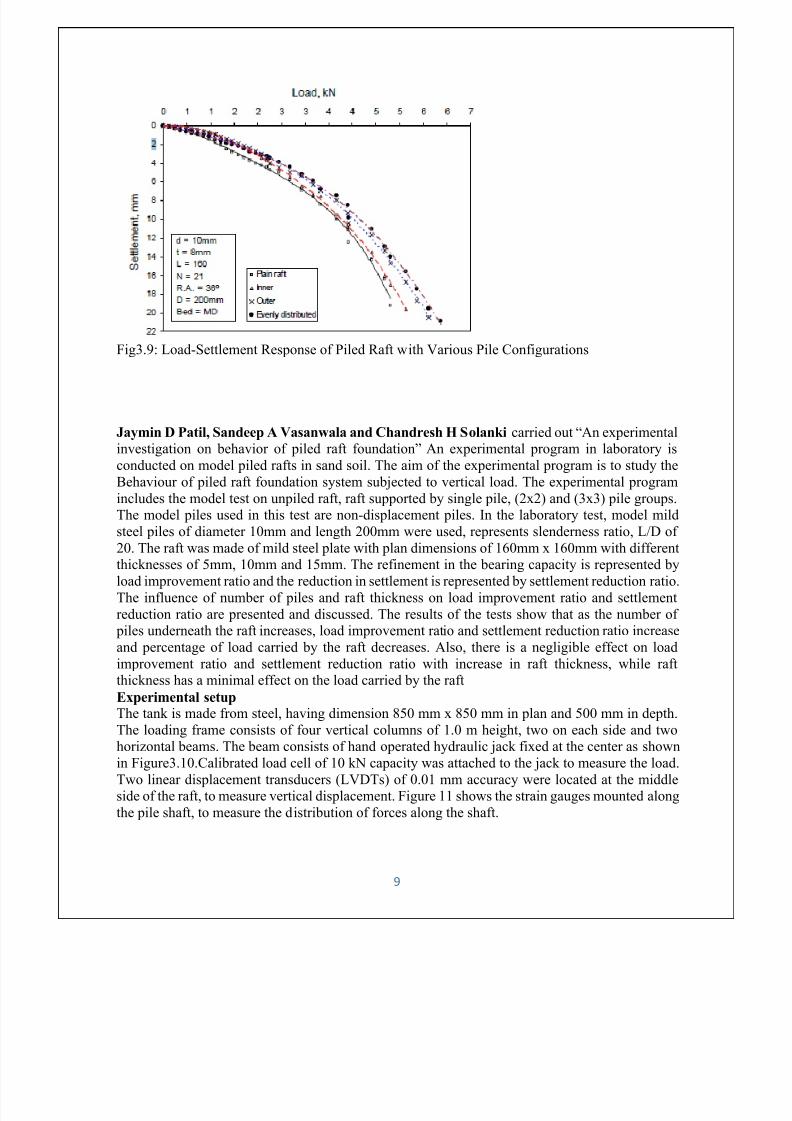
SELECTION OF PILE LAYOUTFigure 3.8 presents the pile layout commonly used for circular tanks. The first arrangement (Figure
3.8a) has piles placed radially with a radial angle (RA) of 36°, with one pile at the center of the
raft. The total number of piles (N) is 21 with a spacing of 4d (d = diameter of pile) along the radialDirection. The second arrangement (Figure 3.8b) is termed as square grid layout, in which piles
are placed at a spacing of 4d and here also the number of piles is 21. In both the cases, the
parameters relating to the piles and raft were kept the same, except the arrangement of piles. Thediameter and length of the pile were 8 mm and 160 mm respectively and the area ratio ( Ar ) of piled
raft ( Ar = Ap/ A, where Ap is total cross sectional area of piles and A is the area of raft) was kept as
5.2%.
(a) No. OF PILES = 21
RADIAL ANGLE 36 ° & 4d ( b) No. OF PILES = 21 SQUARE GRID SPACING 4d
8/16/2019 Final Word 1st Phase
http://slidepdf.com/reader/full/final-word-1st-phase 9/24
9
Fig3.9: Load-Settlement Response of Piled Raft with Various Pile Configurations
Jaymin D Patil, Sandeep A Vasanwala and Chandresh H Solanki carried out “An experimentalinvestigation on behavior of piled raft foundation” An experimental program in laboratory is
conducted on model piled rafts in sand soil. The aim of the experimental program is to study the
Behaviour of piled raft foundation system subjected to vertical load. The experimental program
includes the model test on unpiled raft, raft supported by single pile, (2x2) and (3x3) pile groups.The model piles used in this test are non-displacement piles. In the laboratory test, model mild
steel piles of diameter 10mm and length 200mm were used, represents slenderness ratio, L/D of
20. The raft was made of mild steel plate with plan dimensions of 160mm x 160mm with differentthicknesses of 5mm, 10mm and 15mm. The refinement in the bearing capacity is represented by
load improvement ratio and the reduction in settlement is represented by settlement reduction ratio.
The influence of number of piles and raft thickness on load improvement ratio and settlement
reduction ratio are presented and discussed. The results of the tests show that as the number of piles underneath the raft increases, load improvement ratio and settlement reduction ratio increase
and percentage of load carried by the raft decreases. Also, there is a negligible effect on load
improvement ratio and settlement reduction ratio with increase in raft thickness, while raftthickness has a minimal effect on the load carried by the raft
Experimental setupThe tank is made from steel, having dimension 850 mm x 850 mm in plan and 500 mm in depth.
The loading frame consists of four vertical columns of 1.0 m height, two on each side and twohorizontal beams. The beam consists of hand operated hydraulic jack fixed at the center as shown
in Figure3.10.Calibrated load cell of 10 kN capacity was attached to the jack to measure the load.
Two linear displacement transducers (LVDTs) of 0.01 mm accuracy were located at the middleside of the raft, to measure vertical displacement. Figure 11 shows the strain gauges mounted along
the pile shaft, to measure the distribution of forces along the shaft.

8/16/2019 Final Word 1st Phase
http://slidepdf.com/reader/full/final-word-1st-phase 10/24
10
Fig 3.10: Model Test Setup (unit: mm)
Fig 3.11: Instrumented pile
8/16/2019 Final Word 1st Phase
http://slidepdf.com/reader/full/final-word-1st-phase 11/24
11
Test procedure
1. Sand was poured in tank by rainfall method, In order to achieve required density in all the tests.The total height of the tank was divided into intervals of 50 mm. The sand was poured in tank up
to a height of 450mm with height of fall 600mm, to achieve a unit weight of 15.80 kN/m3.
2. As the piles are non-displacement piles, at first, sand was poured up to a height of 260 mmfrom bottom of tank, then piles having length 200mm, were placed in vertical position with 10mm
penetration into sand, to ensure proper seating. The sequence of pile installation starts with inner
pile, followed by corner piles and finally edge piles. The piles are held in position till the tank isfilled up.
3. After installation of model piles, model raft was placed and connected to each pile by Nuts.
4. The load was transferred to model raft through loading plate, placed on the raft. Then, two
LVDTs were placed at the middle side of the raft, to measure vertical displacement.
5. A calibrated load cell of 10 kN capacity was connected to hydraulic jack. The model raft was
loaded incrementally and at the end of each load increment vertical settlement was measured. The
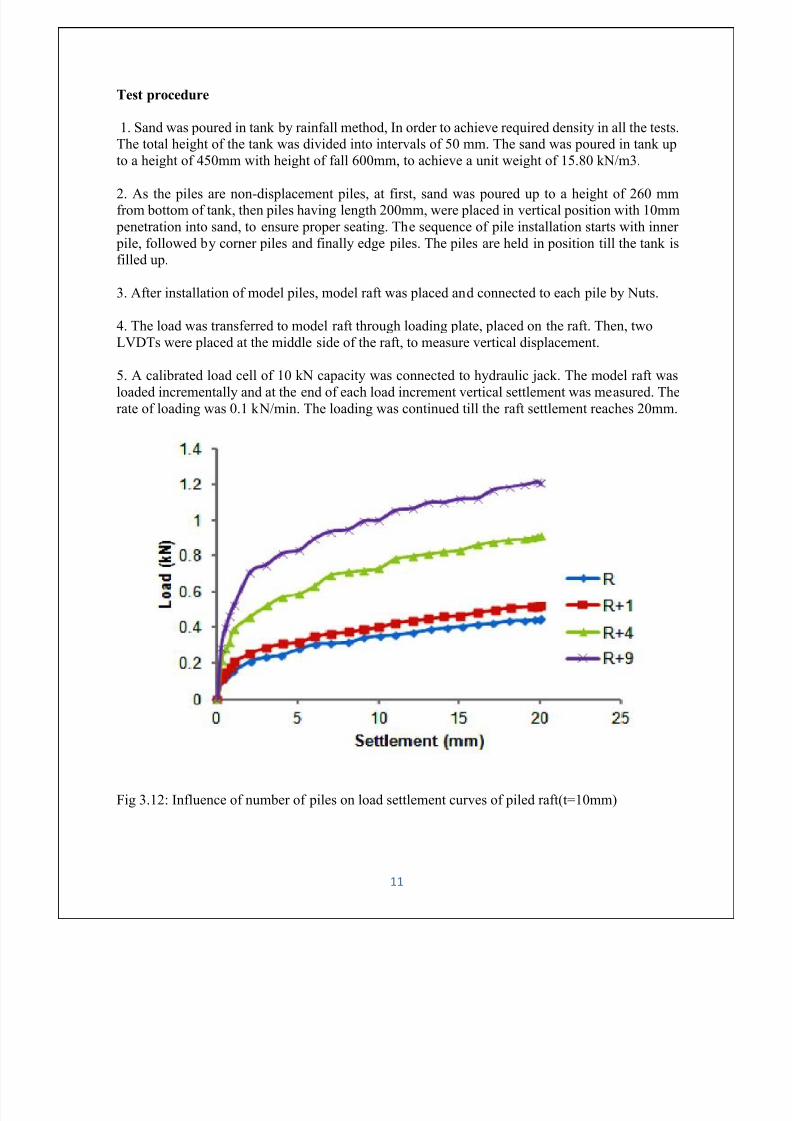
rate of loading was 0.1 kN/min. The loading was continued till the raft settlement reaches 20mm.
Fig 3.12: Influence of number of piles on load settlement curves of piled raft(t=10mm)
8/16/2019 Final Word 1st Phase
http://slidepdf.com/reader/full/final-word-1st-phase 12/24
12
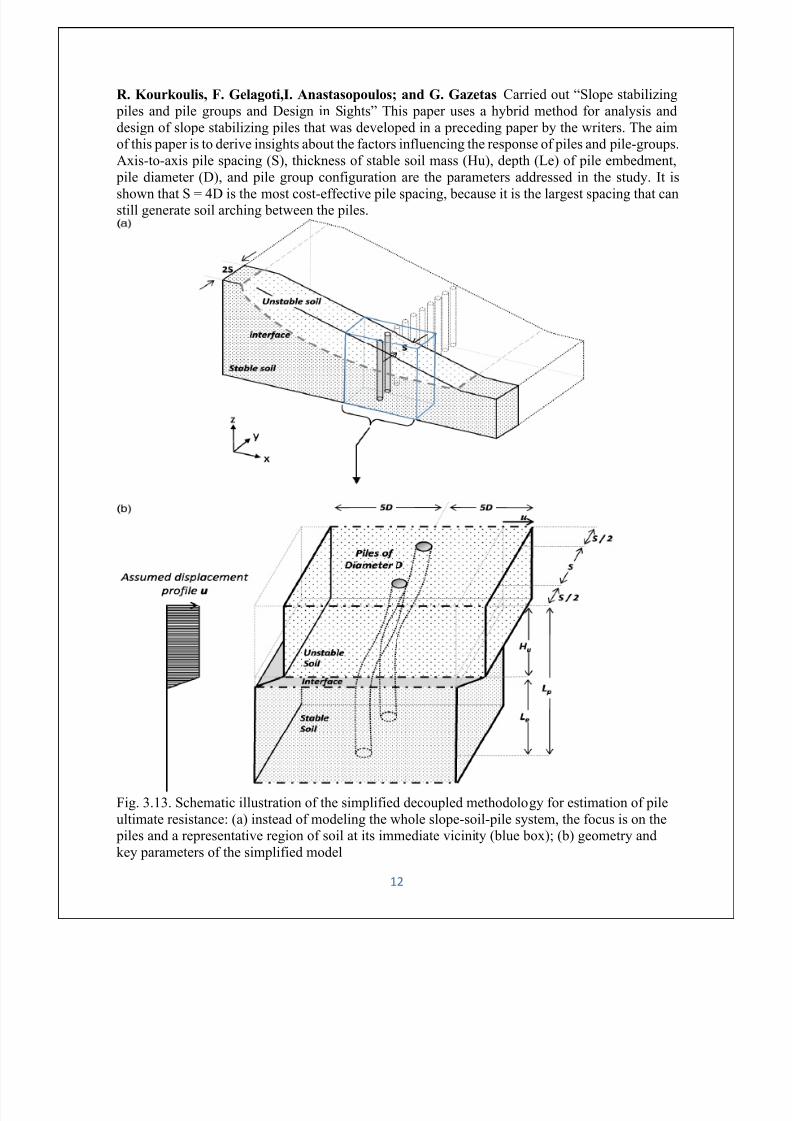
R. Kourkoulis, F. Gelagoti,I. Anastasopoulos; and G. Gazetas Carried out “Slope stabilizing
piles and pile groups and Design in Sights” This paper uses a hybrid method for analysis and
design of slope stabilizing piles that was developed in a preceding paper by the writers. The aimof this paper is to derive insights about the factors influencing the response of piles and pile-groups.
Axis-to-axis pile spacing (S), thickness of stable soil mass (Hu), depth (Le) of pile embedment,
pile diameter (D), and pile group configuration are the parameters addressed in the study. It isshown that S = 4D is the most cost-effective pile spacing, because it is the largest spacing that canstill generate soil arching between the piles.
Fig. 3.13. Schematic illustration of the simplified decoupled methodology for estimation of pile
ultimate resistance: (a) instead of modeling the whole slope-soil-pile system, the focus is on the piles and a representative region of soil at its immediate vicinity (blue box); (b) geometry and
key parameters of the simplified model
8/16/2019 Final Word 1st Phase
http://slidepdf.com/reader/full/final-word-1st-phase 13/24
13
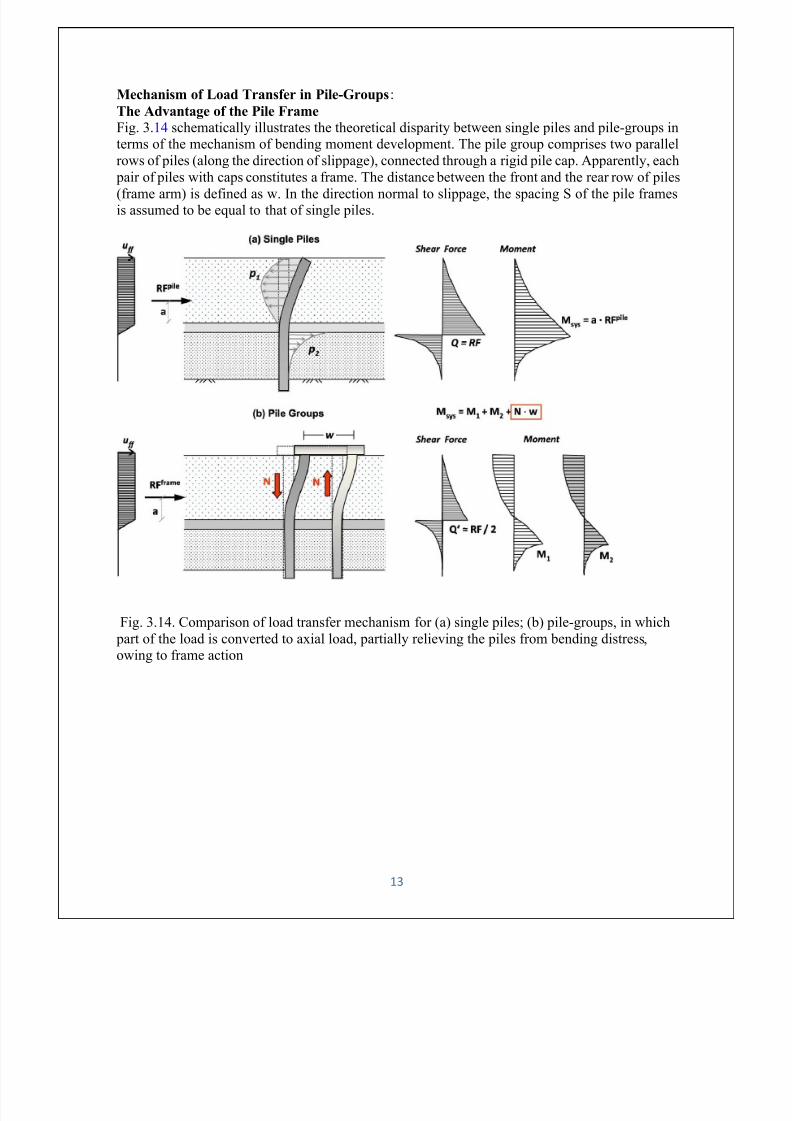
Mechanism of Load Transfer in Pile-Groups:
The Advantage of the Pile Frame
Fig. 3.14 schematically illustrates the theoretical disparity between single piles and pile-groups interms of the mechanism of bending moment development. The pile group comprises two parallel
rows of piles (along the direction of slippage), connected through a rigid pile cap. Apparently, each
pair of piles with caps constitutes a frame. The distance between the front and the rear row of piles(frame arm) is defined as w. In the direction normal to slippage, the spacing S of the pile framesis assumed to be equal to that of single piles.
Fig. 3.14. Comparison of load transfer mechanism for (a) single piles; (b) pile-groups, in which
part of the load is converted to axial load, partially relieving the piles from bending distress,owing to frame action
8/16/2019 Final Word 1st Phase
http://slidepdf.com/reader/full/final-word-1st-phase 14/24
14
4. OBJECTIVE
As a case study, a model of a typical multi storied residential building is considered and the seismic
action on it is determined for the different seismic zones in India and the different ground types.
The procedures, as per IS 1893 is followed to estimate the seismic loads on the structure. The
structure is then analyzed with the structural and seismic loads using the computer program
SAP2000 to determining the loads that are transferred to the foundations. Among differentfoundation loads the maximum loaded foundation was considered for the foundation design.
5. ESTIMATION OF SEISMIC LOADS ON THE STRUCTURE
For an efficient seismic design of the foundation, it is important to estimate the loads that are being
transferred to the foundation during an earthquake. These loads depend on the seismic loads that
act on the super structure during an earthquake. Different codes around the world propose different
methods of estimation of these seismic loads on the super structure. The methods proposed by the
Indian standard (IS 1893) reviewed and used to estimate the seismic loads. A case study of a typical
multi storied structure is considered as a model super structure for the purpose.
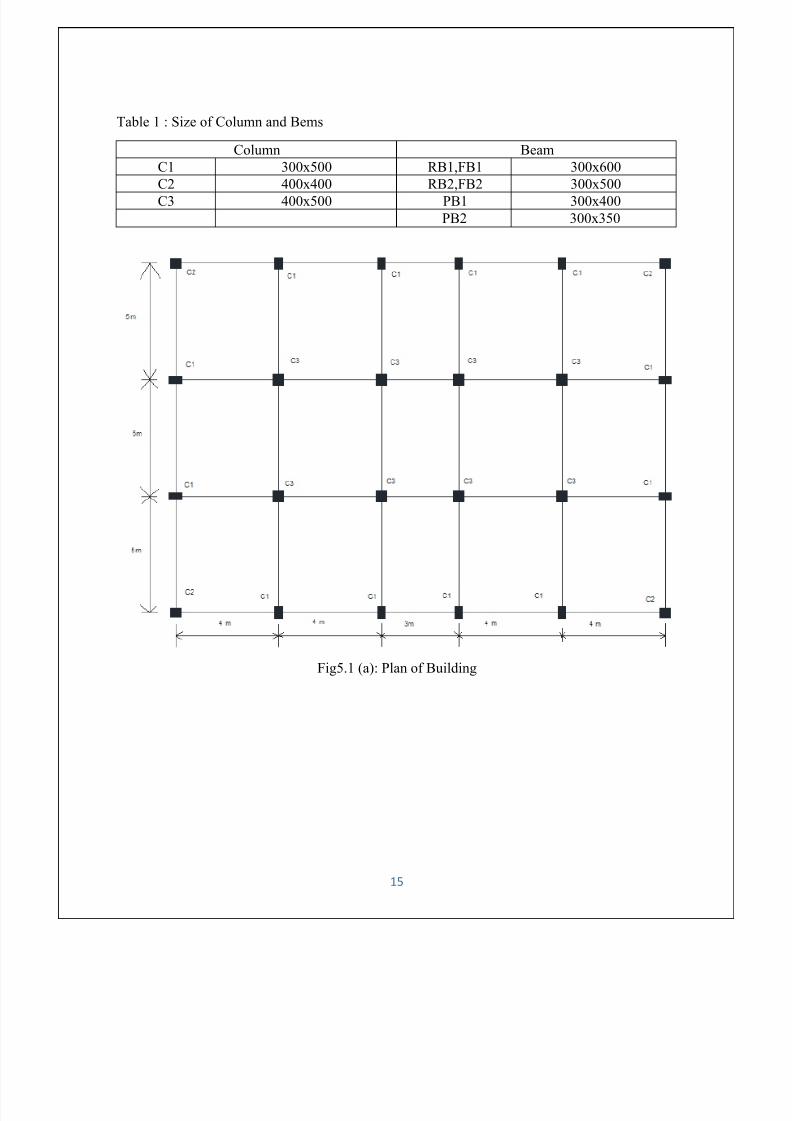
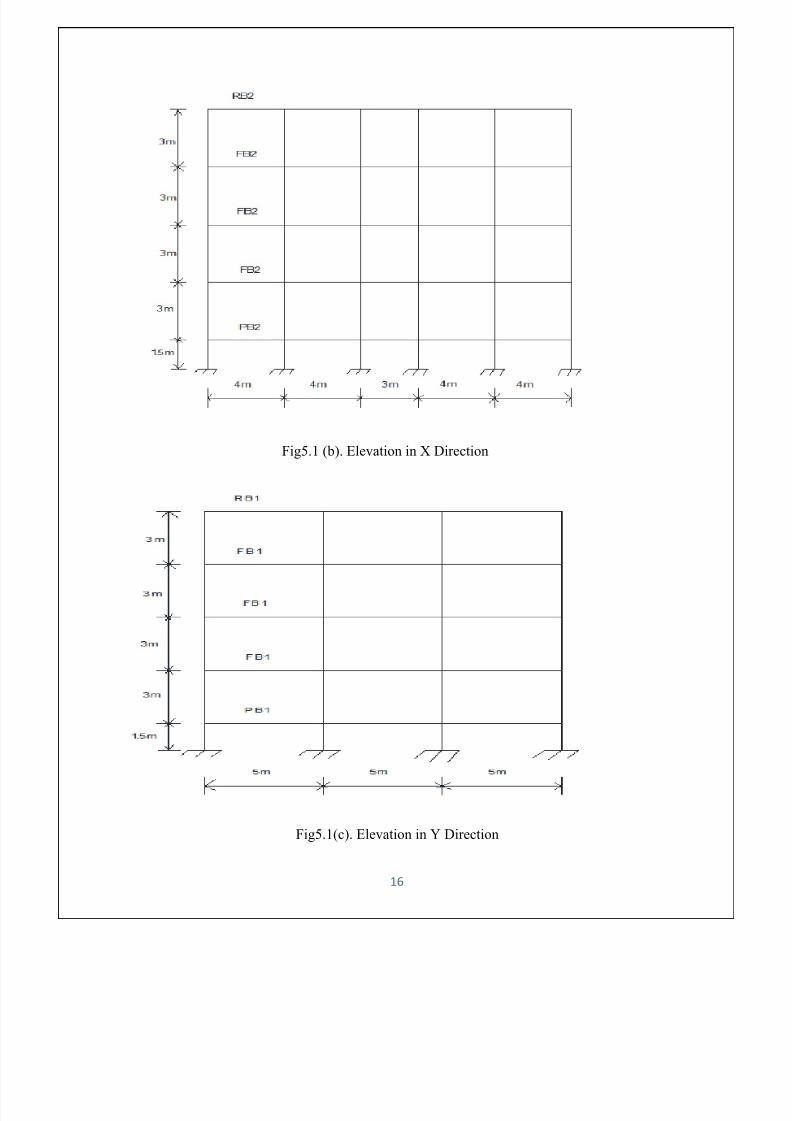
5.1 Model of the Building and Various Parameters Considered
As a case study, to estimate the seismic loads that act on a structure during an earthquake, a typical
multi storied building frame model is considered. The building frame is a moment resisting frame
with reinforced concrete members. The plan and elevation of the concrete building frame
considered are shown in Fig. 5.1. The parameters used for the modelling of the building were based
on the values used in general practice during the construction of a residential complex. Suitable
cross-sectional dimensions of beams and columns, as well as the thickness of slabs and
unreinforced brick masonry infill walls were assumed (all in accordance with the Indian
standards). The grade of concrete and the grade of steel were considered to be M20 and Fe415
respectively. The modelling of the building without the staircase was done in the computer
program SAP2000 with the assumed geometry and material properties.
Grade of Concrete: M2O
Grade of Steel: Fe415
Live Load on Roof: 1.5 kN/m2
Live load on Floor: 3 kN/m2
Roof finish: 1 kN/m2
Floor finish: 1 kN/m2
Brick wall on internal Beams: 150 mm
Density of concrete: 25 kN/m2
Density of brick wall including plaster: 20 kN/m3
Thickness of slab: 125 mm
8/16/2019 Final Word 1st Phase
http://slidepdf.com/reader/full/final-word-1st-phase 15/24
15
Table 1 : Size of Column and Bems
Column Beam
C1 300x500 RB1,FB1 300x600
C2 400x400 RB2,FB2 300x500C3 400x500 PB1 300x400
PB2 300x350
Fig5.1 (a): Plan of Building
8/16/2019 Final Word 1st Phase
http://slidepdf.com/reader/full/final-word-1st-phase 16/24
16
Fig5.1 (b). Elevation in X Direction
Fig5.1(c). Elevation in Y Direction
8/16/2019 Final Word 1st Phase
http://slidepdf.com/reader/full/final-word-1st-phase 17/24
17
5.2. Seismic Loads as per IS 1893 The Indian Standard (IS 1893) identifies three types of soils as foundation soil, based on N values
obtained from the standard penetration test (SPT). Type I, Type II and Type III being the rock orhard soils, medium soils and soft soils respectively.
Seismic weight of the structure = 16548.08 kN
5.2.1. Calculating the Base ShearThe total lateral force that acts at the base of the structure during an earthquake is called the design
seismic base shear (VB). As per IS 1893, base shear is calculated using the Eqn. 1.
VB= Ah. Ws (1)
The seismic weight of the structure (Ws) is as calculated above. The design horizontal seismiccoefficient ( Ah) is a function of the soil type (its stiffness and damping), the time period of the
structure and the zone. Equation 2 is being used to calculate the design horizontal seismic
coefficient
Ah= ..
2.. (2)
The Zone factor ‘Z’ which is indicative of the effective peak ground acceleration of a particular
zone is given in Table 2 of IS-1893. The values for the Importance factor ‘ I ’, which depends on
the functional use of the structure, are given in Table 6 of IS-1893. Considering the present
structure as an important service and community building, the value of ‘ I ’ adopted is I = 1. The
Response Reduction factor ‘ R’, depends on the perceived seismic damage performance of thestructure, characterized by brittle or ductile deformations. From Table 7 of the code, the value of
R for a special moment resisting frame is taken as R = 5. The value of the average spectral
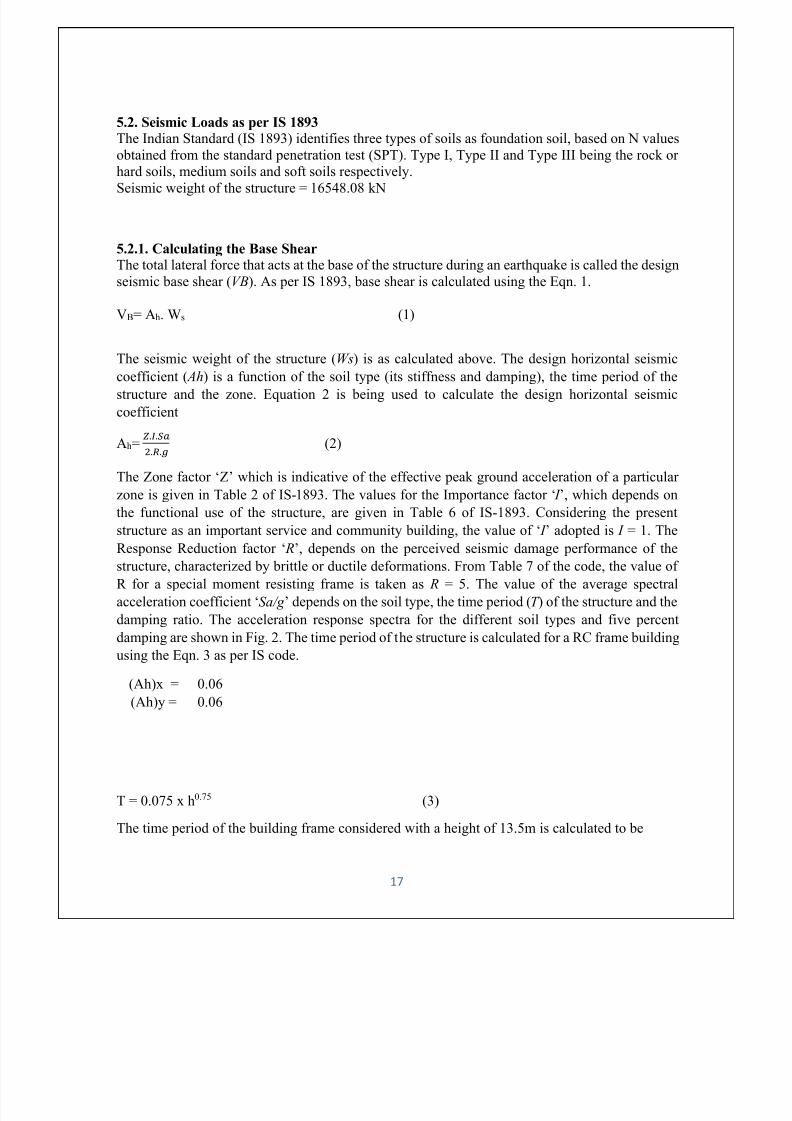
acceleration coefficient ‘Sa/g ’ depends on the soil type, the time period (T ) of the structure and the
damping ratio. The acceleration response spectra for the different soil types and five percent
damping are shown in Fig. 2. The time period of the structure is calculated for a RC frame building
using the Eqn. 3 as per IS code.
(Ah)x = 0.06
(Ah)y = 0.06
T = 0.075 x h0.75 (3)
The time period of the building frame considered with a height of 13.5m is calculated to be
8/16/2019 Final Word 1st Phase
http://slidepdf.com/reader/full/final-word-1st-phase 18/24
18
T =0.09 ℎ
√ (4)
Tx =0.2787 sec
Ty= 0.3137 sec
Assuming the damping to be five percent, the base shear acting on the structure in different zonesand different soil types is calculated and the values are tabulated in Table 2 .
Fig 5.2. Response Spectra for Rock and Soil sites as per IS 1893 for five percent Damping
By SAP2000
Base Shear (Vb) = 993kN
5.3 Seismic Loads as per EN 1998
The Eurocode (EN8) specifies five different ground types (A, B, C, D & E) and two special ground
types (S1 & S2) according to the average shear wave velocity, Vs30. If the shear wave velocity
data is not available the SPT N-values can be used to classify the ground type. Two ground types:
C and D are considered for the estimation of seismic loads on the super structure
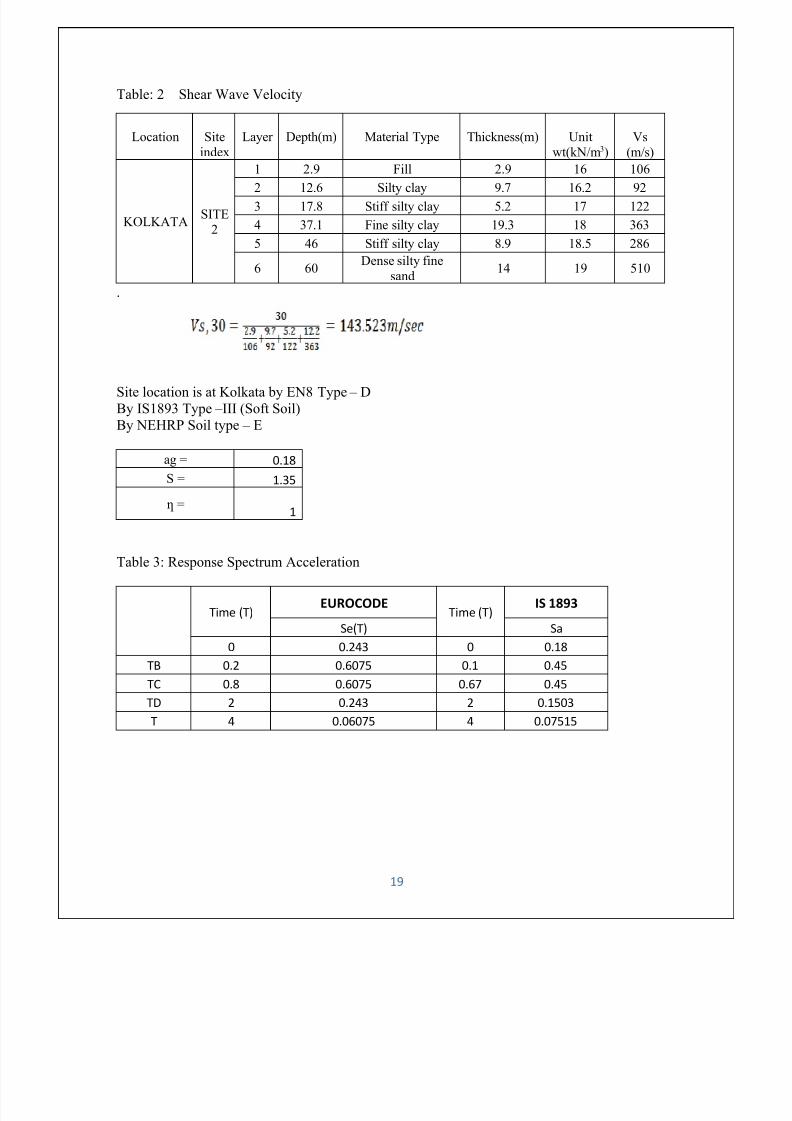
Average Shear Wave Velocity Vs,30 =30
∑ ,
=1
8/16/2019 Final Word 1st Phase
http://slidepdf.com/reader/full/final-word-1st-phase 19/24
19
Table: 2 Shear Wave Velocity
Location Site
index
Layer Depth(m) Material Type Thickness(m) Unit
wt(kN/m3)
Vs
(m/s)
KOLKATA SITE
2
1 2.9 Fill 2.9 16 106
2 12.6 Silty clay 9.7 16.2 92
3 17.8 Stiff silty clay 5.2 17 122
4 37.1 Fine silty clay 19.3 18 363
5 46 Stiff silty clay 8.9 18.5 286
6 60Dense silty fine
sand14 19 510
.
Site location is at Kolkata by EN8 Type – D
By IS1893 Type – III (Soft Soil)
By NEHRP Soil type – E
ag = 0.18
S = 1.35
ƞ = 1
Table 3: Response Spectrum Acceleration
Time (T)EUROCODE
Time (T)IS 1893
Se(T) Sa
0 0.243 0 0.18
TB 0.2 0.6075 0.1 0.45
TC 0.8 0.6075 0.67 0.45
TD 2 0.243 2 0.1503
T 4 0.06075 4 0.07515
8/16/2019 Final Word 1st Phase
http://slidepdf.com/reader/full/final-word-1st-phase 20/24
20
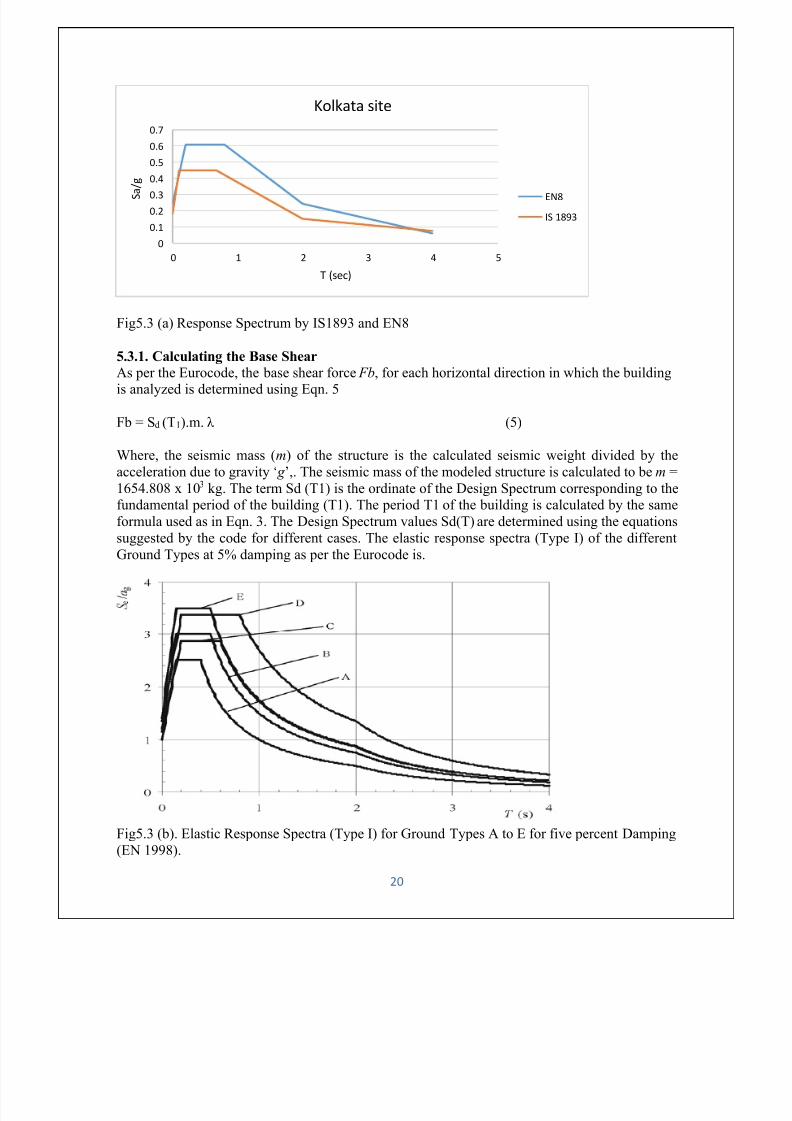
Fig5.3 (a) Response Spectrum by IS1893 and EN8
5.3.1. Calculating the Base Shear
As per the Eurocode, the base shear force Fb, for each horizontal direction in which the buildingis analyzed is determined using Eqn. 5
Fb = Sd (T1).m. λ (5)
Where, the seismic mass (m) of the structure is the calculated seismic weight divided by the
acceleration due to gravity ‘ g ’,. The seismic mass of the modeled structure is calculated to be m =
1654.808 x 103 kg. The term Sd (T1) is the ordinate of the Design Spectrum corresponding to thefundamental period of the building (T1). The period T1 of the building is calculated by the same
formula used as in Eqn. 3. The Design Spectrum values Sd(T) are determined using the equations
suggested by the code for different cases. The elastic response spectra (Type I) of the different
Ground Types at 5% damping as per the Eurocode is.
Fig5.3 (b). Elastic Response Spectra (Type I) for Ground Types A to E for five percent Damping
(EN 1998).
0
0.1
0.2
0.30.4
0.5
0.6
0.7
0 1 2 3 4 5
S a / g
T (sec)
Kolkata site
EN8
IS 1893

8/16/2019 Final Word 1st Phase
http://slidepdf.com/reader/full/final-word-1st-phase 21/24
21
λ in eqn.5 is the correction factor, the value of which is equal to: λ = 0.85 if T1 < 2 TC and the
building has more than two stories, or λ = 1.0 otherwise. Using the design spectral values calculated
from equations suggested by the code, the seismic mass of the structure and the correction factorthe base shear force Fb is calculated for each case and the results are as shown in Table 4.
Se (T) = 0.18 x 1.35 x 2.5= 0.6075 SecDesign Spectrum for elastic analysis
TB≤ T ≤ TC : Sd (T) = ag . S.2.5
= 0.18 x 1.35 x 2.5= 0.6075 Sec
Fb = Sd (T1).m. λ
= 0.6075 x 1654.808 x 103 x 0.85= 854.5015 kN
Base Shear by EN8 CodeFb = 854.5015 kN
5.3.2. Distribution of Base ShearFor the distribution of the base shear force along the height of the building at various floor levels,
the Eurocode suggests the equation as shown in Eqn. 6.
6. SUMMARY AND CONLUSIONS
With the increasing seismic activities in the recent times an efficient design of the pile foundations
to resist the estimated earthquake loads is a major concerned issue. In this interest, this study deals
with the estimation of the seismic loads on a super structure as per international codes selected, IS
1893. Different cases are considered assuming the location of the structure to be in different
seismic zones of India and on different ground types. The estimated seismic loads are applied to
the SAP2000 model of the structure and analyzed to find the maximum (design) foundation loads.
Liquefaction potential was evaluated, before proceeding to the pile design, for the selected soil
profiles in the Seismic region. Then the pile is designed for a selected case of seismic zone IV.
The pile is first designed for using the Indian Standard IS 2911. Then the design was checked
against lateral deflection and limiting moment capacity of pile for the estimated lateral loads and
moments under seismic condition using commonly used method called the Characteristic Load
Method. Further the seismic design is revised for both the cases considering the soil profile to be

8/16/2019 Final Word 1st Phase
http://slidepdf.com/reader/full/final-word-1st-phase 22/24
22
liquefiable. It is to conclude that ground conditions should be considered much prior in the analysis
of any structure to evaluate the seismic loads acting on the structure which will further influence
the foundation design loads and foundation capacity.
8/16/2019 Final Word 1st Phase
http://slidepdf.com/reader/full/final-word-1st-phase 23/24
23
7. References
1.A. Murali Krishna, A. Phani Teja (2012) “Seismic Design of Pile foundation for different
ground condition” Tenth world conference ©2012
2.Geng dong cheng , Bo Wang “Optimum Design of pile foundation” Research paper (2012)
3.R R Chaudhry, Dr K N Kadam “Effect of piled raft design on High rise building” volume 2,
June2013
4.Kevin Z Truman,Dong mei chu “Effect of pile foundation configuration in seismic analysis” 13th World configuration Canada
5.Criteria for Earthquake resistant Design of structures IS 1893 (Part 1) : 2002
6.Michel valley “Foundation Analysis and Design” text book

8/16/2019 Final Word 1st Phase
http://slidepdf.com/reader/full/final-word-1st-phase 24/24
24