Embed Size (px)
Citation preview

Final Waterborne Commerce Statistics
For Calendar Year 2016
Waterborne Commerce National Totals And
Selected Inland Waterways For Multiple Years
Institute for Water Resources
Navigation and Civil Works Decision Support Center
U.S. Army Corps of Engineers
Waterborne Commerce Statistics Center

Introduction
In order to provide waterborne commerce information in a graphical format, the Waterborne Commerce Statistics Center (WCSC) has prepared this summary document of waterborne commerce statistics for calendar year 2016. The foreign inbound and outbound data is import, export, and inbound/outbound in-transit data. The domestic national totals are calendar year 2016 data collected from vessel operating companies. All graphs and tables (except page 1) show domestic tonnages (short tons). All graphs after page 1 include all internal tonnage, which is tonnage moving exclusively on waterways within the boundaries of the United States. The deep-draft sections of the Mississippi, the Columbia and the Gulf Intracoastal Waterway include domestic coastwise data as well. This coastwise tonnage travels on these internal waterways and also Coastwise (the oceans or the Gulf of Mexico). Please note that rounding may result in commodity tonnages that do not add up to the totals for a waterway. WCSC uses the Internet to expedite release of statistics. Please visit our World Wide Web home page at:
http://www.navigationdatacenter.us/
There you will find the timeliest WCSC statistics including this report, port rankings, container information, and our monthly internal traffic indicators. Questions or comments may be communicated to:
Waterborne Commerce Statistics Center, USACE P. O. Box 61280 New Orleans, LA 70161-1280 Telephone: (504) 862-1426 (504) 862-1441 Fax No.: (504) 862-1423 E-Mail: [email protected]
i

Table of Contents
Table/Graph Page Introduction i Table of Contents ii Explanation of Commodity Groups iii Foreign Waterborne Inbound and Outbound Traffic (2007-2016) 1 Domestic Waterborne Commerce of the U.S. – By Type Traffic (2007-2016)
1
Internal Waterways Tonnage Comparisons: 2016 vs 2015 2 Internal Waterways Tonnage Comparisons: Graph of Percent Change 3 National Internal Commodities 4 Total of Selected Waterways (2007-2016) 5 Allegheny River 6 Atchafalaya River 8 Atlantic Intracoastal Waterway 10 Big Sandy River 12 Black Warrior and Tombigbee Rivers 14 Columbia River 16 Cumberland River 18 Gulf Intracoastal Waterway 20 Illinois Waterway 22 Kanawha River 24 McClellan-Kerr Waterway 26 Mississippi River 28 Missouri River 30 Monongahela River 32 Ohio River 34 Snake River 36 Tennessee River 38 Tennessee-Tombigbee Waterway 40
ii

Explanation of Commodity Groups
Coal: Coal, lignite, and coke Petro & Petro Products: Petroleum and Petroleum Products Chemicals: Chemicals and fertilizers Crude Materials: Crude materials, inedible, such as: forest products,
pulp, sand, gravel, stone, iron ore, marine shells, non-ferrous metallic ores, and sulphur
Manufactured Goods: Primary manufactured goods, such as: paper and
allied products, concrete, iron, steel, non-ferrous metals, and wood products
Food and Farm: Food, grain, and farm products Manufactured Equipment: All manufactured equipment Waste material: Waste material, such as: garbage, landfill, sewage
sludge, and waste water. Other: Commodity group not specifically listed in a table.
(This will differ from table to table).
iii

Source: USACE Waterborne Commerce Statistics Center 1
2007 2008 2009 2010 2011 2012 2013 2014 2015 2016
Total 1542.5 1520.8 1353.7 1440.9 1479.6 1421.9 1383.6 1408.7 1374.2 1415.5
Inbound 1075.7 998.7 858.9 883.1 869.1 804.5 758.7 760.9 751.6 755.6
Outbound 466.8 522.1 494.8 557.8 610.4 617.4 624.9 647.8 622.5 659.8
0
200
400
600
800
1000
1200
1400
1600
1800
Millio
ns o
f S
ho
rt T
on
s
Foreign Waterborne Inbound and Outbound Traffic2007-2016, Millions of Short Tons
2007 2008 2009 2010 2011 2012 2013 2014 2015 2016
Total** 1021.7 956.4 858.4 893.7 892.4 890.0 891.4 937.2 904.8 876.6
Internal*** 622.0 588.6 523.8 565.8 557.7 570.0 567.0 599.6 565.9 548.1
Coastwise 205.8 186.3 167.8 164.5 161.0 152.2 164.9 172.0 175.1 168.7
Lakewise 95.6 90.4 63.2 80.5 88.1 84.4 85.4 87.9 83.9 78.2
0
200
400
600
800
1000
1200
Mil
lio
ns o
f S
ho
rt T
on
s
**Total also includes Intraport and Intra-territory traffic.***Total Internal excludes waterway improvement materials.
Domestic Waterborne Commerce of the U.S. 2007-2016, Millions of Short Tons, by Type of Traffic

Source: USACE Waterborne Commerce Statistics Center 2
Domestic U.S. Waterborne Traffic Annual Tonnage Comparisons: 2016 VS 2015
Millions of Short Tons
CY15 CY16 Percent
National Totals** Change
Domestic 904.8 876.6 -3.12%
Lakewise 83.9 78.2 -6.80%
Coastwise 175.1 168.7 -3.63%
Intraport 78.3 80.1 2.24%
Intra-territory 1.6 1.5 -6.12%
Internal 565.9 548.1 -3.15%
National Internal Commodities
Coal 126.2 109.8 -13.00%
Petroleum 162.8 157.6 -3.16%
Chemicals 50.9 52.3 2.80%
Crude Materials 100.0 96.7 -3.37%
Manufactured Goods 28.6 26.8 -6.08%
Food and Farm 89.7 97.2 8.37%
Manufactured Equipment 6.8 6.8 -0.10%
Other 1.0 0.9 -8.08%
Waterways
Allegheny River 0.7 0.7 -1.03%
Atchafalaya River (Upper) 10.9 9.1 -15.73%
Atlantic Intracoastal 2.6 2.2 -12.84%
Big Sandy 6.1 5.3 -12.76%
Black Warrior River 18.4 17.7 -3.69%
Columbia River*** 13.5 13.8 2.03%
Cumberland River 21.8 22.5 2.92%
Gulf Intracoastal*** 118.9 111.7 -6.10%
Illinois Waterway 35.5 39.0 9.86%
Kanawha River 13.9 11.7 -15.60%
McClellan-Kerr Wtwy 10.2 11.6 13.61%
Mississippi River*** 315.8 307.6 -2.58%
Missouri River 4.4 4.7 5.78%
Monongahela River 16.3 14.5 -11.27%
Ohio River 201.4 184.2 -8.53%
Snake River 3.6 3.4 -6.41%
Tennessee River 35.8 37.7 5.24%
Tennessee Tombigbee 8.1 7.9 -1.71%
**All National Totals exclude waterway improvement materials.
***Includes domestic coastwise tonnage.

Source: USACE Waterborne Commerce Statistics Center 3
-1.71%
5.24%
-6.41%
-8.53%
-11.27%
5.78%
-2.58%
13.61%
-15.60%
9.86%
-6.10%
2.92%
2.03%
-3.69%
-12.76%
-12.84%
-15.73%
-1.03%
-8.08%
-0.10%
8.37%
-6.08%
-3.37%
2.80%
-3.16%
-13.00%
-3.15%
-6.12%
2.24%
-3.63%
-6.80%
-3.12%
-20.00% -15.00% -10.00% -5.00% 0.00% 5.00% 10.00% 15.00% 20.00%
Waterway improvement materials excluded from National Totals.
Domestic U.S. Waterborne TrafficTonnage Comparisons: 2016 vs. 2015
Domestic
Lakewise
Coastwise
Intraport
Intra-territory
Internal
Coal
Petroleum
Chemicals
Crude Materials
Manufactured Goods
Food and Farm
Manufactured Equipment
Other
Allegheny River
Atchafalaya River (Upper)
Atlantic Intracoastal
Big Sandy
Black Warrior River
Columbia River
Cumberland River
Gulf Intracoastal
Illinois Waterway
Kanawha River
McClellan-Kerr Wtwy
Mississippi River
Missouri River
Monongahela River
Ohio River
Snake River
Tennessee River
Tennessee-Tombigbee

Source: USACE Waterborne Commerce Statistics Center 4
2007 2008 2009 2010 2011 2012 2013 2014 2015 2016
Coal 182.16 184.96 161.74 175.65 177.60 173.12 162.26 154.98 126.20 109.79
Petroleum 164.80 149.54 145.73 145.74 139.38 150.11 160.32 165.67 162.78 157.63
Chemicals 50.96 45.70 42.46 49.33 51.03 50.81 50.16 51.88 50.88 52.30
Crude Materials 109.49 105.87 75.14 87.65 87.11 88.17 90.01 98.49 100.03 96.65
Manufactured Goods 27.04 25.09 15.04 20.63 23.15 26.24 26.40 31.32 28.55 26.82
Food and Farm 77.63 67.70 75.32 79.38 72.41 74.11 70.85 89.98 89.66 97.16
Manufactured Equipment 8.76 8.47 7.38 6.51 6.12 6.50 5.97 6.23 6.81 6.81
Other 1.19 1.24 1.02 0.95 0.90 0.99 1.05 1.01 1.02 0.94
0
20
40
60
80
100
120
140
160
180
200
Mil
lio
ns o
f S
ho
rt T
on
s
National Internal Commodities2007-2016, Millions of Short Tons, By Commodity

Source: USACE Waterborne Commerce Statistics Center 5
2007 2008 2009 2010 2011 2012 2013 2014 2015 2016
Total Internal** 622.03 588.56 523.84 565.83 557.71 570.05 567.02 599.56 565.93 548.09
Mississippi*** 313.31 295.18 280.00 294.31 297.17 304.96 299.68 326.75 315.77 307.63
Ohio 230.84 230.80 207.45 220.59 215.25 216.51 215.15 220.84 201.40 184.21
Tennessee 49.45 49.67 39.23 38.20 37.36 36.29 35.34 35.68 35.85 37.73
Illinois 41.12 37.28 36.41 36.12 36.36 33.41 27.39 37.06 35.47 38.97
GIWW*** 125.06 115.88 108.55 116.23 112.09 114.37 115.36 126.12 118.91 111.65
0
100
200
300
400
500
600
700
Mil
lio
ns o
f S
ho
rt T
on
s
**Total Internal excludes waterway improvement materials. ***Includes domestic coastwise tonnage.
Commerce on Selected WaterwaysInternal Traffic, 2007-2016

Source: USACE Waterborne Commerce Statistics Center 6
2007 2008 2009 2010 2011 2012 2013 2014 2015 2016
Total 2.71 2.49 2.00 1.63 1.75 1.66 1.77 1.73 0.66 0.65
Coal 1.19 1.05 1.12 0.80 1.09 1.04 1.38 1.33 0.29 0.35
Petro & Petro Products 0.18 0.19 0.13 0.12 0.15 0.12 0.12 0.11 0.10 0.10
Chemicals 0.09 0.09 0.08 0.11 0.05 0.05 0.03 0.06 0.06 0.07
Crude Materials 1.21 1.12 0.64 0.57 0.43 0.42 0.21 0.21 0.18 0.08
Other 0.05 0.04 0.02 0.03 0.01 0.03 0.04 0.03 0.03 0.05
0.0
0.5
1.0
1.5
2.0
2.5
3.0
Mil
lio
ns o
f S
ho
rt T
on
s
Allegheny River - Totals2007-2016, Millions of Short Tons, By Commodity

Source: USACE Waterborne Commerce Statistics Center 7
2007 2008 2009 2010 2011 2012 2013 2014 2015 2016
Total 1.18 1.13 0.64 0.63 0.54 0.56 0.35 0.25 0.12 0.11
Crude Materials 1.11 1.03 0.54 0.51 0.41 0.36 0.09 0.00 0.00 0.00
Other 0.07 0.10 0.10 0.12 0.13 0.20 0.26 0.24 0.12 0.11
0.0
0.2
0.4
0.6
0.8
1.0
1.2
1.4
Mil
lio
ns o
f S
ho
rt T
on
s
Allegheny River - Downbound2007-2016, Millions of Short Tons, By Commodity
2007 2008 2009 2010 2011 2012 2013 2014 2015 2016
Total 1.53 1.36 1.36 0.99 1.21 1.10 1.42 1.49 0.54 0.55
Coal 1.15 1.01 1.08 0.75 1.06 0.94 1.20 1.18 0.26 0.33
Petro & Petro Products 0.15 0.14 0.07 0.05 0.06 0.02 0.03 0.02 0.01 0.02
Crude Materials 0.10 0.09 0.10 0.06 0.03 0.06 0.13 0.21 0.18 0.08
Other 0.13 0.13 0.11 0.14 0.07 0.07 0.07 0.08 0.09 0.11
0.0
0.2
0.4
0.6
0.8
1.0
1.2
1.4
1.6
1.8
Mil
lio
ns o
f S
ho
rt T
on
s
Allegheny River - Upbound2007-2016, Millions of Short Tons, By Commodity

Source: USACE Waterborne Commerce Statistics Center 8
2007 2008 2009 2010 2011 2012 2013 2014 2015 2016
Total 10.85 9.58 11.68 9.69 10.55 9.30 12.32 11.13 10.85 9.14
Petro & Petro Products 4.13 3.82 5.06 3.55 4.66 4.77 6.77 6.58 6.15 4.46
Chemicals 1.51 0.90 1.59 1.28 1.11 0.90 1.05 0.96 1.09 0.64
Crude Materials 4.17 3.83 4.19 4.16 3.55 2.45 2.88 2.49 2.88 3.38
Food & Farm 0.60 0.47 0.36 0.43 0.61 0.65 0.75 0.64 0.35 0.42
Other 0.45 0.56 0.49 0.27 0.62 0.54 0.87 0.47 0.38 0.25
0
2
4
6
8
10
12
14
Mil
lio
ns o
f S
ho
rt T
on
s
Upper Atchafalaya River - Totals2007-2016, Millions of Short Tons, By Commodity

Source: USACE Waterborne Commerce Statistics Center 9
2007 2008 2009 2010 2011 2012 2013 2014 2015 2016
Total 6.78 6.30 7.63 7.13 6.90 5.43 6.80 5.46 6.33 5.69
Petro & Petro Products 1.64 1.92 2.42 2.00 2.47 2.12 2.84 2.25 2.74 1.91
Chemicals 0.68 0.47 0.82 0.67 0.55 0.37 0.43 0.38 0.48 0.20
Crude Materials 3.93 3.33 3.89 3.97 3.18 2.29 2.65 2.34 2.74 3.34
Other 0.53 0.59 0.50 0.49 0.69 0.65 0.88 0.50 0.38 0.25
0
1
2
3
4
5
6
7
8
9
Mil
lio
ns o
f S
ho
rt T
on
s
Upper Atchafalaya River - Downbound2007-2016, Millions of Short Tons, By Commodity
2007 2008 2009 2010 2011 2012 2013 2014 2015 2016
Total 4.07 3.27 4.05 2.56 3.64 3.88 5.52 5.68 4.52 3.45
Petro & Petro Products 2.49 1.90 2.65 1.55 2.18 2.65 3.93 4.33 3.41 2.55
Chemicals 0.83 0.43 0.76 0.61 0.56 0.53 0.62 0.58 0.62 0.44
Food & Farm 0.44 0.36 0.26 0.19 0.43 0.52 0.70 0.60 0.35 0.41
Other 0.30 0.58 0.37 0.20 0.47 0.18 0.27 0.16 0.14 0.04
0
1
2
3
4
5
6
Mil
lio
ns o
f S
ho
rt T
on
s
Upper Atchafalaya River - Upbound2007-2016, Millions of Short Tons, By Commodity

Source: USACE Waterborne Commerce Statistics Center 10
2007 2008 2009 2010 2011 2012 2013 2014 2015 2016
Total 2.53 2.91 2.45 2.90 2.86 2.65 2.91 2.37 2.58 2.25
Petro & Petro Products 0.51 0.55 0.46 0.45 0.60 0.53 0.48 0.49 0.52 0.39
Chemicals 1.34 1.49 1.50 1.64 1.59 1.30 1.48 0.89 0.91 0.86
Crude Materials 0.34 0.69 0.42 0.71 0.55 0.60 0.71 0.58 0.66 0.66
Other 0.34 0.18 0.07 0.10 0.11 0.23 0.23 0.42 0.49 0.35
0
1
2
3
4
Mil
lio
ns o
f S
ho
rt T
on
s
Atlantic Intracoastal Waterway Totals2007-2016, Millions of Short Tons, By Commodity
Source: USACE Waterborne Commerce Statistics Center 11
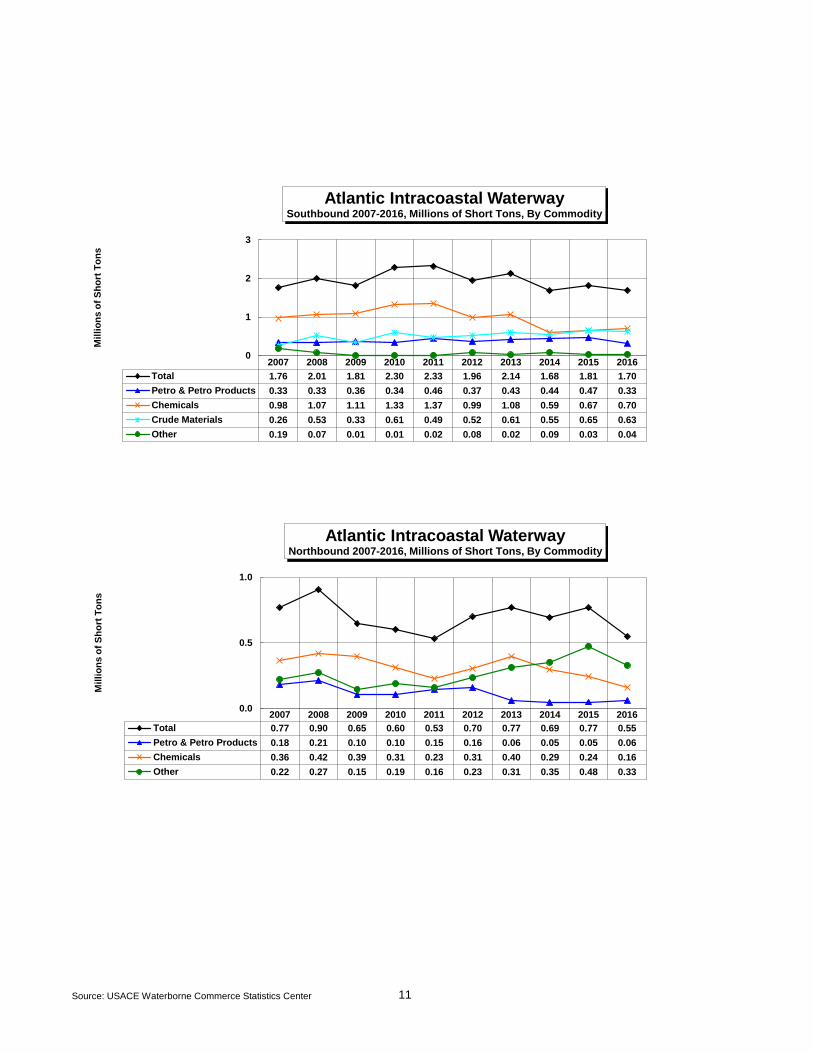
2007 2008 2009 2010 2011 2012 2013 2014 2015 2016
Total 1.76 2.01 1.81 2.30 2.33 1.96 2.14 1.68 1.81 1.70
Petro & Petro Products 0.33 0.33 0.36 0.34 0.46 0.37 0.43 0.44 0.47 0.33
Chemicals 0.98 1.07 1.11 1.33 1.37 0.99 1.08 0.59 0.67 0.70
Crude Materials 0.26 0.53 0.33 0.61 0.49 0.52 0.61 0.55 0.65 0.63
Other 0.19 0.07 0.01 0.01 0.02 0.08 0.02 0.09 0.03 0.04
0
1
2
3
Mil
lio
ns o
f S
ho
rt T
on
s
Atlantic Intracoastal Waterway Southbound 2007-2016, Millions of Short Tons, By Commodity
2007 2008 2009 2010 2011 2012 2013 2014 2015 2016
Total 0.77 0.90 0.65 0.60 0.53 0.70 0.77 0.69 0.77 0.55
Petro & Petro Products 0.18 0.21 0.10 0.10 0.15 0.16 0.06 0.05 0.05 0.06
Chemicals 0.36 0.42 0.39 0.31 0.23 0.31 0.40 0.29 0.24 0.16
Other 0.22 0.27 0.15 0.19 0.16 0.23 0.31 0.35 0.48 0.33
0.0
0.5
1.0
Mil
lio
ns o
f S
ho
rt T
on
s
Atlantic Intracoastal Waterway Northbound 2007-2016, Millions of Short Tons, By Commodity

Source: USACE Waterborne Commerce Statistics Center 12
2007 2008 2009 2010 2011 2012 2013 2014 2015 2016
Total 21.90 17.38 11.14 11.16 12.35 9.43 9.85 9.35 6.13 5.35
Coal 17.80 13.68 8.32 8.34 9.59 6.86 7.19 6.42 3.37 2.64
Petro & Petro Products 3.41 3.04 1.99 1.63 1.64 1.23 2.06 2.39 2.29 2.13
Other 0.69 0.66 0.83 1.19 1.12 1.34 0.61 0.54 0.46 0.58
0
5
10
15
20
25
Mil
lio
ns o
f S
ho
rt T
on
s
Big Sandy River - Totals2007-2016, Millions of Short Tons, By Commodity

Source: USACE Waterborne Commerce Statistics Center 13
2007 2008 2009 2010 2011 2012 2013 2014 2015 2016
Total 16.77 15.18 9.17 9.16 10.48 7.55 8.03 6.84 3.93 4.09
Coal 14.54 13.30 7.82 7.66 8.79 5.64 6.06 4.75 2.29 2.39
Petro & Petro Products 1.95 1.44 0.86 0.71 0.98 0.84 1.63 1.78 1.45 1.33
Other 0.28 0.44 0.49 0.79 0.72 1.07 0.33 0.32 0.20 0.37
0
2
4
6
8
10
12
14
16
18
Mil
lio
ns o
f S
ho
rt T
on
s
Big Sandy River - Downbound2007-2016, Millions of Short Tons, By Commodity
2007 2008 2009 2010 2011 2012 2013 2014 2015 2016
Total 5.13 2.20 1.97 1.99 1.86 1.88 1.82 2.50 2.19 1.25
Coal 3.26 0.39 0.50 0.68 0.80 1.21 1.13 1.67 1.08 0.25
Petro & Petro Products 1.46 1.59 1.13 0.92 0.66 0.39 0.42 0.61 0.84 0.79
Other 0.41 0.22 0.34 0.40 0.40 0.28 0.27 0.22 0.27 0.21
0.0
1.0
2.0
3.0
4.0
5.0
6.0
Mil
lio
ns o
f S
ho
rt T
on
s
Big Sandy River - Upbound2007-2016, Millions of Short Tons, By Commodity

Source: USACE Waterborne Commerce Statistics Center 14
2007 2008 2009 2010 2011 2012 2013 2014 2015 2016
Total 21.08 19.90 15.71 18.54 19.87 20.69 19.17 21.19 18.38 17.71
Coal 13.30 12.54 10.94 13.40 10.72 10.26 8.53 10.13 7.14 6.70
Petro & Petro Products 2.41 2.08 1.55 1.36 2.08 2.27 1.83 1.55 2.05 1.63
Crude Materials 3.21 3.17 2.06 1.99 2.09 2.12 2.26 2.49 2.31 2.97
Manufactured Goods 1.11 1.29 0.47 1.06 3.78 4.90 4.96 5.75 5.66 5.47
Other 1.05 0.81 0.69 0.73 1.19 1.14 1.59 1.27 1.22 0.94
0
5
10
15
20
25
Mil
lio
ns o
f S
ho
rt T
on
s
Black Warrior & Tombigbee Rivers Totals2007-2016, Millions of Short Tons, By Commodity

Source: USACE Waterborne Commerce Statistics Center 15
2007 2008 2009 2010 2011 2012 2013 2014 2015 2016
Total 7.77 8.52 7.65 9.14 8.72 8.98 7.87 8.65 7.85 7.17
Coal 3.78 4.32 5.11 6.96 6.28 6.13 5.20 5.80 4.58 3.60
Crude Materials 2.19 2.25 1.46 1.00 0.80 0.67 0.84 0.78 1.00 1.56
Other 1.80 1.95 1.09 1.18 1.65 2.18 1.83 2.07 2.27 2.02
0
1
2
3
4
5
6
7
8
9
10
Mil
lio
ns o
f S
ho
rt T
on
s
Black Warrior & Tombigbee RiversDownbound, 2007-2016, Millions of Short Tons, By Commodity
2007 2008 2009 2010 2011 2012 2013 2014 2015 2016
Total 13.31 11.38 8.05 9.40 11.15 11.71 11.30 12.55 10.53 10.53
Coal 9.52 8.22 5.83 6.44 4.45 4.13 3.33 4.33 2.56 3.10
Petro & Petro Products 1.59 1.33 0.98 0.84 1.82 1.79 1.40 1.04 1.44 1.27
Crude Materials 1.02 0.92 0.60 0.99 1.29 1.45 1.42 1.72 1.31 1.41
Other 1.18 0.90 0.64 1.13 3.59 4.34 5.15 5.45 5.22 4.75
0
2
4
6
8
10
12
14
Mil
lio
ns o
f S
ho
rt T
on
s
Black Warrior & Tombigbee RiversUpbound, 2007-2016, Millions of Short Tons, By Commodity

Source: USACE Waterborne Commerce Statistics Center 16
2007 2008 2009 2010 2011 2012 2013 2014 2015 2016
Total 18.51 13.68 13.24 13.26 13.06 13.55 15.13 16.17 13.50 13.77
Petro & Petro Products 6.56 4.48 4.49 4.13 3.46 3.97 5.22 5.54 3.67 3.33
Chemicals 0.09 0.23 0.16 0.12 0.11 0.10 0.15 0.20 0.16 0.26
Crude Materials 5.75 4.78 3.69 4.17 4.32 3.98 4.46 4.72 4.93 5.05
Food & Farm 5.48 3.71 4.54 4.54 4.88 5.12 4.89 5.27 4.21 4.25
Other 0.62 0.49 0.36 0.29 0.29 0.38 0.41 0.45 0.53 0.88
0
2
4
6
8
10
12
14
16
18
20
Mil
lio
ns o
f S
ho
rt T
on
s
Domestic tonnage only (including coastwise).
Columbia River - Totals2007-2016, Millions of Short Tons, By Commodity

Source: USACE Waterborne Commerce Statistics Center 17
2007 2008 2009 2010 2011 2012 2013 2014 2015 2016
Total 8.50 6.15 6.21 6.86 7.18 7.34 8.20 9.04 7.08 7.51
Crude Materials 2.58 2.00 1.44 2.07 2.20 1.93 2.14 2.34 2.36 2.76
Food & Farm 5.31 3.67 4.49 4.53 4.82 5.11 4.81 5.04 4.19 4.21
Other 0.61 0.48 0.28 0.26 0.16 0.30 1.25 1.65 0.52 0.54
0
1
2
3
4
5
6
7
8
9
10
Mil
lio
ns o
f S
ho
rt T
on
s
Domestic tonnage only (including coastwise).
Columbia River - Downbound2007-2016, Millions of Short Tons, By Commodity
2007 2008 2009 2010 2011 2012 2013 2014 2015 2016
Total 10.01 7.53 7.02 6.40 5.88 6.21 6.93 7.13 6.42 6.26
Petro & Petro Products 6.28 4.29 0.00 0.00 0.00 0.00 0.00 0.00 0.00 0.00
Chemicals 0.05 0.11 4.41 4.02 3.43 3.82 4.18 4.20 3.36 3.10
Crude Materials 3.17 2.78 0.06 0.05 0.06 0.05 0.08 0.05 0.07 0.10
Other 0.51 0.36 2.56 2.33 2.39 2.34 2.68 2.88 2.99 3.06
0
2
4
6
8
10
12
Mil
lio
ns o
f S
ho
rt T
on
s
Domestic tonnage only (including coastwise).
Columbia River - Upbound2007-2016, Millions of Short Tons, By Commodity

Source: USACE Waterborne Commerce Statistics Center 18
2007 2008 2009 2010 2011 2012 2013 2014 2015 2016
Total 22.55 23.33 21.08 21.26 21.24 19.89 22.25 22.38 21.81 22.45
Coal 11.28 11.97 10.73 9.74 10.23 9.60 10.20 9.49 8.47 8.33
Petro & Petro Products 0.56 0.37 0.20 0.21 0.17 0.16 0.34 0.34 0.49 0.78
Crude Materials 8.57 9.33 8.65 9.71 9.14 8.36 9.33 10.39 10.51 10.78
Manufactured Goods 1.47 0.97 0.64 0.70 0.81 0.90 0.98 0.97 0.93 1.14
Food & Farm 0.41 0.41 0.53 0.57 0.54 0.55 0.92 0.87 1.02 0.97
Other 0.26 0.29 0.34 0.33 0.35 0.32 0.47 0.34 0.39 0.45
0
2
4
6
8
10
12
14
16
18
20
22
24
26
Mil
lio
ns o
f S
ho
rt T
on
s
Cumberland River - Totals2007-2016, Millions of Short Tons, By Commodity

Source: USACE Waterborne Commerce Statistics Center 19
2007 2008 2009 2010 2011 2012 2013 2014 2015 2016
Total 4.52 6.06 6.38 7.68 6.81 6.09 7.04 7.85 7.66 6.58
Crude Materials 4.05 5.55 5.80 6.98 6.22 5.51 6.11 6.96 6.62 5.55
Food & Farm 0.37 0.41 0.53 0.56 0.54 0.54 0.84 0.86 0.99 0.97
Other 0.10 0.10 0.04 0.13 0.06 0.05 0.09 0.02 0.05 0.06
0
1
2
3
4
5
6
7
8
9
Mil
lio
ns o
f S
ho
rt T
on
s
Cumberland River - Downbound2007-2016, Millions of Short Tons, By Commodity
2007 2008 2009 2010 2011 2012 2013 2014 2015 2016
Total 18.03 17.27 14.70 13.58 14.43 13.80 15.21 14.54 14.16 15.87
Coal 11.25 11.90 10.71 9.70 10.22 9.60 10.16 9.48 8.46 8.31
Petro & Petro Products 0.55 0.37 0.20 0.21 0.17 0.16 0.34 0.34 0.49 0.77
Crude Materials 4.51 3.78 2.84 2.73 2.92 2.85 3.23 3.43 3.89 5.23
Manufactured Goods 1.42 0.96 0.62 0.67 0.79 0.89 0.96 0.97 0.91 1.11
Other 0.29 0.26 0.33 0.27 0.32 0.29 0.52 0.33 0.41 0.45
0
2
4
6
8
10
12
14
16
18
20
Millio
ns o
f S
ho
rt T
on
s
Cumberland River - Upbound2007-2016, Millions of Short Tons, By Commodity

Source: USACE Waterborne Commerce Statistics Center 20
2007 2008 2009 2010 2011 2012 2013 2014 2015 2016
Total 125.06 115.88 108.55 116.23 112.09 114.37 115.36 126.12 118.91 111.65
Coal 7.26 6.92 5.25 6.32 3.89 2.84 3.15 3.97 1.93 1.78
Petro & Petro Products 66.12 59.40 61.44 64.04 62.33 65.84 68.79 75.71 73.05 68.86
Chemicals 24.02 20.19 17.92 21.20 21.42 21.32 20.66 21.14 20.24 20.27
Crude Materials 19.40 20.76 16.63 16.82 17.32 16.95 15.99 17.84 17.12 14.92
Manufactured Goods 5.12 5.60 3.54 4.30 4.05 4.61 4.07 4.87 3.96 3.14
Food & Farm 1.07 1.03 1.34 1.46 1.51 1.45 1.40 1.56 1.70 1.99
Other 2.07 1.98 2.43 2.09 1.57 1.36 1.29 1.04 0.90 0.68
0
20
40
60
80
100
120
140
Mil
lio
ns o
f S
ho
rt T
on
s
Includes coastwise tonnage.
Gulf Intracoastal Waterway Totals2007-2016, Millions of Short Tons, By Commodity

Source: USACE Waterborne Commerce Statistics Center 21
2007 2008 2009 2010 2011 2012 2013 2014 2015 2016
Total 58.15 54.00 49.94 54.70 52.20 52.87 49.31 55.17 51.53 51.50
Petro & Petro Products 32.45 29.45 30.24 32.21 30.92 30.55 28.08 31.37 32.13 32.52
Chemicals 9.96 8.77 7.97 9.87 9.84 9.89 9.95 10.51 9.14 9.66
Crude Materials 6.97 6.75 4.40 5.08 5.57 6.32 5.39 6.40 5.49 5.20
Manufactured Goods 4.16 4.37 2.59 3.02 3.03 3.61 3.12 3.69 2.99 2.36
Other 4.60 4.66 4.74 4.52 2.84 2.50 2.76 3.20 1.78 1.75
0
10
20
30
40
50
60
70
Mil
lio
ns o
f S
ho
rt T
on
s
Includes coastwise tonnage.
Gulf Intracoastal Waterway Westbound2007-2016, Millions of Short Tons,By Commodity
2007 2008 2009 2010 2011 2012 2013 2014 2015 2016
Total 66.91 61.87 58.61 61.53 59.89 61.50 66.05 70.95 67.38 60.16
Coal 4.43 3.98 2.53 3.51 2.61 1.80 1.94 2.40 1.68 1.69
Petro & Petro Products 33.67 29.95 31.20 31.83 31.41 35.29 40.71 44.34 40.93 36.34
Chemicals 14.06 11.41 9.95 11.32 11.59 11.43 10.71 10.63 11.10 10.60
Crude Materials 12.43 14.01 12.23 11.74 11.75 10.63 10.61 11.44 11.63 9.73
Other 2.33 2.52 2.70 3.12 2.54 2.35 2.09 2.15 2.04 1.80
0
10
20
30
40
50
60
70
80
Mil
lio
ns o
f S
ho
rt T
on
s
Includes coastwise tonnage.
Gulf Intracoastal Waterway Eastbound2007-2016, Millions of Short Tons, By Commodity

Source: USACE Waterborne Commerce Statistics Center 22
2007 2008 2009 2010 2011 2012 2013 2014 2015 2016
Total 41.12 37.28 36.41 36.12 36.36 33.41 27.39 37.06 35.47 38.97
Coal 5.44 4.46 4.38 4.67 6.04 3.45 2.49 1.49 1.27 1.00
Petro & Petro Products 6.77 6.49 6.07 6.14 4.87 5.85 5.34 7.09 6.01 6.49
Chemicals 4.80 4.44 4.13 4.75 5.37 5.30 5.11 5.66 5.56 5.92
Crude Materials 6.53 7.19 5.95 3.83 4.57 4.54 3.64 5.63 6.66 7.42
Manufactured Goods 4.02 3.15 1.89 2.66 3.22 3.62 3.16 4.04 3.79 2.97
Food & Farm 13.49 11.51 13.92 13.84 12.07 10.57 7.61 13.16 12.15 15.13
Other 0.08 0.04 0.08 0.22 0.22 0.08 0.03 0.01 0.03 0.03
0
5
10
15
20
25
30
35
40
45
Mil
lio
ns o
f S
ho
rt T
on
s
Illinois Waterway - Totals2007-2016, Millions of Short Tons, By Commodity

Source: USACE Waterborne Commerce Statistics Center 23
2007 2008 2009 2010 2011 2012 2013 2014 2015 2016
Total 20.21 17.82 19.91 20.06 18.51 18.29 14.48 22.11 20.17 24.21
Coal 0.16 0.08 0.13 0.16 0.34 0.46 0.54 0.26 0.02 0.12
Petro & Petro Products 3.41 3.39 3.25 3.32 3.27 4.19 3.57 4.96 4.10 4.67
Food & Farm 13.31 11.24 13.58 13.48 11.75 10.07 7.06 12.75 11.80 14.80
Other 3.32 3.11 2.95 3.11 3.15 3.56 3.31 4.14 4.26 4.62
0
5
10
15
20
25
30
Mil
lio
ns o
f S
ho
rt T
on
s
Illinois Waterway - Downbound2007-2016, Millions of Short Tons, By Commodity
2007 2008 2009 2010 2011 2012 2013 2014 2015 2016
Total 20.90 19.46 16.50 16.06 17.85 15.12 12.91 14.95 15.29 14.76
Coal 5.28 4.38 4.25 4.51 5.70 2.99 1.96 1.24 1.25 0.88
Petro & Petro Products 3.36 3.10 2.82 2.83 1.60 1.66 1.77 2.12 1.91 1.81
Chemicals 3.66 3.44 2.95 3.46 3.93 3.81 3.50 3.72 3.78 3.74
Crude Materials 5.25 5.73 4.70 2.62 3.50 3.27 2.66 4.20 4.89 5.52
Other 3.36 2.80 1.78 2.63 3.13 3.39 3.01 3.67 3.47 2.80
0
5
10
15
20
25
Mil
lio
ns o
f S
ho
rt T
on
s
Illinois Waterway - Upbound2007-2016, Millions of Short Tons, By Commodity

Source: USACE Waterborne Commerce Statistics Center 24
2007 2008 2009 2010 2011 2012 2013 2014 2015 2016
Total 20.99 20.20 18.51 22.25 20.11 17.74 14.41 13.48 13.85 11.69
Coal 16.67 15.75 14.43 17.87 15.56 13.67 10.77 9.94 10.18 8.55
Petro & Petro Products 1.01 0.93 0.93 0.90 0.96 0.96 0.84 0.82 0.75 0.70
Crude Materials 2.51 2.81 2.64 2.89 2.98 2.54 2.24 2.20 2.36 1.98
Other 0.81 0.71 0.51 0.59 0.61 0.58 0.56 0.53 0.55 0.45
0
5
10
15
20
25
Mil
lio
ns o
f S
ho
rt T
on
s
Kanawha River - Totals2007-2016, Millions of Short Tons, By Commodity

Source: USACE Waterborne Commerce Statistics Center 25
2007 2008 2009 2010 2011 2012 2013 2014 2015 2016
Total 16.26 14.65 12.74 15.21 12.86 10.88 8.21 7.35 7.47 5.58
Coal 16.13 14.51 12.64 15.15 12.81 10.82 8.15 7.28 7.42 5.53
Other 0.13 0.13 0.10 0.06 0.06 0.06 0.06 0.06 0.05 0.05
0
5
10
15
20
Mil
lio
ns o
f S
ho
rt T
on
s
Kanawha River - Downbound2007-2016, Millions of Short Tons, By Commodity
2007 2008 2009 2010 2011 2012 2013 2014 2015 2016
Total 4.73 5.56 5.77 7.03 7.25 6.86 6.20 6.14 6.38 6.11
Petro & Petro Products 1.01 0.93 0.93 0.90 0.96 0.96 0.84 0.82 0.75 0.70
Crude Materials 2.48 2.74 2.60 2.87 2.97 2.53 2.24 2.20 2.36 1.98
Other 1.25 1.88 2.25 3.26 3.31 3.37 3.12 3.12 3.26 3.43
0
1
2
3
4
5
6
7
8
Mil
lio
ns o
f S
ho
rt T
on
s
Kanawha River - Upbound2007-2016, Millions of Short Tons, By Commodity

Source: USACE Waterborne Commerce Statistics Center 26
2007 2008 2009 2010 2011 2012 2013 2014 2015 2016
Total 12.10 11.01 10.76 11.12 10.63 11.38 12.19 11.95 10.23 11.62
Chemicals 1.83 1.45 1.73 1.86 2.11 2.38 2.45 2.64 2.36 3.09
Crude Materials 5.36 5.25 5.07 4.25 3.62 3.23 3.25 3.56 3.17 3.81
Manufactured Goods 1.20 1.01 0.73 1.08 0.97 1.11 1.23 1.38 1.27 0.99
Food & Farm 2.23 2.36 2.22 2.77 2.58 2.82 3.25 3.26 2.60 3.08
Other 1.47 0.93 1.01 1.15 1.35 1.84 2.01 1.10 0.82 0.65
0
2
4
6
8
10
12
14
Mil
lio
ns o
f S
ho
rt T
on
s
McClellan-Kerr Waterway - Totals2007-2016, Millions of Short Tons, By Commodity

Source: USACE Waterborne Commerce Statistics Center 27
2007 2008 2009 2010 2011 2012 2013 2014 2015 2016
Total 6.68 6.96 6.43 6.47 6.03 6.38 6.47 5.26 4.45 6.45
Crude Materials 3.84 3.97 3.67 2.95 2.46 1.94 1.77 1.46 1.59 2.63
Food & Farm 2.04 2.06 1.80 2.36 2.17 2.46 2.87 2.88 2.37 2.85
Other 0.79 0.93 0.96 1.16 1.40 1.98 1.82 0.92 0.49 0.97
0
1
2
3
4
5
6
7
8
Mil
lio
ns o
f S
ho
rt T
on
s
McClellan-Kerr Waterway - Downbound2007-2016, Millions of Short Tons, By Commodity
2007 2008 2009 2010 2011 2012 2013 2014 2015 2016
Total 5.42 4.05 4.33 4.64 4.60 5.00 5.72 6.69 5.78 5.17
Chemicals 1.53 1.07 1.30 1.51 1.67 1.82 2.05 2.21 2.19 2.50
Crude Materials 1.51 1.28 1.40 1.30 1.16 1.29 1.48 2.11 1.59 1.18
Manufactured Goods 1.14 0.90 0.72 0.94 0.90 1.09 1.23 1.38 1.24 0.95
Other 1.23 0.81 0.91 0.88 0.87 0.80 0.96 0.99 0.76 0.54
0
1
2
3
4
5
6
7
8
Mil
lio
ns o
f S
ho
rt T
on
s
McClellan-Kerr Waterway - Upbound2007-2016, Millions of Short Tons, By Commodity

Source: USACE Waterborne Commerce Statistics Center 28
2007 2008 2009 2010 2011 2012 2013 2014 2015 2016
Total 313.31 295.18 280.00 294.31 297.17 304.96 299.68 326.75 315.77 307.63
Coal 47.00 50.50 45.52 44.36 53.32 51.60 42.30 32.14 24.91 19.40
Petro & Petro Products 86.13 78.45 76.76 79.14 78.34 85.82 94.01 100.27 103.66 100.45
Chemicals 38.06 33.92 31.56 36.14 38.18 38.87 38.45 41.23 41.23 42.94
Crude Materials 48.79 49.84 44.26 44.82 43.89 42.66 43.78 48.32 43.10 36.62
Manufactured Goods 20.97 18.46 10.97 15.69 16.66 18.53 17.81 22.07 19.64 17.68
Food & Farm 71.17 62.62 70.03 73.19 65.76 66.47 62.77 82.29 82.92 90.37
Other 1.20 1.38 0.91 0.97 1.03 1.00 0.56 0.44 0.30 0.18
0
50
100
150
200
250
300
350
Millio
ns o
f S
ho
rt T
on
s
Domestic tonnage only (including coastwise).
Mississippi River - Totals2007-2016, Millions of Short Tons, By commodity

Source: USACE Waterborne Commerce Statistics Center 29
2007 2008 2009 2010 2011 2012 2013 2014 2015 2016
Total 197.23 187.95 190.02 197.96 204.41 212.09 205.09 214.57 203.07 203.62
Coal 36.65 41.17 39.34 37.58 46.76 46.13 37.43 26.69 19.57 15.68
Petro & Petro Products 46.70 44.57 44.53 48.10 52.06 59.90 65.37 64.56 63.98 62.02
Chemicals 9.90 9.17 10.15 11.41 11.55 11.48 10.99 11.46 11.98 12.52
Crude Materials 25.43 24.15 23.57 23.65 23.07 22.72 23.58 24.65 20.54 19.35
Food & Farm 69.66 60.69 67.34 70.57 63.75 63.84 60.36 79.90 80.79 88.33
Other 8.89 8.19 5.09 6.64 7.23 8.02 7.37 7.32 6.20 5.71
0
50
100
150
200
250
Mil
lio
ns o
f S
ho
rt T
on
s
Domestic tonnage only (including coastwise).
Mississippi River - Downbound2007-2016, Millions of Short Tons, By Commodity
2007 2008 2009 2010 2011 2012 2013 2014 2015 2016
Total 116.08 107.23 89.98 96.36 92.76 92.87 94.59 112.17 112.70 104.01
Coal 10.35 9.33 6.17 6.78 6.56 5.48 4.86 5.45 5.34 3.73
Petro & Petro Products 39.43 33.88 32.23 31.04 26.29 25.92 28.64 35.71 39.68 38.43
Chemicals 28.15 24.75 21.41 24.74 26.63 27.39 27.46 29.77 29.25 30.41
Crude Materials 23.36 25.69 20.69 21.17 20.81 19.94 20.20 23.67 22.56 17.26
Manufactured Goods 12.37 10.70 6.28 9.31 9.68 10.85 10.62 14.89 13.52 12.03
Other 2.41 2.88 3.19 3.32 2.79 3.29 2.80 2.69 2.35 2.15
0
20
40
60
80
100
120
140
Mil
lio
ns o
f S
ho
rt T
on
s
Domestic tonnage only (including coastwise).
Mississippi River - Upbound2007-2016, Millions of Short Tons, By Commodity
Source: USACE Waterborne Commerce Statistics Center 30
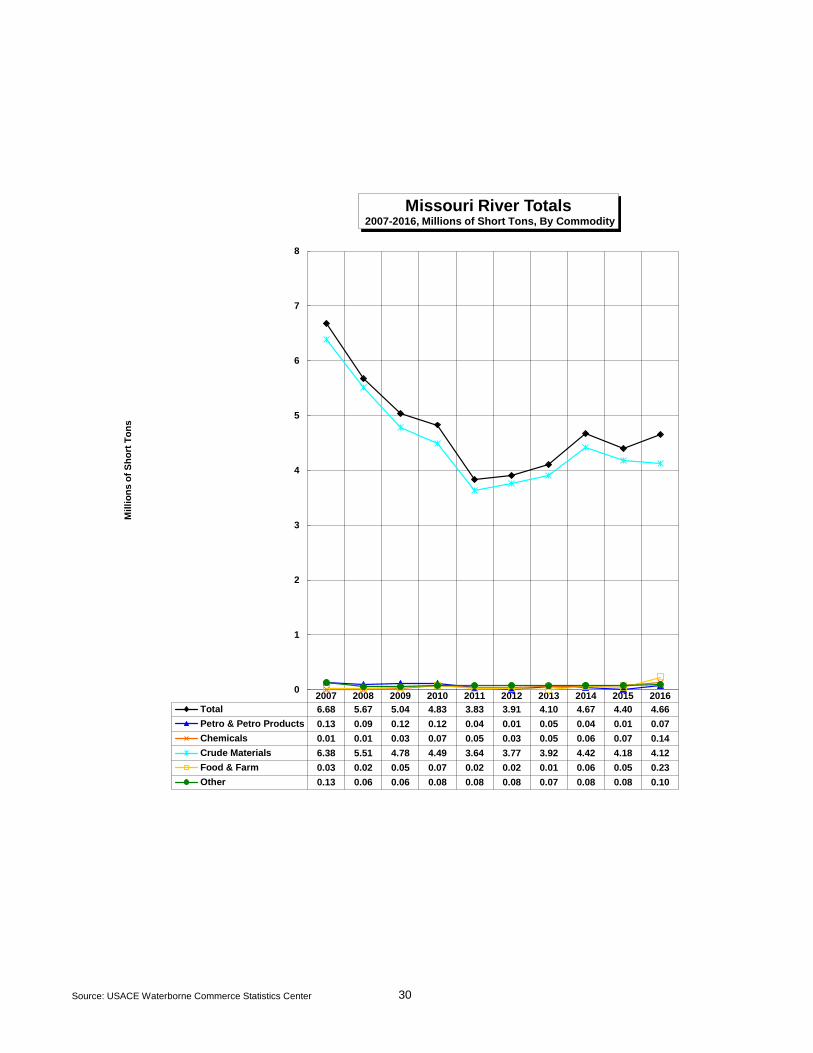
2007 2008 2009 2010 2011 2012 2013 2014 2015 2016
Total 6.68 5.67 5.04 4.83 3.83 3.91 4.10 4.67 4.40 4.66
Petro & Petro Products 0.13 0.09 0.12 0.12 0.04 0.01 0.05 0.04 0.01 0.07
Chemicals 0.01 0.01 0.03 0.07 0.05 0.03 0.05 0.06 0.07 0.14
Crude Materials 6.38 5.51 4.78 4.49 3.64 3.77 3.92 4.42 4.18 4.12
Food & Farm 0.03 0.02 0.05 0.07 0.02 0.02 0.01 0.06 0.05 0.23
Other 0.13 0.06 0.06 0.08 0.08 0.08 0.07 0.08 0.08 0.10
0
1
2
3
4
5
6
7
8
Mil
lio
ns o
f S
ho
rt T
on
s
Missouri River Totals2007-2016, Millions of Short Tons, By Commodity

Source: USACE Waterborne Commerce Statistics Center 31
2007 2008 2009 2010 2011 2012 2013 2014 2015 2016
Total 4.48 4.04 3.57 3.08 2.66 2.44 2.51 2.83 2.41 2.35
Crude Materials 4.41 4.02 3.52 3.01 2.64 2.42 2.50 2.76 2.36 2.11
Food & Farm 0.03 0.02 0.05 0.07 0.02 0.02 0.01 0.06 0.05 0.23
Other 0.04 0.00 0.00 0.00 0.00 0.00 0.00 0.00 0.00 0.02
0
1
2
3
4
5
Mil
lio
ns o
f S
ho
rt T
on
s
Missouri River Downbound2007-2016, Millions of Short Tons, By Commodity
2007 2008 2009 2010 2011 2012 2013 2014 2015 2016
Total 2.21 1.64 1.46 1.75 1.17 1.47 1.60 1.84 1.99 2.30
Crude Materials 1.97 1.49 1.26 1.48 1.00 1.35 1.42 1.66 1.82 2.01
Other 0.23 0.15 0.20 0.26 0.17 0.12 0.18 0.19 0.17 0.29
0
1
1
2
2
3
Mil
lio
ns o
f S
ho
rt T
on
s
Missouri River Upbound2007-2016, Millions of Short Tons, By Commodity

Source: USACE Waterborne Commerce Statistics Center 32
2007 2008 2009 2010 2011 2012 2013 2014 2015 2016
Total 26.69 28.00 20.94 20.93 20.19 20.37 20.47 19.36 16.32 14.48
Coal 23.38 24.57 18.40 17.75 17.33 17.58 17.79 16.44 13.35 11.86
Petro & Petro Products 0.27 0.34 0.22 0.25 0.24 0.23 0.37 0.42 0.40 0.27
Crude Materials 2.37 2.50 1.94 2.47 2.17 2.06 1.90 2.10 2.23 2.11
Other 0.66 0.59 0.39 0.46 0.44 0.49 0.41 0.40 0.33 0.23
0
5
10
15
20
25
30
Mil
lio
ns o
f S
ho
rt T
on
s
Monongahela River - Totals2007-2016, Millions of Short Tons, By Commodity

Source: USACE Waterborne Commerce Statistics Center 33
2007 2008 2009 2010 2011 2012 2013 2014 2015 2016
Total 14.30 14.76 12.35 11.15 11.41 11.66 10.10 11.05 8.97 9.28
Coal 12.68 13.27 11.32 9.92 10.14 10.50 8.97 9.65 7.62 7.98
Crude Materials 1.22 1.18 0.87 0.97 1.01 1.00 0.85 1.17 1.13 1.18
Other 0.40 0.31 0.16 0.25 0.27 0.16 0.27 0.23 0.22 0.11
0
2
4
6
8
10
12
14
16
Mil
lio
ns o
f S
ho
rt T
on
s
Monongahela River - Downbound2007-2016, Millions of Short Tons, By Commodity
2007 2008 2009 2010 2011 2012 2013 2014 2015 2016
Total 12.39 13.24 8.58 9.77 8.77 8.71 10.38 8.31 7.34 5.20
Coal 10.70 11.31 7.07 7.82 7.19 7.08 8.82 6.79 5.73 3.87
Petro & Petro Products 0.18 0.27 0.15 0.15 0.14 0.14 0.25 0.31 0.31 0.22
Crude Materials 1.16 1.32 1.07 1.50 1.16 1.07 1.04 0.94 1.10 0.93
Other 0.35 0.35 0.29 0.30 0.28 0.43 0.26 0.28 0.20 0.17
0
2
4
6
8
10
12
14
Mil
lio
ns o
f S
ho
rt T
on
s
Monongahela River - Upbound2007-2016, Millions of Short Tons, By Commodity

Source: USACE Waterborne Commerce Statistics Center 34
2007 2008 2009 2010 2011 2012 2013 2014 2015 2016
Total 230.84 230.80 207.45 220.59 215.25 216.51 215.15 220.84 201.40 184.21
Coal 123.34 128.44 118.82 122.75 122.41 122.51 119.08 112.88 93.09 82.32
Petro & Petro Products 18.70 16.91 13.77 14.18 13.29 14.04 15.22 16.70 18.85 18.82
Crude Materials 52.05 51.36 45.76 50.32 49.28 48.86 47.02 51.59 53.08 48.87
Manufactured Goods 12.26 11.40 6.71 8.55 8.04 8.36 8.44 9.75 8.61 8.19
Food & Farm 14.29 13.85 14.37 14.90 12.68 13.08 16.45 20.85 19.15 16.98
Other 10.21 8.84 8.01 9.89 9.56 9.65 8.93 9.06 8.62 9.05
0
50
100
150
200
250
Mil
lio
ns o
f S
ho
rt T
on
s
Ohio River - Totals2007-2016, Millions of Short Tons, By Commodity

Source: USACE Waterborne Commerce Statistics Center 35
2007 2008 2009 2010 2011 2012 2013 2014 2015 2016
Total 122.57 115.47 102.21 108.57 103.84 100.70 98.71 103.04 95.43 92.43
Coal 67.97 64.03 55.03 57.43 56.52 56.11 50.31 46.75 39.06 38.43
Crude Materials 28.54 26.29 23.85 26.58 24.83 22.00 23.06 25.56 26.00 25.63
Food & Farm 12.18 11.95 12.67 13.07 11.22 11.17 14.39 18.94 17.40 14.86
Other 13.88 13.20 10.65 11.49 11.27 11.41 10.94 11.79 12.97 13.50
0
20
40
60
80
100
120
140
Mil
lio
ns o
f S
ho
rt T
on
s
Ohio River - Downbound2007-2016, Millions of Short Tons, By Commodity
2007 2008 2009 2010 2011 2012 2013 2014 2015 2016
Total 108.27 115.33 105.24 112.03 111.41 115.82 116.44 117.80 105.97 91.79
Coal 55.37 64.41 63.79 65.32 65.89 66.40 68.77 66.13 54.03 43.89
Petro & Petro Products 10.64 9.11 6.93 7.42 6.58 6.97 7.56 7.79 8.49 7.86
Crude Materials 23.52 25.06 21.91 23.75 24.45 26.86 23.96 26.03 27.08 23.24
Other 18.75 16.74 12.61 15.55 14.49 15.59 16.15 17.85 16.37 16.80
0
20
40
60
80
100
120
140
Mil
lio
ns o
f S
ho
rt T
on
s
Ohio River - Upbound2007-2016, Millions of Short Tons, By Commodity

Source: USACE Waterborne Commerce Statistics Center 36
2007 2008 2009 2010 2011 2012 2013 2014 2015 2016
Total 5.42 3.70 4.40 3.38 2.72 3.25 3.66 4.36 3.64 3.40
Petro & Petro Products 1.91 1.52 1.54 0.58 0.00 0.06 0.89 1.49 1.07 0.88
Crude Materials 0.19 0.21 0.21 0.28 0.24 0.31 0.17 0.29 0.24 0.20
Food & Farm 3.10 1.85 2.59 2.51 2.45 2.86 2.57 2.55 2.29 2.21
Other 0.22 0.12 0.06 0.02 0.03 0.02 0.04 0.03 0.05 0.12
0
1
2
3
4
5
6
Mil
lio
ns o
f S
ho
rt T
on
s
Snake River - Totals2007-2016, Millions of Short Tons, By Commodity

Source: USACE Waterborne Commerce Statistics Center 37
2007 2008 2009 2010 2011 2012 2013 2014 2015 2016
Total 3.32 1.98 2.69 2.70 2.64 3.09 2.69 2.75 2.49 2.41
Crude Materials 0.07 0.05 0.08 0.18 0.18 0.22 0.10 0.19 0.18 0.15
Food & Farm 3.05 1.85 2.59 2.51 2.45 2.86 2.56 2.54 2.29 2.19
Other 0.20 0.08 0.02 0.01 0.02 0.02 0.02 0.02 0.02 0.07
0
1
1
2
2
3
3
4
Mil
lio
ns o
f S
ho
rt T
on
s
Snake River - Downbound2007-2016, Millions of Short Tons, By Commodity
2007 2008 2009 2010 2011 2012 2013 2014 2015 2016
Total 2.10 1.72 1.71 0.69 0.07 0.16 0.97 1.61 1.15 0.99
Petro & Petro Products 1.89 1.52 1.54 0.58 0.00 0.06 0.88 1.48 1.05 0.87
Other 0.21 0.20 0.17 0.11 0.07 0.10 0.09 0.13 0.10 0.12
0
1
2
3
Mil
lio
ns o
f S
ho
rt T
on
s
Snake River - Upbound2007-2016, Millions of Short Tons, By Commodity

Source: USACE Waterborne Commerce Statistics Center 38
2007 2008 2009 2010 2011 2012 2013 2014 2015 2016
Total 49.45 49.67 39.23 38.20 37.36 36.29 35.34 35.68 35.85 37.73
Coal 19.15 23.54 17.30 15.03 15.08 14.20 12.04 11.36 9.42 8.65
Crude Materials 17.14 14.40 12.21 12.54 12.01 11.29 11.32 12.13 13.73 15.32
Manufactured Goods 3.22 3.05 1.60 1.95 1.96 2.12 2.31 3.34 3.05 2.71
Food & Farm 3.70 3.76 3.58 3.37 3.01 3.32 4.24 3.70 3.51 3.45
Other 6.24 4.92 4.55 5.31 5.31 5.37 5.42 5.15 6.14 7.59
0
10
20
30
40
50
60
Mil
lio
ns o
f S
ho
rt T
on
s
Tennessee River - Totals2007-2016, Millions of Short Tons, By Commodity

Source: USACE Waterborne Commerce Statistics Center 39
2007 2008 2009 2010 2011 2012 2013 2014 2015 2016
Total 12.87 15.10 14.92 11.79 12.47 12.75 11.05 10.22 12.04 12.15
Coal 1.32 4.54 5.79 2.44 3.00 4.23 2.70 1.62 2.19 1.97
Crude Materials 8.34 7.39 6.09 6.17 5.92 5.16 4.57 4.93 5.50 5.50
Food & Farm 1.14 1.37 1.55 1.38 1.39 1.40 2.17 2.01 1.87 1.45
Other 2.06 1.80 1.49 1.79 2.16 1.97 1.61 1.67 2.48 3.23
0
4
8
12
16
Millio
ns o
f S
ho
rt T
on
s
Tennessee River - Downbound2007-2016, Millions of Short Tons, By Commodity
2007 2008 2009 2010 2011 2012 2013 2014 2015 2016
Total 36.59 34.57 24.32 26.41 24.89 23.54 24.29 25.46 23.81 25.58
Coal 17.83 19.00 11.51 12.58 12.07 9.97 9.34 9.74 7.23 6.68
Crude Materials 8.80 7.01 6.11 6.37 6.09 6.13 6.76 7.20 8.24 9.83
Manufactured Goods 2.40 2.12 1.23 1.50 1.40 1.60 1.85 2.57 2.40 2.26
Food & Farm 2.56 2.38 2.03 1.99 1.62 1.92 2.08 1.69 1.64 2.00
Other 5.00 4.05 3.43 3.96 3.71 3.92 4.27 4.26 4.30 4.81
0
5
10
15
20
25
30
35
40
Millio
ns o
f S
ho
rt T
on
s
Tennessee River - Upbound2007-2016, Millions of Short Tons, By Commodity

Source: USACE Waterborne Commerce Statistics Center 40
2007 2008 2009 2010 2011 2012 2013 2014 2015 2016
Total 6.22 6.49 5.79 5.93 6.49 7.10 7.84 8.80 8.07 7.93
Coal 1.05 0.98 1.64 1.71 1.67 1.56 1.61 1.84 1.24 1.73
Crude Materials 3.09 3.45 2.72 2.65 2.42 2.29 2.45 3.09 3.22 3.55
Other 2.08 2.05 1.43 1.57 2.39 3.25 3.79 3.86 3.61 2.64
0
1
2
3
4
5
6
7
8
9
10
Mil
lio
ns o
f S
ho
rt T
on
s
Tennessee-Tombigbee Waterway - Totals2007-2016, Millions of Short Tons, By Commodity

Source: USACE Waterborne Commerce Statistics Center 41
2007 2008 2009 2010 2011 2012 2013 2014 2015 2016
Total 3.46 4.23 3.97 3.62 2.88 3.02 3.26 3.98 3.56 3.97
Coal 1.02 0.94 1.59 1.69 1.52 1.30 1.34 1.59 1.05 1.61
Crude Materials 1.88 2.35 1.87 1.49 0.85 0.69 0.84 1.25 1.36 1.69
Other 0.56 0.94 0.51 0.44 0.52 1.04 1.07 1.14 1.15 0.66
0
1
1
2
2
3
3
4
4
5
Mil
lio
ns o
f S
ho
rt T
on
s
Tennessee - Tombigbee WaterwaySouthbound, 2007-2016, Millions of Short Tons, By Commodity
2007 2008 2009 2010 2011 2012 2013 2014 2015 2016
Total 2.75 2.26 1.82 2.31 3.60 4.08 4.59 4.82 4.51 3.96
Crude Materials 1.20 1.11 0.85 1.16 1.58 1.60 1.61 1.84 1.86 1.86
Other 1.55 1.15 0.97 1.15 2.03 2.48 2.98 2.97 2.65 2.10
0
1
2
3
4
5
6
Mil
lio
ns o
f S
ho
rt T
on
s
Tennessee - Tombigbee Waterway Northbound, 2007-2016, Millions of Short Tons, By Commodity