Embed Size (px)
Citation preview

Final
Water Quality Modeling for Packwood Lake for
Energy Northwest's Packwood Lake Hydroelectric Project
FERC No. 2244 Lewis County, Washington
Submitted to
P.O. Box 968 Richland, Washington 99352-0968
Submitted by
1155 North State Street, Suite 700 Bellingham, Washington 98225
360.734.5915 phone, 360.734.5918 fax
October 2007
Consulting EES
Packwood Lake Water Quality Model Report
Packwood Lake Hydroelectric Project i Final October 2007 FERC No. 2244
TABLE OF CONTENTS
1.0 Introduction........................................................................................................... 1
1.1 Purpose............................................................................................................. 1
1.2 Packwood Lake and Project Facilities............................................................... 2
2.0 Study Area............................................................................................................ 2
3.0 Methods................................................................................................................ 2
3.1 Model Selection ................................................................................................ 2
3.2 Model Period..................................................................................................... 7
3.3 Model Setup...................................................................................................... 7
3.3.1 Model Geometry .......................................................................................... 7
3.3.1.1 Bathymetry............................................................................................ 7
3.3.1.2 Boundaries............................................................................................ 7
3.3.1.3 Grid Development ................................................................................. 8
3.3.1.4 Project Features.................................................................................. 10
3.3.2 Meteorology............................................................................................... 10
3.3.3 Hydrology .................................................................................................. 11
3.3.3.1 Lake Elevation .................................................................................... 11
3.3.3.2 Tributary Inflow ................................................................................... 11
3.3.3.3 Outflow................................................................................................ 12
3.3.4 Water Quality Data .................................................................................... 16
4.0 Results ............................................................................................................... 18
4.1 Calibration....................................................................................................... 18
4.1.1 Hydrodynamics.......................................................................................... 19
4.1.2 Temperature .............................................................................................. 19
4.1.3 Dissolved Oxygen...................................................................................... 22
4.1.5 Other Water Quality Constituents .............................................................. 25
4.2 Model Application............................................................................................ 25
5.0 Summary ............................................................................................................ 32
6.0 Literature Cited................................................................................................... 33
Packwood Lake Water Quality Model Report
Packwood Lake Hydroelectric Project ii Final October 2007 FERC No. 2244
List of Figures
Figure 2.1. Packwood Lake Hydroelectric Project Facilities, General Location............. 3 Figure 3.1. Coordinate system for CE-QUAL-W2 Version 2.......................................... 5 Figure 3.2. Coordinate system for CE-QUAL-W2 Version 3.1....................................... 6 Figure 3.3. Model segments and bathymetric contours for Packwood Lake. ................ 8 Figure 3.4. Plan view of CE-QUAL-W2 grid .................................................................. 9 Figure 3.5. Profile view of CE-QUAL-W2 grid ............................................................... 9 Figure 3.6. Tributary inflows for CE-QUAL-W2 model................................................. 12 Figure 3.7. Project outflows used in the CE-QUAL-W2 model for existing condition... 13 Figure 3.8. Outflow for the natural lake condition. ....................................................... 14 Figure 3.9. Outflow for the proposed Project operation scenario. ............................... 16 Figure 3.10. Water quality monitoring locations for Packwood Lake and boundary
conditions.................................................................................................. 17 Figure 4.1. Comparison of measured and modeled water surface elevation for existing
conditions. ................................................................................................. 19 Figure 4.2. Comparison of surface measured and predicted temperatures................. 20 Figure 4.3. Measured and predicted water temperature profiles ................................. 21 Figure 4.4. Measured and predicted dissolved oxygen profiles................................... 24 Figure 4.5. Packwood Lake water surface elevation for existing (2005), natural, and
proposed operational conditions. .............................................................. 26 Figure 4.6. Comparison of existing and natural surface water temperatures .............. 27 Figure 4.7. Comparison of surface water temperatures for natural conditions and the
proposed Project operation condition........................................................ 27 Figure 4.8. Water temperature profiles for natural and proposed Project operation
conditions.................................................................................................. 29 Figure 4.9. Dissolved oxygen profiles for natural and proposed conditions ................ 31 Figure 4.10 Chlorophyll a levels for existing, natural and proposed conditions............ 32
List of Tables
Table 3.1. Packwood Lake model grid characteristics.................................................. 8
Table 3.2. Project Features Incorporated into CE-QUAL-W2 Model for Packwood Lake .......................................................................................................... 10
Table 4.1. Model error statistics for water surface elevation for Packwood Lake ....... 19
Table 4.2. Model error statistics for water surface temperature at segment 7 (sampling site PLA) for Packwood Lake .................................................................... 20
Table 4.3. Model error statistics for vertical temperature profiles ............................... 22
Table 4.4. Model error statistics for vertical dissolved oxygen profiles ....................... 23
Packwood Lake Water Quality Model Report
Packwood Lake Hydroelectric Project 1 Final October 2007 FERC No. 2244
PACKWOOD LAKE HYDROELECTRIC PROJECT FERC Project No. 2244
Water Quality Model Report for Packwood Lake
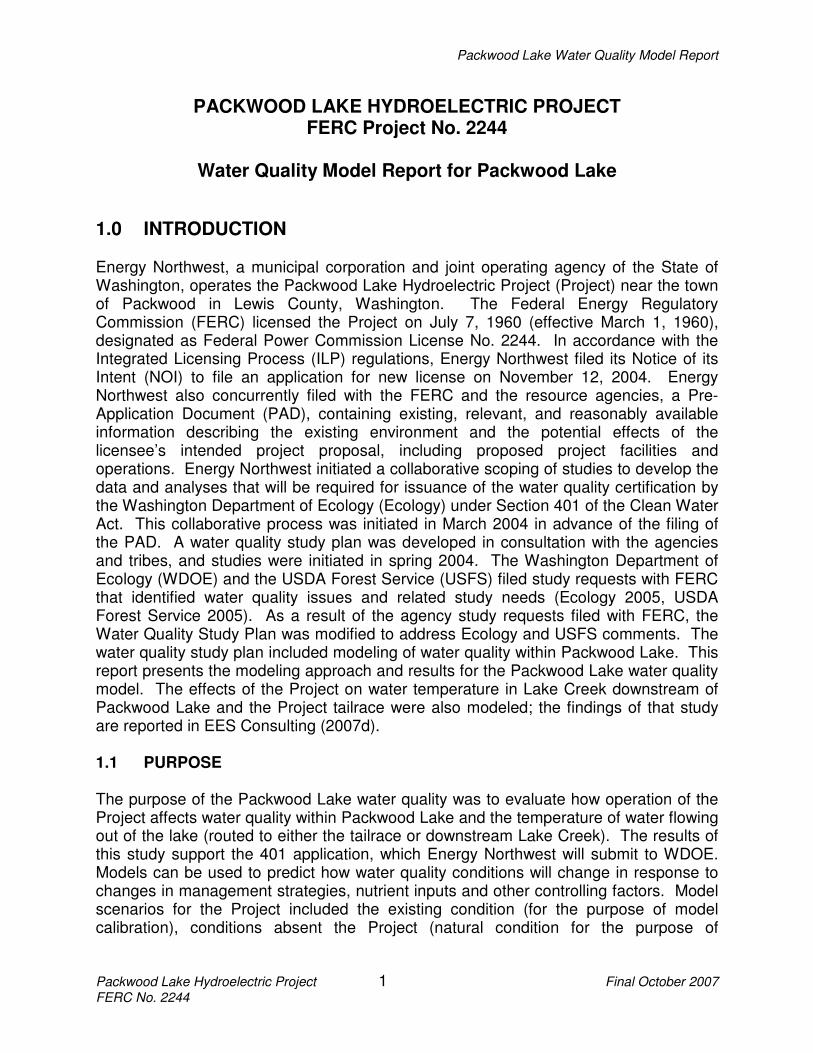
1.0 INTRODUCTION Energy Northwest, a municipal corporation and joint operating agency of the State of Washington, operates the Packwood Lake Hydroelectric Project (Project) near the town of Packwood in Lewis County, Washington. The Federal Energy Regulatory Commission (FERC) licensed the Project on July 7, 1960 (effective March 1, 1960), designated as Federal Power Commission License No. 2244. In accordance with the Integrated Licensing Process (ILP) regulations, Energy Northwest filed its Notice of its Intent (NOI) to file an application for new license on November 12, 2004. Energy Northwest also concurrently filed with the FERC and the resource agencies, a Pre-Application Document (PAD), containing existing, relevant, and reasonably available information describing the existing environment and the potential effects of the licensee’s intended project proposal, including proposed project facilities and operations. Energy Northwest initiated a collaborative scoping of studies to develop the data and analyses that will be required for issuance of the water quality certification by the Washington Department of Ecology (Ecology) under Section 401 of the Clean Water Act. This collaborative process was initiated in March 2004 in advance of the filing of the PAD. A water quality study plan was developed in consultation with the agencies and tribes, and studies were initiated in spring 2004. The Washington Department of Ecology (WDOE) and the USDA Forest Service (USFS) filed study requests with FERC that identified water quality issues and related study needs (Ecology 2005, USDA Forest Service 2005). As a result of the agency study requests filed with FERC, the Water Quality Study Plan was modified to address Ecology and USFS comments. The water quality study plan included modeling of water quality within Packwood Lake. This report presents the modeling approach and results for the Packwood Lake water quality model. The effects of the Project on water temperature in Lake Creek downstream of Packwood Lake and the Project tailrace were also modeled; the findings of that study are reported in EES Consulting (2007d). 1.1 PURPOSE The purpose of the Packwood Lake water quality was to evaluate how operation of the Project affects water quality within Packwood Lake and the temperature of water flowing out of the lake (routed to either the tailrace or downstream Lake Creek). The results of this study support the 401 application, which Energy Northwest will submit to WDOE. Models can be used to predict how water quality conditions will change in response to changes in management strategies, nutrient inputs and other controlling factors. Model scenarios for the Project included the existing condition (for the purpose of model calibration), conditions absent the Project (natural condition for the purpose of

Packwood Lake Water Quality Model Report
Packwood Lake Hydroelectric Project 2 Final October 2007 FERC No. 2244
establishing a baseline relative to water quality criteria), and conditions for the proposed Project operation (for the purpose of evaluating future Project effects). 1.2 PACKWOOD LAKE AND PROJECT FACILITIES Located within the Gifford Pinchot National Forest, Packwood Lake was formed when a large mass of soil and rock slid off Snyder Mountain and dammed Lake Creek approximately 1,100 years ago (Swanson 1996). Water that originates as rainfall and snowmelt in the Goat Rocks Wilderness Area and the Cascade Mountains drains into Packwood Lake. The natural elevation of Packwood Lake lies at an elevation of approximately 2,857 feet MSL. Packwood Lake and Lake Creek are bounded on the southwest by Snyder Mountain, elevation 5,011 feet. Upper Lake Creek is the largest tributary flowing into Packwood Lake. Meltwater from glaciers located in the Upper Lake Creek watershed contribute to the flow in Upper Lake Creek. Consequently, Upper Lake Creek seasonally carries a high suspended sediment load, which influences water quality within Packwood Lake and Lake Creek.
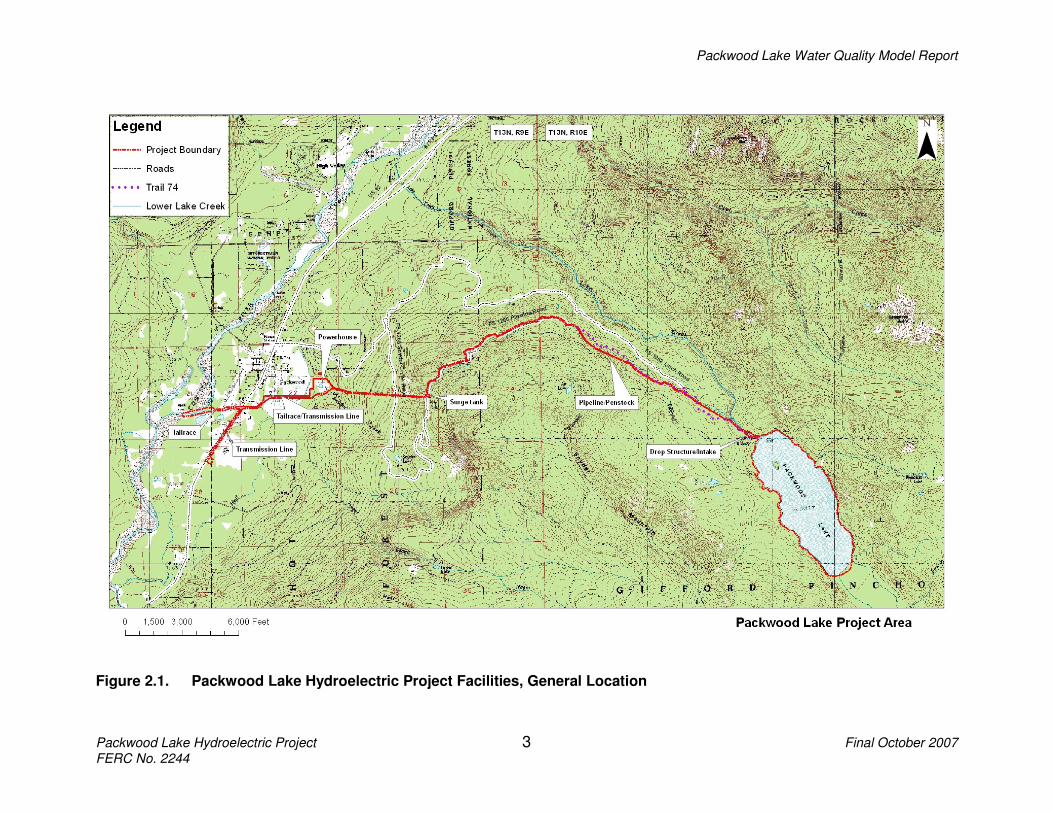
2.0 STUDY AREA The study area includes Packwood Lake. The mouths of tributaries were identified as boundary conditions in the model. Project outflow structures including the Project intake, bypass flow pipe and drop structure were incorporated into the model. Figure 2.1 shows the general location of Packwood Lake.
3.0 METHODS 3.1 MODEL SELECTION Selection of the appropriate water quality model is a function of properly identifying the water quality problem ("conceptualization") and selecting a model that appropriately describes the water quality changes in the water body, is theoretically valid, and can be easily adapted to site-specific physical characteristics of the water body. The performance of a mathematical model in predicting the existing and future water quality dynamics of a system is dependent on the following steps: (i) identification of the problem (ii) selection of model type and relationship of model to the problem (iii) computational representation (iv) model response studies or model sensitivity analyses (v) model calibration (vi) application of model to evaluate management strategies
Packwood Lake Water Quality Model Report
Packwood Lake Hydroelectric Project 3 Final October 2007 FERC No. 2244
Figure 2.1. Packwood Lake Hydroelectric Project Facilities, General Location

Packwood Lake Water Quality Model Report
Packwood Lake Hydroelectric Project 4 Final October 2007 FERC No. 2244
Because there are many water quality models available, a choice of the appropriate model would be made after considering the following questions: (1) What physical processes are represented in the model and which are ignored? (2) How are physical processes included in the model? (3) What processes are represented by model coefficients? For example in defining the problem, the following questions could be asked: (i) What are the dominant physical processes at work and can the chosen model represent those processes? (For example, how does the water move? Is there stratification, wind-driven currents, and/or selective withdrawal?) (ii) What are the spatial and temporal scales of these processes and can the model represent them? (For example, is steady-state representation adequate; is 1-D, 2-D, or 3-D spatial discretization necessary?) The choice of the proper model is also based on answering: (1) Site specific questions (physical characteristics of the each system component -
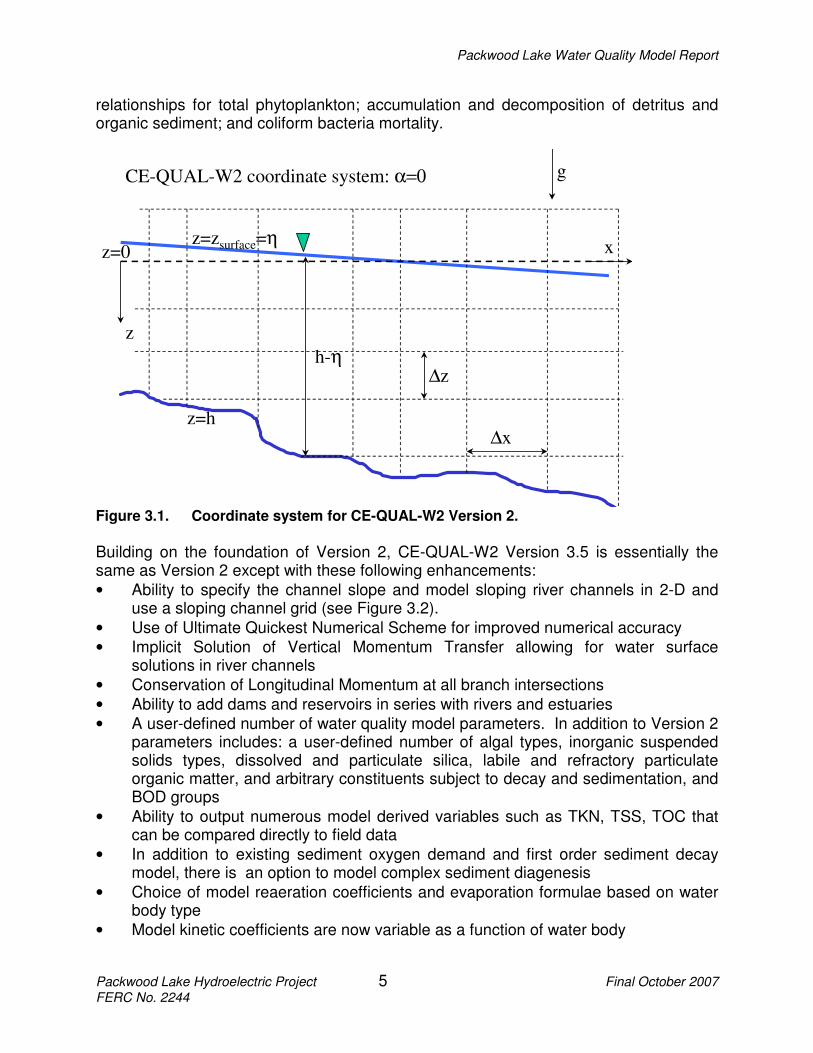
river or reservoir reach, water quality cycles, algal types), (2) Management objectives (required accuracy, use for future studies), and (3) Project resources (data availability, staff constraints, time limitations). The model chosen for Packwood Lake was the Corps of Engineers model CE-QUAL-W2 Version 3.5 (Cole and Wells 2006). CE-QUAL-W2 Version 3.5 is a dynamic 2-D (x-z) model developed for stratified water-bodies (Cole and Buchak 1995). This is a Corps of Engineers modification of the Laterally Averaged Reservoir Model (Edinger and Buchak 1978). CE-QUAL-W2, whose grid is shown in Figure 3.1, consists of directly coupled hydrodynamic and water quality transport models. Hydrodynamic computations are influenced by variable water density caused by temperature, salinity, and dissolved and suspended solids. Developed for reservoirs and narrow, stratified estuaries, CE-QUAL-W2 can handle a branched and/or looped system with flow and/or head boundary conditions. With two dimensions depicted, point and non-point loading can be spatially distributed. Relative to other 2-D models, CE-QUAL-W2 is efficient and cost effective to use. This model allows the user to use the QUICKEST numerical scheme for constituent transport rather than the UPWIND scheme. In addition to temperature, CE-QUAL-W2 Version 3.5 simulates as many as 49 other water quality variables. Primary physical processes included are surface heat transfer, short-wave and long-wave radiation and penetration, convective mixing, wind and flow induced mixing, entrainment of ambient water by pumped-storage inflows, inflow density stratification as impacted by temperature and dissolved and suspended solids. Major chemical and biological processes in CE-QUAL-W2 include: the effects of DO of atmospheric exchange, photosynthesis, respiration, organic matter decomposition, nitrification, and chemical oxidation of reduced substances; uptake, excretion, and regeneration of phosphorus and nitrogen and nitrification-denitrification under aerobic and anaerobic conditions; carbon cycling and alkalinity-pH-CO2 interactions; trophic
Packwood Lake Water Quality Model Report
Packwood Lake Hydroelectric Project 5 Final October 2007 FERC No. 2244
relationships for total phytoplankton; accumulation and decomposition of detritus and organic sediment; and coliform bacteria mortality.
x
z
z=zsurface=η
z=h
gCE-QUAL-W2 coordinate system: α=0
z=0
h-η
∆x
∆z
Figure 3.1. Coordinate system for CE-QUAL-W2 Version 2.
Building on the foundation of Version 2, CE-QUAL-W2 Version 3.5 is essentially the same as Version 2 except with these following enhancements:
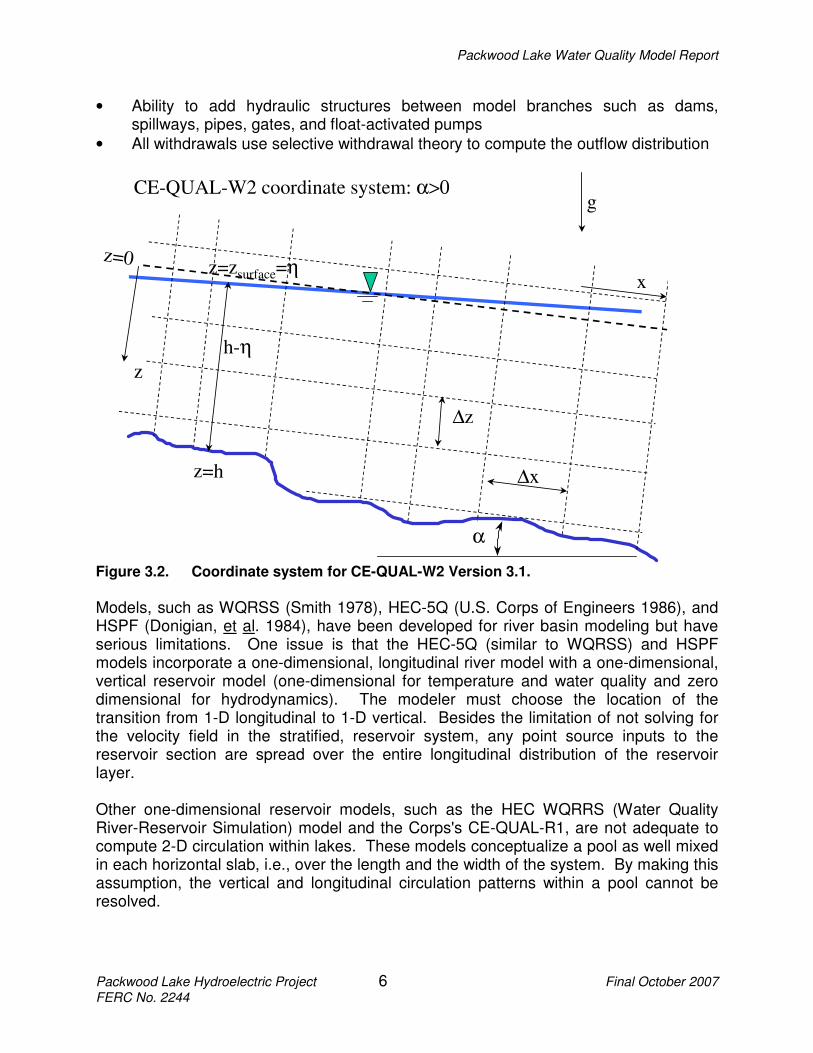
• Ability to specify the channel slope and model sloping river channels in 2-D and use a sloping channel grid (see Figure 3.2).
• Use of Ultimate Quickest Numerical Scheme for improved numerical accuracy
• Implicit Solution of Vertical Momentum Transfer allowing for water surface solutions in river channels
• Conservation of Longitudinal Momentum at all branch intersections
• Ability to add dams and reservoirs in series with rivers and estuaries
• A user-defined number of water quality model parameters. In addition to Version 2 parameters includes: a user-defined number of algal types, inorganic suspended solids types, dissolved and particulate silica, labile and refractory particulate organic matter, and arbitrary constituents subject to decay and sedimentation, and BOD groups
• Ability to output numerous model derived variables such as TKN, TSS, TOC that can be compared directly to field data
• In addition to existing sediment oxygen demand and first order sediment decay model, there is an option to model complex sediment diagenesis
• Choice of model reaeration coefficients and evaporation formulae based on water body type
• Model kinetic coefficients are now variable as a function of water body
Packwood Lake Water Quality Model Report
Packwood Lake Hydroelectric Project 6 Final October 2007 FERC No. 2244
• Ability to add hydraulic structures between model branches such as dams, spillways, pipes, gates, and float-activated pumps
• All withdrawals use selective withdrawal theory to compute the outflow distribution
x
z
z=h
gCE-QUAL-W2 coordinate system: α>0
z=0
h-η
∆z
α
∆x
z=zsurface=η
Figure 3.2. Coordinate system for CE-QUAL-W2 Version 3.1.
Models, such as WQRSS (Smith 1978), HEC-5Q (U.S. Corps of Engineers 1986), and HSPF (Donigian, et al. 1984), have been developed for river basin modeling but have serious limitations. One issue is that the HEC-5Q (similar to WQRSS) and HSPF models incorporate a one-dimensional, longitudinal river model with a one-dimensional, vertical reservoir model (one-dimensional for temperature and water quality and zero dimensional for hydrodynamics). The modeler must choose the location of the transition from 1-D longitudinal to 1-D vertical. Besides the limitation of not solving for the velocity field in the stratified, reservoir system, any point source inputs to the reservoir section are spread over the entire longitudinal distribution of the reservoir layer. Other one-dimensional reservoir models, such as the HEC WQRRS (Water Quality River-Reservoir Simulation) model and the Corps's CE-QUAL-R1, are not adequate to compute 2-D circulation within lakes. These models conceptualize a pool as well mixed in each horizontal slab, i.e., over the length and the width of the system. By making this assumption, the vertical and longitudinal circulation patterns within a pool cannot be resolved.
Packwood Lake Water Quality Model Report
Packwood Lake Hydroelectric Project 7 Final October 2007 FERC No. 2244
Based on the depth of Packwood Lake, a one-dimensional model would not be adequate because of possible longitudinal and vertical gradients in water quality. Because Packwood Lake is relatively narrow, lateral homogeneity can be assumed without loss of resolution. The CE-QUAL-W2 model has been under development for many years and is a public-domain code maintained by the Corps of Engineers, Waterways Experiments Station (WES), located in Vicksburg, Mississippi. The current version, Version 3.5 (Cole and Wells 2006), has undergone rigorous testing and has been successfully applied to many river basin systems. Further information about CE-QUAL-W2 Version 3.5 is shown at http://www.ce.pdx.edu/w2.
3.2 MODEL PERIOD
Water quality data for Packwood Lake and its tributaries were available from April through October for 2004 and 2005. The meteorological station at Packwood Lake was not activated until mid-July 2004. Therefore, the period April 20, 2005 through October 31, 2005 (Julian day 110 – 304) was selected as the best model period.
3.3 MODEL SETUP
3.3.1 Model Geometry
3.3.1.1 Bathymetry
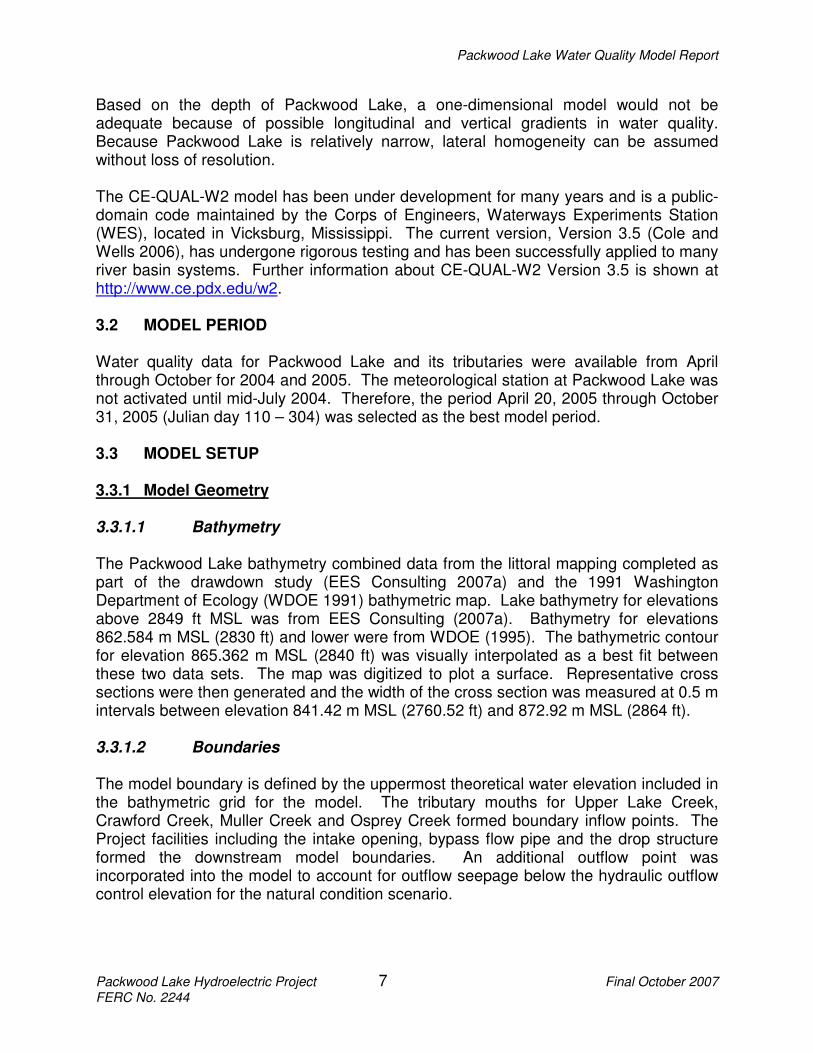
The Packwood Lake bathymetry combined data from the littoral mapping completed as part of the drawdown study (EES Consulting 2007a) and the 1991 Washington Department of Ecology (WDOE 1991) bathymetric map. Lake bathymetry for elevations above 2849 ft MSL was from EES Consulting (2007a). Bathymetry for elevations 862.584 m MSL (2830 ft) and lower were from WDOE (1995). The bathymetric contour for elevation 865.362 m MSL (2840 ft) was visually interpolated as a best fit between these two data sets. The map was digitized to plot a surface. Representative cross sections were then generated and the width of the cross section was measured at 0.5 m intervals between elevation 841.42 m MSL (2760.52 ft) and 872.92 m MSL (2864 ft).
3.3.1.2 Boundaries
The model boundary is defined by the uppermost theoretical water elevation included in the bathymetric grid for the model. The tributary mouths for Upper Lake Creek, Crawford Creek, Muller Creek and Osprey Creek formed boundary inflow points. The Project facilities including the intake opening, bypass flow pipe and the drop structure formed the downstream model boundaries. An additional outflow point was incorporated into the model to account for outflow seepage below the hydraulic outflow control elevation for the natural condition scenario.

Packwood Lake Water Quality Model Report
Packwood Lake Hydroelectric Project 8 Final October 2007 FERC No. 2244
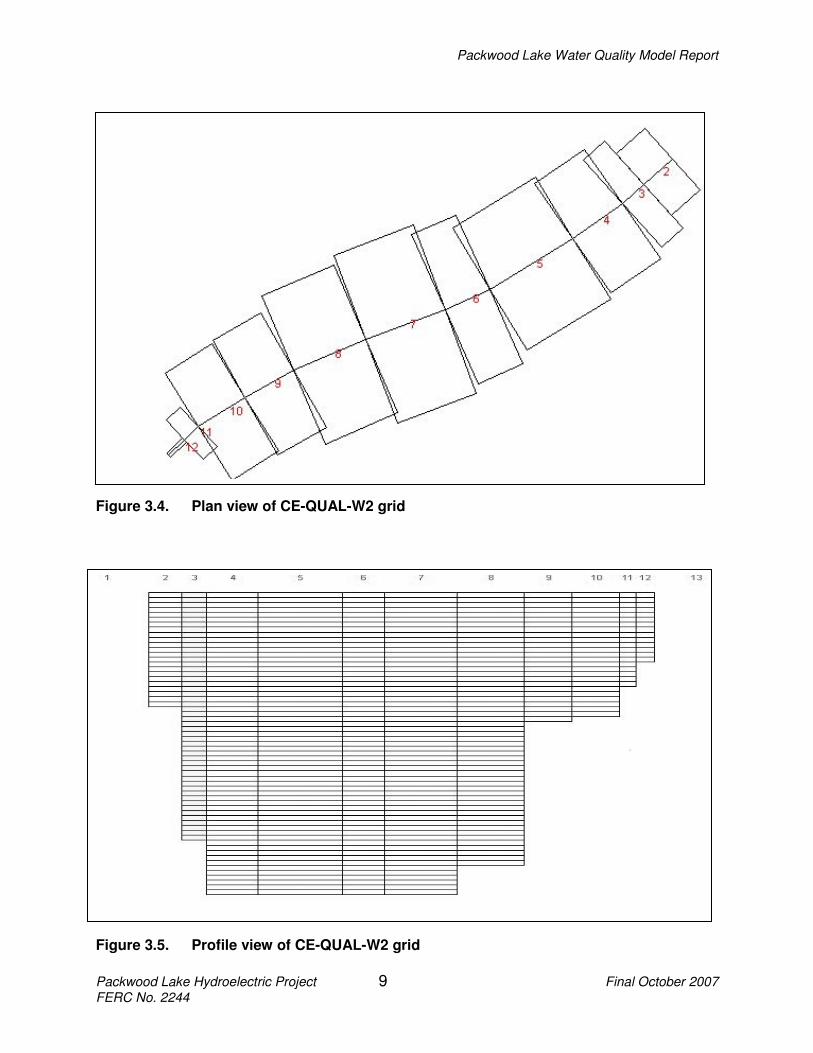
3.3.1.3 Grid Development The bathymetric map of the lake was partitioned into 12 longitudinal segments based on the variability of the shoreline and lake depths. Cross-sectional widths were measured at the longitudinal midpoint of each segment. Figure 3.3 shows the grid segments on a map of the lake that also shows the 10 ft vertical contour intervals. Segments 1 and 13 are dimensionless boundary segments. Each segment was partitioned into vertical layers at 0.5 m intervals. The layer widths of the segment with the island were reduced so that the island mass was not included in the lake grid. Figure 3.4 and Figure 3.5 show the CE-QUAL-W2 model plan view and side view of the grid respectively. Table 3.1 lists the grid characteristics. Table 3.1. Packwood Lake model grid characteristics
Value Parameter Description
841.42 m WSL Grid Bottom Elevation
872.42 m WSL Top of Grid Elevation
870.8136 Natural Lake Elevation
13 Number of segments, IMX
63 Number of layers, KMX
98 – 501 m Segment Length (Longitudinal Spacing)
0.5 m Segment Layer Height (Vertical Spacing)
1 Number of Water bodies
1 Number of Branches
Figure 3.3. Model segments and bathymetric contours for Packwood Lake.
Packwood Lake Water Quality Model Report
Packwood Lake Hydroelectric Project 9 Final October 2007 FERC No. 2244
Figure 3.4. Plan view of CE-QUAL-W2 grid
Figure 3.5. Profile view of CE-QUAL-W2 grid
Packwood Lake Water Quality Model Report
Packwood Lake Hydroelectric Project 10 Final October 2007 FERC No. 2244
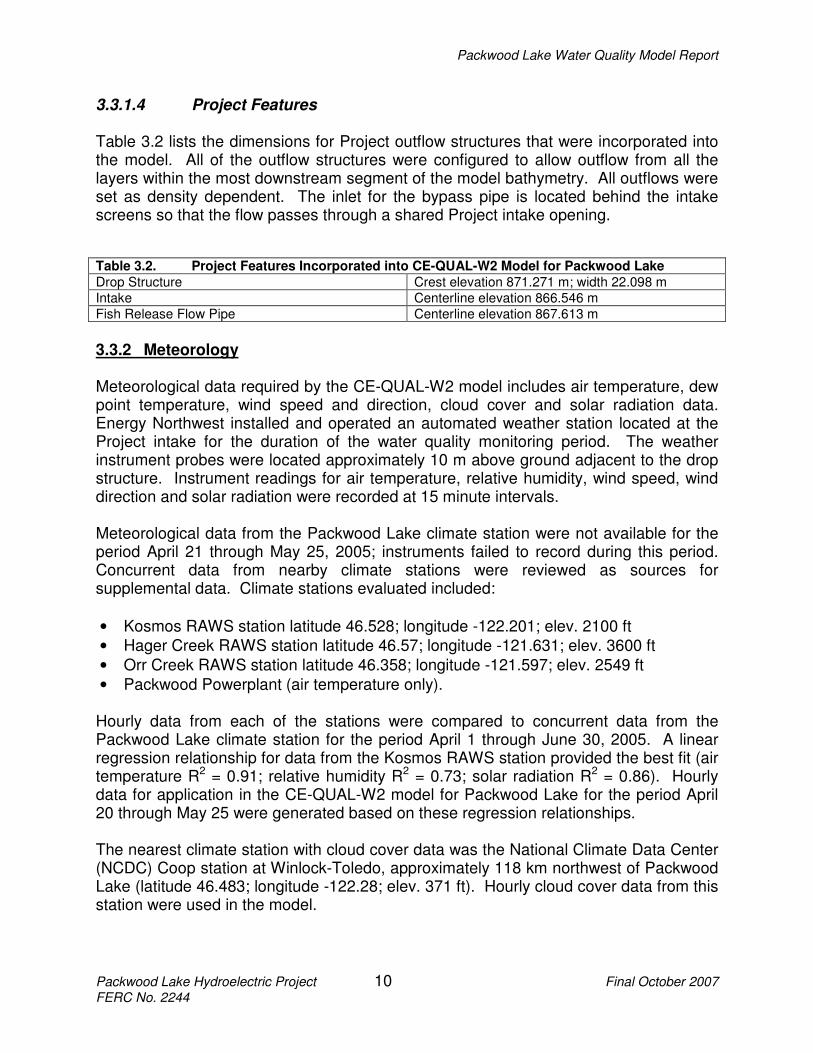
3.3.1.4 Project Features Table 3.2 lists the dimensions for Project outflow structures that were incorporated into the model. All of the outflow structures were configured to allow outflow from all the layers within the most downstream segment of the model bathymetry. All outflows were set as density dependent. The inlet for the bypass pipe is located behind the intake screens so that the flow passes through a shared Project intake opening.
Table 3.2. Project Features Incorporated into CE-QUAL-W2 Model for Packwood Lake
Drop Structure Crest elevation 871.271 m; width 22.098 m
Intake Centerline elevation 866.546 m
Fish Release Flow Pipe Centerline elevation 867.613 m
3.3.2 Meteorology
Meteorological data required by the CE-QUAL-W2 model includes air temperature, dew point temperature, wind speed and direction, cloud cover and solar radiation data. Energy Northwest installed and operated an automated weather station located at the Project intake for the duration of the water quality monitoring period. The weather instrument probes were located approximately 10 m above ground adjacent to the drop structure. Instrument readings for air temperature, relative humidity, wind speed, wind direction and solar radiation were recorded at 15 minute intervals. Meteorological data from the Packwood Lake climate station were not available for the period April 21 through May 25, 2005; instruments failed to record during this period. Concurrent data from nearby climate stations were reviewed as sources for supplemental data. Climate stations evaluated included:
• Kosmos RAWS station latitude 46.528; longitude -122.201; elev. 2100 ft
• Hager Creek RAWS station latitude 46.57; longitude -121.631; elev. 3600 ft
• Orr Creek RAWS station latitude 46.358; longitude -121.597; elev. 2549 ft
• Packwood Powerplant (air temperature only). Hourly data from each of the stations were compared to concurrent data from the Packwood Lake climate station for the period April 1 through June 30, 2005. A linear regression relationship for data from the Kosmos RAWS station provided the best fit (air temperature R2 = 0.91; relative humidity R2 = 0.73; solar radiation R2 = 0.86). Hourly data for application in the CE-QUAL-W2 model for Packwood Lake for the period April 20 through May 25 were generated based on these regression relationships. The nearest climate station with cloud cover data was the National Climate Data Center (NCDC) Coop station at Winlock-Toledo, approximately 118 km northwest of Packwood Lake (latitude 46.483; longitude -122.28; elev. 371 ft). Hourly cloud cover data from this station were used in the model.
Packwood Lake Water Quality Model Report
Packwood Lake Hydroelectric Project 11 Final October 2007 FERC No. 2244
Air temperature and relative humidity data were used to calculate the dew point temperature at Packwood Lake using Equation 1 below (Singh 1992).
8
9.0112
1.0112
+
+−=
a
da
T
TTRH
3.3.3 Hydrology
3.3.3.1 Lake Elevation
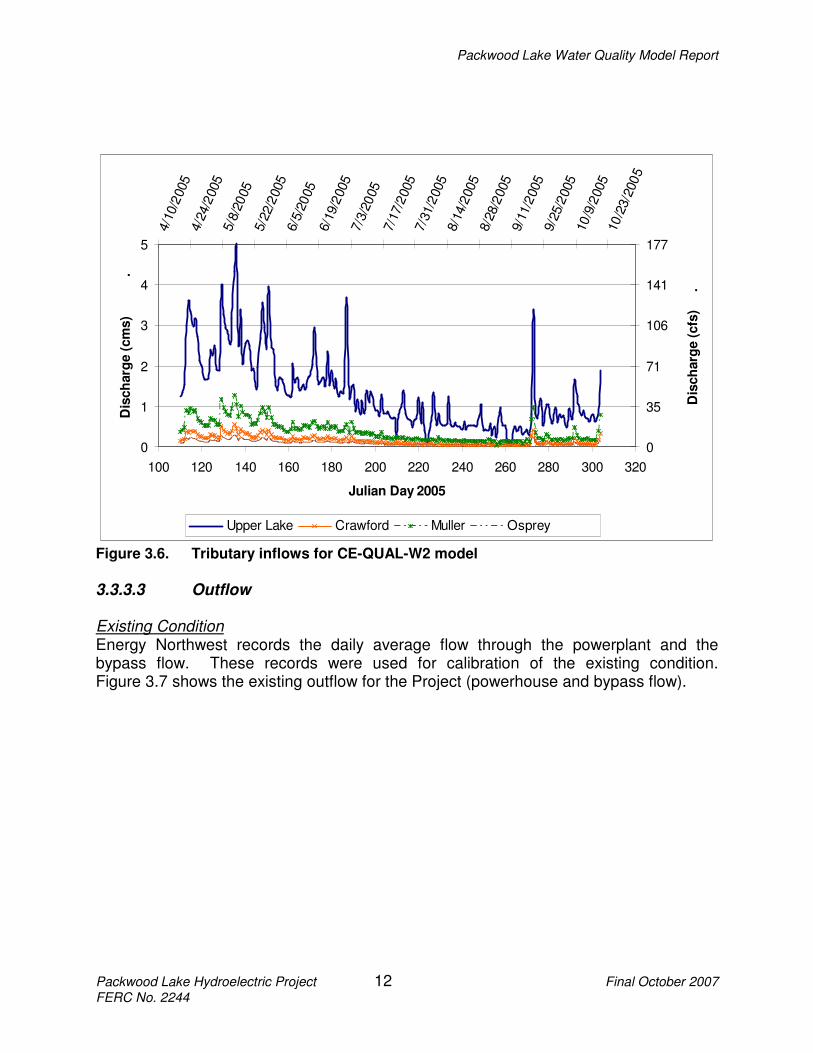
Lake elevation data are recorded daily by Energy Northwest as part of Project operation records. These data for the 2005 model period were initially used for model calibration. There is only limited information on seasonal lake level fluctuations prior to construction of the project. Royce (1965): notes “The changes in lake level recorded by the U.S. Geological Survey through the years ’60 through ’63 show differences between annual maxima and minima ranging from 2.3 to 3.4 feet. The summer changes in lake level between May 1 and September 15 during these same years ranged from approximately 1.2 to 2.1 feet.”…..“I would judge from the shoreline development that the seasonal average in lake level must have been in the neighborhood of 2856 to 2857 feet, as measured by the most recent surveys.” 3.3.3.2 Tributary Inflow Energy Northwest records the daily total inflow to Packwood Lake based on a back calculation of outflow and change in lake volume. The Project operation records for total inflow were partitioned among the tributaries based on basin area. The proportion of the total inflow allocated to Upper Lake Creek was increased to account for the greater contribution of snow pack within this tributary basin. The relative increase was adjusted so that the flow in other tributaries was approximately equal to the measured flows. Figure 3.6 shows the tributary inflows. The model was set up with Upper Lake Creek as the branch inflow with Crawford, Muller and Osprey Creeks as tributaries.
Packwood Lake Water Quality Model Report
Packwood Lake Hydroelectric Project 12 Final October 2007 FERC No. 2244
0
1
2
3
4
5
100 120 140 160 180 200 220 240 260 280 300 320
Julian Day 2005
Dis
ch
arg
e (
cm
s)
.
0
35
71
106
141
177
4/1
0/2
005
4/2
4/2
005
5/8
/2005
5/2
2/2
005
6/5
/2005
6/1
9/2
005
7/3
/2005
7/1
7/2
005
7/3
1/2
005
8/1
4/2
005
8/2
8/2
005
9/1
1/2
005
9/2
5/2
005
10/9
/2005
10/2
3/2
005
Dis
ch
arg
e (
cfs
) .
Upper Lake Crawford Muller Osprey
Figure 3.6. Tributary inflows for CE-QUAL-W2 model
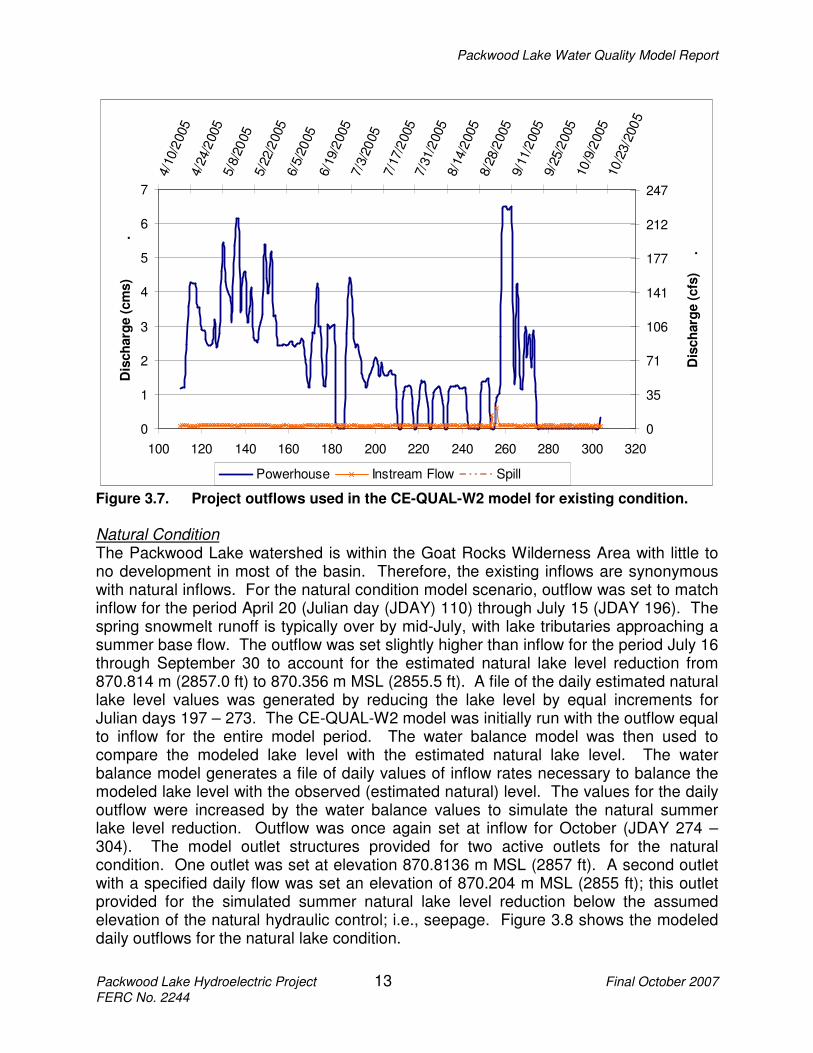
3.3.3.3 Outflow Existing Condition Energy Northwest records the daily average flow through the powerplant and the bypass flow. These records were used for calibration of the existing condition. Figure 3.7 shows the existing outflow for the Project (powerhouse and bypass flow).
Packwood Lake Water Quality Model Report
Packwood Lake Hydroelectric Project 13 Final October 2007 FERC No. 2244
0
1
2
3
4
5
6
7
100 120 140 160 180 200 220 240 260 280 300 320
Julian Day 2005
Dis
ch
arg
e (
cm
s)
.
0
35
71
106
141
177
212
247
4/1
0/2
005
4/2
4/2
005
5/8
/2005
5/2
2/2
005
6/5
/2005
6/1
9/2
005
7/3
/2005
7/1
7/2
005
7/3
1/2
005
8/1
4/2
005
8/2
8/2
005
9/1
1/2
005
9/2
5/2
005
10/9
/2005
10/2
3/2
005
Dis
ch
arg
e (
cfs
) .
Powerhouse Instream Flow Spill
Figure 3.7. Project outflows used in the CE-QUAL-W2 model for existing condition.
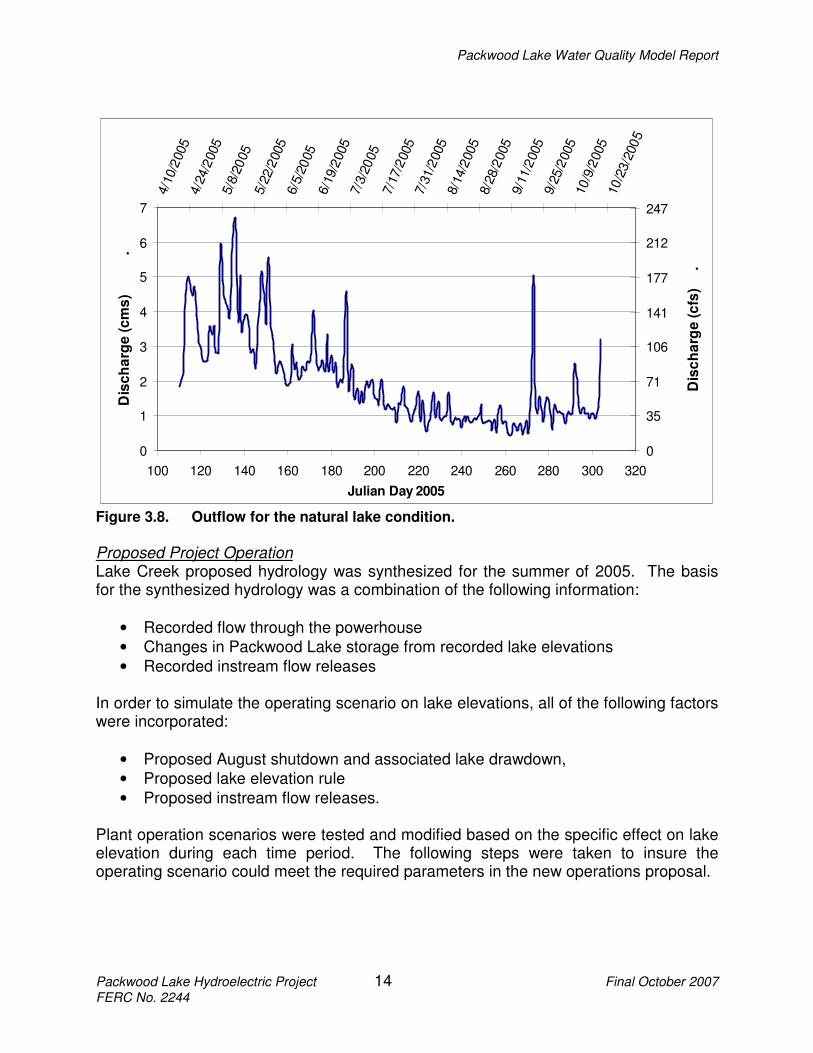
Natural Condition The Packwood Lake watershed is within the Goat Rocks Wilderness Area with little to no development in most of the basin. Therefore, the existing inflows are synonymous with natural inflows. For the natural condition model scenario, outflow was set to match inflow for the period April 20 (Julian day (JDAY) 110) through July 15 (JDAY 196). The spring snowmelt runoff is typically over by mid-July, with lake tributaries approaching a summer base flow. The outflow was set slightly higher than inflow for the period July 16 through September 30 to account for the estimated natural lake level reduction from 870.814 m (2857.0 ft) to 870.356 m MSL (2855.5 ft). A file of the daily estimated natural lake level values was generated by reducing the lake level by equal increments for Julian days 197 – 273. The CE-QUAL-W2 model was initially run with the outflow equal to inflow for the entire model period. The water balance model was then used to compare the modeled lake level with the estimated natural lake level. The water balance model generates a file of daily values of inflow rates necessary to balance the modeled lake level with the observed (estimated natural) level. The values for the daily outflow were increased by the water balance values to simulate the natural summer lake level reduction. Outflow was once again set at inflow for October (JDAY 274 – 304). The model outlet structures provided for two active outlets for the natural condition. One outlet was set at elevation 870.8136 m MSL (2857 ft). A second outlet with a specified daily flow was set an elevation of 870.204 m MSL (2855 ft); this outlet provided for the simulated summer natural lake level reduction below the assumed elevation of the natural hydraulic control; i.e., seepage. Figure 3.8 shows the modeled daily outflows for the natural lake condition.
Packwood Lake Water Quality Model Report
Packwood Lake Hydroelectric Project 14 Final October 2007 FERC No. 2244
0
1
2
3
4
5
6
7
100 120 140 160 180 200 220 240 260 280 300 320
Julian Day 2005
Dis
ch
arg
e (
cm
s)
.
0
35
71
106
141
177
212
247
4/1
0/2
005
4/2
4/2
005
5/8
/2005
5/2
2/2
005
6/5
/2005
6/1
9/2
005
7/3
/2005
7/1
7/2
005
7/3
1/2
005
8/1
4/2
005
8/2
8/2
005
9/1
1/2
005
9/2
5/2
005
10/9
/2005
10/2
3/2
005
Dis
ch
arg
e (
cfs
) .
Figure 3.8. Outflow for the natural lake condition.
Proposed Project Operation Lake Creek proposed hydrology was synthesized for the summer of 2005. The basis for the synthesized hydrology was a combination of the following information:
• Recorded flow through the powerhouse
• Changes in Packwood Lake storage from recorded lake elevations
• Recorded instream flow releases In order to simulate the operating scenario on lake elevations, all of the following factors were incorporated:
• Proposed August shutdown and associated lake drawdown,
• Proposed lake elevation rule
• Proposed instream flow releases. Plant operation scenarios were tested and modified based on the specific effect on lake elevation during each time period. The following steps were taken to insure the operating scenario could meet the required parameters in the new operations proposal.
Packwood Lake Water Quality Model Report
Packwood Lake Hydroelectric Project 15 Final October 2007 FERC No. 2244
• From April 20, 2005 through July 15, 2005 water out of Packwood Lake was equal to the recorded flow through the powerhouse plus the proposed instream flow of 0.113 cms (4 cfs). Lake elevation on July 15 was 870.935 m MSL (2857.4 ft).
• From July 16 through July 30, 2005 the Project was operated (hypothetically) to reduce the lake level by 0.6 m (2 ft) from the July 15 level. The instream flow was set at 0.113 cms (4 cfs). The actual recorded powerhouse flow for each day was used plus a fixed additional amount to lower the lake 2 feet. After several trial runs, the additional amount of water to be taken through the powerhouse each day was 0.625 cms (23.23 cfs).
• From July 31, 2005 (a Sunday) through August 21, 2005 the Project was shut down and lake levels rose depending on recorded inflow to the lake. Instream flow release increased to 0.198 cms (7 cfs) on August 1.
• On August 21, 2005 Packwood Lake was at 871.027 m MSL (2857.7 ft) based on the modeled flow balance. On August 22, the project was operated (hypothetically) at the recorded flow through the powerhouse plus an additional flow computed to bring the lake level lower with 0.198 cms (7 cfs) instream flow.
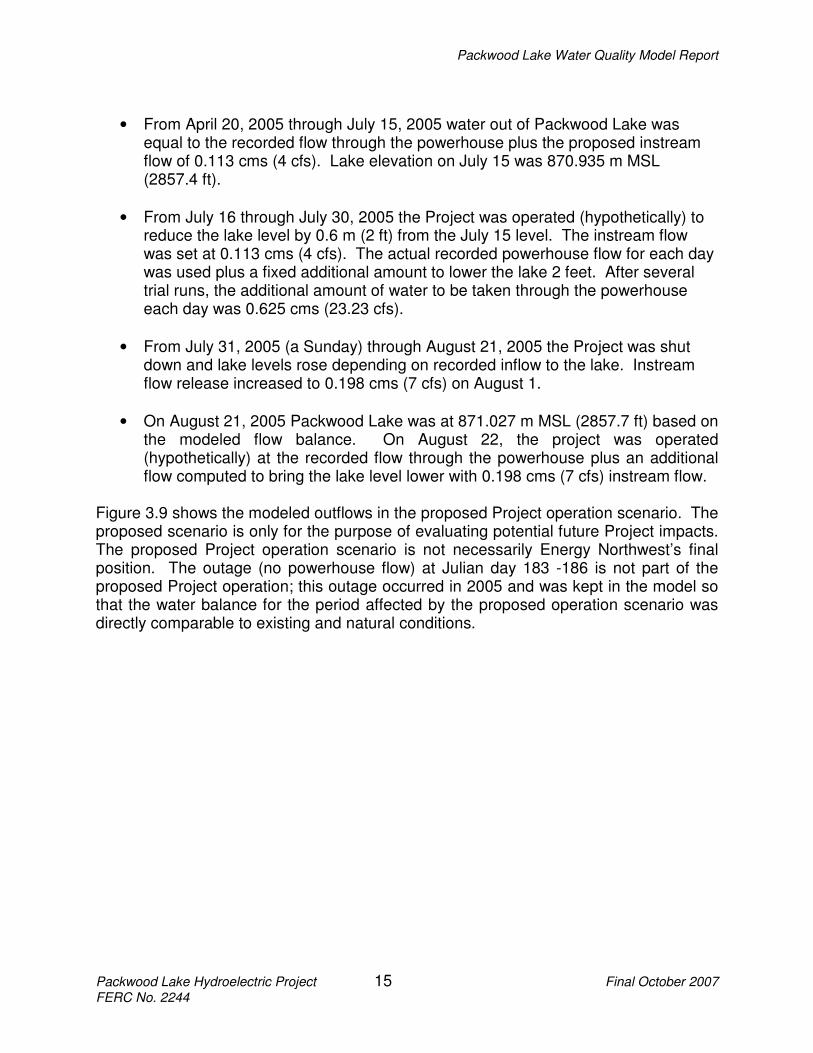
Figure 3.9 shows the modeled outflows in the proposed Project operation scenario. The proposed scenario is only for the purpose of evaluating potential future Project impacts. The proposed Project operation scenario is not necessarily Energy Northwest’s final position. The outage (no powerhouse flow) at Julian day 183 -186 is not part of the proposed Project operation; this outage occurred in 2005 and was kept in the model so that the water balance for the period affected by the proposed operation scenario was directly comparable to existing and natural conditions.
Packwood Lake Water Quality Model Report
Packwood Lake Hydroelectric Project 16 Final October 2007 FERC No. 2244
0
1
2
3
4
5
6
7
100 120 140 160 180 200 220 240 260 280 300 320
Julian Day 2005
Dis
ch
arg
e (
cm
s)
.
0
35
71
106
141
177
212
247
4/1
0/2
005
4/2
4/2
005
5/8
/2005
5/2
2/2
005
6/5
/2005
6/1
9/2
005
7/3
/2005
7/1
7/2
005
7/3
1/2
005
8/1
4/2
005
8/2
8/2
005
9/1
1/2
005
9/2
5/2
005
10/9
/2005
10/2
3/2
005
Dis
ch
arg
e (
cfs
) .
Powerhouse Instream Flow Spill
Figure 3.9. Outflow for the proposed Project operation scenario.
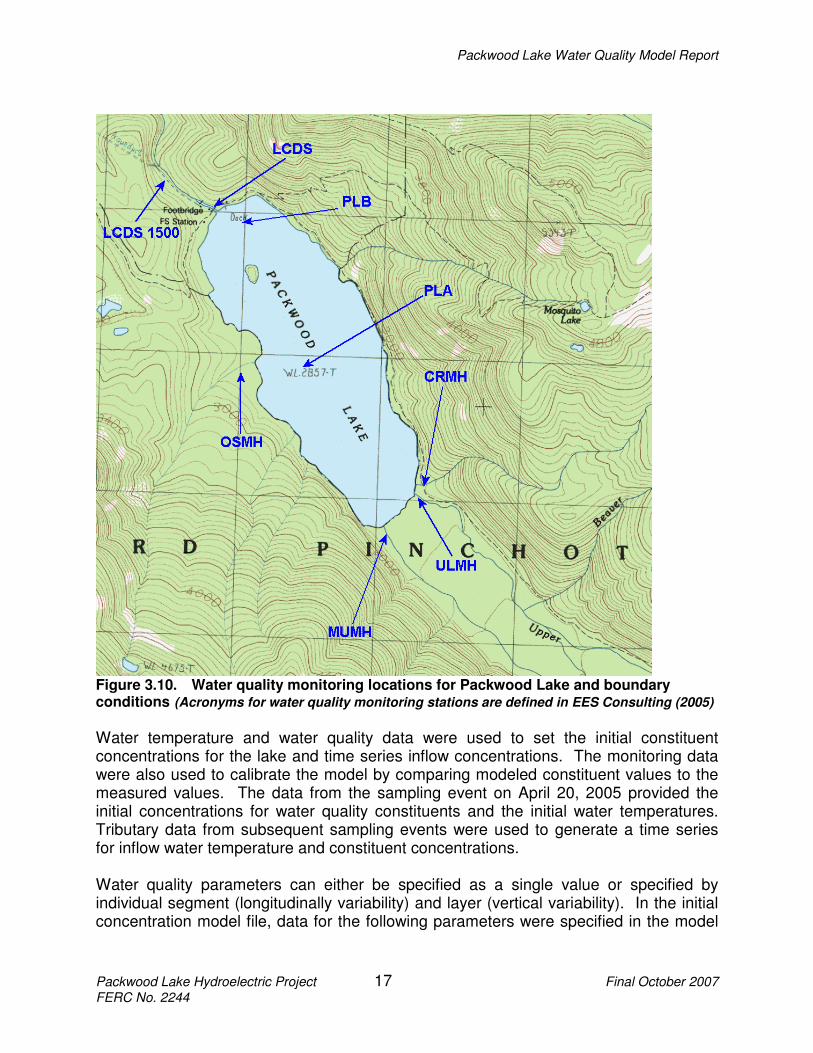
3.3.4 Water Quality Data Measured water quality data were used for both model setup and calibration. The model requires the initial starting water temperature and water quality constituent concentrations be specified. Inflow temperatures and constituent concentrations must also be specified for the entire model period. The time step can be variable for model input data for each water quality parameter. Water temperatures were monitored continuously with hourly recordings for tributary mouths (boundary conditions) and at multiple depths at two locations in the lake. Results for water temperature monitoring are reported in EES Consulting (2006a) and EES Consulting (2007b). Water quality constituents in Packwood Lake and its tributaries were monitored monthly with two monitoring events occurring in August 2005. The results of this study are reported in EES Consulting (2006b) and EES Consulting (2007c). Figure 3.10 shows the location of water quality monitoring stations.
Packwood Lake Water Quality Model Report
Packwood Lake Hydroelectric Project 17 Final October 2007 FERC No. 2244
Figure 3.10. Water quality monitoring locations for Packwood Lake and boundary conditions (Acronyms for water quality monitoring stations are defined in EES Consulting (2005)
Water temperature and water quality data were used to set the initial constituent concentrations for the lake and time series inflow concentrations. The monitoring data were also used to calibrate the model by comparing modeled constituent values to the measured values. The data from the sampling event on April 20, 2005 provided the initial concentrations for water quality constituents and the initial water temperatures. Tributary data from subsequent sampling events were used to generate a time series for inflow water temperature and constituent concentrations. Water quality parameters can either be specified as a single value or specified by individual segment (longitudinally variability) and layer (vertical variability). In the initial concentration model file, data for the following parameters were specified in the model
Packwood Lake Water Quality Model Report
Packwood Lake Hydroelectric Project 18 Final October 2007 FERC No. 2244
as a vertical profile for segments 7 (sampling station PLA) and segment 11 (sampling station PLB):
• Temperature,
• Algal group 1: Baciliphyta,
• Algal group 2: Chrysophta, and
• Algal group 3: Chrysophyta, and
• Dissolved oxygen. The model derives the pH so it was not necessary to include pH in the vertical profile input file. All other water quality constituents were specified as a single value in the initial concentration file. The three most dominant algal groups were selected for modeling. Algal concentrations in the model are based on chlorophyll a. Therefore, the measured biomass data for algal groups had to be converted to the equivalent chlorophyll a concentration. Equation 2 states the formula for converting algal biomass to the equivalent chlorophyll a value.
1000*67**1
1 ChlassTotalbioma
biomassALGALG
=
Where: ALG1 = model constituent concentration for algal group 1 (g/m3) AL1biomass = biomass for algal group 1 (µm3/mL) Totalbiomass = Total algal biomass (µm3/mL) Chla = Chlorophyll a (µm3/mL) Conversion rate biomass to chlorophyll a = 67 (Reynolds 1993) The temperature inflow files used an hourly time step. The time step for the water quality constituent inflow files was approximately monthly and based on the sampling dates.
4.0 RESULTS 4.1 CALIBRATION Calibration is the process of comparing model results to the measured data and adjusting the model variables to achieve a best fit. The model hydrodynamics are first calibrated. Temperature is next calibrated. Dissolved oxygen and algal groups are calibrated next.
Packwood Lake Water Quality Model Report
Packwood Lake Hydroelectric Project 19 Final October 2007 FERC No. 2244
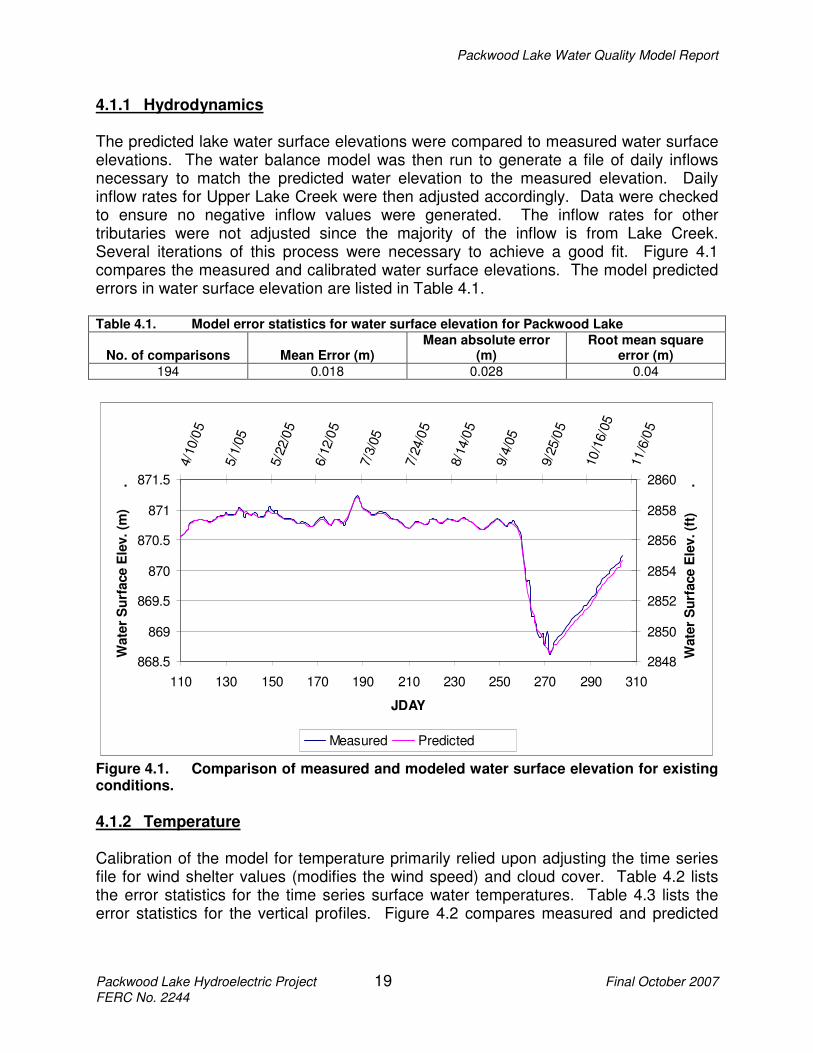
4.1.1 Hydrodynamics The predicted lake water surface elevations were compared to measured water surface elevations. The water balance model was then run to generate a file of daily inflows necessary to match the predicted water elevation to the measured elevation. Daily inflow rates for Upper Lake Creek were then adjusted accordingly. Data were checked to ensure no negative inflow values were generated. The inflow rates for other tributaries were not adjusted since the majority of the inflow is from Lake Creek. Several iterations of this process were necessary to achieve a good fit. Figure 4.1 compares the measured and calibrated water surface elevations. The model predicted errors in water surface elevation are listed in Table 4.1. Table 4.1. Model error statistics for water surface elevation for Packwood Lake
No. of comparisons Mean Error (m) Mean absolute error
(m) Root mean square
error (m)
194 0.018 0.028 0.04
868.5
869
869.5
870
870.5
871
871.5
110 130 150 170 190 210 230 250 270 290 310
JDAY
Wate
r S
urf
ace E
lev. (m
) .
2848
2850
2852
2854
2856
2858
2860
4/1
0/0
5
5/1
/05
5/2
2/0
5
6/1
2/0
5
7/3
/05
7/2
4/0
5
8/1
4/0
5
9/4
/05
9/2
5/0
5
10
/16/0
5
11
/6/0
5
Wate
r S
urf
ace E
lev. (f
t) .
Measured Predicted
Figure 4.1. Comparison of measured and modeled water surface elevation for existing conditions.
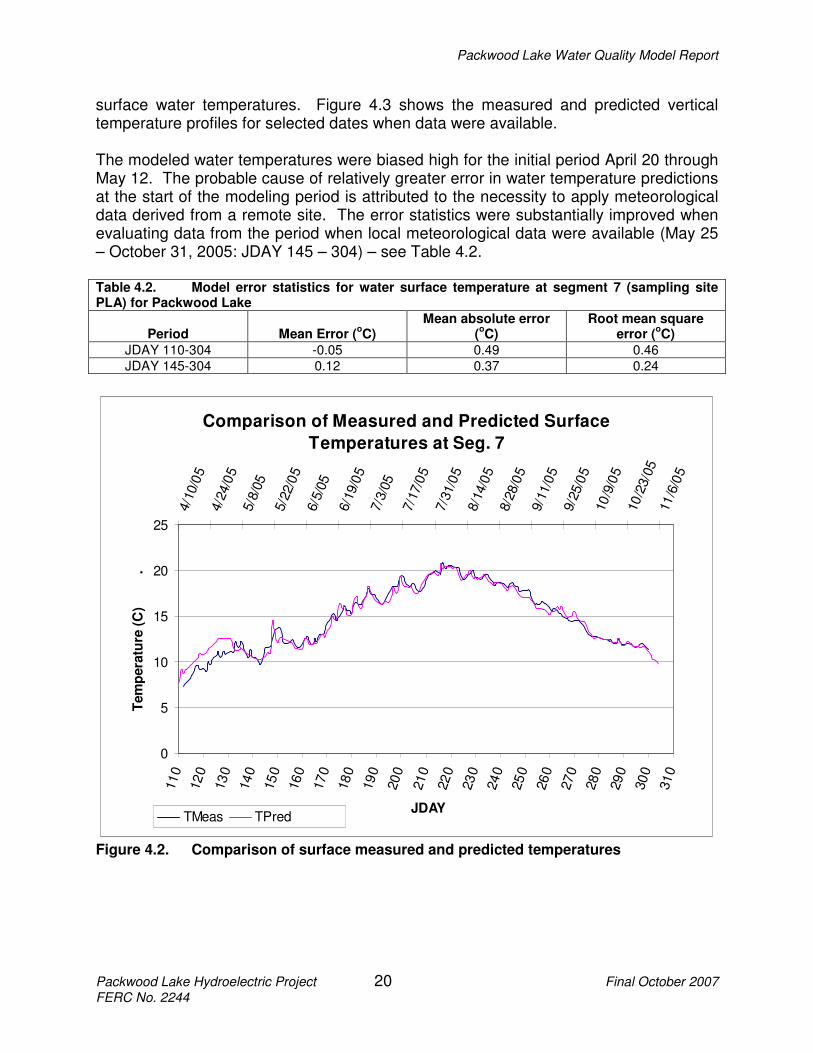
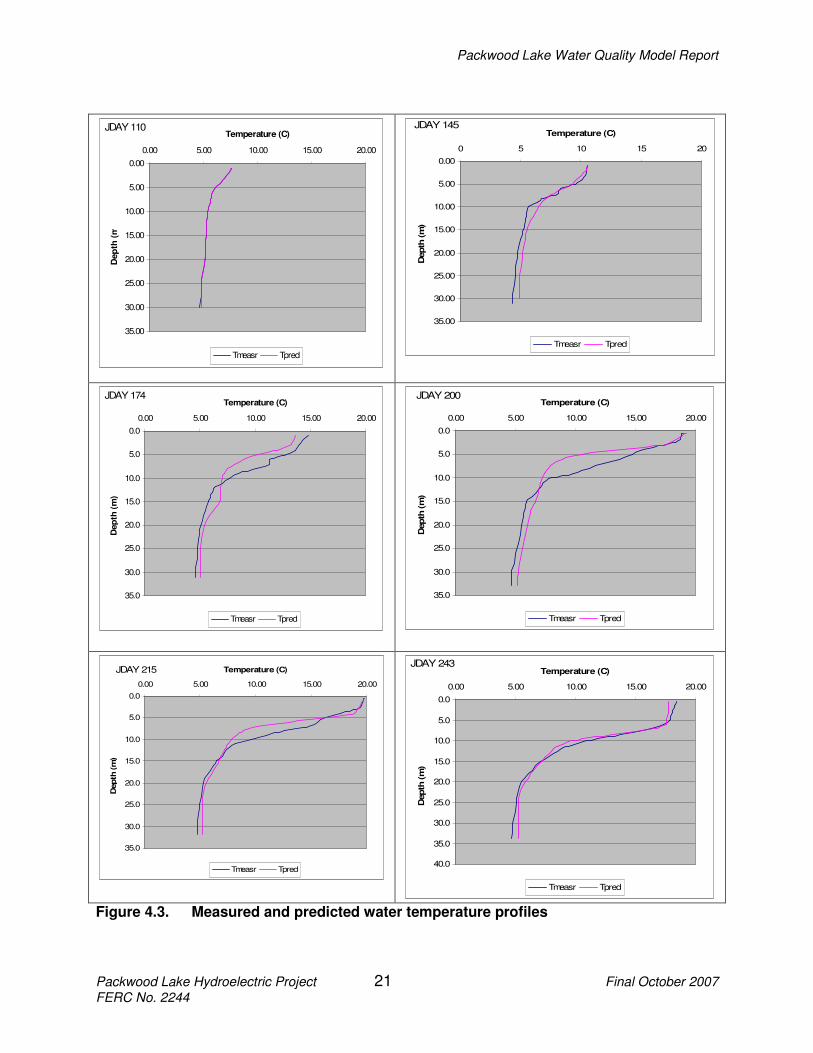
4.1.2 Temperature Calibration of the model for temperature primarily relied upon adjusting the time series file for wind shelter values (modifies the wind speed) and cloud cover. Table 4.2 lists the error statistics for the time series surface water temperatures. Table 4.3 lists the error statistics for the vertical profiles. Figure 4.2 compares measured and predicted
Packwood Lake Water Quality Model Report
Packwood Lake Hydroelectric Project 20 Final October 2007 FERC No. 2244
surface water temperatures. Figure 4.3 shows the measured and predicted vertical temperature profiles for selected dates when data were available.
The modeled water temperatures were biased high for the initial period April 20 through May 12. The probable cause of relatively greater error in water temperature predictions at the start of the modeling period is attributed to the necessity to apply meteorological data derived from a remote site. The error statistics were substantially improved when evaluating data from the period when local meteorological data were available (May 25 – October 31, 2005: JDAY 145 – 304) – see Table 4.2. Table 4.2. Model error statistics for water surface temperature at segment 7 (sampling site PLA) for Packwood Lake
Period Mean Error (oC)
Mean absolute error (oC)
Root mean square error (
oC)
JDAY 110-304 -0.05 0.49 0.46
JDAY 145-304 0.12 0.37 0.24
Comparison of Measured and Predicted Surface
Temperatures at Seg. 7
0
5
10
15
20
25
11
0
12
0
13
0
14
0
15
0
16
0
17
0
18
0
19
0
20
0
21
0
22
0
23
0
24
0
25
0
26
0
27
0
28
0
29
0
30
0
31
0
JDAY
Tem
pera
ture
(C
) .
4/1
0/0
5
4/2
4/0
5
5/8
/05
5/2
2/0
5
6/5
/05
6/1
9/0
5
7/3
/05
7/1
7/0
5
7/3
1/0
5
8/1
4/0
5
8/2
8/0
5
9/1
1/0
5
9/2
5/0
5
10
/9/0
5
10
/23/0
511
/6/0
5
TMeas TPred
Figure 4.2. Comparison of surface measured and predicted temperatures
Packwood Lake Water Quality Model Report
Packwood Lake Hydroelectric Project 21 Final October 2007 FERC No. 2244
0.00
5.00
10.00
15.00
20.00
25.00
30.00
35.00
0.00 5.00 10.00 15.00 20.00
Temperature (C)
Dep
th (
m)
Tmeasr Tpred
JDAY 110
0.00
5.00
10.00
15.00
20.00
25.00
30.00
35.00
0 5 10 15 20
Temperature (C)
Depth
(m
) .
Tmeasr Tpred
JDAY 145
0.0
5.0
10.0
15.0
20.0
25.0
30.0
35.0
0.00 5.00 10.00 15.00 20.00
Temperature (C)
Dep
th (
m)
.
Tmeasr Tpred
JDAY 174
0.0
5.0
10.0
15.0
20.0
25.0
30.0
35.0
0.00 5.00 10.00 15.00 20.00
Temperature (C)
Depth
(m
) .
Tmeasr Tpred
JDAY 200
0.0
5.0
10.0
15.0
20.0
25.0
30.0
35.0
0.00 5.00 10.00 15.00 20.00
Temperature (C)
Depth
(m
) .
Tmeasr Tpred
JDAY 215
0.0
5.0
10.0
15.0
20.0
25.0
30.0
35.0
40.0
0.00 5.00 10.00 15.00 20.00
Temperature (C)
Depth
(m
) .
Tmeasr Tpred
JDAY 243
Figure 4.3. Measured and predicted water temperature profiles
Packwood Lake Water Quality Model Report
Packwood Lake Hydroelectric Project 22 Final October 2007 FERC No. 2244
0.0
5.0
10.0
15.0
20.0
25.0
30.0
35.0
0.00 5.00 10.00 15.00 20.00
Temperature (C)
Dep
th (
m)
.
Tmeasr Tpred
JDAY 264
0.0
5.0
10.0
15.0
20.0
25.0
30.0
35.0
0.00 5.00 10.00 15.00 20.00
Temperature (C)
Depth
(m
) .
Tmeasr Tpred
JDAY 299
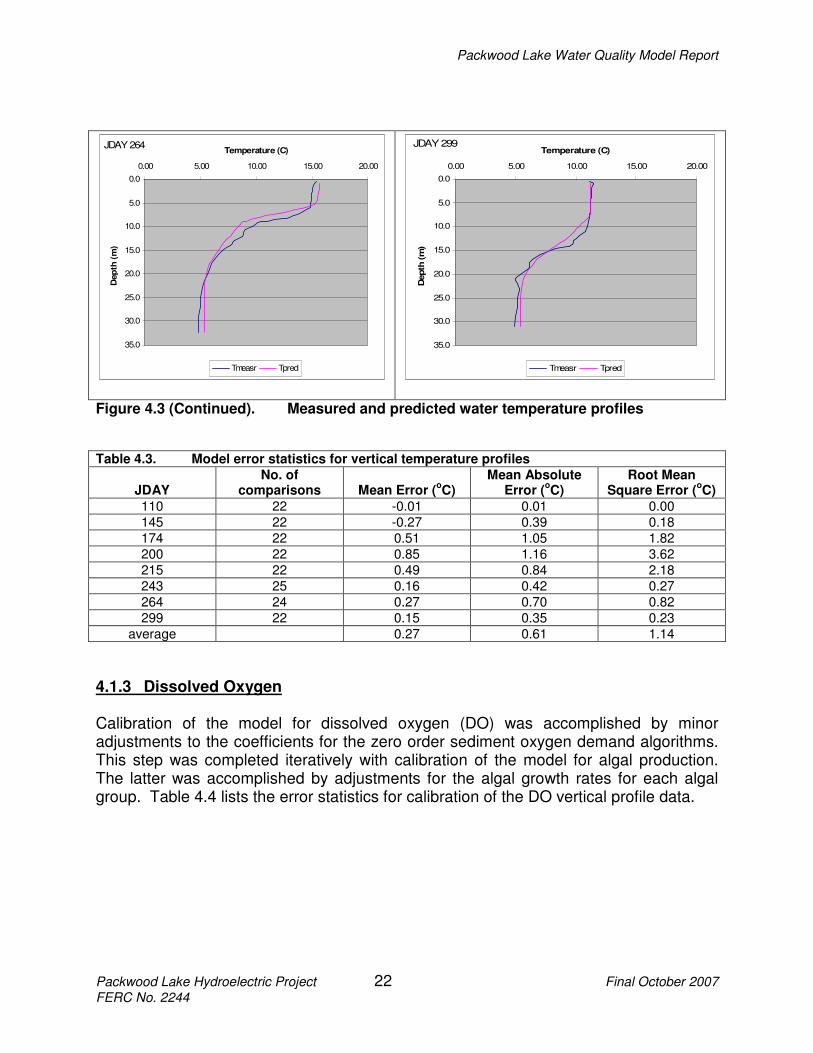
Figure 4.3 (Continued). Measured and predicted water temperature profiles Table 4.3. Model error statistics for vertical temperature profiles
JDAY No. of
comparisons Mean Error (oC)
Mean Absolute Error (
oC)
Root Mean Square Error (
oC)
110 22 -0.01 0.01 0.00
145 22 -0.27 0.39 0.18
174 22 0.51 1.05 1.82
200 22 0.85 1.16 3.62
215 22 0.49 0.84 2.18
243 25 0.16 0.42 0.27
264 24 0.27 0.70 0.82
299 22 0.15 0.35 0.23
average 0.27 0.61 1.14
4.1.3 Dissolved Oxygen Calibration of the model for dissolved oxygen (DO) was accomplished by minor adjustments to the coefficients for the zero order sediment oxygen demand algorithms. This step was completed iteratively with calibration of the model for algal production. The latter was accomplished by adjustments for the algal growth rates for each algal group. Table 4.4 lists the error statistics for calibration of the DO vertical profile data.

Packwood Lake Water Quality Model Report
Packwood Lake Hydroelectric Project 23 Final October 2007 FERC No. 2244
Table 4.4. Model error statistics for vertical dissolved oxygen profiles
JDAY No. of
comparisons Mean Error
(mg/L)
Mean Absolute Error
(mg/L)
Root Mean Square Error
(mg/L)
110 22 -0.05 0.06 0.05
145 22 -0.35 0.35 0.15
174 22 -0.02 0.38 0.28
200 22 -0.42 0.45 0.29
215 22 -0.54 0.55 0.41
243 25 0.01 0.52 0.62
264 24 -0.52 0.71 0.86
299 22 -1.33 1.33 1.92
average -0.40 0.43 0.38
The modeled DO profiles appeared reasonable with the exception of not fully characterizing near-anaerobic conditions in the lower hypolimnion. The carbonaceous biological oxygen demand was not modeled. The accumulation of organic decay material near the bottom and sediment diagenesis was not fully accounted for in the model. Project operations are not likely to alter the water quality dynamics for the deepest portion of the lake so the difference in modeled DO profiles at this depth is not a major shortcoming. The modeled DO profiles did characterize the increase in DO within the lower portion of the photic zone, which is a function of algal production.

Packwood Lake Water Quality Model Report
Packwood Lake Hydroelectric Project 24 Final October 2007 FERC No. 2244
0.00
5.00
10.00
15.00
20.00
25.00
30.00
35.00
4 5 6 7 8 9 10 11 12
Dissolved Oxygen (mg/L)
Dep
th (
m)
.
DO Meas DO Pred
JDAY 110
0.00
5.00
10.00
15.00
20.00
25.00
30.00
35.00
4 5 6 7 8 9 10 11 12
Dissolved Oxygen (mg/L)
Depth
(m
) .
DO Meas DO Pred
JDAY 145
0.0
5.0
10.0
15.0
20.0
25.0
30.0
35.0
4 5 6 7 8 9 10 11 12
Dissolved Oxygen (mg/L)
Dep
th (
m)
.
DO Meas DO Pred
JDAY 174
0.0
5.0
10.0
15.0
20.0
25.0
30.0
35.0
4 5 6 7 8 9 10 11 12
Dissolved Oxygen (mg/L)
Depth
(m
) .
DO Meas DO Pred
JDAY 200
0.0
5.0
10.0
15.0
20.0
25.0
30.0
35.0
4 5 6 7 8 9 10 11 12
Dissolved Oxygen (mg/L)
Dep
th (
m)
.
DO Meas DO Pred
JDAY 215
0.0
5.0
10.0
15.0
20.0
25.0
30.0
35.0
4 5 6 7 8 9 10 11 12
Dissolved Oxygen (mg/L)
Depth
(m
) .
DO Meas DO Pred
JDAY 243
Figure 4.4. Measured and predicted dissolved oxygen profiles

Packwood Lake Water Quality Model Report
Packwood Lake Hydroelectric Project 25 Final October 2007 FERC No. 2244
0.0
5.0
10.0
15.0
20.0
25.0
30.0
35.0
4 5 6 7 8 9 10 11 12
Dissolved Oxygen (mg/L)
Dep
th (
m)
.
DO Meas DO Pred
JDAY 264
0.0
5.0
10.0
15.0
20.0
25.0
30.0
35.0
4 5 6 7 8 9 10 11 12
Dissolved Oxygen (mg/L)
Depth
(m
) .
DO Meas DO Pred
JDAY 299
Figure 4.4 (Continued). Measured and predicted dissolved oxygen profiles
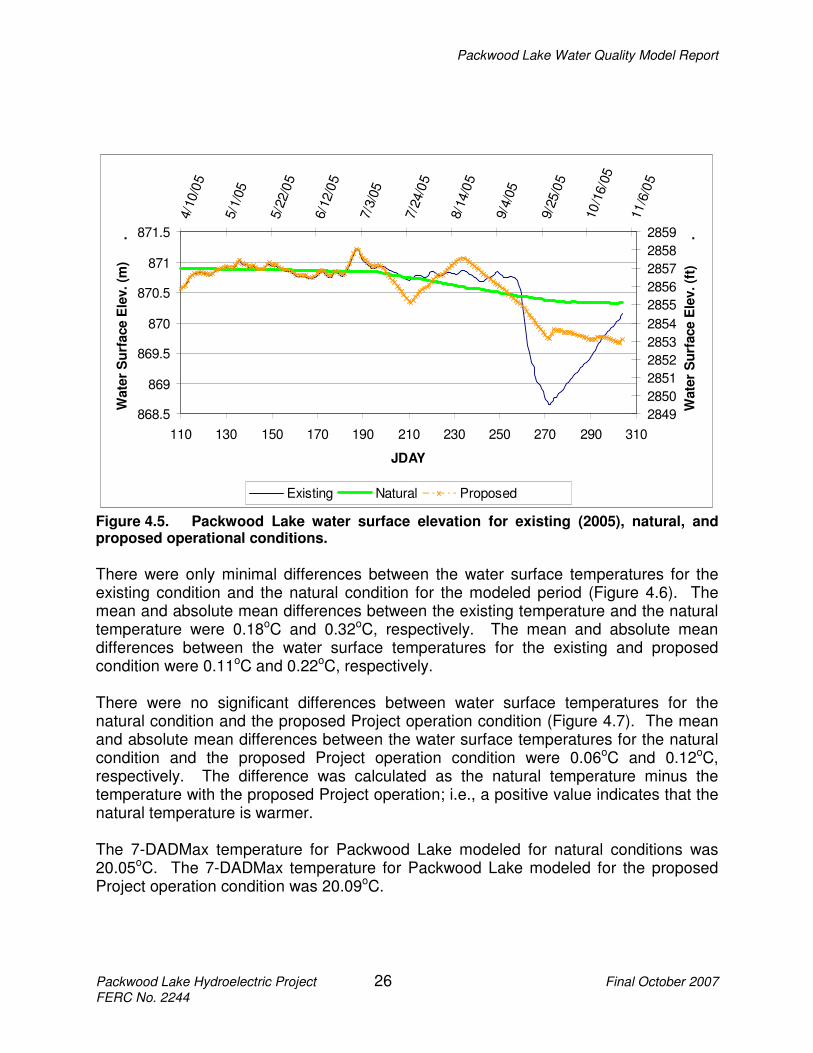
4.1.5 Other Water Quality Constituents Model default values (Cole and Wells 2006) for coefficients governing the dynamics for other water quality constituents were applied. 4.2 MODEL APPLICATION The calibrated model was applied to model water quality associated with both natural conditions without the Project and proposed future operations of the Project. Water outflow files were modified to simulate the seasonal pattern for lake water surface elevation under each of these scenarios. The initial water surface elevation for the natural condition was altered from the existing 870.56 m MSL (2856.17 ft) to 870.9 m MSL (2857.28 ft). The elevation of the natural hydraulic control for the lake outlet is believed to be 870.814 m MSL (2857 ft). It was assumed that the natural lake level at the start of the model period would be slightly higher than the natural hydraulic control. It was assumed that inflow equaled outflow at this time, which would be an outflow of 1.855 cms (65.5 cfs). Figure 4.5 shows the modeled water surface elevation for the natural and proposed operational scenarios as well as the existing condition for the 2005 model period. Summer lake levels under the proposed Project operation closely mimic natural conditions.
Packwood Lake Water Quality Model Report
Packwood Lake Hydroelectric Project 26 Final October 2007 FERC No. 2244
868.5
869
869.5
870
870.5
871
871.5
110 130 150 170 190 210 230 250 270 290 310
JDAY
Wate
r S
urf
ace E
lev. (m
) .
2849
2850
2851
2852
2853
2854
2855
2856
2857
2858
2859
4/1
0/0
5
5/1
/05
5/2
2/0
5
6/1
2/0
5
7/3
/05
7/2
4/0
5
8/1
4/0
5
9/4
/05
9/2
5/0
5
10
/16/0
5
11
/6/0
5
Wate
r S
urf
ace E
lev. (f
t) .
Existing Natural Proposed
Figure 4.5. Packwood Lake water surface elevation for existing (2005), natural, and proposed operational conditions.
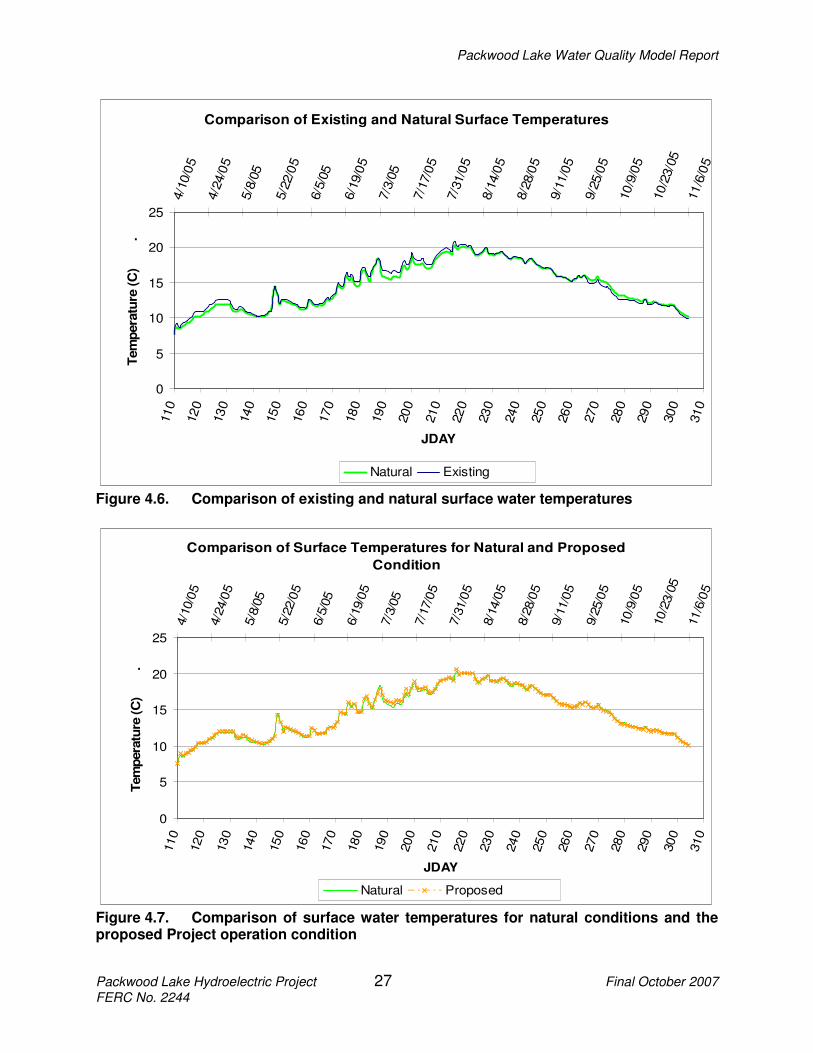
There were only minimal differences between the water surface temperatures for the existing condition and the natural condition for the modeled period (Figure 4.6). The mean and absolute mean differences between the existing temperature and the natural temperature were 0.18oC and 0.32oC, respectively. The mean and absolute mean differences between the water surface temperatures for the existing and proposed condition were 0.11oC and 0.22oC, respectively. There were no significant differences between water surface temperatures for the natural condition and the proposed Project operation condition (Figure 4.7). The mean and absolute mean differences between the water surface temperatures for the natural condition and the proposed Project operation condition were 0.06oC and 0.12oC, respectively. The difference was calculated as the natural temperature minus the temperature with the proposed Project operation; i.e., a positive value indicates that the natural temperature is warmer. The 7-DADMax temperature for Packwood Lake modeled for natural conditions was 20.05oC. The 7-DADMax temperature for Packwood Lake modeled for the proposed Project operation condition was 20.09oC.
Packwood Lake Water Quality Model Report
Packwood Lake Hydroelectric Project 27 Final October 2007 FERC No. 2244
Comparison of Existing and Natural Surface Temperatures
0
5
10
15
20
25
110
120
130
140
150
160
170
180
190
200
210
220
230
240
250
260
270
280
290
300
310
JDAY
Tem
pera
ture
(C
) .
4/1
0/0
5
4/2
4/0
5
5/8
/05
5/2
2/0
5
6/5
/05
6/1
9/0
5
7/3
/05
7/1
7/0
5
7/3
1/0
5
8/1
4/0
5
8/2
8/0
5
9/1
1/0
5
9/2
5/0
5
10/9
/05
10/2
3/0
5
11/6
/05
Natural Existing
Figure 4.6. Comparison of existing and natural surface water temperatures
Comparison of Surface Temperatures for Natural and Proposed
Condition
0
5
10
15
20
25
110
120
130
140
150
160
170
180
190
200
210
220
230
240
250
260
270
280
290
300
310
JDAY
Tem
pera
ture
(C
) .
4/1
0/0
5
4/2
4/0
5
5/8
/05
5/2
2/0
5
6/5
/05
6/1
9/0
5
7/3
/05
7/1
7/0
5
7/3
1/0
5
8/1
4/0
5
8/2
8/0
5
9/1
1/0
5
9/2
5/0
5
10/9
/05
10/2
3/0
5
11/6
/05
Natural Proposed
Figure 4.7. Comparison of surface water temperatures for natural conditions and the proposed Project operation condition

Packwood Lake Water Quality Model Report
Packwood Lake Hydroelectric Project 28 Final October 2007 FERC No. 2244
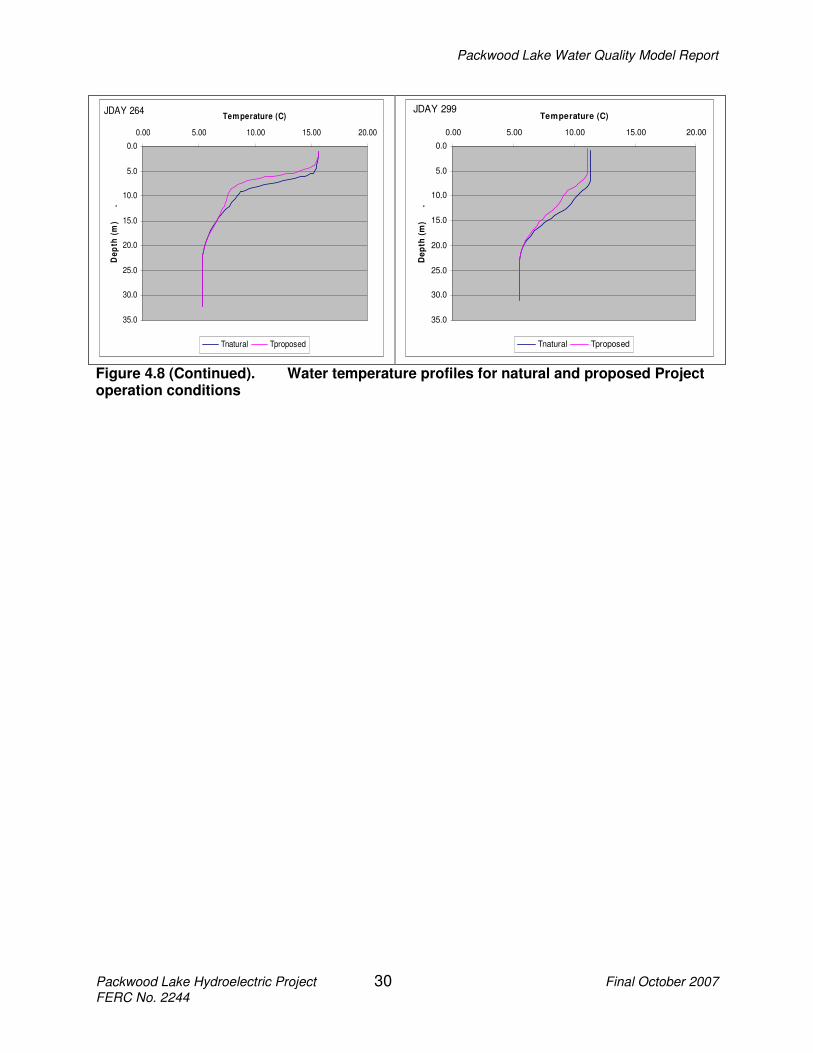
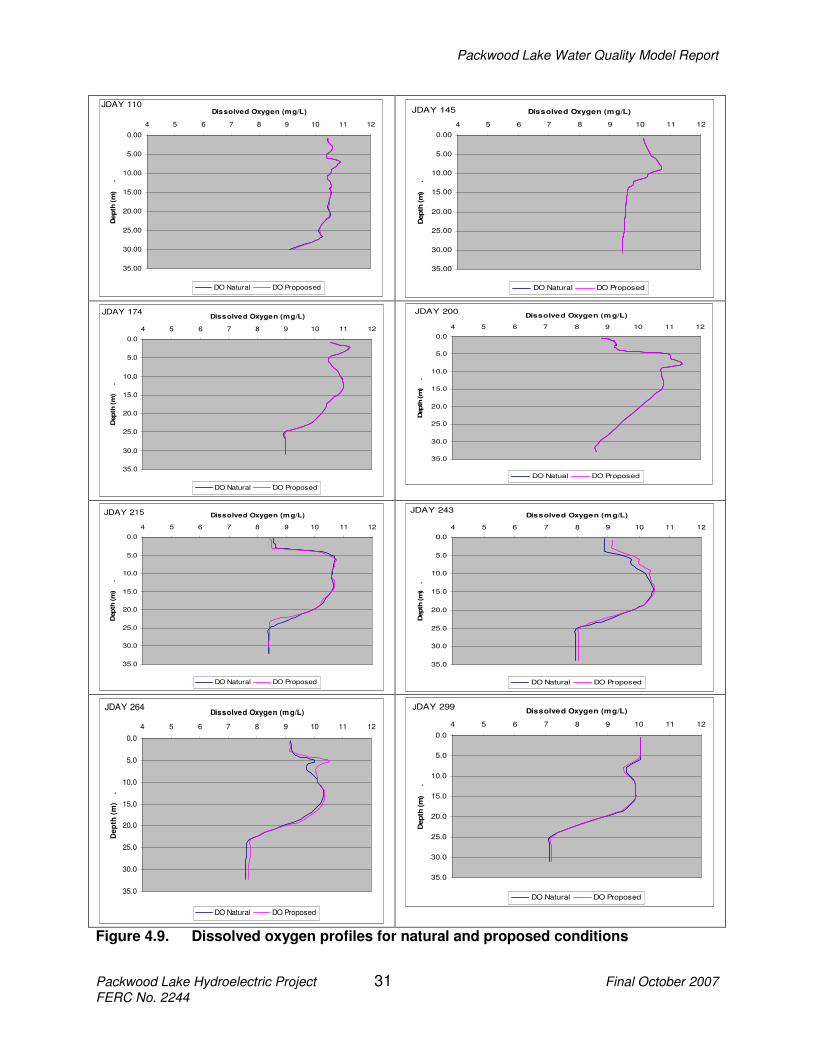
Figure 4.8 shows the vertical temperature profiles for the natural condition and with the proposed Project operation. The metalimnion depth range is slightly shallower after Julian day 215 (September 15) under the proposed Project operation condition. This is because as the lake level is lowered, the volume of water in the weakly stratified epilimnion is reduced. Differences between the profiles for dissolved oxygen for the natural and proposed Project operation conditions were less than 0.2 mg/L at all depths (Figure 4.9). Figure 4.10 shows the measured chlorophyll a levels for the photic zone and the levels for the natural condition. The modeled chlorophyll a levels for the proposed Project operation condition nearly identical to that for the natural condition.

Packwood Lake Water Quality Model Report
Packwood Lake Hydroelectric Project 29 Final October 2007 FERC No. 2244
0.00
5.00
10.00
15.00
20.00
25.00
30.00
35.00
0 5 10 15 20
Temperature (C)D
ep
th (
m)
Tnatural Tproposed
JDAY 110
0.00
5.00
10.00
15.00
20.00
25.00
30.00
35.00
0 5 10 15 20
Temperature (C)
De
pth
(m
)
.
Tnatural Tproposed
JDAY 145
0.0
5.0
10.0
15.0
20.0
25.0
30.0
35.0
0 5 10 15 20
Temperature (C)
De
pth
(m
)
.
Tnatural Tproposed
JDAY 174
0.0
5.0
10.0
15.0
20.0
25.0
30.0
35.0
0.00 5.00 10.00 15.00 20.00
Temperature (C)
De
pth
(m
)
.
Tnatural Tproposed
JDAY 200
0.0
5.0
10.0
15.0
20.0
25.0
30.0
35.0
0.00 5.00 10.00 15.00 20.00
Temperature (C)
De
pth
(m
)
.
Tnatural Tproposed
JDAY 215
0.0
5.0
10.0
15.0
20.0
25.0
30.0
35.0
40.0
0.00 5.00 10.00 15.00 20.00
Temperature (C)
De
pth
(m
)
.
Tnatural Tproposed
JDAY 243
Figure 4.8. Water temperature profiles for natural and proposed Project operation conditions
Packwood Lake Water Quality Model Report
Packwood Lake Hydroelectric Project 30 Final October 2007 FERC No. 2244
0.0
5.0
10.0
15.0
20.0
25.0
30.0
35.0
0.00 5.00 10.00 15.00 20.00
Temperature (C)D
ep
th (
m)
.
Tnatural Tproposed
JDAY 264
0.0
5.0
10.0
15.0
20.0
25.0
30.0
35.0
0.00 5.00 10.00 15.00 20.00
Temperature (C)
De
pth
(m
)
.
Tnatural Tproposed
JDAY 299
Figure 4.8 (Continued). Water temperature profiles for natural and proposed Project operation conditions
Packwood Lake Water Quality Model Report
Packwood Lake Hydroelectric Project 31 Final October 2007 FERC No. 2244
0.00
5.00
10.00
15.00
20.00
25.00
30.00
35.00
4 5 6 7 8 9 10 11 12
Dissolved Oxygen (mg/L)D
ep
th (
m)
.
DO Natural DO Propoosed
JDAY 110
0.00
5.00
10.00
15.00
20.00
25.00
30.00
35.00
4 5 6 7 8 9 10 11 12
Dissolved Oxygen (mg/L)
Depth
(m
) .
DO Natural DO Proposed
JDAY 145
0.0
5.0
10.0
15.0
20.0
25.0
30.0
35.0
4 5 6 7 8 9 10 11 12
Dissolved Oxygen (mg/L)
Depth
(m
) .
DO Natural DO Proposed
JDAY 174
0.0
5.0
10.0
15.0
20.0
25.0
30.0
35.0
4 5 6 7 8 9 10 11 12
Dissolved Oxygen (mg/L)
Depth
(m
) .
DO Natual DO Proposed
JDAY 200
0.0
5.0
10.0
15.0
20.0
25.0
30.0
35.0
4 5 6 7 8 9 10 11 12
Dissolved Oxygen (mg/L)
Depth
(m
) .
DO Natural DO Proposed
JDAY 215
0.0
5.0
10.0
15.0
20.0
25.0
30.0
35.0
4 5 6 7 8 9 10 11 12
Dissolved Oxygen (mg/L)
Depth
(m
) .
DO Natural DO Proposed
JDAY 243
0.0
5.0
10.0
15.0
20.0
25.0
30.0
35.0
4 5 6 7 8 9 10 11 12
Dissolved Oxygen (mg/L)
Dep
th (
m)
.
DO Natural DO Proposed
JDAY 264
0.0
5.0
10.0
15.0
20.0
25.0
30.0
35.0
4 5 6 7 8 9 10 11 12
Dissolved Oxygen (mg/L)
Depth
(m
) .
DO Natural DO Proposed
JDAY 299
Figure 4.9. Dissolved oxygen profiles for natural and proposed conditions

Packwood Lake Water Quality Model Report
Packwood Lake Hydroelectric Project 32 Final October 2007 FERC No. 2244
-
0.5
1.0
1.5
2.0
2.5
3.0
3.5
110
130
150
170
190
210
230
250
270
290
310
Chlo
rophyll a (ug/L)
04/10/05
04/24/05
05/08/05
05/22/05
06/05/05
06/19/05
07/03/05
07/17/05
07/31/05
08/14/05
08/28/05
09/11/05
09/25/05
10/09/05
10/23/05
11/06/05
Existing Natural Proposed
Figure 4.10 Chlorophyll a levels for existing, natural and proposed conditions
5.0 SUMMARY A water quality and hydrodynamic model, CE-QUAL-W2 Version 3.5 (Cole and Wells 2006) was applied to Packwood Lake. The system model required that boundary conditions be defined. Data supporting this modeling effort included:
• Dynamic inflow and outflow (discharge) rates,
• Dynamic inflow and outflow temperatures,
• Dynamic meteorological data (air temperature, dew point temperature, wind speed, wind direction, cloud cover, and solar radiation), and
• Model bathymetry. The model was calibrated and applied to the period April 20 through October 31, 2005. Modeled temperatures were sensitive to wind sheltering and cloud cover, which were the two factors used to calibrate the model for temperature. A zero order carbon oxygen demand algorithm was applied with the coefficients adjusted to calibrate the model for dissolved oxygen. Three algal groups were included in the model; algal productivity affects dissolved oxygen so the algal growth rates were adjusted to match measured algal biomass (expressed as a percentage of chlorophyll a) as well as generate reasonable vertical profiles for dissolved oxygen levels. The calibrated model was applied to natural conditions for Packwood Lake as well as conditions associated with the proposed Project operation. There were no significant difference in water temperature, dissolved oxygen and algal productivity for the proposed Project operation condition relative to the natural condition.
Packwood Lake Water Quality Model Report
Packwood Lake Hydroelectric Project 33 Final October 2007 FERC No. 2244
6.0 LITERATURE CITED
Cole, T. and Buchak, E. 1995. CE-QUAL-W2: A Two-Dimensional, Laterally Averaged, Hydrodynamic and Water Quality Model, Version 2.0. US Army Corps of Engineers, Instruction Report EL-95-1, Waterways Experiments Station, Vicksburg, MS.
Cole, T. M. and S. A. Wells. 2006. CE-QUAL-W2: A Two Dimensional Laterally
Averaged Hydrodynamic and Water Quality Model: Ver. 3.5. User Manual Draft Report. U.S. Army Corps of Engineers. Washington D.C.
Donigian, A.S., Jr., J.C. Imhoff, B.R. Bicknell and J.L. Kittle, Jr. 1984. Application
Guide for Hydrological Simulation Program Fortran (HSPF). EPA-600/3-84-065, U.S. Envir. Prot. Agency. Athens, GA
Edinger, J. E. and Buchak, E. M. 1978. Reservoir Longitudinal and Vertical Implicit
Hydrodynamics. Environmental Effects of Hydraulic Engineering Works, Proceedings of an International Symposium. Knoxville, TN.
EES Consulting, 2005. Revised Water Quality Study Plan for Energy Northwest’s
Packwood Lake Hydroelectric Project, FERC No. 2244, Lewis County, WA. August 22, 2005.
EES Consulting. 2006a. Draft Water Temperature Report for 2005 for Energy
Northwest’s Packwood Lake Hydroelectric Project, FERC No. 2244, Lewis County, WA. August 2006.
EES Consulting. 2006b. Water Quality Interim Report: 1st Year Study Results for
Energy Northwest’s Packwood Lake Hydroelectric Project, FERC No. 2244, Lewis County, WA. April 2006.
EES Consulting. 2007a. Final Packwood Lake Drawdown Study Report for Energy
Northwest’s Packwood Lake Hydroelectric Project, FERC No. 2244, Lewis County, WA. July 2007.
EES Consulting. 2007b. Final Report Water Temperature Report for Energy
Northwest’s Packwood Lake Hydroelectric Project, FERC No. 2244, Lewis County, WA. February 2007.
EES Consulting. 2007c. Water Quality Report: 2nd Year Study Results for Energy
Northwest’s Packwood Lake Hydroelectric Project, FERC No. 2244, Lewis County, WA. February 2007.
EES Consulting 2007d. Draft Water Quality Temperature Modeling Report for Lake
Creek for Energy Northwest’s Packwood Lake Hydroelectric Project, FERC No. 2244, Lewis County, WA. July 2007.
Packwood Lake Water Quality Model Report
Packwood Lake Hydroelectric Project 34 Final October 2007 FERC No. 2244
Energy Northwest. 2004a. Packwood Lake Hydroelectric Project, FERC Project No.
2244, Pre-Application Document, November 10, 2004. Energy Northwest. 2004b. Notification of Intent, Packwood Lake Hydroelectric Project,
FERC Project Number 2244, November 10, 2004. Royce, William F. 1965. “Effect of changes in lake level on fishing in Packwood Lake”.
University of Washington, Seattle,. Reynolds, C. S. (1993). "The Ecology of Freshwater Phytoplankton." Cambridge
University Press, New York, NY Singh, V. (1992) Elementary Hydrology, Prentice Hall, NY Smith, D. J. 1978. Water Quality for River Reservoir Systems, Generalized computer
program for River-Reservoir systems. U.S. Army Corps of Engineers, Hydrologic Engineering Center. Davis, CA.
Swanson, D.A. 1996. Geologic Map of the Packwood Lake Quadrangle, Southern
Cascade Range, Washington. USGS Open-File Report 96-704. U.S. Army Corps of Engineers. 1986. HEC-5 Simulation of Flood Control and
Conservation Systems. CPD-5Q, Hydrologic Engineering Center. Davis, CA. Washington State Department of Ecology. 1991. Lake Water Quality Assessment
Project, 1989. Document 91-60. November 1991