Embed Size (px)
Citation preview
Final Version, 10 April 2018
PHASE 2 ENGAGEMENT REPORT, MITS, FINAL VERSION, 10 APRIL 2018
1 WWW.CAPIRE.COM.AU
Privacy
Capire Consulting Group and any person(s) acting on our behalf is committed to protecting privacy and personally identifiable information by meeting our responsibilities under the Victorian Privacy Act 1988 and the Australian Privacy Principles 2014 as well as relevant industry codes of ethics and conduct.
For the purpose of program delivery, and on behalf of our clients, we collect personal information from individuals, such as e-mail addresses, contact details, demographic data and program feedback to enable us to facilitate participation in consultation activities. We follow a strict procedure for the collection, use, disclosure, storage and destruction of personal information. Any information we collect is stored securely on our server for the duration of the program and only disclosed to our client or the program team. Written notes from consultation activities are manually transferred to our server and disposed of securely.
Comments recorded during any consultation activities are faithfully transcribed however not attributed to individuals. Diligence is taken to ensure that any comments or sensitive information does not become personally identifiable in our reporting, or at any stage of the program.
Capire operates an in-office server with security measures that include, but are not limited to, password protected access, restrictions to sensitive data and the encrypted transfer of data.
For more information about the way we collect information, how we use, store and disclose information as well as our complaints procedure, please see www.capire.com.au or telephone (03) 9285 9000.
Consultation
Unless otherwise stated, all feedback documented by Capire Consulting Group and any person(s) acting on our behalf is written and/or recorded during our program/consultation activities.
Capire staff and associates take great care while transcribing participant feedback but unfortunately cannot guarantee the accuracy of all notes. We are however confident that we capture the full range of ideas, concerns and views expressed during our consultation activities.
Unless otherwise noted, the views expressed in our work represent those of the participants and not necessarily those of our consultants or our clients.
© Capire Consulting Group Pty Ltd. This document belongs to and will remain the property of Capire Consulting Group Pty Ltd.
All content is subject to copyright and may not be reproduced in any form without express written consent of Capire Consulting Group Pty Ltd.
Authorisation can be obtained via email to [email protected] or in writing to: 96 Pelham Street Carlton VIC Australia 3053.
PHASE 2 ENGAGEMENT REPORT, MITS, FINAL VERSION, 10 APRIL 2018
2
Background
Moreland City Council (Council) is developing a new Moreland Integrated Transport Strategy
(MITS) to set the direction on dealing with major transport issues within the municipality for the
next decade. Council is working to achieve a shift towards sustainable transport options
(walking, cycling and public transport) for travelling around Moreland, relying less on cars to get
around. Council is also developing a Parking Strategy at the same time as the MITS. Council
engaged GTA Consultants to prepare the MITS. GTA Consultants’ team includes Capire
Consulting Group to design and deliver the engagement strategy, and CrowdSpot to deliver
online map-based hot-spotting engagement.
There will be three phases of engagement to deliver the MITS:
• Phase 1: Pre-engagement. 1–22 December 2017
• Phase 2: Engagement on background paper and to inform draft MITS. 15 February – 7
March (with a soft launch of the CrowdSpot map on 31 January)
• Phase 3: Consultation on draft MITS and Parking Strategy. June - July 2018.
This report details the engagement findings for Phase 2. It includes findings collated from a
variety of face-to-face and online engagement activities as outlined in Table 1.
Engagement activities and participation
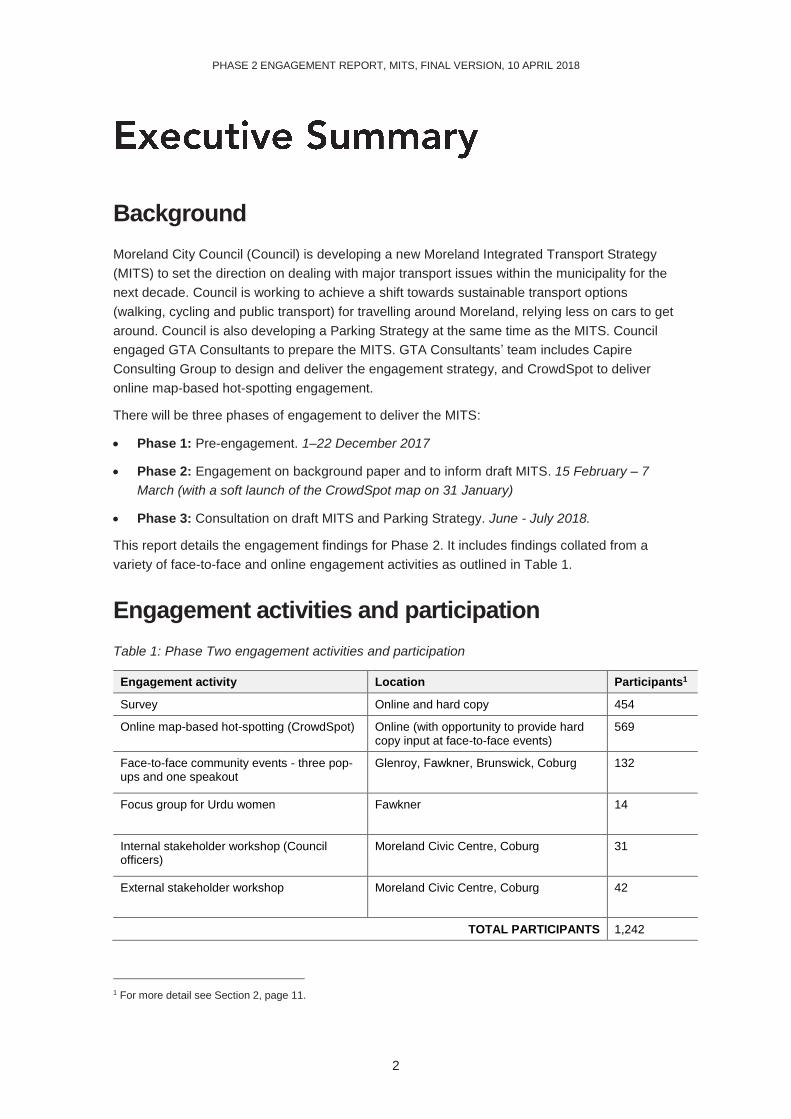
Table 1: Phase Two engagement activities and participation
Engagement activity Location Participants1
Survey Online and hard copy 454
Online map-based hot-spotting (CrowdSpot) Online (with opportunity to provide hard copy input at face-to-face events)
569
Face-to-face community events - three pop-ups and one speakout
Glenroy, Fawkner, Brunswick, Coburg 132
Focus group for Urdu women Fawkner 14
Internal stakeholder workshop (Council officers)
Moreland Civic Centre, Coburg 31
External stakeholder workshop Moreland Civic Centre, Coburg 42
TOTAL PARTICIPANTS 1,242
1 For more detail see Section 2, page 11.
PHASE 2 ENGAGEMENT REPORT, MITS, FINAL VERSION, 10 APRIL 2018
3 WWW.CAPIRE.COM.AU
Findings
The key findings from Phase 2 of engagement are described below. This list is a summary of
participant sentiment and does not necessarily reflect Council’s views. These findings will be
used to inform the development of the draft MITS.
• Overall, participants felt that sustainability, liveability and safety should be the top
principles driving the MITS, and that economic prosperity / growth should be the lowest.
• The key location-based transport issues identified by community members using the online
pinpointing map CrowdSpot related to unsafe bicycle lanes when cycling, limited
crossing locations when walking and speeding traffic, and feeling unsafe and traffic
congestion in relation to cars’ presence.
• The biggest barriers to using all modes of transport were: time (waiting time, travel time,
frequency); convenience (transport mode does not go where I need it to go, transport
modes are not well linked, it is difficult to carry things, difficult to access); safety concerns
(regarding traffic speed, road rage/aggression, personal safety on and moving between
modes); and distance (between start and end points and moving between different modes).
• Participants who have a connection to the north of Moreland reported more barriers to tram
usage and walking than those participants connected to the south of Moreland.2
• Participants from both the north and south of Moreland reported numerous barriers related
to cycling, train and bus usage. However, there were many opportunities identified to
enable mode shift to more sustainable transport options by:
o The provision of safe and amenable environments for pedestrians and cyclists. For
cycling, this was through improved bike lanes and shared use paths, and through the
provision of end of trip facilities such as showers, bike lockers and bike parking at
transport hubs. For walking, it was frequent crossing opportunities, increasing the
feeling of safety, and making walking to activity centres more attractive.
o By increasing the reliability and frequency of public transport modes and aligning the
time tabling of different public transport modes to support multi-mode journeys.
• While participants were in broad agreement about supporting measures to improve
conditions for walking, cycling and public transport, even where this takes space or
priority away from cars, there was not agreement about the role of parking. Participants
were divided as to whether parking should be increased and free in shopping strips, with
developments required to provide significant on-site parking or the reverse situation.
Participants from the north of Moreland were more likely to support the increased and free
parking option, whereas participants from the south were more likely to support the reverse.
• Community thought Council should prioritise advocacy to other levels of government in the
areas of cyclist safety on major roads, the frequency of trains and lengthening
existing tram lines into new areas.
2 South Moreland includes the suburbs of Brunswick, Brunswick West, Brunswick East, Coburg, Pascoe Vale South and Fitzroy North. North Moreland includes Coburg North, Fawkner, Glenroy, Gowanbrae, Hadfield, Pascoe Vale, Tullamarine and Oak Park.
PHASE 2 ENGAGEMENT REPORT, MITS, FINAL VERSION, 10 APRIL 2018
4
2
6
1.1 Project background 6
1.2 Engagement approach 7
1.2.1 Moreland Engagement Strategy 7
1.2.2 Objectives and line of inquiry 7
1.3 This report 9
1.3.1 Engagement in Phase 2 9
1.3.2 Promotion of engagement in Phase 2 9
1.3.3 Limitations 10
11
2.1 Number of participants 11
2.2 Demographics of community participants 12
2.2.1 Age 12
2.2.2 Location 12
2.2.3 Gender 13
14
3.1 Transport and the Moreland lifestyle 14
3.2 Prioritising transport principles 14
3.3 Transport issues 14
3.4 Transport barriers and enablers 15
3.5 Transport trade-offs 16
3.6 Advocacy 17
4 Detailed engagement findings 18
4.1 Transport and the Moreland lifestyle 18
4.1.1 Usage of different modes of transport 18
4.1.2 Role of transport in lifestyle 18
4.2 Principles to guide transport in MITS 20
4.3 Location-based transport issues and opportunities 23
4.3.1 Transport issues according to community 23
4.3.2 Opportunities and issues according to stakeholders 26
4.3.3 Did the background report capture all the issues and opportunities? 35
4.4 Mode change to sustainable transport 36
4.4.1 Barriers to mode change 36
4.4.2 Enablers of mode change 45
4.5 Acceptability of transport trade-offs 49
PHASE 2 ENGAGEMENT REPORT, MITS, FINAL VERSION, 10 APRIL 2018
5 WWW.CAPIRE.COM.AU
4.5.1 Walking and cycling 50
4.5.2 Parking 51
4.5.3 Public transport 54
4.6 Advocacy priorities for Moreland 56
4.7 Opportunities for collaboration 58
4.7.1 External collaboration 58
4.7.2 Internal collaboration 60
61
Event agendas 61
Survey tool 64
PHASE 2 ENGAGEMENT REPORT, MITS, FINAL VERSION, 10 APRIL 2018
6
1.1 Project background
Moreland City Council (Council) is developing a new Moreland Integrated Transport Strategy
(MITS) to set the direction on dealing with major transport issues within the municipality for the
next decade. Council is working to achieve a shift towards sustainable transport options
(walking, cycling and public transport) for travelling around Moreland, relying less on cars to get
around. Council is also examining how much car parking is provided across Moreland and
whether this should change in the future, and is developing a Parking Strategy at the same time
as the MITS.
Council’s broad vision is to create an environment where sustainable transport options are
convenient and attractive, with the aim that Moreland is a more liveable, sustainable and
healthy place to be. Council is also looking at ways that developers can contribute to funding
sustainable transport initiatives.
Council engaged GTA Consultants to prepare MITS. GTA Consultants’ team includes Capire
Consulting Group to design and deliver the engagement strategy, and CrowdSpot to deliver
online map-based hot-spotting engagement.
The objectives of MITS are:
• To create a comprehensive picture of current travel conditions in Moreland.
• To review the relationship between integrated transport outcomes and relevant policy
directions adopted by Council.
• To establish a clear vision and strategic objectives that align to corresponding policy
directions and work to be undertaken by Council.
• To develop a clearly defined document for the next decade and beyond that provides
priorities, implementation actions and delivery timeframes.
• To evaluate if the existing public and private car parking being provided is sufficient for the
current and future population, having regard to the above objectives, and to make
recommendations for the future use of land designated for public and private car parking.
PHASE 2 ENGAGEMENT REPORT, MITS, FINAL VERSION, 10 APRIL 2018
7 WWW.CAPIRE.COM.AU
1.2 Engagement approach
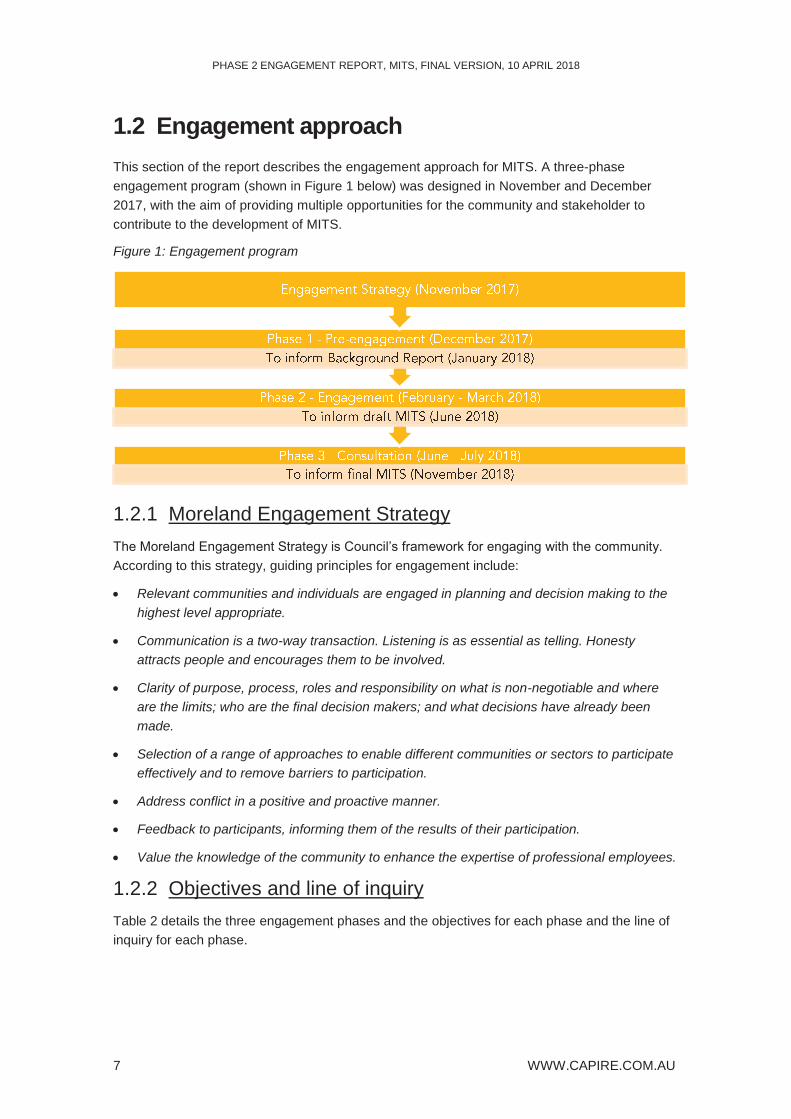
This section of the report describes the engagement approach for MITS. A three-phase
engagement program (shown in Figure 1 below) was designed in November and December
2017, with the aim of providing multiple opportunities for the community and stakeholder to
contribute to the development of MITS.
Figure 1: Engagement program
1.2.1 Moreland Engagement Strategy
The Moreland Engagement Strategy is Council’s framework for engaging with the community.
According to this strategy, guiding principles for engagement include:
• Relevant communities and individuals are engaged in planning and decision making to the
highest level appropriate.
• Communication is a two-way transaction. Listening is as essential as telling. Honesty
attracts people and encourages them to be involved.
• Clarity of purpose, process, roles and responsibility on what is non-negotiable and where
are the limits; who are the final decision makers; and what decisions have already been
made.
• Selection of a range of approaches to enable different communities or sectors to participate
effectively and to remove barriers to participation.
• Address conflict in a positive and proactive manner.
• Feedback to participants, informing them of the results of their participation.
• Value the knowledge of the community to enhance the expertise of professional employees.
1.2.2 Objectives and line of inquiry
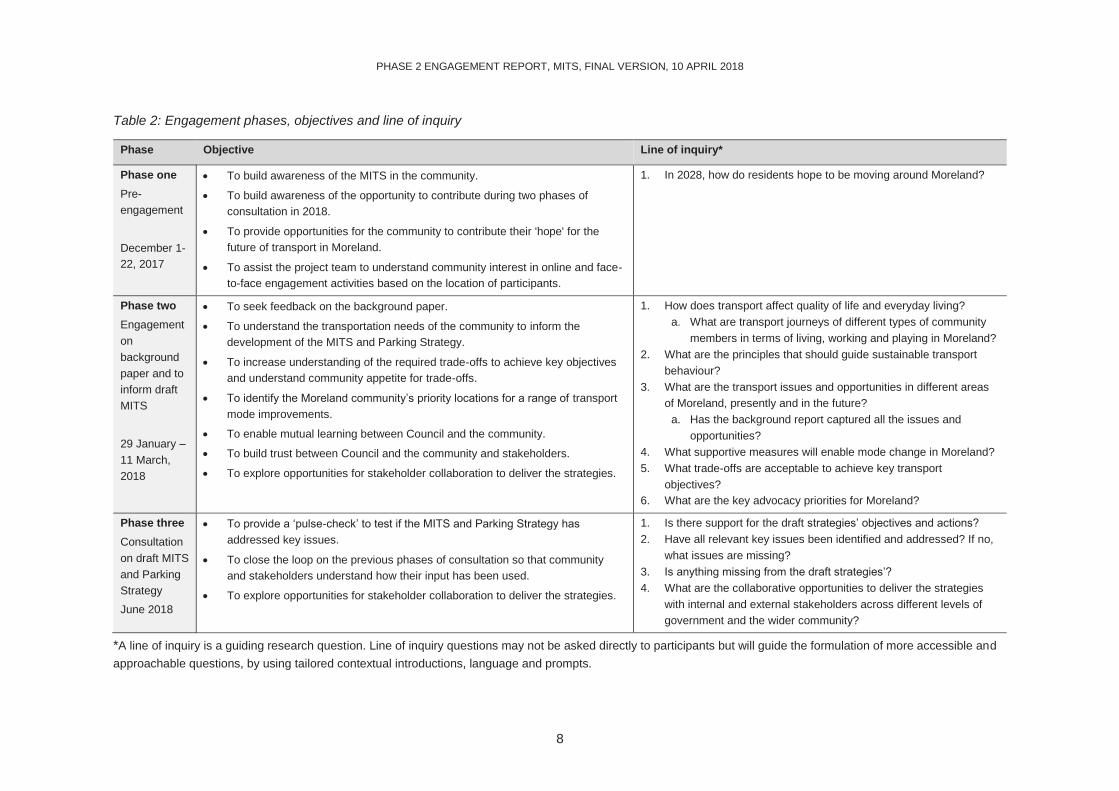
Table 2 details the three engagement phases and the objectives for each phase and the line of
inquiry for each phase.
PHASE 2 ENGAGEMENT REPORT, MITS, FINAL VERSION, 10 APRIL 2018
8
Table 2: Engagement phases, objectives and line of inquiry
Phase Objective Line of inquiry*
Phase one
Pre-
engagement
December 1-
22, 2017
• To build awareness of the MITS in the community.
• To build awareness of the opportunity to contribute during two phases of
consultation in 2018.
• To provide opportunities for the community to contribute their 'hope' for the
future of transport in Moreland.
• To assist the project team to understand community interest in online and face-
to-face engagement activities based on the location of participants.
1. In 2028, how do residents hope to be moving around Moreland?
Phase two
Engagement
on
background
paper and to
inform draft
MITS
29 January –
11 March,
2018
• To seek feedback on the background paper.
• To understand the transportation needs of the community to inform the
development of the MITS and Parking Strategy.
• To increase understanding of the required trade-offs to achieve key objectives
and understand community appetite for trade-offs.
• To identify the Moreland community’s priority locations for a range of transport
mode improvements.
• To enable mutual learning between Council and the community.
• To build trust between Council and the community and stakeholders.
• To explore opportunities for stakeholder collaboration to deliver the strategies.
1. How does transport affect quality of life and everyday living?
a. What are transport journeys of different types of community
members in terms of living, working and playing in Moreland?
2. What are the principles that should guide sustainable transport
behaviour?
3. What are the transport issues and opportunities in different areas
of Moreland, presently and in the future?
a. Has the background report captured all the issues and
opportunities?
4. What supportive measures will enable mode change in Moreland?
5. What trade-offs are acceptable to achieve key transport
objectives?
6. What are the key advocacy priorities for Moreland?
Phase three
Consultation
on draft MITS
and Parking
Strategy
June 2018
• To provide a ‘pulse-check’ to test if the MITS and Parking Strategy has
addressed key issues.
• To close the loop on the previous phases of consultation so that community
and stakeholders understand how their input has been used.
• To explore opportunities for stakeholder collaboration to deliver the strategies.
1. Is there support for the draft strategies’ objectives and actions?
2. Have all relevant key issues been identified and addressed? If no,
what issues are missing?
3. Is anything missing from the draft strategies’?
4. What are the collaborative opportunities to deliver the strategies
with internal and external stakeholders across different levels of
government and the wider community?
*A line of inquiry is a guiding research question. Line of inquiry questions may not be asked directly to participants but will guide the formulation of more accessible and
approachable questions, by using tailored contextual introductions, language and prompts.
PHASE 2 ENGAGEMENT REPORT, MITS, FINAL VERSION, 10 APRIL 2018
9 WWW.CAPIRE.COM.AU
1.3 This report
This report details the engagement findings for Phase 2 of engagement, conducted over February and
March 2018. It includes the findings against all lines of inquiry, from all the engagement activities
conducted over this phase via face-to-face and online engagement.
1.3.1 Engagement in Phase 2
Over February and March 2018, the following activities were delivered to seek community and
stakeholder input:
• Survey – available online and in hard copy
• Online map-based location hot-spotting using CrowdSpot
• Three pop-ups in Glenroy, Fawkner and Brunswick3
• Community speak out in Coburg
• Focus group with Urdu women living in northern Moreland
• Internal stakeholder workshop (Council officers)
• External stakeholder workshop (including state government agencies, resident groups, traders’
associations, and so on).
1.3.2 Promotion of engagement in Phase 2
To promote the opportunity to participate in engagement to inform MITS, Council created awareness
and invited people to participate using the following channels:
• Online promotion:
o Council’s Facebook channel
o Council’s website
o Emails sent to people who participated in the December 2017 phase of engagement
• Other promotion:
o video screens at customer service centres
o posters at libraries and customer service centres
o advertisement in City News section of Moreland Leader
o opportunity to call Council to provide feedback and request hard copy of survey if required.
3 The survey was administered at pop ups alongside a ‘lo-fi’ paper-based version of the location hot-spotting similar to CrowdSpot, which was entered into the CrowdSpot online map after the pop ups
PHASE 2 ENGAGEMENT REPORT, MITS, FINAL VERSION, 10 APRIL 2018
10
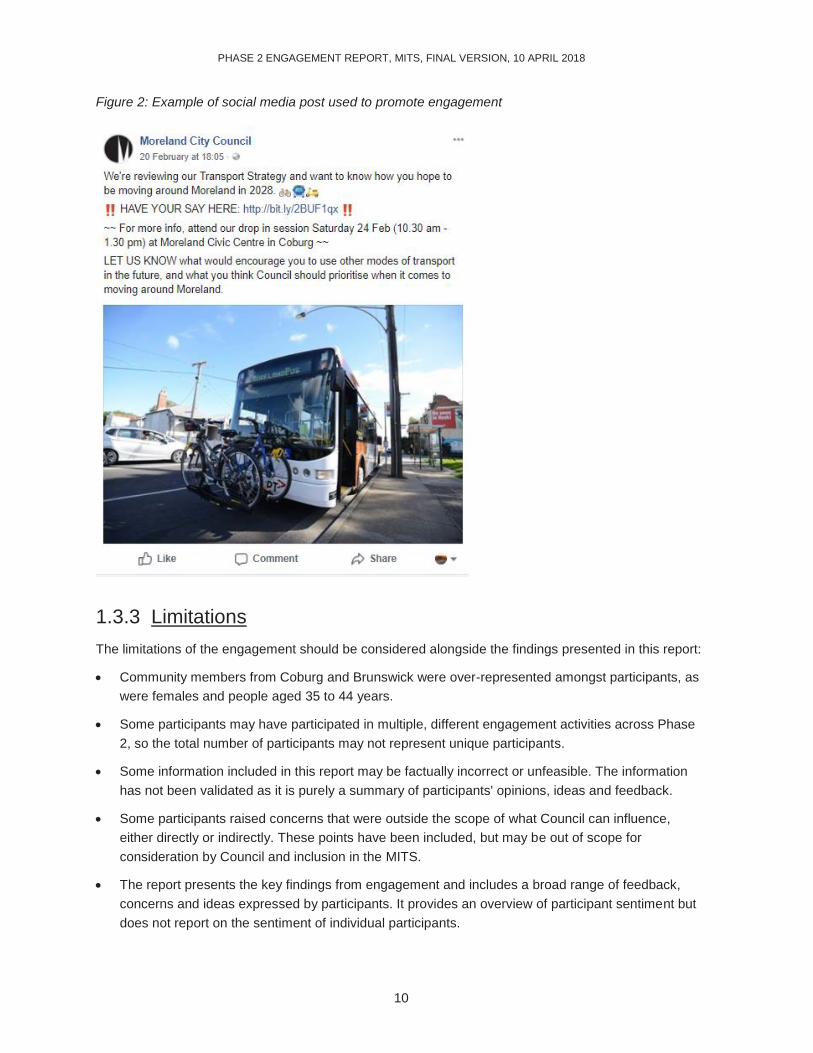
Figure 2: Example of social media post used to promote engagement
1.3.3 Limitations
The limitations of the engagement should be considered alongside the findings presented in this report:
• Community members from Coburg and Brunswick were over-represented amongst participants, as
were females and people aged 35 to 44 years.
• Some participants may have participated in multiple, different engagement activities across Phase
2, so the total number of participants may not represent unique participants.
• Some information included in this report may be factually incorrect or unfeasible. The information
has not been validated as it is purely a summary of participants' opinions, ideas and feedback.
• Some participants raised concerns that were outside the scope of what Council can influence,
either directly or indirectly. These points have been included, but may be out of scope for
consideration by Council and inclusion in the MITS.
• The report presents the key findings from engagement and includes a broad range of feedback,
concerns and ideas expressed by participants. It provides an overview of participant sentiment but
does not report on the sentiment of individual participants.
PHASE 2 ENGAGEMENT REPORT, MITS, FINAL VERSION, 10 APRIL 2018
11 WWW.CAPIRE.COM.AU
This section summarises the participation in Phase 2 of engagement and provides a demographic
breakdown of participants. Participants were not required to provide demographic or identifying
information if they did not wish.
2.1 Number of participants
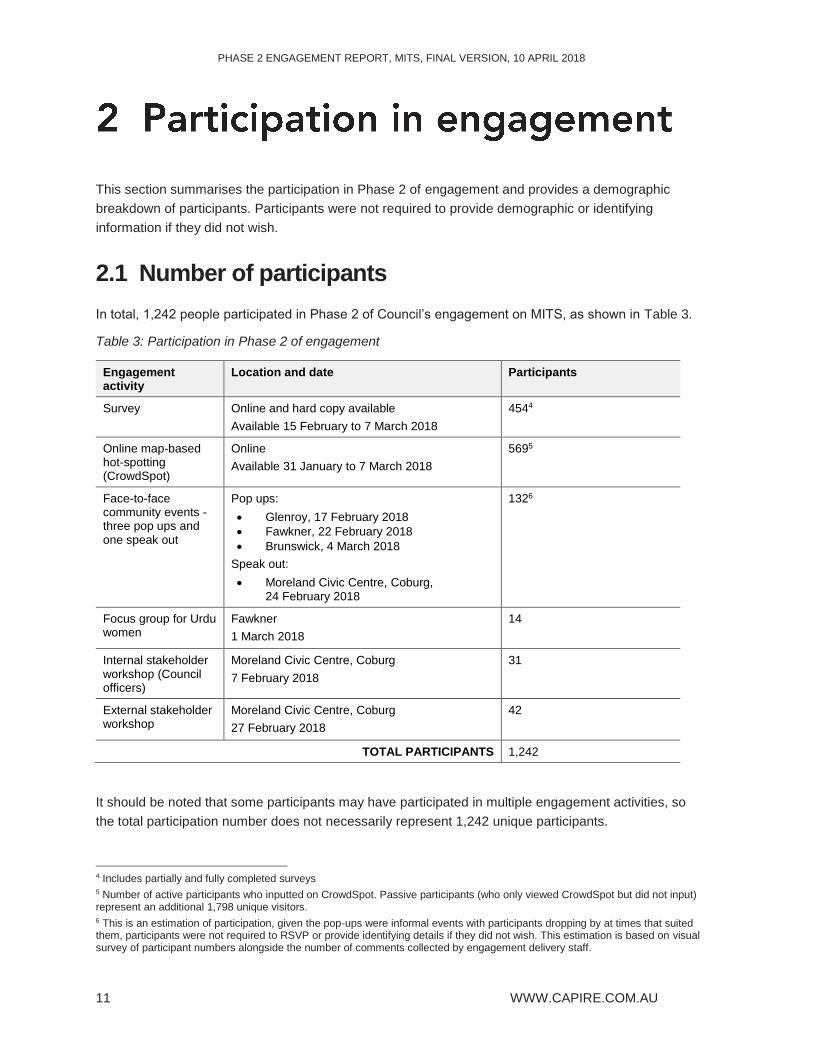
In total, 1,242 people participated in Phase 2 of Council’s engagement on MITS, as shown in Table 3.
Table 3: Participation in Phase 2 of engagement
Engagement activity
Location and date Participants
Survey Online and hard copy available
Available 15 February to 7 March 2018
4544
Online map-based hot-spotting (CrowdSpot)
Online
Available 31 January to 7 March 2018
5695
Face-to-face community events - three pop ups and one speak out
Pop ups:
• Glenroy, 17 February 2018
• Fawkner, 22 February 2018
• Brunswick, 4 March 2018
Speak out:
• Moreland Civic Centre, Coburg, 24 February 2018
1326
Focus group for Urdu women
Fawkner
1 March 2018
14
Internal stakeholder workshop (Council officers)
Moreland Civic Centre, Coburg
7 February 2018
31
External stakeholder workshop
Moreland Civic Centre, Coburg
27 February 2018
42
TOTAL PARTICIPANTS 1,242
It should be noted that some participants may have participated in multiple engagement activities, so
the total participation number does not necessarily represent 1,242 unique participants.
4 Includes partially and fully completed surveys 5 Number of active participants who inputted on CrowdSpot. Passive participants (who only viewed CrowdSpot but did not input) represent an additional 1,798 unique visitors. 6 This is an estimation of participation, given the pop-ups were informal events with participants dropping by at times that suited them, participants were not required to RSVP or provide identifying details if they did not wish. This estimation is based on visual survey of participant numbers alongside the number of comments collected by engagement delivery staff.
PHASE 2 ENGAGEMENT REPORT, MITS, FINAL VERSION, 10 APRIL 2018
12
2.2 Demographics of community participants
2.2.1 Age
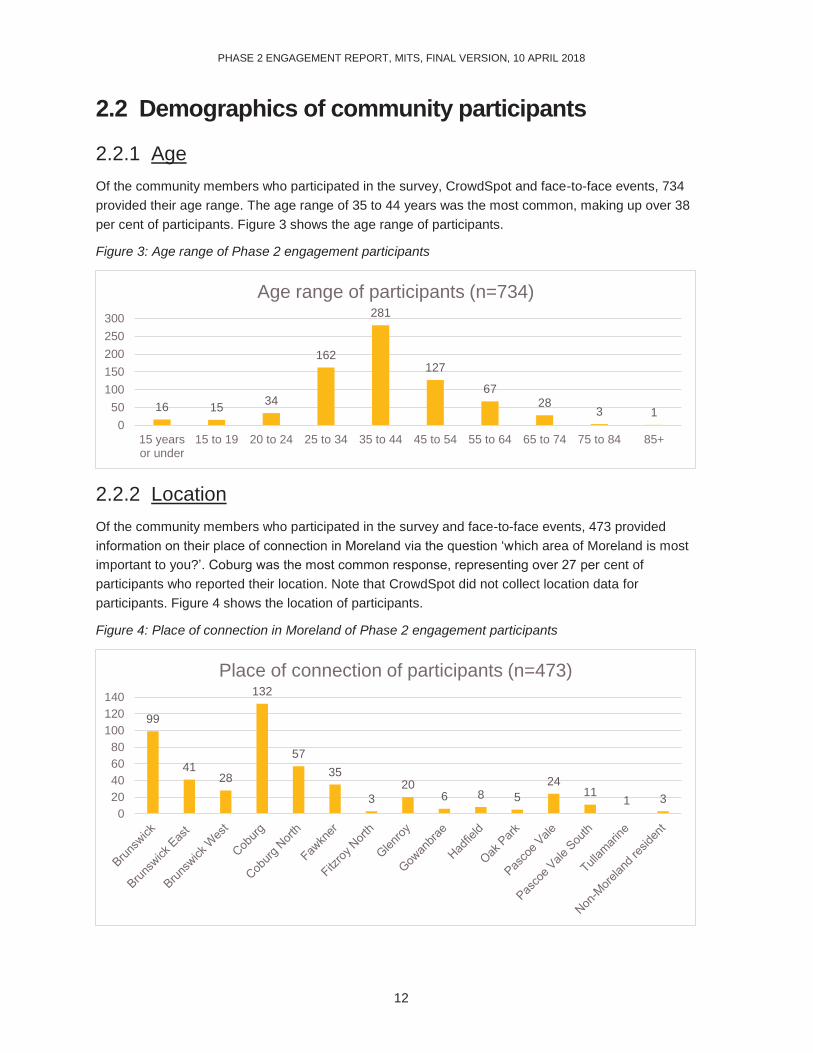
Of the community members who participated in the survey, CrowdSpot and face-to-face events, 734
provided their age range. The age range of 35 to 44 years was the most common, making up over 38
per cent of participants. Figure 3 shows the age range of participants.
Figure 3: Age range of Phase 2 engagement participants
2.2.2 Location
Of the community members who participated in the survey and face-to-face events, 473 provided
information on their place of connection in Moreland via the question ‘which area of Moreland is most
important to you?’. Coburg was the most common response, representing over 27 per cent of
participants who reported their location. Note that CrowdSpot did not collect location data for
participants. Figure 4 shows the location of participants.
Figure 4: Place of connection in Moreland of Phase 2 engagement participants
16 1534
162
281
127
6728
3 10
50
100
150
200
250
300
15 yearsor under
15 to 19 20 to 24 25 to 34 35 to 44 45 to 54 55 to 64 65 to 74 75 to 84 85+
Age range of participants (n=734)
99
4128
132
57
35
3
206 8 5
2411
1 3
0
20
40
60
80
100
120
140
Place of connection of participants (n=473)
PHASE 2 ENGAGEMENT REPORT, MITS, FINAL VERSION, 10 APRIL 2018
13 WWW.CAPIRE.COM.AU
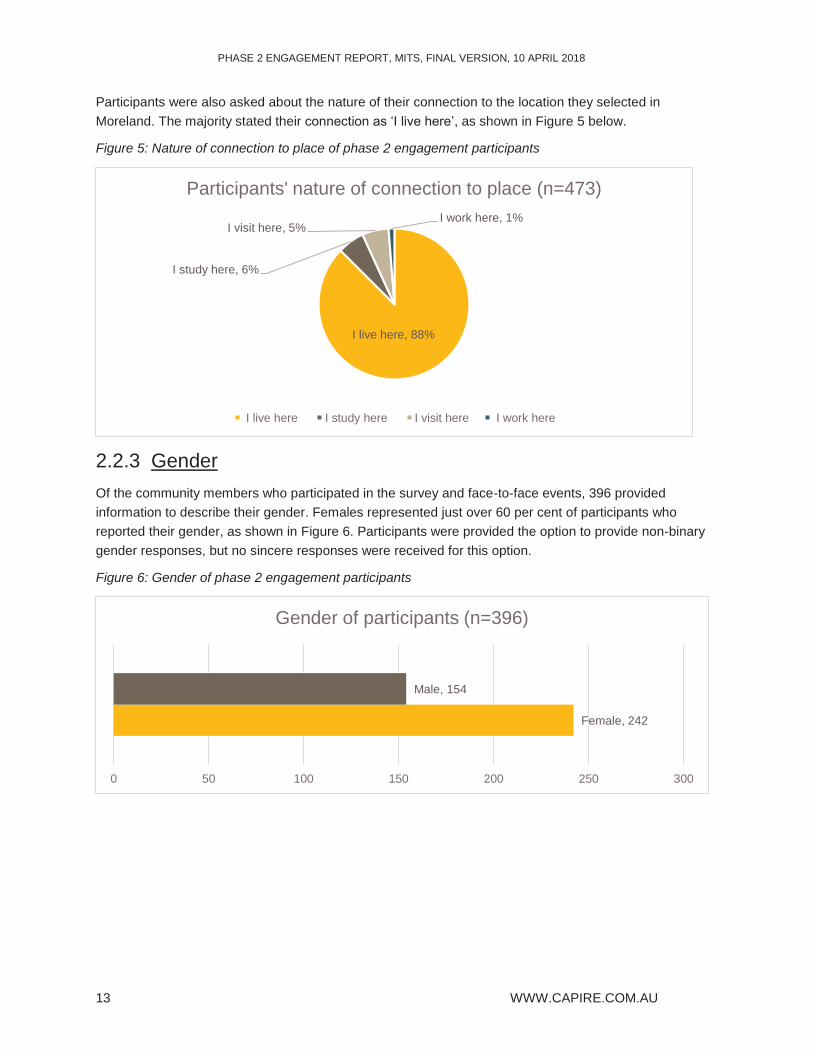
Participants were also asked about the nature of their connection to the location they selected in
Moreland. The majority stated their connection as ‘I live here’, as shown in Figure 5 below.
Figure 5: Nature of connection to place of phase 2 engagement participants
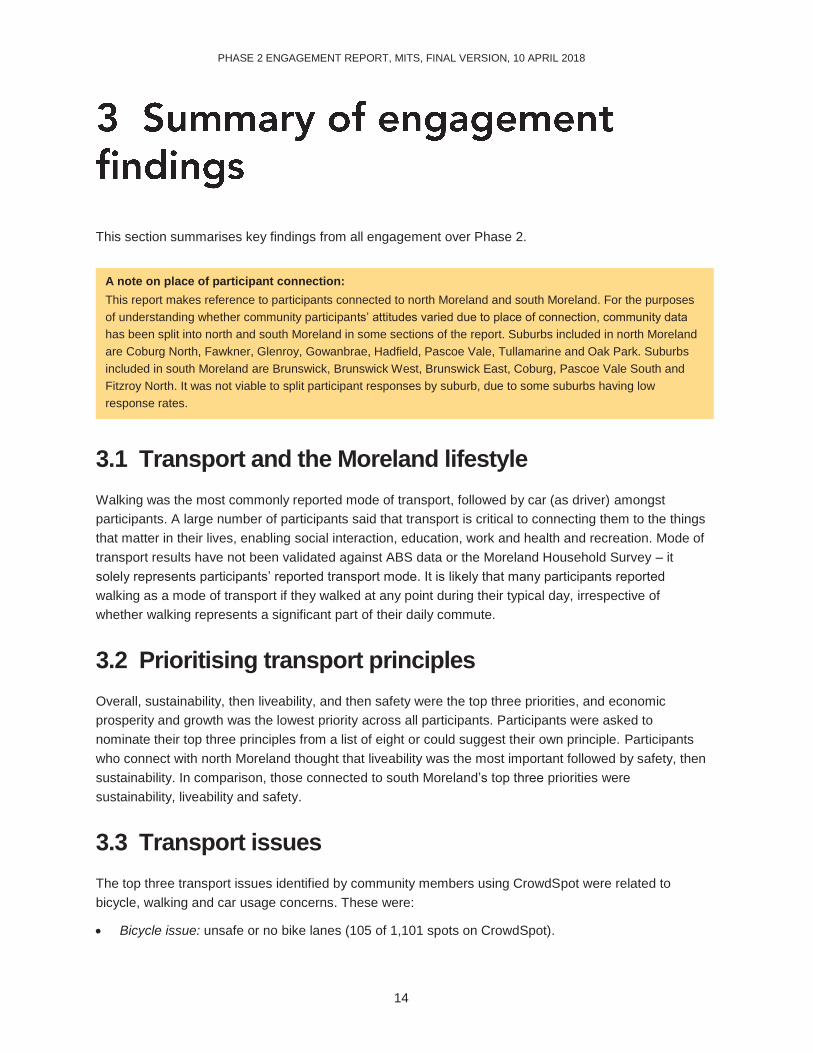
2.2.3 Gender
Of the community members who participated in the survey and face-to-face events, 396 provided
information to describe their gender. Females represented just over 60 per cent of participants who
reported their gender, as shown in Figure 6. Participants were provided the option to provide non-binary
gender responses, but no sincere responses were received for this option.
Figure 6: Gender of phase 2 engagement participants
I live here, 88%
I study here, 6%
I visit here, 5%I work here, 1%
Participants' nature of connection to place (n=473)
I live here I study here I visit here I work here
Female, 242
Male, 154
0 50 100 150 200 250 300
Gender of participants (n=396)
PHASE 2 ENGAGEMENT REPORT, MITS, FINAL VERSION, 10 APRIL 2018
14
This section summarises key findings from all engagement over Phase 2.
3.1 Transport and the Moreland lifestyle
Walking was the most commonly reported mode of transport, followed by car (as driver) amongst
participants. A large number of participants said that transport is critical to connecting them to the things
that matter in their lives, enabling social interaction, education, work and health and recreation. Mode of
transport results have not been validated against ABS data or the Moreland Household Survey – it
solely represents participants’ reported transport mode. It is likely that many participants reported
walking as a mode of transport if they walked at any point during their typical day, irrespective of
whether walking represents a significant part of their daily commute.
3.2 Prioritising transport principles
Overall, sustainability, then liveability, and then safety were the top three priorities, and economic
prosperity and growth was the lowest priority across all participants. Participants were asked to
nominate their top three principles from a list of eight or could suggest their own principle. Participants
who connect with north Moreland thought that liveability was the most important followed by safety, then
sustainability. In comparison, those connected to south Moreland’s top three priorities were
sustainability, liveability and safety.
3.3 Transport issues
The top three transport issues identified by community members using CrowdSpot were related to
bicycle, walking and car usage concerns. These were:
• Bicycle issue: unsafe or no bike lanes (105 of 1,101 spots on CrowdSpot).
A note on place of participant connection:
This report makes reference to participants connected to north Moreland and south Moreland. For the purposes
of understanding whether community participants’ attitudes varied due to place of connection, community data
has been split into north and south Moreland in some sections of the report. Suburbs included in north Moreland
are Coburg North, Fawkner, Glenroy, Gowanbrae, Hadfield, Pascoe Vale, Tullamarine and Oak Park. Suburbs
included in south Moreland are Brunswick, Brunswick West, Brunswick East, Coburg, Pascoe Vale South and
Fitzroy North. It was not viable to split participant responses by suburb, due to some suburbs having low
response rates.
PHASE 2 ENGAGEMENT REPORT, MITS, FINAL VERSION, 10 APRIL 2018
15 WWW.CAPIRE.COM.AU
• Walking issue: no crossing facilities (99 of 1,101 spots on CrowdSpot).
• Car issues: speeding traffic, seems unsafe and seems congested (67, 67 and 64 spots respectively
of 1,101 spots on CrowdSpot).
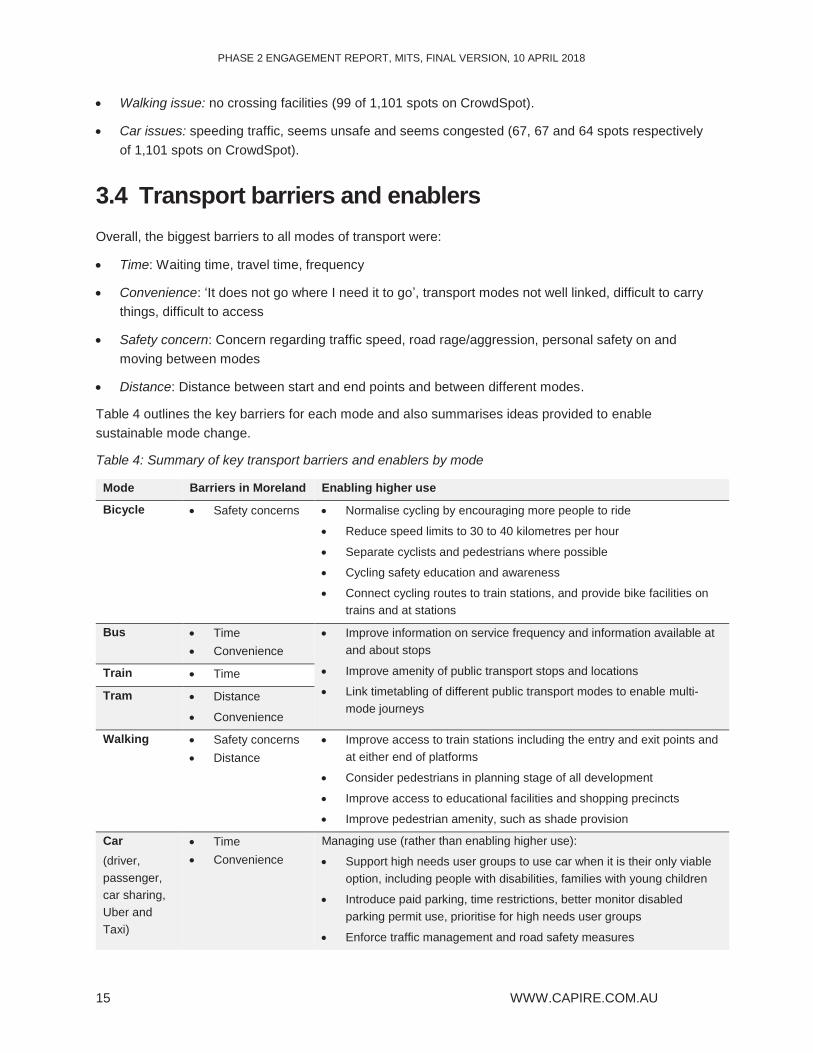
3.4 Transport barriers and enablers
Overall, the biggest barriers to all modes of transport were:
• Time: Waiting time, travel time, frequency
• Convenience: ‘It does not go where I need it to go’, transport modes not well linked, difficult to carry
things, difficult to access
• Safety concern: Concern regarding traffic speed, road rage/aggression, personal safety on and
moving between modes
• Distance: Distance between start and end points and between different modes.
Table 4 outlines the key barriers for each mode and also summarises ideas provided to enable
sustainable mode change.
Table 4: Summary of key transport barriers and enablers by mode
Mode Barriers in Moreland Enabling higher use
Bicycle • Safety concerns • Normalise cycling by encouraging more people to ride
• Reduce speed limits to 30 to 40 kilometres per hour
• Separate cyclists and pedestrians where possible
• Cycling safety education and awareness
• Connect cycling routes to train stations, and provide bike facilities on
trains and at stations
Bus • Time
• Convenience
• Improve information on service frequency and information available at
and about stops
• Improve amenity of public transport stops and locations
• Link timetabling of different public transport modes to enable multi-
mode journeys
Train • Time
Tram • Distance
• Convenience
Walking • Safety concerns
• Distance
• Improve access to train stations including the entry and exit points and
at either end of platforms
• Consider pedestrians in planning stage of all development
• Improve access to educational facilities and shopping precincts
• Improve pedestrian amenity, such as shade provision
Car
(driver,
passenger,
car sharing,
Uber and
Taxi)
• Time
• Convenience
Managing use (rather than enabling higher use):
• Support high needs user groups to use car when it is their only viable
option, including people with disabilities, families with young children
• Introduce paid parking, time restrictions, better monitor disabled
parking permit use, prioritise for high needs user groups
• Enforce traffic management and road safety measures
PHASE 2 ENGAGEMENT REPORT, MITS, FINAL VERSION, 10 APRIL 2018
16
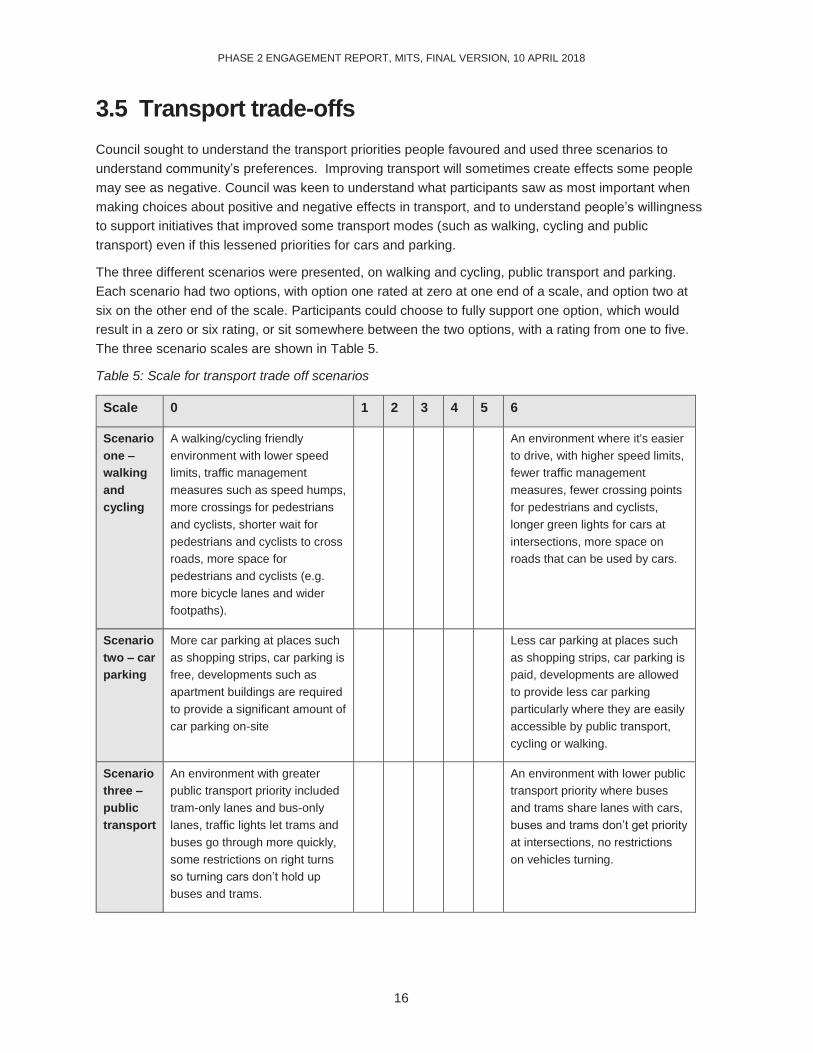
3.5 Transport trade-offs
Council sought to understand the transport priorities people favoured and used three scenarios to
understand community’s preferences. Improving transport will sometimes create effects some people
may see as negative. Council was keen to understand what participants saw as most important when
making choices about positive and negative effects in transport, and to understand people’s willingness
to support initiatives that improved some transport modes (such as walking, cycling and public
transport) even if this lessened priorities for cars and parking.
The three different scenarios were presented, on walking and cycling, public transport and parking.
Each scenario had two options, with option one rated at zero at one end of a scale, and option two at
six on the other end of the scale. Participants could choose to fully support one option, which would
result in a zero or six rating, or sit somewhere between the two options, with a rating from one to five.
The three scenario scales are shown in Table 5.
Table 5: Scale for transport trade off scenarios
Scale 0 1 2 3 4 5 6
Scenario
one –
walking
and
cycling
A walking/cycling friendly
environment with lower speed
limits, traffic management
measures such as speed humps,
more crossings for pedestrians
and cyclists, shorter wait for
pedestrians and cyclists to cross
roads, more space for
pedestrians and cyclists (e.g.
more bicycle lanes and wider
footpaths).
An environment where it's easier
to drive, with higher speed limits,
fewer traffic management
measures, fewer crossing points
for pedestrians and cyclists,
longer green lights for cars at
intersections, more space on
roads that can be used by cars.
Scenario
two – car
parking
More car parking at places such
as shopping strips, car parking is
free, developments such as
apartment buildings are required
to provide a significant amount of
car parking on-site
Less car parking at places such
as shopping strips, car parking is
paid, developments are allowed
to provide less car parking
particularly where they are easily
accessible by public transport,
cycling or walking.
Scenario
three –
public
transport
An environment with greater
public transport priority included
tram-only lanes and bus-only
lanes, traffic lights let trams and
buses go through more quickly,
some restrictions on right turns
so turning cars don’t hold up
buses and trams.
An environment with lower public
transport priority where buses
and trams share lanes with cars,
buses and trams don’t get priority
at intersections, no restrictions
on vehicles turning.
PHASE 2 ENGAGEMENT REPORT, MITS, FINAL VERSION, 10 APRIL 2018
17 WWW.CAPIRE.COM.AU
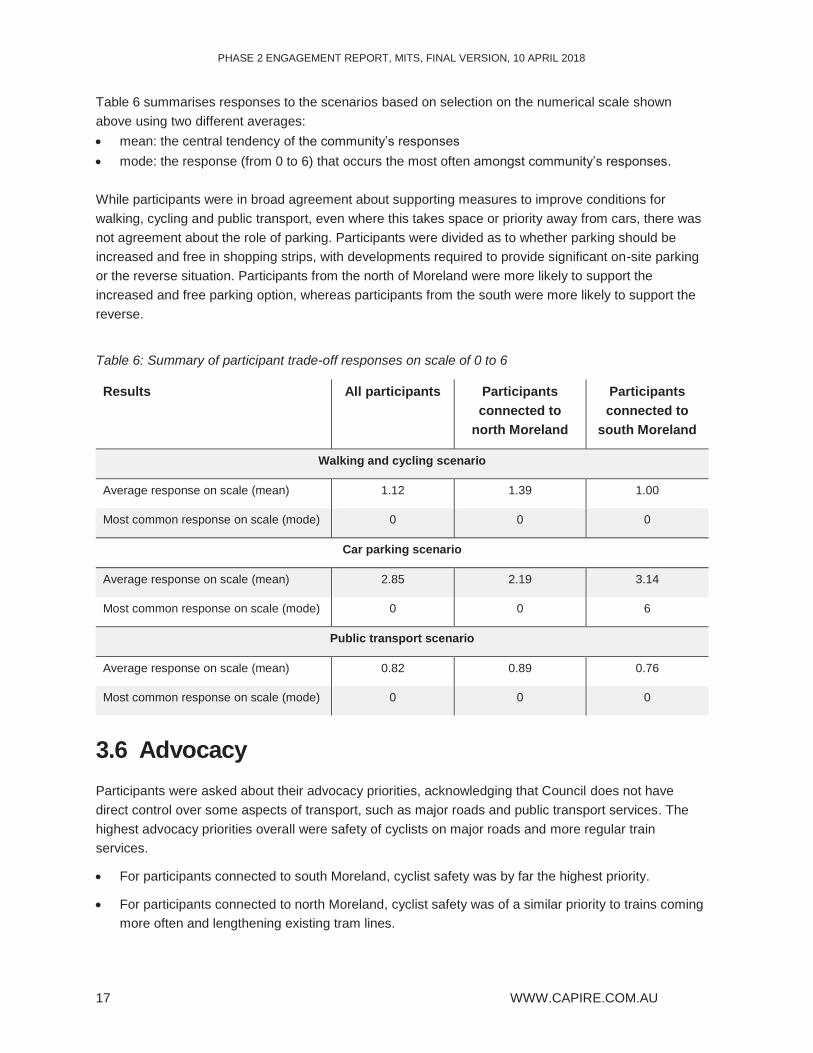
Table 6 summarises responses to the scenarios based on selection on the numerical scale shown
above using two different averages:
• mean: the central tendency of the community’s responses
• mode: the response (from 0 to 6) that occurs the most often amongst community’s responses.
While participants were in broad agreement about supporting measures to improve conditions for
walking, cycling and public transport, even where this takes space or priority away from cars, there was
not agreement about the role of parking. Participants were divided as to whether parking should be
increased and free in shopping strips, with developments required to provide significant on-site parking
or the reverse situation. Participants from the north of Moreland were more likely to support the
increased and free parking option, whereas participants from the south were more likely to support the
reverse.
Table 6: Summary of participant trade-off responses on scale of 0 to 6
Results All participants Participants
connected to
north Moreland
Participants
connected to
south Moreland
Walking and cycling scenario
Average response on scale (mean) 1.12 1.39 1.00
Most common response on scale (mode) 0 0 0
Car parking scenario
Average response on scale (mean) 2.85 2.19 3.14
Most common response on scale (mode) 0 0 6
Public transport scenario
Average response on scale (mean) 0.82 0.89 0.76
Most common response on scale (mode) 0 0 0
3.6 Advocacy
Participants were asked about their advocacy priorities, acknowledging that Council does not have
direct control over some aspects of transport, such as major roads and public transport services. The
highest advocacy priorities overall were safety of cyclists on major roads and more regular train
services.
• For participants connected to south Moreland, cyclist safety was by far the highest priority.
• For participants connected to north Moreland, cyclist safety was of a similar priority to trains coming
more often and lengthening existing tram lines.
PHASE 2 ENGAGEMENT REPORT, MITS, FINAL VERSION, 10 APRIL 2018
18
4 Detailed engagement findings
4.1 Transport and the Moreland lifestyle
4.1.1 Usage of different modes of transport
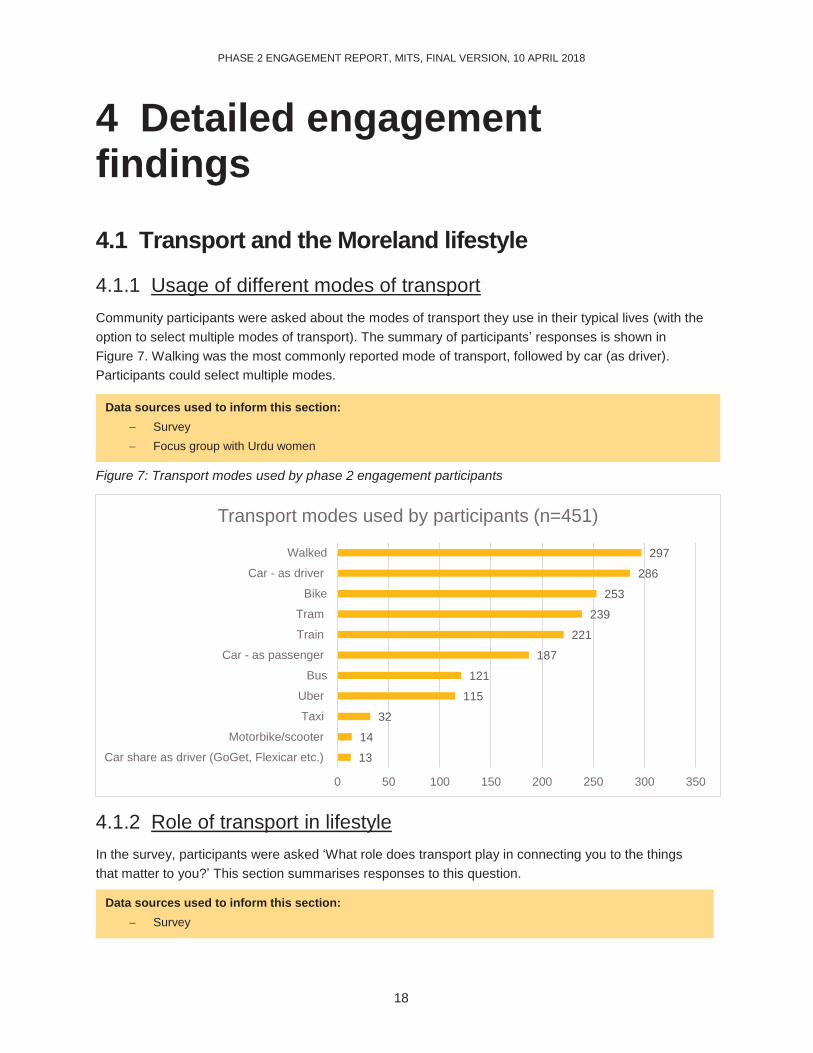
Community participants were asked about the modes of transport they use in their typical lives (with the
option to select multiple modes of transport). The summary of participants’ responses is shown in
Figure 7. Walking was the most commonly reported mode of transport, followed by car (as driver).
Participants could select multiple modes.
Figure 7: Transport modes used by phase 2 engagement participants
4.1.2 Role of transport in lifestyle
In the survey, participants were asked ‘What role does transport play in connecting you to the things
that matter to you?’ This section summarises responses to this question.
13
14
32
115
121
187
221
239
253
286
297
0 50 100 150 200 250 300 350
Car share as driver (GoGet, Flexicar etc.)
Motorbike/scooter
Taxi
Uber
Bus
Car - as passenger
Train
Tram
Bike
Car - as driver
Walked
Transport modes used by participants (n=451)
Data sources used to inform this section:
Survey
Focus group with Urdu women
Data sources used to inform this section:
Survey
PHASE 2 ENGAGEMENT REPORT, MITS, FINAL VERSION, 10 APRIL 2018
19 WWW.CAPIRE.COM.AU
Most of the 159 participants who answered this question said broadly that transport connected them to
the things that matter most to them in their life. Of the survey participants who answered this question,
43 per cent (68 of 159) said specifically that transport is critical to connecting them to the things that
matter in their lives. To describe the role of transport these participants used words such as necessary,
vital, immensely important, crucial, essential, fundamental, major, central.
Most participants who answered this question discussed public transport over cars. There were 37
participants who mentioned public transport and two who mentioned cars specifically.
Key themes
The key themes identified by participants are listed below, alongside some participants’ responses on
the aspects of their life that transport connects them to.
• Social interaction (28 participants): Connection to friends and community locally and in other parts
of Melbourne; access to events, new locations and social activities, more opportunities to
participate in public life as well as the chances to interact with others while travelling.
o ‘Having wheelchair-accessible transport options means I can socialise and otherwise
participate in my community, which I believe is essential.’
o ‘Lots of my social life also requires me to get to the Melbourne CBD or other areas outside
of where I live so public transport plays a huge role in getting me there.’
o ‘I would be very isolated and trapped without my car.’
• Education (21 participants): Travelling between home and school for both children and adults.
Many of the parents who responded said it is important that the journey is safe, enjoyable and
efficient.
o ‘Better transport means us mums can stay longer at work, no need to pick kids up.’
o ‘I frequently ride with my young children, to their school and to local shops and to visit
friends, and with better infrastructure this could also be much safer.’
o ‘I work in the CBD, but my 12-month-old daughter is at childcare near home on Victoria
street. Travelling to/from the city is an important part of my day.’
• Work (20 participants): Getting to work efficiently and on time was important to many participants.
o ‘Transport is vital to how my family participates in society in relation to work. It is also
crucially important in maintaining relationships and personal wellbeing.’
o ‘It ensures I get to work on time.’
o ‘Main mode of transport to work - affects my commute time.’
o ‘Without my bicycle I would not have convenient access to work in the city.’
• Health and recreation (12 participants): Walking and public transport can provide opportunities to
exercise, live a healthy lifestyle and can have positive outcomes on mental health. Transport also
plays an important role in connecting people to health services and places for recreation.
o ‘In emergency I can go by the train and connects me health service.’
PHASE 2 ENGAGEMENT REPORT, MITS, FINAL VERSION, 10 APRIL 2018
20
o ‘Bike transport makes life easier to get around (no parking, no car maintenance) so I pop
out more often, I bump into people I know more often, it's great health wise (physical and
mental).’
• Family (8 participants): The ability to travel to visit and connect with family across Melbourne as
well as the need to ensure family members, especially young children can travel safely.
o ‘Without my car I could not conveniently visit family living in the western suburbs.’
o ‘It plays a big role and will play an even bigger role when my daughter is old enough to take
public transport on her own, but Fawkner is not connected well enough which worries me a
lot.’
Some participants also noted that having various modes of transport also plays a role in ensuring
people of all abilities can reach the things that matter:
o ‘I am disabled and cannot cycle or walk far, so rely more on other forms of transport which
can be disappointing.’
o ‘I used to walk but now illness means it is not possible.’
4.2 Principles to guide transport in MITS
This section outlines participant feedback on the principles that should guide the new MITS.
Participants were asked to choose their top three priorities from the list in Error! Reference source n
ot found.Table 7, though they could also suggest other principles. Figure 8 on the following page
shows the principles in priority order for participants.
Data sources used to inform this section:
Survey
Community speakout
Pop-up (Brunswick - co-located with the Sydney Road Street Party where Council had a stall, so
more extensive engagement activities were able to be run)
PHASE 2 ENGAGEMENT REPORT, MITS, FINAL VERSION, 10 APRIL 2018
21 WWW.CAPIRE.COM.AU
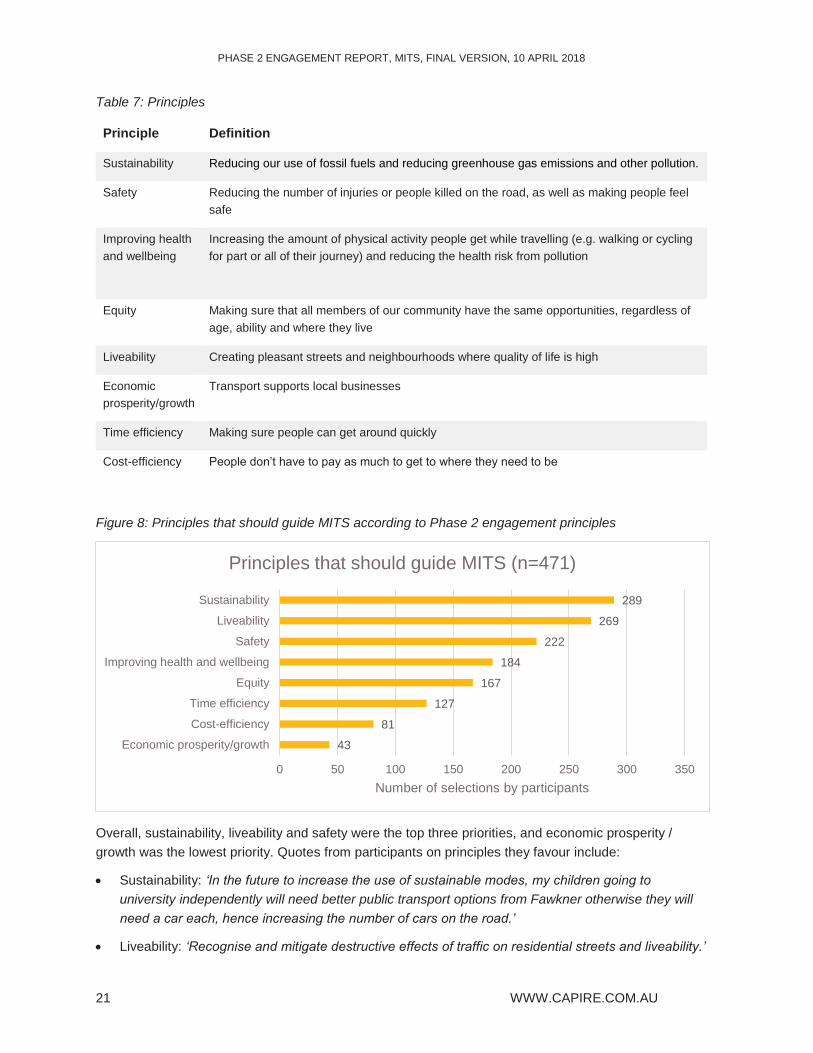
Table 7: Principles
Principle Definition
Sustainability Reducing our use of fossil fuels and reducing greenhouse gas emissions and other pollution.
Safety Reducing the number of injuries or people killed on the road, as well as making people feel
safe
Improving health
and wellbeing
Increasing the amount of physical activity people get while travelling (e.g. walking or cycling
for part or all of their journey) and reducing the health risk from pollution
Equity Making sure that all members of our community have the same opportunities, regardless of
age, ability and where they live
Liveability Creating pleasant streets and neighbourhoods where quality of life is high
Economic
prosperity/growth
Transport supports local businesses
Time efficiency Making sure people can get around quickly
Cost-efficiency People don’t have to pay as much to get to where they need to be
Figure 8: Principles that should guide MITS according to Phase 2 engagement principles
Overall, sustainability, liveability and safety were the top three priorities, and economic prosperity /
growth was the lowest priority. Quotes from participants on principles they favour include:
• Sustainability: ‘In the future to increase the use of sustainable modes, my children going to
university independently will need better public transport options from Fawkner otherwise they will
need a car each, hence increasing the number of cars on the road.’
• Liveability: ‘Recognise and mitigate destructive effects of traffic on residential streets and liveability.’
43
81
127
167
184
222
269
289
0 50 100 150 200 250 300 350
Economic prosperity/growth
Cost-efficiency
Time efficiency
Equity
Improving health and wellbeing
Safety
Liveability
Sustainability
Number of selections by participants
Principles that should guide MITS (n=471)
PHASE 2 ENGAGEMENT REPORT, MITS, FINAL VERSION, 10 APRIL 2018
22
• Safety: ‘I commend the council for thinking about the safety of people walking and cycling but
please do not forget about us who need to use a car, bus, train and tram.’
• Improving health and wellbeing: ‘Let's have a transport strategy that values people centred
transport, for a greener, safer and healthier Moreland.’’
• Equity: ‘That all local streets are treated equally. To prevent some streets bearing more of the brunt
of through traffic than others.’
• Time efficiency: ‘(Transport should help) me get to where I need to go. Ideally, in the least possible
time and with minimal hassle.’
• Cost-efficiency: ‘Moreland Council should focus on reducing costs (of transport).’
• Economic prosperity/growth: ‘Economic growth - transport sustains increased residential numbers.’
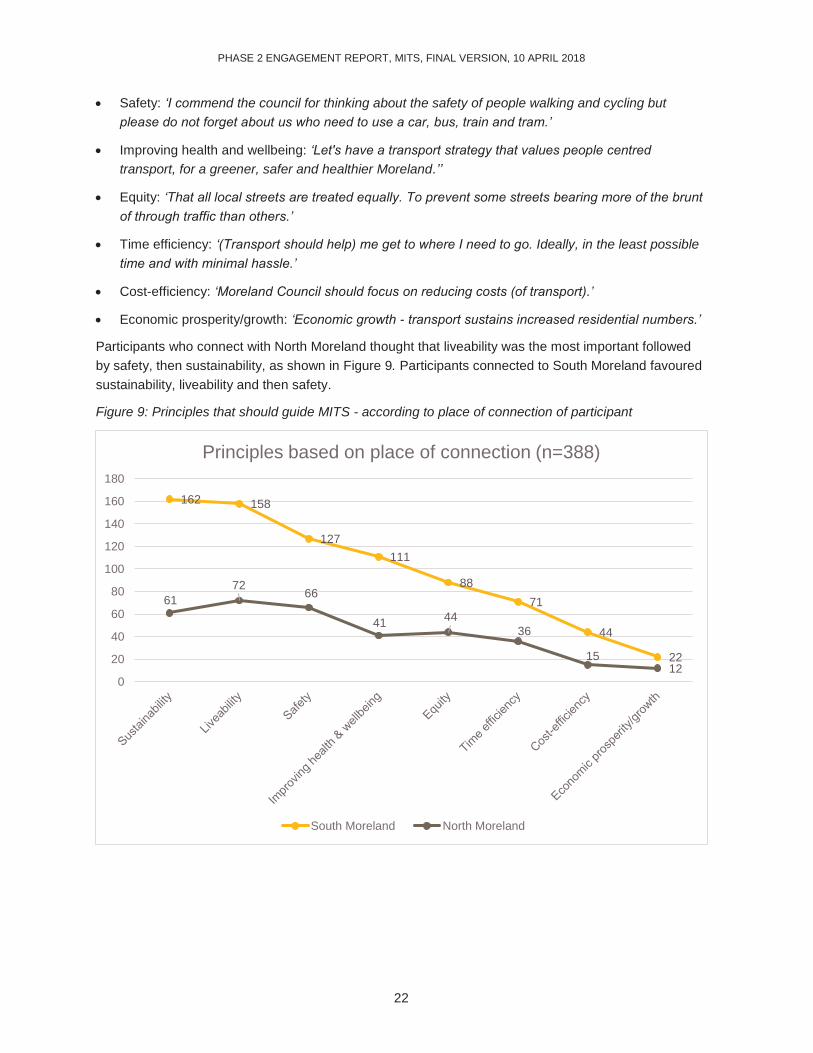
Participants who connect with North Moreland thought that liveability was the most important followed
by safety, then sustainability, as shown in Figure 9. Participants connected to South Moreland favoured
sustainability, liveability and then safety.
Figure 9: Principles that should guide MITS - according to place of connection of participant
162 158
127
111
88
71
44
22
61
7266
4144
36
1512
0
20
40
60
80
100
120
140
160
180
Principles based on place of connection (n=388)
South Moreland North Moreland
PHASE 2 ENGAGEMENT REPORT, MITS, FINAL VERSION, 10 APRIL 2018
23 WWW.CAPIRE.COM.AU
4.3 Location-based transport issues and opportunities
Participants identified location-based issues and opportunities across Moreland that hinder and help
movement. This section summarises their feedback. Community and stakeholder feedback has been
split into two sections, as different tools of data collection were employed for these two groups.
Community members completed this activity via CrowdSpot, while stakeholders contributed via
workshops and also focused on providing actions to respond to situations.
Refer to the separate CrowdSpot report for a detailed analysis of community feedback on
location-based issues.
4.3.1 Transport issues according to community
This section summarises key findings from CrowdSpot’s analysis of community input on location-based
issues.
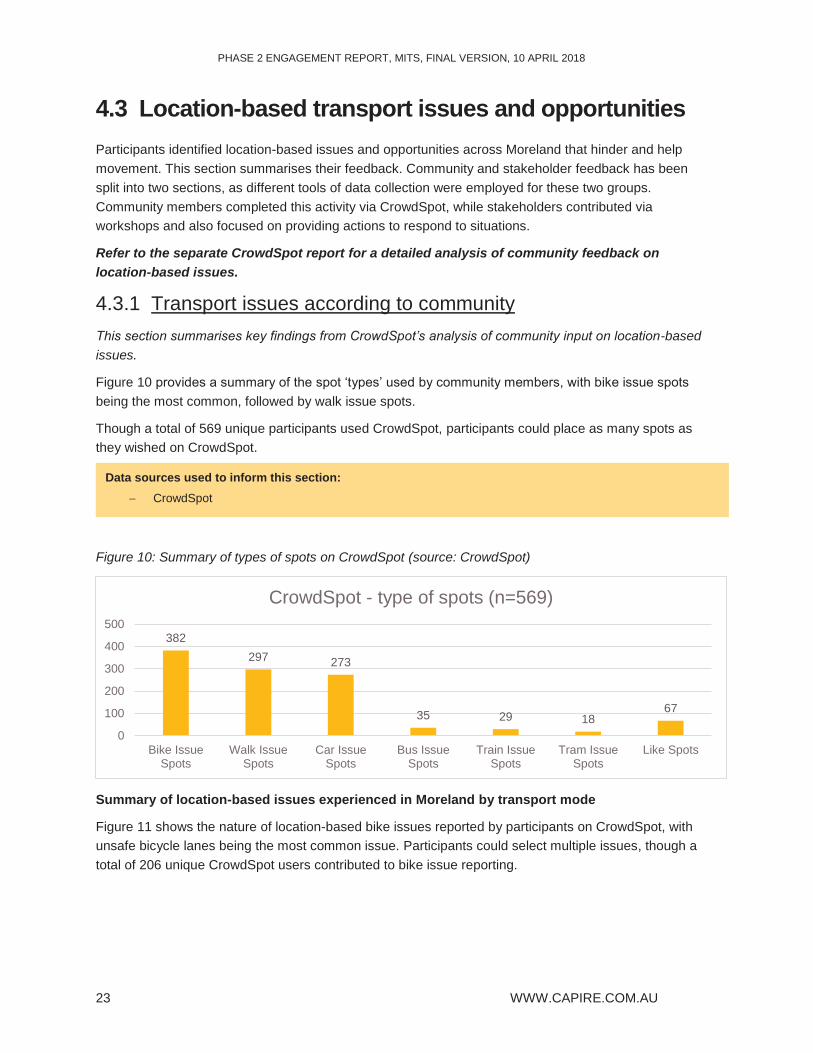
Figure 10 provides a summary of the spot ‘types’ used by community members, with bike issue spots
being the most common, followed by walk issue spots.
Though a total of 569 unique participants used CrowdSpot, participants could place as many spots as
they wished on CrowdSpot.
Figure 10: Summary of types of spots on CrowdSpot (source: CrowdSpot)
Summary of location-based issues experienced in Moreland by transport mode
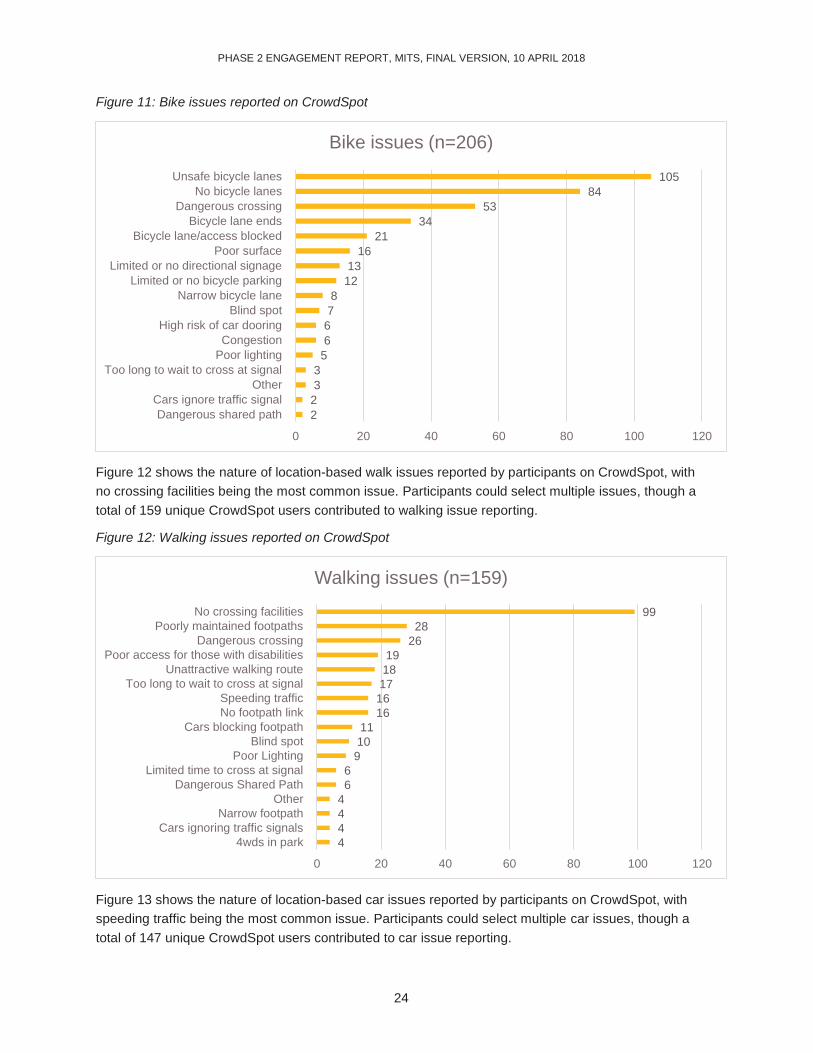
Figure 11 shows the nature of location-based bike issues reported by participants on CrowdSpot, with
unsafe bicycle lanes being the most common issue. Participants could select multiple issues, though a
total of 206 unique CrowdSpot users contributed to bike issue reporting.
382
297 273
35 29 1867
0
100
200
300
400
500
Bike IssueSpots
Walk IssueSpots
Car IssueSpots
Bus IssueSpots
Train IssueSpots
Tram IssueSpots
Like Spots
CrowdSpot - type of spots (n=569)
Data sources used to inform this section:
CrowdSpot
PHASE 2 ENGAGEMENT REPORT, MITS, FINAL VERSION, 10 APRIL 2018
24
Figure 11: Bike issues reported on CrowdSpot
Figure 12 shows the nature of location-based walk issues reported by participants on CrowdSpot, with
no crossing facilities being the most common issue. Participants could select multiple issues, though a
total of 159 unique CrowdSpot users contributed to walking issue reporting.
Figure 12: Walking issues reported on CrowdSpot
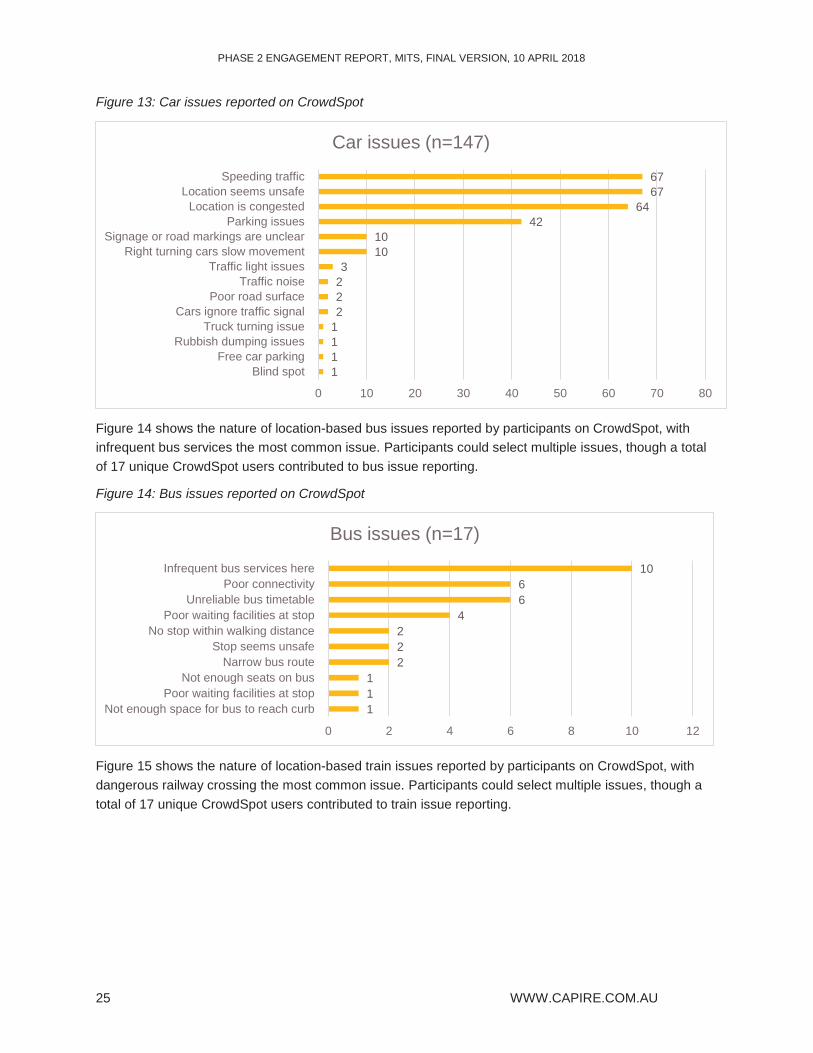
Figure 13 shows the nature of location-based car issues reported by participants on CrowdSpot, with
speeding traffic being the most common issue. Participants could select multiple car issues, though a
total of 147 unique CrowdSpot users contributed to car issue reporting.
2
2
3
3
5
6
6
7
8
12
13
16
21
34
53
84
105
0 20 40 60 80 100 120
Dangerous shared path
Cars ignore traffic signal
Other
Too long to wait to cross at signal
Poor lighting
Congestion
High risk of car dooring
Blind spot
Narrow bicycle lane
Limited or no bicycle parking
Limited or no directional signage
Poor surface
Bicycle lane/access blocked
Bicycle lane ends
Dangerous crossing
No bicycle lanes
Unsafe bicycle lanes
Bike issues (n=206)
4
4
4
4
6
6
9
10
11
16
16
17
18
19
26
28
99
0 20 40 60 80 100 120
4wds in park
Cars ignoring traffic signals
Narrow footpath
Other
Dangerous Shared Path
Limited time to cross at signal
Poor Lighting
Blind spot
Cars blocking footpath
No footpath link
Speeding traffic
Too long to wait to cross at signal
Unattractive walking route
Poor access for those with disabilities
Dangerous crossing
Poorly maintained footpaths
No crossing facilities
Walking issues (n=159)
PHASE 2 ENGAGEMENT REPORT, MITS, FINAL VERSION, 10 APRIL 2018
25 WWW.CAPIRE.COM.AU
Figure 13: Car issues reported on CrowdSpot
Figure 14 shows the nature of location-based bus issues reported by participants on CrowdSpot, with
infrequent bus services the most common issue. Participants could select multiple issues, though a total
of 17 unique CrowdSpot users contributed to bus issue reporting.
Figure 14: Bus issues reported on CrowdSpot
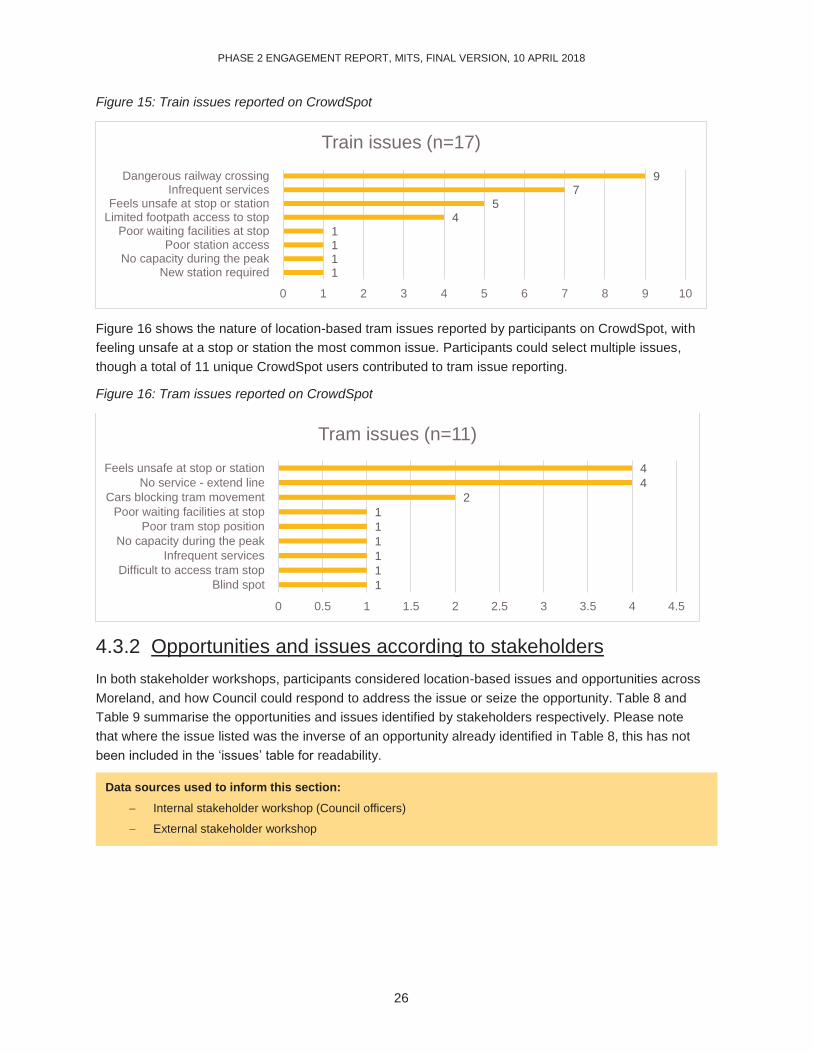
Figure 15 shows the nature of location-based train issues reported by participants on CrowdSpot, with
dangerous railway crossing the most common issue. Participants could select multiple issues, though a
total of 17 unique CrowdSpot users contributed to train issue reporting.
1
1
1
1
2
2
2
3
10
10
42
64
67
67
0 10 20 30 40 50 60 70 80
Blind spot
Free car parking
Rubbish dumping issues
Truck turning issue
Cars ignore traffic signal
Poor road surface
Traffic noise
Traffic light issues
Right turning cars slow movement
Signage or road markings are unclear
Parking issues
Location is congested
Location seems unsafe
Speeding traffic
Car issues (n=147)
1
1
1
2
2
2
4
6
6
10
0 2 4 6 8 10 12
Not enough space for bus to reach curb
Poor waiting facilities at stop
Not enough seats on bus
Narrow bus route
Stop seems unsafe
No stop within walking distance
Poor waiting facilities at stop
Unreliable bus timetable
Poor connectivity
Infrequent bus services here
Bus issues (n=17)
PHASE 2 ENGAGEMENT REPORT, MITS, FINAL VERSION, 10 APRIL 2018
26
Figure 15: Train issues reported on CrowdSpot
Figure 16 shows the nature of location-based tram issues reported by participants on CrowdSpot, with
feeling unsafe at a stop or station the most common issue. Participants could select multiple issues,
though a total of 11 unique CrowdSpot users contributed to tram issue reporting.
Figure 16: Tram issues reported on CrowdSpot
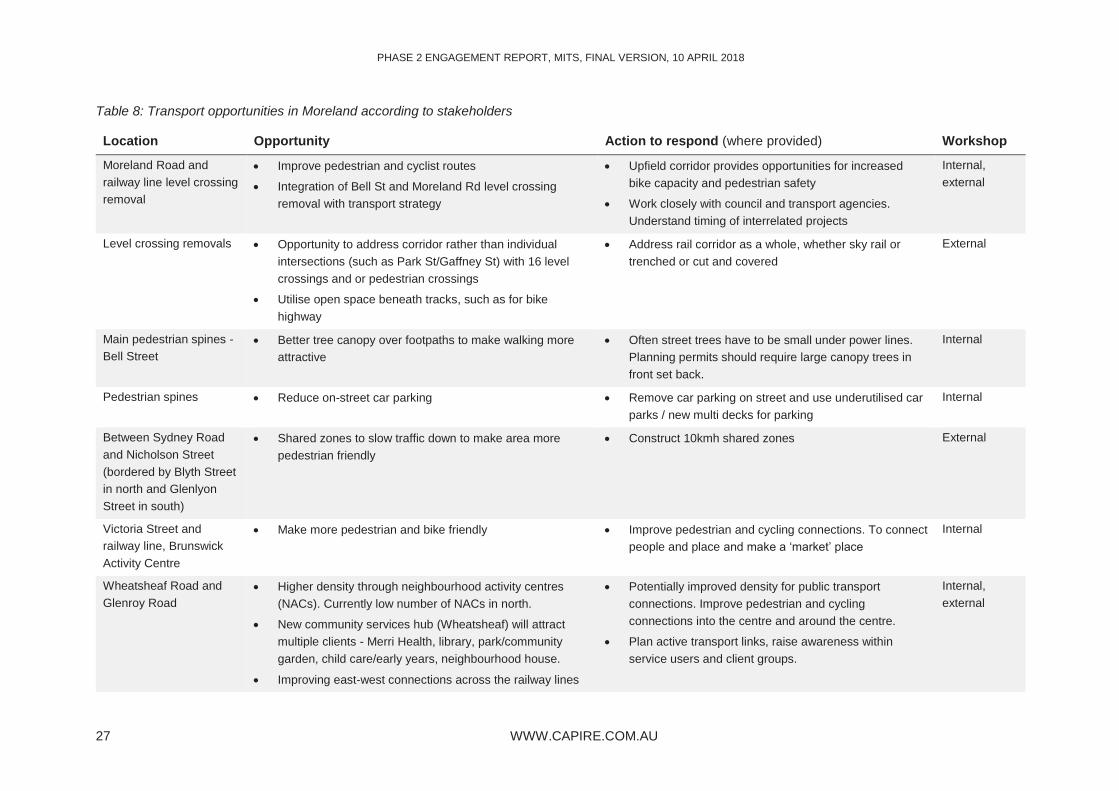
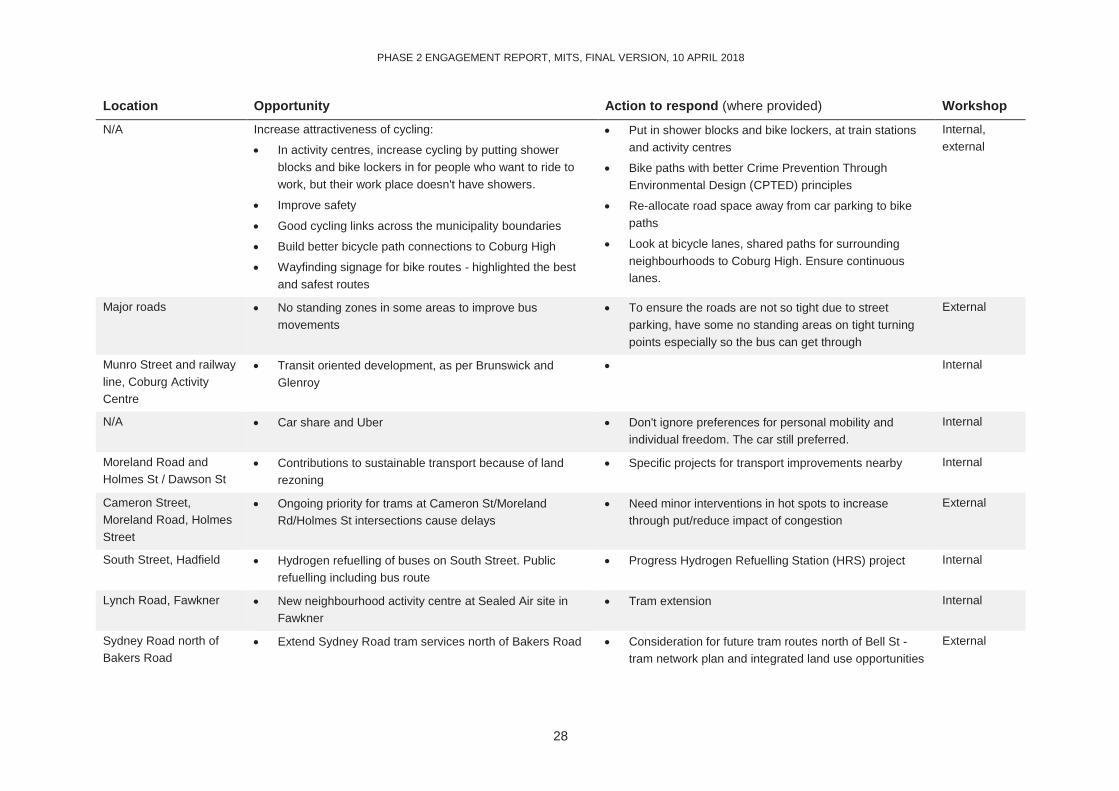
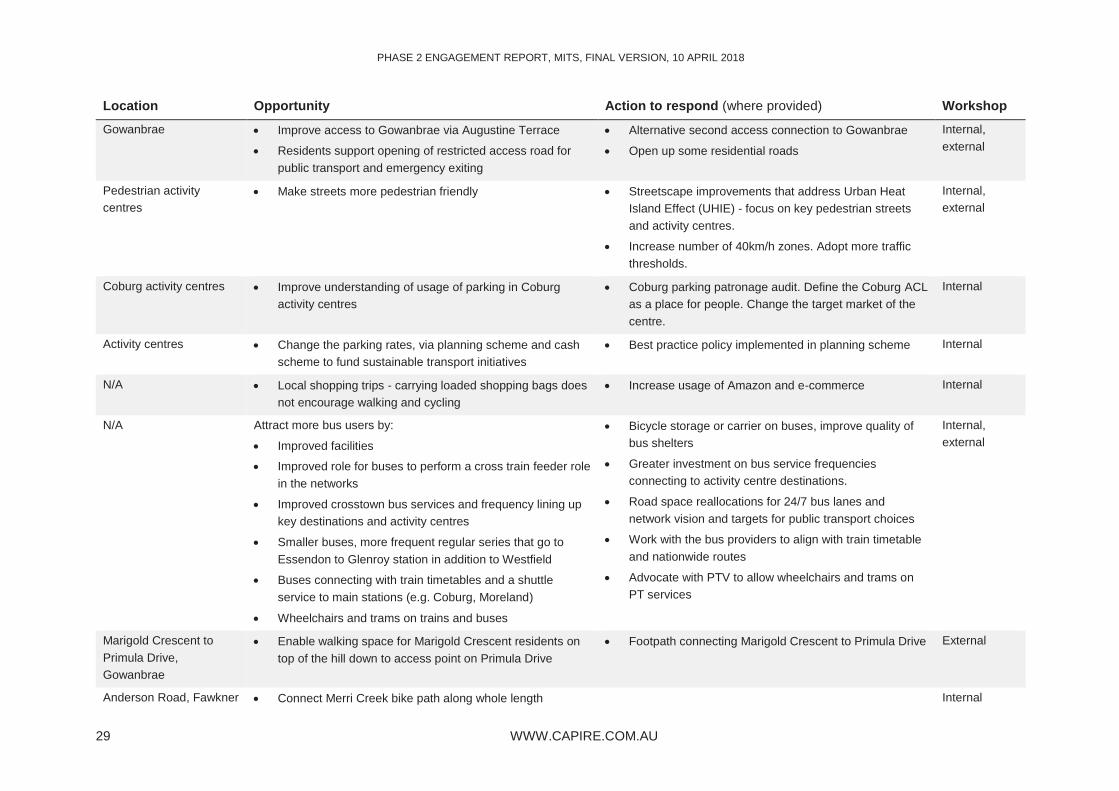
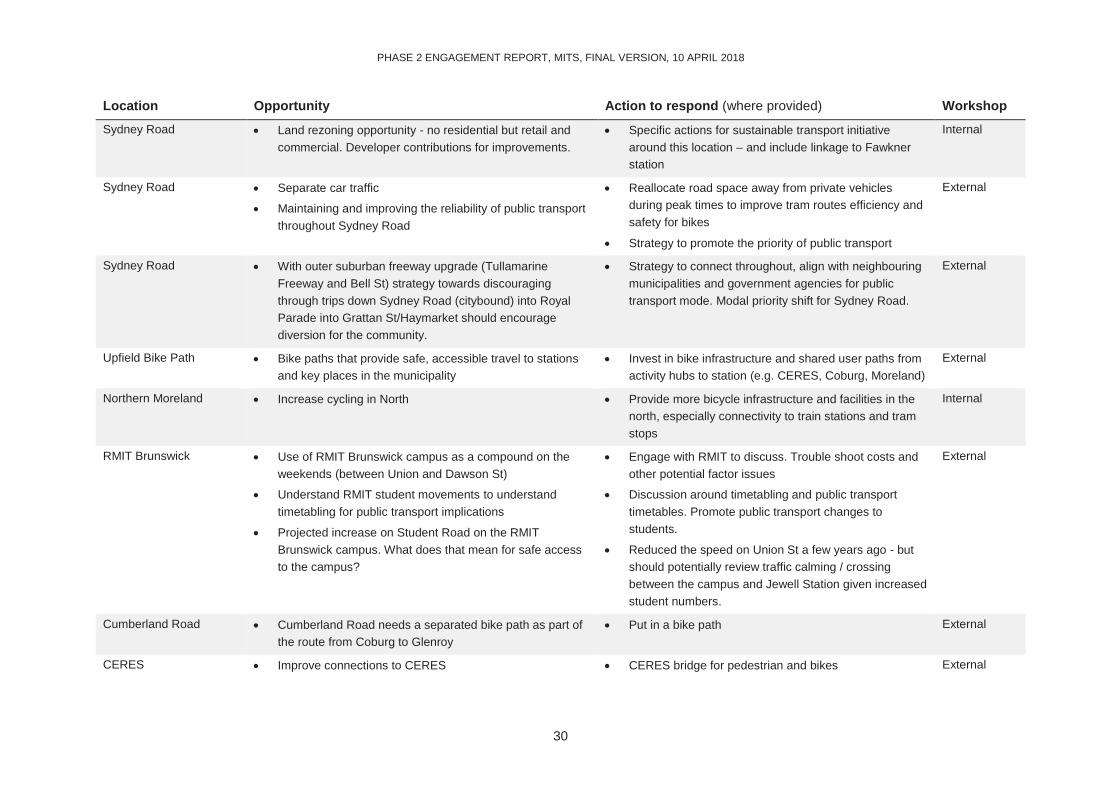
4.3.2 Opportunities and issues according to stakeholders
In both stakeholder workshops, participants considered location-based issues and opportunities across
Moreland, and how Council could respond to address the issue or seize the opportunity. Table 8 and
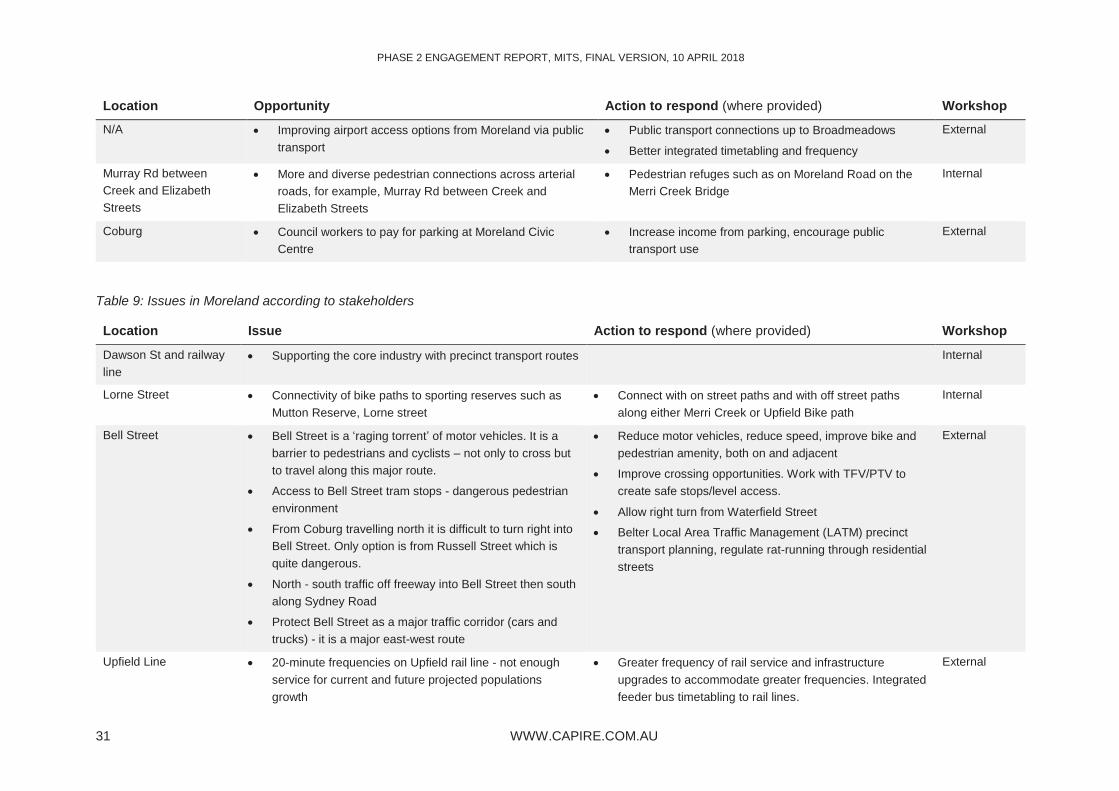
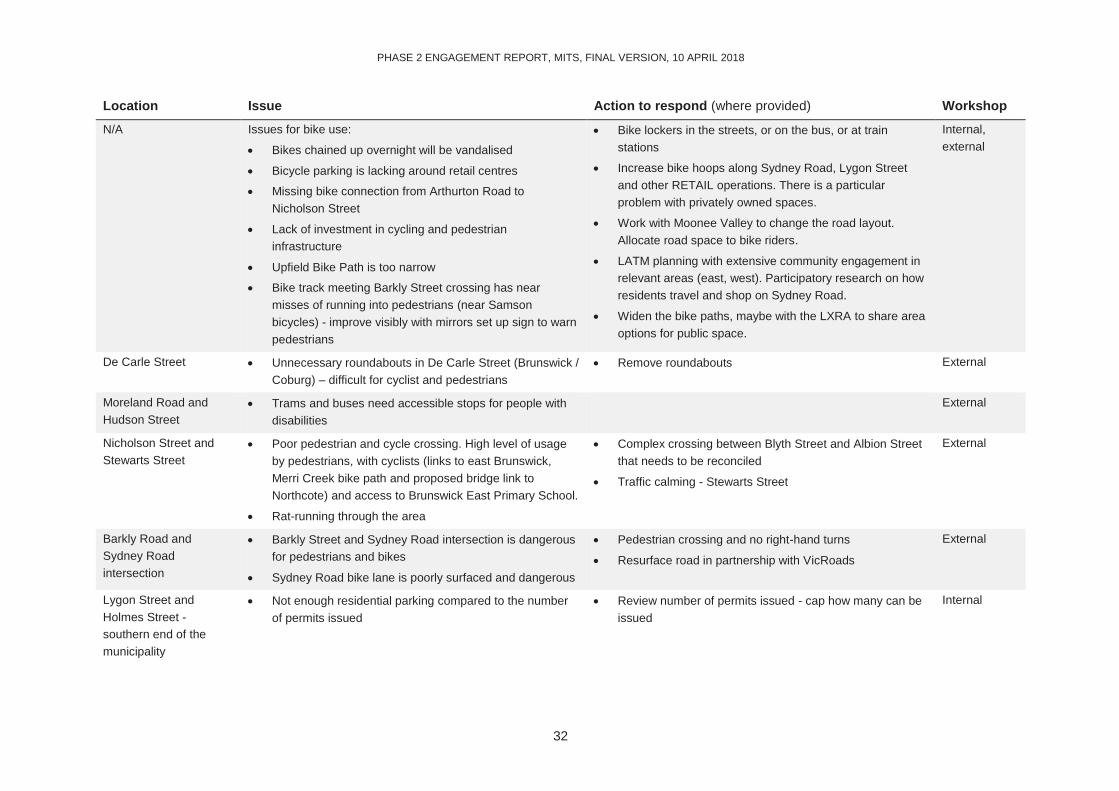
Table 9 summarise the opportunities and issues identified by stakeholders respectively. Please note
that where the issue listed was the inverse of an opportunity already identified in Table 8, this has not
been included in the ‘issues’ table for readability.
1111
45
79
0 1 2 3 4 5 6 7 8 9 10
New station requiredNo capacity during the peak
Poor station accessPoor waiting facilities at stop
Limited footpath access to stopFeels unsafe at stop or station
Infrequent servicesDangerous railway crossing
Train issues (n=17)
1
1
1
1
1
1
2
4
4
0 0.5 1 1.5 2 2.5 3 3.5 4 4.5
Blind spot
Difficult to access tram stop
Infrequent services
No capacity during the peak
Poor tram stop position
Poor waiting facilities at stop
Cars blocking tram movement
No service - extend line
Feels unsafe at stop or station
Tram issues (n=11)
Data sources used to inform this section:
Internal stakeholder workshop (Council officers)
External stakeholder workshop
PHASE 2 ENGAGEMENT REPORT, MITS, FINAL VERSION, 10 APRIL 2018
27 WWW.CAPIRE.COM.AU
Table 8: Transport opportunities in Moreland according to stakeholders
Location Opportunity Action to respond (where provided) Workshop
Moreland Road and
railway line level crossing
removal
• Improve pedestrian and cyclist routes
• Integration of Bell St and Moreland Rd level crossing
removal with transport strategy
• Upfield corridor provides opportunities for increased
bike capacity and pedestrian safety
• Work closely with council and transport agencies.
Understand timing of interrelated projects
Internal,
external
Level crossing removals • Opportunity to address corridor rather than individual
intersections (such as Park St/Gaffney St) with 16 level
crossings and or pedestrian crossings
• Utilise open space beneath tracks, such as for bike
highway
• Address rail corridor as a whole, whether sky rail or
trenched or cut and covered
External
Main pedestrian spines -
Bell Street
• Better tree canopy over footpaths to make walking more
attractive
• Often street trees have to be small under power lines.
Planning permits should require large canopy trees in
front set back.
Internal
Pedestrian spines • Reduce on-street car parking • Remove car parking on street and use underutilised car
parks / new multi decks for parking
Internal
Between Sydney Road
and Nicholson Street
(bordered by Blyth Street
in north and Glenlyon
Street in south)
• Shared zones to slow traffic down to make area more
pedestrian friendly
• Construct 10kmh shared zones External
Victoria Street and
railway line, Brunswick
Activity Centre
• Make more pedestrian and bike friendly • Improve pedestrian and cycling connections. To connect
people and place and make a ‘market’ place
Internal
Wheatsheaf Road and
Glenroy Road
• Higher density through neighbourhood activity centres
(NACs). Currently low number of NACs in north.
• New community services hub (Wheatsheaf) will attract
multiple clients - Merri Health, library, park/community
garden, child care/early years, neighbourhood house.
• Improving east-west connections across the railway lines
• Potentially improved density for public transport
connections. Improve pedestrian and cycling
connections into the centre and around the centre.
• Plan active transport links, raise awareness within
service users and client groups.
Internal,
external
PHASE 2 ENGAGEMENT REPORT, MITS, FINAL VERSION, 10 APRIL 2018
28
Location Opportunity Action to respond (where provided) Workshop
N/A Increase attractiveness of cycling:
• In activity centres, increase cycling by putting shower
blocks and bike lockers in for people who want to ride to
work, but their work place doesn't have showers.
• Improve safety
• Good cycling links across the municipality boundaries
• Build better bicycle path connections to Coburg High
• Wayfinding signage for bike routes - highlighted the best
and safest routes
• Put in shower blocks and bike lockers, at train stations
and activity centres
• Bike paths with better Crime Prevention Through
Environmental Design (CPTED) principles
• Re-allocate road space away from car parking to bike
paths
• Look at bicycle lanes, shared paths for surrounding
neighbourhoods to Coburg High. Ensure continuous
lanes.
Internal,
external
Major roads • No standing zones in some areas to improve bus
movements
• To ensure the roads are not so tight due to street
parking, have some no standing areas on tight turning
points especially so the bus can get through
External
Munro Street and railway
line, Coburg Activity
Centre
• Transit oriented development, as per Brunswick and
Glenroy
• Internal
N/A • Car share and Uber • Don't ignore preferences for personal mobility and
individual freedom. The car still preferred.
Internal
Moreland Road and
Holmes St / Dawson St
• Contributions to sustainable transport because of land
rezoning
• Specific projects for transport improvements nearby Internal
Cameron Street,
Moreland Road, Holmes
Street
• Ongoing priority for trams at Cameron St/Moreland
Rd/Holmes St intersections cause delays
• Need minor interventions in hot spots to increase
through put/reduce impact of congestion
External
South Street, Hadfield • Hydrogen refuelling of buses on South Street. Public
refuelling including bus route
• Progress Hydrogen Refuelling Station (HRS) project Internal
Lynch Road, Fawkner • New neighbourhood activity centre at Sealed Air site in
Fawkner
• Tram extension Internal
Sydney Road north of
Bakers Road
• Extend Sydney Road tram services north of Bakers Road • Consideration for future tram routes north of Bell St -
tram network plan and integrated land use opportunities
External
PHASE 2 ENGAGEMENT REPORT, MITS, FINAL VERSION, 10 APRIL 2018
29 WWW.CAPIRE.COM.AU
Location Opportunity Action to respond (where provided) Workshop
Gowanbrae • Improve access to Gowanbrae via Augustine Terrace
• Residents support opening of restricted access road for
public transport and emergency exiting
• Alternative second access connection to Gowanbrae
• Open up some residential roads
Internal,
external
Pedestrian activity
centres
• Make streets more pedestrian friendly • Streetscape improvements that address Urban Heat
Island Effect (UHIE) - focus on key pedestrian streets
and activity centres.
• Increase number of 40km/h zones. Adopt more traffic
thresholds.
Internal,
external
Coburg activity centres • Improve understanding of usage of parking in Coburg
activity centres
• Coburg parking patronage audit. Define the Coburg ACL
as a place for people. Change the target market of the
centre.
Internal
Activity centres • Change the parking rates, via planning scheme and cash
scheme to fund sustainable transport initiatives
• Best practice policy implemented in planning scheme Internal
N/A • Local shopping trips - carrying loaded shopping bags does
not encourage walking and cycling
• Increase usage of Amazon and e-commerce Internal
N/A Attract more bus users by:
• Improved facilities
• Improved role for buses to perform a cross train feeder role
in the networks
• Improved crosstown bus services and frequency lining up
key destinations and activity centres
• Smaller buses, more frequent regular series that go to
Essendon to Glenroy station in addition to Westfield
• Buses connecting with train timetables and a shuttle
service to main stations (e.g. Coburg, Moreland)
• Wheelchairs and trams on trains and buses
• Bicycle storage or carrier on buses, improve quality of
bus shelters
• Greater investment on bus service frequencies
connecting to activity centre destinations.
• Road space reallocations for 24/7 bus lanes and
network vision and targets for public transport choices
• Work with the bus providers to align with train timetable
and nationwide routes
• Advocate with PTV to allow wheelchairs and trams on
PT services
Internal,
external
Marigold Crescent to
Primula Drive,
Gowanbrae
• Enable walking space for Marigold Crescent residents on
top of the hill down to access point on Primula Drive
• Footpath connecting Marigold Crescent to Primula Drive
External
Anderson Road, Fawkner • Connect Merri Creek bike path along whole length Internal
PHASE 2 ENGAGEMENT REPORT, MITS, FINAL VERSION, 10 APRIL 2018
30
Location Opportunity Action to respond (where provided) Workshop
Sydney Road • Land rezoning opportunity - no residential but retail and
commercial. Developer contributions for improvements.
• Specific actions for sustainable transport initiative
around this location – and include linkage to Fawkner
station
Internal
Sydney Road • Separate car traffic
• Maintaining and improving the reliability of public transport
throughout Sydney Road
• Reallocate road space away from private vehicles
during peak times to improve tram routes efficiency and
safety for bikes
• Strategy to promote the priority of public transport
External
Sydney Road • With outer suburban freeway upgrade (Tullamarine
Freeway and Bell St) strategy towards discouraging
through trips down Sydney Road (citybound) into Royal
Parade into Grattan St/Haymarket should encourage
diversion for the community.
• Strategy to connect throughout, align with neighbouring
municipalities and government agencies for public
transport mode. Modal priority shift for Sydney Road.
External
Upfield Bike Path • Bike paths that provide safe, accessible travel to stations
and key places in the municipality
• Invest in bike infrastructure and shared user paths from
activity hubs to station (e.g. CERES, Coburg, Moreland)
External
Northern Moreland • Increase cycling in North • Provide more bicycle infrastructure and facilities in the
north, especially connectivity to train stations and tram
stops
Internal
RMIT Brunswick • Use of RMIT Brunswick campus as a compound on the
weekends (between Union and Dawson St)
• Understand RMIT student movements to understand
timetabling for public transport implications
• Projected increase on Student Road on the RMIT
Brunswick campus. What does that mean for safe access
to the campus?
• Engage with RMIT to discuss. Trouble shoot costs and
other potential factor issues
• Discussion around timetabling and public transport
timetables. Promote public transport changes to
students.
• Reduced the speed on Union St a few years ago - but
should potentially review traffic calming / crossing
between the campus and Jewell Station given increased
student numbers.
External
Cumberland Road • Cumberland Road needs a separated bike path as part of
the route from Coburg to Glenroy
• Put in a bike path External
CERES • Improve connections to CERES • CERES bridge for pedestrian and bikes External
PHASE 2 ENGAGEMENT REPORT, MITS, FINAL VERSION, 10 APRIL 2018
31 WWW.CAPIRE.COM.AU
Location Opportunity Action to respond (where provided) Workshop
N/A • Improving airport access options from Moreland via public
transport
• Public transport connections up to Broadmeadows
• Better integrated timetabling and frequency
External
Murray Rd between
Creek and Elizabeth
Streets
• More and diverse pedestrian connections across arterial
roads, for example, Murray Rd between Creek and
Elizabeth Streets
• Pedestrian refuges such as on Moreland Road on the
Merri Creek Bridge
Internal
Coburg • Council workers to pay for parking at Moreland Civic
Centre
• Increase income from parking, encourage public
transport use
External
Table 9: Issues in Moreland according to stakeholders
Location Issue Action to respond (where provided) Workshop
Dawson St and railway
line
• Supporting the core industry with precinct transport routes Internal
Lorne Street • Connectivity of bike paths to sporting reserves such as
Mutton Reserve, Lorne street
• Connect with on street paths and with off street paths
along either Merri Creek or Upfield Bike path
Internal
Bell Street • Bell Street is a ‘raging torrent’ of motor vehicles. It is a
barrier to pedestrians and cyclists – not only to cross but
to travel along this major route.
• Access to Bell Street tram stops - dangerous pedestrian
environment
• From Coburg travelling north it is difficult to turn right into
Bell Street. Only option is from Russell Street which is
quite dangerous.
• North - south traffic off freeway into Bell Street then south
along Sydney Road
• Protect Bell Street as a major traffic corridor (cars and
trucks) - it is a major east-west route
• Reduce motor vehicles, reduce speed, improve bike and
pedestrian amenity, both on and adjacent
• Improve crossing opportunities. Work with TFV/PTV to
create safe stops/level access.
• Allow right turn from Waterfield Street
• Belter Local Area Traffic Management (LATM) precinct
transport planning, regulate rat-running through residential
streets
External
Upfield Line • 20-minute frequencies on Upfield rail line - not enough
service for current and future projected populations
growth
• Greater frequency of rail service and infrastructure
upgrades to accommodate greater frequencies. Integrated
feeder bus timetabling to rail lines.
External
PHASE 2 ENGAGEMENT REPORT, MITS, FINAL VERSION, 10 APRIL 2018
32
Location Issue Action to respond (where provided) Workshop
N/A Issues for bike use:
• Bikes chained up overnight will be vandalised
• Bicycle parking is lacking around retail centres
• Missing bike connection from Arthurton Road to
Nicholson Street
• Lack of investment in cycling and pedestrian
infrastructure
• Upfield Bike Path is too narrow
• Bike track meeting Barkly Street crossing has near
misses of running into pedestrians (near Samson
bicycles) - improve visibly with mirrors set up sign to warn
pedestrians
• Bike lockers in the streets, or on the bus, or at train
stations
• Increase bike hoops along Sydney Road, Lygon Street
and other RETAIL operations. There is a particular
problem with privately owned spaces.
• Work with Moonee Valley to change the road layout.
Allocate road space to bike riders.
• LATM planning with extensive community engagement in
relevant areas (east, west). Participatory research on how
residents travel and shop on Sydney Road.
• Widen the bike paths, maybe with the LXRA to share area
options for public space.
Internal,
external
De Carle Street • Unnecessary roundabouts in De Carle Street (Brunswick /
Coburg) – difficult for cyclist and pedestrians
• Remove roundabouts External
Moreland Road and
Hudson Street
• Trams and buses need accessible stops for people with
disabilities
External
Nicholson Street and
Stewarts Street
• Poor pedestrian and cycle crossing. High level of usage
by pedestrians, with cyclists (links to east Brunswick,
Merri Creek bike path and proposed bridge link to
Northcote) and access to Brunswick East Primary School.
• Rat-running through the area
• Complex crossing between Blyth Street and Albion Street
that needs to be reconciled
• Traffic calming - Stewarts Street
External
Barkly Road and
Sydney Road
intersection
• Barkly Street and Sydney Road intersection is dangerous
for pedestrians and bikes
• Sydney Road bike lane is poorly surfaced and dangerous
• Pedestrian crossing and no right-hand turns
• Resurface road in partnership with VicRoads
External
Lygon Street and
Holmes Street -
southern end of the
municipality
• Not enough residential parking compared to the number
of permits issued
• Review number of permits issued - cap how many can be
issued
Internal
PHASE 2 ENGAGEMENT REPORT, MITS, FINAL VERSION, 10 APRIL 2018
33 WWW.CAPIRE.COM.AU
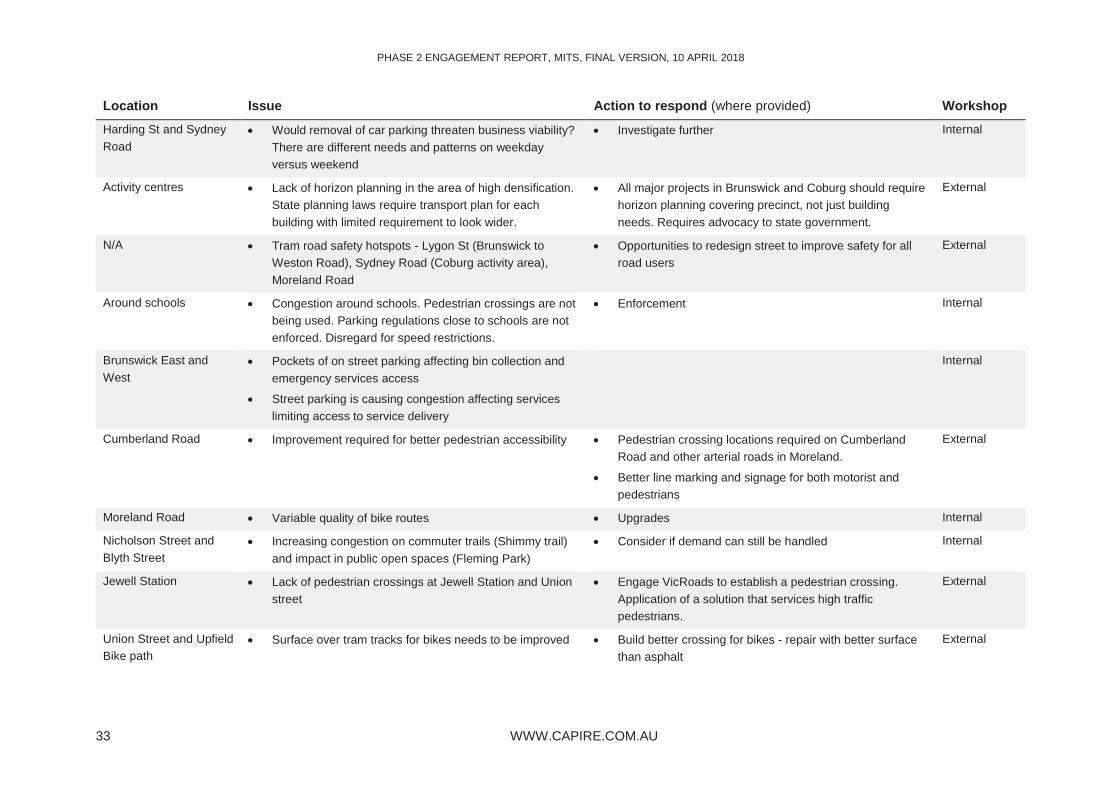
Location Issue Action to respond (where provided) Workshop
Harding St and Sydney
Road
• Would removal of car parking threaten business viability?
There are different needs and patterns on weekday
versus weekend
• Investigate further Internal
Activity centres • Lack of horizon planning in the area of high densification.
State planning laws require transport plan for each
building with limited requirement to look wider.
• All major projects in Brunswick and Coburg should require
horizon planning covering precinct, not just building
needs. Requires advocacy to state government.
External
N/A • Tram road safety hotspots - Lygon St (Brunswick to
Weston Road), Sydney Road (Coburg activity area),
Moreland Road
• Opportunities to redesign street to improve safety for all
road users
External
Around schools • Congestion around schools. Pedestrian crossings are not
being used. Parking regulations close to schools are not
enforced. Disregard for speed restrictions.
• Enforcement Internal
Brunswick East and
West
• Pockets of on street parking affecting bin collection and
emergency services access
• Street parking is causing congestion affecting services
limiting access to service delivery
Internal
Cumberland Road • Improvement required for better pedestrian accessibility • Pedestrian crossing locations required on Cumberland
Road and other arterial roads in Moreland.
• Better line marking and signage for both motorist and
pedestrians
External
Moreland Road • Variable quality of bike routes • Upgrades Internal
Nicholson Street and
Blyth Street
• Increasing congestion on commuter trails (Shimmy trail)
and impact in public open spaces (Fleming Park)
• Consider if demand can still be handled Internal
Jewell Station • Lack of pedestrian crossings at Jewell Station and Union
street
• Engage VicRoads to establish a pedestrian crossing.
Application of a solution that services high traffic
pedestrians.
External
Union Street and Upfield
Bike path
• Surface over tram tracks for bikes needs to be improved • Build better crossing for bikes - repair with better surface
than asphalt
External
PHASE 2 ENGAGEMENT REPORT, MITS, FINAL VERSION, 10 APRIL 2018
34
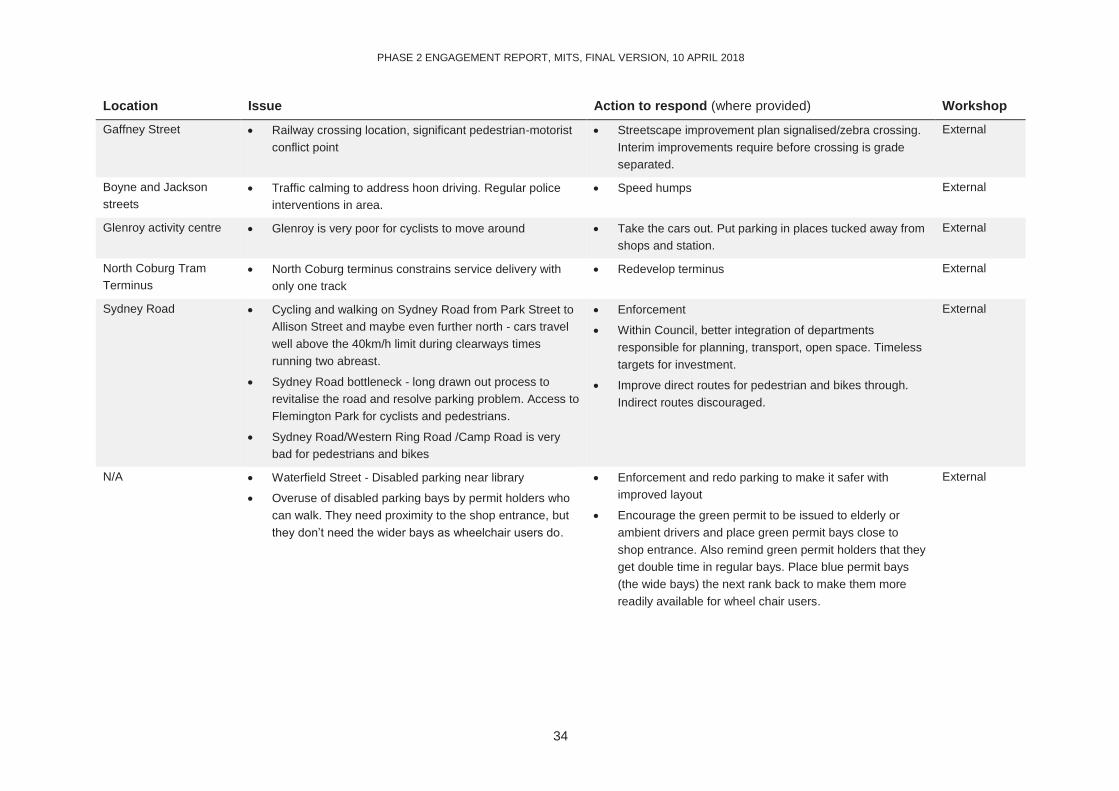
Location Issue Action to respond (where provided) Workshop
Gaffney Street • Railway crossing location, significant pedestrian-motorist
conflict point
• Streetscape improvement plan signalised/zebra crossing.
Interim improvements require before crossing is grade
separated.
External
Boyne and Jackson
streets
• Traffic calming to address hoon driving. Regular police
interventions in area.
• Speed humps External
Glenroy activity centre • Glenroy is very poor for cyclists to move around • Take the cars out. Put parking in places tucked away from
shops and station.
External
North Coburg Tram
Terminus
• North Coburg terminus constrains service delivery with
only one track
• Redevelop terminus External
Sydney Road • Cycling and walking on Sydney Road from Park Street to
Allison Street and maybe even further north - cars travel
well above the 40km/h limit during clearways times
running two abreast.
• Sydney Road bottleneck - long drawn out process to
revitalise the road and resolve parking problem. Access to
Flemington Park for cyclists and pedestrians.
• Sydney Road/Western Ring Road /Camp Road is very
bad for pedestrians and bikes
• Enforcement
• Within Council, better integration of departments
responsible for planning, transport, open space. Timeless
targets for investment.
• Improve direct routes for pedestrian and bikes through.
Indirect routes discouraged.
External
N/A • Waterfield Street - Disabled parking near library
• Overuse of disabled parking bays by permit holders who
can walk. They need proximity to the shop entrance, but
they don’t need the wider bays as wheelchair users do.
• Enforcement and redo parking to make it safer with
improved layout
• Encourage the green permit to be issued to elderly or
ambient drivers and place green permit bays close to
shop entrance. Also remind green permit holders that they
get double time in regular bays. Place blue permit bays
(the wide bays) the next rank back to make them more
readily available for wheel chair users.
External
PHASE 2 ENGAGEMENT REPORT, MITS, FINAL VERSION, 10 APRIL 2018
35 WWW.CAPIRE.COM.AU
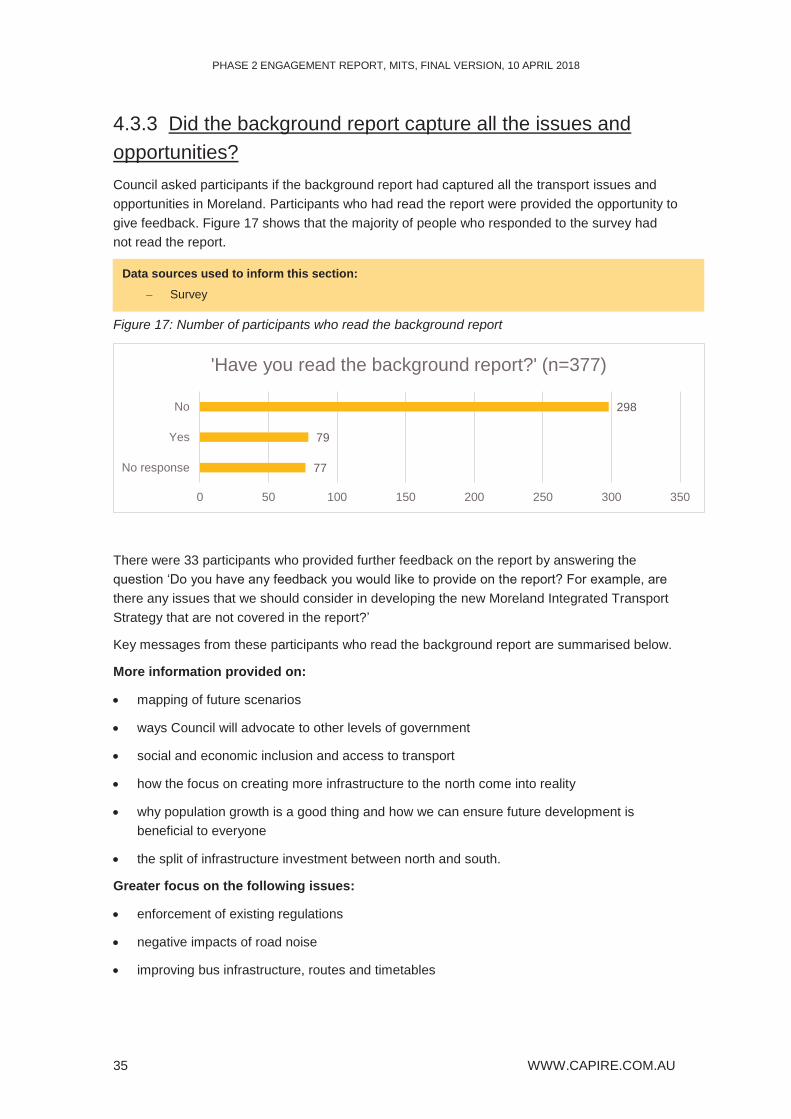
4.3.3 Did the background report capture all the issues and
opportunities?
Council asked participants if the background report had captured all the transport issues and
opportunities in Moreland. Participants who had read the report were provided the opportunity to
give feedback. Figure 17 shows that the majority of people who responded to the survey had
not read the report.
Figure 17: Number of participants who read the background report
There were 33 participants who provided further feedback on the report by answering the
question ‘Do you have any feedback you would like to provide on the report? For example, are
there any issues that we should consider in developing the new Moreland Integrated Transport
Strategy that are not covered in the report?’
Key messages from these participants who read the background report are summarised below.
More information provided on:
• mapping of future scenarios
• ways Council will advocate to other levels of government
• social and economic inclusion and access to transport
• how the focus on creating more infrastructure to the north come into reality
• why population growth is a good thing and how we can ensure future development is
beneficial to everyone
• the split of infrastructure investment between north and south.
Greater focus on the following issues:
• enforcement of existing regulations
• negative impacts of road noise
• improving bus infrastructure, routes and timetables
77
79
298
0 50 100 150 200 250 300 350
No response
Yes
No
'Have you read the background report?' (n=377)
Data sources used to inform this section:
Survey
PHASE 2 ENGAGEMENT REPORT, MITS, FINAL VERSION, 10 APRIL 2018
36
• issues within Council control
• separated bike paths (as in Partille, a suburb of Gothenburg, Sweden)
• the rise of electrified bikes, scooters, skateboards, mopeds, etc
• liveability, health and user experience
• cycling infrastructure in the north
• promoting active journeys to school
• train travel - double tracks, more pedestrian crossings over tracks
• parking restrictions and speed limit signage
• more walkable streetscapes.
Policy development should consider:
• visitors from other suburbs
• including specific and detailed strategies
• views from a diversity of participants.
4.4 Mode change to sustainable transport
Council acknowledges that it needs to increase the use of sustainable modes of transport to
ensure the future of Moreland. However, Council knows that increasing the usage of
sustainable transport requires understanding and what is currently inhibiting people from using
bikes, walking or public transport, and what may be enabling unnecessary car travel. This
section summarises the barriers and enablers to different forms of transport.
Council notes that while it seeks to reduce car usage, some trips will continue to be taken by
car. Disability and poor access to public transport prevent people from using sustainable
transport alternatives.
4.4.1 Barriers to mode change
Community participants were asked to list the barriers that stop them from using the transport
modes they would like to use more. Workshop, pop-up, speakout and focus group participants
were provided with an opportunity to provide open ended comments, whereas survey
participants were given a choice of several barriers for each mode of transport.
Data sources used to inform this section:
Internal stakeholder workshop
External stakeholder workshop
Focus group with Urdu women
Pop-ups (Glenroy, Fawkner, Brunswick)
Community speak-out
Survey
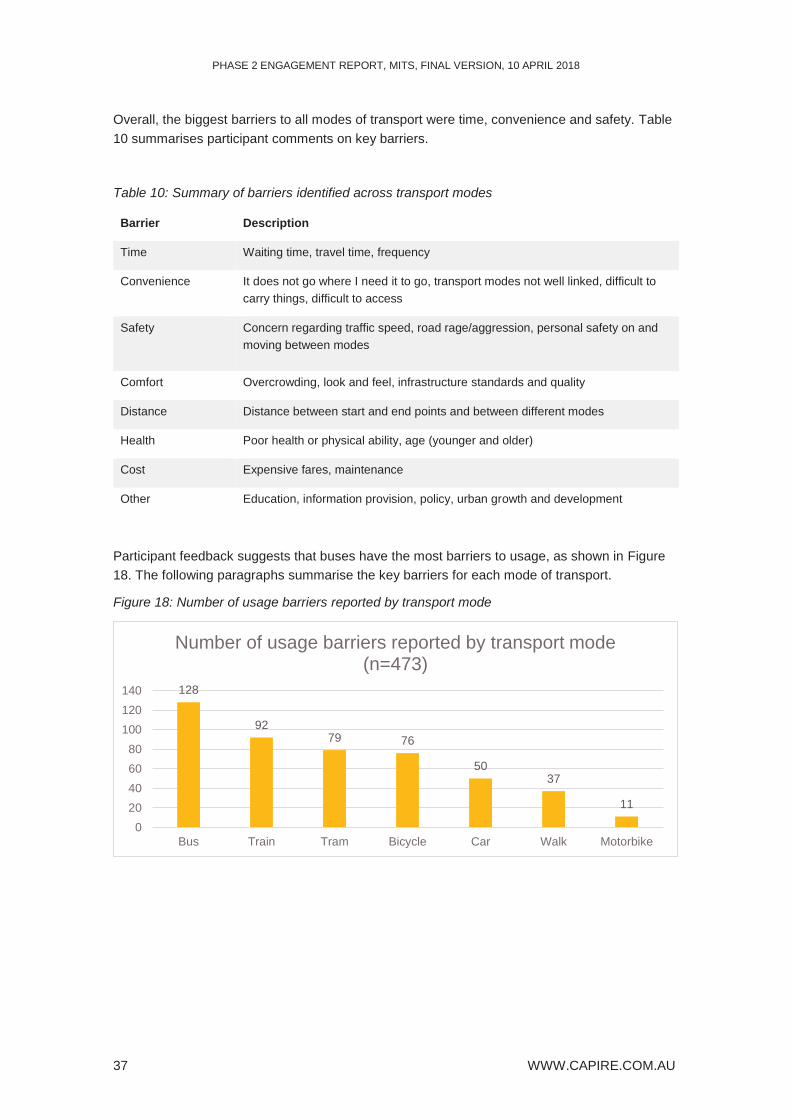
PHASE 2 ENGAGEMENT REPORT, MITS, FINAL VERSION, 10 APRIL 2018
37 WWW.CAPIRE.COM.AU
Overall, the biggest barriers to all modes of transport were time, convenience and safety. Table
10 summarises participant comments on key barriers.
Table 10: Summary of barriers identified across transport modes
Barrier Description
Time Waiting time, travel time, frequency
Convenience It does not go where I need it to go, transport modes not well linked, difficult to
carry things, difficult to access
Safety
Concern regarding traffic speed, road rage/aggression, personal safety on and
moving between modes
Comfort Overcrowding, look and feel, infrastructure standards and quality
Distance Distance between start and end points and between different modes
Health Poor health or physical ability, age (younger and older)
Cost Expensive fares, maintenance
Other Education, information provision, policy, urban growth and development
Participant feedback suggests that buses have the most barriers to usage, as shown in Figure
18. The following paragraphs summarise the key barriers for each mode of transport.
Figure 18: Number of usage barriers reported by transport mode
128
9279 76
5037
11
0
20
40
60
80
100
120
140
Bus Train Tram Bicycle Car Walk Motorbike
Number of usage barriers reported by transport mode (n=473)
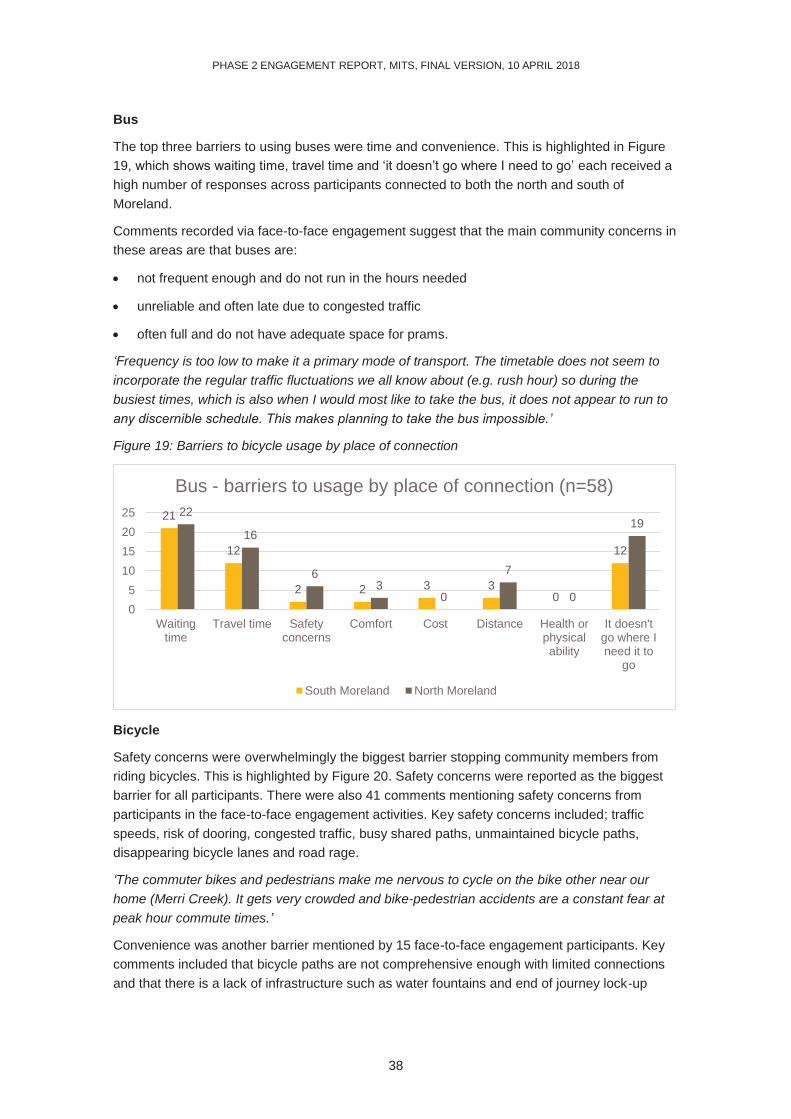
PHASE 2 ENGAGEMENT REPORT, MITS, FINAL VERSION, 10 APRIL 2018
38
Bus
The top three barriers to using buses were time and convenience. This is highlighted in Figure
19, which shows waiting time, travel time and ‘it doesn’t go where I need to go’ each received a
high number of responses across participants connected to both the north and south of
Moreland.
Comments recorded via face-to-face engagement suggest that the main community concerns in
these areas are that buses are:
• not frequent enough and do not run in the hours needed
• unreliable and often late due to congested traffic
• often full and do not have adequate space for prams.
‘Frequency is too low to make it a primary mode of transport. The timetable does not seem to
incorporate the regular traffic fluctuations we all know about (e.g. rush hour) so during the
busiest times, which is also when I would most like to take the bus, it does not appear to run to
any discernible schedule. This makes planning to take the bus impossible.’
Figure 19: Barriers to bicycle usage by place of connection
Bicycle
Safety concerns were overwhelmingly the biggest barrier stopping community members from
riding bicycles. This is highlighted by Figure 20. Safety concerns were reported as the biggest
barrier for all participants. There were also 41 comments mentioning safety concerns from
participants in the face-to-face engagement activities. Key safety concerns included; traffic
speeds, risk of dooring, congested traffic, busy shared paths, unmaintained bicycle paths,
disappearing bicycle lanes and road rage.
‘The commuter bikes and pedestrians make me nervous to cycle on the bike other near our
home (Merri Creek). It gets very crowded and bike-pedestrian accidents are a constant fear at
peak hour commute times.’
Convenience was another barrier mentioned by 15 face-to-face engagement participants. Key
comments included that bicycle paths are not comprehensive enough with limited connections
and that there is a lack of infrastructure such as water fountains and end of journey lock-up
21
12
2 2 3 30
12
22
16
63
0
7
0
19
0
5
10
15
20
25
Waitingtime
Travel time Safetyconcerns
Comfort Cost Distance Health orphysicalability
It doesn'tgo where Ineed it to
go
Bus - barriers to usage by place of connection (n=58)
South Moreland North Moreland
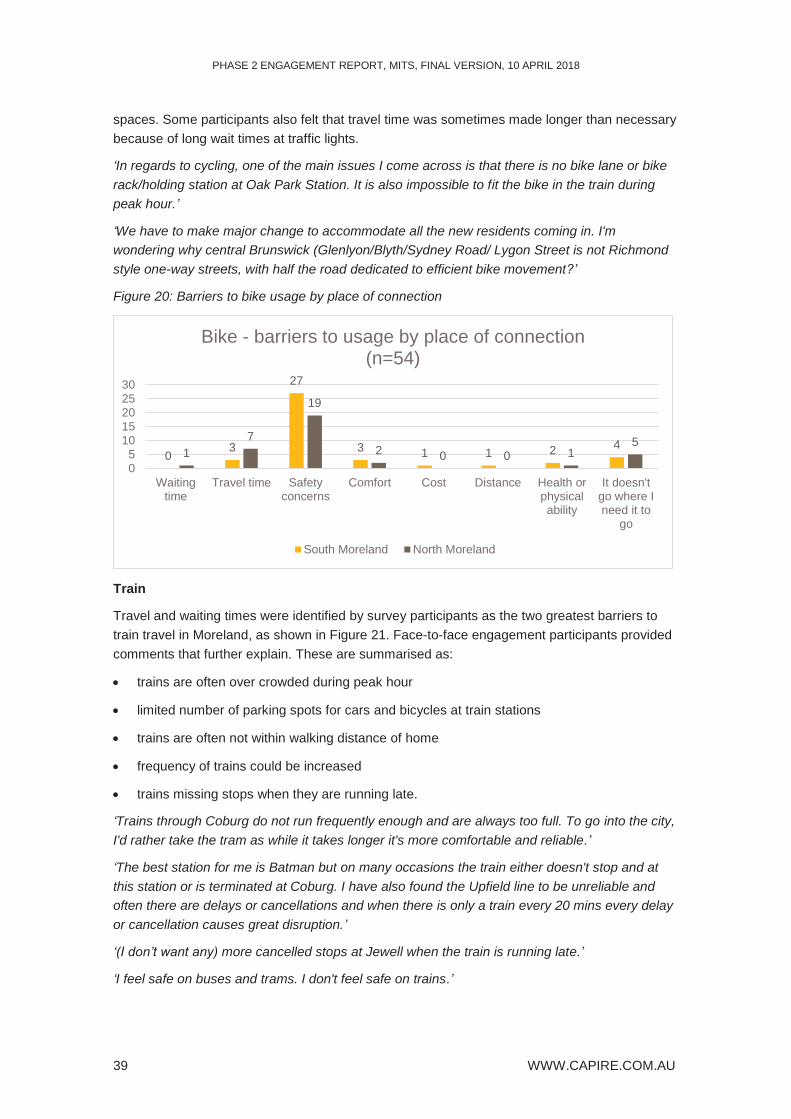
PHASE 2 ENGAGEMENT REPORT, MITS, FINAL VERSION, 10 APRIL 2018
39 WWW.CAPIRE.COM.AU
spaces. Some participants also felt that travel time was sometimes made longer than necessary
because of long wait times at traffic lights.
‘In regards to cycling, one of the main issues I come across is that there is no bike lane or bike
rack/holding station at Oak Park Station. It is also impossible to fit the bike in the train during
peak hour.’
‘We have to make major change to accommodate all the new residents coming in. I'm
wondering why central Brunswick (Glenlyon/Blyth/Sydney Road/ Lygon Street is not Richmond
style one-way streets, with half the road dedicated to efficient bike movement?’
Figure 20: Barriers to bike usage by place of connection
Train
Travel and waiting times were identified by survey participants as the two greatest barriers to
train travel in Moreland, as shown in Figure 21. Face-to-face engagement participants provided
comments that further explain. These are summarised as:
• trains are often over crowded during peak hour
• limited number of parking spots for cars and bicycles at train stations
• trains are often not within walking distance of home
• frequency of trains could be increased
• trains missing stops when they are running late.
‘Trains through Coburg do not run frequently enough and are always too full. To go into the city,
I'd rather take the tram as while it takes longer it's more comfortable and reliable.’
‘The best station for me is Batman but on many occasions the train either doesn't stop and at
this station or is terminated at Coburg. I have also found the Upfield line to be unreliable and
often there are delays or cancellations and when there is only a train every 20 mins every delay
or cancellation causes great disruption.’
‘(I don’t want any) more cancelled stops at Jewell when the train is running late.’
‘I feel safe on buses and trams. I don't feel safe on trains.’
03
27
3 1 1 2 41
7
19
2 0 0 15
05
1015202530
Waitingtime
Travel time Safetyconcerns
Comfort Cost Distance Health orphysicalability
It doesn'tgo where Ineed it to
go
Bike - barriers to usage by place of connection (n=54)
South Moreland North Moreland
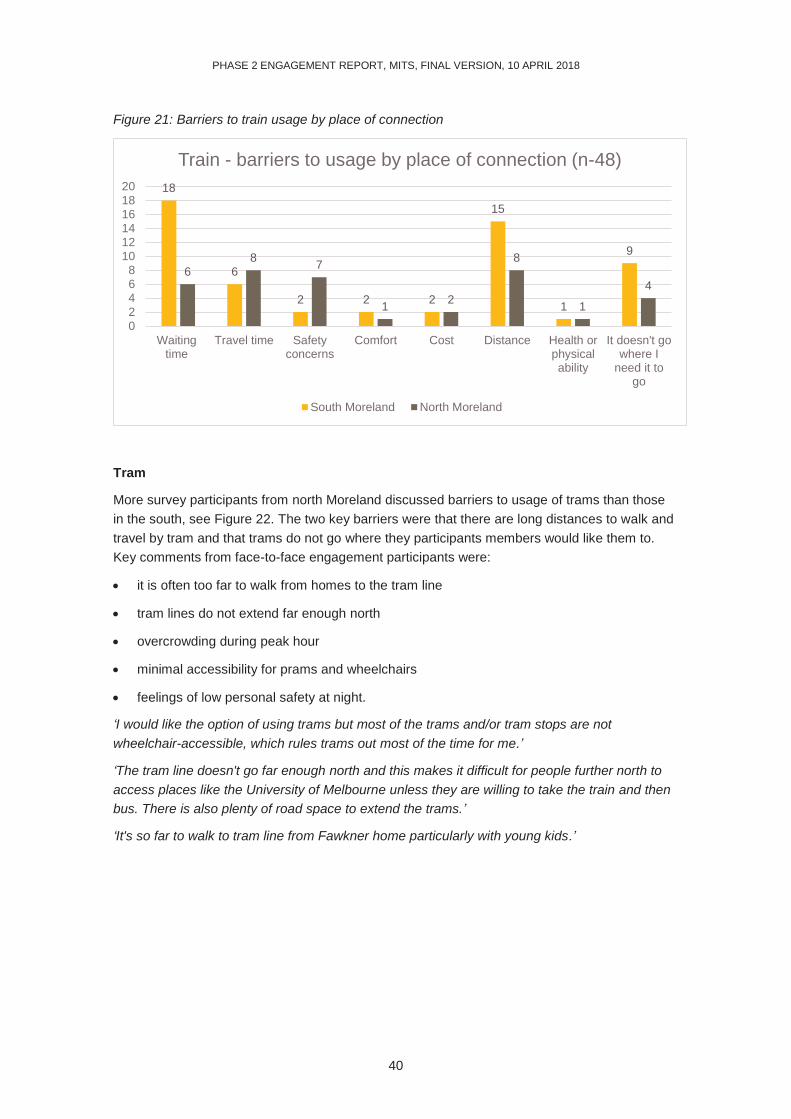
PHASE 2 ENGAGEMENT REPORT, MITS, FINAL VERSION, 10 APRIL 2018
40
Figure 21: Barriers to train usage by place of connection
Tram
More survey participants from north Moreland discussed barriers to usage of trams than those
in the south, see Figure 22. The two key barriers were that there are long distances to walk and
travel by tram and that trams do not go where they participants members would like them to.
Key comments from face-to-face engagement participants were:
• it is often too far to walk from homes to the tram line
• tram lines do not extend far enough north
• overcrowding during peak hour
• minimal accessibility for prams and wheelchairs
• feelings of low personal safety at night.
‘I would like the option of using trams but most of the trams and/or tram stops are not
wheelchair-accessible, which rules trams out most of the time for me.’
‘The tram line doesn't go far enough north and this makes it difficult for people further north to
access places like the University of Melbourne unless they are willing to take the train and then
bus. There is also plenty of road space to extend the trams.’
‘It's so far to walk to tram line from Fawkner home particularly with young kids.’
18
6
2 2 2
15
1
9
68
7
12
8
1
4
02468
101214161820
Waitingtime
Travel time Safetyconcerns
Comfort Cost Distance Health orphysicalability
It doesn't gowhere I
need it togo
Train - barriers to usage by place of connection (n-48)
South Moreland North Moreland
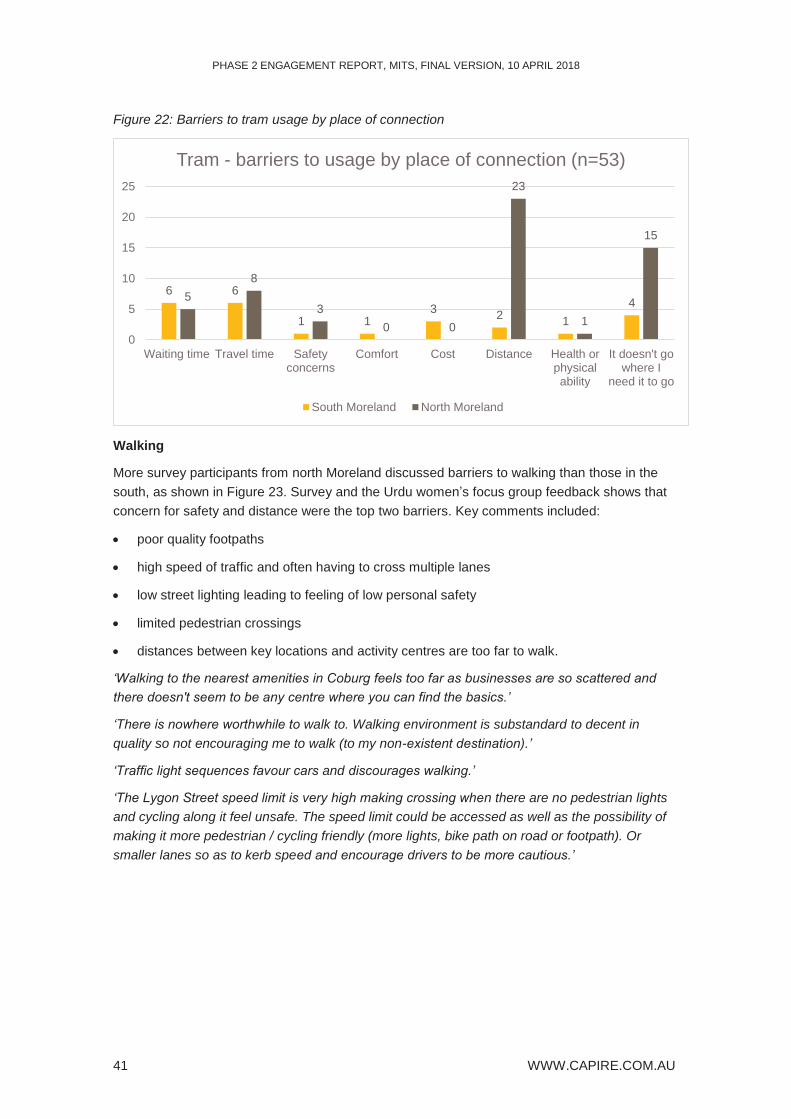
PHASE 2 ENGAGEMENT REPORT, MITS, FINAL VERSION, 10 APRIL 2018
41 WWW.CAPIRE.COM.AU
Figure 22: Barriers to tram usage by place of connection
Walking
More survey participants from north Moreland discussed barriers to walking than those in the
south, as shown in Figure 23. Survey and the Urdu women’s focus group feedback shows that
concern for safety and distance were the top two barriers. Key comments included:
• poor quality footpaths
• high speed of traffic and often having to cross multiple lanes
• low street lighting leading to feeling of low personal safety
• limited pedestrian crossings
• distances between key locations and activity centres are too far to walk.
‘Walking to the nearest amenities in Coburg feels too far as businesses are so scattered and
there doesn't seem to be any centre where you can find the basics.’
‘There is nowhere worthwhile to walk to. Walking environment is substandard to decent in
quality so not encouraging me to walk (to my non-existent destination).’
‘Traffic light sequences favour cars and discourages walking.’
‘The Lygon Street speed limit is very high making crossing when there are no pedestrian lights
and cycling along it feel unsafe. The speed limit could be accessed as well as the possibility of
making it more pedestrian / cycling friendly (more lights, bike path on road or footpath). Or
smaller lanes so as to kerb speed and encourage drivers to be more cautious.’
6 6
1 13
21
45
8
3
0 0
23
1
15
0
5
10
15
20
25
Waiting time Travel time Safetyconcerns
Comfort Cost Distance Health orphysicalability
It doesn't gowhere I
need it to go
Tram - barriers to usage by place of connection (n=53)
South Moreland North Moreland
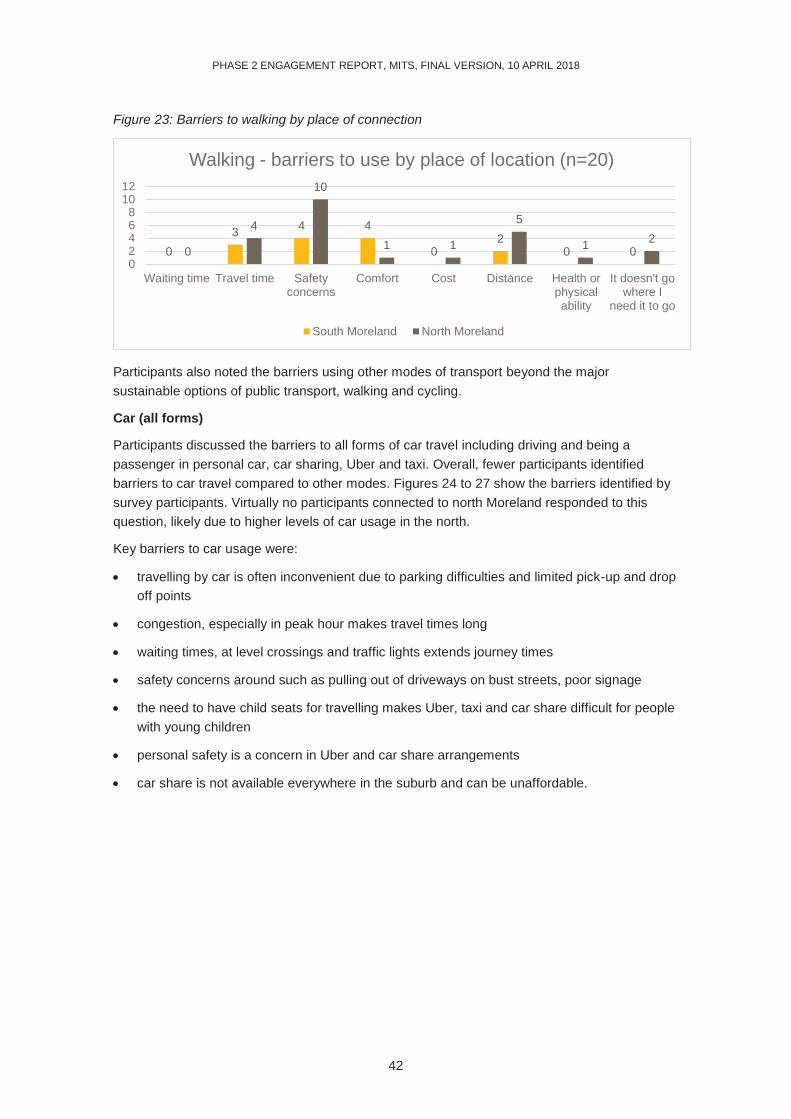
PHASE 2 ENGAGEMENT REPORT, MITS, FINAL VERSION, 10 APRIL 2018
42
Figure 23: Barriers to walking by place of connection
Participants also noted the barriers using other modes of transport beyond the major
sustainable options of public transport, walking and cycling.
Car (all forms)
Participants discussed the barriers to all forms of car travel including driving and being a
passenger in personal car, car sharing, Uber and taxi. Overall, fewer participants identified
barriers to car travel compared to other modes. Figures 24 to 27 show the barriers identified by
survey participants. Virtually no participants connected to north Moreland responded to this
question, likely due to higher levels of car usage in the north.
Key barriers to car usage were:
• travelling by car is often inconvenient due to parking difficulties and limited pick-up and drop
off points
• congestion, especially in peak hour makes travel times long
• waiting times, at level crossings and traffic lights extends journey times
• safety concerns around such as pulling out of driveways on bust streets, poor signage
• the need to have child seats for travelling makes Uber, taxi and car share difficult for people
with young children
• personal safety is a concern in Uber and car share arrangements
• car share is not available everywhere in the suburb and can be unaffordable.
0
34 4
02
0 00
4
10
1 1
5
12
02468
1012
Waiting time Travel time Safetyconcerns
Comfort Cost Distance Health orphysicalability
It doesn't gowhere I
need it to go
Walking - barriers to use by place of location (n=20)
South Moreland North Moreland
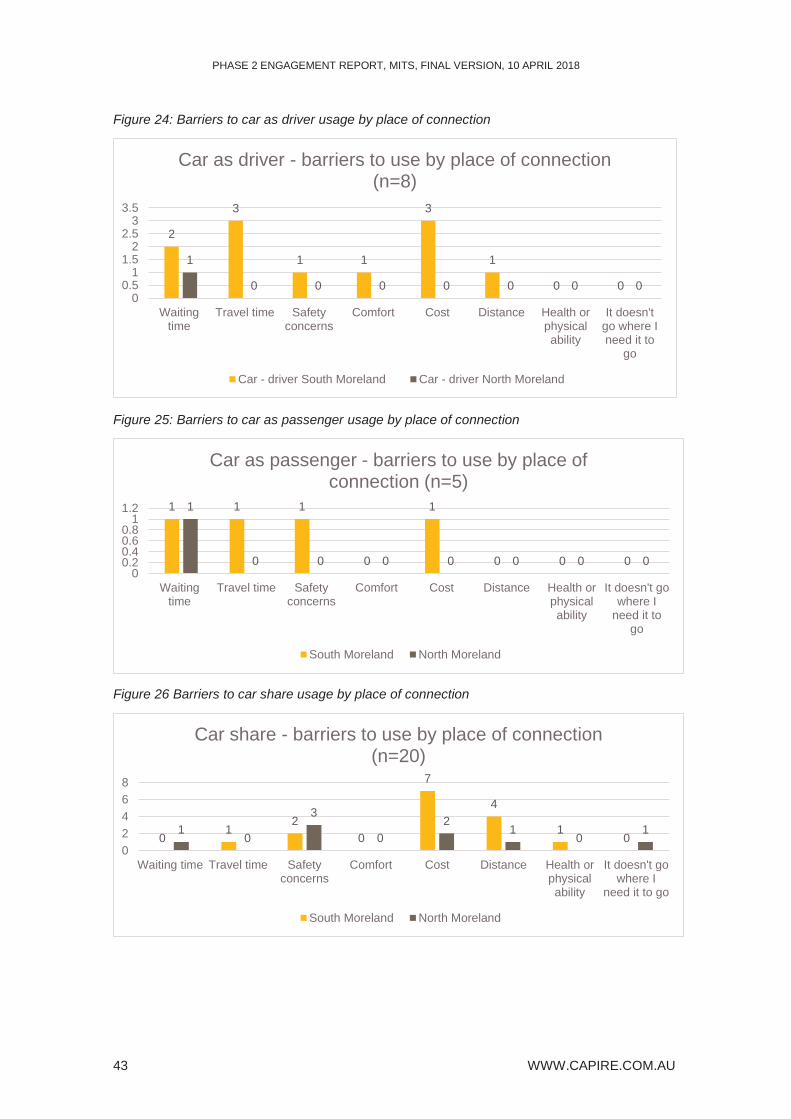
PHASE 2 ENGAGEMENT REPORT, MITS, FINAL VERSION, 10 APRIL 2018
43 WWW.CAPIRE.COM.AU
Figure 24: Barriers to car as driver usage by place of connection
Figure 25: Barriers to car as passenger usage by place of connection
Figure 26 Barriers to car share usage by place of connection
2
3
1 1
3
1
0 0
1
0 0 0 0 0 0 00
0.51
1.52
2.53
3.5
Waitingtime
Travel time Safetyconcerns
Comfort Cost Distance Health orphysicalability
It doesn'tgo where Ineed it to
go
Car as driver - barriers to use by place of connection (n=8)
Car - driver South Moreland Car - driver North Moreland
1 1 1
0
1
0 0 0
1
0 0 0 0 0 0 00
0.20.40.60.8
11.2
Waitingtime
Travel time Safetyconcerns
Comfort Cost Distance Health orphysicalability
It doesn't gowhere I
need it togo
Car as passenger - barriers to use by place of connection (n=5)
South Moreland North Moreland
01
2
0
7
4
10
10
3
0
21
01
0
2
4
6
8
Waiting time Travel time Safetyconcerns
Comfort Cost Distance Health orphysicalability
It doesn't gowhere I
need it to go
Car share - barriers to use by place of connection (n=20)
South Moreland North Moreland
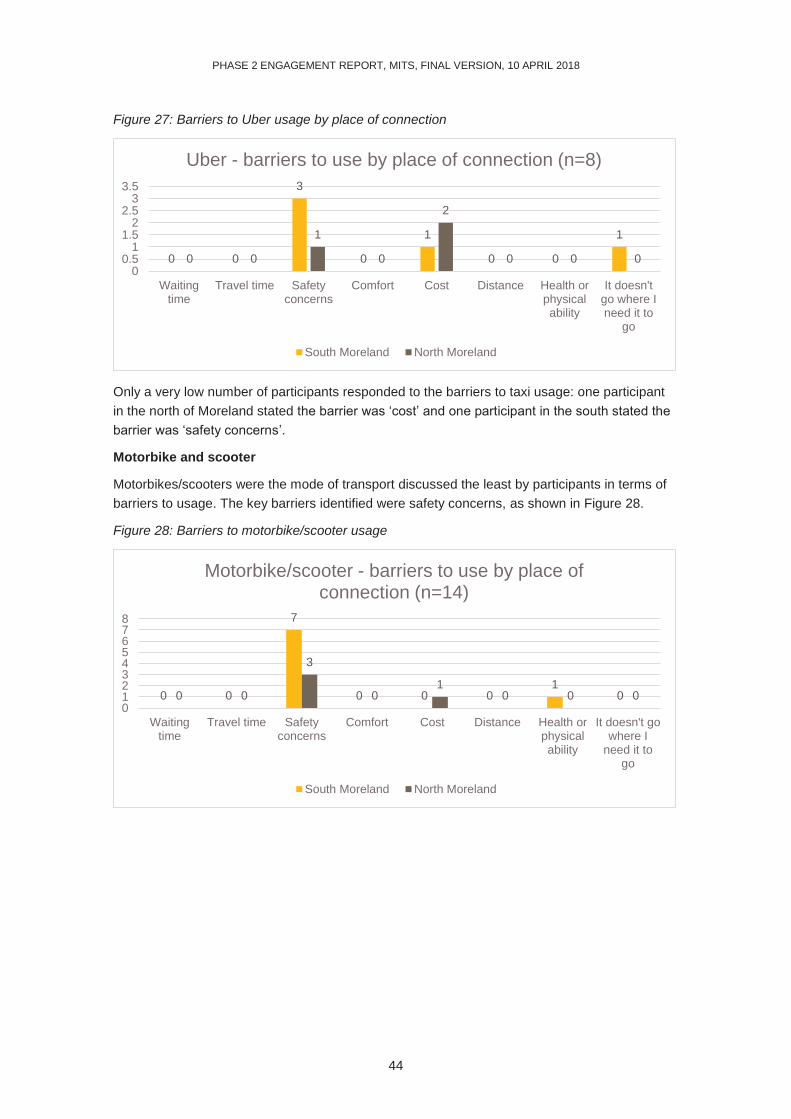
PHASE 2 ENGAGEMENT REPORT, MITS, FINAL VERSION, 10 APRIL 2018
44
Figure 27: Barriers to Uber usage by place of connection
Only a very low number of participants responded to the barriers to taxi usage: one participant
in the north of Moreland stated the barrier was ‘cost’ and one participant in the south stated the
barrier was ‘safety concerns’.
Motorbike and scooter
Motorbikes/scooters were the mode of transport discussed the least by participants in terms of
barriers to usage. The key barriers identified were safety concerns, as shown in Figure 28.
Figure 28: Barriers to motorbike/scooter usage
0 0
3
0
1
0 0
1
0 0
1
0
2
0 0 00
0.51
1.52
2.53
3.5
Waitingtime
Travel time Safetyconcerns
Comfort Cost Distance Health orphysicalability
It doesn'tgo where Ineed it to
go
Uber - barriers to use by place of connection (n=8)
South Moreland North Moreland
0 0
7
0 0 01
00 0
3
01
0 0 0012345678
Waitingtime
Travel time Safetyconcerns
Comfort Cost Distance Health orphysicalability
It doesn't gowhere I
need it togo
Motorbike/scooter - barriers to use by place of connection (n=14)
South Moreland North Moreland
PHASE 2 ENGAGEMENT REPORT, MITS, FINAL VERSION, 10 APRIL 2018
45 WWW.CAPIRE.COM.AU
4.4.2 Enablers of mode change
Participants throughout the engagement discussed methods to enable increasing use of
walking, cycling and public transport. The results of these discussions are summarised in Table
11 on page 46.
Stakeholders’ key recommendations for enabling higher levels of sustainable transport are
summarised below.
Cycling
To improve safety for cyclists on the roads, stakeholders suggested that cycling on-road needs
to be normalised by encouraging more people to ride. They suggested reducing speed limits to
30 to 40 kilometres per hour and separating cyclists and pedestrians where possible. Education
and increasing awareness of cycling and safety on the roads with children and the community
was also mentioned as an initiative to improve safety. It was also mentioned that there should
be cycling and walking routes connected to train stations, and bike facilities on trains.
Walking
In response to barriers for pedestrians, stakeholders’ suggestions were to improve access to
train stations, schools and around precincts. Increased pedestrian access should be considered
in the planning stage and consider access to educational facilities and at the entry and exit
points to train stations at either end of platforms. Paths should cater for cyclists and pedestrians
and be shaded.
Public transport
In relation to public transport, stakeholders suggested improving information on service
frequency and information available at and about stops. They suggested considering the
amenity of public transport stops when designing them, as well as their locations. There was
also a comment about re-allocating priorities to leverage pedestrians and cyclists over car
users.
Cars
Suggestions to address barriers to using cars as a mode of transport focused access for high
needs user groups. There was a suggestion to introduce paid parking and change the time
restrictions on parks, and better monitor disabled parking permit use. Another suggestion was to
prioritise carparks for high needs user groups including people with disabilities and families with
young children. Traffic management measures should be enforced including road closures.
Stakeholders recognised that high needs user group needed to be supported to use cars when
this was their only viable transport option.
Data sources used to inform this section:
Internal stakeholder workshop
External stakeholder workshop
Focus group with Urdu women
Pop-up (Brunswick)
Community speak-out
Survey
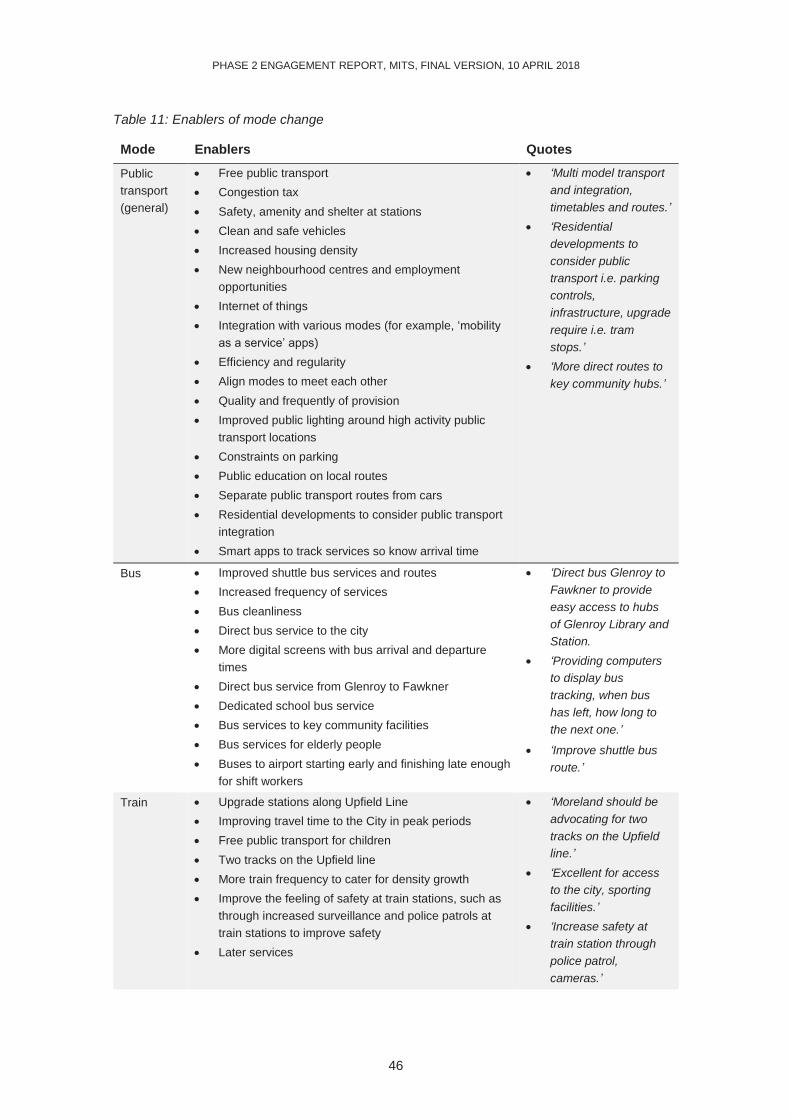
PHASE 2 ENGAGEMENT REPORT, MITS, FINAL VERSION, 10 APRIL 2018
46
Table 11: Enablers of mode change
Mode Enablers Quotes
Public
transport
(general)
• Free public transport
• Congestion tax
• Safety, amenity and shelter at stations
• Clean and safe vehicles
• Increased housing density
• New neighbourhood centres and employment
opportunities
• Internet of things
• Integration with various modes (for example, ‘mobility
as a service’ apps)
• Efficiency and regularity
• Align modes to meet each other
• Quality and frequently of provision
• Improved public lighting around high activity public
transport locations
• Constraints on parking
• Public education on local routes
• Separate public transport routes from cars
• Residential developments to consider public transport
integration
• Smart apps to track services so know arrival time
• ‘Multi model transport
and integration,
timetables and routes.’
• ‘Residential
developments to
consider public
transport i.e. parking
controls,
infrastructure, upgrade
require i.e. tram
stops.’
• ‘More direct routes to
key community hubs.’
Bus • Improved shuttle bus services and routes
• Increased frequency of services
• Bus cleanliness
• Direct bus service to the city
• More digital screens with bus arrival and departure
times
• Direct bus service from Glenroy to Fawkner
• Dedicated school bus service
• Bus services to key community facilities
• Bus services for elderly people
• Buses to airport starting early and finishing late enough
for shift workers
• ‘Direct bus Glenroy to
Fawkner to provide
easy access to hubs
of Glenroy Library and
Station.
• ‘Providing computers
to display bus
tracking, when bus
has left, how long to
the next one.’
• ‘Improve shuttle bus
route.’
Train • Upgrade stations along Upfield Line
• Improving travel time to the City in peak periods
• Free public transport for children
• Two tracks on the Upfield line
• More train frequency to cater for density growth
• Improve the feeling of safety at train stations, such as
through increased surveillance and police patrols at
train stations to improve safety
• Later services
• ‘Moreland should be
advocating for two
tracks on the Upfield
line.’
• ‘Excellent for access
to the city, sporting
facilities.’
• ‘Increase safety at
train station through
police patrol,
cameras.’
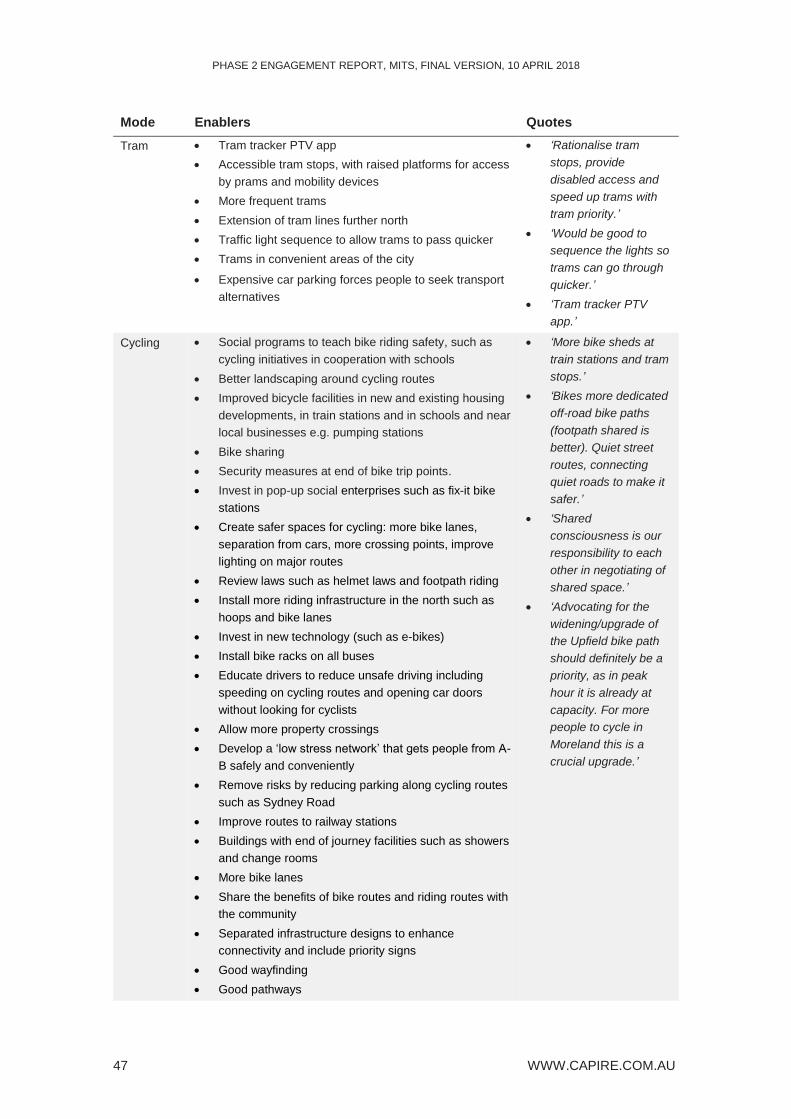
PHASE 2 ENGAGEMENT REPORT, MITS, FINAL VERSION, 10 APRIL 2018
47 WWW.CAPIRE.COM.AU
Mode Enablers Quotes
Tram • Tram tracker PTV app
• Accessible tram stops, with raised platforms for access
by prams and mobility devices
• More frequent trams
• Extension of tram lines further north
• Traffic light sequence to allow trams to pass quicker
• Trams in convenient areas of the city
• Expensive car parking forces people to seek transport
alternatives
• ‘Rationalise tram
stops, provide
disabled access and
speed up trams with
tram priority.’
• ‘Would be good to
sequence the lights so
trams can go through
quicker.’
• ‘Tram tracker PTV
app.’
Cycling
• Social programs to teach bike riding safety, such as
cycling initiatives in cooperation with schools
• Better landscaping around cycling routes
• Improved bicycle facilities in new and existing housing
developments, in train stations and in schools and near
local businesses e.g. pumping stations
• Bike sharing
• Security measures at end of bike trip points.
• Invest in pop-up social enterprises such as fix-it bike
stations
• Create safer spaces for cycling: more bike lanes,
separation from cars, more crossing points, improve
lighting on major routes
• Review laws such as helmet laws and footpath riding
• Install more riding infrastructure in the north such as
hoops and bike lanes
• Invest in new technology (such as e-bikes)
• Install bike racks on all buses
• Educate drivers to reduce unsafe driving including
speeding on cycling routes and opening car doors
without looking for cyclists
• Allow more property crossings
• Develop a ‘low stress network’ that gets people from A-
B safely and conveniently
• Remove risks by reducing parking along cycling routes
such as Sydney Road
• Improve routes to railway stations
• Buildings with end of journey facilities such as showers
and change rooms
• More bike lanes
• Share the benefits of bike routes and riding routes with
the community
• Separated infrastructure designs to enhance
connectivity and include priority signs
• Good wayfinding
• Good pathways
• ‘More bike sheds at
train stations and tram
stops.’
• ‘Bikes more dedicated
off-road bike paths
(footpath shared is
better). Quiet street
routes, connecting
quiet roads to make it
safer.’
• ‘Shared
consciousness is our
responsibility to each
other in negotiating of
shared space.’
• ‘Advocating for the
widening/upgrade of
the Upfield bike path
should definitely be a
priority, as in peak
hour it is already at
capacity. For more
people to cycle in
Moreland this is a
crucial upgrade.’
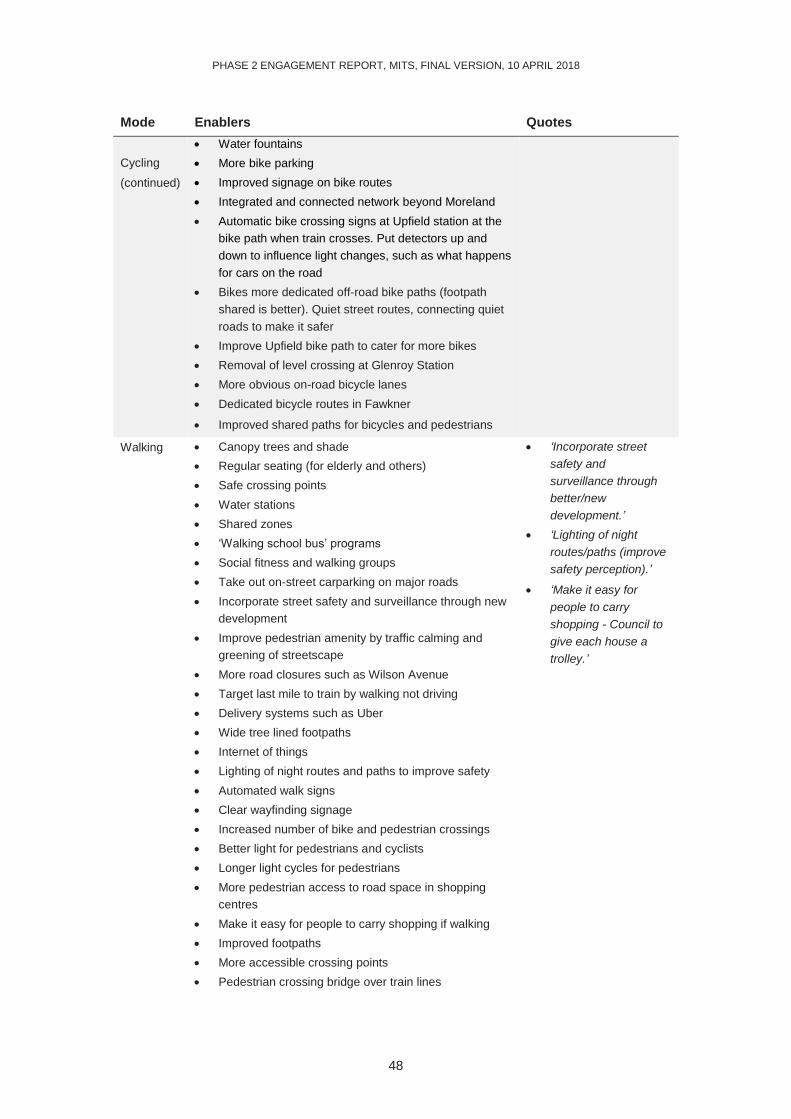
PHASE 2 ENGAGEMENT REPORT, MITS, FINAL VERSION, 10 APRIL 2018
48
Mode Enablers Quotes
Cycling
(continued)
• Water fountains
• More bike parking
• Improved signage on bike routes
• Integrated and connected network beyond Moreland
• Automatic bike crossing signs at Upfield station at the
bike path when train crosses. Put detectors up and
down to influence light changes, such as what happens
for cars on the road
• Bikes more dedicated off-road bike paths (footpath
shared is better). Quiet street routes, connecting quiet
roads to make it safer
• Improve Upfield bike path to cater for more bikes
• Removal of level crossing at Glenroy Station
• More obvious on-road bicycle lanes
• Dedicated bicycle routes in Fawkner
• Improved shared paths for bicycles and pedestrians
Walking
• Canopy trees and shade
• Regular seating (for elderly and others)
• Safe crossing points
• Water stations
• Shared zones
• ‘Walking school bus’ programs
• Social fitness and walking groups
• Take out on-street carparking on major roads
• Incorporate street safety and surveillance through new
development
• Improve pedestrian amenity by traffic calming and
greening of streetscape
• More road closures such as Wilson Avenue
• Target last mile to train by walking not driving
• Delivery systems such as Uber
• Wide tree lined footpaths
• Internet of things
• Lighting of night routes and paths to improve safety
• Automated walk signs
• Clear wayfinding signage
• Increased number of bike and pedestrian crossings
• Better light for pedestrians and cyclists
• Longer light cycles for pedestrians
• More pedestrian access to road space in shopping
centres
• Make it easy for people to carry shopping if walking
• Improved footpaths
• More accessible crossing points
• Pedestrian crossing bridge over train lines
• ‘Incorporate street
safety and
surveillance through
better/new
development.’
• ‘Lighting of night
routes/paths (improve
safety perception).’
• ‘Make it easy for
people to carry
shopping - Council to
give each house a
trolley.’
PHASE 2 ENGAGEMENT REPORT, MITS, FINAL VERSION, 10 APRIL 2018
49 WWW.CAPIRE.COM.AU
Mode Enablers Quotes
Walking
(continued)
• Merri Creek bridge (at Ceres)
• Pathways through new developments
• More street signs would make it easier to get around
(such as names of streets)
• Car-free streets
• More bike paths and less parking
• Supermarkets are close by
• Adult exercise equipment in all parks in Moreland
• Safe, active streets connected up to laneways
• Close to connecting forms of public transport
Car (for
high needs
user
groups)
• Low cost car parking
• Autonomous vehicles and charging points available at
Councils and in new developments
• Freeway connectivity encouraged through the
community
• Clearway finding signage
• More parking
• Car pooling
• Increased flexibility and agile carpark facilities, such as
through RMIT Campus parking on weekends
• Ridesharing
• At four-way intersections - everyone should be going
left in left hand turn lanes, have a U-turn mid-block,
and have a separate pedestrian crossing
• Reduce line of intersections
• Remove street parking in commuting times from 7am
to 9am and 4pm to 7pm
• Angle parking in front of main road shops is safer and
easier
• ‘Affordable
autonomous vehicles
and charging points.’
• ‘Electric vehicles -
opportunity for cleaner
car travel.’
4.5 Acceptability of transport trade-offs
Improving transport will sometimes create effects that some people may see as negative. For
example, if speed limits are reduced this can improve safety but the increased amount of time it
takes to travel may be considered a negative. Council wanted to understand what kinds of
approaches people favoured in different transport scenarios.
Data sources used to inform this section:
Internal stakeholder workshop
External stakeholder workshop
Community speak-out
Survey
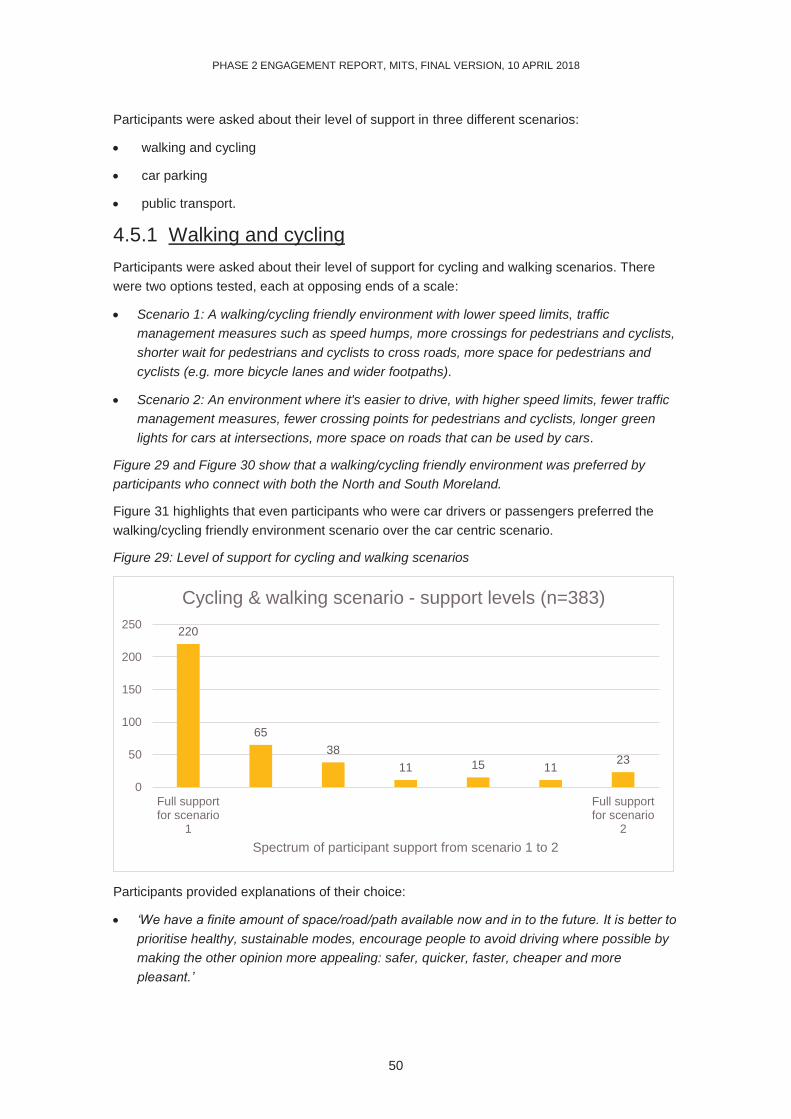
PHASE 2 ENGAGEMENT REPORT, MITS, FINAL VERSION, 10 APRIL 2018
50
Participants were asked about their level of support in three different scenarios:
• walking and cycling
• car parking
• public transport.
4.5.1 Walking and cycling
Participants were asked about their level of support for cycling and walking scenarios. There
were two options tested, each at opposing ends of a scale:
• Scenario 1: A walking/cycling friendly environment with lower speed limits, traffic
management measures such as speed humps, more crossings for pedestrians and cyclists,
shorter wait for pedestrians and cyclists to cross roads, more space for pedestrians and
cyclists (e.g. more bicycle lanes and wider footpaths).
• Scenario 2: An environment where it's easier to drive, with higher speed limits, fewer traffic
management measures, fewer crossing points for pedestrians and cyclists, longer green
lights for cars at intersections, more space on roads that can be used by cars.
Figure 29 and Figure 30 show that a walking/cycling friendly environment was preferred by
participants who connect with both the North and South Moreland.
Figure 31 highlights that even participants who were car drivers or passengers preferred the
walking/cycling friendly environment scenario over the car centric scenario.
Figure 29: Level of support for cycling and walking scenarios
Participants provided explanations of their choice:
• ‘We have a finite amount of space/road/path available now and in to the future. It is better to
prioritise healthy, sustainable modes, encourage people to avoid driving where possible by
making the other opinion more appealing: safer, quicker, faster, cheaper and more
pleasant.’
220
65
38
11 15 1123
0
50
100
150
200
250
Full supportfor scenario
1
Full supportfor scenario
2
Spectrum of participant support from scenario 1 to 2
Cycling & walking scenario - support levels (n=383)
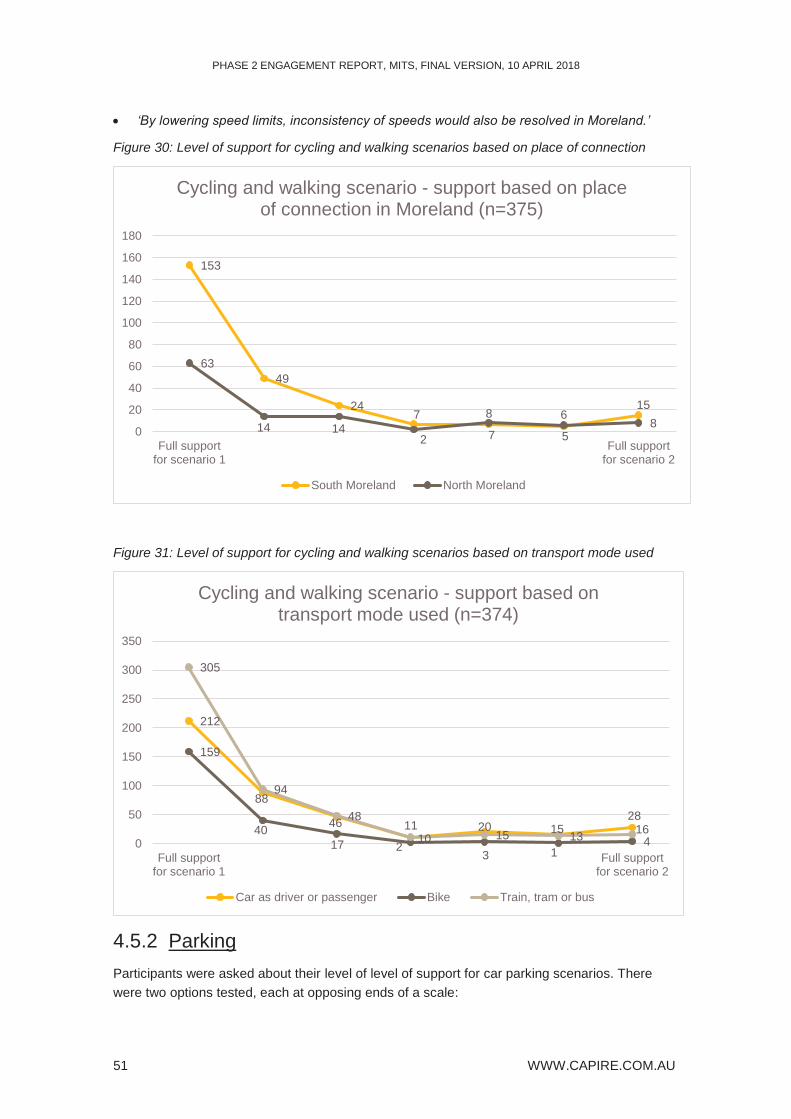
PHASE 2 ENGAGEMENT REPORT, MITS, FINAL VERSION, 10 APRIL 2018
51 WWW.CAPIRE.COM.AU
• ‘By lowering speed limits, inconsistency of speeds would also be resolved in Moreland.’
Figure 30: Level of support for cycling and walking scenarios based on place of connection
Figure 31: Level of support for cycling and walking scenarios based on transport mode used
4.5.2 Parking
Participants were asked about their level of level of support for car parking scenarios. There
were two options tested, each at opposing ends of a scale:
153
49
247
7 5
15
63
14 142
8 68
0
20
40
60
80
100
120
140
160
180
Full supportfor scenario 1
Full supportfor scenario 2
Cycling and walking scenario - support based on place of connection in Moreland (n=375)
South Moreland North Moreland
212
88
46
1020 15
28
159
40
17 23 1
4
305
94
4811
15 1316
0
50
100
150
200
250
300
350
Full supportfor scenario 1
Full supportfor scenario 2
Cycling and walking scenario - support based on transport mode used (n=374)
Car as driver or passenger Bike Train, tram or bus
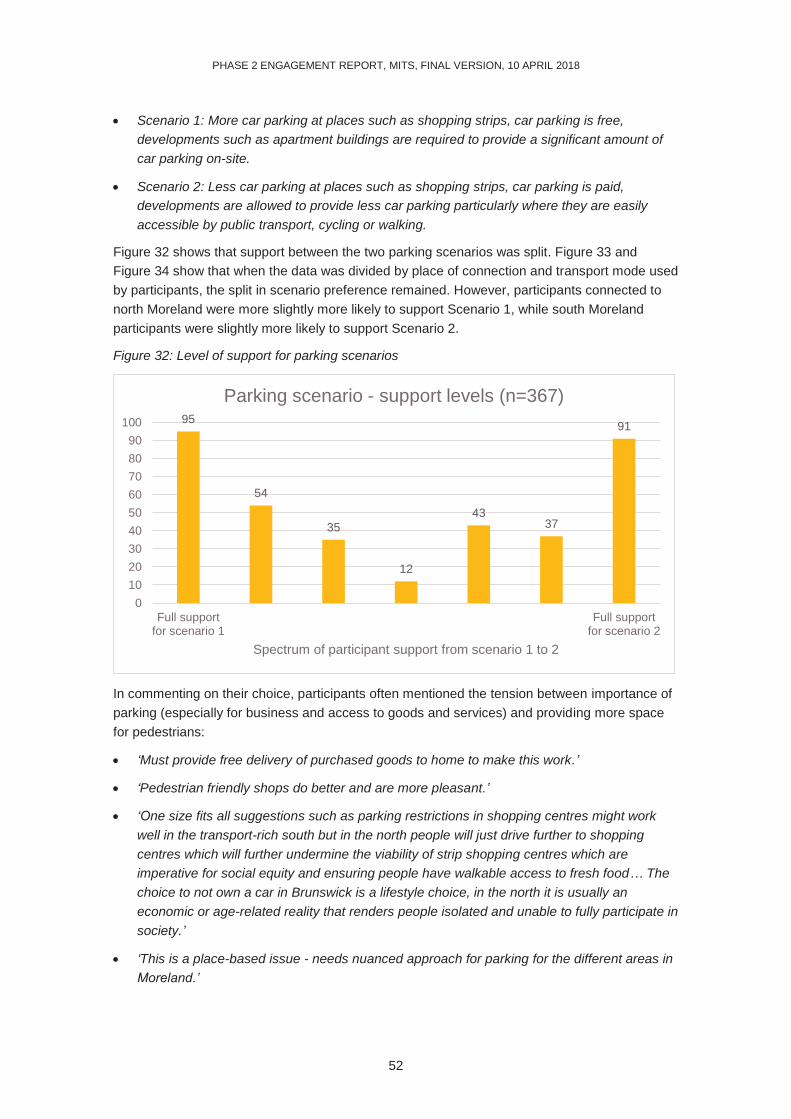
PHASE 2 ENGAGEMENT REPORT, MITS, FINAL VERSION, 10 APRIL 2018
52
• Scenario 1: More car parking at places such as shopping strips, car parking is free,
developments such as apartment buildings are required to provide a significant amount of
car parking on-site.
• Scenario 2: Less car parking at places such as shopping strips, car parking is paid,
developments are allowed to provide less car parking particularly where they are easily
accessible by public transport, cycling or walking.
Figure 32 shows that support between the two parking scenarios was split. Figure 33 and
Figure 34 show that when the data was divided by place of connection and transport mode used
by participants, the split in scenario preference remained. However, participants connected to
north Moreland were more slightly more likely to support Scenario 1, while south Moreland
participants were slightly more likely to support Scenario 2.
Figure 32: Level of support for parking scenarios
In commenting on their choice, participants often mentioned the tension between importance of
parking (especially for business and access to goods and services) and providing more space
for pedestrians:
• ‘Must provide free delivery of purchased goods to home to make this work.’
• ‘Pedestrian friendly shops do better and are more pleasant.’
• ‘One size fits all suggestions such as parking restrictions in shopping centres might work
well in the transport-rich south but in the north people will just drive further to shopping
centres which will further undermine the viability of strip shopping centres which are
imperative for social equity and ensuring people have walkable access to fresh food… The
choice to not own a car in Brunswick is a lifestyle choice, in the north it is usually an
economic or age-related reality that renders people isolated and unable to fully participate in
society.’
• ‘This is a place-based issue - needs nuanced approach for parking for the different areas in
Moreland.’
95
54
35
12
4337
91
0
10
20
30
40
50
60
70
80
90
100
Full supportfor scenario 1
Full supportfor scenario 2
Spectrum of participant support from scenario 1 to 2
Parking scenario - support levels (n=367)
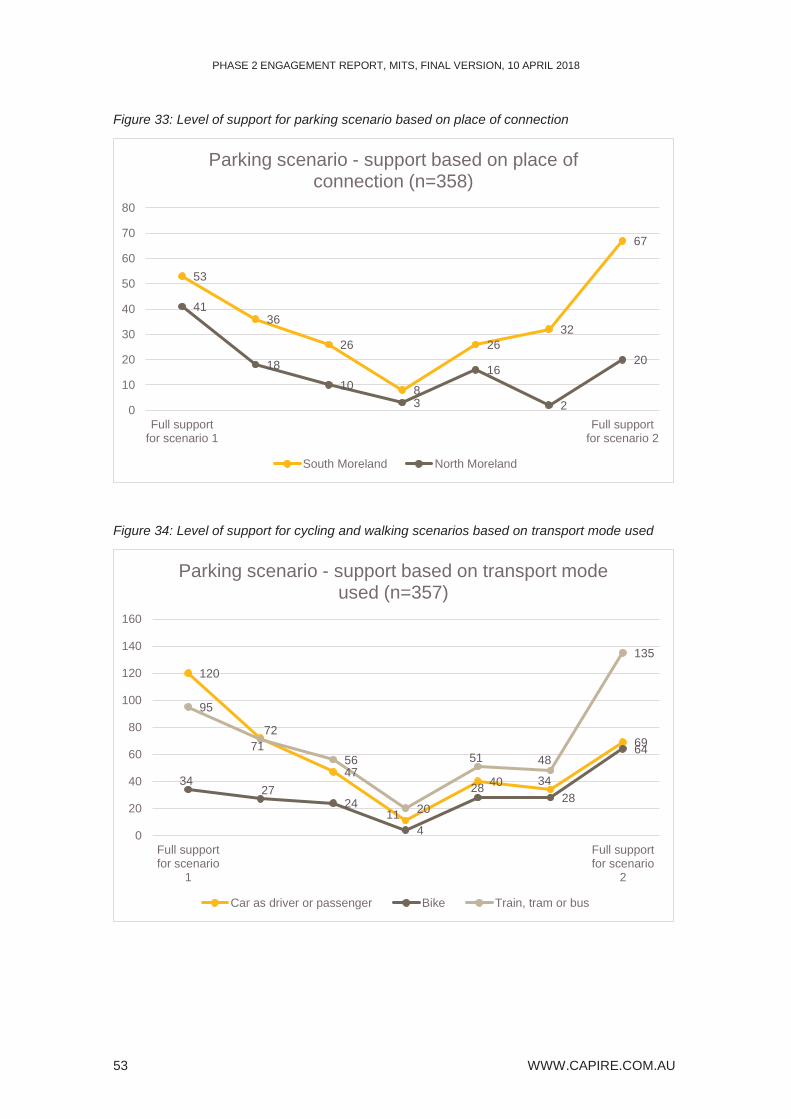
PHASE 2 ENGAGEMENT REPORT, MITS, FINAL VERSION, 10 APRIL 2018
53 WWW.CAPIRE.COM.AU
Figure 33: Level of support for parking scenario based on place of connection
Figure 34: Level of support for cycling and walking scenarios based on transport mode used
53
36
26
8
26
32
67
41
18
10
3
16
2
20
0
10
20
30
40
50
60
70
80
Full supportfor scenario 1
Full supportfor scenario 2
Parking scenario - support based on place of connection (n=358)
South Moreland North Moreland
120
72
47
11
40 34
69
3427
24
4
2828
64
95
7156
20
51 48
135
0
20
40
60
80
100
120
140
160
Full supportfor scenario
1
Full supportfor scenario
2
Parking scenario - support based on transport mode used (n=357)
Car as driver or passenger Bike Train, tram or bus
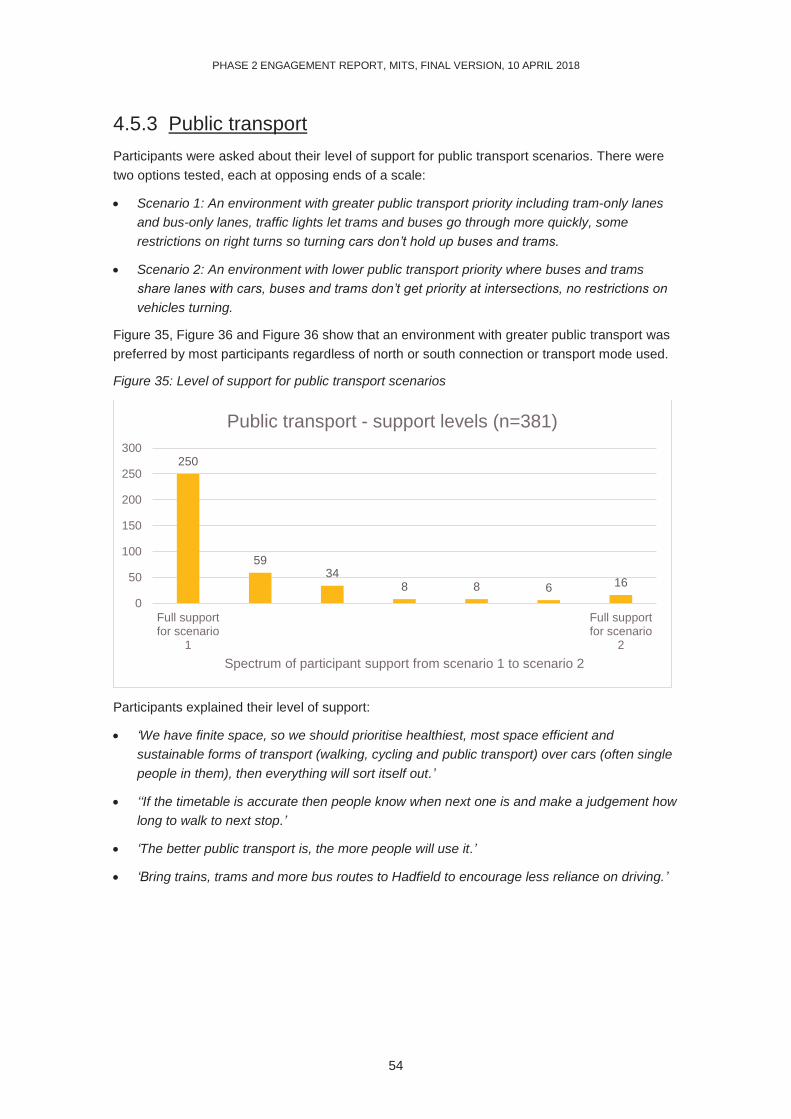
PHASE 2 ENGAGEMENT REPORT, MITS, FINAL VERSION, 10 APRIL 2018
54
4.5.3 Public transport
Participants were asked about their level of support for public transport scenarios. There were
two options tested, each at opposing ends of a scale:
• Scenario 1: An environment with greater public transport priority including tram-only lanes
and bus-only lanes, traffic lights let trams and buses go through more quickly, some
restrictions on right turns so turning cars don’t hold up buses and trams.
• Scenario 2: An environment with lower public transport priority where buses and trams
share lanes with cars, buses and trams don’t get priority at intersections, no restrictions on
vehicles turning.
Figure 35, Figure 36 and Figure 36 show that an environment with greater public transport was
preferred by most participants regardless of north or south connection or transport mode used.
Figure 35: Level of support for public transport scenarios
Participants explained their level of support:
• ‘We have finite space, so we should prioritise healthiest, most space efficient and
sustainable forms of transport (walking, cycling and public transport) over cars (often single
people in them), then everything will sort itself out.’
• ‘‘If the timetable is accurate then people know when next one is and make a judgement how
long to walk to next stop.’
• ‘The better public transport is, the more people will use it.’
• ‘Bring trains, trams and more bus routes to Hadfield to encourage less reliance on driving.’
250
5934
8 8 6 16
0
50
100
150
200
250
300
Full supportfor scenario
1
Full supportfor scenario
2
Spectrum of participant support from scenario 1 to scenario 2
Public transport - support levels (n=381)
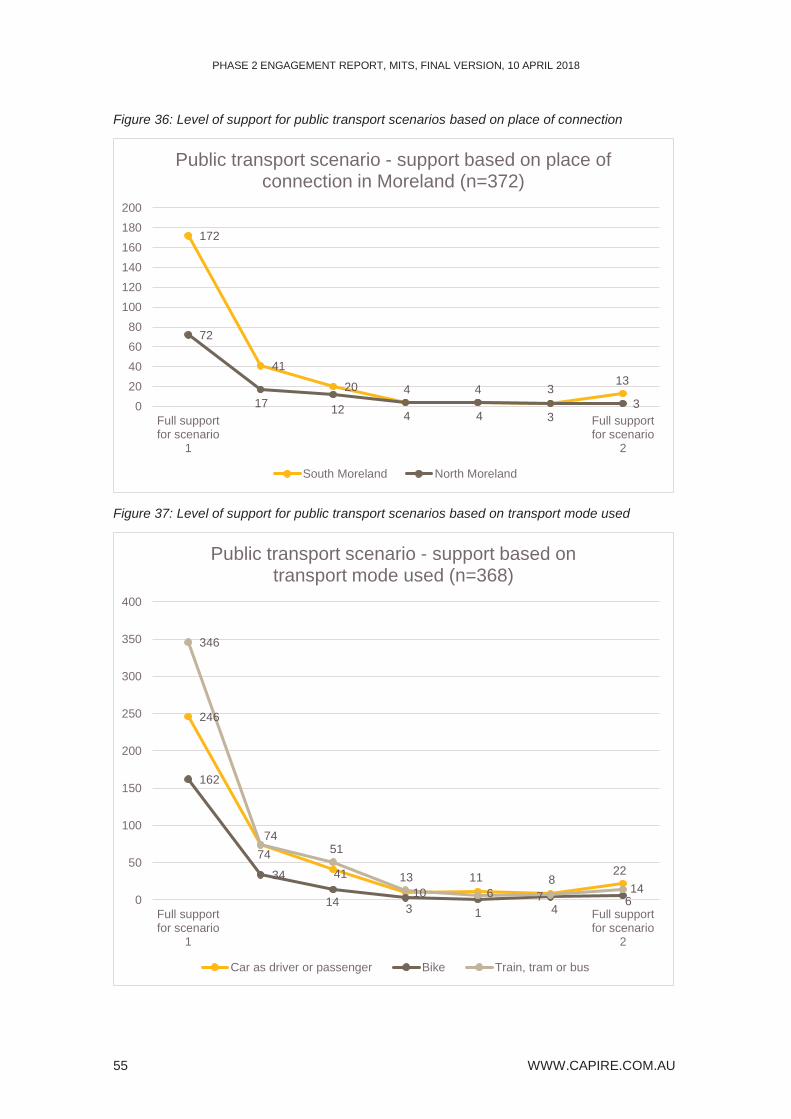
PHASE 2 ENGAGEMENT REPORT, MITS, FINAL VERSION, 10 APRIL 2018
55 WWW.CAPIRE.COM.AU
Figure 36: Level of support for public transport scenarios based on place of connection
Figure 37: Level of support for public transport scenarios based on transport mode used
172
41
20
4 4 3
13
72
1712
4 4 3
30
20
40
60
80
100
120
140
160
180
200
Full supportfor scenario
1
Full supportfor scenario
2
Public transport scenario - support based on place of connection in Moreland (n=372)
South Moreland North Moreland
246
74
41
10
11 822
162
34
143 1 4
6
346
7451
13
6 714
0
50
100
150
200
250
300
350
400
Full supportfor scenario
1
Full supportfor scenario
2
Public transport scenario - support based on transport mode used (n=368)
Car as driver or passenger Bike Train, tram or bus
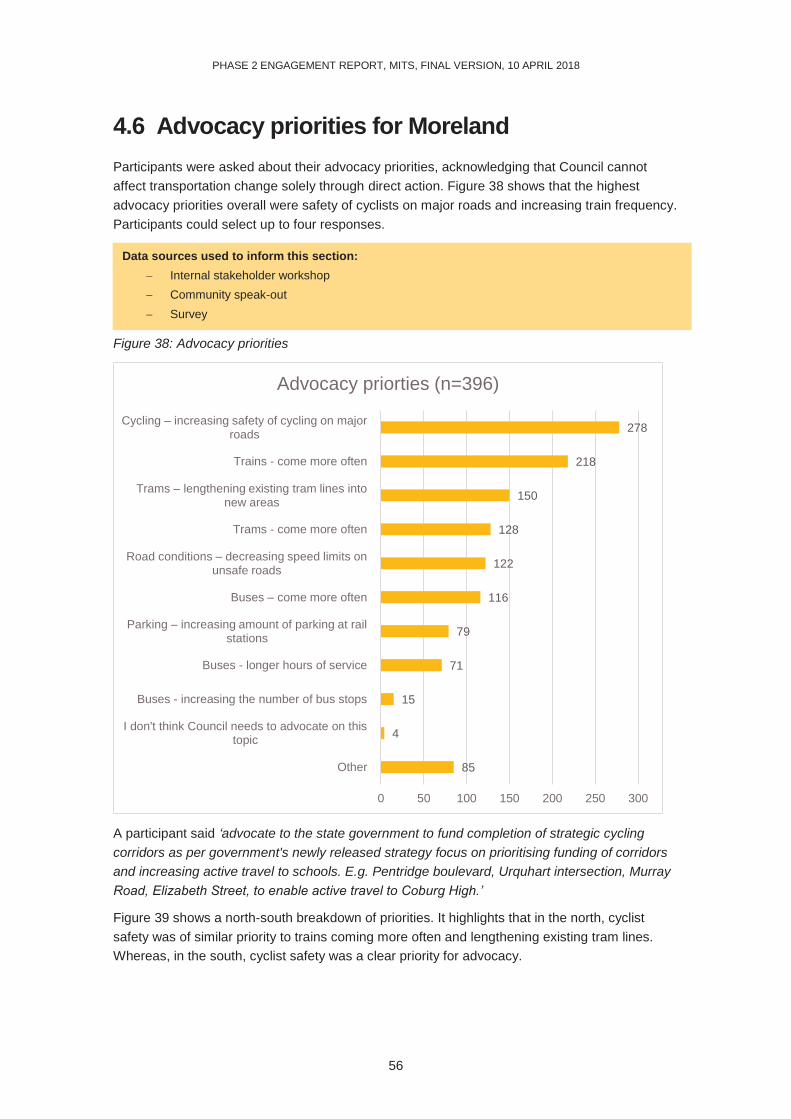
PHASE 2 ENGAGEMENT REPORT, MITS, FINAL VERSION, 10 APRIL 2018
56
4.6 Advocacy priorities for Moreland
Participants were asked about their advocacy priorities, acknowledging that Council cannot
affect transportation change solely through direct action. Figure 38 shows that the highest
advocacy priorities overall were safety of cyclists on major roads and increasing train frequency.
Participants could select up to four responses.
Figure 38: Advocacy priorities
A participant said ‘advocate to the state government to fund completion of strategic cycling
corridors as per government's newly released strategy focus on prioritising funding of corridors
and increasing active travel to schools. E.g. Pentridge boulevard, Urquhart intersection, Murray
Road, Elizabeth Street, to enable active travel to Coburg High.’
Figure 39 shows a north-south breakdown of priorities. It highlights that in the north, cyclist
safety was of similar priority to trains coming more often and lengthening existing tram lines.
Whereas, in the south, cyclist safety was a clear priority for advocacy.
85
4
15
71
79
116
122
128
150
218
278
0 50 100 150 200 250 300
Other
I don't think Council needs to advocate on thistopic
Buses - increasing the number of bus stops
Buses - longer hours of service
Parking – increasing amount of parking at rail stations
Buses – come more often
Road conditions – decreasing speed limits on unsafe roads
Trams - come more often
Trams – lengthening existing tram lines into new areas
Trains - come more often
Cycling – increasing safety of cycling on major roads
Advocacy priorties (n=396)
Data sources used to inform this section:
Internal stakeholder workshop
Community speak-out
Survey
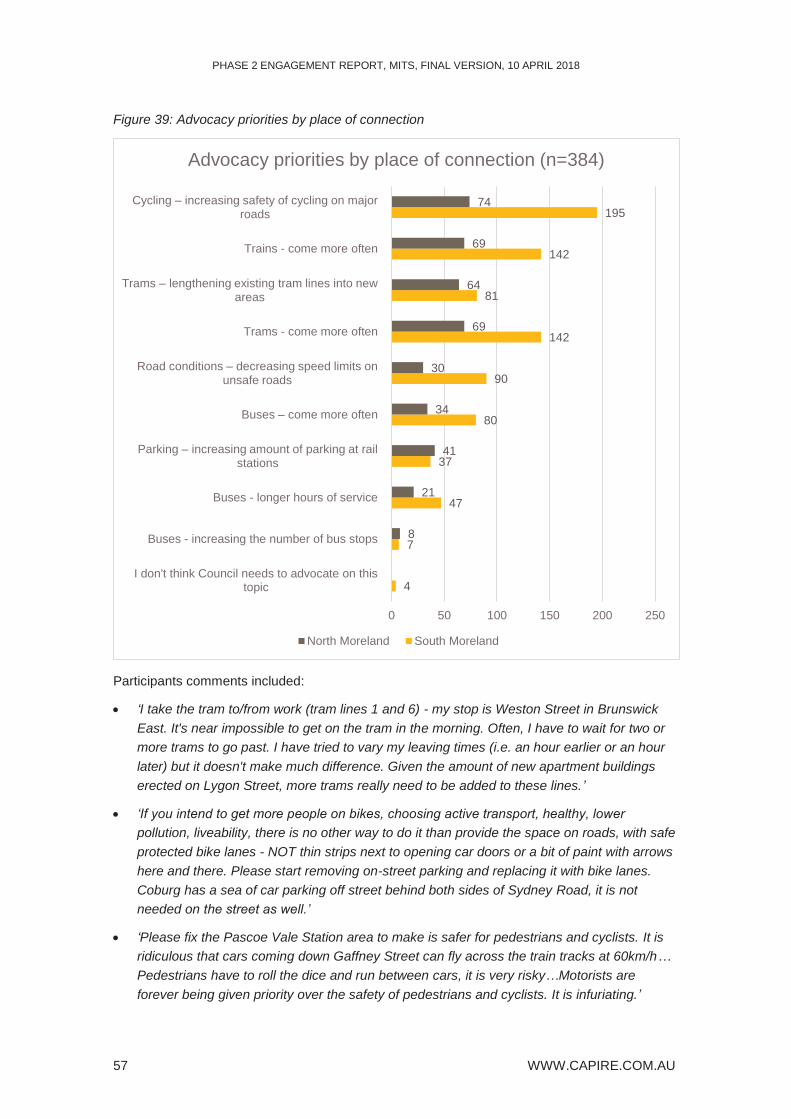
PHASE 2 ENGAGEMENT REPORT, MITS, FINAL VERSION, 10 APRIL 2018
57 WWW.CAPIRE.COM.AU
Figure 39: Advocacy priorities by place of connection
Participants comments included:
• ‘I take the tram to/from work (tram lines 1 and 6) - my stop is Weston Street in Brunswick
East. It's near impossible to get on the tram in the morning. Often, I have to wait for two or
more trams to go past. I have tried to vary my leaving times (i.e. an hour earlier or an hour
later) but it doesn't make much difference. Given the amount of new apartment buildings
erected on Lygon Street, more trams really need to be added to these lines.’
• ‘If you intend to get more people on bikes, choosing active transport, healthy, lower
pollution, liveability, there is no other way to do it than provide the space on roads, with safe
protected bike lanes - NOT thin strips next to opening car doors or a bit of paint with arrows
here and there. Please start removing on-street parking and replacing it with bike lanes.
Coburg has a sea of car parking off street behind both sides of Sydney Road, it is not
needed on the street as well.’
• ‘Please fix the Pascoe Vale Station area to make is safer for pedestrians and cyclists. It is
ridiculous that cars coming down Gaffney Street can fly across the train tracks at 60km/h…
Pedestrians have to roll the dice and run between cars, it is very risky…Motorists are
forever being given priority over the safety of pedestrians and cyclists. It is infuriating.’
4
7
47
37
80
90
142
81
142
195
8
21
41
34
30
69
64
69
74
0 50 100 150 200 250
I don't think Council needs to advocate on thistopic
Buses - increasing the number of bus stops
Buses - longer hours of service
Parking – increasing amount of parking at rail stations
Buses – come more often
Road conditions – decreasing speed limits on unsafe roads
Trams - come more often
Trams – lengthening existing tram lines into new areas
Trains - come more often
Cycling – increasing safety of cycling on major roads
Advocacy priorities by place of connection (n=384)
North Moreland South Moreland
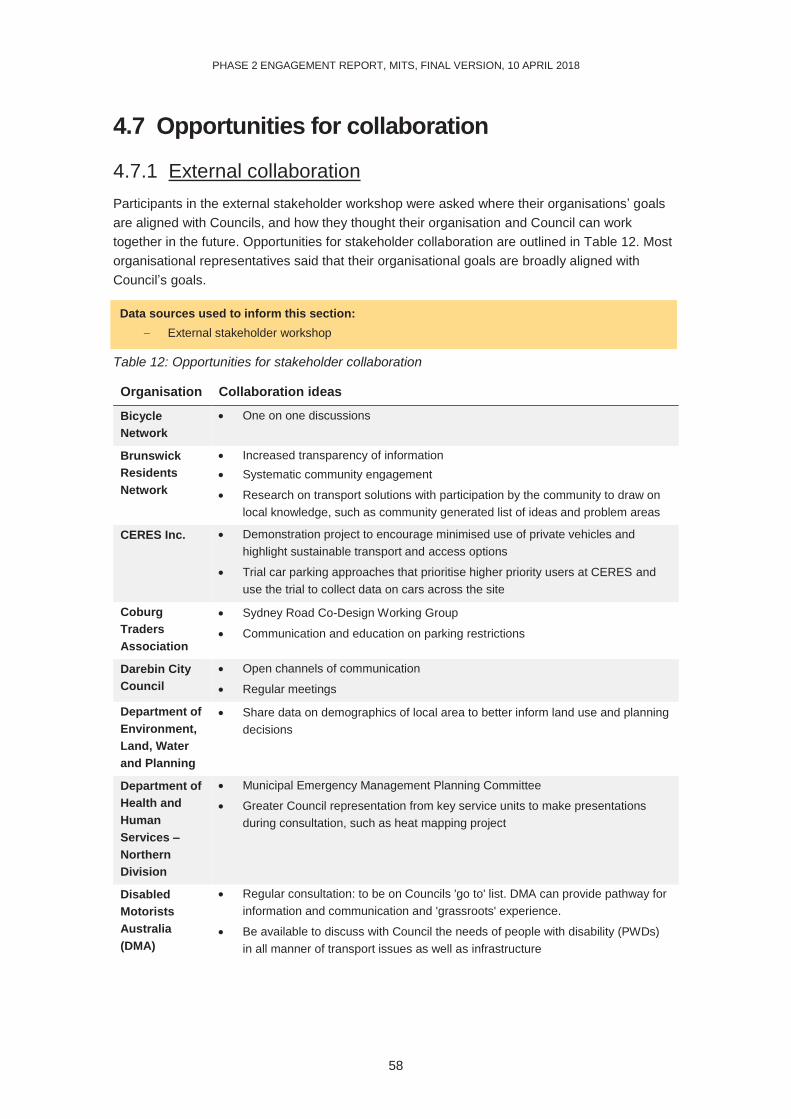
PHASE 2 ENGAGEMENT REPORT, MITS, FINAL VERSION, 10 APRIL 2018
58
4.7 Opportunities for collaboration
4.7.1 External collaboration
Participants in the external stakeholder workshop were asked where their organisations’ goals
are aligned with Councils, and how they thought their organisation and Council can work
together in the future. Opportunities for stakeholder collaboration are outlined in Table 12. Most
organisational representatives said that their organisational goals are broadly aligned with
Council’s goals.
Table 12: Opportunities for stakeholder collaboration
Organisation Collaboration ideas
Bicycle
Network
• One on one discussions
Brunswick
Residents
Network
• Increased transparency of information
• Systematic community engagement
• Research on transport solutions with participation by the community to draw on
local knowledge, such as community generated list of ideas and problem areas
CERES Inc. • Demonstration project to encourage minimised use of private vehicles and
highlight sustainable transport and access options
• Trial car parking approaches that prioritise higher priority users at CERES and
use the trial to collect data on cars across the site
Coburg
Traders
Association
• Sydney Road Co-Design Working Group
• Communication and education on parking restrictions
Darebin City
Council
• Open channels of communication
• Regular meetings
Department of
Environment,
Land, Water
and Planning
• Share data on demographics of local area to better inform land use and planning
decisions
Department of
Health and
Human
Services –
Northern
Division
• Municipal Emergency Management Planning Committee
• Greater Council representation from key service units to make presentations
during consultation, such as heat mapping project
Disabled
Motorists
Australia
(DMA)
• Regular consultation: to be on Councils 'go to' list. DMA can provide pathway for
information and communication and 'grassroots' experience.
• Be available to discuss with Council the needs of people with disability (PWDs)
in all manner of transport issues as well as infrastructure
Data sources used to inform this section:
External stakeholder workshop
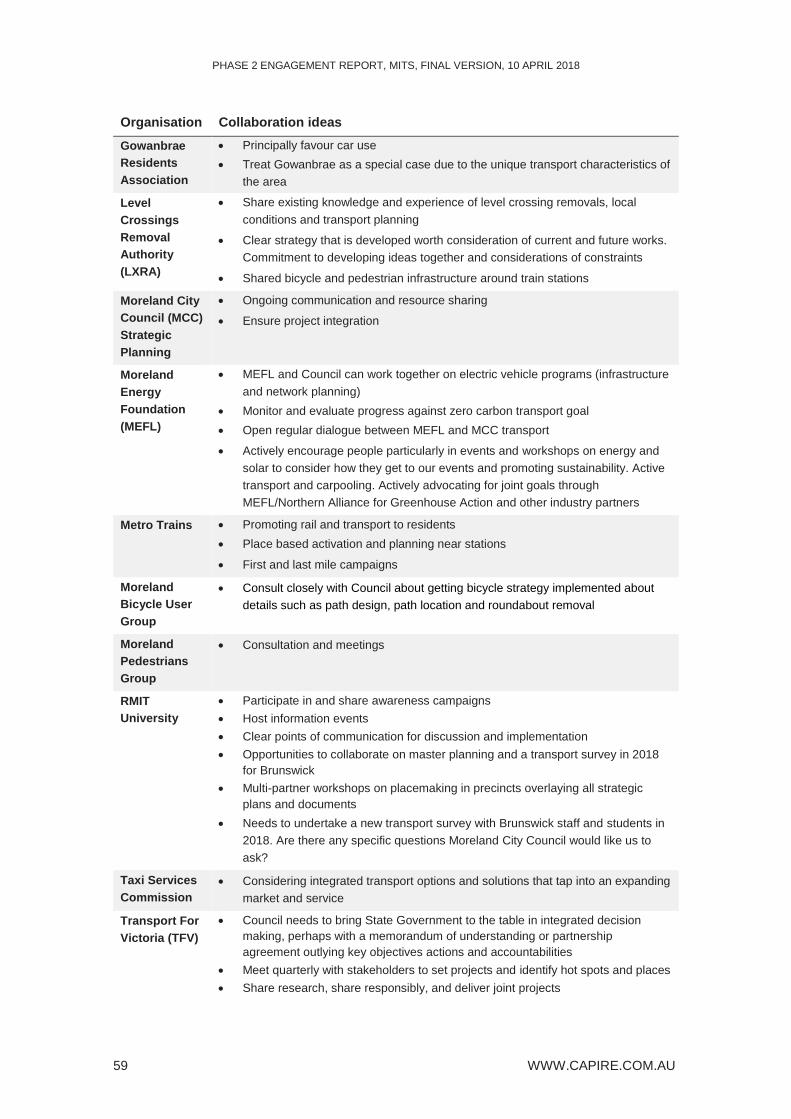
PHASE 2 ENGAGEMENT REPORT, MITS, FINAL VERSION, 10 APRIL 2018
59 WWW.CAPIRE.COM.AU
Organisation Collaboration ideas
Gowanbrae
Residents
Association
• Principally favour car use
• Treat Gowanbrae as a special case due to the unique transport characteristics of
the area
Level
Crossings
Removal
Authority
(LXRA)
• Share existing knowledge and experience of level crossing removals, local
conditions and transport planning
• Clear strategy that is developed worth consideration of current and future works.
Commitment to developing ideas together and considerations of constraints
• Shared bicycle and pedestrian infrastructure around train stations
Moreland City
Council (MCC)
Strategic
Planning
• Ongoing communication and resource sharing
• Ensure project integration
Moreland
Energy
Foundation
(MEFL)
• MEFL and Council can work together on electric vehicle programs (infrastructure
and network planning)
• Monitor and evaluate progress against zero carbon transport goal
• Open regular dialogue between MEFL and MCC transport
• Actively encourage people particularly in events and workshops on energy and
solar to consider how they get to our events and promoting sustainability. Active
transport and carpooling. Actively advocating for joint goals through
MEFL/Northern Alliance for Greenhouse Action and other industry partners
Metro Trains • Promoting rail and transport to residents
• Place based activation and planning near stations
• First and last mile campaigns
Moreland
Bicycle User
Group
• Consult closely with Council about getting bicycle strategy implemented about
details such as path design, path location and roundabout removal
Moreland
Pedestrians
Group
• Consultation and meetings
RMIT
University
• Participate in and share awareness campaigns
• Host information events
• Clear points of communication for discussion and implementation
• Opportunities to collaborate on master planning and a transport survey in 2018
for Brunswick
• Multi-partner workshops on placemaking in precincts overlaying all strategic
plans and documents
• Needs to undertake a new transport survey with Brunswick staff and students in
2018. Are there any specific questions Moreland City Council would like us to
ask?
Taxi Services
Commission
• Considering integrated transport options and solutions that tap into an expanding
market and service
Transport For
Victoria (TFV)
• Council needs to bring State Government to the table in integrated decision
making, perhaps with a memorandum of understanding or partnership
agreement outlying key objectives actions and accountabilities
• Meet quarterly with stakeholders to set projects and identify hot spots and places
• Share research, share responsibly, and deliver joint projects
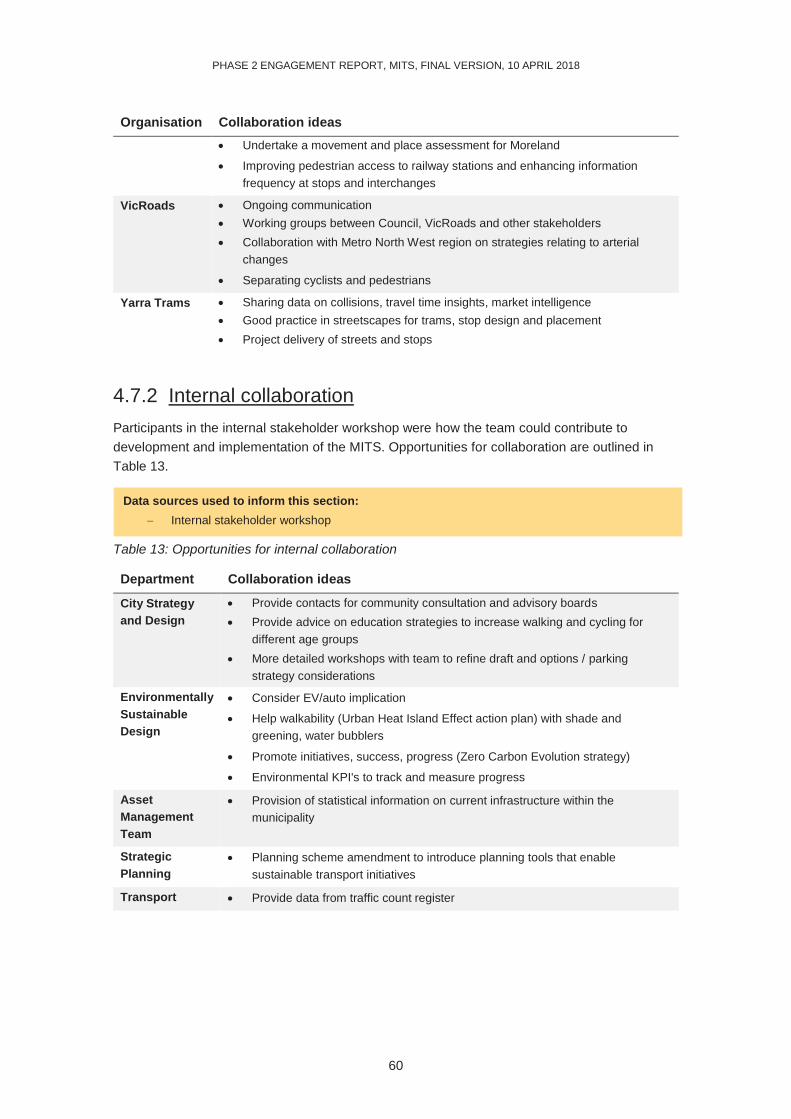
PHASE 2 ENGAGEMENT REPORT, MITS, FINAL VERSION, 10 APRIL 2018
60
Organisation Collaboration ideas
• Undertake a movement and place assessment for Moreland
• Improving pedestrian access to railway stations and enhancing information
frequency at stops and interchanges
VicRoads • Ongoing communication
• Working groups between Council, VicRoads and other stakeholders
• Collaboration with Metro North West region on strategies relating to arterial
changes
• Separating cyclists and pedestrians
Yarra Trams • Sharing data on collisions, travel time insights, market intelligence
• Good practice in streetscapes for trams, stop design and placement
• Project delivery of streets and stops
4.7.2 Internal collaboration
Participants in the internal stakeholder workshop were how the team could contribute to
development and implementation of the MITS. Opportunities for collaboration are outlined in
Table 13.
Table 13: Opportunities for internal collaboration
Department Collaboration ideas
City Strategy
and Design
• Provide contacts for community consultation and advisory boards
• Provide advice on education strategies to increase walking and cycling for
different age groups
• More detailed workshops with team to refine draft and options / parking
strategy considerations
Environmentally
Sustainable
Design
• Consider EV/auto implication
• Help walkability (Urban Heat Island Effect action plan) with shade and
greening, water bubblers
• Promote initiatives, success, progress (Zero Carbon Evolution strategy)
• Environmental KPI's to track and measure progress
Asset
Management
Team
• Provision of statistical information on current infrastructure within the
municipality
Strategic
Planning
• Planning scheme amendment to introduce planning tools that enable
sustainable transport initiatives
Transport • Provide data from traffic count register
Data sources used to inform this section:
Internal stakeholder workshop

PHASE 2 ENGAGEMENT REPORT, MITS, FINAL VERSION, 10 APRIL 2018
61 WWW.CAPIRE.COM.AU
Event agendas
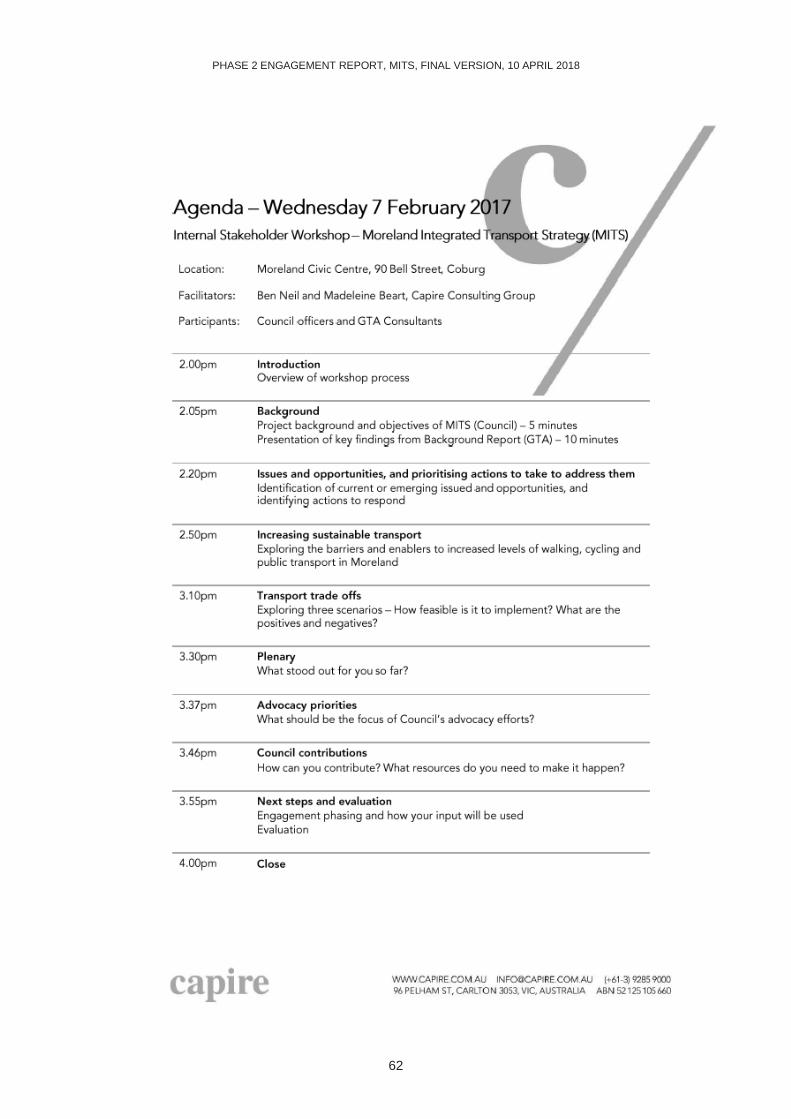
PHASE 2 ENGAGEMENT REPORT, MITS, FINAL VERSION, 10 APRIL 2018
62
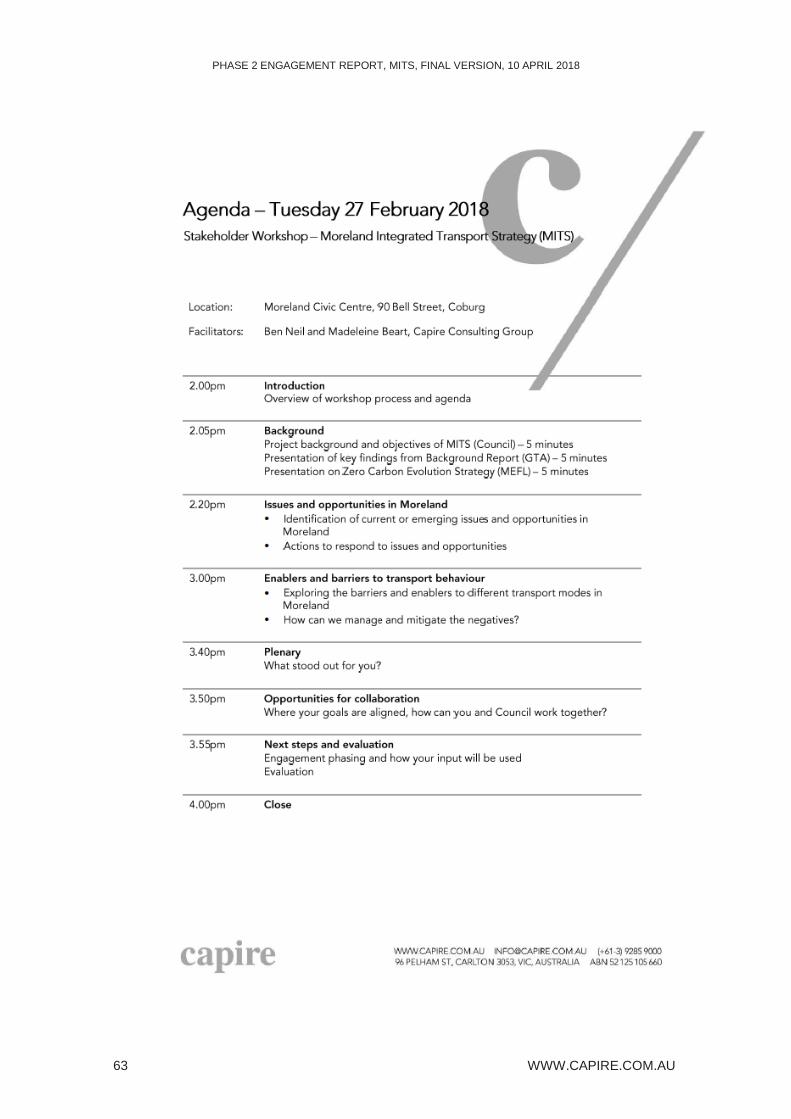
PHASE 2 ENGAGEMENT REPORT, MITS, FINAL VERSION, 10 APRIL 2018
63 WWW.CAPIRE.COM.AU
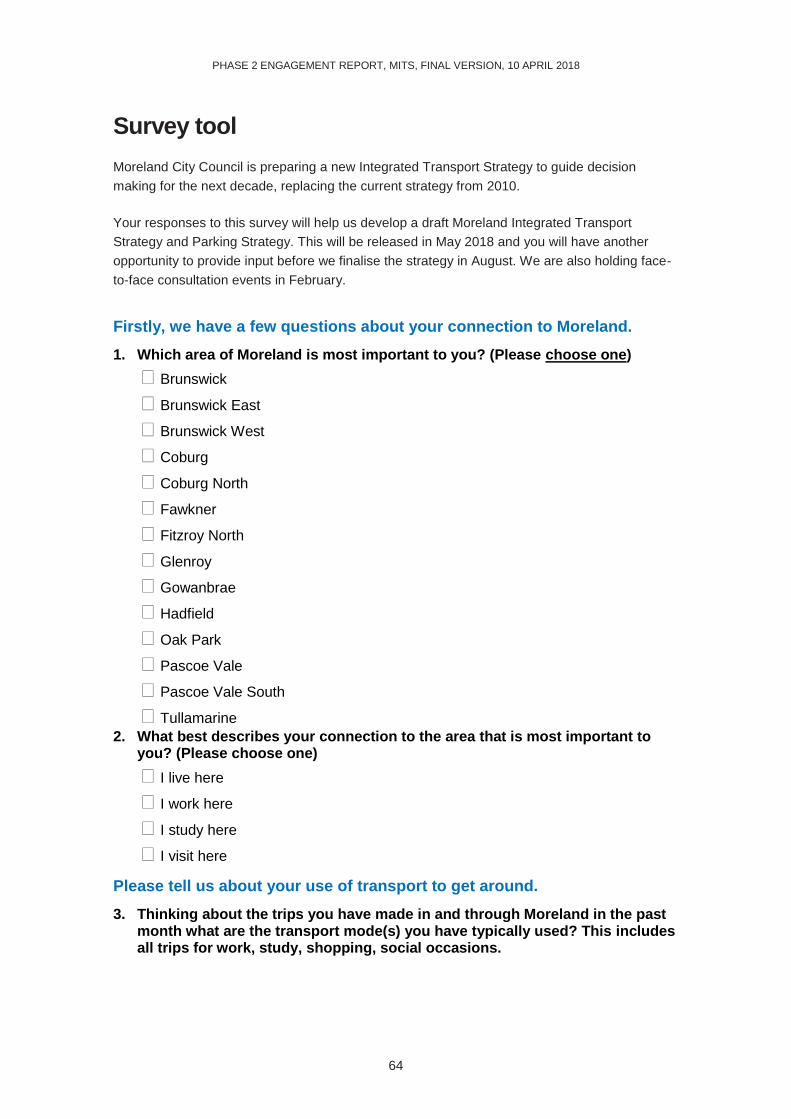
PHASE 2 ENGAGEMENT REPORT, MITS, FINAL VERSION, 10 APRIL 2018
64
Survey tool
Moreland City Council is preparing a new Integrated Transport Strategy to guide decision
making for the next decade, replacing the current strategy from 2010.
Your responses to this survey will help us develop a draft Moreland Integrated Transport
Strategy and Parking Strategy. This will be released in May 2018 and you will have another
opportunity to provide input before we finalise the strategy in August. We are also holding face-
to-face consultation events in February.
Firstly, we have a few questions about your connection to Moreland.
1. Which area of Moreland is most important to you? (Please choose one)
Brunswick
Brunswick East
Brunswick West
Coburg
Coburg North
Fawkner
Fitzroy North
Glenroy
Gowanbrae
Hadfield
Oak Park
Pascoe Vale
Pascoe Vale South
Tullamarine
2. What best describes your connection to the area that is most important to you? (Please choose one)
I live here
I work here
I study here
I visit here
Please tell us about your use of transport to get around.
3. Thinking about the trips you have made in and through Moreland in the past month what are the transport mode(s) you have typically used? This includes all trips for work, study, shopping, social occasions.
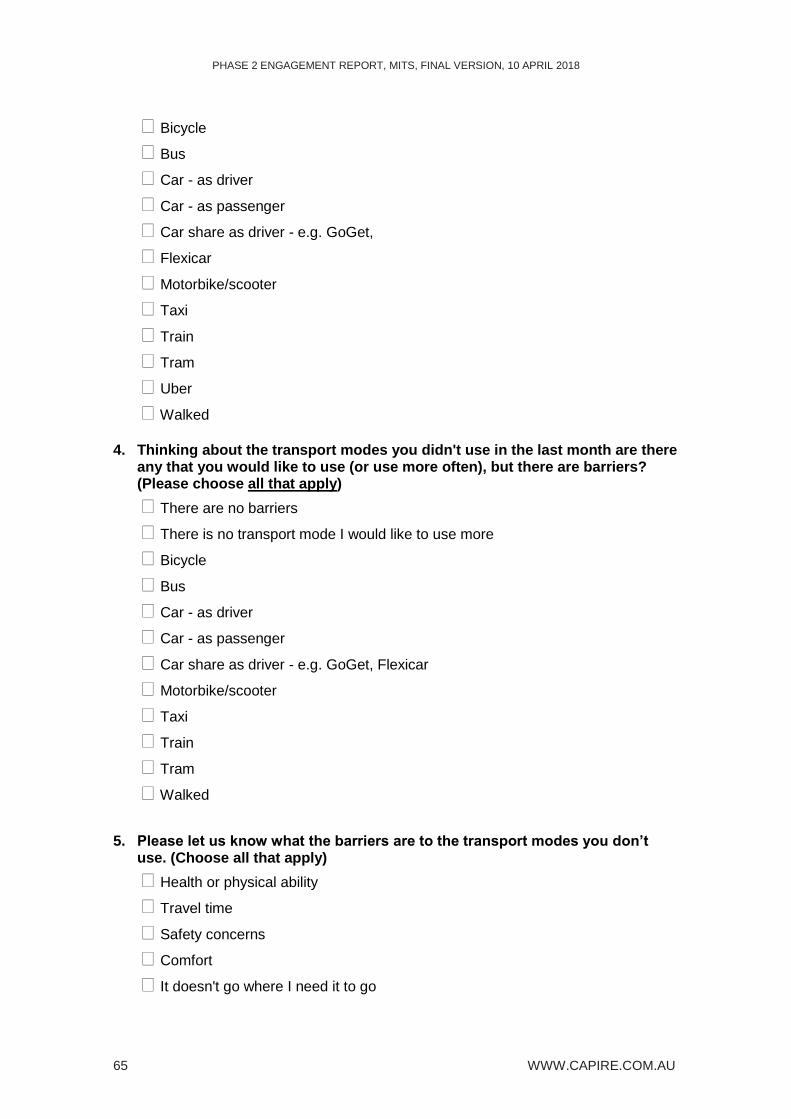
PHASE 2 ENGAGEMENT REPORT, MITS, FINAL VERSION, 10 APRIL 2018
65 WWW.CAPIRE.COM.AU
Bicycle
Bus
Car - as driver
Car - as passenger
Car share as driver - e.g. GoGet,
Flexicar
Motorbike/scooter
Taxi
Train
Tram
Uber
Walked
4. Thinking about the transport modes you didn't use in the last month are there
any that you would like to use (or use more often), but there are barriers? (Please choose all that apply)
There are no barriers
There is no transport mode I would like to use more
Bicycle
Bus
Car - as driver
Car - as passenger
Car share as driver - e.g. GoGet, Flexicar
Motorbike/scooter
Taxi
Train
Tram
Walked
5. Please let us know what the barriers are to the transport modes you don’t use. (Choose all that apply)
Health or physical ability
Travel time
Safety concerns
Comfort
It doesn't go where I need it to go
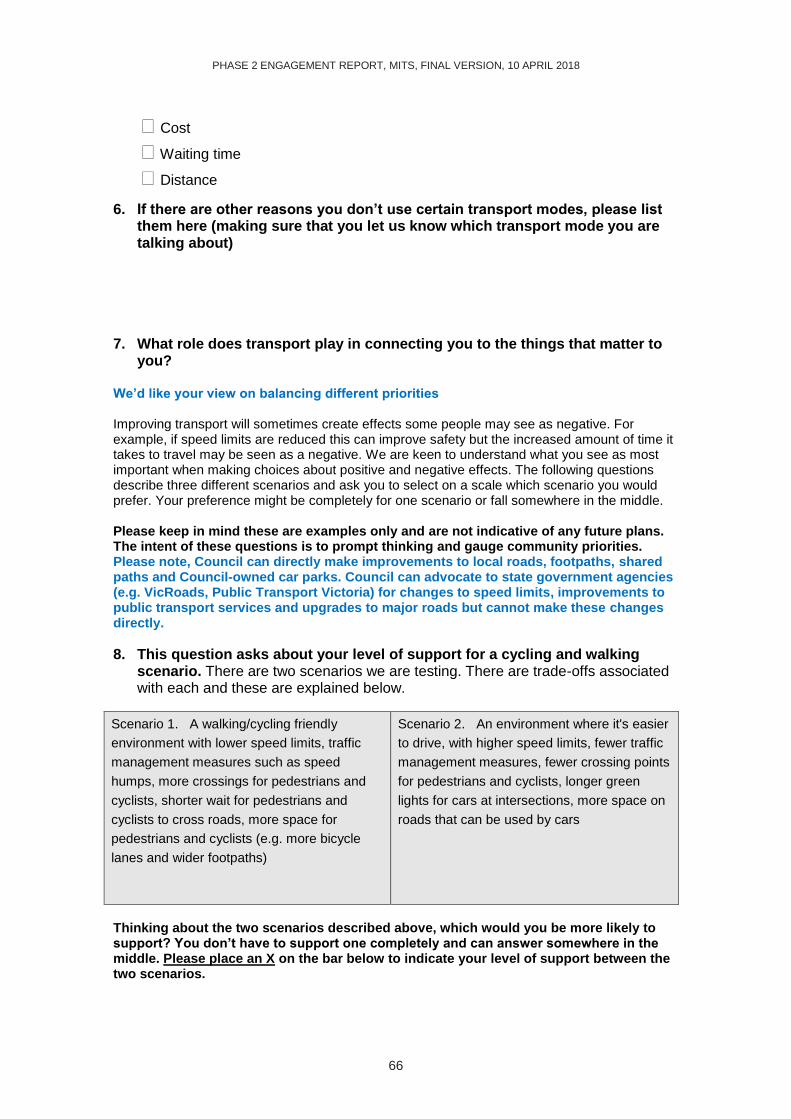
PHASE 2 ENGAGEMENT REPORT, MITS, FINAL VERSION, 10 APRIL 2018
66
Cost
Waiting time
Distance
6. If there are other reasons you don’t use certain transport modes, please list them here (making sure that you let us know which transport mode you are talking about)
7. What role does transport play in connecting you to the things that matter to
you? We’d like your view on balancing different priorities Improving transport will sometimes create effects some people may see as negative. For example, if speed limits are reduced this can improve safety but the increased amount of time it takes to travel may be seen as a negative. We are keen to understand what you see as most important when making choices about positive and negative effects. The following questions describe three different scenarios and ask you to select on a scale which scenario you would prefer. Your preference might be completely for one scenario or fall somewhere in the middle. Please keep in mind these are examples only and are not indicative of any future plans. The intent of these questions is to prompt thinking and gauge community priorities. Please note, Council can directly make improvements to local roads, footpaths, shared paths and Council-owned car parks. Council can advocate to state government agencies (e.g. VicRoads, Public Transport Victoria) for changes to speed limits, improvements to public transport services and upgrades to major roads but cannot make these changes directly.
8. This question asks about your level of support for a cycling and walking scenario. There are two scenarios we are testing. There are trade-offs associated with each and these are explained below.
Scenario 1. A walking/cycling friendly
environment with lower speed limits, traffic
management measures such as speed
humps, more crossings for pedestrians and
cyclists, shorter wait for pedestrians and
cyclists to cross roads, more space for
pedestrians and cyclists (e.g. more bicycle
lanes and wider footpaths)
Scenario 2. An environment where it's easier
to drive, with higher speed limits, fewer traffic
management measures, fewer crossing points
for pedestrians and cyclists, longer green
lights for cars at intersections, more space on
roads that can be used by cars
Thinking about the two scenarios described above, which would you be more likely to support? You don’t have to support one completely and can answer somewhere in the middle. Please place an X on the bar below to indicate your level of support between the two scenarios.
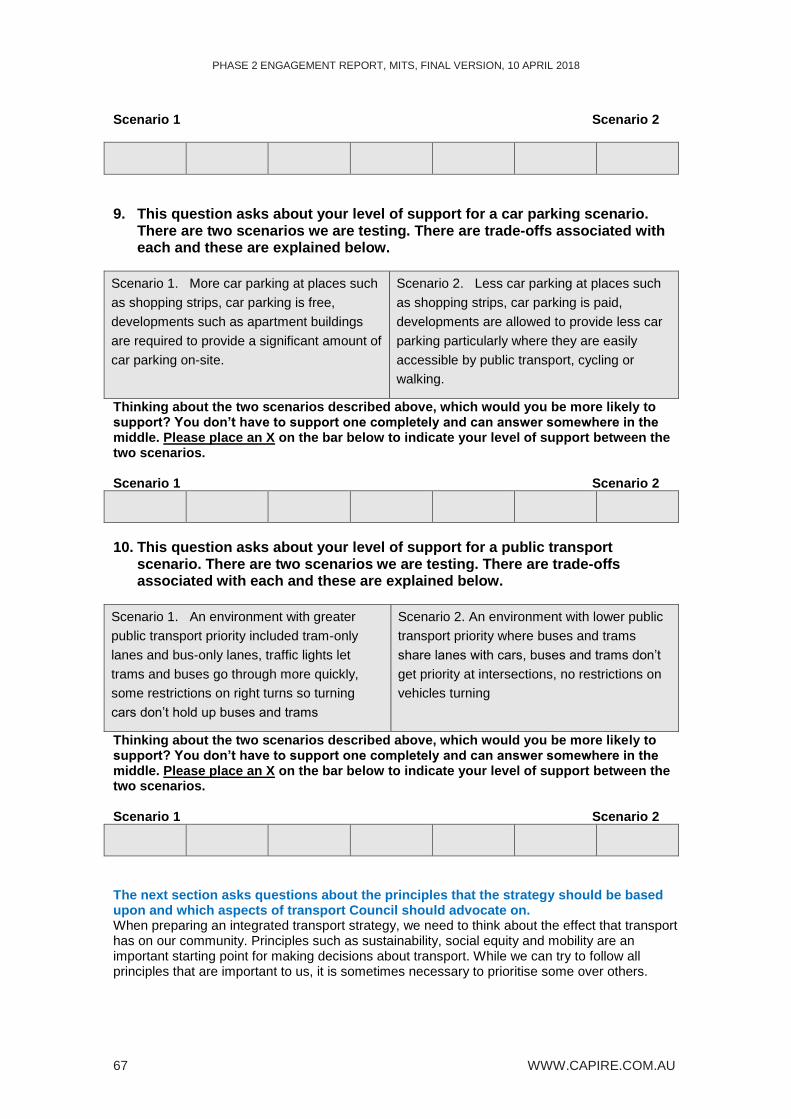
PHASE 2 ENGAGEMENT REPORT, MITS, FINAL VERSION, 10 APRIL 2018
67 WWW.CAPIRE.COM.AU
Scenario 1 Scenario 2
9. This question asks about your level of support for a car parking scenario. There are two scenarios we are testing. There are trade-offs associated with each and these are explained below.
Scenario 1. More car parking at places such
as shopping strips, car parking is free,
developments such as apartment buildings
are required to provide a significant amount of
car parking on-site.
Scenario 2. Less car parking at places such
as shopping strips, car parking is paid,
developments are allowed to provide less car
parking particularly where they are easily
accessible by public transport, cycling or
walking.
Thinking about the two scenarios described above, which would you be more likely to support? You don’t have to support one completely and can answer somewhere in the middle. Please place an X on the bar below to indicate your level of support between the two scenarios. Scenario 1 Scenario 2
10. This question asks about your level of support for a public transport scenario. There are two scenarios we are testing. There are trade-offs associated with each and these are explained below.
Scenario 1. An environment with greater
public transport priority included tram-only
lanes and bus-only lanes, traffic lights let
trams and buses go through more quickly,
some restrictions on right turns so turning
cars don’t hold up buses and trams
Scenario 2. An environment with lower public
transport priority where buses and trams
share lanes with cars, buses and trams don’t
get priority at intersections, no restrictions on
vehicles turning
Thinking about the two scenarios described above, which would you be more likely to support? You don’t have to support one completely and can answer somewhere in the middle. Please place an X on the bar below to indicate your level of support between the two scenarios. Scenario 1 Scenario 2
The next section asks questions about the principles that the strategy should be based upon and which aspects of transport Council should advocate on. When preparing an integrated transport strategy, we need to think about the effect that transport has on our community. Principles such as sustainability, social equity and mobility are an important starting point for making decisions about transport. While we can try to follow all principles that are important to us, it is sometimes necessary to prioritise some over others.
PHASE 2 ENGAGEMENT REPORT, MITS, FINAL VERSION, 10 APRIL 2018
68
11. What do you think are the top three principles that should guide the new Moreland Integrated Transport Strategy? This does not mean that other principles are not important or that they will not be considered. Please select three only. Sustainability – reducing our use of fossil fuels, and reducing greenhouse gas emissions and other pollution
Safety – reducing the number of injuries or people killed on the road, as well as making people feel safe
Improving health and wellbeing – increasing the amount of physical activity people get while travelling (e.g. walking or cycling for part or all of their journey) and reducing the health risk from pollution
Equity – making sure that all members of our community have the same opportunities, regardless of age, ability and where they live
Liveability – creating pleasant streets and neighbourhoods where quality of life is high
Economic prosperity/growth – transport supports local businesses
Time efficiency – making sure people can get around quickly
Cost-efficiency – people don’t have to pay as much to get to where they need to be
Other – please specify: As mentioned previously, there are many aspects of transport that Council cannot control directly. However, Council will use the Moreland Integrated Transport Strategy to advocate to other levels of government, mostly state government agencies such as VicRoads and Public Transport Victoria, for transport improvements for the Moreland community. Some things that Council may advocate for can be more easily or quickly influenced than others. For example, it may be easier to advocate to VicRoads for reduced speed limits than for new bicycle lanes on major roads. It may also be easier to advocate to Public Transport Victoria for more frequent bus services than for an extension to a tram route. It is important for Council’s advocacy to focus on the things that are most likely to achieve a positive outcome for the Moreland community, as time and resources are limited. If Council attempts to advocate for a large number of changes which are unlikely to occur, it can miss the opportunity to make a real difference.
12. Thinking about what Council cannot control directly and the need to focus advocacy activities on things that are likely to lead to improvements for the Moreland community, what should be the focus of Council’s advocacy to other levels of government?
I don't think Council needs to advocate on this topic
Trams - come more often
Buses – come more often
Trains - come more often
Cycling – increasing safety of cycling on major roads
Parking – increasing amount of parking at rail stations
Buses - increasing the number of bus stops
Buses - longer hours of service
Trams – lengthening existing tram lines into new areas
Road conditions – decreasing speed limits on unsafe roads
Other, please specify: Council has produced a background report on the state of transport in Moreland and the future trends in population growth and the implications for getting around the municipality, to inform the development of MITS. The background report has informed this survey.
PHASE 2 ENGAGEMENT REPORT, MITS, FINAL VERSION, 10 APRIL 2018
69 WWW.CAPIRE.COM.AU
13. Have you read the background report? Yes
No
14. Do you have any feedback you would like to provide on the report? For example, are there any issues that we should consider in developing the new Moreland Integrated Transport Strategy that aren’t covered in the report?
Finally, we’d like to know a little about you.
15. Do you identify as: Female
Male
I identify as: _____________________
16. What age group are you in? 14 or under
15 - 19
20 - 24
25 - 34
35 - 44
45 - 54
55 - 64
65 - 74
75 - 84
85 and over
17. If you have any final comments please leave them here: If you would like to stay informed about the Moreland Integrated Transport Strategy, particularly when there is another opportunity to provide your input, please provide your name and email address below. We will not publish this information and it will be separated from your answers. Name: Email address or postal address: Please leave your survey at a Council service centre, library or post it to Strategic Transport, Moreland City Council, Locked Bag 10, Moreland 3058