Embed Size (px)
Citation preview

2
Final Version 1
Hydrocarbons in Latin America – Case of Brazil Ronaldo Seroa da Motta*
Amanda Aragão† Jacqueline Mariano‡
[email protected] Rio de Janeiro, 05th June 2008
1. Introduction
The oil industry in Brazil is dominated by Petrobras a “mixed-economy” company created
to explore the monopoly on every oil activity in the country. On November 9, 1995, the
Constitution of 1988 was amended to break this monopoly, allowing the federal
government to contract with any private or government company to carry out exploration,
production, refining and distribution of hydrocarbons. This amendment was regulated by
the enactment of Law 9478 on August 6, 1997 (known as the Petroleum Law), which
established the rules for competition in the Brazilian market for oil, natural gas and refined
products. The new regulatory arrangement includes the National Energy Policy Council
(CNPE) and the National Petroleum, Natural Gas and Biofuels Agency (ANP) as the
regulator of the oil and gas sector in Brazil.
Starting on January 2, 2002, the government deregulated the prices of petroleum and
derivatives, although with a general rule that domestic prices should follow international
ones. The gradual transformation of the Brazilian oil and gas sector since 1997 has led to an
impressive growth on production with a greater participation by international companies,
both as competitors and partners in joint undertakings.
Although causality will not be empirically tested, such changes on business environment
and the resulting impressive increase in performance on all oil activities in Brazil will be
the subject of this chapter. Section 2 presents the evolution of the oil sector and Section 3
* Researcher at IPEA (Research Institute for Applied Economics), Rio de Janeiro, Brazil † Energy Analyst at EPE (Energy Planning Company), Rio de Janeiro, Brazil ‡ Energy Analyst at ANP (National Oil Agency), Rio de Janeiro, Brazil

3
examines the oil and natural gas pricing policies. Next section describes the corporative
development of Petrobras and indicates long term prospects on oil production in the
country. Section 5 analyses other energy regulatory approaches that affect the oil and
natural gas sector, such as, electricity and biofuels. Last section just presents final
comments.
2. Evolution and Development of Oil Sector in Brazil
This section summarizes the history of petroleum exploration and production in Brazil that
can be divided into four phases. The first goes from the initial exploratory efforts in the
second half of the nineteenth century up to 1938. This activity was sparse and carried out
by private initiative. The second phase began with the nationalization of mineral resources
by the Brazilian government and the creation of the National Petroleum Council in 1938.
The third phase started with the establishment of the state monopoly and creation of the
federally owned company Petróleo Brasileiro S.A. – Petrobras, according to Law 2004 of
October 3, 1953, under the government of President Getúlio Vargas. This was a noteworthy
phase in the history of oil in Brazil, especially because Petrobras emerged from a
democratic debate, after broad and lengthy discussion among political parties and the
public at large (UNICAMP, 2007). The fourth and current phase began with the enactment
of Law 9478 on August 6, 1997, the second “Petroleum Law” in Brazilian history. This law
relaxed the state monopoly on oil industry activities and created the National Petroleum
Agency (ANP) as the regulator for the petroleum, natural gas and biofuels sector.§
To shed more light on the evolution of the production of oil and natural gas in Brazil, in its
regulatory and technological aspects, each of the phases is discussed in more detail below,
the first two together.
2.2 The First Two Phases: Before the Creation of Petrobras
The first records of the search for hydrocarbons in Brazil date to 1858, when the Emperor
granted permission to prospect and mine coal and bituminous schists in the region of Ilhéus
§ Due to the increasing importance of natural gas and biofuels (particularly ethanol) for the Brazilian economy, the official name has been changed to the National Petroleum, Natural Gas and Biofuels Agency.

4
in the state of Bahia (Lucchesi, 1998). The first concession to explore for oil was given to
an Englishman, Thomas Denny Sargent, by imperial decree in 1864, covering the region of
Camamu, Bahia, but he was not successful.
Later, between 1892 and 1896, Brazilian Eugênio Ferreira de Camargo drilled what can be
considered the first deep test well, in the region of Bofete in the state of São Paulo. The
well reached a depth of 488 meters and found sulfurous water and only two barrels of oil.
In 1907 the Brazilian Geological and Mineralogical Service (Serviço Geológico e
Mineralógico Brasileiro – SGMB) was created, which prompted a considerable increase in
test drilling. The SGMB purchased equipment and set up infrastructure for research and
exploratory drilling.
This led to another (frustrated) attempt, directly under the responsibility of the government,
to find commercial oil deposits, in the region of Marechal Mallet, Paraná, starting in
August 1919. The SGMB drilled a well to a depth of 84 meters, but abandoned it the next
year.
In 1934, with Decree 23,979, the federal government created the National Mineral
Production Department (Departamento Nacional de Produção Mineral – DNPM),
introducing a specific policy for development of mineral extraction activities in the country.
Among its powers and duties were:
• To carry out research for exploitation of mineral deposits;
• To conduct studies on ores, minerals, rocks, fuels and other substances;
• To issue official opinions on requests for authorization for research and
extraction concessions;
• To oversee the activities for research and extraction of mineral deposits.
In 1938, the government by presidential decree created the National Petroleum Council
(Conselho Nacional de Petróleo – CNP), charged with structuring and regulating the
activities of the petroleum industry, from exploration and production to importation,

5
transportation, distribution and commercialization of refined products. Decree 395 of April
29, 1938 also made all mineral resources the property of the federal government and
declared activities of the oil industry to be a public utility, in addition to determining that
the ownership and management of oil refineries was restricted to native Brazilians. The
powers and duties of the CNP were:
• To regulate, authorize and control downstream activities, except refining;
• To authorize the construction and operation of refineries;
• To conduct audits of oil companies;
• To define the policy on prices and taxes for petroleum derivatives; and
• To assist the federal government regarding the concession of upstream activities.
The creation of the CNP, under legislation giving the government control of exploration,
production and refining of oil, was the first step in a nationalist policy that would culminate
with the future establishment of a state monopoly in the sector – the creation of Petrobras.
Despite all the developments in this period, oil in Brazil did not attract much interest and
there was little exploration activity. In 1939, the first discovery was made, by the Division
to Encourage Mineral Production (Divisão de Fomento da Produção Mineral), an entity of
the DNPM. This was well number 163, located in the municipality** of Lobato, in the area
of Bahia known as the “Recôncavo Baiano”. However, the discovery was not considered
commercial. Two years later, Decree-Law 3236 of 1941 specifically gave the federal
government ownership of all deposits of petroleum and natural gases found in national
territory. The same year the first commercial discovery was also made, in Candeias, also in
Bahia.
In the period from 1939 to 1953, there were 52 wells drilled in the country and nine areas
for exploration were discovered, but as the 1950s began, 90% of Brazil’s consumption of
refined products came from imports.
** At the local level, Brazil is divided into municipalities, which are similar to counties, except they have a single administration, headed by a mayor and municipal council.

6
With the end of the Second World War, in 1946 a great debate began regarding the
country’s petroleum policy, pitting the nationalists against those who would accept the
participation of foreign companies to explore for and produce oil. In this period a
nationalist campaign began under the slogan “O Petróleo é Nosso” (“The Petroleum is
Ours”), sponsored by the Center for the Defense of Petroleum.
So, although subject to government control (and ownership of mineral resources), from
1858 to 1953 Brazil’s sedimentary basins were open to private initiative.
2.2 The Third Phase: The Creation of Petrobras and the Five Decades of State
Monopoly
The lengthy “The Oil is Ours” debate was won by the nationalist faction, and on October 3,
1953 Law 2004 was signed by President Vargas, establishing a federal monopoly over the
activities of the oil industry:
• Research and extraction of deposits of petroleum and other fluid hydrocarbons
and rare gases in national territory;
• Refining of domestic or imported crude oil;
• Maritime transport of crude oil of domestic origin or derivatives of petroleum
produced in the country; and
• Transport by pipelines of crude oil and refined products, as well as any rare gases
of any origin.
Law 2004/53 also established that the Brazilian government was authorized to set up
Petróleo Brasileiro S.A. – Petrobras, as the state-owned oil company, to exercise the
monopoly, including any related or similar activities thereto.
Petrobras was incorporated on March 12, 1954, during the 82nd Extraordinary Session of
the National Petroleum Council (CNP), a decision that was officially approved by Decree
35,308. Petrobras began its activities with the assets received from the CNP, which retained
its oversight function. These assets were composed of:

7
• oilfields with capacity to produce 2,700 barrels per day (bpd);
• assets of the Commission for Processing Bituminous Schist (Comissão de
Industrialização do Xisto Betuminoso);
• Mataripe Refinery, in the state of Bahia (currently known by the initials RLAM),
processing 5,000 bpd;
• a refinery under construction in Cubatão, São Paulo (currently RPBC);
• twenty oil tankers with capacity to carry 221 thousand metric tons;
• recoverable reserves estimated at 15 million barrels;
• a market consuming refined products equivalent to 137,000 bpd; and
• a fertilizer factory under construction in Cubatão, SP) (Petrobras, 2007).
Exploration and production of crude oil, along with other activities of the oil, natural gas
and derivatives sector, with the exception of wholesale distribution and retail sales at
service stations, were a monopoly of Petrobras from 1954 to 1997, with the CNP in this
phase acting as the supervisory agency. The company’s mission was to supply the internal
market with petroleum and refined products from national or imported production.
At the time Petrobras was created, oil output in Brazil was very small, not more than 3,000
barrels per day, and was concentrated onshore in the Recôncavo Baiano region. In an effort
to find more oil, from 1954 to 1961 a large contingent of foreign technicians and other
experts was recruited, with exploratory efforts centered in Bahia and the Amazon region. In
the following years, until 1968, the prospecting focus was shifted to offshore basins.
In the 1960s the discovery of the Carmópolis field in the state of Sergipe opened new
perspectives outside Bahia, where output remained stationary after 1961. Petrobras’ 1965
report on activities not only revealed the success of Carmópolis, but also the discovery of
new fields in the traditional Recôncavo Baiano region. In 1966, the value of national oil
managed to surpass half that of consumption measured at import prices. The increased
domestic production of crude oil contributed considerably to this result (FGV, 2007).

8
In 1968 the Guaricema field was discovered, the first Brazilian field on the continental
shelf, in the Sergipe-Alagoas Basin, a fact that renewed hopes of self-sufficiency. At the
end of that year, national output was more than 160 thousand barrels per day and reserves
had reached 1,247.0 million barrels. But the country was still highly dependent on imported
oil, and the feeling was that there was little prospect of finding significant deposits of oil
and gas in onshore basins.
From 1969 to 1974, the first discoveries were made in the onshore and near offshore part of
the Espírito Santo Basin. More importantly, significant oil deposits were found in this
period in the offshore Campos Basin, currently responsible for over 80% of Brazil’s oil
production.
In 1969 the São Mateus field, in the Espírito Santo Basin (onshore) was discovered, and in
1973, with the first oil shock and the discovery of the Ubarana field in the offshore part of
the Potiguar Basin, investments increased to find offshore oil. This led in 1974 to the
discovery of the Garoupa field in the Campos Basin, a watershed for the national oil
industry, touching off a new cycle.
In the period from 1975 to 1984 production began to decline from the land basins and the
discoveries in the Campos Basin were confirmed, cementing that basin’s position as a new
producing area. In 1979 the second oil shock occurred due to the halting of Iranian
production after that country’s Islamic revolution led by Ayatollah Khomeini. The average
price per barrel shot up to the equivalent in today’s US$ 80. This shock spurred exploration
and production from offshore deposits in deeper waters, and Brazilian engineering, already
able to operate at depths greater than 120 meters, advanced to enable production at depths
greater than 400 meters, resulting in a series of important commercial discoveries. In 1975,
the first giant field was discovered in Brazil: the Namorado field in the Campos Basin. In
1976, the first risk contracts were signed between Petrobras and foreign companies (Shell,
Exxon, Texaco, BP, Elf, Total, Conoco, Marathon), as well as Brazilian ones (PauliPetro,
Azevedo Travassos and Camargo Corrêa, among others). The first discovery by one of

9
these companies occurred offshore in 1979 by Pecten: the Merluza natural gas field, located
in the Santos Basin.
In 1984 the Albacora field, another giant in the Campos Basin, was discovered at a depth
ranging from 400 to 1000 meters, and the even deeper Marimbá field, further confirmation
that Brazil’s offshore areas held important deposits of oil and gas. The same year, domestic
output reached 500 thousand barrels per day, meeting the government’s target for 1985 a
year in advance.
Between 1975 and 1984, Petrobras drilled 885 onshore and 750 offshore wells. The
companies under risk contracts, in turn, drilled 51 onshore and 64 offshore wells.
In the period from 1984 to 1997, the huge gas potential was confirmed of the deepwater
regions of the Campos Basin, and attention also turned to ultradeep waters. There were
important discoveries, such as the Barracuda and Roncador fields. The giant Roncador field
was discovered in 1996 and began producing in 1999. In this period, Petrobras drilled 930
wells on land and 549 at sea, while the companies with risk contracts drilled 71 onshore
and 10 offshore wells, attaining modest results. The goal of producing one million barrels
per day was achieved in 1997, the same year the monopoly was loosened.
The risk contracts were in effect from 1979 to 1988, when the promulgation of the new
Brazilian Constitution forbade new such contracts (because they had not had the effects the
government had hoped for). Only those under which commercial discoveries had been
made continued in effect. All told, under the risk contracts 122 onshore and 74 offshore
wells were drilled, in addition to 165,500 km of 2D seismic studies (ANP, 2004). From
1954 to 1997, the efforts of Petrobras alone along with those of companies operating under
risk contracts were responsible for discovering 209 onshore and 79 offshore fields,
scattered in eight sedimentary basins.

10
Figure 1 shows the evolution of proven Brazilian reserves, by location, between 1858 and
2003 and Figure 2 presents the evolution of output between 1954 and 2006, in thousands of
barrels per day. Figure 3 shows the evolution of national production, by area.

11
Figure 1. Evolution of proven Brazilian reserves and their location
between 1858 and 2006 Source: PETROBRAS, 2007.
Figure 2. Evolution of Brazilian production of petroleum and condensate between
1954 and 2006 Source: PETROBRAS, 2007.

12
Figure 3. Evolution of Brazilian production of petroleum and condensate, by area,
between 1954 and 2004 Source: ANP, 2004.
Table 1 summarizes the main results obtained by the oil industry between 1954 and 1997.
Table 1. Results of the 1954-1997 period and situation of Brazil on Dec. 31, 1997 Reserves/Production Proven Total Accumulated Output
Oil and Condensate (bbl) 7.11x10⁹ 14.22x10⁹ 4.73x10⁹
Natural Gas (m3) 227.65x10⁹ 435.46x10⁹ 134.14x10⁹
Source: ANP, 2004.
The next section discusses the process of relaxing the state monopoly in Brazil and its main
results for the industry and society.
13
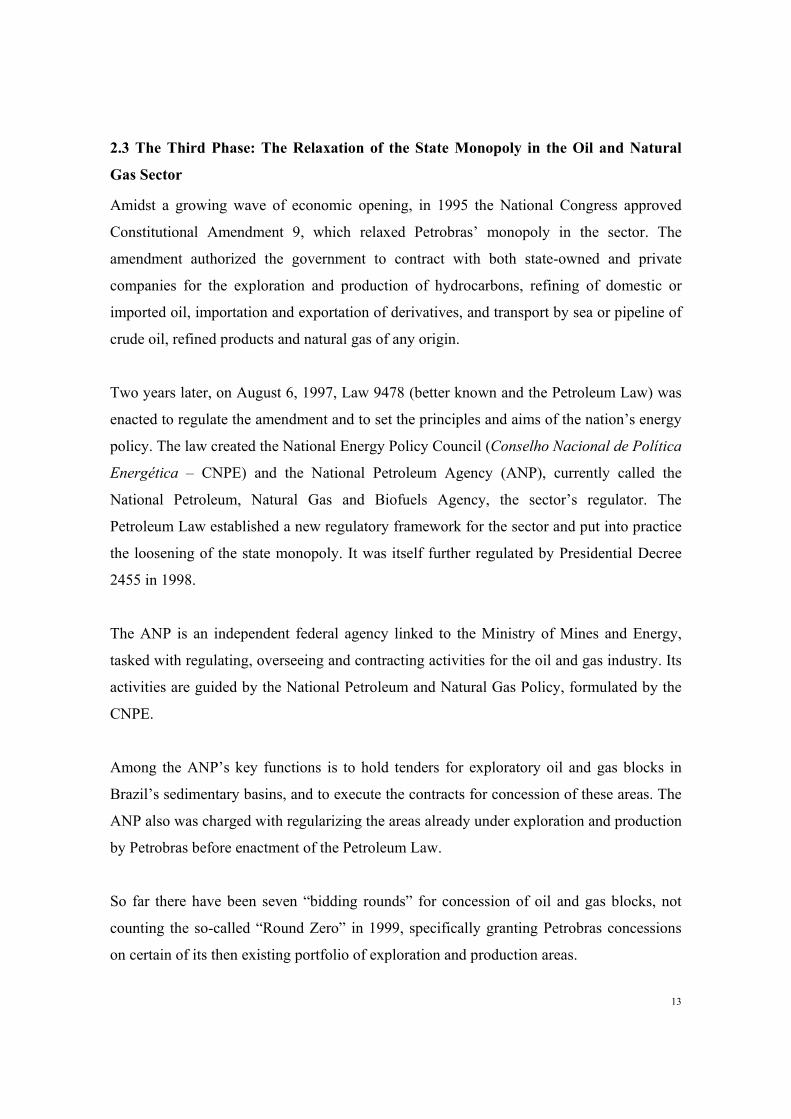
2.3 The Third Phase: The Relaxation of the State Monopoly in the Oil and Natural
Gas Sector
Amidst a growing wave of economic opening, in 1995 the National Congress approved
Constitutional Amendment 9, which relaxed Petrobras’ monopoly in the sector. The
amendment authorized the government to contract with both state-owned and private
companies for the exploration and production of hydrocarbons, refining of domestic or
imported oil, importation and exportation of derivatives, and transport by sea or pipeline of
crude oil, refined products and natural gas of any origin.
Two years later, on August 6, 1997, Law 9478 (better known and the Petroleum Law) was
enacted to regulate the amendment and to set the principles and aims of the nation’s energy
policy. The law created the National Energy Policy Council (Conselho Nacional de Política
Energética – CNPE) and the National Petroleum Agency (ANP), currently called the
National Petroleum, Natural Gas and Biofuels Agency, the sector’s regulator. The
Petroleum Law established a new regulatory framework for the sector and put into practice
the loosening of the state monopoly. It was itself further regulated by Presidential Decree
2455 in 1998.
The ANP is an independent federal agency linked to the Ministry of Mines and Energy,
tasked with regulating, overseeing and contracting activities for the oil and gas industry. Its
activities are guided by the National Petroleum and Natural Gas Policy, formulated by the
CNPE.
Among the ANP’s key functions is to hold tenders for exploratory oil and gas blocks in
Brazil’s sedimentary basins, and to execute the contracts for concession of these areas. The
ANP also was charged with regularizing the areas already under exploration and production
by Petrobras before enactment of the Petroleum Law.
So far there have been seven “bidding rounds” for concession of oil and gas blocks, not
counting the so-called “Round Zero” in 1999, specifically granting Petrobras concessions
on certain of its then existing portfolio of exploration and production areas.

14
The concession contracts with the winning bidders (often joint ventures between Petrobras
and private companies) cover two phases: exploration and production. The exploratory
phase lasts from two to eight years, during which the companies carry out work to acquire
further and more detailed geological and geophysical data than those made available before
bid presentation, as well as drill exploratory wells. If they make commercial discoveries,
the concessions shift to the production phase, during which they must make certain
minimum development investments and observe minimum local content requirements in
contracting materials and services.
The bidding rounds are the main point of planning expansion of the oil and gas sector under
the new model. Despite the significant participation of private players, current output and
projections for the short and medium terms still largely depend on the strategic planning of
Petrobras, which still is responsible for nearly all Brazilian oil and gas production.
Nevertheless, the new players have definitely increased upstream (exploration and
production) activity. During the monopoly period, although Petrobras was very active, it
did not have the capital to follow up on all the prospective areas in Brazil’s sedimentary
basins. So, the new entrants have helped fill a gap.
In analyzing the trends facing the national petroleum industry, particularly the evolution of
demand for refined products and gas in recent years, the situation of the country’s reserves
and the new institutional scenario, it is possible to forecast that oil and gas will continue
playing a crucial role the Brazil’s energy matrix. In 2006, petroleum represented 37.7% of
the total output of primary energy in the country, while natural gas chimed in with 9.6%
(MME, 2007).
In the new regulatory climate, the government’s aim is to keep the country self-sufficient in
oil and increase natural gas output by continued opening of the sector, through new
investments by private companies and restructuring of Petrobras. Self-sufficiency in oil was
attained in 2006 (PETROBRAS, 2006 and ANP, 2007). However, Brazil still needs to

15
import light crude to meet the demand profile for refined products and the characteristics of
its existing refineries, because most of its domestic oil is heavy.
The discoveries made so far from the seismic studies already conducted indicate that the
offshore basins, especially those located in deep waters, are the most promising. This
justifies the fact that the great majority of blocks offered in the bidding rounds have been
offshore. As stated earlier, over 80% of the country’s oil output currently comes from the
Campos Basin, made up of large deposits in deep and ultradeep waters. Of Brazil’s proven
and total reserves, 90% occur in offshore basins and 80% are at depths of greater than 400
meters (ANP, 2005).
2.4 Supply and Consumption of Oil and Natural Gas in Brazil
Despite Brazil’s large output of biofuels (particularly ethanol from sugarcane) and ample
hydroelectric generation, petroleum and its derivatives remain one of the main sources of
energy in the country, corresponding in 2006 to 37.7% of the total domestic energy supply
(the sum of internal supply of energy from renewable and nonrenewable sources). The
same year the internal supply of natural gas was responsible for 9.6% of this energy, a
figure that has been growing steadily for over a decade. Therefore, oil and gas together in
2006 accounted for nearly half of Brazil’s energy supply (MME, 2007).
The consumption of final energy from petroleum derivatives was equal to 42% of the
energy consumed by the country in 2006 (MME, 2007), a figure that has remained
relatively stable for the past decade. The sectors of the economy where that count most
heavily on this source are transportation (50.7% of total consumption in 2006) and
industry, that includes the energy sector (18.5% in the same year).
The same year, final energy consumption of natural gas was equal to 6.4% of the energy
consumed in the country. Again, the sectors most reliant on gas are industry and
transportation (in the latter case, in the land mode). The use of natural gas to power vehicles

16
(cars and buses) has been growing since the 1980s, mainly through conversion of engines
to run on vehicular natural gas (VNG). The consumption of natural gas in the transportation
sector was equal to 8.4% of the total, and in industry this figure was 31.3% in 2006 (MME,
2005). The figure below shows the breakdown of natural gas consumption in Brazil in
2006.
Figure 4. Structure of Natural Gas Consumption in Brazil in 2006
Source: Prepared by the authors based on BEN, 2007.
The increased consumption of oil and gas is closely linked to the country’s economic
development. In the past decade, consumption of oil and refined products has been growing
at roughly 4% a year, and over the same period consumption of natural gas has more than
doubled (at an average pace of 7.7% a year). Consumption of natural gas is expected to
continue growing strongly in coming years, mainly replacing firewood (including charcoal)
and coal, in line with a trend in many countries for increased use of natural gas.
While Brazil has reached self-sufficiency in oil, it is still a net importer of petroleum and
refined products taken together, since domestic crude does not fully meet the demand
profile for derivatives and domestic refining capability. Due to these factors, the country

17
exports some of its heavy oil production and imports lighter oils to mix with the domestic
product to meet the national refining technology and demand profile.
As mentioned, Brazil’s dependence on imported oil declined gradually over several
decades, and the country reached self-sufficiency in 2006. In the same year, by the reasons
mentioned before, Brazil imported 131,942 thousand barrels of crude oil, from different
countries and exported a volume of 134,336 thousand barrels.
In 2006, total imports of oil products were equal to 13,414.4 thousand of cubic meters,
while exports were 16.774 thousand of cubic meters. The following figure shows the
evolution of domestic petroleum production, consumption and external dependence (ANP,
2007). The figure below shows the Brazilian balance and its external dependence on crude
oil and oil products in 2006, accordingly to ANP’s data.
Figure 5. Evolution of External Dependence on Petroleum and Derivatives from 1997 to 2006 Source: ANP, 2007.

18
2.5 Blocks and Fields Conceded
Through the end of 2006, under ANP concessions there were 14 blocks still in the
exploratory phase, 67 fields under development for production and 265 producing fields
from Round Zero; 4 exploratory blocks from Round One; 13 exploratory blocks from
Round Two; 22 exploratory blocks from Round Three; 18 exploratory blocks from Round
Four; 24 exploratory blocks from Round Five; 57 exploratory blocks from Round Six; and
95 exploratory blocks from Round Seven.
Up to the same date, the ANP had accepted the return of 33 blocks declared not of
commercial interest, that is, exploratory blocks that did not reach the development or
production stages. Of these, 26 were returned in 1999; 3 in 2000; 44 in 2001; 18 in 2002;
14 in 2003, 9 in 2004, 6 in 2005 and 13 in 2006. The breakdown of returned blocks by
bidding round was 89 from Round Zero, 8 from Round One, 8 from Round Two, 13 from
Round Three, 2 from Round Four, 3 from Round Five and 10 from Round Six.
Therefore, at the end of 2006, the ANP administered concession contracts for 247
exploratory blocks, 66 fields under development and 264 producing fields.
Because of the ANP bidding rounds held between 1999 and 2006, 44 concessionaires
(including Petrobras) were conducting exploratory activities and 14 firms besides Petrobras
had producing fields, 8 of them in partnership with Petrobras.
Of the 247 exploratory blocks at the end of 2006, 73 were being explored only by
Petrobras, 100 by other companies without Petrobras, and the rest in partnership between
Petrobras and other firms.
Of the 66 fields under development at 2006 year-end, there was also a pronounced
concentration of activities in the hands of Petrobras, which operated alone in 45 of these
fields and participated in 14 partnerships. The following operating companies had joint
ventures with Petrobras: Esso, Shell, Manati, Norse, Rio das Contas, Chevron, Frade Japão,

19
Norsk, Kerr-McGee, Devon Energy, Sk Brasil, Unopaso, Recôncavo E&P, Queiroz
Galvão, Petrosynergy and Coplex.
Of the 264 producing fields at the end of 2006, 18 did not have participation by Petrobras, 8
were operated by joint ventures between it and other concessionaires and the others were
producing under concessions to Petrobras alone.
2.6 The Bidding Rounds for Exploratory Blocks
Since 1999, the ANP has held seven bidding rounds [update?], not counting the so-called
Round Zero, without competitive bidding, where the ANP granted to Petrobras 115 blocks
that were already being explored, 51 fields in the development stage and 231 producing
ones, for a total of 397 concession contracts. The total area covered by these fields was
more than 450,000 km2.
The First Bidding Round was held on June 15 and 16, 1999. All told, 21 bids were
received from 14 companies. Of the 27 blocks on offer, 12 were conceded, bringing in
roughly US$ 181 million, and the winning bidders committed to local content in the
acquisition of goods and services of an average of 25% in the exploratory phase and 27% in
the development phase. Eleven companies from six countries obtained concessions for at
least one block.
The Second Bidding Round took place on June 7, 2000. Of the 23 blocks offered, 21 were
conceded, brining in about US$ 261 million, with an average local content commitment of
41% in the exploration phase and 47% in the development phase.
The Third Bidding Round was held on June 19 and 20, 2001. Of the 53 blocks offered, 34
were conceded, bringing in US$ 240.8 million in signing bonuses, with an average local
content commitment of 28% in the exploration phase and 40% in the development phase.
The Fourth Bidding Round was held on June 19 and 20, 2002, during which 54 blocks
were offered (39 offshore and 15 onshore), distributed in 18 sedimentary basins:
Amazonas, Barreirinhas, Campos, Cumuruxatiba, Espírito Santo, Foz do Amazonas,

20
Jequitinhonha, Pará-Maranlion, Parnaíba, Pelotas, Pernambuco-Paraíba, Potiguar,
Recôncavo, Santos, São Francisco, São Luís, Sergipe-Alagoas and Solimões.
There were bids received from 29 companies from 15 countries. Of the blocks offered, 21
were conceded, corresponding to 17.5% of the total area offered. Fourteen companies won
the right to explore these 21 blocks, 6 of which were contracted to consortiums and 15 to
single companies.
The new concessionaires promised in their minimum exploration programs to drill 210 test
wells and to gather data from approximately 84 thousand km of seismic lines, within a
period of eight years.
The total amount raised in signing bonuses from the fourth round was US$ 33.9 million.
The average local content commitment in this round was 39.05% in the exploration phase
and 53.81% in the development phase.
The Fifth Bidding Round took place on August 19 and 20, 2003. There were 908 blocks
offered, of which 654 were offshore and 254 onshore, distributed in nine sedimentary
basins: Foz do Amazonas, Barreirinhas, Potiguar, Recôncavo, Jequitinhonha, Espírito
Santo, Campos, Santos and Pelotas.
Some important changes were introduced in the bidding system in the fifth round. In the
new model, the sedimentary basins were divided into sectors, which were in turn divided
into blocks of varying size, depending on their geographic location (onshore or offshore,
and in the latter case, in shallow or deep waters).
In an attempt to stimulate exploratory activity, the ANP did not define the minimum
exploratory program for each block in the invitation to bid. This was offered by the bidding
companies themselves, being one of the factors considered in awarding the concession,
along with the signing bonus bid and the proposal for local content.

21
Besides this, the ANP created different mandatory minimum local investments in
exploration and development for the various types of blocks, with the aim of stimulating
the development of the domestic industry for goods and services linked to the petroleum
sector. This local content rule was set at 30% for both the exploration and development
phases in deep waters. For shallow waters, it was 50% in the exploration phase and 60% in
the development phase, while for onshore blocks the percentage was 70% for both phases.
Of all the blocks offered, 101 were contracted to six companies, covering an area of 21,951
km2, corresponding to 13.5% of the total area offered. The amount raised in signing
bonuses was US$ 9.2 million.
The new concessionaires promised to spend at least R$ 350 million in their minimum
exploratory programs, divided into 33,671 Work Units (under a system of exploratory work
equivalence created as of the fifth round).
The Sixth Bidding Round was held on August 17 and 18, 2004, with 154 blocks conceded
(39,657 km²) to 19 companies, out of 913 blocks offered, of which 619 were offshore and
294 onshore, distributed in 12 sedimentary basins: Pelotas, Campos, Santos, Espírito Santo,
Jequitinhonha, Camamu-Almada, Sergipe-Alagoas, Barreirinhas, Pará-Maranlion, Foz do
Amazonas, Recôncavo and Potiguar.
Just as in the fifth round, the basins were divided into sectors and further into blocks.
However, the blocks selected for the sixth round were subject to three exploration models:
blocks in mature basins, blocks in new frontier basins and blocks with high potential.
The ANP established that the minimum exploratory programs would last from three to
eight years, and along with the signing bonus price, local content was maintained as one of
the factors in evaluating the offers. But the ANP changed the minimum percentages of
mandatory local investment in the exploration and development phases in relation to the
fifth round. For the sixth round, the percentage for the exploration and development phases
was set between 30% and 70% according to the operational qualification required for the

22
block. The companies were classified as “A”, “B” and “C” operators, with respective
percentages of, 30%, 50% and 70% for exploration and 30%, 60% and 70% for
development.
Of the blocks offered, 154 were granted, to 19 companies, covering an area of 36,657 km2,
corresponding to 18.1% of the area tendered (202,739 km2).
The new concessionaires pledged in their minimum exploratory programs to carry out
131,137 Work Units (under the system first established in the fifth round), which translated
into estimated exploration investments of R$ 2.05 billion. The total amount raised in
signing bonuses in the sixth round was US$ 221.7 million.
The Seventh Bidding Round took place on October 17-19, 2005, with a total of 194,651
km² offered, divided into Part A and Part B, as follows:
• Part A – 251 blocks with exploratory risk (a total of 194,651 km² - 186,916 km²
onshore and 3,066 km² offshore in shallow waters and 4,669 km² in deep waters);
• Part B – 16 inactive areas with marginal accumulations (88 km², all onshore).
Of the 1,134 Part A blocks offered, 251 were auctioned off, and 16 of the 17 blocks in Part
B areas. Of the 116 companies eligible to bid, 85 presented offers individually or through
consortiums, of which 41 were successful and signed concession contracts. The amount
taken in from signing bonuses was R$ 1.09 billion, nearly all in Part A blocks (only R$ 3
million was paid for inactive and marginal accumulation areas (Part B). In dollars, the total
was US$ 425.4 million.
The minimum exploratory program for blocks with exploratory risk (Part A) totaled
195,741 Work Units, permitting the ANP to estimate minimum exploratory investments of
around R$ 1.8 billion over the following six years. For the inactive and marginal areas the
figures were 6,182 Work Units, leading to an estimate of R$ 62 million in investments.

23
The Eight Bidding Round took place on 28-29th November, 2006, and 284 blocks were
offered, in seven sedimentary basins: Barreirinhas, Espírito Santo, Pará-Maranhão, Pelotas,
Santos, Sergipe-Alagoas and Tucano-Sul. There were 40 blocks in high potential areas, 148
blocks in new exploratory frontiers offshore areas, where there were technological barriers
to be faced, 47 blocks in new exploratory frontiers onshore areas and 49 blocks in onshore
mature areas. Due to a legal decision, the Eight Bidding Round was suspended, and for this
reason there are not final available results.
The Ninth Bidding Round took place on 27th November, 2007 and offered 271 blocks in a
total area of 73 thousand square meters. These areas were located in nine sedimentary
basins, Campos, Espírito Santo, Pará-Maranhão, Parnaíba, Pernambuco-Paraíba, Potiguar,
Santos, Recôncavo e Rio do Peixe. Initially, 67 oil companies were qualified (32 Brazilian
companies and 35 from other countries) and 42 took part of the Bidding Round. Of the
blocks offered, 117 were granted by 24 operator companies. Other twelve enterprises took
part in winner consortia. The amount raised in signing bonuses was more than US$ 1
billion, a Brazilian record. The total sum of the work programs offered by the winner
companies was equal to 169,436 Work Units, value that can generate more than 0.5 million
of dollars in local investments.
The table below contains some information about these bidding rounds, and the chart
shows the companies involved and their countries of origin.

24
Table 2. Characteristics of the ANP Bidding Rounds Round First
(1999) Second (2000)
Third(2001)
4th (2002)
5th (2003)
6th (2004)
7th (2005)
8th (2006)††
9th
(2007) Blocks Offered 27 23 53 54 908 913 1,134 284 271
Blocks Contracted 12 21 34 21 101 154 251 38 117 Onshore Blocks
Contracted 0 9 7 10 20 89 n.a. n.a. 65
Offshore Blocks Contracted
12 12 27 11 81 65 n.a. n.a. 52
Area Contracted (km2)
54,660 48,074 48,629 25,289 21,951 39,657 194,739 11,890 Variable
Offshore Area Contracted
54,660 37,846.7 46,266 14,669 21,254 36,811 7,735 n.a. Variable
Sedimentary Basins 8 9 12 18 9 12 18 n.a. 9 Winning Bidders 11 16 22 14 6 19 41 n.a. 36 New Operators 6 8 8 5 1 n.a. n.a. 11 Average Local
Content – Exploratory Phase
25% 42% 28% 39% 78.8% 85.7%* 74%** n.a. 69%
Average Local Content –
Development and Production Phase
27% 48% 40% 54% 85.6% 88.8%* 81%** n.a. 77%
Minimum 2D Seismic Studies (km)
43,000 45,850 44,700 17,000 83,700 Variable Variable n.a. Variable
Minimum Number of Exploratory Wells to
Be Drilled
58 96 136 83 210 Variable Variable n.a. Variable
Signing Bonus (US$ million‡‡) 181.0 262 241 34 9 222 485 n.a. 1.141
Minimum Investment in the First
Exploratory Period (US$ million) of Three
Years)
65 60 51 28.5 121*** 681*** 828.9*** n.a. 739
*Weighted average as of the Fourth Round.
** Only exploratory blocks (marginal accumulations with local minimum content of 70%)
***Amounts in dollars at the exchange rate on the auction date, according to Work Units.
Source: Prepared by the authors based on ANP, 2008.
Chart 1. Oil and Gas Companies Active in Brazil at the End of 2004
Company Country of Origin Arbi
Amerada Hess Aurizônia
Brazil United States
Brazil †† Canceled due to an injunction. ‡‡ These amounts are in dollars at the exchange rate on the auction date and have not been adjusted to 2006 dollars.

25
Brastech BHP Billiton British Gas
British Petroleum Chevron Texaco
Devon El Paso EnCana Eni Oil
Exxon Mobil Kerr-McGee
Lasa Maersk
Marítima Newfield Partex
Petrobras Petrogal
Petrosinergy Potióleo
Queiroz Galvão Repsol – YPF
Recôncavo Shell
Starfish Statoil
TotalFinaElf Unocal
W. Washington Wintershall
Brazil Holland
United Kingdom United Kingdom
United States United States United States
Canada Italy
United States United States
Brazil Denmark
Brazil Canada Brazil Brazil
Portugal United States
Brazil Brazil
Spain/Argentina Brazil
UK/Holland Brazil
United States France
Germany United States
Germany Source: ANP, 2007.
2.7 Brazilian Reserves of Petroleum and Natural Gas
According to data from the International Energy Agency (IEA), Brazil has the third largest
remaining petroleum reserves, after Venezuela and Mexico, equivalent to 8.9 billion
barrels. According to the US Geological Service, Brazil also has around 47 billion barrels
of undiscovered recoverable oil equivalent and 8 billion barrels of undiscovered
recoverable natural gas liquids, nearly all located in offshore fields (USGS, 2000).

26
There are 29 sedimentary basins in Brazilian territory, occupying an area of 5.7 million
km2, of which 4.8 million km2 are on land and 1.6 million km2 at sea. Among these basins,
nine are currently producing oil and gas, with reserves on the order of 9.9 billion barrels of
oil equivalent (boe). However, the distribution of Brazil’s reserves, as is usual in the world,
is highly asymmetric, and the Campos Basin holds 80% of the country’s reserves (2006
figures§§), as will be seen below.
At the end of 2006, Brazil’s total petroleum reserves were estimated at 18.2 billion barrels,
reflecting an annual growth rate of 2.8% over the preceding ten years. Proven reserves
amounted to 12. billion barrels the same year (3.5% higher volume than in 2005),
representing 67.0% of total reserves, putting Brazil in 17th place in the world ranking of
proven oil reserves, the same position as the year before.
Of these reserves, 92.6% were located offshore, particularly off the coast of the state of Rio
de Janeiro (86.6% of proven offshore reserves), and 7.4% were onshore.
In 2006, the most significant growth in proven reserves was offshore of the state of Espírito
Santo, which increased by 14.2%.
Regarding natural gas, the proven reserves were 347.9 billion m³ in 2006, which
represented 59.1% of the total gas reserves in Brazilian territory (588.6 billion m³). From
2005 to 2006, the total volume of reserves grew 29.5%, and between 1997 and 2006, yearly
growth averaged 4.8%.
Similar to petroleum, most proven natural gas in Brazil is found offshore (78.6%), with Rio
de Janeiro’s waters being the standout, concentrating 47.3% of national volume, followed
by Amazonas, whose land deposits represent 15.3% of proven national reserves. The
§§ Recently huge new discoveries have been announced in other basins, but it is still too soon to have a clear estimate of their size.
27
dispersal of gas throughout the country does not follow that of oil. The latter is more
concentrated in the country’s Southeast region.
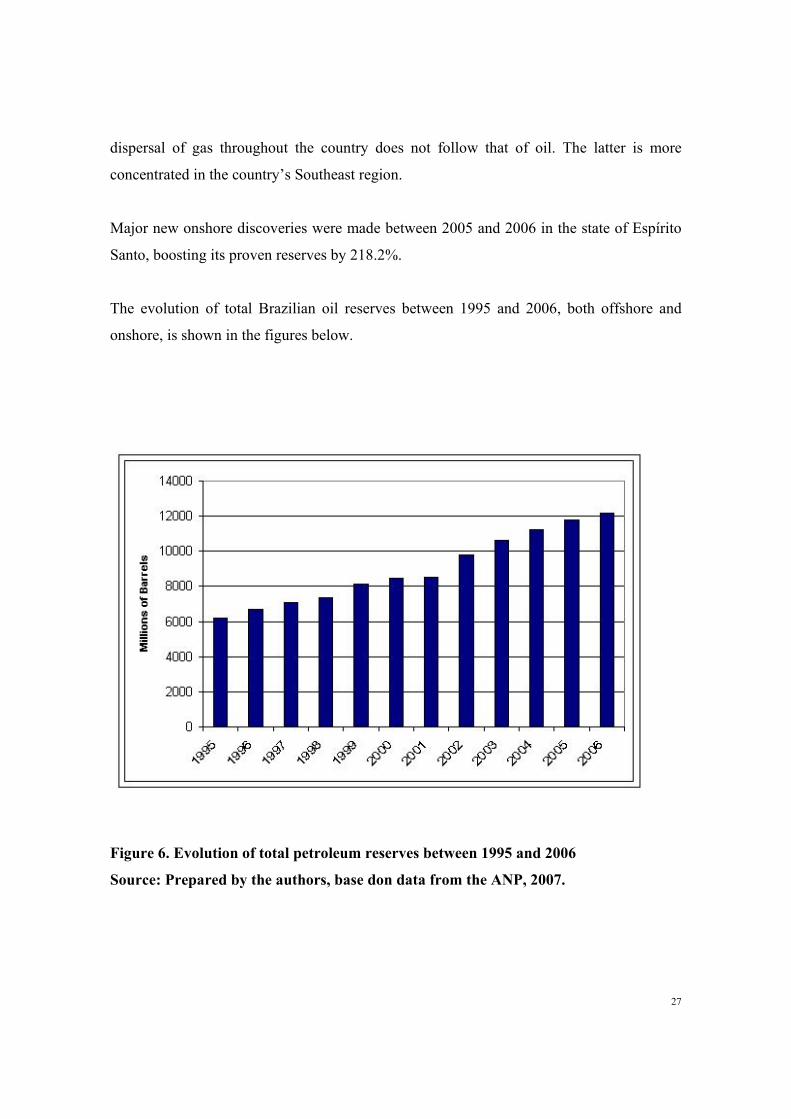
Major new onshore discoveries were made between 2005 and 2006 in the state of Espírito
Santo, boosting its proven reserves by 218.2%.
The evolution of total Brazilian oil reserves between 1995 and 2006, both offshore and
onshore, is shown in the figures below.
Figure 6. Evolution of total petroleum reserves between 1995 and 2006
Source: Prepared by the authors, base don data from the ANP, 2007.

28
Figure 7. Evolution of proven petroleum reserves, by location, between 1995 and 2006
Source: Prepared by the authors, based on data from the ANP, 2007.
Knowledge of Brazilian hydrocarbon reserves has been expanding at a rapid pace in recent
years, leading to the discovery of major new deposits in deepwater fields.

29
2.8 National Output of Oil and Natural Gas
In 2006, there were 8,287 wells producing oil and natural gas, 3.6% more than in 2005. The
onshore wells, representing 90.8% of the total number, increased by 3.4% in the period,
while the offshore wells (9.2% of the total) increased by 5.4% between 2005 and 2006.
The same year, daily national output of petroleum (including crude oil and condensate but
not including natural gas liquids (NGL), schist oil, LPG and C5+) was 1.7 million barrles
(628.8 million barrels a year), an increase of 5.5% over 2005. Between 1997 and 2006,
production grew by an annual average of 8.3%, making Brazil the world’s 16th largest oil
producer in 2006 (including crude oil, condensate and NGL).
The reserves/production ratio of natural gas (R/P) fell from 23.2 years in 1997 to 19.4 years
in 2006. On average, this index fell by 2.0% a year in the previous ten years.
Most national output of petroleum (including NGL) came from offshore fields, responsible
for 88.7% of total output. The state of Rio de Janeiro was responsible for 94.9% of offshore
production and 84.2% of national output. In 2006, this state once again registered a
substantial increase in petroleum production of 5.6%, the highest increase of any state.
Over the preceding ten years, Rio de Janeiro’s petroleum production grew by an average of
10.4% a year.
However, in 2006 the greatest increase in offshore petroleum production was in waters off
the coast of the state of Espírito Santo, which jumped by 181.9%. This state’s share of
national production grew 3.6% that year 2006. In the opposite direction, the state of Paraná
experienced the largest drop in production in 2006 (-36.2%), which reduced its share of
national petroluem output to 0.3% in 2006.

30
On land, the state of Rio Grande do Norte was the largest producer, concentrating 28.8% of
onshore output in 2006, although its total production (offshore and onshore) represented
only 3.8% of the national figure.
Between 1997 and 2006, national output of natural gas grew by an average of 6.8% a year,
reaching 17.7 billion m³ in 2006, adding the volumes of gas reinjected, flared off, lost,
consumed in production activities, refined, processed and transported, as well as the
volume of condensate in the form of NGL. The volume of natural gas reinjected, which
decreased in 2005, rose by 6.2% in 2006. From 1999 to 2006 the volume of gas reinjected
grew by an average of 10.3% a year, while the amount flared off and lost went down by
25.2% in 2006 in relation to 2005. Between 1999 and 2006, there was an yearly average
decline of 2.9% in the volume of natural gas flared off and lost.
In 2006, Brazil ranked 35th in the world in natural gas production. This ranking does not
consider the amount of gas flared off, lost and reinjected.
Offshore fields were responsible for 62.4% of the country’s natural gas output in 2006.
Offshore production rose 7.0% from 2005 to 2006, while onshore production fell 9.7% in
the same period. As for oil, the state of Rio de Janeiro was the leading producer of natural
gas, concentrating 46.4% of total national volume and 74.4% of total offshore production.
The second leading producing state was Amazonas, with 19.1% of total national output and
50.7% of onshore volume.
Of the total volume of natural gas produced in 2006, 1.9 billion m³ (10.5%) was flared off
and lost and 3.2 billion m³ (17.9%) was reinjected. The volume of gas flared off and lost,
after falling for three consecutive years, grew in 2006 by 25.2%. In the fields with gas
associated with petroleum, part of the gas (if not reinjected aiming to increase oil recovery)
does not have a consumer market near enough to be profitable, so it winds up being flared
off. Production of gas not associated with oil increased by 3.2% in 2006. In fields with non-
associated natural gas, all the infrastructure is aimed at extraction, so the rates of flaring
and loss are minimized.

31
Figure 8 shows the evolution of total volume of crude oil between 1977 and 2003, broken
down by origin (onshore and offshore, in waters less and more than 400 meters deep), as
well as Petrobras’ targets until 2009.
[Thousand bpd / Onshore / Offshore < 400 m / Offshore > 400 m / Target]
Figure 8. Distribution of national output of crude oil by location of reserve
Source: PETROBRAS, 2004.
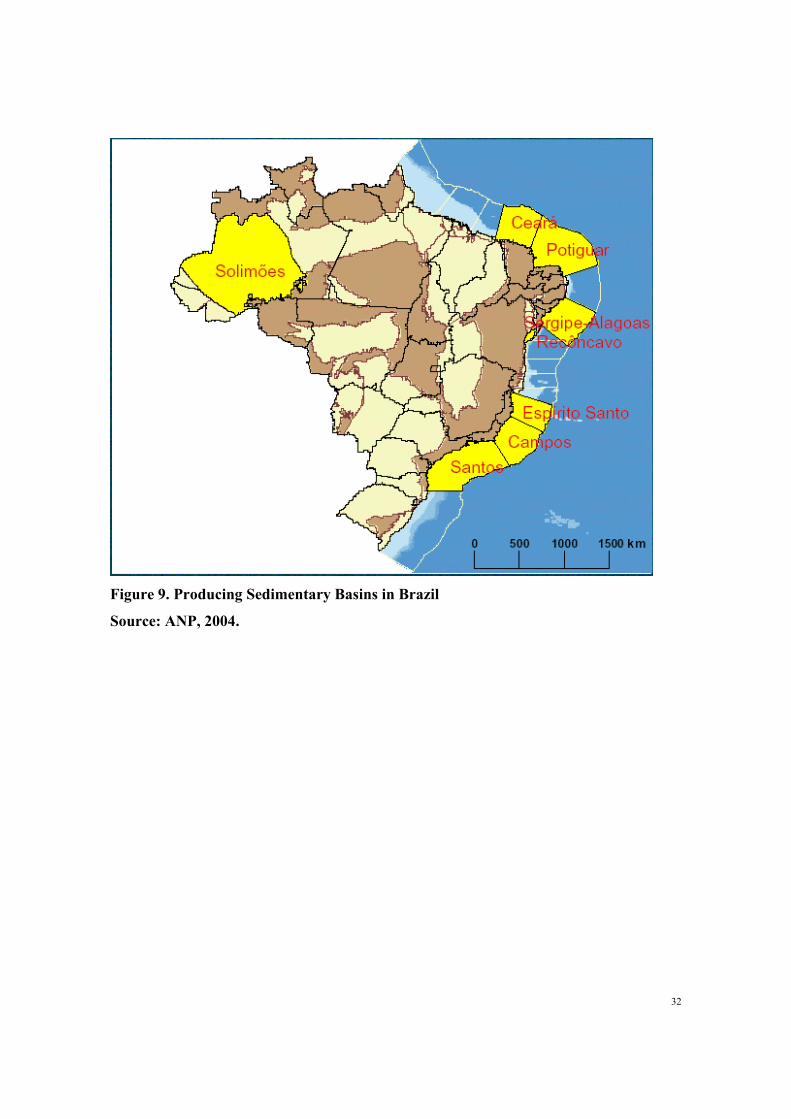
32
Figure 9. Producing Sedimentary Basins in Brazil
Source: ANP, 2004.

33
Figure 10 shows the evolution of petroleum production, by location onshore or offshore,
between 1995 and 2006.
Figure 10. Evolution of petroleum production by location between 1995 and 2006
Source: Prepared by the authors based on data from the ANP, 2007.

34
Figure 11 presents the evolution of the volume of petroleum produced in Brazil between
1954 and 2006.
Figure 11. Evolution of national petroleum output between 1954 and 2006
Source: Prepared by the authors based on data from Petrobras, 2007.

35
The figure below shows the evolution of natural gas output in Brazil between 1954 and
2006.
Figure 12. Evolution of production of natural gas in Brazil between 1954 and 2006
Source: Prepared by the authors based on data from Petrobras, 2007.

36
The figure below shows the evolution of the reserves/production indicator for natural gas
between 1995 and 2004.
Figure 13. Evolution of the reserves/production indicator for natural gas between
1995 and 2006
Source: Prepared by the authors from data from the ANP, 2007.

37
Figure 14. Evolution of natural gas production by location between 1995 and 2006
Source: Prepared by the authors from data from the ANP, 2007.

38
Figure 15. Maintenance of Self-Sufficiency
Source: Petrobras, 2007
Figure 16. Main Oil Production Projects of Petrobras Source: Petrobras, 2007

39
Figure 17: Main Natural Gas Production Projects of Petrobras in Brazil
Source: Petrobras, 2007.

40
Figure 18: Main Projects of Petrobras for Delivery of Natural Gas in Brazil
Source: Petrobras, 2007.
3. Oil and Natural Gas Pricing Policy in Brazil
This section examines the pricing policies and structures followed for petroleum derivatives
and natural gas in Brazil. Because of the differences in pricing policies, both over time and
due to the structure of the industries, the study looks at the petroleum derivatives and
natural gas separately.
3.1 Evolution of the price policy for petroleum derivatives
Until the 1990s, the prices of products refined from oil were regulated by the government
as an economic policy instrument, with prices adjusted at levels below inflation. The policy
was to set the prices of basic derivatives (diesel oil, fuel oil and LPG) below true market
rates as a way to minimize the costs for the industrial, transport and residential sectors. This
was enabled by passing the cost to the price of gasoline, a product basically used for private
transportation, with a lesser impact on the productive chain and hence on inflation
(SATHLER, 2000).

41
There was a change in the 1990s in the institutional framework of the Brazilian petroleum
industry, through a series of new laws and regulations. The prices of refined products were
gradually deregulated, and finally freed of all controls in January 2002.
Therefore, 1990 is a convenient dividing line to examine the evolution of the pricing
policies on oil derivatives.
3.1.1 Evolution of the price structure before 1990
The first effort at a government pricing policy for petroleum derivatives in Brazil dates to
1938, when Decree-Law 538/38 created the National Petroleum Council (Conselho
Nacional de Petróleo -CNP). One of its duties was to set the maximum and minimum
limits for the sale prices of refined products (imported or domestic).
When Petrobras was created by Law 2004 in 1954, there was a redistribution of functions,
and the responsibility for carrying out the policy on final prices of derivatives was entrusted
to the CNP (which was only disbanded in 1990.
In 1956, the government established the first criteria for derivatives price formation through
Law 2975/56, through a system of price parity between national products at the refineries
and the counterpart imported products at the destination ports. Thus, prices were not
uniform throughout the country, and the transport costs (by truck or train) were set by the
CNP (ANP, 2001a).
Until the mid-sixties, the prices of refined products remained tied to the behavior of the
international market, understandable because of Brazil’s heavy dependence on imports of
oil and derivatives.
At the start of the 1950s, 96% (8.8 million m³) of the refined products consumed in Brazil
were imported and the price of crude oil was maintained at low international. Thus,
Petrobras instituted a policy of building and expanding domestic refineries to increase the
volume of derivatives processed*** in the country. The success of this initiative can be
measured by the reduction of refined products imported, which fell to only 5% (1.17
million m³) in 1969 (ARAGÃO, 2005).
*** At the end of the 1960s, Brazil had eight refineries in operation: Landulpho Alves (Rlam), which started producing in 1950; Capuava (Recap), 1954; Presidente Bernardes (RPBC), 1955; Manaus (Reman), 1956; Duque de Caxias (Reduc), 1961; Lubrificantes e Derivados de Petróleo do Nordeste (Lubnor), 1966; Gabriel Passos (Regap), 1968; and Alberto Pasqualini (Refap), 1968.

42
With the successful expansion of the country’s refining capacity and supply of domestic
demand for derivatives by Petrobras, the price determination criteria was altered in 1964,
through Law 4452/64. The new criterion established a new component, called the
“realization price” (ex-refinery price), which was given for each derivative produced in the
country periodically by the CNP, by multiplying the coefficients by the weighted average
CIF cost of imported oil, converted into Brazilian currency (ANP, 2001a).
This system was again changed in 1966 through Decree-Law 61/66, which established that
the realization prices had to be related to the average refining cost, at a level to protect
Petrobras’ refining margins. An average realization cost was defined, equal to the
realization price of gasoline. Hence, the prices of LPG, diesel and fuel oil were fixed based
on a scale in relation to that of type A gasoline††† (Billwiller, 2002).
In 1977, pursuant to Decree-Law 1599/77, gasoline ceased being the reference for
calculating the prices of other refined products. The new system gave policymakers more
leeway to adjust prices of all derivatives according to economic and social objectives.
In this period, the cost of petroleum to the refinery was determined by the cost of imported
oil, due to the low market share of domestic oil. The government, through the CNP, started
to raise the prices of refined products to permit Petrobras to transfer increased in the price
of imported oil to its average realization price. As in the past, gasoline suffered the greatest
price hikes, while the prices of other derivatives were increased less.
The two oil shocks of the 1970s exposed the fragility of Brazil’s model, since in 1973 and
1979, respectively, the country imported 79% and 86% of its oil (BP, 2006). The result for
Brazil was a sharp rise in the outflow of foreign exchange to pay for imported oil in the
1980s. In 1982 and 83, these expenditures reached 44% of the total of imports, a figure that
went down gradually to 15.6% by 1989 (TOLMASQUIM et al., 2000), due to the national
program to replace gasoline with ethanol as fuel for cars.
Until the second oil crisis, the policy of cross-subsidies of derivatives prices was focused
on controlling inflation (which was rampant for most of the 1980s and the first half of the
90s). After 1979, the price changes for refined products also became instruments used by
the government to adjust the external accounts. Starting in 1980, the government created a
††† Type A gasoline is without ethanol blended in. All gasoline sold at the pump in Brazil contains roughly 25% ethanol. This blend is called type C gasoline. Class B gasoline (leaded) is no longer sold.

43
mechanism known as the “petroleum account”, which permitted Petrobras not to pass
through increases in its costs to the prices of derivatives, without penalizing the company.
The shortfall was made up by the government.
Table 13 below shows the evolution of the prices of gasoline, fuel oil, LPG and diesel over
the period from 1978 to 1985.
Table 3 – Price Index of Refined Products to Consumers
Gasoline Diesel Fuel Oil LPG 1978 100.0 100.0 100.0 100.0 1979 101.7 110.6 122.1 84.7 1980 144.4 113.7 222.2 69.0 1981 143.8 135.7 295.4 66.8 1982 127.2 135.4 266.2 62.5 1983 118.1 137.5 293.2 67.4 1984 110.3 139.2 307.7 72.7 1985 100.2 122.5 281.2 65.2
Source: Billwiller (2002).
As can be seen, fuel oil increased in price most among derivatives, followed by gasoline and diesel.
The price of LPG was adjusted below inflation, chiefly because it is used for cooking by most of the
population, particularly the lower classes‡‡‡.
Therefore, during the period from 1954 to 1990, the fuel pricing policy was marked by heavy
government intervention, based on attempts to equalize prices throughout the country, control
inflation and soften the impact on the poorer classes, through a system of cross-subsidies (ANP,
2001a).
3.1.2 Price Policy after 1990
The deregulation of the fuel supply sector in Brazil began in the 1990s and included, among
other measures, liberation of prices, margins and transport costs along the entire productive
chain. The policy of uniform national prices started to be abandoned with the following
steps: (1) removal of transport subsidies from the refineries to distribution bases, and of the
final price of some derivatives, such as LPG; (2) liberation of the retail prices, within a cap
price (i.e., allowing service stations to compete on price) (SINDICOM, 2004).
‡‡‡ Distribution of piped gas (either manufactured gas, or now increasingly natural gas, is very limited in Brazil, confined mainly to middle and upper class areas of large cities.

44
According to Law 9478/97 (Petroleum Law), the prices of all derivatives had to be
completely deregulated within 36 months of its publication date. However, this deadline
was extended to December 31, 2001 by Law 9990 of June 2000.
In the transition period to fully deregulated prices, the Petroleum Law states: “the
adjustments and revisions of the prices of basic petroleum derivatives and natural gas
charged by the refineries and processing units shall be carried out according to the specific
directives and parameters established by joint act of the Ministries of Finance and Mines
and Energy.” (Art. 69, Law 9478/97). Also according to this law, the ANP took over the
functions previously exercised by the National Fuels Department (Departamento Nacional
de Combustíveis – DNC)§§§.
The start of the economic opening and alignment of national prices to the international
market was marked by issuance of MF/MME Joint Edict 3/98 on July 27, 1998, which
revoked the then existing system of price formation for refined products and established a
new price structure for crude oil and derivatives (ANP, 2001a).
Under the new system, the Ministry of Finance (MF) and Ministry of Mines and Energy
(MME), together with Petrobras, define an initial realization price for each refined product,
reflecting the company’s operating cost plus a profit margin. As of August 1, 1998, the
realization price of each derivative started to vary monthly, in function of international
market prices. This price is updated on the first of each month, according to the variation in
the exchange rate and the market prices of US Gulf, except in the case of LPG, which
follows the Mont Belvieu price.
Finally, starting on January 1, 2002, the fuels market in Brazil was totally deregulated,
permitting other companies to produce and sell refined products in the domestic market,
and to import and export them as well. Under this new policy, the prices at the refinery of
basic derivatives now follow the parameters of the international market.
Nevertheless, in the case of gasoline, diesel and LPG, there is a certain degree of inertia in
the pass-through of international market fluctuations to the domestic price. The prices of
petrochemical naphtha and aviation kerosene are adjusted monthly, according to the
variation of the international prices. For fuel oil there is no set frequency for price
adjustment (Araújo, 2006).
§§§ In 1990, the DNC replaced the CNP, pursuant to Decree-Law 99,180/90.

45
National realization prices (ex-refinery) of type A gasoline, diesel, aviation kerosene, LPG
and fuel oil are disclosed by the ANP. In the case of petrochemical naphtha, the prices are
negotiated by Petrobras and the large petrochemical complexes.
For comparison, the international benchmark prices for these derivatives are: US Gulf
Coast (USGC) market for gasoline, diesel, fuel oil (HS or LS****) and aviation kerosene;
Mont Belvieu (Texas) for LPG; and the Amsterdam-Rotterdam-Antwerp (Northeast Europe
- ARA) market for petrochemical naphtha.
We now focus on the three fuels with the greatest economic impact: gasoline, diesel and
LPG.
The figure below shows the evolution of the Brazilian and international ex-refinery price of
gasoline (Unleaded U.S. Gulf Coast) between 2002 and 2006.
Figure 19 – National and International Price of Gasoline
Source: Araújo (2006)
As can be seen, since 2004 there has been a generally widening gap between the domestic
and international price of gasoline. That year the Brazilian exchange rate began to
strengthen against the dollar (after having weakened sharply in the so-called crisis of
confidence during the changeover to the Lula administration), and was also marked by the
start of the run-up in the prices of petroleum and derivatives. For most of this period, the
domestic gasoline price has been below the international level.
**** High sulfur and low sulfur content, respectively.

46
According to Silva (2003), the behavior of gasoline in the post-deregulation period has
tended to exaggerate in prevention of entry. The national price has been below the export
parity level, meaning gains from exports greater than the prices obtained on sales in the
domestic market.
The graph below shows the evolution of the domestic and international ex-refinery price of
diesel (Number 2 U.S. Gulf Coast) for the period from 2002 to 2006. As can be seen, the
domestic price has behaved more smoothly, putting it alternately above and below the
international price. Given that the country is a net importer of this derivative, the price
policy is coherent with the economic orientation of Petrobras.
Figure 20 – National and International Price of Diesel
Source: Araújo (2006)
For formation of the international price of LPG, we used the prices of propane and butane
in the Mont Belvieu (Texas) market, considering a 50/50 ratio. The figure below shows the
evolution of this international price and the domestic ex-refinery price of LPG.
Figure 21 – National and International Price of LPG

47
Source: Araújo (2006)
Just as in the case of diesel, Brazil is also a net importer of LPG. As the figure shows, the
domestic price of LPG has been well below the international price since the middle of
2004. The reason, as mentioned earlier, is the great social impact of this product’s price,
particularly for low-income people, causing it to still be administered by the government.
This pattern persists when through 2007 ex-refinery prices of gasoline, diesel oil and LGP
have not been changed despite changes of respective international prices up to 70%.
Regarding the final retail prices of refined products, these are monitored and disclosed by
the ANP through weekly surveys. The table below shows the composition of the price of
gasoline to consumers. For the consumer price of LPG and diesel, see the appendix.
Table 4 – Composition of the Price of Gasoline and Fuel Alcohol
1) COMPOSITION OF THE PRICE OF TYPE "A" GASOLINE FROM THE
PRODUCER TO CONSUMER
A. EX-REFINERY PRICE (1)
B. CONTRIBUTION FOR INTERVENTION
IN THE ECONOMIC DOMAIN – CIDE (2)
C. PIS/PASEP AND COFINS (3)
C = (PIS + COFINS) x (1 –
REDUCTION INDEX (4))
D. PRICE WITHOUT ICMS D = A + B + C

48
E. PRODUCER ICMS (5) E = [(D / (1 - ICMS%)] – D
F. CALCULATION BASE FOR “FULL ICMS”
(6) F = D / (1 - ICMS%) x ( 1 + MVA%)
G. TAXPAYER SUBSTITUTION ICMS G = (F x ICMS%) - E
H. PRICE FROM THE PRODUCER H = D + E + G
2) COMPOSITION OF THE PRICE OF ANHYDROUS ALCOHOL
I. PRICE OF ANHYDROUS ALCOHOL (1
J. TRANSPORT COST (1)
K. PRICE OF ANYHDROUS ALCOHOL
[FROM THE DISTRIBUTOR OR
DISTILLERY?] K = I + J
3)COMPOSITION OF THE PRICE OF TYPE “C” GASOLINE FROM THE
DISTRIBUTOR
L. TRANSPORT OF TYPE “A” GASOLINE
TO THE DISTRIBUTION BASE (1)
M. DISTRIBUTOR’S ACQUISITION PRICE
(MIX) (7) M = [(H + L) x 0,75] + (K x 0,25)
N. DISTRIBUTOR’S MARGIN (1)
O. TRANSPORT FROM THE DISTRIBUTION
BASE TO THE SERVICE STATION (1)
P. CPMF ON DISTRIBUTION P = (M + N + O) x CPMF%
Q. PRICE FROM THE DISTRIBUTOR Q = M + N + O + P
4) COMPOSITION OF THE RETAIL PRICE OF GASOLINE
R. PRICE OF ACQUISITION FOR RESALE R = Q
S. RESALE MARGIN (1)
T. CPMF ON RESALE T = (R + S) x CPMF%
U. PUMP PRICE OF TYPE "C" GASOLINE U = R + S + T Note: The Brazilian tax system has two types of levies, taxes per se (impostos) and contributions
(contribuições). The revenue from the former goes into the general fund and from the latter is earmarked for
particular uses. CIDE is an industry-specific contribution to finance R&D in that industry. CPMF is the
provisional contribution on bank withdrawals/transfers/checks, which Congress recently refused to extend, so
49
it can now be ignored in the above formulas. ICMS is state value-added tax. The “taxpayer substitution”
ICMS is paid by the producer on behalf of the receiver, because it is easier to monitor ICMS at the refinery
than at the service station level. The “full ICMS” includes surcharges paid to state development funds. MVA
is margem de valor adicionado, or value-added margin. PIS/PASEP and COFINS are, respectively, the
Contribution to the Social Integration Fund and Contribution to Fund Social Security.
Source: ANP (2007)
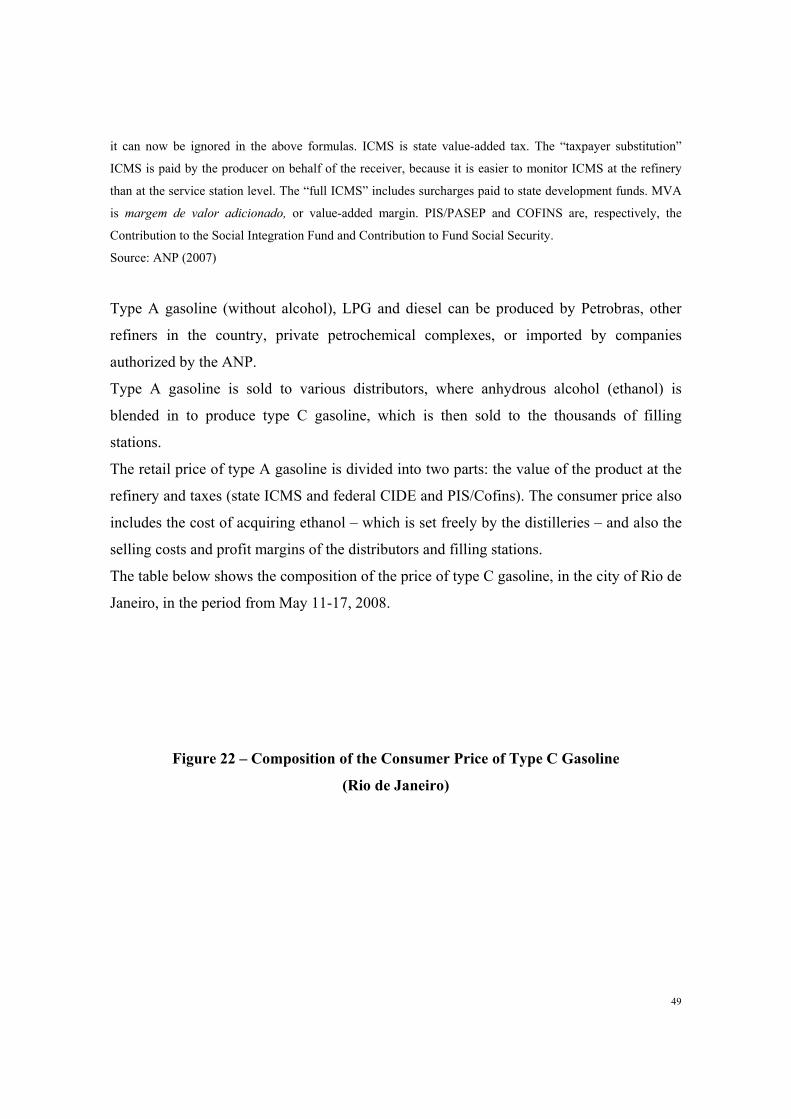
Type A gasoline (without alcohol), LPG and diesel can be produced by Petrobras, other
refiners in the country, private petrochemical complexes, or imported by companies
authorized by the ANP.
Type A gasoline is sold to various distributors, where anhydrous alcohol (ethanol) is
blended in to produce type C gasoline, which is then sold to the thousands of filling
stations.
The retail price of type A gasoline is divided into two parts: the value of the product at the
refinery and taxes (state ICMS and federal CIDE and PIS/Cofins). The consumer price also
includes the cost of acquiring ethanol – which is set freely by the distilleries – and also the
selling costs and profit margins of the distributors and filling stations.
The table below shows the composition of the price of type C gasoline, in the city of Rio de
Janeiro, in the period from May 11-17, 2008.
Figure 22 – Composition of the Consumer Price of Type C Gasoline
(Rio de Janeiro)

50
Source: Petrobras (2008)
Sale of LPG starts with the sale of the bulk product by the producer or importer to
distribution companies. The distributors, in turn, receive the fuel through pipelines and
resell part of this to the industrial segment, generally also in bulk, in tank trucks. The
remaining portion (generally the larger share) is sold directly in pressurized canisters to
commercial, residential and institutional customers (Petrobras, 2007). The most common
form sold to residential users is in canisters holding 13 kg. Household users make up about
80% of the LPG market nationwide (BEN, 2006).
The sale price of LPG represents the sum of the cost of the product plus state and federal
taxes (ICMS and CIDE, PIS/Cofins, respectively). The canister price includes the selling
costs and profit margins of the distributors and resellers. (Petrobras, 2007). The canisters
are returned empty for refilling and for sale to later customers, with a deposit calculated in
the price of the first canister, like the now fading practice for soft drink bottles.
Figure 23 – Composition of the Consumer Price of LPG

51
(Rio de Janeiro)
Source: Petrobras (2008)
In the case of diesel, Petrobras sells the product produced at its refineries to various
distributors. These in turn resell it to filling stations or to bus and truck fleet owners and
other large users, such as factories and farms. The large users can also buy directly from
Petrobras (Petrobras, 2007).
Just as for the other fuels, the price of diesel at the refinery includes the production cost
plus state (ICMS) and federal (CIDE, PIS/Cofins) taxes.
Figure 24 – Composition of the Consumer Price of Diesel
(Rio de Janeiro)

52
Source: Petrobras (2008)
The consumer prices of type C gasoline, diesel and LPG grew at an average yearly rate of
7.9%, 16.3% and 12.1%, respectively, between 2001 and 2006. The table below shows the
evolution of the average consumer prices, by region of the country.

53
Table 5 – Consumer Price of Type C Gasoline, Diesel and LPG, 2001 to 2006
Average Consumer Price
Country and Regions 2001¹ 2002 2003 2004 2005 2006
Type C Gasoline Average Consumer Price (R$/liter)
Brazil 1.741 1.735 2.072 2.082 2.312 2.541
North Region 1.913 1.856 2.212 2.259 2.553 2.691
Northeast Region 1.769 1.750 2.096 2.133 2.409 2.670
Southeast Region 1.706 1.704 2.023 2.023 2.259 2.483
South Region 1.759 1.777 2.157 2.163 2.459 2.641
Midwest Region 1.758 1.748 2.122 2.180 2.431 2.655
Diesel Average Consumer Price (R$/liter)
Brazil 0.876 1.041 1.452 1.471 1.731 1.864
North Region 0.927 1.094 1.540 1.570 1.820 1.995
Northeast Region 0.917 1.052 1.446 1.447 1.709 1.856
Southeast Region 0.857 1.025 1.430 1.450 1.722 1.853
South Region 0.844 1.038 1.457 1.492 1.770 1.893
Midwest Region 0.920 1.087 1.530 1.564 1.832 1.959
LPG Average Consumer Price (R$/kg)
Brazil 1.398 1.866 2.246 2.306 2.292 2.473
North Region 1.282 1.846 2.387 2.408 2.367 2.573
Northeast Region 1.278 1.845 2.252 2.399 2.345 2.456
Southeast Region 1.425 1.808 2.175 2.227 2.238 2.476
South Region 1.539 1.957 2.295 2.372 2.425 2.405
Midwest Region 1.541 1.951 2.376 2.394 2.379 2.573
Note: ¹Average prices of 2001 calculated based on prices between July and December
Source: ANP (2007).
3.2 Evolution of price policy for natural gas in Brazil
Since the enactment of Law 2004 in 1953 until Constitutional Amendment 9 in 1995, all
activity for exploration, production, processing and transport of natural gas was a monopoly
of Petrobras, which gave the company the power to define the markets and penetration of
natural gas in the country’s energy matrix. The only change during this period occurred in
1988, upon promulgation of the current Constitution, by which the states gained the power

54
to grant distribution concessions, usually to companies owned by the state governments
themselves (Costa, 2003).
Until 1999, the maximum sale price of natural gas to the state concessionaire distributors of
piped gas was determined by DNC Edict 24 of 1994. This edict established a parity of 75%
between the maximum sale price of natural gas for fuel and the price of fuel oil 1A, at the
primary distribution base, considering the energy equivalence between these two products.
The natural gas sale price did not separately identify the portion of the price for transport to
the delivery points.
Starting in 2000, the price of natural gas of domestic origin was regulated by MME/MF
Interministerial Edict 003/2000. The price has basically consisted of two components, one
the wellhead price, to remunerate the producer, and the other called the transport tariff††††,
to pay for moving the gas between producing and consuming areas. The price was the sum
of the two components, and the transport tariff was calculated by the ANP (ANP, 2001b).
Since 2002, with the deregulation of prices under the Petroleum Law, prices are no longer
controlled. Nevertheless, the above mechanism is still applied, which makes the subject of
the final market price complex (Costa, 2003).
For imported natural gas, the sale price to distributors was already liberated since the
issuance of the referred edict. The product price and transport tariffs in this case have been
freely negotiated between the parties.
Finally, there is a special price for thermoelectric plants under the Thermoelectricity
Priority Program (Programa Prioritário de Termeletricidade - PPT), pursuant to MME/MF
Interministerial Edict 176 of 2001. This establishes a maximum price for gas supplied to
thermopower plants regardless of origin (domestic or imported). In an attempt to make
feasible the thermoelectric projects planned under the PPT, which were mainly intended to
be supplied with imported gas (more expensive to distributors than national gas), an
†††† There are basically two types of pipeline transport of natural gas: firm transport service (serviço de transporte firme, or STF) and interruptible transport service (serviço de transporte interruptível, or STI). In the former type, the user contacts a reserve capacity in the pipeline and is then entitled to move a daily volume limited by this capacity. The latter service depends on the spare capacity of the pipeline (ANP, 2007).

55
average price was established based on a profile of 80% imported gas versus 20% domestic
gas (ANP, 2007).
The following table shows the evolution of the price of national and imported gas and gas
sold to thermoelectric plants since 2002.
Table 6 – Price of Natural Gas (wellhead + transport) in US$ (*4)/MMBTU) WELLHEAD + TRANSPORT US$(*4)/MMBTU
National
Thermal
Generation Imported
Quarter Year (*1) (*2) (*3)
First 2008 8.43 4.51 6.80
Fourth 2007 7.43 4.21 6.00
Third 2007 6.46 4.17 5.51
Second 2007 5.72 3.88 5.14
First 2007 4.72 3.93 5.28
Fourth 2006 4.62 3.95 5.48
Third 2006 4.58 3.77 5.41
Second 2006 4.55 3.65 5.15
First 2006 4.53 3.54 4.89
Fourth 2005 4.35 3.47 4.29
Third 2005 3.88 3.47 3.71
Second 2005 3.58 3.30 3.56
First 2005 3.33 3.15 3.56
Fourth 2004 3.19 2.97 3.39
Third 2004 2.98 2.82 3.39
Second 2004 2.92 2.84 3.39
First 2004 3.01 3.07 3.39
Fourth 2003 2.89 3.17 3.38
Third 2003 2.86 3.14 3.38
Second 2003 2.81 2.87 3.38
First 2003 2.40 2.24 3.38
Fourth 2002 2.29 3.49 3.03
Third 2002 2.06 3.19 3.01
Second 2002 1.79 2.74 3.16
First 2002 1.73 2.66 3.31
Notes: (*1) Natural gas sold as domestic: Unweighted average prices with PIS/COFINS and without
ICMS. (*2) Natural gas sold to thermal power plants: Unweighted average prices without
PIS/COFINS and ICMS (*3) Natural gas sold as imported: Unweighted average prices without
PIS/COFINS and ICMS. (*4) Commercial sale exchange rate with the dollar - PTAX SISBACEN.
Source: Petrobras (2008).

56
57
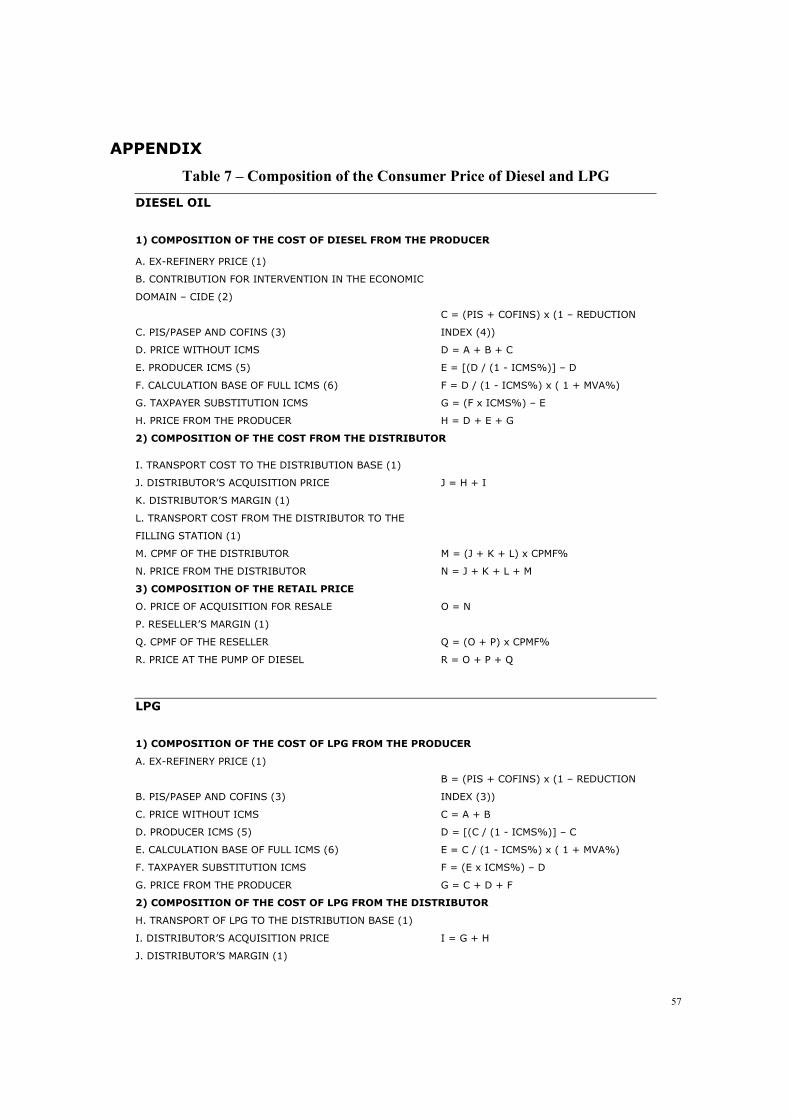
APPENDIX
Table 7 – Composition of the Consumer Price of Diesel and LPG
DIESEL OIL
1) COMPOSITION OF THE COST OF DIESEL FROM THE PRODUCER
A. EX-REFINERY PRICE (1)
B. CONTRIBUTION FOR INTERVENTION IN THE ECONOMIC
DOMAIN – CIDE (2)
C. PIS/PASEP AND COFINS (3)
C = (PIS + COFINS) x (1 – REDUCTION
INDEX (4))
D. PRICE WITHOUT ICMS D = A + B + C
E. PRODUCER ICMS (5) E = [(D / (1 - ICMS%)] – D
F. CALCULATION BASE OF FULL ICMS (6) F = D / (1 - ICMS%) x ( 1 + MVA%)
G. TAXPAYER SUBSTITUTION ICMS G = (F x ICMS%) – E
H. PRICE FROM THE PRODUCER H = D + E + G
2) COMPOSITION OF THE COST FROM THE DISTRIBUTOR
I. TRANSPORT COST TO THE DISTRIBUTION BASE (1) J. DISTRIBUTOR’S ACQUISITION PRICE J = H + I
K. DISTRIBUTOR’S MARGIN (1)
L. TRANSPORT COST FROM THE DISTRIBUTOR TO THE
FILLING STATION (1)
M. CPMF OF THE DISTRIBUTOR M = (J + K + L) x CPMF%
N. PRICE FROM THE DISTRIBUTOR N = J + K + L + M
3) COMPOSITION OF THE RETAIL PRICE
O. PRICE OF ACQUISITION FOR RESALE O = N
P. RESELLER’S MARGIN (1)
Q. CPMF OF THE RESELLER Q = (O + P) x CPMF%
R. PRICE AT THE PUMP OF DIESEL R = O + P + Q
LPG
1) COMPOSITION OF THE COST OF LPG FROM THE PRODUCER
A. EX-REFINERY PRICE (1)
B. PIS/PASEP AND COFINS (3)
B = (PIS + COFINS) x (1 – REDUCTION
INDEX (3))
C. PRICE WITHOUT ICMS C = A + B
D. PRODUCER ICMS (5) D = [(C / (1 - ICMS%)] – C
E. CALCULATION BASE OF FULL ICMS (6) E = C / (1 - ICMS%) x ( 1 + MVA%)
F. TAXPAYER SUBSTITUTION ICMS F = (E x ICMS%) – D
G. PRICE FROM THE PRODUCER G = C + D + F
2) COMPOSITION OF THE COST OF LPG FROM THE DISTRIBUTOR
H. TRANSPORT OF LPG TO THE DISTRIBUTION BASE (1)
I. DISTRIBUTOR’S ACQUISITION PRICE I = G + H
J. DISTRIBUTOR’S MARGIN (1)

58
K. TRANSPORT FROM THE DISTRIBUTION BASE TO
RESELLER (1)
L. CPMF OF THE DISTRIBUTOR L = (I + J + K) x CPMF%
M. PRICE FROM THE DISTRIBUTOR M = I + J + K + L
3)COMPOSITION OF THE RETAIL PRICE
N. PRICE OF ACQUISTIION FOR RESALE N = M
O. RESELLER’S MARGIN (1)
P. CPMF OF THE RESELLER P = (N + O) x CPMF%
Q. RETAIL PRICE OF LPG Q = N + O + P
Remarks:
(1) Amounts not subject to table prices.
(2) Pursuant to Law 10,865/0.
(3) pursuant to Decree 5059/04.
(4) Rates established by state governments.
(5) Value added margin (MVA) established in ICMS Conventions among the states, or average price to
final consumer, established by acts of the Permanent Technical Commission on ICMS (COPTEPE).
The CIDE rate was reduced to zero by Decree 5.060/04.
4. Corporation Development of Petrobras
This section presents an evolution of the corporation development of Petrobras from a
typical state-owned structure towards open corporation.
First it is worth to mention that, based on consolidated revenues in 2006, Petrobras is the
largest company in Brazil and one of the largest oil and gas companies in Latin America. In
2006 sales of products and services reached US$ 93.893 million, and net operating
revenues were US$ 72.347 million, producing a net profit of US$ 12.826 million.
Secondly, the Company is involved in a wide range of oil and gas activities, covering the
following areas of operations:
· Exploration and Production –E&P activities include exploration, development and
production of oil and gas fields in Brazil.
· Supply –supply activities take in refining, logistics, transportation and purchase of
petroleum, as well as purchase and sale of refined products and fuel alcohol. Besides this, it
also has a division producing petrochemicals and fertilizers.
· Distribution –distribution of petroleum derivatives and alcohol in Brazil through a wholly
owned subsidiary, Petrobras Distribuidora S.A. - BR .

59
· Natural Gas and Energy –purchase, sale and transport of natural gas produced in Brazil or
imported. Also activities for domestic commercialization of electricity and investments in
companies that transport domestic natural gas, natural gas distributors and thermoelectric
plants.
· International – includes interests in all the above areas (E&P, supply, distribution and gas
and energy) in the following countries: Angola, Argentina, Bolivia, Colombia, Ecuador,
Equatorial Guinea, Iran, Libya, Mexico, Nigeria, Paraguay, Peru, Tanzania, Turkey, United
States, Uruguay and Venezuela.
· Corporative –responsible for the activities not attributed to the other areas, such as
corporate financial and general administration related to central management and other
expenses, including actuarial expenses related to our pension and health assistance plans for
inactive participants.
Over the past 23 years, Petrobras, a pioneer in the concept of floating production, has
always stressed innovation and improvement of its offshore operations. The first PROCAP
(which in Portuguese stands for Program to Develop Technology for Deepwater Production
Systems)-was launched in 1986, with the objective of improving the company’s technical
competence in oil and gas production in waters up to 1000 meters deep. Under this initial
effort, the Albacora and Marlim fields were developed. The results of this program and
other discoveries encouraged the company in 1993 to create a second such program,
dubbed PROCAP-2000. This was a much greater challenge, prompted by the desire to put
into production the discoveries already made in deep waters, and to find new fields at
depths up to 3000 meters. The current version of this program, launched in 2000, is called
PROCAP-3000, for ultradeep waters.
The Company has also a Research and Development Center (CENPES) to meet Petrobras’
needs for new technologies. Advanced technology is the basis for consolidation and
expansion of the company in the world energy market. With over 1500 employees working
in an area of 122 thousand square meters, CENPES has 30 pilot units and 137 laboratories
that serve the various parts of the company. The technologies developed by CENPES have
60
resulted in 950 international patent applications and 500 purely national ones, besides a
considerable number or registered trademarks.
4.1 The Corporative System
Before enactment of the Petroleum Law in August 1997, the President of the Republic, with
terms of three years, named the members of the board of directors and executive board and
all the officers had seats on the board of directors. The chief executive officer had the
power to veto decisions of the board of directors.
The first big change in the bylaws occurred in 1999 and introduced great changes in the
company’s governance, such as:
- The power to name the executive board passed to the board of directors, the latter elected
by the general shareholders’ meeting;
- All restrictions were eliminated on detaining common shares by minority stockholders;
- The officers no longer had seats on the board of directors, and the chairman of the board
ceased to be the CEO as well (although continuing to be a member of the board);
- The number of directors was reduced from 12 to 9;
- The minority shareholders gained the right to elect one member of the board of directors.
During the following years, a great effort was made to expand the shareholder base through
two public offers of common and preferred shares (with the Brazilian government still
holding the majority of voting shares). There was also an overhaul of the organizational
structure, with more professional management, strictly focused on profitability with social
and environmental responsibility.
At the end of 2001, the board of directors decided that the company should take an
additional step to assure its access to financing, through another reform of the bylaws to
raise the corporate governance level higher, by giving additional rights to minority
shareholders and increasing transparency.

61
The same year, the São Paulo Stock Exchange (Bovespa) created a listing segment reserved
for the shares of companies that pledge voluntarily to adopt enhanced corporate governance
practices and to disclose additional information than required by corporate legislation.
In March and June 2002, there was another reform of the management structure, including
the following changes:
- The adoption of an arbitration chamber to resolve disputes;
- A election of one member of the board of directors by the preferred shareholders;
- The establishment of corporate governance guidelines, including a mechanism for
consulting the preferred shareholders on certain matters;
- The board of directors was reformulated to have five members representing the
controlling shareholder (Brazilian government), from one to three elected by the minority
common shareholders (using a multiple-vote scheme), and one chosen by the preferred
shareholders. In this case, the controlling shareholder nominates three candidates, and the
preferred shareholders choose one of them;
- The directors’ term was reduced to one year, reelection permitted;
- It was prohibited for the independent auditor also to provide consulting services to the
company.
As a result, the following new instruments were drafted and approved: new bylaws,
corporate governance guidelines, code of good practices, internal regulations of the board
of directors, committees of the board of directors and a special business committee, besides
the existing general Code of Ethics and Code of Conduct of the High Federal
Administration.
Petrobras is aware of its responsibilities as the largest and second most traded company in
the Brazilian market. Although it has not yet attained Level 1 listing on the Bovespa, this
priority goal is well in sight.
Additionally, specific actions to enhance corporate governance are being taken regularly,
including, among others:
- Application of a crisis communication plan and share buyback policy;
- The holding of an annual meeting with investors, when the executive board presents the

62
financial results and the business plans;
- The sending of a quarterly newsletter entitled Petrobras em Ações to 300 thousand
investors and individuals, providing information on the plans and results obtained;
- Ongoing modernization and reformulation of the investor relations website, enabling
quicker response to the needs of the investing public;
- The conduction of surveys to learn the profile of the shareholders;
- The creation of more efficient communication channels, such as a 0800 number to clarify
doubts and a quarterly chat with individual investors.
The company’s corporate governance is in constant evolution. Among the recent
improvements are:
- The company is implementing the adjustments necessary in its internal control procedures
and bringing its audit committee into compliance with the Sarbanes-Oxley Act, since
Petrobras shares are traded on the New York Stock Exchange (NYSE);
- The managers with activities linked to the subsidiaries and affiliated companies are being
trained in corporate governance, along with the members of the boards of directors and
executives of these companies.
It is hoped that the introduction of these changes will be reflected in greater value for the
shares issued by the company, because their aim is:
- To show the market that the board of directors has an active and independent posture,
responsive to all the shareholders;
- To make the decisions taken by the company more closely reflect the interests of all the
shareholders, not just the government;
- To make the company more attractive to investors and increase the demand for its
securities, thus reducing its funding costs and increasing its competitiveness at the
international level.
The efforts made by the company to become more transparent and respected in the eyes of
shareholders, investors in general and society at large have been recognized by national and
foreign entities and publications. For example, in September 2007, a survey among the
holders of the company’s common and preferred shares indicated an 84% level of
acceptance of its policies of transparency and business ethics, with respondents praising the

63
clear management rules.
The company is convinced that to guarantee continued access to the capital market,
companies will have to adopt the best practices of corporate governance, protection of
minority shareholder rights and transparency. The Brazilian government, through its
members on the board of directors, has been giving unconditional support to the
implementation of efforts to achieve these objectives.
Petrobras continually seeks to improve its corporate governance practices and its relations
with its shareholders, customers, suppliers, employees and other stakeholders. Because of
the markets in which it operates, the company is subject to the rules of the Comissão de
Valores Mobiliários (CVM, the Brazilian Securities Commission) and the São Paulo Stock
Exchange (Bovespa) in Brazil, the Securities and Exchange Commission (SEC) and New
York Stock Exchange (NYSE) in the United States, the Latibex Exchange in Madrid,
Spain, and the Buenos Aires Stock Exchange in Argentina, through Petrobras Energia. This
requires ongoing monitoring of rule changes and implementation of the practices
established in these markets.
In 2004, the company began to analyze the process of formal adhesion to differentiated
levels of corporate governance of the Bovespa. Since the changes in the bylaws in 2002,
Petrobras had been aligned with the practices required for enhanced listing and one of its
goals for 2005 was to qualify for Level 1.
The program of executive training in corporate governance was improved and expanded,
with the inclusion of themes relevant to the actuation of upper management and debates
about the company’s relationship with the other firms of the Petrobras System. The
company sought to spread internally the best corporate governance practices in Brazil and
abroad, and to promote awareness of upper management and employees about the theme’s
importance. The conclusions and recommendations will be used to improve corporate
governance throughout the Petrobras System.

64
In conformity with the requirements for listing on the New York Stock Exchange for
foreign issuers, in 2004 the company disclosed at its Internet a table describing the
significant differences between its corporate governance practices and those followed by
American companies listed on the NYSE.
Since the government monopoly was relaxed, Petrobras, while still controlled by the
Brazilian government, has become a publicly traded corporation falling under the rules of
the Law of Corporations (Law 6404 of December 15, 1976) besides its own bylaws. The
federal government’s control is exercised through possession of at least 50% plus one
voting share.
4.2 The Regulatory Framework
The National Petroleum, Natural Gas and Biofuels Agency (ANP) is an independent
agency of the federal administration, linked to the Ministry of Mines and Energy. Its
purpose is regulation, contracting and oversight of economic activities in the oil, natural gas
and biofuels industries, according to Law 9478/97 and Decree 2455/98, plus the directives
issued by the National Energy Policy Council (CNPE), in conformity with the country’s
interests. Regulation is the basis for the ANP’s actions, while oversight is the executive
action to suppress violations of the legislation and to support the Agency’s contractual
arrangements.
Besides the above activities, the ANP implements, in its sphere of authority, the National
Policy on Petroleum, Natural Gas and Biofuels, part of the National Energy Policy issued
by the CNPE.
According to Law 9478/97, all the rights to explore for and produce oil and natural gas in
Brazilian territory, including the territorial waters, continental shelf and exclusive economic
zone, belong to the Brazilian government, with the ANP entrusted with administering these
rights.

65
The collection of technical data on Brazilian sedimentary basins is also considered part of
the national hydrocarbon resources, with the ANP in charge of collecting, maintaining and
managing this database.
In the new model for the sector, exploration and production of petroleum, natural gas and
other liquid hydrocarbons shall be done by concession, preceded by competitive bidding
(Article 15, paragraph 1, Decree 2455/97).
The concession contracts contemplate two phases: exploration and production. The
exploration phase includes evaluation of the commercial feasibility of any discoveries. The
production phase also includes the development activities getting ready for production.
Only companies that meet the technical, economic and legal standards set by the ANP can
obtain oil and gas concessions.
The concession entails the obligation for the concessionaire to explore the tendered blocks,
at its account and risk, and in case of success, to produce hydrocarbons. Upon extraction,
the company obtains possession of the output, in return for which it must pay the taxes and
other legal and contractual charges assessed.
If an economic deposit is found, the concession holder must submit its plans to develop
production to the ANP for approval. The ANP will issue a opinion on this plan, within 180
days. If it fails to meet his deadline, the plans will be deemed automatically approved.
When fields are discovered that extend to neighboring blocks with different
concessionaires, the parties must enter into an agreement to individualize the output. If they
cannot reach an agreement within the maximum period set by the ANP, the Agency will
establish the terms for equitably sharing the rights and obligations regarding the blocks,
based on an arbitral award, arrived at according to the general principles of law applicable.
The concessions will be canceled in the following cases:
I – at the end of the contractual period;

66
II – by agreement between the parties;
III – for the termination reasons set forth in the concession contract;
IV – at the end of the exploration phase if no commercial discovery has been made, as
defined in the contract;
V – at the end of the exploration phase if the concessionaire exercises its right to withdraw
and returns the areas that, according to its discretion, do not warrant further investments for
development.
The return of the areas, as well as the reversion of assets, does not imply any cost for the
Brazilian government or ANP, nor does it afford any right to compensation to the
concessionaire for the drilling work, other services, real estate and reversible assets, which
return to the ownership of the government, under the management of the ANP.
According to the Petroleum Law, in any case of extinction of the concession, the holder
must at its own account remove all equipment and other goods that are not subject to
reversion, and is also obliged to repair or indemnify any damages resulting from its
activities and to undertake the environmental rehabilitation acts determined by the
competent authorities.
The concession contract may be transferred, as long as its subject matter and contractual
conditions are maintained and the transferee satisfies the technical, economic and legal
requirements set by the ANP.
Therefore, transfer of the contract also requires express prior authorization from the ANP.
Any contract for exploration, development and production of hydrocarbons does not extend
to any other natural resource that may be found, and the concessionaire must report this
promptly and exclusively to the ANP (Law 9478/97).
Among its attributes, the ANP drafts and issues the invitations to bid and conducts the
respective auctions for exploratory blocks, and executes the contracts resulting therefrom,
besides overseeing compliance with legislation and the contractual terms (Law 9478/97).

67
4.3 Taxation and Charges
The concession contract provides the following government participations, as set forth in
the invitation to bid:
I – signing bonus;
II - royalties;
III – special participation (royalty surcharge); and
IV – payment for occupation or retention of the area.
The royalties and payment for occupation and retention of the areas are compulsory. The
minimum amount of the signing bonus is set in the invitation to bid and corresponds to the
price bid at the auction to obtain the concession. It is paid upon signing the contract.
The royalties are paid monthly in Brazilian currency, as of start of commercial production
of each field, in an amount corresponding to ten percent of the petroleum or natural gas
produced.
In view of the geological risks, production expectations and other pertinent factors, the
royalties may be reduced to five percent of output at the least.
The criteria for calculating the value of the royalties are established by presidential decree,
in function of the market prices for oil, natural gas or condensate, the product specifications
and location of the field.
The flaring of gas in detriment to its sale, and any output lost under the responsibility of the
concessionaire are also included in the total volume for computation of the royalties owed.
The portion of the royalties set forth in the concession contract that represents five percent
(5%) of production, corresponding to the minimum royalty amount referred to above, will
be distributed according to the criteria of Law 7990 of 1989.
The portion of the royalties exceeding five percent will be distributed as follows:
I – when the extraction is onshore or in lakes, rivers or river or lake islands:
a) 52.5% to the states where the production occurs;

68
b) 15% to the municipalities‡‡‡‡ where the production occurs;
c) 7.5% to the municipalities that have been affected by the loading and unloading of oil
and natural gas, as per the criterion established by the ANP;
d) 25% to the Ministry of Science and Technology, to finance programs to support
scientific research and technological development applied to the oil, natural gas and
biofuels industries;
II – when the extraction is on the continental shelf:
a) 22.5% to the states onshore of where the production occurs;
b) 22.5% to the onshore municipalities;
c) 15% to the Navy Ministry, to pay for oversight and protection in the production areas;
d) 7.5% to the municipalities that have been affected by the loading and unloading of oil
and natural gas, as per the criterion established by the ANP;
e) 7.5% to constitute a Special Fund, to be distributed among all the states, territories and
municipalities in the country;
f) 25% to the Ministry of Science and Technology, to finance programs to support scientific
research and technological development applied to the oil, natural gas and biofuels
industries.
Out the resources that go to the Ministry of Science and Technology, at least 40% must be
spent on programs to foster scientific and technical training and development in the North
and Northeast regions of the country.
The Ministry of Science and Technology administers these programs, with technical
support from the ANP and through working arrangements with universities and research
centers.
The invitation to bid and the concession contracts establish that in cases of large production
volumes or highly profitable output, there will be a surcharge (“special participation”) paid
to the government. This special participation is calculated on the gross revenue from
production, less the royalties, investments in exploration, operating costs, depreciation and
taxes paid.
‡‡‡‡ At the local level, Brazil is divided into municipalities, which are similar to counties, except they have a single administration, headed by a mayor and municipal council.
69
The money from the special participation must be distributed as follows:
I - 40% to the Ministry of Mines and Energy (MME), of which 70% must go to finance
studies and services in the area of geology and geophysics applied to prospecting for fossil
fuels, to be promoted by the ANP and MME, 15% goes to pay for planning studies to
expand the country’s energy system and 15% to finance studies, projects, activities and
services to gather basic geological data.
II – 10% to the Ministry of the Environment, earmarked for development of studies and
projects related to the environment and reclamation of areas damaged by the petroleum
industry.
III – 40% to the state where the onshore production occurs, or onshore from the continental
shelf where offshore production occurs.
IV – 10% to the municipality where the onshore production occurs, or onshore from the
continental shelf where offshore production occurs.
The environmental studies referred to above will be developed by the Ministry of the
Environment, with technical support from the ANP.
The invitation to bid and respective concession contracts from each bidding round stipulate
the payment for occupation or retention of the area. The payment is owed every year,
computed per square kilometer or fraction thereof in the block, as set by presidential
decree. The amount of this payment is increased by a percentage established by the ANP
any time the exploration period is extended.
For onshore blocks, the concession contract also will contain a clause stipulating payment
to the landowners, ranging from 0.5% to 1% of the output of oil or gas, at the discretion of
the ANP. This money will be divided in proportion to the production on the regularly
demarcated properties in the block.
At the end of the bidding, the concession contracts are executed between the ANP, on
behalf of the Brazilian government, and the winning bidder for each block (individual
companies or consortiums). The Agency monitors the performance of these contracts,
which establish:
1. The payments for occupation (or retention) of the areas;

70
2. The royalty payments;
3. The payment of any special participation on fields with exceptionally large or
profitable production;
4. The conditions for return of the areas;
5. The duration of the contract and the time limits and working programs for
exploration and production activities;
6. A local content commitment involving goods and services;
7. The commitment to carry out the minimum exploratory program proposed in the
winning bid;
8. The responsibilities of the concessionaire, including for environmental damages.
The minimum exploratory program varies generally from three to eight years. In this phase,
the companies must acquire data (beyond those they already obtained in the ANP data room
or through other sources to formulate their bids), undertake new geological and geophysical
studies, drill exploratory wells and evaluate whether any discoveries are commercially
feasible.
If a discovery is considered commercial, the company must submit a development plan to
the ANP for approval, specifying forecast work and outlays that will be necessary before
starting production.
The concession contracts also stipulate that in the even of any domestic supply shortage,
the concessionaires must give priority to the internal market. With this in mind, Law
9478/97 (which created the ANP) also gives the Agency the task of authorizing the export
of oil, natural gas and their derivatives (Source: ANP, 2007).
4.4 Summary
Since establishment in 1997 of the current regulatory regime for the oil and gas sector until
the end of 2006, Brazil’s proven petroleum reserves jumped from 7.1 billion to 12.2 billion
barrels and the proven reserves of natural gas rose from 228 billion m³ to 348 billion m³.

71
Yearly oil output in the same period rose from 306 million to 629 million barrels – a
volume that made Brazil self-sufficient in oil – and production of natural gas went up from
9.8 billion m³ to 17.7 billion m³ (ANP, 2007).
Since 1997, the oil and gas industry has grown over 300% in monetary terms. Between
1997 and 2006, its contribution toward the nation’s gross domestic product (GDP)
increased from 2.75% to nearly 10%.
For the period from 2006 to 2010, the minimum investments declared to the ANP by the
current concession holders are US$ 33.8 billion, a figure that has certainly increased due to
subsequent discoveries (ANP, 2007).
After declining from the peaks of the 1980s, there has been a considerable increase in the
number of exploratory wells drilled since 1999, after enactment of the Petroleum Law. This
can be noted particularly in 2001, because of the end of the period given to Petrobras in the
so-called Round Zero of Concessions (“blue blocks”) in 1999, because the company had to
comply with the minimum exploratory program so as not to have to return areas to the
ANP. Of the total number of exploratory wells, 79 offshore ones were classed as pioneer in
2001, of which 41 were drilled by Petrobras and 28 by other companies that arrived after
opening of the sector.
4.5 Oil and Gas Reserves
Periodically the United States Geological Survey (USGS) evaluates the potential resources
of oil, natural gas and natural gas liquids in regions within the United States and other parts
of the world. The purpose is to obtain scientifically based estimates of the volume of
hydrocarbons that have real chances of being added to the world’s reserves within a
determined time frame, that is, the growth of reserves within this interval. This evaluation
seeks to determine, based on a probabilistic approach, the volume of undiscovered
resources in conventional deposits. Undiscovered reserves for this purpose are those that,
according to the geological theories and knowledge, “should” exist outside known
hydrocarbon fields. Conventional deposits for this discussion are defined as discrete and

72
countable deposits commonly delineated by interfaces with deposits of water. This
definition does not include criteria involving variables such as depth of the water,
regulatory or engineering questions.
In the last such evaluation by the USGS, the World Petroleum Assessment 2000, the
growth of potential reserves is defined as being equivalent to the quantities of petroleum,
natural gas and natural gas liquids that have the potential to be added within 30 years to the
remaining reserves in known fields, through processes such as extension of fields, revisions
and enhanced recovery techniques. For this evaluation, the growth of reserves was
considered only for the case of fields within areas (assessment units) for which there
already were prognoses on the existence of hydrocarbon resources.
Table 7 below shows the estimates of the United States Geological Survey for undiscovered
resources of oil, natural gas and natural gas liquids (NGL) of some of the Brazilian
sedimentary basins, rated as having a 95% chance of occurrence.

73
Table 7
Estimated undiscovered resources of oil, natural gas and natural gas liquids of some
Brazilian sedimentary basins – 95% probability of occurrence
Sedimentary Basin Oil Reserves
(million barrels)
Natural Gas
Reserves
(million m3)
NGL Reserves
(million barrels)
Campos 3.441 106 101
Santos 4.117 498.4 837
Pelotas 0 0 0
Foz do Amazonas 0 216 71
Sergipe-Alagoas 197 38.7 62
Espírito Santo 305 105 165
Total Onshore 18 1.4 1
Total Offshore 8,042 962.9 1,234
TOTAL BRAZIL 8,060 964.4 1,236
Source: USGS, 2000.
The above table shows the volumes of undiscovered resources that will be added to the
proven reserves with 95% probability in the 30 years from the date it was written (2000),
that is, by 2030. Therefore, over that period, 8,060 million barrels of oil, 964.4 million
cubic meters of gas and 1,236 million barrels of gas liquids will be added to the remaining
proven Brazilian reserves. The figure for oil corresponds to roughly 80% of the proven
reserves at the end of 2002, while for gas it only corresponds to 0.4% of the proven
reserves on that date.
Table 8 shows the estimates of the USGS for undiscovered reserves of the same three
products from Brazilian sedimentary basins with 50% probability of occurrence.

74
Table 8
Estimated undiscovered resources of oil, natural gas and natural gas liquids of some
Brazilian sedimentary basins – 50% probability of occurrence
Sedimentary Basin Oil Reserves
(million barrels)
Natural Gas
Reserves
(million m3)
NGL Reserves
(million barrels)
Campos 14,235 467.3 451
Santos 21,963 2,107.2 3,762
Pelotas 2,421 528.4 873
Foz do Amazonas 0 786.8 271
Sergipe-Alagoas 1,271 198.3 338
Espírito Santo 2,338 775.4 1,243
Total Onshore 57 5.1 5
Total Offshore 42,177 4,859.3 6,935
TOTAL BRAZIL 42,234 4,864.4 6,940
Source: USGS, 2000.
According to the above table, then, there is a 50% probability of adding 42,234 million
barrels of oil, 4,864.4 million cubic meters of gas and 6,940 million barrels of gas liquids to
proven Brazilian reserves by 2030.
Table 9 shows the same estimates from the USGS for resources of oil, natural gas and
natural gas liquids from Brazilian sedimentary basins with 5% probability of occurrence.

75
Table 9
Estimated undiscovered resources of oil, natural gas and natural gas liquids of some
Brazilian sedimentary basins – 5% probability of occurrence
Sedimentary Basin Oil Reserves
(million barrels)
Natural Gas
Reserves
(million m3)
NGL Reserves
(million barrels)
Campos 36,478 1,321.5 1,357
Santos 46,265 4,634.3 9,023
Pelotas 6,824 1,500.9 2,696
Foz do Amazonas 0 1,644.6 620
Sergipe-Alagoas 3,527 563.8 1,035
Espírito Santo 7,735 2,508.3 4,341
Total Onshore 119 11.9 14
Total Offshore 100,728 12,164.3 19,064
TOTAL BRAZIL 100,848 12,176.2 19,078
Source: USGS, 2000.
Therefore, according to the above table there is a 5% probability of adding 100,848 million
barrels of oil, 12,176.2 million cubic meters of gas and 19,078 million barrels of gas liquids
to Brazilian reserves by 2030.
Naturally, it cannot be expected that all these figures will be realized in the short run, but
this potential suggests that the addition of reserves should not be a strong limiting factor on
the country’s domestic oil and gas supply, so it is correct to predict that the sector will
continue being one of the most dynamic in the country.
The recent announcement of offshore oil discoveries at the depth of 8000 meters along the
Brazilian coast with a potential output of 20 000 million barrels (Carioca and Tupi wells)
would double the current oil reserves and enormously increase gas production.
5. Other Regulatory Frameworks

76
In this section regulation on biofuels and electricity that are strongly related to the oil and
gas industries in Brazil are discussed.
5.1 Electricity Regulation Electricity production and distribution firms have been fully state-owned until 1995 when
almost 100% of the distribution and about 20 % of generation was privatized. Later
privatization of transmission advanced and expansion is now only with private capital.
Further privatization of generation never occurred due to severe political pressures based in
both ideological opposition to privatization or technical concerns with the depletion of the
dominant hydroelectric capacity. Uncertainty of the additional reforms in the sector did not
allow for the development of a dynamic energy market resulting in very low public and
private investments.
In addition to that, governance was also jeopardized since the Ministry of the Energy and
the regulatory agency (ANEEL) were not able to clearly separate their planning and
regulatory functions. With the drought in 2001 the country faced a electricity crisis when
energy consumption was controlled and prices were largely increased with severe impact
on the economy growth. The 2003 new federal administration has completely changed the
sector regulation. First it officially declared that no additional privatization was to be made.
Secondly it created a monopsonic pool to purchase output from generators and deliver it to
distributors with separated auctions to existing capacity and new projects. The whole
justification for the pool was that centralized purchase with auctions and with long term
contracts that would reduce prices and guarantee the match of supply and demand overtime.
Surprisingly generous entry and leave conditions and tax exemptions were given to users
that do not wish to take part of this heavy regulated market and decided to contract out
directly to generators at their own risk.
Auction of existing energy did really manage to cut prices that were in fact already low
because of the installed surplus capacity resulting from the effects of emergencial
investments in energy projects and particularly due to the energy conservation measures
that high energy tariffs applied during the 2001 crisis. The new regulation give too much
discretion to the government of the day when pool contracts has no contingencies
provisions and protection against default, apart from the heavy tax burden. Auction results

77
have shown that private sector had a minor participation in the new hydro plants and state-
owned companies today carry on new projects. Private investors, instead, have made
contracts with thermal plants since natural gas contracts are bind by law with Petrobras and
gas price variation is fully captured in tariff adjustments. However, Petrobras claims that
electricity sector planning of thermal plants is not fully integrated to the company´s
commercial strategies and disputes its regulated supply obligations.
3.2 Biofuel Regulation
Sugar production in Brazil date back to the 16th century as one of the main source of
colonial exploitation and it has been privately undertaken since them. But the sector has
been subjected to regulation on prices and structure to conciliate domestic consumption and
export in the booming periods and subsidizing the sector at declining international price
phases. In response to the oil crisis in the 1970´s, Brazil has implemented an ambitious
program of fuel ethanol produced from sugar cane. Substitution took place by adding a
20% share of ethanol in the gasoline and with fully fuelled-ethanol cars. As a major sugar
producer, the effect of generous credit subsidies for production and ethanol users was a fast
growing consumption that reached the level of 12 billion liters in less than six years.
To compensate for its lower fuel consumption efficiency consumer price of ethanol fuel
was regulated to keep a 0.80 parity with gasoline price and producer prices controlled with
arbitrary parities to sugar international prices. Distribution and storage were centralized by
Petrobras that also had to deal at low international prices the resulting surplus of gasoline
that its distilleries could not avoid. Since ethanol production somehow competes with
sugar in the agricultural market and production of ethanol is reduced when relative prices
are favoring sugar. Such shortages and declining oil prices from 1986 onwards jeopardized

78
the reliability of pure ethanol-fuelled cars and their sales after reaching almost the
proportion of 100% of total sales in late 1980´s dropped gradually to almost 5%.
Ethanol prices were finally deregulated in the price reforms of 1995 that allow producers
and retailers to gain some efficiency in the distribution and market allocation that allowed
them to reduce real prices, as shown in Table 9, but fuel reliability was not restored. The
2002 oil price surge associated with a rapid appreciation of the exchange rate gave the car
industry an opportunity to introduce cars with the capacity to run in both gasoline and
ethanol fuels, the so-called bi-fuel cars that may cost over 5% of the gasoline version. Such
fuel flexibility restored users confidence on ethanol and almost every model gained it bi-
fuel version that soon gained half of the new sales in 2005 when ethanol fuel consumption
increased in 10%. Exports have also increased and current production capacity of 17 billion
liters is expected to reach 50 billion litters in 2030 to meet domestic and international
markets§§§§. Petrobras continues to control and run ethanol storage for gasoline mixing
and it claims that pure ethanol fuel must advance in accordance and pace with its refinery
profile.
The new emerging biofuel in Brazil is biodiesel. The Brazilian Biodiesel program was
launched in 2005 with favorable tax credits to stimulate agricultural production undertaken
by small landowners***** and away from valuable commodities, such as, soybeans. Apart
from that the program has set a mandatory mix of 2% in 2007 and 5% in 2020. At the
current annual diesel consumption level of 40 million m3 it represents yearly production of
0.8 million m3, which has already production capacity installed in the country. Ambitious
targets for biodiesel are planned with a 12% mix envisaged by 2030. With the current
§§§§ See Seroa da Motta (2007) for details.
***** Tax subsidy of about US$ 0.10 per liter.

79
emphasis on biofuel energy options for climate change mitigation policies, Brazilian
production can go far beyond that.
The Petroleum National Agency (ANP) through auctions controls Biofuel trade. The recent
increase in the international soybean price has jeopardized those producers adopting this
source that, as said before, has no tax subsidies. Social biodiesel from small-scale
agricultural farming away from soybean have shown rising costs due to inefficiency in
production and high logistic and technical assistance investments. Today auctions do not
capture half of the installed capacity and some contracts are already in default since
producers cannot delivery at the bid costs. Relative price of biodiesel is another burden to
Petrobras. Auction prices have reached levels above diesel retail price and the company is
financing the transport, storage and tax obligations to sustain the program.
Concerns about these conflicts between biofuel and oil product strategies and market
constraints, the federal government has recently proposed a regulation that gives ANP full
power to force ethanol producers to comply with planned biofuel production levels using
export restrictions and price control. Private producers claim that such regulation violates
competition and, in fact, this regulation can be ineffective and also lead to the increase the
oligopolization of the sector with the resulting inefficiencies and welfare losses.
6. Final Comments
Although causality was not empirically tested, our study has pointed out a great correlation
between changes on business environment and the resulting impressive increase in
performance on all oil activities in Brazil.
Although projections of increasing oil and gas reserves in Brazil are now reaching
consensus with the latest discoveries, expansion and production will depend much on the
financing of the sector. This financing, as previously shown, has been matched not only by

80
the improvement in corporative management in Petrobras but also from efficient pricing
and private capital ventures.
Despite uncertainty in pricing regulation that reduces efficiency and competition, our
analysis indicates that oil sector in Brazil has evolved and is already mature and motivated
by competition.
However, gas natural sector is still facing uncertainties on pricing and market access for the
expansion of the sector. In addition to that, the oil and gas industries must account for the
advancements taking place in electricity and biofuel sectors.
References
ANP (2000), A Nova Realidade do Setor de Petróleo e Gás natural no Brasil após a
Flexibilização do Monopólio, Palestra proferida por Eloi Fernández y Fernández, Diretor,
em Setembro de 2000, AGÊNCIA NACIONAL DO PETRÓLEO, Rio de Janeiro
ANP (2001a). Combustíveis no Brasil: política de preços e estrutura tributária.
Superintendência de Estudos Estratégicos, AGÊNCIA NACIONAL DO PETRÓLEO, Rio
de Janeiro.
ANP (2001b). Indústria brasileira de gás natural: histórico recente da política de preços,
AGÊNCIA NACIONAL DO PETRÓLEO. Rio de Janeiro.
ANP (2002), Balanço e Perspectivas das Atividades de Exploração de Petróleo,
Presentation by John Forman, Director of the AGÊNCIA NACIONAL DO PETRÓLEO, in
September 2002 at the 17th World Petroleum Congress, AGÊNCIA NACIONAL DO
PETRÓLEO, Rio de Janeiro.
ANP (2003), O Papel da AGÊNCIA NACIONAL DO PETRÓLEO na Regulação da
Indústria do Petróleo, Presentation of the Superintendent Office of Strategic Studies of the
AGÊNCIA NACIONAL DO PETRÓLEO, Rio de Janeiro
ANP (2004), Perspectivas da Exploração no Brasil: Visão Geral das Descobertas
Recentes, Presentation by Fabio Pinto, Superintendent Office of Tenders in April2004 at

81
the Seminário Técnico da Sexta Rodada de Licitações, AGÊNCIA NACIONAL DO
PETRÓLEO, Rio de Janeiro.
ANP (2004), Novas Fronteiras Exploratórias – Estudando o Futuro do Setor Petróleo no
Brasil, Palestra Proferida por Milton Franke – Superintendente de Definição de Blocks na
Rio Oil and Gas Expo and Coference, AGÊNCIA NACIONAL DO PETRÓLEO, Rio de
Janeiro.
ANP (2004), Novas Fronteiras Exploratórias: Estudando o Futuro do Setor de Petróleo no
Brasil, Presentation by Milton Franke, Superintendent of Defining Blocks, in October 2004
at the Rio Oil and Gas Expo and Conference, AGÊNCIA NACIONAL DO PETRÓLEO,
Rio de Janeiro
ANP (2005), Informe Conjuntura e Informação N0 27 – Investimentos da Indústria do
Petróleo em Exploração e Produção em 2004-2008, AGÊNCIA NACIONAL DO
PETRÓLEO, Rio de Janeiro
ANP (2006). Anuário estatístico brasileiro do petróleo e do gás natural 2005. AGÊNCIA
NACIONAL DO PETRÓLEO, Rio de Janeiro.
ANP (2007). Anuário estatístico brasileiro do petróleo e do gás natural 2006. AGÊNCIA
NACIONAL DO PETRÓLEO, Rio de Janeiro.
ARAGÃO, A.P.(2005). Estimativa da contribuição do setor petróleo ao Produto Interno
Bruto: 1955/2004. Masters Dissertation, PPE/COPPE/UFRJ, Rio de Janeiro.
ARAÚJO,T. J. (2006). Quais são os efeitos da volatilidade de preços de petróleo na
economia brasileira? Uma análise de 2002 a 2006. Masters Dissertation, IBMEC, Rio de
Janeiro.
BILLWILLER, B.A.. (2002). A política de preços dos derivados de petróleo no Brasil.
Monografia, IE/UFRJ, Rio de Janeiro.
BP (2006). BP Statistical review of world energy 2005. Disponível em: www.bp.com
COELHO (2006), Aislan de Souza, As Participações Governamentais e o Impacto dos
Royalties sobre a Economia do Estado do Rio de Janeiro, Monografia de Pós Graduação
em Direito Ambiental com Ênfase em Petróleo, Universidade Cândido Mendes, Rio de
Janeiro.
CONGRESSO NACIONAL (2000), Lei 9.478/1997 – Lei do Petróleo, AGÊNCIA
NACIONAL DO PETRÓLEO, Brasília.

82
FGV (2007), O Petróleo, available at www.cpdoc.fgv.Br, accessed on August 12, 2007.
COSTA, H.H.(2003). Regulação da indústria de gás natural no Brasil: fatos e desafios.
Masters Dissertation, PPE/COPPE/UFRJ, Rio de Janeiro.
EIA (2008). Topics for petroleum prices. Washington, D.C.: Energy Information
Administration, US Department of Energy. Disponível em: http://www.eia.doe.gov.
EPE (2007). Plano Decenal de Energia 2007-2016. Rio de Janeiro: Empresa de Pesquisa
Energética, Ministério de Minas e Energia. Disponível em: http://www.epe.gov.br.
LUCCHESI (1998), Celso Fernando, Petróleo, Série Estudos Avançados, MCT, Brasília.
MACHADO (2002), Giovani Vitória, Estimativa da Contribuição do Setor Petróleo ao
Produto Interno do Brasil, Nota Técnica AGÊNCIA NACIONAL DO PETRÓLEO N0 13,
AGÊNCIA NACIONAL DO PETRÓLEO, Rio de Janeiro.
MACHADO (2004), Giovani Vitória, Estimativa da Contribuição do Setor Petróleo ao
Produto Interno do Brasil: 1997-2001, article presented at the 10th Brazilian Energy
Congress, Rio de Janeiro, October
MARIANO, Jacqueline, SALA, Janaína e TAVARES, Marina, Evolução do Mercado de
Derivados, IBP, Rio de Janeiro, 2004.
MME (2007), Balanço Energético Nacional 2007 (Ano Base 2006), Ministério de Minas e
Energia, Brasília,
ONIP (2000), Impacto Econômico da Expansão da Indústria do Petróleo – Relatório Final,
ORGANIZAÇÃO NACIONAL DA INDÚSTRIA DO PETRÓLEO, Rio de Janeiro
PETROBRAS (2004) 50 Anos de Petrobras e a Auto-Suficiência em Petróleo do Brasil,
Presentation by Guilherme Estrella, Director of E&P of Petrobras, on May 26, 2004 at
COPPE/UFRJ, Rio de Janeiro.
PETROBRAS (2007). www.petrobras.com.br
PETROBRAS (2008). www.petrobras.com.br
SATHLER, M. (2000). Análise da evolução do sistema de formação de preços dos
derivados de petróleo no Brasil. Masters Dissertation, PPE/COPPE/UFRJ, Rio de Janeiro.
SEROA DA MOTTA, R.(2007) A BRIC perspective to OECD Environmental Outlook to
2030: Brazil, Global Forum on Sustainable Development, OECD, Paris

83
SILVA, C. M. (2003). Estratégia de preços da Petrobras no mercado de combustíveis
brasileiro pós-liberalização e instrumentos de amortecimento de variações internacionais.
Masters Dissertation, IE/UFRJ, Rio de Janeiro.
SINDIPETRO (2004). www.sindipetro-ce.org.br
TOLMASQUIM, M.T., SCHAEFFER, R., SZKLO, A.S., TAVARES, M.E.E. (2000).
Liberação das importações de derivados de petróleo no Brasil. COPPE/UFRJ. 2000. Rio
de Janeiro
UNICAMP (2007), O Que é o Petróleo?, available at
http://www.cepetro.unicamp.br/petroleo/index_petroleo.html, accessed on August 12.
VALOIS (2000), Paulo, A Evolução do Monopólio Estatal do Petróleo, Editora Lúmen
Júris, Rio de Janeiro, 1st Ed


![[LATAM Webinar Slides] Brazil & Beyond: Privacy Trends in Latin America](https://img.pdfslide.us/doc/110x75/58f9c008760da32f4b8b4e74/latam-webinar-slides-brazil-beyond-privacy-trends-in-latin-america-58f9cc16b1b55.jpg)