Embed Size (px)
Citation preview
Printed on recycled paper
FINAL USER’S GUIDE
UG-2087-ENV GUIDANCE FOR OPTIMIZING REMEDY EVALUATION, SELECTION, AND DESIGN by Battelle Memorial Institute 505 King Avenue Columbus, Ohio March 9, 2010
Approved for public release; distribution is unlimited.
ENGINEERING SERVICE CENTER Port Hueneme, California 93043-4370
ii
The work reported in this document is funded by the United States Department of the Navy under Task Order 042 of Contract N62473-07-D-4013 to Battelle. It has been subjected to the Navy’s peer and administrative reviews and has been approved for publication as a Navy document. Any opinions expressed in this paper are those of the author(s) and do not, necessarily, reflect the official positions and policies of the Navy. Any mention of products or trade names does not constitute recommendation for use by the Navy.
iii
REPORT DOCUMENTATION PAGE Form Approved OMB No. 0704-0811
The public reporting burden for this collection of information is estimated to average 1 hour per response, including the time for reviewing instructions, searching existing data sources, gathering and maintaining the data needed, and completing and reviewing the collection of information. Send comments regarding this burden estimate or any other aspect of this collection of information, including suggestions for reducing the burden to Department of Defense, Washington Headquarters Services, Directorate for Information Operations and Reports (0704-0188), 1215 Jefferson Davis Highway, Suite 1204, Arlington, VA 22202-4302. Respondents should be aware that notwithstanding any other provision of law, no person shall be subject to any penalty for failing to comply with a collection of information, it if does not display a currently valid OMB control number. PLEASE DO NOT RETURN YOUR FORM TO THE ABOVE ADDRESS. 1. REPORT DATE (DD-MM-YYYY) 2. REPORT TYPE 3. DATES COVERED (From – To)
09 March 2010 Final 4. TITLE AND SUBTITLE 5a. CONTRACT NUMBER
GUIDANCE FOR OPTIMIZING REMEDY EVALUATION, SELECTION, AND DESIGN
5b. GRANT NUMBER
5c. PROGRAM ELEMENT NUMBER
6. AUTHOR(S) 5d. PROJECT NUMBER
Battelle Memorial Institute 505 King Avenue Columbus, OH 43201
5e. TASK NUMBER
5f. WORK UNIT NUMBER
7. PERFORMING ORGANIZATION NAME(S) AND ADDRESSES 8. PERFORMING ORGANIZATION REPORT NUMBER
Commanding Officer Naval Facilities Engineering Command Engineering Service Center 1100 23rd Avenue Port Hueneme, CA 93043
9. SPONSORING/MONITORING AGENCY NAME(S) AND ADDRESS(ES) 10. SPONSOR/MONITORS ACRONYM(S)
11. SPONSOR/MONITOR’S REPORT NUMBER(S)
12. DISTRIBUTION/AVAILABILITY STATEMENT
Approved for public release; distribution is unlimited
13. SUPPLEMENTARY NOTES
Environmental restoration, feasibility study; installation restoration 14. ABSTRACT
This document provides a general overview and explanation of key optimization concepts as they pertain to the FS, ROD, and RD clean-up phases. This document is not intended to provide guidance on determining site-specific risk-based clean-up goals, performing risk assessments, conducting site assessments and background investigations, or other site-specific contaminant characterization activities for which United States Environmental Protection Agency (U.S. EPA) and Navy guidance already exists. Rather, this document complements these important components of the site remediation process by providing recommendations for optimizing remedy selection and design.
15. SUBJECT TERMS
Installation restoration; environmental restoration; feasibility study 16. SECURITY CLASSIFICATION OF: 17. LIMITATION OF
ABSTRACT 18. NUMBER OF
PAGES 19a. NAME OF RESPONSIBLE PERSON
a. REPORT b. ABSTRACT c. THIS PAGE U U U U 67 19b. TELEPHONE NUMBER (include area code)
Standard Form 298 (Rev. 8/98) Prescribed by ANSI Std. Z39.18
iv
ACKNOWLEDGMENTS
The Department of the Navy acknowledges the members of the NAVFAC Environmental Restoration (ER) Optimization Work Group for their contributions in preparing this guidance.
NAVFAC Headquarters Consultant - NAVFAC Engineering Service Center NAVFAC Atlantic NAVFAC Engineering Service Center NAVFAC Mid-Atlantic NAVFAC Pacific NAVFAC Northwest NAVFAC Washington NAVFAC Engineering Service Center Navy BRAC Program Management Office NAVFAC Southeast NAVFAC Atlantic NAVFAC Southwest NAVFAC Pacific NAVFAC Atlantic
v
CONTENTS Acknowledgments ........................................................................................................................................ iv Acronyms and Abbreviations .................................................................................................................... viii 1.0 Introduction ............................................................................................................................................ 1
1.1 Background .................................................................................................................................... 1 1.2 Regulatory Framework and Navy Policy ....................................................................................... 1 1.3 Benefits of Optimization ................................................................................................................ 5 1.4 Objectives ....................................................................................................................................... 6 1.5 Document Organization ................................................................................................................. 6
2.0 Overview of Optimization Concepts ...................................................................................................... 8
2.1 Conceptual Site Model ................................................................................................................... 8 2.2 Remedial Action Objectives ......................................................................................................... 14 2.3 Target Treatment Zone(s) ............................................................................................................. 15 2.4 Multiple Remedial Technologies: The “Treatment Train” Concept ............................................ 18 2.5 Performance Objectives ............................................................................................................... 21 2.6 Optimization and Exit Strategies .................................................................................................. 23
3.0 Considerations for Optimizing Remedies During the FS .................................................................... 26
3.1 Initial Steps ................................................................................................................................... 26 3.2 Identification and Screening of Remedial Alternatives................................................................ 26 3.3 Detailed Evaluation of Remedial Alternatives ............................................................................. 27
3.3.1 Green and Sustainable Remediation ................................................................................. 30 3.3.2 Cost versus Risk Reduction Considerations ..................................................................... 31 3.3.3 Incorporating Optimization Concepts into Remedy Alternative Development ................ 31
3.4 Media-Specific Considerations .................................................................................................... 35 3.4.1 Soil and Groundwater Sites .............................................................................................. 35 3.4.2 Landfill Sites ..................................................................................................................... 39 3.4.3 Sediment Sites ................................................................................................................... 40 3.4.4 Munitions Response Sites ................................................................................................. 43
4.0 Considerations for Optimizing RODs .................................................................................................. 49
4.1 Purpose of the ROD ..................................................................................................................... 49 4.2 ROD Language that Allows Future Optimization ........................................................................ 49 4.3 Concepts of the Improved ROD ................................................................................................... 50
5.0 Considerations for Optimizing Remedies During the RD ................................................................... 54
5.1 General Optimization Strategies .................................................................................................. 55 5.2 In Situ Treatment Optimization Strategies ................................................................................... 59
5.2.1 Source Characterization Impacts to Successful Treatment ............................................... 59 5.2.2 Geochemical Impacts to Successful Treatment ................................................................ 60 5.2.3 Delivery System Design Impacts to Successful Treatment .............................................. 60
5.3 Ex Situ Treatment Optimization Strategies .................................................................................. 61 5.4 Sustainable Remedial Design Strategies ...................................................................................... 62
6.0 Conclusions .......................................................................................................................................... 69 7.0 References ............................................................................................................................................ 71
vi
FIGURES Figure 1-1. Typical Navy Facility ............................................................................................................. 2 Figure 2-1. Elements of a Conceptual Site Model .................................................................................... 9 Figure 2-2. Example Exposure Pathway CSM in Table Format ............................................................. 10 Figure 2-3. Example Picture Cartoon CSM ............................................................................................ 11 Figure 2-4. Example Plan View and Cross Section CSM....................................................................... 12 Figure 2-5. Example of Time-Series Data Showing Contaminant Trend ............................................... 13 Figure 2-6. Example Site: Potential Target Treatment Zones and RAO per Zone ................................. 16 Figure 2-7. Example Site: Treatment Train Alternatives ........................................................................ 18 Figure 2-8. Example of Challenge in Obtaining Clean-up Goals with Active Technologies ................. 21 Figure 2-9. Example Site: Performance Objectives ................................................................................ 22 Figure 2-10. Generalized Optimization and Exit Strategy ........................................................................ 23 Figure 2-11. Cost Reduction from Treatment Trains and Performance Objectives Used to
Develop Exit Strategy for Each Phase of the Remedy ......................................................... 25 Figure 3-1. Hypothetical Example of Cost and Risk Comparison .......................................................... 33 Figure 3-2. Hypothetical Technology Transition .................................................................................... 33 Figure 3-3. Typical Soil and Groundwater Remediation Performance Curve ........................................ 36 Figure 3-4. Effect of Groundwater Flow on Contaminant Removal ...................................................... 37 Figure 5-1. Life-Cycle Considerations for RD Phase ............................................................................. 55 Figure 5-2. Example of how Sustainability Metrics can be Incorporated into Performance
Objectives and Exit Strategies ............................................................................................. 64
TABLES Table 1-1. Phases in the ER Process ............................................................................................................ 3 Table 1-2. RCRA, UST, and CERCLA Processes for Remediation of Contaminated Sites ....................... 4 Table 3-1. Summary of the CERCLA Nine Criteria .................................................................................. 28 Table 3-2. Examples of Footprint Reduction Techniques for Selected Activities ..................................... 32
ADDITIONAL INFORMATION AND CASE EXAMPLES Identifying Target Treatment Zones and the Sequential Application of Passive Cleanup Processes,
Naval Weapons Station, Charleston, SC ............................................................................................. 17 Treatment Train Approach to In Situ Treatment of Chlorinated Solvents in Low Permeability
Soils in Conjunction with Natural Attenuation, Marine Corps Logistics Base, Albany, GA .............. 20 Useful Web Sites for Remedy Selection ..................................................................................................... 29 Net Present Value and Total Cost ............................................................................................................... 34 Landfill Site Remedial Design Strategy at Portsmouth Naval Shipyard, Kittery, ME ............................... 41 Munitions Investigation and Cleanup at Naval Air Facility, Adak, AK ..................................................... 45 FS Optimization Checklist .......................................................................................................................... 47 ROD Developed to Allow Optimization of SVE System at a Southern California NPL Site ................... 52 Permit Developed to Allow Optimization of the Pensacola Wastewater Treatment Plant ......................... 52 Checklist for Optimizing the ROD ............................................................................................................. 53 In Situ Treatment Life-Cycle Design at Former Long Beach Naval Shipyard IR Sites 1 and 2 ................ 57 Ex Situ Treatment Life-Cycle Design at Coastal Systems Station (CSS), Panama City, FL ..................... 58

vii
Ex Situ Treatment, Design, and Optimization for Pump and Treat System, Trenton, NJ .......................... 62 Performance Objectives/Exit Strategies and Sustainability Metrics, LP-20 Area - Norfolk Naval
Station, Norfolk VA............................................................................................................................. 64 Resources for Treatment Train Design and Optimization .......................................................................... 65 RD Optimization Checklist ......................................................................................................................... 67
viii
ACRONYMS AND ABBREVIATIONS 2-D two-dimensional 3-D three-dimensional AAR after action report AFCEE Air Force Center for Engineering and the Environment AR administrative record ARAR applicable or relevant and appropriate requirement AS air sparging ASN Assistant Secretary of the Navy ASTM American Society for Testing and Materials BMP best management practices BRAC Base Realignment and Closure CAP corrective action plan CERCLA Comprehensive Environmental Response, Compensation, and Liability Act COC contaminant of concern COPC contaminant of potential concern CMS corrective measures study CNO Chief of Naval Operations CSM conceptual site model CT carbon tetrachloride CVOC chlorinated volatile organic compound DAF dissolved air flotation DDESB Department of Defense Explosives Safety Board DERP Defense Environmental Restoration Program DMM dispose military munitions DNAPL dense non-aqueous phase liquid DoD Department of Defense DON Department of the Navy DQO data quality objective DRC dispute resolution committee EE/CA engineering evaluation/cost analysis ER Environmental Restoration ERA ecological risk assessment ERH electrical resistance heating ERT2 Environmental Restoration Technology Transfer ESC Engineering Service Center ESD explanation of significant differences ESS explosives safety submittal FEC facility engineering command FRTR Federal Remediation Technologies Roundtable FS feasibility study GAC granular activated carbon GHG greenhouse gas
ix
GIS geographic information system GSR green and sustainable remediation IDQTF Intergovernmental Data Quality Task Force IR Installation Restoration IRP Installation Restoration Program ITRC Interstate Technology & Regulatory Council JILF Jamaica Island Landfill LNAPL light non-aqueous phase liquid LTMgt long-term management LUC land use control MC munitions constituent MCL maximum contaminant level MCLB Marine Corps Logistics Base MEC munitions and explosives of concern MGFD munitions with the greatest fragment distance MNA monitored natural attenuation MNR monitored natural recovery MPPEH materials potentially presenting an explosive hazard MR munitions response NADEP Naval Aviation Depot NAPL non-aqueous phase liquid NAVFAC Naval Facilities Engineering Command NCP National Contingency Plan NEBA net environmental benefit analysis NERP Navy Environmental Restoration Program NIRIS Naval Installation Restoration Information Solution NOx oxides of nitrogen NORM Normalization of Environmental Data Systems NOSSA Naval Ordnance Safety and Security Activity NPL National Priorities List NPV net present value NRC National Research Council O&M operation and maintenance OMB Office of Management and Budget OMMO operation, maintenance, monitoring, and optimization ORC® Oxygen Release Compound OU operable unit PA preliminary assessment PAH polycyclic aromatic hydrocarbon PBC performance based contracting PCB polychlorinated biphenyl PCE perchloroethene PM particulate matter PMO Program Management Office PNS Portsmouth Naval Shipyard
x
POC point of compliance PP proposed plan ppb parts per billion PQO project quality objective PRB permeable reactive barrier PVC polyvinyl chloride QA/QC quality assurance/quality control RAA remedial alternative analysis RA-C remedial action construction RA-O remedial action operations RAO remedial action objective RC response complete RCRA Resource Conservation and Recovery Act RD remedial design RFA RCRA facility assessment RFI RCRA facility investigation RI remedial investigation RIP remedy in place RITS Remediation Innovative Technology Seminars ROD record of decision RPM remedial project manager RSE remediation system evaluation RTK DGPS real-time kinematic differential global positioning system SARA Superfund Amendments and Reauthorization Act SC site closeout SI site inspection SOx sulfur oxides SOP standard operating procedure SVE soil vapor extraction TCA trichloroethane TCE trichloroethene TIP Technology Innovation Program TPH total petroleum hydrocarbon UFP-QAPP Uniform Federal Policy Quality Assurance Project Plan USACE United States Army Corps of Engineers U.S. EPA United States Environmental Protection Agency UST underground storage tank UUUE unrestricted use, unlimited exposure UXO unexploded ordnance VFD variable frequency drive VOC volatile organic compound WCSD Watershed Contaminated Source Document WWTP wastewater treatment plan ZVI zero-valent iron
1
1.0 INTRODUCTION A clean, healthy environment is essential to supporting the Department of the Navy’s (DON’s) primary mission of maintaining fleet readiness. Although past activities have resulted in the release of contaminants into the environment, DON is committed to cleaning up these sites in an effective and efficient manner. Navy guidance documents, such as this report, are intended to support the environmental restoration (ER) program goal of achieving environmentally protective site closeout at the least cost. Decisions made for ER and Base Realignment and Closure (BRAC) sites during the remedy evaluation, selection, and design phases have significant risk and performance implications on site cleanup. This guidance document describes how Navy remedial project managers (RPMs) and contractors working on these sites can apply key principles during planning and design of a remedy to ensure appropriate technologies are selected and optimized, and remedial action objectives (RAOs) are met efficiently and cost-effectively. Additional information supporting Naval Facilities Engineering Command (NAVFAC)’s policies and guidance documents related to ER are located on the following Web page: https://portal.navfac.navy.mil/go/erb.
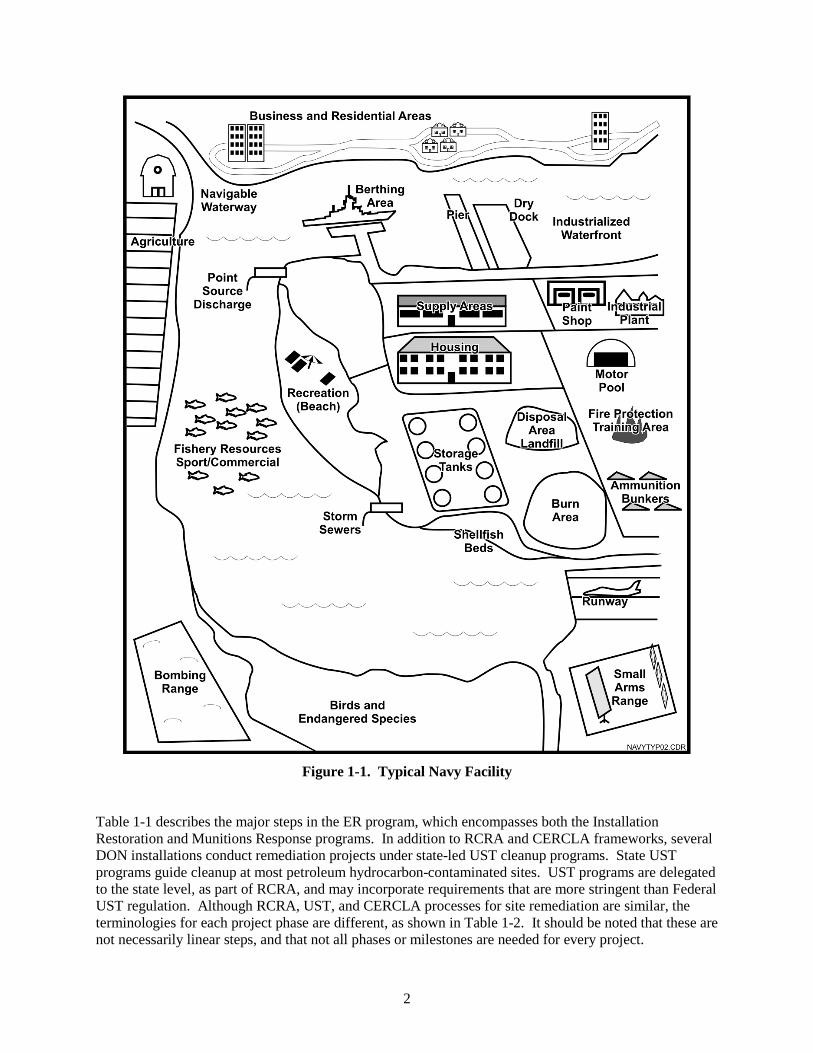
1.1 Background The cleanup of Navy installations poses a major challenge because of the wide variety of activities conducted at these sites and the fact that most Navy installations are located in coastal regions with shallow groundwater and sometimes nearby ecologically sensitive habitats. It is estimated that more than $3 billion is needed to complete the remediation efforts at the current Navy ER sites (DON, 2008). Figure 1-1 summarizes the typical activities that take place at and near Navy installations. Most Navy facilities provide a variety of support functions for aircraft, submarines, and ships. Historic waste management practices associated with these activities have resulted in the release of contaminants to soil, sediment, and groundwater at Navy sites over the last several decades. Some examples include: (a) petroleum hydrocarbons released to soil and groundwater at leaking underground storage tank (UST) sites, tank farms, or former firefighting training areas; (b) equipment from cleaning and degreasing operations that led to chlorinated solvent releases to the environment; (c) sediments that become contaminated through wastewater discharges or stormwater runoff containing chemicals such as polycyclic aromatic hydrocarbons (PAHs) or polychlorinated biphenyls (PCBs); and (d) other contaminant releases that could have occurred as a result of other typical activities at Navy installations, including municipal solid waste landfills, paint shops, plating shops, dry cleaners, and firing ranges.
1.2 Regulatory Framework and Navy Policy In 1980, the Comprehensive Environmental Response, Compensation, and Liability Act (CERCLA) was established to provide a legal framework for cleanup of contaminated sites. The Defense Environmental Restoration Program (DERP) was created when CERCLA was amended in 1986 through the Superfund Amendments and Reauthorization Act (SARA). Through DERP, the Department of Defense (DoD) formally adopted the CERCLA process for most environmental cleanups conducted by DON and other military services. In general, the Navy ER program adheres to the requirements set forth in CERCLA and its implementing regulation known as the National Oil and Hazardous Substances Pollution Contingency Plan (NCP). At DON facilities, the Resource Conservation and Recovery Act (RCRA) also may be applied by regulatory agencies for corrective actions at sites or facilities impacted by past treatment, storage, and disposal practices. It is important to note that the majority of environmental releases (includ-ing accidental spills at DON facilities) occurred prior to the establishment of current environmental laws.
2
Figure 1-1. Typical Navy Facility
Table 1-1 describes the major steps in the ER program, which encompasses both the Installation Restoration and Munitions Response programs. In addition to RCRA and CERCLA frameworks, several DON installations conduct remediation projects under state-led UST cleanup programs. State UST programs guide cleanup at most petroleum hydrocarbon-contaminated sites. UST programs are delegated to the state level, as part of RCRA, and may incorporate requirements that are more stringent than Federal UST regulation. Although RCRA, UST, and CERCLA processes for site remediation are similar, the terminologies for each project phase are different, as shown in Table 1-2. It should be noted that these are not necessarily linear steps, and that not all phases or milestones are needed for every project.
3
Table 1-1. Phases in the ER Process
Phase/Milestone Description
Preliminary Assessment (PA)
The PA is a brief assessment that uses available historic information to determine the probability of and possible locations of potentially contaminated areas.
Site Inspection (SI)
The SI is a limited on-site investigation and includes a physical inspection of potential sites and, depending on site type, would include soil, surface water, sediment and/or groundwater sampling.
Remedial Investigation (RI)
The RI is a comprehensive assessment that includes characterizing the site (including nature and extent of contamination), determining the regulatory requirements, and conducting a baseline risk assessment for human health and the environment.
Feasibility Study (FS)
The RI provides the site-specific information needed in the FS to identify and analyze the range of remedial action options available at a given site. RPMs can refer to several United States Environmental Protection Agency (U.S. EPA) guidance documents associated with preparation of an FS, such as Guidance for Conducting Remedial Investigations and Feasibility Studies under CERCLA, Interim Final (U.S. EPA, 1988): http://www.epa.gov/superfund/policy/remedy/sfremedy/rifs/overview.htm
Engineering Evaluation/Cost Analysis (EE/CA)
Non-time critical removal actions and interim remedial measures require completion of a less comprehensive feasibility review called an EE/CA. More information can be found in the U.S. EPA Guidance on Conducting Non-Time Critical Removal Actions under CERCLA- OSWER Publication 9360.0-32 (1993a).
Record of Decision (ROD)
The ROD is the decision document that describes the background information on the site, the preferred remedial approach, and the rationale behind its selection. The ROD is completed after a Proposed Plan (PP) has been drafted and released to inform the public and obtain comments on the preferred remedial approach. The U.S. EPA Guide to Preparing Superfund Proposed Plans, Records of Decision, and Other Remedy Selection Decision Documents provides more detailed information on the recommended outlines and content for PPs, RODs, Explanation of Significant Differences (ESD), and ROD Amendments (U.S. EPA, 1998). An Action Memorandum is the abbreviated form of a decision document for removal actions, except that the Action Memorandum is only required to be signed by the installation Commanding Officer, and not by the regulatory agencies. An improved ROD is a traditional ROD that provides the full rationale for remedy decision in a concise document through the use of streamlined text, figures, and tables with appropriate references to supporting documentation in the administrative record (AR). The improved ROD must comply with CERCLA and the NCP and follow U.S. EPA guidance. The distinguishing characteristics of an improved ROD are a consolidated outline, detailed references to AR documents that substantiate the information presented, and concise text with maximum use of tables and figures, including a graphic CSM, to summarize key information in formats that are easily interpreted by most readers. More information on improved RODs is available on the Navy improved ROD Web portal at: http://www.ert2.org/t2RODPortal/?id=home.
Remedial Design (RD)
The RD is the design of the selected remedial action, which includes preparation of technical work plans, drawings, and specifications.
Remedial Action Construction (RA-C)
RA-C is the part of the remedial action phase in which a construction contractor cleans up the site or builds and installs a remediation system, and demonstrates that the system is functioning as designed.
Table 1-1. Phases in the ER Process (Continued)
4
Phase/Milestone Description
Remedy in Place (RIP)
RIP is a milestone during the remedial action phase which indicates that the remedial action has been successfully constructed or implemented, and has been demonstrated to be functioning as designed.
Remedial Action Operations (RA-O)
RA-O is the part of the remedial action phase in which the ongoing cleanup work takes place, including O&M support and ongoing monitoring to ensure that the system is operating properly and successfully. Some sites are cleaned up during the RA-C phase (e.g., excavation), and therefore may not require RA-O.
Response Complete (RC)
The RC milestone indicates that the RAOs have been met and the site no longer represents an unacceptable risk to human health and the environment.
Long-Term Management
The long-term management of a site may be required following RC to ensure that conditions at the site continue to be protective of human health and the environment. This could include additional monitoring, land use controls (LUCs), and five-year reviews.
Site Closeout (SC)
SC is reached when a site is acceptable for unrestricted use, unlimited exposure (UUUE) and there is no expectation of further funds to be expended at a site.
Table 1-2. RCRA, UST, and CERCLA Processes for Remediation of Contaminated Sites
RCRA UST CERCLA
RCRA Facility Assessment (RFA) Site Investigation Preliminary Assessment/ Site Inspection (PA/SI)
RCRA Facility Investigation (RFI) Remedial Investigation (RI) Corrective Measures Study (CMS) Corrective Action Plan
(CAP)
Feasibility Study (FS) Draft Permit Modification Proposed Plan (PP) RCRA Permit Record of Decision (ROD)
Corrective Measures Implementation Remediation Work Plan Remedial Design/ Remedial Action (RD/RA)
The Navy strives to implement consistent cost-effective remediation and management approaches during each of these regulatory-driven processes. NAVFAC policies and associated guidance documents are available for various stages/phases of the ER process (see the ER Technology Transfer Web Portal [Documents tab], the NAVFAC ER and BRAC Web Site, and the Optimization Work Group Page to view and download guidance and policy). The Chief of Naval Operations (CNO) Environmental Readiness Division (N45) established Navy/Marine Corps policy for optimizing remedial and removal actions under the Navy Environmental Restoration Program (NERP) (CNO, 2004). This policy is applicable to various phases of the clean-up process:
remedy evaluation (e.g., feasibility study);
remedy selection (e.g., record of decision);
remedial design;
remedial action construction;
remedial action operation (RA-O); and
long-term management (LTMgt).
5
The Navy/Marine Corps optimization policy requires that at each phase of the cleanup, an evaluation of available data is required to ensure that all remedies are continually optimized. The policy further states that documentation within the Navy’s Normalization of Environmental Data Systems (NORM) database is required of all optimization efforts. Periodic third-party independent optimization reviews are highly effective and recommended by the NAVFAC Optimization Workgroup. The following four options (or combination thereof) are available to RPMs for the optimization review and are specified as choices within NORM:
NAVFAC Engineering Service Center (ESC) Tiger Team. A third-party independent optimization review coordinated through NAVFAC ESC drawing upon expertise from industry, academia, other government agencies, and DON. Depending upon site-specific requirements, this could be mostly a contracted effort.
Internal Tiger Team (i.e., a team from the Facilities Engineering Command [FEC] technical group). A third-party independent optimization review primarily by an internal DON team with senior technical staff from DON organizations, e.g., NAVFAC Atlantic, NAVFAC Pacific, other FECs, NAVFAC ESC, and BRAC Program Management Office (PMO). Relatively minor contract support may be acquired to support this effort.
Contracted Optimization Review. A third-party independent optimization review conducted by contractors other than the current operation and maintenance (O&M), design, or remediation contractor for the system being evaluated. Contract support from NAVFAC ESC is available for these reviews.
Project Team. Optimization review performed by the project team that is comprised of senior technical staff from within the FEC working with the RPM and current contractors.
This updated guidance document provides RPMs and contractors with specific instructions for how to meet the objectives of Navy/Marine Corps policy related to the optimization of remedy evaluation, selection and design. Extensive updates and revisions have made to the 2004 version of this guidance and some of the more significant changes include: inclusion of sustainability concepts to account for overall environmental footprint that a remedial action may have; an expanded view of the conceptual site model (CSM); and revised methods for developing the decision documents. The NAVFAC ER Optimization Workgroup led the development of this and other guidance documents related to optimization during various phases of the clean-up process. The Guidance for Planning and Optimizing Monitoring Strategies (NAVFAC, 2008a) provides procedures to ensure that Navy monitoring programs are designed and periodically optimized to cost-effectively support program goals throughout the RA-O and LTMgt phases. The Guidance for Optimizing Remedial Action Operations (NAVFAC, 2001) provides step-wise optimization guidance during the RA-O phase of the process.
1.3 Benefits of Optimization Applying optimization concepts throughout the ER process helps to ensure the most appropriate remedies are screened, evaluated, selected, designed, and properly operated/maintained. Thus, the optimization concepts presented in this document should be considered during routine execution of all phases of project work. However, optimization also includes periodic optimization reviews at key phases of the remedial process, besides being in compliance with Navy policy, a well-implemented optimization review process offers several benefits. The optimization process provides an independent assessment of the technical approach (i.e., clean-up technologies and monitoring techniques), regulatory issues (including regulatory drivers and stakeholder/social issues), and cost strategy, which may offer the following benefits:
6
Reveal certain obstacles or issues that need to be addressed or efficiencies that may be gained by leveraging experience from similar sites;
Implement a more robust remedy with wider acceptance;
Achieve long-term cost avoidance and savings resulting from more optimal use of available technologies;
Ensure sustainability factors are appropriately considered when selecting the remedial approach as well during the planning, design and operation of the remedial system; and
Ensure efficient, cost-effective and sustainable site closeout.
The increase in efficiency and cost effectiveness is well documented through information in the NORM database. As of mid-way through FY09, a total of 233 sites have been reported to have undergone an optimization review. For these sites, a total of $7,442,157 has been spent on performing the review plus an additional $4,444,733 to implement optimization recommendations for a total optimization investment of $11,886,890. The documented cost avoidance is $82,277,101 for a return on investment of 6.9. As illustrated by these numbers, optimization has been found to significantly improve the efficiency of the overall ER program.
1.4 Objectives The objective of this guidance is to highlight the important principles that should be considered by the RPMs and their contractors during optimization of the clean-up strategy at key steps, namely Feasibility Study (FS), Record of Decision (ROD), and Remedial Design (RD) for the optimization of remedial systems at Navy ER sites. This document is meant to serve as a companion to the previous optimization guidance documents identified in Section 1.2. Although the recommendations in this guidance are focused on optimization principles that apply to early remedy implementation steps, optimization principles can be applied during later stages of the clean-up process as well. This document provides a general overview and explanation of key optimization concepts as they pertain to the FS, ROD, and RD clean-up phases. This document is not intended to provide guidance on determining site-specific risk-based clean-up goals, performing risk assessments, conducting site assessments and background investigations, or other site-specific contaminant characterization activities for which United States Environmental Protection Agency (U.S. EPA) and Navy guidance (NAVFAC, 2002a; 2003a; 2003b; 2004a; 2004b; 2008b) already exists. Rather, this document complements these important components of the site remediation process by providing recommendations for optimizing remedy selection and design.
1.5 Document Organization This document is organized as follows to provide relevant background information and a step-wise approach for Navy RPMs to optimize projects during the FS, ROD, and RD phases:
Overview of Optimization Elements (Section 2.0) – Includes a discussion of optimization elements including CSMs, RAOs, target treatment zones, treatment trains, performance objectives, and optimization and exit strategies.
Considerations for Optimizing Remedies During the FS (Section 3.0) – Provides remedy optimization recommendations to consider during remedy screening, evaluation, and selection.
Considerations for Optimizing ROD Flexibility (Section 4.0) – Provides recommendations to prepare a ROD with sufficient flexibility to allow optimization, technology transition, and cost-effective cleanup.
7
Considerations for Optimizing Remedies During the RD (Section 5.0) – Provides remedy optimization recommendations to consider during remedy design.
Additional Information and Case Examples
Additional information and case examples are provided throughout the text and are contained in text boxes like this. They are intended to provide guidance on additional informa-tion/resources and to expand further on key concepts presented in the text.
8
2.0 OVERVIEW OF OPTIMIZATION CONCEPTS To incorporate remedy optimization concepts in the remedy selection and design phases, several iterative steps of the ER program require careful attention:
Develop and maintain an up-to-date CSM that reflects the level of complexity of the site and all the information known about the site.
Identify RAOs that provide a clear and concise description of what the remedial action should accomplish at the site and how the remedial action protects human health and the environment, but allows flexibility regarding the technologies and methods used to accomplish the RAOs. The RAOs should be revisited periodically to incorporate current regulations, standards, requirements, and other precedents.
Identify the target treatment zone(s) based on CSM and RAOs.
Develop remedial alternatives, including “treatment trains,” for each target treatment zone, incorporating typical life-cycle behavior. As part of this step, conduct a life-cycle cost analysis to evaluate individual unit processes and the total cost for each remedial alternative. The cost analysis should be refined throughout the remedy selection and design process.
Develop realistic system performance objectives for each component of the treatment train that account for technology applicability and limitations (e.g., source treatment vs. plume control).
Develop an optimization and exit strategy for each component of the treatment train. When developing the exit strategy, consideration should be given to the impact on cost as well as sustainability metrics if remedial systems operate beyond the point of diminishing returns.
Consider the sustainability of each alternative and identify elements of each alternative that result in the most significant environmental footprint along with potential footprint reduction techniques.
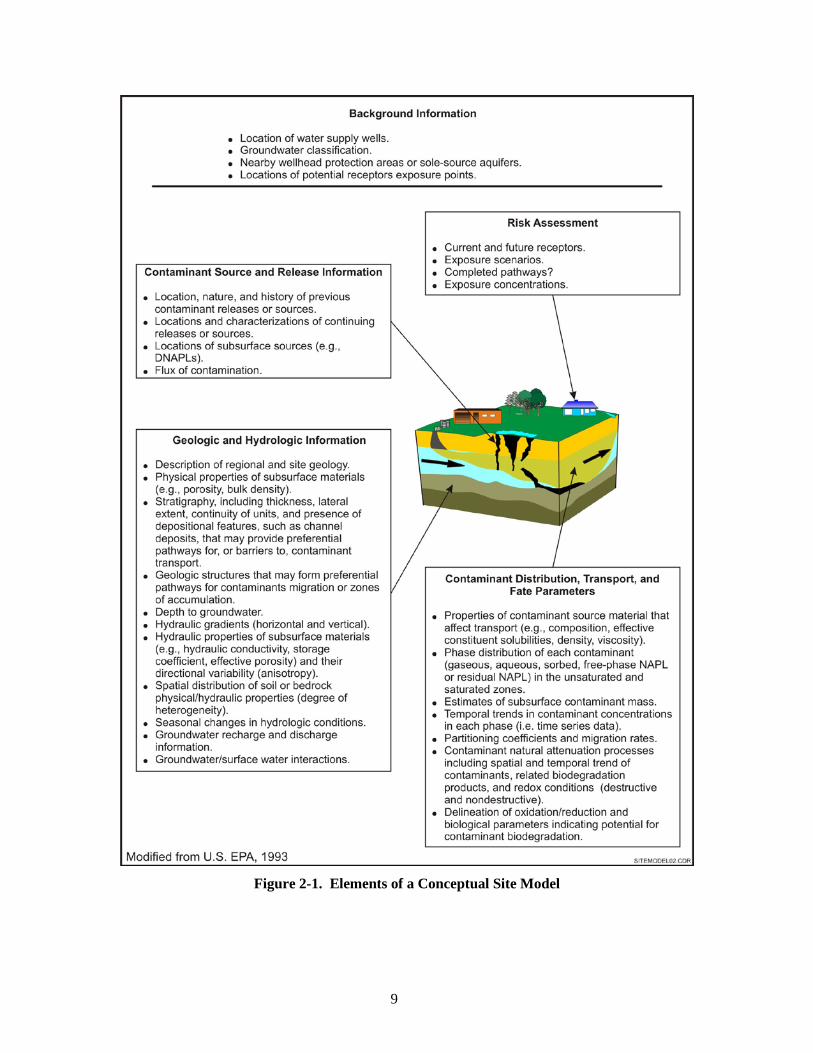
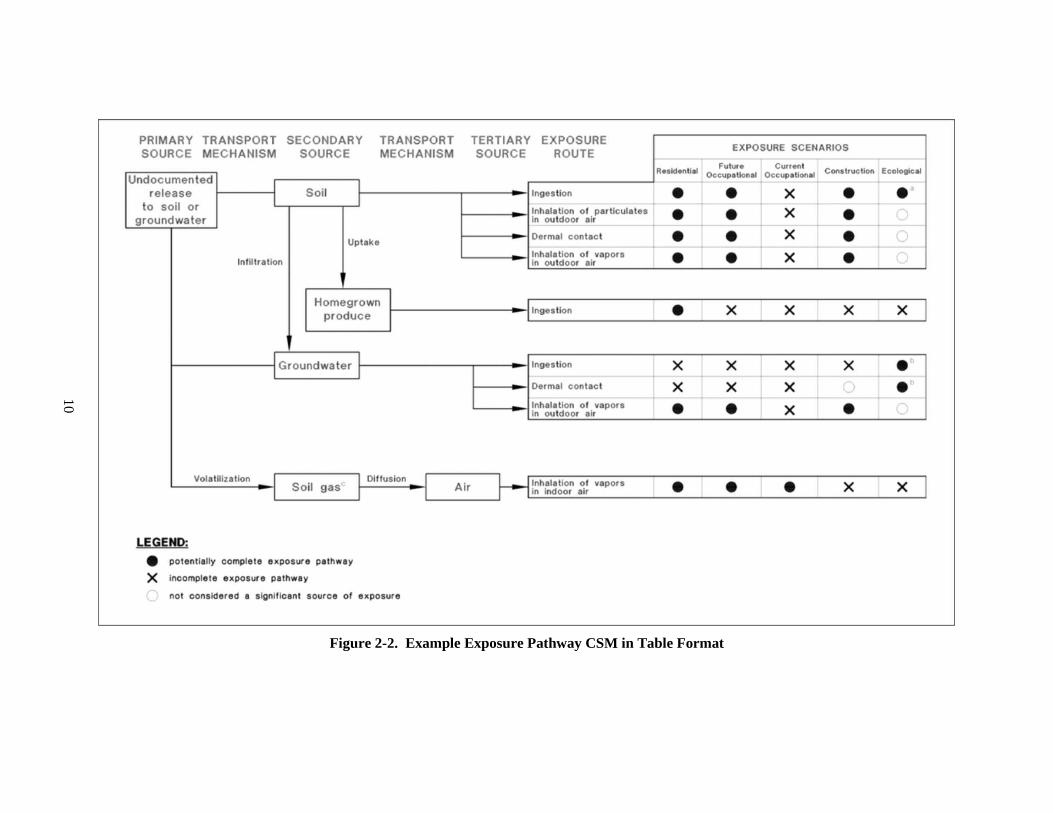
2.1 Conceptual Site Model An important optimization component is the development and maintenance of an up-to-date and well-defined CSM. The CSM is a useful engineering management tool and helps to successfully manage a site through the ER process. A comprehensive CSM should include background information, geologic and hydrogeologic data, contaminant source, distribution and fate and transport data, and risk assessment information for a given site. A comprehensive CSM includes the elements illustrated in Figure 2-1. There are several formats which can be used to display elements of a CSM and a comprehensive CSM should include a network of data visualization methods, such as text, schematic, tables, Geographic Information System (GIS) maps, photos, three-dimensional (3-D) physical model, computer model, receptor flow chart, two-dimensional (2-D) cross section, time-series plots, and treatment train conceptual design. An example of each of these various CSM formats is provided in the CSM Tool (CSM Visualization tab) on the NAVFAC Environmental Restoration Technology Transfer (ERT2) Web site and selected examples are presented in Figures 2-2 through 2-5. The most appropriate formats for visualization of the CSM will vary based on specific project and document needs. For instance, 3-D figures may provide an overall summary, but also may be hard to interpret. On the other hand, cross sections are easier to comprehend, but may not accurately represent site conditions with respect to
9
Figure 2-1. Elements of a Conceptual Site Model
10
Figure 2-2. Example Exposure Pathway CSM in Table Format
11
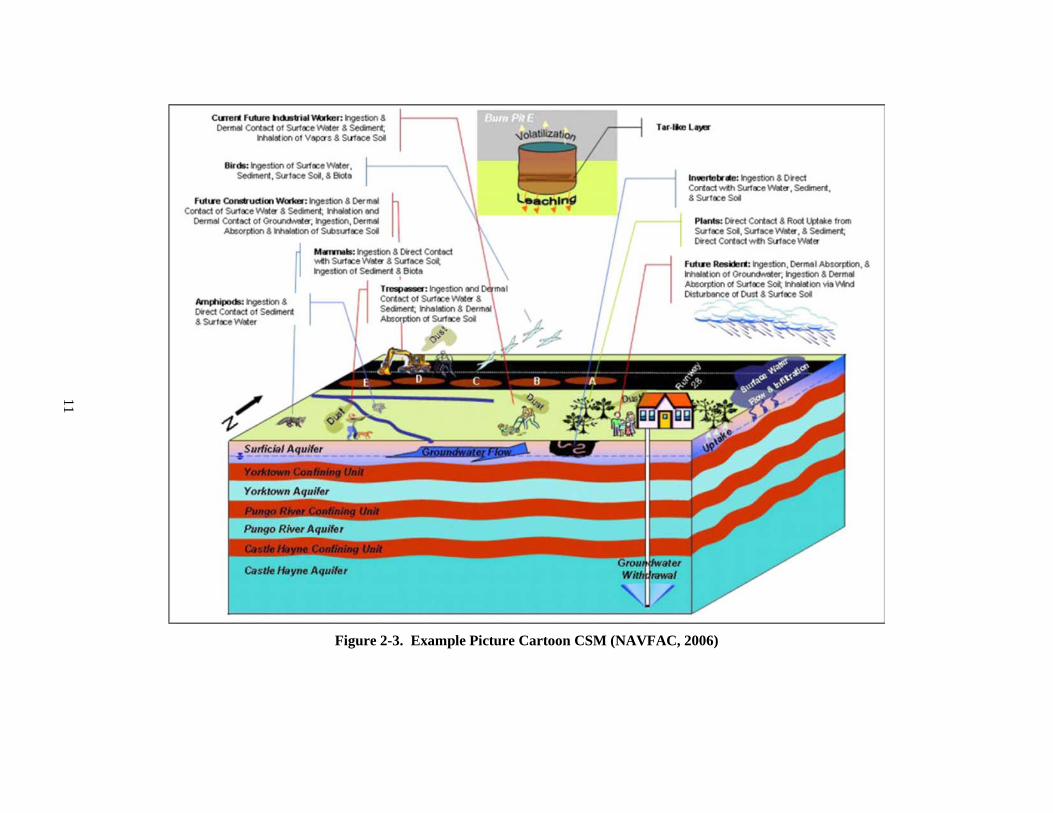
Figure 2-3. Example Picture Cartoon CSM (NAVFAC, 2006)
12
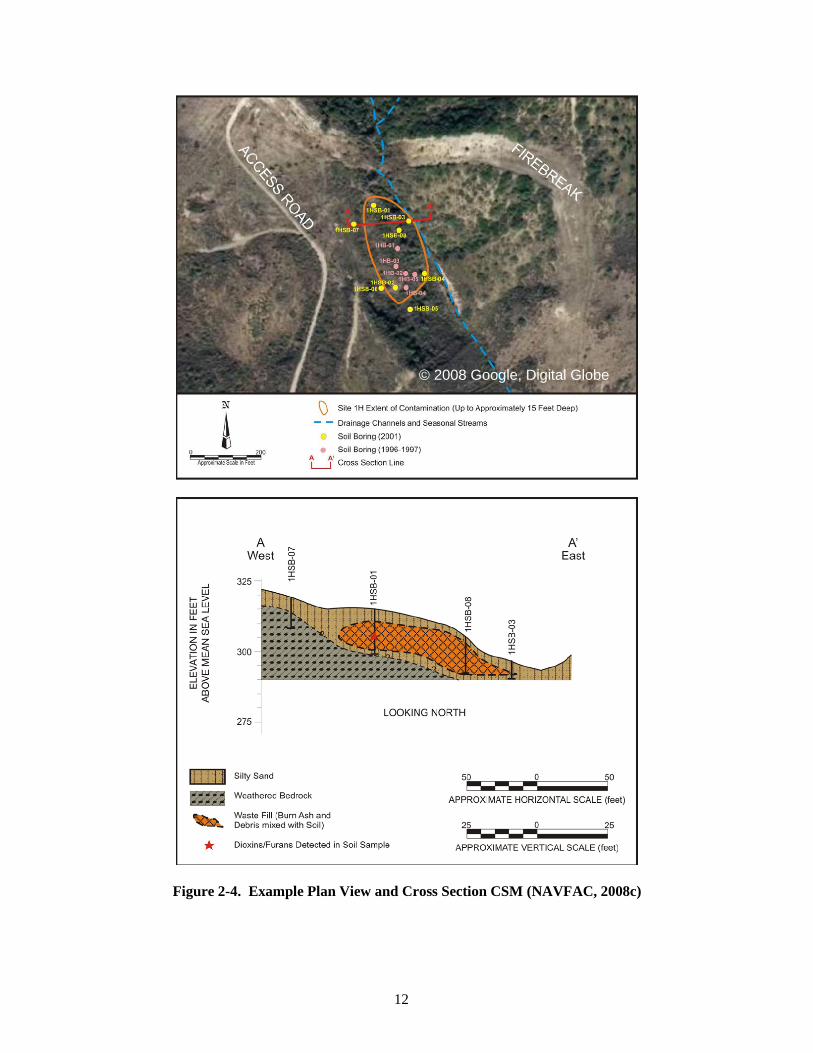
Figure 2-4. Example Plan View and Cross Section CSM (NAVFAC, 2008c)
© 2008 Google, Digital Globe
13
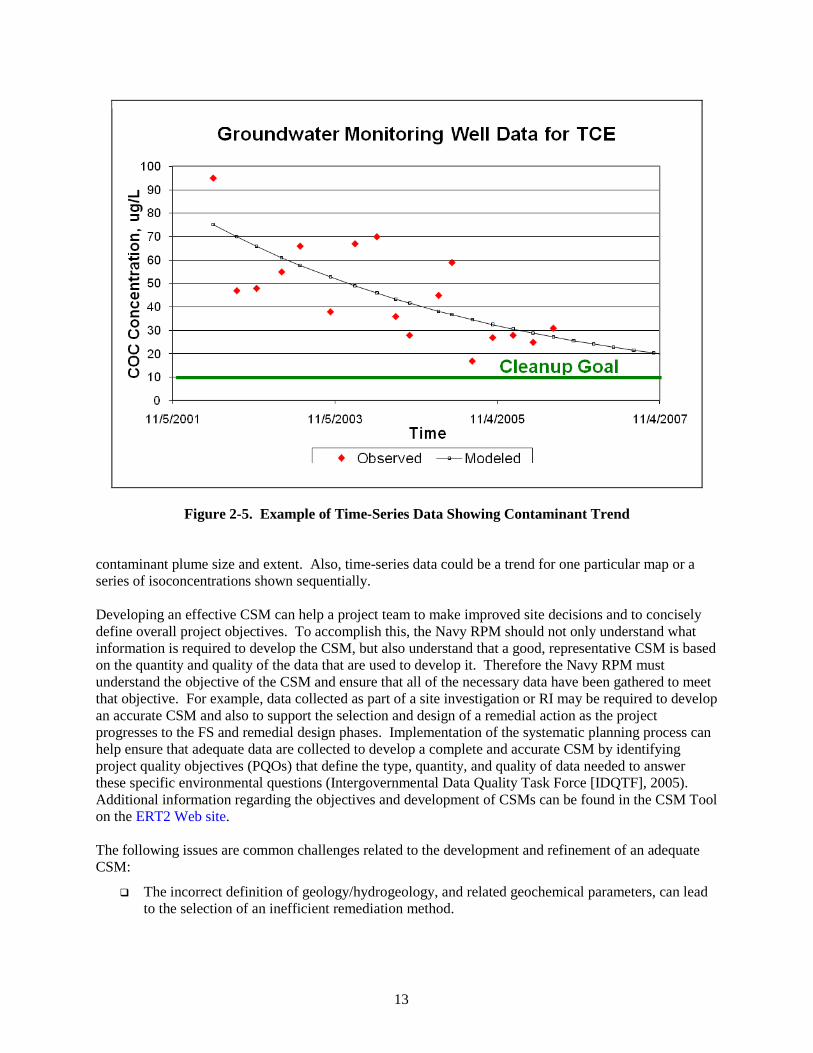
Figure 2-5. Example of Time-Series Data Showing Contaminant Trend
contaminant plume size and extent. Also, time-series data could be a trend for one particular map or a series of isoconcentrations shown sequentially. Developing an effective CSM can help a project team to make improved site decisions and to concisely define overall project objectives. To accomplish this, the Navy RPM should not only understand what information is required to develop the CSM, but also understand that a good, representative CSM is based on the quantity and quality of the data that are used to develop it. Therefore the Navy RPM must understand the objective of the CSM and ensure that all of the necessary data have been gathered to meet that objective. For example, data collected as part of a site investigation or RI may be required to develop an accurate CSM and also to support the selection and design of a remedial action as the project progresses to the FS and remedial design phases. Implementation of the systematic planning process can help ensure that adequate data are collected to develop a complete and accurate CSM by identifying project quality objectives (PQOs) that define the type, quantity, and quality of data needed to answer these specific environmental questions (Intergovernmental Data Quality Task Force [IDQTF], 2005). Additional information regarding the objectives and development of CSMs can be found in the CSM Tool on the ERT2 Web site. The following issues are common challenges related to the development and refinement of an adequate CSM:
The incorrect definition of geology/hydrogeology, and related geochemical parameters, can lead to the selection of an inefficient remediation method.
14
The inadequate definition of contaminant type, source areas, and distribution can lead to incomplete and/or prolonged site remediation.
Failure to prepare time-series data can lead to a lack of understanding of contaminant trends.
The CSM is first developed during the PA/SI phase, but should be updated continually as new information becomes available to enhance remedy selection and design. In some cases, long periods of time could elapse between the different phases of a project and it is essential that an up-to-date CSM is used to make the optimum decisions. For example, at the time the remedy is being selected, there may have been several rounds of chemical data collected from a monitoring well network that was not included in the RI report. In addition, site features may have changed as a result of building demolition or new construction, or removal actions to address previously identified source areas may have been completed. This new information must be incorporated into the CSM, and it is of particular importance to ensure that the CSM is updated prior to entering the next phase of the project or making any decisions regarding the remedy selection or design. During the remedy implementation and long-term site management phases, the CSM should continue to be updated as performance data are collected, and analyzed to refocus the remedy(ies) as necessary based on an “observational approach”. The CSM should be considered a living tool that needs to be updated after every event and kept up-to-date throughout every stage of the process. The preferred method of maintaining the CSM is through electronic data management systems. This allows the CSM to be updated in the most efficient manner and allows a greater number of people to have access to the CSM. The Naval Installation Restoration Information Solution (NIRIS) is a central web-based electronic data management system developed by the Navy that is used to store both analytical and spatial data for ER projects at Navy and Marine Corps sites. NIRIS offers tools to access, query, visualize, analyze, and extract data, and should therefore be used by Navy RPMs and their contractors to support development and continued maintenance of the CSM. In some cases, a targeted CSM may be useful where a more precise depiction is needed in a particular area or for a particular element of the comprehensive CSM to address a specific question or to support additional investigative sampling at the site. For example, a targeted CSM could include a focused look at the source zone for conceptual remedial design or a fate and transport model for groundwater discharge to surface water near the site boundary. Alternately, for an Ecological Risk Assessment (ERA), the targeted CSM may focus on the exposure pathways and assessment endpoints. Results of the targeted CSM need to be incorporated into the comprehensive CSM.
2.2 Remedial Action Objectives U.S. EPA defines RAOs as medium-specific (e.g., soil or groundwater specific) goals for protecting human health and the environment (U.S. EPA, 1988). RAOs serve to focus the remedy selection process and provide context for the overall scope of potential clean-up activities at a site; therefore, they guide the development and assessment of suitable remedial alternatives. RAOs are based on the contaminants of concern (COCs), the impacted media, fate and transport of COCs, the exposure routes, and the potential receptors identified in the CSM. The RAOs should provide a clear and concise description of what the remedial action should accomplish at a given site. Some sample RAOs for soil, sediment, groundwater, and landfill sites are as follows:
Limit human and ecological receptors from direct exposure to contaminants in surface soil.
Remove contaminant mass in the vadose zone to the degree necessary to prevent further degradation of the groundwater above groundwater clean-up standards and minimize the aquifer clean-up time.
15
Limit human and ecological exposure to contaminated sediments.
Prevent COCs in groundwater from reaching points of compliance (POCs) at concentrations above the clean-up goal.
Protect future residential receptors from unacceptable risks associated with inhalation and ingestion of volatile organic compounds (VOCs) in groundwater.
Prevent infiltration of precipitation into landfill waste to minimize leachate and prevent surface exposure.
Once the RAOs have been established, the final remedial goals are selected to meet the identified objective. Remedial goals may be established based on regulatory standards, such as maximum contaminant levels (MCLs) for groundwater consumption, or site-specific risk-based values that have been determined to be protective of human health and the environment. Since the remedial goals are developed to achieve the RAO, the RAO does not need to specifically identify the final remedial goals. Establishing this type of flexible RAO allows for consideration of the greatest number of remedial alternatives in the FS, as alternatives which include engineering or institutional controls can be evaluated along with those that include active treatment. For example, given the above RAO to protect future residential receptors from unacceptable risks associated with inhalation and ingestion of VOCs in groundwater, the final remedial goals would be MCLs. However, the flexible RAO allows evaluation of several alternatives including (1) treatment of all COCs to below MCLs, (2) treatment to achieve COC concentrations in groundwater protective of the vapor intrusion pathway with institutional controls to prohibit the use of groundwater for drinking water purposes, and (3) use of engineering controls (e.g., vapor barriers) and institutional controls (e.g., prohibiting the use of groundwater as drinking water) without any active treatment. Preliminary RAOs may be recommended in the RI report based on results of the risk assessment. The RAOs should be clear and concise without being overly prescriptive so that when they are incorporated into the FS a broad range of remedial alternatives can be evaluated. For example, an overly prescriptive RAO may state that groundwater in a certain area must be hydraulically controlled to prevent migration of COCs to a downgradient surface water body. This is a poorly written RAO because it requires that groundwater extraction and treatment be performed over the area where clean-up goals are exceeded. A preferred RAO would be to prevent migration of COCs to the surface water body at concentrations that would cause surface water standards to be exceeded. This accomplished the same overall objective but allows much more flexibility with respect to how this is achieved. Final RAOs are then documented in the ROD or other decision documents based on what was developed and evaluated in the FS.
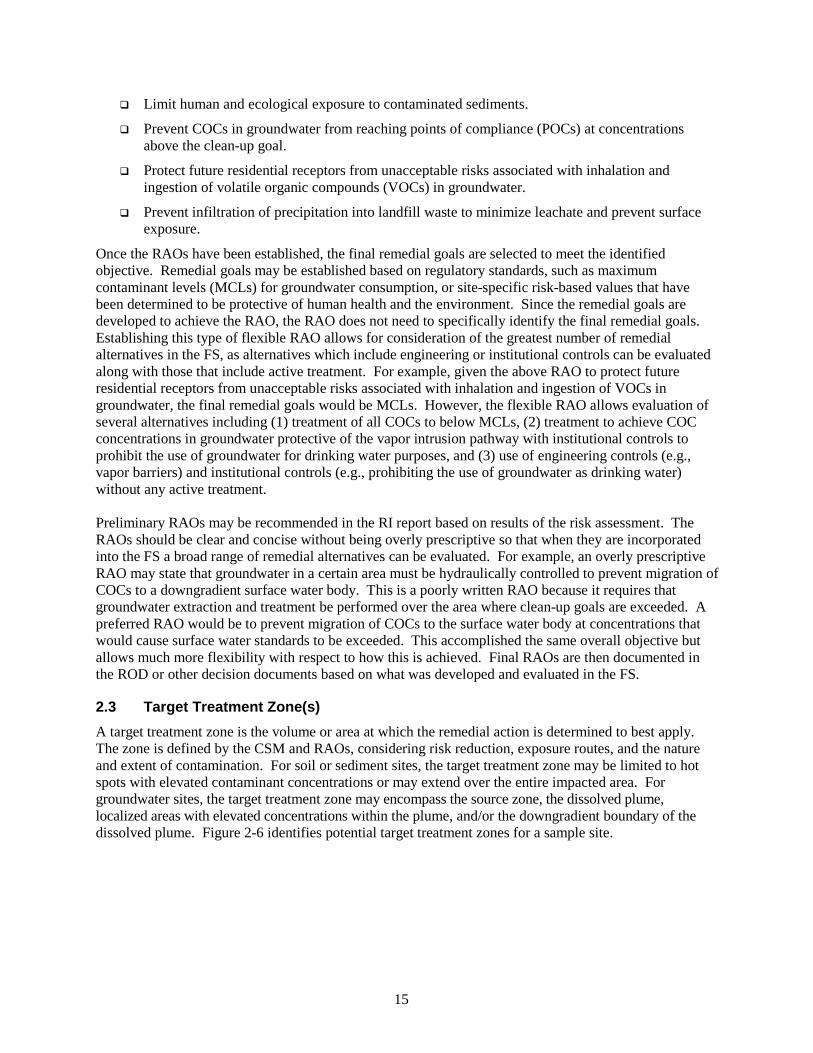
2.3 Target Treatment Zone(s) A target treatment zone is the volume or area at which the remedial action is determined to best apply. The zone is defined by the CSM and RAOs, considering risk reduction, exposure routes, and the nature and extent of contamination. For soil or sediment sites, the target treatment zone may be limited to hot spots with elevated contaminant concentrations or may extend over the entire impacted area. For groundwater sites, the target treatment zone may encompass the source zone, the dissolved plume, localized areas with elevated concentrations within the plume, and/or the downgradient boundary of the dissolved plume. Figure 2-6 identifies potential target treatment zones for a sample site.
16
Figure 2-6. Example Site: Potential Target Treatment Zones and RAO per Zone
The selection of the target treatment zone, as defined within the CSM, has a very significant impact on the life-cycle costs for a remediation project and often influences the length of time needed to achieve RC at a given site. In most cases, targeting hot spots or source zones can be a cost-effective means of removing a large amount of mass in a relatively short time period. However, such remedies are effective only if targeted and applied properly. In some cases, in situ technologies were initially considered ineffective, but further analysis indicated the target treatment zones were not well-defined and the technologies were not tested and specifically targeted to where the majority of contaminants were present. In situations like these, attempts to optimize can be difficult and futile. Accurate delineation of the source zone and hydrogeologic and geochemical parameters are critical for effective design and implementation of remedies. In many cases, the CSM reveals that the site has areas with significantly different characteristics, either due to differences in geology/hydrogeology or differences in the levels and types of contamination. A typical example is one in which a moderately sized source zone exists where COC concentrations are extremely high but downgradient of the source zone is a very large plume that contains low to moderate levels of COCs. Applying the same technology to the entire site would likely result in either: (1) an inefficient remediation system that uses a costly and aggressive system over a large area, resulting in a very high project cost or (2) an ineffective system that does not adequately address the source area, resulting in continued releases of COCs from the source area. In order to address this situation in an optimal fashion, it is important to first have an adequate CSM that properly depicts the differences between different parts of the site and then to implement multiple technologies or approaches to address each target treatment zone. In some cases, multiple techniques should be applied to different parts of the plume based on conditions at each location, considering contaminant depth, COC concentration, changes
17
in geology/hydrogeology, and surface features. Sites with large plumes can be very complex to manage and it is suggested that a holistic strategic approach be implemented that may include a variety of techniques, such as treatment barriers, containment methods, monitored natural attenuation (MNA), development of alternate clean-up levels, and LUCs. A comprehensive discussion of plume management strategies is included in the Navy Groundwater Risk Management Handbook (NAVFAC, 2008d).
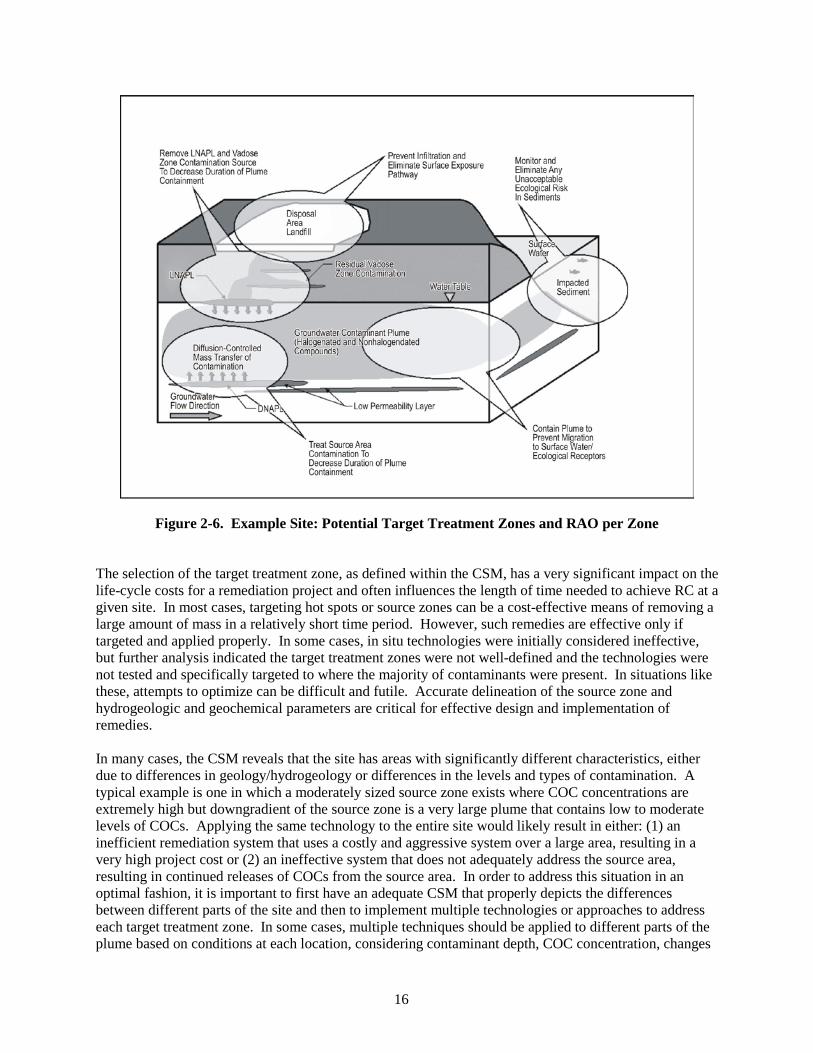
Identifying Target Treatment Zones and the Sequential Application of Passive Clean-up Processes, Naval Weapons Station, Charleston, SC
Project Summary
A former UST site is the location of a mixed chlorinated aliphatic groundwater plume containing perchloroethene (PCE), trichloroethene (TCE), and 1,1,1-trichloroethane (1,1,1-TCA) in excess of 100 mg/L concentrations of total chlorinated volatile organic compounds (CVOCs) in groundwater. CVOCs at high dissolved concentrations and/or in the form of dense non-aqueous phase liquid (DNAPL) distributed as ganglia are located in the low permeability sediments from land surface to approximately 10 ft below land surface. Identification of treatment zones and the application of sequential passive treatment technologies were instituted as shown in Figure 1. Loblolly pine trees were planted to treat contamination in the source area without encouraging the downward migration of solvents into the lower, more permeable formation. This created a mechanism for direct uptake, phyto-volatilization, and improved soil structure to enhance biodegradation in the newly formed rhizosphere. Immediately downgradient of the source area, a permeable reactive barrier (PRB) consisting of zero-valent iron (ZVI) is used to treat high CVOC groundwater concentrations that have the potential to exceed the natural attenuation capacity of the aqui-fer. The PRB acts to cut off the pollutant load to the downgradient portion of the flow zone and the detached plume downgradient of the PRB can be naturally attenuated prior to dis-charge to a freshwater marsh. A mature lowland forest that incorporates direct uptake for phytovolatilization is part of the natural attenuation processes in the downgradient plume area beyond the PRB.
Figure 1. Identification of Target Treatment Areas
Optimization Strategy Employed
Identifying the target treatment zones aided in the subsequent identification of the appropriate level of remedial action required within each zone which allowed the project team to take advantage of the naturally occurring passive processes (MNA and phytovolatilization) and to enhance these processes using low energy techniques (PRB and engineered phyto-remediation) for treatment of the entire plume area. This optimized the remedial design and implementation by avoiding the higher costs associated with more aggressive engineered remedies and minimized impact to the natural landscape.
18
As part of the optimization process, updating the CSM (and target treatment zones) during the implementation of the active remedy is very important. For example, during the non-aqueous phase liquid (NAPL) source removal process, if it can be established through adequate on-going groundwater monitoring and updating of the CSM that the dissolved plume is stable or receding, MNA can be the final groundwater remedy without having to wait or resort to an additional active groundwater remedy to treat dissolved-phase contaminants.
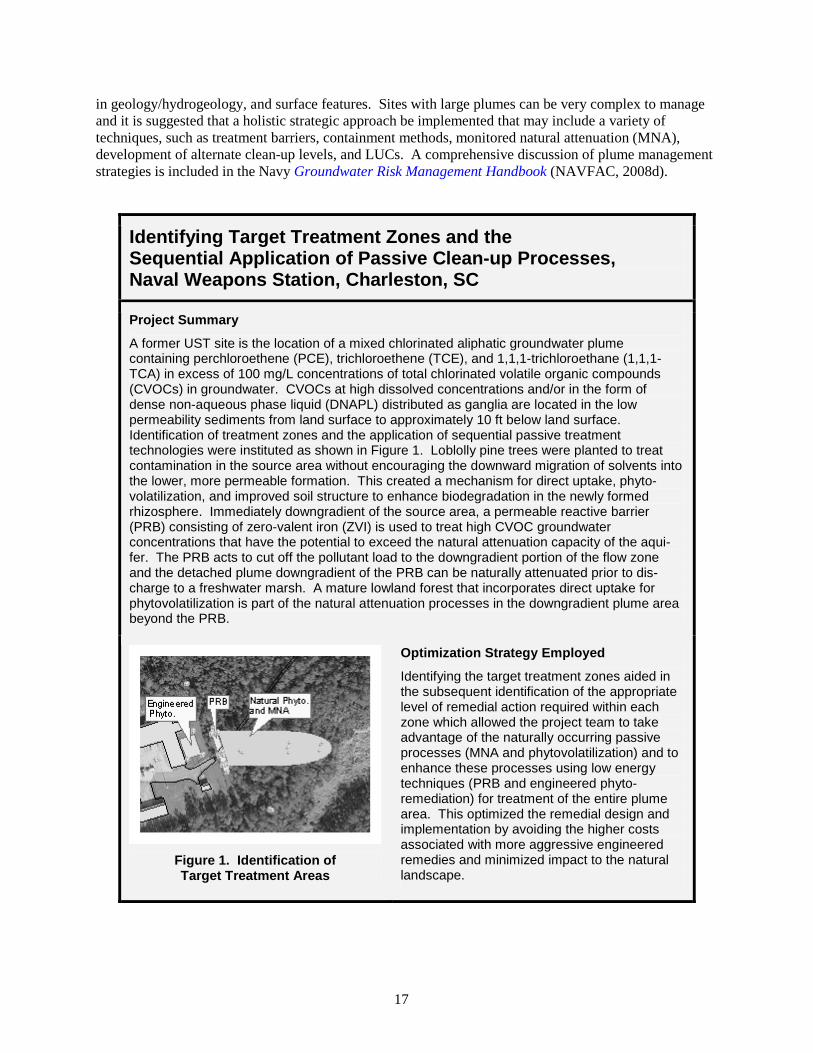
2.4 Multiple Remedial Technologies: The “Treatment Train” Concept A key optimization concept is that of sequential implementation of multiple remedial alternatives, also known as a “treatment train.” A single remedial technology is rarely the most cost-effective approach throughout the life cycle of a site clean-up project. The treatment train concept emphasizes that multiple remedial technologies often are needed to achieve cost-effective remediation at a given site. Figure 2-7 identifies treatment trains or a series of technologies or approaches to be applied over time for each target treatment area in the example site.
Figure 2-7. Example Site: Treatment Train Alternatives
The treatment train concept can be applied to several different aspects of a remediation project. It can include the use of multiple remedial technologies over time. It can encompass the concurrent use of multiple remedial technologies over various locations for the same contaminant and/or media. The treatment train concept can also entail the use of several different unit processes within a single remediation system. All of these perspectives on treatment trains are discussed below.
19
The importance of treatment trains in the wastewater industry offers a good analogy for the need for treatment trains in the remediation field. For example, conventional wastewater treatment is separated into preliminary, primary, secondary, and advanced systems. Preliminary systems remove bulk contamination such as large floating solids, grit, and possibly grease. Primary systems remove suspended solids through sedimentation. Secondary systems are typically biological processes such as trickling filters that remove the soluble and colloidal organic matter that remains after primary treatment. Tertiary, or advanced, wastewater treatment includes techniques that further improve the quality of wastewater and are typically directed at the removal of suspended solids and/or dissolved constituents such as ammonia, nitrogen, phosphorus, and metals. Just as wastewater treatment systems may require multiple technologies to achieve the desired water quality, so often does site cleanup. For example, bulk contaminant removal at a petroleum- or chlorinated solvent-contaminated site may involve hot spot soil excavation as the first step in site cleanup. Following excavation, light non-aqueous phase liquid (LNAPL) removal can be achieved by implementing the appropriate remedial technology such as multiphase extraction or skimming. Following LNAPL reduction, further remediation of soil and/or groundwater may be necessary by active remedial techniques to further reduce contaminant mass. Examples of active remedial techniques include bioventing, soil vapor extraction (SVE), and air sparging (AS). Application of these and other active remedial technologies can be considered analogous to primary or secondary wastewater treatment. Passive technologies that provide for a “polishing step” might be considered analogous to tertiary or advanced treatment. Examples of passive remedial technologies include passive bioventing (e.g., barometric pumping), MNA, and LUCs. A treatment train that combines both an active and passive remedial approach is an important strategy for achieving cost-effective site cleanup. The use of passive remedial technologies is likely an important component of site cleanup because of the difficulty in cost-effectively treating contaminants that are trapped in the subsurface. These contaminants are often trapped within low permeability layers or in pore spaces and their release rate is slow and diffusion-controlled. Examples of this approach are the application of air sparging or chemical oxidation to reduce elevated source area concentrations followed by MNA for groundwater contaminated with dissolved organic compounds. The concurrent implementation of multiple technologies such as LNAPL removal coupled with the downgradient application of MNA may also be effective. While the use of multiple technologies may increase the initial remedial costs because of the need for additional equipment for each technology being implemented, the total life-cycle cost will be reduced because the aggressive systems with high operating cost will operate for a much shorter period of time and will be replaced by operation of less aggressive or passive technologies with a much lower operating cost. Another way to apply the treatment train concept is to consider the selection of various unit processes within a single aboveground treatment system. For example, thermal stripping would involve an extraction unit, a condensation unit, a water treatment unit (or a holding tank for disposal), and an off-gas treatment unit. Each component in the treatment train is cost-effective for a specific purpose and over a specific contaminant concentration range. Selection of appropriate units and buying or leasing options with flexibility to change the treatment components should be an integral part of the treatment train design. Most remedial technologies consist of a treatment train or multiple unit processes.
20
Treatment Train Approach to In Situ Treatment of Chlorinated Solvents in Low Permeability Soils in Conjunction with Natural Attenuation, Marine Corps Logistics Base, Albany, GA Project Summary The Navy completed four pilot tests of in situ treatment of CVOCs in a low permeability forma-tion at Marine Corps Logistics Base (MCLB) Albany. The tests were conducted as part of the RD phase for Operable Unit (OU) 6 which covers base-wide groundwater. The first two tests consisted of injecting ethyl lactate and hydrogen into the formation to enhance the natural biodegradation that was already occurring. The other two tests evaluated the effectiveness of chemical oxidation using potassium permanganate and chemical reduction using ZVI. Soil “fracturing” was utilized in all tests to allow the injected chemicals to treat a greater area. The objectives of the pilot testing program were to help to determine the site-specific viability of each technology and to obtain critical design factors that would minimize life-cycle costs for the selected remedy. Optimization Strategy Employed During the initial stages of the OU 6 RD phase, natural attenuation modeling was performed for the existing base-wide groundwater plume. The objective was to determine what level of contaminants could be left to naturally attenuate within the timeframes set in the ROD. Based on the modeling, active treatment was needed for TCE concentrations above 150 parts per billion (ppb), PCE concentrations above 20 ppb, and carbon tetrachloride (CT) concentrations above 100 ppb. The remaining plume areas are expected to naturally attenuate. This optimization step resulted in a significant reduction in the plume area requiring active treatment. The natural attenuation modeling also helped to support the use of a “treatment train” approach that included active treatment technologies in conjunction with the more passive and inexpensive remedy of MNA. The focus of the pilot test program was to select the active technology in the treatment train that would be most suitable given the low permeability formation and other site-specific condi-tions. Results from both of the enhanced biodegradation tests confirmed that CVOCs could be biodegraded through the addition of an electron donor. The ethyl lactate injections caused an 80% reduction in TCE after two months, and significant production of daughter products including vinyl chloride. The hydrogen sparge injections had less of an effect on CVOC concentrations in nearby monitoring wells, likely due to poor hydrogen distribution achieved by the amendment delivery system. The potassium permanganate reduced CVOC concentra-tions to below detection limits within a few weeks and there was no rebound observed after six months. Potassium permanganate proved to have the greatest radius of influence at 50 ft and was effective for all CVOCs except CT. Potassium permanganate delivery was limited in one of the pilot study areas due to the heterogeneous distribution of aquifer sediments. The ZVI was also effective in reducing CVOC concentrations, but some rebound was observed near the edge of the treated zone. For the final remedy, potassium permanganate was used to treat TCE and PCE hot spots near the edges of the landfill, while ZVI barriers were used to treat CT plumes present near the MCLB Albany property boundary. Per the presumptive remedy guidance for military landfill, in situ treatment was not performed within the interior of the landfill to minimize the risk of contaminant displacement. Hot spot treatment and in situ barriers were used to control sources areas and prevent further expansion of the plume, respectively. In addition to in situ treatment, long-term monitoring, MNA, and LUCs will be used to manage the risks at OU 6 over the site life cycle. The use of the above optimization strategies helped to reduce the size of the active treatment area, reduce the number of required injection points via fracturing, and helped to realize significant cost savings to the project through the use of innovative technologies and life-cycle optimization strategies.
21
2.5 Performance Objectives Performance objectives are criteria that measure the operational efficiency and suitability of a particular remedial technology. They trigger a response to:
Modify or optimize the current system,
Transition to an alternate (less active and more cost effective) technology, or
Discontinue a unit process or remediation altogether (an exit strategy).
Practical performance objectives should be established for each component of the treatment train. Per-formance objectives are typically distinct from RAOs and remedial goals because they take into account typical engineering performance and the limitations of the individual technology. Performance objectives help to define what the expected effective operational range of a given remedial technology may be, and can allow for flexibility within the remedial decision process to discontinue use of a specific technology once it is no longer the most cost-effective approach. Figure 2-8 illustrates the need for performance objectives that allow for the utilization of a technology as long as it is operating cost-effectively. This figure is an example of the challenges faced in obtaining final clean-up goals for three common contaminants at air sparging sites. The graph indicates that, on average, the systems were very effective at reducing chemical concentrations with more than a 90% reduction of VOCs in the groundwater. However, even though air sparging was effective at removing a significant amount of the contaminant mass, it was unable to achieve final clean-up goals at several of the sites. This can result from slow, diffusion-limited mass removal that occurs when the remaining contamination is trapped and largely inaccessible to removal from the subsurface. Similarly, rebound following shutdown of active systems is often associated with trapped contaminant mass.
Figure 2-8. Example of Challenge in Obtaining Clean-up
Goals with Active Technologies Some examples performance objectives for a bioslurping or multiphase extraction system might include:
Remove LNAPL to the extent practicable as determined by the ratio of water to LNAPL recovered.
Operate until mass recovery becomes asymptotic and technology is no longer cost-effective based on the unit cost per mass removed.
Operate until the technology is no longer the most sustainable solution based on sustainability metrics, such as the mass of contaminant removal per mass of greenhouse gases emitted.
22
Operate only while cost-effective considering the ability of MNA or other remedial approaches to reduce residual contaminant levels to below remedial goals.
Figure 2-9 provides more examples of appropriate performance objectives for an example site.
Figure 2-9. Example Site: Performance Objectives
As part of optimization, performance objectives need to be continually evaluated to determine if they have been met and thus would trigger a change in the operating mode of the remedy or to determine if the performance objective itself needs to be modified. Continued operation of the remedial system may demonstrate that the performance objective cannot be met or it is not efficient to operate the system until this criteria is met. For example, if the performance objective is to remove LNAPL to the extent practicable, a point is reached where LNAPL is still being removed but the ratio of water to LNAPL recovered has increased to a point where bioslurping or multiphase extraction is no longer the most cost-effective remedy to recover LNAPL. In that case, it may be more cost effective to operate a less active LNAPL removal technology, such as a skimmer unit, until LNAPL is removed to the extent practicable. Performance objectives can also be incorporated into performance based contracting (PBC) as a method for providing incentives to the clean-up contractor to meet a set of objectives. These objectives could be related to meeting operational specifications for a remedial system or for achieving a certain milestone that triggers the transition from one technology to another. An example of the former case may be that the contractor must inject biostimulants such that a certain level of reducing conditions is established in monitoring wells within a target treatment zone. An example of the latter case would be that the contractor achieves a sufficient reduction in contaminant mass that allows for a transition to MNA.
23
More information regarding performance objectives can be found in the Remedial Action Performance Objective Tool on the NAVFAC ERT2 Web site.
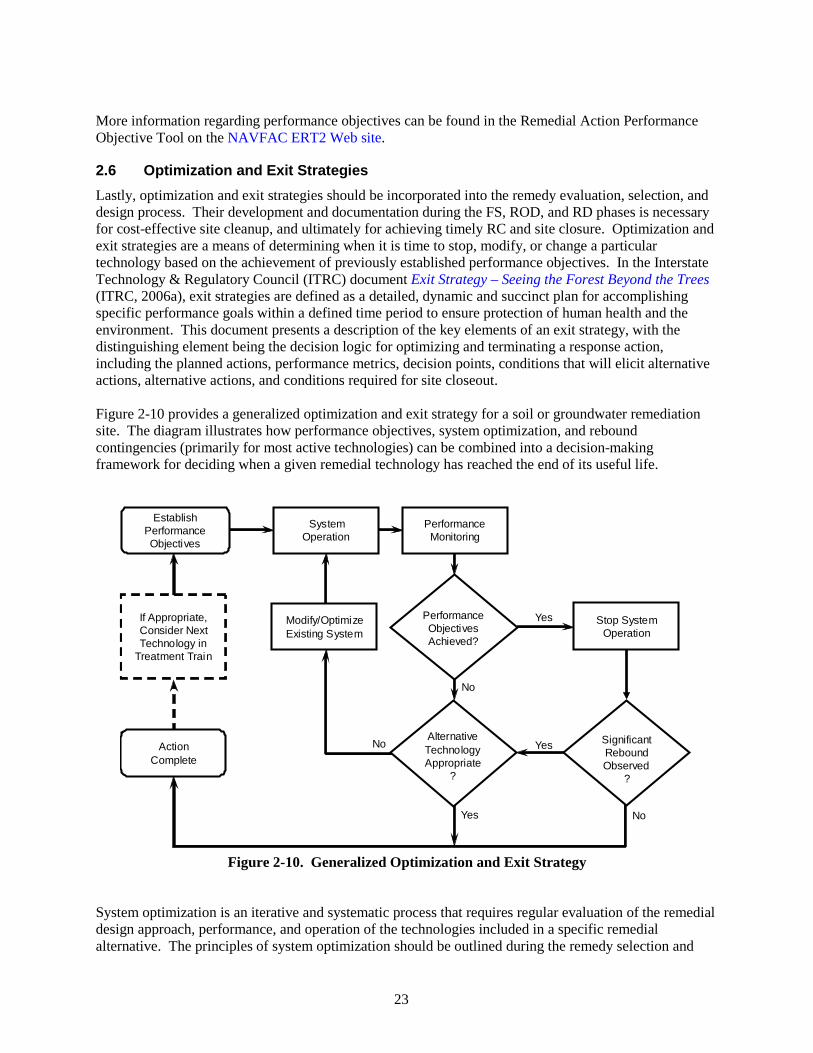
2.6 Optimization and Exit Strategies Lastly, optimization and exit strategies should be incorporated into the remedy evaluation, selection, and design process. Their development and documentation during the FS, ROD, and RD phases is necessary for cost-effective site cleanup, and ultimately for achieving timely RC and site closure. Optimization and exit strategies are a means of determining when it is time to stop, modify, or change a particular technology based on the achievement of previously established performance objectives. In the Interstate Technology & Regulatory Council (ITRC) document Exit Strategy – Seeing the Forest Beyond the Trees (ITRC, 2006a), exit strategies are defined as a detailed, dynamic and succinct plan for accomplishing specific performance goals within a defined time period to ensure protection of human health and the environment. This document presents a description of the key elements of an exit strategy, with the distinguishing element being the decision logic for optimizing and terminating a response action, including the planned actions, performance metrics, decision points, conditions that will elicit alternative actions, alternative actions, and conditions required for site closeout. Figure 2-10 provides a generalized optimization and exit strategy for a soil or groundwater remediation site. The diagram illustrates how performance objectives, system optimization, and rebound contingencies (primarily for most active technologies) can be combined into a decision-making framework for deciding when a given remedial technology has reached the end of its useful life.
ActionComplete
If Appropriate, Consider Next Technology in
Treatment Train
Yes Stop System Operation
SignificantReboundObserved
?
Yes
No
SystemOperation
Performance Monitoring
PerformanceObjectivesAchieved?
Modify/Optimize Existing System
AlternativeTechnologyAppropriate
?
No
No
Yes
Establish Performance Objectives
Figure 2-10. Generalized Optimization and Exit Strategy
System optimization is an iterative and systematic process that requires regular evaluation of the remedial design approach, performance, and operation of the technologies included in a specific remedial alternative. The principles of system optimization should be outlined during the remedy selection and
24
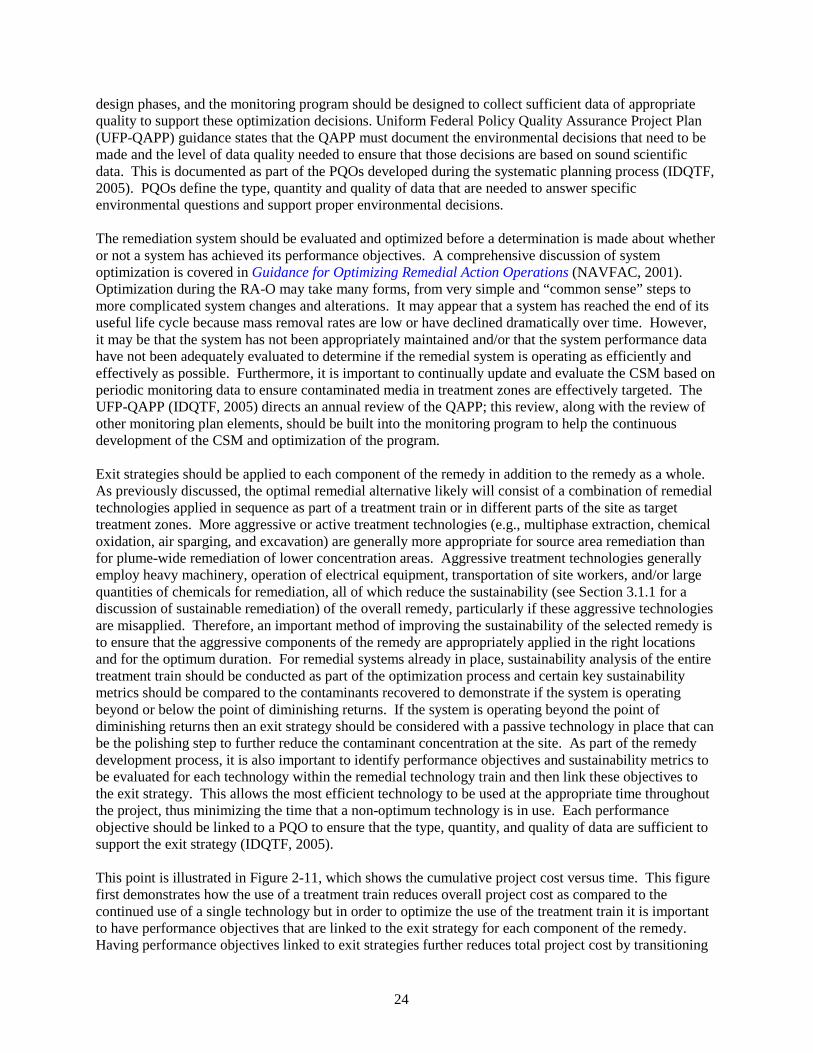
design phases, and the monitoring program should be designed to collect sufficient data of appropriate quality to support these optimization decisions. Uniform Federal Policy Quality Assurance Project Plan (UFP-QAPP) guidance states that the QAPP must document the environmental decisions that need to be made and the level of data quality needed to ensure that those decisions are based on sound scientific data. This is documented as part of the PQOs developed during the systematic planning process (IDQTF, 2005). PQOs define the type, quantity and quality of data that are needed to answer specific environmental questions and support proper environmental decisions. The remediation system should be evaluated and optimized before a determination is made about whether or not a system has achieved its performance objectives. A comprehensive discussion of system optimization is covered in Guidance for Optimizing Remedial Action Operations (NAVFAC, 2001). Optimization during the RA-O may take many forms, from very simple and “common sense” steps to more complicated system changes and alterations. It may appear that a system has reached the end of its useful life cycle because mass removal rates are low or have declined dramatically over time. However, it may be that the system has not been appropriately maintained and/or that the system performance data have not been adequately evaluated to determine if the remedial system is operating as efficiently and effectively as possible. Furthermore, it is important to continually update and evaluate the CSM based on periodic monitoring data to ensure contaminated media in treatment zones are effectively targeted. The UFP-QAPP (IDQTF, 2005) directs an annual review of the QAPP; this review, along with the review of other monitoring plan elements, should be built into the monitoring program to help the continuous development of the CSM and optimization of the program. Exit strategies should be applied to each component of the remedy in addition to the remedy as a whole. As previously discussed, the optimal remedial alternative likely will consist of a combination of remedial technologies applied in sequence as part of a treatment train or in different parts of the site as target treatment zones. More aggressive or active treatment technologies (e.g., multiphase extraction, chemical oxidation, air sparging, and excavation) are generally more appropriate for source area remediation than for plume-wide remediation of lower concentration areas. Aggressive treatment technologies generally employ heavy machinery, operation of electrical equipment, transportation of site workers, and/or large quantities of chemicals for remediation, all of which reduce the sustainability (see Section 3.1.1 for a discussion of sustainable remediation) of the overall remedy, particularly if these aggressive technologies are misapplied. Therefore, an important method of improving the sustainability of the selected remedy is to ensure that the aggressive components of the remedy are appropriately applied in the right locations and for the optimum duration. For remedial systems already in place, sustainability analysis of the entire treatment train should be conducted as part of the optimization process and certain key sustainability metrics should be compared to the contaminants recovered to demonstrate if the system is operating beyond or below the point of diminishing returns. If the system is operating beyond the point of diminishing returns then an exit strategy should be considered with a passive technology in place that can be the polishing step to further reduce the contaminant concentration at the site. As part of the remedy development process, it is also important to identify performance objectives and sustainability metrics to be evaluated for each technology within the remedial technology train and then link these objectives to the exit strategy. This allows the most efficient technology to be used at the appropriate time throughout the project, thus minimizing the time that a non-optimum technology is in use. Each performance objective should be linked to a PQO to ensure that the type, quantity, and quality of data are sufficient to support the exit strategy (IDQTF, 2005). This point is illustrated in Figure 2-11, which shows the cumulative project cost versus time. This figure first demonstrates how the use of a treatment train reduces overall project cost as compared to the continued use of a single technology but in order to optimize the use of the treatment train it is important to have performance objectives that are linked to the exit strategy for each component of the remedy. Having performance objectives linked to exit strategies further reduces total project cost by transitioning
25
between treatment phases in a timely manner, thereby preventing a technology from operating beyond the time when it is no longer functioning at its optimum effectiveness.
Figure 2-11. Cost Reduction from Treatment Trains and Performance Objectives Used
to Develop Exit Strategy for Each Phase of the Remedy
Treatment Trains with Performance Objectives to Reduce Project Cost
No Treatment Train
Treatment Train with Poorly Defined Performance Objectives Treatment Train with Well Defined Performance Objectives
Time, Years
Cum
ulat
ive
Proj
ect C
ost Duration of Using
Non-Optimal Technology
Duration of Using Non-Optimal Technology
Explanation
Well Defined Performance Objective Allows Transition to Less Active Technology Well Defined Performance Objective Allows Transition to Passive Technology Poorly Defined Performance Objective Allows Transition to Less Active Technology Poorly Defined Performance Objective Allows Transition to Passive Technology
Cost Avoidance for Using Treatment Train
Cost Avoidance for Using Well Defined
Performance Objectives
Cost Avoidance Using Treatment Train with Well Defined Performance Objective
26
3.0 CONSIDERATIONS FOR OPTIMIZING REMEDIES DURING THE FS During the FS phase, technologies are identified and screened, and remedial alternatives are evaluated. Recommendations for optimizing remedies during the FS are provided in this section. A checklist is provided at the end of this section that summarizes the key considerations for optimizing remedies during the FS.
3.1 Initial Steps Initial FS optimization steps include developing/refining the CSM and establishing RAOs to address unacceptable risks identified in the RI. The development of a thorough CSM will help in the selection of the most appropriate remedy and its effective implementation. To develop an accurate CSM, it should be determined whether or not the available datasets are of sufficient type, quantity, and quality (i.e., that proper collection and analytical quality assurance/quality control [QA/QC] procedures were followed to ensure data quality) and representative of current conditions. The site conditions and contaminant characteristics (phase, concentration, and distribution), as defined by the CSM, will drive remedy screening, evaluation, and selection decisions. Therefore, it is important that the CSM accurately reflect current site conditions (see Section 2.1). Additionally, the wording of the RAOs is important and should be considered carefully, even as early as drafting the RI report where the preliminary RAOs are recommended. The RAOs should then be re-evaluated when drafting the FS, where the RAOs are first established. RAOs should neither require a particular remedial technology to be operated until remedial goals are achieved, nor should they dictate the choice and/or duration of a proposed remedial action. Instead, the objectives should express how to protect human health and the environment. Additional discussion of RAOs was provided in Section 2.2.
3.2 Identification and Screening of Remedial Alternatives By developing a clearly defined CSM, establishing RAOs, and identifying target treatment zone(s), the project team led by the RPM should be able to identify a concise list of potential remedial alternatives applicable to each treatment zone at a given site. The general categories of remedial actions are listed below and proceed from actions generally requiring lower logistics and/or costs to those actions requiring greater logistics and/or costs:
No further action,
Land use controls (NAVFAC, 2003c),
Containment and other engineering controls,
In situ treatment/mass removal, and/or
Ex situ treatment/mass removal.
In considering the appropriateness of remedies that fall into one of these general categories, the RPM should consider that risk management (e.g., institutional controls and containment) may be more cost-effective than cleanup at certain sites. That is, a remedy can achieve protectiveness of human health and the environment through the elimination of exposure pathways or preventing contact with receptors, rather than by eliminating sources of contamination. Such an approach may be the only technically practical means of managing risks at sites involving a combination of complex, heterogeneous hydrogeology and recalcitrant contaminants, such as DNAPL. In addition, LUCs are often part of a treatment train used in conjunction with active and passive remedies (e.g., MNA to manage risks during remediation). Similarly, a combination of remedial action categories often is used in a treatment train approach such as in situ treatment/mass removal, containment, and LUCs.
27
The overall objective of the Navy’s policy is to consider optimization steps throughout the ER process. ER is a fairly mature field today and it is not necessary to consider every potential remedial alternative for the constituent and media of concern during the FS process. Any relevant historical information such as treatability studies or actual remedies implemented at the same base or similar environmental conditions can be useful when developing a FS. To the extent possible, presumptive remedies, and those remedies that are successful and cost-effective (best available technologies), should be included in the initial remedial alternative list. Presumptive remedies are standard technologies that can be applied at certain types of sites, such as municipal landfills or soils impacted with VOCs. They are designated by the U.S. EPA based on historical patterns of remedy selection, past experience, and technology performance. The U.S. EPA expects presumptive remedies (see U.S. EPA 1993b and U.S. EPA 1993c for information about presumptive remedies) to be considered at all applicable sites. Another way to optimize remedies during the remedy identification process is to take a holistic approach and consider many or all contaminated sites at a base, rather than approaching each site on an individual basis. In general, if similar contaminants are present at more than one site, it can be more practical and cost-effective to select remedies that can treat those multiples sites. For example, if the quantity of contaminated soil at a site is small, excavation and off-site treatment and/or disposal may be the most cost-effective remedial option. However, if several sites contain soils that are similarly contaminated, then on-site treatment (e.g., a biopile) followed by on-site disposal (as clean fill or daily cover at the base landfill) may be the better, more cost-efficient option. Similarly, if an effective technology is being used at a site and the remedy is nearing completion, the associated equipment is likely to be available for reuse at a different site at the same installation with a minimum cost. The number of alternatives to be carried over for a detailed evaluation typically is limited through a preliminary consideration of the potential effectiveness, implementability, and costs associated with each remedial alternative. Both effectiveness and implementability are qualitative criteria, but technology information available through the Navy and other agencies can facilitate a good screening process. Cost estimates can vary significantly for a given technology at different sites, and it is important to distinguish independent objective literature from vendor information to obtain reliable cost estimates. Therefore, resources such as the “Cost and Performance Reports” available on the internet can be valuable in making correct decisions (see Useful Web Sites for Remedy Selection text box). The point of the FS process where remedial alternatives have been identified and screened but prior to detailed evaluation is the appropriate time to conduct a third party Remedial Alternative Analysis (RAA) review. The RAA review is a fast-tracked optimization review of the remedial alternatives that will ultimately be evaluated in the FS. It provides an opportunity to optimize the remedial alternative evaluation process, looking at the alternatives selected for further review and potentially considering additional alternatives not selected. Past experience has shown that an optimization review at this stage can save time and cost by avoiding the need to back up and re-consider alternatives after the full draft FS has been submitted for review. More detail regarding the RAA process can be obtained from a NAVFAC Optimization Workgroup member and will be documented in the NAVFAC Business Management System.
3.3 Detailed Evaluation of Remedial Alternatives The process of identifying and screening various remedial action alternatives is followed by a detailed evaluation of those alternatives that pass the screening. The U.S. EPA developed nine criteria to be used for the objective assessment of the various remedial alternatives (U.S. EPA, 1988). This framework is a first step in the evaluation process, and allows a comparison of the relative advantages and disadvantages for each remedial alternative and helps to justify the selection of the most appropriate remedial action.
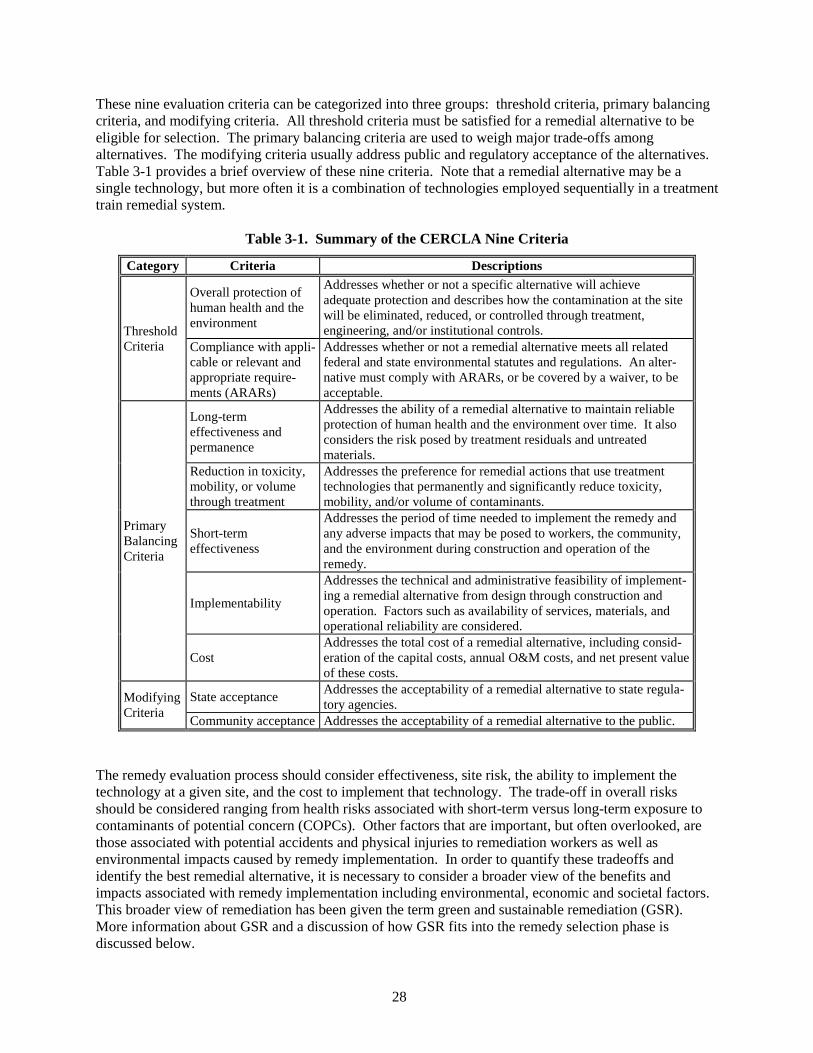
28
These nine evaluation criteria can be categorized into three groups: threshold criteria, primary balancing criteria, and modifying criteria. All threshold criteria must be satisfied for a remedial alternative to be eligible for selection. The primary balancing criteria are used to weigh major trade-offs among alternatives. The modifying criteria usually address public and regulatory acceptance of the alternatives. Table 3-1 provides a brief overview of these nine criteria. Note that a remedial alternative may be a single technology, but more often it is a combination of technologies employed sequentially in a treatment train remedial system.
Table 3-1. Summary of the CERCLA Nine Criteria
Category Criteria Descriptions
Threshold Criteria
Overall protection of human health and the environment
Addresses whether or not a specific alternative will achieve adequate protection and describes how the contamination at the site will be eliminated, reduced, or controlled through treatment, engineering, and/or institutional controls.
Compliance with appli-cable or relevant and appropriate require-ments (ARARs)
Addresses whether or not a remedial alternative meets all related federal and state environmental statutes and regulations. An alter-native must comply with ARARs, or be covered by a waiver, to be acceptable.
Primary Balancing Criteria
Long-term effectiveness and permanence
Addresses the ability of a remedial alternative to maintain reliable protection of human health and the environment over time. It also considers the risk posed by treatment residuals and untreated materials.
Reduction in toxicity, mobility, or volume through treatment
Addresses the preference for remedial actions that use treatment technologies that permanently and significantly reduce toxicity, mobility, and/or volume of contaminants.
Short-term effectiveness
Addresses the period of time needed to implement the remedy and any adverse impacts that may be posed to workers, the community, and the environment during construction and operation of the remedy.
Implementability
Addresses the technical and administrative feasibility of implement-ing a remedial alternative from design through construction and operation. Factors such as availability of services, materials, and operational reliability are considered.
Cost Addresses the total cost of a remedial alternative, including consid-eration of the capital costs, annual O&M costs, and net present value of these costs.
Modifying Criteria
State acceptance Addresses the acceptability of a remedial alternative to state regula-tory agencies.
Community acceptance Addresses the acceptability of a remedial alternative to the public.
The remedy evaluation process should consider effectiveness, site risk, the ability to implement the technology at a given site, and the cost to implement that technology. The trade-off in overall risks should be considered ranging from health risks associated with short-term versus long-term exposure to contaminants of potential concern (COPCs). Other factors that are important, but often overlooked, are those associated with potential accidents and physical injuries to remediation workers as well as environmental impacts caused by remedy implementation. In order to quantify these tradeoffs and identify the best remedial alternative, it is necessary to consider a broader view of the benefits and impacts associated with remedy implementation including environmental, economic and societal factors. This broader view of remediation has been given the term green and sustainable remediation (GSR). More information about GSR and a discussion of how GSR fits into the remedy selection phase is discussed below.
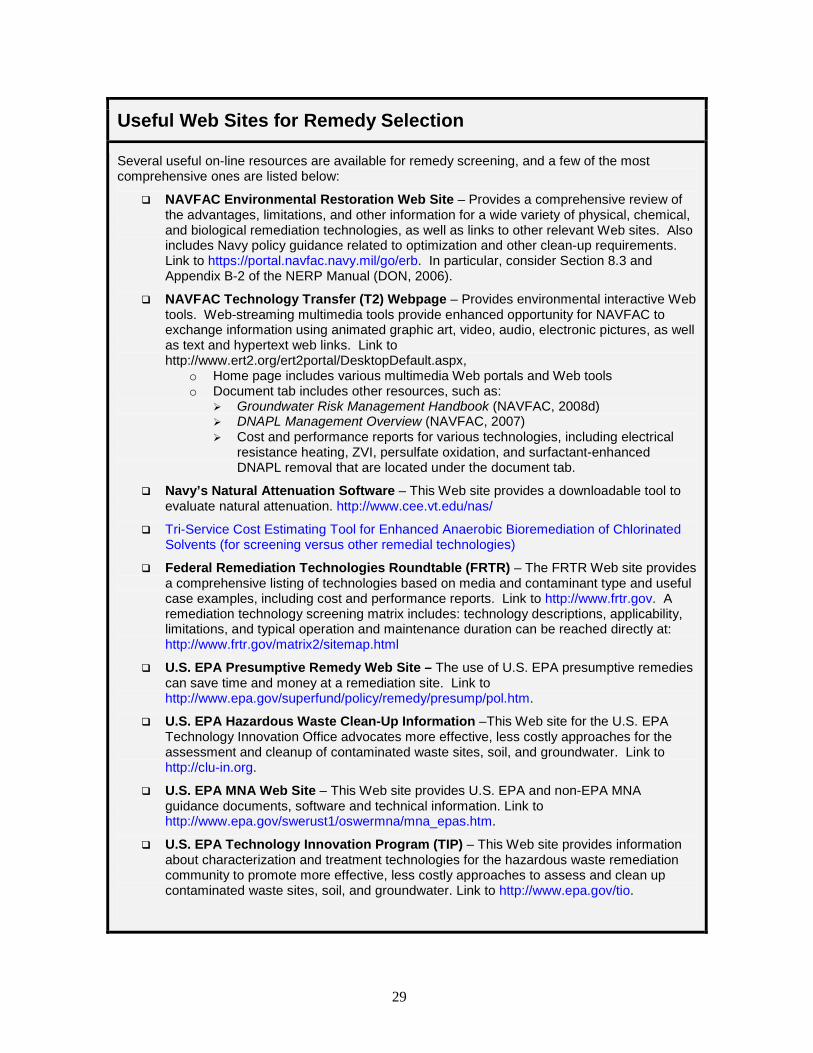
29
Useful Web Sites for Remedy Selection
Several useful on-line resources are available for remedy screening, and a few of the most comprehensive ones are listed below:
NAVFAC Environmental Restoration Web Site – Provides a comprehensive review of the advantages, limitations, and other information for a wide variety of physical, chemical, and biological remediation technologies, as well as links to other relevant Web sites. Also includes Navy policy guidance related to optimization and other clean-up requirements. Link to https://portal.navfac.navy.mil/go/erb. In particular, consider Section 8.3 and Appendix B-2 of the NERP Manual (DON, 2006).
NAVFAC Technology Transfer (T2) Webpage – Provides environmental interactive Web tools. Web-streaming multimedia tools provide enhanced opportunity for NAVFAC to exchange information using animated graphic art, video, audio, electronic pictures, as well as text and hypertext web links. Link to http://www.ert2.org/ert2portal/DesktopDefault.aspx,
o Home page includes various multimedia Web portals and Web tools o Document tab includes other resources, such as:
Groundwater Risk Management Handbook (NAVFAC, 2008d) DNAPL Management Overview (NAVFAC, 2007) Cost and performance reports for various technologies, including electrical
resistance heating, ZVI, persulfate oxidation, and surfactant-enhanced DNAPL removal that are located under the document tab.
Navy’s Natural Attenuation Software – This Web site provides a downloadable tool to evaluate natural attenuation. http://www.cee.vt.edu/nas/
Tri-Service Cost Estimating Tool for Enhanced Anaerobic Bioremediation of Chlorinated Solvents (for screening versus other remedial technologies)
Federal Remediation Technologies Roundtable (FRTR) – The FRTR Web site provides a comprehensive listing of technologies based on media and contaminant type and useful case examples, including cost and performance reports. Link to http://www.frtr.gov. A remediation technology screening matrix includes: technology descriptions, applicability, limitations, and typical operation and maintenance duration can be reached directly at: http://www.frtr.gov/matrix2/sitemap.html
U.S. EPA Presumptive Remedy Web Site – The use of U.S. EPA presumptive remedies can save time and money at a remediation site. Link to http://www.epa.gov/superfund/policy/remedy/presump/pol.htm.
U.S. EPA Hazardous Waste Clean-Up Information –This Web site for the U.S. EPA Technology Innovation Office advocates more effective, less costly approaches for the assessment and cleanup of contaminated waste sites, soil, and groundwater. Link to http://clu-in.org.
U.S. EPA MNA Web Site – This Web site provides U.S. EPA and non-EPA MNA guidance documents, software and technical information. Link to http://www.epa.gov/swerust1/oswermna/mna_epas.htm.
U.S. EPA Technology Innovation Program (TIP) – This Web site provides information about characterization and treatment technologies for the hazardous waste remediation community to promote more effective, less costly approaches to assess and clean up contaminated waste sites, soil, and groundwater. Link to http://www.epa.gov/tio.
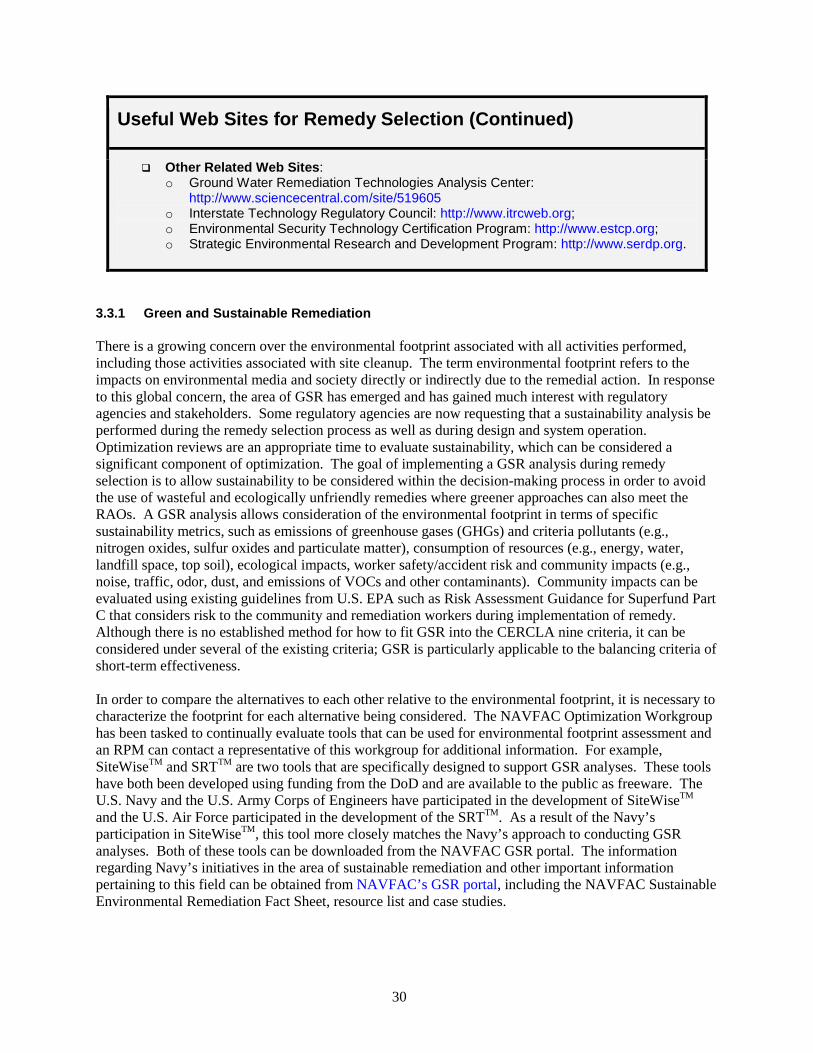
30
Useful Web Sites for Remedy Selection (Continued)
Other Related Web Sites: o Ground Water Remediation Technologies Analysis Center:
http://www.sciencecentral.com/site/519605 o Interstate Technology Regulatory Council: http://www.itrcweb.org; o Environmental Security Technology Certification Program: http://www.estcp.org; o Strategic Environmental Research and Development Program: http://www.serdp.org.
3.3.1 Green and Sustainable Remediation There is a growing concern over the environmental footprint associated with all activities performed, including those activities associated with site cleanup. The term environmental footprint refers to the impacts on environmental media and society directly or indirectly due to the remedial action. In response to this global concern, the area of GSR has emerged and has gained much interest with regulatory agencies and stakeholders. Some regulatory agencies are now requesting that a sustainability analysis be performed during the remedy selection process as well as during design and system operation. Optimization reviews are an appropriate time to evaluate sustainability, which can be considered a significant component of optimization. The goal of implementing a GSR analysis during remedy selection is to allow sustainability to be considered within the decision-making process in order to avoid the use of wasteful and ecologically unfriendly remedies where greener approaches can also meet the RAOs. A GSR analysis allows consideration of the environmental footprint in terms of specific sustainability metrics, such as emissions of greenhouse gases (GHGs) and criteria pollutants (e.g., nitrogen oxides, sulfur oxides and particulate matter), consumption of resources (e.g., energy, water, landfill space, top soil), ecological impacts, worker safety/accident risk and community impacts (e.g., noise, traffic, odor, dust, and emissions of VOCs and other contaminants). Community impacts can be evaluated using existing guidelines from U.S. EPA such as Risk Assessment Guidance for Superfund Part C that considers risk to the community and remediation workers during implementation of remedy. Although there is no established method for how to fit GSR into the CERCLA nine criteria, it can be considered under several of the existing criteria; GSR is particularly applicable to the balancing criteria of short-term effectiveness. In order to compare the alternatives to each other relative to the environmental footprint, it is necessary to characterize the footprint for each alternative being considered. The NAVFAC Optimization Workgroup has been tasked to continually evaluate tools that can be used for environmental footprint assessment and an RPM can contact a representative of this workgroup for additional information. For example, SiteWiseTM and SRTTM are two tools that are specifically designed to support GSR analyses. These tools have both been developed using funding from the DoD and are available to the public as freeware. The U.S. Navy and the U.S. Army Corps of Engineers have participated in the development of SiteWiseTM and the U.S. Air Force participated in the development of the SRTTM. As a result of the Navy’s participation in SiteWiseTM, this tool more closely matches the Navy’s approach to conducting GSR analyses. Both of these tools can be downloaded from the NAVFAC GSR portal. The information regarding Navy’s initiatives in the area of sustainable remediation and other important information pertaining to this field can be obtained from NAVFAC’s GSR portal, including the NAVFAC Sustainable Environmental Remediation Fact Sheet, resource list and case studies.
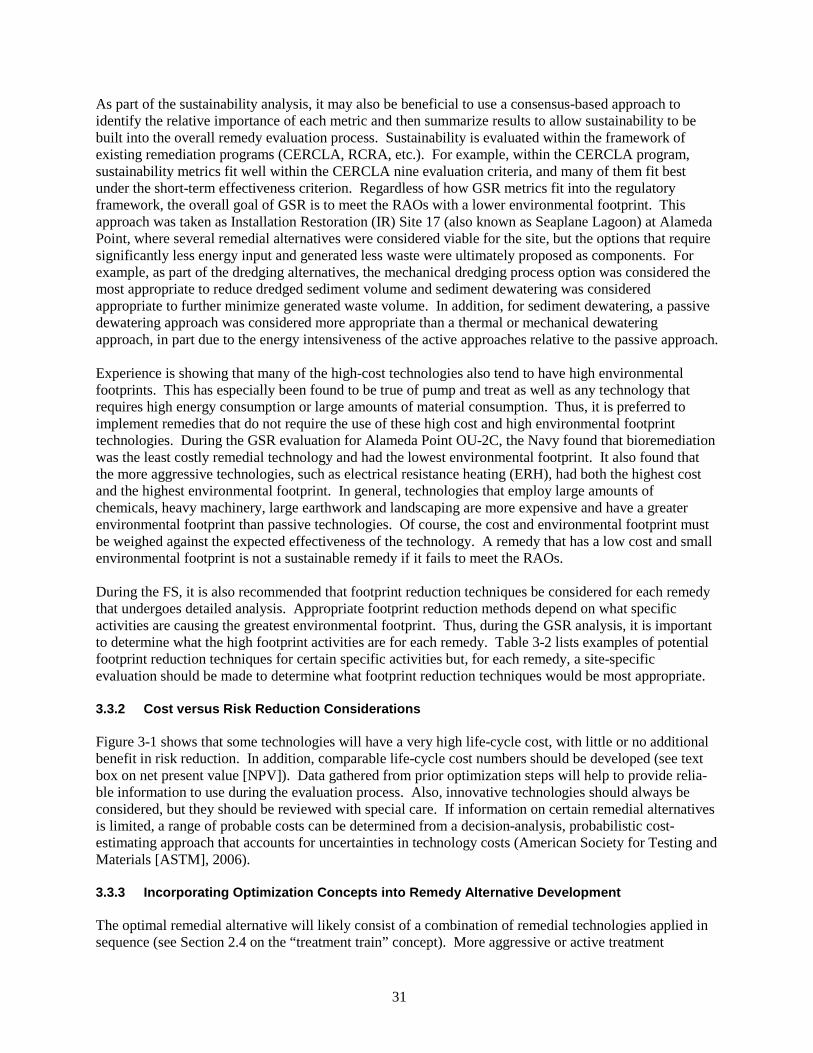
31
As part of the sustainability analysis, it may also be beneficial to use a consensus-based approach to identify the relative importance of each metric and then summarize results to allow sustainability to be built into the overall remedy evaluation process. Sustainability is evaluated within the framework of existing remediation programs (CERCLA, RCRA, etc.). For example, within the CERCLA program, sustainability metrics fit well within the CERCLA nine evaluation criteria, and many of them fit best under the short-term effectiveness criterion. Regardless of how GSR metrics fit into the regulatory framework, the overall goal of GSR is to meet the RAOs with a lower environmental footprint. This approach was taken as Installation Restoration (IR) Site 17 (also known as Seaplane Lagoon) at Alameda Point, where several remedial alternatives were considered viable for the site, but the options that require significantly less energy input and generated less waste were ultimately proposed as components. For example, as part of the dredging alternatives, the mechanical dredging process option was considered the most appropriate to reduce dredged sediment volume and sediment dewatering was considered appropriate to further minimize generated waste volume. In addition, for sediment dewatering, a passive dewatering approach was considered more appropriate than a thermal or mechanical dewatering approach, in part due to the energy intensiveness of the active approaches relative to the passive approach. Experience is showing that many of the high-cost technologies also tend to have high environmental footprints. This has especially been found to be true of pump and treat as well as any technology that requires high energy consumption or large amounts of material consumption. Thus, it is preferred to implement remedies that do not require the use of these high cost and high environmental footprint technologies. During the GSR evaluation for Alameda Point OU-2C, the Navy found that bioremediation was the least costly remedial technology and had the lowest environmental footprint. It also found that the more aggressive technologies, such as electrical resistance heating (ERH), had both the highest cost and the highest environmental footprint. In general, technologies that employ large amounts of chemicals, heavy machinery, large earthwork and landscaping are more expensive and have a greater environmental footprint than passive technologies. Of course, the cost and environmental footprint must be weighed against the expected effectiveness of the technology. A remedy that has a low cost and small environmental footprint is not a sustainable remedy if it fails to meet the RAOs. During the FS, it is also recommended that footprint reduction techniques be considered for each remedy that undergoes detailed analysis. Appropriate footprint reduction methods depend on what specific activities are causing the greatest environmental footprint. Thus, during the GSR analysis, it is important to determine what the high footprint activities are for each remedy. Table 3-2 lists examples of potential footprint reduction techniques for certain specific activities but, for each remedy, a site-specific evaluation should be made to determine what footprint reduction techniques would be most appropriate. 3.3.2 Cost versus Risk Reduction Considerations Figure 3-1 shows that some technologies will have a very high life-cycle cost, with little or no additional benefit in risk reduction. In addition, comparable life-cycle cost numbers should be developed (see text box on net present value [NPV]). Data gathered from prior optimization steps will help to provide relia-ble information to use during the evaluation process. Also, innovative technologies should always be considered, but they should be reviewed with special care. If information on certain remedial alternatives is limited, a range of probable costs can be determined from a decision-analysis, probabilistic cost-estimating approach that accounts for uncertainties in technology costs (American Society for Testing and Materials [ASTM], 2006). 3.3.3 Incorporating Optimization Concepts into Remedy Alternative Development The optimal remedial alternative will likely consist of a combination of remedial technologies applied in sequence (see Section 2.4 on the “treatment train” concept). More aggressive or active treatment
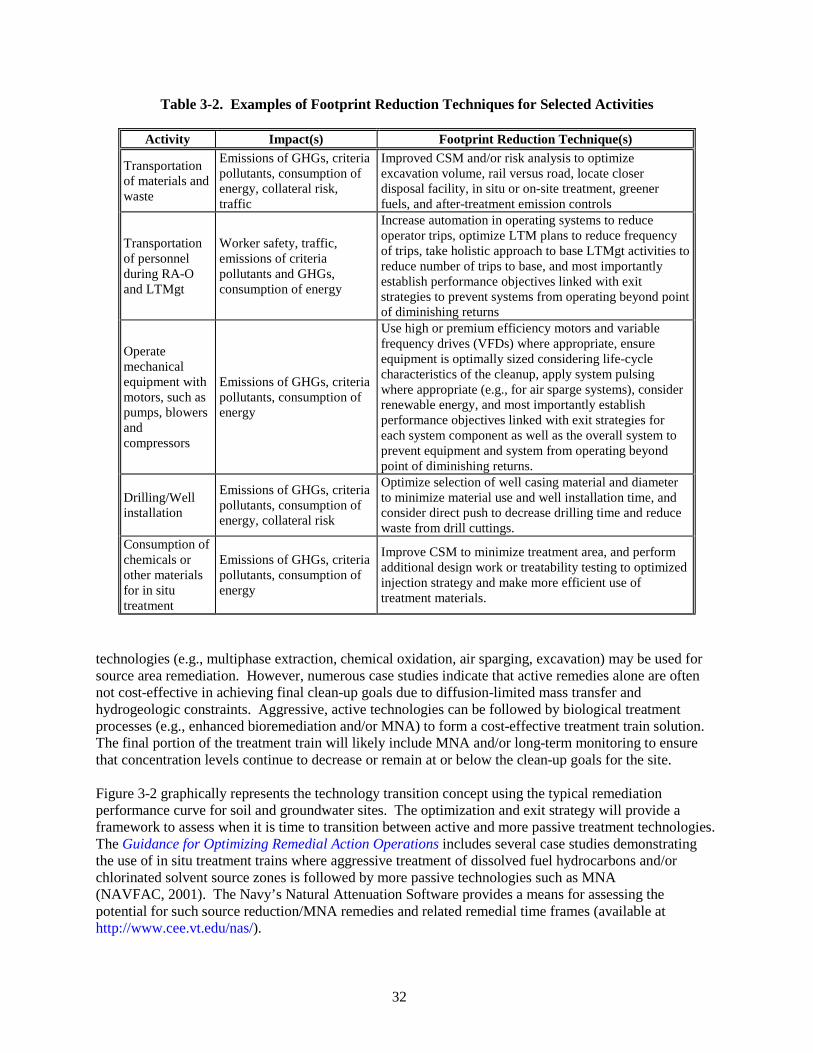
32
Table 3-2. Examples of Footprint Reduction Techniques for Selected Activities
Activity Impact(s) Footprint Reduction Technique(s)
Transportation of materials and waste
Emissions of GHGs, criteria pollutants, consumption of energy, collateral risk, traffic
Improved CSM and/or risk analysis to optimize excavation volume, rail versus road, locate closer disposal facility, in situ or on-site treatment, greener fuels, and after-treatment emission controls
Transportation of personnel during RA-O and LTMgt
Worker safety, traffic, emissions of criteria pollutants and GHGs, consumption of energy
Increase automation in operating systems to reduce operator trips, optimize LTM plans to reduce frequency of trips, take holistic approach to base LTMgt activities to reduce number of trips to base, and most importantly establish performance objectives linked with exit strategies to prevent systems from operating beyond point of diminishing returns
Operate mechanical equipment with motors, such as pumps, blowers and compressors
Emissions of GHGs, criteria pollutants, consumption of energy
Use high or premium efficiency motors and variable frequency drives (VFDs) where appropriate, ensure equipment is optimally sized considering life-cycle characteristics of the cleanup, apply system pulsing where appropriate (e.g., for air sparge systems), consider renewable energy, and most importantly establish performance objectives linked with exit strategies for each system component as well as the overall system to prevent equipment and system from operating beyond point of diminishing returns.
Drilling/Well installation
Emissions of GHGs, criteria pollutants, consumption of energy, collateral risk
Optimize selection of well casing material and diameter to minimize material use and well installation time, and consider direct push to decrease drilling time and reduce waste from drill cuttings.
Consumption of chemicals or other materials for in situ treatment
Emissions of GHGs, criteria pollutants, consumption of energy
Improve CSM to minimize treatment area, and perform additional design work or treatability testing to optimized injection strategy and make more efficient use of treatment materials.
technologies (e.g., multiphase extraction, chemical oxidation, air sparging, excavation) may be used for source area remediation. However, numerous case studies indicate that active remedies alone are often not cost-effective in achieving final clean-up goals due to diffusion-limited mass transfer and hydrogeologic constraints. Aggressive, active technologies can be followed by biological treatment processes (e.g., enhanced bioremediation and/or MNA) to form a cost-effective treatment train solution. The final portion of the treatment train will likely include MNA and/or long-term monitoring to ensure that concentration levels continue to decrease or remain at or below the clean-up goals for the site. Figure 3-2 graphically represents the technology transition concept using the typical remediation performance curve for soil and groundwater sites. The optimization and exit strategy will provide a framework to assess when it is time to transition between active and more passive treatment technologies. The Guidance for Optimizing Remedial Action Operations includes several case studies demonstrating the use of in situ treatment trains where aggressive treatment of dissolved fuel hydrocarbons and/or chlorinated solvent source zones is followed by more passive technologies such as MNA (NAVFAC, 2001). The Navy’s Natural Attenuation Software provides a means for assessing the potential for such source reduction/MNA remedies and related remedial time frames (available at http://www.cee.vt.edu/nas/).
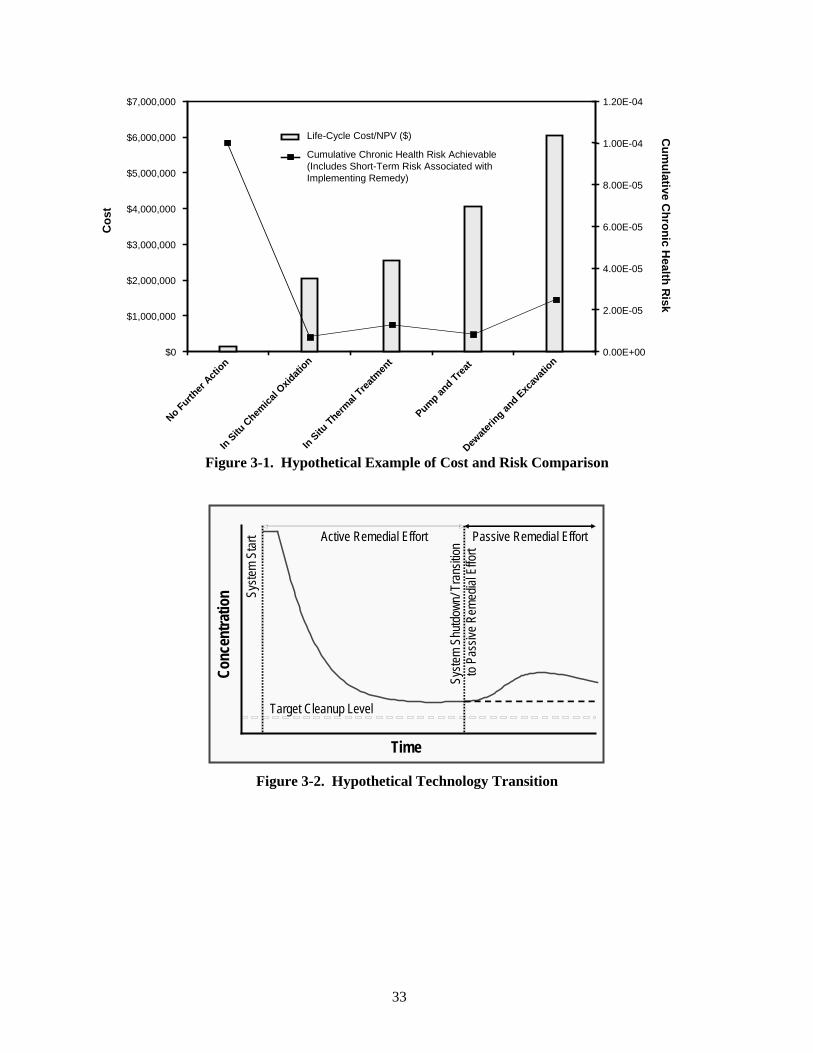
33
$0
$1,000,000
$2,000,000
$3,000,000
$4,000,000
$5,000,000
$6,000,000
$7,000,000
No Further
Action
In Situ C
hemica
l Oxid
ation
In Situ Therm
al Trea
tmen
t
Pump and Trea
t
Dewate
ring an
d Excav
ation
0.00E+00
2.00E-05
4.00E-05
6.00E-05
8.00E-05
1.00E-04
1.20E-04
Life-Cycle Cost/NPV ($)
Cumulative Chronic Health Risk Achievable(Includes Short-Term Risk Associated withImplementing Remedy)
Cum
ulative Chronic H
ealth Risk
Cos
t
Figure 3-1. Hypothetical Example of Cost and Risk Comparison
Conc
entra
tion
Time
Target Cleanup LevelTarget Cleanup Level
Syste
m Sh
utdow
n/ Tr
ansit
ion
to Pa
ssive
Rem
edial
Effo
rtSy
stem
Shutd
own/
Tran
sition
to
Pass
ive R
emed
ial E
ffort
Syste
m St
art
Syste
m St
art Active Remedial EffortActive Remedial Effort Passive Remedial EffortPassive Remedial Effort
Figure 3-2. Hypothetical Technology Transition
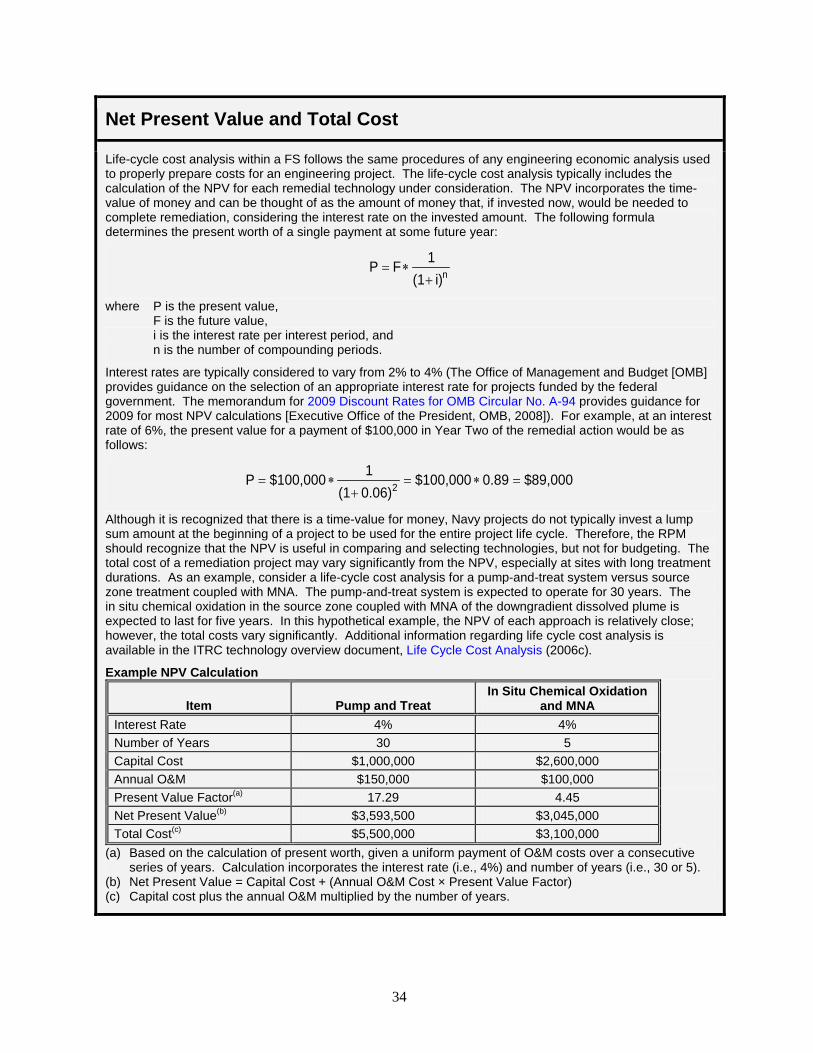
34
Net Present Value and Total Cost
Life-cycle cost analysis within a FS follows the same procedures of any engineering economic analysis used to properly prepare costs for an engineering project. The life-cycle cost analysis typically includes the calculation of the NPV for each remedial technology under consideration. The NPV incorporates the time-value of money and can be thought of as the amount of money that, if invested now, would be needed to complete remediation, considering the interest rate on the invested amount. The following formula determines the present worth of a single payment at some future year:
ni)(11FP+
∗=
where P is the present value, F is the future value, i is the interest rate per interest period, and n is the number of compounding periods.
Interest rates are typically considered to vary from 2% to 4% (The Office of Management and Budget [OMB] provides guidance on the selection of an appropriate interest rate for projects funded by the federal government. The memorandum for 2009 Discount Rates for OMB Circular No. A-94 provides guidance for 2009 for most NPV calculations [Executive Office of the President, OMB, 2008]). For example, at an interest rate of 6%, the present value for a payment of $100,000 in Year Two of the remedial action would be as follows:
$89,0000.89$100,0000.06)(11$100,000P 2 =∗=
+∗=
Although it is recognized that there is a time-value for money, Navy projects do not typically invest a lump sum amount at the beginning of a project to be used for the entire project life cycle. Therefore, the RPM should recognize that the NPV is useful in comparing and selecting technologies, but not for budgeting. The total cost of a remediation project may vary significantly from the NPV, especially at sites with long treatment durations. As an example, consider a life-cycle cost analysis for a pump-and-treat system versus source zone treatment coupled with MNA. The pump-and-treat system is expected to operate for 30 years. The in situ chemical oxidation in the source zone coupled with MNA of the downgradient dissolved plume is expected to last for five years. In this hypothetical example, the NPV of each approach is relatively close; however, the total costs vary significantly. Additional information regarding life cycle cost analysis is available in the ITRC technology overview document, Life Cycle Cost Analysis (2006c).
Example NPV Calculation
Item Pump and Treat In Situ Chemical Oxidation
and MNA Interest Rate 4% 4% Number of Years 30 5 Capital Cost $1,000,000 $2,600,000 Annual O&M $150,000 $100,000 Present Value Factor(a) 17.29 4.45 Net Present Value(b) $3,593,500 $3,045,000 Total Cost(c) $5,500,000 $3,100,000
(a) Based on the calculation of present worth, given a uniform payment of O&M costs over a consecutive series of years. Calculation incorporates the interest rate (i.e., 4%) and number of years (i.e., 30 or 5).
(b) Net Present Value = Capital Cost + (Annual O&M Cost × Present Value Factor) (c) Capital cost plus the annual O&M multiplied by the number of years.
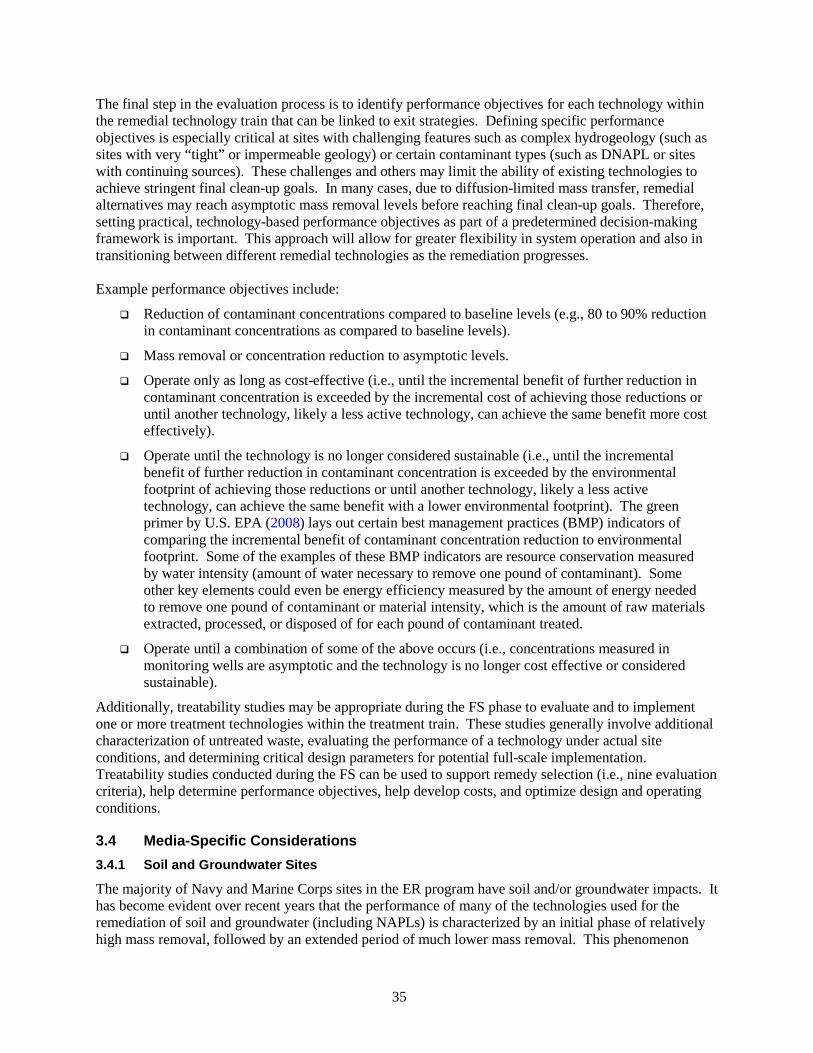
35
The final step in the evaluation process is to identify performance objectives for each technology within the remedial technology train that can be linked to exit strategies. Defining specific performance objectives is especially critical at sites with challenging features such as complex hydrogeology (such as sites with very “tight” or impermeable geology) or certain contaminant types (such as DNAPL or sites with continuing sources). These challenges and others may limit the ability of existing technologies to achieve stringent final clean-up goals. In many cases, due to diffusion-limited mass transfer, remedial alternatives may reach asymptotic mass removal levels before reaching final clean-up goals. Therefore, setting practical, technology-based performance objectives as part of a predetermined decision-making framework is important. This approach will allow for greater flexibility in system operation and also in transitioning between different remedial technologies as the remediation progresses. Example performance objectives include:
Reduction of contaminant concentrations compared to baseline levels (e.g., 80 to 90% reduction in contaminant concentrations as compared to baseline levels).
Mass removal or concentration reduction to asymptotic levels.
Operate only as long as cost-effective (i.e., until the incremental benefit of further reduction in contaminant concentration is exceeded by the incremental cost of achieving those reductions or until another technology, likely a less active technology, can achieve the same benefit more cost effectively).
Operate until the technology is no longer considered sustainable (i.e., until the incremental benefit of further reduction in contaminant concentration is exceeded by the environmental footprint of achieving those reductions or until another technology, likely a less active technology, can achieve the same benefit with a lower environmental footprint). The green primer by U.S. EPA (2008) lays out certain best management practices (BMP) indicators of comparing the incremental benefit of contaminant concentration reduction to environmental footprint. Some of the examples of these BMP indicators are resource conservation measured by water intensity (amount of water necessary to remove one pound of contaminant). Some other key elements could even be energy efficiency measured by the amount of energy needed to remove one pound of contaminant or material intensity, which is the amount of raw materials extracted, processed, or disposed of for each pound of contaminant treated.
Operate until a combination of some of the above occurs (i.e., concentrations measured in monitoring wells are asymptotic and the technology is no longer cost effective or considered sustainable).
Additionally, treatability studies may be appropriate during the FS phase to evaluate and to implement one or more treatment technologies within the treatment train. These studies generally involve additional characterization of untreated waste, evaluating the performance of a technology under actual site conditions, and determining critical design parameters for potential full-scale implementation. Treatability studies conducted during the FS can be used to support remedy selection (i.e., nine evaluation criteria), help determine performance objectives, help develop costs, and optimize design and operating conditions.
3.4 Media-Specific Considerations 3.4.1 Soil and Groundwater Sites
The majority of Navy and Marine Corps sites in the ER program have soil and/or groundwater impacts. It has become evident over recent years that the performance of many of the technologies used for the remediation of soil and groundwater (including NAPLs) is characterized by an initial phase of relatively high mass removal, followed by an extended period of much lower mass removal. This phenomenon
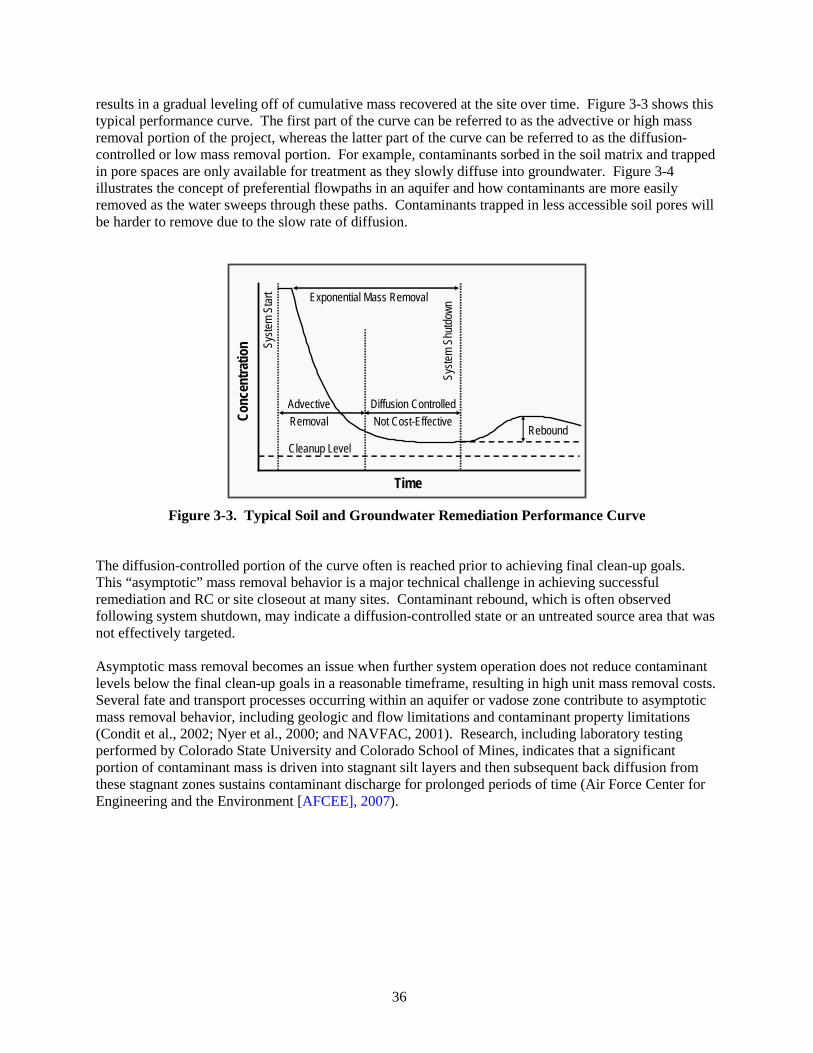
36
results in a gradual leveling off of cumulative mass recovered at the site over time. Figure 3-3 shows this typical performance curve. The first part of the curve can be referred to as the advective or high mass removal portion of the project, whereas the latter part of the curve can be referred to as the diffusion-controlled or low mass removal portion. For example, contaminants sorbed in the soil matrix and trapped in pore spaces are only available for treatment as they slowly diffuse into groundwater. Figure 3-4 illustrates the concept of preferential flowpaths in an aquifer and how contaminants are more easily removed as the water sweeps through these paths. Contaminants trapped in less accessible soil pores will be harder to remove due to the slow rate of diffusion.
Conc
entra
tion
Time
Cleanup LevelSy
stem
Shutd
own
Syste
m St
art Exponential Mass Removal
ReboundNot Cost-Effective
Diffusion ControlledAdvectiveRemoval
Figure 3-3. Typical Soil and Groundwater Remediation Performance Curve
The diffusion-controlled portion of the curve often is reached prior to achieving final clean-up goals. This “asymptotic” mass removal behavior is a major technical challenge in achieving successful remediation and RC or site closeout at many sites. Contaminant rebound, which is often observed following system shutdown, may indicate a diffusion-controlled state or an untreated source area that was not effectively targeted. Asymptotic mass removal becomes an issue when further system operation does not reduce contaminant levels below the final clean-up goals in a reasonable timeframe, resulting in high unit mass removal costs. Several fate and transport processes occurring within an aquifer or vadose zone contribute to asymptotic mass removal behavior, including geologic and flow limitations and contaminant property limitations (Condit et al., 2002; Nyer et al., 2000; and NAVFAC, 2001). Research, including laboratory testing performed by Colorado State University and Colorado School of Mines, indicates that a significant portion of contaminant mass is driven into stagnant silt layers and then subsequent back diffusion from these stagnant zones sustains contaminant discharge for prolonged periods of time (Air Force Center for Engineering and the Environment [AFCEE], 2007).
37
Figure 3-4. Effect of Groundwater Flow on Contaminant Removal Therefore, source zone treatments that primarily remove contaminant mass from the transmissive zones may allow substantial contaminant mass to remain in the stagnant zones causing asymptotic behavior and/or post-treatment contaminant rebound. Understanding these processes and potential performance of remedial technologies under such conditions is necessary to develop an appropriate treatment train, logical performance objectives, and the optimization and exit strategy. An approach to address these mass removal limitations is to develop plume management strategies (NAVFAC, 2008d) that may include a variety of passive techniques (e.g., treatment barriers, MNA and LUCs) as well as alternate clean-up levels. If it is necessary to use active technologies initially for a site where asymptotic characteristics may prevent the clean-up goal from being met, it is important to have provisions in the performance objectives and/or exit strategy to allow systems to be shut down or transitioned to less active systems at the time that asymptotic behavior has been established. Two challenges are worth noting with respect to demonstrating that asymptotic levels have been reached. The first is to demonstrate that appropriate system optimization has been performed to maximize the ability of the system to achieve mass removal to the extent practicable. The second is to demonstrate that the data trend is characteristic of an asymptote. This can be done qualitatively by viewing time-series data or by the use of statistical methods to demonstrate that changes in mass removal or concentration over time are not statistically significant or are small relative to the initial changes over time. Information about statistical methods is presented in Appendix B of the Guidance for Planning and Optimizing Monitoring Strategies (NAVFAC, 2008a). Geologic and Flow Limitations Geologic heterogeneity can have a major impact on the performance of many in situ and ex situ treatment technologies. The permeability of soil in the vadose and saturated zones can vary by orders of magnitude at a given site. This geologic heterogeneity can lead to contaminants becoming trapped in low
38
permeability layers such as silt or clay lenses over time, and also can influence the flow of water, air, and/or treatment reagents during active remediation. For example, during active remediation with a pump-and-treat or air sparging system, a relatively large amount of mass will be removed by advective transport as water or air sweeps out the most accessible contamination located in sandy or more permeable layers. The less permeable layers, such as silt and clay lenses, may be bypassed by the main water or airflow paths within the subsurface. The removal of contamination in these less permeable layers is controlled by molecular diffusion. (Molecular diffusion is the natural tendency of chemical molecules to move from an area of high concentration to an area of low concentration and it is a relatively slow process.) During the later stages of a project, the contaminant molecules must diffuse through water or air from the low flow or low permeability areas to the high flow areas (i.e., preferential pathways) before recovery or in situ destruction. This leads to mass removal rates that decline over time as the most easily reached contamination is removed or destroyed first, and then diffusion-controlled mass transport processes begin to dominate. When applying aggressive technologies specifically to target the source zone, the transition of site characteristics to diffusion limiting conditions should trigger discontinuance of the aggressive technology. When applying technologies to address the more dilute parts of a plume, a strategy must be developed that can cost effectively manage the plume for long periods of time. More information about plume management strategies is available in the Navy Groundwater Risk Management Handbook (NAVFAC, 2008d). In addition, the injection of fluids such as air, surfactants, chemical oxidants, or biological amendments may be limited by geologic heterogeneity within an aquifer. The injected fluids will tend to flow in the most permeable layers within an aquifer and may not come into direct contact with all of the residual contamination trapped in the pore spaces. Also, the mixing of injected fluids and groundwater may be incomplete or result in the contaminated groundwater being pushed outside of the treatment zone (Nyer et al., 2000; National Research Council [NRC], 2003). Contaminant Property Limitations Several chemical and physical properties of contaminants can limit the effectiveness of their removal or destruction and therefore contribute to diffusion-controlled, “asymptotic” mass removal toward the end of a project. Several parameters play a role in the fate and transport of contaminants during active remediation, including sorption, volatility, solubility, and biodegradability as follows (Freeze and Cherry, 1979):
Sorption – The movement of organic and inorganic chemicals in the subsurface is affected by their affinity for the soil matrix. Sorption can affect leaching from the vadose zone as well as contaminant movement within an aquifer. The degree of sorption depends on the properties of both the contaminant and the soil at the site. Slow desorption of contaminants from soil limits the ability to remove mass from the subsurface over time. Slow desorption can contribute to the diffusion-limited tailing behavior (e.g., concentration decreasing versus time) in pump and treat and other remediation systems. It can limit the effectiveness of many in situ treatment technol-ogies, because many injected reagents and biological processes only react with contaminants in the dissolved phase. It also can reduce the effectiveness of ex situ separation treatment technologies such as soil washing.
Solubility – The solubility of a contaminant in water determines the maximum rate at which mass can be removed from the subsurface when water is used as a carrier. Pure organic liquids or NAPLs are immiscible and only sparingly soluble in water. The NAPL constituents at the NAPL-water interface will dissolve very slowly into the flowing groundwater. LNAPLs such as petroleum hydrocarbons and DNAPLs such as chlorinated solvents are difficult to remove from the subsurface due to their limited solubility in water. NAPLs represent a significant
39
continuing source of contamination because they are pure compounds and therefore have a high proportion of mass trapped in a relatively small volume. Although pools of DNAPLs are rarely found on low permeability layers, residuals are typically present in the form of ganglia and droplets trapped in the pore spaces and sorbed in the soil matrix, which serve as a continuing source and contribute to the diffusion-limited tailing behavior.
Volatility – Because several types of organic compounds are highly volatile and not highly soluble, the use of air as a carrier in active remediation can be an improvement over the use of water as a carrier, because the movement of VOCs in the air phase is on the order of 10,000 times faster than in the water phase. For example, technologies such as air sparging in the saturated zone take advantage of this fact and can achieve significant mass removal within a shorter timeframe. Air sparging systems typically operate for less than two years, whereas pump-and-treat methods can take several decades to achieve adequate mass removal. However, it should be noted that air-based technologies (e.g., AS and SVE) still experience diffusion-limited mass removal during the end stages of a project. The rate of removal will depend on the volatility of the NAPL (i.e., vapor pressure) and whether or not the air comes into direct contact with NAPL or with dissolved-phase contamination. Direct volatilization of the contaminant from the NAPL phase to air will result in higher mass removal rates compared to stripping from the water phase. Over time, mass removal tends to decrease as the contaminant is cleaned up in the vicinity of the main airflow paths and must travel farther before reaching the main air channels and volatilizing (Kavanaugh, 1996; Nyer et al., 2000; NRC, 2003).
Biodegradability – Organic contaminants are often amenable to either aerobic, anaerobic, or cometabolic biodegradation by microorganisms present in soil or groundwater. For example, petroleum hydrocarbons biodegrade more readily under aerobic conditions, and chlorinated solvents, such as tetrachloroethene, generally degrade more readily under anaerobic conditions (exceptions exist, such as vinyl chloride, which degrades under aerobic conditions). Typically, lighter molecular weight compounds degrade more readily than heavier molecular weight compounds. The complexity of the molecular structure and the strength of the bonds holding the various elements together also play a role in the recalcitrance of some organic compounds. Other site-specific conditions can limit the rate of biodegradation including the lack of oxygen under aerobic conditions, the lack of suitable electron donors under anaerobic conditions, the lack of adequate micronutrients, high or low pH conditions, and other site variables that impact the growth and/or metabolism of microbes. In some cases, no microorganisms or only a limited population may exist at a given site with the metabolic capabilities to break down the COCs. As mentioned previously and analogous to wastewater treatment, biodegradation mechanisms can be exploited to achieve final polishing of contaminants that are diffusion-controlled. More information is available at the U.S. EPA’s MNA Web site: http://www.epa.gov/swerust1/oswermna/index.htm.
3.4.2 Landfill Sites
Commonly, landfill sites have soil and groundwater impacted by contamination (see Section 3.4.1). These sites have unique challenges that an RPM and their contractors must consider during remedy selection and design. Treatment of all of the waste in a landfill typically is impractical due to the volume and heterogeneity of the waste in landfills. Also, risks are typically low at landfill sites, except for hot spots of groundwater or soil contamination resulting from the leaching or release of hazardous materials disposed at the site. Therefore, large landfill sites often require a combination of active treatment, containment, and long-term management, depending on the surface exposure, age of landfill, disposal history, and impacts to groundwater, including:
Cap or soil cover to eliminate surface exposure pathway and/or minimize infiltration. Containment is the U.S. EPA Presumptive Remedy for landfill sites (U.S. EPA, 1996a).
40
Groundwater containment downgradient of the landfill.
Leachate collection and treatment.
Landfill gas collection and treatment.
Institutional controls to prevent unintended future land use.
Long-term monitoring of groundwater and maintenance of the cap or soil cover.
Hot spot removal of localized areas of wastes in soil and groundwater (rare and only in special cases).
A landfill site may only require a soil cover to prevent surface exposure and periodic groundwater monitoring if groundwater contaminants are not present or are not migrating. At the Portsmouth Naval Shipyard Jamaica Island Landfill, the Navy consolidated landfill waste, reducing the overall physical area, and implemented containment, monitoring, and long-term management of the site. The cleared area was used to enhance the beneficial use of the estuarine habitat surrounding Portsmouth Naval Shipyard. 3.4.3 Sediment Sites
Sediment sites vary in size and complexity and may require additional consideration when preparing a FS than some terrestrial sites. This is because sediment sites are often contaminated with a mixture of COCs from multiple sources; they involve multiple media (water, sediment, and biota) and a host of issues (sediment chemistry, sediment stability and transport, bioaccumulation, etc.), and they generally tend to be large sites incurring spatial and temporal trends. Remedial options for sediment cleanup include dredging, monitored natural recovery (MNR), in situ capping, and in situ treatment. A brief description of each of the remedial options for sediments is provided as follows (NAVFAC, 2002b):
Dredging is a removal activity that is most appropriate for high-risk sites where the benefit of sediment removal outweighs the risks of dredging and sediment resuspension. Once the sediment is removed, it typically needs to be de-watered and then treated using thermal, chemical, or biological methods. Off-site disposal at an approved facility may also be appropriate depending on the waste volume and characteristics.
MNR relies upon the natural deposition of uncontaminated sediments over time and upon intrinsic contaminant attenuation. It is most applicable at relatively low risk sites to human and ecological receptors.
In situ capping involves covering the contaminated sediment in place with clean material to physically isolate it from the water column and aquatic environment. Traditional caps are composed primarily of clean sand, however, more recently engineers and scientists have been testing the effectiveness and implementability of reactive sediment capping alternatives, such as organoclays, synthetic materials, carbon, and metal ores.
In situ treatment is an emerging technology and only a few approaches are technically and commercially viable. This approach promotes the in situ treatment of contaminants through several means such as phytoremediation, amendment addition, and aeration.
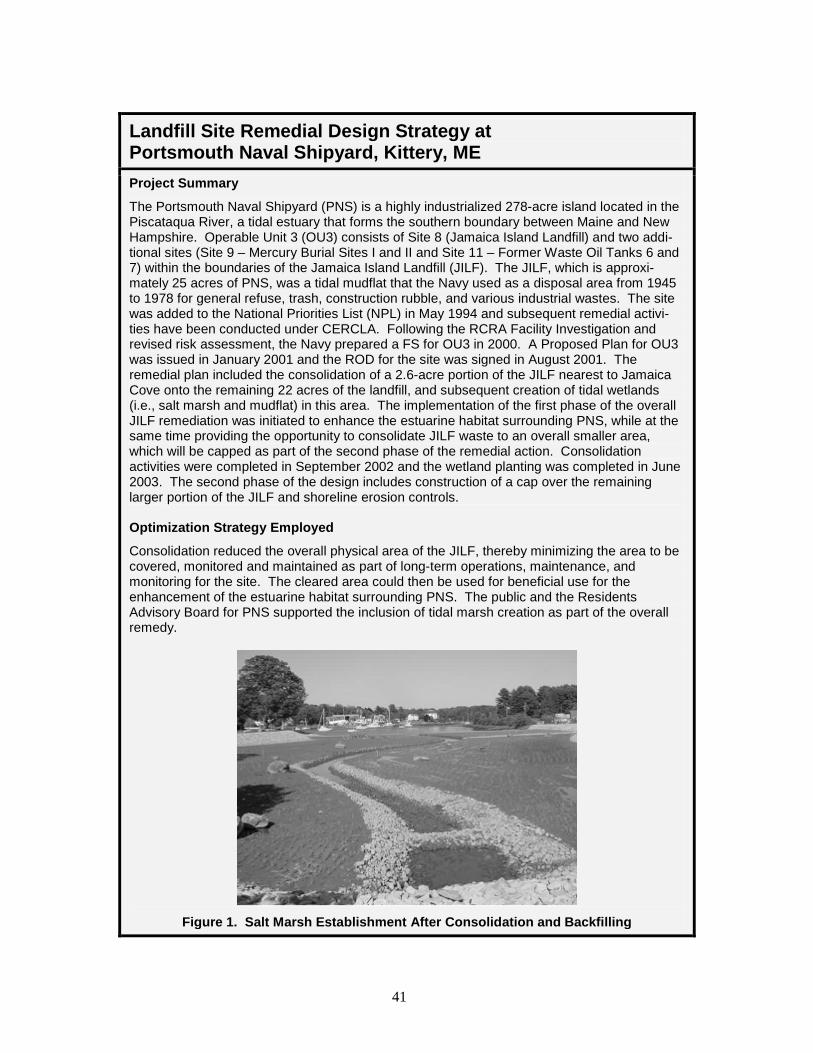
41
Landfill Site Remedial Design Strategy at Portsmouth Naval Shipyard, Kittery, ME Project Summary
The Portsmouth Naval Shipyard (PNS) is a highly industrialized 278-acre island located in the Piscataqua River, a tidal estuary that forms the southern boundary between Maine and New Hampshire. Operable Unit 3 (OU3) consists of Site 8 (Jamaica Island Landfill) and two addi-tional sites (Site 9 – Mercury Burial Sites I and II and Site 11 – Former Waste Oil Tanks 6 and 7) within the boundaries of the Jamaica Island Landfill (JILF). The JILF, which is approxi-mately 25 acres of PNS, was a tidal mudflat that the Navy used as a disposal area from 1945 to 1978 for general refuse, trash, construction rubble, and various industrial wastes. The site was added to the National Priorities List (NPL) in May 1994 and subsequent remedial activi-ties have been conducted under CERCLA. Following the RCRA Facility Investigation and revised risk assessment, the Navy prepared a FS for OU3 in 2000. A Proposed Plan for OU3 was issued in January 2001 and the ROD for the site was signed in August 2001. The remedial plan included the consolidation of a 2.6-acre portion of the JILF nearest to Jamaica Cove onto the remaining 22 acres of the landfill, and subsequent creation of tidal wetlands (i.e., salt marsh and mudflat) in this area. The implementation of the first phase of the overall JILF remediation was initiated to enhance the estuarine habitat surrounding PNS, while at the same time providing the opportunity to consolidate JILF waste to an overall smaller area, which will be capped as part of the second phase of the remedial action. Consolidation activities were completed in September 2002 and the wetland planting was completed in June 2003. The second phase of the design includes construction of a cap over the remaining larger portion of the JILF and shoreline erosion controls. Optimization Strategy Employed
Consolidation reduced the overall physical area of the JILF, thereby minimizing the area to be covered, monitored and maintained as part of long-term operations, maintenance, and monitoring for the site. The cleared area could then be used for beneficial use for the enhancement of the estuarine habitat surrounding PNS. The public and the Residents Advisory Board for PNS supported the inclusion of tidal marsh creation as part of the overall remedy.
Figure 1. Salt Marsh Establishment After Consolidation and Backfilling
42
Before selecting a sediment alternative, one should consider conducting a net environmental benefit analysis (NEBA) to determine which sediment management option may be the most appropriate in an effort to maximize the environmental outcome. Dredging is generally employed for near-term immediate mass removal of COCs, however it is a relatively intrusive remedy and can have significant immediate negative impacts on the ecosystem as well. Dredge effectiveness can be complicated by the level of subsurface debris or site-specific obstacles such as geologic features of the underlying sediment. Obstacles often found in the near-shore area may include abandoned pier pilings, electric or communication cables, or utility pipelines. Subsurface debris could include essentially any abandoned and buried items. Appropriately implemented sonar surveys will help define the debris field and can be used to identify locations where cost-effective dredging could be problematic or impossible. While the technology of environmental dredging has improved in recent years, dredge residuals are common and may contain unacceptable levels of contamination. The FS should plan for secondary dredging scenarios, thin layer sand covers, or MNR as additional steps to effectively address “hot spot” locations and to facilitate benthic recovery. Lastly, the FS should consider the long-term sustainability issues associated with dredging. These may include, but shouldn’t be limited to: dredge equipment operation and dredge material management (e.g., transportation, treatment and/or disposal options). A well conducted NEBA will take these into consideration and will help guide ecologically acceptable remedial options. When caps or other in-situ deployments such as surface amendments are recommended, the FS should clearly define the potential for negative impacts due to extreme storm events. If information such as shear stress and erosion are not well understood it may be appropriate to conduct data gap studies to acquire location specific values to ascertain the likelihood of cap surface damage or shifting. Focused treatability studies may also help determine the appropriate cap amendment, thickness, or sorptive capacity of specific materials. If it is determined during the FS that additional sampling or monitoring is necessary to fill such data gaps, there are a variety of tools and approaches to consider (NAVFAC, 2008a). The collection of additional physical, chemical, and biological data should be accomplished by optimizing the number and location of additional sampling stations and by determining if single samples can be used for multiple parameters. An optimized FS approach will also consider the logistical complications of cap implementation. Near- shore applications are often conducted and require additional design considerations for application. A light-weight vessel having minimum draft coupled with a broadcast spreader for cap application may be a more cost-effective and time efficient alternative to applying the cap with heavy equipment from the shoreline. The latter would more likely have greater ecological impacts and require a more extensive restoration plan. In situ approaches such as enhanced MNR can be used to facilitate benthic recovery. This technology is usually implemented with the application of thin layers of sand or clean sediment to “kick-start” the recovery of the benthos potentially reducing the overall length or extent of the monitoring program. Other in-situ methods such as the addition of sorptive or reactive amendments if identified in the FS should be re-evaluated depending on the duration of time in between FS and remedial action (RA), since these technologies are rapidly evolving. It is also important to understand the overall functionality and additional sources of contamination in the watershed to understand other potential impacts on a specific site and/or the site remedy. During the FS, the effects of the local watershed should be evaluated and web available hydrodynamic inputs such as water direction and velocity, tidal influence, and seasonal variation should be considered. The RPM is referred to the Watershed Contaminated Source Document (WCSD) which places some focus on identifying non-Navy sources of contamination (CNO, 2003).
43
The selection of a cost-effective remedy and the setting of realistic remedial action and clean-up objectives for sediment sites can be a complex and challenging process. While there are sediment quality standards in certain states, there are no federal clean-up levels that have been promulgated for sediments, and the vast majority of sediment clean-up sites are remediated to comply with site-specific, risk-based clean-up goals. However, limited data are available on the fate, transport, and toxicity of contaminants in the aquatic environment. In addition, the sediments near Navy installations have likely been impacted by a wide range of non-Navy sources such as municipal stormwater discharges and releases from private industrial entities. Navy policy on sediment sites requires identification of other sources of contamination, development of site-specific risk-based clean-up goals, consideration of background levels, development of CSM and data quality objectives (DQOs), and containment of ongoing Navy sources before remediation can start (DON, 2002; NAVFAC, 2003b). More information on Navy sediment policies and remedy selection can be found in the Implementation Guide for Assessing and Managing Contaminated Sediments at Navy Facilities (NAVFAC, 2005). This document contains practical guidelines for conducting sediment site assessments and remedial alternative evaluations at Navy sites. 3.4.4 Munitions Response Sites
Munitions response (MR) sites may have two related but different types of contaminants to remediate. The obvious contaminant type is munitions and explosives of concern (MEC) which includes unexploded ordnance (UXO), discarded military munitions (DMM) and munitions constituents (MC) present in high enough concentrations to present an explosive hazard (generally defined as concentrations > 10% by volume). The other contaminant type is MC present at concentrations below explosive hazard levels that contaminates soil and groundwater and requires a more conventional remedial approach (see Sec-tion 3.4.1). Remediation activities at MEC sites will generate materials potentially presenting an explosive hazard (MPPEH). MPPEH includes packaging materials, munitions debris, range related debris and requires inspection, certification and verification by qualified personnel before it can be shipped to a qualified recycler for processing. Some MPPEH may require specific demilitarization to comply with applicable DoD regulations. MPPEH requires specific handling, storage and tracking onsite and during shipment and processing for which the RPM should be aware. NAVSEA OP 5, Volume 1, 7th Revision provides detailed instructions relating to MPPEH. Most of the MR sites are in the early stages of the remedial process and either have not reached the RI phase or are within the RI phase. However, unlike Installation Restoration Program (IRP) sites, much of the MEC removal activity is performed during the RI phase and thus the RPM must be considering future land use and RAOs before implementation of the RI. In addition many of the construction-related activities that are usually not addressed until remedy selection is complete for an IRP site must be taken into consideration during the RI phase of the MRP sites. Key considerations include safety and the approvals required to perform MEC removal. Safety is the paramount concern at munitions sites. MEC remediation requires specially trained and equipped UXO personnel who execute their duties in accordance with specific, approved procedures. The Department of Defense Explosives Safety Board (DDESB) has established the minimum requirements for training and experience in its Technical Paper 18 (TP 18) (DDESB, 2004). Prior to executing a munitions response project, the RPM may be required to submit an Explosives Safety Submittal (ESS) through the Naval Ordnance Safety and Security Activity (NOSSA). In the ESS it is important to include the munitions with the greatest fragment distance (MGFD) that is reasonably expected (based on research or characterization) to be encountered in any particular area. Also important are contingency MGFDs (a specified munitions item or items that may potentially be present at an MR site); however, there is a low likelihood of the item actually being present. Inclusion of the contingency MGFDs can reduce work stoppages, resubmission of the ESS and help to optimize the field work. NOSSA Instruction 8020.15B provides the guidance for submission of an ESS and the MGFDs (NOSSA, 2009). The ESS must be
44
reviewed and approved by NOSSA and the DDESB. NOSSA also provides specific guidance on the requirements for the After Action Report (AAR). The RPM should review these requirements to ensure that all of the required data are collected during the project.
Considerations in determining RAOs and selecting a remedy at a MR site can include the type, age, location, soil or rock type, number of targets, number of target areas, and size of the surrounding human population. Another consideration is the accessibility of the MEC (e.g., underwater, in steep terrain) as well as the completed exposure pathways that may exist to MEC or MC at the site. For this reason, it is important to develop a comprehensive CSM for the site and to evaluate future land use scenarios. As the future land use has a great impact on the degree to which MEC removal must be performed, the RPM must involve the appropriate Navy personnel early in the process as this will impact the methods used during the RI. In addition, specific project quality objectives must be established early in the investigative phase to help guide the data collection process, leading to selection of a remedy at the site. NAVFAC recommends that the work be guided using a MEC QAPP, which follows the UFP-QAPP format with supporting NAVFAC guidance. The project work plans will consist of the MEC QAPP, contractor standard operating procedures (SOPs) and health and safety plans. To address the explosive safety hazard at a MEC site, some level of LUCs, which include both institutional controls and engineering controls, to prevent or reduce risks to human health and the environment, are almost always implemented and maintained prior to, during and following removal activities. This owes mainly to the fact that unlike IR-type contaminants where analytical sampling can verify whether the contaminant has been remediated, geophysical mapping for MEC is never 100% accurate. In addition to the use of LUCs, MEC remediation typically comes down to performing some level of removal unless it is determined that removal is not practical. Options for MEC removal range from performing a visual surface sweep to conducting a subsurface removal to the depth of detection (removal to depth). Removal depth, which drives the cost of the cleanup, is determined by the anticipated future land use. There is currently no agreed upon Tier 1 screening level hazard assessment for MEC sites. RPMs can use the operation risk management procedures provided in OPNAVINST 3500.39B to perform the initial hazard assessment that is normally performed at the end of the site inspection. There is, however, a standardized approach to MEC hazard assessment for an RI/FS, which is under a two-year trial period within the DON. This MEC Hazard Assessment Methodology addresses human health and safety concerns associated with potential exposure to MEC. RPMs can use the MEC Hazard Assessment Methodology to help with the evaluation of clean-up alternatives in the FS. Project teams will then have to select the alternative to be implemented and determine “how clean is clean” for their site. The chemical constituents of an MC site can be addressed like other IRP contaminants in soil, groundwater, and sediments. After the explosive risk has been mitigated, methods include:
Passive treatment (i.e., MNA);
Hot spot removal of localized areas of wastes in soil and groundwater;
LUCs which include both institutional controls and engineering controls to prevent unacceptable future land use;
Cap or soil cover to eliminate surface exposure pathway and or minimize infiltration;
Active treatment (e.g., bioremediation, PRBs, etc.).
45
Munitions Investigation and Cleanup at Naval Air Facility, Adak, AK
Project Summary
The former Naval Air Facility at Adak Island, AK was used for more than 50 years, dating back to WWII, for a variety of military support roles. These included the handling, use, storage, and disposal of military munitions which led to the potential for a number of sites on the military reservation to be contaminated with MEC. While the Navy operated the base at Adak, munitions-related hazards were successfully managed by means of a public awareness pro-gram as well as access restrictions for areas known to contain munitions or munitions rem-nants. In 1995, Congress included the base at Adak on its closure list, and the last military operations ended there in 1997. With the closure of the base, it became necessary to address munitions hazards in such a way that private economic reuse by nonmilitary personnel would be possible. The Navy has been involved in completing environmental investigation and cleanup in preparation for transferring the base to private ownership and reuse and to a publicly accessible wildlife refuge. Because Adak was listed on the NPL (Superfund) in 1994, the approach for investigation and cleanup of past contamination (chemical contamination as well as munitions) was required to be performed under the framework provided by CERCLA.
Typically, past CERCLA-based investigation and remediation projects ― including those con-ducted at Adak ― relied on well-developed regulatory guidance, past precedents, and appli-cable, relevant, and appropriate environmental regulatory requirements. Although CERCLA provides a mature, well-developed framework for investigation, decision making, and cleanup of sites with chemical contamination, it provides no specific guidance for determining cleanup requirements at sites with potential explosive hazards associated with munitions. The need for investigation, decision making, and a clean-up process that considered the needs of all stakeholders (i.e., Navy, regulatory agencies, U.S. Fish and Wildlife Service, prospective future land owners, tribal interests, and community members) with respect to the remediation of hazards associated with MEC soon became apparent. Optimization Strategy Employed
To separate the munitions cleanup from the cleanup of chemical contamination, the Navy, U.S. EPA Region 10, and the State of Alaska agreed to create a separate Operable Unit (OU) B. To work toward an agreement on how to conduct the investigation and cleanup of the sites within the newly designated OU B, senior managers representing the Navy, U.S. EPA, and the State of Alaska formed a Dispute Resolution Committee (DRC). Rather than dictating a specific resolution to each of the issues under dispute, the DRC directed the formation of a project team composed of project managers from the Navy, U.S. EPA and the State of Alaska, as well as representatives from the U.S. Fish and Wildlife Service, the Aleutian/Pribilof Island Association (representing tribal interests), and The Aleut Corporation (the intended reuse authority). Support to this team was provided from technical consultants with expertise in munitions use, explosives safety, risk assessment, community relations, and munitions detec-tion and remedial technology. This team was chartered with developing an RI/FS work plan for OU B that met the needs of all stakeholders.
46
Munitions Investigation and Cleanup at Naval Air Facility, Adak, AK (Continued)
To foster an atmosphere of clear and open communication among the stakeholders, the Navy employed the services of a professional facilitator. In June of 2000, the constructive relation-ship enjoyed by members of the OU B Project Team made it possible to complete its task of reaching agreement on an RI/FS work plan a little less than a year after the team was formed. The success of the partnered approach used by the Adak Project Team continued long after the completion of the RI/FS work plan. The team continued to work as a group to arrive at clean-up decisions based on the information gathered during the RI/FS.
This team approach was aimed at optimizing the resources available to arrive at expedited risk-based decisions concerning remediation of MEC sites on Adak. Among the innovations developed by the project team are:
Developing a risk-based preliminary assessment screening approach to categorize sites requiring the following: – Immediate response to reduce munitions hazards; – Additional investigation or information to determine the need for further cleanup; or – No further action to address potential munitions hazards.
Developing sampling methodologies and SOPs to gather necessary data at sites where the project team felt there was a need to determine the nature and extent of munitions contamination;
Defining performance requirements for munitions detection systems. Developing and implementing field-based validation procedures for munitions
detection systems to verify and document that they met the required performance standards for the project.
As a result, in December of 2001, the Navy, State of Alaska, and U.S. EPA Region 10 signed a ROD for 131 sites in OU B, for which much of the cleanup work had already been accomplished. Additionally, the 2008 Adak munitions remediation field season provides an example of the use of the UFP-QAPP format on MEC projects (MEC QAPP). The traditional-style work plans, including contractor SOPs, included many instances of repeat information which was often conflicting or inconsistent. For example, the metric associated with the accuracy of Real-time kinematic differential global positioning system (RTK DGPS) to re-occupy a known point was provided in the Technical Management Plan, the QC Plan and multiple contractor SOPs. Descriptions of the checks and surveillances performed as part of the three-phases of the control QC process were described in some detail in multiple documents and related QC checklists were placed in both the QC Plan and the respective contractor SOPs. Using the MEC QAPP format helps optimize the remedy by eliminating virtually all of these repeat descriptions, checklists and forms and providing the information only once, in a specific location, which could then be cross-referenced in either other sections of the QAPP or in SOPs. The QAPP provides a straightforward way to identify and validate that the project is obtaining the types and quantities of data needed to support decisions. It provides clear definitions for expected QC and QA roles and responsibilities. Several of the QAPP Worksheets link directly between the project definable features of work and SOPs, clearly defining the requirements for QC inspections (frequency and accountability) and describing the required metrics for those inspections. All of these factors combined support the notion that the MEC QAPP is a good format for both presenting the project to stakeholders and for conducting the work.
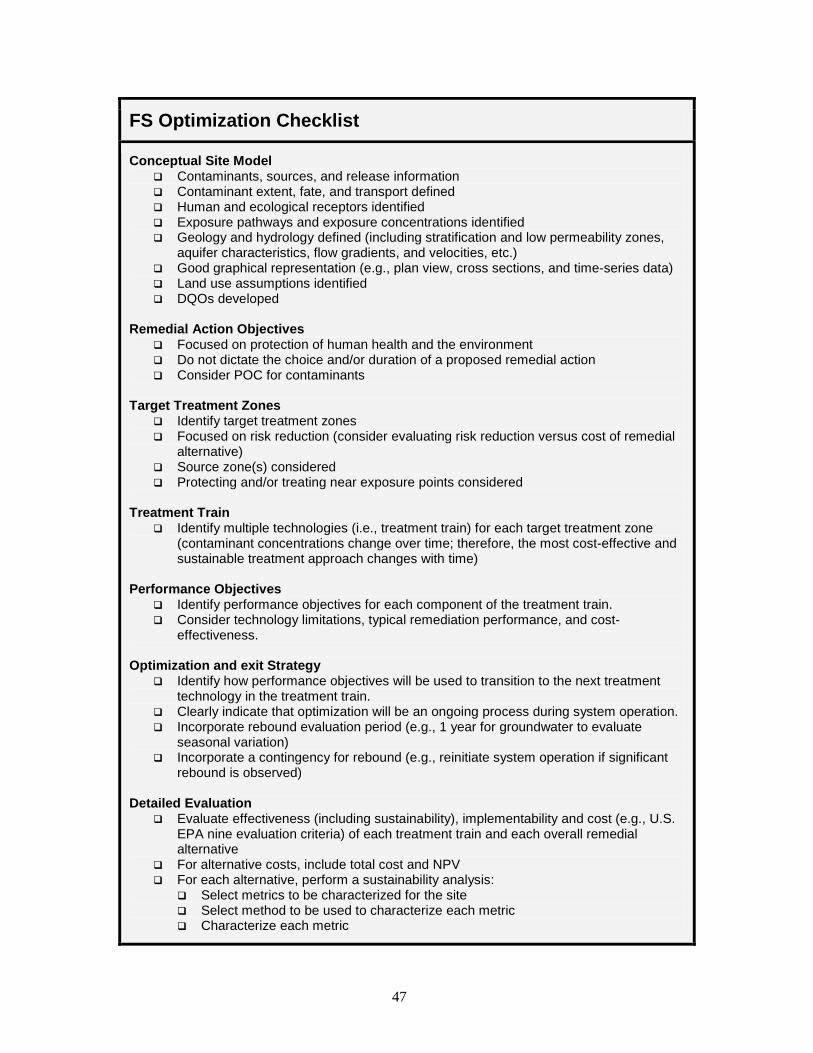
47
FS Optimization Checklist
Conceptual Site Model Contaminants, sources, and release information Contaminant extent, fate, and transport defined Human and ecological receptors identified Exposure pathways and exposure concentrations identified Geology and hydrology defined (including stratification and low permeability zones,
aquifer characteristics, flow gradients, and velocities, etc.) Good graphical representation (e.g., plan view, cross sections, and time-series data) Land use assumptions identified DQOs developed
Remedial Action Objectives
Focused on protection of human health and the environment Do not dictate the choice and/or duration of a proposed remedial action Consider POC for contaminants
Target Treatment Zones
Identify target treatment zones Focused on risk reduction (consider evaluating risk reduction versus cost of remedial
alternative) Source zone(s) considered Protecting and/or treating near exposure points considered
Treatment Train
Identify multiple technologies (i.e., treatment train) for each target treatment zone (contaminant concentrations change over time; therefore, the most cost-effective and sustainable treatment approach changes with time)
Performance Objectives
Identify performance objectives for each component of the treatment train. Consider technology limitations, typical remediation performance, and cost-
effectiveness. Optimization and exit Strategy
Identify how performance objectives will be used to transition to the next treatment technology in the treatment train.
Clearly indicate that optimization will be an ongoing process during system operation. Incorporate rebound evaluation period (e.g., 1 year for groundwater to evaluate
seasonal variation) Incorporate a contingency for rebound (e.g., reinitiate system operation if significant
rebound is observed) Detailed Evaluation
Evaluate effectiveness (including sustainability), implementability and cost (e.g., U.S. EPA nine evaluation criteria) of each treatment train and each overall remedial alternative
For alternative costs, include total cost and NPV For each alternative, perform a sustainability analysis:
Select metrics to be characterized for the site Select method to be used to characterize each metric Characterize each metric
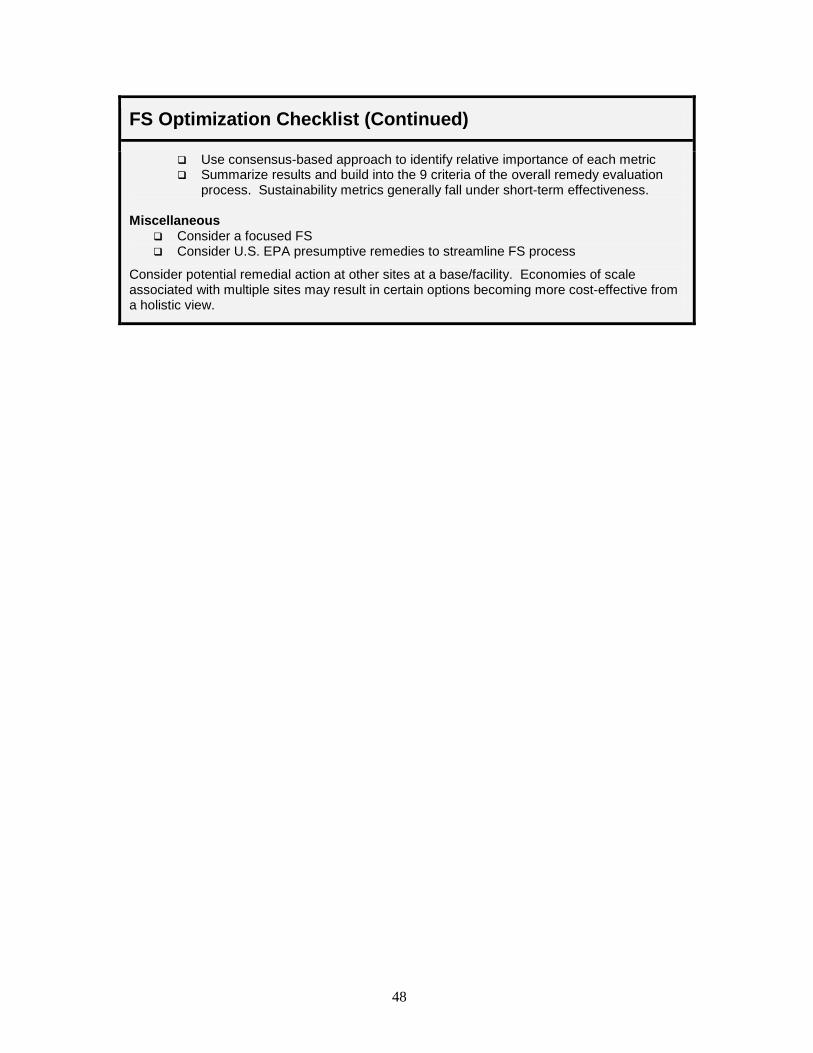
48
FS Optimization Checklist (Continued)
Use consensus-based approach to identify relative importance of each metric Summarize results and build into the 9 criteria of the overall remedy evaluation
process. Sustainability metrics generally fall under short-term effectiveness. Miscellaneous
Consider a focused FS Consider U.S. EPA presumptive remedies to streamline FS process
Consider potential remedial action at other sites at a base/facility. Economies of scale associated with multiple sites may result in certain options becoming more cost-effective from a holistic view.
49
4.0 CONSIDERATIONS FOR OPTIMIZING RODS This section provides overall recommendations for optimizing a ROD or other remedy decision document, including incorporating flexibility into the verbage to allow for future optimization steps, and using the improved ROD format to fully explain the rationale for the remedy decision in a concise manner. A checklist is provided at the end of the chapter that summarizes key considerations. 4.1 Purpose of the ROD After evaluation of the nine criteria is completed within the FS, a PP is developed that includes the selected remedy. The PP is a concise document for wider distribution among the public and other relevant parties. Its purpose is to describe the selected remedy and to obtain final comments on the remedy. Within the PP, it is important to include the RAOs and multiple remedial alternatives with flexibility to change the remedy based on performance objectives, exit strategy, and RAOs. Once the PP is accepted by the regulatory agencies, the remedy selection is documented in the ROD. The ROD is a decision document that provides the risk exposure assumptions, describes the risk that requires remediation, identifies all reasonably anticipated future land uses, and documents the remedial alternatives and the remedy selection. The development of the ROD plays a major role in ensuring that cleanup at a site is completed in a successful and cost-effective manner. The ROD is a legally binding agreement between the Navy and regulatory agencies and changing the ROD subsequent to signing is a relatively complicated process. For this reason, the ROD should be carefully developed so that unexpected technical, administrative, and/or regulatory issues can be addressed in the future without requiring a change to the ROD. Potential changes to RODs must be implemented through an ESD or a ROD amendment, and these additional steps can be costly and time-consuming. Because the overall content of the ROD is very similar to the FS, all of the concepts discussed in Section 3.0 should also be considered by an RPM during the drafting of the ROD. However, the ROD differs from the FS because it is a decision document that explains what remedy has been selected for a site. The ROD is required to cover several issues related to remedy selection including: (1) the rationale for the selected remedy, (2) a description of the selected remedy, (3) estimated costs, and (4) the expected outcome of the selected remedy. The drafting of the language in these sections is important for future optimization efforts as discussed below. More information on the content of the ROD can be found in the U.S. EPA’s Guide to Preparing Superfund Proposed Plans, Records of Decision, and Other Remedy Selection Documents (U.S. EPA, 1998). 4.2 ROD Language that Allows Future Optimization Assuming that the optimization considerations provided in Sections 2.0 and 3.0 have been implemented in the FS, optimizing ROD flexibility consists of providing an “observational approach” and implementing these optimization concepts. This will allow adjustments and modifications to address uncertainties that are typically encountered during implementation of a remedy as additional site and performance data are collected. The iterative and dynamic nature of effective optimization necessitates incorporating flexibility in the ROD, which has been referred to as a “flexible,” “smart,” or “performance- based” ROD. Flexibility associated with design and implementation of a remedial action is critical due to the uncertainty that is inherent with most remedial projects, and the requirements and conditions of a site will likely change over the course of a project (Koerner et al., 1998). It is important that the language used in the remedy description allow for flexibility in technology transition and unit process selection. If the remedy description is written too narrowly, then there will be
50
little room to make adjustments or changes in the future. A carefully written remedy description is key to the ability to implement a treatment train approach as site conditions change over time. For example, remedial technologies such as six phase heating, bioslurping, and others often require off-gas treatment. The remedy description can state that off-gas treatment will be required and that several different options are available such as granular activated carbon (GAC), catalytic oxidation, and VOC-adsorbing resins. The wording used in the ROD should state what the preference is at the time given current site conditions, but recognize the potential need for a transition to other more cost-effective options over time. Likewise, the remedy description should also discuss the treatment train planned for remedial technologies such as a transition from in situ chemical oxidation for source area treatment to MNA for dissolved plume treatment. Another important section of the ROD for incorporating optimization concepts is the required section on the expected outcomes of the selected remedy. This section is required to contain a discussion of expected outcomes in terms of resulting land and groundwater uses and risk reduction achieved as a result of the response action. This is the most appropriate place in the ROD to document performance objectives for the selected remedy components and the need for technology transition, as further operation becomes no longer cost-effective or sustainable, as well as the overall exit strategy for a site. As discussed in Section 2.0, a single technology is often not able to reduce groundwater contaminant levels to risk-based standards such as MCLs. Instead, a treatment train approach is often needed with the use of multiple technologies over time or at various locations. This section should also include a flowchart with decision criteria for stopping further system operation or transitioning technologies. The documentation of this information within the ROD will provide an agreed upon framework for future operations between the Navy and regulatory stakeholders. In conclusion, incorporating flexibility into the ROD language will facilitate effective system design and implementation of the optimization concepts discussed in Section 2.0. These key concepts include treatment trains, performance objectives, optimization and exit strategies. Incorporating flexibility into the ROD will also help to avoid costly and time-consuming revisions via an ESD or a ROD amendment. 4.3 Concepts of the Improved ROD All future Navy RODs and decision documents are to be developed as improved RODs to meet the goals described in the DON Streamlined ROD Strategy (DON, 2007). An improved ROD is a traditional ROD that provides the full rationale for remedy decision in a concise document through the use of streamlined text, figures, and tables with appropriate references to supporting documentation in the AR. The improved ROD must comply with CERCLA and the NCP and follow U.S. EPA guidance. The distinguishing characteristics of an improved ROD are a consolidated outline, detailed references to AR documents that substantiate the information presented, and concise text with maximum use of tables and figures, including a graphic CSM, to summarize key information in formats that are easily interpreted by most readers. The goals of the improved ROD are to facilitate quick access to referenced information, shorten review times, improve readability, and enhance public understanding. This concept was developed as a joint effort between the DoD and U.S. EPA as part of a task force formed to identify ways to improve the closeout process for CERCLA NPL sites. DoD and U.S. EPA worked together to develop a pilot improved ROD for a site at Marine Corps Air Station Cherry Point, North Carolina, which was signed in September 2006. Following signature of the pilot improved ROD, the DON issued the Streamlined Record of Decision Strategy in August 2007 which sets a goal for all active and BRAC ER sites to develop improved RODs and improved decision documents.
51
Consistent with the U.S. EPA ROD guidance, the improved ROD includes three main parts: Declaration, Declaration Summary, and Responsiveness Summary. However, much of the information is presented in a concise form with references to previous documents in the AR. For example, the site description in an improved ROD may be presented in a few short paragraphs with the use of a figure or site map embedded in the text. Detailed information from the AR that describes operational activities, sources or practices resulting in release of hazardous substances can be referenced to substantiate the site description. The summary of previous investigations may be presented in a summary table identifying the primary CERCLA documents in the AR (e.g., UFP-QAPP, PA, SI, RI, or FS) on which the ROD relies. Additionally, a figure illustrating the results of the previous investigations and areas of contamination (e.g., a groundwater plume map) may be provided. Because the improved ROD relies heavily on the AR, a detailed list of references is required to identify title, author, date, section number and page numbers to relevant information from the AR. Key words should be highlighted in the improved ROD to correspond with each reference to direct the reader to the more detailed information in the AR. An optional feature to enhance the improved ROD is to include a CD containing the relevant referenced information from the AR. The CD provides immediate access to the referenced material, expediting the review process for stakeholders. In summary, the improved ROD is expected to optimize the ROD process by reducing the length of the document, reducing preparation time, reducing errors caused by transcription of data, reducing review time, and increasing the efficiency of the closeout process. For additional information on improved RODs, the Navy has developed an improved ROD Web portal which will include examples, templates, relevant references (including the Navy Streamlined ROD Strategy) and guidance, success stories/lessons learned, outreach resources, and Navy contacts. This Web portal is available at: http://www.ert2.org/t2RODPortal/?id=home.
52
ROD Developed to Allow Optimization of SVE System at a Southern California NPL Site
A southern California NPL site was found to have VOCs in soil and groundwater as a result of historic waste management practices. During the 1940s and 1950s, subsurface seepage pits were used to dispose of liquid and solid wastes collected from drains and sinks within buildings at the site. This was an acceptable waste management practice at the time; however, it resulted in the release of spent chlorinated solvents and other chemicals into the environment.
The ROD for the on-site impacted soils was signed in 2002. The ROD established the RAOs at the site to clean-up VOCs in soil to the extent practicable in order to prevent their further migration to groundwater. SVE was the selected remedy because it was the U.S. EPA-designated presumptive remedy for VOCs in soil and it had public and regulatory acceptance. The ROD was written in a flexible manner to enable future cost-effective operation of the SVE system. In the remedy description, GAC was noted as the current selection of the unit process for vapor treatment. However, other potential options were noted in the ROD and it stated that this selection could “be modified based on the concentrations of VOCs in extracted soil vapor.” The ROD also established the following performance objectives for operation of the SVE system:
Reduction of overall contaminant concentrations compared to baseline levels Mass removal to asymptotic levels (following appropriate optimization of the system) Operate only as long as cost-effective.
These performance objectives were defined in the ROD and a flowchart of the exit strategy was provided to document the decision criteria that would be used to measure the progress toward meeting the performance objectives. This flexible approach was approved by the regulatory stakeholders and incorporated into the ROD and the following RD document.
Permit Developed to Allow Optimization of the Pensacola Wastewater Treatment Plant The benefits of a ROD developed with sufficient flexibility to allow for optimization are demonstrated by the Pensacola Wastewater Treatment Plant (WWTP) revised RCRA permit. The RCRA permit, as a decision document, can be considered analogous to a CERCLA ROD. This permit was amended in 2000 and replaced previous, more rigid permit conditions that specified pump and treat as the corrective action. The revised permit included a contingency plan that allowed for flexibility in modifying the selected remedy, “...based on an analysis of site specific data and evaluation of remedial alternatives, such as additional monitoring, reestablishing location of temporary point of compliance wells, containment, additional source reduction, and/or enhanced bioremediation.” Also, the permit was written in such a way that any additional source reduction activities would only require submittal of a treatment plan and not a revised permit. This flexibility represents a significant savings in both time and costs.
Since the revised permit was issued in 2000, the Navy issued a treatment plan to use Oxygen Release Compound (ORC®) to remediate a chlorobenzene hot spot. Additional characterization indicated that the hot spot was larger than expected and the Navy is currently preparing another treatment plan, including an evaluation of alternatives for additional source reduction at the chloro-benzene hot spot and at a chlorinated ethene hot spot. Concentrations associated with the chlori-nated ethene hot spot rebounded after being treated with chemical oxidation (Fenton’s reagent) in 1998. Based on the current understanding of site conditions, the source reduction for the shallow, localized chlorobenzene hot spot will likely consist of excavation and removal. The source reduction for the chlorinated ethene source area will likely be in situ treatment with potassium permanganate chemical oxidation or some other reagent having residual long-term effectiveness.
53
Checklist for Optimizing the ROD Conceptual Site Model
Contaminants, sources, and release information Contaminant extent, fate, and transport defined Human and ecological receptors identified Exposure pathways and exposure concentrations identified Geology and hydrology defined (including stratification and low permeability zones,
aquifer characteristics, flow gradients, and velocities, etc.) Land use assumptions identified DQOs developed
Remedial Action Objectives
Focused on protection of human health and the environment Allow flexibility and do not dictate the choice and/or duration of a proposed remedial
action Consider POC for contaminants
Target Treatment Zones
Identify target treatment zones Focused on risk reduction (consider evaluating risk reduction versus cost of remedial
alternative) Source zone(s) considered Protecting and/or treating near exposure points considered
Treatment Train
Identify multiple technologies (i.e., treatment train) for each target treatment zone (contaminant concentrations change over time; therefore the most cost-effective treatment approach changes with time)
Performance Objectives
Identify performance objectives for each component of the treatment train. Consider technology limitations, typical remediation performance, and cost-
effectiveness. Optimization and Exit Strategy
Identify how performance objectives will be used to transition to the next treatment technology in the treatment train and ensure there is sufficient flexibility so that transitioning to a new technology does not require an ESD or ROD Amendment.
Clearly indicate that optimization will be an ongoing process during system operation. Incorporate rebound evaluation period (e.g., 1 year for groundwater to evaluate
seasonal variation). Incorporate a contingency for rebound (e.g., reinitiate system operation if significant
rebound is observed). Incorporate an “observational approach” that will allow adjustments and modifications
to the remedial action during implementation of a remedy as additional site and performance data are collected.
Improved ROD
Include a consolidated outline with stakeholder consensus. Use streamlined text, figures, and tables with appropriate and detailed references to
supporting documentation in the AR that substantiate the information presented. Include a graphic CSM to summarize key information.
54
5.0 CONSIDERATIONS FOR OPTIMIZING REMEDIES DURING THE RD This section will discuss general design and life-cycle considerations during the RD phase and how to incorporate these strategies for the optimal design of ex situ and in situ treatment technologies. A checklist is also provided at the end of this section that summarizes the key considerations for optimizing remedies during the RD. After the ROD is signed, the RD phase of work is initiated. The RD includes preparation of engineering reports, work plans, technical drawings, and specifications to describe implementation of the selected remedy(ies). Upon approval of the RD by the Navy, the remedial action, or the actual construction and implementation of the selected clean-up alternative is initiated. More information on this project phase can be found in the Remedial Design/Remedial Action Handbook (U.S. EPA, 1995). Unlike in typical water and wastewater system designs that require flexibility to expand with increasing future demand, the remedial system designs should incorporate flexibility to accommodate decreasing mass removal rate with time. The optimization of the RD for a selected remedy should involve planning for a transition from higher- to lower-cost process options or technologies over the lifetime of the project. In the beginning, process options or technologies that can handle larger volumes or higher concentrations may be needed, but their use will likely become prohibitively expensive over time. Therefore, a transition over time to lower-cost process options or technologies needs to be considered in the design process. Figure 5-1 shows that, RPMs should consider the life-cycle design of the selected remedy as part of an optimized RD. The selected process options or technologies should be designed for extended maximum efficiency over the complete duration of the project. Remediation systems are often designed for the “worst case” initial contaminant concentration, which results in high initial capital costs and potentially higher O&M costs due to increased energy demands and other factors. A proper life-cycle design will result in a more sustained mass removal rate over time and typically lower capital and total O&M costs in the long run. There are cases in which remedial systems are not well equipped to handle certain challenges that arise, which can also lead to costly operations. In addition, remediation systems are often unsuccessful in meeting clean-up goals and/or appear to meet clean-up goals but then contaminant concentrations rebound to levels exceeding the goals after active remediation is stopped. This is often caused by back diffusion as discussed in Section 3.4.1. To manage these uncertainties, the system design should be flexible enough to easily allow design modifications and operating adjustments to be made during the RA-O phase without high cost construction efforts. As discussed in Sections 2.5 and 2.6, performance objectives and exit strategies should be used to transition to more appropriate and cost- effective processes. The remedial systems should be designed with these potential transitions in mind. Another important aspect of optimization is the consideration and continual evaluation of site conditions, technological advances, and regulatory developments during the remedy selection and design phase. It is common for multiple years to pass between the FS and the completion of the RD. Much can change over that time period with respect to site conditions, advances in technologies, or changes in regulatory requirements. Since site conditions can change between the FS and RD phases, RPMs should take special action to further refine the CSM at this point to account for additional site data, changing risk assumptions, and other dynamic factors. Additionally, data from the RI/FS may not be detailed enough and better data may be necessary to define source areas to be treated with in situ technologies. For example, a membrane interface probe followed by confirmation sampling with a Geoprobe™ could be used to better define contaminant extent prior to implementation of in situ chemical oxidation.
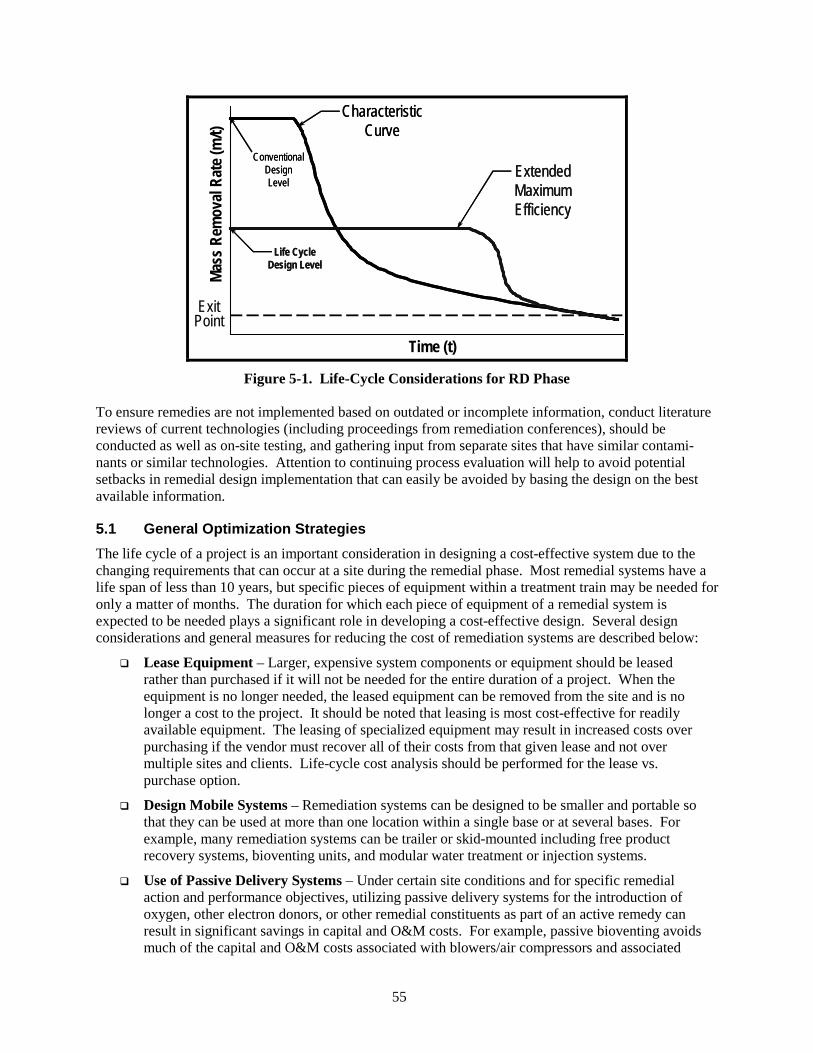
55
Time (t)
Mass
Rem
oval
Rate
(m/t)
ExitPoint
CharacteristicCurve
CharacteristicCurve
ConventionalDesignLevel
ConventionalDesignLevel
Life CycleDesign Level
Life CycleDesign Level
ExtendedMaximumEfficiency
ExtendedMaximumEfficiency
Figure 5-1. Life-Cycle Considerations for RD Phase
To ensure remedies are not implemented based on outdated or incomplete information, conduct literature reviews of current technologies (including proceedings from remediation conferences), should be conducted as well as on-site testing, and gathering input from separate sites that have similar contami-nants or similar technologies. Attention to continuing process evaluation will help to avoid potential setbacks in remedial design implementation that can easily be avoided by basing the design on the best available information.
5.1 General Optimization Strategies The life cycle of a project is an important consideration in designing a cost-effective system due to the changing requirements that can occur at a site during the remedial phase. Most remedial systems have a life span of less than 10 years, but specific pieces of equipment within a treatment train may be needed for only a matter of months. The duration for which each piece of equipment of a remedial system is expected to be needed plays a significant role in developing a cost-effective design. Several design considerations and general measures for reducing the cost of remediation systems are described below:
Lease Equipment – Larger, expensive system components or equipment should be leased rather than purchased if it will not be needed for the entire duration of a project. When the equipment is no longer needed, the leased equipment can be removed from the site and is no longer a cost to the project. It should be noted that leasing is most cost-effective for readily available equipment. The leasing of specialized equipment may result in increased costs over purchasing if the vendor must recover all of their costs from that given lease and not over multiple sites and clients. Life-cycle cost analysis should be performed for the lease vs. purchase option.
Design Mobile Systems – Remediation systems can be designed to be smaller and portable so that they can be used at more than one location within a single base or at several bases. For example, many remediation systems can be trailer or skid-mounted including free product recovery systems, bioventing units, and modular water treatment or injection systems.
Use of Passive Delivery Systems – Under certain site conditions and for specific remedial action and performance objectives, utilizing passive delivery systems for the introduction of oxygen, other electron donors, or other remedial constituents as part of an active remedy can result in significant savings in capital and O&M costs. For example, passive bioventing avoids much of the capital and O&M costs associated with blowers/air compressors and associated
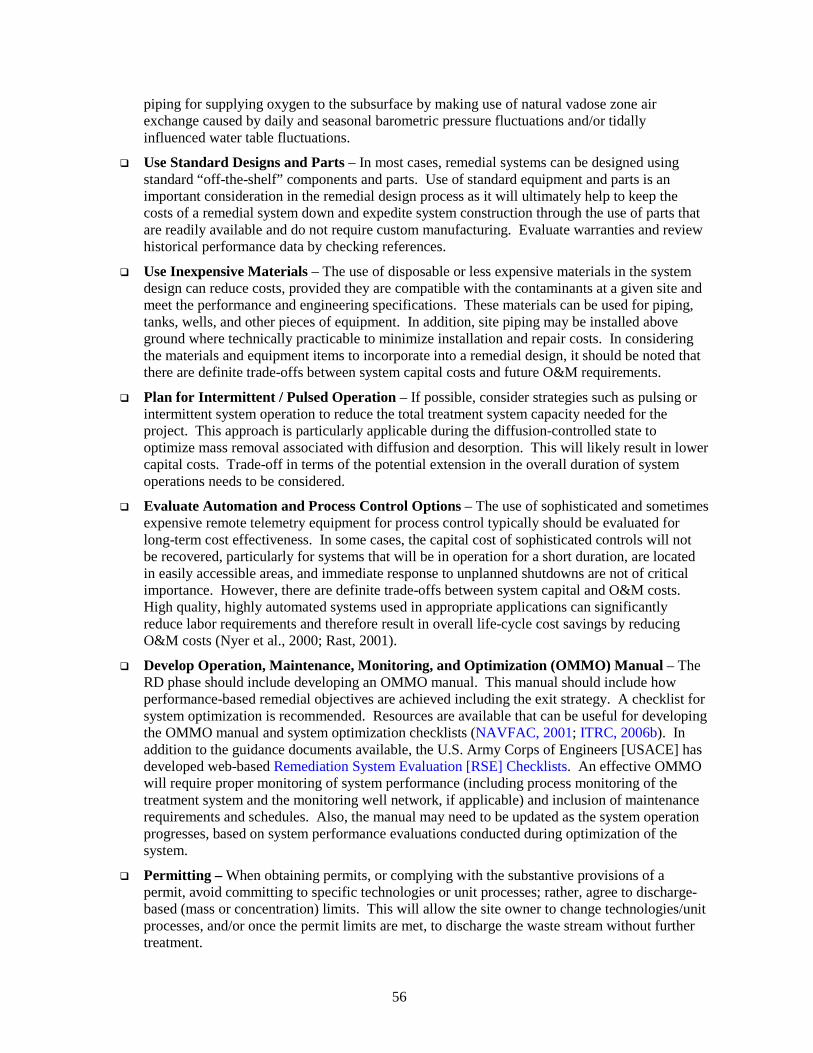
56
piping for supplying oxygen to the subsurface by making use of natural vadose zone air exchange caused by daily and seasonal barometric pressure fluctuations and/or tidally influenced water table fluctuations.
Use Standard Designs and Parts – In most cases, remedial systems can be designed using standard “off-the-shelf” components and parts. Use of standard equipment and parts is an important consideration in the remedial design process as it will ultimately help to keep the costs of a remedial system down and expedite system construction through the use of parts that are readily available and do not require custom manufacturing. Evaluate warranties and review historical performance data by checking references.
Use Inexpensive Materials – The use of disposable or less expensive materials in the system design can reduce costs, provided they are compatible with the contaminants at a given site and meet the performance and engineering specifications. These materials can be used for piping, tanks, wells, and other pieces of equipment. In addition, site piping may be installed above ground where technically practicable to minimize installation and repair costs. In considering the materials and equipment items to incorporate into a remedial design, it should be noted that there are definite trade-offs between system capital costs and future O&M requirements.
Plan for Intermittent / Pulsed Operation – If possible, consider strategies such as pulsing or intermittent system operation to reduce the total treatment system capacity needed for the project. This approach is particularly applicable during the diffusion-controlled state to optimize mass removal associated with diffusion and desorption. This will likely result in lower capital costs. Trade-off in terms of the potential extension in the overall duration of system operations needs to be considered.
Evaluate Automation and Process Control Options – The use of sophisticated and sometimes expensive remote telemetry equipment for process control typically should be evaluated for long-term cost effectiveness. In some cases, the capital cost of sophisticated controls will not be recovered, particularly for systems that will be in operation for a short duration, are located in easily accessible areas, and immediate response to unplanned shutdowns are not of critical importance. However, there are definite trade-offs between system capital and O&M costs. High quality, highly automated systems used in appropriate applications can significantly reduce labor requirements and therefore result in overall life-cycle cost savings by reducing O&M costs (Nyer et al., 2000; Rast, 2001).
Develop Operation, Maintenance, Monitoring, and Optimization (OMMO) Manual – The RD phase should include developing an OMMO manual. This manual should include how performance-based remedial objectives are achieved including the exit strategy. A checklist for system optimization is recommended. Resources are available that can be useful for developing the OMMO manual and system optimization checklists (NAVFAC, 2001; ITRC, 2006b). In addition to the guidance documents available, the U.S. Army Corps of Engineers [USACE] has developed web-based Remediation System Evaluation [RSE] Checklists. An effective OMMO will require proper monitoring of system performance (including process monitoring of the treatment system and the monitoring well network, if applicable) and inclusion of maintenance requirements and schedules. Also, the manual may need to be updated as the system operation progresses, based on system performance evaluations conducted during optimization of the system.
Permitting – When obtaining permits, or complying with the substantive provisions of a permit, avoid committing to specific technologies or unit processes; rather, agree to discharge-based (mass or concentration) limits. This will allow the site owner to change technologies/unit processes, and/or once the permit limits are met, to discharge the waste stream without further treatment.
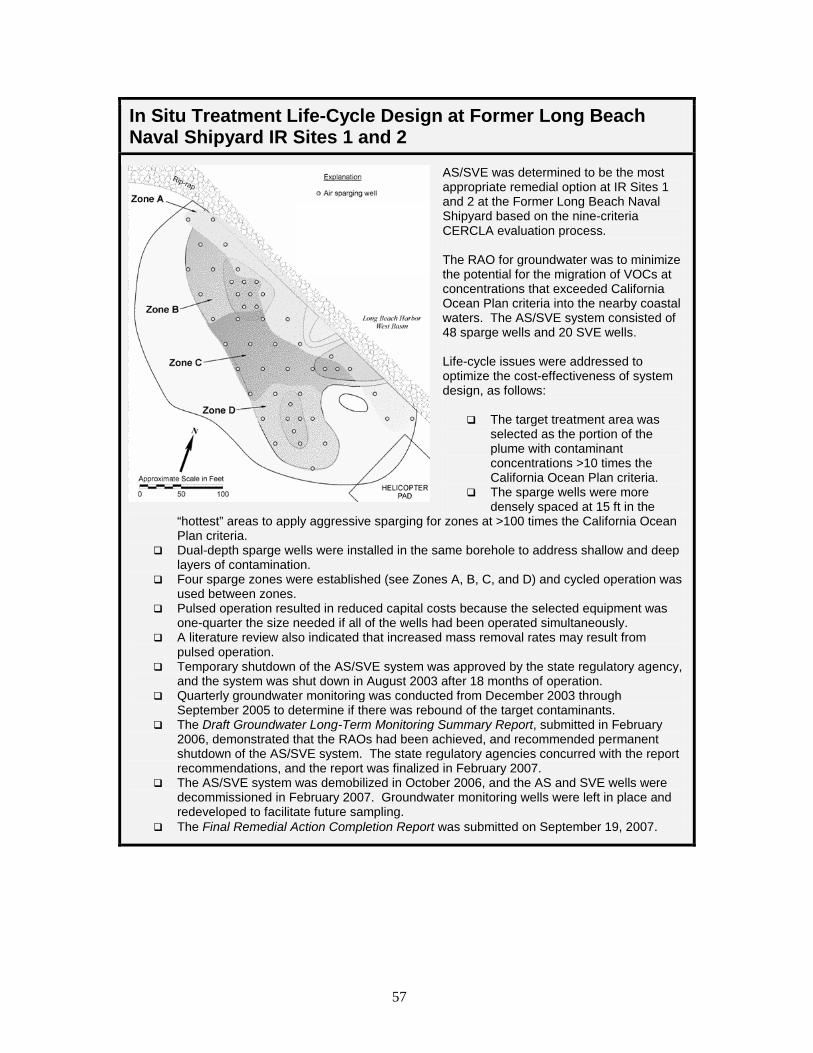
57
In Situ Treatment Life-Cycle Design at Former Long Beach Naval Shipyard IR Sites 1 and 2
AS/SVE was determined to be the most appropriate remedial option at IR Sites 1 and 2 at the Former Long Beach Naval Shipyard based on the nine-criteria CERCLA evaluation process. The RAO for groundwater was to minimize the potential for the migration of VOCs at concentrations that exceeded California Ocean Plan criteria into the nearby coastal waters. The AS/SVE system consisted of 48 sparge wells and 20 SVE wells. Life-cycle issues were addressed to optimize the cost-effectiveness of system design, as follows:
The target treatment area was selected as the portion of the plume with contaminant concentrations >10 times the California Ocean Plan criteria.
The sparge wells were more densely spaced at 15 ft in the
“hottest” areas to apply aggressive sparging for zones at >100 times the California Ocean Plan criteria.
Dual-depth sparge wells were installed in the same borehole to address shallow and deep layers of contamination.
Four sparge zones were established (see Zones A, B, C, and D) and cycled operation was used between zones.
Pulsed operation resulted in reduced capital costs because the selected equipment was one-quarter the size needed if all of the wells had been operated simultaneously.
A literature review also indicated that increased mass removal rates may result from pulsed operation.
Temporary shutdown of the AS/SVE system was approved by the state regulatory agency, and the system was shut down in August 2003 after 18 months of operation.
Quarterly groundwater monitoring was conducted from December 2003 through September 2005 to determine if there was rebound of the target contaminants.
The Draft Groundwater Long-Term Monitoring Summary Report, submitted in February 2006, demonstrated that the RAOs had been achieved, and recommended permanent shutdown of the AS/SVE system. The state regulatory agencies concurred with the report recommendations, and the report was finalized in February 2007.
The AS/SVE system was demobilized in October 2006, and the AS and SVE wells were decommissioned in February 2007. Groundwater monitoring wells were left in place and redeveloped to facilitate future sampling.
The Final Remedial Action Completion Report was submitted on September 19, 2007.
58
Ex Situ Treatment Life-Cycle Design at Coastal Systems Station (CSS), Panama City, FL At a site in northern Florida, 63,000 gallons of petroleum hydrocarbons were released at a fire-fighting training pit, most of which were burned as part of the fire training exercises. These activities resulted in a ½-acre LNAPL plume with an estimated 500 to 5,000 gallons of recov-erable LNAPL. The initial proposed remedy was interceptor trenches and sumps, but vacuum-enhanced free product recovery or bioslurping was later selected as a more optimal approach. The bioslurping system installed at the site consisted of 17 extraction wells, 12 groundwater monitoring wells, and unit processes for free product recovery and water and off-gas treatment. Several life-cycle considerations were taken into account in the design, as follows:
Some of the equipment was leased to the Navy without the need to purchase the equipment.
The system was designed for the expected short duration of LNAPL recovery. Polyvinyl chloride (PVC) was used instead of metal piping because of the expected
short duration of the project. Aboveground piping was used to save installation costs and allow for less extensive
secondary containment. The system was designed for average, not maximum, fluid recoveries and contaminant
loadings. Each well had a flow control to adjust loading to the aboveground treatment equipment,
depending on the LNAPL thickness observed in the well. Optimal treatment train design was used to implement a phased approach to water and
off-gas treatment.
As listed above, optimal treatment train design for off-gas treatment and water treatment played a role in ensuring the cost-effectiveness of the remedy.
Figure 1 shows the transition of the water treatment system from chemical treatment with dissolved air flotation (DAF) to direct discharge to the Base’s WWTP. During the initial stages of the project, very high free product recovery necessitated the use of DAF to reach the appro-priate discharge limits for TPH. However, after 15 weeks, the recovery of LNAPL declined and the TPH levels in the extracted groundwater were below the appropriate discharge limits. The use of DAF was discontinued and the water was discharged directly to the WWTP. This resulted in an approximate cost savings of $15,000 per month.
Figure 1, Waste Treatment System Transition
In addition, successful removal of LNAPL in the source area has enabled the natural attenuation capacity of the aquifer to be an effective remedy for dissolved-phase residual contaminants that had the potential to impact St. Andrews Bay (therefore, this site is an example of a source reduction and MNA treatment train).
59
5.2 In Situ Treatment Optimization Strategies In situ treatment methods are a large part of the remedial strategy at many contaminated sites. Because they are below ground, in situ methods offer potential advantages over aboveground treatment systems, including reduced exposure of on-site personnel and the population to contaminants, minimization of aboveground support equipment that may interfere with site aesthetics or operations, reduced costs related to extraction and transport of contaminants and operation and maintenance of systems, and reduced liability of transferring contaminated media to other sites, e.g., landfills. In situ treatment trains are an important part of the life-cycle design of groundwater and soil remedies because a single technology may often be unable to meet RAOs in a reasonable timeframe. Some in situ remedial technologies are best suited to reduce the mass in source zone or hot spot treatment, while other technologies are more suitable for the treatment of larger, more diffusely impacted areas. A remediation strategy frequently used involves a combination of in situ technologies, with active treatment in the source zone and passive treatment in the dissolved-phase plume. For example, chemical oxidation could be used to treat chlorinated solvents in the source zone, while enhanced bioremediation and/or MNA is applied downgradient to polish residual dissolved-phase contaminants. As with aboveground treatment systems, concepts related to source and plume distribution, flow and mass transport, transformation and retardation of contaminants should be understood to achieve optimum results from in situ methods. In general, in situ methods involve treatment within the subsurface matrix that can be complicated by the unique geochemical and lithologic characteristics of the site. As with any treatment method, contact of the contaminant with the reagent or remedial mechanism is a key to successfully achieving remedial goals. Practically, this means site characterization should be sufficiently defined such that source/plume geometry, geochemistry, biological processes, and geologic lithology are sufficiently well understood to allow selection of the most appropriate delivery and treatment option. Failure to sufficiently understand these controlling variables may result in an inadequate design, failure to meet remedial objectives, and additional costs to collect appropriate data after the fact and change or modify the treatment system. An adequate CSM (see Section 2.1) is particularly important for in situ remedies and the detailed requirements of the CSM depend in part with the remedial technologies selected for the site. Thus, once remedial technologies are selected, it may be necessary to further refine the CSM to meet the data requirements for the selected technologies. In many cases, a pilot study may be warranted to evaluate response to treatment and determine critical design parameters prior to design and implementation of full-scale systems. Refer to Section 3.4 for additional information related to controlling variables and limitations that should be considered. The examples in the next sections illustrate the importance of understanding site characteristics, determining technology-specific design parameters, and implications for successful design, installation, and operation of in situ treatment methods. Also, the Naval Weapons Station, Charleston, SC and Marine Corps Logistics Base, Albany, GA case examples provided in Sections 2.3 and 2.4 illustrate optimization concepts described in these sections. 5.2.1 Source Characterization Impacts to Successful Treatment
Adequate characterization of the source zone is required for the successful design and implementation of in situ treatment technologies. As an example, at the Naval Submarine Base Kings Bay, treatment of a source of perchloroethene was hindered by incomplete characterization of the source area. Initial characterization of the subsurface used direct push technology to sample at pre-selected depth intervals to delineate the source of contamination. The intervals and areas selected missed significant portions of the contaminant source. During treatment by chemical oxidation, significant contaminant concentrations remained and required treatment. Follow-up site investigation incorporated the use of continuously
60
reading direct push technology that identified discrete zones of contamination not previously observed. Final treatment after further characterization resulted in successful treatment. Source zones typically represent relatively small areas compared to the area defined by the full extent of impact. In the case of impacted groundwater, source zones are sometimes difficult to locate, especially if the presence of DNAPL is suspected. For this reason, localized areas of elevated concentrations often are used as an indication of the presence of a nearby source. Various characterization technologies can then be applied to further delineate the source. For example, a membrane interface probe may be used to delineate the source and then a Geoprobe™ could be used to collect confirmation samples prior to designing the source reduction remedy. 5.2.2 Geochemical Impacts to Successful Treatment
Failure to account for the presence of certain geochemical constituents in groundwater systems can have negative impacts on technology performance. As an example, a Fenton’s based chemical oxidation project at Naval Air Station Pensacola designed to treat chlorinated solvents in groundwater was deployed that failed to incorporate site geochemistry into the design of the reagent application. In this case, the site had elevated levels of ferrous iron in groundwater caused by the low pH conditions in the aquifer (<4) that was not properly evaluated prior to remedy implementation. Iron is a catalyst for the Fenton’s reaction that is used to accelerate the reaction and generate radicals that oxidize the contaminants. Once the Fenton’s reagent was injected into the subsurface, the high concentrations of iron in the groundwater caused the reaction to proceed very quickly at the injection point without reaching the intended radius of distribution. This initial round of treatment and mobilization was determined to be unsuccessful. After further evaluation of the site geochemistry, the reagent and catalyst were modified to account for the high ferrous iron in groundwater. The subsequent oxidation treatments with Fenton’s reagent were deemed successful. Similarly, aquifer redox conditions are critical to the successful design of enhanced bioremediation systems. For example, a shallow aquifer contaminated with chlorinated solvents and with oxic conditions frequently induced from infiltrating rainfall may require significantly more carbon substrate addition to develop and maintain anaerobic conditions favorable for reductive dechlorination. Such oxic conditions may also preclude the use of bioaugmentation that is sometimes considered for enhanced treatment of “DCE stall” conditions as survival and growth of microbes injected for this purpose strongly favors an anaerobic environment. 5.2.3 Delivery System Design Impacts to Successful Treatment
A variety of engineered delivery methods are available to introduce treatment reagents to the subsurface for both source zone and dissolved plume treatment. The delivery system should be designed with site-specific conditions and RAOs in mind. In situ treatment options can be classified as either passive or active. The distinction between these two categories is the degree of ongoing O&M of the treatment system. Passive implies minimal O&M as compared to active systems. Examples of passive delivery systems are PRBs or biobarriers consisting of emulsified vegetable oil injected by direct push technology. For passive remediation systems in which transport of the contaminant to the treatment system occurs naturally, careful hydraulic evaluation should be made to ensure contaminants do not bypass the treatment system. Active delivery systems include groundwater recirculation systems that extract contaminated groundwater from the subsurface, amend the water with treatment reagent, and inject the mixture back into the subsurface. The ongoing O&M requirements for recirculation systems should be considered when implementing these types of systems for in situ treatment.
61
5.3 Ex Situ Treatment Optimization Strategies
Treatment train optimization is also an important consideration for ex situ treatment systems that generate secondary waste streams and residuals that must be managed appropriately. Common outputs of remediation systems that must be managed include the following:
Air Emissions – Typical air emissions from remediation sites include dust and VOCs. The selection, design, and operation of the VOC off-gas treatment system often plays a major role in the cost-effectiveness of a given remediation system. At many sites, off-gas treatment costs represent the largest portion of the total project O&M costs. It is important to optimize the selection of the vapor treatment technology because operating costs can be more than doubled if a less than optimal vapor treatment technology is used. Off-gas concentrations typically decline rapidly over time. Life-cycle concepts, therefore, need to be incorporated into the selection of off-gas treatment systems. Often, a phased approach is used at a site. For example, at a site with nonhalogenated VOCs, a thermal oxidizer might be used to combust the initial highly contaminated off-gas stream, followed by a catalytic oxidizer, and then GAC or direct dis-charge. In addition, stringent regulatory requirements for off-gas treatment can drive costs at a remediation site. The air permit, or permit equivalency, should contain provisions to change out the off-gas treatment equipment over time and provide for direct discharge at safe levels. Once granted, this permit or permit equivalency will set emission limits and monitoring requirements for each type of equipment. The type of VOC off-gas treatment system appropriate for a given site should be made on a site-specific basis, based on the contaminant type, anticipated flowrate, mass loading, regulatory treatment requirements, and other factors.
Water Discharges – Several site-specific factors play a role in the optimal selection of the type and capacity of water treatment units. These factors include contaminant types, influent/effluent concentrations, and natural water quality constituents. Typical water treatment technologies for organics include air stripping, GAC, chemical/ultraviolet oxidation, and biological reactors. Typical water treatment technologies for inorganics include chemical precipitation, ion exchange, adsorption, and electrochemical methods. Recommendations for the exact type of treatment process to be used are beyond the scope of this document, but additional resources are highlighted in the following text box. It is important that life-cycle design be incorporated into the selection and design of water treatment unit processes. A phased approach to water treatment should be considered so that the system can be modified over time in response to changes in flowrate or contaminant loadings. The phased approach can be achieved with modular treatment components that can easily be added or removed from the treatment system as appropriate (U.S. EPA, 1996b). The water discharge permit or permit equivalency should contain provisions that allow for transitioning between water treatment options as appropriate during the course of the remedial action.
Solid Wastes – Excavation and disposal may be a cost-effective remedial technology at sites with shallow source areas, considering the many uncertainties associated with in situ technologies. The handling of contaminated soil and sediment removed from a site can be optimized in several ways. One method is to segregate stockpiles into different sections depending on the level and types of contamination. Soils or sediments that are appropriate for backfilling and/or surface restoration activities can be segregated from more heavily contaminated soils. Soil or sediments that are hazardous according to state regulations but not federal regulations can be segregated for treatment and disposal at the proper state-authorized facilities. Finally, soil or sediments that are hazardous, according to state and federal regulations, can be segregated for treatment and disposal at the proper federally authorized facilities. This approach will likely improve ease of handling by allowing “clean” soil or sediments to remain onsite, and may also result in significant cost savings for treatment and disposal.
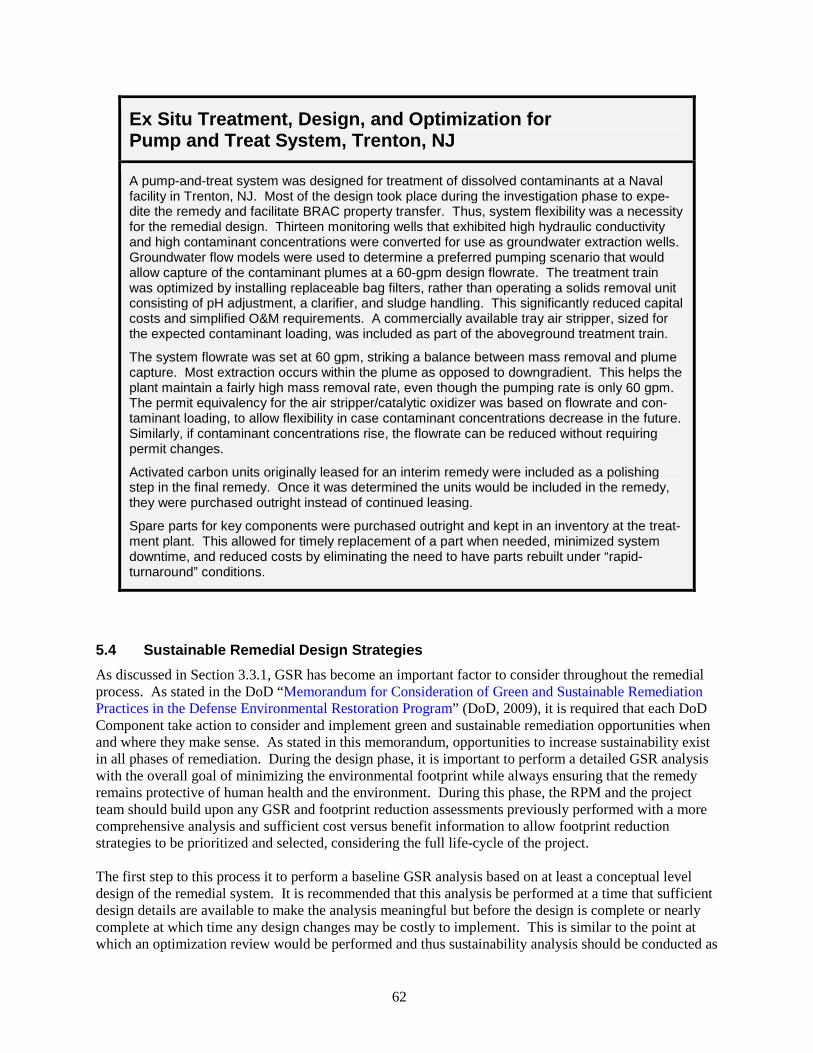
62
Ex Situ Treatment, Design, and Optimization for Pump and Treat System, Trenton, NJ
A pump-and-treat system was designed for treatment of dissolved contaminants at a Naval facility in Trenton, NJ. Most of the design took place during the investigation phase to expe-dite the remedy and facilitate BRAC property transfer. Thus, system flexibility was a necessity for the remedial design. Thirteen monitoring wells that exhibited high hydraulic conductivity and high contaminant concentrations were converted for use as groundwater extraction wells. Groundwater flow models were used to determine a preferred pumping scenario that would allow capture of the contaminant plumes at a 60-gpm design flowrate. The treatment train was optimized by installing replaceable bag filters, rather than operating a solids removal unit consisting of pH adjustment, a clarifier, and sludge handling. This significantly reduced capital costs and simplified O&M requirements. A commercially available tray air stripper, sized for the expected contaminant loading, was included as part of the aboveground treatment train.
The system flowrate was set at 60 gpm, striking a balance between mass removal and plume capture. Most extraction occurs within the plume as opposed to downgradient. This helps the plant maintain a fairly high mass removal rate, even though the pumping rate is only 60 gpm. The permit equivalency for the air stripper/catalytic oxidizer was based on flowrate and con-taminant loading, to allow flexibility in case contaminant concentrations decrease in the future. Similarly, if contaminant concentrations rise, the flowrate can be reduced without requiring permit changes.
Activated carbon units originally leased for an interim remedy were included as a polishing step in the final remedy. Once it was determined the units would be included in the remedy, they were purchased outright instead of continued leasing.
Spare parts for key components were purchased outright and kept in an inventory at the treat-ment plant. This allowed for timely replacement of a part when needed, minimized system downtime, and reduced costs by eliminating the need to have parts rebuilt under “rapid-turnaround” conditions.
5.4 Sustainable Remedial Design Strategies As discussed in Section 3.3.1, GSR has become an important factor to consider throughout the remedial process. As stated in the DoD “Memorandum for Consideration of Green and Sustainable Remediation Practices in the Defense Environmental Restoration Program” (DoD, 2009), it is required that each DoD Component take action to consider and implement green and sustainable remediation opportunities when and where they make sense. As stated in this memorandum, opportunities to increase sustainability exist in all phases of remediation. During the design phase, it is important to perform a detailed GSR analysis with the overall goal of minimizing the environmental footprint while always ensuring that the remedy remains protective of human health and the environment. During this phase, the RPM and the project team should build upon any GSR and footprint reduction assessments previously performed with a more comprehensive analysis and sufficient cost versus benefit information to allow footprint reduction strategies to be prioritized and selected, considering the full life-cycle of the project. The first step to this process it to perform a baseline GSR analysis based on at least a conceptual level design of the remedial system. It is recommended that this analysis be performed at a time that sufficient design details are available to make the analysis meaningful but before the design is complete or nearly complete at which time any design changes may be costly to implement. This is similar to the point at which an optimization review would be performed and thus sustainability analysis should be conducted as
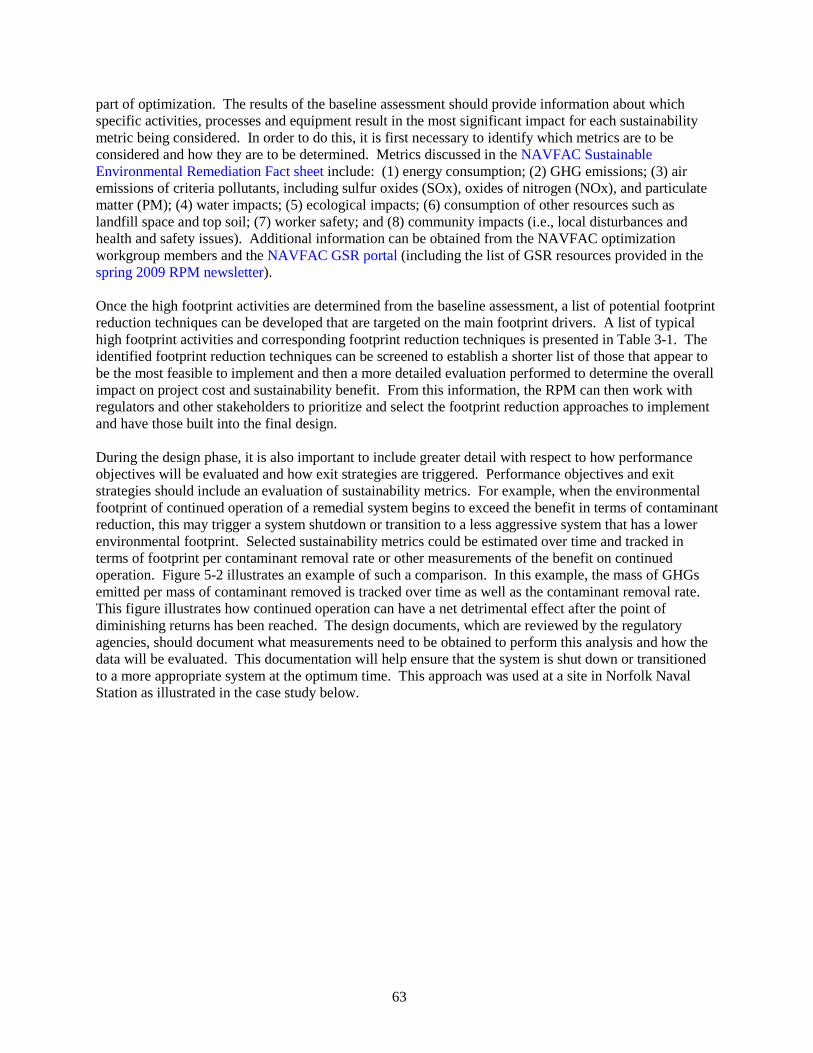
63
part of optimization. The results of the baseline assessment should provide information about which specific activities, processes and equipment result in the most significant impact for each sustainability metric being considered. In order to do this, it is first necessary to identify which metrics are to be considered and how they are to be determined. Metrics discussed in the NAVFAC Sustainable Environmental Remediation Fact sheet include: (1) energy consumption; (2) GHG emissions; (3) air emissions of criteria pollutants, including sulfur oxides (SOx), oxides of nitrogen (NOx), and particulate matter (PM); (4) water impacts; (5) ecological impacts; (6) consumption of other resources such as landfill space and top soil; (7) worker safety; and (8) community impacts (i.e., local disturbances and health and safety issues). Additional information can be obtained from the NAVFAC optimization workgroup members and the NAVFAC GSR portal (including the list of GSR resources provided in the spring 2009 RPM newsletter). Once the high footprint activities are determined from the baseline assessment, a list of potential footprint reduction techniques can be developed that are targeted on the main footprint drivers. A list of typical high footprint activities and corresponding footprint reduction techniques is presented in Table 3-1. The identified footprint reduction techniques can be screened to establish a shorter list of those that appear to be the most feasible to implement and then a more detailed evaluation performed to determine the overall impact on project cost and sustainability benefit. From this information, the RPM can then work with regulators and other stakeholders to prioritize and select the footprint reduction approaches to implement and have those built into the final design. During the design phase, it is also important to include greater detail with respect to how performance objectives will be evaluated and how exit strategies are triggered. Performance objectives and exit strategies should include an evaluation of sustainability metrics. For example, when the environmental footprint of continued operation of a remedial system begins to exceed the benefit in terms of contaminant reduction, this may trigger a system shutdown or transition to a less aggressive system that has a lower environmental footprint. Selected sustainability metrics could be estimated over time and tracked in terms of footprint per contaminant removal rate or other measurements of the benefit on continued operation. Figure 5-2 illustrates an example of such a comparison. In this example, the mass of GHGs emitted per mass of contaminant removed is tracked over time as well as the contaminant removal rate. This figure illustrates how continued operation can have a net detrimental effect after the point of diminishing returns has been reached. The design documents, which are reviewed by the regulatory agencies, should document what measurements need to be obtained to perform this analysis and how the data will be evaluated. This documentation will help ensure that the system is shut down or transitioned to a more appropriate system at the optimum time. This approach was used at a site in Norfolk Naval Station as illustrated in the case study below.
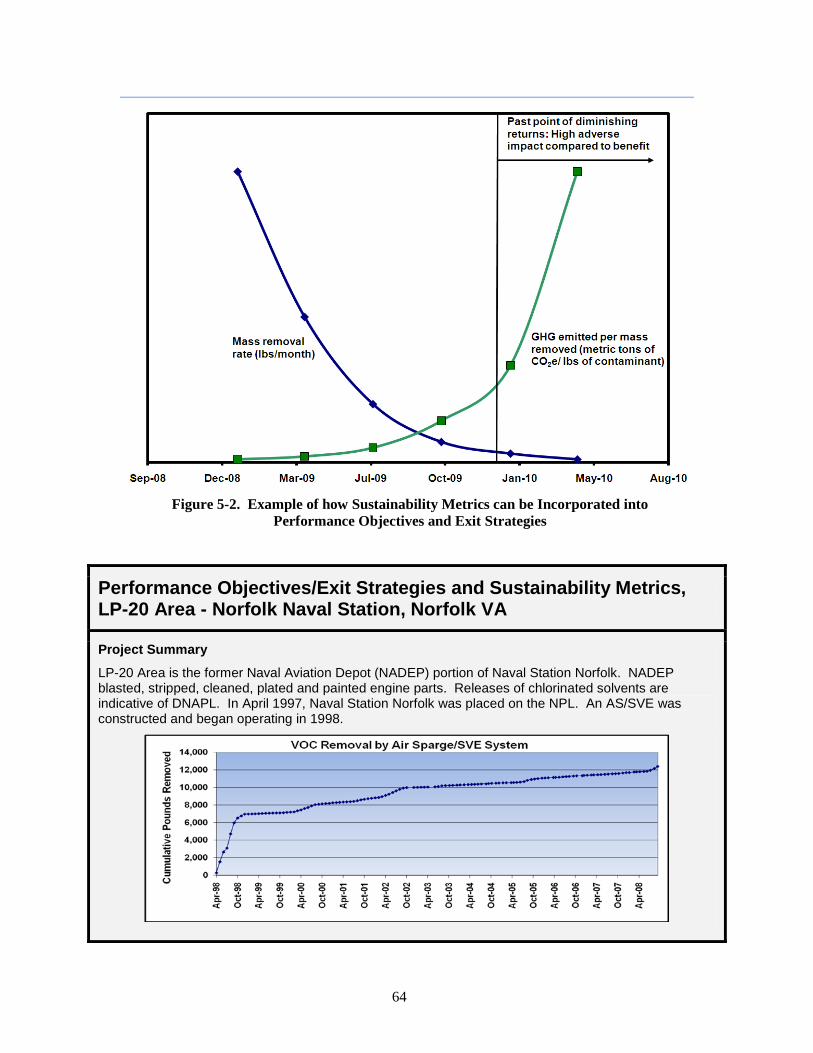
64
Figure 5-2. Example of how Sustainability Metrics can be Incorporated into
Performance Objectives and Exit Strategies
Performance Objectives/Exit Strategies and Sustainability Metrics, LP-20 Area - Norfolk Naval Station, Norfolk VA
Project Summary
LP-20 Area is the former Naval Aviation Depot (NADEP) portion of Naval Station Norfolk. NADEP blasted, stripped, cleaned, plated and painted engine parts. Releases of chlorinated solvents are indicative of DNAPL. In April 1997, Naval Station Norfolk was placed on the NPL. An AS/SVE was constructed and began operating in 1998.
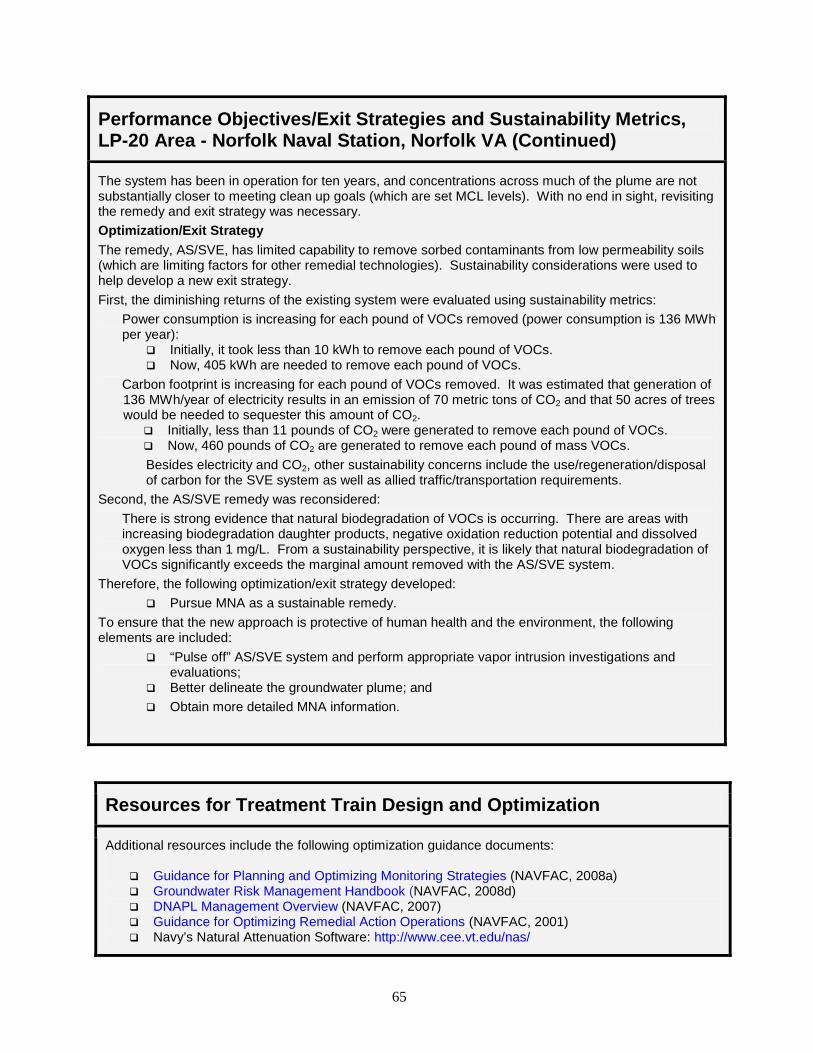
65
Performance Objectives/Exit Strategies and Sustainability Metrics, LP-20 Area - Norfolk Naval Station, Norfolk VA (Continued)
The system has been in operation for ten years, and concentrations across much of the plume are not substantially closer to meeting clean up goals (which are set MCL levels). With no end in sight, revisiting the remedy and exit strategy was necessary. Optimization/Exit Strategy The remedy, AS/SVE, has limited capability to remove sorbed contaminants from low permeability soils (which are limiting factors for other remedial technologies). Sustainability considerations were used to help develop a new exit strategy. First, the diminishing returns of the existing system were evaluated using sustainability metrics:
Power consumption is increasing for each pound of VOCs removed (power consumption is 136 MWh per year):
Initially, it took less than 10 kWh to remove each pound of VOCs. Now, 405 kWh are needed to remove each pound of VOCs.
Carbon footprint is increasing for each pound of VOCs removed. It was estimated that generation of 136 MWh/year of electricity results in an emission of 70 metric tons of CO2 and that 50 acres of trees would be needed to sequester this amount of CO2.
Initially, less than 11 pounds of CO2 were generated to remove each pound of VOCs. Now, 460 pounds of CO2 are generated to remove each pound of mass VOCs. Besides electricity and CO2, other sustainability concerns include the use/regeneration/disposal of carbon for the SVE system as well as allied traffic/transportation requirements.
Second, the AS/SVE remedy was reconsidered: There is strong evidence that natural biodegradation of VOCs is occurring. There are areas with increasing biodegradation daughter products, negative oxidation reduction potential and dissolved oxygen less than 1 mg/L. From a sustainability perspective, it is likely that natural biodegradation of VOCs significantly exceeds the marginal amount removed with the AS/SVE system.
Therefore, the following optimization/exit strategy developed: Pursue MNA as a sustainable remedy.
To ensure that the new approach is protective of human health and the environment, the following elements are included:
“Pulse off” AS/SVE system and perform appropriate vapor intrusion investigations and evaluations;
Better delineate the groundwater plume; and Obtain more detailed MNA information.
Resources for Treatment Train Design and Optimization
Additional resources include the following optimization guidance documents:
Guidance for Planning and Optimizing Monitoring Strategies (NAVFAC, 2008a) Groundwater Risk Management Handbook (NAVFAC, 2008d) DNAPL Management Overview (NAVFAC, 2007) Guidance for Optimizing Remedial Action Operations (NAVFAC, 2001) Navy’s Natural Attenuation Software: http://www.cee.vt.edu/nas/
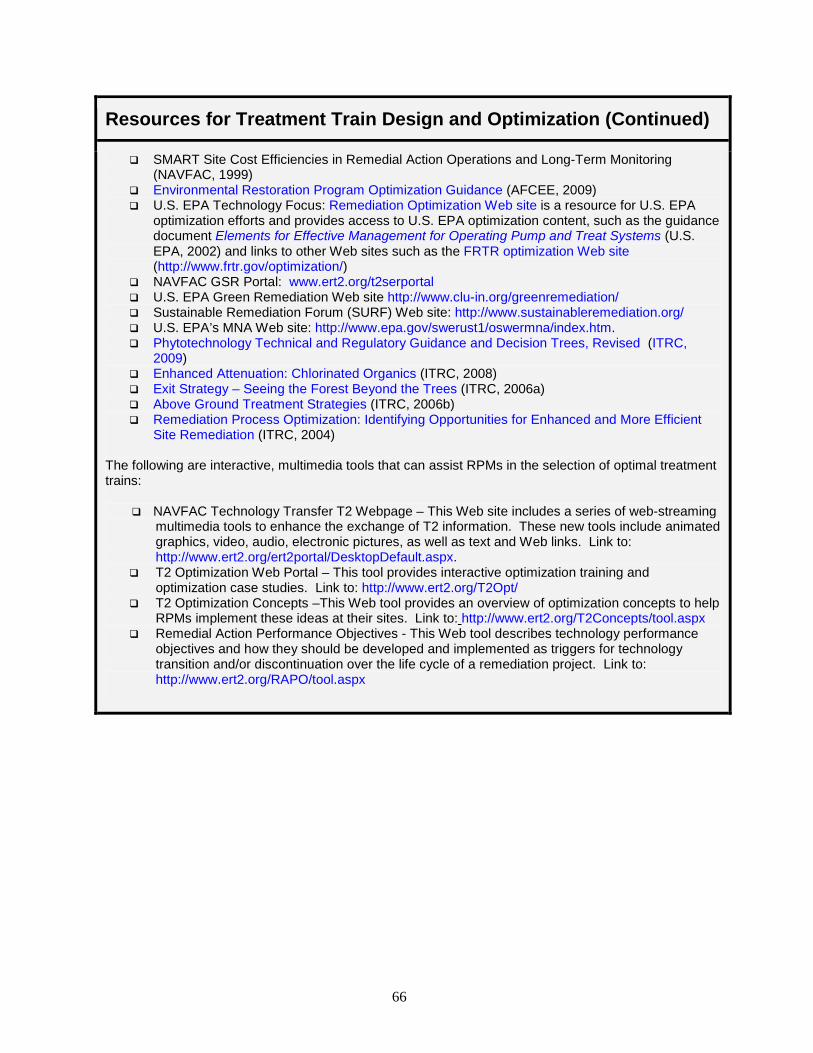
66
Resources for Treatment Train Design and Optimization (Continued)
SMART Site Cost Efficiencies in Remedial Action Operations and Long-Term Monitoring (NAVFAC, 1999)
Environmental Restoration Program Optimization Guidance (AFCEE, 2009) U.S. EPA Technology Focus: Remediation Optimization Web site is a resource for U.S. EPA
optimization efforts and provides access to U.S. EPA optimization content, such as the guidance document Elements for Effective Management for Operating Pump and Treat Systems (U.S. EPA, 2002) and links to other Web sites such as the FRTR optimization Web site (http://www.frtr.gov/optimization/)
NAVFAC GSR Portal: www.ert2.org/t2serportal U.S. EPA Green Remediation Web site http://www.clu-in.org/greenremediation/ Sustainable Remediation Forum (SURF) Web site: http://www.sustainableremediation.org/ U.S. EPA’s MNA Web site: http://www.epa.gov/swerust1/oswermna/index.htm. Phytotechnology Technical and Regulatory Guidance and Decision Trees, Revised (ITRC,
2009) Enhanced Attenuation: Chlorinated Organics (ITRC, 2008) Exit Strategy – Seeing the Forest Beyond the Trees (ITRC, 2006a) Above Ground Treatment Strategies (ITRC, 2006b) Remediation Process Optimization: Identifying Opportunities for Enhanced and More Efficient
Site Remediation (ITRC, 2004) The following are interactive, multimedia tools that can assist RPMs in the selection of optimal treatment trains:
NAVFAC Technology Transfer T2 Webpage – This Web site includes a series of web-streaming multimedia tools to enhance the exchange of T2 information. These new tools include animated graphics, video, audio, electronic pictures, as well as text and Web links. Link to: http://www.ert2.org/ert2portal/DesktopDefault.aspx.
T2 Optimization Web Portal – This tool provides interactive optimization training and optimization case studies. Link to: http://www.ert2.org/T2Opt/
T2 Optimization Concepts –This Web tool provides an overview of optimization concepts to help RPMs implement these ideas at their sites. Link to: http://www.ert2.org/T2Concepts/tool.aspx
Remedial Action Performance Objectives - This Web tool describes technology performance objectives and how they should be developed and implemented as triggers for technology transition and/or discontinuation over the life cycle of a remediation project. Link to: http://www.ert2.org/RAPO/tool.aspx
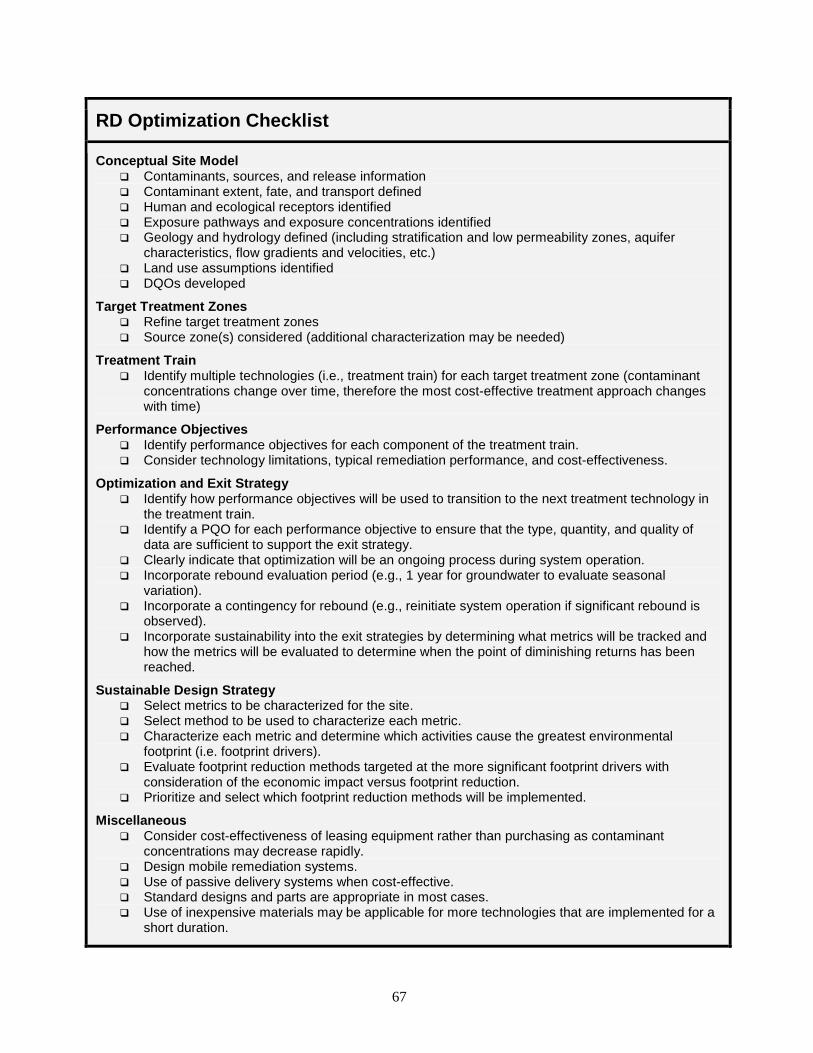
67
RD Optimization Checklist
Conceptual Site Model Contaminants, sources, and release information Contaminant extent, fate, and transport defined Human and ecological receptors identified Exposure pathways and exposure concentrations identified Geology and hydrology defined (including stratification and low permeability zones, aquifer
characteristics, flow gradients and velocities, etc.) Land use assumptions identified DQOs developed
Target Treatment Zones Refine target treatment zones Source zone(s) considered (additional characterization may be needed)
Treatment Train Identify multiple technologies (i.e., treatment train) for each target treatment zone (contaminant
concentrations change over time, therefore the most cost-effective treatment approach changes with time)
Performance Objectives Identify performance objectives for each component of the treatment train. Consider technology limitations, typical remediation performance, and cost-effectiveness.
Optimization and Exit Strategy Identify how performance objectives will be used to transition to the next treatment technology in
the treatment train. Identify a PQO for each performance objective to ensure that the type, quantity, and quality of
data are sufficient to support the exit strategy. Clearly indicate that optimization will be an ongoing process during system operation. Incorporate rebound evaluation period (e.g., 1 year for groundwater to evaluate seasonal
variation). Incorporate a contingency for rebound (e.g., reinitiate system operation if significant rebound is
observed). Incorporate sustainability into the exit strategies by determining what metrics will be tracked and
how the metrics will be evaluated to determine when the point of diminishing returns has been reached.
Sustainable Design Strategy Select metrics to be characterized for the site. Select method to be used to characterize each metric. Characterize each metric and determine which activities cause the greatest environmental
footprint (i.e. footprint drivers). Evaluate footprint reduction methods targeted at the more significant footprint drivers with
consideration of the economic impact versus footprint reduction. Prioritize and select which footprint reduction methods will be implemented.
Miscellaneous Consider cost-effectiveness of leasing equipment rather than purchasing as contaminant
concentrations may decrease rapidly. Design mobile remediation systems. Use of passive delivery systems when cost-effective. Standard designs and parts are appropriate in most cases. Use of inexpensive materials may be applicable for more technologies that are implemented for a
short duration.
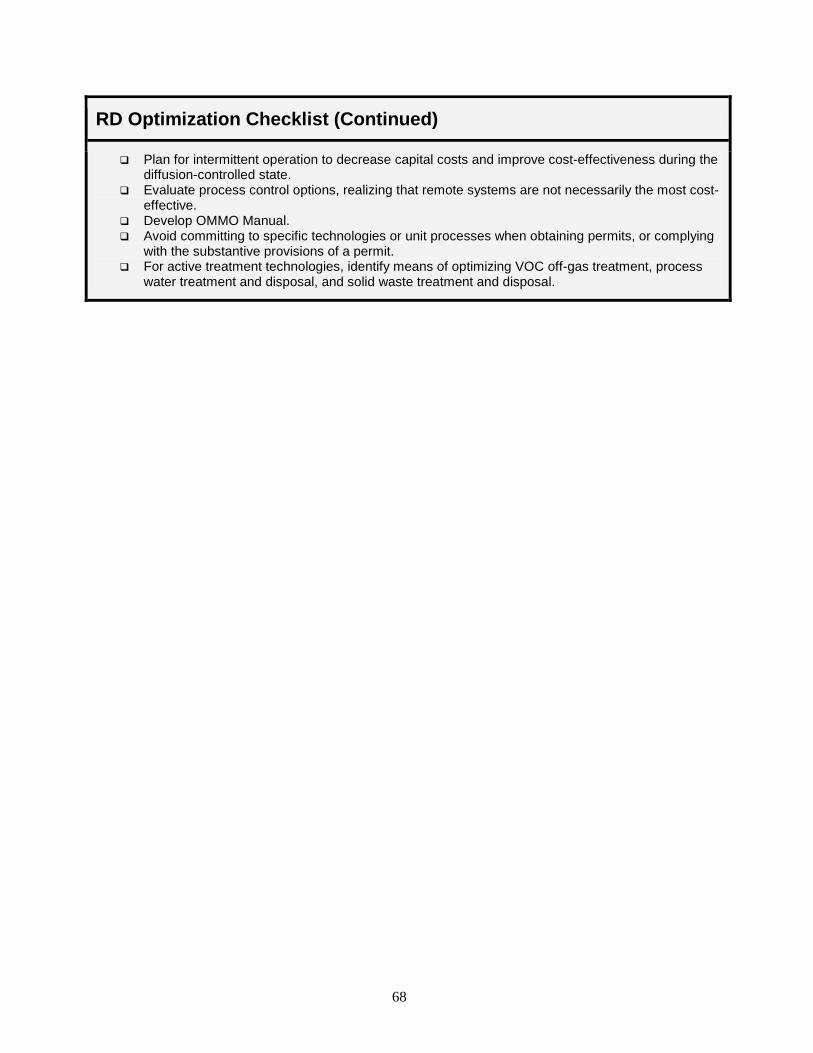
68
RD Optimization Checklist (Continued)
Plan for intermittent operation to decrease capital costs and improve cost-effectiveness during the diffusion-controlled state.
Evaluate process control options, realizing that remote systems are not necessarily the most cost-effective.
Develop OMMO Manual. Avoid committing to specific technologies or unit processes when obtaining permits, or complying
with the substantive provisions of a permit. For active treatment technologies, identify means of optimizing VOC off-gas treatment, process
water treatment and disposal, and solid waste treatment and disposal.
69
6.0 CONCLUSIONS The following are the major conclusions of this guidance document and recommendations for RPMs regarding the optimization of remedy selection and remedial design:
Incorporate CSM and Target Treatment Zone Concepts into FS, ROD, and RD – A complete picture of site conditions and the selected target treatment zone will provide a strong foundation for remedy selection and design. The CSM should be continuously updated to accurately represent the site conditions as new performance data are collected. These data should be regularly analyzed to refocus remedy selection and design. This “observational approach” will lead to more cost-effective site cleanup.
Develop and Establish Performance Objectives in the FS, ROD, and RD That Are Distinct from RAOs – RAOs should be focused on the protection of human health and the environment and should not dictate the choice and/or duration of a proposed remedial action. Performance objectives should be developed for each component of a treatment train and should incorporate consideration of technology limitations, typical remedial performance, and cost-effectiveness.
Incorporate a Treatment Train Approach and Life Cycle Design Concepts into the FS, ROD, and RD – Multiple remedial technologies are often needed to achieve cost-effective remediation at a given site. The FS and ROD should identify multiple technologies for each target treatment zone. Therefore, as contaminant concentrations change over time, the project can adapt to employ the most cost-effective treatment technologies and/or unit processes. The development of a ROD with sufficient flexibility and with an appropriately tailored discussion of the selected remedies and expected outcomes will allow for these changes to be made in a timely manner. The RD should then provide the design details that incorporate life cycle design considerations and a treatment train approach.
Provide for Optimization and an Exit Strategy in the FS, ROD, and RD – RPMs should consider negotiating with supporting regulatory agencies to develop defensible exit strategies for remedial actions at their sites. The use of exit strategies will help to prevent prolonged and costly operation of a remediation system beyond its useful life. The exit strategy criteria should be first considered during the remedy selection phase in the FS and then documented in the ROD and RD documents.
Use Improved ROD for Decision Documents – The improved ROD is expected to optimize the ROD process by reducing the length of the document, reducing preparation time, reducing errors caused by transcription of data, reducing review time, and increasing the efficiency of the closeout process.
Incorporate Green and Sustainable Practices into the Remediation Process – Opportunities exist to reduce the environmental footprint throughout all phases of remediation, including remedy evaluation, selection and design, regardless of the selected clean-up remedy. As part of the remedy evaluation and selection process, GSR analysis should be performed to allow consideration to be given to the environmental footprint of each remedial alternative. During the design phase, GSR analysis should be performed to evaluate methods to minimize the environmental footprint while ensuring that the remedy remains sufficiently protective of human health and the environment. In addition, sustainability metrics should be incorporated into performance objectives and exit strategies to prevent remedial systems from operating beyond the point of diminishing returns where the environmental footprint of continued operation is large in comparison to the remedial benefits.
Conduct an Independent Optimization Review as Part of the FS and RD – Navy policy has been developed in conjunction with this guidance document to facilitate effective optimization.
70
The NAVFAC Optimization Workgroup recommends an independent optimization review as part of the FS and RD. This review should focus on the appropriate implementation of the optimization concepts presented in this document. Several options are available to the RPM for conducting the optimization review as discussed in Section 1.2. One of these options must be specified within the NORM database and associated costs must be incorporated into site budgets.
Update the NORM Optimization Module – RPMs should update both planned and completed optimization reviews per semi-annual budget guidance. Information entered and updated includes a description of the optimization evaluation results, costs of the evaluation, costs to implement the recommendations, actions taken, and potential (or actual) cost avoidance or improvements. This information is compiled and reported to CNO, Assistant Secretary of the Navy (ASN), and DoD.
71
7.0 REFERENCES Air Force Center for Engineering and the Environment (AFCEE). 2007. AFCEE Source Zone Initiative.
August.
Air Force Center for Engineering and the Environment (AFCEE). 2009. Environmental Restoration Program Optimization Guidance.
American Society of Testing and Materials (ASTM). 2006. Standard Guide for Estimating Monetary Costs and Liabilities for Environmental Matters. ASTM E2137-06.
Condit, W.E., K.A. Fields, and R. Zuromski. 2002. “Exit Strategies for Air Sparging and Soil Vapor Extraction Systems.” Proceedings of the Third International Conference on Remediation of Chlorinated and Recalcitrant Compounds, Monterey, California. Battelle Press, Columbus, OH. May.
Chief of Naval Operations (CNO). 2003. Watershed Contaminated Source Document Fact Sheet. March.
Chief of Naval Operations (CNO). 2004. “Policy for Optimizing Remedial and Removal Actions Under the Environmental Restoration Programs,” Environmental Readiness Division. 23 April.
Department of Defense (DoD). 2009. “Memorandum for Consideration of Green and Sustainable Remediation Practices in the Defense Environmental Restoration Program”. August 10.
Department of Defense Explosives Safety Board (DDESB). 2004. Minimum Qualifications for Unexploded Ordnance (UXO) Technicians and Personnel. December 20.
Department of the Navy (DON). 2002. Policy on Sediment Site Investigation and Response Actions. February.
Department of the Navy (DON). 2007. Streamlined Record of Decision Strategy Memorandum. August 31.
Department of the Navy (DON). 2006. Department of the Navy Environmental Restoration Program (NERP) Manual. August.
Department of the Navy (DON). 2008. Environmental Restoration Program Progress Report.
Executive Office of the President, Office of Management and Budget. 2008. Memorandum for the Heads of Departments and Agencies, 2009 Discount Rates for OMB Circular No. A-94, December 12.
Freeze, R.A., and J.A. Cherry. 1979. Groundwater. Prentice Hall, Englewood Cliffs, NJ.
Intergovernmental Data Quality Task Force (IDQTF). 2005. Uniform Federal Policy for Implementing Environmental Quality Systems. DTIC ADA 395303, EPA-505-F-03-001. March.
Interstate Technology & Regulatory Council (ITRC). 2004. Remediation Process Optimization: Identifying Opportunities for Enhanced and More Efficient Site Remediation. September.
72
Interstate Technology & Regulatory Council (ITRC). 2006a. Exit Strategy-Seeing the Forest Beyond the Trees. Second in a Series of Remediation Process Optimization Advanced Topics. March.
Interstate Technology & Regulatory Council (ITRC). 2006b. Above Ground Treatment Technologies. Third in a Series of Remediation Process Optimization Advanced Topics. March.
Interstate Technology & Regulatory Council (ITRC). 2006c. Life Cycle Cost Analysis. April.
Interstate Technology & Regulatory Council (ITRC). 2008. Enhanced Attenuation: Chlorinated Organics. April.
Interstate Technology & Regulatory Council (ITRC). 2009. Phytotechnology Technical and Regulatory Guidance and Decision Trees, Revised. February.
Kavanaugh, M.C. 1996. “Overview of the Management of Contaminated Sites in the U.S.: The Conflict Between Technology and Public Policy.” Water Science and Technology. 34(7-8): 275-283. Part 4.
Koerner, L.N., L.R. Blotz, and R.B. Gilbert. 1998. “Lessons Learned — An Assessment of Performance for Completed Remediation Projects.” Proceedings of the 1998 Geo-Congress, October 18-21, Boston, MA. pp. 141-158.
National Research Council (NRC). 2003. Environmental Cleanup at Navy Facilities: Adaptive Site Management. Committee on Environmental Remediation at Naval Facilities. Water Science and Technology Board. Division of Earth and Life Sciences. Washington, DC: National Academy Press.
Naval Facilities Engineering Command (NAVFAC). 1999. SMART Site Cost Efficiencies in Remedial Action Operations and Long-Term Monitoring.
Naval Facilities Engineering Command (NAVFAC). 2001. Guidance for Optimizing Remedial Action Operations. (SR-2101-ENV). Prepared for NAVFAC by Radian International. Research Triangle Park, NC.
Naval Facilities Engineering Command (NAVFAC). 2002a. Guidance for Environmental Background Analysis, Volume I: Soil (UG-2049-ENV). Prepared for NAVFAC by Battelle Memorial Institute, EarthTech, Inc., and NewFields, Inc. April.
Naval Facilities Engineering Command (NAVFAC). 2002b. Contaminated Sediments at Navy Facili-ties: Cleanup Alternatives. TDS-2092-ENV.
Naval Facilities Engineering Command (NAVFAC). 2003a. Navy Guidance for Conducting Ecological Risk Assessments.
Naval Facilities Engineering Command (NAVFAC). 2003b. Guidance for Environmental Background Analysis, Volume II: Sediments (UG-2054-ENV). Prepared for NAVFAC by Battelle Memorial Institute, EarthTech, Inc., and NewFields, Inc. April.
Naval Facilities Engineering Command (NAVFAC). 2003c. Principles and Procedures for Specifying, Monitoring, and Enforcement of Land Use Controls and Other Post-ROD Actions. October.
73
Naval Facilities Engineering Command (NAVFAC). 2004a. Guidance for Environmental Background Analysis, Volume III: Groundwater (UG-2059-ENV). Prepared for NAVFAC by Battelle Memorial Institute, EarthTech, Inc., and NewFields, Inc. April.
Naval Facilities Engineering Command (NAVFAC). 2004b. Navy Policy for Conducting Ecological Risk Assessments.
Naval Facilities Engineering Command (NAVFAC). 2005. Implementation Guide for Assessing and Managing Contaminated Sediment at Navy Facilities (UG-2053-ENV). Prepared for NAVFAC by SPAWAR Systems Center (SSC) San Diego. January.
Naval Facilities Engineering Command (NAVFAC). 2006. Final Record of Decision Operable Unit 6, Site 12, Marine Corps Air Station Cherry Point, North Carolina. September.
Naval Facilities Engineering Command (NAVFAC). 2007. DNAPL Management Overview. April.
Naval Facilities Engineering Command (NAVFAC). 2008a. Guidance for Planning and Optimizing Monitoring Strategies (UG-2081-ENV). Prepared for NAVFAC by Battelle. August.
Naval Facilities Engineering Command (NAVFAC). 2008b. U.S. Navy Human Health Risk Assessment Guidance. Prepared for NAVFAC by Pioneer Technologies Corporation. December.
Naval Facilities Engineering Command (NAVFAC). 2008c. Final Record of Decision for Operable Unit 5, Sites 1A-1, 1H, and 6A, Marine Corps Base Camp Pendleton, California. January.
Naval Facilities Engineering Command (NAVFAC). 2008d. Groundwater Risk Management Handbook. January.
Naval Ordnance Security and Safety Activity (NOSSA). 2009. Instruction 8020.15B, Explosives Safety Review, Oversight, and Verification of Munitions Responses. January.
Nyer, E.K., P.L. Palmer, E.P. Carman, G. Boettcher, J.M. Bedessem, F. Lenzo, T.L. Crossman, G.J. Rorech, and D.F. Kidd. 2000. In Situ Treatment Technology, Second Edition. Lewis Publishers, Washington, DC.
Rast, J.C. 2001. “O&M Cost Estimates: Covering All the Bases.” Pollution Engineering. 31(1): 46-50.
U.S. Environmental Protection Agency (U.S. EPA). 1988. Guidance for Conducting Remedial Investigations and Feasibility Studies Under CERCLA. Interim Final. EPA/540/G-89/004.
U.S. Environmental Protection Agency (U.S. EPA). 1993a. Guidance on Conducting Non-Time Critical Removal Actions under CERCLA- OSWER Publication 9360.0-32. EPA 540/F-94/009, OSWER 9360.0-32FS, NTIS: PB93-963422.
U.S. Environmental Protection Agency (U.S. EPA). 1993b. Presumptive Remedies: Policy and Procedures. EPA 540-F-93-047, OSWER 9355.0-47FS, September.
U.S. Environmental Protection Agency (U.S. EPA). 1993c. Presumptive Remedies: Site Characterization and Technology Selection for CERCLA Sites with Volatile Organic Compounds in Soils. EPA 540-F-93-048, OSWER 9355.0-48FS. September.
74
U.S. Environmental Protection Agency (U.S. EPA). 1995. Remedial Design/Remedial Action Handbook. EPA 540/R-95-049, OSWER 9355.0-04B, NTIS PB95-963307.
U.S. Environmental Protection Agency (U.S. EPA). 1996a. Application of CERCLA Municipal Landfill Presumptive Remedy to Military Landfills. EPA/540/F-96/020.
U.S. Environmental Protection Agency (U.S. EPA). 1996b. Presumptive Response Strategy and Ex-Situ Treatment Technologies for Contaminated Groundwater at CERCLA Sites, Final Guidance, Directive 9283.1-12. EPA 540/R-96/023. PB96-963508. October.
U.S. Environmental Protection Agency (U.S. EPA). 1998. Guide to Preparing Superfund Proposed Plans, Records of Decision, and Other Remedy Selection Decision Documents. EPA 540-R-98-031.
U.S. Environmental Protection Agency (U.S. EPA). 2002. Elements for Effective Management of Operating Pump and Treat Systems. November. OSWER 9355.4-27FS-A.
U.S. Environmental Protection Agency (U.S. EPA). 2008. Green Remediation: Incorporating Sustainable Environmental Practices into Remediation of Contaminated Sites. EPA 542-R-08-002. April.