Embed Size (px)
Citation preview

Final Turbine and Test Facility Design Report
Alden/NREC Fish Friendly Turbine
DOE/ID-10821
FinaFinaFinalll TTTurbine andurbine andurbine and TTTest Faciest Faciest Facilllityityity DDDesiesiesigggnnn RRReeeppportortort
AlAlAldendenden/NR/NR/NREEECCC Fish FriendFish FriendFish Friendlllyyy TTTurbineurbineurbine
United States
Field Studies
Laboratory StudiesComputational
Studies
AHTS Advanced Hydropower
Turbine SystemAdvanced Hydropower
Turbine System
Department of Energy

DOE/ID-10821
Final Turbine and Test Facility Design ReportAlden/NREC Fish Friendly Turbine
Thomas C. Cook, P.E. Stuart A. Cain, Ph.D.
Paul Fetfatsidis George E. Hecker, P.E.
Philip S. Stacy
Published September 2000
Prepared byAlden Research Laboratory, Inc.
Northern Research and Engineering Corporationfor the
U.S. Department of EnergyIdaho Operations Office

FINAL REPORT ALDEN/NREC FISH FRIENDLY TURBINE
DOE ADVANCED HYDRO-POWER TURBINE SYSTEM
FINAL TURBINE AND TEST FACILITY DESIGN
Page
1.0 INTRODUCTION 1
1.1 SUMMARY OF PILOT SCALE STUDY 1 1.2 OBJECTIVES OF DESIGN PHASE 2 1.3 OVERVIEW OF DESIGN PHASE 3
2.0 TURBINE DESIGN 4
2.1 SCROLL CASE DESIGN 4 2.1.1 Scroll Case Without Wicket Gates 7 2.1.2 Scroll Case With Wicket Gates 8
2.2 RUNNER 25 2.2.1 Initial Design of Runner 25 2.2.2 Refinements of Initial Runner Geometry 27 2.2.3 Further Refinement of Runner 28 2.2.4 Two-Dimensional Analysis 30 2.2.5 Three-Dimensional Analyses (CFD) 32
2.3 DRAFT TUBE 35 2.4 TURBINE FABRICATION 36 2.5 TURBINE MECHANICAL COMPONENTS 36 2.6 DYNAMOMETER 37
3.0 TEST FLOW LOOP 55
3.1 GENERAL 55 3.2 BASIC FEATURES 55 3.3 FISH INJECTION AND COLLECTION 60 3.4 FISH HOLDING FACILITIES 61 3.5 INSTRUMENTATION 62 3.6 AUXILIARY EQUIPMENT 63
-i-

Table of Contents (Continued)
Page
4.0 TEST PLAN 64
4.1 GENERAL 64 4.1.1 Summary of Experimental Scope 64 4.1.2 Pilot Study Scale Effects On Fish 66
4.2 BIOLOGICAL 67 4.2.1 Procedure/Facility Tests 67 4.2.2 Fish Introduction and Collection 68 4.2.3 Depth of Injection for Control Fish 68 4.2.4 Fish Visualization 69 4.2.5 Turbine Passage Tests 69
4.2.5.1 Tests Without Wicket Gates 70 4.2.5.2 Tests With Wicket Gates 70
4.2.6 Methodology 70 4.2.6.1 Fish Acclimation 71 4.2.6.2 Fish Marking and Release 71 4.2.6.3 Fish Collection 73 4.2.6.4 Injury and Mortality Evaluation 73
4.2.7 Fish Size and Species 74 4.2.8 Sample Size And Number Of Replicates 77 4.2.9 Water Quality Monitoring 78
4.3 ENGINEERING 82 4.3.1 Preliminary Tests 82
4.3.1.1 Instrumentation Check-out 82 4.3.1.2 Instrumentation Calibration 83 4.3.1.3 Facility Check-out 84 4.3.1.4 Testing Without Wicket Gates 84 4.3.1.5 Testing With Wicket Gates 85
4.3.2 Final Tests: With Wicket Gates 87 4.3.3 Turbine Efficiency 87 4.3.4 Scaling Relationships 89 4.3.5 Independent Witness 90 4.3.6 Future Tests 91
5.0 COSTS 92
6.0 SCHEDULE 108
-ii-

Table of Contents (Continued)
Page
7.0 APPLICATION TO JOHN DAY PROJECT 110
7.1 INTRODUCTION TO APPLICATION 110 7.2 SCOPE OF WORK 110 7.3 JOHN DAY PROJECT CHARACTERISTICS 111 7.4 SCALE UP OF ALDEN/NREC RUNNER 115 7.5 TURBINE DESIGN FOR EMPTY BAY 118 7.6 TURBINE DESIGN FOR EXISTING WICKET GATES 118 7.7 COST ESTIMATES FOR JOHN DAY 125 7.8 CONCLUSIONS ON JOHN DAY APPLICATION 128
8.0 SUMMARY AND CONCLUSIONS 129
8.1 GENERAL 129 8.2 TURBINE 129 8.3 TEST FACILITY 130 8.4 TEST PROGRAM 132 8.5 COSTS 134 8.6 SCHEDULE 135 8.7 APPLICATION TO JOHN DAY PROJECT 135
9.0 ACKNOWLEDGMENTS 136
10.0 REFERENCES 137
-iii-

List of Tables
Table Number Title
2-1 Optimization of Initial Runner Geometry 2-2 Results of Three-Dimensional Analysis
3-1 Test Facility Equipment and Components
4-1 Sequence of Planned Fish Passage Tests 4-2 Statistical Parameters 4-3 Water Quality Parameters
5-1 Contractor Bid Solicitation Lists 5-2 Test Loop Pump Options 5-3 Pilot Scale Cost Summary 5-4 Pilot Study Detailed Cost Breakdown
7-1 Estimated Costs for Installing an Alden/NREC Turbine in the Empty Bay at the John Day Project
List of Figures
Figure Number Title
2-1 Plan of Scroll Showing Idealized Streamlines Through Wicket Gate Area 2-2 Plan of Scroll Showing Wickets Aligned to Flow Streamlines 2-3 Scroll Case Design Without Wicket Gates - Computational Mesh 2-4 Scroll Case Design Without Wicket Gates - Velocity Distribution at Mid Plane 2-5 Scroll Case Design Without Wicket Gates - Velocity Distribution Along
Consecutive Vertical Planes 2-6 Average Velocity Distribution at Entrance to Downturn Without Wicket Gates 2-7 Average Angular Distribution at Entrance to Downturn Without Wicket Gates 2-8 Scroll Case Design Without Wicket Gates - Streamline Contours 2-9 Scroll Case Design With Wicket Gates - Computational Mesh 2-10 Scroll Case Design With Wicket Gates - Computational Mesh Near Gates 2-11 Scroll Case Design With Wicket Gates - Velocity Distribution at Mid-Plane 2-12 Scroll Case Design With Wicket Gates - Velocity Distribution at Mid-Plane
Between Two Wicket Gates 2-13 Average Velocity Distribution at Entrance to Downturn With Wicket Gates
-iv-

List of Figures (Continued)
2-14 Average Angular Distribution at Entrance to Downturn With Wicket Gates 2-15 Scroll Case Design With Wicket Gates - Streamline Contours 2-16 Optimization of Size (75 ft actual head, 1,000 cfs) 2-17 Meridional View of Flow Path of Full-Scale Runner Including Partial Upstream
and Downstream Ducts 2-18 Distribution of Velocity Along the Hub Streamtube 2-19 Distribution of Loading Parameter Along the Hub Streamtube 2-20 Relative Velocity Magnitude at Mid-Span (Two-Bladed Runner) 2-21 Relative Velocity Magnitude at Mid-Span (Three-Bladed Runner) 2-22 Runner Mid-Passage Meridional Velocity 2-23 Pressure Loading Diagram at the Hub 2-24 Pressure Loading Diagram at the Shroud 2-25 Shear Magnitude at Mid-Span (Two Bladed Runner) 2-26 Shear Magnitude at Mid-Span (Three Bladed Runner) 2-27 Static Pressure Rate of Change at Mid-Passage 2-28 Leading Edge Relative Velocity Magnitude at Mid-Span of Three Bladed Design
(Vector Field) 2-29 Leading Edge Relative Flow Angle (Circumferentially Mass Averaged - Three
Bladed Runner) 2-30 Trailing Edge Relative Flow Angle (Circumferentially Mass Averaged - Three
Bladed Runner) 2-31 Leading Edge Absolute Flow Angle (Circumferentially Mass Averaged - Three
Bladed Runner) 2-32 Trailing Edge Absolute Flow Angle (Circumferentially Mass Averaged - Three
Bladed Runner) 2-33 Leading Edge Tangential Velocity (Circumferentially Mass Averaged - Three
Bladed Runner) 2-34 Trailing Edge Tangential Velocity (Circumferentially Mass Averaged - Three
Bladed Runner) 2-35 Leading Edge Meridional Velocity (Circumferentially Mass Averaged - Three
Bladed Runner) 2-36 Trailing Edge Meridional Velocity (Circumferentially Mass Averaged - Three
Bladed Runner) 2-37 Plan and Meridional Section of Alden/NREC Fish-Friendly Turbine 2-38 Cut-Away View of Pilot Turbine
3-1 Test Loop Configuration 3-2 Test Loop Section Looking at Turbine
6-1 Project Schedule
-v-

List of Figures (Continued)
7-1 Transverse Section Through Generator Bays 7-2 John Day Turbine Performance Characteristics 7-3 John Day Turbine Performance Curve 7-4 Transverse Section Through Skeleton Bay 7-5 Power Versus Runner Diameter 7-6 Conceptual Design No. 1 - Largest Runner 7-7 Revised Runner Geometry for Empty John Day Bay 7-8 Efficiency, Flow, Velocity Versus Power, Conceptual Design No. 1 - Empty Bay 7-9 Distribution of Loading Parameter Along the Hub Stream Tube, Conceptual
Design No. 1 - Empty Bay 7-10 Distribution of Relative Velocity Along the Hub Stream Tube, Conceptual Design
No. 1 - Empty Bay 7-11 Conceptual Design No. 2 - Existing Hardware 7-12 Efficiency, Flow and Velocity Versus Power Conceptual Design No. 2 - Existing
Wicket Gates, b2 = 10.79 ft
-vi-

FINAL REPORT
ALDEN/NREC FISH FRIENDLY TURBINE
DOE ADVANCED HYDRO-POWER TURBINE SYSTEM
FINAL TURBINE AND TEST FACILITY DESIGN
1.0 INTRODUCTION
1.1 SUMMARY OF PILOT SCALE STUDY
Alden Research Laboratory, Inc. (Alden) and Northern Research and Engineering Corporation
(NREC) are conducting a research program to develop a new turbine runner to substantially reduce
fish mortality at hydroelectric projects. Conceptual design of the turbine, previously conducted as
part of the Advanced Hydropower Turbine Project sponsored by the U.S. Department of Energy
(DOE), defined a new hydro-turbine runner with a unique geometry (U.S. Patent No. 5,997,242) that
meets criteria that should allow safe passage of fish through the runner, while achieving a
competitive hydraulic power efficiency (Cook, et al., 1997). The DOE then contracted Alden/NREC
to refine the runner geometry and to design a pilot scale test facility that will be used to quantify the
effect on fish passing through the turbine and verify the basic hydraulic characteristics of the turbine.
The main objective of the pilot scale turbine tests is to quantify the effects of the turbine on fish
which pass through it. This will be accomplished by comparing the injury and survival rates of fish
released upstream of the turbine (treatment groups) with that of control fish introduced in the same
way downstream of the turbine. Handling and collection techniques will be designed to minimize
the potential for stress and/or injury in order to provide the most accurate assessment possible of the
small expected effects of passage through the turbine. Any observable injuries among treatment and
control fish will be documented and survival will be evaluated over a four-day period following
testing. Visualization of flow and fish passage will be recorded and attempts will be made to
correlate the type of fish injury, if any, to turbine/runner features to identify possible future
improvements to the runner. Actual runner improvements are, however, not envisioned.

If the difference in injury and mortality between the treatment and control fish is sufficiently small
(i.e., there is negligible injury due to turbine passage), efforts will be directed toward the second
objective, which is to measure the hydraulic characteristics of the turbine. Water-to-shaft power
efficiency, local pressures, and velocities will be measured for comparison to the CFD analyses and
for correlation to any observed fish injury. Tests for the onset of cavitation will not be possible due
to facility constraints and are not of interest due to the high absolute pressures within the runner in
actual applications.
Some power efficiency measurements will also be made prior to testing with fish to define the
Best Efficiency Point (BEP). For a particular turbine, the BEP is that combination of head, speed
and gate opening which produces the maximum efficiency.
The pilot scale turbine and test loop will be located within an existing Alden building. The test
facility will be a closed flow loop with a pump, fish injection system, pilot scale turbine, and fish
collection system. The pilot scale turbine will consist of a scroll case, wicket gates, runner, shaft,
dynamometer, and draft tube. The facility will include auxiliary systems for holding and examining
fish, controlling water quality, and turbine performance monitoring.
1.2 OBJECTIVES OF DESIGN PHASE
The basic objectives of the design phase reported on herein were to conduct additional analyses on
the turbine and runner and to provide a final design of the pilot scale test facility.
Refinement of the turbine was necessary since the original runner was designed without regard to
size and did not include a scroll case to distribute flow around the periphery of the runner. Also, any
further possible improvement to the hydraulic efficiency was to be made since this would make the
turbine a more competitive product in the marketplace.
Final design of the pilot scale test facility included selection of all hardware, especially the main test
loop pump, all instrumentation, piping, fish injection and retrieval systems, fish rearing and handling
-2-

facilities, water quality monitoring equipment, electrical wiring and any changes which needed to
be made to the site foundation and building to accommodate the test facility. A final cost for
constructing the facility and conducting the planned tests was prepared to complete the design effort.
Since the test program has a major influence on the required facility components and design,
considerable effort was devoted to developing the program for biological (fish) and engineering tests.
1.3 OVERVIEW OF DESIGN PHASE
This report concludes the design phase for the turbine and pilot scale test facility, as well as a
preliminary feasibility study to apply the new turbine to an existing Columbia River project (the John
Day Project). Also completed is the program for biological and engineering tests, although some
changes in the test program may occur with time, especially as early test results become available.
Future efforts will cover construction of the test facility, including a pilot scale turbine (with a four
foot runner diameter), and conducting both the biological (fish) and engineering tests.
This report summarizes the second phase of the turbine design, leading to a refinement of the runner
shape and design of the scroll case and wicket gates, describes the final design of the test loop and
auxiliary equipment, provides details of the test program, and gives a summary of the cost estimate
for various aspects of the work.
The turbine design is covered in Section 2.0, followed by a description of the test loop design and
features in Section 3. Both the biological and engineering test programs are covered in some detail
in Section 4.0. Cost estimates are provided in Section 5.0 for completing the pilot scale study,
including the procurement of needed equipment and subcontract services for fabrication and
installation of the test facility components. Section 6.0 presents the proposed schedule for
completing the test facility and evaluating the new turbine performance. An application of the new
turbine to the John Day Project is provided in Section 7.0.
-3-
2.0 TURBINE DESIGN
The Phase 1 conceptual design considered only the runner and was based on the assumption that the
non-rotating inlet portion (scroll case) of the turbine flow path could later be designed to achieve the
inlet conditions calculated in Phase 1 based on conservation of angular momentum. In addition, flow
control devices, such as wicket gates, were not considered in the Phase1 conceptual design of the
runner. Three-dimensional analysis of the scroll case (with and without wicket gates) was conducted
to determine the approach flow angle to the blade's leading edges. Three-dimensional (CFD)
analysis of the runner was being conducted almost simultaneously to maintain the schedule,
assuming the same inlet conditions as for the Phase 1 runner design. Therefore, design of the scroll
was based on achieving this same inlet condition. A vaneless nozzle between the wicket gate end
and the runner inlet is used to start turning the flow downward to achieve the desired mixed inflow
to the runner.
2.1 SCROLL CASE DESIGN
The pilot scale turbine was developed from the full size unit which had a design point of 1,000 cfs
and 85 ft head, resulting in a runner diameter of 13 ft. The sizing of the pilot scale turbine was based
in part on providing flow passages large enough for meaningful testing of available fish species; the
minimum allowable flow passage within the scroll and runner was chosen to be about 6 inches by
6 inches. The pilot turbine is designed to operate at the full size turbine gross head of 85 ft.
Together with the available flow capacity of the test loop at this head, the minimum clearance
resulted in a pilot scale runner diameter of 4 ft. These factors lead to the following scroll case design
parameters:
• Geometric scaling is 3.25 to 1 (13 ft to 4 ft)
• Pilot scale flow is 95 cfs
• Number of wicket gates is 11
-4-

The 3.25:1 scale pilot runner entrance opening is slightly greater at 6-7/8 inches than the design goal.
In order to maintain a minimum —square“ passage through the wicket gates, 11 gates were chosen.
Also, to avoid resonant interaction between the runner and the gates, the number of wicket gates (11)
was selected to not be a multiple of the number of runner blades (3).
The shape of the scroll was derived with the goal of using a single scroll case with and without
wicket gates installed. For this to work, the scroll must be designed to provide the desired velocity
and angle at the runner entrance without gates and, when installed at BEP, the gates must not alter
the streamlines established by the scroll. There must also be sufficient room to increase the gate
opening from BEP, and the gates must be long enough to have sufficient overlap to guide the flow
at off BEP positions and seal when closed.
The first step to designing the dual purpose scroll was to incorporate a region outside the entrance
to the runner where the gates would be placed (allowing for opening the gates approximately
10 degrees beyond BEP). The second step involved adjusting the angular momentum in the scroll
(average velocity times radius from scroll centerline) by changing the scroll entrance velocity (size
of pipe) and radial location of the scroll relative to the runner. These adjustments were needed to
overcome the effects of friction on the flow speed and direction entering the vaneless downturn and
the runner, so that the design head of the runner would be achieved. The area reduction of the scroll
was adjusted to establish a constant circumferential velocity and, thus, provide uniform flow around
the circumference of the runner.
Numerical methods, described in following sections, were used to analyze the performance of several
scroll geometries. These analyses included the effects of friction and geometry within the scroll and
transition to the radial (horizontal) wicket gate space; a total of ten iterations of the scroll geometry
were required to meet the entrance conditions assumed for the runner design. The final scroll
without gates established the correct inlet velocity and area reduction schedule so that after the flow
passed through the empty wicket gate area, its velocity and angular components matched those used
to design the runner. Figure 2-1 shows the scroll with idealized streamlines through the wicket gate
area.
-5-

Once a suitable scroll without gates was developed, the wicket gates were —installed“ and the
numerical analysis was repeated. In addition to maintaining the minimum flow passage through the
wicket gates, it was desired to maintain sufficient overlap between gates in plan view, as shown in
Figure 2-2, to provide adequate flow guidance at off design operation. This nozzle passage is
generated by the length of the vanes placed along streamlines determined by the numerical analysis
of the scroll without gates, as shown in Figure 2-2.
As described above, the single scroll design assumed that once the geometry without wicket gates
was finalized, the wicket gates could be installed and aligned with the flow streamlines to minimize
their effect on the flow patterns at BEP. Details of the design at BEP were based on the pilot scale
flow of 95 cfs and included:
• establishing a flow angle of 69.5 degrees (±0.75 degrees) from radial at the entrance to the
vaneless downturn nozzle,
• minimizing regions of flow separation at BEP (i.e., at the leading and trailing edges of the
wicket gates), and , as a result,
• minimizing the head loss from scroll inlet to runner inlet.
In addition to these hydraulic criteria, the design of the scroll (including the shape and thickness of
the wicket gates) was also influenced by structural requirements.
The preliminary analytical scroll design without wicket gates was based on the principals of
conservation of angular momentum and did not include the effects of viscosity, turbulence and
boundary surface characteristics on the flow. To evaluate the effects of these parameters on the flow
through the scroll and to further refine the design, three-dimensional numerical simulations were
performed using Computational Fluid Dynamics (CFD). CFD has been extensively used in
hydroturbine component design and is particularly well suited for three dimensional scroll case
analyses. For the present analysis, the CFD software FIDAP V8.5 was used to perform the flow
simulations. FIDAP is a state-of-the-art fluid flow simulation suite with program modules for
problem setup, boundary condition specification, and solution phases of a flow analysis. The
-6-
computational mesh was developed using the program GAMBIT and solution analyses were
performed using the FIELDVIEW post-processing software.
Problem setup included generation of a three dimensional computational grid (for scroll geometries
with and without wicket gates) and specification of flow properties, boundary conditions and initial
conditions. The commonly used k-ω model, modified for high Reynolds number flow, was used to
simulate the effects of turbulence. Boundary conditions included a uniform inlet velocity
distribution with an average magnitude of 13.9 ft/s and a uniform pressure distribution at the
entrance to the runner. The no-slip condition was applied along all solid surfaces with an absolute
roughness height equivalent to that of steel plate.
Simulations of the scroll without wicket gates were performed first followed by simulations of the
scroll with wicket gates.
2.1.1 Scroll Case Without Wicket Gates
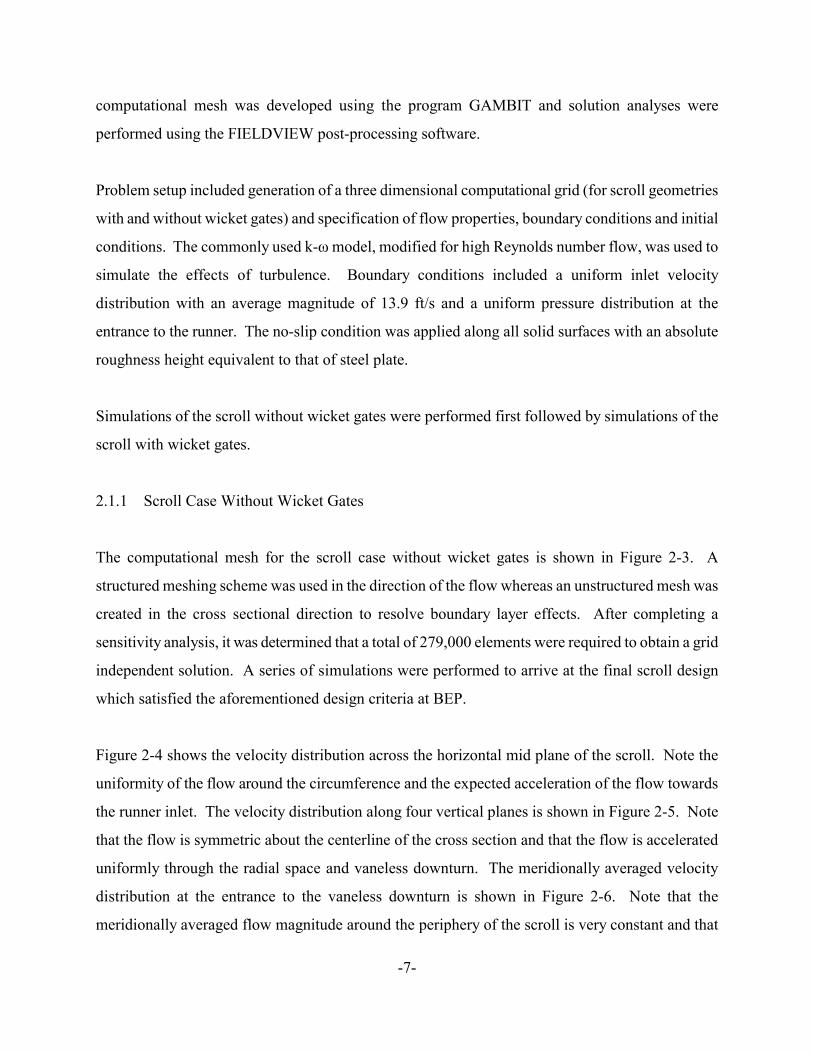
The computational mesh for the scroll case without wicket gates is shown in Figure 2-3. A
structured meshing scheme was used in the direction of the flow whereas an unstructured mesh was
created in the cross sectional direction to resolve boundary layer effects. After completing a
sensitivity analysis, it was determined that a total of 279,000 elements were required to obtain a grid
independent solution. A series of simulations were performed to arrive at the final scroll design
which satisfied the aforementioned design criteria at BEP.
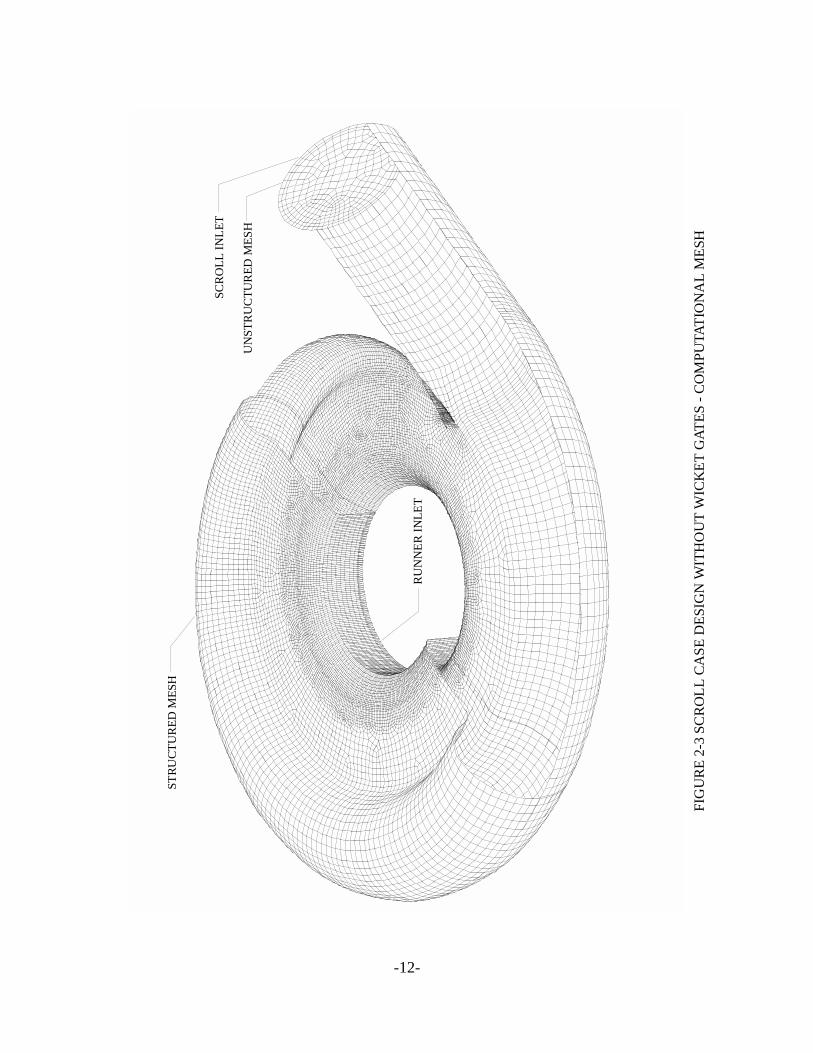
Figure 2-4 shows the velocity distribution across the horizontal mid plane of the scroll. Note the
uniformity of the flow around the circumference and the expected acceleration of the flow towards
the runner inlet. The velocity distribution along four vertical planes is shown in Figure 2-5. Note
that the flow is symmetric about the centerline of the cross section and that the flow is accelerated
uniformly through the radial space and vaneless downturn. The meridionally averaged velocity
distribution at the entrance to the vaneless downturn is shown in Figure 2-6. Note that the
meridionally averaged flow magnitude around the periphery of the scroll is very constant and that
-7-

the circumferentially averaged vertical (meridional) velocity profile is nearly linear. The effect of
the wake created by the tongue is evident at an angle of approximately 45 degrees. The average
meridional flow angle distribution (angle measured off radial) is shown in Figure 2-7. For the final
selected scroll design, the average angle is 70.1 degrees, which is within the desired range of
69.5 degrees to ±0.75 degrees. Figure 2-8 shows the three dimensional flow streamlines at BEP.
Head loss through the scroll without any gates was determined to be approximately 1.8 ft.
Once the final scroll design without wicket gates had been completed, an analysis was performed
with the wicket gates in place (initially aligned with the BEP flow streamlines) to determine their
influence, if any, on the flow through the scroll.
2.1.2 Scroll Case With Wicket Gates
The computational mesh for the scroll case with the 11 wicket gates installed is shown in Figures
2-9 and 2-10. The wicket gates were initially aligned with the flow streamlines calculated in the
previous simulation (without wicket gates) to minimize their effect on the flow patterns in the scroll.
A structured meshing scheme was used in the direction of the flow whereas an unstructured mesh
was created in the cross-sectional direction to resolve boundary layer effects. A concentration of
rectangular elements were placed along each wicket gate to properly model the flow along the gate
surface. After completing a sensitivity analysis it was determined that a total of 578,000 elements
were required to obtain a grid independent solution.
A series of simulations were performed to arrive at the final scroll design which satisfied the
aforementioned design criteria at BEP. It was determined that the 11 gates did slightly influence
flow patterns as the gate blockage caused higher velocities and more tangential flow angles.
Consequently, the length of the gates was slightly reduced and the gates were turned about four
degrees farther open to achieve the more radial design inflow conditions for the runner at BEP.
Figure 2-11 shows the velocity distribution across the horizontal mid plane of the scroll. Note the
uniformity of the flow around the circumference and the expected acceleration of the flow through
-8-

the gates towards the runner inlet. Local accelerations between the gates are also evident with gate
wake effects extending downstream of the trailing edge of each gate. Figure 2-12 shows a detail of
the velocity field between two consecutive gates. Note that the approach flow nearly bisects the
leading edge of the gate and that there is no appreciable flow separation immediately downstream
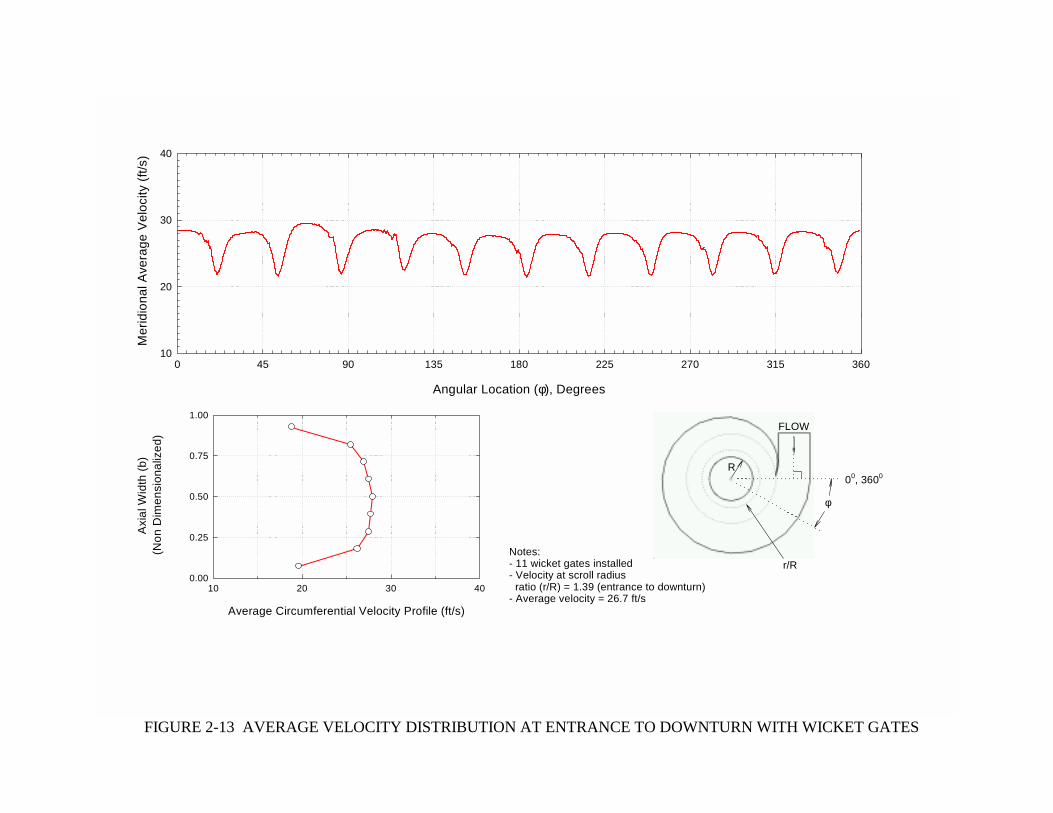
of the gate trailing edge. The average meridional velocity distribution at the entrance to the vaneless
downturn is shown in Figure 2-13. The circumferentially averaged vertical velocity profile is
parabolic and the average flow magnitude around the periphery of the scroll clearly shows the
individual gate wakes. However, the effect of the wake created by the tongue is barely evident
between the angles of 45 to 50 degrees since that wake was aligned with a gate, see Figure 2-13. The
average meridional flow angle distribution (angle measured off radial) is shown in Figure 2-14.
Again, the affect of the wicket gates on the local flow angles is evident. However, for the final
selected design, the average angle is 69.9 degrees which is within the desired range of 69.5 degrees
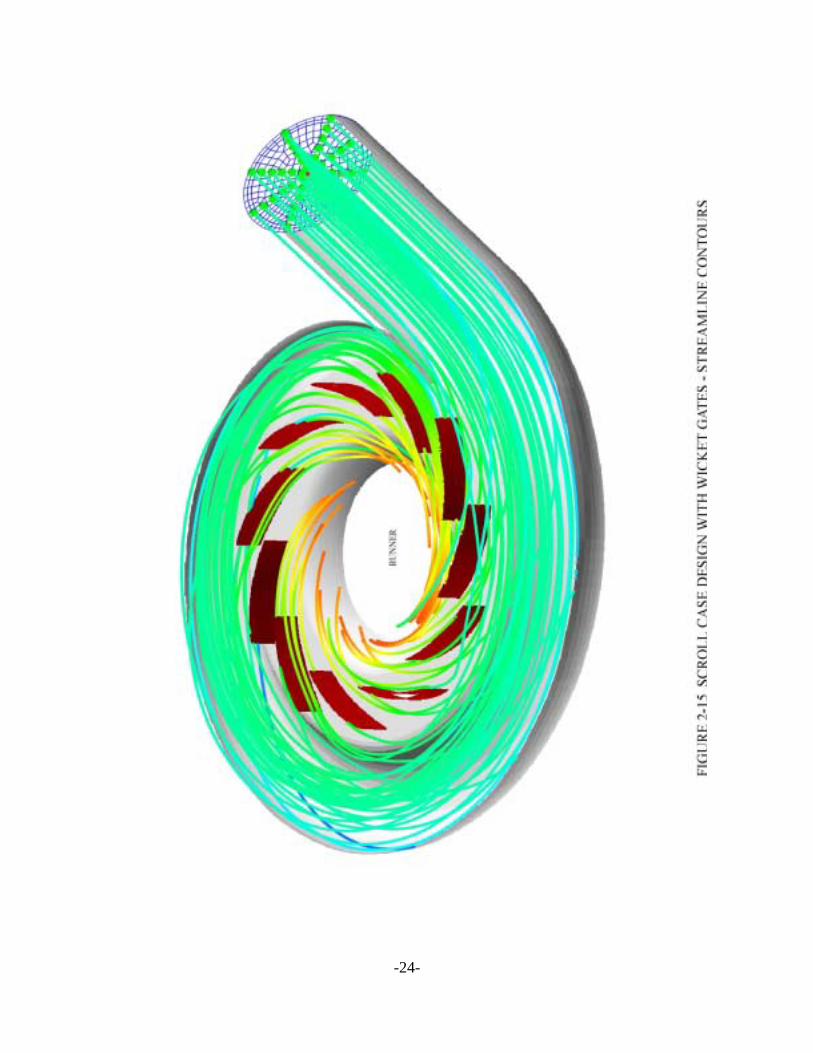
to ±0.75 degrees. Figure 2-15 shows the three dimensional flow streamlines at BEP. The head loss
through the scroll with the wicket gates installed is 2.2 ft.
-9-

FIGURE 2-1 PLAN OF SCROLL SHOWING IDEALIZED STREAMLINES THROUGH WICKET GATE AREA
-10-

FIGURE 2-2 PLAN OF SCROLL SHOWING WICKET GATES ALIGNED TO FLOW STREAMLINES
-11-
-12-
STRU
CTU
RED
MES
H
SCR
OLL
INLE
T
UN
STR
UC
TUR
ED M
ESH
RU
NN
ER IN
LET
FIG
UR
E 2-
3 SC
RO
LL C
ASE
DES
IGN
WIT
HO
UT
WIC
KET
GAT
ES -
CO
MPU
TATI
ON
AL
MES
H

-13-
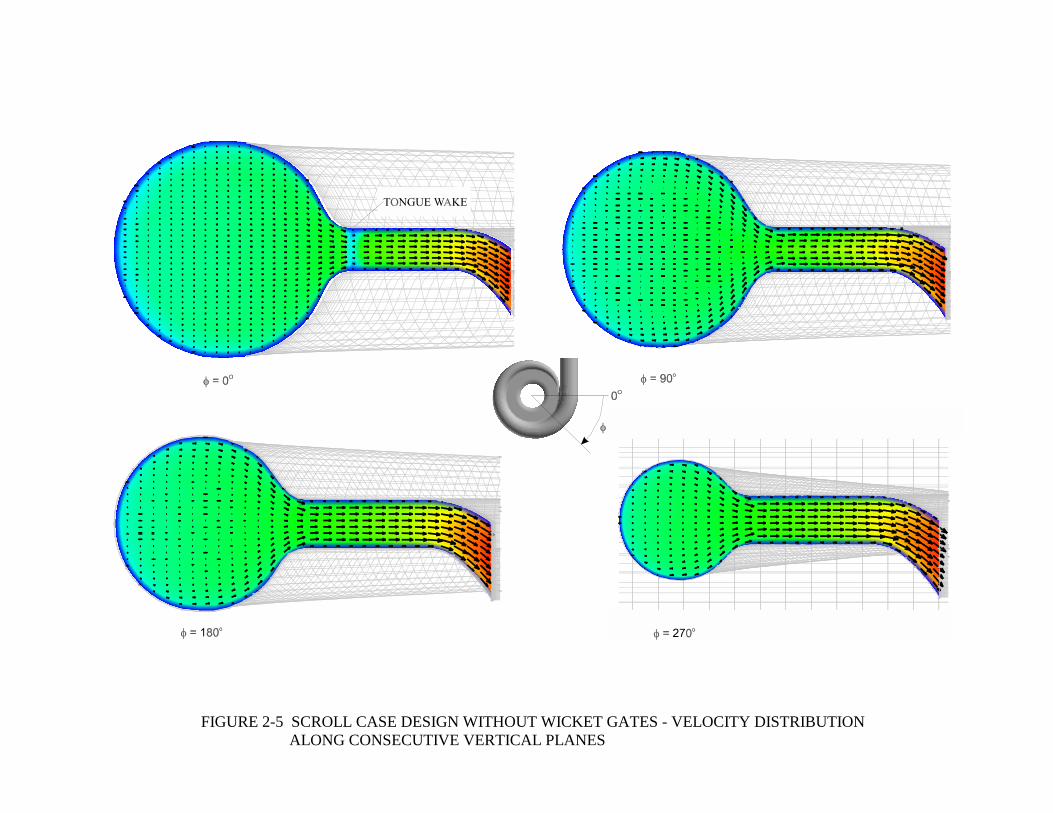
FIGURE 2-5 SCROLL CASE DESIGN WITHOUT WICKET GATES - VELOCITY DISTRIBUTION ALONG CONSECUTIVE VERTICAL PLANES
Axi
al W
idth
(b)
Mer
idio
nal A
vera
ge V
eloc
ity (f
t/s) 40
30
20
10
1.00
0 45 90 135 180 225 270 315 360
Angular Location (φ), Degrees
(Non
Dim
ensi
onal
ized
)
0.75
10 20 30 40
Average Circumferential Velocity Profile (ft/s)
FLOW
R 00, 3600
0.50 φ
0.25 Notes: - No wicket gates installed r/R - Velocity at scroll radius
ratio (r/R) = 1.39 (entrance to downturn) 0.00
- Average velocity = 26.7 ft/s
FIGURE 2-6 AVERAGE VELOCITY DISTRIBUTION AT ENTRANCE TO DOWNTURN WITHOUT WICKET GATES

Axia
l Wid
th (b
)Av
erag
e M
erid
iona
l Flo
w A
ngle
(θ) ,
Deg
rees
80
70
60 0 45 90 135 180 225 270 315 360
Angular Location (φ), Degrees
1.00
0.75
(Non
Dim
ensi
onal
ized
)
60 70 80
Average Flow Angle Profile
θ
FLOW
r/R
R 00, 3600
φ0.50
0.25 Notes: - No wicket gates installed - Values at scroll radius
ratio = 1.39 (entrance to downturn) - Average angle (θ) = 70.1 degrees
0.00
FIGURE 2-7 AVERAGE ANGULAR DISTRIBUTION AT ENTRANCE TO DOWNTURN WITHOUT WICKET GATES
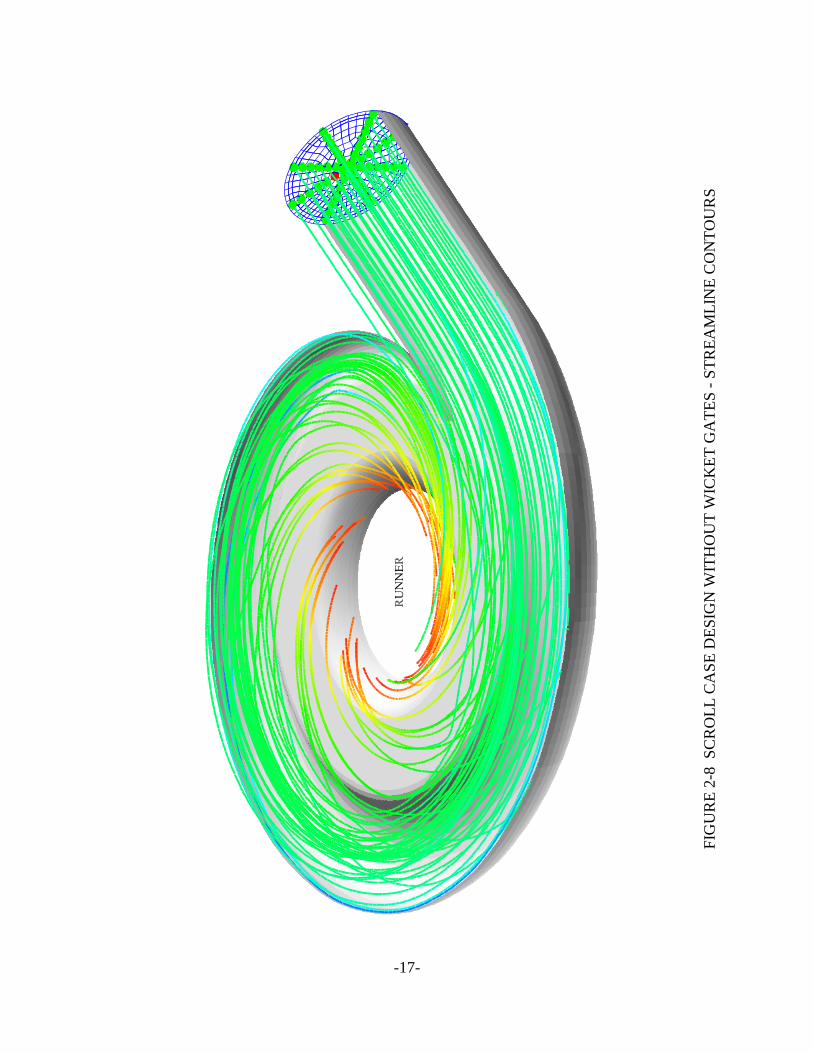
FIG
UR
E 2-
8 S
CR
OLL
CA
SE D
ESIG
N W
ITH
OU
T W
ICK
ET G
ATE
S - S
TREA
MLI
NE
CO
NTO
UR
S
-17-

-18-

FIG
UR
E 2-
10 S
CR
OLL
CA
SE D
ESIG
N W
ITH
WIC
KET
GA
TES
- CO
MPU
TATI
ON
AL
MES
H N
EAR
GA
TES
-19-

-20-
FIG
UR
E 2-
11 S
CR
OLL
CA
SE D
ESIG
N W
ITH
WIC
KET
GA
TES
- VEL
OC
T8Y
DIS
TRIB
UTI
ON
AT
MID
PLA
NE

-21-
Axi
al W
idth
(b)
Mer
idio
nal A
vera
ge V
eloc
ity (f
t/s) 40
30
20
10 0 45 90 135 180 225 270 315 360
Angular Location (φ), Degrees
1.00 FLOW
(Non
Dim
ensi
onal
ized
)
0.75 R
00, 3600
0.50 φ
0.25 Notes:
10 0.00
Average Circumferential Velocity Profile (ft/s)
20 30 40
- 11 wicket gates installed - Velocity at scroll radius ratio (r/R) = 1.39 (entrance to downturn) - Average velocity = 26.7 ft/s
r/R
FIGURE 2-13 AVERAGE VELOCITY DISTRIBUTION AT ENTRANCE TO DOWNTURN WITH WICKET GATES

Axi
al W
idth
(b)
Ave
rage
Mer
idio
nal F
low
Ang
le (θ
) , D
egre
es
80
70
60 0 45 90 135 180 225 270 315 360
Angular Location (φ), Degrees
θ
FLOW
r/R
R
1.00
0.75
60 70 80
Average Flow Angle Profile
(Non
Dim
ensi
onal
ized
)
00, 3600
φ0.50
0.25 Notes: - 11 wicket gates installed - Values at scroll radius ratio = 1.39 (entrance to downturn)
0.00
- Average angle (θ) = 69.8 degrees
FIGURE 2-14 AVERAGE ANGULAR DISTRIBUTION AT ENTRANCE TO DOWNTURN WITH WICKET GATES
-24-