Embed Size (px)
Citation preview
Tampere University Applied SciencesDepartment of Environmental EngineeringAbel Terefe
FINAL THESIS
Application and use of GIS in small Sanitation projects in Developing countries
Supervisor: Head of the forestry degree program, senior lecturer Eeva Sundström
Commissioned by: KeTu ry
Tampere June 2010
Tampere University of Applied sciencesDepartment of Environmental Engineering
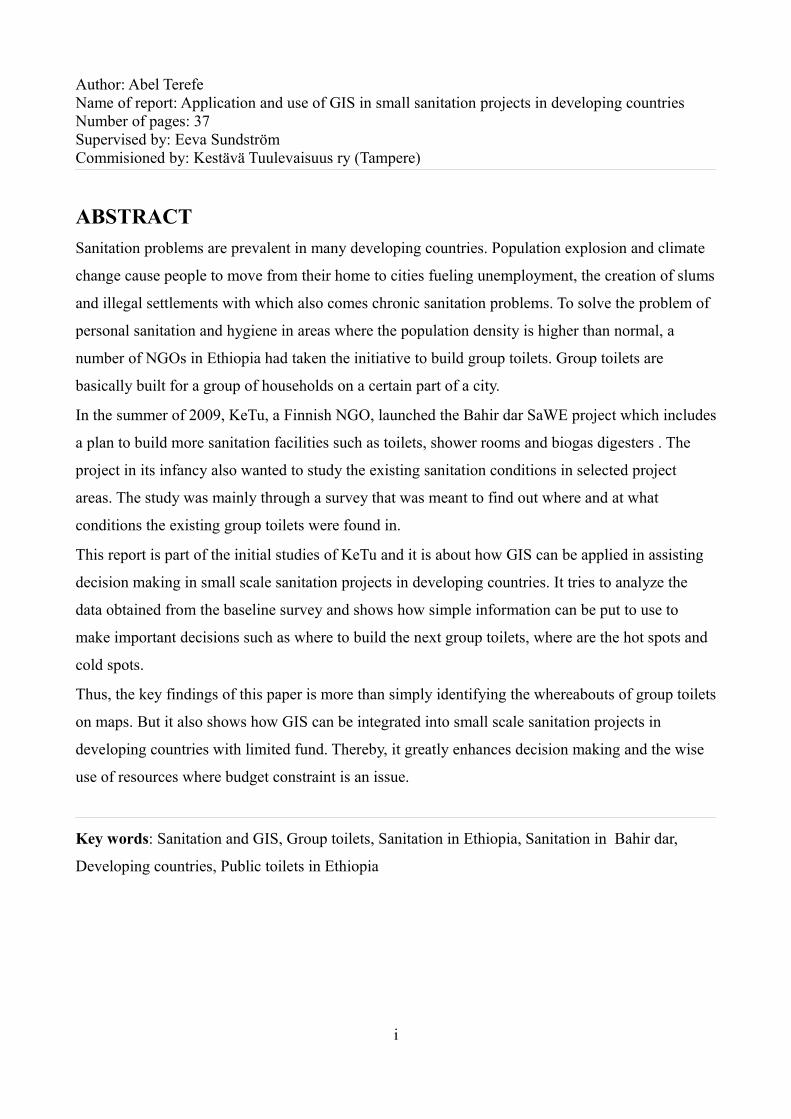
Author: Abel TerefeName of report: Application and use of GIS in small sanitation projects in developing countriesNumber of pages: 37Supervised by: Eeva SundströmCommisioned by: Kestävä Tuulevaisuus ry (Tampere)
ABSTRACTSanitation problems are prevalent in many developing countries. Population explosion and climate
change cause people to move from their home to cities fueling unemployment, the creation of slums
and illegal settlements with which also comes chronic sanitation problems. To solve the problem of
personal sanitation and hygiene in areas where the population density is higher than normal, a
number of NGOs in Ethiopia had taken the initiative to build group toilets. Group toilets are
basically built for a group of households on a certain part of a city.
In the summer of 2009, KeTu, a Finnish NGO, launched the Bahir dar SaWE project which includes
a plan to build more sanitation facilities such as toilets, shower rooms and biogas digesters . The
project in its infancy also wanted to study the existing sanitation conditions in selected project
areas. The study was mainly through a survey that was meant to find out where and at what
conditions the existing group toilets were found in.
This report is part of the initial studies of KeTu and it is about how GIS can be applied in assisting
decision making in small scale sanitation projects in developing countries. It tries to analyze the
data obtained from the baseline survey and shows how simple information can be put to use to
make important decisions such as where to build the next group toilets, where are the hot spots and
cold spots.
Thus, the key findings of this paper is more than simply identifying the whereabouts of group toilets
on maps. But it also shows how GIS can be integrated into small scale sanitation projects in
developing countries with limited fund. Thereby, it greatly enhances decision making and the wise
use of resources where budget constraint is an issue.
Key words: Sanitation and GIS, Group toilets, Sanitation in Ethiopia, Sanitation in Bahir dar,
Developing countries, Public toilets in Ethiopia
i
Foreward
In the summer of 2009, the Bahirdar sanitation, water and energy(SaWE) project was launched by a
Finnish NGO called KeTu (an acronym for 'Sustainable future' in Finnish langauge) and an
Ethiopian NGO called LEM the environment and development society of Ethiopia. The project was
mainly aimed at helping the locals tackle sanitation problems using simpler, cheaper yet workable
technologies. These includes the adoption of urban agriculture, construction of biogas digesters and
toilets and other sanitation facilities such as shower rooms.
During the actual project implementation, it was decided to carry out a baseline survey at the initial
stage. The survey included the study of all group and public toilets in the selected project areas.
However, an interesting aspect of the study was the use of Geographic information system elements
in the survey. It was done in a manner such that all the toilets were located with a GPS receiver. The
incorporation of GIS elements into the study has had several advantages.
Later that year, I was offered by KeTu to write a comprehensive conclusive report on the survey.
This paper is part of the project's report on the survey in 2009.
Abel Terefe
June 2010, Tampere
ii
Table of ContentsABSTRACT..........................................................................................................................................iForeward...............................................................................................................................................ii
List of tables...............................................................................................................................ivList of Figures............................................................................................................................iv
Acronyms.............................................................................................................................................v1. Introduction......................................................................................................................................1
1.1 Socio-economic problems and sanitation condition..................................................................11.3 Using GIS for decision making.................................................................................................3
2. Getting the relevant data...................................................................................................................52.1 Organization of data...................................................................................................................62.2 Georeferenced data....................................................................................................................8
3 . Description of the work ..................................................................................................................93.1 The Bahirdar SaWE preliminary survey and mapping..............................................................93.2 Exporting data into ArcGIS.....................................................................................................103.3 Coordinate Systems.................................................................................................................12
3.3.1 Geographic coordinate system.........................................................................................123.3.2 Projected Coordinate system............................................................................................13
3.4 Selecting features and SQL expressions..................................................................................144. Results............................................................................................................................................15
4.1 Geographic patterns spatial statistical analysis .......................................................................154.2 Challenges in GIS work in developing countries....................................................................17
4.2.1 Data availability and accessibility....................................................................................194.2.2 Data management.............................................................................................................194.2.3 Lack of GIS Skills............................................................................................................19
4.3 Sources of error........................................................................................................................205. Conclusion and discussion.............................................................................................................21References:.........................................................................................................................................23
Appendix ...........................................................................................................................................25
A. Background data.......................................................................................................................25B. Hotspot Analysis result on working group toilets using number of households......................26C. Public toilets – working and closed.........................................................................................27D. Group Toilets – Working and Closed........................................................................................28E. Unemptied toilets – Toilets built before 2006 and never been emptied....................................29
iii
List of tablesTable 1. Toilet data field and description Table 2. Some of the common factors that have been known to impede the efforts to implement GIS/6/
List of FiguresFigure 1. The modern planning process in GIS(Aronoff 1995/2/Figure 2. Map of Cholera deaths in London by John Snow /9/Figure 3. The relationship of data quality and data cost (Adapted from Aronof 1995 /2/)Figure 4. Representation of points, lines and polygonsFigure 5. Survey formFigure 6. Using the latitude and longitude to locate a point on the surface of the earth/16/Figure 7. Simple representation of projected coordinate system[Source:ESRI /17/]Figure 8. Screenshot of the Average Nearest Neighbor distance analysis result for group toilets
(ArcGIS Desktop 9.3)Figure 9. High/Low Clustering tool result for number of households in working group
toilets[ArcGIS Desktop 9.3]Figure10. Hotspot analysis for number of households using group toilets
iv

Acronyms
KeTu Kestävä Tuulevaisuus ry (Sustainable future association)SaWE Sanitation Waste and EnergyGIS Geographic Information SystemGPS Global Positioning SystemCSA Central Statistical AuthoritySQL Structured Query LanguageESRI Environmental Systems Research InstituteFID Feature IDEPSG European Petroleum Survey GroupUTM Universal Traverse MercatorADA Amhara Development AssociationUNICEF United Nations Children's FundETB Ethiopian Birr (Ethiopian Currency)
v
Tampere University of Applied Sciences Final ThesisEnvironmental Engineering Department Abel Terefe | June 2010
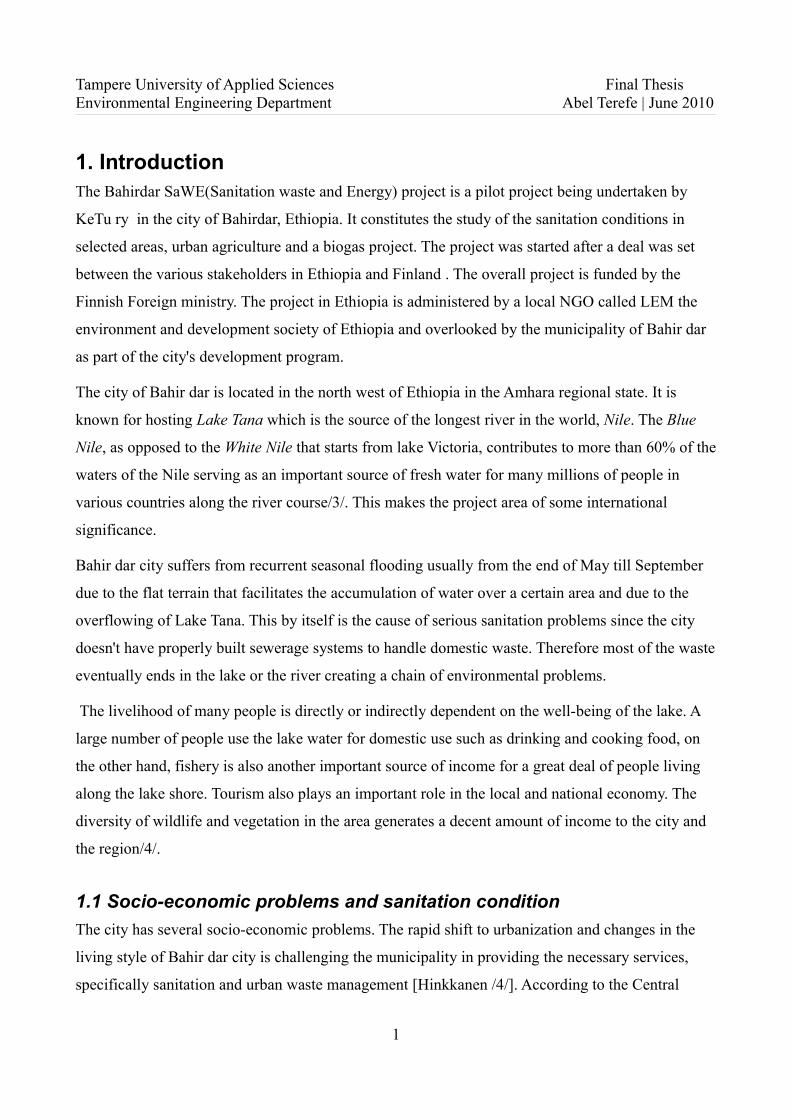
1. IntroductionThe Bahirdar SaWE(Sanitation waste and Energy) project is a pilot project being undertaken by
KeTu ry in the city of Bahirdar, Ethiopia. It constitutes the study of the sanitation conditions in
selected areas, urban agriculture and a biogas project. The project was started after a deal was set
between the various stakeholders in Ethiopia and Finland . The overall project is funded by the
Finnish Foreign ministry. The project in Ethiopia is administered by a local NGO called LEM the
environment and development society of Ethiopia and overlooked by the municipality of Bahir dar
as part of the city's development program.
The city of Bahir dar is located in the north west of Ethiopia in the Amhara regional state. It is
known for hosting Lake Tana which is the source of the longest river in the world, Nile. The Blue
Nile, as opposed to the White Nile that starts from lake Victoria, contributes to more than 60% of the
waters of the Nile serving as an important source of fresh water for many millions of people in
various countries along the river course/3/. This makes the project area of some international
significance.
Bahir dar city suffers from recurrent seasonal flooding usually from the end of May till September
due to the flat terrain that facilitates the accumulation of water over a certain area and due to the
overflowing of Lake Tana. This by itself is the cause of serious sanitation problems since the city
doesn't have properly built sewerage systems to handle domestic waste. Therefore most of the waste
eventually ends in the lake or the river creating a chain of environmental problems.
The livelihood of many people is directly or indirectly dependent on the well-being of the lake. A
large number of people use the lake water for domestic use such as drinking and cooking food, on
the other hand, fishery is also another important source of income for a great deal of people living
along the lake shore. Tourism also plays an important role in the local and national economy. The
diversity of wildlife and vegetation in the area generates a decent amount of income to the city and
the region/4/.
1.1 Socio-economic problems and sanitation conditionThe city has several socio-economic problems. The rapid shift to urbanization and changes in the
living style of Bahir dar city is challenging the municipality in providing the necessary services,
specifically sanitation and urban waste management [Hinkkanen /4/]. According to the Central
1

Tampere University of Applied Sciences Final ThesisEnvironmental Engineering Department Abel Terefe | June 2010
Statistics Agency of the Federal Democratic Republic of Ethiopia 2006 census report, the
population of Bahir dar city is estimated to be around 175 185. The population growth rate is about
3% due to migration of people from rural areas and high birth rate/5/.
The continuous increase in population number has caused a series of problems. To mention few,
increase in illegal settlements and slums, poor urban waste management, unemployment and low
economic performance. Malaria is prevalent in the area due to the warm climatic condition, the
existence of large water body and the poor sanitation condition/4/.
The city's capacity to handle the domestic waste is very limited. As of 2009, the municipality owns
only three vacuum trucks to transport sewage from pit latrines to the landfill out of which only one
is actively functioning. Residents has to wait for at least 3 months to empty the septic tanks.
Therefore, several NGOs over the years has been involved in sanitation work in the city. Among
which it includes the building of public and group toilets in slum areas where people cannot afford
to build a toilet for themselves.
A group toilet is a single toilet building consisting of usually 4 to 6 rooms and shared by several
households. The households doesn't pay for the service they receive apart from paying for the cost
of emptying the septic tank. Meanwhile, public toilets are used by anyone in the city. Unlike group
toilets, public toilets aren't free of charge. Users usually pay 0.2ETB to get the service. In addition,
most of the working public toilets have been outsourced to a private enterprise and are being run by
employed people.
It has also been noted that, local NGOs and youth association has been working in house to house
dry waste collection and city cleaning. Decentralized options in sanitation and energy management
can offer flexibility, which allows restructuring of the city without large investment and
maintenance costs. Besides, decentralized systems can help create micro business opportunities and
secure food and water supply as well as empower people to take an active role in the development
of their environment [Hinkannen 2009/4/].
1.2 What is Geographical infromation system(GIS)?Geographic location is an important attribute of activities, policies, strategies, and plans.
Geographic information systems are a special class of information systems that keep track of not
only events, activities and things, but also of where these events, activities, and things happen or
exist [Longley, Goodchild, Maguire, Rhind 2005 /1/]. A geographic information system (GIS)
2
Tampere University of Applied Sciences Final ThesisEnvironmental Engineering Department Abel Terefe | June 2010
integrates hardware, software, and data for capturing, managing, analyzing, and displaying all forms
of geographically referenced information (ESRI /8/).
Maps which are at the heart of GIS allow us to gain perspective of our surroundings. They enable us
to see patterns by reducing the complexity of the surrounding world. Virtually any data that can be
spatially referenced can be shown on maps and yet various kinds of data can be represented on a
single map. This would give us the chance to analyze the interaction between the different kinds of
data and reach at better conclusion than we would have done it otherwise.
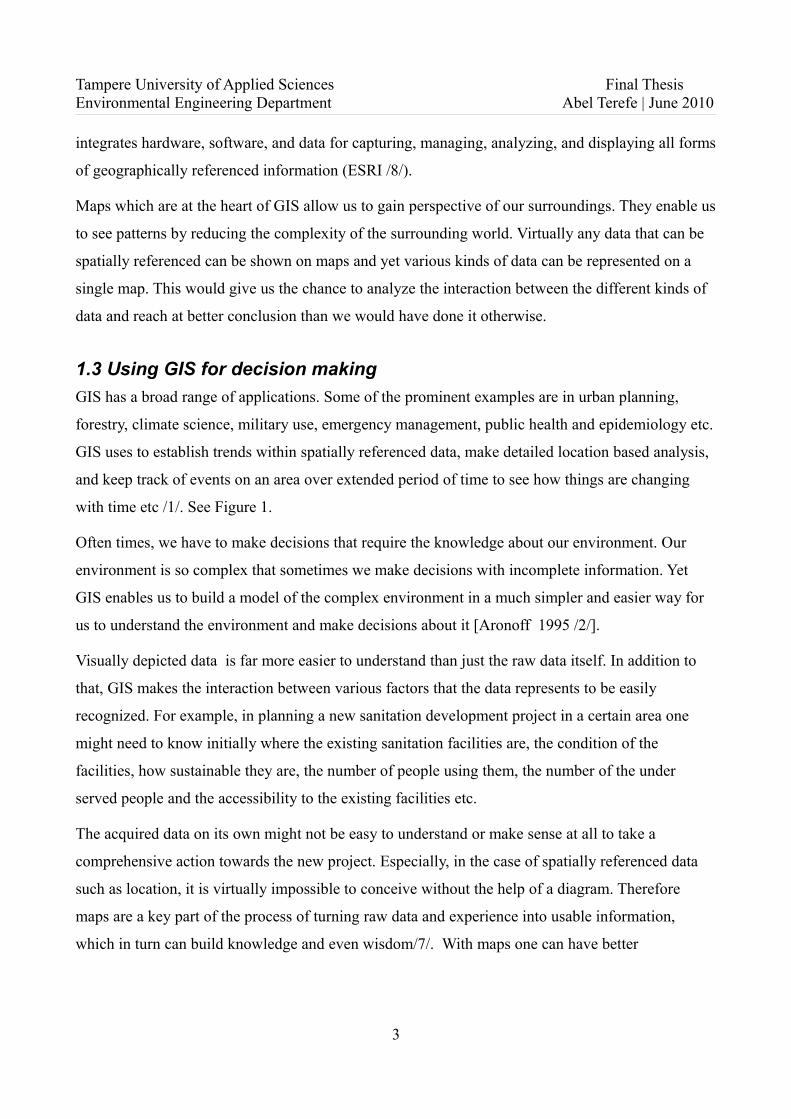
1.3 Using GIS for decision makingGIS has a broad range of applications. Some of the prominent examples are in urban planning,
forestry, climate science, military use, emergency management, public health and epidemiology etc.
GIS uses to establish trends within spatially referenced data, make detailed location based analysis,
and keep track of events on an area over extended period of time to see how things are changing
with time etc /1/. See Figure 1.
Often times, we have to make decisions that require the knowledge about our environment. Our
environment is so complex that sometimes we make decisions with incomplete information. Yet
GIS enables us to build a model of the complex environment in a much simpler and easier way for
us to understand the environment and make decisions about it [Aronoff 1995 /2/].
Visually depicted data is far more easier to understand than just the raw data itself. In addition to
that, GIS makes the interaction between various factors that the data represents to be easily
recognized. For example, in planning a new sanitation development project in a certain area one
might need to know initially where the existing sanitation facilities are, the condition of the
facilities, how sustainable they are, the number of people using them, the number of the under
served people and the accessibility to the existing facilities etc.
The acquired data on its own might not be easy to understand or make sense at all to take a
comprehensive action towards the new project. Especially, in the case of spatially referenced data
such as location, it is virtually impossible to conceive without the help of a diagram. Therefore
maps are a key part of the process of turning raw data and experience into usable information,
which in turn can build knowledge and even wisdom/7/. With maps one can have better
3
Tampere University of Applied Sciences Final ThesisEnvironmental Engineering Department Abel Terefe | June 2010
imagination of the real world scenario. A large amount of different data becomes more conceivable
and easier to understand with maps.
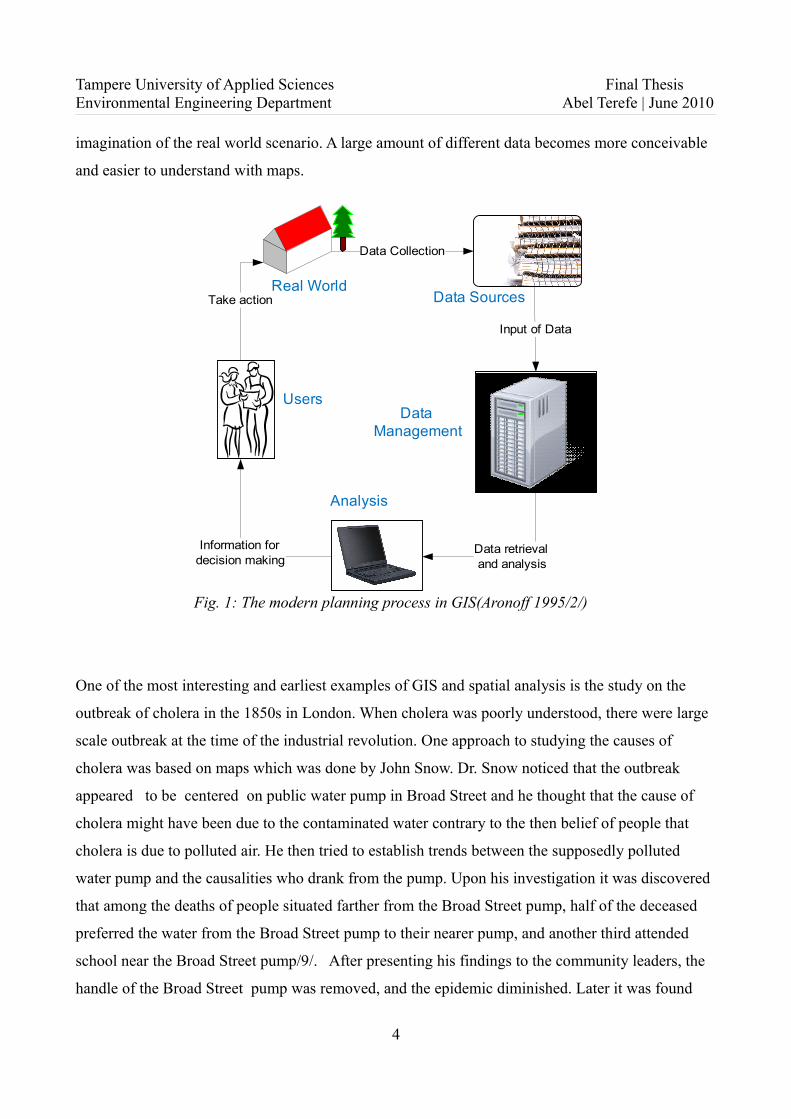
One of the most interesting and earliest examples of GIS and spatial analysis is the study on the
outbreak of cholera in the 1850s in London. When cholera was poorly understood, there were large
scale outbreak at the time of the industrial revolution. One approach to studying the causes of
cholera was based on maps which was done by John Snow. Dr. Snow noticed that the outbreak
appeared to be centered on public water pump in Broad Street and he thought that the cause of
cholera might have been due to the contaminated water contrary to the then belief of people that
cholera is due to polluted air. He then tried to establish trends between the supposedly polluted
water pump and the causalities who drank from the pump. Upon his investigation it was discovered
that among the deaths of people situated farther from the Broad Street pump, half of the deceased
preferred the water from the Broad Street pump to their nearer pump, and another third attended
school near the Broad Street pump/9/. After presenting his findings to the community leaders, the
handle of the Broad Street pump was removed, and the epidemic diminished. Later it was found
4
Fig. 1: The modern planning process in GIS(Aronoff 1995/2/)
Data Collection
Input of Data
Data retrievaland analysis
Information for decision making
Take actionReal World
Data Sources
DataManagement
Analysis
Users
Tampere University of Applied Sciences Final ThesisEnvironmental Engineering Department Abel Terefe | June 2010
out that a sewer pipe underground was leaking raw sewage into the drinking water of the Broad
Street pump. In the process of his discovery Dr. Snow thought that a map would be a useful tool to
his report. Figure 2 shows one of Snow's original maps.
2. Getting the relevant dataOne of the significant challenges in GIS work is obtaining relevant data. After all, the data lies at
the heart of geographical information system. The data used in GIS represents something about the
real world at some point in time. They are always an abstraction of reality because we don't need or
want every bit of data, just the ones we think would be useful[Aronof 1995/2/]. The data that we
consider relevant is the first constraint on the capabilities of the GIS. This in fact means that
ultimately the result depends on the quality of the data.
5
Fig. 2: Map of Cholera deaths in London by John Snow /9/
Tampere University of Applied Sciences Final ThesisEnvironmental Engineering Department Abel Terefe | June 2010
The most important aspects of data quality are accuracy, precision, time, currency, and
completeness. Accuracy is about how often, by how much, and the predictability of the correctness
of the data. Precision indicates the fineness of the scale with which the data was described. The time
indicates the interval at which the data was taken or the point when the data was taken. Time can
usually affect the quality of data critically. Yet currency tells about how recently the data was
collected. And completeness refers to the portion of the area of interest for which data is available
[Aronof 1995 /2/].
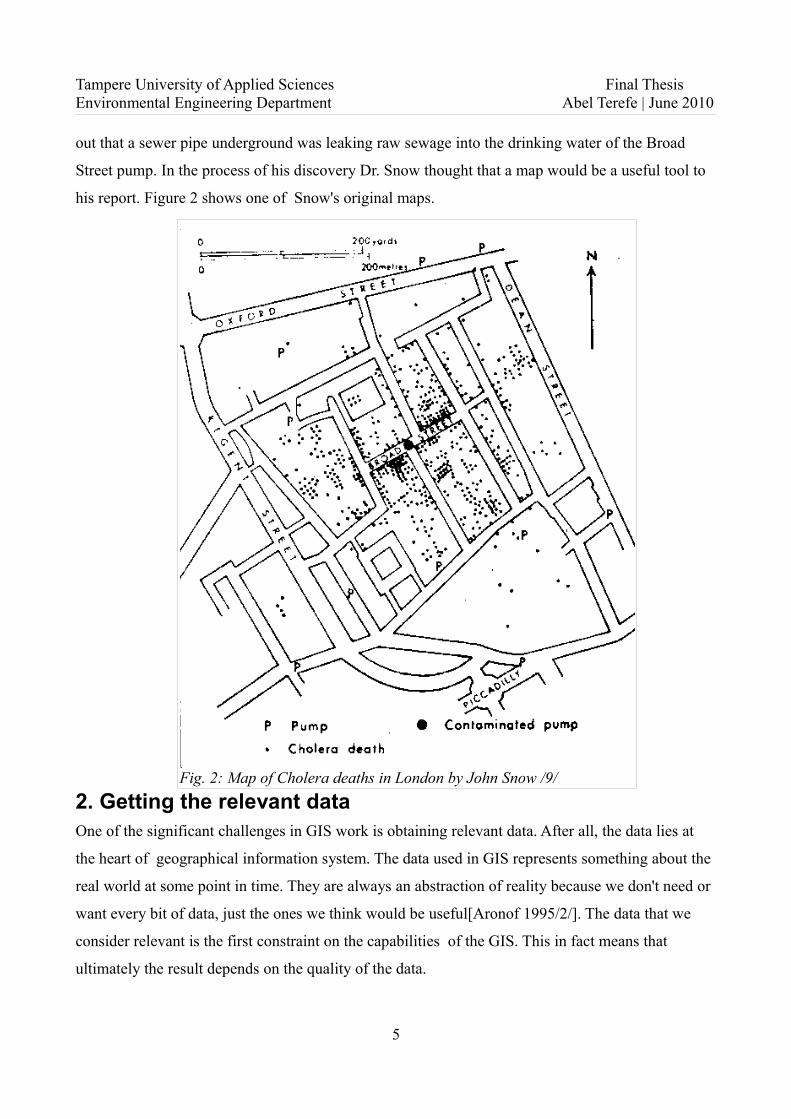
Data quality is always costly to achieve. In fact, there is an inverse relation ship between data
quality and data cost. The following figure shows the relation ship between the data quality and
cost.
2.1 Organization of dataData organization is another important factor that needs to be done for a good use of GIS. There are
several spatial data models to take care of data organization. Some of the traditional data models
are:
1. Coverages (sometimes referred to as layers or themes/11/) are one of the basic spatial data
models. It is a georelational data model that stores vector data. Coverages contain spatial
6
Fig. 3: The relationship of data quality and data cost (Adapted from Aronof 1995 /2/)
Tampere University of Applied Sciences Final ThesisEnvironmental Engineering Department Abel Terefe | June 2010
information representing location and and an attribute data for geographic features[ESRI /
12/].
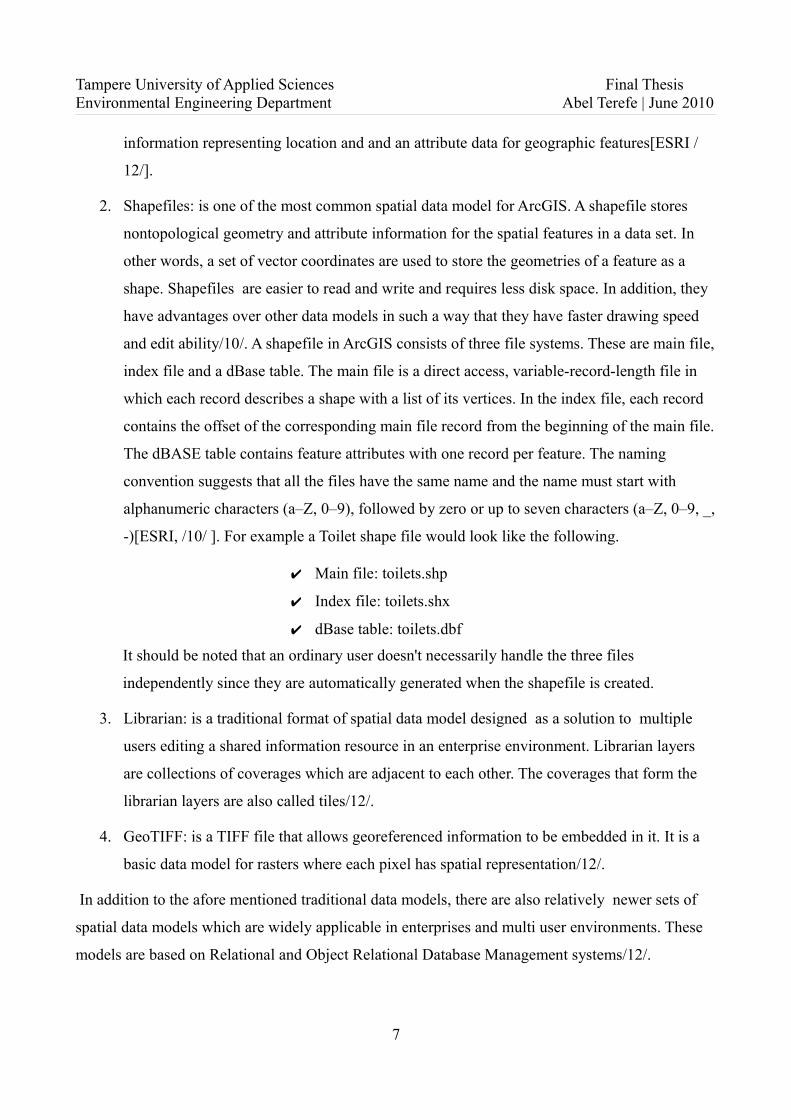
2. Shapefiles: is one of the most common spatial data model for ArcGIS. A shapefile stores
nontopological geometry and attribute information for the spatial features in a data set. In
other words, a set of vector coordinates are used to store the geometries of a feature as a
shape. Shapefiles are easier to read and write and requires less disk space. In addition, they
have advantages over other data models in such a way that they have faster drawing speed
and edit ability/10/. A shapefile in ArcGIS consists of three file systems. These are main file,
index file and a dBase table. The main file is a direct access, variable-record-length file in
which each record describes a shape with a list of its vertices. In the index file, each record
contains the offset of the corresponding main file record from the beginning of the main file.
The dBASE table contains feature attributes with one record per feature. The naming
convention suggests that all the files have the same name and the name must start with
alphanumeric characters (a–Z, 0–9), followed by zero or up to seven characters (a–Z, 0–9, _,
-)[ESRI, /10/ ]. For example a Toilet shape file would look like the following.
✔ Main file: toilets.shp
✔ Index file: toilets.shx
✔ dBase table: toilets.dbf
It should be noted that an ordinary user doesn't necessarily handle the three files
independently since they are automatically generated when the shapefile is created.
3. Librarian: is a traditional format of spatial data model designed as a solution to multiple
users editing a shared information resource in an enterprise environment. Librarian layers
are collections of coverages which are adjacent to each other. The coverages that form the
librarian layers are also called tiles/12/.
4. GeoTIFF: is a TIFF file that allows georeferenced information to be embedded in it. It is a
basic data model for rasters where each pixel has spatial representation/12/.
In addition to the afore mentioned traditional data models, there are also relatively newer sets of
spatial data models which are widely applicable in enterprises and multi user environments. These
models are based on Relational and Object Relational Database Management systems/12/.
7
Tampere University of Applied Sciences Final ThesisEnvironmental Engineering Department Abel Terefe | June 2010
2.2 Georeferenced dataGeographic data is usually composed of two kinds of information. The first and obvious
information is the location data on the surface of the earth, i.e. x-coordinate and y-coordinate values
or longitude and latitude values. The second is the phenomenon being reported at the given
location. For example, the population size at area A1, the public toilets in a given section of a city,
height of forest canopy, soil type etc /2/. Additional to the two attributes though, time is also an
important component of geographic data. That is because data has a period of validity. A certain
geographic data for example may only be valid for a specific period of time. However, the data can
be used to trace history of the given location. For instance, a land area with a pine forest may be
given for property developers to become a settlement for a group of people. In this regard, the
history of this particular place can be traced back by the data before and after the settlement.
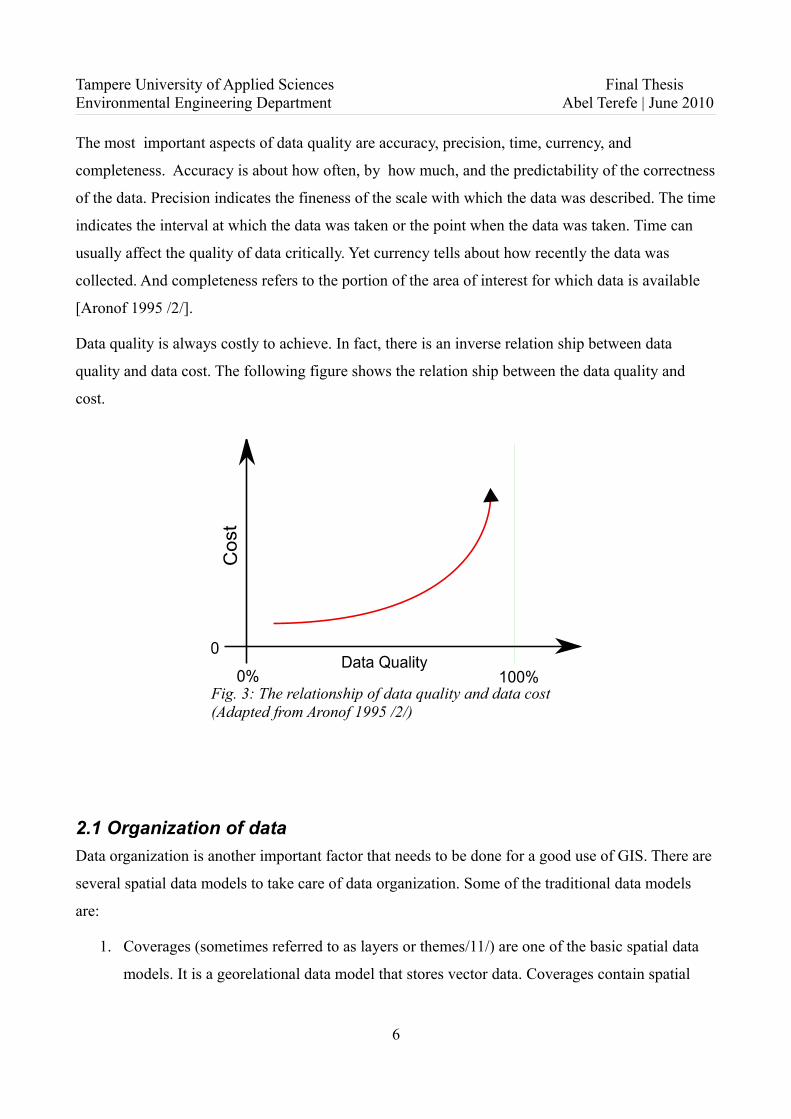
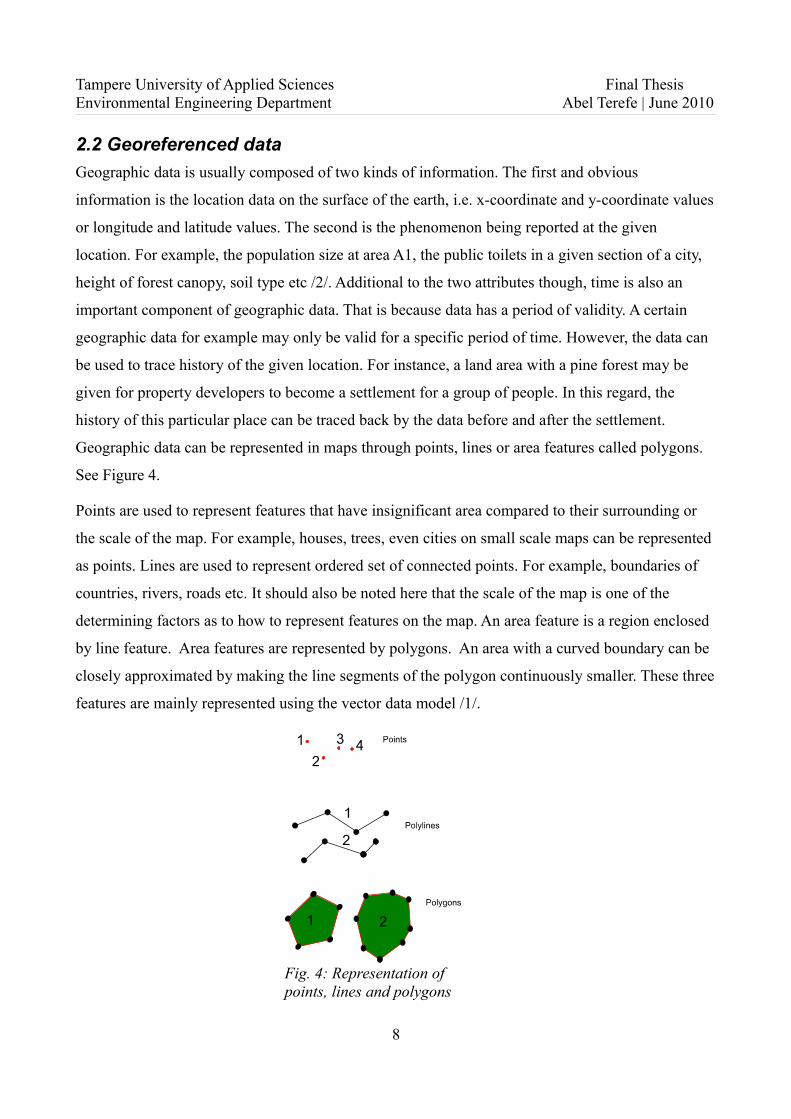
Geographic data can be represented in maps through points, lines or area features called polygons.
See Figure 4.
Points are used to represent features that have insignificant area compared to their surrounding or
the scale of the map. For example, houses, trees, even cities on small scale maps can be represented
as points. Lines are used to represent ordered set of connected points. For example, boundaries of
countries, rivers, roads etc. It should also be noted here that the scale of the map is one of the
determining factors as to how to represent features on the map. An area feature is a region enclosed
by line feature. Area features are represented by polygons. An area with a curved boundary can be
closely approximated by making the line segments of the polygon continuously smaller. These three
features are mainly represented using the vector data model /1/.
8
Fig. 4: Representation of points, lines and polygons
Tampere University of Applied Sciences Final ThesisEnvironmental Engineering Department Abel Terefe | June 2010
Several books define georeferenced data in many ways. One definition of it is a unique data where
only one location is associated with a given georeference[Longley, Goodchild, Maguire, Rhine
2005 /1/]. For example, a street address with the Zip code refers to only one location on earth and
hence is a georeference. Another definition of a georeferenced data is a spatial data that pertains to a
location on the earth's surface[Aronof 1995 /2/].
3 . Description of the work
3.1 The Bahirdar SaWE preliminary survey and mappingIn its planning of the survey, KeTu made a relatively newer approach by integrating GIS
components to the survey. That was done by locating every toilet in the area using a GPS receiver
device and interviewing the locals who at the time were using the toilets. That way it was possible
to make use of spatially referenced data in the process of the study and later in decision making.
Since the survey of toilets in the area was the first of its kind, there were no pre-existing
identification names for the entire group toilets and public toilets. Thus, it was decided to make use
of conventional names which are the names of popular people or place in close proximity to the
toilet in question to be able to identify later by name where exactly the toilets are situated.
The GPS receiver device used is called Garmin GPS III Plus. In the survey, location precision
wasn't given the top priority and thus most of the readings varied between 3m and 30m difference.
In the beginning, the device had to be initialized so that it would calculate a fix. The process of
initialization consists of multiple stages. At first, the receiver must lock onto satellites. This is
shown on the signal strength bars where hollow signal bars represent that the device is trying to
establish a connection to a satellite in the horizon. On the other hand, solid signal bars represent that
the receiver has collected the necessary data and the satellite is ready for use. Once a fix has been
calculated, the GPS III will update the position as long as there are satellites in the horizon /13/.
In addition to the location information, data about the number of people using the toilet, the time
when the toilets were built and the emptying frequency from the septic tanks were learned from the
interview with the locals. However, for the most part these information were very much based the
locals perception and not necessarily the accurate figures. It also included subjective information
based on personal observation about the hygiene condition and the state of the building. These data
were later classified and further refined into nominal, ordinal and interval data types of fields.
9
Tampere University of Applied Sciences Final ThesisEnvironmental Engineering Department Abel Terefe | June 2010
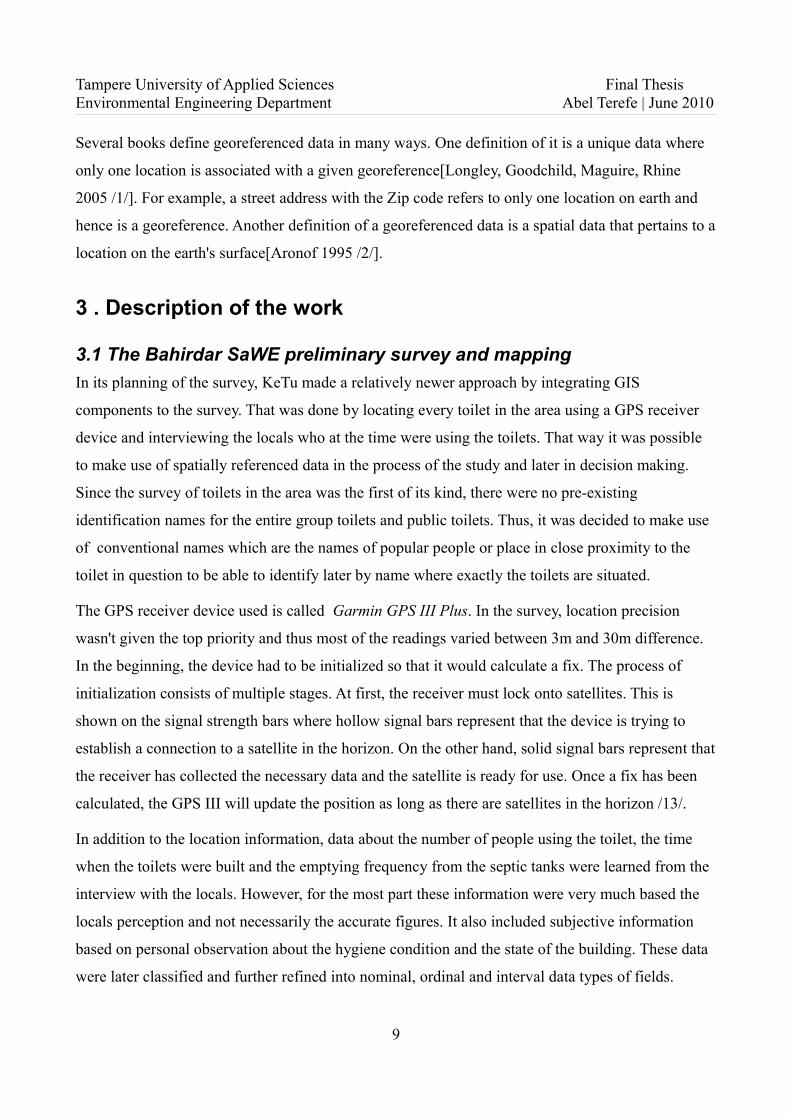
Figure 5 shows the survey form in its original form.
3.2 Exporting data into ArcGISBefore exporting the data to ArcGIS, it is necessary to prepare the data to be fed to the Arcmap
program in a usable and simpler form. The toilet data was sorted into several column of fields.
These fields are the key features of the toilet. They should be able to provide the most important
information about the toilets for our study. The longitude and latitude values were converted from
degree minute second format to decimal degrees format /14/. On top of that, the large volume of
data was condensed using numbers and easily recognizable key terms to facilitate ease of use of the
data.
The raw data is a mixture of all kinds of data types[See Appendix A]. For example, the location,
number of rooms and number of households are interval data types since the values can be correctly
determined. More precisely though, location is a continuous interval data type and thus was
represented by a floating point data type or Double data type. On the other hand, number of
households or number of rooms are discrete data types and were represented by Short integers.
Nominal data types such as conventional names and kebele names are simple names of places and
10
Fig. 5: Survey form
Tampere University of Applied Sciences Final ThesisEnvironmental Engineering Department Abel Terefe | June 2010
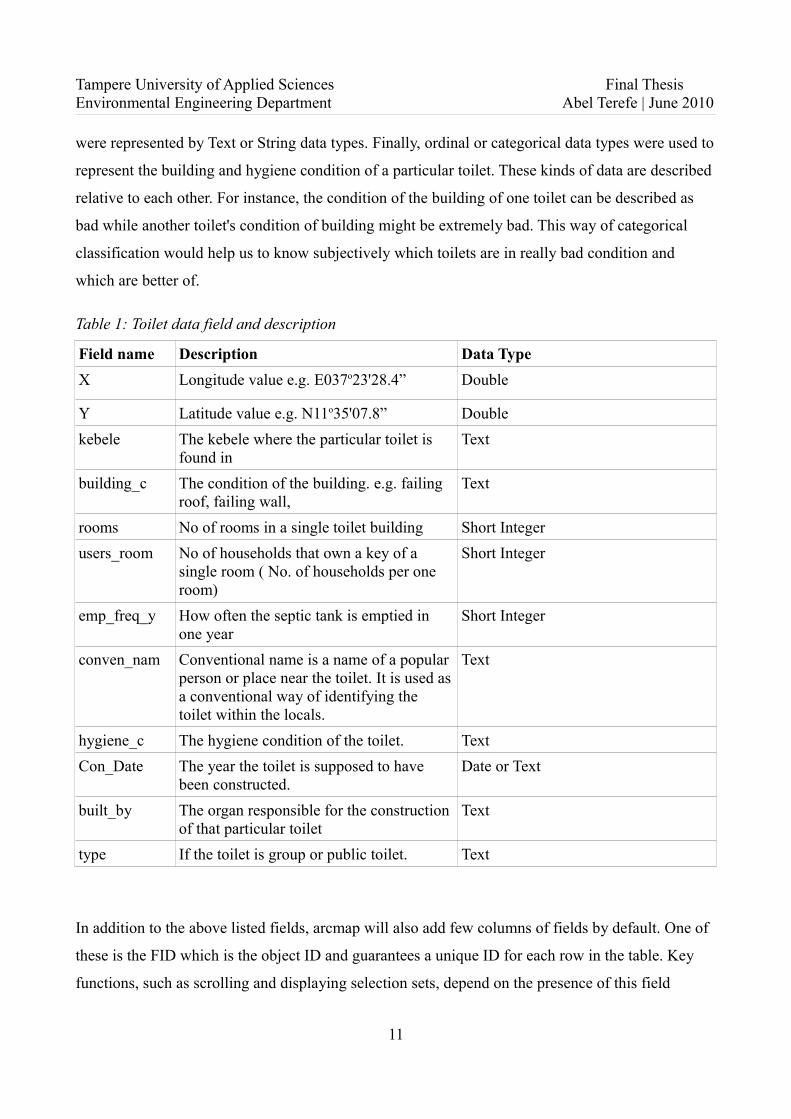
were represented by Text or String data types. Finally, ordinal or categorical data types were used to
represent the building and hygiene condition of a particular toilet. These kinds of data are described
relative to each other. For instance, the condition of the building of one toilet can be described as
bad while another toilet's condition of building might be extremely bad. This way of categorical
classification would help us to know subjectively which toilets are in really bad condition and
which are better of.
Table 1: Toilet data field and description
Field name Description Data TypeX Longitude value e.g. E037o23'28.4” Double
Y Latitude value e.g. N11o35'07.8” Doublekebele The kebele where the particular toilet is
found inText
building_c The condition of the building. e.g. failing roof, failing wall,
Text
rooms No of rooms in a single toilet building Short Integerusers_room No of households that own a key of a
single room ( No. of households per one room)
Short Integer
emp_freq_y How often the septic tank is emptied in one year
Short Integer
conven_nam Conventional name is a name of a popular person or place near the toilet. It is used as a conventional way of identifying the toilet within the locals.
Text
hygiene_c The hygiene condition of the toilet. TextCon_Date The year the toilet is supposed to have
been constructed.Date or Text
built_by The organ responsible for the construction of that particular toilet
Text
type If the toilet is group or public toilet. Text
In addition to the above listed fields, arcmap will also add few columns of fields by default. One of
these is the FID which is the object ID and guarantees a unique ID for each row in the table. Key
functions, such as scrolling and displaying selection sets, depend on the presence of this field
11
Tampere University of Applied Sciences Final ThesisEnvironmental Engineering Department Abel Terefe | June 2010
[ESRI /15/]. In other words, if a table lacks an object ID field, it will not be possible to select
features in the layer on the map in anyway. And the other field that is created by default is the
SHAPE field with type Geometry. The geometry data type indicates the type of geometry, that is
point, line, polygon, multipoint, or multipatch which the table stores.
3.3 Coordinate Systems
In the process of exporting data to ArcGIS, it is also important to understand the underlying
coordinate system that the data is based on. There are two main classes of coordinate systems.
These are Geographic coordinate system and Projected coordinate system.
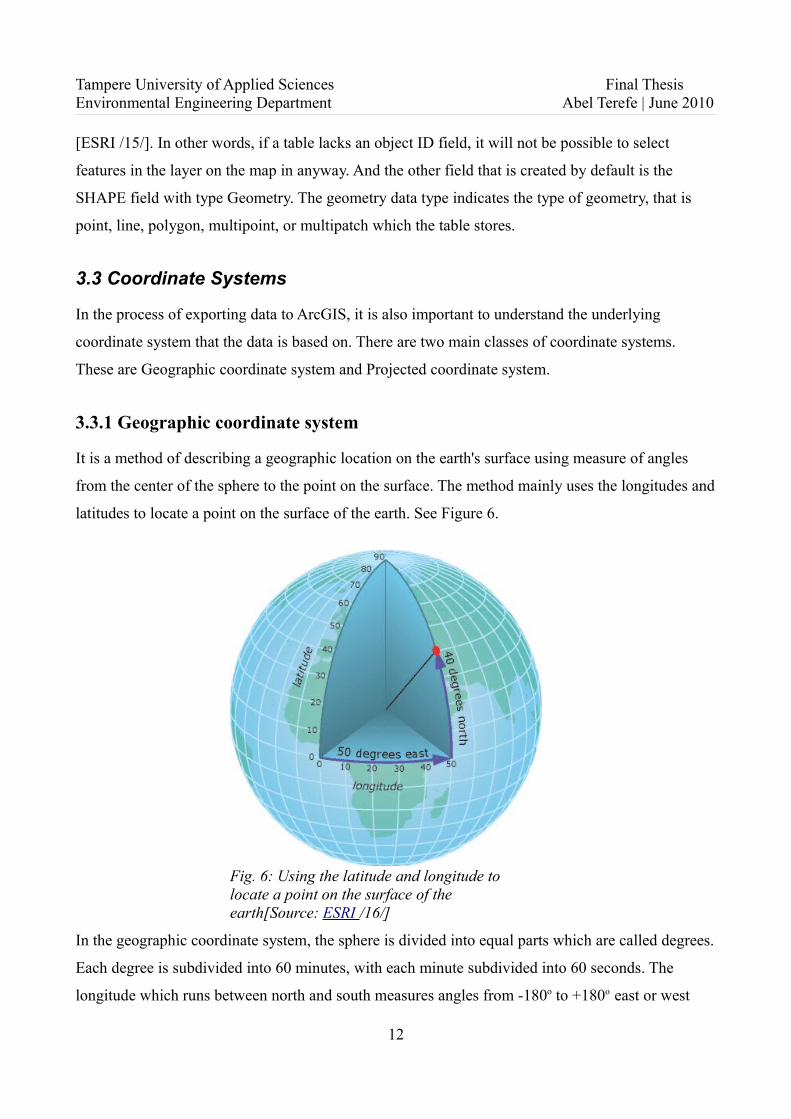
3.3.1 Geographic coordinate system
It is a method of describing a geographic location on the earth's surface using measure of angles
from the center of the sphere to the point on the surface. The method mainly uses the longitudes and
latitudes to locate a point on the surface of the earth. See Figure 6.
In the geographic coordinate system, the sphere is divided into equal parts which are called degrees.
Each degree is subdivided into 60 minutes, with each minute subdivided into 60 seconds. The
longitude which runs between north and south measures angles from -180o to +180o east or west
12
Fig. 6: Using the latitude and longitude to locate a point on the surface of the earth[Source: ESRI /16/]
Tampere University of Applied Sciences Final ThesisEnvironmental Engineering Department Abel Terefe | June 2010
from the prime meridian. And latitudes run between east and west and measure angles between -90
to +90 north or south of the equator.
Users with global datasets often use geographic coordinates to store and manage their data on a
global framework but project the data into a local planar coordinate system for editing and analysis /
16/. The GPS uses the geographic coordinate system to locate points on the ground.
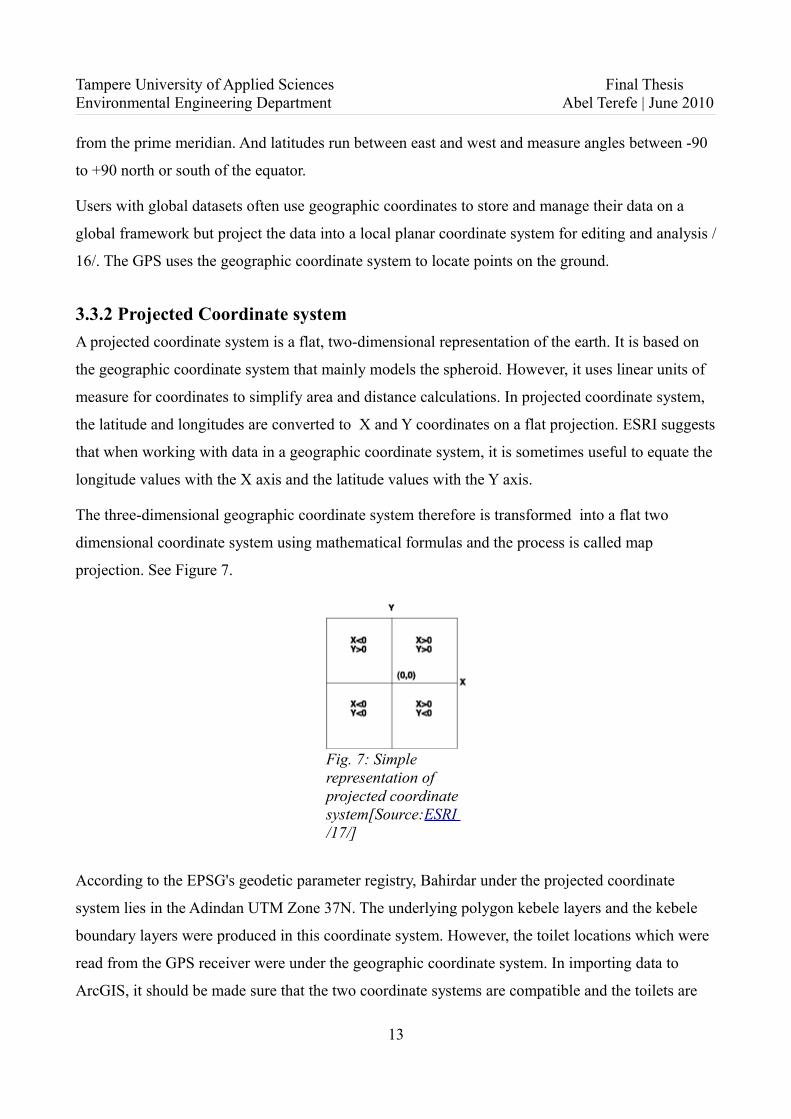
3.3.2 Projected Coordinate systemA projected coordinate system is a flat, two-dimensional representation of the earth. It is based on
the geographic coordinate system that mainly models the spheroid. However, it uses linear units of
measure for coordinates to simplify area and distance calculations. In projected coordinate system,
the latitude and longitudes are converted to X and Y coordinates on a flat projection. ESRI suggests
that when working with data in a geographic coordinate system, it is sometimes useful to equate the
longitude values with the X axis and the latitude values with the Y axis.
The three-dimensional geographic coordinate system therefore is transformed into a flat two
dimensional coordinate system using mathematical formulas and the process is called map
projection. See Figure 7.
According to the EPSG's geodetic parameter registry, Bahirdar under the projected coordinate
system lies in the Adindan UTM Zone 37N. The underlying polygon kebele layers and the kebele
boundary layers were produced in this coordinate system. However, the toilet locations which were
read from the GPS receiver were under the geographic coordinate system. In importing data to
ArcGIS, it should be made sure that the two coordinate systems are compatible and the toilets are
13
Fig. 7: Simple representation of projected coordinate system[Source:ESRI /17/]
Tampere University of Applied Sciences Final ThesisEnvironmental Engineering Department Abel Terefe | June 2010
represented at the correct places. To handle this kind of coordinate system incompatibility, ArcGIS
has a function that is capable of making conversions of Geographic coordinate systems into any
form of projected coordinate systems.
3.4 Selecting features and SQL expressionsSelection is a very common operation in GIS. We often need to select a group of features from a
large data. It enables us to build relationships within the data and make classifications of the large
data into finer and simpler groups. There are several kinds of selection techniques in ArcGIS. I
would only discuss here about selection by attributes using SQL expressions.
SQL (Structured Query Language) is a standard computer language for managing data in relational
databases. A SQL query is a request for data from a database using a SQL expression.
Selection by attributes is one such prominent feature of ArcGIS that is handy when it comes to
selecting features using their attributes from a layer. For example, from all Toilets, one may be
interested in the toilets that were built four or more years ago and had never been emptied. Using
the Select by attribute feature of ArcGIS we can write a SQL expression to retrieve the toilets that
were built before 2006 and never been emptied.
SELECT * FROM toilets WHERE:
"Con_Date" <= '2006' AND "emp_freq_y" = 0 AND ( "building_c" = 'bad' OR "building_c" =
'extremely bad' OR "building_c" = 'good' OR "building_c" = 'tolerable' OR "building_c" = 'very
good' )
What the above SQL expression does is, from the TOILETS layer it selects the toilets where the
attributes are such that “construction date is in 2006 or before 2006” with “zero emptying
frequency” and those toilets that are operational. In other words, the building condition
“building_c” can have all values except 'closed'.
After selection, we can export the selected features to a separate shapefile that can be added as a
new layer into the map. Such functionality is very handy when dealing with a large bulk of data and
when a separate analysis of the portion of the data is required.
The other kinds of selection techniques includes, selecting interactively which is by clicking a
feature on the map and selecting that particular feature. Select by location also has a lot more
advanced capability to determine spatial relationships.
14
Tampere University of Applied Sciences Final ThesisEnvironmental Engineering Department Abel Terefe | June 2010
4. Results
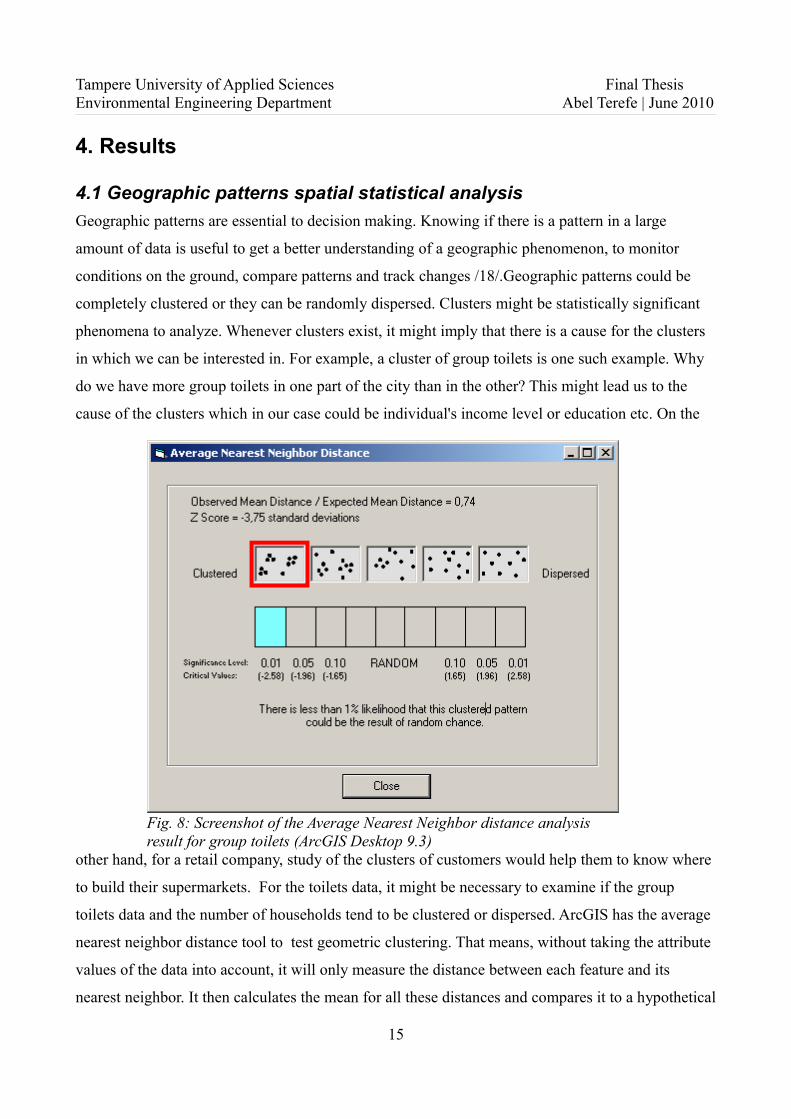
4.1 Geographic patterns spatial statistical analysis Geographic patterns are essential to decision making. Knowing if there is a pattern in a large
amount of data is useful to get a better understanding of a geographic phenomenon, to monitor
conditions on the ground, compare patterns and track changes /18/.Geographic patterns could be
completely clustered or they can be randomly dispersed. Clusters might be statistically significant
phenomena to analyze. Whenever clusters exist, it might imply that there is a cause for the clusters
in which we can be interested in. For example, a cluster of group toilets is one such example. Why
do we have more group toilets in one part of the city than in the other? This might lead us to the
cause of the clusters which in our case could be individual's income level or education etc. On the
other hand, for a retail company, study of the clusters of customers would help them to know where
to build their supermarkets. For the toilets data, it might be necessary to examine if the group
toilets data and the number of households tend to be clustered or dispersed. ArcGIS has the average
nearest neighbor distance tool to test geometric clustering. That means, without taking the attribute
values of the data into account, it will only measure the distance between each feature and its
nearest neighbor. It then calculates the mean for all these distances and compares it to a hypothetical
15
Fig. 8: Screenshot of the Average Nearest Neighbor distance analysis result for group toilets (ArcGIS Desktop 9.3)
Tampere University of Applied Sciences Final ThesisEnvironmental Engineering Department Abel Terefe | June 2010
random distribution /19/.
And the result as shown in figure 8 says, there is less than 1% likelihood that this clustered pattern
could be the result of random chance. Therefore, we can conclude that the group toilets are
geometrically clustered.
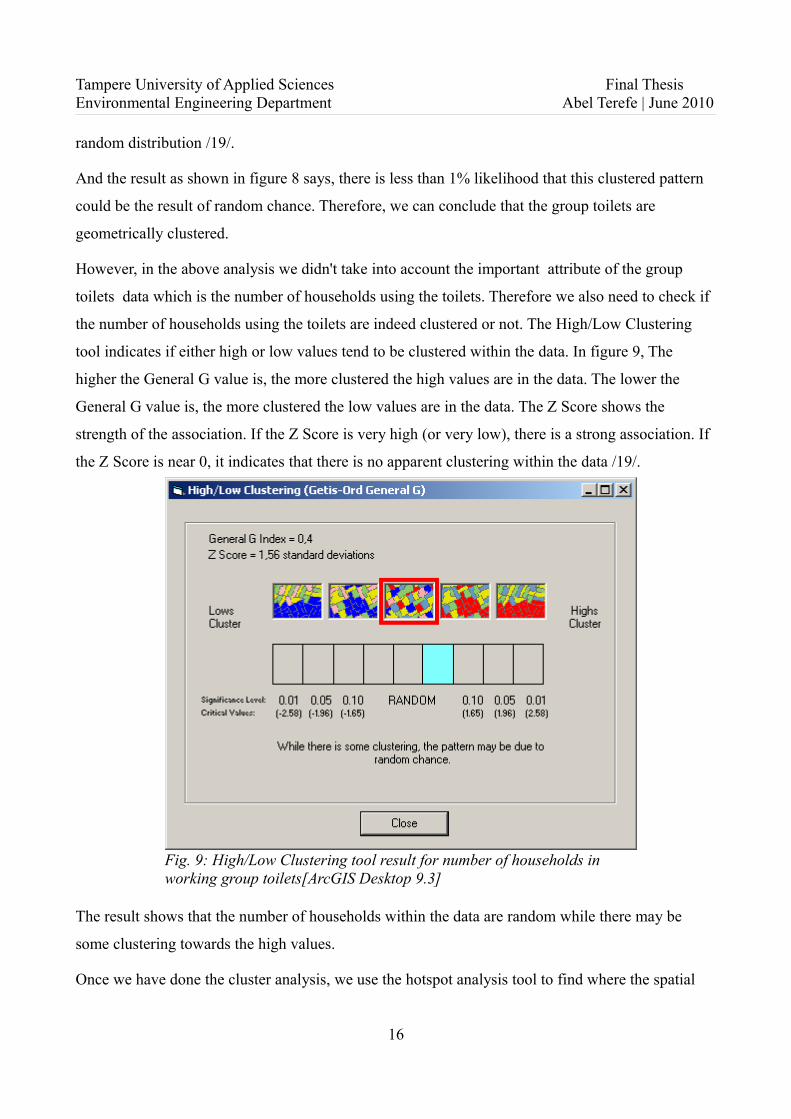
However, in the above analysis we didn't take into account the important attribute of the group
toilets data which is the number of households using the toilets. Therefore we also need to check if
the number of households using the toilets are indeed clustered or not. The High/Low Clustering
tool indicates if either high or low values tend to be clustered within the data. In figure 9, The
higher the General G value is, the more clustered the high values are in the data. The lower the
General G value is, the more clustered the low values are in the data. The Z Score shows the
strength of the association. If the Z Score is very high (or very low), there is a strong association. If
the Z Score is near 0, it indicates that there is no apparent clustering within the data /19/.
The result shows that the number of households within the data are random while there may be
some clustering towards the high values.
Once we have done the cluster analysis, we use the hotspot analysis tool to find where the spatial
16
Fig. 9: High/Low Clustering tool result for number of households in working group toilets[ArcGIS Desktop 9.3]
Tampere University of Applied Sciences Final ThesisEnvironmental Engineering Department Abel Terefe | June 2010
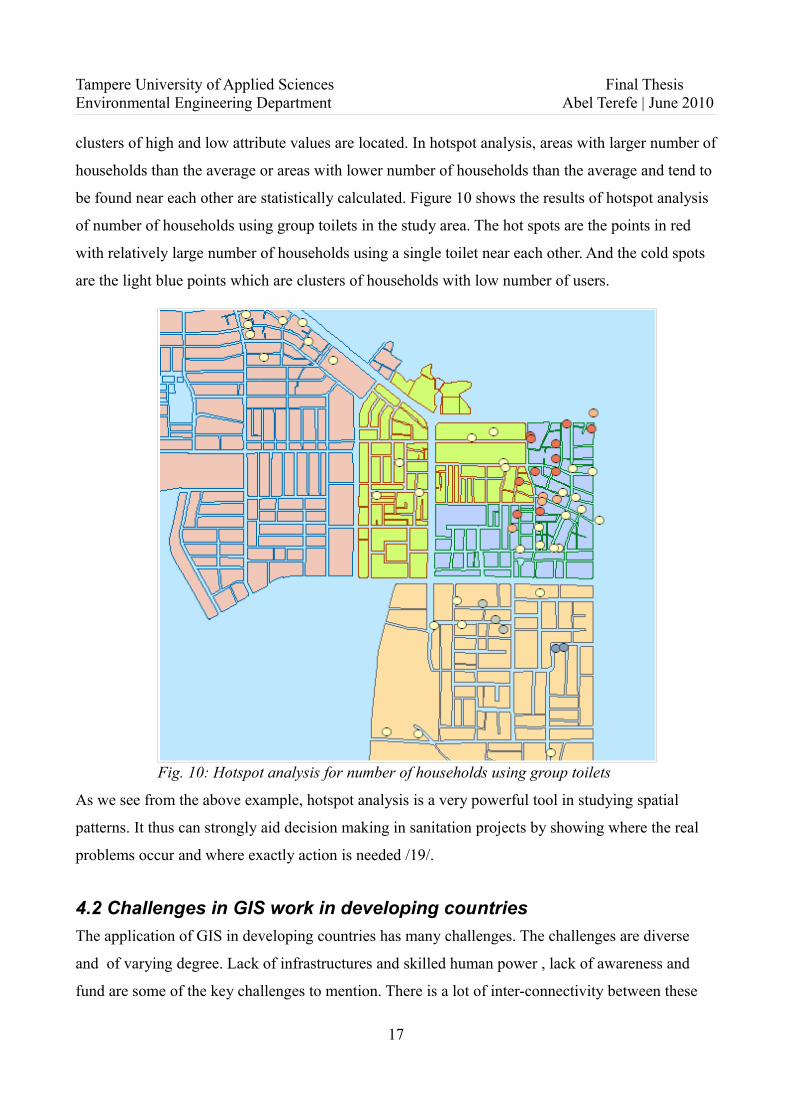
clusters of high and low attribute values are located. In hotspot analysis, areas with larger number of
households than the average or areas with lower number of households than the average and tend to
be found near each other are statistically calculated. Figure 10 shows the results of hotspot analysis
of number of households using group toilets in the study area. The hot spots are the points in red
with relatively large number of households using a single toilet near each other. And the cold spots
are the light blue points which are clusters of households with low number of users.
As we see from the above example, hotspot analysis is a very powerful tool in studying spatial
patterns. It thus can strongly aid decision making in sanitation projects by showing where the real
problems occur and where exactly action is needed /19/.
4.2 Challenges in GIS work in developing countriesThe application of GIS in developing countries has many challenges. The challenges are diverse
and of varying degree. Lack of infrastructures and skilled human power , lack of awareness and
fund are some of the key challenges to mention. There is a lot of inter-connectivity between these
17
Fig. 10: Hotspot analysis for number of households using group toilets

Tampere University of Applied Sciences Final ThesisEnvironmental Engineering Department Abel Terefe | June 2010
challenges. In fact, it is virtually impossible to look at the one with out describing the other.
GIS is a fairly expensive technology to use in developing countries. The cost of data collection, cost
of software/ hardware and costs of employing and training GIS staff is beyond what most African
countries can do at a local level. Lack of internet connection or its limited speed makes
communication and data transfer difficult. However, shortages of staff with the appropriate skills
and training is the biggest constraint even above shortages of funding /6/.
Lack of support from institutions and lack of awareness among senior managers of what GIS can
actually do to help empower decision makers with a more reliable and simpler model of the real
world scenario is by itself another problem. With very little knowledge of the senior managers
about GIS, it is virtually impossible to get their support to allocate resources to the development of
GIS. Therefore, it is essential to work to raise awareness of the governing bodies to convince them
allocate resources towards the development of the technology.
Table 2: Some of the common factors that have been known to impede the efforts to implement GIS [Adapted from Making GIS work in developing countries: views from practitioners in Africa]
Infrastructure Suitability and security of buildings Limited communication and access to information Equipment — hardware and software problem
Data Limited availability Quality and currentness of data Lack of adequate base mapping Difficulty in sharing data Poor data management — existing data is hard to find
Human Resources Lack of trained staff Lack of awareness Low priority for staff training Poorly developed self-help networks
Financial Limited budget for maintaining the project High cost of proprietary software Insufficient budget for staff training
Institutional No political or legislative support No government policy Lack of awareness within the government bodies Conflict of interest
18
Tampere University of Applied Sciences Final ThesisEnvironmental Engineering Department Abel Terefe | June 2010
4.2.1 Data availability and accessibilityThe lack of spatial data infrastructures(SDI) is the biggest challenges to get background materials
for the project. Data relevant to the Bahir dar SAWE Project was obtained through surveys and
from the Bahir dar cadastre office. These includes, the toilets data which was obtained through a
baseline survey conducted by KeTu ry and kebele boundary and base map from the cadastre office.
However, much relevant data such as population number in the kebeles and the income distribution
is not available. To make a reasonably good use of GIS in the project there needs to be more
physical data collection in different areas of the city.
In addition, there is lack of clear administerial responsibility as to who takes care of the data
concerning the conditions of sanitation and other related issues. In principle, it is the responsibility
of the Bahirdar water bureau to keep data about the sanitation issues in the city. However, it is
impossible to know which department really has the relevant data within the bureau.
4.2.2 Data managementThe municipality of Bahirdar has no identifiable library for relevant sanitation data in digital form
or paper form within the city. And there is no formal way for sharing data and information within
the government organizations themselves. Most of the government departments seem not to have
active formal information storage systems/7/. The data in question might be available within some
people's office shelves or in the hard disk of individual's computer. But in time of need of the
material, it is extremely difficult to get hold of the data. Lack of skill in data management software
such as Ms Access and Ms Excel adds up to the extent of the problem. Besides, when individual's
leave the organization due to retirement or moving to another location, it is very possible that the
data is lost.
4.2.3 Lack of GIS SkillsLack of GIS skills perhaps is the most prevalent hinderance to the development and use of maps in
managing sanitation projects in Ethiopia. Organizations are not used to using maps in project
management. As a matter of fact, there is a very limited use of even the standard packages such as
Ms Excel and Access. Therefore it is very essential to promote the use of GIS and the use of spatial
thinking in general within the local administrative organs.
On one side, the lack of of GIS skills of the technicians and lack of fund of the organizations to
19
Tampere University of Applied Sciences Final ThesisEnvironmental Engineering Department Abel Terefe | June 2010
build capacity and on the other side, the lack of awareness of the senior management groups to
allocate resources, preventing those interested in driving GIS forward to make managers aware of
its relevance and potential creates a vicious cycle that goes no where[6].
4.3 Sources of errorIn this basic and preliminary work there is expected to be fairly some amount of errors. These errors
could be related to the challengers mentioned above. Some of these are:
1. Quality of data: in the Bahir dar SAWE project a calculated risk was taken due to limitations
of fund, skilled labor and lack of equipments. For example, the location of the toilets varies
between 3m and 30m in the actual sites. This is due to the use of fairly old and simple kind
of GPS receiver device and it was decided to go with what we have from the outset than to
spend more money to get a better receiver.
2. Survey techniques: During the survey of the entire group and public toilets, the information
was obtained by interviewing the locals. And there was no single documented data used
from any government office or other non-governmental institutions. In most cases, during
the interview, when people were unable to tell what was asked they tend to approximate
numbers or guess facts. This would definitely have a consequence in the quality of data
obtained. However, this technique has also enabled us to see what exactly peoples need is
and what facts lie on the ground.
3. Method of analysis: analyzing the results of the survey is another step where some degree
of uncertainties are expected to occur. The structure of the survey itself is such that it
consists of several subjective elements. Extracting the most relevant information out of these
subjective elements is a difficult task. For example, in defining the conditions of a toilet, one
may regard the sanitation condition as 'good'. Another person may call it 'bad'. Therefore,
there is lack of uniformity in grading the conditions. This kind of problem is associated with
all kinds of ordinal or categorical data types where features are classified as categories.
On the other hand, in the spatial statistical analysis of the areas, the input feature classes
didn't contain projected data. This would have probably caused more uncertainty especially
when using the inverse distance conceptualization of spatial relationships which should be
used only with projected coordinate systems /20/. In addition, the neighborhood search
20
Tampere University of Applied Sciences Final ThesisEnvironmental Engineering Department Abel Terefe | June 2010
threshold or the distance band was set to default. These risks were taken by assuming that
the area under investigation was so small and thus the difference in result using the
Geographic coordinate system wouldn't be significant.
4. Interpretation of results: In the final interpretation of results, it is necessary to note the
combined effect of all other potential sources of uncertainty. The final results are the
products of the various factors involved in the study. This includes personnel, data,
equipments, methods , and background information used. Each of this factors uniquely
influence the results of the analysis.
5. Conclusion and discussionIn this essay, the intent was to show how GIS can be put to use in small scale sanitation projects in
developing countries especially in the Bahir dar SaWE project. The use of GIS can systematize the
decision making process for a proper resource distribution over the project areas. It has also been
shown that the integration of GIS can be done without spending a large amount of money. After
conducting the study of the sanitation facilities, GIS has enabled us to have a more conceivable
picture of the area.
1. The results have shown which areas have the highest density of users per toilet room. This is
shown in the hot spot analysis. And it was possible to see which areas are better of
compared to the worst toilets. This has the advantage of knowing where to build extra toilets
to relieve the problem. In the map[Appendix B], it was shown that the Gishabay kebele is
the worst affected in terms of toilet inadequacy. This can actually be subjectively proved
from our observation. The Gishabay kebele is one of the oldest kebeles in the city of Bahir
dar. It has a population of about 18 973 inhabitants[Hinkkanen 2009]. The chairperson of the
kebele, Ato Eyaya Negatu says the kebele has a lot of small enterprises and a severe
sanitation problem. The distribution of toilets compared to the number of people living in
the kebele is totally unmatchable. This is mainly because a lot of people live in a small piece
of land where the land isn't legally issued to them or by illegally expanding their block of
land and with the lacking supervision of the concerned organ from the kebele
administration, every open space has been inhabited. In this kebele, more than 95 % of
toilets are in real bad condition. It was also noted that most of the toilets were lacking either
roof or the floor slab was deteriorating. This on the other hand, raises the issue of safety
21
Tampere University of Applied Sciences Final ThesisEnvironmental Engineering Department Abel Terefe | June 2010
concerns especially for children.
2. Secondly, the use of maps has explicitly shown us the distribution of public and group
toilets, closed and working toilets over the study area. This provides a general picture as to
which kebeles have the largest number of group toilets or public toilet. It was also shown
which kebeles has 'extremely bad' toilets, 'bad' toilets, 'good' toilets or 'very good' toilets. It
is no wonder that this kind of analysis can be done with other kinds of statistical methods.
Nevertheless, maps have the advantage of enabling us to know the location in the real world.
Maps show us the general picture of the situation more vividly than we could have imagined
otherwise.
3. With maps it is easy to examine trends. Trends are patterns in which entities behave in a
certain environment. These patterns could be indicative of some facts on the ground. For
example, the fact that there are more group toilets in Gishabay than in any other kebele may
suggest that people in Gishabay kebele have low income level or low level of education etc.
This presumption might not be correct on its own but it would give us an insight as to why
these patterns exist. Thus, further investigation will tell us why indeed there are more group
toilets in Gishabay kebele.
Similarly, it is possible to see if there is any pattern in the location of 'ever unemptied '
toilets. These are toilets that had never been emptied since they were built. At the time of the
survey, the interviewees near these toilets responded that the toilets were full during the
rainy season and empty during the dry season suggesting infiltration of the sludge into the
ground. The pattern here is the tiolets in this particular area had never been emptied which
may suggest that the geologic formation of the area is such that sludge can infiltrate through
it. Or the construction of the toilets in that area is questionable.
This may be an interesting phenomenon to look at from protecting the ground water aquifers
point of view. Whatever is the correct answer, further investigation will tell what really is
happening to the sludge. However, the pattern with regard to the geographic location of
these toilets would provide an invaluable information about the underlying soil structure of
the area and other related issues.
22
Tampere University of Applied Sciences Final ThesisEnvironmental Engineering Department Abel Terefe | June 2010
References:Books:
1. Longley, Paul A., Goodchild, Michael F., Maguire, David J., Rhind David W.,2006 Geographic information systems and science, Second edition, John Wily & Sons, Ltd, ISBN 0-470-87001-X paperback
2. Aronof, Stan, 1995, Geographic information systems: A management perspective, ISBN 0-921804-91-1 paperback
Articles:3. Block, Paul J., 2007, Integrated Management of the Blue Nile Basin in Ethiopia:
Hydropower and Irrigation Modeling, IFPRI Discussion Paper 00700
4. Hinkannen, Kati, 2009, KeTu ry Project Plan: Kestävä Tuulevaisuus ry
5. Ethiopian Central statistical Agency(CSA) 2007, Statistical Bulletin 394, Household income, consumption and expenditure(HICE) Survey 2004/5 Volume I Analytical report
6. Stuart, Neil, Moss, Duncan, Hodgart, Robert & Radikonyana, Paul, 2009, Making GIS Work in Developing countries: Views from practitioners in Africa. Institute of Geography, University of Edinburgh, Scotland, UK. Published by RICS, ISBN: 978-1-84219-475-7
7. MacDonald, Alan, Dochartaigh, Brighid Ó & Welle, Kathi, 2009, Mapping for water supply and Sanitation(WSS) in Ethiopia, Working Paper 11: Research-inspired Policy and Practice Learning in Ethiopia and the Nile region (RiPPLE).
Internet resources:8. ESRI inc.─ Environmental systems research institute[Online] cited April 2010. Available
http://www.esri.com/what-is-gis/index.html
9. John Snow, Inc.and JSI research and training institute, Inc. [Online] cited April 2010. Available http://www.jsi.com/JSIInternet/AboutJSI/drsnow.cfm
10. ESRI Shapefiles technical description: An ESRI white paper ─ July 1998 [Online] cited April 2010. Available http://www.esri.com/library/whitepapers/pdfs/shapefile.pdf
11. GIS Lounge, Information about Geographic Information Systems, GPS, cartography, and geography [Online] cited April 2010. Available http://gislounge.com/coverage/
12. Spatial Data Management in an Enterprise GIS [online] cited May 2010. Available http://proceedings.esri.com/library/userconf/proc01/professional/papers/pap742/p742.htm
13. Garmin GPS III plus user manual [online] cited April 2010. Available http://www8.garmin.com/manuals/GPSIIIPlus_OwnersManual.pdf
14. University of Alberta Biological Sciences─GIS [Online] cited May 2010. Available http://www.biology.ualberta.ca/facilities/gis/uploads/instructions/AVXYData.pdf
15. ESRI – ArcGIS 9.2 desktop help, About ObjectID fields [online] cited May 2010. Available http://webhelp.esri.com/arcgisdesktop/9.2/index.cfm?TopicName=About_ObjectID_fields
23
Tampere University of Applied Sciences Final ThesisEnvironmental Engineering Department Abel Terefe | June 2010
16. ESRI – ArcGIS 9.2 desktop help, Geographic coordinate system[online] cited May 2010. Available http://webhelp.esri.com/arcgisdesktop/9.2/index.cfm?id=132&pid=103&topicname=Geographic_Coordinate_System
17. ESRI – ArcGIS 9.2 desktop help, Projected coordinate system[online] cited May 2010. Available http://webhelp.esri.com/arcgisdesktop/9.2/index.cfm?id=91&pid=90&topicname=About_projected_coordinate_systems
18. Sable, Clive, 2005, Presentation on clustering of disease. University of Canterbury[online] cited May 2010. Available http://www.geog.ubc.ca/courses/geog270/labs/Spatial_Clusters.pdf
19. ESRI – Spatial statistics for commercial applications, An ESRI white paper April 2005 [online] cited May 2010. Available http://www.esri.com/library/whitepapers/pdfs/spatial-stats-comm-apps.pdf
20. ESRI – Cluster and outlier analysis [online] cited May 2010. Available http://webhelp.esri.com/arcgisdesktop/9.2/index.cfm?TopicName=Cluster%20and%20Outlier%20Analysis:%20Anselin%20Local%20Moran's%20I%20(Spatial%20Statistics)
24
Appendix
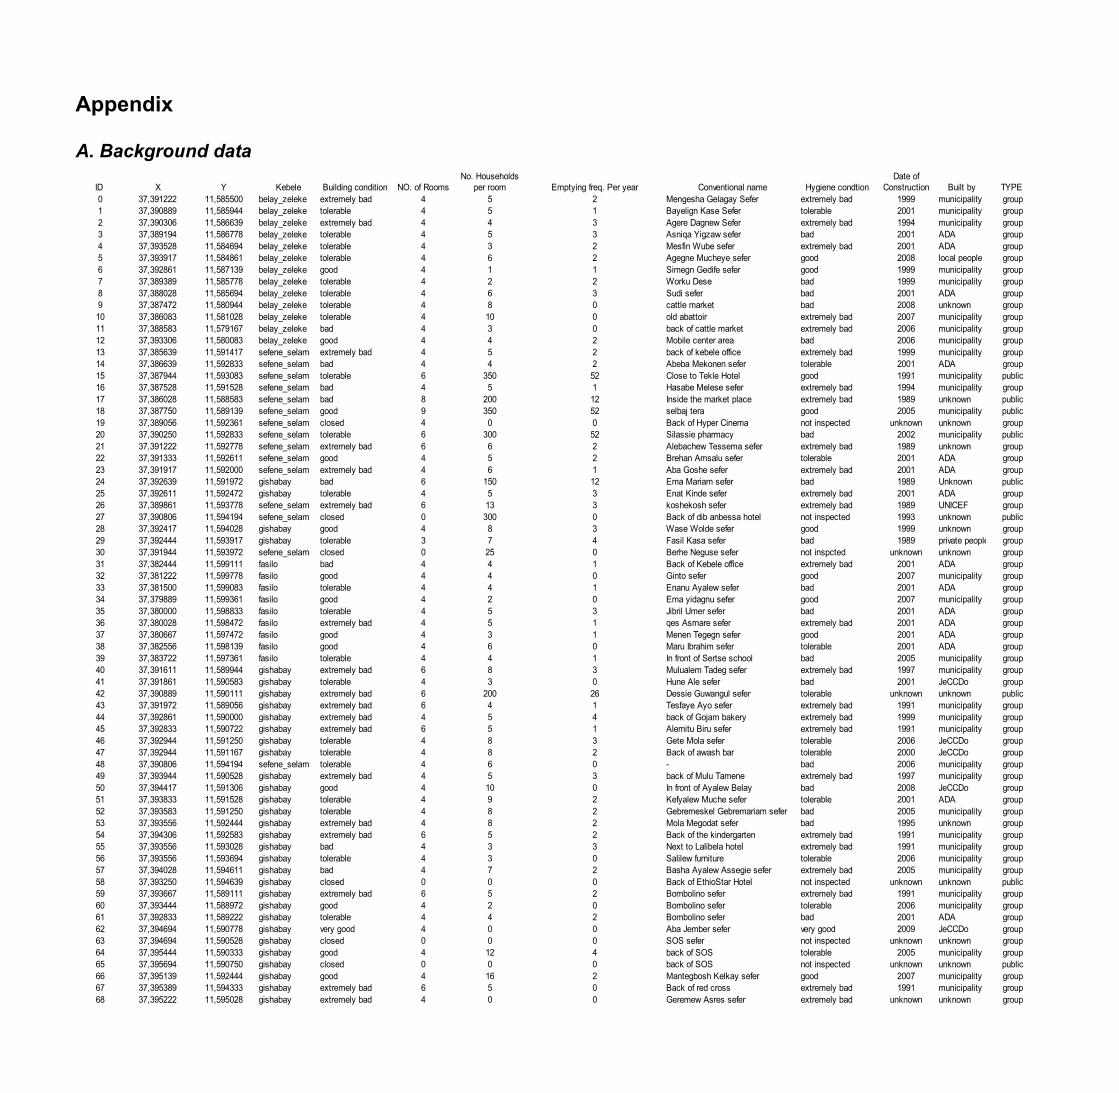
A. Background data
ID X Y Kebele Building condition NO. of Rooms Emptying freq. Per year Conventional name Hygiene condtion Built by TYPE 0 37,391222 11,585500 belay_zeleke extremely bad 4 5 2 Mengesha Gelagay Sefer extremely bad 1999 municipality group1 37,390889 11,585944 belay_zeleke tolerable 4 5 1 Bayelign Kase Sefer tolerable 2001 municipality group2 37,390306 11,586639 belay_zeleke extremely bad 4 4 3 Agere Dagnew Sefer extremely bad 1994 municipality group3 37,389194 11,586778 belay_zeleke tolerable 4 5 3 Asniqa Yigzaw sefer bad 2001 ADA group4 37,393528 11,584694 belay_zeleke tolerable 4 3 2 Mesfin Wube sefer extremely bad 2001 ADA group5 37,393917 11,584861 belay_zeleke tolerable 4 6 2 Agegne Mucheye sefer good 2008 local people group6 37,392861 11,587139 belay_zeleke good 4 1 1 Simegn Gedife sefer good 1999 municipality group7 37,389389 11,585778 belay_zeleke tolerable 4 2 2 Worku Dese bad 1999 municipality group8 37,388028 11,585694 belay_zeleke tolerable 4 6 3 Sudi sefer bad 2001 ADA group9 37,387472 11,580944 belay_zeleke tolerable 4 8 0 cattle market bad 2008 unknown group10 37,386083 11,581028 belay_zeleke tolerable 4 10 0 old abattoir extremely bad 2007 municipality group11 37,388583 11,579167 belay_zeleke bad 4 3 0 back of cattle market extremely bad 2006 municipality group12 37,393306 11,580083 belay_zeleke good 4 4 2 Mobile center area bad 2006 municipality group13 37,385639 11,591417 sefene_selam extremely bad 4 5 2 back of kebele office extremely bad 1999 municipality group14 37,386639 11,592833 sefene_selam bad 4 4 2 Abeba Mekonen sefer tolerable 2001 ADA group15 37,387944 11,593083 sefene_selam tolerable 6 350 52 Close to Tekle Hotel good 1991 municipality public16 37,387528 11,591528 sefene_selam bad 4 5 1 Hasabe Melese sefer extremely bad 1994 municipality group17 37,386028 11,588583 sefene_selam bad 8 200 12 Inside the market place extremely bad 1989 unknown public18 37,387750 11,589139 sefene_selam good 9 350 52 selbaj tera good 2005 municipality public19 37,389056 11,592361 sefene_selam closed 4 0 0 Back of Hyper Cinema not inspected unknown unknown group20 37,390250 11,592833 sefene_selam tolerable 6 300 52 Silassie pharmacy bad 2002 municipality public21 37,391222 11,592778 sefene_selam extremely bad 6 6 2 Alebachew Tessema sefer extremely bad 1989 unknown group22 37,391333 11,592611 sefene_selam good 4 5 2 Brehan Amsalu sefer tolerable 2001 ADA group23 37,391917 11,592000 sefene_selam extremely bad 4 6 1 Aba Goshe sefer extremely bad 2001 ADA group24 37,392639 11,591972 gishabay bad 6 150 12 Ema Mariam sefer bad 1989 Unknown public25 37,392611 11,592472 gishabay tolerable 4 5 3 Enat Kinde sefer extremely bad 2001 ADA group26 37,389861 11,593778 sefene_selam extremely bad 6 13 3 koshekosh sefer extremely bad 1989 UNICEF group27 37,390806 11,594194 sefene_selam closed 0 300 0 Back of dib anbessa hotel not inspected 1993 unknown public28 37,392417 11,594028 gishabay good 4 8 3 Wase Wolde sefer good 1999 unknown group29 37,392444 11,593917 gishabay tolerable 3 7 4 Fasil Kasa sefer bad 1989 private people group30 37,391944 11,593972 sefene_selam closed 0 25 0 Berhe Neguse sefer not inspcted unknown unknown group31 37,382444 11,599111 fasilo bad 4 4 1 Back of Kebele office extremely bad 2001 ADA group32 37,381222 11,599778 fasilo good 4 4 0 Ginto sefer good 2007 municipality group33 37,381500 11,599083 fasilo tolerable 4 4 1 Enanu Ayalew sefer bad 2001 ADA group34 37,379889 11,599361 fasilo good 4 2 0 Ema yidagnu sefer good 2007 municipality group35 37,380000 11,598833 fasilo tolerable 4 5 3 Jibril Umer sefer bad 2001 ADA group36 37,380028 11,598472 fasilo extremely bad 4 5 1 qes Asmare sefer extremely bad 2001 ADA group37 37,380667 11,597472 fasilo good 4 3 1 Menen Tegegn sefer good 2001 ADA group38 37,382556 11,598139 fasilo good 4 6 0 Maru Ibrahim sefer tolerable 2001 ADA group39 37,383722 11,597361 fasilo tolerable 4 4 1 In front of Sertse school bad 2005 municipality group40 37,391611 11,589944 gishabay extremely bad 6 8 3 Mulualem Tadeg sefer extremely bad 1997 municipality group41 37,391861 11,590583 gishabay tolerable 4 3 0 Hune Ale sefer bad 2001 JeCCDo group42 37,390889 11,590111 gishabay extremely bad 6 200 26 Dessie Guwangul sefer tolerable unknown unknown public43 37,391972 11,589056 gishabay extremely bad 6 4 1 Tesfaye Ayo sefer extremely bad 1991 municipality group44 37,392861 11,590000 gishabay extremely bad 4 5 4 back of Gojam bakery extremely bad 1999 municipality group45 37,392833 11,590722 gishabay extremely bad 6 5 1 Alemitu Biru sefer extremely bad 1991 municipality group46 37,392944 11,591250 gishabay tolerable 4 8 3 Gete Mola sefer tolerable 2006 JeCCDo group47 37,392944 11,591167 gishabay tolerable 4 8 2 Back of awash bar tolerable 2000 JeCCDo group48 37,390806 11,594194 sefene_selam tolerable 4 6 0 - bad 2006 municipality group49 37,393944 11,590528 gishabay extremely bad 4 5 3 back of Mulu Tamene extremely bad 1997 municipality group50 37,394417 11,591306 gishabay good 4 10 0 In front of Ayalew Belay bad 2008 JeCCDo group51 37,393833 11,591528 gishabay tolerable 4 9 2 Kefyalew Muche sefer tolerable 2001 ADA group52 37,393583 11,591250 gishabay tolerable 4 8 2 Gebremeskel Gebremariam sefer bad 2005 municipality group53 37,393556 11,592444 gishabay extremely bad 4 8 2 Mola Megodat sefer bad 1995 unknown group54 37,394306 11,592583 gishabay extremely bad 6 5 2 Back of the kindergarten extremely bad 1991 municipality group55 37,393556 11,593028 gishabay bad 4 3 3 Next to Lalibela hotel extremely bad 1991 municipality group56 37,393556 11,593694 gishabay tolerable 4 3 0 Salilew furniture tolerable 2006 municipality group57 37,394028 11,594611 gishabay bad 4 7 2 Basha Ayalew Assegie sefer extremely bad 2005 municipality group58 37,393250 11,594639 gishabay closed 0 0 0 Back of EthioStar Hotel not inspected unknown unknown public59 37,393667 11,589111 gishabay extremely bad 6 5 2 Bombolino sefer extremely bad 1991 municipality group60 37,393444 11,588972 gishabay good 4 2 0 Bombolino sefer tolerable 2006 municipality group61 37,392833 11,589222 gishabay tolerable 4 4 2 Bombolino sefer bad 2001 ADA group62 37,394694 11,590778 gishabay very good 4 0 0 Aba Jember sefer very good 2009 JeCCDo group63 37,394694 11,590528 gishabay closed 0 0 0 SOS sefer not inspected unknown unknown group64 37,395444 11,590333 gishabay good 4 12 4 back of SOS tolerable 2005 municipality group65 37,395694 11,590750 gishabay closed 0 0 0 back of SOS not inspected unknown unknown public66 37,395139 11,592444 gishabay good 4 16 2 Mantegbosh Kelkay sefer good 2007 municipality group67 37,395389 11,594333 gishabay extremely bad 6 5 0 Back of red cross extremely bad 1991 municipality group68 37,395222 11,595028 gishabay extremely bad 4 0 0 Geremew Asres sefer extremely bad unknown unknown group
No. Households per room
Date of Construction
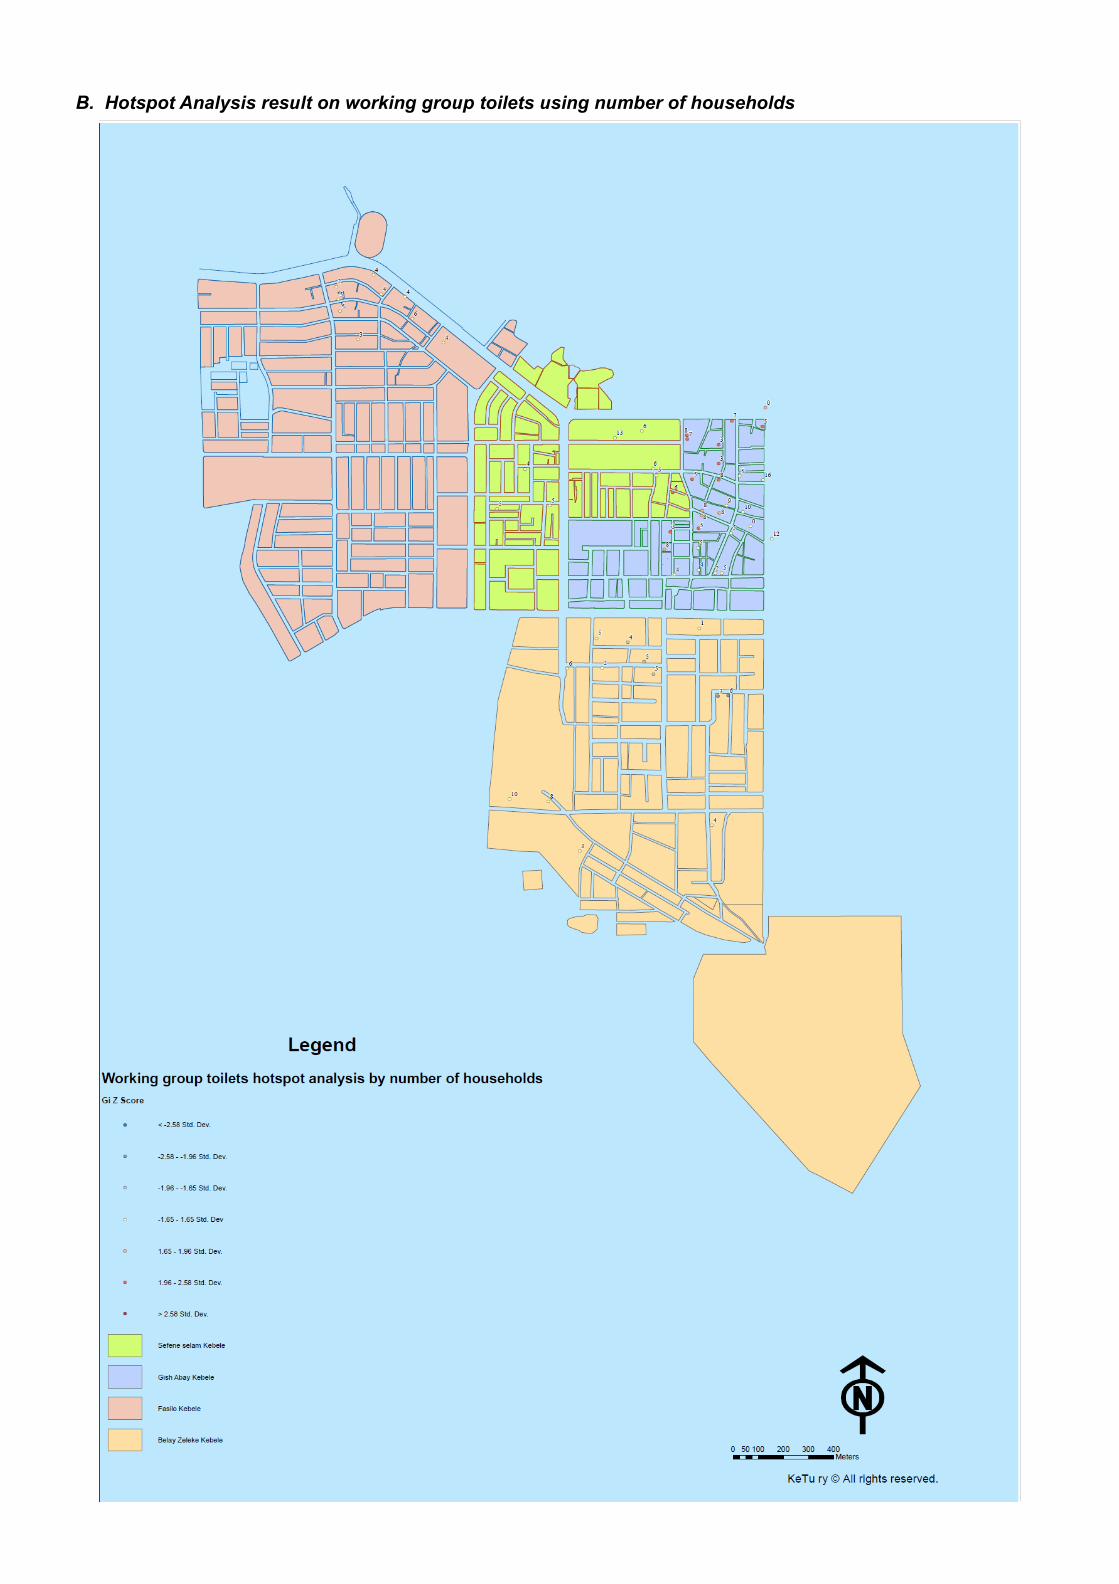
B. Hotspot Analysis result on working group toilets using number of households
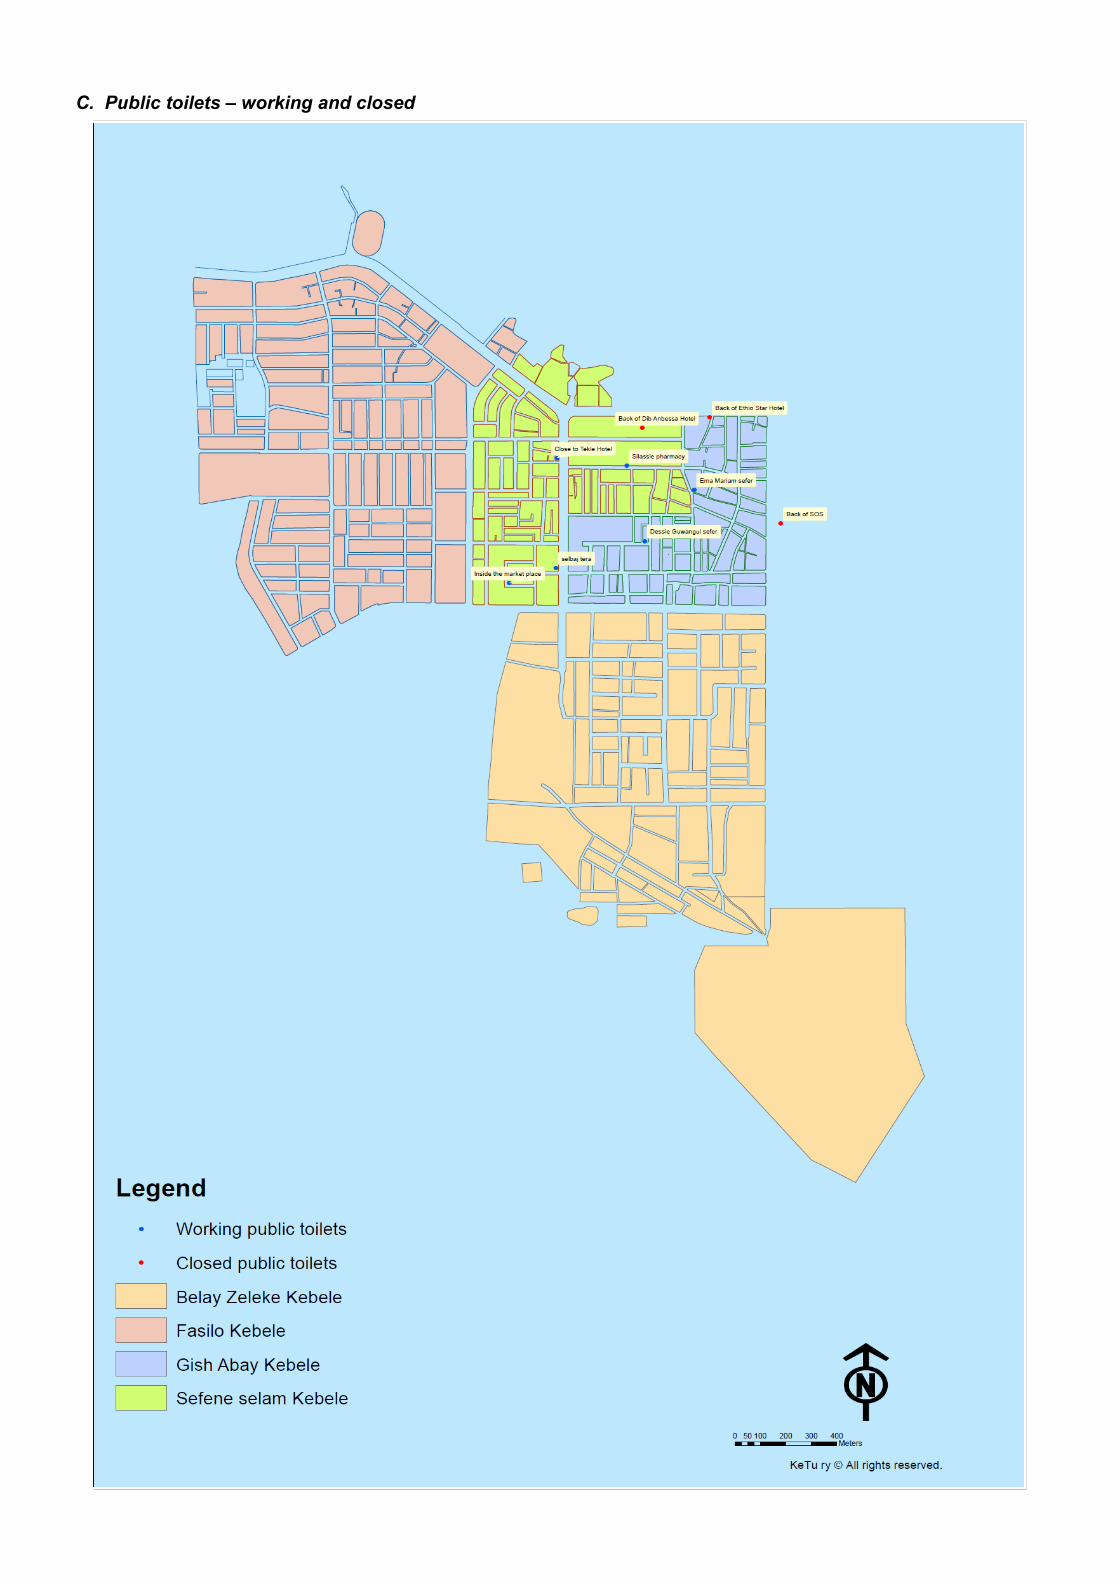
C. Public toilets – working and closed
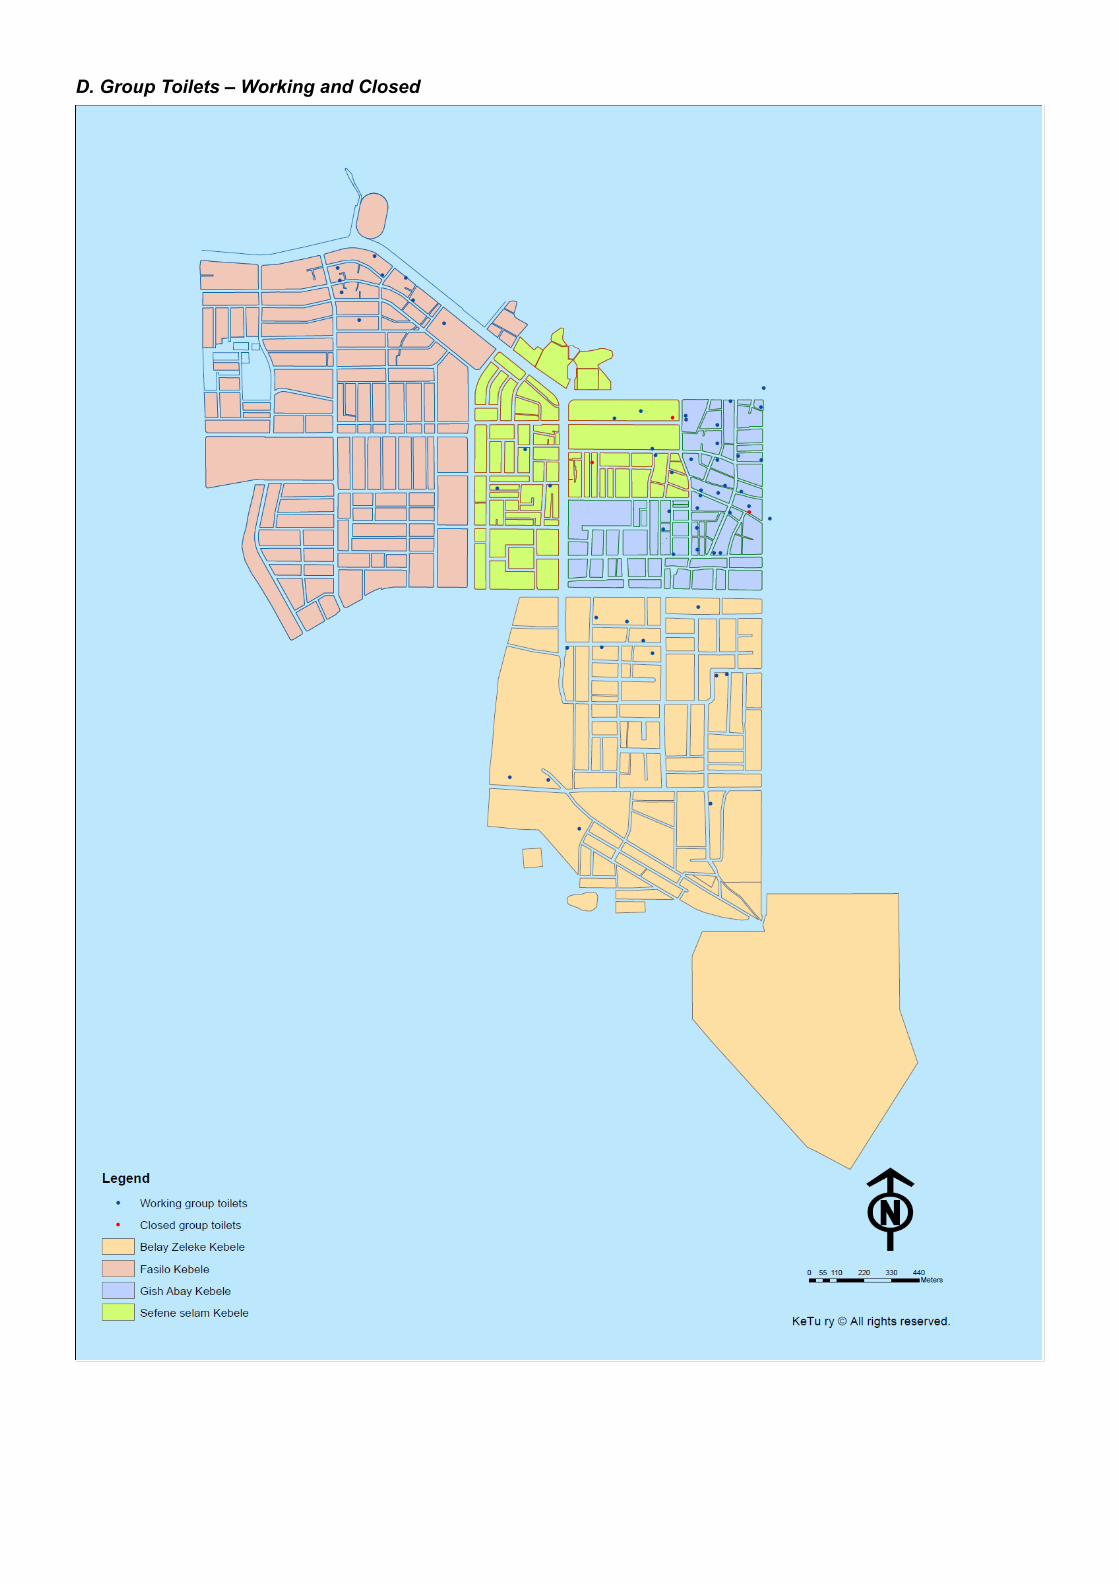
D. Group Toilets – Working and Closed
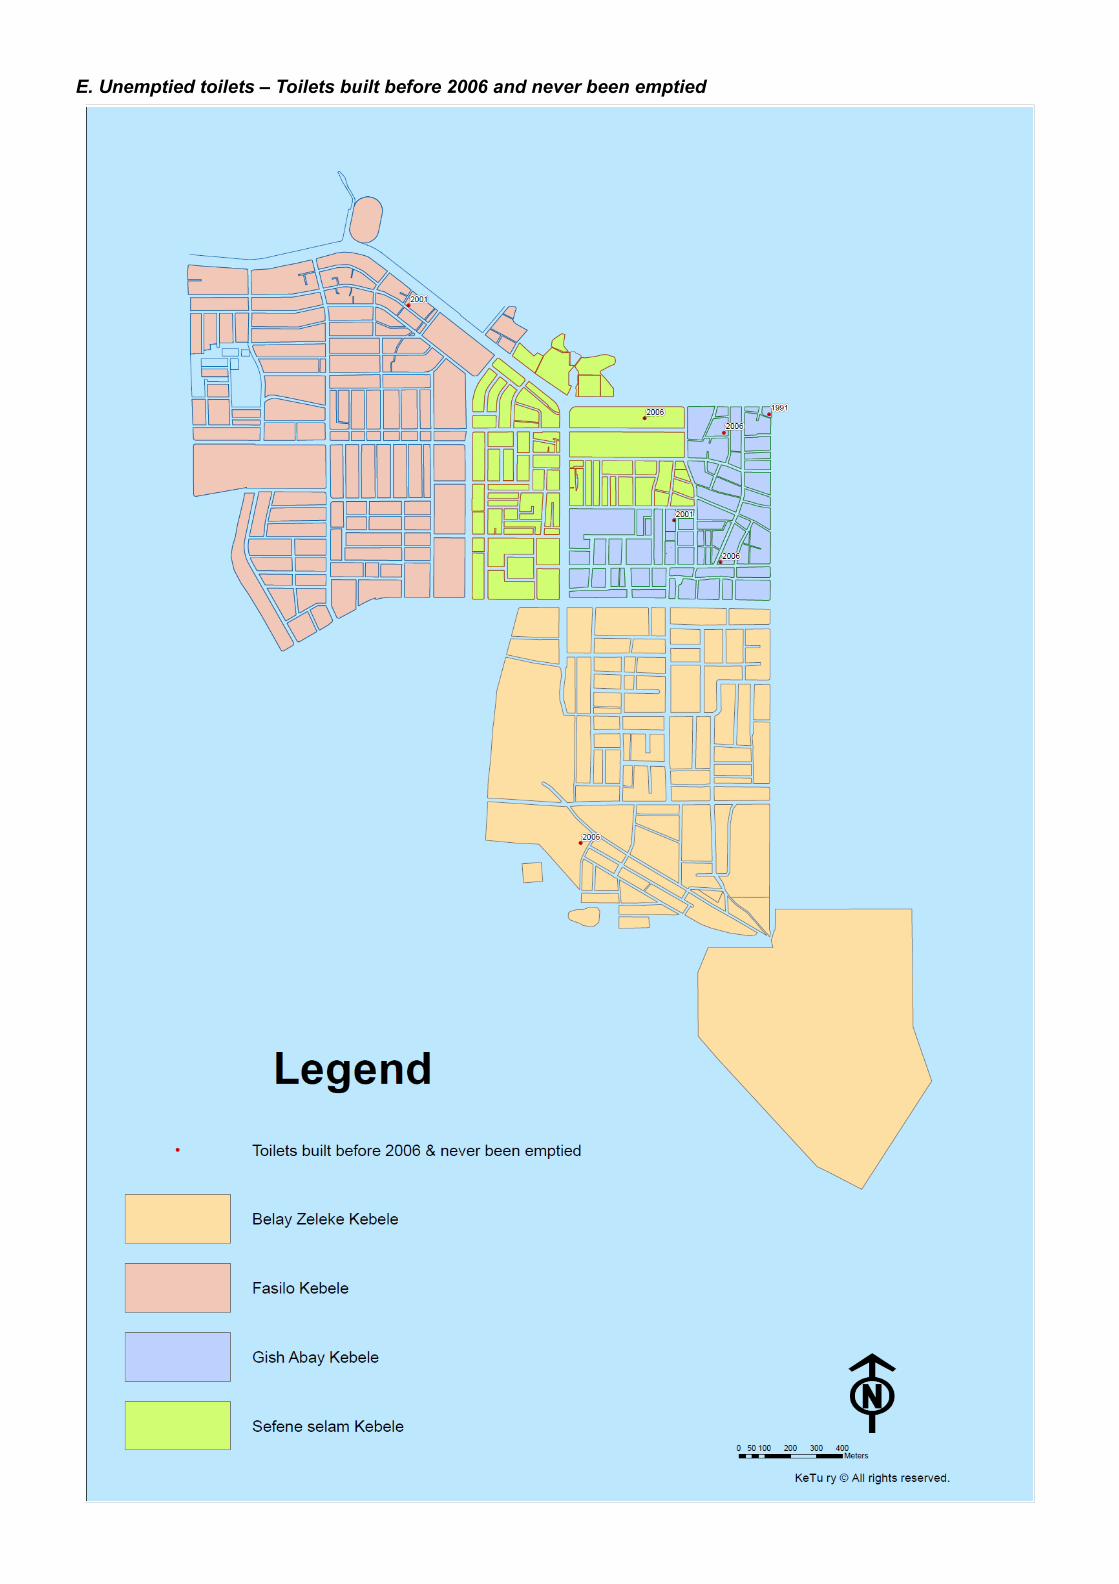
E. Unemptied toilets – Toilets built before 2006 and never been emptied