Embed Size (px)
Citation preview
FINAL TECHNICAL REPORT November 1, 2000 through December 31, 2001
Project Title: EVALUATION OF NEW COAL SIZING TECHNOLOGIES
TO IMPROVE PLANT PROFITABILITY ICCI Project Number: 00-1/4.1A-1 Principal Investigator: Dr. M. K. Mohanty, Southern Illinois University Project Manager: Dr. Ken Ho
ABSTRACT
An improvement in the size separation performance for fine coal could potentially increase the overall quantity and quality of coal recovered from the fine coal cleaning circuits of Illinois coal preparation plants. Thus, the main objective of this study was to evaluate state of the art screening and classification technologies to improve fine coal sizing performance. The new technologies studied in this investigation include the Pansep screening technology, Krebs’ new design gMax cyclone and the Cyclowash attachment with an industrial size cyclone. The Pansep screen’s performance has been evaluated for 100 mesh particle size separation and compared with the performances of sieve bend and 15 inch cyclones operating in an Illinois coal preparation plant. The performances of 6-inch gMax cyclone, the Cyclowash attachment and also the Pansep screen have been evaluated for 325 mesh size separation and compared with the 6-inch cyclone of conventional design operating in an Illinois coal preparation plant. The optimized Pansep screen performance is significantly better than the performance of 15-inch cyclone and sieve bend for classifying the minus 1 mm particle size slurry at 100 mesh. The undersize bypass was reduced from nearly 27% with 15-inch cyclone to nearly 2% with the Pansep screen. The undersize bypass of nearly 22% from the sieve bend was reduced to nearly 2% with the Pansep screen. Similarly, the optimized new design gMax cyclone performance obtained for near 325 mesh particle size classification is significantly better than the conventional cyclone design. The undersize and over size bypass amounts were reduced from nearly 32% to 12% and 3% to nil, respectively. Both undersize and oversize bypass amount were completely eliminated by the use of the Cyclowash. However, the injection of high amount elutriation water to minimize the undersize bypass increased the d50c separation size. The Pansep screening achieved a near perfect efficiency value of 98% to 99% for both 100 and 325 mesh size separation. A cost-benefit analysis conducted for one Illinois coal preparation plant suggests that the increased capital and operating cost of Pansep screening technology for 100 mesh size separation will be far offset by the additional revenue generated from preventing the fine coal loss due to the inefficiency at the 15 inch cyclone.
EXECUTIVE SUMMARY The performance from many Illinois coal preparation plant could be improved by enhancing the performance from the fine coal cleaning circuit. The integration of advanced technologies for achieving high efficient cleaning and dewatering performance in the coal cleaning plants may be a sure way of improving the fine coal circuit performance. However, by simply improving the size classification efficiency also a significant additional benefit can be realized from the existing cleaning technologies being used in the coal preparation plants. Thus, the main objective of this study was to evaluate state of the art screening and classification technologies to improve fine coal sizing performance. The new technologies studied in this investigation include the Pansep screening technology, Krebs’ new design gMax cyclone and the Cyclowash attachment with an industrial size cyclone. The Pansep screen’s performance has been evaluated for 100 mesh particle size separation and compared with the performances of sieve bend and 15 inch cyclones operating in an Illinois coal preparation plant. The performances of 6-inch gMax cyclone with and without the Cyclowash attachment and the Pansep screen have been evaluated for 325 mesh size separation and compared with the 6-inch cyclone of conventional design operating in an Illinois coal preparation plant. Statistically designed experimental programs were pursued for quick identification of the key operating parameters and the subsequent optimization of these operating parameters to achieve target classification performances. In addition, the statistical data analysis also intended to study the operating parameter effects on the various classification performance parameters. This experimental study was conducted at the Illinois Coal Development Park utilizing a Pansep screen having 0.5 m2 of screening surface area, 15 cm (6 inch) diameter g-Max classifying cyclone and a KH-3 Cyclowash. A 25-2 fractional factorial design and two 3-factor Box Behnken designs were conducted for optimizing the Pansep screen performance for 100 mesh and 325 mesh size separations. Similarly a 3-factor Box Behnken design was conducted to optimize the gMax cyclone performance, whereas 5-factor Plackett-Burman design and 4-factor Box Behnken design experimental programs were conducted for identifying and optimizing the key process parameters for the Cyclowash. The optimized Pansep screen performance was found to be significantly better than the performance of 15-inch cyclone and sieve bend for classifying the minus 1 mm particle size slurry at 100 mesh. The undersize bypass was reduced from nearly 27% with 15-inch cyclone to nearly 2% with the Pansep screen. The corresponding improvement in the sharpness of size separation is indicated by an improvement in the corrected selectivity index and imperfection values from 0.51 and 0.33 to 0.23 and 0.64, respectively. An overall particle size separation efficiency of 57% obtained from the 15-inch Cyclone and 44% obtained from the VariSieve were improved to 98% by the Pansep screen. The improved size separation efficiency was achieved mainly due to the decreased undersize bypass to the overflow stream in comparison to the VariSieve, whereas both decreased
3
undersize bypass and sharper separation caused the efficiency enhancement in comparison to the 15-inch cyclone. The optimized new design gMax cyclone performance obtained for 325-mesh classification was significantly better than the conventional cyclone design used in the plants. The undersize and oversize bypass amounts were reduced from nearly 27% to 12% and 3% to nil respectively. Both undersize and oversize bypass were completely eliminated by the use of the Cyclowash, while improving the imperfection and selectivity index values from 0.34 and 0.56, respectively, to 0.22 and 0.64, respectively. However, the injection of high amount elutriation water to improve the Cyclowash performance also increased the separation size. The Pansep screen achieved excellent overall size separation efficiency of nearly 99% due to negligible amount of bypass materials and sharper separations. An economic analysis was conducted to estimate the potential plant profitability achievable due to the integration of Pansep technology in place of 15 inch Cyclones to an Illinois coal preparation plant treating nearly 370 tph of coal in its fine circuit. Due to the inefficiency at the classifying Cyclone, an estimated 59 tph of minus 100 mesh size coal having an ash content of nearly 40% is directly lost to the plant thickener. This fine coal loss can be potentially reduced to 3 tph by using Pansep screens. The resulting increased coal recovery of 56 tph may generate additional annual revenue of $ 6.7 million dollars considering nearly 7000 working hours per year and a selling price of $1.05/mBtu. More than $ 6 million dollars of additional revenue will far offset the increased annual capital and operating cost of $136, 000 incurred due to the installation of Pansep screens in the plant in place of the existing 15-inch cyclones. By replacing the Sieve bends and VariSieves used for desliming the spiral product by the Pansep screens will potentially decrease the ash content of the screen overflow clean coal product. This will not only improve the overall quality of the clean coal from the fine coal circuit, but also aid the dewatering process due the reduced ultrafine ash material content of the dewatering feed slurry. The 6-inch diameter Cyclone banks used to deslime the minus 100-mesh particle size fraction in the coal preparation plant produce very poor classification performance. Nearly 54% of the undersize materials present in the feed are misplaced to the Cyclone underflow and nearly 18% of the oversize material is lost to the overflow. The presence of extremely high amount of misplaced ultrafine materials having a very high ash content is highly detrimental to the conventional flotation process. In addition, the commercialization of the enhanced gravity separators to effectively clean the 28 x 325 mesh size fraction will warrant a significantly more efficient 325-mesh size classification. The Pansep screen providing nearly 99% overall size separation efficiency may prove to be the technology to solve the ultrafine classification problem. However, further investigation is recommended to improve the throughput capacity of the Pansep screen while maintaining high efficient size classification.
1
OBJECTIVES The overall goal of this project was to demonstrate two state of the art coal screening and classification technologies to improve the quality and quantity of the fine clean coal product and thus, increase plant profitability. The technologies evaluated for achieving 100 mesh and 325 mesh size separations include Pansep screening technologies, Krebs’ new design gMax cyclone and the Cyclowash. The specific project objectives were: 1. To evaluate the newly developed Pansep Screening Technology for achieving fine
(100 mesh) and ultrafine (325 mesh) particle size separations. The target misplacements for the 100 mesh and 325 mesh particle size separations were less than 5% and 10%, respectively.
2. To evaluate the Krebs’ new design 6 inch diameter gMax cyclone and Cyclowash
units for their desliming performances at 325 mesh. The target misplacement was less than 10%.
3. To compare the performance obtained from the traditional screening and
classification units operating in an Illinois coal preparation plant with that of Pansep screen and Cyclowash system.
4. To conduct an economic analysis for commercializing the new coal sizing
technologies and estimating the resulting plant profitability.
INTRODUCTION AND BACKGROUND
The physical separation processes utilized in coal preparation plants to obtain a desired Btu recovery and pyrite rejection are effective only for a specified particle size range. Beyond the optimum size range the separation efficiency of the processes are affected drastically. For example, the conventional flotation process achieves an effective separation in the 60 x 325 mesh particle size range. The presence of finer clays (minus 325 mesh) affects the separation process and results in a decreased product quality due to the hydraulic entrainment problem. Many preparation plant operators complain that the performance from their flotation banks suffer due to the presence of undesirable ultrafine clay particles in their flotation feed even after undergoing a desliming classification process. In addition, presence of coal particles of in-appropriate size also causes a significant loss of clean coal to the reject stream. For example, the spiral banks in a coal preparation plant achieve an efficient separation in the 16 x 100 mesh particle size range. Most of the finer (minus100 mesh) materials report to the fine coal product stream and is ultimately rejected to the thickener as the sieve-bend underflow, thus causing a loss of recoverable fine clean coal. To improve the performance from fine coal circuit, several enhanced gravity separators have been developed over the past several years including Falcon Concentrator, which was developed at SIU with the research funds received from Illinois Department of Commerce and Community Affairs (IDCCA) and Illinois Clean Coal Institute (ICCI). A
2
low cost and high capacity enhanced gravity separator like Falcon Concentrator could be used very effectively to reject the coal pyrites while achieving a high Btu recovery thus lowering the sulfur dioxide (SO2) emission potential of the high sulfur Illinois coal. However, Falcon concentrator is known to perform effectively only over a particle size range of 16 x 325 mesh and its performance deteriorates sharply beyond this particle size range. Thus, a precise 325-mesh particle size-cut is a pre-requisite for a successful commercialization of Falcon concentrator as well as other enhanced gravity concentrators. The fine coal sizing technologies used in the existing coal preparation plants include vibratory screens, sieve bends and classifying cyclones. Vibratory Screens : High frequency vibratory screens allow maximum repeated incidence of particles to the screening surfaces increasing the probability of undersize materials to pass through the screen opening. Vertical vibration is induced either by the rotation of a mechanical reciprocating device applied to the casing or by electrical devices operating directly on the screen, as shown in Figure 1 (a) of Appendix-I. Although extensively used in the coal industry, the high frequency vibratory screens have numerous drawbacks, which includes inefficiency, short life of screen mesh due to shaking and the continuous feeding into one part of the screen, high maintenance cost, excessive noise and a large foot print. Sieve Bend: The most beneficial feature provided by the sieve bend is its hydraulic capacity per foot area. Since the fine particle streams in a coal preparation plants are associated with a rather large water content resulting in excessively high volumetric flow rates, sieve bends find a wide application in the fine coal cleaning circuit of a coal preparation plant. Krebs VariSieveTM, shown in Figure 1 (c) of Appendix-I is an improved sieve bend design. However, a significant amount of the fine ash material typically still reports along with the sieve bend overflow, thus lowering the product quality. Screen blinding, lack of open area due to build-up of material, high maintenance cost and mesh wear commonly result in sub-par performance for the sieve-bends (Buisman and Reyneke, 2000) Classifying Cyclones: In the conventional cyclone design, shown in Figure 1 (b) of Appendix-I, the fluid enters the cylindrical section of the cyclone tangentially and an upward vortex is created at the center of the cyclone due to the swirling motion of the fluid. The solid particles in the fluid are subjected to a centrifugal field by which the larger particles are moved to the cyclone wall at a faster rate than the smaller particles. This difference in the lateral position of the smaller and larger particles inside the cyclone causes the former to report to the overflow with the vortex and the latter to report to the underflow.
3
Classifying cyclones of varying sizes are used for fine and ultrafine classification in Illinois coal preparation plants. The minus1mm feed coal stream is traditionally classified by using 15 inch diameter cyclones to prepare a 1mm x 100 mesh fraction to be treated by spirals and a minus100 mesh fraction as a feed to the desliming (6 inch diameter) cyclones. The desliming cyclones provide a nominally 100 x 325 mesh coal fraction to be treated in the flotation bank and a high ash overflow (minus325 mesh) to be discarded into the thickener. Classifying cyclones are very popular in the coal industry due to their high capacity. However, the cyclones suffer from a significant amount of particle bypass (as high as 20 to 30%) to the underflow. The inefficiency at the 15 inch cyclone dilutes the spiral feed with unwanted minus100 mesh coal fines, which are ultimately rejected as the sieve bend underflow, causing loss of valuable clean coal. The ultrafine particle by-pass at the desliming cyclones produces a flotation feed consisting of a significant amount of unwanted ultrafine ash material, which is detrimental to the conventional flotation performance. This study aimed at demonstrating two new technologies as suitable alternatives to the currently used relatively inferior fine coal sizing technologies in the Illinois coal preparation plants. The fine coal cleaning performances resulting from the improved sizing has been calculated and the resulting plant profitability evaluated. The results of these technical and economic evaluations are the subject matter of this report. For the convenience of the readers, a list of the original tasks proposed is provided as follows: Task 1: Sample Collection and Characterization: Three different samples from various process streams of American Coal Company will be collected to be used in this study. The processing streams will include:
1. 15-inch classifying cyclone feed (nominally –16 mesh) slurry. 2. Spiral clean coal product (sieve bend feed slurry) 3. 6-inch desliming cyclone feed (nominally –100 mesh) slurry.
The samples will be collected in 55 gallon barrels and transferred to the pilot-plant research facility at SIU. Before starting the experimental program the samples will be homogenized in a large tank to collect representative samples for size-by-size weight, ash, sulfur and Btu analysis. Task 2: Pansep Screen Evaluation: To conduct a scientific study and optimize the screening performance of newly developed Pansep Screening technology for both fine (100 mesh) and ultrafine (325 mesh) size cuts, this research task has been subdivided into following six sub tasks. Task 2.1: Procurement and Installation of the Equipment at SIUC During the initial two months of the project initiation a continuously operating single deck Mini-Pansep Screen will be procured and installed in the pilot-plant research facility of SIU. The technical personnel from the Dewar Inc. will provide help during the
4
installation and initial run of the machine to train the research staff at SIU. A recirculation feed arrangement equipped with a pump and sump will be made to run the screening device in a continuous mode. Task 2.2: Exploratory Test Program to Determine the Key Process Parameters Pansep Screening technology has a variety of process (both design and operating) parameters that needs to be studied to determine the key parameters. After conducting few preliminary experiments, some of the parameters will be selected and 12 experiments will be conducted using a Placket & Burmen experimental design to statistically evaluate the key process parameters according to the order of their importance. Based on this study the key process parameters will be identified to further optimize the performance in task 2.3 Task 2.3: Performance Optimization using the Key Process Parameters for an efficient
100-mesh particle size cut. Upon identification of the key process parameters a 3-factor level Box-Behnken experimental design will be pursued to further optimize the process parameters. Depending on whether 3 or 4 key parameters are selected, 17 or 29 experiments will be conducted using a standard combination of operating parameter values to generate the required data for statistical analysis. The response performance variables that will be studied in this test program may include Cut size (d50), particle by-pass (α) and the imperfection (I). The target screening performance will be the lowest I and α and highest SI at a desired d50 value of 100 mesh. An optimum experimental region will be determined to achieve this target screening performance. Five additional experiments will be conducted to validate the model predictions and also check the repeatability of the device. Task 2.4: Performance Optimization using the Key Process Parameters for an Efficient
325-mesh particle size cut. The same exercise as described in Sub task 2.3 will be conducted to achieve a d50 value of 325 mesh with the lowest possible I and α values and highest possible SI values. Task 2.5: Evaluation of the Existing Plant Screening Performance for both 100 mesh and
325 mesh Screening To evaluate the performance of the competing unit operations operating in the American Coal’s Galatia preparation plant, five gallon bucket samples will be collected around the 15 inch classifying cyclone, sieve bend and the 6 inch desliming cyclones. Size-by-size analysis of each sample will be conducted in the laboratory to generate size partition curve, d50, I, SI, and α values for the existing unit operations in the plant.
5
Task 2.6: Comparison of Performance A performance comparison will be conducted to show the improvement that can be potentially resulted by replacing Pansep screening unit in place of 15 inch classifying cyclones, sieve bends and the 6 inch desliming classifying cyclones. Task 3: New Design Cyclowash System Task 3.1: Installation of a 6 inch Cyclone Circuit Between the 6th and 7th project months a 6-inch classifying cyclone with the new design Cyclowash attachment supplied by the Kreb’s Engineers will be installed in the pilot-plant research facility of SIU. The personnel from the Krebs will provide technical help during the installation and set-up the of the cyclone circuit. A recirculation feed arrangement equipped with a pump and sump will be made to run the system in a continuous mode. Task 3.2: Optimization of the New Design Cyclowash attached to a 6 inch Cyclone The Cylcowash optimization study will examine the effects of the key process parameters. Based on several exploratory tests and the results obtained from an on-going Cyclowash study the key process parameters will be identified. A 3-factor level Box-Behnken experimental design will be pursued to further optimize the process parameters. Depending on whether 3 or 4 key parameters are selected, 17 or 29 experiments will be conducted using a standard combination of operating parameter values to generate the required data for statistical analysis. The response performance variables that will be studied in this test program may include Cut size (d50), particle by-pass (α) and the imperfection (I). The target classification performance will be the lowest I and α at a desired d50 value of 325 mesh. An optimum experimental region will be determined to achieve this target screening performance. Five additional experiments will be conducted to validate the model predictions and also check the repeatability of the device. Task 3.3: Comparison of Results The Cyclowash results will be compared with that obtained from the Pansep screen for the 325-mesh size cut and the plant desliming cyclones. Task 4: Economic Analysis An economic analysis will be conducted in direct consultation with the Dewar Inc.’s personnel and the American coal company personnel to determine the screening capital and operating cost both for 100 mesh and 325-mesh size cuts. Similar exercise will be conducted in direct consultation with the Krebs Engineers to evaluate classification capital and operating costs for the classification with the new design Cyclowash unit. These costs will be compared with that of the competing conventional technologies used in the plants. An overall plant profitability calculation will be conducted using these
6
analysis and the incremental improvement in the plant performance that will be resulted from the commercialization of these new coal sizing devices in a typical Illinois coal preparation plant Task 5: Report Preparation: Monthly progress reports and a Mid-year technical and management report will be submitted throughout the duration of this project as per the guidelines given by Illinois Clean Coal Institute. After the completion of the project, a final report containing a summary of all test results and data analyses will be submitted. The final report will also provide recommendations and proposed outline of the Phase II plant demonstration study.
EXPERIMENTAL
Sample Collection Three different samples from various process streams of an Illinois coal preparation plant was were collected for this study. These processing streams included:
1. 15-inch classifying cyclone feed (nominally minus16 mesh) slurry. 2. Spiral clean coal product (sieve bend feed slurry) 3. 6-inch desliming cyclone feed (nominally minus100 mesh) slurry.
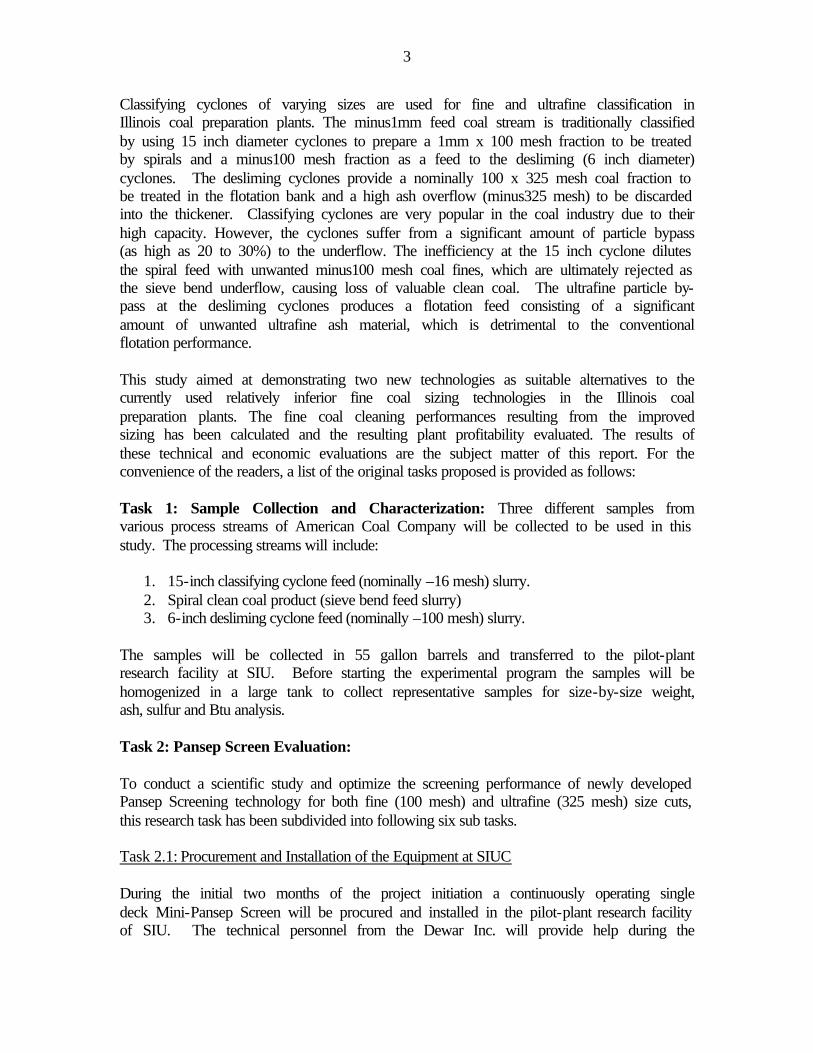
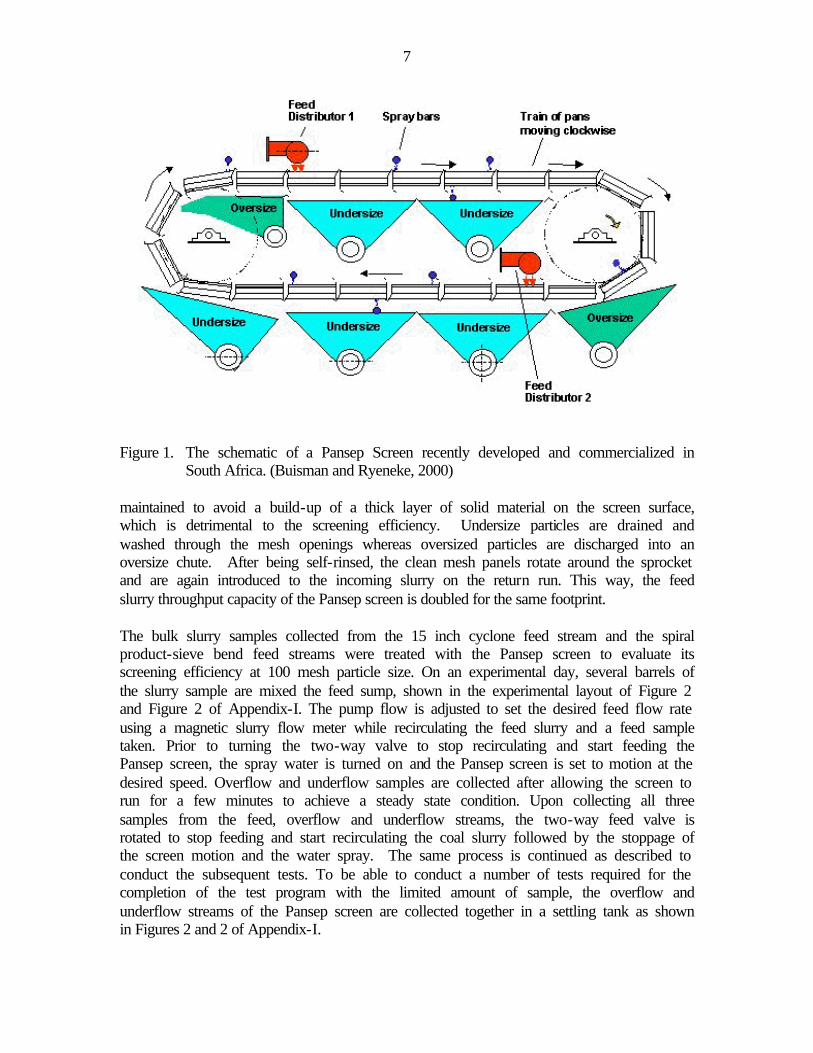
A total of 50 fifty-five gallon barrels of samples were collected and transferred to the pilot-plant research facility at SIU. Before starting the experimental program the samples were homogenized in a large tank to collect representative samples for size-by-size weight, ash, sulfur and Btu analysis. Pansep Screen Evaluation: Experimental Layout and Procedure A novel fine particle screening technology known as the Pansep Screen has been recently developed and commercialized by the Particle Separation Systems in South Africa. Figure 1 shows the schematic of a Pansep Screen. The Pansep principle incorporates a system of separate non-flexing screen cloths each tensioned within its own frame (Brown et al., 2000 and Ryeneke, 2000). The series of segmented pans are mechanically linked together to form a “big chain”, which is rotated by a drive-motor at a desirable speed. The essential advantage of the Pansep screen is that the screen cloth could effectively be of any type appropriate to the duty required, without consideration of a need for flexibility or resilience to fatigue. The screen selection is therefore governed by the separation characteristics required, including open area ratio, accuracy and shape of apertures. A consequent benefit was also the facility to use the return pans for screening operations, by using the reverse side after an intermediate wash. This effectively doubles the capacity for a given screen size. As shown in Figure 1, the feed slurry is introduced to the moving screen panels through a uniform feed distributor. The screening of the undersize material is assisted by the spray
7
Figure 1. The schematic of a Pansep Screen recently developed and commercialized in
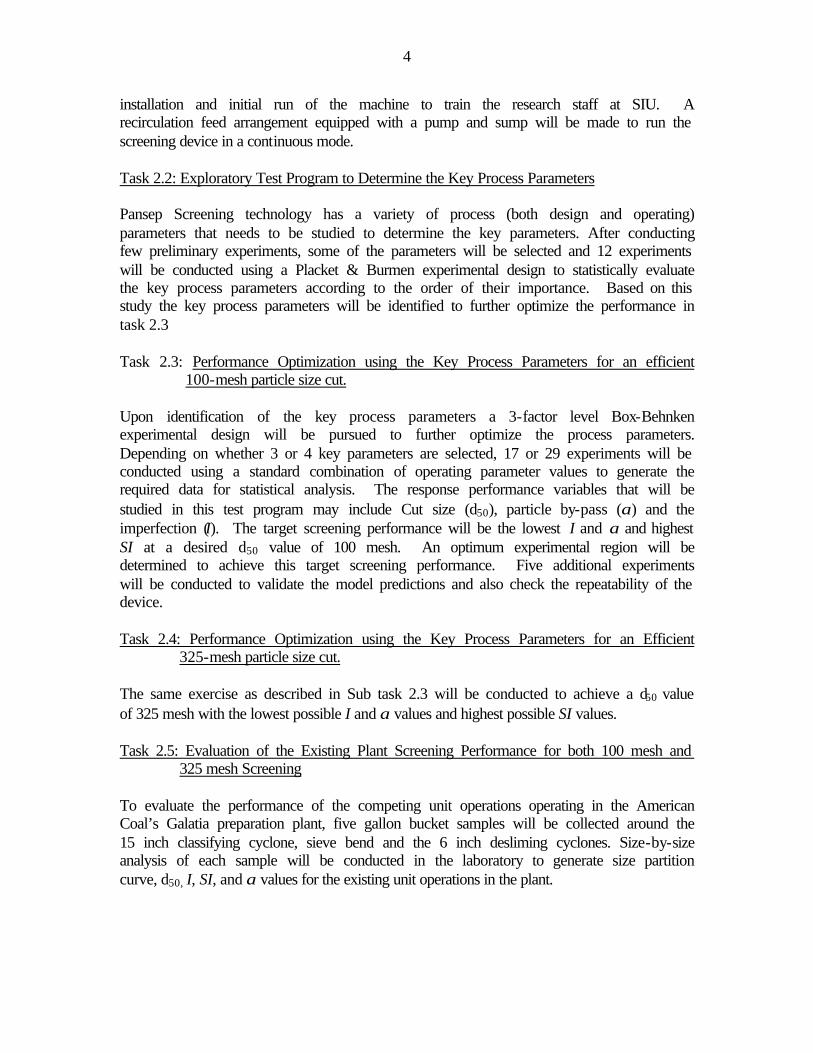
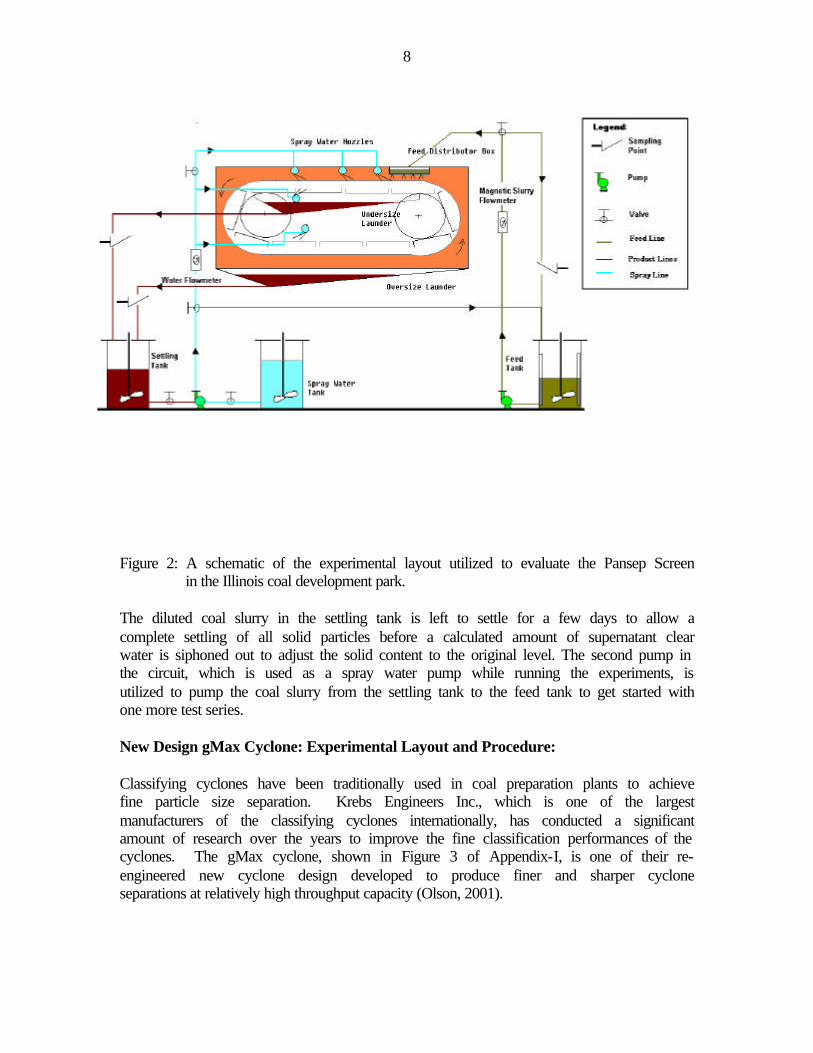
South Africa. (Buisman and Ryeneke, 2000) maintained to avoid a build-up of a thick layer of solid material on the screen surface, which is detrimental to the screening efficiency. Undersize particles are drained and washed through the mesh openings whereas oversized particles are discharged into an oversize chute. After being self-rinsed, the clean mesh panels rotate around the sprocket and are again introduced to the incoming slurry on the return run. This way, the feed slurry throughput capacity of the Pansep screen is doubled for the same footprint. The bulk slurry samples collected from the 15 inch cyclone feed stream and the spiral product-sieve bend feed streams were treated with the Pansep screen to evaluate its screening efficiency at 100 mesh particle size. On an experimental day, several barrels of the slurry sample are mixed the feed sump, shown in the experimental layout of Figure 2 and Figure 2 of Appendix-I. The pump flow is adjusted to set the desired feed flow rate using a magnetic slurry flow meter while recirculating the feed slurry and a feed sample taken. Prior to turning the two-way valve to stop recirculating and start feeding the Pansep screen, the spray water is turned on and the Pansep screen is set to motion at the desired speed. Overflow and underflow samples are collected after allowing the screen to run for a few minutes to achieve a steady state condition. Upon collecting all three samples from the feed, overflow and underflow streams, the two-way feed valve is rotated to stop feeding and start recirculating the coal slurry followed by the stoppage of the screen motion and the water spray. The same process is continued as described to conduct the subsequent tests. To be able to conduct a number of tests required for the completion of the test program with the limited amount of sample, the overflow and underflow streams of the Pansep screen are collected together in a settling tank as shown in Figures 2 and 2 of Appendix-I.
8
Figure 2: A schematic of the experimental layout utilized to evaluate the Pansep Screen
in the Illinois coal development park. The diluted coal slurry in the settling tank is left to settle for a few days to allow a complete settling of all solid particles before a calculated amount of supernatant clear water is siphoned out to adjust the solid content to the original level. The second pump in the circuit, which is used as a spray water pump while running the experiments, is utilized to pump the coal slurry from the settling tank to the feed tank to get started with one more test series. New Design gMax Cyclone: Experimental Layout and Procedure: Classifying cyclones have been traditionally used in coal preparation plants to achieve fine particle size separation. Krebs Engineers Inc., which is one of the largest manufacturers of the classifying cyclones internationally, has conducted a significant amount of research over the years to improve the fine classification performances of the cyclones. The gMax cyclone, shown in Figure 3 of Appendix-I, is one of their re-engineered new cyclone design developed to produce finer and sharper cyclone separations at relatively high throughput capacity (Olson, 2001).
9
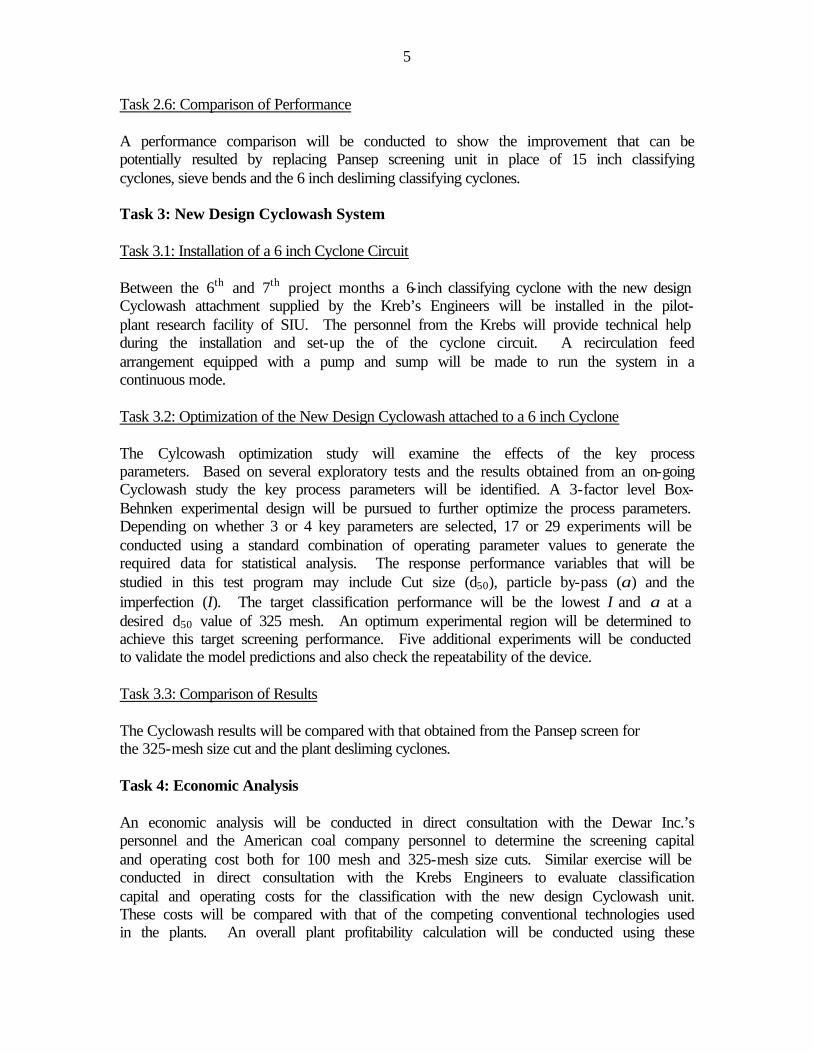
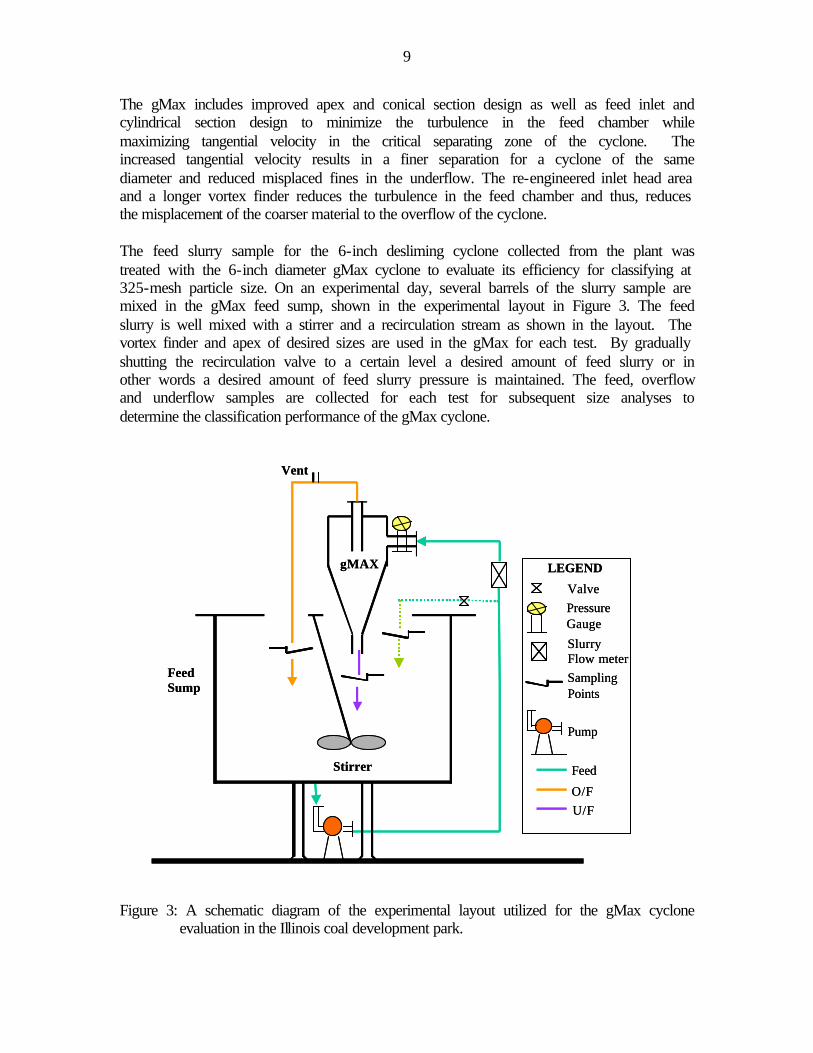
The gMax includes improved apex and conical section design as well as feed inlet and cylindrical section design to minimize the turbulence in the feed chamber while maximizing tangential velocity in the critical separating zone of the cyclone. The increased tangential velocity results in a finer separation for a cyclone of the same diameter and reduced misplaced fines in the underflow. The re-engineered inlet head area and a longer vortex finder reduces the turbulence in the feed chamber and thus, reduces the misplacement of the coarser material to the overflow of the cyclone. The feed slurry sample for the 6-inch desliming cyclone collected from the plant was treated with the 6-inch diameter gMax cyclone to evaluate its efficiency for classifying at 325-mesh particle size. On an experimental day, several barrels of the slurry sample are mixed in the gMax feed sump, shown in the experimental layout in Figure 3. The feed slurry is well mixed with a stirrer and a recirculation stream as shown in the layout. The vortex finder and apex of desired sizes are used in the gMax for each test. By gradually shutting the recirculation valve to a certain level a desired amount of feed slurry or in other words a desired amount of feed slurry pressure is maintained. The feed, overflow and underflow samples are collected for each test for subsequent size analyses to determine the classification performance of the gMax cyclone.
Figure 3: A schematic diagram of the experimental layout utilized for the gMax cyclone
evaluation in the Illinois coal development park.
LEGEND
Pump
SamplingPoints
SlurryFlow meter
PressureGauge
Valve
FeedSump
Stirrer Feed
O/FU/F
gMAX
Vent
LEGEND
Pump
SamplingPoints
SlurryFlow meter
PressureGauge
Valve
FeedSump
Stirrer Feed
O/FU/F
gMAX
Vent
10
Cyclowash Test Layout and Procedure:
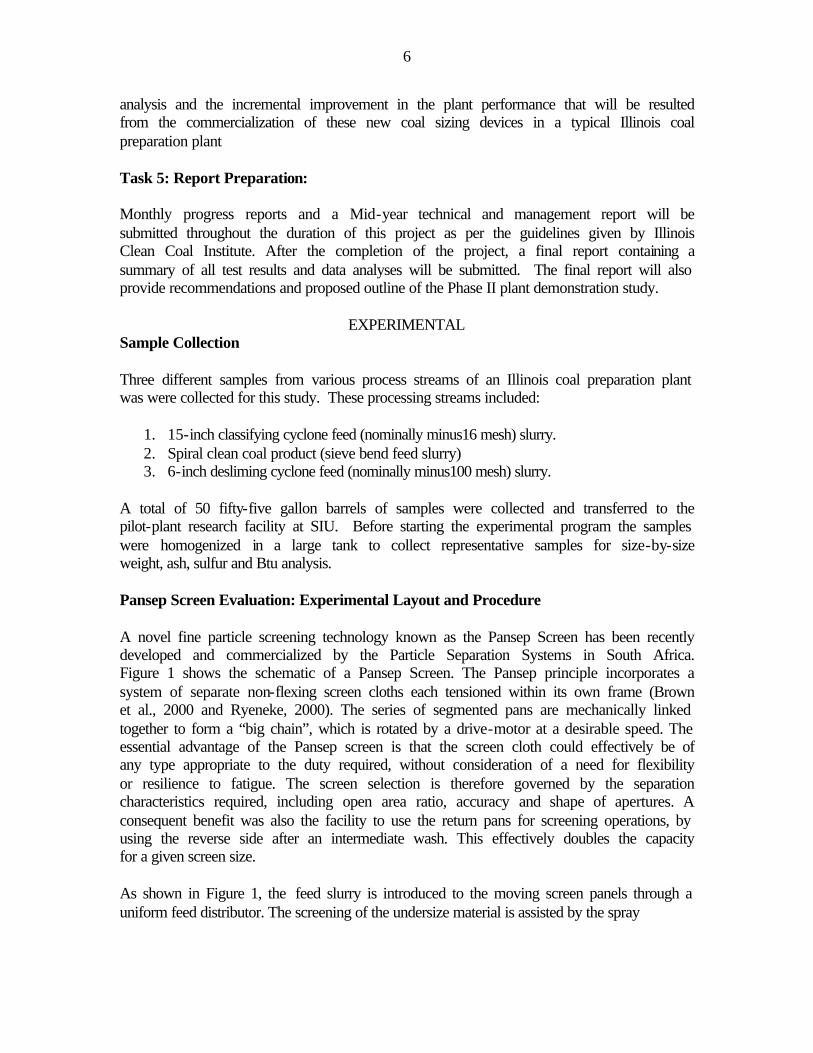
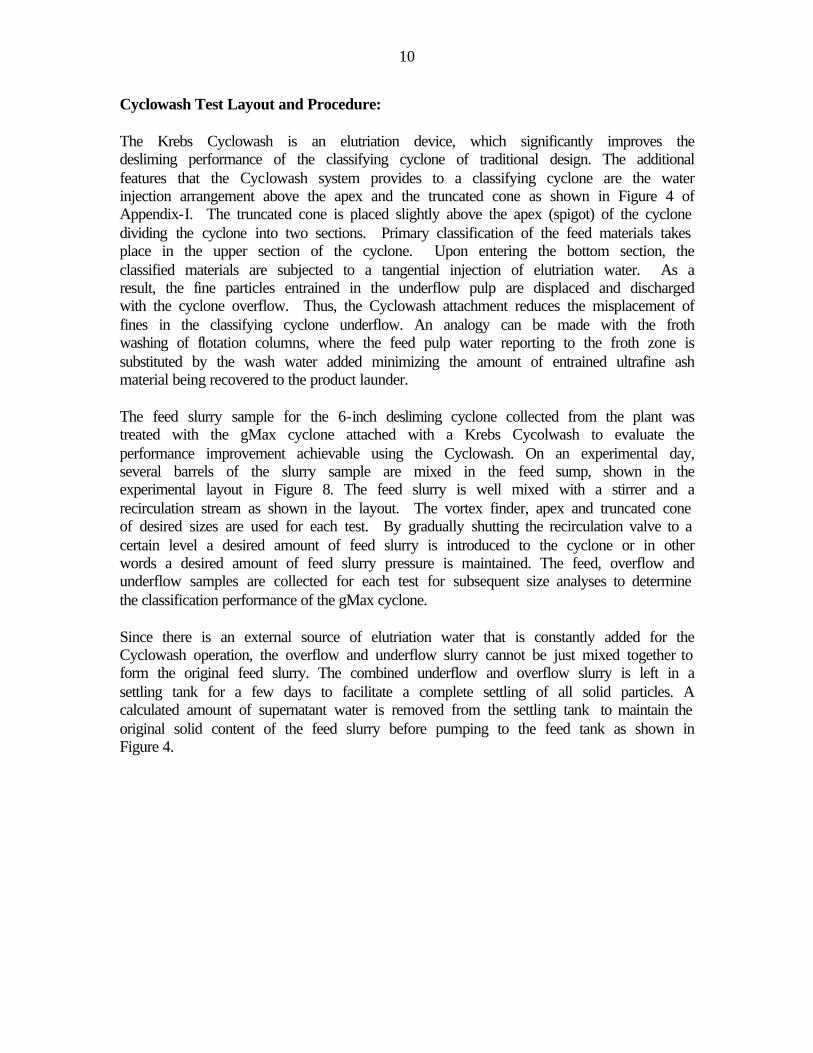
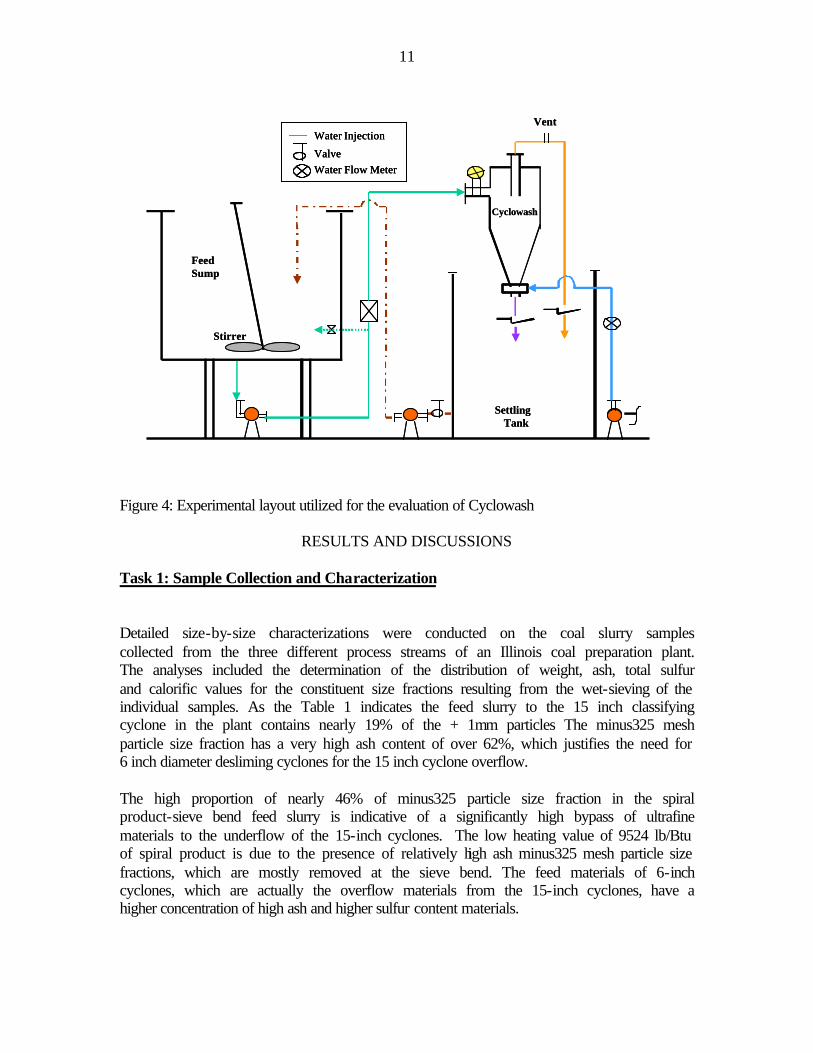
The Krebs Cyclowash is an elutriation device, which significantly improves the desliming performance of the classifying cyclone of traditional design. The additional features that the Cyclowash system provides to a classifying cyclone are the water injection arrangement above the apex and the truncated cone as shown in Figure 4 of Appendix-I. The truncated cone is placed slightly above the apex (spigot) of the cyclone dividing the cyclone into two sections. Primary classification of the feed materials takes place in the upper section of the cyclone. Upon entering the bottom section, the classified materials are subjected to a tangential injection of elutriation water. As a result, the fine particles entrained in the underflow pulp are displaced and discharged with the cyclone overflow. Thus, the Cyclowash attachment reduces the misplacement of fines in the classifying cyclone underflow. An analogy can be made with the froth washing of flotation columns, where the feed pulp water reporting to the froth zone is substituted by the wash water added minimizing the amount of entrained ultrafine ash material being recovered to the product launder. The feed slurry sample for the 6-inch desliming cyclone collected from the plant was treated with the gMax cyclone attached with a Krebs Cycolwash to evaluate the performance improvement achievable using the Cyclowash. On an experimental day, several barrels of the slurry sample are mixed in the feed sump, shown in the experimental layout in Figure 8. The feed slurry is well mixed with a stirrer and a recirculation stream as shown in the layout. The vortex finder, apex and truncated cone of desired sizes are used for each test. By gradually shutting the recirculation valve to a certain level a desired amount of feed slurry is introduced to the cyclone or in other words a desired amount of feed slurry pressure is maintained. The feed, overflow and underflow samples are collected for each test for subsequent size analyses to determine the classification performance of the gMax cyclone. Since there is an external source of elutriation water that is constantly added for the Cyclowash operation, the overflow and underflow slurry cannot be just mixed together to form the original feed slurry. The combined underflow and overflow slurry is left in a settling tank for a few days to facilitate a complete settling of all solid particles. A calculated amount of supernatant water is removed from the settling tank to maintain the original solid content of the feed slurry before pumping to the feed tank as shown in Figure 4.
11
Figure 4: Experimental layout utilized for the evaluation of Cyclowash
RESULTS AND DISCUSSIONS
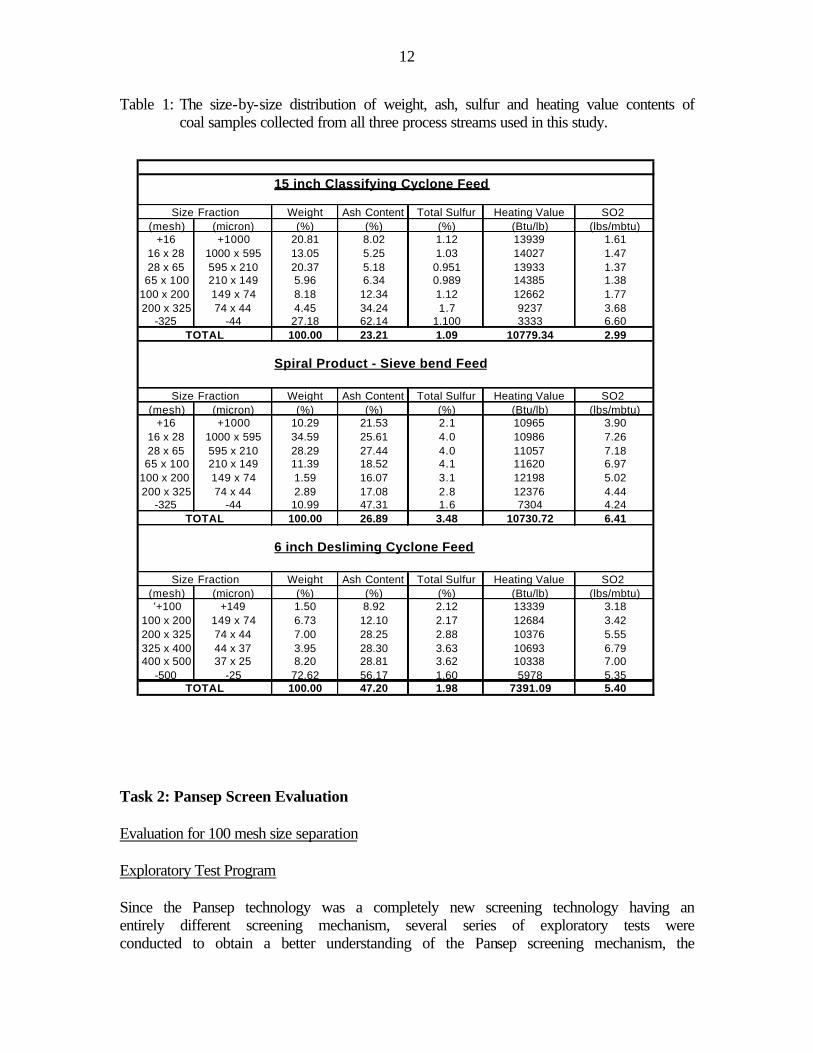
Task 1: Sample Collection and Characterization Detailed size-by-size characterizations were conducted on the coal slurry samples collected from the three different process streams of an Illinois coal preparation plant. The analyses included the determination of the distribution of weight, ash, total sulfur and calorific values for the constituent size fractions resulting from the wet-sieving of the individual samples. As the Table 1 indicates the feed slurry to the 15 inch classifying cyclone in the plant contains nearly 19% of the + 1mm particles The minus325 mesh particle size fraction has a very high ash content of over 62%, which justifies the need for 6 inch diameter desliming cyclones for the 15 inch cyclone overflow. The high proportion of nearly 46% of minus325 particle size fraction in the spiral product-sieve bend feed slurry is indicative of a significantly high bypass of ultrafine materials to the underflow of the 15-inch cyclones. The low heating value of 9524 lb/Btu of spiral product is due to the presence of relatively high ash minus325 mesh particle size fractions, which are mostly removed at the sieve bend. The feed materials of 6-inch cyclones, which are actually the overflow materials from the 15-inch cyclones, have a higher concentration of high ash and higher sulfur content materials.
Water Injection
ValveWater Flow Meter
SettlingTank
FeedSump
Stirrer
Cyclowash
VentWater Injection
ValveWater Flow Meter
Water Injection
ValveWater Flow Meter
SettlingTank
FeedSump
Stirrer
Cyclowash
Vent
12
Table 1: The size-by-size distribution of weight, ash, sulfur and heating value contents of coal samples collected from all three process streams used in this study.
Task 2: Pansep Screen Evaluation Evaluation for 100 mesh size separation Exploratory Test Program Since the Pansep technology was a completely new screening technology having an entirely different screening mechanism, several series of exploratory tests were conducted to obtain a better understanding of the Pansep screening mechanism, the
15 inch Classifying Cyclone Feed
Weight Ash Content Total Sulfur Heating Value SO2 (mesh) (micron) (%) (%) (%) (Btu/lb) (lbs/mbtu)
+16 +1000 20.81 8.02 1.12 13939 1.6116 x 28 1000 x 595 13.05 5.25 1.03 14027 1.4728 x 65 595 x 210 20.37 5.18 0.951 13933 1.3765 x 100 210 x 149 5.96 6.34 0.989 14385 1.38
100 x 200 149 x 74 8.18 12.34 1.12 12662 1.77200 x 325 74 x 44 4.45 34.24 1.7 9237 3.68
-325 -44 27.18 62.14 1.100 3333 6.60100.00 23.21 1.09 10779.34 2.99
Spiral Product - Sieve bend Feed
Weight Ash Content Total Sulfur Heating Value SO2 (mesh) (micron) (%) (%) (%) (Btu/lb) (lbs/mbtu)
+16 +1000 10.29 21.53 2.1 10965 3.9016 x 28 1000 x 595 34.59 25.61 4.0 10986 7.2628 x 65 595 x 210 28.29 27.44 4.0 11057 7.1865 x 100 210 x 149 11.39 18.52 4.1 11620 6.97
100 x 200 149 x 74 1.59 16.07 3.1 12198 5.02200 x 325 74 x 44 2.89 17.08 2.8 12376 4.44
-325 -44 10.99 47.31 1.6 7304 4.24100.00 26.89 3.48 10730.72 6.41
6 inch Desliming Cyclone Feed
Weight Ash Content Total Sulfur Heating Value SO2 (mesh) (micron) (%) (%) (%) (Btu/lb) (lbs/mbtu) '+100 +149 1.50 8.92 2.12 13339 3.18
100 x 200 149 x 74 6.73 12.10 2.17 12684 3.42200 x 325 74 x 44 7.00 28.25 2.88 10376 5.55325 x 400 44 x 37 3.95 28.30 3.63 10693 6.79400 x 500 37 x 25 8.20 28.81 3.62 10338 7.00
-500 -25 72.62 56.17 1.60 5978 5.35100.00 47.20 1.98 7391.09 5.40
Size Fraction
TOTAL
Size Fraction
TOTAL
Size Fraction
TOTAL
13
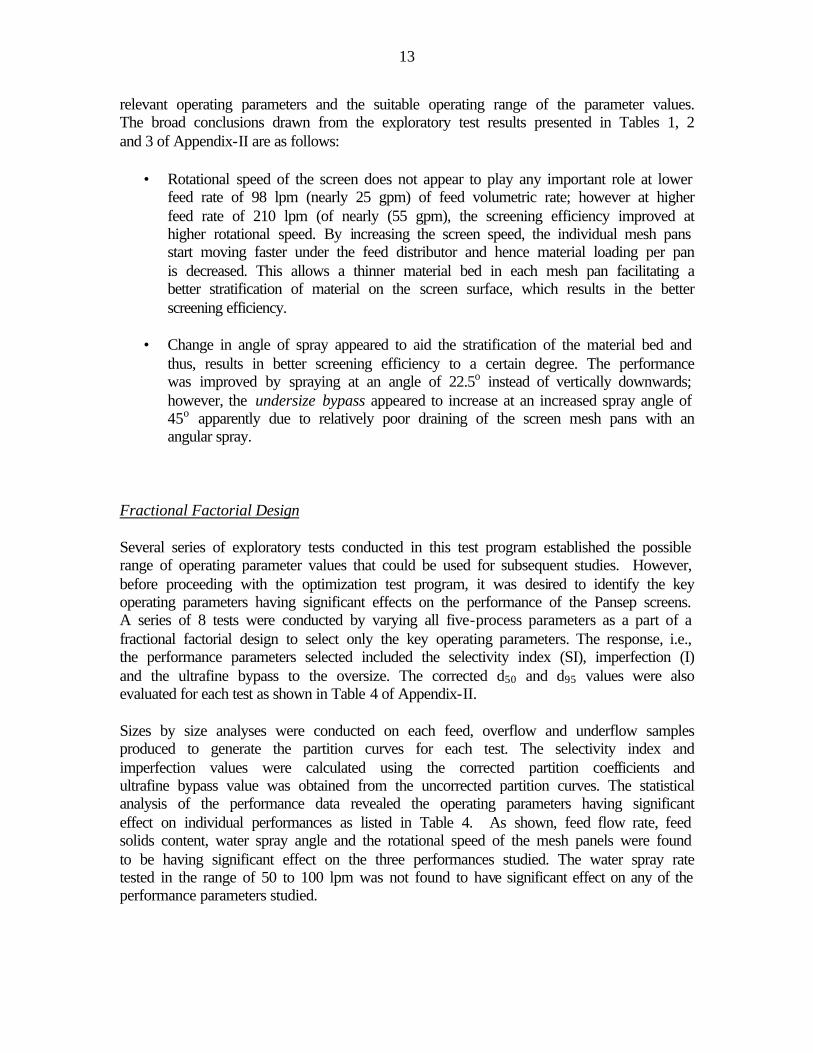
relevant operating parameters and the suitable operating range of the parameter values. The broad conclusions drawn from the exploratory test results presented in Tables 1, 2 and 3 of Appendix-II are as follows:
• Rotational speed of the screen does not appear to play any important role at lower feed rate of 98 lpm (nearly 25 gpm) of feed volumetric rate; however at higher feed rate of 210 lpm (of nearly (55 gpm), the screening efficiency improved at higher rotational speed. By increasing the screen speed, the individual mesh pans start moving faster under the feed distributor and hence material loading per pan is decreased. This allows a thinner material bed in each mesh pan facilitating a better stratification of material on the screen surface, which results in the better screening efficiency.
• Change in angle of spray appeared to aid the stratification of the material bed and
thus, results in better screening efficiency to a certain degree. The performance was improved by spraying at an angle of 22.5o instead of vertically downwards; however, the undersize bypass appeared to increase at an increased spray angle of 45o apparently due to relatively poor draining of the screen mesh pans with an angular spray.
Fractional Factorial Design Several series of exploratory tests conducted in this test program established the possible range of operating parameter values that could be used for subsequent studies. However, before proceeding with the optimization test program, it was desired to identify the key operating parameters having significant effects on the performance of the Pansep screens. A series of 8 tests were conducted by varying all five-process parameters as a part of a fractional factorial design to select only the key operating parameters. The response, i.e., the performance parameters selected included the selectivity index (SI), imperfection (I) and the ultrafine bypass to the oversize. The corrected d50 and d95 values were also evaluated for each test as shown in Table 4 of Appendix-II. Sizes by size analyses were conducted on each feed, overflow and underflow samples produced to generate the partition curves for each test. The selectivity index and imperfection values were calculated using the corrected partition coefficients and ultrafine bypass value was obtained from the uncorrected partition curves. The statistical analysis of the performance data revealed the operating parameters having significant effect on individual performances as listed in Table 4. As shown, feed flow rate, feed solids content, water spray angle and the rotational speed of the mesh panels were found to be having significant effect on the three performances studied. The water spray rate tested in the range of 50 to 100 lpm was not found to have significant effect on any of the performance parameters studied.
14
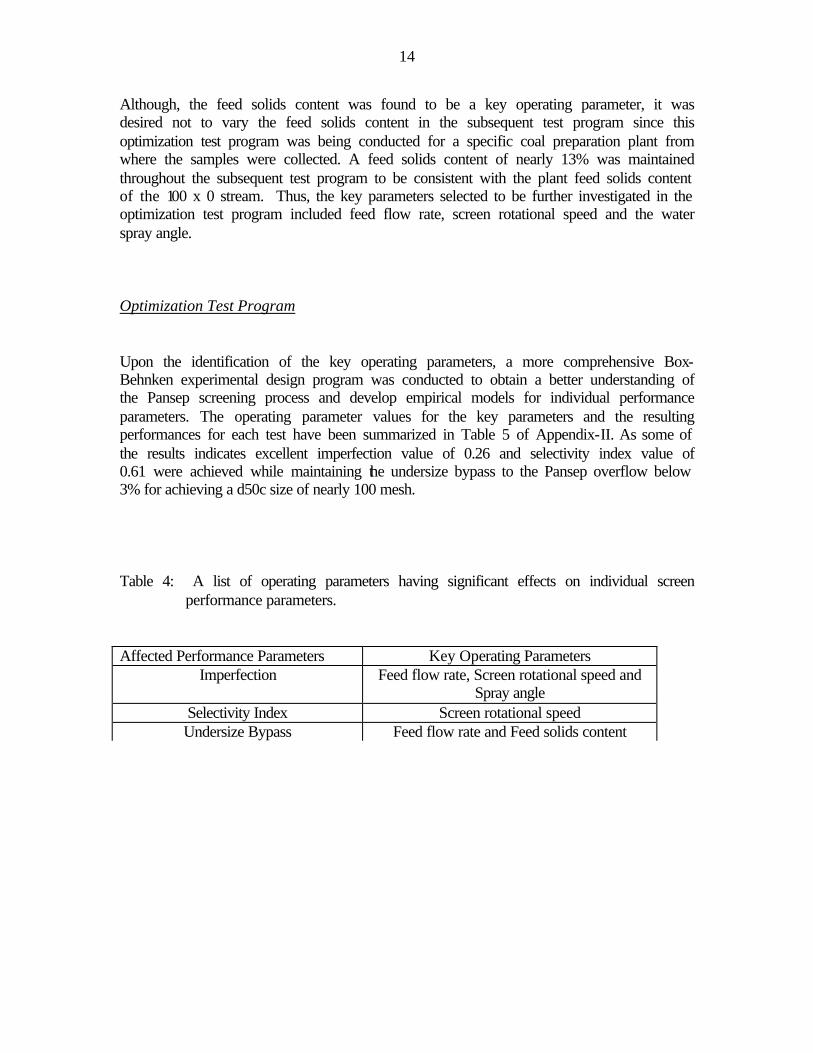
Although, the feed solids content was found to be a key operating parameter, it was desired not to vary the feed solids content in the subsequent test program since this optimization test program was being conducted for a specific coal preparation plant from where the samples were collected. A feed solids content of nearly 13% was maintained throughout the subsequent test program to be consistent with the plant feed solids content of the 100 x 0 stream. Thus, the key parameters selected to be further investigated in the optimization test program included feed flow rate, screen rotational speed and the water spray angle. Optimization Test Program Upon the identification of the key operating parameters, a more comprehensive Box-Behnken experimental design program was conducted to obtain a better understanding of the Pansep screening process and develop empirical models for individual performance parameters. The operating parameter values for the key parameters and the resulting performances for each test have been summarized in Table 5 of Appendix-II. As some of the results indicates excellent imperfection value of 0.26 and selectivity index value of 0.61 were achieved while maintaining the undersize bypass to the Pansep overflow below 3% for achieving a d50c size of nearly 100 mesh. Table 4: A list of operating parameters having significant effects on individual screen
performance parameters.
Affected Performance Parameters Key Operating Parameters Imperfection Feed flow rate, Screen rotational speed and
Spray angle Selectivity Index Screen rotational speed Undersize Bypass Feed flow rate and Feed solids content
15
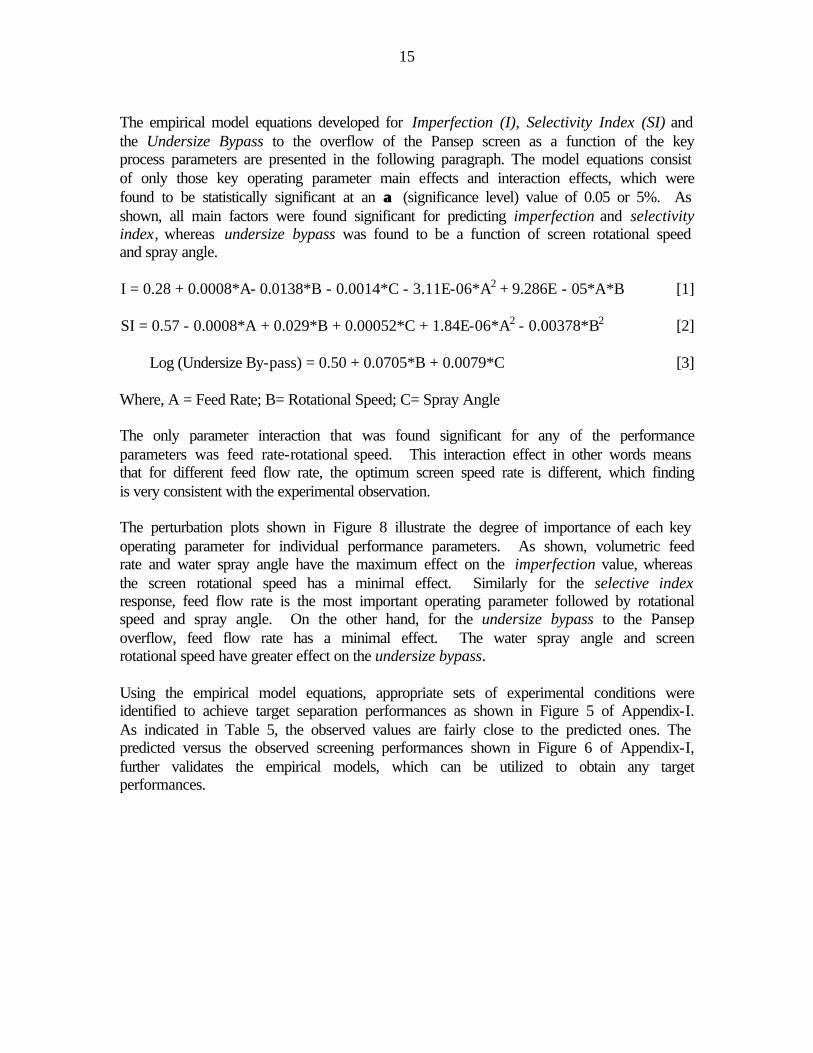
The empirical model equations developed for Imperfection (I), Selectivity Index (SI) and the Undersize Bypass to the overflow of the Pansep screen as a function of the key process parameters are presented in the following paragraph. The model equations consist of only those key operating parameter main effects and interaction effects, which were found to be statistically significant at an αα (significance level) value of 0.05 or 5%. As shown, all main factors were found significant for predicting imperfection and selectivity index, whereas undersize bypass was found to be a function of screen rotational speed and spray angle. I = 0.28 + 0.0008*A- 0.0138*B - 0.0014*C - 3.11E-06*A2 + 9.286E - 05*A*B [1] SI = 0.57 - 0.0008*A + 0.029*B + 0.00052*C + 1.84E-06*A2 - 0.00378*B2 [2]
Log (Undersize By-pass) = 0.50 + 0.0705*B + 0.0079*C [3]
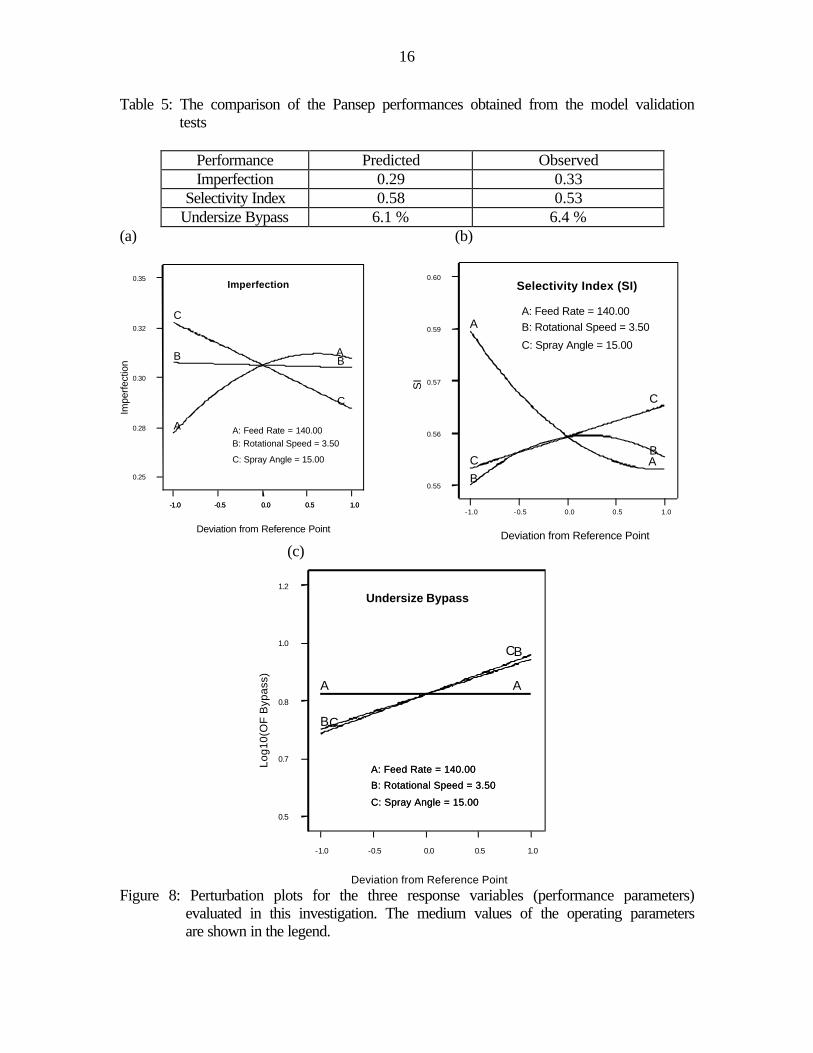
Where, A = Feed Rate; B= Rotational Speed; C= Spray Angle The only parameter interaction that was found significant for any of the performance parameters was feed rate-rotational speed. This interaction effect in other words means that for different feed flow rate, the optimum screen speed rate is different, which finding is very consistent with the experimental observation. The perturbation plots shown in Figure 8 illustrate the degree of importance of each key operating parameter for individual performance parameters. As shown, volumetric feed rate and water spray angle have the maximum effect on the imperfection value, whereas the screen rotational speed has a minimal effect. Similarly for the selective index response, feed flow rate is the most important operating parameter followed by rotational speed and spray angle. On the other hand, for the undersize bypass to the Pansep overflow, feed flow rate has a minimal effect. The water spray angle and screen rotational speed have greater effect on the undersize bypass. Using the empirical model equations, appropriate sets of experimental conditions were identified to achieve target separation performances as shown in Figure 5 of Appendix-I. As indicated in Table 5, the observed values are fairly close to the predicted ones. The predicted versus the observed screening performances shown in Figure 6 of Appendix-I, further validates the empirical models, which can be utilized to obtain any target performances.
16
Table 5: The comparison of the Pansep performances obtained from the model validation tests
Performance Predicted Observed Imperfection 0.29 0.33
Selectivity Index 0.58 0.53 Undersize Bypass 6.1 % 6.4 %
(a) (b)
(c)
Figure 8: Perturbation plots for the three response variables (performance parameters) evaluated in this investigation. The medium values of the operating parameters are shown in the legend.
Imperfection
A: Feed Rate = 140.00B: Rotational Speed = 3.50
C: Spray Angle = 15.00
Deviation from Reference Point
Impe
rfect
ion
-1.0 -0.5 0.0 0.5 1.0-1.0 -0.5 0.0 0.5 1.0
0.25
0.28
0.30
0.32
0.35
A
AB B
C
C
Selectivity Index (SI)
Deviation from Reference Point
SI
-1.0 -0.5 0.0 0.5 1.0
0.55
0.56
0.57
0.59
0.60
A
AB
BC
C
A: Feed Rate = 140.00B: Rotational Speed = 3.50
C: Spray Angle = 15.00
Undersize Bypass
Deviation from Reference Point
Log1
0(O
F B
ypas
s)
-1.0 -0.5 0.0 0.5 1.0
0.5
0.7
0.8
1.0
1.2
A A
B
B
C
C
A: Feed Rate = 140.00
B: Rotational Speed = 3.50
C: Spray Angle = 15.00
A: Feed Rate = 140.00
B: Rotational Speed = 3.50
C: Spray Angle = 15.00
17
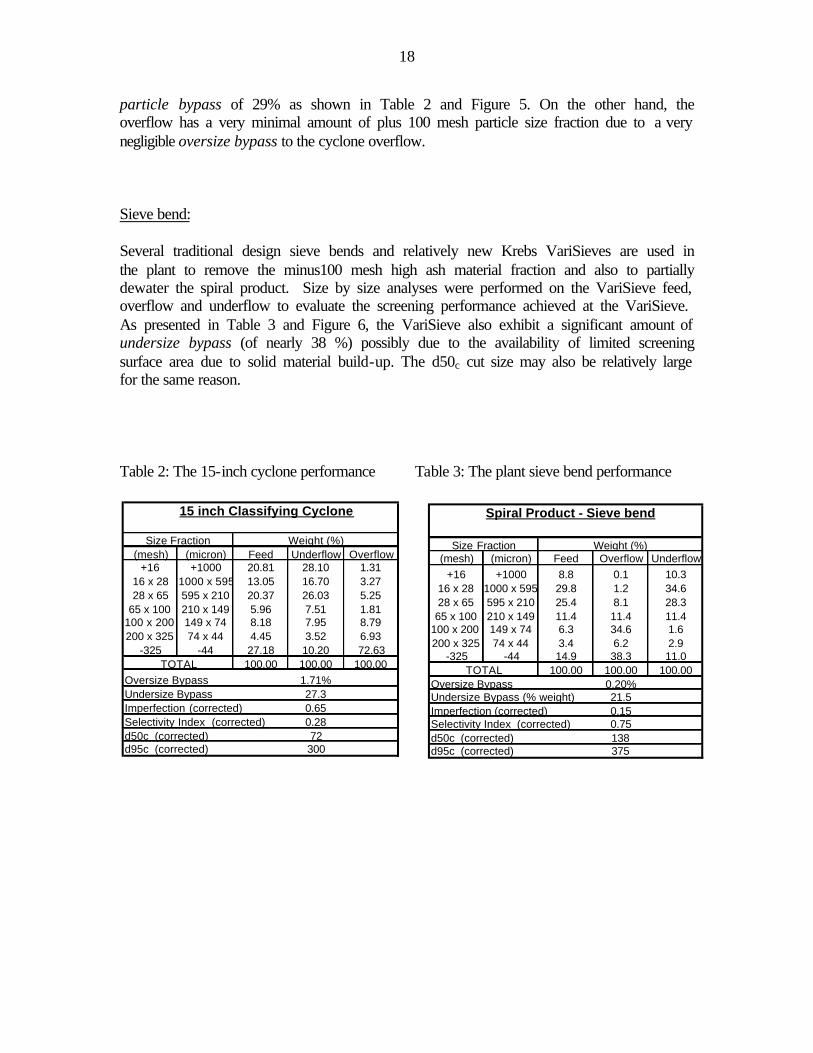
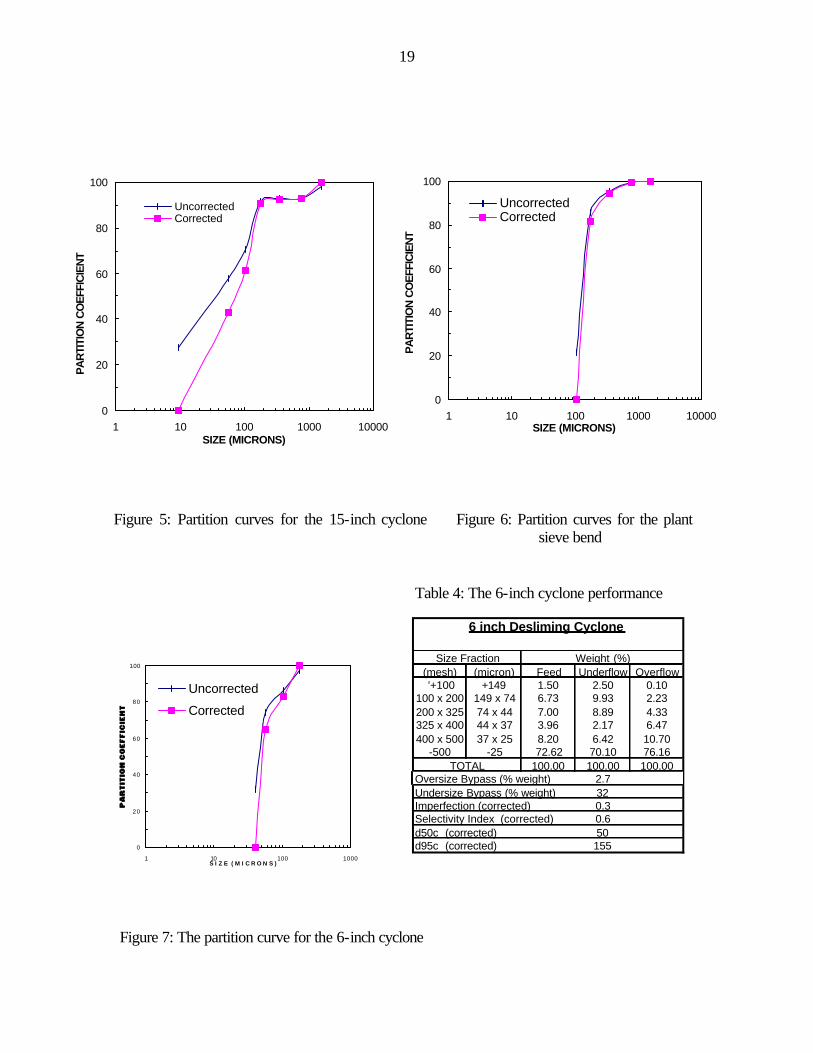
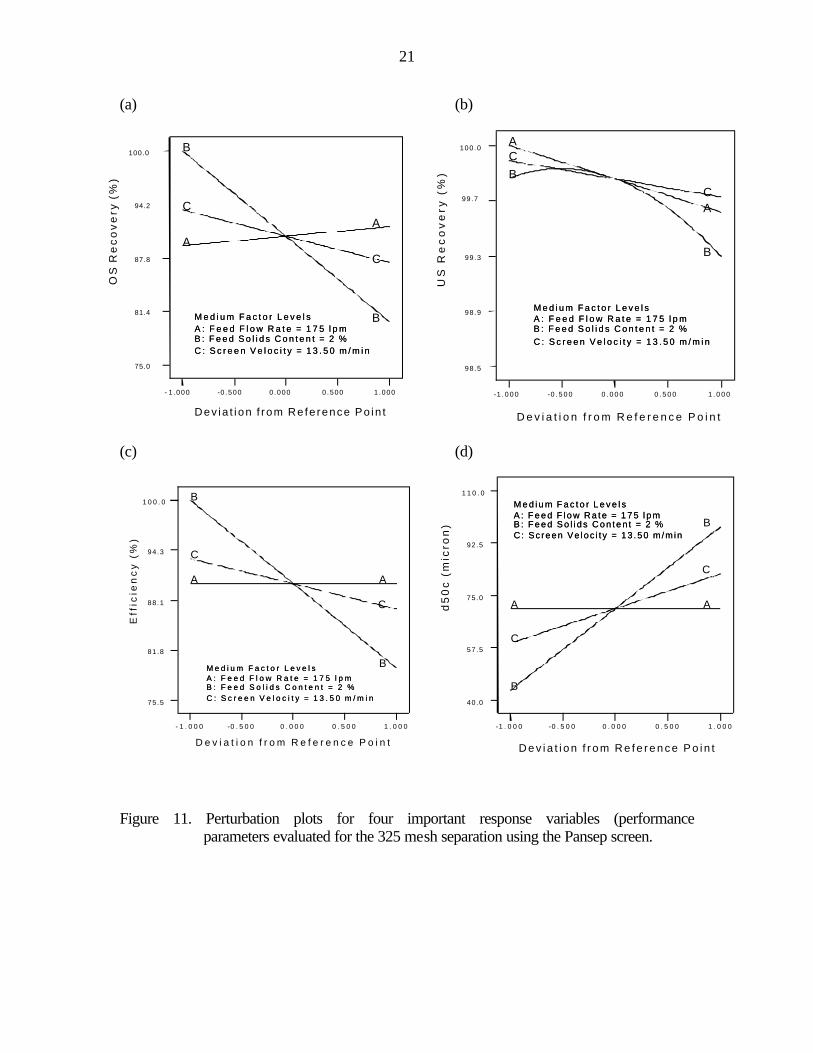
Pansep Evaluation for 325-mesh size separation Exploratory Test Program: Special mesh panels were imported from South Africa for achieving 325 mesh size separation using the Pansep technology. A series of exploratory tests were conducted to investigate the hydraulic capacity and the need for adjusting the spray angle. Previously, for the 100 mesh size separation, the spray angle was varied over a range of 0 to 30o; however it was found that the increasing spray angle had a negative impact on the overall efficiency of screening. During this exploratory test series very little difference in performance was observed over 15o to 45o. Thus, it was desired to maintain the spray angle constant for the optimization test program. As the results in the Tables 6 and 7 of the Appendix II indicate, the d50c size for all tests were above the desired 45-micron (325 mesh) probably due to the high feed volumetric rates. Optimization Test Program: An optimization test program was conducted using the Box-Behnken experimental design. A total of seventeen tests were conducted by varying three key factors i.e., feed volumetric flow rate, feed solids content and the screen speed. The performance parameters evaluated included oversize (os) recovery to the screen overflow, undersize (us) recovery to the screen underflow, overall efficiency and the d50c separation size. As shown in the perturbation plots in Figure 11, feed solids content had the maximum effect on all the performance parameters evaluated, whereas the volumetric flow rate had a minimal effect. This may indicate the high hydraulic capacity of the Pansep screen, which is very important for fine coal screening. The d50c separation size increases with both feed solids content and increasing screen velocity. As shown, near perfect efficiency, oversize recovery to the overflow stream and undersize recovery to the underflow stream of 1.0 were achieved using the Pansep screen, which indicates the high efficient screening achievable even in the ultrafine size range. Evaluation of Existing Technologies The conventional fine coal sizing technologies that are used in the Illinois coal preparation plants typically include 15 inch classifying cyclone for raw coal classification at 100 mesh, 6 inch classifying cyclone for raw coal classification at 325 mesh and sieve bends (or vary-sieves) for spiral clean coal product at nearly 100 mesh. 15 inch Classifying Cyclone: The entire fine coal feed slurry (nearly 350 tph) of the preparation plant under investigation is classified at 100 mesh using a bank of 15 inch classifying cyclones to separately clean the minus100 mesh and the plus100 mesh particle size fractions using different processing technologies. Although a d50c size of nearly the desired 100 mesh (149 micron) is achieved, the classification efficiency obtained from the traditional design plant cyclone is not satisfactory, as shown in Table 2. The cyclone underflow, which is supposed contain mostly the plus100 mesh particle size fraction, actually contains nearly 24% of minus100 mesh particle size material. A simple analysis indicates that this misplacement occurs due to high imperfection value of 0.57 and an undersize
18
particle bypass of 29% as shown in Table 2 and Figure 5. On the other hand, the overflow has a very minimal amount of plus 100 mesh particle size fraction due to a very negligible oversize bypass to the cyclone overflow. Sieve bend: Several traditional design sieve bends and relatively new Krebs VariSieves are used in the plant to remove the minus100 mesh high ash material fraction and also to partially dewater the spiral product. Size by size analyses were performed on the VariSieve feed, overflow and underflow to evaluate the screening performance achieved at the VariSieve. As presented in Table 3 and Figure 6, the VariSieve also exhibit a significant amount of undersize bypass (of nearly 38 %) possibly due to the availability of limited screening surface area due to solid material build-up. The d50c cut size may also be relatively large for the same reason. Table 2: The 15-inch cyclone performance Table 3: The plant sieve bend performance
15 inch Classifying Cyclone
(mesh) (micron) Feed Underflow Overflow+16 +1000 20.81 28.10 1.31
16 x 28 1000 x 595 13.05 16.70 3.2728 x 65 595 x 210 20.37 26.03 5.25
65 x 100 210 x 149 5.96 7.51 1.81100 x 200 149 x 74 8.18 7.95 8.79200 x 325 74 x 44 4.45 3.52 6.93
-325 -44 27.18 10.20 72.63100.00 100.00 100.00
Oversize Bypass 1.71%Undersize Bypass 27.3Imperfection (corrected) 0.65Selectivity Index (corrected) 0.28d50c (corrected) 72d95c (corrected) 300
Size Fraction Weight (%)
TOTAL
Spiral Product - Sieve bend
(mesh) (micron) Feed Overflow Underflow+16 +1000 8.8 0.1 10.3
16 x 28 1000 x 595 29.8 1.2 34.628 x 65 595 x 210 25.4 8.1 28.365 x 100 210 x 149 11.4 11.4 11.4
100 x 200 149 x 74 6.3 34.6 1.6200 x 325 74 x 44 3.4 6.2 2.9
-325 -44 14.9 38.3 11.0100.00 100.00 100.00
Oversize Bypass 0.20%Undersize Bypass (% weight) 21.5Imperfection (corrected) 0.15Selectivity Index (corrected) 0.75d50c (corrected) 138d95c (corrected) 375
Size Fraction Weight (%)
TOTAL
19
Figure 5: Partition curves for the 15-inch cyclone Figure 6: Partition curves for the plant
sieve bend
Table 4: The 6-inch cyclone performance
Figure 7: The partition curve for the 6-inch cyclone
0
20
40
60
80
100
1 10 100 1000 10000SIZE (MICRONS)
PAR
TITI
ON
CO
EFFI
CIE
NT
UncorrectedCorrected
6 inch Desliming Cyclone
(mesh) (micron) Feed Underflow Overflow '+100 +149 1.50 2.50 0.10
100 x 200 149 x 74 6.73 9.93 2.23200 x 325 74 x 44 7.00 8.89 4.33325 x 400 44 x 37 3.96 2.17 6.47400 x 500 37 x 25 8.20 6.42 10.70
-500 -25 72.62 70.10 76.16100.00 100.00 100.00
Oversize Bypass (% weight) 2.7Undersize Bypass (% weight) 32Imperfection (corrected) 0.3Selectivity Index (corrected) 0.6d50c (corrected) 50d95c (corrected) 155
TOTAL
Size Fraction Weight (%)
0
20
40
60
80
100
1 10 100 1000S I Z E ( M I C R O N S )
Uncorrected
Corrected
0
20
40
60
80
100
1 10 100 1000 10000SIZE (MICRONS)
PAR
TITI
ON
CO
EFFI
CIE
NT
UncorrectedCorrected
20
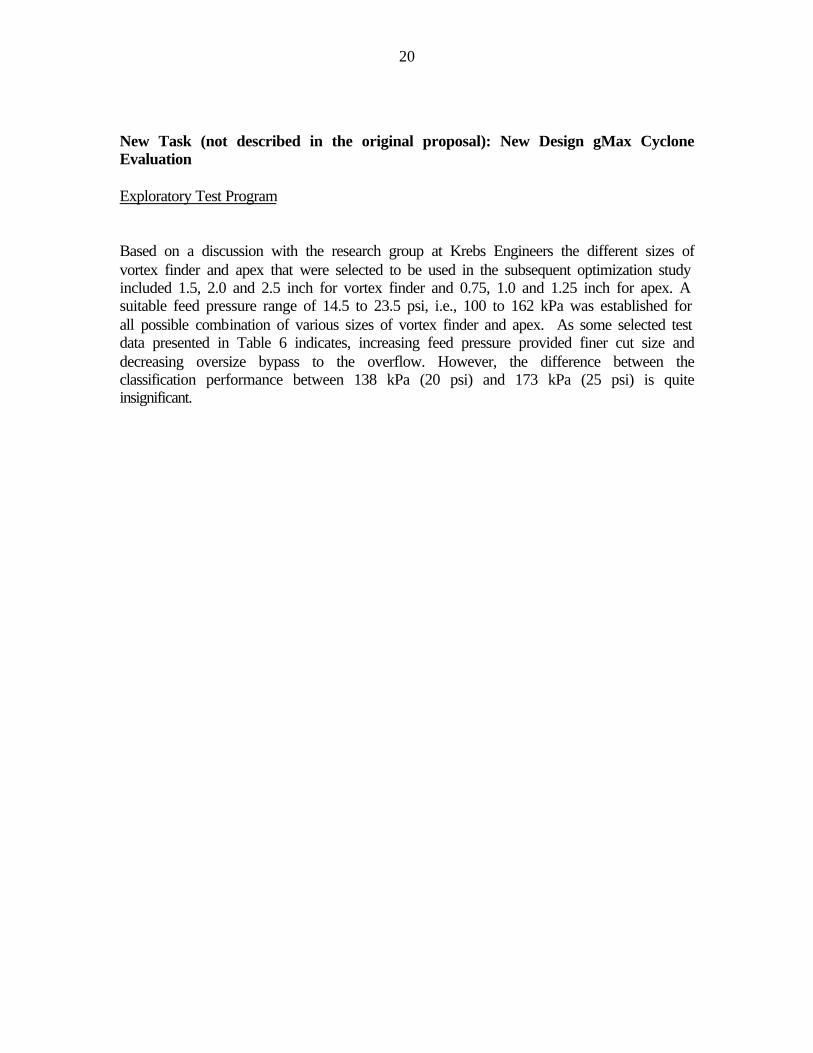
New Task (not described in the original proposal): New Design gMax Cyclone Evaluation Exploratory Test Program Based on a discussion with the research group at Krebs Engineers the different sizes of vortex finder and apex that were selected to be used in the subsequent optimization study included 1.5, 2.0 and 2.5 inch for vortex finder and 0.75, 1.0 and 1.25 inch for apex. A suitable feed pressure range of 14.5 to 23.5 psi, i.e., 100 to 162 kPa was established for all possible combination of various sizes of vortex finder and apex. As some selected test data presented in Table 6 indicates, increasing feed pressure provided finer cut size and decreasing oversize bypass to the overflow. However, the difference between the classification performance between 138 kPa (20 psi) and 173 kPa (25 psi) is quite insignificant.
21
(a) (b)
(c) (d)
Figure 11. Perturbation plots for four important response variables (performance
parameters evaluated for the 325 mesh separation using the Pansep screen.
Dev ia t i on f rom Re fe rence Po in t
OS
Re
co
ve
ry (
%)
- 1 .000 -0 .500 0 .000 0 .500 1 .000
75.0
81.4
87.8
94.2
100.0
A
A
B
B
C
C
B : F e e d S o l i d s C o n t e n t = 2 %
M e d i u m F a c t o r L e v e l sA : F e e d F l o w R a t e = 1 7 5 l p m
C : S c r e e n V e l o c i t y = 1 3 . 5 0 m / m i nB : F e e d S o l i d s C o n t e n t = 2 %
M e d i u m F a c t o r L e v e l sA : F e e d F l o w R a t e = 1 7 5 l p m
C : S c r e e n V e l o c i t y = 1 3 . 5 0 m / m i n
D e v i a t i o n f r o m R e f e r e n c e P o i n t
US
Re
co
ve
ry (
%)
-1 . 0 0 0 -0 . 5 0 0 0 . 0 0 0 0 . 5 0 0 1 . 0 0 0
98.5
98.9
99.3
99.7
100 .0A
A
B
B
C
C
B : F e e d S o l i d s C o n t e n t = 2 %
M e d i u m F a c t o r L e v e l sA : F e e d F l o w R a t e = 1 7 5 l p m
C : S c r e e n V e l o c i t y = 1 3 . 5 0 m / m i nB : F e e d S o l i d s C o n t e n t = 2 %
M e d i u m F a c t o r L e v e l sA : F e e d F l o w R a t e = 1 7 5 l p m
C : S c r e e n V e l o c i t y = 1 3 . 5 0 m / m i n
D e v i a t i o n f r o m R e f e r e n c e P o i n t
d5
0c
(m
icro
n)
-1 . 0 0 0 -0 . 5 0 0 0 . 0 0 0 0 . 5 0 0 1 . 0 0 0
40.0
57.5
75.0
92.5
1 1 0 . 0
A A
B
B
C
C
B : F e e d S o l i d s C o n t e n t = 2 %
M e d i u m F a c t o r L e v e l sA : F e e d F l o w R a t e = 1 7 5 l p m
C: Sc reen Ve loc i t y = 13 .50 m/m inB : F e e d S o l i d s C o n t e n t = 2 %
M e d i u m F a c t o r L e v e l sA : F e e d F l o w R a t e = 1 7 5 l p m
C: Sc reen Ve loc i t y = 13 .50 m/m in
D e v i a t i o n f r o m R e f e r e n c e P o i n t
Eff
icie
nc
y (
%)
- 1 . 0 0 0 -0 . 5 0 0 0 . 0 0 0 0 . 5 0 0 1 . 0 0 0
75.5
81.8
88.1
94.3
1 0 0 . 0
A A
B
B
C
C
B : F e e d S o l i d s C o n t e n t = 2 %
M e d i u m F a c t o r L e v e l sA : F e e d F l o w R a t e = 1 7 5 l p m
C : S c r e e n V e l o c i t y = 1 3 . 5 0 m / m i nB : F e e d S o l i d s C o n t e n t = 2 %
M e d i u m F a c t o r L e v e l sA : F e e d F l o w R a t e = 1 7 5 l p m
C : S c r e e n V e l o c i t y = 1 3 . 5 0 m / m i n
22
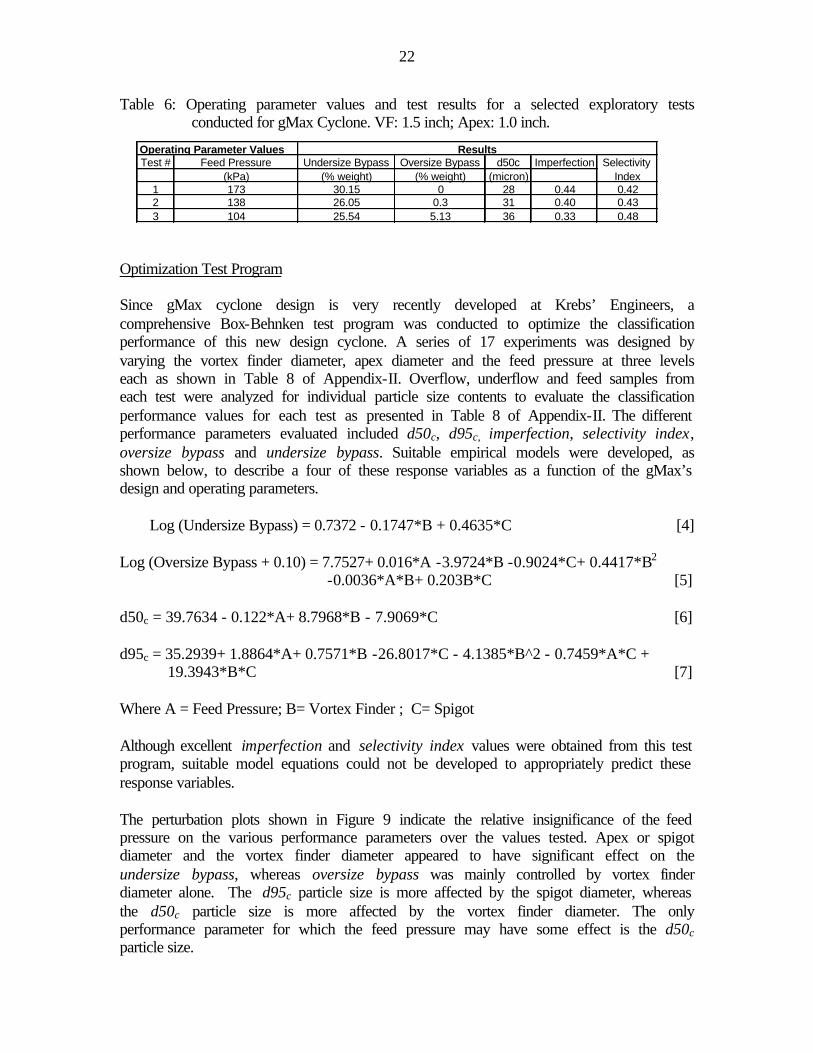
Table 6: Operating parameter values and test results for a selected exploratory tests conducted for gMax Cyclone. VF: 1.5 inch; Apex: 1.0 inch.
Optimization Test Program Since gMax cyclone design is very recently developed at Krebs’ Engineers, a comprehensive Box-Behnken test program was conducted to optimize the classification performance of this new design cyclone. A series of 17 experiments was designed by varying the vortex finder diameter, apex diameter and the feed pressure at three levels each as shown in Table 8 of Appendix-II. Overflow, underflow and feed samples from each test were analyzed for individual particle size contents to evaluate the classification performance values for each test as presented in Table 8 of Appendix-II. The different performance parameters evaluated included d50c, d95c, imperfection, selectivity index, oversize bypass and undersize bypass. Suitable empirical models were developed, as shown below, to describe a four of these response variables as a function of the gMax’s design and operating parameters.
Log (Undersize Bypass) = 0.7372 - 0.1747*B + 0.4635*C [4] Log (Oversize Bypass + 0.10) = 7.7527+ 0.016*A -3.9724*B -0.9024*C+ 0.4417*B2
-0.0036*A*B+ 0.203B*C [5] d50c = 39.7634 - 0.122*A+ 8.7968*B - 7.9069*C [6] d95c = 35.2939+ 1.8864*A+ 0.7571*B -26.8017*C - 4.1385*B^2 - 0.7459*A*C +
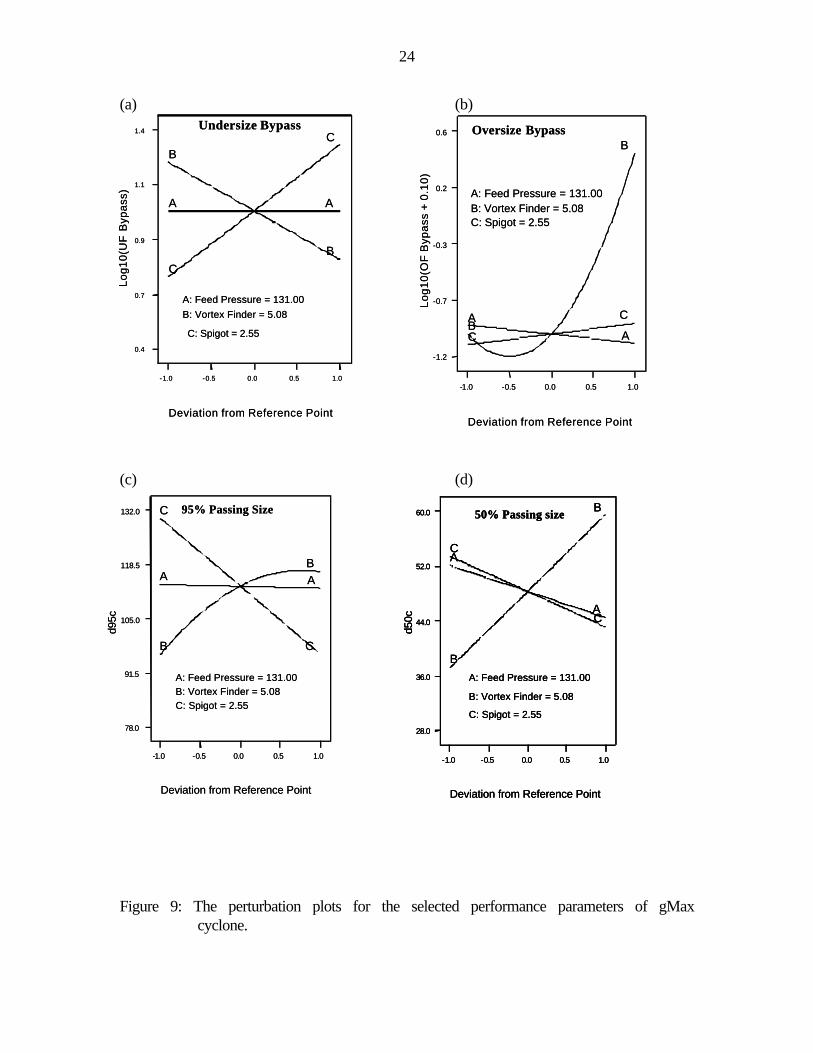
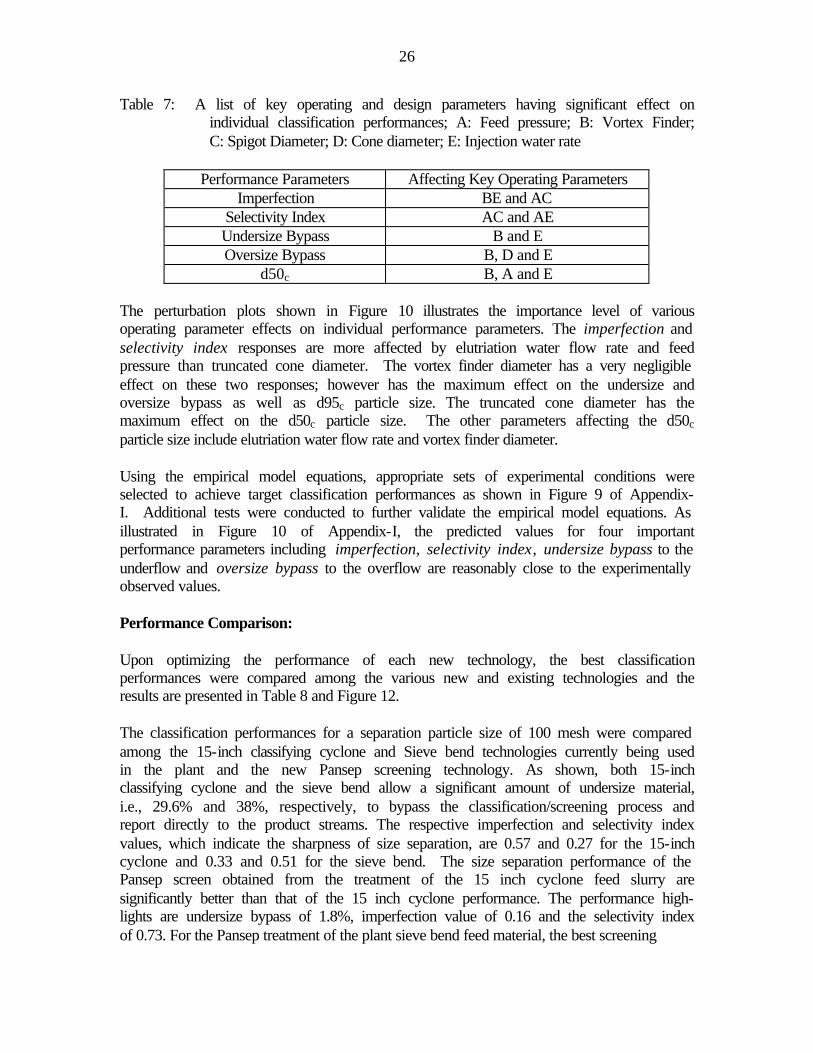
19.3943*B*C [7] Where A = Feed Pressure; B= Vortex Finder ; C= Spigot Although excellent imperfection and selectivity index values were obtained from this test program, suitable model equations could not be developed to appropriately predict these response variables. The perturbation plots shown in Figure 9 indicate the relative insignificance of the feed pressure on the various performance parameters over the values tested. Apex or spigot diameter and the vortex finder diameter appeared to have significant effect on the undersize bypass, whereas oversize bypass was mainly controlled by vortex finder diameter alone. The d95c particle size is more affected by the spigot diameter, whereas the d50c particle size is more affected by the vortex finder diameter. The only performance parameter for which the feed pressure may have some effect is the d50c particle size.
Test # Feed Pressure Undersize Bypass Oversize Bypass d50c Imperfection Selectivity (kPa) (% weight) (% weight) (micron) Index
1 173 30.15 0 28 0.44 0.422 138 26.05 0.3 31 0.40 0.433 104 25.54 5.13 36 0.33 0.48
ResultsOperating Parameter Values
23
Using the empirical model equations, appropriate sets of experimental conditions were identified to achieve target separation performances as shown in Figure 7 of Appendix-I. As illustrated in Figure 8 of Appendix-I, the observed and predicted classification performances are fairly close both for the Box-Behnken tests and the model validation tests conducted after the development of the models. Task 3: Cyclowash Evaluation Exploratory Test Program The main objective of the Cyclowash application was to reduce the amount of undersize bypass and thus improve the classification efficiency. The gMax cyclone study discussed in the previous section indicates that by optimizing the operating and design parameter values, the under size bypass could be reduced even without having the Cyclowash attachment to less than 10% level, however with relatively inferior imperfection and selectivity index values. To conduct a preliminary evaluation of the effectiveness of the Cyclowash, it was desired to set the gMax parameters at a condition, which was known to provide poor classification performance, comparable to what is obtained with the 6-inch cyclone in the plant. The parameters selected were 1.5 inch, 1.0 inch and 23.5 psi for vortex finder diameter, spigot diameter and the feed pressure, respectively. The classification performance produced using this base condition included 30% of undersize bypass, d50c value of 32 micron, imperfection and selectivity index values of 0.46 and 0.33, respectively. As shown in Table 9 of Appendix-II, twelve exploratory tests were conducted with the Cyclowash by varying only truncated cone diameter and thus the angle and the elutriation water rate. Based on the resulting classification data, following conclusions are made:
• The undersize bypass was reduced to nearly 1% from 30% with some specific test conditions. The respective improvement of the corrected imperfection and selectivity values were from 0.46 to 0.24 and from 0.33 to 0.63.
• The d50c size was increased from 32 micron to 45 micron.
• The under size bypass increased with the use of increasing truncated cone sizes.
The classification performance with large truncated cone diameter was even worse than the base gMax performance.
• The Cyclowash attachment did not have any effect on the oversize bypass.
24
(a) (b)
(c) (d)
Figure 9: The perturbation plots for the selected performance parameters of gMax
cyclone.
A: Feed Pressure = 131.00B: Vortex Finder = 5.08
C: Spigot = 2.55
Deviation from Reference Point
Log1
0(U
F B
ypas
s)
-1.0 -0.5 0.0 0.5 1.0
0.4
0.7
0.9
1.1
1.4
A A
B
BC
CUndersize Bypass
A: Feed Pressure = 131.00B: Vortex Finder = 5.08C: Spigot = 2.55
Deviation from Reference PointLo
g10(
OF
Byp
ass
+ 0
.10)
-1.0 -0.5 0.0 0.5 1.0
-1.2
-0.7
-0.3
0.2
0.6
AA
B
B
C
C
Oversize Bypass
A: Feed Pressure = 131.00B: Vortex Finder = 5.08C: Spigot = 2.55
Deviation from Reference Point
d95c
-1.0 -0.5 0.0 0.5 1.0
78.0
91.5
105.0
118.5
132.0
A A
B
B
C
C
95% Passing Size
A: Feed Pressure = 131.00
B: Vortex Finder = 5.08
C: Spigot = 2.55
Deviation from Reference Point
d50c
-1.0 -0.5 0.0 0.5 1.0
28.0
36.0
44.0
52.0
60.0
A
A
B
B
C
C
50% Passing size
A: Feed Pressure = 131.00
B: Vortex Finder = 5.08
C: Spigot = 2.55
Deviation from Reference Point
d50c
-1.0 -0.5 0.0 0.5 1.0
28.0
36.0
44.0
52.0
60.0
A
A
B
B
C
C
50% Passing size
25
Plackett-Burman Design Test Program To determine which factors have significant effect on the Cyclowash performance, twelve tests were conducted as a part of a Plackett-Burman experimental program using the parameter values listed in Table 10 of the Appendix-II. A statistical analysis of the experimental data determined the key operating and design parameter values, which affect various performance parameters as shown in Table 7. As shown, the main parameter effects for all five performances evaluated were caused due to feed pressure, vortex finder, truncated cone diameter and elutriation water rate. Hence, these four parameters were further investigated during the subsequent optimization test program. Optimization Test Program A Box-Behnken experimental program with four factors was designed to optimize the classification performance achievable from the Cyclowash. A list of operating parameter values used for each experiment is provided in Table 9 of Appendix-II. As shown, the feed pressure was varied over a range of 100 kPa (14.5 psi) to 162 kpa (23.5psi), whereas the vortex finder diameter over 3.81 cm (1.5 inch) to 6.35 cm (2.5 inch). Similarly the range of values used for the truncated cone diameter and the elutriation water flow rate are from 2.54 cm (1 inch) to 5.08 cm (2 inch) and 0 to 150 lpm (40 gpm), respectively. The test results are listed in Table 10 of Appendix-II, which shows some of the excellent classification performance with nearly 0 bypass for both undersize and oversize. Empirical models were developed for six different performance parameters, including imperfection, selectivity index, undersize bypass, oversize bypass, d50c and d95c. The model equations are as follows: Imperfection = - 0.052 + 0.0154*A -0.099*B - 0.0099*C –6.2E-05*A2 + 2.35E-05*A*C
+ 0.0016*B*C [8]
Selectivity Index = 0.774 - 0.012*A + 0.085*B + 0.009*C + 4.85E-05*A2 - 2.16E-5*A*C - 0.0014*B*C [9]
Sqrt (Undersize Bypass) = 8.3809 - 1.52125*D + 0.976*B - 0.021*C [10] Oversize Bypass = 114.79 - 0.9137*A - 25.241*D + 0.0175*C + 0.0033*A2 + 2.9461*D2 [11] d95c = 97.97 - 0.0417*A+ 15.7301*D -13.1562*B + 0.1169*C -1.7226*D2
-0.00025*C2+ 1.7825*D*B -0.0209*D*C+ 0.01837*B*C [12] 1.0/(d50c) = 0.0013+3.66E-05*A - 0.004*D + 0.0153*B - 4.09E - 05*C - 0.0016*B2 [13] where, A = Feed pressure; B=Cone diameter; C= Water flow rate; D= vortex finder
26
Table 7: A list of key operating and design parameters having significant effect on individual classification performances; A: Feed pressure; B: Vortex Finder; C: Spigot Diameter; D: Cone diameter; E: Injection water rate
Performance Parameters Affecting Key Operating Parameters
Imperfection BE and AC Selectivity Index AC and AE Undersize Bypass B and E Oversize Bypass B, D and E
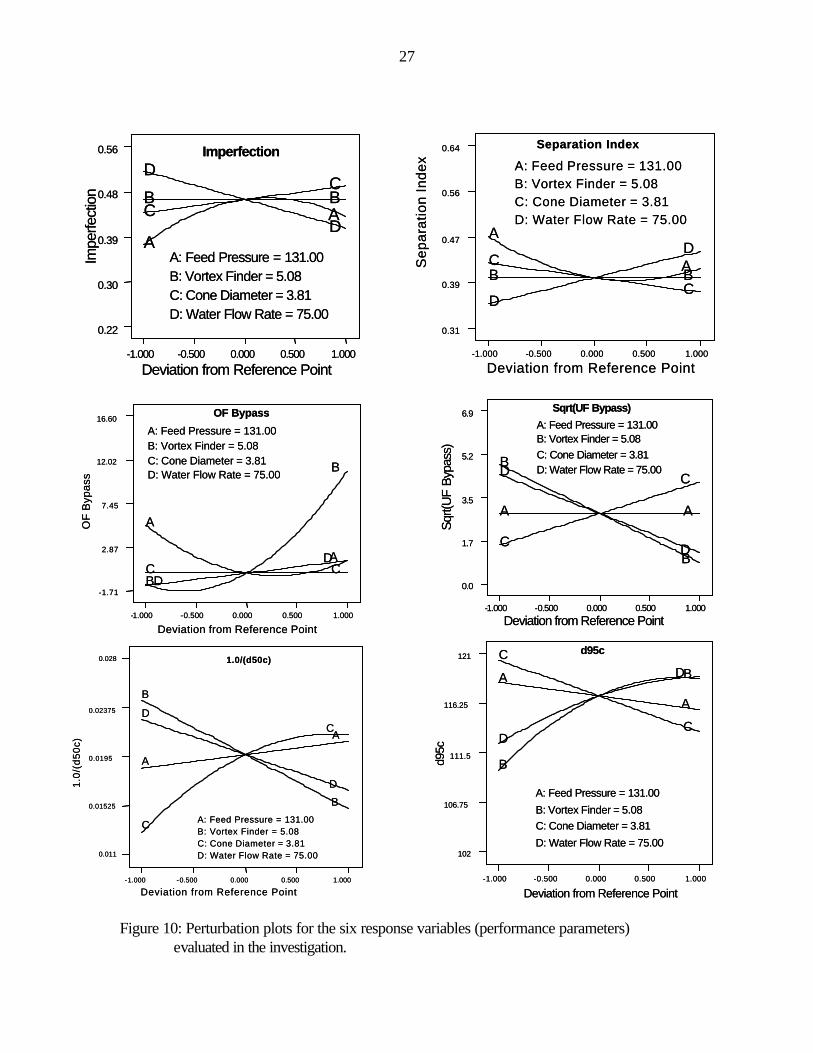
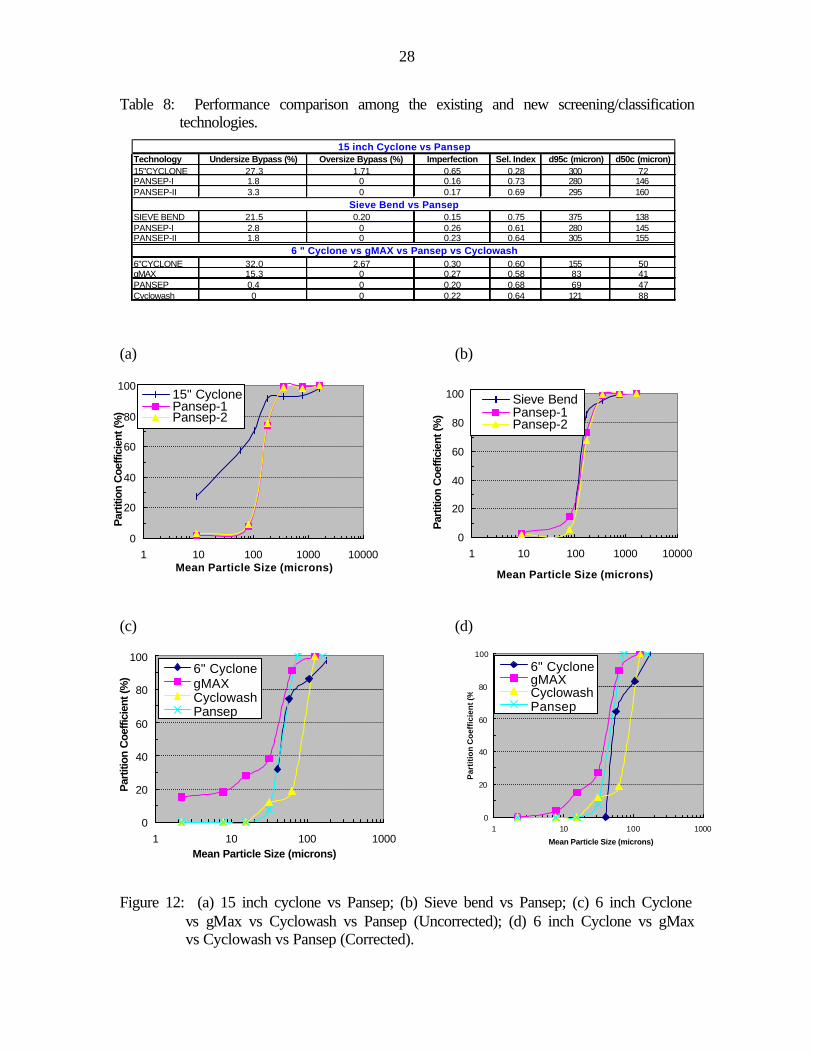
d50c B, A and E The perturbation plots shown in Figure 10 illustrates the importance level of various operating parameter effects on individual performance parameters. The imperfection and selectivity index responses are more affected by elutriation water flow rate and feed pressure than truncated cone diameter. The vortex finder diameter has a very negligible effect on these two responses; however has the maximum effect on the undersize and oversize bypass as well as d95c particle size. The truncated cone diameter has the maximum effect on the d50c particle size. The other parameters affecting the d50c particle size include elutriation water flow rate and vortex finder diameter. Using the empirical model equations, appropriate sets of experimental conditions were selected to achieve target classification performances as shown in Figure 9 of Appendix-I. Additional tests were conducted to further validate the empirical model equations. As illustrated in Figure 10 of Appendix-I, the predicted values for four important performance parameters including imperfection, selectivity index, undersize bypass to the underflow and oversize bypass to the overflow are reasonably close to the experimentally observed values. Performance Comparison: Upon optimizing the performance of each new technology, the best classification performances were compared among the various new and existing technologies and the results are presented in Table 8 and Figure 12. The classification performances for a separation particle size of 100 mesh were compared among the 15-inch classifying cyclone and Sieve bend technologies currently being used in the plant and the new Pansep screening technology. As shown, both 15-inch classifying cyclone and the sieve bend allow a significant amount of undersize material, i.e., 29.6% and 38%, respectively, to bypass the classification/screening process and report directly to the product streams. The respective imperfection and selectivity index values, which indicate the sharpness of size separation, are 0.57 and 0.27 for the 15-inch cyclone and 0.33 and 0.51 for the sieve bend. The size separation performance of the Pansep screen obtained from the treatment of the 15 inch cyclone feed slurry are significantly better than that of the 15 inch cyclone performance. The performance high- lights are undersize bypass of 1.8%, imperfection value of 0.16 and the selectivity index of 0.73. For the Pansep treatment of the plant sieve bend feed material, the best screening
27
Figure 10: Perturbation plots for the six response variables (performance parameters)
evaluated in the investigation.
Imperfection
Deviation from Reference Point
Impe
rfect
ion
-1.000 -0.500 0.000 0.500 1.000
0.22
0.30
0.39
0.48
0.56
A
AB BC
CD
D
A: Feed Pressure = 131.00B: Vortex Finder = 5.08C: Cone Diameter = 3.81D: Water Flow Rate = 75.00
Imperfection
Deviation from Reference Point
Impe
rfect
ion
-1.000 -0.500 0.000 0.500 1.000
0.22
0.30
0.39
0.48
0.56
A
AB BC
CD
D
A: Feed Pressure = 131.00B: Vortex Finder = 5.08C: Cone Diameter = 3.81D: Water Flow Rate = 75.00
Separation Index
Deviation from Reference Point
Sep
arat
ion
Inde
x
-1.000 -0.500 0.000 0.500 1.000
0.31
0.39
0.47
0.56
0.64
A
AB BC
CD
D
A: Feed Pressure = 131.00B: Vortex Finder = 5.08C: Cone Diameter = 3.81D: Water Flow Rate = 75.00
Separation Index
Deviation from Reference Point
Sep
arat
ion
Inde
x
-1.000 -0.500 0.000 0.500 1.000
0.31
0.39
0.47
0.56
0.64
A
AB BC
CD
D
A: Feed Pressure = 131.00B: Vortex Finder = 5.08C: Cone Diameter = 3.81D: Water Flow Rate = 75.00
Sqrt(UF Bypass)
A: Feed Pressure = 131.00
Deviation from Reference Point
Sqrt(
UF
Bypa
ss)
-1.000 -0.500 0.000 0.500 1.000
0.0
1.7
3.5
5.2
6.9
A A
B
BC
CD
D
B: Vortex Finder = 5.08C: Cone Diameter = 3.81D: Water Flow Rate = 75.00
Sqrt(UF Bypass)
A: Feed Pressure = 131.00
Deviation from Reference Point
Sqrt(
UF
Bypa
ss)
-1.000 -0.500 0.000 0.500 1.000
0.0
1.7
3.5
5.2
6.9
A A
B
BC
CD
D
B: Vortex Finder = 5.08C: Cone Diameter = 3.81D: Water Flow Rate = 75.00
OF Bypass
A: Feed Pressure = 131.00
Deviation from Reference Point
OF
Byp
ass
-1.000 -0.500 0.000 0.500 1.000
-1.71
2.87
7.45
12.02
16.60
A
A
B
B
C CD
D
B: Vortex Finder = 5.08C: Cone Diameter = 3.81D: Water Flow Rate = 75.00
OF Bypass
A: Feed Pressure = 131.00
Deviation from Reference Point
OF
Byp
ass
-1.000 -0.500 0.000 0.500 1.000
-1.71
2.87
7.45
12.02
16.60
A
A
B
B
C CD
D
B: Vortex Finder = 5.08C: Cone Diameter = 3.81D: Water Flow Rate = 75.00
d95c
A: Feed Pressure = 131.00
Deviation from Reference Point
d95c
-1.000 -0.500 0.000 0.500 1.000
102
106.75
111.5
116.25
121
A
A
B
BC
CD
D
B: Vortex Finder = 5.08C: Cone Diameter = 3.81
D: Water Flow Rate = 75.00
d95c
A: Feed Pressure = 131.00
Deviation from Reference Point
d95c
-1.000 -0.500 0.000 0.500 1.000
102
106.75
111.5
116.25
121
A
A
B
BC
CD
D
B: Vortex Finder = 5.08C: Cone Diameter = 3.81
D: Water Flow Rate = 75.00
1.0/(d50c)
A: Feed Pressure = 131.00B: Vortex Finder = 5.08C: Cone Diameter = 3.81D: Water Flow Rate = 75.00
Deviation from Reference Point
1.0/
(d50
c)
-1.000 -0.500 0.000 0.500 1.000
0.011
0.01525
0.0195
0.02375
0.028
A
A
B
B
C
CD
D
1.0/(d50c)
A: Feed Pressure = 131.00B: Vortex Finder = 5.08C: Cone Diameter = 3.81D: Water Flow Rate = 75.00
Deviation from Reference Point
1.0/
(d50
c)
-1.000 -0.500 0.000 0.500 1.000
0.011
0.01525
0.0195
0.02375
0.028
A
A
B
B
C
CD
D
28
Table 8: Performance comparison among the existing and new screening/classification technologies.
(a) (b)
(c) (d)
Figure 12: (a) 15 inch cyclone vs Pansep; (b) Sieve bend vs Pansep; (c) 6 inch Cyclone
vs gMax vs Cyclowash vs Pansep (Uncorrected); (d) 6 inch Cyclone vs gMax vs Cyclowash vs Pansep (Corrected).
Technology Undersize Bypass (%) Oversize Bypass (%) Imperfection Sel. Index d95c (micron) d50c (micron)15"CYCLONE 27.3 1.71 0.65 0.28 300 72PANSEP-I 1.8 0 0.16 0.73 280 146PANSEP-II 3.3 0 0.17 0.69 295 160
SIEVE BEND 21.5 0.20 0.15 0.75 375 138PANSEP-I 2.8 0 0.26 0.61 280 145PANSEP-II 1.8 0 0.23 0.64 305 155
6"CYCLONE 32.0 2.67 0.30 0.60 155 50gMAX 15.3 0 0.27 0.58 83 41PANSEP 0.4 0 0.20 0.68 69 47Cyclowash 0 0 0.22 0.64 121 88
15 inch Cyclone vs Pansep
Sieve Bend vs Pansep
6 " Cyclone vs gMAX vs Pansep vs Cyclowash
0
20
40
60
80
100
1 10 100 1000
Mean Particle Size (microns)
Par
titi
on
Co
effi
cien
t (%
)
6" CyclonegMAXCyclowashPansep
0
20
40
60
80
100
1 10 100 1000Mean Particle Size (microns)
Par
titio
n C
oeffi
cien
t (%
)
6" CyclonegMAXCyclowashPansep
0
20
40
60
80
100
1 10 100 1000 10000Mean Particle Size (microns)
Par
titio
n C
oeffi
cien
t (%
)
15" CyclonePansep-1Pansep-2
0
20
40
60
80
100
1 10 100 1000 10000
Mean Particle Size (microns)
Par
titio
n C
oeffi
cien
t (%
)
Sieve BendPansep-1Pansep-2
29
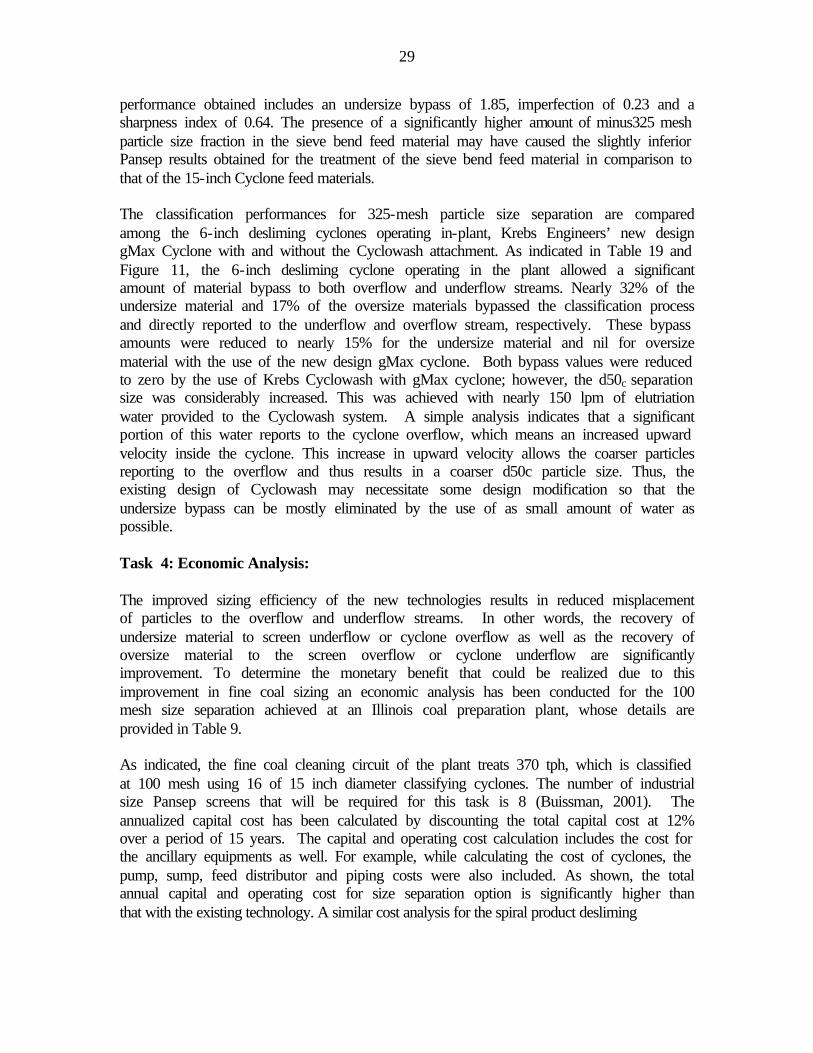
performance obtained includes an undersize bypass of 1.85, imperfection of 0.23 and a sharpness index of 0.64. The presence of a significantly higher amount of minus325 mesh particle size fraction in the sieve bend feed material may have caused the slightly inferior Pansep results obtained for the treatment of the sieve bend feed material in comparison to that of the 15-inch Cyclone feed materials. The classification performances for 325-mesh particle size separation are compared among the 6-inch desliming cyclones operating in-plant, Krebs Engineers’ new design gMax Cyclone with and without the Cyclowash attachment. As indicated in Table 19 and Figure 11, the 6-inch desliming cyclone operating in the plant allowed a significant amount of material bypass to both overflow and underflow streams. Nearly 32% of the undersize material and 17% of the oversize materials bypassed the classification process and directly reported to the underflow and overflow stream, respectively. These bypass amounts were reduced to nearly 15% for the undersize material and nil for oversize material with the use of the new design gMax cyclone. Both bypass values were reduced to zero by the use of Krebs Cyclowash with gMax cyclone; however, the d50c separation size was considerably increased. This was achieved with nearly 150 lpm of elutriation water provided to the Cyclowash system. A simple analysis indicates that a significant portion of this water reports to the cyclone overflow, which means an increased upward velocity inside the cyclone. This increase in upward velocity allows the coarser particles reporting to the overflow and thus results in a coarser d50c particle size. Thus, the existing design of Cyclowash may necessitate some design modification so that the undersize bypass can be mostly eliminated by the use of as small amount of water as possible. Task 4: Economic Analysis: The improved sizing efficiency of the new technologies results in reduced misplacement of particles to the overflow and underflow streams. In other words, the recovery of undersize material to screen underflow or cyclone overflow as well as the recovery of oversize material to the screen overflow or cyclone underflow are significantly improvement. To determine the monetary benefit that could be realized due to this improvement in fine coal sizing an economic analysis has been conducted for the 100 mesh size separation achieved at an Illinois coal preparation plant, whose details are provided in Table 9. As indicated, the fine coal cleaning circuit of the plant treats 370 tph, which is classified at 100 mesh using 16 of 15 inch diameter classifying cyclones. The number of industrial size Pansep screens that will be required for this task is 8 (Buissman, 2001). The annualized capital cost has been calculated by discounting the total capital cost at 12% over a period of 15 years. The capital and operating cost calculation includes the cost for the ancillary equipments as well. For example, while calculating the cost of cyclones, the pump, sump, feed distributor and piping costs were also included. As shown, the total annual capital and operating cost for size separation option is significantly higher than that with the existing technology. A similar cost analysis for the spiral product desliming
30
Table 9: A comparative cost analysis for 100 mesh size separation
Feed rate to the fine circuit: 370 tph; 11000 gpm
Annualized Capital Cost ($)
Annual Operating Cost
($)
Total Annual Cost ($)
No. of 15 inch Cyclone used in the plant
16 27, 974 20, 100 48, 074
No. of 9 m2 Pansep units required
8 88, 080 96, 000 184, 000
Spiral product rate: 200 tph No. of Sieve bend and VariSieve used in plant
4, 2 10, 630 43, 440 54, 070
No. of 9 m2 Pansep units required
4 43, 800 48 000 91 800
at 100 mesh using a Sieve bend-VariSieve combination versus Pansep screen also indicates the higher capital and operating cost for the Pansep option. However, a benefit analysis described in the following paragraph will indicate that, although the new technology integration will cost significantly higher than the old ones, the resulting improved size efficiency will prevent the loss of significant amount of misplaced clean coal to the plant thickener. The resulting additional revenue due to the recovery of additional clean coal will far offset the increased cost of the new technologies and increase the plant profitability. The preparation plant used in this study rejects the underflow of the Sieve bends, which screen the spiral product, supposedly, for removing relatively high ash fine material. This means that the –100 mesh fine coal misplaced to the cyclone underflow, which bypasses the spiral cleaning process is ultimately rejected to the plant thickener causing a significant loss of valuable fine coal. A simple analysis indicates that due to the high proportion, i.e., nearly 40% of –100 mesh material misplaced to the cyclone underflow, nearly 57 tph of misplaced fine coal having an ash content of 39% is lost to the plant thickener. This loss could be reduced to only 3 tph by using Pansep screens in place of the banks of 15 inch cyclones in the plant. Thus, additional 54 tph fine coals could be recovered. Based on a $1.05 /mbtu and 8000 btu/lb for the high ash coals on a dry basis as well as nearly 7000 hrs of working hours a year, nearly $ 6.7 millions of additional revenue could be generated every year. Understandably this will far offset the increased annual cost of $136, 000 incurred due to the new technologies and result in increased plant profitability.
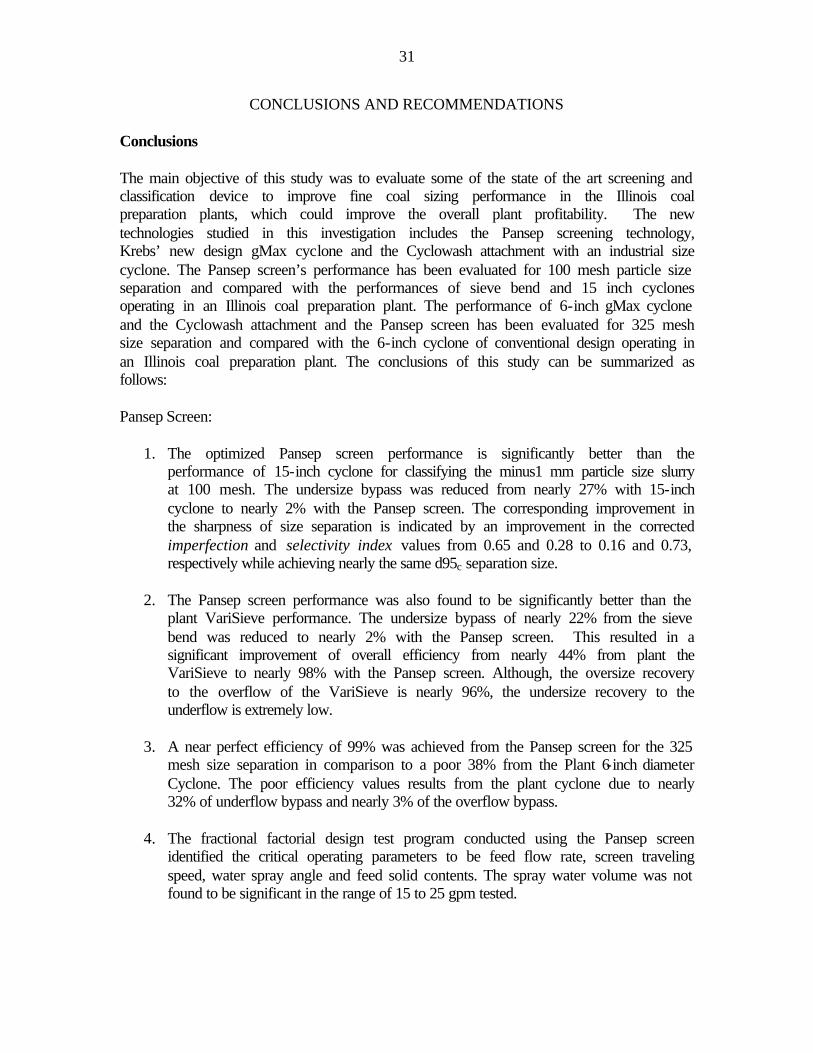
31
CONCLUSIONS AND RECOMMENDATIONS
Conclusions The main objective of this study was to evaluate some of the state of the art screening and classification device to improve fine coal sizing performance in the Illinois coal preparation plants, which could improve the overall plant profitability. The new technologies studied in this investigation includes the Pansep screening technology, Krebs’ new design gMax cyclone and the Cyclowash attachment with an industrial size cyclone. The Pansep screen’s performance has been evaluated for 100 mesh particle size separation and compared with the performances of sieve bend and 15 inch cyclones operating in an Illinois coal preparation plant. The performance of 6-inch gMax cyclone and the Cyclowash attachment and the Pansep screen has been evaluated for 325 mesh size separation and compared with the 6-inch cyclone of conventional design operating in an Illinois coal preparation plant. The conclusions of this study can be summarized as follows: Pansep Screen:
1. The optimized Pansep screen performance is significantly better than the performance of 15-inch cyclone for classifying the minus1 mm particle size slurry at 100 mesh. The undersize bypass was reduced from nearly 27% with 15-inch cyclone to nearly 2% with the Pansep screen. The corresponding improvement in the sharpness of size separation is indicated by an improvement in the corrected imperfection and selectivity index values from 0.65 and 0.28 to 0.16 and 0.73, respectively while achieving nearly the same d95c separation size.
2. The Pansep screen performance was also found to be significantly better than the
plant VariSieve performance. The undersize bypass of nearly 22% from the sieve bend was reduced to nearly 2% with the Pansep screen. This resulted in a significant improvement of overall efficiency from nearly 44% from plant the VariSieve to nearly 98% with the Pansep screen. Although, the oversize recovery to the overflow of the VariSieve is nearly 96%, the undersize recovery to the underflow is extremely low.
3. A near perfect efficiency of 99% was achieved from the Pansep screen for the 325
mesh size separation in comparison to a poor 38% from the Plant 6-inch diameter Cyclone. The poor efficiency values results from the plant cyclone due to nearly 32% of underflow bypass and nearly 3% of the overflow bypass.
4. The fractional factorial design test program conducted using the Pansep screen
identified the critical operating parameters to be feed flow rate, screen traveling speed, water spray angle and feed solid contents. The spray water volume was not found to be significant in the range of 15 to 25 gpm tested.
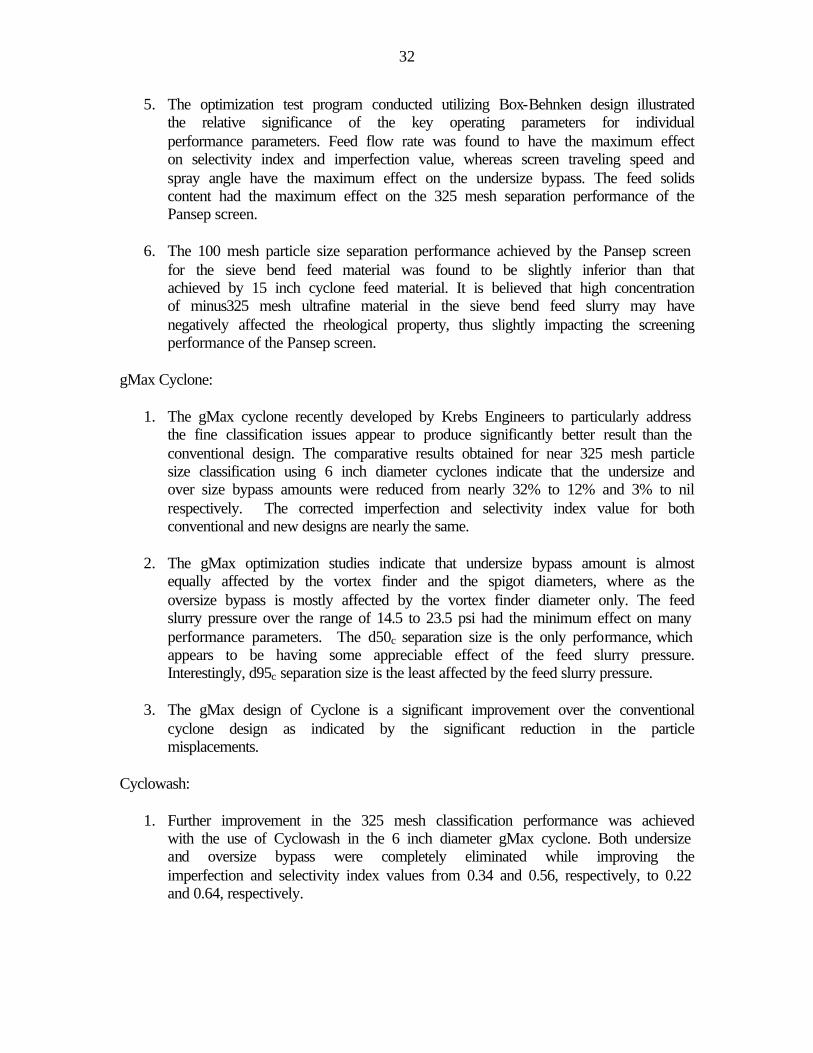
32
5. The optimization test program conducted utilizing Box-Behnken design illustrated the relative significance of the key operating parameters for individual performance parameters. Feed flow rate was found to have the maximum effect on selectivity index and imperfection value, whereas screen traveling speed and spray angle have the maximum effect on the undersize bypass. The feed solids content had the maximum effect on the 325 mesh separation performance of the Pansep screen.
6. The 100 mesh particle size separation performance achieved by the Pansep screen
for the sieve bend feed material was found to be slightly inferior than that achieved by 15 inch cyclone feed material. It is believed that high concentration of minus325 mesh ultrafine material in the sieve bend feed slurry may have negatively affected the rheological property, thus slightly impacting the screening performance of the Pansep screen.
gMax Cyclone:
1. The gMax cyclone recently developed by Krebs Engineers to particularly address the fine classification issues appear to produce significantly better result than the conventional design. The comparative results obtained for near 325 mesh particle size classification using 6 inch diameter cyclones indicate that the undersize and over size bypass amounts were reduced from nearly 32% to 12% and 3% to nil respectively. The corrected imperfection and selectivity index value for both conventional and new designs are nearly the same.
2. The gMax optimization studies indicate that undersize bypass amount is almost
equally affected by the vortex finder and the spigot diameters, where as the oversize bypass is mostly affected by the vortex finder diameter only. The feed slurry pressure over the range of 14.5 to 23.5 psi had the minimum effect on many performance parameters. The d50c separation size is the only performance, which appears to be having some appreciable effect of the feed slurry pressure. Interestingly, d95c separation size is the least affected by the feed slurry pressure.
3. The gMax design of Cyclone is a significant improvement over the conventional
cyclone design as indicated by the significant reduction in the particle misplacements.
Cyclowash:
1. Further improvement in the 325 mesh classification performance was achieved with the use of Cyclowash in the 6 inch diameter gMax cyclone. Both undersize and oversize bypass were completely eliminated while improving the imperfection and selectivity index values from 0.34 and 0.56, respectively, to 0.22 and 0.64, respectively.
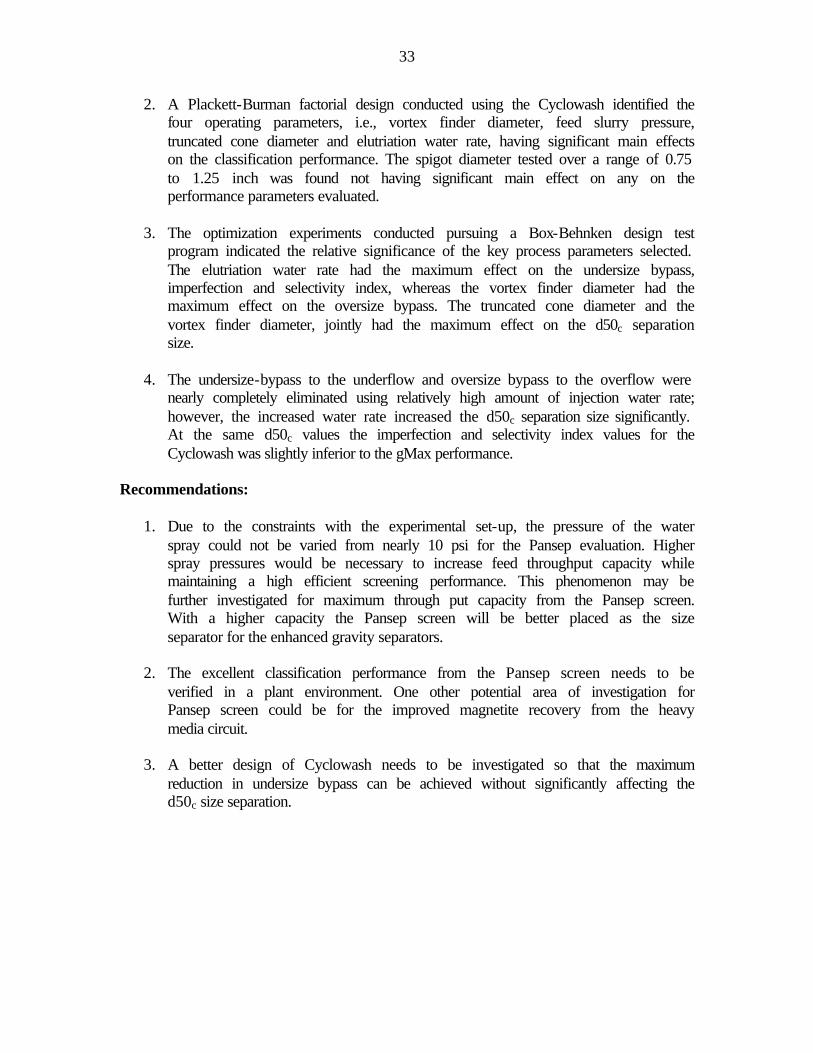
33
2. A Plackett-Burman factorial design conducted using the Cyclowash identified the four operating parameters, i.e., vortex finder diameter, feed slurry pressure, truncated cone diameter and elutriation water rate, having significant main effects on the classification performance. The spigot diameter tested over a range of 0.75 to 1.25 inch was found not having significant main effect on any on the performance parameters evaluated.
3. The optimization experiments conducted pursuing a Box-Behnken design test
program indicated the relative significance of the key process parameters selected. The elutriation water rate had the maximum effect on the undersize bypass, imperfection and selectivity index, whereas the vortex finder diameter had the maximum effect on the oversize bypass. The truncated cone diameter and the vortex finder diameter, jointly had the maximum effect on the d50c separation size.
4. The undersize-bypass to the underflow and oversize bypass to the overflow were
nearly completely eliminated using relatively high amount of injection water rate; however, the increased water rate increased the d50c separation size significantly. At the same d50c values the imperfection and selectivity index values for the Cyclowash was slightly inferior to the gMax performance.
Recommendations:
1. Due to the constraints with the experimental set-up, the pressure of the water spray could not be varied from nearly 10 psi for the Pansep evaluation. Higher spray pressures would be necessary to increase feed throughput capacity while maintaining a high efficient screening performance. This phenomenon may be further investigated for maximum through put capacity from the Pansep screen. With a higher capacity the Pansep screen will be better placed as the size separator for the enhanced gravity separators.
2. The excellent classification performance from the Pansep screen needs to be
verified in a plant environment. One other potential area of investigation for Pansep screen could be for the improved magnetite recovery from the heavy media circuit.
3. A better design of Cyclowash needs to be investigated so that the maximum
reduction in undersize bypass can be achieved without significantly affecting the d50c size separation.
34
ACKNOWLEDGEMENT
The Principal Investigator greatly appreciates the dedicated effort of his research team, which includes Mr. Richard Geilhausen, Mr. Ayan Pailt, Mr. Bikash Dube, Mr. Ping Han and Ms. Nancy Stetler, for the completion of this research project. The project co-operation received from the American Coal Company, Krebs Engineers, Dewar Inc. and the Waltech group is also greatly appreciated. In particular, the consultations of Robert Moorhead and Tim Olson from the Krebs’ Engineers and Kobus Reyeneke of the Waltech group as well as the inventor of the Pansep screen, Dr. Rein Buissman are truly appreciated. The help of Mr. Hunter Davis of American Coal Company in the bulk sample collection and the plant sampling is duly appreciated.
REFERENCES
1. Brown, J. V., Buisman, R., Imhof R. M., 2000, “paper- Cost savings Potentials of Pansep Screening Technology,” proceedings Major Trends in Development of Sulfide Ores Up-Grading in the 21st century, Norilisk, April 24-28.
2. Buisman Rein, Kobus Reyneke, 2000, “Fine Coal Screening Using the New
Pansep Screen,” proceedings, 17th International Coal Preparation Conference, Lexington, Kentucky, 71-85.
3. Buisman Rein, 2001; Business Communications
4. Olson, Tim, 2001, Krebs’ Engineers, “Business communication”, Krebs
Engineers
5. Moorhead, Robert, 2001, “Business communication”, Krebs Engineers
6. Reyneke, Kobus, 2000, “Business Communication,” Waltech Group
7. WWW. pansep. com
8. WWW. krebs. com
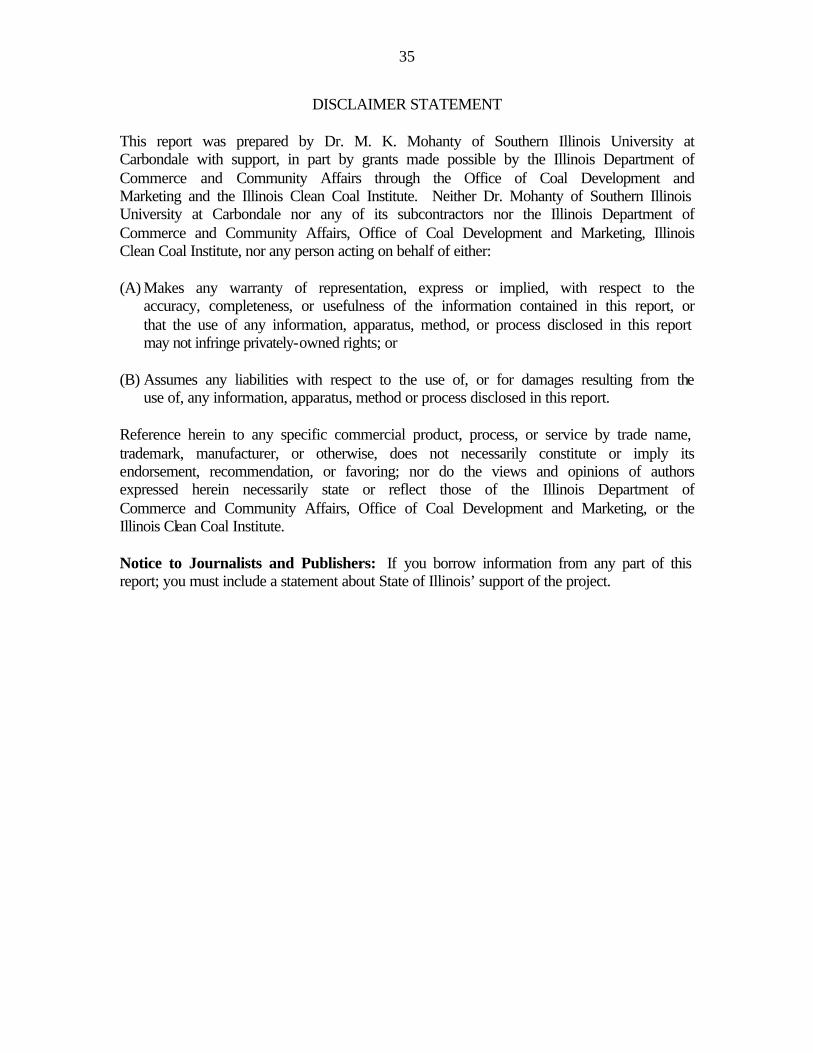
35
DISCLAIMER STATEMENT This report was prepared by Dr. M. K. Mohanty of Southern Illinois University at Carbondale with support, in part by grants made possible by the Illinois Department of Commerce and Community Affairs through the Office of Coal Development and Marketing and the Illinois Clean Coal Institute. Neither Dr. Mohanty of Southern Illinois University at Carbondale nor any of its subcontractors nor the Illinois Department of Commerce and Community Affairs, Office of Coal Development and Marketing, Illinois Clean Coal Institute, nor any person acting on behalf of either: (A) Makes any warranty of representation, express or implied, with respect to the
accuracy, completeness, or usefulness of the information contained in this report, or that the use of any information, apparatus, method, or process disclosed in this report may not infringe privately-owned rights; or
(B) Assumes any liabilities with respect to the use of, or for damages resulting from the
use of, any information, apparatus, method or process disclosed in this report. Reference herein to any specific commercial product, process, or service by trade name, trademark, manufacturer, or otherwise, does not necessarily constitute or imply its endorsement, recommendation, or favoring; nor do the views and opinions of authors expressed herein necessarily state or reflect those of the Illinois Department of Commerce and Community Affairs, Office of Coal Development and Marketing, or the Illinois Clean Coal Institute. Notice to Journalists and Publishers: If you borrow information from any part of this report; you must include a statement about State of Illinois’ support of the project.

36
Appendix- I
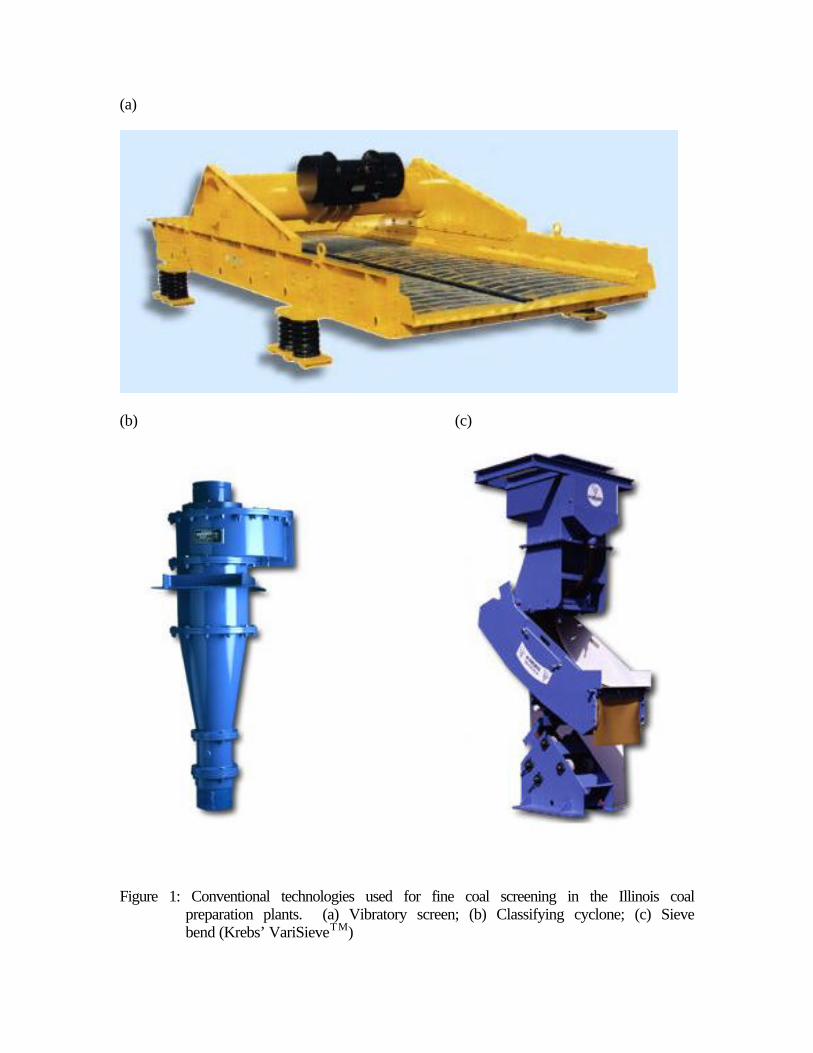
(a)
(b) (c)
Figure 1: Conventional technologies used for fine coal screening in the Illinois coal
preparation plants. (a) Vibratory screen; (b) Classifying cyclone; (c) Sieve bend (Krebs’ VariSieveTM)
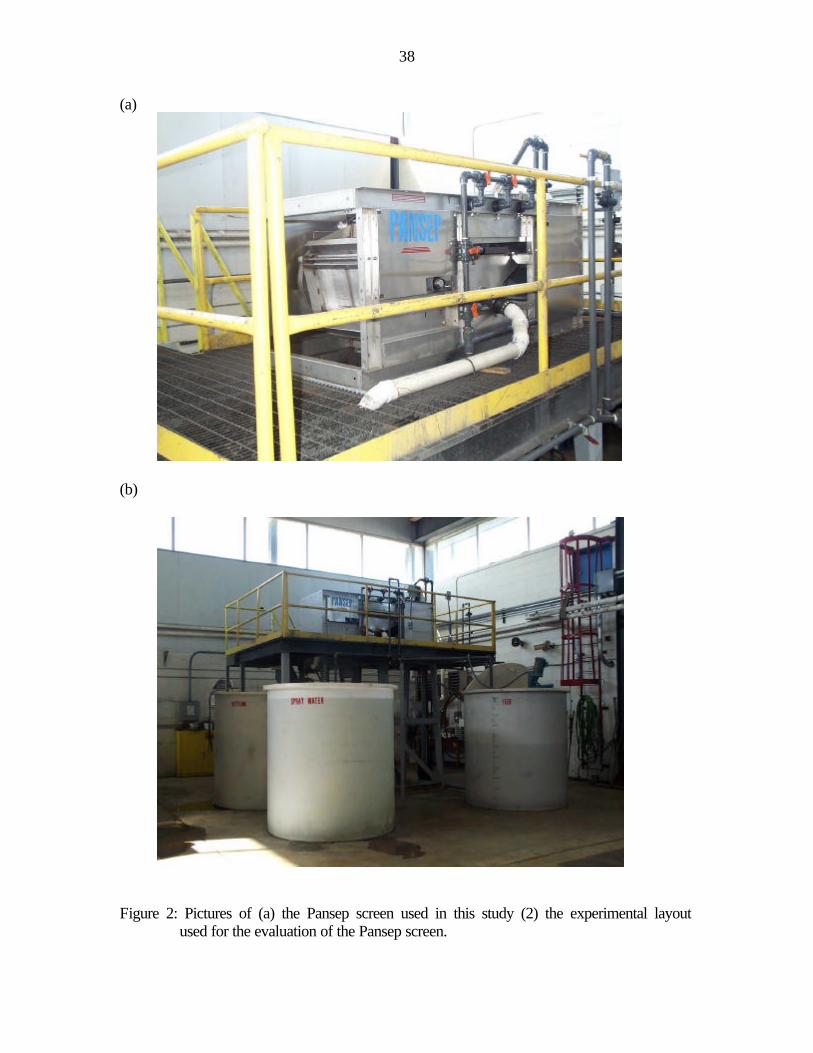
38
(a) (b)
Figure 2: Pictures of (a) the Pansep screen used in this study (2) the experimental layout
used for the evaluation of the Pansep screen.
39
Figure 3: Geometric comparison of gMax cyclone with the traditional Krebs’ cyclone
design.
Comparison of Different Cyclone DesignsComparison of Different Cyclone Designs
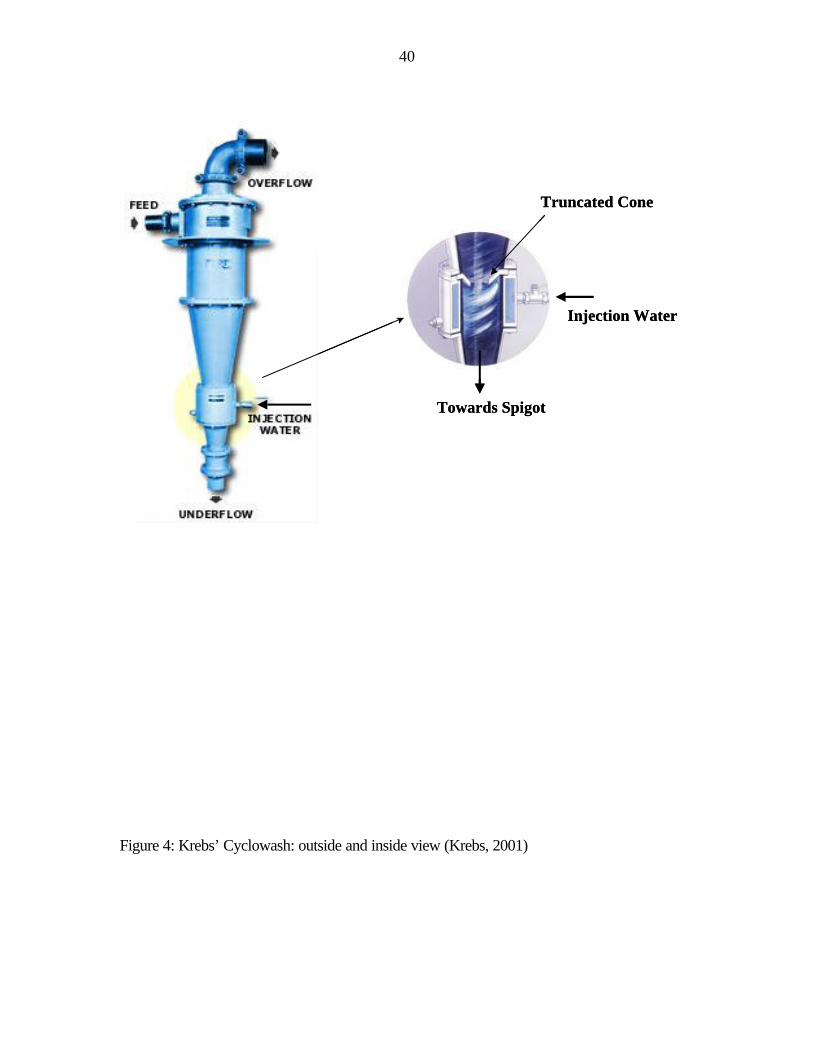
40
Figure 4: Krebs’ Cyclowash: outside and inside view (Krebs, 2001)
Truncated Cone
Injection Water
Towards Spigot
Truncated Cone
Injection Water
Towards Spigot
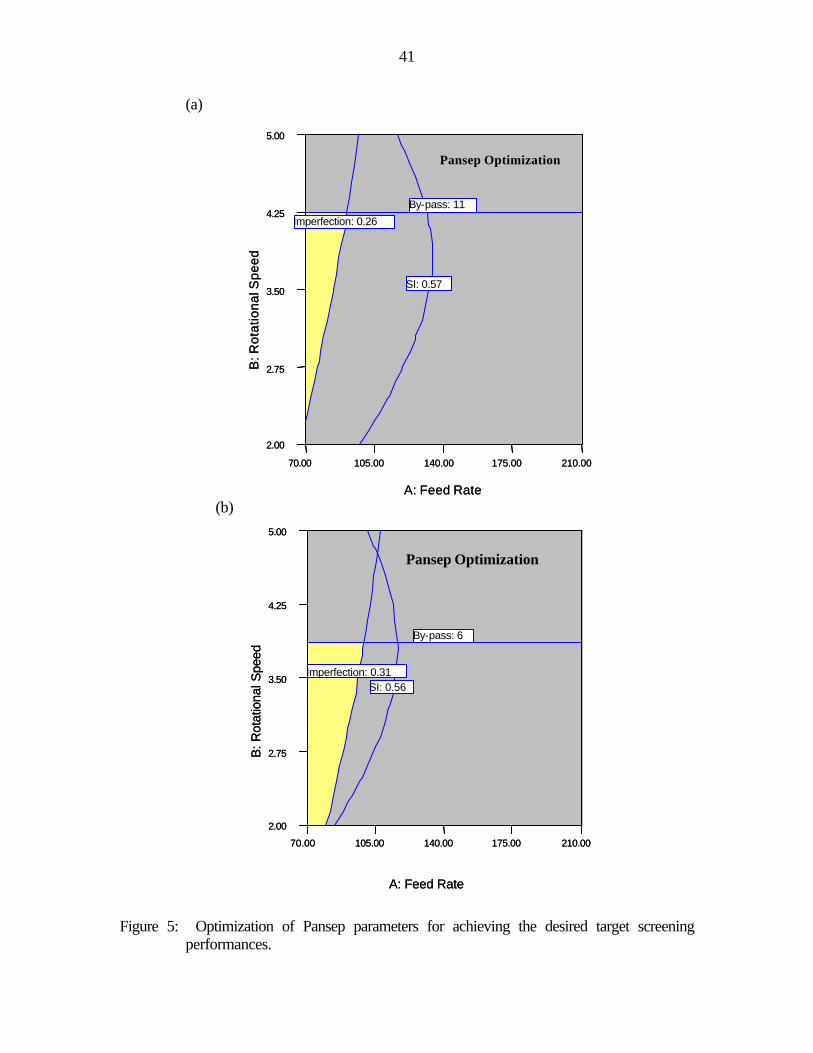
41
(a)
(b)
Figure 5: Optimization of Pansep parameters for achieving the desired target screening
performances.
A: Feed Rate
B: R
otat
iona
l Spe
ed
70.00 105.00 140.00 175.00 210.00
2.00
2.75
3.50
4.25
5.00
Imperfection: 0.31SI: 0.56
By-pass: 6
Pansep Optimization
A: Feed Rate
B: R
otat
iona
l Spe
ed
70.00 105.00 140.00 175.00 210.00
2.00
2.75
3.50
4.25
5.00
Imperfection: 0.31SI: 0.56
By-pass: 6
Pansep Optimization
A: Feed Rate
B: R
otat
iona
l Spe
ed
70.00 105.00 140.00 175.00 210.00
2.00
2.75
3.50
4.25
5.00
Imperfection: 0.26
SI: 0.57
By-pass: 11
Pansep Optimization
A: Feed Rate
B: R
otat
iona
l Spe
ed
70.00 105.00 140.00 175.00 210.00
2.00
2.75
3.50
4.25
5.00
Imperfection: 0.26
SI: 0.57
By-pass: 11
Pansep Optimization
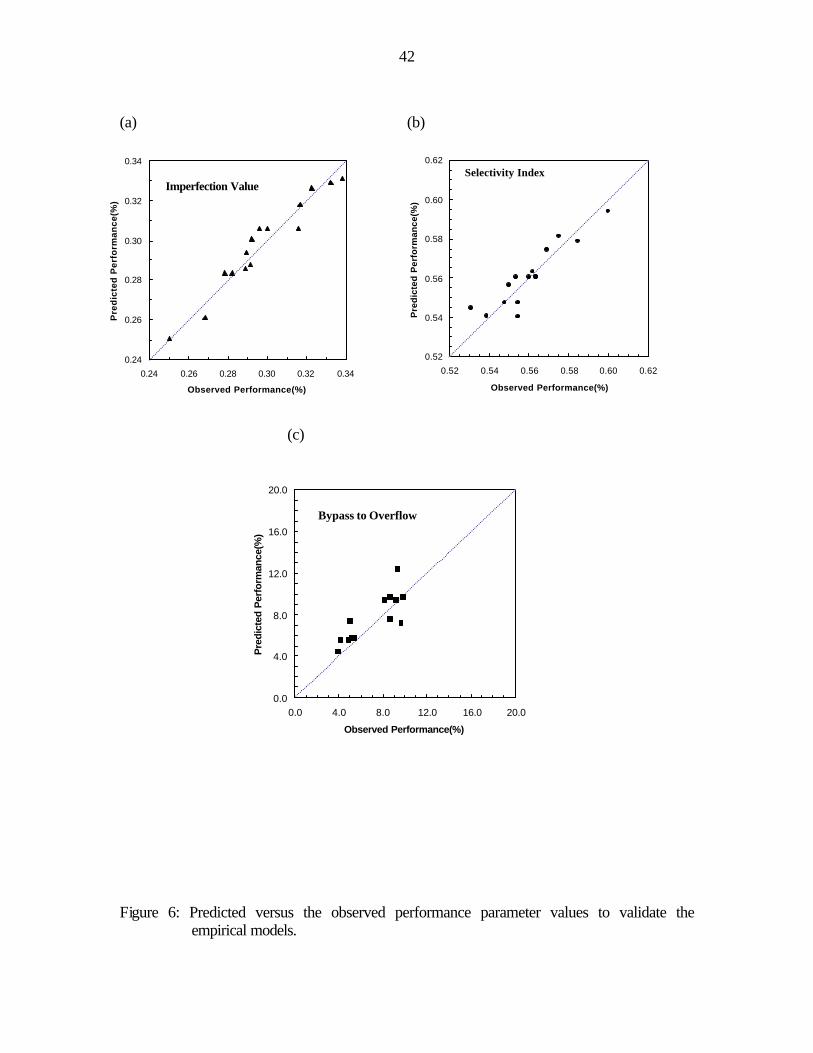
42
(a) (b)
(c)
Figure 6: Predicted versus the observed performance parameter values to validate the
empirical models.
0.24
0.26
0.28
0.30
0.32
0.34
0.24 0.26 0.28 0.30 0.32 0.34
Observed Performance(%)
Pre
dic
ted
Per
form
ance
(%)
Imperfection Value
0.52
0.54
0.56
0.58
0.60
0.62
0.52 0.54 0.56 0.58 0.60 0.62
Observed Performance(%)
Pre
dic
ted
Per
form
ance
(%)
Selectivity Index
0.0
4.0
8.0
12.0
16.0
20.0
0.0 4.0 8.0 12.0 16.0 20.0
Observed Performance(%)
Pre
dict
ed P
erfo
rman
ce(%
)
Bypass to Overflow
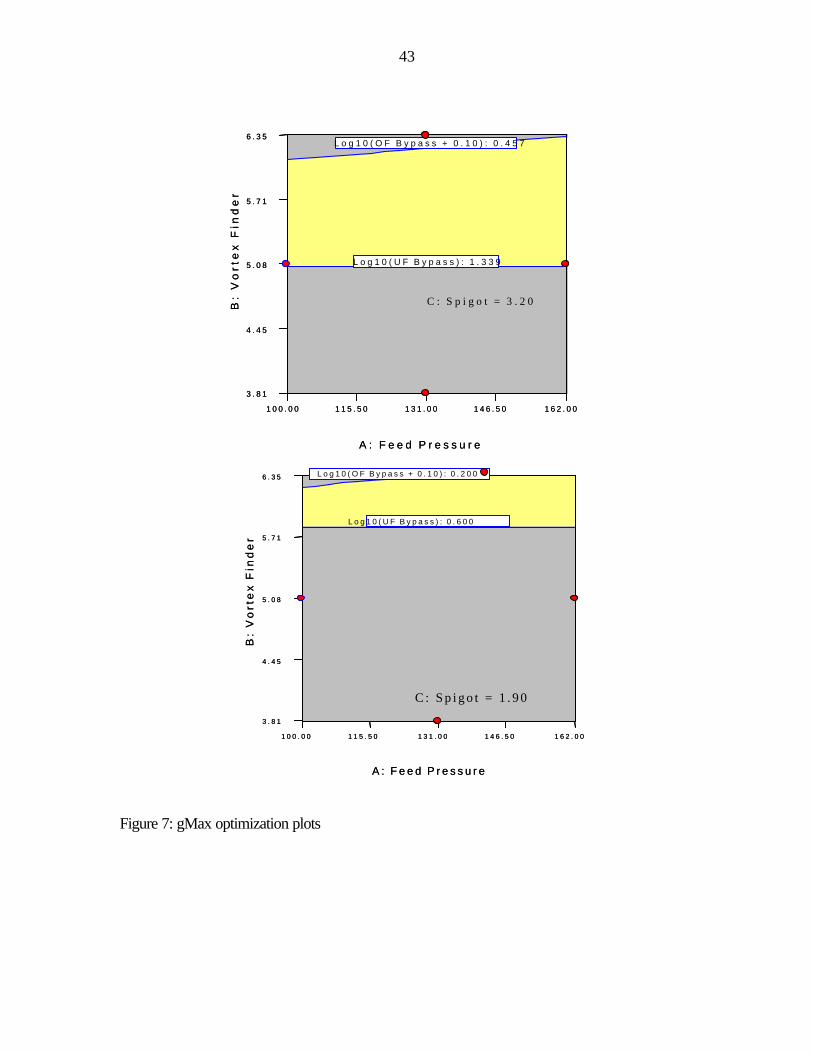
43
Figure 7: gMax optimization plots
A : F e e d P r e s s u r e
B:
Vo
rte
x F
ind
er
1 0 0 . 0 0 1 1 5 . 5 0 1 3 1 . 0 0 1 4 6 . 5 0 1 6 2 . 0 0
3 . 8 1
4 . 4 5
5 . 0 8
5 . 7 1
6 . 3 5
L o g 1 0 ( U F B y p a s s ) : 1 . 3 3 9
L o g 1 0 ( O F B y p a s s + 0 . 1 0 ) : 0 . 4 5 7
C : S p i g o t = 3 . 2 0
A : F e e d P r e s s u r e
B:
Vo
rte
x F
ind
er
1 0 0 . 0 0 1 1 5 . 5 0 1 3 1 . 0 0 1 4 6 . 5 0 1 6 2 . 0 0
3 . 8 1
4 . 4 5
5 . 0 8
5 . 7 1
6 . 3 5
L o g 1 0 ( U F B y p a s s ) : 1 . 3 3 9
L o g 1 0 ( O F B y p a s s + 0 . 1 0 ) : 0 . 4 5 7
C : S p i g o t = 3 . 2 0
A : F e e d P r e s s u r e
B:
Vo
rte
x F
ind
er
1 0 0 . 0 0 1 1 5 . 5 0 1 3 1 . 0 0 1 4 6 . 5 0 1 6 2 . 0 0
3 . 8 1
4 . 4 5
5 . 0 8
5 . 7 1
6 . 3 5
L o g 1 0 ( U F B y p a s s ) : 0 . 6 0 0
L o g 1 0 ( O F B y p a s s + 0 . 1 0 ) : 0 . 2 0 0
C : S p i g o t = 1 . 9 0
A : F e e d P r e s s u r e
B:
Vo
rte
x F
ind
er
1 0 0 . 0 0 1 1 5 . 5 0 1 3 1 . 0 0 1 4 6 . 5 0 1 6 2 . 0 0
3 . 8 1
4 . 4 5
5 . 0 8
5 . 7 1
6 . 3 5
L o g 1 0 ( U F B y p a s s ) : 0 . 6 0 0
L o g 1 0 ( O F B y p a s s + 0 . 1 0 ) : 0 . 2 0 0
C : S p i g o t = 1 . 9 0
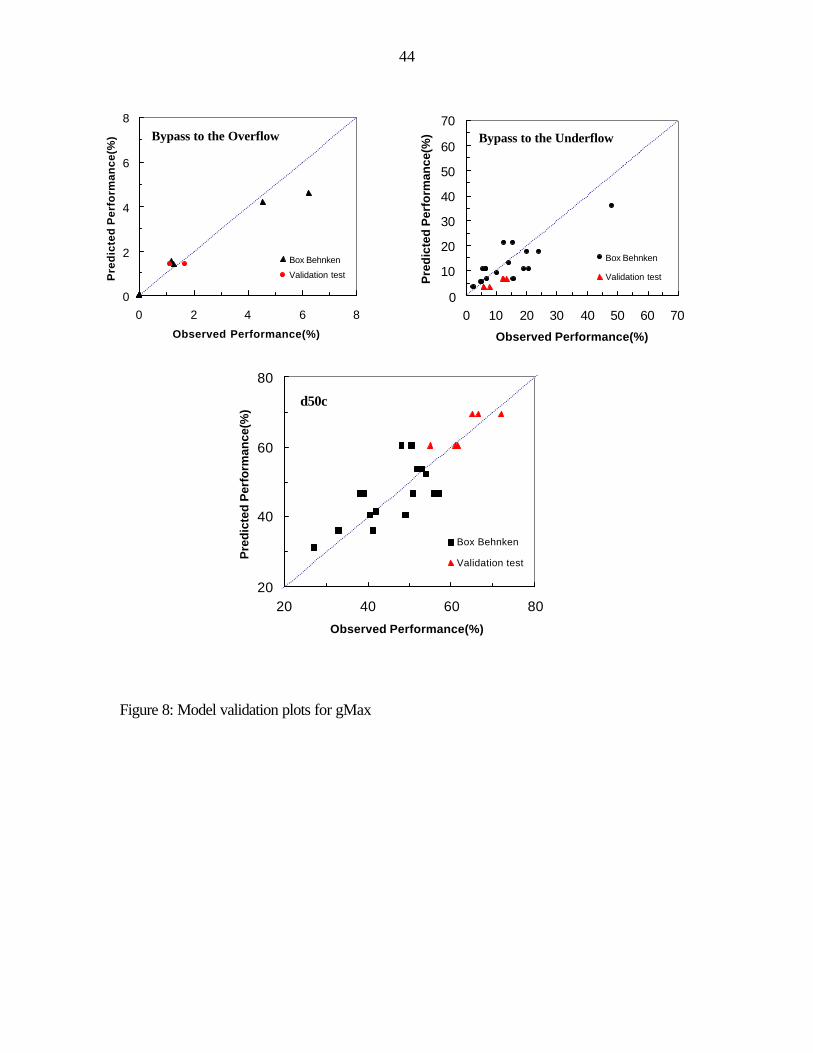
44
Figure 8: Model validation plots for gMax
0
2
4
6
8
0 2 4 6 8
Observed Performance(%)
Pre
dic
ted
Per
form
ance
(%)
Box Behnken
Validation test
Bypass to the Overflow
0
10
20
30
40
50
60
70
0 10 20 30 40 50 60 70
Observed Performance(%)
Pre
dict
ed P
erfo
rman
ce(%
)
Box Behnken
Validation test
Bypass to the Underflow
20
40
60
80
20 40 60 80
Observed Performance(%)
Pre
dict
ed P
erfo
rman
ce(%
)
Box Behnken
Validation test
d50c
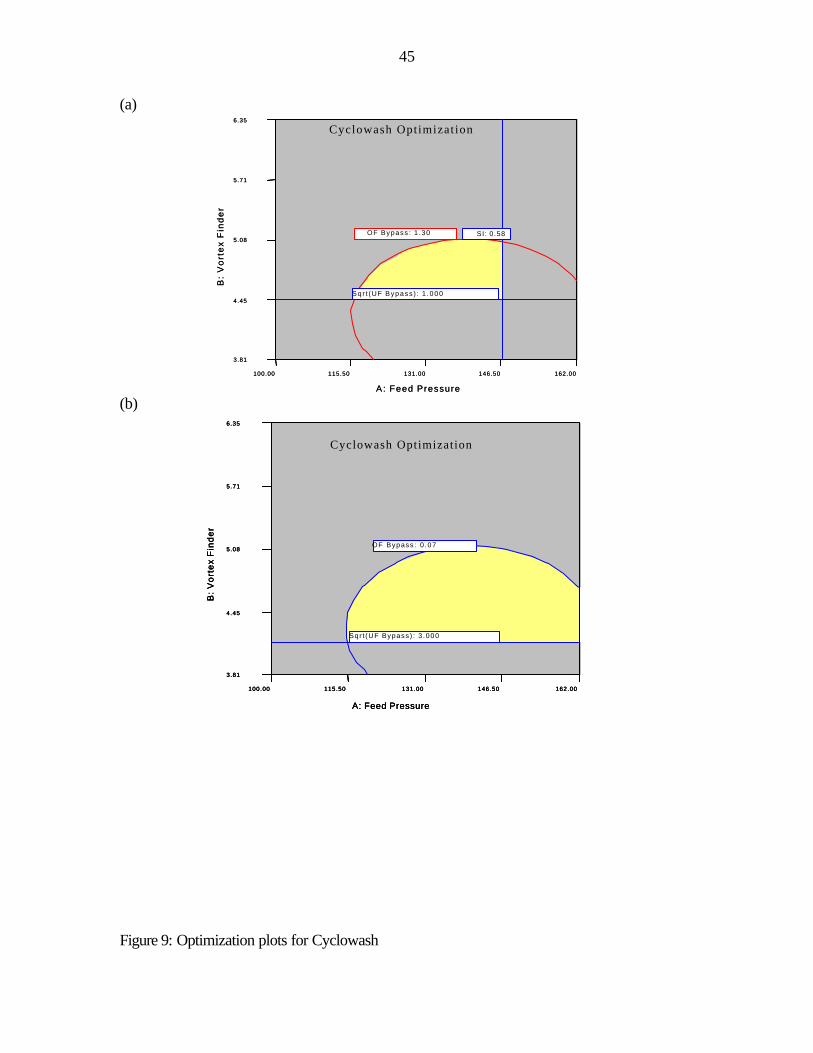
45
(a)
(b)
Figure 9: Optimization plots for Cyclowash
A: Feed Pressure
B:
Vo
rte
x F
ind
er
100.00 115.50 131.00 146.50 162.00
3.81
4.45
5.08
5.71
6.35
SI: 0.58
Sqr t (UF Bypass ) : 1 .000
OF Bypass: 1 .30
Cyclowash Optimizat ion
A: Feed Pressure
B:
Vo
rte
x F
ind
er
100.00 115.50 131.00 146.50 162.00
3.81
4.45
5.08
5.71
6.35
SI: 0.58
Sqr t (UF Bypass ) : 1 .000
OF Bypass: 1 .30
Cyclowash Optimizat ion
A: Feed Pressure
B:
Vo
rte
x F
ind
er
100.00 115.50 131.00 146.50 162.00
3.81
4.45
5.08
5.71
6.35
Sqr t (UF Bypass) : 3 .000
OF Bypass: 0 .07
Cyclowash Optimization
A: Feed Pressure
B:
Vo
rte
x F
ind
er
100.00 115.50 131.00 146.50 162.00
3.81
4.45
5.08
5.71
6.35
Sqr t (UF Bypass) : 3 .000
OF Bypass: 0 .07
A: Feed Pressure
B:
Vo
rte
x F
ind
er
100.00 115.50 131.00 146.50 162.00
3.81
4.45
5.08
5.71
6.35
Sqr t (UF Bypass) : 3 .000
OF Bypass: 0 .07
Cyclowash Optimization
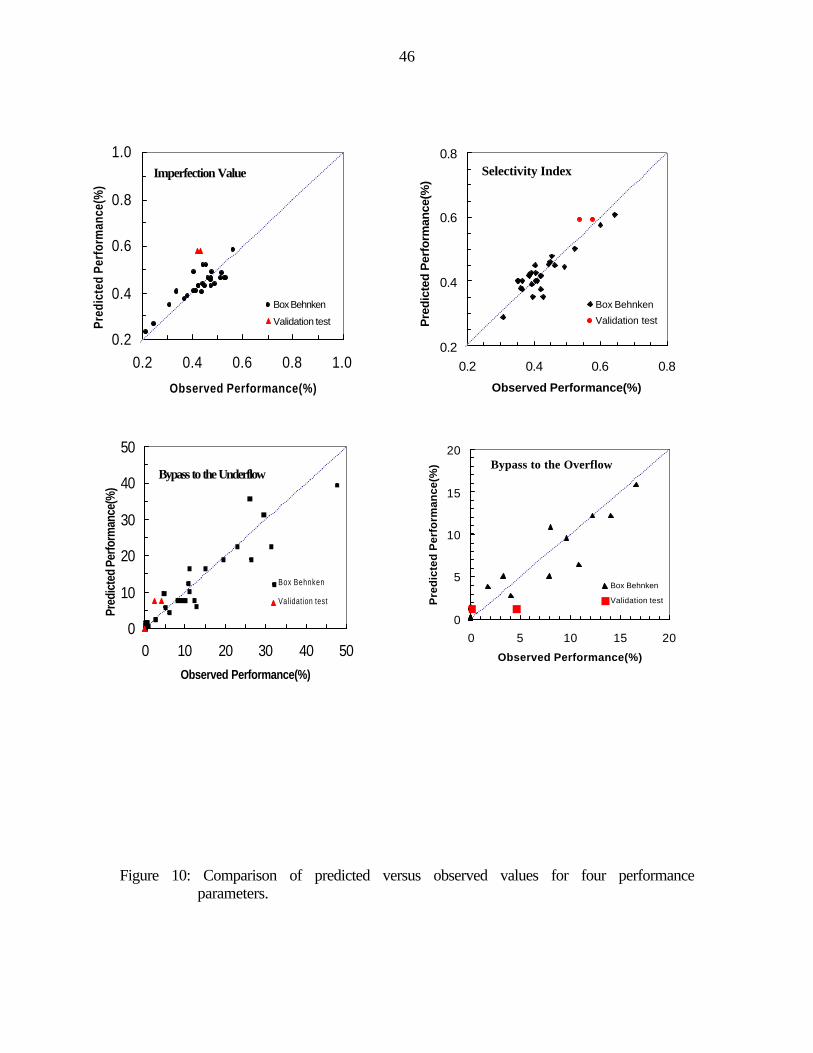
46
Figure 10: Comparison of predicted versus observed values for four performance
parameters.
0.2
0.4
0.6
0.8
1.0
0.2 0.4 0.6 0.8 1.0
Observed Performance(%)
Pred
icte
d Pe
rfor
man
ce(%
)
Box Behnken
Validation test
Imperfection Value
0.2
0.4
0.6
0.8
0.2 0.4 0.6 0.8
Observed Performance(%)
Pre
dict
ed P
erfo
rman
ce(%
)
Box Behnken
Validation test
Selectivity Index
0
10
20
30
40
50
0 10 20 30 40 50Observed Performance(%)
Pred
icte
d Pe
rform
ance
(%)
Box Behnken
Validation test
Bypass to the Underflow
0
5
10
15
20
0 5 10 15 20
Observed Performance(%)
Pre
dic
ted
Per
form
ance
(%)
Box Behnken
Validation test
Bypass to the Overflow

47
Appendix-II
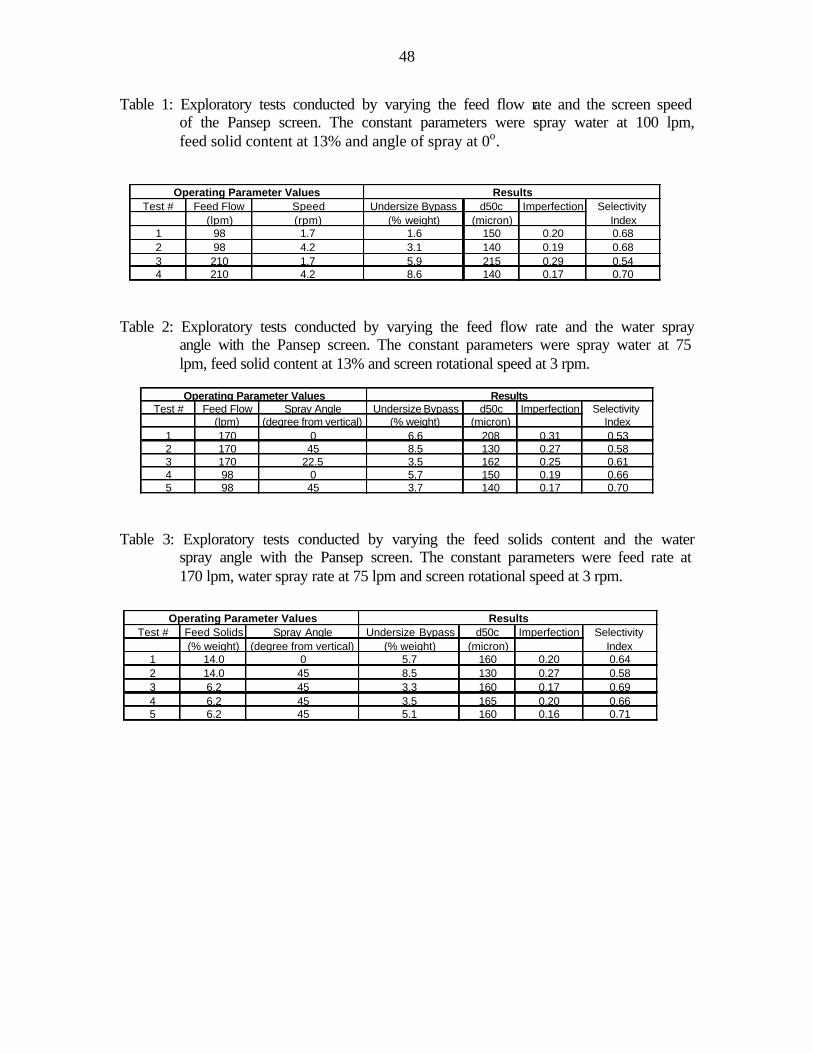
48
Table 1: Exploratory tests conducted by varying the feed flow rate and the screen speed of the Pansep screen. The constant parameters were spray water at 100 lpm, feed solid content at 13% and angle of spray at 0o.
Table 2: Exploratory tests conducted by varying the feed flow rate and the water spray
angle with the Pansep screen. The constant parameters were spray water at 75 lpm, feed solid content at 13% and screen rotational speed at 3 rpm.
Table 3: Exploratory tests conducted by varying the feed solids content and the water
spray angle with the Pansep screen. The constant parameters were feed rate at 170 lpm, water spray rate at 75 lpm and screen rotational speed at 3 rpm.
Test # Feed Flow Speed Undersize Bypass d50c Imperfection Selectivity (lpm) (rpm) (% weight) (micron) Index
1 98 1.7 1.6 150 0.20 0.682 98 4.2 3.1 140 0.19 0.683 210 1.7 5.9 215 0.29 0.544 210 4.2 8.6 140 0.17 0.70
Operating Parameter Values Results
Test # Feed Flow Spray Angle Undersize Bypass d50c Imperfection Selectivity (lpm) (degree from vertical) (% weight) (micron) Index
1 170 0 6.6 208 0.31 0.532 170 45 8.5 130 0.27 0.583 170 22.5 3.5 162 0.25 0.614 98 0 5.7 150 0.19 0.665 98 45 3.7 140 0.17 0.70
Operating Parameter Values Results
Test # Feed Solids Spray Angle Undersize Bypass d50c Imperfection Selectivity (% weight) (degree from vertical) (% weight) (micron) Index
1 14.0 0 5.7 160 0.20 0.642 14.0 45 8.5 130 0.27 0.583 6.2 45 3.3 160 0.17 0.694 6.2 45 3.5 165 0.20 0.665 6.2 45 5.1 160 0.16 0.71
Operating Parameter Values Results
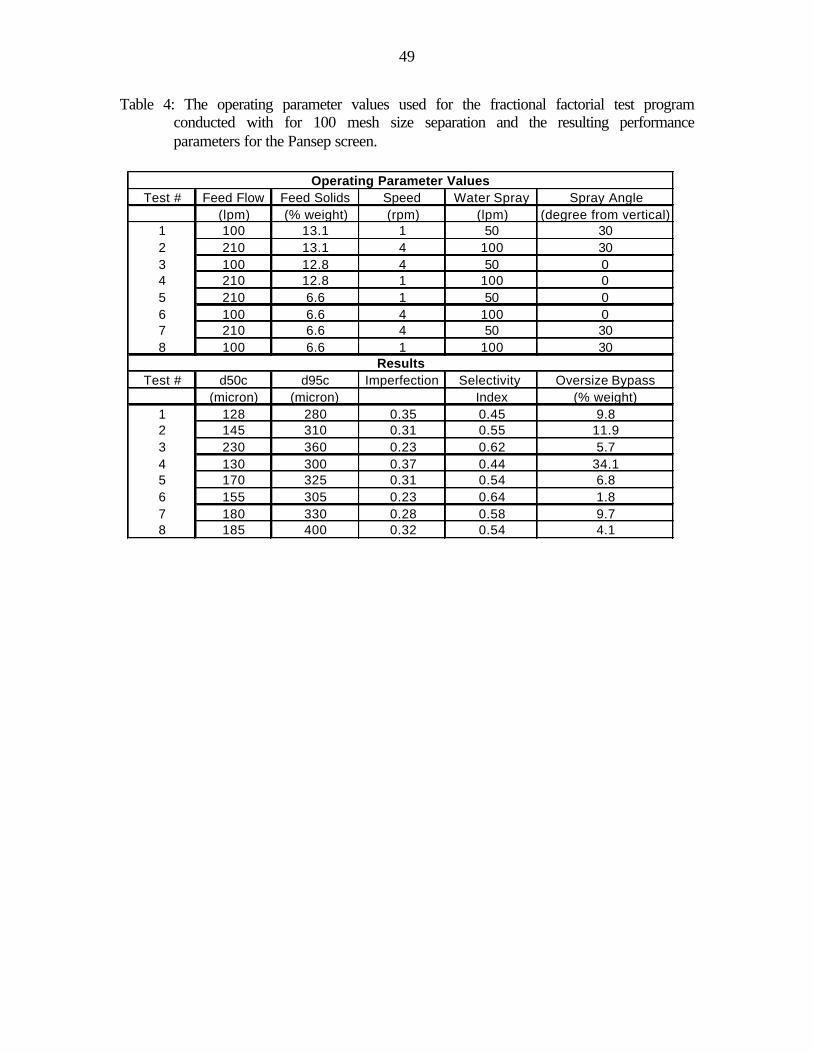
49
Table 4: The operating parameter values used for the fractional factorial test program conducted with for 100 mesh size separation and the resulting performance parameters for the Pansep screen.
Test # Feed Flow Feed Solids Speed Water Spray Spray Angle(lpm) (% weight) (rpm) (lpm) (degree from vertical)
1 100 13.1 1 50 302 210 13.1 4 100 303 100 12.8 4 50 04 210 12.8 1 100 05 210 6.6 1 50 06 100 6.6 4 100 07 210 6.6 4 50 308 100 6.6 1 100 30
Test # d50c d95c Imperfection Selectivity Oversize Bypass(micron) (micron) Index (% weight)
1 128 280 0.35 0.45 9.82 145 310 0.31 0.55 11.93 230 360 0.23 0.62 5.74 130 300 0.37 0.44 34.15 170 325 0.31 0.54 6.86 155 305 0.23 0.64 1.87 180 330 0.28 0.58 9.78 185 400 0.32 0.54 4.1
Operating Parameter Values
Results
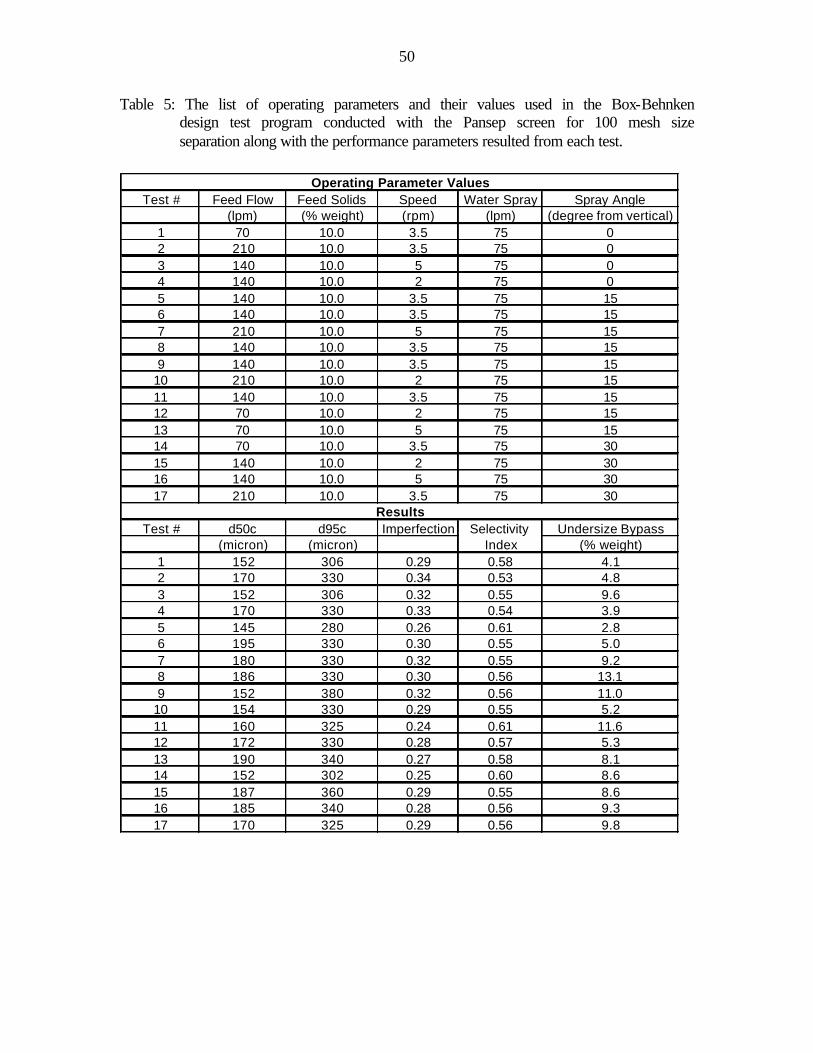
50
Table 5: The list of operating parameters and their values used in the Box-Behnken design test program conducted with the Pansep screen for 100 mesh size separation along with the performance parameters resulted from each test.
Test # Feed Flow Feed Solids Speed Water Spray Spray Angle(lpm) (% weight) (rpm) (lpm) (degree from vertical)
1 70 10.0 3.5 75 02 210 10.0 3.5 75 03 140 10.0 5 75 04 140 10.0 2 75 05 140 10.0 3.5 75 156 140 10.0 3.5 75 157 210 10.0 5 75 158 140 10.0 3.5 75 159 140 10.0 3.5 75 15
10 210 10.0 2 75 1511 140 10.0 3.5 75 1512 70 10.0 2 75 1513 70 10.0 5 75 1514 70 10.0 3.5 75 3015 140 10.0 2 75 3016 140 10.0 5 75 3017 210 10.0 3.5 75 30
Test # d50c d95c Imperfection Selectivity Undersize Bypass(micron) (micron) Index (% weight)
1 152 306 0.29 0.58 4.12 170 330 0.34 0.53 4.83 152 306 0.32 0.55 9.64 170 330 0.33 0.54 3.95 145 280 0.26 0.61 2.86 195 330 0.30 0.55 5.07 180 330 0.32 0.55 9.28 186 330 0.30 0.56 13.19 152 380 0.32 0.56 11.0
10 154 330 0.29 0.55 5.211 160 325 0.24 0.61 11.612 172 330 0.28 0.57 5.313 190 340 0.27 0.58 8.114 152 302 0.25 0.60 8.615 187 360 0.29 0.55 8.616 185 340 0.28 0.56 9.317 170 325 0.29 0.56 9.8
Operating Parameter Values
Results
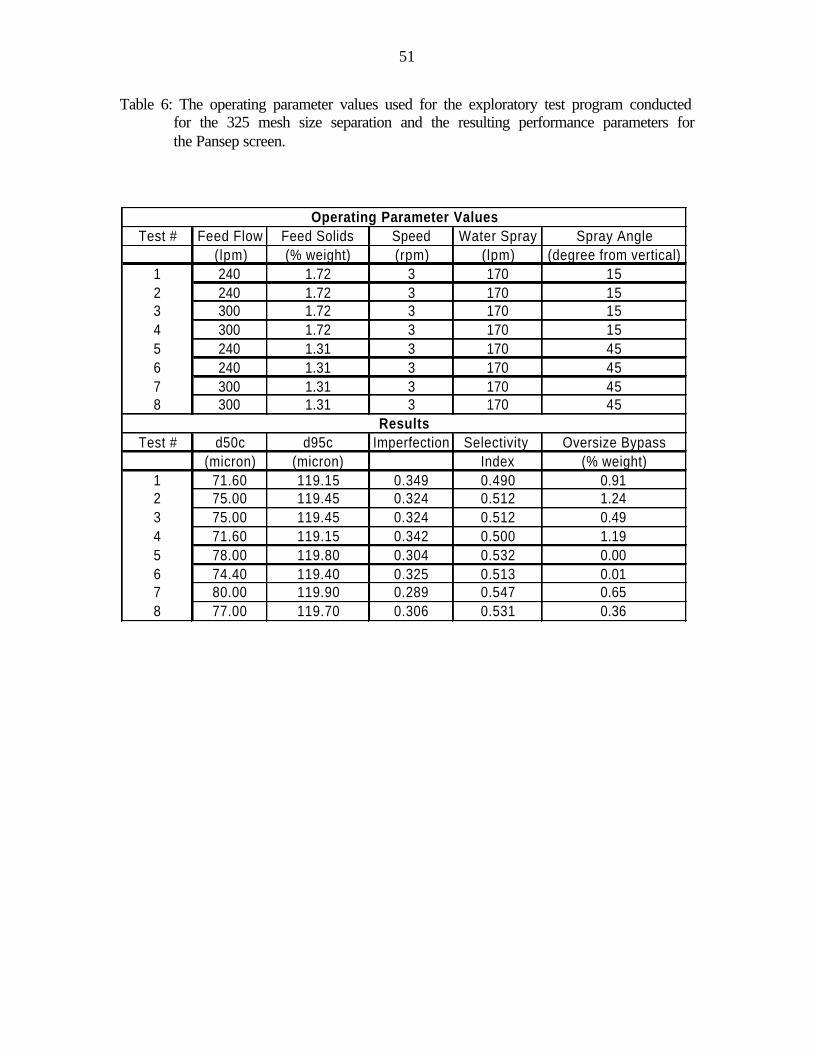
51
Table 6: The operating parameter values used for the exploratory test program conducted for the 325 mesh size separation and the resulting performance parameters for the Pansep screen.
Test # Feed Flow Feed Solids Speed Water Spray Spray Angle(lpm) (% weight) (rpm) (lpm) (degree from vertical)
1 240 1.72 3 170 152 240 1.72 3 170 153 300 1.72 3 170 154 300 1.72 3 170 155 240 1.31 3 170 456 240 1.31 3 170 457 300 1.31 3 170 458 300 1.31 3 170 45
Test # d50c d95c Imperfection Selectivity Oversize Bypass(micron) (micron) Index (% weight)
1 71.60 119.15 0.349 0.490 0.912 75.00 119.45 0.324 0.512 1.243 75.00 119.45 0.324 0.512 0.494 71.60 119.15 0.342 0.500 1.195 78.00 119.80 0.304 0.532 0.006 74.40 119.40 0.325 0.513 0.017 80.00 119.90 0.289 0.547 0.658 77.00 119.70 0.306 0.531 0.36
Operating Parameter Values
Results
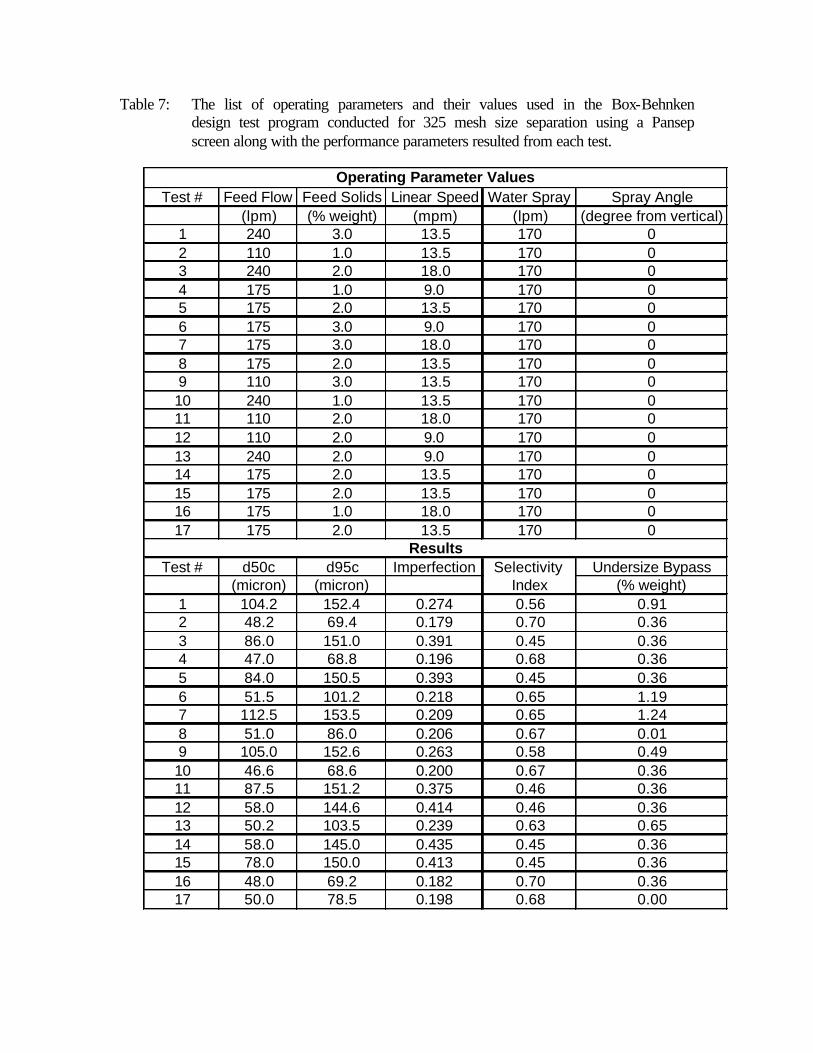
Table 7: The list of operating parameters and their values used in the Box-Behnken design test program conducted for 325 mesh size separation using a Pansep screen along with the performance parameters resulted from each test.
Test # Feed Flow Feed Solids Linear Speed Water Spray Spray Angle(lpm) (% weight) (mpm) (lpm) (degree from vertical)
1 240 3.0 13.5 170 02 110 1.0 13.5 170 03 240 2.0 18.0 170 04 175 1.0 9.0 170 05 175 2.0 13.5 170 06 175 3.0 9.0 170 07 175 3.0 18.0 170 08 175 2.0 13.5 170 09 110 3.0 13.5 170 010 240 1.0 13.5 170 011 110 2.0 18.0 170 012 110 2.0 9.0 170 013 240 2.0 9.0 170 014 175 2.0 13.5 170 015 175 2.0 13.5 170 016 175 1.0 18.0 170 017 175 2.0 13.5 170 0
Test # d50c d95c Imperfection Selectivity Undersize Bypass(micron) (micron) Index (% weight)
1 104.2 152.4 0.274 0.56 0.912 48.2 69.4 0.179 0.70 0.363 86.0 151.0 0.391 0.45 0.364 47.0 68.8 0.196 0.68 0.365 84.0 150.5 0.393 0.45 0.366 51.5 101.2 0.218 0.65 1.197 112.5 153.5 0.209 0.65 1.248 51.0 86.0 0.206 0.67 0.019 105.0 152.6 0.263 0.58 0.4910 46.6 68.6 0.200 0.67 0.3611 87.5 151.2 0.375 0.46 0.3612 58.0 144.6 0.414 0.46 0.3613 50.2 103.5 0.239 0.63 0.6514 58.0 145.0 0.435 0.45 0.3615 78.0 150.0 0.413 0.45 0.3616 48.0 69.2 0.182 0.70 0.3617 50.0 78.5 0.198 0.68 0.00
Operating Parameter Values
Results
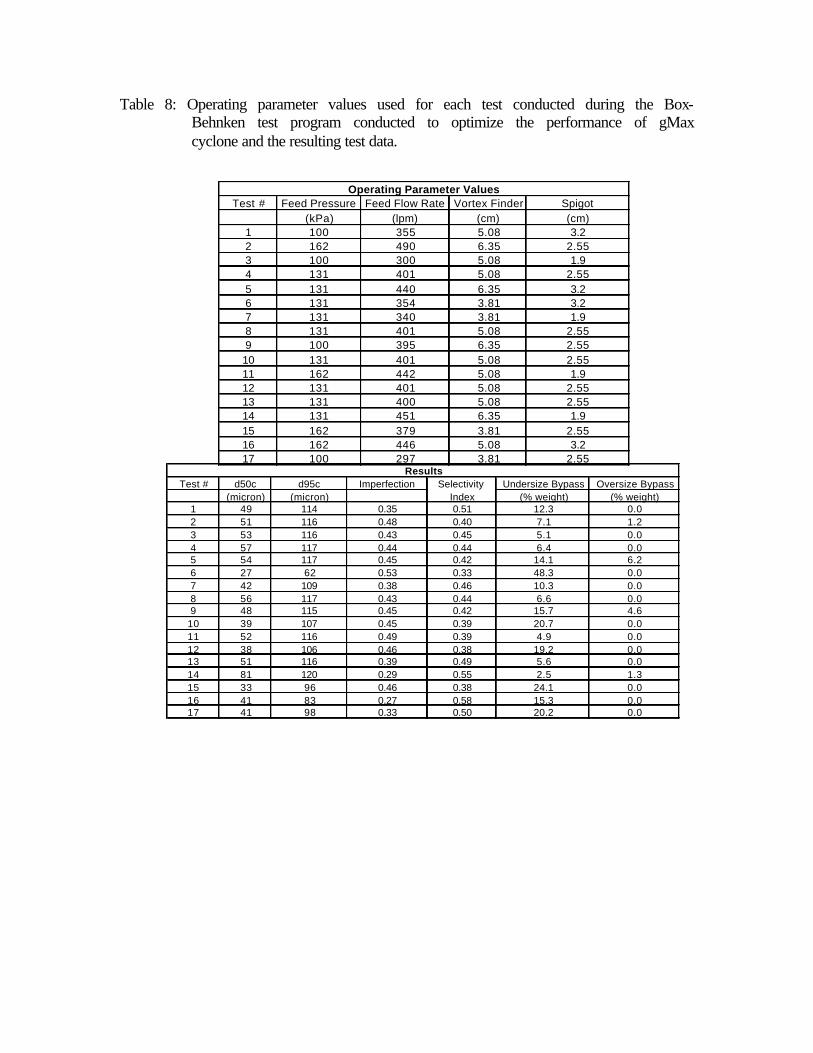
Table 8: Operating parameter values used for each test conducted during the Box-Behnken test program conducted to optimize the performance of gMax cyclone and the resulting test data.
Test # Feed Pressure Feed Flow Rate Vortex Finder Spigot(kPa) (lpm) (cm) (cm)
1 100 355 5.08 3.22 162 490 6.35 2.553 100 300 5.08 1.94 131 401 5.08 2.555 131 440 6.35 3.26 131 354 3.81 3.27 131 340 3.81 1.98 131 401 5.08 2.559 100 395 6.35 2.5510 131 401 5.08 2.5511 162 442 5.08 1.912 131 401 5.08 2.5513 131 400 5.08 2.5514 131 451 6.35 1.915 162 379 3.81 2.5516 162 446 5.08 3.217 100 297 3.81 2.55
Operating Parameter Values
Test # d50c d95c Imperfection Selectivity Undersize Bypass Oversize Bypass(micron) (micron) Index (% weight) (% weight)
1 49 114 0.35 0.51 12.3 0.02 51 116 0.48 0.40 7.1 1.23 53 116 0.43 0.45 5.1 0.04 57 117 0.44 0.44 6.4 0.05 54 117 0.45 0.42 14.1 6.26 27 62 0.53 0.33 48.3 0.07 42 109 0.38 0.46 10.3 0.08 56 117 0.43 0.44 6.6 0.09 48 115 0.45 0.42 15.7 4.6
10 39 107 0.45 0.39 20.7 0.011 52 116 0.49 0.39 4.9 0.012 38 106 0.46 0.38 19.2 0.013 51 116 0.39 0.49 5.6 0.014 81 120 0.29 0.55 2.5 1.315 33 96 0.46 0.38 24.1 0.016 41 83 0.27 0.58 15.3 0.017 41 98 0.33 0.50 20.2 0.0
Results
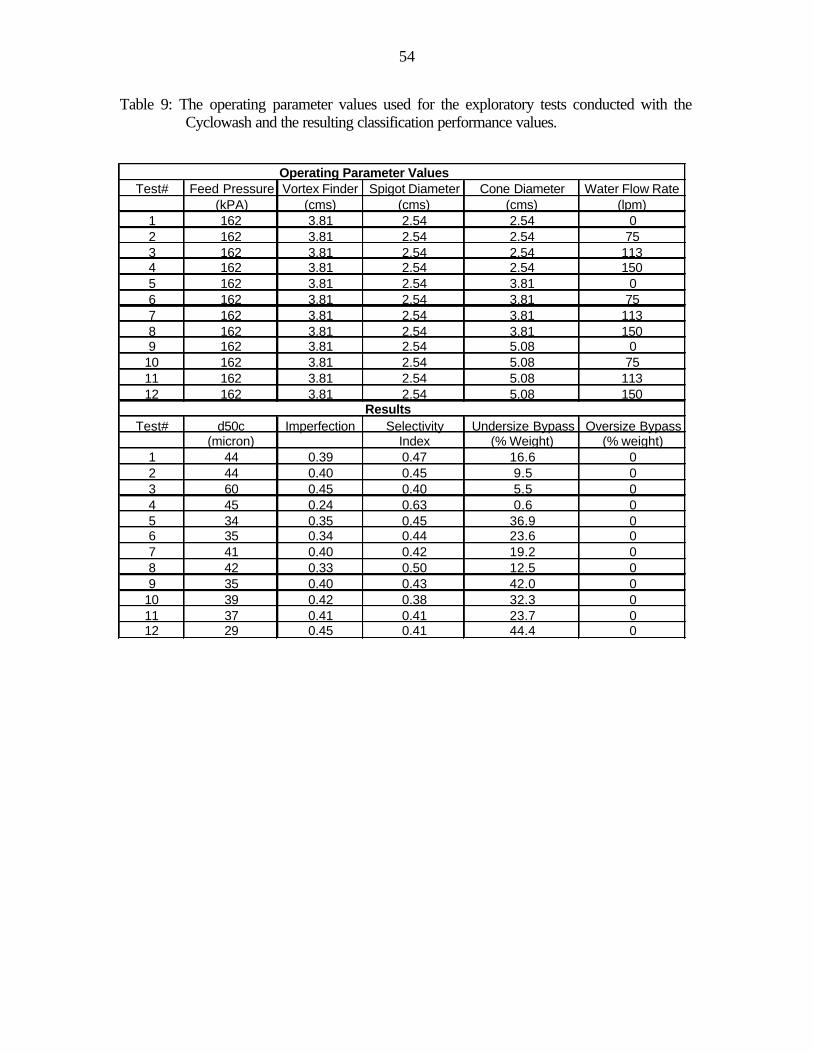
54
Table 9: The operating parameter values used for the exploratory tests conducted with the Cyclowash and the resulting classification performance values.
Operating Parameter ValuesTest# Feed Pressure Vortex Finder Spigot Diameter Cone Diameter Water Flow Rate
(kPA) (cms) (cms) (cms) (lpm)1 162 3.81 2.54 2.54 02 162 3.81 2.54 2.54 753 162 3.81 2.54 2.54 1134 162 3.81 2.54 2.54 1505 162 3.81 2.54 3.81 06 162 3.81 2.54 3.81 757 162 3.81 2.54 3.81 1138 162 3.81 2.54 3.81 1509 162 3.81 2.54 5.08 0
10 162 3.81 2.54 5.08 7511 162 3.81 2.54 5.08 11312 162 3.81 2.54 5.08 150
ResultsTest# d50c Imperfection Selectivity Undersize Bypass Oversize Bypass
(micron) Index (% Weight) (% weight)1 44 0.39 0.47 16.6 02 44 0.40 0.45 9.5 03 60 0.45 0.40 5.5 04 45 0.24 0.63 0.6 05 34 0.35 0.45 36.9 06 35 0.34 0.44 23.6 07 41 0.40 0.42 19.2 08 42 0.33 0.50 12.5 09 35 0.40 0.43 42.0 0
10 39 0.42 0.38 32.3 011 37 0.41 0.41 23.7 012 29 0.45 0.41 44.4 0
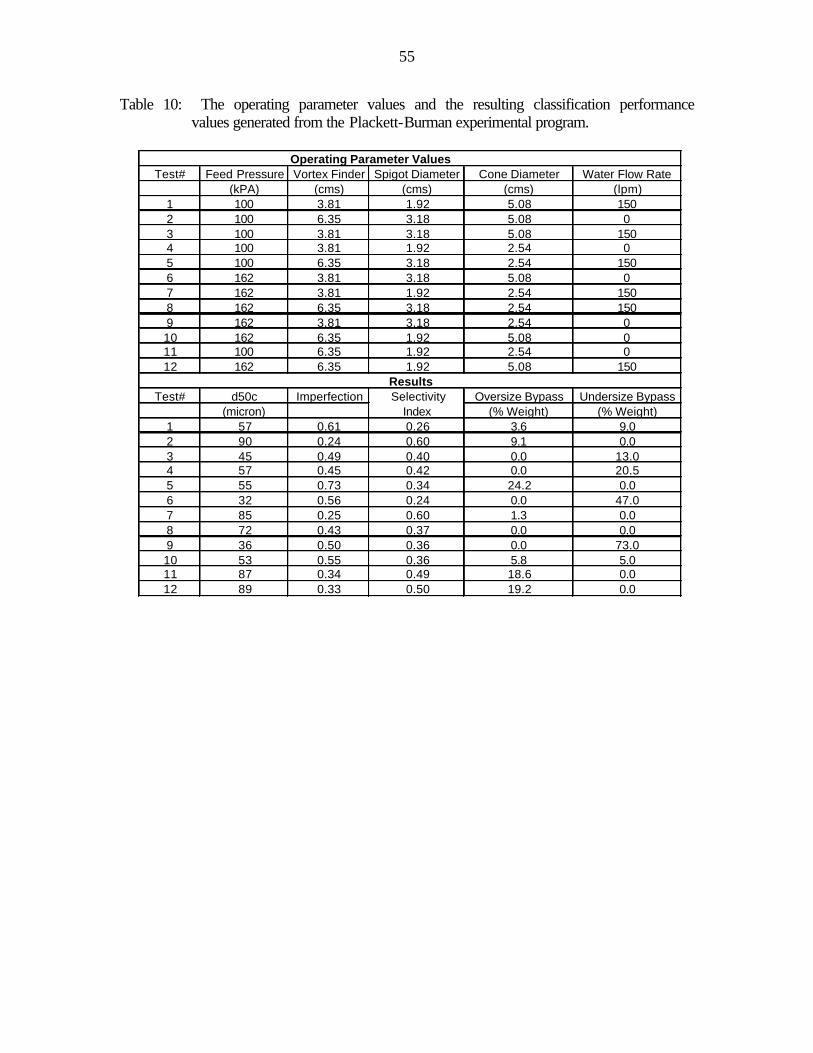
55
Table 10: The operating parameter values and the resulting classification performance values generated from the Plackett-Burman experimental program.
Operating Parameter ValuesTest# Feed Pressure Vortex Finder Spigot Diameter Cone Diameter Water Flow Rate
(kPA) (cms) (cms) (cms) (lpm)1 100 3.81 1.92 5.08 1502 100 6.35 3.18 5.08 03 100 3.81 3.18 5.08 1504 100 3.81 1.92 2.54 05 100 6.35 3.18 2.54 1506 162 3.81 3.18 5.08 07 162 3.81 1.92 2.54 1508 162 6.35 3.18 2.54 1509 162 3.81 3.18 2.54 010 162 6.35 1.92 5.08 011 100 6.35 1.92 2.54 012 162 6.35 1.92 5.08 150
Test# d50c Imperfection Selectivity Oversize Bypass Undersize Bypass(micron) Index (% Weight) (% Weight)
1 57 0.61 0.26 3.6 9.02 90 0.24 0.60 9.1 0.03 45 0.49 0.40 0.0 13.04 57 0.45 0.42 0.0 20.55 55 0.73 0.34 24.2 0.06 32 0.56 0.24 0.0 47.07 85 0.25 0.60 1.3 0.08 72 0.43 0.37 0.0 0.09 36 0.50 0.36 0.0 73.010 53 0.55 0.36 5.8 5.011 87 0.34 0.49 18.6 0.012 89 0.33 0.50 19.2 0.0
Results
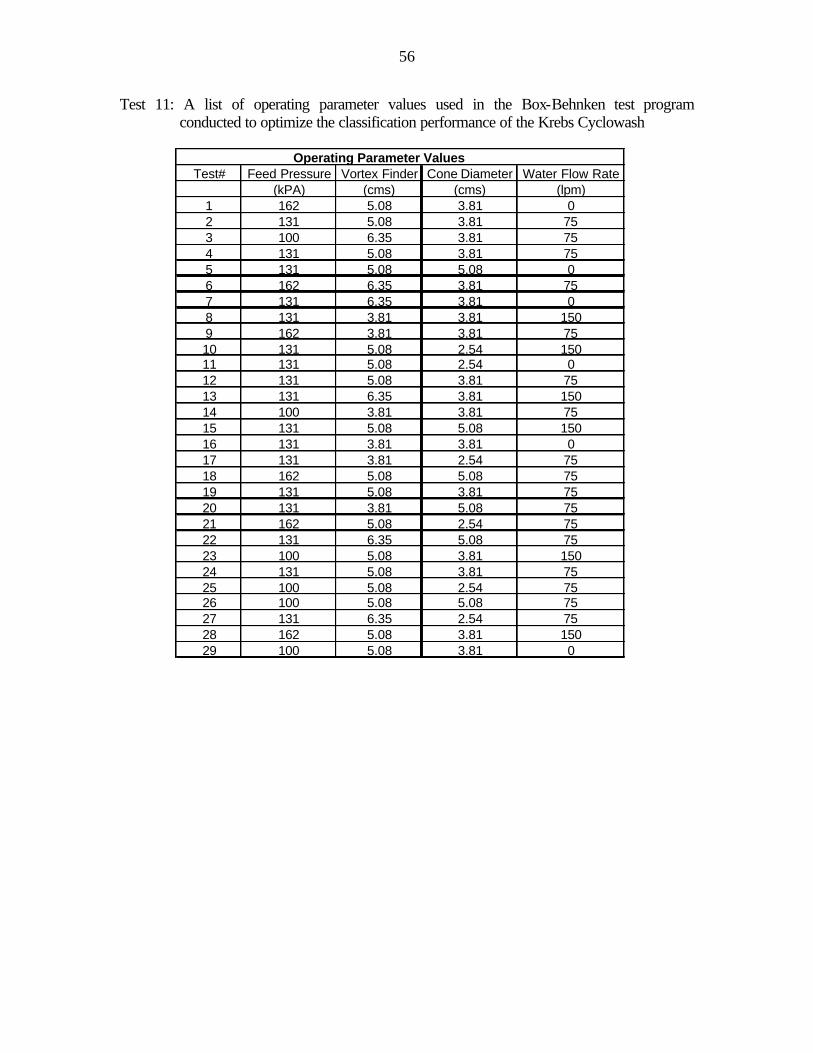
56
Test 11: A list of operating parameter values used in the Box-Behnken test program conducted to optimize the classification performance of the Krebs Cyclowash
Operating Parameter ValuesTest# Feed Pressure Vortex Finder Cone Diameter Water Flow Rate
(kPA) (cms) (cms) (lpm)1 162 5.08 3.81 02 131 5.08 3.81 753 100 6.35 3.81 754 131 5.08 3.81 755 131 5.08 5.08 06 162 6.35 3.81 757 131 6.35 3.81 08 131 3.81 3.81 1509 162 3.81 3.81 7510 131 5.08 2.54 15011 131 5.08 2.54 012 131 5.08 3.81 7513 131 6.35 3.81 15014 100 3.81 3.81 7515 131 5.08 5.08 15016 131 3.81 3.81 017 131 3.81 2.54 7518 162 5.08 5.08 7519 131 5.08 3.81 7520 131 3.81 5.08 7521 162 5.08 2.54 7522 131 6.35 5.08 7523 100 5.08 3.81 15024 131 5.08 3.81 7525 100 5.08 2.54 7526 100 5.08 5.08 7527 131 6.35 2.54 7528 162 5.08 3.81 15029 100 5.08 3.81 0
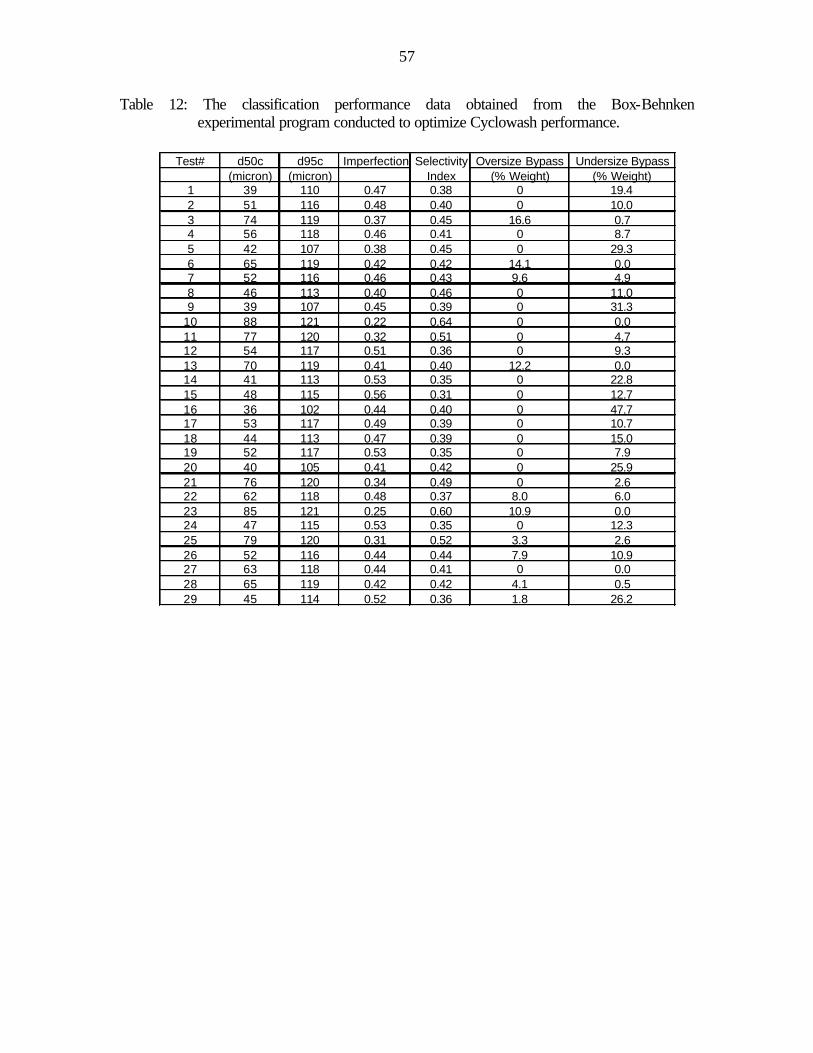
57
Table 12: The classification performance data obtained from the Box-Behnken experimental program conducted to optimize Cyclowash performance.
Test# d50c d95c Imperfection Selectivity Oversize Bypass Undersize Bypass(micron) (micron) Index (% Weight) (% Weight)
1 39 110 0.47 0.38 0 19.42 51 116 0.48 0.40 0 10.03 74 119 0.37 0.45 16.6 0.74 56 118 0.46 0.41 0 8.75 42 107 0.38 0.45 0 29.36 65 119 0.42 0.42 14.1 0.07 52 116 0.46 0.43 9.6 4.98 46 113 0.40 0.46 0 11.09 39 107 0.45 0.39 0 31.3
10 88 121 0.22 0.64 0 0.011 77 120 0.32 0.51 0 4.712 54 117 0.51 0.36 0 9.313 70 119 0.41 0.40 12.2 0.014 41 113 0.53 0.35 0 22.815 48 115 0.56 0.31 0 12.716 36 102 0.44 0.40 0 47.717 53 117 0.49 0.39 0 10.718 44 113 0.47 0.39 0 15.019 52 117 0.53 0.35 0 7.920 40 105 0.41 0.42 0 25.921 76 120 0.34 0.49 0 2.622 62 118 0.48 0.37 8.0 6.023 85 121 0.25 0.60 10.9 0.024 47 115 0.53 0.35 0 12.325 79 120 0.31 0.52 3.3 2.626 52 116 0.44 0.44 7.9 10.927 63 118 0.44 0.41 0 0.028 65 119 0.42 0.42 4.1 0.529 45 114 0.52 0.36 1.8 26.2


![Gmax Ambient Occlusion for Gmax using xNormalfrenchvfr.free.fr/file/_KB/gmax/[Gmax]_utilisation_Ambient...Gmax Ambient Occlusion for Gmax using xNormal . _____ _____ ©2014 par Lagaffe](https://img.pdfslide.us/doc/110x75/5c75469909d3f28c0f8b4fd4/gmax-ambient-occlusion-for-gmax-using-gmaxutilisationambientgmax-ambient-occlusion.jpg)