Embed Size (px)
Citation preview
FINAL TECHNICAL REPORT
Grant # NAG 5 3015
"A Search for Hot, Diffuse Gas in Superclusters"
Stephen P. Boughn, PI
December 8, 1998
The HEAO1 A2 full sky, 2-10 keV X-ray map was searched for diffuse emission
correlated with the plane of the local supercluster of galaxies and a positive
correlation was found at the 99% confidence level. The most obvious interpretation
is that the local supercluster contains a substantial amount of hot (108 OK), diffuse
gas, i.e. ionized hydrogen, with a density on the order of 2 - 3 × 10 -6 ions per cubic
centimeter. This density is about an order of magnitude larger than the average
baryon density of the universe and is consistent with a supercluster collapse factor of
10. The implied total mass is of the order of 1016 times the mass of the sun and
would constitute a large fraction of the baryonic matter in the local universe. This
result supports current thinking that most of the ordinary matter in the universe is
in the form of ionized hydrogen; however, the high temperature implied by the
X-ray emission is at the top of the range predicted by most theories. The presence of
a large amount of hot gas would leave its imprint on the Cosmic Microwave
Background (CMB) via the Sunyaev-Zel'dovich (SZ) effect. A marginal decrement
(-17 _K) was found in the COBE 4-year 53 GHz CMB map coincident with the plane of
the local supercluster. Although the detection is only lc_, the level is consistent with
the SZ effect predicted from the hot gas. If these results are confirmed by future
observations they will have important implications for the formation of large-scale
structure in the universe.
Three other projects related directly to the HEAO 1 map or the X-ray
background in general benefited from this NASA grant. They are: (1) "Correlations
between the Cosmic X-ray and Microwave Backgrounds: Constraints on a
Cosmological Constant"; (2) "Cross-correlation of the X-ray Background with Radio
Sources: Constraining the Large-Scale Structure of the X-ray Background"; and
(3) "Radio and X-ray Emission Mechanisms in Advection Dominated Accretion
https://ntrs.nasa.gov/search.jsp?R=19990013980 2018-06-06T12:30:09+00:00Z

2
Flows". All of these studies grew out of the research funded by the present NASA
grant, and I have acknowledged the grant in four publications relating to these topics.
Several Haverford undergraduates have participated in this project. Lynne
Raschke (four weeks during the summer of 1995) and Michael Lerner (ten weeks
during the summer of 1996) were supported by this grant. Edward Stamas '96
completed a physics senior thesis on a model of the fluctuations in the cosmic
microwave background due to the Sunyaev-Zel'dovich effect (with the above
amplitude) in superclusters. Stamas is currently a data analyst employed by the
Center for Astrophysics at Harvard.
The results of the "supercluster" project have been presented as colloquiums
at the National Radio Astronomy Observatory (May, 1996) and at Rutgers University
(December, 1996), and at the American Astronomical Society meeting in Madison,
WI (June, 1996). A detailed description of results appear in a paper which is currently
under review by the Astrophysical Journal. This manuscript and the four papers
mentioned above are included with this report.
Publications:
1. "Evidence for Hot, Diffuse Gas in the Local Supercluster", under review by the
Astrophysical Journal (1998).
2. "Cross-correlation of the 2-10 keV X-ray Background with Radio Sources:
Constraining the Large-Scale Structure of the X-ray Background", Astrophysical
Journal, volume 499, 533 (1998).
3. "Correlations between the Cosmic X-ray and Microwave Backgrounds:
Constraints on a Cosmological Constant" (with R. Crittenden and N. Turok),
New Astronomy , volume 3, 275 (1998).
4. "Radio/X-ray Luminosity Relation for Advection-Dominated Accretion:
Implications for Emission-Line Galaxies and the X-ray Background" (with
I. Yi), Astrophysical Journal, volume 499, 198 (1998).
5. "On Radio and X-ray Emission Mechanisms in Nearby, X-ray Bright Galactic
Nuclei" (with I. Yi), Astrophysical Journal, volume 515, in press (1998).

3
FINAL EQUIPMENT AND PROPERTY INVENTORY REPORT
none
INVENTIONS DISCLOSURE REPORT
none

Evidence for Hot, Diffuse Gas in the Local Supercluster
Stephen P. Boughn
Department of Astronomy, Haverford College, Haverford, PA 19041 [email protected]
ABSTRACT
The HEA01 A2 full sky, 2- 10 keV X-ray map was searched for emission
correlated with the plane of the local supercluster of galaxies. After removing
strong point and moderately extended sources (e.g. the core of the Virgo
cluster), there remained a statistically signficant component of "diffuse" X-rays
in the plane of the superclnster. Fitting this diffuse component with a simple
"pillbox" model of the local supercluster implies a volume X-ray emissivity of
f, = 3.0 4- 0.3 x 1039 (Rsc/20 Mpc)-lerg s-lMpc -3 where Rsc is the radius of
the supercluster and the error is photon counting noise only. If one considers
fluctuations in the X-ray background as an additional component of noise then
the significance of the detection is reduced to 2 to 3_r. This is consistent with
fits of the model to data sets obtained by rotating the original data. The
distribution of these rotated fits indicates that the detection is signficant at the
99% confidence level. If the source of the X-ray emission is Bremsstrahlung from
a uniformly distributed plasma with temperature Te then the implied electron
number density is Ne = 2.5 x 10 -e (Rsv/20 Mpc)-½ (kT_/lO keV) -_. crn -3. This
value is about an order of magnitude larger than the average baryon number
density implied by nucleosynthesis and is consistent with a collapse factor of 10.
A search for similar structure in the COBS 53 GHz microwave background map
yielded a marginal detection with an amplitude of ,,- -17 4- 5 pK (statistical
error only) which is consistent with the Sunyaev-gel'dovich (SZ) effect expected
from 10 keV gas. This latter value is comparable to the amplitude of intrinsic
large-scale fluctuations in the microwave background and should he considered
to be a la result at best.
Subject headings: diffuse radiation - large-scale structure of the universe -
X-rays: galaxies- X-rays: general
1. Introduction
The largest known structures in the clustering heirarchy of galaxies are flattened
distributions known as "superclusters _ (SCs). The local supercluster (LSC), the supercluster

-2-
of which the Galaxy is a member, was initially discus:_d by de Vaucouleurs (1953). Since
then catalogues containing hundreds of SCs have beer compiled (Bahcall & Soneira 1984;
Batuski & Bums 1985; Einasto et al. 1997). Although it seems likely that many, if not
most, SCs are gravitationally bound structures, they are far from virialized. Never-the-less,
Small et al. (1998) have recently used virial type ar_ments to place a lower limit on the
mass of the Corona Borealis SC. The fact that SCs are only marginally over-dense, i.e.
5pip ,.. 10, further complicates studies of their structures. While the study of SCs is in its
infancy, these objects promise to provide important information about the formation of
large-scale structure in the Universe.
If little is known about the dynamics of SCs, even less is known about the intra-
supercluster (ISC) medium. Assuming SCs have baryon-to-light ratios comparable to
rich clusters of galaxies, then one expects a substantial amount of ISC gas. Furthermore,
the virial temperatures of SCs are .-. 10s K so it would not be surprising to find "hard"
(> 1 keV) X-ray emission from the ISC medium as is the case for the intergalactic medium
in rich clusters of galaxies. Most models of structure formation predict the presence of a
hot ISC, whether it is primoridal, created from winds from an early population of stars,
or tidally stripped from merging structures (Molnar g: Birkinshaw 1998 and references
cited therein). Estimated temperatures range from 1( _° K to 10s K (Klypin & Kates
1991; Rephaell & Persic 1992; Metzler & Evrard 1994; Anninos & Norman 1996). It
is straightforward to show that the cooling time for such gas at the expected densities
(< 10 -a cra -a) is much longer than a Hubble time (Rephaeli & Persic 1992) so it would
remain hot today.
There have been several searches for diffuse X-ray _ mission from SCs. Although Murray
et al. (1978) claimed that UHURU data showed evidence for ISC emission, subsequent
observations and analyses have not supported this claim (Pravdo et al. 1979; Persic,
Rephaeli, & Boldt 1988; Persic et al. 1990). Using ROSAT PSPC data Bardelli et al. (1996)
reported the detection of diffuse emission in the region between two clusters in the Shapley
superclnster. On the other hand, Day et al. (1991) am[ Molnar & Birkinshaw (1998) have
placed relatively strong upper limits on the 2 - 10 keV diffuse emission in this supercluster.
While the current upper limits are interesting, they still leave room for a substantial amount
of hot ISC matter and more sensitive searches are un&,rway. Particularly intriguing is the
result from the cross-correlation analysis of the ROSAI' All-Sky Survey with the Abell
catalog. Soltan et al. (1996) found that Abell clusters :teemed to be associated with diffuse
X-ray emission with an extent of ,-, 20Mpc. It is tempting to associate this emssion with
hot ISC gas; although, there is as yet no direct evidenc_ for this.
Hot ISC gas can also leave its signature on the Cosmic Microwave Background
-3-
(CMB) via the Sunyaev-Ze'dovich (SZ) effect. Hogan (1992) suggested that the SZ effect
in superclusters might account for the fluctuations in the CMB observed by the COBE
satellite; however, subsequent analyses have shown that this is not the case (Boughn &
Jahoda 1993; Bennett et al. 1993). Molnar and Birkinshaw (1998) used the lack of an
SZ effect in the COBE DMR data to place an additional constraint on the ISC gas in the
Shapley supercluster while Banday et al. (1996) found no evidence for the SZ effect in
superclusters using a statistical cross-correlation analysis. Because of the large intrinsic
fluctuations in the CMB, searches for the SZ effect in SCs will undoubtedly result in upper
limits until the next generation of CMB satellites provide adequate frequency coverage to
resolve the two effects.
Searches for ISC gas in the local supercluster (LSC) have the advantage of much
higher integrated signal, however, are frustrated by the presence of other large-scale
structure in the X-ray sky. Sharer (1983) and Boldt (1987) reported evidence for large-scale
structure in the HEAO 1 A2 2 - 10 keV data which is roughly consistent with either
the Compton-Getting dipole expected from the Earth's motion with respect to the CMB
or general emission from the direction of the center of the LSC. Subsequent analyses
(Sharer & Fabian 1983) demonstrated that Compton-Getting dipole adequately accounts
for this large-scale structure; however, the direction of the dipole was determined to be in a
somewhat different direction than that of the CMB dipole. Jahoda and Mushotzky (1989)
found evidence for enhanced 2 - 10 keV emission from the direction of the Great Attractor
which is in the same general direction as the Compton-Getting dipole. In addition, Jahoda
(1993) has found evidence for high lattitude 2 - 10 keV emission from the Galaxy as well as
emission associated with the Superglactic plane (the plane of the LSC), the latter of which
is particularly relevant to the analysis presented in this paper.
In the following sections we present evidence that there is enhanced emission in the
Supergalactic plane and that this emission is distinct from the other large-scale structures
indicated above. To the extent that this is true, we will argue that the emission is diffuse
and not associated with galaxies or other compact X-ray sources in the plane. It is, of
course, possible that the emission is due to still larger scale structure of the type discussed
by Miyaji & Boldt (1990) and Lahav, Piran, & Treyer (1997) or even to the chance
alignment of fluctuations in the X-ray background (XRB); although, we argue that the
latter is unlikely. These possibilites will be discussed in more detail below.

2. HEAO1 A2 2- 10 keY X-ray Map
The HEAO1 A2 experiment measured the surface brightness of the X-ray background
in the 0.1 - 60 keV band (Boldt 1987). The present data set was constructed from the
output of two medium energy detectors (MED) with different fields of view (3 ° x 3° and
3" × 1.5") and two high energy detectors (HED3) with these same fields of view. The data
were collected during the six month period beginning on day 322 of 1977. Counts from
the four detectors were combined and binned in 24,576 1.3 ° x 1.3 ° pixels in an equatorial
quadrilateraJized spherical cube projection on the sky (White & Stemwedel 1992). The
combined map has a spectral bandpass (quantum efl_:iency _ 50%) of approximately
3 - 17 keV (Jahoda & Mushotzky 1989) and is shown in Galactic coordinates in Figure 1.
For consistency with previous work all signals will be converted to equivalent flux in the
2 - 10 keV band.
The effective point spread function (PSF) of the nap was determined by averaging
the PSFs of 75 HEAO1 point sources (Piccinotti et al 1982). The composite PSF is well
fitted by a gaussian with a full width, half maximum of 2.96 °. This value will be important
in estimating the effective noise in the maximum liklihood fits of §3.4. Because of the
pixelization, the PSF varies somewhat with location on the sky; however, this has tittle
effect on noise estimates so we assume a constant PSF
In order to remove the effects of both points sourc_ and large-scale structure, more than
half the map was flagged and not included in the fits d__cribed in §3. The dominant feature
in the HEAO map is the Galaxy (see Figure 1) so all cata within 20" of the Galactic plane
and, in addition, within 30 ° of the Galactic center were cut from the map. In addition,
10 ° diameter regions around 90 discrete X-ray sources with 2 - 10 keV fluxes larger than
3 x 10-11erg s-lc-m -2 (Piccinotti et al. 1982) were removed. The resulting _cleaned" map
covered about 50% the sky. In order to identify additonal point sources, the map itself
was searched for %ources" that exceeded the nearby _ackground by a specified amount.
This was accomplished by first averaging each pixel with its 8 neighbors (note that the
quadrilaterized cube format lays out the pixels on an a_proximately square array) and then
comparing this value with the median value of the nex_ nearest 16 pixels. Pixels within the
flagged Galactic region are ignored. If the average flux associated with a given pixel exceeds
the median flux of the background, then all 25 pixels are flagged and removed from further
consideration. These flagged regions correspond appro):imately to a 6.5 ° × 6.5 ° patch. This
proceedure is not done iteratively, i.e. each comparisor is made on the basis of the original
map with only the Galaxy flagged. Cuts were made _t several levels corresponding to
average fluxes of from 3 to 7 x 10 -12 er 9 s-lcm -2. The most extreme cut corresponds to an
equivalent point source flux of 3 × 10 -ll er 9 s-lc'm -2 md results in 75_ of the sky being

-5-
flagged. At this level, most of the "sources" cut are either noise fluctuations or fluctuations
in the X-ray background. In any case, the results of §3.5 are largely insensitive to these
cuts.
Only one large-scale correction to the map, the Compton-Getting dipole, was made
a priori. If the dipole moment of the cosmic microwave background is a kinematic effect,
as it has been widely interpreted (Bennett et al. 1996), then the X-ray background should
possess a similar dipole structure (Compton-Getting effect) with an amplitude of 4.3 x 10 -3.
As discuseed in §1, evidence for this structure is found in the HEAO map (Sharer 1983;
Sharer & Fabian 1983; Lahav, Piran, & Treyer 1997). The cleaned map was corrected for
this effect; however, the results of §3.5 are the same even if the amplitude and direction of
the dipole axe fit from the data.
The presence of three other sources of large-scale structure in the X-ray map has
been noted. A linear time drift in detector sensivity (Jahoda 1993) results in effective
large-scale structure of known form but unknown amplitude. In addition, the 2 - 10 keV
background shows evidence of high latitude Galactic emission as well as emission associated
with the Supergalactic plane (Jahoda 1993). Models for all three of these contributions are
simultaneously fit to the data as is discussed in §3.4.
Because of the ecliptic longitude scan pattern of the HEAO satellite, sky coverage and,
therefore, photon shot noise are not uniform. However, the mean variance of the cleaned,
corrected map, 2.0 x IO-_(TOT cts/sec) 2, is considerably larger than the mean variance of
photon shot noise, 0.67 x IO-2(TOT cts/sec) 2, where 1 TOT ct/sec _ 2.1 x 10⁻¹ter9 s-tcra -2
(Allen, Jahoda, & Whitlock 1994). This implies that the X-ray map is dominated by "real"
structure (not photon shot noise). For this reason, we chose to weight the pixels equally in
all subsequent analyses.
3. Modelling the Large-Scale Structure
3.1. Instrument Drift
At least one of the A-2 detectors changed sensivity by ,-, 1% in the six month interval
of the current data set (Jahoda 1993). Because of the ecliptic scan pattern of the HEAO
satellite, this results in a large-scale pattern in the sky which varies with ecliptic longitude
with a period of 180". If the drift is assumed to be linear, the form of the resulting large-scale
structure in the map is completely determined. A linear drift of unkown amplitude is taken
into account by constructing a sky map with the appropriate structure and then fitting for
the amplitude simultaneously with the other parameters. We investigated the possibility of
-6-
non-lineaz driR by considering quadratic and cubic terms as well; however, the results of
§3.5 were insensitive to this refinement.
S.2. The Galaxy
The X-ray background has a diffuse (or unresolved) Galactic component which varies
strongly with Galactic latitude (Iwan et M. 1982). This emission is still significant at
high Galactic latitude (bH > 20 °) and extrapolates to _ 1% at the Galactic poles. We
modeled this emission in two ways. The first model consisted of a linear combination of
a secant law Galaxy with the Haslam 408 GHz full sl, y map (Haslam et al. 1982). The
latter was included to take into account X-rays generated by inverse Compton scattering of
CMB photons from high energy electrons in the Galactic halo, the source of much of the
synchrotron emission in the Haslam map. We find only marginal evidence for such emission
(§3.5). As an alternative Galaxy model we also considered the two disk, exponentially
truncated model of Iwan et al. (1982). The analysis of _3.5 shows significant X-ray emission
correlated with either of these models.
3.3. The Local Super_:luster
The level of emission from the plane of the LSC reported in this paper is barely above
the noise (SIN _ 3). Therefore, detailed models of LSC emission are not particularly useful.
We chose a simple "pillbox" model, i.e uniform X-ray _missivity, e_, within a circular disk
of radius Rsc and height (thickness), Hsc. The X-ray intensity in a particular direction
is then proportional to the pathlength, L, through the LSC disk, i.e., I, = ezL/4_r. The
nominal location of the LSC disk was chosen to be in the Supergalactic plane (Tully 1982)
with a nominal center in the direction of the Virgo clu._ter (M87); however, these positions
were allowed to vary from their fiducial locations. The radial position of the Galaxy was
assumed to be 0.8 Rsc from the center of the LSC, i.e, near the edge. The value of Rsc
is left as a scale parameter in the final results; howevel, the dependence on the diameter
of the LSC was investigated by varying the radial posil ion of the Galaxy within the LSC
disk (see §4.5). The thickness to diameter ratio, Hsc/', Rsc, was also varied; however, we
considered the nominal value to be 1/8 which is consistent with the distribution of galaxies
in the LSC (Tully 1982). In any case, as is true for the Galaxy model, the results of §3.5
are not overly sensitive to these model parameters.

-7-
3.4. Analysis
Combining the three above models with a uniform X-ray background we arrive at the
following 5 parameter expression for the "diffuse" X-ray intensity, Xi, in the i th sky pixel,
Xl = al +aa x Pi + ao x Ti + a4 x Si +as x Hi (1)
where the first term represents the intensity of the uniform X-ray background, P/represents
the intensity due to the LSC "pillbox" normalized to a pathlength of 1 Rsc, Ti is the
pattern on the sky caused by a linear drift in detector sensitivity, 5"/is emission proportional
to the cosecant of Galactic latitude normalized to the Galactic pole, Ili is the antenna
temperature (in OK) of the 408 MHz Haslam map, and ak are the 5 free parameters. P/,
Si, and Hi are convolved with the 'PSF of the observed map. Since, as discussed above,
each pixel was weighted equally, the least squares fit to the 5 parameters is obtained by
minimizing an effective X 2,
x = E (2)i m
where zi is the observed X-ray intensity in the i th pixel, Xm,i is the i th pixel of the rn th
parameter map (i.e., Xt,; = 1, X2,i = Pi, X3,i = T/, X4,1 = Si, and Xs,i = Hi), and am is the
mth fit parameter. The sum, El, is over all unflagged pixels in the cleaned HEAO map.
The errors in the fit due to uncorrelated shot noise are easily computed by (see for
example Press et al. 1986)
= E E (3)"?ll' t n i
where 1 < k, rn, n < 5 indicate the 5 fit parameters and ai indicates the photon shot noise in
the i th pixel. Cm,,, is the inverse of the matrix Am,,, which is defined as Am,,, = Ei Xm,iX,*,i"
The intrinsic fluctuations in the X-ray background (XRB) can be thought of as an
additional source of noise. The errors in the fit parameters induced by this noise are more
problematic since XRB fluctuations exhibit pixel to pixel correlations due to the finite PSF
of the detectors and the clustering of X-ray sources. In addition, these fluctuations may not
be uniform on the sky. If P_,e = (_l_:,_l_,i,) represents the auto-correlation function (ACF)
of the intensity of the XRB then it is straightforward to show that the corresponding errors
in the fit parameters are given by
ak 2 = E Ck,_Ck,,_ E Ri,i,X_,iX.,,, (4)m,,* i,i t
As an estimate of these errors we will, in the analysis to follow, assume that the
fluctuations are uniform. This assumption was checked after the fact by evaluating the
-8-
post-fit residual rrns fluctuations. After accounting for photon counting noise, there
is no evidence for significant variation of the intrinsic fluctuations across the sky. In
particular, the rrn8 sky fluctuations near the plane of the LSC was within 3% of the rma
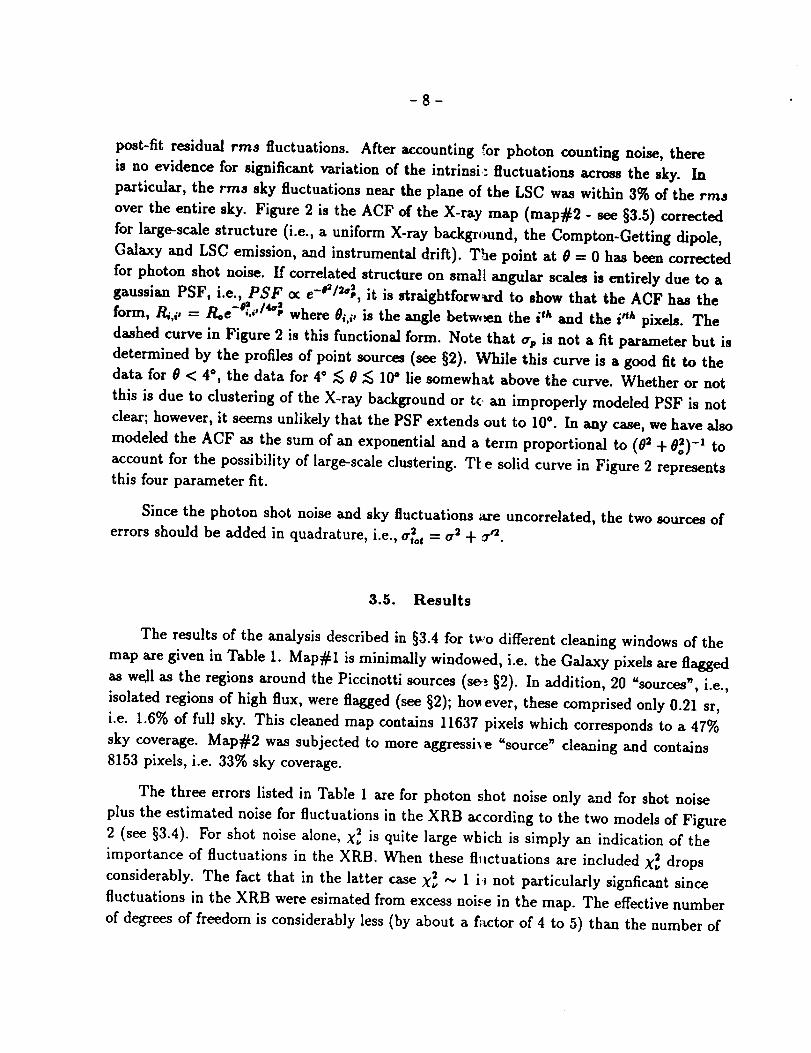
over the entire sky. Figure 2 is the ACF of the X-ray map (map#2 - see §3.5) corrected
for large-scale structure (i.e., a uniform X-ray background, the Compton-Getting dipole,
Galaxy and LSC emission, and instrumental drift). The point at 0 - 0 has been corrected
for photon shot noise. If correlated structure on small angular scales is entirely due to a
gaussian PSF, i.e., PSF o¢ e-P/2°_, it is straightforward to show that the ACF has the
form, R_,i, = p_e-_,,,/_'_ where 0i,+, is the angle between the i th and the i nh pixels. The
dashed curve in Figure 2 is this functional form. Note that _rp is not a fit parameter but is
determined by the profiles of point sources (see §2). While this curve is a good fit to the
data for 0 < 4 °, the data for 4° _ 0 _ 10_ lie somewhat above the curve. Whether or not
this is due to clustering of the X-ray background or te an improperly modeled PSF is not
clear; however, it seems unlikely that the PSF extends out to 10°. In any case, we have also
modeled the ACF as the sum of an exponential and a term proportional to (0 2 + 0o_)-1 to
account for the possibility of large-scale clustering. T[:e solid curve in Figure 2 represents
this four parameter fit.
Since the photon shot noise and sky fluctuations are uncorrelated, the two sources of
errors should be added in quadrature, i.e., <r_ot - _r2 + _r_.
3.5. Results
The results of the analysis described in §3.4 for two different cleaning windows of the
map are given in Table 1. Map#1 is minimally windowed, i.e. the Galaxy pixels are flagged
as well as the regions around the Piccinotti sources (se_,. §2). In addition, 20 "sources", i.e.,
isolated regions of high flux, were flagged (see §2); however, these comprised only 0.21 st,
i.e. 1.6% of full sky. This cleaned map contains 11637 pixels which corresponds to a 47%
sky coverage. Map#2 was subjected to more aggressive "source" cleaning and contains
8153 pixels, i.e. 33% sky coverage.
The three errors listed in Table 1 are for photon shot noise only and for shot noise
plus the estimated noise for fluctuations in the XRB according to the two models of Figure
2 (see §3.4). For shot noise alone, X2, is quite large which is simply an indication of the
importance of fluctuations in the XRB. When these fl_tctuations are included X_ drops
considerably. The fact that in the latter case X_ " 1 is not particularly signficant since
fluctuations in the XRB were esimated from excess noi._e in the map. The effective number
of degrees of freedom is considerably less (by about a f_:u:tor of 4 to 5) than the number of

-9-
pixels since the largest component of the noise is correlated.
It is clear from Table 1 that the parameters from the two fits are consistent with
each other and indicate that all parameters except as are significantly different from zero.
From Table 2 we see that fit parameters are not strongly correlated with each other. Of
particular significance to this paper is that the flux associated with the supercluster is
positive by _ 3_, even when the fluctuations in the XRB are taken into account. A test for
the statistical significance for this result is discussed in §4.4. Taken at face value, the fits in
Table 1 indicate that diffuse X-ray emission from the local supercluster has been detected.
However, a great many checks must be made on robustness of this result: e.g., whether or
not the signal comes from a few strong point sources located near the supergalactic plane;
whether or not the signal is due to X-ray emitting galaxies distributed in the LSC; whether
or not the signal arises from a chance alignment of fluctuations in the X-ray background;
whether or not the result is sensitive to the pillbox model parameters; etc. The next section
contains a detailed discussion of these issues.
While photon counting noise is smaller than intrinsic sky fluctuations, it is not
negligible and, furthermore, varies by a factor of 2 over the sky. The resulting total variance,
shot noise plus sky fluctuations, varies by -,, 4-20% from the mean. One might argue that it
is better to weight the individual terms in X _ (see eq. 2) inversely with the total variance
appropriate for each pixel. Certainly this should reduce somewhat the error in the fit. If
the analyses are performed in this way the fits for the the local supercluster parameter, as,
decrease by an average of about 4% while the errors in the fits decrease by an average of
about 2%, i.e. the results are not significantly different. We prefer to weight the pixels
equally to minimize any systematic structure in the map that happens to be correlated with
the noise pattern.
4. Systematlcs
4.1. The Galaxy
Even though the plane of the Galaxy, a strong source of X-ray emission, was removed
from the map (see §2), high Galactic latitude emission is large enough to be a potential
source of error. However, the planes of the Galaxy and the LSC are nearly perpendicular
and the center of the LSC is nearly at the Galactic pole. It is these fortuitous circumstances
that result in nearly uncorrelated Galaxy and LSC fit parameters (see Table 2). As a
consequence, one expects that the fit to LSC emission will be nearly independent of Galactic
emission. As an alternative Galaxy model we considered the two disk, exponentially

- 10-
truncated model of Iwan et al. (1982). The _2 for the fits with this model were slightly
worse while the LSC fit parameters were essentially unchanged (6a2 _ 3%). Even if the
Galaxy model is left out of the fit entirely, the resulting LSC emission changes by only
,,- 25%; however, the X 2 is signficantly worse. Therefc_re, we consider it unlikely that the
supercluster emission found above is due to Galaxy coatamination.
4.2. Compton-Getting Dipole
As discussed in §2 , the X-ray map was corrected for the Earth's motion relative
to the average rest frame of the distant Universe as _efined by the CMB dipole. This
is justified since the bulk of the X-ray background arises from sources at high redshift
(z _ 1). The amplitude of the X-ray dipole is easily computed from the CMB dipole and
the spectrum of the X-ray background, i.e., 5Is�Is = 4.3 × 10 -3 which is _ 3.4 times
larger than the CMB dipole. In addition, it is likely Lhat X-rays trace the asymmetric
mass distribution which created our peculiar velocity, and one would expect an intrinsic
dipole moment in the XR.B which is more or less aligned with the Compton-Getting dipole.
However, it seems unlikely that the former will be as large as the latter. From unified
models of the XRB (e.g. Comastri et al. 1995), less t_an 0.2% of the XRB background
arises from sources within 50 Mpc and with fluxes < 3 × 10-11ergs-lcm -2. Lahav, Piran,
and "Deyer (1997) demonstrated that the large-scale structure dipole can be comparable
to the Compton-Getting dipole if one assumes, contrary to observations, unevolving X-ray
luminosity and no upper limit on source flux. It is unlikely that their calculation is relevant
to our analysis; never-the-less, we considered the possil: ility that the dipole correction made
to the data is in error. If a dipole term is included in th,." fit, it is also not strongly correlated
with the "pillbox" term and the resulting LSC emissioxL changes by only _ 15% for Map#1
and by -,, 5% for Map#2. The X2's were only marginal:y better if these terms are included.
It is interesting that the resulting fit dipoles for the two maps agree within errors with
that predicted for the Compton-Getting dipole. For Map#2, the fit dipole amplitude is
5Iz/l_ = 5.3 + 1.8 x 10 -3 while the direction is ,,, 19 ° "rom the CMB dipole which is well
within the directional error. For Map#l these values _re 5I_/I_ = 2.7 4- 1.8 × 10 -3 and
--, 35 ° also consistent with the Compton-Getting dipole. We find the results of the dipole
fits signficant in that they indicate that large-scale strt cture can be detected at this level.
If the dipole term is excluded altogether from the fit, the values of LSC emission for the
two maps increase by about 30%.

-11-
4.3. Timedrift
The timedrift fit parameter in Table 1 corresponds to somewhat less than 2% of
the XRB during the six month interval of the observations and, therefore, is also of
potential concern. However, from Table 2 it is evident that this fit parameter is essentially
uncorrelated with the LSC parameter indicating that our estimate of LSC emission is also
not very sensitive to drift of detector sensitivity. In the case that the linear timedrift model
is removed from the fit, the LSC parameter changes by < 5% while the X2's axe significantly
worse. In order to test the limitations of the linear timedrift model we included cubic and
quadratic terms as well. The solutions and Xa's were essentially unchanged. We conclude
that detector drift cannot account for the observed emission from the LSC.
The Galaxy, the dipole, and the effects of timedrift are all more or less orthogonal to
the LSC. In fact, if we remove all three of these items from the analysis the fit to LSC
emission changes by only 4% for Map#2 and by 20% for Map#1.
4.4. The XRB
It is now generally accepted that the X-ray background is composed of discrete sources
(Hasinger et al. 1993; Georgantopoulos et al. 1997). Source confusion due to the finite
resolution of the map along with inherent clustering of sources result in fluctuations in the
XRR with an angular scale of about 3 ° and an amplitude of about 3% of the background.
On the other hand, the implied LSC emission is about 1% of the XRB so it is important to
consider whether or not chance alignments of these fluctuation could account for it.
To the extent that fluctuations in the XRB can be modeled as in §3.5, the above
analysis indicates that the fit to LSC emission is signficant at the -,, 3_ level. As an
independent check we repeated the fits for 5000 pillbox models with a uniform distibution
of orientations in the sky. Because of the extensive windowing of the Galactic plane, models
lying within 30 ° of the Galactic plane were disregarded. Also because of the "detected"
LSC emission, models lying within 30 ° of the LSC plane were also excluded. For Map#l,
the amplitude of LSC emission in Table 1 exceeds those of 97% of the trials while 93% of
the X2s of the trial fits exceed the value in the table. Only 2.6% of the trials have LSC
emission greater and X_S less than those listed in Table 1. The results for Map#2 are even
stronger. The LSC emission exceeds the fits of 99% of the trials while the X 2 is exceeded by
97% of the X_S of the trials. Only 0.7% of the trials have LSC emission greater and X2s less
than the values listed in Table 1. If one includes the models that lie within 30 ° of the plane
of the LSC, the results for Map#2 are essentially the same while for Map#l 4.6% of the

- 12-
trials have LSC emission greater and X2s less that thcse listed in Table 1. Since Map#l
has significantly more "hot spots" than the more heavily windowed Map#2, it is perhaps
not surprising that the former is more susceptible to chance alignments of these "sources"
resulting in spuriously large amplitudes of emission as,,_ciated with several pillbox models.
We conclude that at the ,,_ 99% confidence level fluctuations in the XRB are not responsible
for the observed signal. This corresonds to a 2a to 3a effect and is roughly consistent with
the estimates of the errors indicated in Table 1.
4.5. Pillbox Model
The pillbox model for the LSC is highly simplistic; however, more refined models seem
unwarranted considering the relatively low signal to n_>ise (_ 3_) indicated in Table 1.
Never-the-less, several important checks of the model can be made. The checks illustrated in
the figures below are for the more extensively windowed Map#2; however, the conclusions
are essentially the same for both maps.
Figure 3 is a plot of the LSC emission fit for a series of pillbox models lying in the
supergala_:tic plane but with centers rotated by angles in steps of 30 ° from the nominal
center of the LSC in Virgo. It is clear that the largest emission signal.q occur when the
model center is near the nominal direction. In additiot, the X2s of the fits are siguficantly
worse for models rotated by angles > 60 °. The lowest _;2 occurs (for both windowed maps)
at an angle of -23 ° for which the LSC emission is somez¢hat larger; however, the differences
from the Virgo centered model are not significant.
The dependence of the results on the vertical position of the Galaxy within the
disk of the LSC is illustrated in Figure 4. The vertical position is expressed in terms of
the disk thickness, Hsc, so 4-0.5 represents the top and bottom of the disk. Again the
nominal central position yields the largest LSC emissioa with the X2s of the fits increasing
siguficantly at the extremes.
Figure 5 illustrates the dependence of results on the radial position of the Galaxy in
the LSC. Position is expressed in units of the superclu:;ter radius. The nominal value is
0.8. It is clear from the figure that the largest LSC em:ssion is found for models with the
Galaxy near the edge of the LSC (note: negative values indicate models with centers in the
direction opposite Virgo). The model with the nominal radial position has the smallest
value of X a while models with radial positions _< 0.5 ha/e significantly larger X2s. For this
test the results for Map#l differ somewhat in that mocels with radial positions _> 0.2 have
reasonable X2s; however, the fit LSC emission was corn[ arable for all these models.
- 13-
In order to test specifically whether or not a few isolated "hot spots" in the supergalactic
plane are responsible for the signal, the data is binned according to that emission predicted
from the pillbox model and then plotted in Figure 6 as a function of emission predicted
from the model. The scale of the predicted emission is taken from Table 1 and the data is
corrected for all fit large-scale structure except for LSC emission. If the signal is due to hot
spots in the direction of the center of the LSC, the extreme right hand data point would
fall well above the unity slope curve while other points would fall well below the curve.
Within the limitations of signal to noise, it appears that this is not the case. Of course, the
disposition of the data is sensitive to the binning. While finer scale binning does show a
great deal of scatter, the linear trend is clear. The data from Map#1 shows the same trend
with a bit more scatter.
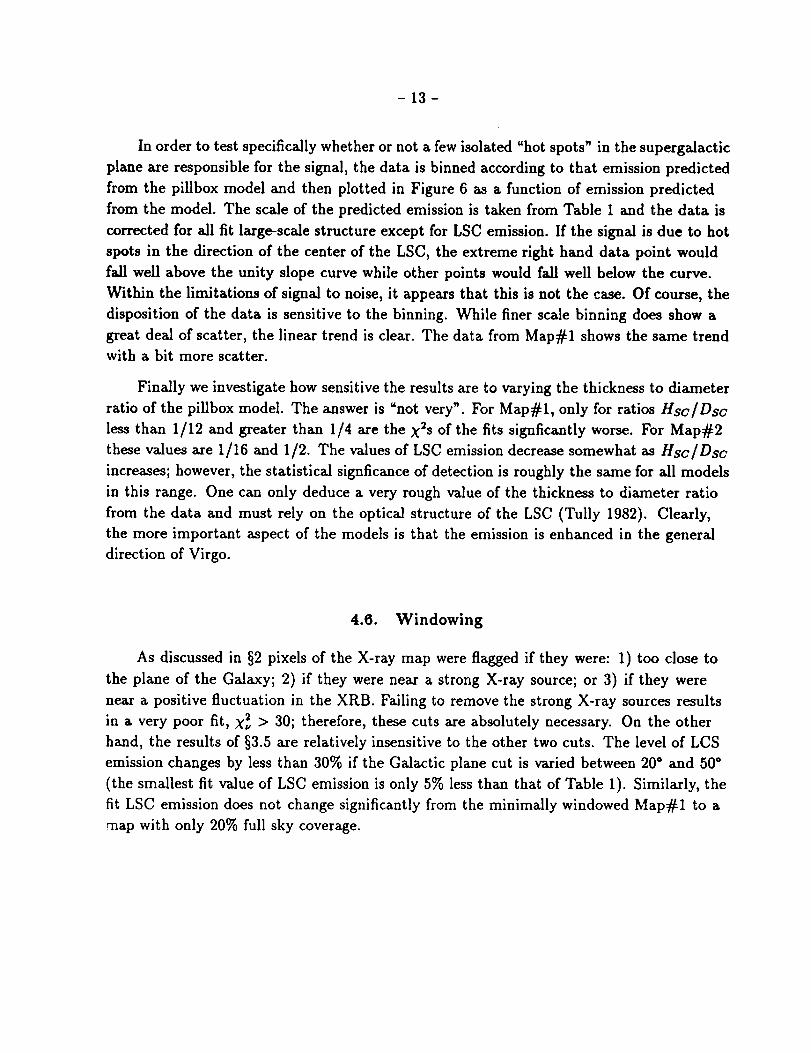
Finally we investigate how sensitive the results are to varying the thickness to diameter
ratio of the pillbox model. The answer is "not very". For Map#l, only for ratios Hsc/Dsc
less than 1/12 and greater than 1/4 are the X2S of the fits signficantly worse. For Map#2
these values are 1/16 and 1/2. The values of LSC emission decrease somewhat as Hsc/Dsc
increases; however, the statistical signficance of detection is roughly the same for all models
in this range. One can only deduce a very rough value of the thickness to diameter ratio
from the data and must rely on the optical structure of the LSC (Tully 1982). Clearly,
the more important aspect of the models is that the emission is enhanced in the general
direction of Virgo.
4.6. Windowing
As discussed in §2 pixels of the X-ray map were flagged if they were: 1) too close to
the plane of the Galaxy; 2) if they were near a strong X-ray source; or 3) if they were
near a positive fluctuation in the XRB. Failing to remove the strong X-ray sources results
in a very poor fit, X_ > 30; therefore, these cuts are absolutely necessary. On the other
hand, the results of §3.5 are relatively insensitive to the other two cuts. The level of LCS
emission changes by less than 30% if the Galactic plane cut is varied between 20 ° and 50"
(the smallest fit value of LSC emission is only 5% less than that of Table 1). Similarly, the
fit LSC emission does not change significantly from the minimally windowed Map#l to a
map with only 20% full sky coverage.
- 14-
4.7. X-ray Auto-Correlation Function
As a check on how well the modeled structure matches the X-ray sky, the auto-
correlation function (ACF) of the map was compared with that predicted by the model.
One might expect that the unity values of the X2's of table 1 indicate that the fit is quite
good. However, recall that this value was forced by assuming that all the excess variance
was due to fluctuations in the XRB. If, on the other hand, the excess were due to unmodeled
large-scale structure then the modeled ACF would not fit the data. Figure 7 shows that the
ACF is well modeled and that there appears to be little other large-scale structure in the
map. The solid curve of Figure 2 was taken as the model of the small-scale fluctuations in
the XRB. For 0 > 10 ° the data is binned in 13° bins tc reduce scatter.
4.8. Point Sources
Even if the above arguments indicate that there is X-ray emission associated with the
plane of the LSC, it is not at all clear that this emission originates from diffuse gas. After
all, there are a great many galaxies and several clusters in this plane and all of these emit
X-rays at some level. However, there are several indications that it is not the case that
faint sources contribute significantly to the X-ray emis::cion in the LSC plane. At a distance
of 20 Mpc the cutoff flux of the present map (3 × 10 -il ergs s -1 crn -2) corresponds to a
luminosity of ,_ 1042 erg s-l; therefore, only relatively weak (compared to AGN) sources
could contribute. The observed upper limit of the average 2 - 10 keV emissivity of such
sources in the local (z _ 0.1) universe is 4 x 10_h erg _-lMpc-a (Miyaji et al. 1994) where
h is the Hubble constant in units of 100 km s -l Mpc "l. On the other hand the pillbox
model of the LSC and the amplitude of the X-ray flux in Table 1 imply an average X-ray
emissivity of 3.0 x 1039 (Rsv/20 Mpc) -_ erg s -_ M_ -3 isee §6). Thus for a Hubble constant
of 60 km s -1 Mpc -l the ratio of the observed LSC emissivity to the average emissivity of
weak sources is _ 12. For an LSC collapse factor is ,_ i0, the observed emissivity could be
due to weak sources without seriously violating this coltstraint.
However, unified models of the XRB indicate that it is unlikely that weak sources make a
signficant contribution to the average X-ray emissivity. For example, the model of Comastri
et al. (1995) imply an average, local 2 - 10 keV emissivity of ?.6 x 103Sh er 9 s-tMpc -3
which is consistent with the observed value (8.6 4- 2.4 :< 103Sh erg s-lMpc -3) derived by
Miyaji et al. (1994) from a cross-correlation analysis of the HEAO-1 A2 map with galaxies
from the IRAS survey. The Comastri model (by design) accounts for the entire XRB.
According to this model, weak sources make a small c(_ntribution to the local emissivity,
i.e. < 7.6 × 1037h erg s -l Mpc -a. For h = 0.6 this is _ factor of ,,, 65 less than inferred
- 15-
for the LSC. If weak sources account for the LSC emissivity, then either Comastri et al.
(1995) seriously underestimate their numbers or the LSC collapse factur is much larger
than observed for visible galaxies. While the above argument is suggestive, it is based on a
untied AGN model which is by no means certain. In fact, there is some spectulation that
weak sources do make a significant contribution to the XRB (Yi & Boughn 1998; Di Matteo
& Fabian 1997). Stronger constraints on the point source contribution to LSC emissivity
come from the consideration of two source catalogs, the Nearby Galaxies Catalog (NBG)
(Tully 1988) and the ROSAT All-Sky Survey Bright Source Catalog (Voges et al. 1996).
There are 2367 galaxies in the NBG catalog which consists of all galaxies with known
velocities _< 3000 km s -1. This catalog is dominated by two data sets: the Shapely-Ames
sample and the all-sky survey of neutral hydrogen. Although the catalog has severe
incompleteness problems at velocities above 2000 km s -1, the coverage is homogeneous
across the unobscured part of the sky (Tully 1988). In any case, if point X-ray sources
associated with galaxies in the LSC are an important source of X-ray emissivity it seems
reasonable that much of the emission would be associated with the galaxies in this catalog.
To check this possibility, the X-ray map was further cleaned by removing ,,_ 15 square
degree regions (somewhat larger than the PSF of the map) at the location of all of catalog
galaxies. Many of these regions lie in already windowed sections of the map. After the
additional cuts the sky coverage was reduced to 26% for Map#l and 18% for Map#2. The
reduced coverage results in an increase in noise; however, the levels of LSC emission axe
still marginally significant (2 _r and 1.5 _ for Map#1 and Map#2 respectively) and are
somewhat larger than but consistent with the values in Table 1.
Another check of the level of contribution of galaxies from the NBG catalog was macle
by fitting the LSC pillbox plus a monopole to the 15 de9 _ regions surrounding the galaxies
but with the appropriate windowing of Maps#l and #2. Before the fits the maps were
corrected for a dipole, the Galaxy and instrumental drift. The sky coverage for these fits
was only 21% and 15%; however, if these regions dominate LSC emission then the amplitude
of the fit should be considerably larger than in Table 1. This was not the case. In fact, the
tit amplitudes of LSC emission are essentially the same as those in Table 1. Although the
above tests are consistent with diffuse LSC emission, the Tully galaxies (smoothed by the
PSF) occupy a great deal of the LSC plane and so this conclusion must be tempered.
One final check on the galaxy contribution was to generate a map by assigning an
X-ray flux to each galaxy, convolve the resulting map with the PSF, and then apply the
windowing appropriate for Maps#1 and #2. The X-ray flux of the galaxies was obtained
by cross-correlating the X-ray map with an appropriately smoothed map of galaxy number
density. This was done in four different distance bins (0 - 10; 10 -20; 20 -30; and
- 16 -
30 - 50 Mpc) in order to account for distance dependence of flux. Only for the first bin was
the correlation statistically significant. The X-ray em ssion from galaxies was determined
using the 1 _ upper limits of the cross-correlation for the appropriate distance bin. The
linear regression applied to the resulting maps yields _lpper limits to LSC emission which
are a factor of 3 below the levels of Table 1. This res_dt is another indication that X-ray
emission from galaxies is not the major component of X-ray emission from the LSC plane.
A more direct indication of the contribution of point sources is the ROSAT All-Sky
Survey (B.ASS) Bright Source Catalog (Voges et al. 1996). There are 18,811 sources in
this catalog down to a 0.I - 2.4 keV flux limit of 0.05 cts/s (3 x I0 -Is er 9 s -l cm -_ for a
photon spectral index of a = -2 where dN/dE c< E°i. At a brightness limit of 0.1 cts/s
(8,547 sources) the catalogue represents a sky coverage of 92%. Two hardness ratios, HR1
and HR2, are defined by HR1 = (B- A)/(B + A) a_d HR2 = (D- C)/(D + C) where
A, B, C, and D are the count rates in passbands that _rrespond roughly to 0.1 - 0.4 keV,
0.5 - 2.0 keV, 0.5 - 0.9 keV, and 0.9 - 2.0 keV (Snow'den et al. 1995). The average HR2
hardness ratio of the sources corresponds to a photon _pectral index of _ ,,- -2; although,
there axe certainly sources that axe much harder as well as sources that are much softer
than this spectrum. For o = -2, the catalog limit co-responds to a 2 - 10 keV flux of
2 × 10 -Is erg s -l crn -2 which is about two orders of n_agnitude below the Piccinotti et al.
(1982) sources (see §2). If there is a signficant population of relatively faint (3 × 10 -_3 to
3 × 10 -11 erg s -l crn -_) sources in the LSC, then a lalge fraction of these should show up
in the Bright Source Survey. Even though the completeness level is not entirely uniform,
the catalog can still he used to give an indication of |he level contamination by point
sources. There are too many RASS sources to simply 'vindow them from the HEAO map
(3 ° cuts around each source would window the entire nap); however, there are several ways
of testing for the effects of RASS point sources.
To check the contamination due to relatively bright sources or clusters of sources we
constructed a B-band (0.5 - 2.0 keV) map of RASS s_urces convolved with the HEAO
PSF. If the resulting B-band flux in any pixel was grea:er than 0.1 ct/sec (for c_ -- -2 this
corresponds to a flux of 1 x 10 -12 erg s -l crn -2) then _. 15 deg 2 region about the pixel was
windowed from the two previously windowed HEAO n:aps, i.e., Maps#l and #2. Note
that a single source with a flux of 0.9 ct/sec is at the cutoff flux after smoothing with the
PSF. The resulting heavily windowed maps, Map#l' and Map#2', had sky coverages of
22% and 1?% respectively. When the linear regression )f §3.4 was performed on these two
maps the fits to LSC emission were somewhat larger b_t not significantly different than
the fits of Table 1. The errors in the fits were about 5)% larger due to the reduced sky
coverage. Similar results were obtained when the RAS_ c cutoff flux level was varied as well
as for windowing individual sources (i.e. not convolved with the PSF) with B-band fluxes

-17-
above a cutoff level. These results indicate that the LSC emission indicated in Table 1 is
not due to the brighter of the RASS sources.
As another check on contaimination, every source in the RASS catalog was assigned a
2 - 10 keV flux from its B-band flux by assuming a spectral index of -1 < a < -3 which
was deduced from HR2 hardness ratio. For faint sources the quantity HR2 is quite noisy
and the computed value of a might be either larger than -1 or smaller than -3. For these
sources a was simply forced to be -1 or -3 which we consider to the limits of the range for
nearly all X-ray sources. The B-band fluxes were corrected for Galactic extinction using
HI column density maps (Stark et al. 1992; Dickey & Lockman 1990) and the absorption
coefficients of Morrison and McCammon (1983). These corrections made little difference
and, in any case, are probably less important than internal extinction in the sources
themselves. The resulting 2 - 10 keV flux map was then convolved with the HEAO PSF
and subtracted from the HEAO maps, Map#1 and Map#2. The linear regressions applied
to these corrected maps implied LSC emission somewhat larger than but not significantly
different from the values in Table 1.
As an upper limit to the contamination by RASS sources we applied the above map
correction assuming that every source has a very hard spectrum, i.e. a = -1. The linear
regression fit to Map#2 was essentially unchanged while the LSC emission fit to Map#1
was reduced by about 40%. Assuming every source has the average spectral index, i.e.
a = -2, yields results that are virtually indistinguishable from those of Table 1.
At the catalog limit, 0.05 cts/sec, the coverage is probably less uniform than at a limit
of 0.1 cts/sec; therefore, we repeated the above corrections for the brightest 8547 RASS
sources (> 0.1 cts/sec). The results were virtually unchanged.
Because of the effects of non-uniform coverage and imperfect knowledge of the spectra
of individual sources, the above source corrections to the 2- 10 keV flux are not particularly
accurate. On the other hand, they do indicate that the emissivity of weak X-ray sources in
the LSC is about an order of magnitude less that those implied in Table 1 and we conclude
that those results are not contaminated by point sources.
4.9. Clusters of Galaxies and the Great Attractor
It is well known that rich clusters of galaxies are strong X-ray emitters and, therefore,
are a potential source of contamination. Distant clusters are indistinguishible from the
point sources discussed above. In addition, 30 bright, nearby clusters including Virgo,
Coma and Centarus are among the Picinnotti et al. (1982) sources and have already been

- 18-
windowed from the map. However, extended emission associated with nearby less compact
clusters of galaxies might be considered a possible sore ce of contamination.
Ebeling et al. (1997) used the ROSAT Brightest Cluster sample to fita Schechter
luminosity function to clustersand obtained a 2 - 10/_eV L* of 1.2 x 10⁴s erg s-l and a
power law exponent of-1.51. Using these values,the implied total2 - 10 keV emissivity
is e= - 1.3 x 10_ erg s-l Mpc -s which isa factorof 25 lessthan that implied by the
values of Table I (see §6). On the other hand, the luminosity of the Virgo duster is
•_ 1.4 x 10⁴s erg _-l and sources thisbrightwould be cut from the windowed data ifthey
were within 60 Mpc. Again using the fit of Ebeling et ILl. (1997), the total emissivity of
clusters less luminous than the Virgo cluster is e, = 1.6 x I0 _ erg s -I cm -2 Mpc -s or a
factor of 200 less than the implied LSC emissivity. Even if this flux is increased by the
col]apse factor of I0, it is still considerably less than that inferred for the LSC (see §6).
As a further check on possible contamination by extended emission from galaxy dusters
we extended the windowing of the X-ray map to include 15" diameter regions around the
Virgo, Centarus, Coma, Fornax, and Ursa Major clusters as well as around the most dense
regions of the Hydra, Pavo, Perseus, and Ophiuchus gMaxy clouds (Tully 1988). Finally
the diffuse emission found by Jahoda & Mushozky (1989) was eliminated by windowing a
40" diameter region about the Great Attractor. Fits of the LSC emission to these further
windowed maps were only ,,- 15% less that those of Table 1 while the errors in the fit were,
of course, somewhat larger. Therefore, there is no indication that the fits of Table 1 are
contaminated by either the cores of clusters of galaxie_ or by diffuse emission from the
Great Attractor.
The windowing of more extensive regions of galaxy clouds in the LSC would not be
possible without cutting most of the plane of the LSC _nd, in any case, it is not clear one
should distinguish such emission with diffuse emission in the LSC. This point is essentially
the same as asking whether or not LSC emission is sm_mth or somewhat clumpy and will
be addressed in §6 below; however, the bottom line is tilat the signal to noise is simply not
high enough to be able to give a clear answer.
5. Sunyaev-ZePdovich Effect in the LSC
If the diffuse X-ray emission in the LSC is due to llremsstrahlung from a hot, ionized
intergalactic medium then one might expect its signatu_ e to be imprinted upon the Cosmic
Microwave Background (CMB) via inverse Compton scettering, i.e. the Sunyaev-Zel'dovich
(SZ) effect (Sunyaev & Zel'dovich 1980). If the gas wer_ uniformly distributed, the profile
- 19-
in the CMB would be the same as in the X-ray except with a negative amplitude for
observations on the Rayleigh-Jeans side of the blackbody spectrum. The CMB temperature
decrement for radiation passing through a gas cloud of uniform electron density N,,
thickness L, and temperature Te is given by (e.g. Hogan 1992)
(6T/T)cMB _ 4.0 X 10 -6 /3 I ne t, (5)
where l = L/IOMpc, n, = N,/10-Scm -3, t¢ = kTJlO keV, /3 = (z-___- 4), and
x - hv/kTcMs. For L = 20 Mpc, Ne = 2.5 x 10 -6, and kT_ = 10 keV, the Rayleigh-Jeans
decrement in the CMB is 15T/TI -,, 4 x 10 -°. This value is somewhat smaller than the 10 °
scale fluctuations observed by the COBE DMR experiment, comparable to other large-scale
structure in the microwave sky, e.g. high latitude Galactic emission and the expected
intrinsic CMB quadrupole, and only marginally larger than the instrument noise in the
DMR data (Bennett et al. 1996). Never-the-less, we performed the same type of analysis
as for the X-ray background described in §3 above.
The four year 53 GHz DMR map was obtained from the COBE data archive in
2.6 ° x 2.6 °, ecliptic, quadrilaterized spherical cube projection format (Bennett et al. 1996).
This map was deemed more appropriate than the 31 GHz or 90 GHz maps because of
a combination of low instrument noise, low Galaxy background, and moderately large
(see eq. 5). An 11 parameter linear regression similar to that of §3.4 was performed on
the map after flagging all pixels within 20 ° of the Galactic plane and within 30 ° of the
Galactic center. The fit parameters were a monopole, a dipole, a quadrupole, a secant law
Galaxy model, and the amplitude of the canonical pillbox model of the LSC. As with the
HEAO X-ray map, the sky coverage for the DMR maps and, hence, instrument noise are
not uniform across the sky. In this case the instrument noise per pixel is larger than the
intrinsic sky fluctuations so the contribution to X 2 (see eq. 2) of each pixel is weighted
inversely with noise variance of the pixel. However, the results did not change significantly
when the analysis was repeated with equally weighted pixels. The formal fit to the pillbox
amplitude (normalized to 1 Rsc) is
5TvMB = --17 :t: 5 #K (6)
where the uncertainty is statistical only and assumes uncorrelated instrument noise.
As mentioned above, this level is comparable to other systematic structure in the map
and, therefore, should by no means be considered as a 3a detection. As an estimate of the
significance of the result, the analysis was repeated for 5000 model pillboxes with a uniform
distribution of orientations in the sky. As in §4.4 models lying within 30 ° of the Galactic
and Supergalactic planes were disregarded. The amplitude of the SZ effect of eq. 6 is more
negative than 82% of the rotated models indicating a significance of ,-_ 1 a. On the other

- 20 -
hand, 80% of the X2s of the trial fits exceed that of the fit of eq. 6 and 9% of the trials have
more negative SZ fits and smaller X_s than the LSC model. If one includes models that lie
within 30" of the plane of the LSC these results do not change significantly. Nor are they
changed for analyses in which the pixels are weighted equally.
Because of the low level of the signal only a few :becks for systematics were made.
The method of _4.5 was used to exclude the possibilit3 that a single "hot* or "cold _ source
at.counted for the signal. The LMC, SMC, and Orion Nebula were explicity excluded with
no significant change in the fit. Finally the three DMR maps (31, 53, & 90 GHz) were
mmbined sccording to the prescriptions suggested by Hinshaw et al. (1996) to minimize
the effect of the Galaxy. These combinations have larger effective noise and so result in
larger statistical errors for the fits of the pillbox amplitude. The fit amplitudes varied
from -5 pK to -22 pK. While it is clear the SZ effe_ t due to hot gas in the LSC is not
significantly detected, we note that the upper limit is ,:onsistent with the amount of hot,
diffuse gas required to account for the diffuse X-ray emission discussed in §6. We do find it
intriguing that the fits correspond to a decrement in the CMB as predicted by the SZ e_ect.
6. Discussion
If one takes seriously the hypothesis that hot, dif[_se gas in the LSC is responsible
for the diffuse X-ray emission claimed in §3, then the s_rength of the emission can be used
to constrain the density and temperature of the gas. For simplicity assume a uniform,
isothermal gas with electron temperature Tc and electron density No. Then the 2 - 10 keV
X-ray intensity due to Bremsstrahlung is given by (e.g. Rybicki & Lightman 1979)
I: = e:L/4_ = 4.0 x 10 -9 net e l erg s-lcrn-2sr -1 (7)
where L is the thickness of the emitting region, I = L/IO Mpc, n, = Ne/10-Scm -3, and
t, = kT,/lO keV. Primordial element abundances are _sumed; however, the coefficient in
eq. 7 only increases by a factor of 1.14 for solar abund_-nce. From Table 1, the amplitude
of the LSC emission normalized to 1 R,_ is ,_ 3.3 x 1{ ,-2 TOT cts#/4.5 deg 2 which
corresponds for a 10 keV Bremsstrahlung spectrum to
I. = 5,0 x 10 -w erg s -1 cm-2 sr-l. (8)
From eqs. 7 and 8 (with L = Rsc)
Ate = 2.5 x 10 -e (Rsc/20 Mpc)-'l_(kTc,'lO keV) -'1' cm -3. (9)
The implied gas density is only weakly dependent on Ftsc and T_. Moreover, it is
reasonable to assume that Rsc "_ 20 Mpc (roughly the distance to the Virgo cluster) and
-21 -
that kT_ ,.., 10 keV. A temperature much greater than 10 keV would exceed the virial
temperature of the LSC while a temperature much less than 10 keV would have rendered
the gas undetectable by HEAO. As a rough consistency check, the X-ray data were split into
"soft" (2-5 keV) and "hard" (5-10 keV) components (Allen, Jahoda, & Whitlock 1994) and
the "pillbox" fits of §3 repeated on the subdivided data sets. The ratio of the fit amplitudes
(in cts/s) in these two bands is fil, op/l_l'h,,,.d _ 1. Although the uncertainty in this ratio is
considerable, it is consistent with an electron temperature of _ 10 keV but inconsistent
with temperatures < 3keV. Therefore, it seems unlikely that the implied electron number
density could be much different than N_ ,,_ 2 to 3 x 10 -6. It is interesting to note that this
value is roughly an order of magnitude larger than the mean number density of baryons in
the universe and is consistent with a collapse factor of 10 which is roughly the aspect ratioof the LSC.
If this hot gas were distributed uniformly within a 40 Mpc diameter by 5 Mpc thickness
supercluster, the implied total mass is ,-, 4 x 10¹⁴ M®. From dynamical considerations,
Shaya, Peebles, & Tully (1995) have estimated the total mass within a distance of 40 Mpc
(about 40 times the volume of the LSC) is about 7 x 10 is M®. On the other hand, total
mass in stars in the same volume is about 1 x 10¹⁴ M®, which is an order of magnitude too
small to account for the baryonic matter which should be present. While the mass of the
hypothetical hot gas in the LSC is insufficient to account for the dynamical mass in the
local universe it may well make up the bulk of the baryonic matter.
These estimates rely on the gas being uniformly distributed. Since Bremsstralalung
is proportional to N_, the emission is enhanced if there is any clumping of the gas. For
example, if the gas is contained in 50% of the volume of the disk of the LSC, i.e. a clumping
factor of 2, then the implied mean density decreases by a factor of l/v/2.
As discussed in §5 above, the presence of hot, ionized gas is imprinted via the SZ effect
on the cosmic microwave background. For 10 keV gas with a density of 2.5 x 10 -8 crn -a
and a thickness of 20 Mpc, the expected decrement in the CMB is -_ -11 /JK for a
Rayleigh-Jeans spectrum. While the fit of a pillbox LSC to the 53 GHz COBE map
is consistent with this prediction, the systematic structure in the map is large and the
agreement should be considered at best a 1 a confirmation.
If superclusters (SCs) with hot gas are common in the universe then their combined
SZ effects would result in fluctuations in the CMB which might be confused with intrinsic
CMB fluctuations (Hogan 1992). This has been demonstrated not to be the case for the
COBE results (Boughn & Jahoda 1993; Bennett et al. 1993). To see how many SCs axe
allowed by this constraint suppose that a fraction f of all bayonic matter is contained in
SCs with diameters of 40 Mpc and thicknesses 5 Mpc. Then the number density of SCs is

-22-
nsc = f/bVsc where Vsc is the volume of an SC sad b is the co]lapse factor. If each results
in a temperature decrement of 6Tc_s ,,, 2 to 3 #K (for a path length equal to the thickness
of the SC) then the rms fluctuations of a distribution of SCs should be _, 2.5 × V/TV'_ pK
where N$¢ _ wI_nscr is the number of SCs along the line of sight out to a distance r. To
compsrv with the COBE DMR data for which 6T, u _- 35/_K we set r _- 400Mpc at which
a 40 Mpe SC would subtend an angle about equal to the COBE beam s_e_ Even if f = I,
i.e. all the baryom in t]_-mfive_se are intheform of hot, diffuse gas in SCs, the fluctuatiom
csm_ by the SZ etfect would be ,_ 7 pK or about 1/5 the level of the CMB fluctuations.
In all lihelihood_ the fraction jr is much smaller thsa unity. From the sup_duster (SC)
catalog of Batuski and Burns (1985), Rephaeli (1993) estimated the local density of SCs to
be 5 × l0 s hs Mpc -a. If these SC's have volumes and densities of that inferred for the
LSC, then only about 0.001 of the bazyonic matter in the universe is contained in SCs,
i.e. f - 0.001. Then the SZ fluctuations would be quite small, _ 1 pK. In any case, the
spectrum of SZ fluctuations differs significantly from those intrinsic to the CMB.
Another way to detect the presence of the SZ effect is via a spectral distortion of the
CMB which is quantified by the Compton I/parameter y = f(kT,/m,c_)N, uTdl where T, is
electron temperature, me is the electron mass, lye is electron density, OT is the Thompson
scattering cross-section, and I is path length (e.g. Rephaeli 1993). Assuming an isothermal
gas this becomes y - (kT,/m, c2)oT f Ned/. A rough approximation of the integral is f times
the mean baryon density times the Hubble radius, i.e._ fnbcHo. Then for kTe -- 10 keV,
y -,_ 4 × 10 -s f. The limit on y from the COBE data is (Fixsen et al. 1996) y _ 10 -s
which implies that f _ 1/4. If f _- 0.001 as inferred fr(m the local density of SCs, then the
presence of hot gas in these SCs is consistent with the ltpper limit to the spectral distortion
of the CMB.
7. Conclusions
Evidence is presented in this paper for X-ray emis: ion associated with the plane of the
local supercluster (LSC). While this has been suggested previously (Jahoda 1993), we argue
that the emission is unlikely to be produced by individual sources but rather is diffuse in
nature. This implies that there is a great deal of hot (~ 10 keV), diffuse (_ 2.5 x 10 -6 cra -3)
gas in the LSC and that the gas may account for the bulk of baryonic matter in the
local universe. The presence of such gas would be imt,rinted on the cosmic microwave
background (CMB) as a Sunyaev-Zel'dovich temperatu:e decrement of ~ -10 pK. While
the COBE 53 GHz map is consistent with such structure, other systematics preclude the
positive identification of this component. Even if superc lusters are relatively plentiful in the
- 23 -
universe and hot gas in them is common, the resulting fluctuations in the CMB would be
small relative to the those found in the COBE data and, therefore, unlikely to compromise
the cosmological implications of those fluctuations.
It should be emphasized that the existence of hot, diffuse gas in the LSC is by no means
firmly established. The results presented here constitute only a 2 to 3 a effect and 3 a results
have a history of disappearing. Also the source of the X-ray emission may not be diffuse, hot
gas; although, we argue that point sources probably do not account for it. None-the-less,
the results are tantalizing and are consistent with the density and temperature of gas that
might be expected to inhabit the intergalactic medium. It is unlikely that more detailed
analyses of the HEAO and COBE data will shed more light on the situation. The signals
to noise of these maps are simply not good enough. However, the next generation of X-ray
satellites with higher angular resolution, better frequency resolution, and higher sensitivities
will likely be able to either confirm or refute the suggestions made in this paper as well as
be able to detect diffuse emission in other relatively nearby superclusters. Finally the new
CMB satellites scheduled for launch in the next few years (i.e. MAP and PLANCK) should
have the angular and frequency resolution required to distinguish an SZ effect in the LSC
from intrinsic CMB fluctuations if the level of the effect is that suggested by this paper.
I would like to acknowledge Keith Jahoda who is responsible for constructing the the
HEAO I A2 X-ray map and who provided me with several data handling programs. I would
also like to acknowledge Ruth Daly who initially suggested this project. Much of this
work was completed at the Princeton University Gravitation and Cosmology computing
cluster where I benefitted greatly from the subroutines of Ed Groth. Finally I would like
to acknowledge the hospitality afforded me at the Institute for Advanced Study where I
collected many of my thoughts for this paper. This work was supported in part by NASA
grant NAG 5-3015, the Monell Foundation, and (through Princeton University) NSF grantPHY-9222952.
- 24 -
REFERENCES
Allen, J., Jahoda, K., & Whitlock, L. 1994, Legacy, 5. 27
Annincl, P., & Norman, M. L. 1996, ApJ, 459, 12
Bahcall, N. A., & Soneira, R. M. 1984, ApJ, 277, 27
Banday, A. J., Gorski, K. M., Bennett, C. L., Hinshaw, G., Kogut, A., & Smoot, G. F.
l e, ApJ, 468,LSS.
Bardelll, S. Zucxa, E., Malizia, A., Zamoraai, G., Sc_amella, R., & Vettolani, G. 1996,
A&A, 3O5, 435
Batusld, D. J., & Bums, J. 0. 1985, A J, 90, 1413
Bennett, C. L., Hinshaw, G., Band,y, A., Kogut, A., Wright, E. L., Lowenstein, K., &
Cheng, E. S. 1993, ApJ, 414, L77
Bennett, C. L., Banday, A. J., Gorski, K. M., Hinsh_.w, G., Jackson, P., Keegstra, P.,
Kogut, A., Smoot, G. F., Wilkinson, D. T., & Wright, E. L. 1996, ApJ, 464, L1
Boldt, E. 1987, Phys Rept, 146, 215
Boughn, S. P., & Jahoda, K. 1993, ApJ, 412, L1
Comastri, A., Setti, G., Zamorani, G., & Hasinger, G. 1995, A & A, 296, 1
Day, C. S. R., Fabian, A. C., Edge, A. C., & Raychaudhury, S. 1991, MNRAS, 252, 394
de Vaucouleurs, G. 1953, A J, 58, 30
Dickey, J. M., & Lockman, F. J. 1990, ARA&A, 28, 215
Di Matteo, T., & Fabian, A. C. 1997, MNRAS, 286, 3!.,3
Ebeling, H., Edge, A. C., Fabian, A. C., Allen, S. W. Crawford, C. S., & Bohringer, H.
1997, ApJ, 479, 101.
Einasto, M., Tago, E., Jaaniste, J., Eina.sto, J., & And_rnach, H. 1997, ALAS, 123, 119
Fixsen, D. J., Cheng, E. S., Gales, J. M., Mather, J. C., Sharer, R. A., & Wright, E. L.
1996, ApJ, 473, 576
Georgantopoulos, I., Stewart, G. C., Blair, A., J., Shar ks, T., Griffiths, R. E., Boyle, B. J.,
Almaini, O., & Roche, N. 1997, MNRAS, 291,203
- 25 -
Hasinger, G., Burg, R., Giacconi, R., Hartner, G., Schmidt, M., Trumper, J., & Zamorani,
G. 1993, A & A, 275, 1
Ha.slam, C. G. T., Salter, C. J., Stoffel, H., & Wilson, W. E. 1982, ALAS, 47, 1
Hinshaw, G., Banday, A. J., Bennett, C. L., Gorski, K. M., Kogut, A., Lineweaver, C. H.,
Smoot, G. F., & Wright, E. L. 1996, ApJ, 464, L25
Hogan, C. 1992, ApJ, 398, L77
Iwan, D., Marshall, R. E., Boldt, E., Mushotzky, R. F., Sharer, R. A., & Stottlemeyer, A.
1982, ApJ, 260, 111
Jahoda, K. 1993, Adv Space Res, 13, No 12, 231
Jahoda, K., & Mushotzky, R. 1989, ApJ, 346, 638
Klypin, A. A., & Kates, R. E. 1991, MNRAS, 251, 41p
Lahav, O., Piran, T., & Treyer, M. A. 1997, MNRAS, 284, 499
Metzler, C. A., & Evrard, A. E. 1994, ApJ, 437, 564
Miyaji, T., & Boldt, E. 1990, ApJ, 353, L3
Miyaji, T., Lahav, O., Jahoda, K., & Boldt, E. 1994, ApJ, 434, 424
Molnar, S. M., & Birkinshaw, M. 1998, ApJ, 497, 1
Murray, S. S., Forman, W., Jones, C., & Giacconi, R. 1978, ApJ, 219, L89
Morrison, R., & McCammon, D. 1983, ApJ, 270, 119
Persic, M., Rephaeli, Y., and Boldt, E. 1988, ApJ, 327, L1
Persic, M., Jahoda, K., Rephaeli, Y., Boldt, E., Marshall, F. E., Mushotzky, R. F., and
Rawley, G. 1990, ApJ, 364, 1
Piccinotti, G., Mushotzky, R., Boldt, E., Marshall, F., Serlemitsos, P., & Sharer, R. 1982,
ApJ, 253, 485
Pravdo, S. H., Boldt, E. A., Marshall, R. E., McKee, J., Mushotzky, R. R., Smith, B. W.,
& Reichert, G. 1979, ApJ, 234, 1
Press, W. H., Flannery, B. P., Teukolsky, S. A., & Vetterling, W. T. 1986, Numerical
Recipes (Cambridge Univ. Press, Cambridge), 509
- 26 -
Rephseli, Y. 1993, ApJ, 418, I
RephaeU, Y., & Persi¢, M. 1992, MNRAS, 259, 613
Rybidd, G. B., & [Jghtman, A. P. 1979, Radiative Processes in Astrophysics (John Wiley
& So_, New York), 158
Fader, IL A. 1983, PhD _ Univ of Marylaad
Sh_er, R., & Fabian, A. 1983, in Early Evolution d the Universe and its Present Structure,
eds. G. Abell and O. Chiacar_, IAU 104, 333.
Sh_yL, E. J., Peebhs, P. J. E., & Tully, P,. B. 1995, AtJ, 454, 15
Small, T. A., M,_, C-P., Sargent, W. L. W., & Hamiltoa, D. 1998, ApJ, 492, 45
Snowden, S. L., Freyberg, M. J., Pludnsky, P. P., Schmitt, J. H. M. M., Tffunper, J., Voges,
W., Edgar, R. J., McCammon, D., & Sanders, W. T. 1995, ApJ, 454, 643.
Soltan, A. M., Hasinger, G., Egger, R., Snowden, S., & Trumper, J. 1996, A&A, 305, 17
Stark, A. A., Gammie, C. F., Wilson, R. W., Bally, J., Linke, P,. A., Heiles, C., & Hurwitz,
M. 1992, ApJS, 79, 77S
Sunyaev, R. A., & Zel'dovich, Y. B. 1980, ARA&A, 18 537
Tully, R. B. 1982, ApJ, 257, 389
Tully, R. B. 1988, Nearby Galaxies Catalog (Cambridg,_. Univ. Press, Cambridge)
Voges, W., et al. 1996, IAUC, 6420
White, R. A. & Stemwede], S. W. 1992, in Astronomical Data Analysis Software and
Systems I, eds. D. M. Worrall, C. Biemesderfer, & J. Barnes (San Francisco: ASP),
379
Yi, I., & Boughn, S. P. 1998, ApJ, 499, 198
This preprint was prepared with the AAS _ macros v4.C.

- 27 -
Fig. 1.-- 2- 10 keV HEAO I A2 map in Galactic coordinates (Jahoda & Mushotzky 1989).
The units are TOT counts/sec (see text).
Fig. 2.-- The autocorrelation function (normalized to unity) of Map#2 (see §3.5) corrected
for large-scale structure. The dashed curve is that expected for the Gaussian PSF of the
map. The solid curve is a fit to the data to account for the tail of the ACF (see text).
Fig. 3.-- LSC emission fit to Map#2 for pillbox models lying in the supergalactic plane
with centers rotated by angles in steps of 30 ° from the nominal center of the LSC in Virgo.
The error bars are statistical only and are highly correlated.
Fig. 4.-- LSC emission fit to Map#2 for pillbox models with central planes offset from the
Galaxy. Vertical position is expressed in terms of the thickness of the pillbox. The error
bars are statistical only and axe highly correlated.
Fig. 5. u LSC emission fit to Map#2 for pillbox models with centers displaced from the
Galaxy. Radial position is expressed in units of the supercluster radius. The nominal value
is 0.8. Negative values indicate models with centers in the direction opposite Virgo. The
error bars are statistical only and are highly correlated.
Fig. 6.-- Average 2 - 10 keV flux of Map#2 binned according to level of emission predicted
from the pillbox model. The predicted emission is taken from Table 1 and the map is
corrected for all fit large-scale structure except for LSC emission. The error bars are
statistical only.
Fig. 7.-- The autocorrelation function (normalized to unity) of Map#2. For 0 > 10 ° the
data is binned in 13 ° bins to reduce scatter. The solid curve is the ACF for the model
including all fit large-scale structure plus the fit of Figure 2 for the small-scale (< 10 °)
structure.
- 28 -
Map#l Map_k2
k ak _ _b _c k ak a_ ab _c
i 1328.17 0.36 1.30 1.49 1 ,_29.06 0.42 1.49 1
d .733.38 0.29 1.06 1.18 2 3.16 0.34 1.21 1.37
6.38 0.29 0.99 1.06 3 6.26 0.34 1.15 1.30
3.23 0.18 0.64 0.70 4 2,25 0.21 0.74 0.84
0.10 0.01 o.o5 o.o5 5 0.06 o.02 0.05 o.o6_! s.57 0.990.99 x',, 2._ 1.oo 1.oo
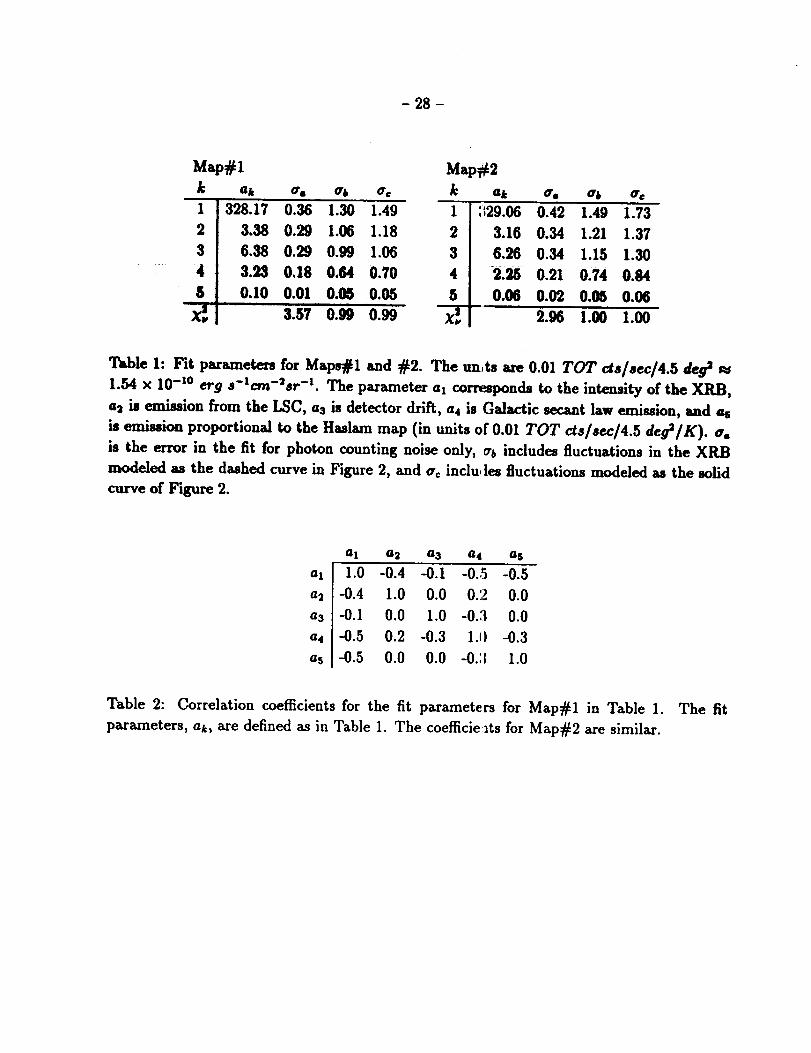
T_le I: Fit par_neters for Maps#l and #2. The units are 0.01 TOT cts/aec/4.5 de_
1.54 × I0 -m er 9 s-lon-2sr -l. The parameter ax corresponds to the intensity of the XRB,
a2 is emission from the LSC, as is detector driR, a4 is Galactic secant law emission, and
is emission proportional to the Haslarn map (in units of 0.01 TOT cta/sec/4.5 deg2/K). ¢,
is the error in the fit for photon counting noise only, =b includes fluctuations in the XRB
modeled as the dashed curve in Figure 2, mad ¢c inclu, ies fluctuations modeled as the solid
curve of Figure 2.
al
a2
a3
a4
a5
Ol G2 G3 a4 as
1.0 -0.4 _.1 -0.5 -0.5
_.4 1.0 0.0 0.2 0.0
-0.1 0.0 1.0 -0.3 0.0
_.5 0.2 -0.3 1.1) -0.3
4.5 0.0 0.0 -0.:| 1.0
Table 2: Correlation coefficients for the fit parameters for Map#l in Table 1. The fit
paxameters, ak, axe defined as in T_ble 1. The coefficie_ts for Map#2 are similar.

÷laJ
,,D
+lad
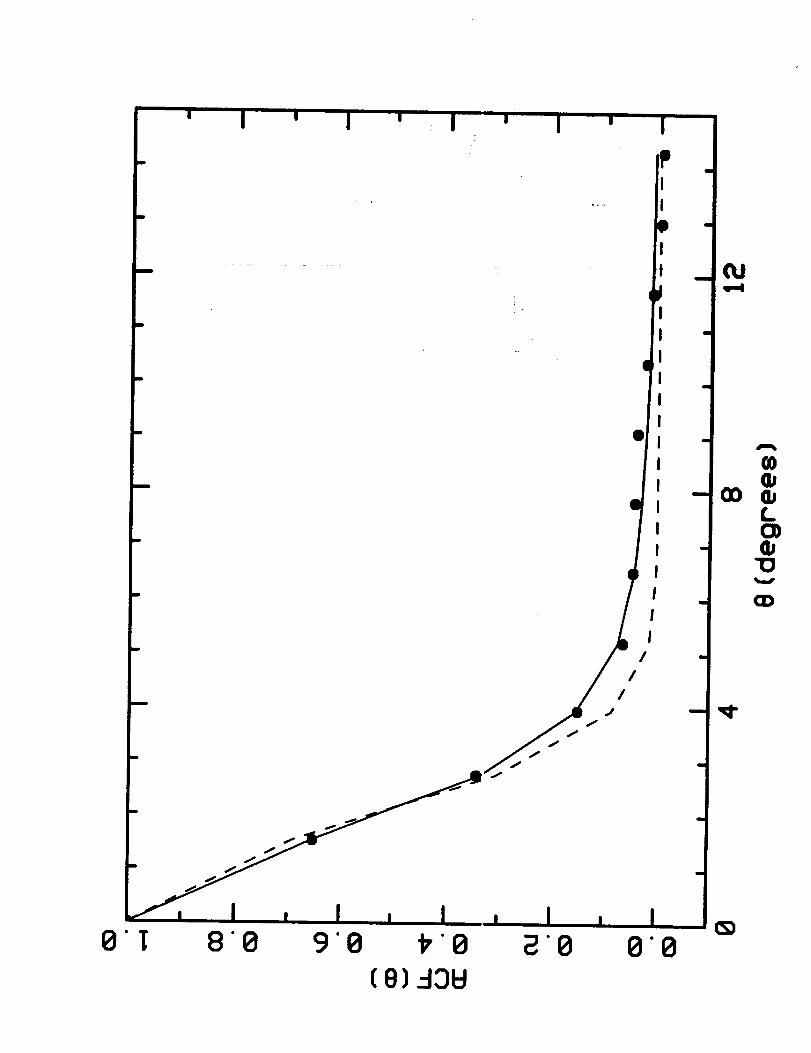
0
we
lee
ee
!
!
!
I
I
I
I
I
I
I
I
I
I
I
I
I
i
/
¢"U
CO
(5)
G)OlGI
GI"10
¢Z)
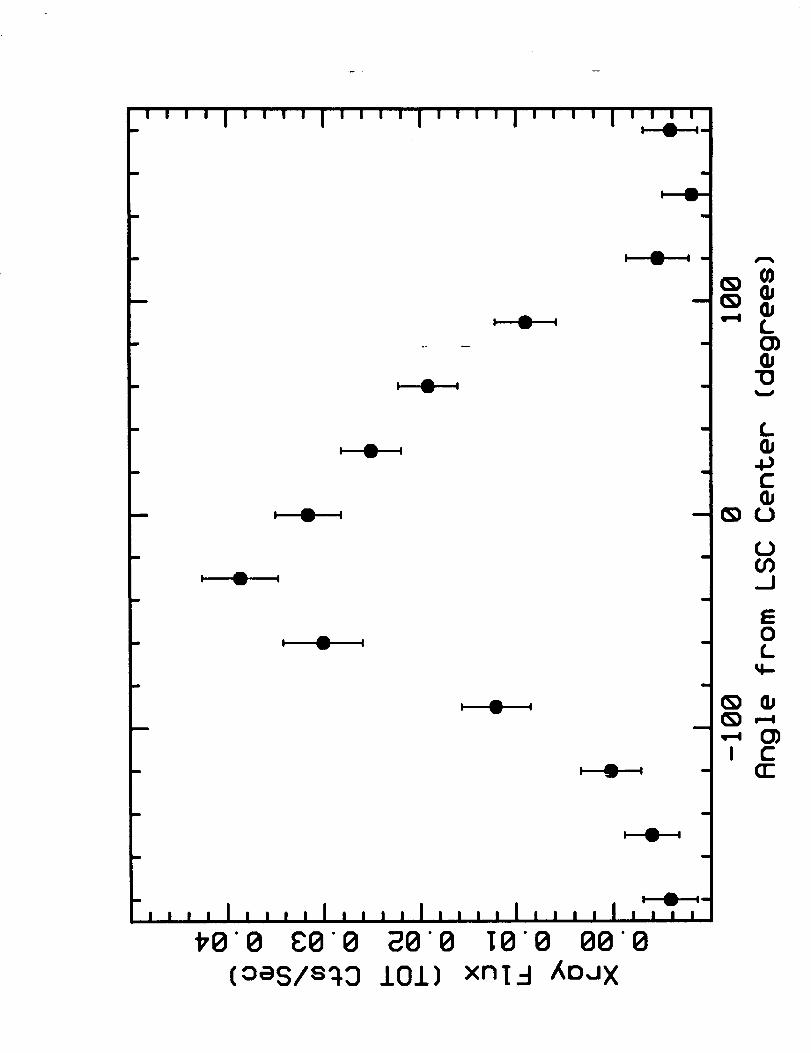
lie
I
el
ell
J_J_J_JJ_ el
A :W
i
A
W
I
W
dh
W
: A :W
m
ell
, I i , i , I ,, i i I ,,,, I i J , , I I a_-_l I -
_0"0 E0"0 _0"0 10"0 00"0
(oas/s_O I01) xn!_ AoJX
m
(.
L
C
Q_
E0L
(I:
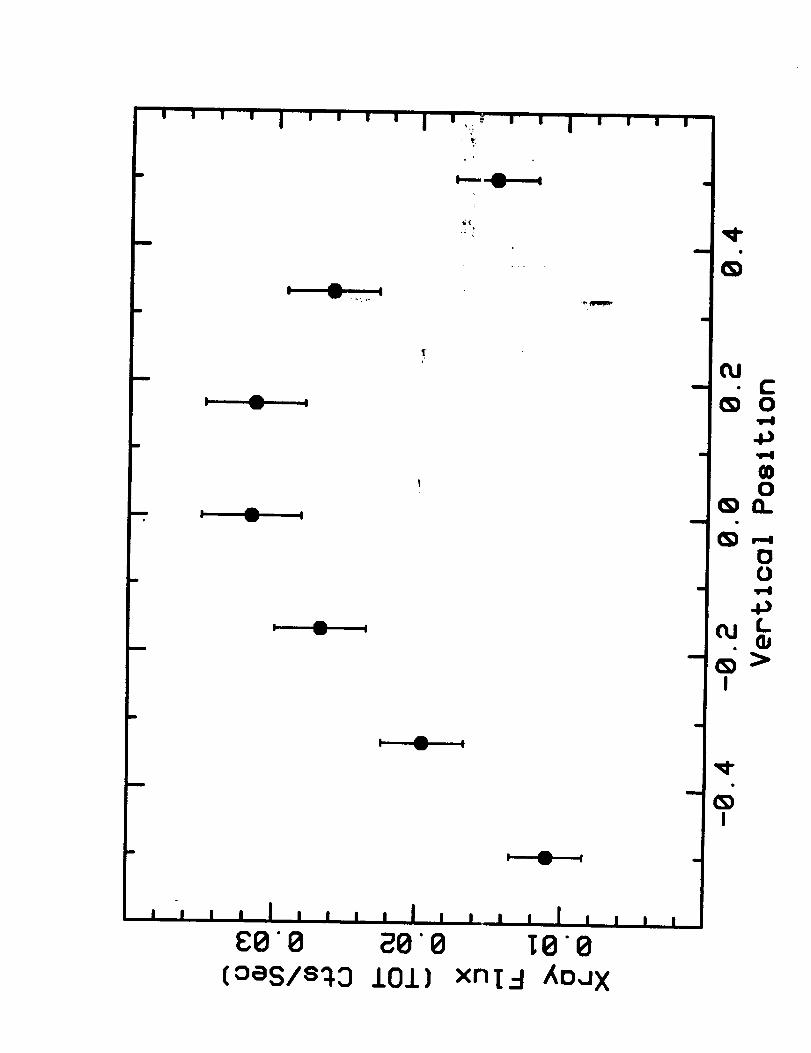
It
._ .MMmJm_
m
w
mA
w I
I'i
• A
W
: _ m
OJ• C
0
O_0
00
4-_
l
$
I
T0"0xn T_-I,4oJX

I
lid
I I I I , ,
,am,: _i,
' I I I
Aw
i _ :
A :I w
i :: w
_0"0 _0"0
(oes/8%3 I01)
''I''''I'''
i .W
: i .W
A .I w
A :: w
, I , , , , I ,
T0"0 00"0xnI_ ADJX
I
W
I
i
I I
_D
I
I
C0
0O_
e.,=0
0
"130OC

lop<'" .rlNW_q.
\''''1''''1''''1''''1''''1m
-\I !
i
n
m
I
i
\
\mb
iD
i
m
up
\A
W
\
\up
m
i
m
i
\
\
am
I
m
qi
m
li
n
aid
i
i
am
i
\b
\
\
\
\
!li
I
i
m
m
i
i
t
mi
i
,in
\-,,,,I,,,,I,,,,I,,,,I,,,,I,,,,_
g0"0 _0"0 _0"0 _0"0 T0"0(oas/s%O I01] xnT_H ,_oJX
(5)O
F--0
P_
"0
o
CL
(S)

(D
£_ "0 0_ "0 _0"0 00"0(6) _3U