Embed Size (px)
Citation preview
1
FINAL REPORT
EVALUATION OF SEDIMENT, WATER AND FISH TISSUE FOR CONTAMINANT LEVELS IN THE SALTON SEA AND ITS TWO PRIMARY TRIBUTARIES, THE ALAMO RIVER AND NEW RIVER FROM 2001-2012
REGION 7
Daniel Schlenk and Cindy Bui University of California, Riverside Department of Environmental Sciences
Cassandra Lamerdin Moss Landing Marine Labs California Surface Water Ambient Monitoring Program
SWAMP-MR-RB7-2014-0003
December 2014
Final Technical Report 2014
2
EVALUATION OF SEDIMENT, WATER AND FISH TISSUE FOR
CONTAMINANT LEVELS IN THE SALTON SEA AND ITS TWO PRIMARY
TRIBUTARIES, THE ALAMO RIVER AND NEW RIVER FROM 2001-2012.
Daniel Schlenk, PhD Department of Environmental Sciences University of California, Riverside
Cindy Bui Department of Environmental Sciences University of California, Riverside
Cassandra Lamerdin California Surface Water Ambient Monitoring Program Data Management Coordinator Moss Landing Marine Labs
3
TABLE OF CONTENTS
Executive Summary 3 Figure Titles 4 Table Titles 4 Appendices Titles 5 Acronymns And Abbreviations 8
1.0 Introduction 9 2.0 Objectives 9 3.0 Site Selections 9 4.0 Methods 10 5.0 Results 12 6.0 Discussion 26 7.0 Conclusions And Recommendations 29 8.0 References 31
Figures And Tables 34 9.0 Appendices 58
4
EXECUTIVE SUMMARY The Salton Sea is of vital importance as a stopover for migrant avifauna along the Pacific flyway. More than 380 species of birds (four are endangered) rely on the Salton Sea as essential habitat. The Sea receives drainage primarily from two rivers in the South: The New River and The Alamo River. Each river traverses geographical areas impacted by urban and agricultural land use wastes. Historical evidence indicates contamination of media and fish from the waterways by metals, legacy pesticides and other contaminants. In order to characterize temporal and spatial trends in contaminant profiles and relative impacts to biota from these locations, databases vetted through the California Surface Water Ambient Monitoring Program (SWAMP) were mined for contaminant occurrence in water, sediments and fish tissues collected from locations that had multiple monitoring events from 2001-2012 in the Alamo River, New River and the Salton Sea. Compounds consistently exceeding media-specific thresholds for potential adverse effects were targeted for temporal and spatial trend analyses. Sediments and water samples from 2011 and 2012 were also evaluated for toxicity.
In summary, persistent legacy organic and inorganic contaminants are still prevalent in fish and sediments of the Salton Sea and its two main tributaries. The New River appears to have higher levels of contamination than the Alamo, particularly at the International Border, but inputs are unclear as both inorganic and organic contaminant concentrations tend to be higher at the International Boundary and at the Outlet sites for the Salton Sea compared to sites along each river. Bioassessment indices conducted in 2003 are consistent with poor condition for the outlets of each river. In addition to persistent contaminants such as ΣDDT, ΣPAHs, current use pesticides such as pyrethroids (cypermethrin) and the organophosphate, chlorpyrifos are associated with the toxicity of sediments and water collected from the rivers. The source of toxicity to Salton Sea water remains unclear although sediment concentrations of Selenium have increased dramatically since 2007. In water and sediments, metals consistently above sediment and water criteria thresholds included Selenium and Copper with occasional exceedances by Chromium, Silver and Mercury. At the New River Boundary site, concentrations of nine metals exceeded sediment criteria from 2002-2010. In the Salton Sea, only Selenium consistently exceeded criteria from 2002-2011. With respect to organic contaminants in sediments from 2002-2011, several DDT isomers and degradates exceeded sediment thresholds in both river outlets and the Salton Sea. Concentrations of DDTs and Selenium within the sediments are consistent with fish tissue contaminants. Fish tissues exceeded ΣDDT criteria at 25 of 31 sampling events from 2004 to 2012. For Selenium 25/32 sites exceeded tissue residue thresholds for piscivorous wildlife. Thus, these two groups of contaminants continue to be cause for concern particularly for avian species due to trophic exposure.
5
FIGURE TITLES Figure 1. Map of Salton Sea, Alamo River and New River with collection sites.
Figure 2. Sediment concentrations of Selenium in the Alamo River (A), New River (B), and Salton Sea (C) from 2002-2011.
Figure 3. Comparisons of sediment concentrations of pyrethroids and chlorpyrifos from the Alamo River Outlet (A) and New River Outlet (B) from 2002-2012.
Figure 4. Temporal comparisons of total DDTs in sediments from Salton Sea, Alamo River Outlet, and New River Outlet (and Boundary) sites from 2002-2011 (A). Temporal values (2004, 2011-2012) of Total DDTs in tissues of fish from the Alamo and New River Outlets (B).
Figure 5. Fish Tissue and Water Concentrations of Selenium for the Alamo River (A) and the New River (B) for October 2012. Solid line represents Tissue based criteria; dotted line represents Aquatic Life Criteria (see Table 1).
Figure 6. Fish Tissue Concentrations of Total DDTs for the Alamo River (A) and the New River (B) for May and October 2012. Solid line represents Tissue based criteria for predators; dotted line represents fish health criteria (see Table 1).
TABLE TITLES
Table 1. Aquatic and sediment criteria used for chemical residue comparisons.
Table 2. Contaminants that exceeded aquatic life criteria in the Alamo and New Rivers in 2011 and 2012.
Table 3. Metal concentrations in sediments of the Alamo and New Rivers that exceed sediment criteria.
Table 4. Metal concentrations in sediments of the Salton Sea that exceed sediment criteria.
Table 5. Organochlorine pesticide concentrations (ng/g dwt) in sediments of the Alamo and New Rivers that exceed sediment criteria.
Table 6. Organochlorine pesticide concentrations (ng/g dwt) in sediments of the Salton Sea that exceed sediment criteria.
Table 7. Pyrethroid insecticide concentrations [ng/g dwt (ng/OC)] in sediments of the Salton Sea as well as the Alamo and New Rivers that exceed sediment criteria.
Table 8. Organophosphate [ng/g dw (ng/OC)], Polyaromatic Hydrocarbon (ng/g dw), and Polychlorinated Biphenyl (ng/g dw) concentrations in sediments of the Salton Sea as well as the Alamo and New Rivers that exceed sediment criteria.
6
Table 9. Contaminants in tissues of fish that exceed residue criteria from the Salton Sea as well as the Alamo and New Rivers.
Table 10. Bioassessment metrics for Salton Sea tributaries for 2003.
Table 11. Toxicity metrics for water and sediments sampled in 2011 and 2012.
APPENDICES
Appendix A. Sample site coordinates
Appendix B. Summary of matrices, constituents, frequency, and locations sampled for the Salton Sea, Alamo and New Rivers.
Appendix C. List of analytes, methods, method detection limits and reporting limits.
Appendix D. Species of fish sampled for chemical analyses.
Appendix E. Concentrations of metals and organic contaminants in fish tissues (ng/g ww) of the Salton Sea, Alamo and New Rivers.
E.1. Alamo River Fish Tissue Residues of Organochlorine Insecticides E.2. New River Fish Tissue Residues of Organochlorine Insecticides E.3. Salton Sea Fish Tissue Residues of Organochlorine Insecticides E.4. Alamo, New Rivers and Salton Sea Fish Tissue Residues of PBDEs E.5. Alamo River Fish Tissue Residues of PCBs E.6. New River Fish Tissue Residues of PCBs E.7. Alamo, New Rivers and Salton Sea Fish Tissue Residues of
Organophosphate and Carbamate pesticides E.8. Salton Sea Fish Tissue Residues of PCBs E.9. Alamo, New Rivers and Salton Sea Fish Tissue Residues of Metals
Appendix F. Concentrations of dissolved metals (ug/L) in surface water from the Salton Sea, Alamo and New Rivers.
Appendix G. Concentrations of organic contaminants (ug/L) in surface water from the Salton Sea, Alamo and New Rivers.
G1. Alamo River Organochlorine Insecticides G2. New River Organochlorine Insecticides G3. Salton Sea Organochlorine Insecticides G4. Alamo River Organophosphate and Carmabate Pesticides G5. New River Organophosphate and Carmabate Pesticides G6. Salton Sea Organophosphate and Carmabate Pesticides G7. Alamo River Pyrethroid Insecticides and Triazine Herbicides G8. New River Pyrethroid Insecticides and Triazine Herbicides G9. Salton Sea Pyrethroid Insecticides and Triazine Herbicides
7
G10. New River Volatile Organic Compounds G11. Alamo River PBDEs G12. New River and Salton Sea PBDEs
Appendix H. Concentrations of metals from sediments (ng/g dw) of the Salton Sea, Alamo and New Rivers.
H1. Alamo River Metals H2. New River Metals H3. Salton Sea Metals
Appendix I. Concentrations of organochlorine insecticides from sediments (ng/g dw) of the Salton Sea, Alamo and New Rivers.
I1. Alamo River Organochlorine Insecticides I2. New River Organochlorine Insecticides I3. Salton Sea Organochlorine Insecticides
Appendix J. Concentrations of pyrethroid insecticides and triazine herbicides from sediments (ng/g dw) of the Salton Sea, Alamo and New Rivers.
J1. Alamo River pyrethroid insecticides and triazine herbicides J2. New River pyrethroid insecticides and triazine herbicides J3. Salton Sea pyrethroid insecticides and triazine herbicides
Appendix K. Concentrations of organophosphate and carbamate pesticides from sediments (ng/g dw) of the Salton Sea, Alamo and New Rivers.
K1. Alamo River organophosphate and carbamate pesticides K2. New River organophosphate and carbamate pesticides K3. Salton Sea organophosphate and carbamate pesticides
Appendix L. Concentrations of polyaromatic hydrocarbons (PAHs) from sediments (ng/g dw) of the Salton Sea, Alamo and New Rivers.
L1. Alamo River PAHs L2. New River PAHs L3. Salton Sea PAHs
Appendix M. Concentrations of polychlorinated biphenyls (PCBs) from sediments (ng/g dw) of the Salton Sea, Alamo and New Rivers.
M1. Alamo River PCBs M2. New River PCBs M3. Salton Sea PCBs
8
Appendix N. Concentrations of polybrominated diphenylethers (PBDEs) from sediments (ng/g dw) of the Alamo and New Rivers.
N1. Alamo River PBDEs N2. New River PBDEs
9
ACRONYMS AND ABBREVIATIONS ALC =aquatic life criteria BMI =benthic macroinvertibrate index DDE = dichlorodiphenyldichloroethane DDT =dichlorodiphenyltrichloroethane DNQ =do not quantify EPT = Ephemeroptera, Plecoptera, and Trichoptera IBI =index of biotic integrity LEL =lowest effect level MQO =measurement quality objectives ng/g dw =nanogram/gram dry weight ng/g ww =nanogram/gram wet weight ng/L =nanogram/Liter OC =organic carbon o’p DDT =ortho, para DDT PAH =polyaromatic hydrocarbon PCB =polychlorinated biphenyl PBDE =polybrominated diphenyl ether QAPrPs =Quality Assurance Program Plan SPoT = Streams Pollution and Trends Program SWAMP = California Surface Water Ambient Monitoring Program TEC =Threshold Effects Concentration TEL =Threshold Effects Level TU =Toxic Unit VoCs =Volatile Organic Compounds USEPA =United States Environmental Protection Agency USGS =United States Geological Survey
ΣDDT =Total DDT isomers ΣPAHs =Total PAH ΣPCBs =Total PCB isomers
10
1.0 INTRODUCTION
The Salton Sea was created in 1905 when an accidental breach of a canal temporarily diverted Colorado River water into a natural depression below sea level. The Sea is of vital importance as a stopover for migrant avifauna along the Pacific flyway. More than 380 species of birds (four are endangered) rely on the Salton Sea as essential habitat, and birdwatchers contribute greatly to the local economy with up to 4 million birds being present on a typical winter day (Jehl, 1996). The Sea receives drainage primarily from two rivers in the South: The New River and The Alamo River. Originating in Baja California and running through the city of Mexicali for 25 km, into the United States, the New River traverses the city of Calexico, California through significant agricultural areas for 100 km and eventually terminates in the Salton Sea (Figure 1). The New River’s flow is composed of waste from agricultural and chemical runoff from the farm industry irrigation in the U.S. (18.4%) and Mexico (51.2%), sewage from Mexicali (29%), and manufacturing plants operating in Mexico (1.4%). The river has been referred to as the most severely polluted river of its size within the United States (RWQCB 1998). The Alamo River flows west and north from the Mexicali Valley (Baja California) across the Imperial Valley (California) and after 84 km drains into the Salton Sea.
Historically receiving significant agrichemical input throughout the past several decades, the rivers that flow into the Sea contain numerous pesticides, fertilizer, and industrial wastes (Setmire et al, 1993). Several studies have demonstrated the occurrence of various inorganic and organic contaminants in the Salton Sea (Riedel et al. 2002; Sapozhnikova et al. 2004; LeBlanc et al. 2006), but few have explored temporal trends between occurrence and biological impacts at specific sites.
2.0 OBJECITIVES
In an attempt to better understand the temporal and spatial distribution of
contaminants in the Salton Sea drainage system, Surface Water Ambient Monitoring Program (SWAMP) databases from the California Water Resources Control Board were evaluated at sites that had the greatest temporal data set for contaminants (typically 2002- 2012). Occurrences of metals, pesticides and industrial contaminants (VoCs; PCBs, PBDEs, PAHs) in water, sediments and fish tissues were condensed and tabulated to evaluate temporal and spatial trends. SWAMP data was selected because of the significant quality control and quality assurance components for the data quality. All data cited in this report are publically available and can be found at (http://www.ceden.us/). To evaluate potential ecological risks due to the contaminants, concentrations of contaminants from 2002-2012 were compared to literature based or USEPA criteria (if available) for each media (Table 1). In addition, limited toxicity (for 2011 and 2012 only) and bioassessment indices (2003 and 2006) were also included to provide limited “triad” data for site assessments.
3.0 SITE SELECTION
Sites for comparison were based on previous California Surface Water Ambient Monitoring Program (SWAMP) studies conducted through the California Water
11
Resources Control Board (Figure 1 and Appendix A). Sites with more than 3 years of monitoring data were selected primarily from drainage (Alamo and New Rivers) and mid-lake areas of the Salton Sea to compare sediment concentrations of contaminants to those in fish tissue. Appendix B shows an overview of the sites, years, and analyses for specific matrices.
4.0 METHODS
4.1 CHEMICAL ANALYSIS
Contaminants Selected for Analysis
For sediments and water samples, a total of 229 semivolatile organic compounds and 12 trace metals were selected for analysis (Appendix C). The semivolatile organic compounds included 32 organochlorine pesticides (including Chlordanes (5 isomers), DDTs (7 metabolites); Endosulfans (3 isomers), Endrins (3 isomers), HCHs (3 isomers), Heptaclors (2 isomers), 19 organophosphate/carbamate insecticides, 54 PCB congeners, 25 PAHs, 24 PBDE congeners, 14 triazine herbicides, and 9 pyrethroids (2 permethrin cis/trans diasteriomers). In addition, 3 Aroclor PCB mixtures were also calculated along with 48 volatile organic compounds. ΣPAHs, ΣPCBs, and ΣDDTs were summations of measured compounds. DNQs were not counted as exceedances.
For fish tissues, species are provided in Appendix D and type (fillet vs. whole body) are provided in Appendix E. Data were collected through the Regional Water Board 7 Monitoring Program (RMB7), the SWAMP Streams Pollution and Trends Program (SPoT) and California Monitoring and Assessment Program, and the SWAMP Bioaccumulation in Sport fish in Lakes Program.
Sampling of all water, sediment and tissues were conducting according to the Surface Water Ambient Monitoring Program coordinated through the State Water Board of California. Chemical analyses were primarily performed at the Department of Fish and Game Water Pollution Chemistry Laboratory, the California State University of Long Beach Institute for Integrated Research in Materials, Environments and Society (IIRMES), or the Department of Fish and Game Marine Pollution Studies Laboratory. Analytical chemistry was evaluated primarily using Standard USEPA methods (Appendix C). Quality Assurance was monitored using three different Quality Assurance documents depending on the time tine the samples were collected. Sediment and water collections prior to 2008 followed the SWAMP Quality Assurance Management Plan v.1 12/22/02. Sediment and water sampled collected after 2008 followed SWAMP Quality Assurance Program Plan v1.0 09/01/08 (SWAMP 2008). Tissue collections followed the procedures and Measurement Quality objectives in Screening Study of Bioaccumulation in California Rivers Quality Assurance Program Plan (Bonnema 2011).
All sediment and water data were verified according to the corresponding SWAMP Quality Assurance Program Plans (QAPrPs). All sediment and water data contained in this report met or deviated from the MQO contained in the QAPrP however these results presented were deemed usable for the intended purposes of the study. Tissue data were
12
validated to the criteria defined in the Bioaccumulation QAPrP. All tissue data presented were deemed usable for the intended purposes of this study.
4.2 BIOLOGICAL ANALYSES
4.2.1 Benthic Macroinvertebrate Index (BMI)
Bioassessment is utilized in California as a tool for freshwater resource assessment (Rehn 2008). All projects sampled BMIs with kick net protocols. To facilitate data comparability, BMI taxa lists from the various projects were standardized at “Level I” taxonomic effort as defined by the Southwestern Association of Freshwater Invertebrate Taxonomists: (http://swamp.mpsl.mlml.calstate.edu/wp-content/uploads/2009/04/swamp_sop_ bioassessment_collection_020107.pdf).
Five hundred count samples were standardized using randomized subsampling without replacement. Samples with < 300 organisms were omitted from analyses. An IBI score was calculated for each site by summing constituent metric scores and adjusting the index to a 100-point scale. Five final metrics were scored for inclusion in the IBI: collector richness (number of taxa that are collector feeders), predator richness (number of taxa that are predators), percent EPT taxa (percent of taxa that are mayflies, stoneflies, or caddisflies), and Shannon diversity (a composite measure of taxonomic richness and evenness of abundance).
Samples were taken in May of 2003 at the Alamo River Outlet and the New River Outlet (see Figure 1 and Appendix A for coordinates). An additional site was included at the Salton Sea Drain (33.446111, -115.848333) at the mouth of Salt Creek, where three replicate samples were collected. Fig Drain on the New River was also evaluated in May of 2006.
4.2.2 Water and Sediment Toxicity Testing
Water and sediment samples were collected in May and October, 2011 and 2012. Samples were stored on ice in the dark prior to delivery to either the Aquatic Toxicology Laboratory at University of California Davis or the Marine Pollution Studies Laboratory at Granite Canyon, CA. All tests were initiated within the holding times specified in the Quality Assurance Project Plan for these tests. For 2011, samples were taken from the Alamo River Outlet, Alamo River at Drop 10 (Central Drain), New River at the International Boundary, New River Outlet, Alamo River at the International Boundary, and three Salton Sea Mid-Lake locations (USGS2, 7, and 9). In 2012, samples were only collected from the Alamo River Outlet, New River at Boundary and New River Outlet sites (see Figure 1 and Appendix A for map and coordinates).
Toxicity tests with Hyallella Azteca were performed according to USEPA protocols (USEPA 2002). The control water consisted of drinking water (DS Waters of America) amended with dry salts to moderately hard specifications. For sediment tests, the 10-d
13
testing procedure for Hyalella azteca was used based on protocols described in the Quality Assurance Program Plan for the California Surface Water Ambient Monitoring Program (http://www.waterboards.ca.gov/water_issues/programs/swamp/).
For topsmelt (Athinerops affinis) tests, a larval toxicity test protocol used a 7-d static renewal exposure (USEPA 1995). A detailed description of the topsmelt protocol is given in Anderson et al. (1994). Test end points were survival for Hyalella water tests, survival and biomass for topsmelt tests, and survival and growth for Hyalella sediment tests.
5.0 RESULTS
5.1 Chemical Analysis
This section will evaluate occurrence primarily from sediment and fish tissue residue analyses and provide exceedance information for contaminants that have either sediment quality guidelines or other thresholds (LC50). Thresholds are provided in Table 1. Contaminants exceeding these thresholds are provided in Tables 2-9. Temporal trends were conducted for Selenium concentrations in sediments (Figure 2), pyrethroid/chlorpyrifos concentrations in sediments (Figure 3) and DDTs concentrations in sediments and fish (Figure 4). Spatial comparisons for river sites were conducted for water and fish tissue concentrations of Selenium (Figure 5) and fish tissue concentrations for DDTs (Figure 6) in 2012.
5.1.1 Water Evaluations
Chemical analyses of water samples were conducted on samples taken during Spring and Fall from 2011-2012 from the Alamo River, the New River and the Salton Sea (See Appendix B for overview).
5.1.1.1 Metals
Alamo River
Nearly all dissolved metals selected for analysis were detected in all water samples (Appendix F). Only Lead and Silver were not detected (Boundary; Barbara Worth Drain (BWD); Drop 10; Peach, Oleander Drains, and Outlet). At the International Boundary and Outlet, Copper (all samples) and Mercury (all but one) exceeded Aquatic Life Criteria (ALC) for freshwater and saltwater for both sampling dates in 2011 (Table 2). One of the samples at the Outlet in October 2011 had Nickel concentrations above the saltwater ALC. At the Alamo Drop 10 at Central Drain, Copper and Selenium exceeded ALC in 2012. Similarly the Barbara Worth, Central Drain and Oleander Drains all had Copper above freshwater criteria. Selenium exceeded freshwater ALC for Drop 10, Central, Oleander Drains but not saltwater criteria for all the Outlet samples for 2012.
14
New River
At the Boundary, Cadmium, Chromium Lead (October 2011), Copper (October 2011) Selenium and Silver were not detected. However, in 2011, Copper concentrations were above freshwater ALC at the Boundary in May, and Greeson, Fig and Rice Drain 3 in 2012. Mercury was over freshwater ALC in October of 2011 at the Boundary but none of the samples at the Outlet were above saltwater ALCs. All were greater than 0.5 ug/L. Selenium was above freshwater ALC at Rice 3 Drain, but not above saltwater ALC at the Outlet.
Salton Sea
Cadmium, Chromium, Lead and Silver were not detected. Although concentrations of Mercury (0.83-0.903) and Copper (0.87-1.69) were relatively high, neither exceeded saltwater ALCs (Table 1). Likewise, all other metals were below ALCs.
5.1.1.2 Organochlorine Pesticides
Alamo River
No organochlorines were detected in water at the International Boundary (Appendix G1). At Drop 10 Central drain, Dacthal was observed in all samples from 2011-2012. Maximum concentrations were 1.2 ug/L. opDDD (0.019 ug/L) was observed in 1/5 samples and ppDDE was measured in 3/5 samples with a max concentration of 0.013 ug/L over the 2 year period. Oxychlordane (0.476 ug/L) was also detected in one sample. At Barbara Worth Drain and Central Drain Dacthal and ppDDE were observed at 0.139 and 0.017 ug/L maximum concentrations, respectively. ppDDE was measured at the Oleander and Peach Drains at concentrations ranging form 0.006-0.009 ug/L. Dacthal was observed at 0.019 ug/L. At the Outlet, ppDDE 5/7 and Dacthal 6/7 were the most frequently detected for 2011-2012. The highest Dacthal concentration was 0.382 ug/L in October of 2011. One detection of aldrin, oxychlordane, and ppDDD was also observed in April of 2011. Dieldrin (0.003-0.005 ng/L) was also detected in 2/7 samples at the Outlet. None of these values exceeded ALC for fresh or saltwater (Table 1).
New River
Organochlorine pesticides were not detected in the water at the International Boundary (Appendix G2). At the Fig Drain, Rice 3 Drain, and Greeson Drain, dacthal (4/6) and ppDDE (4/6) were detected. At the Outlet, oxychlordane (0.015 ug/L), aldrin (0.011 ug/L), Dacthal (1.4 ug/L max) and ppDDE (0.008 ug/L max) were observed. Dachthal was the most frequently detected (6/8). None of these values exceeded ALC for fresh or saltwater (Table 1).
Salton Sea
15
In the Salton Sea, organochlorine pesticides were not detected in collected water (Appendix G3). 5.1.1.3 Organophosphates and carbamates
Alamo River
For the Alamo River International Boundary, no pesticides were detected in 2011 or 2012 (Appendix G4). The most frequently detected pesticide throughout the Alamo River Drainage was chlorpyrifos with concentrations measured at the Drop 10 Central Drain (0.294 ug/L) the Central Drain (0.055 ug/L) and DNQ at the Peach Drain all in the Spring collections. The two concentrations above DNQ exceeded ALC for freshwater CMC (Drop 10) and CCC (Central) effects (Table 2). Other pesticides detected included diazinon (0.070 ug/L) and malathion (0.016 ug/L). With the exception of chlorpyrifos, all of these values were below ALC. At the Outlet 3/7 detections of chlorpyrifos were observed with one DNQ and a 0.058 ug/L max concentration. However, every measured sample exceeded LC50 values (0.040 ug/L) or ALC values for saltwater (0.0056 ug/L).
New River
At the International Boundary, the only measured pesticide was disulfoton (0.095 ug/L) in October 2011 (Appendix G5). In 2012, disulfoton values were 0.197 and 0.110 ug/L in May and October, respectively. At Greeson Drain in 2012, diazinon was 0.0011 ug/L. At the Outlet one fall sample detected chlorpyrifos 0.051 ug/L which exceeded LC50 values and chronic freshwater ALC (Table 2). Diazinon was also detected at 0.143 ug/L which was below the freshwater (0.170 ug/L) and saltwater (0.82 ug/L) ALC.
Salton Sea
None of the targeted pesticides were detected in water collected from the Salton Sea (Appendix G6).
5.1.1.4 Polybrominated diphenyl ethers (PBDEs) and Polychlorinated Biphenyls (PCBs)
Very few detections of PBDEs (Appendix G7) and no PCBs (data not shown) were observed in the Alamo and New Rivers as well as the Salton Sea (Appendix G8). Samples were only collected in May and October of 2011 from 3 locations on the Alamo River and two locations on the New River. Samples were only collected in May for the 3 Salton Sea locations. The most frequently detected was PBDE47 (5/7 with 3 DNQ for Alamo; 4/5 with one DNQ for New River) and PBDE99 (4/7 with two DNQ for Alamo; 4/5 with one DNQ for New River). PBDE99 was measured in the Alamo Outlet at 0.013 ug/L and at 0.009 ug/L in the New River. Both congeners were also observed in the Salton Sea at 0.004-0.005 ug/L concentrations. PBDE47 was detected all three locations with one DNQ and PBDE99 was detected at 2/3 locations. All detections were below a proposed threshold of 1 ug/L (Maruya et al. 2013).
16
5.1.1.5 Polyaromatic Hydrocarbons (PAHs)
As with the PBDEs and PCBs very few PAHs were observed in water collected from the Alamo or New Rivers as well as the Salton Sea (Data not shown). The most frequently detected compounds were fluoranthene, phenanthrene, pyrene and naphthalene all of which were in the ng/L concentration range.
5.1.1.6 Pyrethroid Insecticides and Triazine Herbicides
Sampling for these compounds was only conducted in 2011 (Appendix G9-11).
Alamo River
At the International Boundary during 2011, only λ−cyhalothrin (0.006 ug/L) and 2- hydroxyatrazine (0.007 ug/L) were observed in measurable concentrations in water (Appendix G9). The concentration for λ− cyhalothrin exceeded the UC-Davis ALC (0.001 and 0.0005 ug/L) (Table 2). At the Drop Station 10 site, atrazine (0.028 and 0.006 ug/L), desethyl-atrazine (0.014 ug/L), 2-hydroxyatrazine (0.008 ug/L) were the only compounds detected. They did not exceed threshold concentrations for atrazine. At the Outlet site, atrazine (0.077-0.091 ug/L), and esfenvalerate (0.004 ug/L) were the only compounds observed. Several DNQ detections were observed with prometon, prometryn and propazine.
New River
Only atrazine (0.008 ug/L) and desethyl-atrazine (0.017 ug/L) were observed at the International Boundary in 2011 (Appendix G10). At the Outlet, only λ-cyhalothrin (0.011 ug/L) exceeded water quality criteria in October (Table 2). Prometon, prometryn and propazine were detected but not quantifiable. Atrazine (0.012-.404 ug/L), 2-hydroxy- atrazine (0.011-0.018 ug/L) and desethyl-atrazine (0.026-0.039 ug/L) were also observed at the Outlet.
Salton Sea
At the 3 Salton Sea sites sampled in 2011 (Appendix G11) atrazine (0.032-.034 ug/L), 2- hydroxy-atrazine (0.183-0.200 ug/L) and desethyl-atrazine (0.021 ug/L) were detected but below ALC. Ametryn was detected, but not quantified.
5.1.1.7 Volatile Organic Contaminants (VOCs)
Of 49 VOCs analyzed in 2011, only toluene (0.039 ug/L) was detected at the New River International Boundary in May 2011 (Appendix G12). No other compound was detected at the New River Outlet. The Alamo River and Salton Sea were not sampled.
17
5.1.2 Sediment evaluations
5.1.2.1 Metals
Alamo River
Only one annual sample from Spring and Fall (2011) was available for the International Boundary (Appendix H1) for the Alamo River and none of the metal concentrations exceeded consensus sediment criteria (MacDonald et al. 2000) (Table 3). Only Selenium was targeted at the Drop 10 Central Drain station and it was also below threshold concentrations.
At the Outlet station, concentrations of Chromium and Copper (mg/kg) exceeded criteria in 2006 (Table 3). No significant trends were observed temporally with any of the metal concentrations over time.
New River
From 2002-2006, and in 2010, Cadmium concentrations exceeded consensus thresholds (0.99 mg/kg) at the International Boundary with the highest concentration observed in October 2002 (2.31 mg/kg) (Table 3). With the exception of the single October sample in 2010, Cadmium concentrations had been declining since 2006 (Appendix H2). Similarly, Chromium concentrations were above thresholds from 2003-2006, but were in decline until October 2010. Samples in 2011 were once again below criteria. The highest concentration was October 2004. Copper and Lead concentrations exceeded thresholds continuously from 2002 until 2006 as well, but from 2009-2012 concentrations again were elevated above criteria. The highest Copper measurement was October 2004 (106 mg/kg). For Lead, the maximum concentration was taken in October 2010 (70.2 mg/kg). For Mercury, criteria were exceeded from 2002-2006 with the maximum concentration observed in May of 2005 (3.45 mg/kg). Concentrations again exceeded threshold from 2009-2011. Selenium exceeded sediment thresholds (2.0 mg/kg) in 2006 and 2010. Silver followed a similar pattern with the highest concentration observed in October 2010. Zinc concentrations exceeded sediment criteria (121 mg/kg) in at least one sample every year except for 2007-2008. At the Outlet location, Chromium exceeded criteria for 2002 and 2008 (Table 3). Copper concentrations were above thresholds for 2002.
Salton Sea
For USGS2, Arsenic (2002, 2010), Silver (2002) and Selenium (2002-2011) exceeded sediment quality criteria (Table 4 and Appendix H3). The highest concentrations of Selenium were observed in 2002 (11.9 mg/kg). However, concentrations in 2010 were very similar at 9.11 mg/kg indicating no temporal changes in concentrations (Figure 2). The USGS7 sample had exceedances for Selenium (2002-2010) and Silver (2002). The highest Selenium concentration was 15 mg/kg in 2010. Copper and Silver in 2002, Arsenic in 2004, and Selenium from 2002-2011 exceeded thresholds for USGS9. The
18
highest Selenium concentration was 14.2 mg/kg in 2011. No significant temporal trends were observed for metal concentrations in any Salton Sea site (Figure 2).
5.1.2.2 Organochlorine Pesticides
Alamo River
At the International Boundary in May 2011, 5 organochlorine pesticides were detected but only two were quantified: ppDDE (5.14 ng/g dw) and dieldrin (0.71 ng/g dw) (Appendix I1). The concentration of ppDDE exceeded consensus sediment criteria (3.16 for ΣDDE) (Table 5). In October 2011, only ppDDE was quantified (3.26 ng/g dw) and it again exceeded sediment thresholds. At the Outlet site, other organochlorine pesticides were also detected from 2002 until 2012. Chlordanes (cis 3/22 and trans 5/22) were detected with only 1 cis and 2 trans samples quantifiable. The samples from May of 2010 were above the consensus threshold for combined chlordanes (3.24 ng/g dw) (Table 5). There was an apparent increase in Chlordane concentration until 2010, but no other detections were observed after 2010. Dacthal was frequently detected (21/22) with 12 quantifiable concentrations with no observed temporal reduction in concentrations (Appendix I1). DDD concentrations were also frequently observed with opDDD 16/21 and ppDDD 18/23. Of the 16 detections of opDDD, 11 were DNQ and for ppDDD, 10 of the 18 detections were DNQ. Combined ΣDDD criteria were exceeded in 2002 and 2010. All values were DNQ in 2011 and below detection in 2012. For opDDE, 14/22 samples were detected with 13 of these being DNQ. Detection of ppDDE was 100% (20/20) with 1 being DNQ. All concentrations before 2012 exceeded consensus criteria for ΣDDE. There was no clear trend toward reduction over time, but ppDDE was only detected as DNQ in 2012. DDMU (9/22) detections increased temporally, but since 8 of the detections were DNQ, temporal conclusions are highly uncertain. For opDDT, 6/24 samples were detected, but all were DNQ. ppDDT was more frequently detected 11/24 but with 8 DNQ values. Only one sample exceeded DDT sediment threshold (May 2010). The only other frequently detected pesticide was dieldrin 22/24 which had 4 DNQs and 3 exceedances in 2006, 2008, and 2010. Dieldrin was not detected in 2012
New River
From 2002-2011, cis chlordane was detected 14/19 with 3 DNQs and trans chlordane was detected 16/19 with 5 DNQ at the New River International Boundary (Appendix I2). When combined, 12 concentrations exceeded consensus standards (Table 5). Cis and trans chlordene (not to be confused with chlordane) was observed in 2003 and 2004, but only one value was quantifiable in 2003 (1.74 ng/g dw). Dacthal was frequently detected (9/20) with 4 DNQ). Chlordane concentrations remained constant during the 9 year period, but chlordane and Dacthal gradually decreased from 2004 and 2006, respectively. ΣDDD were detected in 18/19 (opDDD) and 18/20 (ppDDD) samples during the period with 7 and 2 DNQs, respectively. Concentrations were significantly lower in 2007 and 2011, but relatively unchanged throughout 2002-2011. Thirteen samples exceeded consensus sediment criteria for ΣDDD for 2002-2006; 2008-2010 (Table 5). For opDDE, 11/19 detections were observed with 10 DNQs and for ppDDE 18/19 detections occurred with 1 DNQ. When the isomers were combined ΣDDE concentrations exceeded thresholds (3.16 ng/g dw) for every sampling event (Table 5) from 2002-2011. DDMU
19
was detected 9/19 times with all samples being DNQ. For opDDT 7/19 detections were observed but all were DNQ, and 12/20 with 4 exceedances (2002, 2008, 2010-2011) and 9 DNQs were noted for ppDDT. With the exception of October 2002 (39 ng/g dw), no detections were observed until 2005 and no quantifiable concentrations were noted until 2009. Consequently, it would appear that DDT inputs increased from 2002 to 2011 at the International Boundary of the New River. Dieldrin was also frequently detected (15/19) with only 3 DNQs and 7 exceedances for 2005-2006; 2008-2010. No temporal trend was observed for Dieldrin. HCB 13/19 was also observed but concentrations were below detection and quantification since 2007. Trans-Nonachlor concentrations were also frequent 16/19 with 5 DNQ and no apparent temporal trend toward reduction. For cis- Nonachlor only 6/19 samples were detected, but all were DNQ. Only pp isomers of DDT, DDE and DDD along with Dachtal were targeted at Rice Drain #3, and none were detected.
In contrast, nearly all of the compounds observed at the International Boundary were observed at the Outlet to the Salton Sea, but in lower concentrations. Cis (3/24) and trans (6/25) chlordanes were observed with 2 and 4 DNQs, respectively from 2002-2012 at the Outlet. The last quantifiable concentration was observed in 2008 for cis and trans chlordane which when combined exceeded consensus criteria (Table 5). For dacthal, 18/25 samples were detected (12 DNQ) with no temporal trends in concentrations during the 10 year period. For ΣDDD, opDDD (13/24 with 11 DNQ) and ppDDD (15/25 with 11 DNQ) were frequently detected, but none exceeded sediment thresholds. Concentrations of opDDE (10/24 with 8 DNQ) were less frequently detected than at the International Boundary. ppDDE (25/25 with 2 DNQ) was still frequently detected and all 23 of these samples were above sediment thresholds for potential toxicity (Table 5). DDMU was detected 9/23 samples with 8 DNQ. opDDT was only detected 5/24 samples and 4 were DNQ and 5/24 (with 4 DNQ) samples possessed ppDDT with only one sample (October 2008) exceeding thresholds. Temporally, all DDTs again appeared to be higher or more consistently detected from 2007-2012. However, overall contamination was lower than the International Boundary. For Dieldrin 20/24 samples detected compound with 6 DNQ and 4 of the measured values exceeding sediment criteria (2008 and 2010) and overall concentrations increasing from 2004. Infrequent detections (all DNQ) of HCB and nonachlor were also observed with no temporal trends for occurrence.
Salton Sea
For the USGS2 site, 7/24 samples from 2002-2011 detected trans chlordane, but all of the samples were DNQ (Appendix I3). ΣDDD were only detected after 2009 with this sample (7.68 ng/g) exceeding sediment thresholds (Table 6). DNQ detections were noted for 2010 and 2011, but none prior to 2009. A similar temporal trend was observed of opDDE, which was not detected prior to 2008, but was detected in every subsequent sample. ppDDE was detected in every sample throughout the 9 year period (17/17) but had 2 DNQ. Of the 15 remaining samples for DDE, all exceeded consensus thresholds for ΣDDE for 2002-2011 (Table 6). DDMU had two quantifiable samples in 2002 and 2009, but was not detected between 2002 and 2009. Neither isomer of DDT was detected throughout the 9 year period and dieldrin was only quantifiable in 2009 and 2011 when it exceeded sediment criteria in 2/3 samples indicating temporal increases in loading to this site.
20
For USGS7, 2 DNQ trans-chlordane detections were observed in 2003 and 2006. opDDD and ppDDD were detected in 3/15 (3 DNQ) and 4/15 (2 DNQ, respectively. None of the samples exceeded sediment thresholds. opDDE was detected in 4/15 samples and 3 were DNQ. However, ppDDE was detected in 14 of 15 samples with 1 DNQ and all 14 samples exceeded sediment thresholds for 2002-2011 (Table 6). DDMU (6/15) was quantifiable in 2002 and 2009. Only one sample was DNQ for ppDDT in 2010, all other samples failed to detect either DDT isomer. For dieldrin, 5/15 samples detected analyte, but 3 were DNQ, the other two samples in 2009 and 2010 exceeded threshold criteria (1.9 ng/g dw).
A similar pattern for organochlorine pesticides was observed at USGS9 where DDD (4/15; 5/15), DDE (4/15; 14/15), DDMU (9/15) and dieldrin 9/15) had the highest frequencies of detection. Four of the DDD, all of the DDE, and 4 of the dieldrin samples exceeded thresholds with some of the highest concentrations (113 ng/g dw ppDDE in 2003) observed in all sediment samples.
5.1.2.3 Pyrethroid Insecticides and Triazine herbicides
As discussed above, toxicity of a given contaminant in sediments can be estimated based upon comparisons to sediment quality guidelines (Table 1). However, not all measured contaminants have guidelines, and some only have literature-based LC50 values. Pyrethroid insecticides are in the latter category. Using LC50s derived by Amweg et al. (2005) and normalized to organic carbon (OC), toxicity of sediment concentrations was estimated (Table 7). Triazine herbicides do not have sediment criteria and, thus, were not investigated for sediment toxicity.
Alamo River
For the Alamo River at the International Boundary, only two samples were collected; one in May and October of 2011 and pyrethroids were not detected in these samples (Appendix J1).
At the Drop 10 Central Drain site, only one sample from October 2011 was obtained and none of the detected compounds exceeded sediment thresholds as individual compounds. However, if the concentrations were additively combined and a Toxicity Unit (TU) evaluation carried out, significant sediment toxicity would be predicted. TU is calculated by dividing the concentration of the chemical in the matrix by the LC50 of the chemical. When multiple chemicals occur in a matrix and have the same mode of action (for pyrethroids this would be neurotoxicity), the TUs may be added to obtain an overall estimate.
For the Alamo River Outlet, a much greater sample set was available to assess temporal trends since annual sampling in Spring and Fall was conducted from 2003, and then from 2005-2012. Esfenvalerate was the most frequently detected 8/15 (1 DNQ) and the maximum concentration was 4.85 ng/g dw observed in October of 2012 and discussed below as a possible contributor to sediment toxicity in H azteca. Overall concentrations have increased nearly 5 fold since 2008 (Figure 3). Bifenthrin was detected in 6/15
21
samples and had a maximum concentration of 5.12 ng/g dw in April of 2009. Because of lower Total Organic Carbon values (0.018%), normalized concentrations for this sample were 2844 ng/g Organic Carbon (OC) and nearly 6-fold higher than LC50 values normalized to OC (Table 7). Since 2009, concentrations have declined more than 5 fold to 0.884 ng/g dw in 2012 (Figure 3). All other detections (cyfluthrin, λ− cyhalothrin, cypermethrin) were either all DNQ or below thresholds for toxicity. Most of the DNQs were in Fall samples of 2011.
New River
At the International boundary, sediment samples were collected from 2003-2011 most commonly in Spring and Fall (Appendix J2). The most frequently detected pyrethroid was cypermethrin (9/14) with a maximum concentration of 182.9 ng/g dw in May of 2004 which was the first year it was targeted for analysis. This value normalized for OC (8165 ng/g OC) exceeds the published LC50 (1008 ng/g OC) more than 8-fold. Concentrations have generally decreased over time (Figure 3), but the last October 2011 sample (112 ng/g dw) was again 14 fold higher than the LC50 threshold for cypermethrin. However it should be noted that OC measurements were not made with this sample and an assumed concentration of 1.0% was utilized. Nearly all pyrethroids were detected in October 2011. The second most frequently detected pyrethroid was Bifenthrin (8/15). Concentrations have generally diminished over time with the highest concentration detected in 2005 (21.8 ng/g dw). Samples in May 2004 (513 ng/g OC) and September 2005 (960 ng/g OC) were at or exceeded LC50 values (520 ng/g OC) when normalized for organic carbon. The highest concentration of any pyrethroid was cyfluthrin which was 993 ng/g dw (43,744 ng/g OC) in October of 2005. This concentration exceeded the LC50 43 fold. Cyfluthrin was not detected again until October of 2011 where its concentrations were below thresholds. Λ− cyhalothrin (4/15), had one exceedance in April of 2009 (8.59 ng/g dw) which was likely due to low organic carbon content (0.113). Its normalized value of 7601 ng/g OC exceeded the LC50 (450 ng/g OC) 16.8 fold. Concentrations in 2011 were approximately half of those observed in 2005 and 2009. Deltamethrin (2/8) and esfenvalerate (3/15) were infrequently detected with no apparent change in concentration temporally. Permethrin, as combined enantiomers (cis + trans), prior to 2008 was detected 3/5 times. From 2007-2011, it was only detected once in 2009. However, the October 2011 sample had concentrations twice that observed in 2004. None of these concentrations exceeded toxicity thresholds (Table 7). When evaluating all pyrethroids, only two compounds were detected from 2006-2008 (cypermethrin and fenpropathrin) and the later was a DNQ and the only time it had been detected in the 10 year study. Reasons for the gap in detection are unclear.
Although significant detections occurred at the International Boundary of the New River, no detections were observed at the Rice Drain #3 site. However, at the Outlet to the Salton Sea, more frequent detections were again observed with most compounds. Bifenthrin was the most frequently detected (9/18) with a maximum concentration of 2.02 ng/g dw in October of 2010. Esfenvalerate was the second most frequently detected pyrethroid (8/17) with maximum concentrations (12.6 ng/g dw) observed in October 2010. Using TU, Cypermethrin (6/16) would be predicted to have the most toxicity with a value of 1.1 TU (411/380 ng/g OC) in October of 2010. Λ−cyhalothrin (6/18), cis permethrin (4/12) and trans-permethrin were also detected, but did not have
22
concentrations exceeding LC50s when normalized for organic carbon. Pyrethroids likely contributed to sediment toxicity of H. azteca in October of 2012 (see below), and when grouped together exceeded thresholds in October of 2010 as well. Interestingly, none of the concentrations exceeded thresholds for 2011, nor for any other sampling event prior to 2003.
Overall, pyrethroid contamination has been significant at the international boundary since 2004. While the frequency of detections was somewhat lower during 2007-2010, concentrations exceeded sediment criteria and toxicity was observed in 2011. At the Outlet sites, concentrations have steadily increased since 2003 (Figure 3), with limited detections until 2009 and sediment criteria exceedances in 2010-2012 (Table 7).
Salton Sea
For the Salton Sea, only esfenvalerate (2.47 ng/g dw) was detected in a single sampling event (October 2009) for the USGS2 site (Appendix J3). No other sample from any of the Salton Sea locations had quantifiable concentrations. One DNQ was observed for bifenthrin in October 2007 at USGS9. Although only one compound was detected, its organic carbon normalized concentration (8233 ng/g OC) exceeded the published LC50 (1540 ng/g OC) (Table 7). Consequently, there does not appear to be any temporal or spatial trend for pyrethroids in the Salton Sea.
5.1.2.4 Organophosphates and carbamates
Alamo River
For the Alamo River, none of the targeted analytes were detected at the International Boundary or the Drop 10 Central Drain sites in 2011 (Appendix K1). Prior to 2011, chlorpyrifos was detected in concentrations (50,000 and 2958 ng/g OC) exceeding carbon normalized LC50 values (1770 ng/g OC)(Amweg and Weston 2007) in April of 2003 and October of 2004 at the Outlet (Table 8) and may be responsible for the low IBI score in May 2003 (Table 10). Since 2004, chlorpyrifos was only detected in May of 2006 and October of 2011 as DNQ values at the Outlet site indicating significant temporal reductions in sediment concentrations for chlorpyrifos. No other organophosphate or carbamate was observed in the Alamo River during this period.
New River
In contrast to the Alamo River, concentrations of chlorpyrifos were frequently detected at the International Boundary for the New River (12/20) (Appendix K2) and continually exceeded organic carbon normalized LC50 values in October of 2002 (1931 ng/g OC), April of 2003 (3044 ng/g OC), November of 2003 (5367 ng/g OC), May of 2004 (3143 ng/g OC), October of 2004 (5409 ng/g OC), October of 2005 (7533 ng/g OC) May of 2006 (4317 ng/g OC) and the highest concentration of 13,008 ng/g OC in April of 2009 (Table 8). The concentrations in 2003 may be responsible for the diminished IBI scores discussed below (Table 10). Chlorpyrifos was not detected in sediments in 2010 or 2011. No compounds were observed at the Rice Drain #3 site. Although not as temporally
23
consistent nor of the same magnitude as the Boundary, chlorpyrifos was observed in concentrations exceeding LC50s at the Outlet site in October of 2004 (1900 ng/g OC) and October of 2005 (2848 ng/g OC) (Table 8). Its last detection was in October of 2008. The overall frequency of detection at the Outlet was 8/25. The only other organophosphate detected on the New River, was diazinon at the Boundary site and it was below threshold concentrations.
Salton Sea
No targeted analytes were detected at any of the Salton Sea locations (Appendix K3).
5.1.2.5 Polyaromatic hydrocarbons (PAHs)
Alamo River
While frequently detected in sediments, ΣPAHs did not exceed consensus thresholds (1610 ng/g dw) (MacDonald et al. 2000) (Appendix L1). Temporal trends at the Outlet indicated a spike in overall concentration in May 2010, but generally concentrations were consistent in all other sampling periods at the Outlet. The individual compound(s) with the highest concentration (32 ng/g dw) was the composite alkylated fluorenes in May 2010 at the Outlet.
New River
Significantly greater frequency and magnitude of detection was observed at the New River International Boundary where concentrations exceeded ΣPAH thresholds (1610 ng/g) from 2002 to 2006 (Appendix L2 and Table 8). Measured concentration diminished in 2007 and 2008, but increased in April and October of 2009 to just below thresholds. Thresholds were again exceeded in October 2010 and 2011, but not in May likely due to a smaller number of targeted PAHs for those months. Comparing the Boundary concentrations to the Outlet, while again frequently detected in 2002-2012, ΣPAH concentrations did not exceed any threshold and detections were reduced temporally. The highest individual PAHs were generally the alkylated derivatives of the PAHs from the Boundary location. For example, C-2 Phenanthrene/Anthracene (1078 ng/g dw) and C-2 Naphthalenes (666 ng/g dw) were highest in October 2004. Two individual compounds that exceeded threshold criteria were Crysene in October of 2004 (650 ng/g dw) and dibenzo (a,h,)anthracene (131 ng/g dw) in October of 2010 (Table 8). Both were from the International Boundary site.
Salton Sea
For the main body of the Salton Sea, two classes of PAH dominated the entire mixture; 2,6 dimethylnaphthalene and C-2 alkylated naphthalenes making up to 80% of the total mixture of PAHs (Appendix L3). Concentrations were generally higher in the Northern reaches indicating potential loading from the Northern tributaries. None of the sediment values exceeded consensus thresholds for any single compound or ΣPAH.
24
5.1.2.6 Polychlorinated Biphenyls (PCBs)
Alamo River
ΣPCB concentrations in the sediments were generally very low from the International Boundary to the Outlet without exceeding consensus criteria (59.8 ng/g dw) (Appendix M1). Most detections were DNQ at the Boundary for 2011. For the Outlet, 22 detections were observed and the highest concentration was 5.42 ng/g dw of PCB180 in May of 2010. Concentrations have diminished temporally with no congeners detected in 2011 or 2012.
New River
Several sediments collected along the New River exceeded criteria for ΣPCB (Appendix M2 and Table 8). The most contaminated sites were at the International Boundary in 2004 and 2005. Values also exceed thresholds in 2010 (Table 8). The highest individual congener was PCB138 (20 ng/g dw) in April of 2003 (Appendix M2). As with the Alamo River, concentrations have declined temporally with no detections in May 2010 and primarily DNQs for 2011. Spatially, concentrations were even less at the New River Outlet with no single congener greater than 1 ng/g dw.
Salton Sea
As with the tributaries, PCB concentrations were below thresholds with the exception of USGS9 in May of 2004 where a single congener (PCB151) making up 98% of the 3 total congeners (PCB110 and PCB52) having a concentration of 77.7 ng/g dw exceeded criteria (Appendix M3 and Table 8). Since this value was only observed in this single sample, it may likely be spurious. No other sample from the other two locations exceeded 2.01 ng/g dw.
5.1.2.7 Polybrominated Diphenyl Ethers (PBDEs)
Limited sampling was conducted for PBDEs only in 2011 and 2012 (Appendix N1-N2). Detections were not observed on any Alamo River site. On the New River Boundary, 123 ng/g total PBDEs were detected with PBDE47 (30.6 ng/g dw) and PBDE99 (39.6 ng/g dw) making up more than half of the total of the 15 congeners detected. None of the samples exceeded a 3 ng/g dw proposed by Lam et al. (2010). Five congeners were detected at the Outlet of the New River, but concentrations were all less than 1.6 ng/g dw. None of the Salton Sea sites were sampled.
5.1.3 Fish Tissue Evaluations
Alamo River
25
Tissue data from fish was not available at the International Boundary, but samples at Barbara Worth Drain (BWD) were available for May 2012 (Appendix E1-9). Whole organism mosquitofish were collected and analyzed. Only ΣDDT and Selenium exceeded tissue based residue criteria (Appendix E1 and E9, respectively and Table 9). Criteria for ΣDDT ranged from 14 ng/g dw for the protection of wildlife consumers of aquatic biota (Environment Canada 1997) and 600 ng/g for fish health (Beckvar et al. 2005). For selenium, a threshold of 1 ug/g ww (assuming 75% moisture) was used for protection of piscivorous wildlife (Hinck et al. 2005). At the Drop 10 site, fillets of Common carp exceeded tissue criteria for selenium with concentrations averaging 2 ug/g ww, but ΣDDT (~200 ng/g ww) only exceeded the Environmental Canada threshold of 14 ng/g. Fillets of Common carp from the Central Drain in May of 2012 had much lower ΣDDT with exceedance of the 14 ng/g threshold. Selenium was also above criteria. Mosquitofish collected in October at the same site had 18 fold higher ΣPCB and more than 5 fold higher ΣDDT concentrations (Appendix E5), but Selenium concentrations were barely above threshold (1.07 ug/g ww). At the Peach Drain whole mosquitofish had significantly greater concentrations of ΣDDT in the Spring with 928 ng/g ww and Selenium concentrations ~1.6 ug/g for Spring and Fall. At the Oleander Drain Common carp fillets collected only in the Spring exceeded Selenium criteria and ΣDDT criteria for Environment Canada, but no other residue exceeded thresholds. In the Fall whole mosquitofish only exceeded ΣDDT thresholds.
At the Outlet, temporal samples were available for 2004, 2011 and 2012 (Appendix E1). In 2004 channel catfish and tilapia fillets both exceeded ΣDDT thresholds (Table 9), but only the tilapia (2 ug/g ww) exceeded the Selenium standard (Table 9). Flathead catfish fillets were also analyzed but had significantly lower concentrations of both ΣDDT and Selenium. Both species of catfish also possessed measurable chlorpyrifos in fillets (Appendix E4). Body burden thresholds are not available for chlorpyrifos as it is typically rapidly degraded within biota. Temporal trends could not be evaluated as chlorpyrifos was only targeted in 2004. Channel catfish fillets collected in February 2011 had significantly higher concentrations of ΣDDT (~1 ug/g) than those in 2004 (Figure 4). Again, flathead catfish had approximately half as much residues. In May and October of 2012, Common carp were collected and fillets had nearly 17 times less ΣDDT than Channel catfish, but higher Selenium that that observed in Channel catfish in 2004. Common carp fillets from October of that same year, then had approximately 4 fold higher ΣDDT. All ΣDDT concentrations exceed tissue thresholds. Selenium concentrations of 1.6 in Spring and 2.2 in the fall also exceeded tissue criteria (Table 9). When comparing the same species of fish from 2004 and 2011, ΣDDT residues (dominated by ppDDE) increased demonstrating potential temporal increases (Figure 4). No overall trend was observed with Selenium (Figure 5). With only two years of data it is difficult to determine what the actual trends are for ΣDDT. Spatially, ΣDDT occurs in similar concentrations in fish throughout the Alamo River. Likewise, no significant changes occurred in other persistent organochlorine contaminants. ΣPCBs and Σchlordanes also did not change in the drainage over time.
New River
26
At the Boundary in 2012, fillets of Common carp had relatively high concentrations of ΣPCBs (22 and 11 ng/g ww) (Appendix E5), but low ΣDDT that were just above the 14 ng/g Canadian criteria value (Appendix E2 and Table 9). Tilapia fillets from the Greeson Drain did not have ΣDDT exceeding any criteria with concentrations less than 14 ng/g ww. Selenium was just at the 1 ug/g ww threshold (Appendix E9). At the Fig Drain, again ΣDDT residues were less than 5.3 ng/g in tilapia fillets but selenium were > 1 ug/g in Spring and Fall. Common carp fillets from the Rice 3 Drain had ΣDDT residues of 22 ng/g ww from the lone sampling event in October and were thus just above the 14 ng/g threshold. Selenium was also above the 1 ug/g criteria (Table 9).
At the New River Outlet, temporal comparisons could be made between 2004, 2011 and 2012 (Figure 5). Although below body burden thresholds, ΣPCBs were the highest measured values in Channel catfish fillets collected in 2004 and 2011 with max concentrations being up to 49 ng/g ww (Appendix E6). ΣDDT residues were all above the 14 ng/g threshold and just below the 600 ng/g criteria (Figure 4, Appendix E2 and Table 9). Selenium was only measured in the November 2004 sample and was not above threshold (Appendix E9 and Table 9). In 2012, Common carp fillets were analyzed and had higher ΣDDT concentrations (132 ng/g ww) in May relative to October (30 ng/g) (Appendix E2). In contrast, ΣPCBs were nearly 10 fold higher in fall (Appendix E6). Selenium concentrations were lower in Fall 2012 but still above tissue criteria (Table 9). Although ΣPCB and ΣDDT concentrations were present in fish from the Boundary and at the Outlet, limited detections occurred in the tributary sites between the two locations. Temporal evaluations indicated ΣDDT concentrations increased from 2004 to 2011 (Figure 4).
Salton Sea
Only one sampling event for tissue was evaluated in October of 2007. Tilapia fillets had limited ΣDDT and PCBs (Appendix E3 and Appendix E7), although all samples exceeded Selenium criteria (Appendix E9).
5.2 Biological Analyses
5.2.1 Bioassessment
Comparing the 3 sites in 2003, which evaluated drainage areas to the Salton Sea, the Alamo River Outlet had the lowest IBI of 1 even though it had the highest percentage of EPT taxa (Table 10). The New River Outlet had an IBI of 4, with no EPT taxa although the Shannon Index was relatively similar to the Alamo River Outlet. Indices at the Salton Seat Drain at the Salt Creek Mouth indicated relatively higher quality with IBI scores of 14, but a lower Shannon Index and EPT score. When Fig Drain was evaluated in May of 2006, it also had a higher IBI of 9 even though the Shannon Index was similar to the Alamo River Outlet. Although it was not possible to compare the sites to a reference site, a typical reference location would have a hypothetical IBI ranging from 70-100 (Rehn et al. 2008). Consequently, based on IBI rankings the 4 sites evaluated would considered to be relatively impaired. As discussed above, the diminished IBI was consistent with both
27
the Alamo and New River Outlets having the highest concentrations of contaminants particularly in sediments for 2003.
5.2.2 Water and Sediment Toxicity
In October 2011, water only exposures to Hyalella azteca at the Alamo River Outlet caused 100% mortality (Table 11). The toxicity of sediment samples from this site (73% survival) was just above the threshold considered by SWAMP of significant toxicity (70% survival). In contrast to October, the toxicity of sediment samples of May 2011 was significantly higher XXX. Toxicity was also noted in sediments from Alamo River at the Drop 10 location.
Sediment toxicity was also observed in samples from the New River at the International Boundary and water column toxicity was observed at the Outlet for Oct 2011. (Table 11).
Other sites exhibiting toxicity were located within the Salton Sea. Water from all three locations (USGS2, USGS7, and USGS9) in May of 2011 caused significant toxicity as well as diminished growth to topsmelt (Atherinops affinis). Two of the three sediment samples also showed reduced survival in H azteca (70 + 24 %; 53 + 23 %).
For October 2012, Water from the Alamo River and New River Outlet sites had diminished survival (60 + 11 %; 66 + 22 %).
6.0 DISCUSSION
Previous studies in the Salton Sea have demonstrated contamination of fish and sediments from organic and inorganic compounds/elements (Reidel et al.2002; Sapozhnikova et al. 2004). In order to better understand spatial and temporal relationships, data from the SWAMP was mined for chemical analyses in sediments, water and fish tissues from not only the Salton Sea, but also two tributaries: The Alamo and New Rivers.
Overall, Tissue concentrations of contaminants from fish collected from the mouth (outlet) of each River and upstream areas were similar to those previously reported. Concentrations of PCBs in fish muscle collected during and prior to 2001 ranged from 11-85 ng/g ww in fish from either river mouths or nearshore (Riedel et al. 2002; Sapozhinikova et al. 2004). Evaluating data from river mouths in this study, values ranged from 1.5-49 ng/g ww in fish collected from 2004, 2011-2012. All values exceed tissue based criteria of 0.1 ng/g ww (Table 1). Interestingly, only one composite sample from the Salton Sea failed to have detected values in 2007. Given the concentrations found in fish from the river mouths, it would appear that this measurement may be an anomaly and continued monitoring for PCBs in fish from the Salton Sea is necessary to determine whether fish tissue concentrations follow sediment concentrations which have not been detected in the Salton Sea since 2007-2008.
28
Concentrations of DDTs were also similar to previous studies. Values in the Salton Sea as well as the Alamo and New River Outlets ranged from 10-239 ng/g ww in previous studies (Riedel et al. 2002; Sapozhinikova et al. 2004) compared to those of Outlet values of 2012 (30-132 ng/g ww) (Figure 6). Interestingly, although sediment concentrations of DDTs have not varied temporally (Figure 4A) and fish concentration are relatively higher in the Alamo River, normalizing the concentrations in fish tissues to lipid has indicated that concentrations from the Alamo River have declined, whereas tissue values in the New River have trended toward an increase when fish tissue was normalized for limit (Figure 4B). This may be due to species differences between the rivers or differences in lipid content between species. Additional studies allowing better statistical comparisons would be fruitful. Since tissue concentrations have not varied since 2001, criteria for the protection of fish-predators are still being exceeded. Comparing concentrations in 2012, exceedances were observed throughout the entire River from the International Boundary (New River) to Barbara Worth Drain (Alamo River). Thus, continued monitoring for these legacy compounds is recommended.
Selenium values have also remained somewhat constant in fish. Concentrations in 2007 in fish all exceeded tissue-based criteria for the Salton Sea and most of the riverine sites in 2012 (Table 9). Concentrations in fish in 2001 were 1.9- 2.8 mg/kg ww and in 2012 values ranged between 2.24 to 3.52 mg/kg ww. Since fish are the primarily dietary source for the multiple bird species that frequent the Salton Sea, and sediment and water concentrations do not appear to be changing in the rivers (Figure 2 and Figure 5) and may actually be increasing in the Salton Sea (Figure 2), a better understanding of Selenium loading to the Salton Sea is needed.
Although most tissue based studies indicated continued bioaccumulation of legacy contaminants. Temporal studies of sediments indicated a significant change in pesticide loading to the waterways (Figure 3). Since 2005, concentrations of the organophosphate insecticide, chlorpyrifos have been declining, but concentrations of pyrethroid insecticides have increased in the Alamo and New Rivers. Chlorpyrifos was banned for urban use in 1999 and largely replaced by pyrethroids in California (Spurlock and Lee 2008). Each compound has significant toxicity to benthic invertebrates (Ankley and Collyard 1995; Amweg et al. 2006). Monitoring pyrethroids can be difficult as detection limits may actually exceed toxicity thresholds (Amweg et al. 2006). Consequently, continued monitoring and toxicity assessment should be implemented to properly monitor.
In 2011 and 2012, toxicity assessments were conducted on a subset of the sites where chemical monitoring data had been collected. No toxicity was observed at the Boundary site of the Alamo River. However, reductions in H. azteca survival was noted in sediments further downstream at Drop 10 (Table 11). For metal evaluations on those collections, only selenium concentrations were measured, and none exceeded criteria (Table 3). However, several pyrethroid insecticides were detected including bifenthrin, λ− cyhalothrin, and esfenvalerate (Appendix J1) . Unfortunately, organic carbon content was not reported in this sample, so comparisons to other studies is difficult. However, if one assumes a 1.0% total organic carbon value, the concentrations for bifenthrin (267 ng/g OC) were approximately half those of published LC50s (520 ng/g OC) (Amweg et al. 2006) or 0.51 Toxicity Units (TUs). For λ− cyhalothrin, the estimated value would be 123 ng/g OC (again less than 450 ng/g OC). The sediment LC50 for esfenvalerate was
29
1540 ng/g OC, so the estimated value at this site (879 ng/g OC) would again be less than half the LC50 value. If all TU values are additively considered (1.35 TUs), then the potential for toxicity is very likely in this location.
In October 2011, water only exposures to Hyalella azteca at the Alamo River Outlet caused 100% mortality (Table 11). Evaluation of dissolved metal concentrations and organic contaminants indicated exceedances of water quality criteria for Copper (Table 2). One other compound that may also be providing some influence in this sample is the pyrethroid insecticide esfenvalerate, which was measured at 4 ng/L (Appendix G9). The 96 hr LC50 value for esfenvalerate in H. azteca was reported as 8 ng/L (Fojut et al., 2012). Although the measured value is less than the 96 hr concentration, the duration of exposure was 10 days rather than 4 days (96 hr). Consequently, esfenvalerate could have contributed to the effect observed in the sampled water.
In contrast to October, the toxicity of sediment samples of May 2011 at the Alamo River Outlet was significant. While metals did not exceed sediment criteria, several organic contributors were above criteria values and included dieldrin, and ppDDE (Table 5), Another potential contributor was likely the pyrethroid λ−cyhalothrin which was detected at 1.6 ng/g dw (83.3 ng/g OC) (Appendix J1). The 10 d LC50 values for H. azteca were estimated to be 450 ng/g OC (Amweg et al. 2005). While the sediment samples were less than the LC50 threshold, differences in sediment structure (i.e. % fines) may contribute to the differences as well. The Alamo River Outlet sample was 70.8 % silt/clay, which would lead to greater toxicity (Amweg et al. 2006).
Sediment toxicity was also observed in samples from the New River at the International Boundary for Oct 2011. Copper, Lead, Mercury, Silver and Zinc all exceed sediment criteria (Table 5). Cypermethrin concentrations (5333 ng/g OC) were 14 times higher (14 Toxic Units) than published LC50 values for H. azteca in sediments (Amweg et al. 2006). Other pyrethroids were also detected again just below published LC50 values (Table 9b). Bifenthrin (352 ng/g OC); cyfluthrin (104 ng/g OC); Λ− cyhalothrin (176 ng/g OC); esfenvalerate (171 ng/g OC); deltamethrin (230 ng/g OC) and permethrin (4762 ng/g OC) were all below threshold, but when added together using toxicity units and excluding cypermethrin, a 1.58 toxic unit value was observed. In addition to pyrethroids, ΣDDEs ΣDDTs (although these were primarily DNQ values), chlordanes and ΣPAHs all exceeded sediment threshold criteria (Tables 5-7).
Continuing down the New River to the Outlet of the Salton Sea, significant toxicity was observed in the water column in October (Table 11). The only dissolved metal concentration that exceeded criteria was copper (Table 2). The only organic contaminant that exceeded a threshold was λ−cyhalothrin (0.011 ug/L), which was higher than the 0.008 ug/L LC50 (Fojut et al. 2012). PBDE 99 and PBDE 153 were detected at 0.009 and 0.005 ug/L (Table 6L), which were below previously proposed thresholds (1 ug/L for PBDE99) (Maruya et al. 2013).
Other sites exhibiting toxicity were located within the Salton Sea. Water from all three locations (USGS2, USGS7, and USGS9) in May of 2011 caused significant toxicity as well as diminished growth to topsmelt (Atherinops affinis). Two of the three sediment
30
samples also showed reduced survival in H azteca (70 + 24 %; 53 + 23 %). No detected compounds in the water column were above ALC (Table 1). Sediment samples from the USGS2 site had historical Selenium values (2002-2011) and Arsenic (2002 only) samples that exceeded consensus thresholds (Table 4). Sediment ppDDE and dieldrin concentrations also exceeded sediment thresholds at USGS2 (Table 5). Tilapia fillets from USGS7 had limited DDE contamination, but had somewhat elevated selenium concentrations (2.24-3.52). Consequently, the potential cause for the topsmelt toxicity is unclear and may be due to non-targeted contaminants or other water quality stressors.
For October 2012, only 3 samples were evaluated for H azteca toxicity. Water from the Alamo River Outlet site had diminished survival (60 + 11 %). Unfortunately, only metals, organochlorine and organophosphate pesticides were targeted for analyses. Copper, and Mercury were at or exceeded Aquatic Life Criteria thresholds (Table 2). Of the pesticides evaluated only chlorpyrifos was detected at 0.049 ug/L (Appendix G4) which exceeds the LC50 (0.040 ug/L) published by Ankley and Collyard (1995) as well as ALCs (Table 1). Tilapia and Channel catfish sampled from this area in 2004 had measurable concentrations of chlorpyrifos in fillets (Appendix E4) suggesting continued exposure in the water column to chlorpyrifos.
At the New River Outlet, significant water and sediment toxicity to H azteca was observed in October of 2012 (Table 11). Chlorpyrifos and diazinon were detected at 0.051 and 0.143 ug/L, respectively (Appendix G5). As noted above, this concentration exceeds the LC50 for H azteca (Table 8). The concentration for diazinon did not exceed USEPA Aquatic Life Criteria concentrations for fresh (0.170 ug/L) or saltwater (0.820 ug/L) (USEPA, 2005). PAHs, pyrethroids or triazine pesticides were not targeted for water analyses, so it is unclear what contribution they may have.
When evaluating the sediments several pyrethroid insecticides were detected with λ− cyhalothrin exceeding sediment LC50s (Table 7). Using a toxic unit estimate of additive toxicity, 2.53 TU were observed from pyrethroids in sediment. In addition to pyrethroids, historical evaluations of the sediment from the New River Outlet indicate persistent contamination with chlorpyrifos (Figure 3), ΣDDTs (Appendix I2), and somewhat lower concentrations of PAHs (Appendix K2). It is unclear why most chemical measurements in 2012 were below detection.
7.0 CONCLUSIONS AND RECOMMENDATIONS
In summary, persistent organic contaminants and Selenium are still prevalent in fish and sediments of the Salton Sea and its two main tributaries. The New River appears to have higher levels of overall contamination than the Alamo, but inputs are unclear as both inorganic and organic contaminant concentrations tend to be higher at the International Boundary and at the Outlet sites for the Salton Sea compared to sites along each river. Bioassessment indices conducted in 2003 are consistent with poor condition for the outlets of each river. In addition to persistent contaminants such as ΣDDT, ΣPAHs, current use pesticides such as pyrethroids (cypermethrin) and the organophosphate, chlorpyrifos also appear to be contributing to the toxicity of sediments and water collected from the rivers. The source of toxicity to Salton Sea water remains unclear. In
31
water and sediments, metals consistently above criteria thresholds included Selenium, and Copper with occasional exceedances by Chromium and Silver. Given the recurrent exceedances by Copper, a Biotic Ligand Model approach should be implemented since water quality likely varies from freshwater to saltwater throughout the drainage. Mercury exceeded sediment criteria primarily at the New River Boundary sites along with other organic contaminants such as PAHs. Relatively few compounds accumulated to levels exceeding thresholds in fish. Fish tissues exceeded ΣDDT criteria at 25 of 31 sampling events from 2004 to 2012. For Selenium 25/32 sites exceeded tissue residue thresholds for piscivorous wildlife. Thus, these two groups of contaminants continue to be cause for concern particularly for avian species. Other compounds that deserved further monitoring are the pyrethroid insecticides, which likely contribute to toxicity observed in sediments and water during 2011 and 2012. In addition to toxicity and chemical measurement, additional bioassessment determinations are needed to utilize “triad” based tools to evaluate the potential impacts of contaminants on the Salton Sea drainage area. Lastly, loading sources and remediation strategies for some contaminants, particularly Selenium, are warranted given the importance of the area to avian species.
32
8.0 REFERENCES Amweg, EL, Weston, DP, Ureda, NM. 2005. Use and toxicity of pyrethroid pesticides in the Central Valley, CA. Environ. Toxicol. Chem. 24:966-972, with erratum in 24:1300- 1301.
Amweg, EL, Weston DP., You, J. MJ Lydy. 2006. Pyrethroid Insecticides and Sediment Toxicity in Urban Creeks from California and Tennessee. Environ. Sci. Technol. 40:1700-1706.
Amweg EL, Weston DP. 2007. Whole-sediment toxicity identification evaluation tools for pyrethroid insecticides: I. Piperonyl butoxide addition. Environ Toxicol Chem 26:2389–2396.
Anderson, BS, Hunt, JW, McNulty, HR, Turpen, SL, Martin, M.1994. Off season spawning and factors influencing toxicity test development with topsmelt Atherinops affinis Environ Toxicol Chem 133:479-85.
Ankley, G.T. and Collyard, SA 1995. Influence of piperonyl butoxide on the toxicity of organophosphate insecticides to three species of freshwater benthic invertebrates. Comp. Biochem. Physiol. 110C:149-155.
Beckvar, N, Dillon, TM, Read, LB. 2005. Approaches for linking whole-body fish tissue residues of mercury or DDT to biological effects thresholds. Environ Toxicol Chem 24:2094–2105.
Bonnema, A. 2011. Quality Assurance Project Plan: Screening Study of Bioaccumulation in California Rivers. Moss Landing Marine Labs. Prepared for SWAMP BOG, 51 pages plus appendices and attachments. (http://www.waterboards.ca.gov/water_issues/programs/swamp/docs/rivers_study/qapp_r pt_only.pdf).
Environment Canada, 1997. Canadian tissue residue guidelines for DDT for the protection of wildlife consumers of aquatic biota. Final unpublished draft. Environment Canada, Science Policy and Environmental Quality Branch, Guidelines and Standards Division, Hull, Quebec, CN, 278p.
Fojut, TL, Plaumbo AJ, and RS Tjeerdema 2012. Aquatic Life Water Quality Criteria Derived via the UC Davis Method: II. Pyrethroid Insecticides. In: R.S. Tjeerdema (ed.), Aquatic Life Water Quality Criteria for Selected Pesticides, Reviews of Environmental Contamination and Toxicology 216:51-103.
Hinck, JE, Schmitt, CJ, Bartish, TM, Denslow ND, Blazer, VS, Anderson, PJ, Coyle, JJ, Dethloff, GM, Tillett , DE. 2004. Biomonitoring of Environmental Status and Trends (BEST) Program: Environmental Contaminants and their Effects on Fish in the Columbia River Basin: U.S. Geological Survey, Columbia Environmental Research Center, Columbia, Missouri, Scientific Investigators Report 2004-5154, 125p.
33
Jarvinen AW, Ankley GT. 1999. Linkage of Effects to Tissue Residues: Development of a Comprehensive Database for Aquatic Organisms Exposed to Inorganic and Organic Chemicals. SETAC, Pensacola, FL, USA.
Jehl, J., 1996. Mass mortality vents of eared grebes in North America. J. Field Ornithol. 67, 471–476.
Lam, C., R. Neumann, P.K.S. Shin, D.W.T. Au, P.Y Qian and R.S.S. Wu. 2010. Polybrominated diphenylethers (PBDEs) alter larval settlement of marine benthic polychaetes. Environ Sci Technol 44:7130-7137.
LeBlanc, LA, Orlando, JL, Kuivila, KM. 2004, Pesticide concentrations in water and in suspended and bottom sediments in the New and Alamo Rivers, Salton Sea watershed, California, April 2003: U.S. Geological Survey Data Series 104, 15 p.
Lemley, A.D. 2002. Selenium assessment in aquatic ecosystems. US Forest Service, Blacksburg, VA
Maruya, KA, Schlenk, D, Anderson, PD, Denslow, ND, Drewes, JE, Olivieri, AW, Scott, GI. Snyder SA. 2013. An Adaptive, Comprehensive Monitoring Strategy for Chemicals of Emerging Concern (CECs) in California's Aquatic Ecosystems. Integrated Environmental Assessment and Management 10:69–77.
MacDonald, DD, Ingersoll, CG, Berger, TA. 2000. Development and evaluation of consensus-based sediment quality guidelines for freshwater ecosystems. Arch. Environ. Contam. Toxicol. 39:20–31.
Regional Water Quality Control Board. 1998. New River Pollutoin in Mexico, A Historical overview. Dece 1, 1998; 66pp.
Rehn, AC, May, JT and PR. Ode 2005. An Index of Biotic Integrity (IBI) for Perennial Streams in California’s Central Valley. Technical Report: Surface Water Ambient Monitoring Program 32pp.
Rehn, AC (2008) Benthic macroinvertebrates as indicators of biological condition below hydropower dams on West slope sierra nevada streams, California, USA. River. Res. Applic. Published online in Wiley interscience, (www.interscience.wiley.com) DOI: 10.1002/rra.1121
Riedel, R., Schlenk, D., Frank, D., Costa-Pierce, B., 2002. Analyses of organic and inorganic contaminants in Salton Sea fish. Mar. Pollut. Bull. 44, 403–411.
Setmire, J.G., Schroeder, R.A., Densmore, J.N., 1993. Detailed study of water quality, bottom sediment, and biota associated with irrigation drainage in the Salton Sea Area, CA, 1988–1990. US Geological Survey, Water-Resources Investigations, Report 93-4014.
Spurlock F, Lee M. 2008. Synthetic pyrethroids use patterns, properties
34
and environmental effects. In Gan J, Spurlock F, Hendley P, Weston D, eds, Synthetic Pyrethroids: Occurrence and Behavior in Aquatic Environments, Vol 991—ACS Symposium Series. American Chemical Society, Washington, DC, USA, pp 3–25.
SWAMP, 2008. Surface Water Ambient Monitoring Program - Quality Assurance Program Plan Version 1. California Water Boards, Sacramento, CA. http://www.swrcb.ca.gov/water_issues/programs/swamp/tools.shtml#qa
US Environmental Protection Agency 2014. National Recommended Water Quality Criteria.(http://water.epa.gov/scitech/swguidance/standards/criteria/current/index.cfm#alt able)
US Environmental Protection Agency. 1995. Short-term methods for estimating the chronic toxicity of effluents and receiving waters to West Coast marine and estuarine organisms. Chapman GA, Denton DL, and Lazorchak JM, eds. Office of Research and Development. Cincinnati, OH. EPA/600/R-95/136.
US Environmental Protection Agency. 2002. Short-term methods for measuring the chronic toxicity of effluents and receiving waters to freshwater organisms, 4th ed. EPA/821/R-02/013. Washington, DC
US Environmental Protection Agency. 2003a. Ambient aquatic life water quality criteria for atrazine - revised draft. Office of Water EPA-822-R-03-023, Washington, DC
US Environmental Protection Agency. 2003b. 2003 Draft update of Ambient water Quality criteria for Copper EPA 822-R-03-026, Washington, DC
Wisconsin Department of Natural Resources 2003. Consensus-Based Sediment Quality Guidelines Recommendations for Use & Application Interim Guidance. WT-732 2003 40pp.
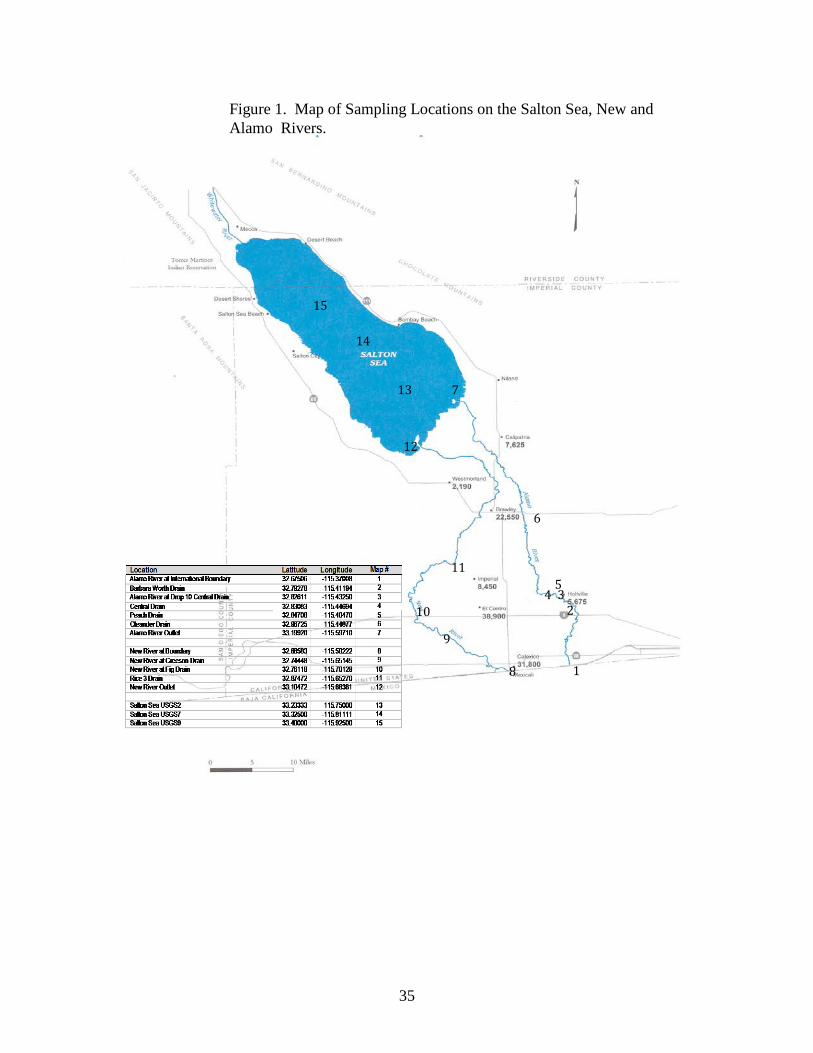
35
Figure 1. Map of Sampling Locations on the Salton Sea, New and Alamo Rivers.
15
14
13 7
12
6
11 5
4 3 10 2
9
8 1
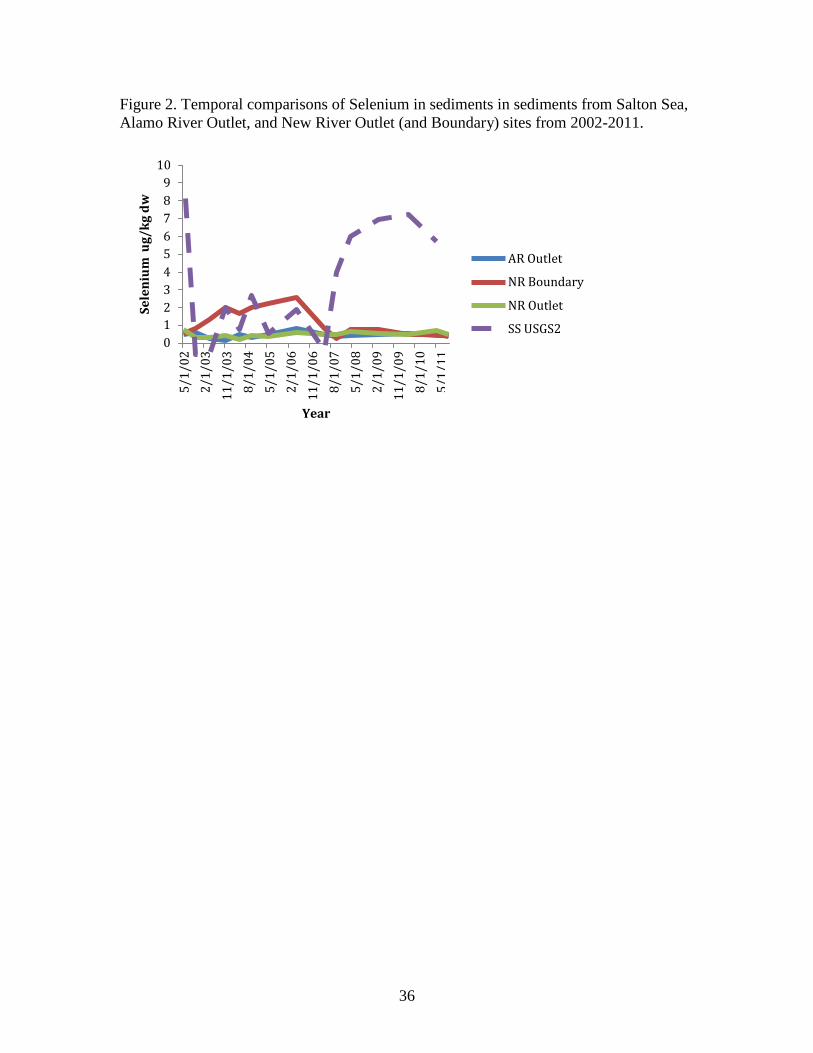
36
Sele
nium
ug/
kg d
w
5/1/
02
2/1/
03
11/1
/03
8/1/
04
5/1/
05
2/1/
06
11/1
/06
8/1/
07
5/1/
08
2/1/
09
11/1
/09
8/1/
10
5/1/
11
Figure 2. Temporal comparisons of Selenium in sediments in sediments from Salton Sea, Alamo River Outlet, and New River Outlet (and Boundary) sites from 2002-2011.
10 9 8 7 6 5 AR Outlet 4 3 NR Boundary 2 NR Outlet 1 SS USGS2 0
Year
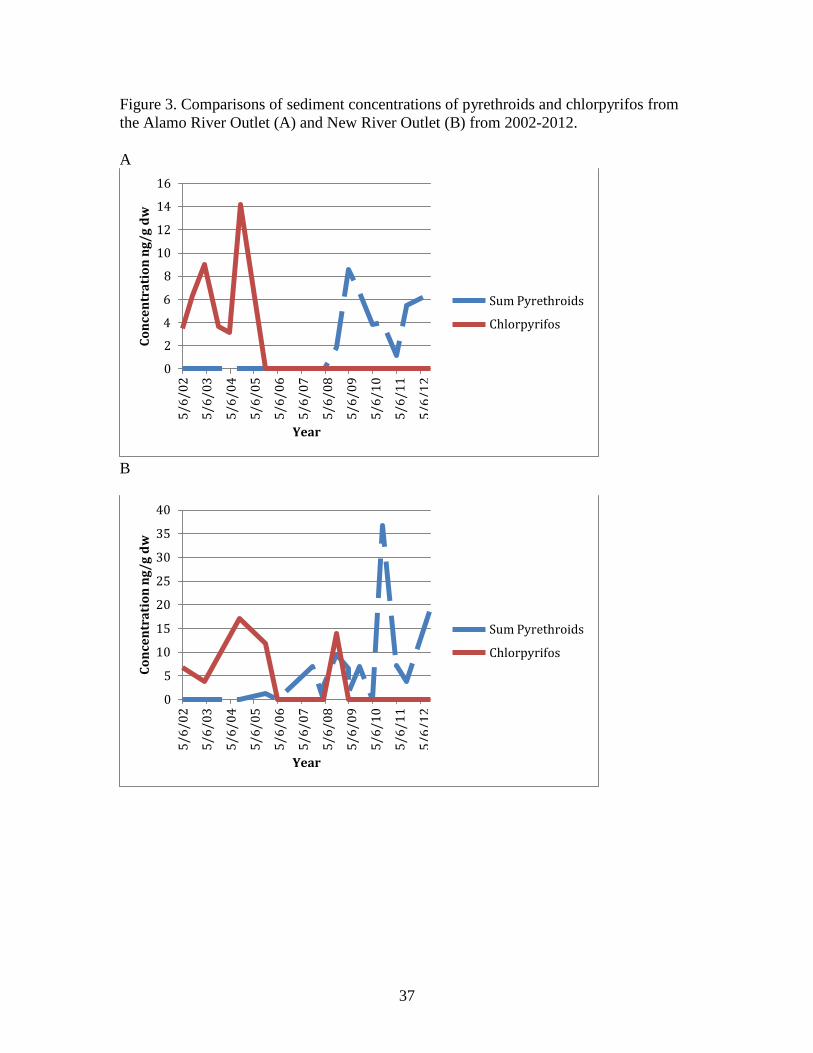
37
Conc
entr
atio
n ng
/g d
w
Conc
entr
atio
n ng
/g d
w
5/6/
02
5/6/
03
5/6/
04
5/6/
05
5/6/
06
5/6/
07
5/6/
08
5/6/
09
5/6/
10
5/6/
11
5/6/
12
5/6/
02
5/6/
03
5/6/
04
5/6/
05
5/6/
06
5/6/
07
5/6/
08
5/6/
09
5/6/
10
5/6/
11
5/6/
12
Figure 3. Comparisons of sediment concentrations of pyrethroids and chlorpyrifos from the Alamo River Outlet (A) and New River Outlet (B) from 2002-2012.
A
16
14
12
10
8
6 Sum Pyrethroids 4 Chlorpyrifos 2
0
Year B
40
35
30
25
20
15 Sum Pyrethroids
10 Chlorpyrifos
5
0
Year
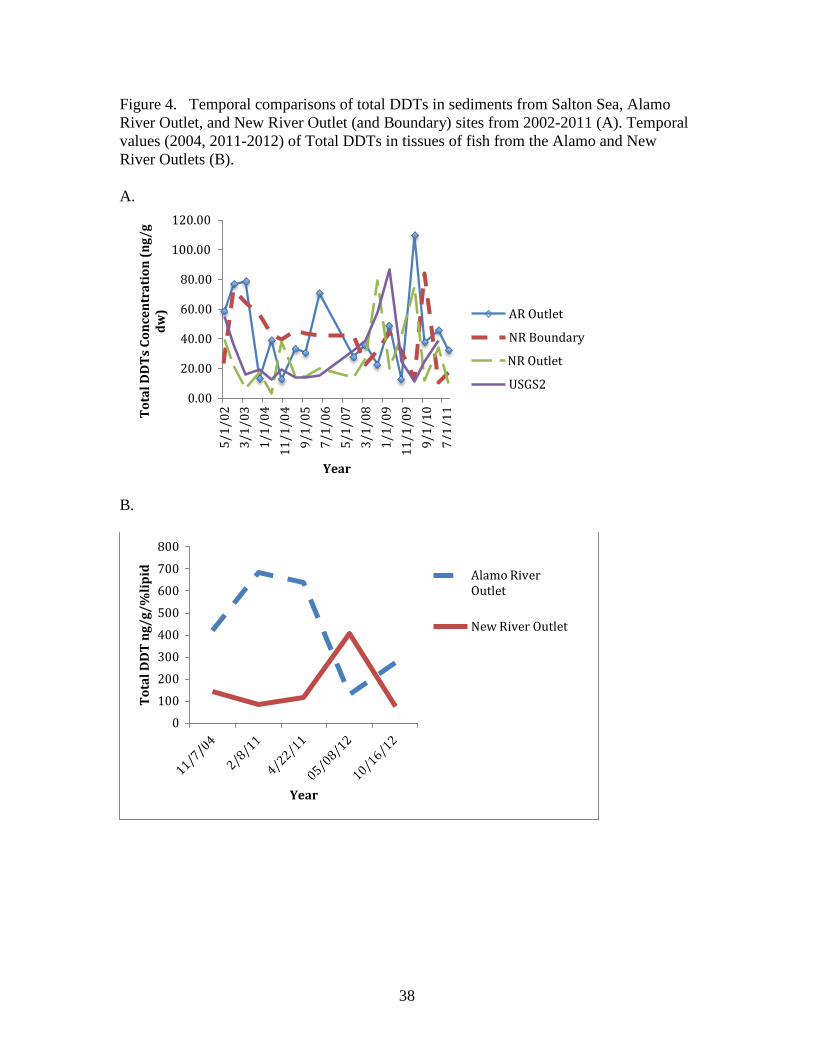
38
Tota
l DD
T ng
/g/%
lipid
To
tal D
DTs
Con
cent
rati
on (n
g/g
dw)
5/1/
02
3/1/
03
1/1/
04
11/1
/04
9/1/
05
7/1/
06
5/1/
07
3/1/
08
1/1/
09
11/1
/09
9/1/
10
7/1/
11
Figure 4. Temporal comparisons of total DDTs in sediments from Salton Sea, Alamo River Outlet, and New River Outlet (and Boundary) sites from 2002-2011 (A). Temporal values (2004, 2011-2012) of Total DDTs in tissues of fish from the Alamo and New River Outlets (B).
A.
120.00
100.00
80.00
60.00
40.00
20.00
0.00
AR Outlet
NR Boundary
NR Outlet
USGS2
Year B.
800
700 600 500 400 300 200 100
0
Alamo River Outlet
New River Outlet
Year
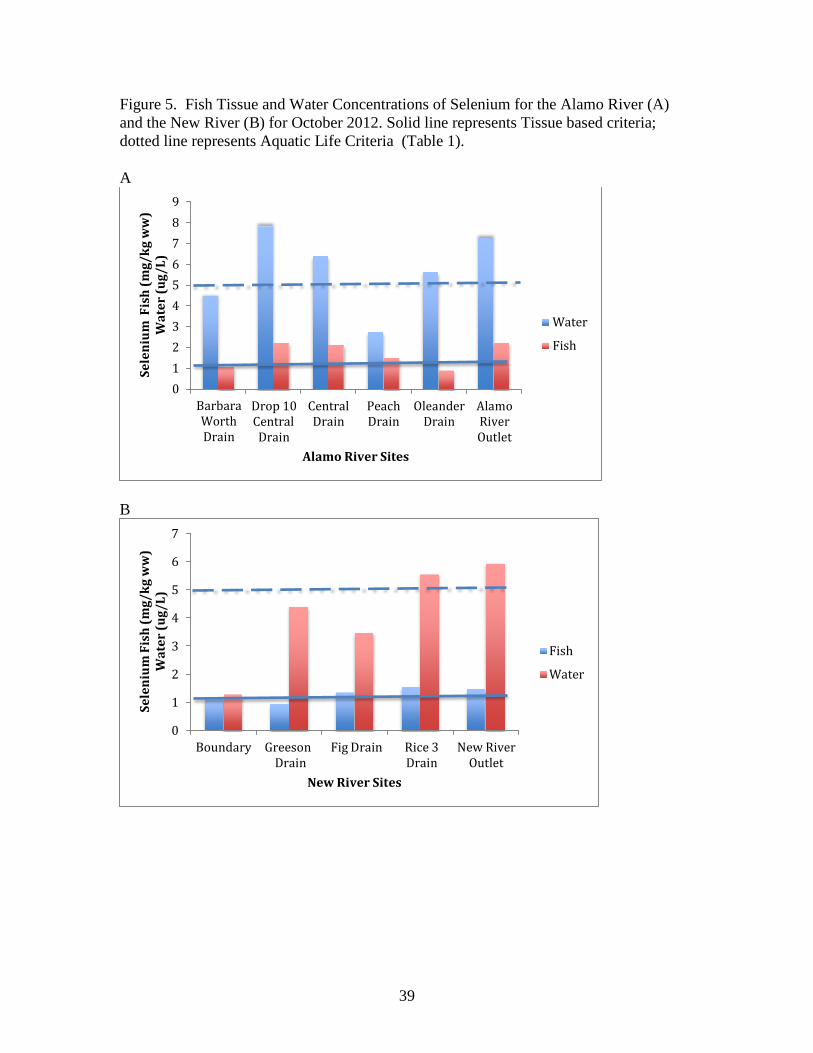
39
Sele
nium
Fis
h (m
g/kg
ww
) W
ater
(ug/
L)
Sele
nium
Fis
h (m
g/kg
ww
) W
ater
(ug/
L)
Figure 5. Fish Tissue and Water Concentrations of Selenium for the Alamo River (A) and the New River (B) for October 2012. Solid line represents Tissue based criteria; dotted line represents Aquatic Life Criteria (Table 1).
A
9 8 7 6 5 4 3 2 1 0
Barbara Worth Drain
Drop 10 Central Drain
Central Drain
Peach Drain
Oleander
Drain
Alamo River Outlet
Water
Fish
Alamo River Sites B
7
6
5
4
3 Fish
2 Water
1
0 Boundary Greeson
Drain
Fig Drain Rice 3
Drain
New River
Outlet New River Sites
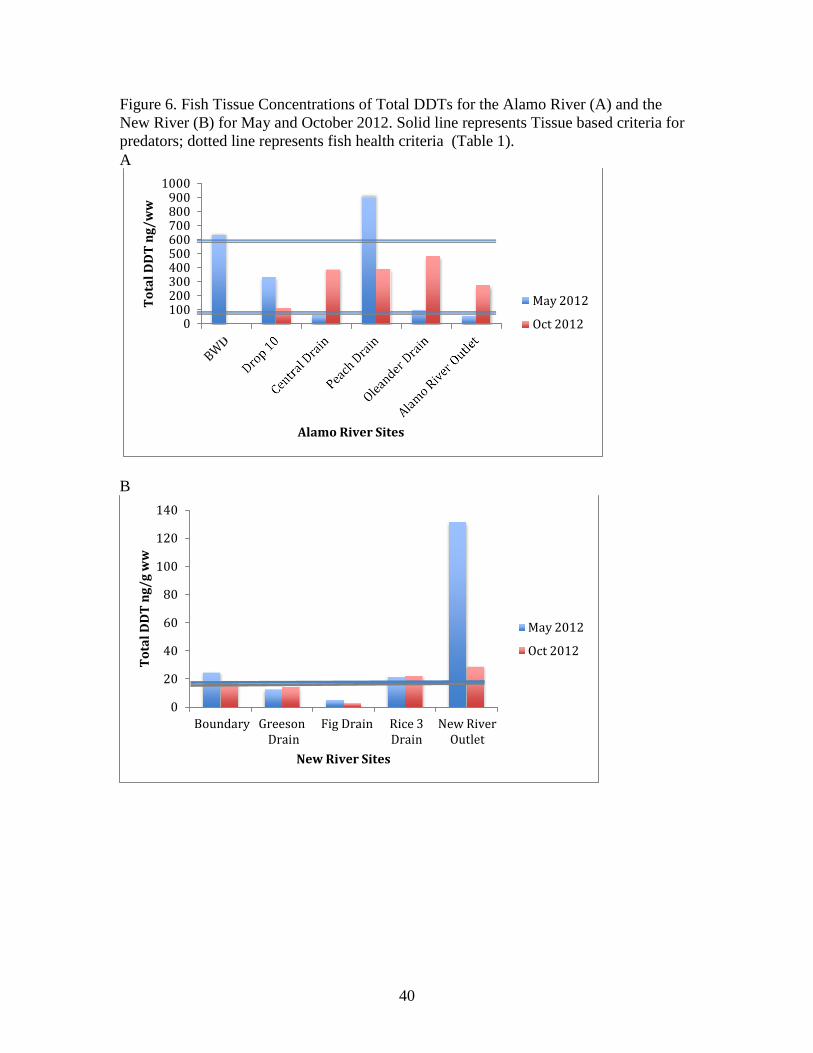
40
Tota
l DD
T ng
/g w
w
Tota
l DD
T ng
/ww
Figure 6. Fish Tissue Concentrations of Total DDTs for the Alamo River (A) and the New River (B) for May and October 2012. Solid line represents Tissue based criteria for predators; dotted line represents fish health criteria (Table 1). A
1000 900 800 700 600 500 400 300 200 100
0
May 2012
Oct 2012
Alamo River Sites B
140
120
100
80
60 May 2012
40 Oct 2012
20
0 Boundary Greeson
Drain
Fig Drain Rice 3
Drain
New River
Outlet New River Sites
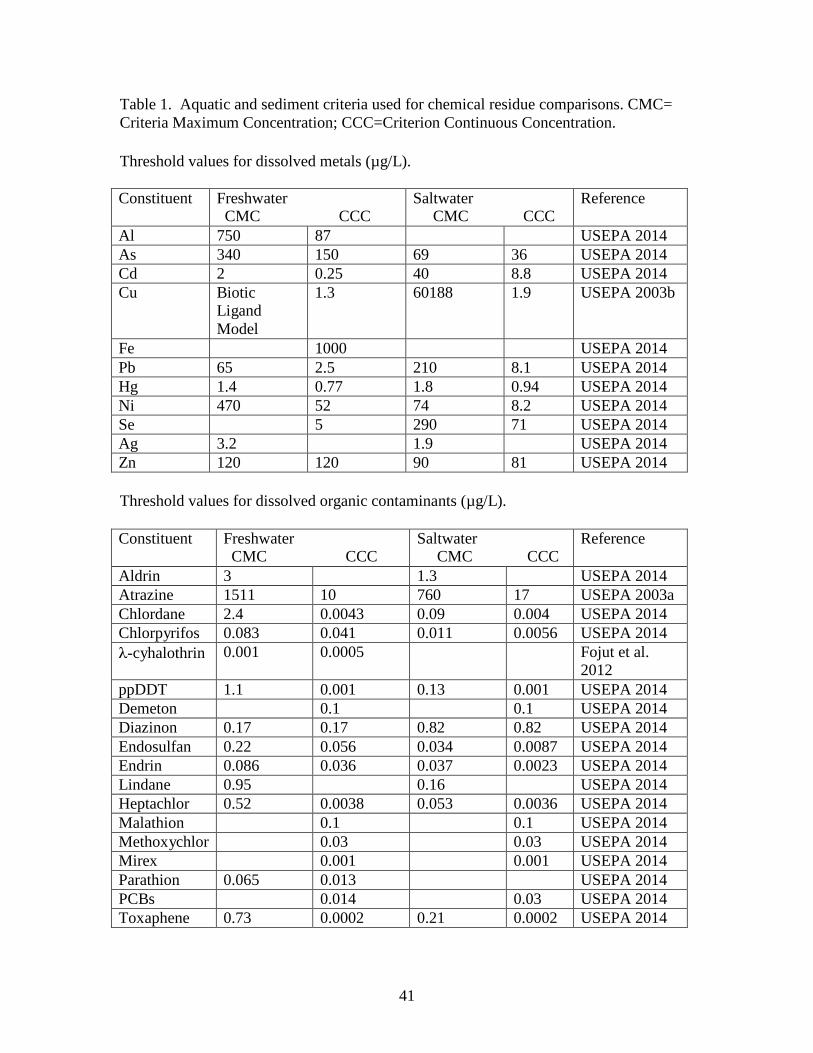
41
Table 1. Aquatic and sediment criteria used for chemical residue comparisons. CMC= Criteria Maximum Concentration; CCC=Criterion Continuous Concentration.
Threshold values for dissolved metals (µg/L).
Constituent Freshwater
CMC CCC Saltwater
CMC CCC Reference
Al 750 87 USEPA 2014 As 340 150 69 36 USEPA 2014 Cd 2 0.25 40 8.8 USEPA 2014 Cu Biotic
Ligand Model
1.3 60188 1.9 USEPA 2003b
Fe 1000 USEPA 2014 Pb 65 2.5 210 8.1 USEPA 2014 Hg 1.4 0.77 1.8 0.94 USEPA 2014 Ni 470 52 74 8.2 USEPA 2014 Se 5 290 71 USEPA 2014 Ag 3.2 1.9 USEPA 2014 Zn 120 120 90 81 USEPA 2014
Threshold values for dissolved organic contaminants (µg/L).
Constituent Freshwater
CMC CCC Saltwater
CMC CCC Reference
Aldrin 3 1.3 USEPA 2014 Atrazine 1511 10 760 17 USEPA 2003a Chlordane 2.4 0.0043 0.09 0.004 USEPA 2014 Chlorpyrifos 0.083 0.041 0.011 0.0056 USEPA 2014 λ-cyhalothrin 0.001 0.0005 Fojut et al.
2012 ppDDT 1.1 0.001 0.13 0.001 USEPA 2014 Demeton 0.1 0.1 USEPA 2014 Diazinon 0.17 0.17 0.82 0.82 USEPA 2014 Endosulfan 0.22 0.056 0.034 0.0087 USEPA 2014 Endrin 0.086 0.036 0.037 0.0023 USEPA 2014 Lindane 0.95 0.16 USEPA 2014 Heptachlor 0.52 0.0038 0.053 0.0036 USEPA 2014 Malathion 0.1 0.1 USEPA 2014 Methoxychlor 0.03 0.03 USEPA 2014 Mirex 0.001 0.001 USEPA 2014 Parathion 0.065 0.013 USEPA 2014 PCBs 0.014 0.03 USEPA 2014 Toxaphene 0.73 0.0002 0.21 0.0002 USEPA 2014
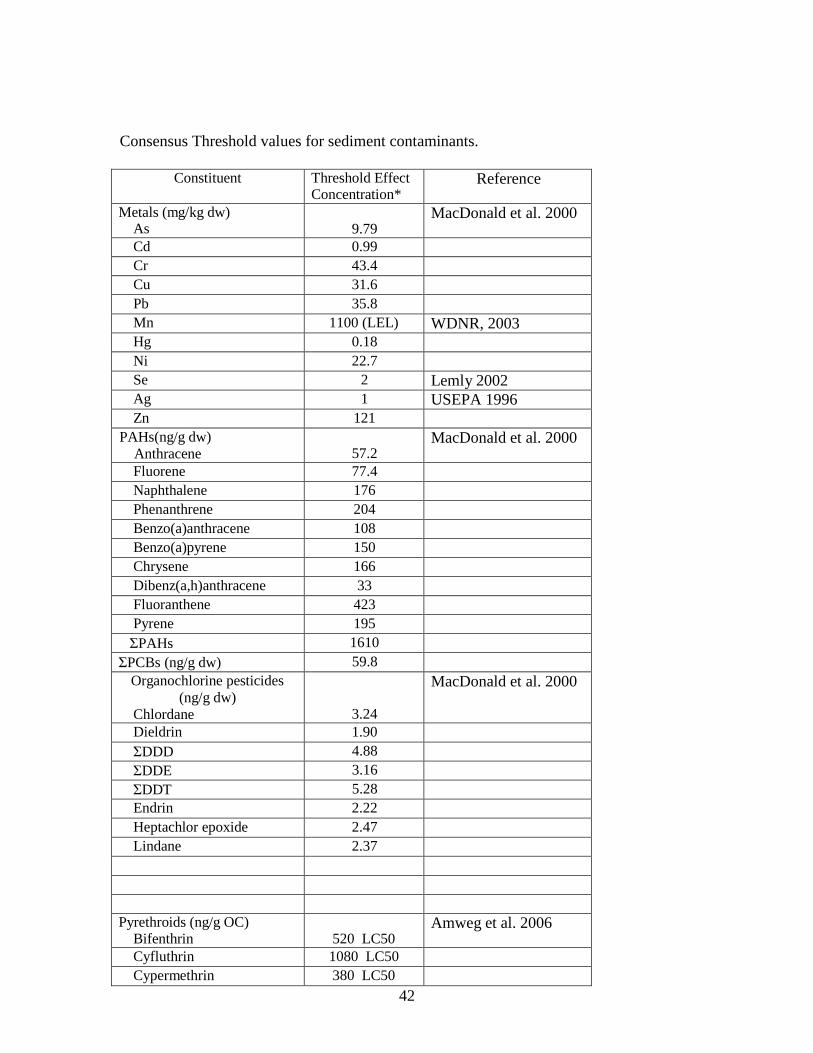
42
Consensus Threshold values for sediment contaminants.
Constituent Threshold Effect Concentration*
Reference
Metals (mg/kg dw) As
9.79
MacDonald et al. 2000
Cd 0.99 Cr 43.4 Cu 31.6 Pb 35.8 Mn 1100 (LEL) WDNR, 2003 Hg 0.18 Ni 22.7 Se 2 Lemly 2002 Ag 1 USEPA 1996 Zn 121
PAHs(ng/g dw) Anthracene
57.2
MacDonald et al. 2000
Fluorene 77.4 Naphthalene 176 Phenanthrene 204 Benzo(a)anthracene 108 Benzo(a)pyrene 150 Chrysene 166 Dibenz(a,h)anthracene 33 Fluoranthene 423 Pyrene 195 ΣPAHs 1610
ΣPCBs (ng/g dw) 59.8 Organochlorine pesticides
(ng/g dw) Chlordane
3.24
MacDonald et al. 2000
Dieldrin 1.90 ΣDDD 4.88 ΣDDE 3.16 ΣDDT 5.28 Endrin 2.22 Heptachlor epoxide 2.47 Lindane 2.37
Pyrethroids (ng/g OC)
Bifenthrin
520 LC50 Amweg et al. 2006
Cyfluthrin 1080 LC50 Cypermethrin 380 LC50
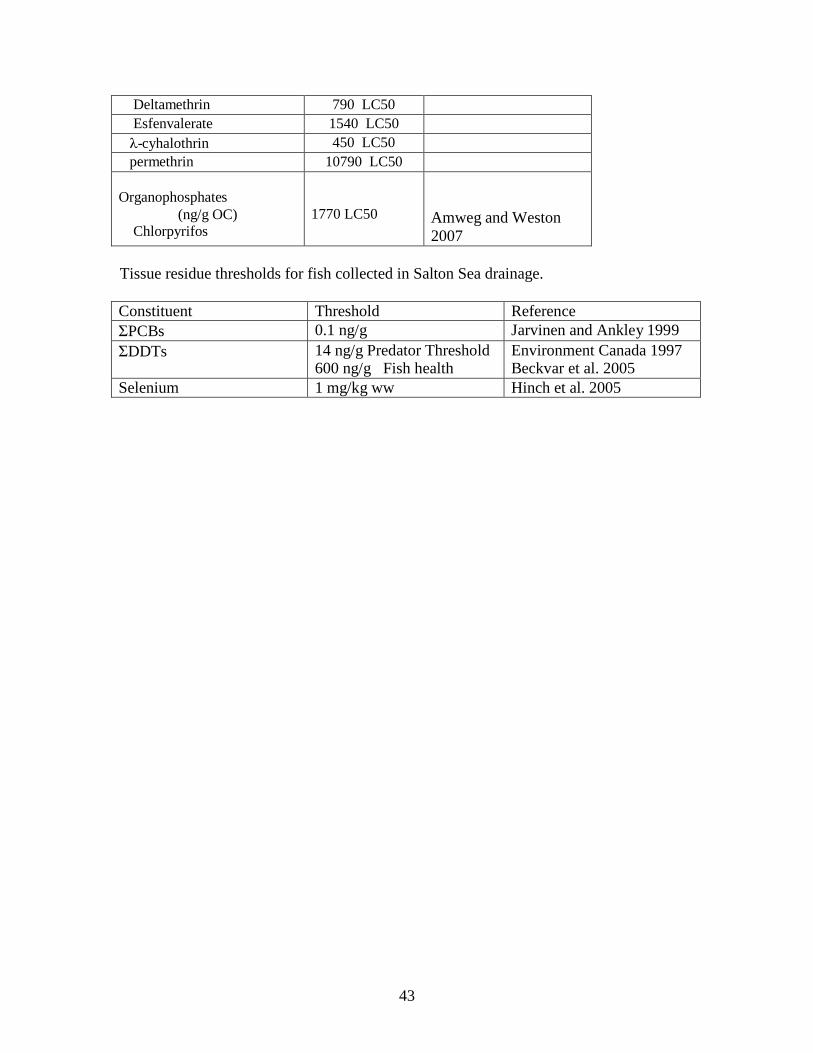
43
Deltamethrin 790 LC50 Esfenvalerate 1540 LC50 λ-cyhalothrin 450 LC50 permethrin 10790 LC50
Organophosphates
(ng/g OC) Chlorpyrifos
1770 LC50
Amweg and Weston 2007
Tissue residue thresholds for fish collected in Salton Sea drainage.
Constituent Threshold Reference ΣPCBs 0.1 ng/g Jarvinen and Ankley 1999 ΣDDTs 14 ng/g Predator Threshold
600 ng/g Fish health Environment Canada 1997 Beckvar et al. 2005
Selenium 1 mg/kg ww Hinch et al. 2005
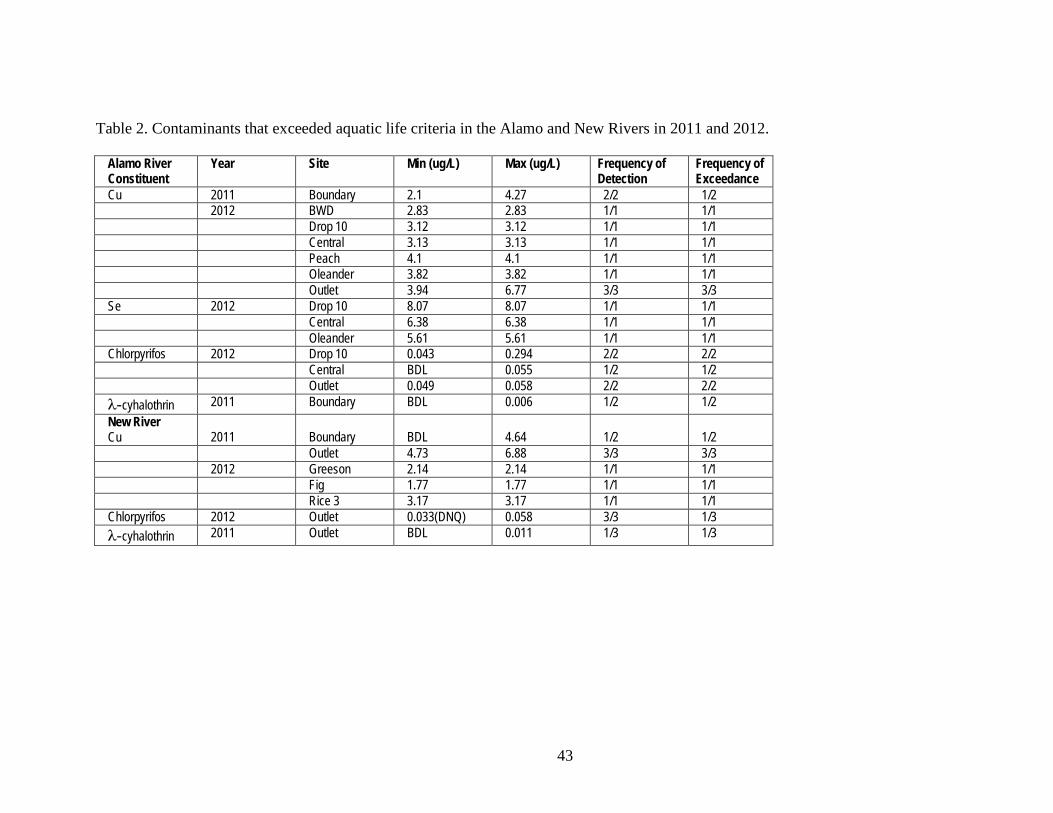
Table 2. Contaminants that exceeded aquatic life criteria in the Alamo and New Rivers in 2011 and 2012.
Alamo River Constituent
Year Site Min (ug/L) Max (ug/L) Frequency of Detection
Frequency of Exceedance
Cu 2011 Boundary 2.1 4.27 2/2 1/2 2012 BWD 2.83 2.83 1/1 1/1 Drop 10 3.12 3.12 1/1 1/1 Central 3.13 3.13 1/1 1/1 Peach 4.1 4.1 1/1 1/1 Oleander 3.82 3.82 1/1 1/1 Outlet 3.94 6.77 3/3 3/3
Se 2012 Drop 10 8.07 8.07 1/1 1/1 Central 6.38 6.38 1/1 1/1 Oleander 5.61 5.61 1/1 1/1
Chlorpyrifos 2012 Drop 10 0.043 0.294 2/2 2/2 Central BDL 0.055 1/2 1/2 Outlet 0.049 0.058 2/2 2/2
λ-cyhalothrin 2011 Boundary BDL 0.006 1/2 1/2 New River Cu
2011
Boundary
BDL
4.64
1/2
1/2
Outlet 4.73 6.88 3/3 3/3 2012 Greeson 2.14 2.14 1/1 1/1 Fig 1.77 1.77 1/1 1/1 Rice 3 3.17 3.17 1/1 1/1
Chlorpyrifos 2012 Outlet 0.033(DNQ) 0.058 3/3 1/3 λ-cyhalothrin 2011 Outlet BDL 0.011 1/3 1/3
43
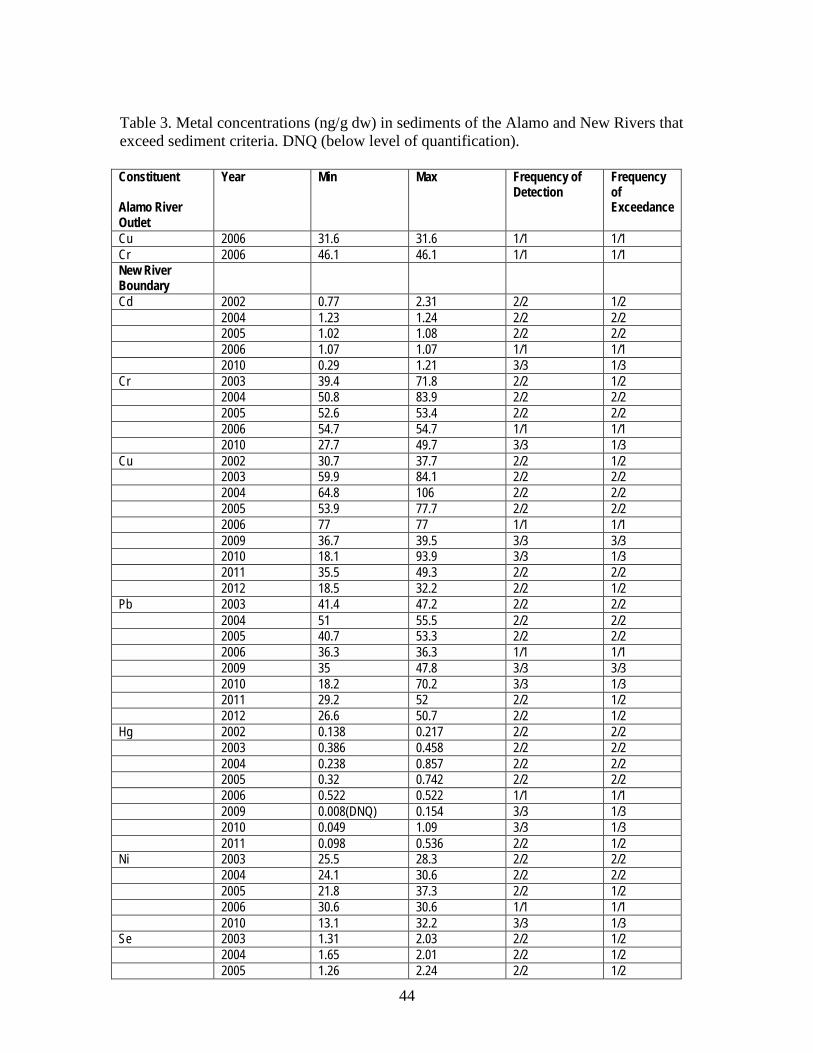
44
Table 3. Metal concentrations (ng/g dw) in sediments of the Alamo and New Rivers that exceed sediment criteria. DNQ (below level of quantification).
Constituent
Alamo River Outlet
Year Min Max Frequency of Detection
Frequency of Exceedance
Cu 2006 31.6 31.6 1/1 1/1 Cr 2006 46.1 46.1 1/1 1/1 New River Boundary
Cd 2002 0.77 2.31 2/2 1/2 2004 1.23 1.24 2/2 2/2 2005 1.02 1.08 2/2 2/2 2006 1.07 1.07 1/1 1/1 2010 0.29 1.21 3/3 1/3
Cr 2003 39.4 71.8 2/2 1/2 2004 50.8 83.9 2/2 2/2 2005 52.6 53.4 2/2 2/2 2006 54.7 54.7 1/1 1/1 2010 27.7 49.7 3/3 1/3
Cu 2002 30.7 37.7 2/2 1/2 2003 59.9 84.1 2/2 2/2 2004 64.8 106 2/2 2/2 2005 53.9 77.7 2/2 2/2 2006 77 77 1/1 1/1 2009 36.7 39.5 3/3 3/3 2010 18.1 93.9 3/3 1/3 2011 35.5 49.3 2/2 2/2 2012 18.5 32.2 2/2 1/2
Pb 2003 41.4 47.2 2/2 2/2 2004 51 55.5 2/2 2/2 2005 40.7 53.3 2/2 2/2 2006 36.3 36.3 1/1 1/1 2009 35 47.8 3/3 3/3 2010 18.2 70.2 3/3 1/3 2011 29.2 52 2/2 1/2 2012 26.6 50.7 2/2 1/2
Hg 2002 0.138 0.217 2/2 2/2 2003 0.386 0.458 2/2 2/2 2004 0.238 0.857 2/2 2/2 2005 0.32 0.742 2/2 2/2 2006 0.522 0.522 1/1 1/1 2009 0.008(DNQ) 0.154 3/3 1/3 2010 0.049 1.09 3/3 1/3 2011 0.098 0.536 2/2 1/2
Ni 2003 25.5 28.3 2/2 2/2 2004 24.1 30.6 2/2 2/2 2005 21.8 37.3 2/2 1/2 2006 30.6 30.6 1/1 1/1 2010 13.1 32.2 3/3 1/3
Se 2003 1.31 2.03 2/2 1/2 2004 1.65 2.01 2/2 1/2 2005 1.26 2.24 2/2 1/2
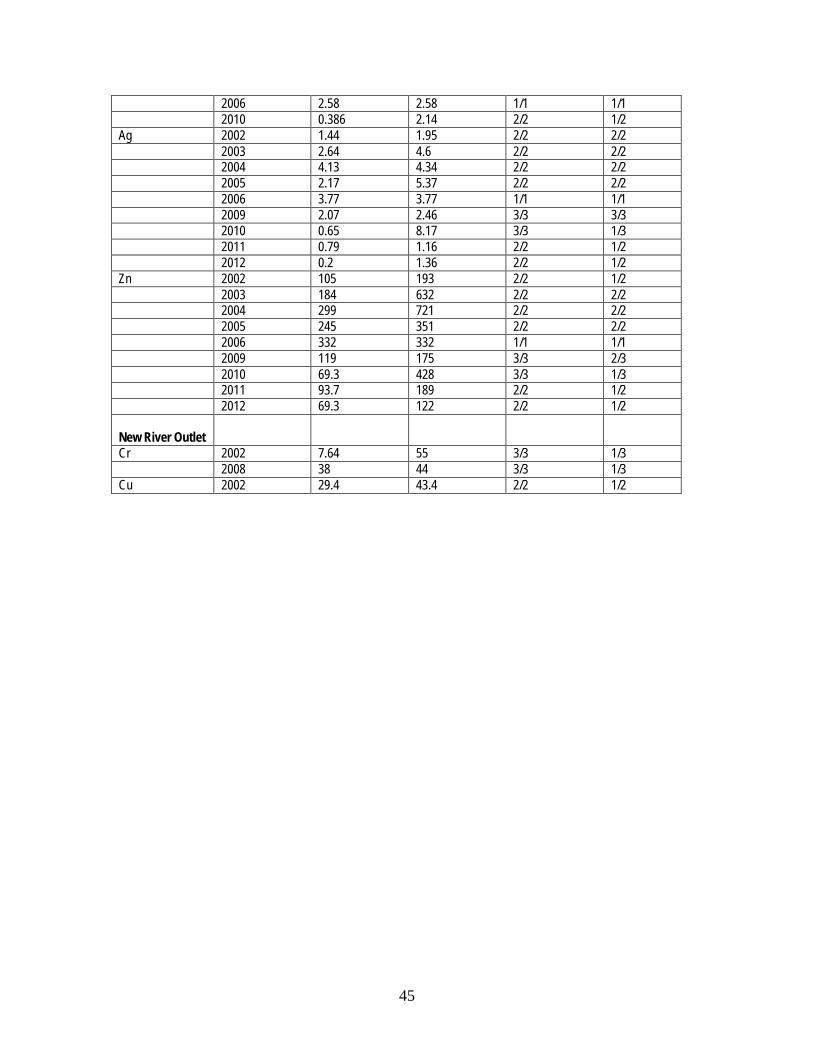
45
2006 2.58 2.58 1/1 1/1 2010 0.386 2.14 2/2 1/2
Ag 2002 1.44 1.95 2/2 2/2 2003 2.64 4.6 2/2 2/2 2004 4.13 4.34 2/2 2/2 2005 2.17 5.37 2/2 2/2 2006 3.77 3.77 1/1 1/1 2009 2.07 2.46 3/3 3/3 2010 0.65 8.17 3/3 1/3 2011 0.79 1.16 2/2 1/2 2012 0.2 1.36 2/2 1/2
Zn 2002 105 193 2/2 1/2 2003 184 632 2/2 2/2 2004 299 721 2/2 2/2 2005 245 351 2/2 2/2 2006 332 332 1/1 1/1 2009 119 175 3/3 2/3 2010 69.3 428 3/3 1/3 2011 93.7 189 2/2 1/2 2012 69.3 122 2/2 1/2
New River Outlet
Cr 2002 7.64 55 3/3 1/3 2008 38 44 3/3 1/3
Cu 2002 29.4 43.4 2/2 1/2
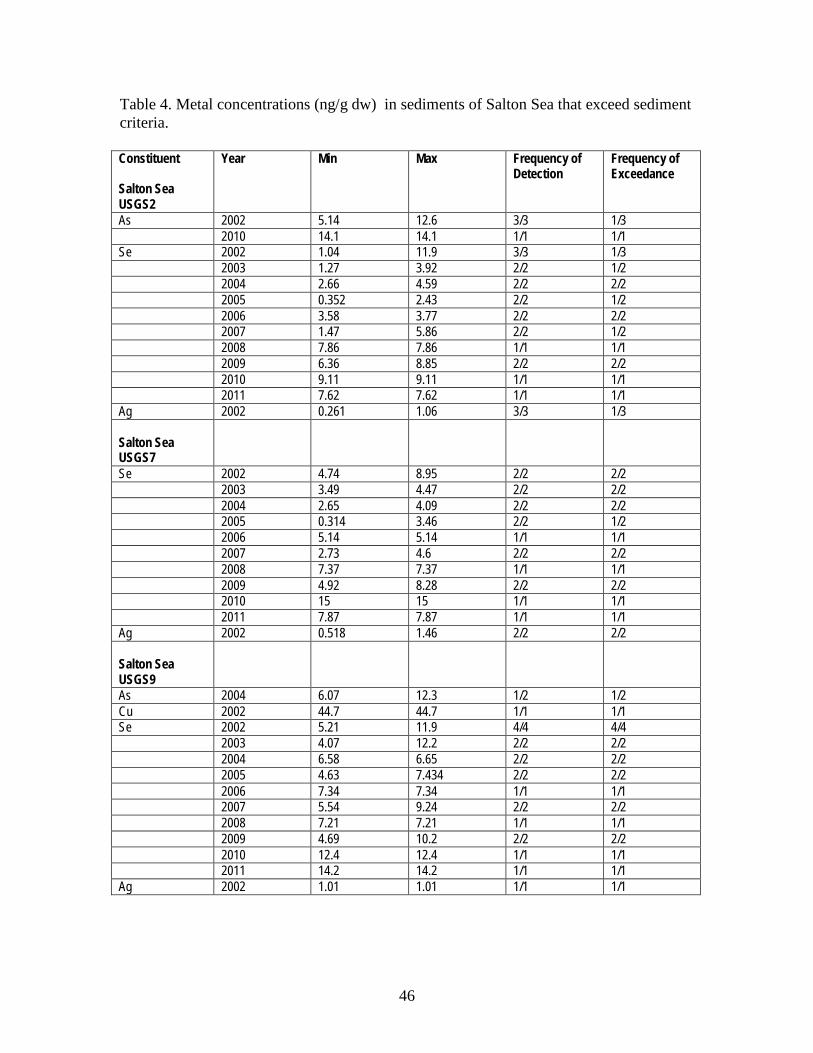
46
Table 4. Metal concentrations (ng/g dw) in sediments of Salton Sea that exceed sediment criteria.
Constituent
Salton Sea USGS2
Year Min Max Frequency of Detection
Frequency of Exceedance
As 2002 5.14 12.6 3/3 1/3 2010 14.1 14.1 1/1 1/1
Se 2002 1.04 11.9 3/3 1/3 2003 1.27 3.92 2/2 1/2 2004 2.66 4.59 2/2 2/2 2005 0.352 2.43 2/2 1/2 2006 3.58 3.77 2/2 2/2 2007 1.47 5.86 2/2 1/2 2008 7.86 7.86 1/1 1/1 2009 6.36 8.85 2/2 2/2 2010 9.11 9.11 1/1 1/1 2011 7.62 7.62 1/1 1/1
Ag 2002 0.261 1.06 3/3 1/3
Salton Sea USGS7
Se 2002 4.74 8.95 2/2 2/2 2003 3.49 4.47 2/2 2/2 2004 2.65 4.09 2/2 2/2 2005 0.314 3.46 2/2 1/2 2006 5.14 5.14 1/1 1/1 2007 2.73 4.6 2/2 2/2 2008 7.37 7.37 1/1 1/1 2009 4.92 8.28 2/2 2/2 2010 15 15 1/1 1/1 2011 7.87 7.87 1/1 1/1
Ag 2002 0.518 1.46 2/2 2/2
Salton Sea USGS9
As 2004 6.07 12.3 1/2 1/2 Cu 2002 44.7 44.7 1/1 1/1 Se 2002 5.21 11.9 4/4 4/4
2003 4.07 12.2 2/2 2/2 2004 6.58 6.65 2/2 2/2 2005 4.63 7.434 2/2 2/2 2006 7.34 7.34 1/1 1/1 2007 5.54 9.24 2/2 2/2 2008 7.21 7.21 1/1 1/1 2009 4.69 10.2 2/2 2/2 2010 12.4 12.4 1/1 1/1 2011 14.2 14.2 1/1 1/1
Ag 2002 1.01 1.01 1/1 1/1
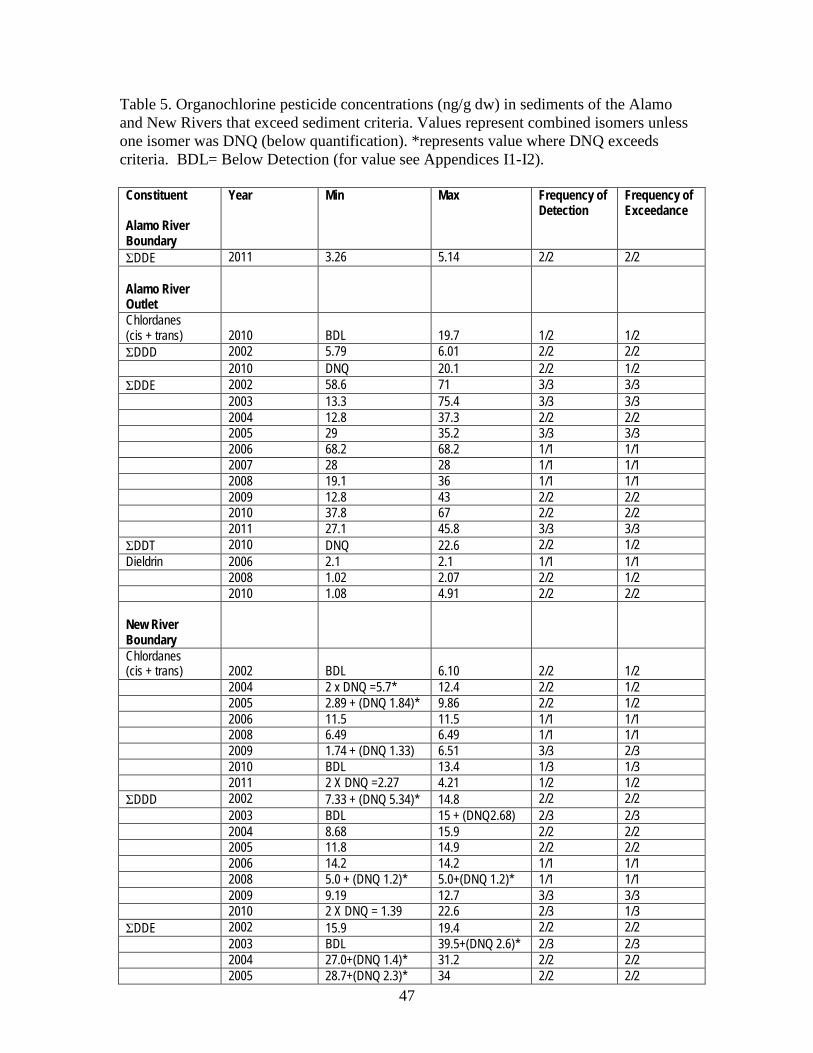
47
Table 5. Organochlorine pesticide concentrations (ng/g dw) in sediments of the Alamo and New Rivers that exceed sediment criteria. Values represent combined isomers unless one isomer was DNQ (below quantification). *represents value where DNQ exceeds criteria. BDL= Below Detection (for value see Appendices I1-I2).
Constituent
Alamo River Boundary
Year Min Max Frequency of Detection
Frequency of Exceedance
ΣDDE 2011 3.26 5.14 2/2 2/2
Alamo River Outlet
Chlordanes (cis + trans)
2010
BDL
19.7
1/2
1/2
ΣDDD 2002 5.79 6.01 2/2 2/2 2010 DNQ 20.1 2/2 1/2
ΣDDE 2002 58.6 71 3/3 3/3 2003 13.3 75.4 3/3 3/3 2004 12.8 37.3 2/2 2/2 2005 29 35.2 3/3 3/3 2006 68.2 68.2 1/1 1/1 2007 28 28 1/1 1/1 2008 19.1 36 1/1 1/1 2009 12.8 43 2/2 2/2 2010 37.8 67 2/2 2/2 2011 27.1 45.8 3/3 3/3
ΣDDT 2010 DNQ 22.6 2/2 1/2 Dieldrin 2006 2.1 2.1 1/1 1/1
2008 1.02 2.07 2/2 1/2 2010 1.08 4.91 2/2 2/2
New River Boundary
Chlordanes (cis + trans)
2002
BDL
6.10
2/2
1/2
2004 2 x DNQ =5.7* 12.4 2/2 1/2 2005 2.89 + (DNQ 1.84)* 9.86 2/2 1/2 2006 11.5 11.5 1/1 1/1 2008 6.49 6.49 1/1 1/1 2009 1.74 + (DNQ 1.33) 6.51 3/3 2/3 2010 BDL 13.4 1/3 1/3 2011 2 X DNQ =2.27 4.21 1/2 1/2
ΣDDD 2002 7.33 + (DNQ 5.34)* 14.8 2/2 2/2 2003 BDL 15 + (DNQ2.68) 2/3 2/3 2004 8.68 15.9 2/2 2/2 2005 11.8 14.9 2/2 2/2 2006 14.2 14.2 1/1 1/1 2008 5.0 + (DNQ 1.2)* 5.0+(DNQ 1.2)* 1/1 1/1 2009 9.19 12.7 3/3 3/3 2010 2 X DNQ = 1.39 22.6 2/3 1/3
ΣDDE 2002 15.9 19.4 2/2 2/2 2003 BDL 39.5+(DNQ 2.6)* 2/3 2/3 2004 27.0+(DNQ 1.4)* 31.2 2/2 2/2 2005 28.7+(DNQ 2.3)* 34 2/2 2/2
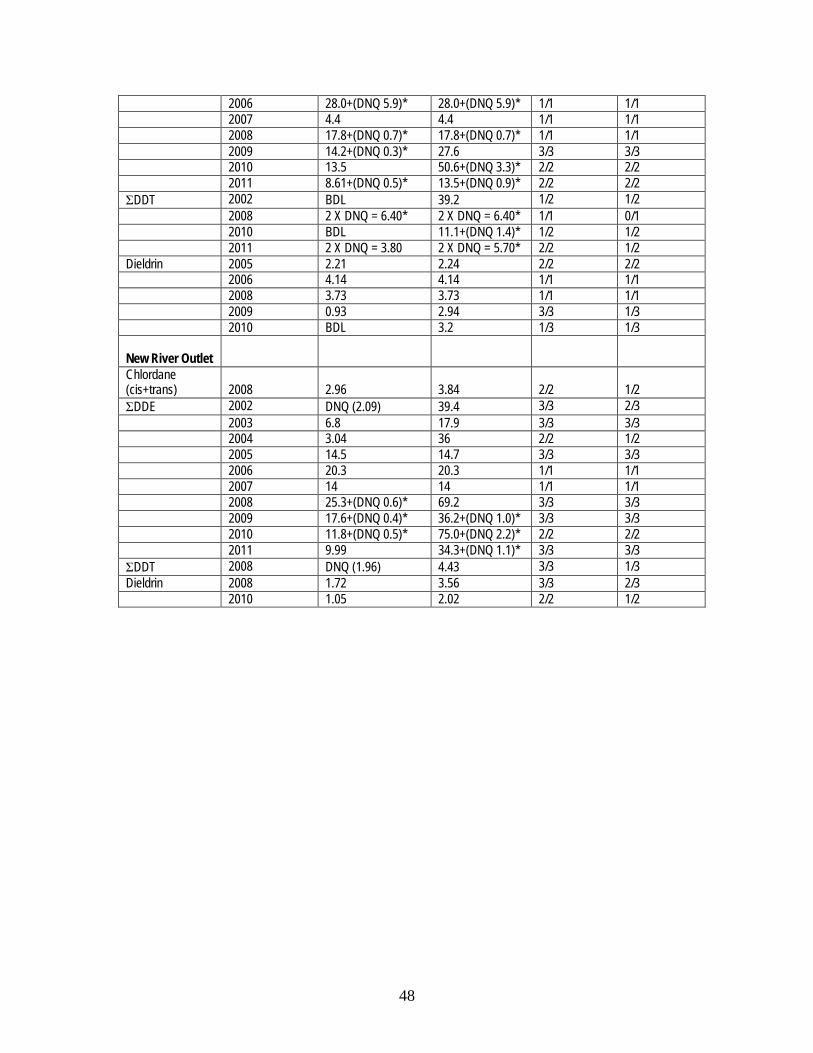
48
2006 28.0+(DNQ 5.9)* 28.0+(DNQ 5.9)* 1/1 1/1 2007 4.4 4.4 1/1 1/1 2008 17.8+(DNQ 0.7)* 17.8+(DNQ 0.7)* 1/1 1/1 2009 14.2+(DNQ 0.3)* 27.6 3/3 3/3 2010 13.5 50.6+(DNQ 3.3)* 2/2 2/2 2011 8.61+(DNQ 0.5)* 13.5+(DNQ 0.9)* 2/2 2/2
ΣDDT 2002 BDL 39.2 1/2 1/2 2008 2 X DNQ = 6.40* 2 X DNQ = 6.40* 1/1 0/1 2010 BDL 11.1+(DNQ 1.4)* 1/2 1/2 2011 2 X DNQ = 3.80 2 X DNQ = 5.70* 2/2 1/2
Dieldrin 2005 2.21 2.24 2/2 2/2 2006 4.14 4.14 1/1 1/1 2008 3.73 3.73 1/1 1/1 2009 0.93 2.94 3/3 1/3 2010 BDL 3.2 1/3 1/3
New River Outlet
Chlordane (cis+trans)
2008
2.96
3.84
2/2
1/2
ΣDDE 2002 DNQ (2.09) 39.4 3/3 2/3 2003 6.8 17.9 3/3 3/3 2004 3.04 36 2/2 1/2 2005 14.5 14.7 3/3 3/3 2006 20.3 20.3 1/1 1/1 2007 14 14 1/1 1/1 2008 25.3+(DNQ 0.6)* 69.2 3/3 3/3 2009 17.6+(DNQ 0.4)* 36.2+(DNQ 1.0)* 3/3 3/3 2010 11.8+(DNQ 0.5)* 75.0+(DNQ 2.2)* 2/2 2/2 2011 9.99 34.3+(DNQ 1.1)* 3/3 3/3
ΣDDT 2008 DNQ (1.96) 4.43 3/3 1/3 Dieldrin 2008 1.72 3.56 3/3 2/3
2010 1.05 2.02 2/2 1/2
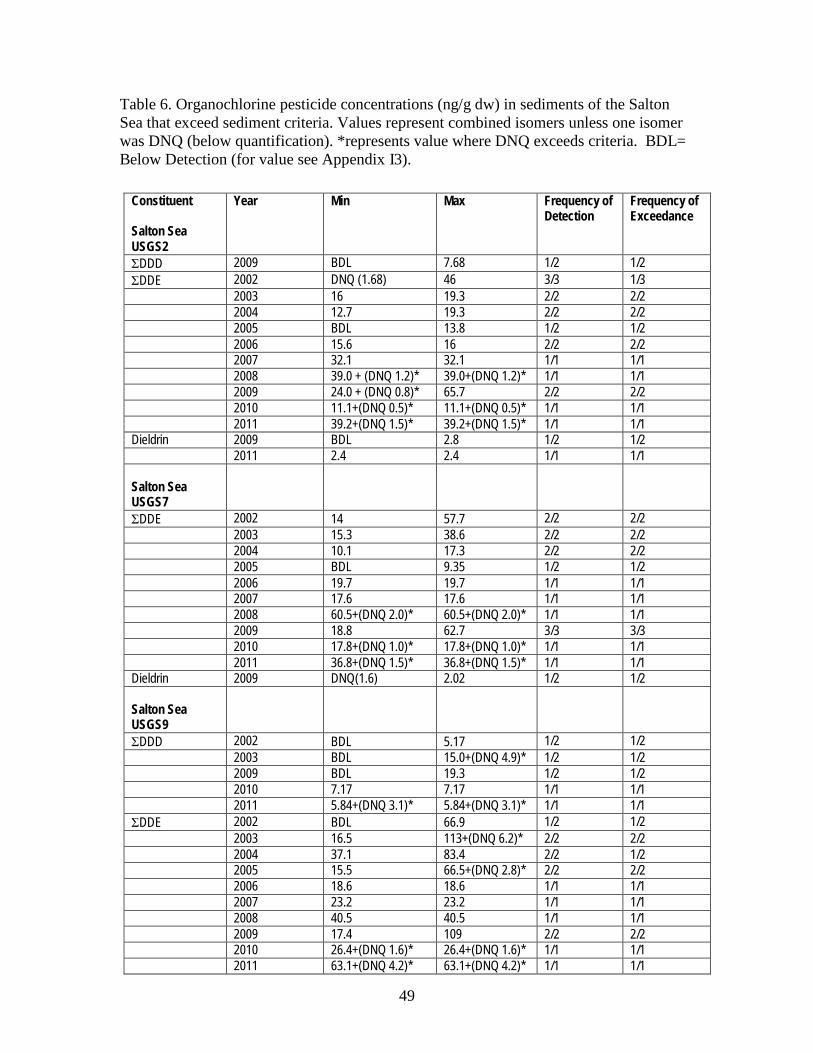
49
Table 6. Organochlorine pesticide concentrations (ng/g dw) in sediments of the Salton Sea that exceed sediment criteria. Values represent combined isomers unless one isomer was DNQ (below quantification). *represents value where DNQ exceeds criteria. BDL= Below Detection (for value see Appendix I3).
Constituent
Salton Sea USGS2
Year Min Max Frequency of Detection
Frequency of Exceedance
ΣDDD 2009 BDL 7.68 1/2 1/2 ΣDDE 2002 DNQ (1.68) 46 3/3 1/3
2003 16 19.3 2/2 2/2 2004 12.7 19.3 2/2 2/2 2005 BDL 13.8 1/2 1/2 2006 15.6 16 2/2 2/2 2007 32.1 32.1 1/1 1/1 2008 39.0 + (DNQ 1.2)* 39.0+(DNQ 1.2)* 1/1 1/1 2009 24.0 + (DNQ 0.8)* 65.7 2/2 2/2 2010 11.1+(DNQ 0.5)* 11.1+(DNQ 0.5)* 1/1 1/1 2011 39.2+(DNQ 1.5)* 39.2+(DNQ 1.5)* 1/1 1/1
Dieldrin 2009 BDL 2.8 1/2 1/2 2011 2.4 2.4 1/1 1/1
Salton Sea USGS7
ΣDDE 2002 14 57.7 2/2 2/2 2003 15.3 38.6 2/2 2/2 2004 10.1 17.3 2/2 2/2 2005 BDL 9.35 1/2 1/2 2006 19.7 19.7 1/1 1/1 2007 17.6 17.6 1/1 1/1 2008 60.5+(DNQ 2.0)* 60.5+(DNQ 2.0)* 1/1 1/1 2009 18.8 62.7 3/3 3/3 2010 17.8+(DNQ 1.0)* 17.8+(DNQ 1.0)* 1/1 1/1 2011 36.8+(DNQ 1.5)* 36.8+(DNQ 1.5)* 1/1 1/1
Dieldrin 2009 DNQ(1.6) 2.02 1/2 1/2
Salton Sea USGS9
ΣDDD 2002 BDL 5.17 1/2 1/2 2003 BDL 15.0+(DNQ 4.9)* 1/2 1/2 2009 BDL 19.3 1/2 1/2 2010 7.17 7.17 1/1 1/1 2011 5.84+(DNQ 3.1)* 5.84+(DNQ 3.1)* 1/1 1/1
ΣDDE 2002 BDL 66.9 1/2 1/2 2003 16.5 113+(DNQ 6.2)* 2/2 2/2 2004 37.1 83.4 2/2 1/2 2005 15.5 66.5+(DNQ 2.8)* 2/2 2/2 2006 18.6 18.6 1/1 1/1 2007 23.2 23.2 1/1 1/1 2008 40.5 40.5 1/1 1/1 2009 17.4 109 2/2 2/2 2010 26.4+(DNQ 1.6)* 26.4+(DNQ 1.6)* 1/1 1/1 2011 63.1+(DNQ 4.2)* 63.1+(DNQ 4.2)* 1/1 1/1
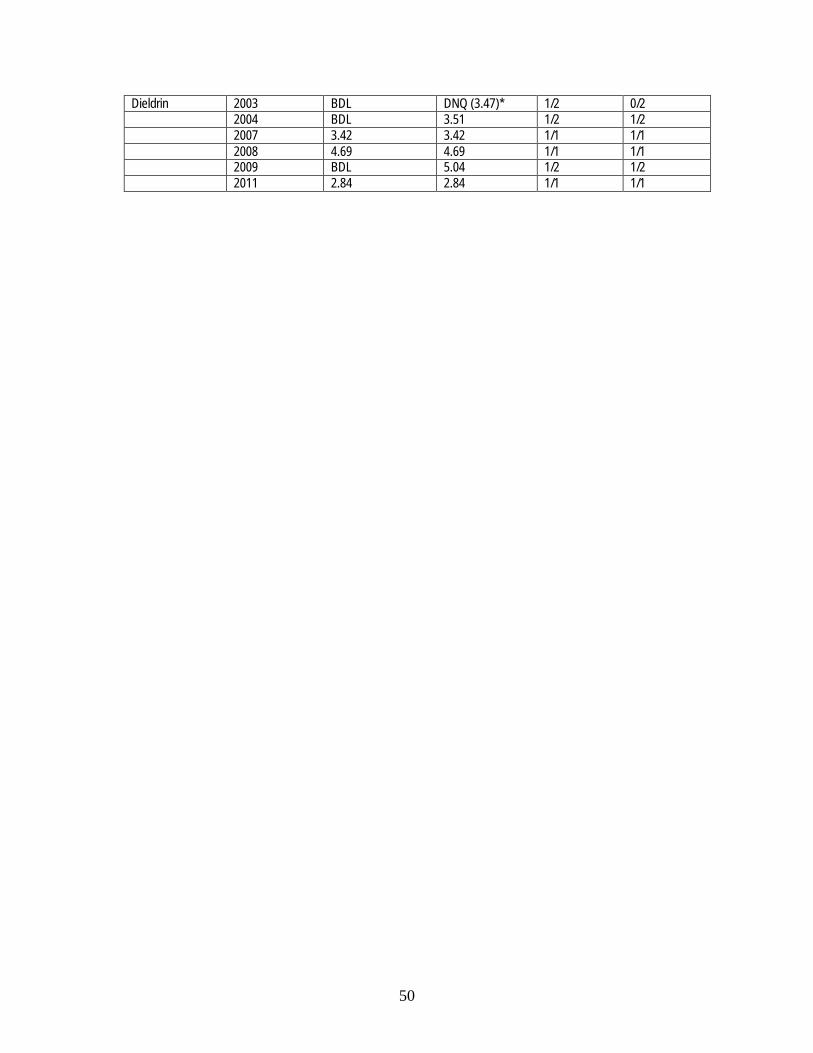
50
Dieldrin 2003 BDL DNQ (3.47)* 1/2 0/2 2004 BDL 3.51 1/2 1/2 2007 3.42 3.42 1/1 1/1 2008 4.69 4.69 1/1 1/1 2009 BDL 5.04 1/2 1/2 2011 2.84 2.84 1/1 1/1
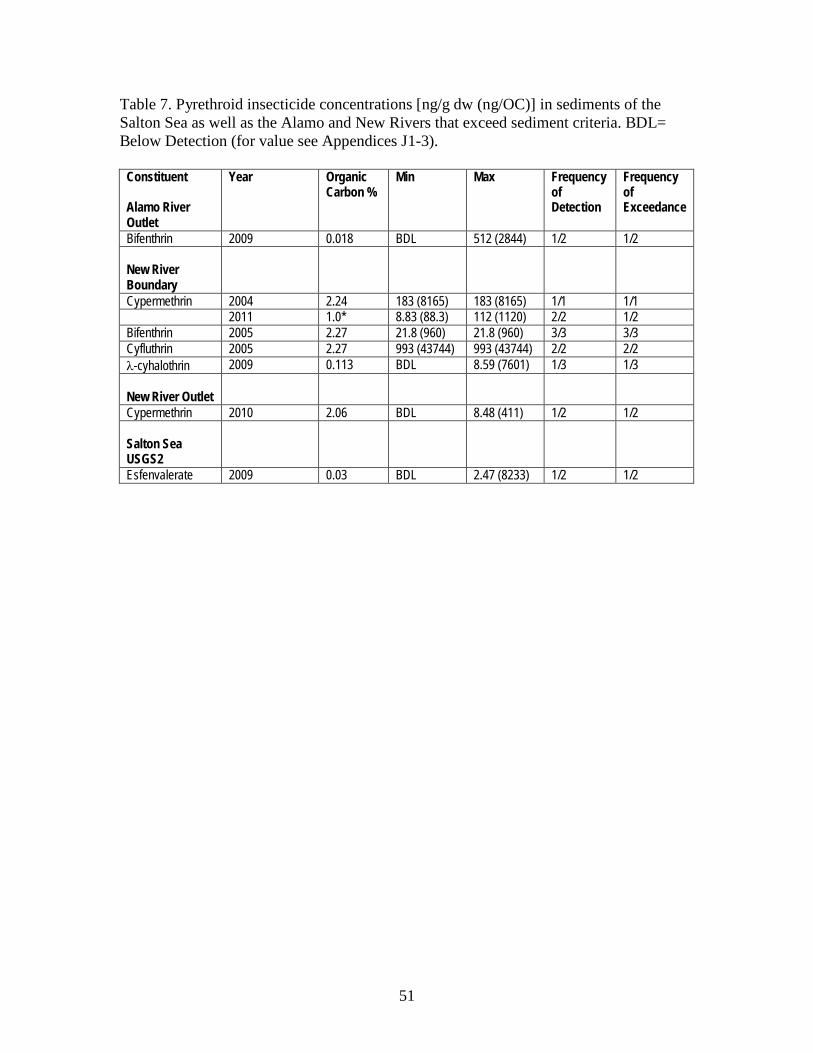
51
Table 7. Pyrethroid insecticide concentrations [ng/g dw (ng/OC)] in sediments of the Salton Sea as well as the Alamo and New Rivers that exceed sediment criteria. BDL= Below Detection (for value see Appendices J1-3).
Constituent
Alamo River Outlet
Year Organic Carbon %
Min Max Frequency of Detection
Frequency of Exceedance
Bifenthrin 2009 0.018 BDL 512 (2844) 1/2 1/2
New River Boundary
Cypermethrin 2004 2.24 183 (8165) 183 (8165) 1/1 1/1 2011 1.0* 8.83 (88.3) 112 (1120) 2/2 1/2
Bifenthrin 2005 2.27 21.8 (960) 21.8 (960) 3/3 3/3 Cyfluthrin 2005 2.27 993 (43744) 993 (43744) 2/2 2/2 λ-cyhalothrin 2009 0.113 BDL 8.59 (7601) 1/3 1/3
New River Outlet
Cypermethrin 2010 2.06 BDL 8.48 (411) 1/2 1/2
Salton Sea USGS2
Esfenvalerate 2009 0.03 BDL 2.47 (8233) 1/2 1/2
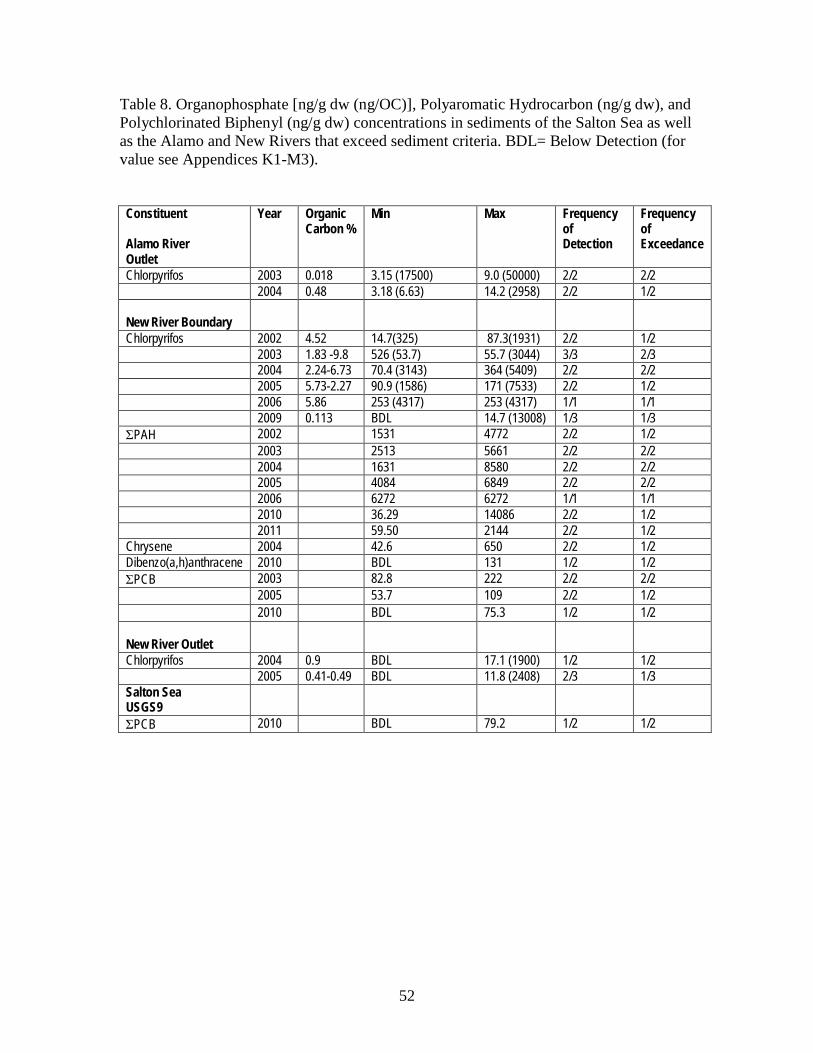
52
Table 8. Organophosphate [ng/g dw (ng/OC)], Polyaromatic Hydrocarbon (ng/g dw), and Polychlorinated Biphenyl (ng/g dw) concentrations in sediments of the Salton Sea as well as the Alamo and New Rivers that exceed sediment criteria. BDL= Below Detection (for value see Appendices K1-M3).
Constituent
Alamo River Outlet
Year Organic Carbon %
Min Max Frequency of Detection
Frequency of Exceedance
Chlorpyrifos 2003 0.018 3.15 (17500) 9.0 (50000) 2/2 2/2 2004 0.48 3.18 (6.63) 14.2 (2958) 2/2 1/2
New River Boundary
Chlorpyrifos 2002 4.52 14.7(325) 87.3(1931) 2/2 1/2 2003 1.83 -9.8 526 (53.7) 55.7 (3044) 3/3 2/3 2004 2.24-6.73 70.4 (3143) 364 (5409) 2/2 2/2 2005 5.73-2.27 90.9 (1586) 171 (7533) 2/2 1/2 2006 5.86 253 (4317) 253 (4317) 1/1 1/1 2009 0.113 BDL 14.7 (13008) 1/3 1/3
ΣPAH 2002 1531 4772 2/2 1/2 2003 2513 5661 2/2 2/2 2004 1631 8580 2/2 2/2 2005 4084 6849 2/2 2/2 2006 6272 6272 1/1 1/1 2010 36.29 14086 2/2 1/2 2011 59.50 2144 2/2 1/2
Chrysene 2004 42.6 650 2/2 1/2 Dibenzo(a,h)anthracene 2010 BDL 131 1/2 1/2 ΣPCB 2003 82.8 222 2/2 2/2
2005 53.7 109 2/2 1/2 2010 BDL 75.3 1/2 1/2
New River Outlet
Chlorpyrifos 2004 0.9 BDL 17.1 (1900) 1/2 1/2 2005 0.41-0.49 BDL 11.8 (2408) 2/3 1/3
Salton Sea USGS9
ΣPCB 2010 BDL 79.2 1/2 1/2
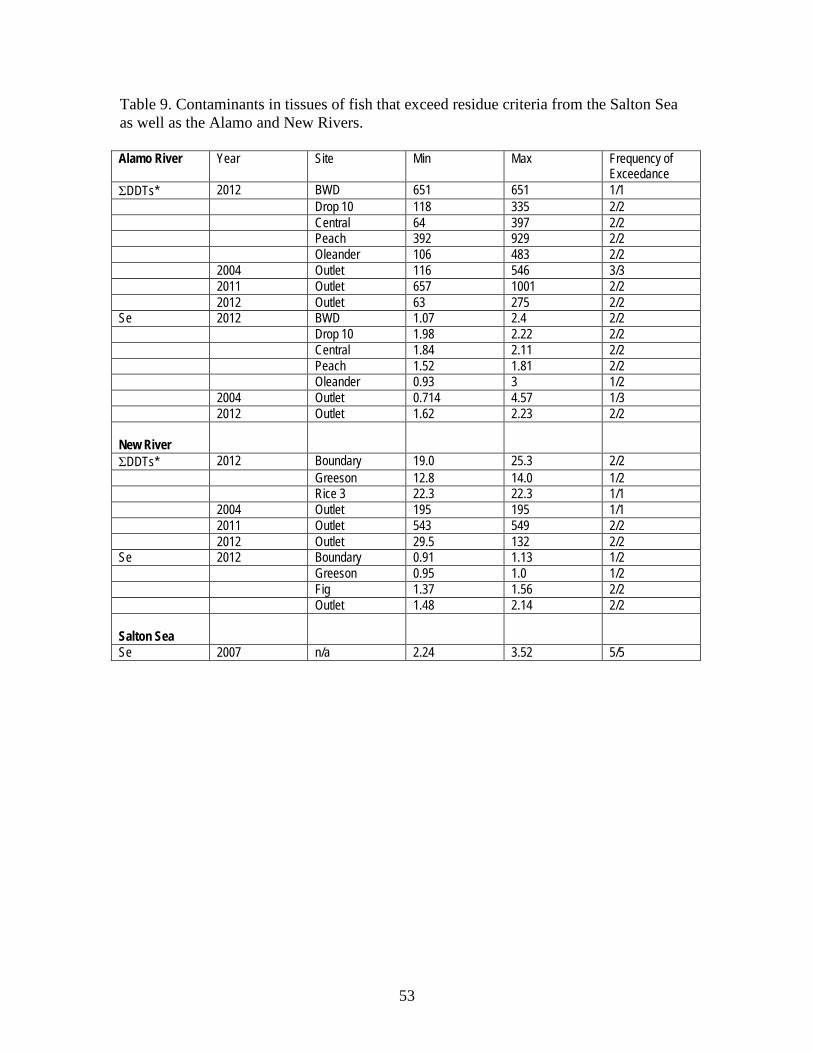
53
Table 9. Contaminants in tissues of fish that exceed residue criteria from the Salton Sea as well as the Alamo and New Rivers.
Alamo River Year Site Min Max Frequency of
Exceedance ΣDDTs* 2012 BWD 651 651 1/1
Drop 10 118 335 2/2 Central 64 397 2/2 Peach 392 929 2/2 Oleander 106 483 2/2 2004 Outlet 116 546 3/3 2011 Outlet 657 1001 2/2 2012 Outlet 63 275 2/2
Se 2012 BWD 1.07 2.4 2/2 Drop 10 1.98 2.22 2/2 Central 1.84 2.11 2/2 Peach 1.52 1.81 2/2 Oleander 0.93 3 1/2 2004 Outlet 0.714 4.57 1/3 2012 Outlet 1.62 2.23 2/2
New River
ΣDDTs* 2012 Boundary 19.0 25.3 2/2 Greeson 12.8 14.0 1/2 Rice 3 22.3 22.3 1/1 2004 Outlet 195 195 1/1 2011 Outlet 543 549 2/2 2012 Outlet 29.5 132 2/2
Se 2012 Boundary 0.91 1.13 1/2 Greeson 0.95 1.0 1/2 Fig 1.37 1.56 2/2 Outlet 1.48 2.14 2/2
Salton Sea
Se 2007 n/a 2.24 3.52 5/5
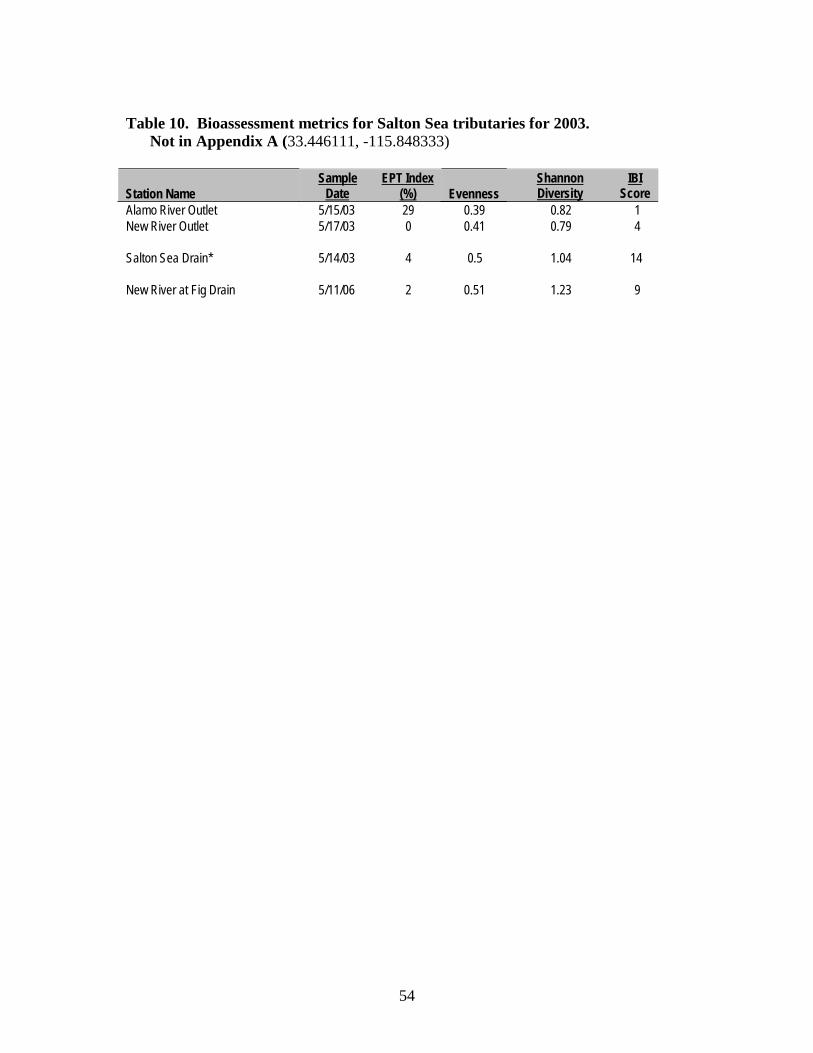
54
Station Name
Sample EPT Index Date (%)
Evenness
Shannon IBI Diversity Score
Table 10. Bioassessment metrics for Salton Sea tributaries for 2003.
Not in Appendix A (33.446111, -115.848333)
Alamo River Outlet 5/15/03 29 0.39 0.82 1 New River Outlet 5/17/03 0 0.41 0.79 4
Salton Sea Drain*
5/14/03
4
0.5
1.04
14
New River at Fig Drain
5/11/06
2
0.51
1.23
9
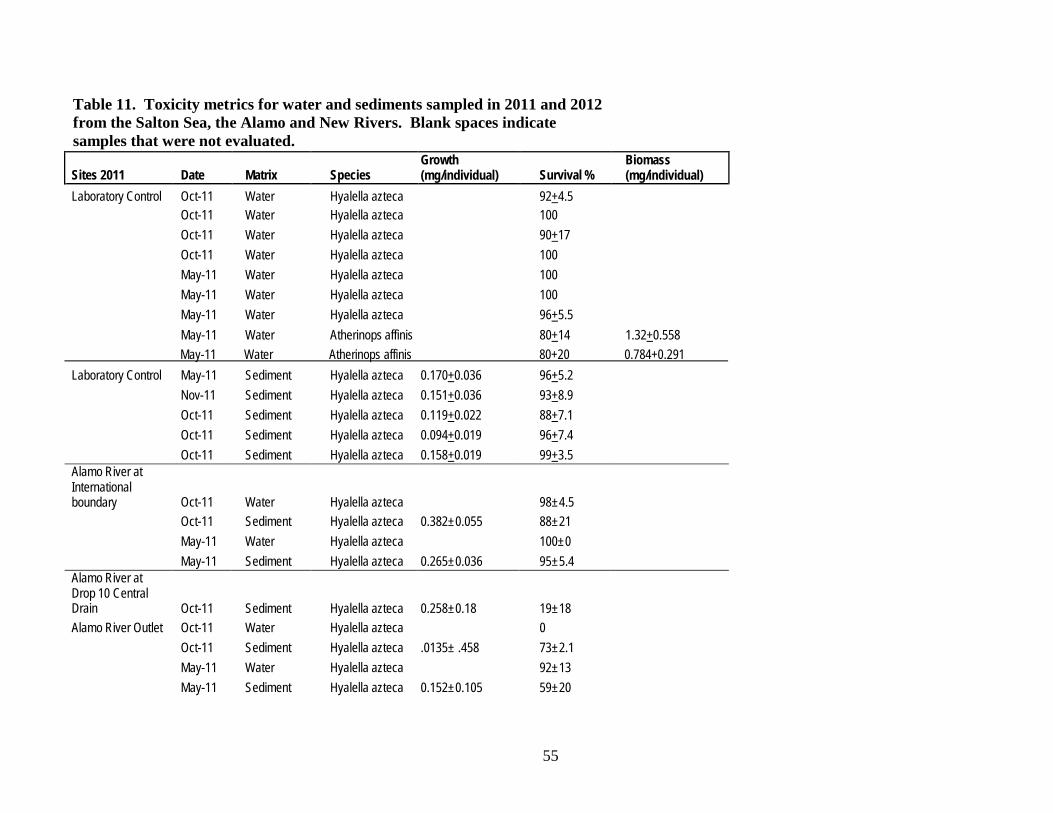
55
Table 11. Toxicity metrics for water and sediments sampled in 2011 and 2012 from the Salton Sea, the Alamo and New Rivers. Blank spaces indicate samples that were not evaluated.
Sites 2011
Date
Matrix
Species
Growth (mg/individual)
Survival %
Biomass (mg/individual)
Laboratory Control Oct-11 Water Hyalella azteca 92+4.5 Oct-11 Water Hyalella azteca 100 Oct-11 Water Hyalella azteca 90+17 Oct-11 Water Hyalella azteca 100 May-11 Water Hyalella azteca 100 May-11 Water Hyalella azteca 100 May-11 Water Hyalella azteca 96+5.5 May-11 Water Atherinops affinis 80+14 1.32+0.558 May-11 Water Atherinops affinis 80+20 0.784+0.291
Laboratory Control May-11 Sediment Hyalella azteca 0.170+0.036 96+5.2 Nov-11 Sediment Hyalella azteca 0.151+0.036 93+8.9 Oct-11 Sediment Hyalella azteca 0.119+0.022 88+7.1 Oct-11 Sediment Hyalella azteca 0.094+0.019 96+7.4 Oct-11 Sediment Hyalella azteca 0.158+0.019 99+3.5
Alamo River at International boundary
Oct-11
Water
Hyalella azteca
98±4.5
Oct-11 Sediment Hyalella azteca 0.382±0.055 88±21 May-11 Water Hyalella azteca 100±0 May-11 Sediment Hyalella azteca 0.265±0.036 95±5.4
Alamo River at Drop 10 Central Drain
Oct-11
Sediment
Hyalella azteca
0.258±0.18
19±18
Alamo River Outlet Oct-11 Water Hyalella azteca 0 Oct-11 Sediment Hyalella azteca .0135± .458 73±2.1 May-11 Water Hyalella azteca 92±13 May-11 Sediment Hyalella azteca 0.152±0.105 59±20
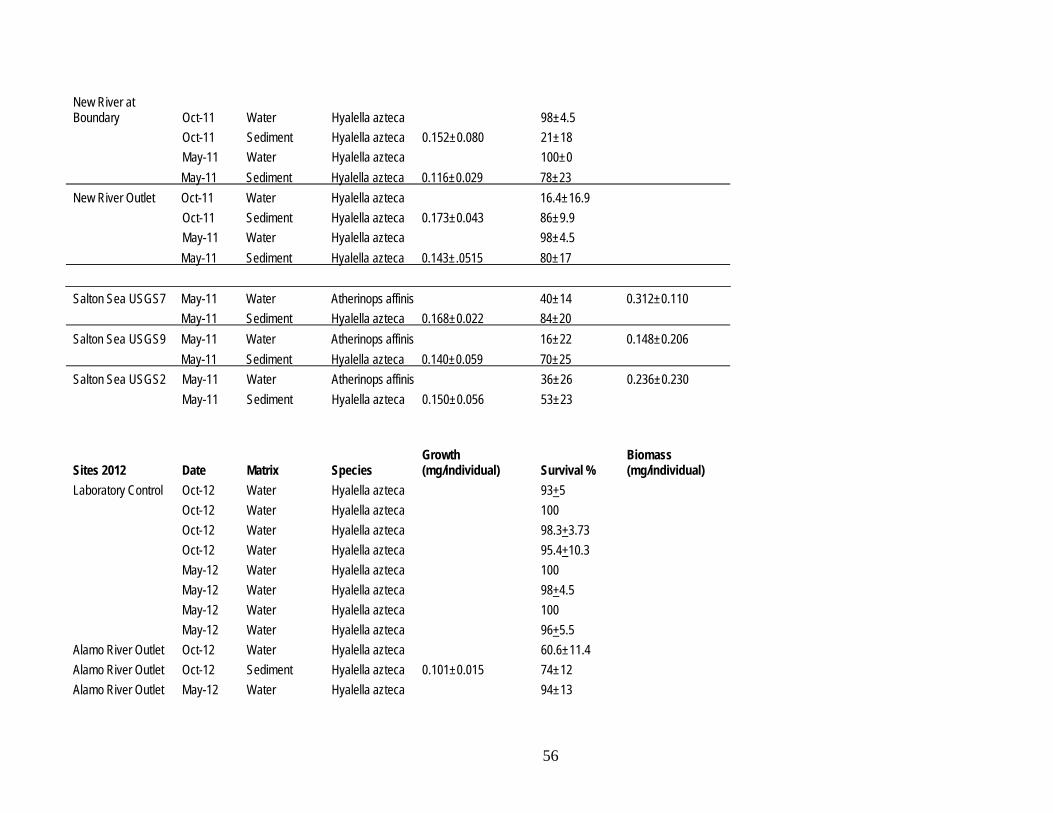
56
New River at Boundary Oct-11
Oct-11 May-11
Water Sediment Water
Hyalella azteca Hyalella azteca Hyalella azteca
0.152±0.080
98±4.5 21±18 100±0
May-11 Sediment Hyalella azteca 0.116±0.029 78±23 New River Outlet Oct-11 Water Hyalella azteca 16.4±16.9
Oct-11 Sediment Hyalella azteca 0.173±0.043 86±9.9 May-11 Water Hyalella azteca 98±4.5
May-11 Sediment Hyalella azteca 0.143±.0515 80±17
Salton Sea USGS7 May-11 Water Atherinops affinis 40±14 0.312±0.110 May-11 Sediment Hyalella azteca 0.168±0.022 84±20
Salton Sea USGS9 May-11 Water Atherinops affinis 16±22 0.148±0.206 May-11 Sediment Hyalella azteca 0.140±0.059 70±25
Salton Sea USGS2 May-11 Water Atherinops affinis 36±26 0.236±0.230 May-11 Sediment Hyalella azteca 0.150±0.056 53±23
Sites 2012
Date
Matrix
Species
Growth (mg/individual)
Survival %
Biomass (mg/individual)
Laboratory Control Oct-12 Water Hyalella azteca 93+5 Oct-12 Water Hyalella azteca 100 Oct-12 Water Hyalella azteca 98.3+3.73 Oct-12 Water Hyalella azteca 95.4+10.3 May-12 Water Hyalella azteca 100 May-12 Water Hyalella azteca 98+4.5 May-12 Water Hyalella azteca 100 May-12 Water Hyalella azteca 96+5.5 Alamo River Outlet Oct-12 Water Hyalella azteca 60.6±11.4 Alamo River Outlet Oct-12 Sediment Hyalella azteca 0.101±0.015 74±12 Alamo River Outlet May-12 Water Hyalella azteca 94±13
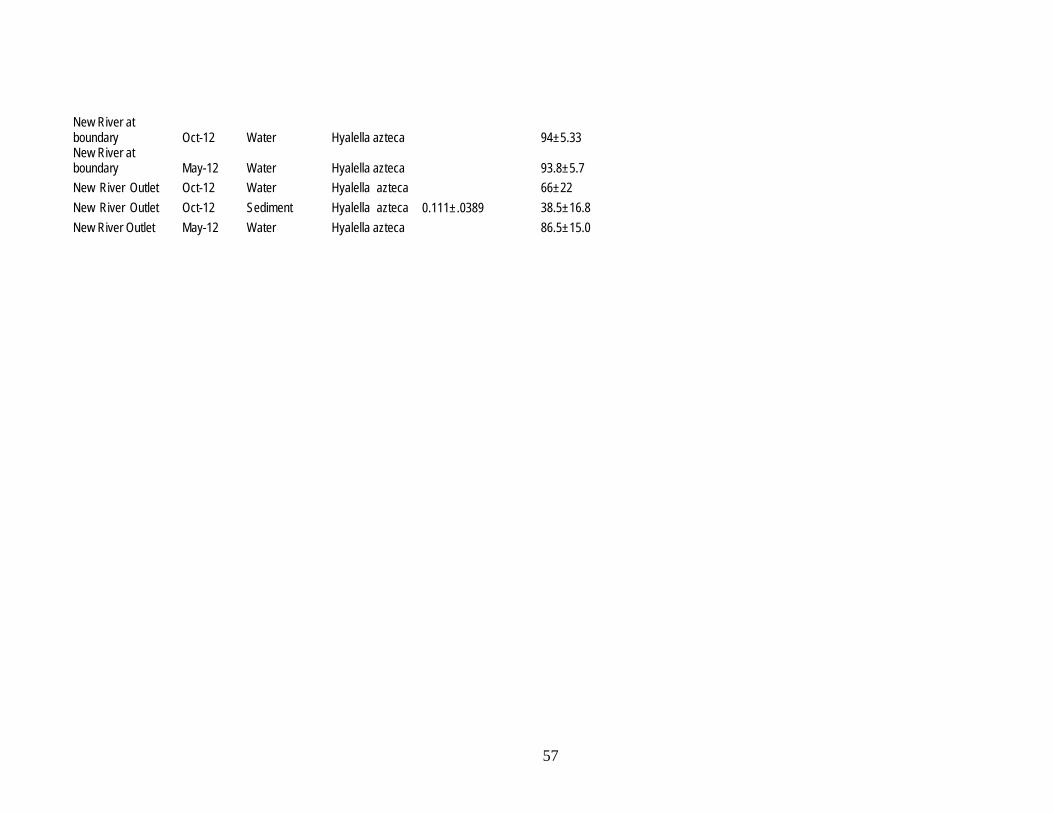
57
New River at boundary Oct-12 Water Hyalella azteca 94±5.33 New River at boundary New River Outlet New River Outlet New River Outlet
May-12 Oct-12 Oct-12 May-12
Water Water Sediment Water
Hyalella azteca Hyalella azteca Hyalella azteca Hyalella azteca
0.111±.0389
93.8±5.7 66±22 38.5±16.8 86.5±15.0
9.0 APPENDICES
58
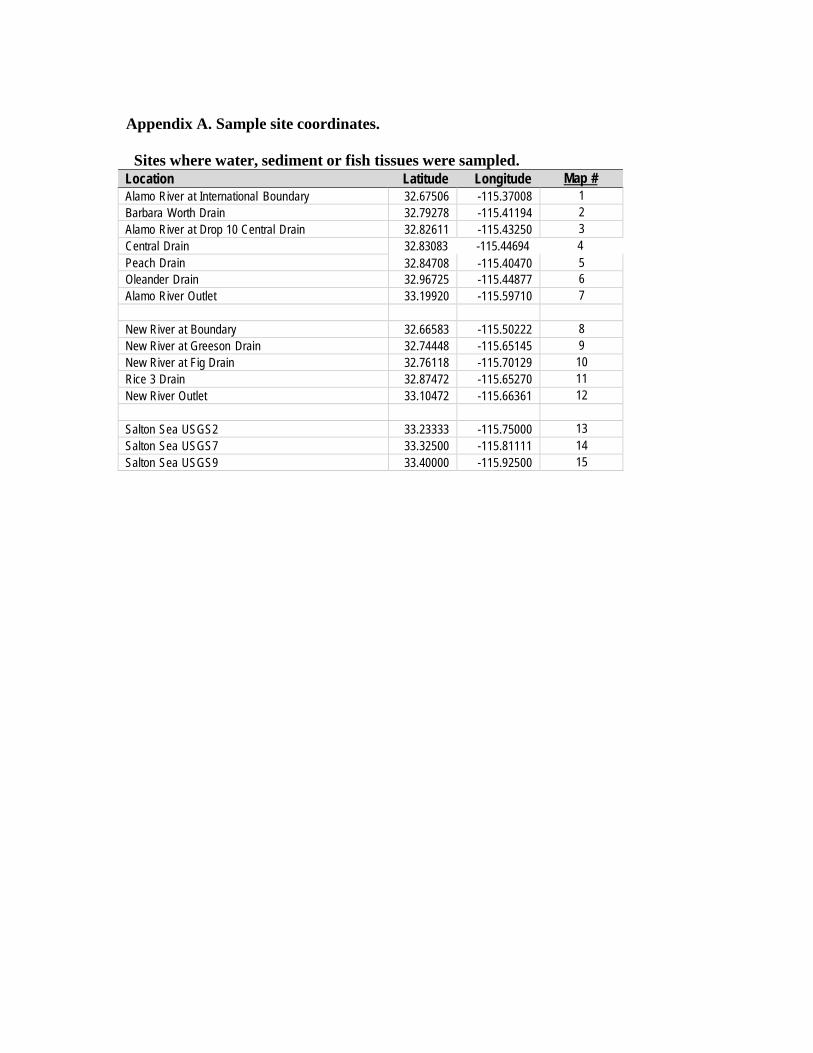
Appendix A. Sample site coordinates.
Sites where water, sediment or fish tissues were sampled.
Location Latitude Longitude Map # Alamo River at International Boundary 32.67506 -115.37008 1 Barbara Worth Drain 32.79278 -115.41194 2 Alamo River at Drop 10 Central Drain 32.82611 -115.43250 3 Central Drain 32.83083 -115.44694 4 Peach Drain 32.84708 -115.40470 5 Oleander Drain 32.96725 -115.44877 6 Alamo River Outlet 33.19920 -115.59710 7
New River at Boundary 32.66583 -115.50222 8 New River at Greeson Drain 32.74448 -115.65145 9 New River at Fig Drain 32.76118 -115.70129 10 Rice 3 Drain 32.87472 -115.65270 11 New River Outlet 33.10472 -115.66361 12
Salton Sea USGS2 33.23333 -115.75000 13 Salton Sea USGS7 33.32500 -115.81111 14 Salton Sea USGS9 33.40000 -115.92500 15
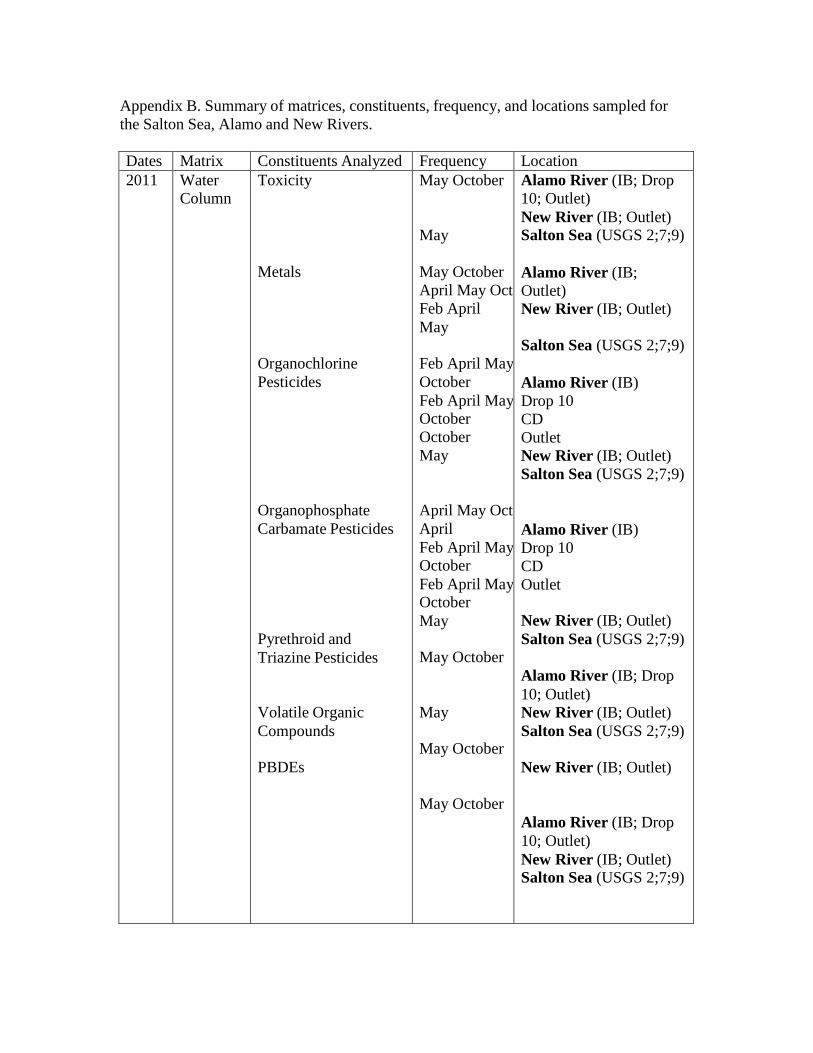
Appendix B. Summary of matrices, constituents, frequency, and locations sampled for the Salton Sea, Alamo and New Rivers.
Dates Matrix Constituents Analyzed Frequency Location 2011 Water
Column Toxicity
Metals
Organochlorine Pesticides
Organophosphate Carbamate Pesticides
Pyrethroid and Triazine Pesticides
Volatile Organic Compounds
PBDEs
May October May
May October April May Oct Feb April May
Feb April May October Feb April May October October May
April May Oct April Feb April May October Feb April May October May
May October
May
May October
May October
Alamo River (IB; Drop 10; Outlet) New River (IB; Outlet) Salton Sea (USGS 2;7;9)
Alamo River (IB; Outlet) New River (IB; Outlet)
Salton Sea (USGS 2;7;9)
Alamo River (IB) Drop 10 CD Outlet New River (IB; Outlet) Salton Sea (USGS 2;7;9)
Alamo River (IB) Drop 10 CD Outlet
New River (IB; Outlet) Salton Sea (USGS 2;7;9)
Alamo River (IB; Drop 10; Outlet) New River (IB; Outlet) Salton Sea (USGS 2;7;9)
New River (IB; Outlet)
Alamo River (IB; Drop 10; Outlet) New River (IB; Outlet) Salton Sea (USGS 2;7;9)
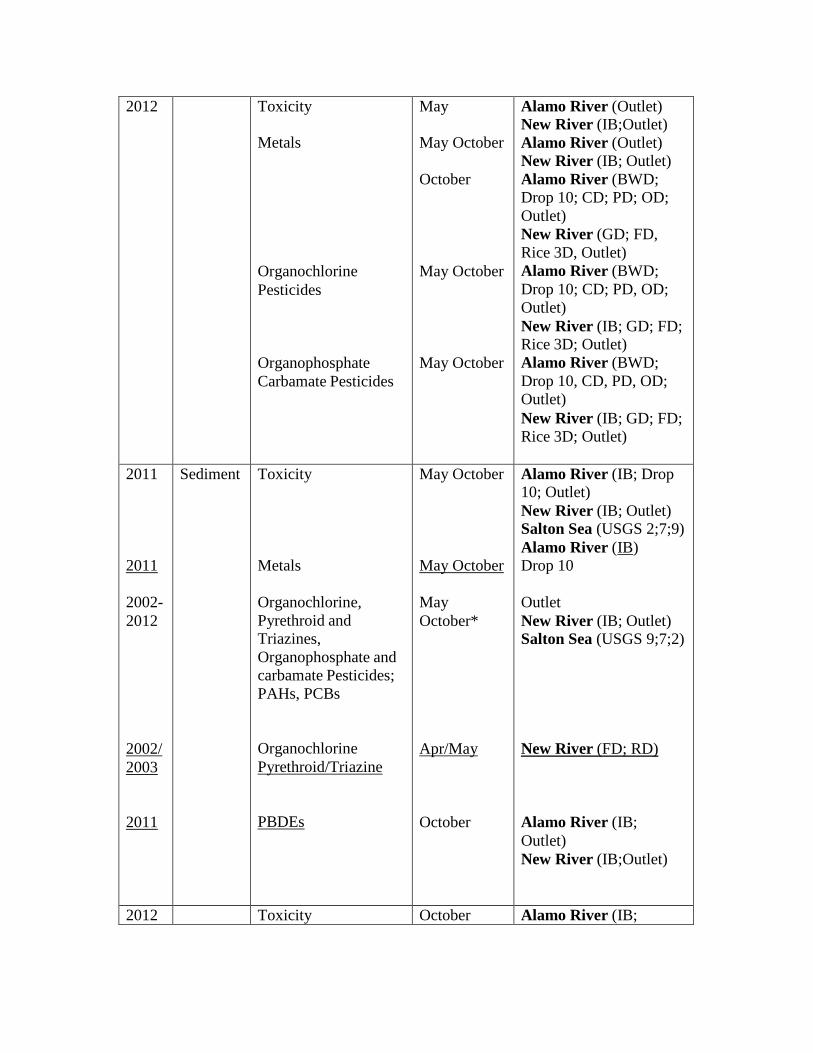
2012 Toxicity Metals
Organochlorine Pesticides
Organophosphate Carbamate Pesticides
May May October
October
May October
May October
Alamo River (Outlet) New River (IB;Outlet) Alamo River (Outlet) New River (IB; Outlet) Alamo River (BWD; Drop 10; CD; PD; OD; Outlet) New River (GD; FD, Rice 3D, Outlet) Alamo River (BWD; Drop 10; CD; PD, OD; Outlet) New River (IB; GD; FD; Rice 3D; Outlet) Alamo River (BWD; Drop 10, CD, PD, OD; Outlet) New River (IB; GD; FD; Rice 3D; Outlet)
2011
2011
2002- 2012
2002/ 2003
2011
Sediment Toxicity
Metals
Organochlorine, Pyrethroid and Triazines, Organophosphate and carbamate Pesticides; PAHs, PCBs
Organochlorine Pyrethroid/Triazine
PBDEs
May October
May October
May October*
Apr/May
October
Alamo River (IB; Drop 10; Outlet) New River (IB; Outlet) Salton Sea (USGS 2;7;9) Alamo River (IB) Drop 10
Outlet New River (IB; Outlet) Salton Sea (USGS 9;7;2)
New River (FD; RD)
Alamo River (IB; Outlet) New River (IB;Outlet)
2012 Toxicity October Alamo River (IB;
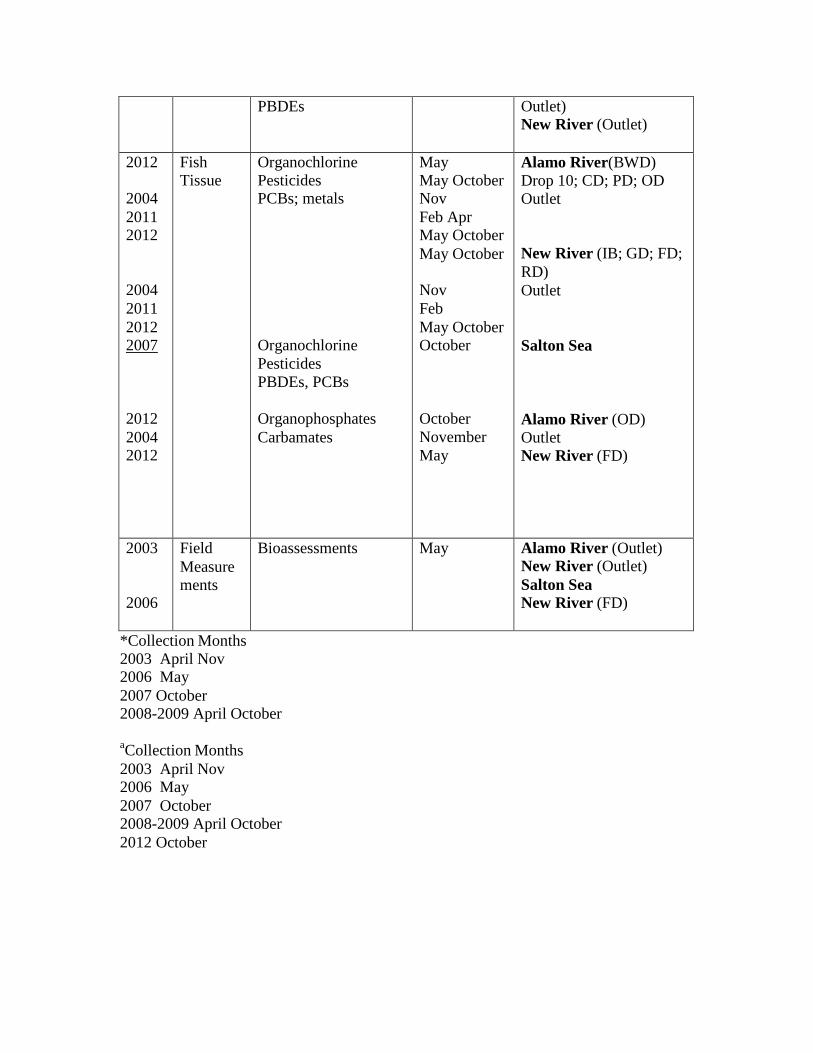
PBDEs Outlet) New River (Outlet)
2012 2004 2011 2012
2004 2011 2012 2007
2012 2004 2012
Fish Tissue
Organochlorine Pesticides PCBs; metals
Organochlorine Pesticides PBDEs, PCBs
Organophosphates Carbamates
May May October Nov Feb Apr May October May October
Nov Feb May October October
October November May
Alamo River(BWD) Drop 10; CD; PD; OD Outlet
New River (IB; GD; FD; RD) Outlet
Salton Sea
Alamo River (OD) Outlet New River (FD)
2003 2006
Field Measure ments
Bioassessments May Alamo River (Outlet) New River (Outlet) Salton Sea New River (FD)
*Collection Months 2003 April Nov 2006 May 2007 October 2008-2009 April October
aCollection Months 2003 April Nov 2006 May 2007 October 2008-2009 April October 2012 October
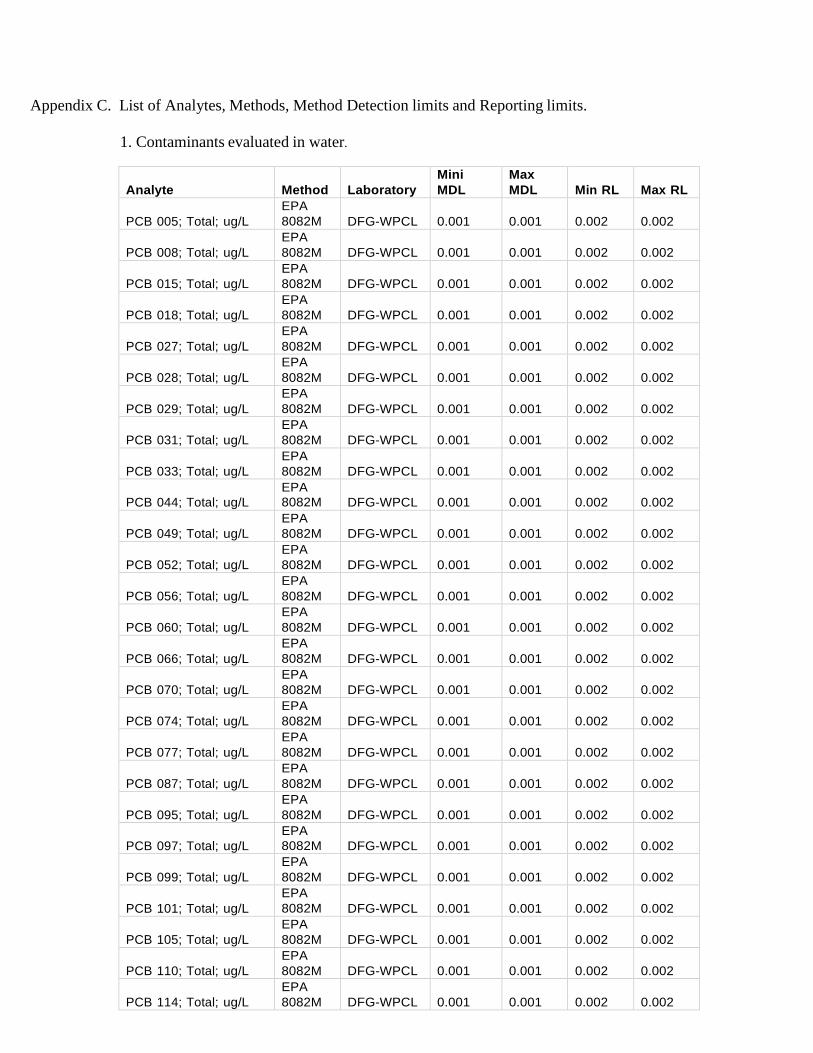
Appendix C. List of Analytes, Methods, Method Detection limits and Reporting limits.
1. Contaminants evaluated in water.
Analyte
Method
Laboratory
Mini MDL
Max MDL
Min RL
Max RL
PCB 005; Total; ug/L
EPA 8082M
DFG-WPCL
0.001
0.001
0.002
0.002
PCB 008; Total; ug/L
EPA 8082M
DFG-WPCL
0.001
0.001
0.002
0.002
PCB 015; Total; ug/L
EPA 8082M
DFG-WPCL
0.001
0.001
0.002
0.002
PCB 018; Total; ug/L
EPA 8082M
DFG-WPCL
0.001
0.001
0.002
0.002
PCB 027; Total; ug/L
EPA 8082M
DFG-WPCL
0.001
0.001
0.002
0.002
PCB 028; Total; ug/L
EPA 8082M
DFG-WPCL
0.001
0.001
0.002
0.002
PCB 029; Total; ug/L
EPA 8082M
DFG-WPCL
0.001
0.001
0.002
0.002
PCB 031; Total; ug/L
EPA 8082M
DFG-WPCL
0.001
0.001
0.002
0.002
PCB 033; Total; ug/L
EPA 8082M
DFG-WPCL
0.001
0.001
0.002
0.002
PCB 044; Total; ug/L
EPA 8082M
DFG-WPCL
0.001
0.001
0.002
0.002
PCB 049; Total; ug/L
EPA 8082M
DFG-WPCL
0.001
0.001
0.002
0.002
PCB 052; Total; ug/L
EPA 8082M
DFG-WPCL
0.001
0.001
0.002
0.002
PCB 056; Total; ug/L
EPA 8082M
DFG-WPCL
0.001
0.001
0.002
0.002
PCB 060; Total; ug/L
EPA 8082M
DFG-WPCL
0.001
0.001
0.002
0.002
PCB 066; Total; ug/L
EPA 8082M
DFG-WPCL
0.001
0.001
0.002
0.002
PCB 070; Total; ug/L
EPA 8082M
DFG-WPCL
0.001
0.001
0.002
0.002
PCB 074; Total; ug/L
EPA 8082M
DFG-WPCL
0.001
0.001
0.002
0.002
PCB 077; Total; ug/L
EPA 8082M
DFG-WPCL
0.001
0.001
0.002
0.002
PCB 087; Total; ug/L
EPA 8082M
DFG-WPCL
0.001
0.001
0.002
0.002
PCB 095; Total; ug/L
EPA 8082M
DFG-WPCL
0.001
0.001
0.002
0.002
PCB 097; Total; ug/L
EPA 8082M
DFG-WPCL
0.001
0.001
0.002
0.002
PCB 099; Total; ug/L
EPA 8082M
DFG-WPCL
0.001
0.001
0.002
0.002
PCB 101; Total; ug/L
EPA 8082M
DFG-WPCL
0.001
0.001
0.002
0.002
PCB 105; Total; ug/L
EPA 8082M
DFG-WPCL
0.001
0.001
0.002
0.002
PCB 110; Total; ug/L
EPA 8082M
DFG-WPCL
0.001
0.001
0.002
0.002
PCB 114; Total; ug/L
EPA 8082M
DFG-WPCL
0.001
0.001
0.002
0.002
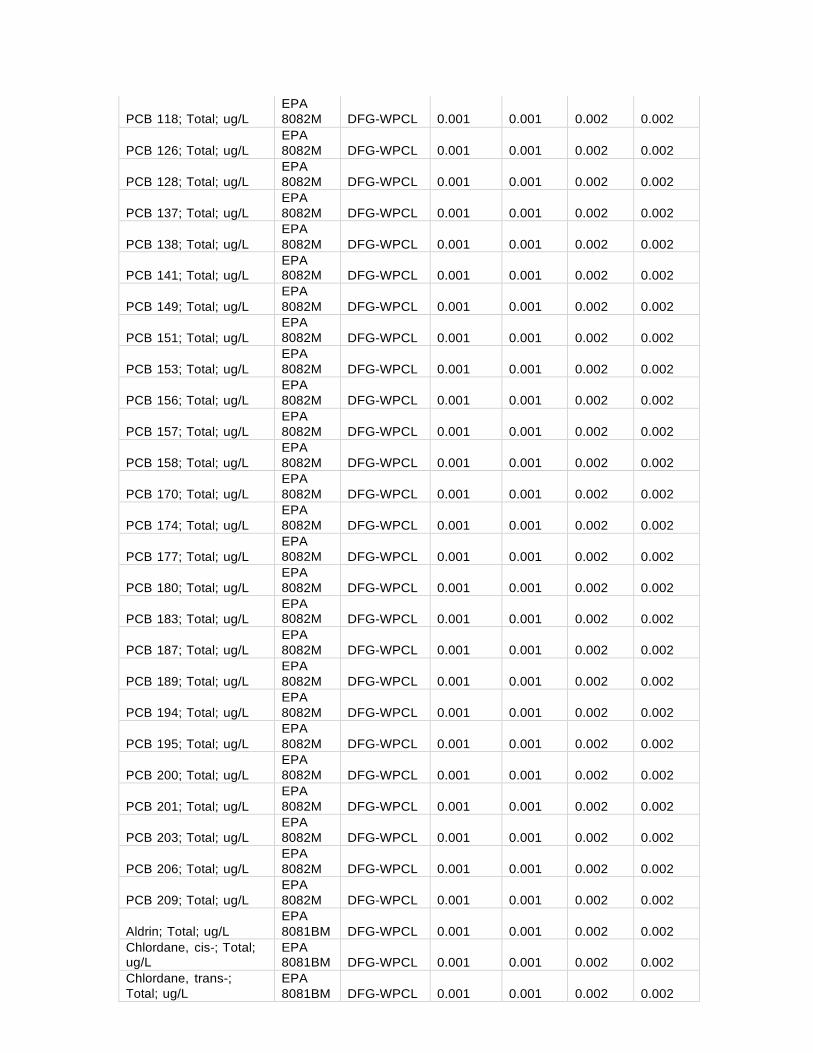
PCB 118; Total; ug/L
EPA 8082M
DFG-WPCL
0.001
0.001
0.002
0.002
PCB 126; Total; ug/L
EPA 8082M
DFG-WPCL
0.001
0.001
0.002
0.002
PCB 128; Total; ug/L
EPA 8082M
DFG-WPCL
0.001
0.001
0.002
0.002
PCB 137; Total; ug/L
EPA 8082M
DFG-WPCL
0.001
0.001
0.002
0.002
PCB 138; Total; ug/L
EPA 8082M
DFG-WPCL
0.001
0.001
0.002
0.002
PCB 141; Total; ug/L
EPA 8082M
DFG-WPCL
0.001
0.001
0.002
0.002
PCB 149; Total; ug/L
EPA 8082M
DFG-WPCL
0.001
0.001
0.002
0.002
PCB 151; Total; ug/L
EPA 8082M
DFG-WPCL
0.001
0.001
0.002
0.002
PCB 153; Total; ug/L
EPA 8082M
DFG-WPCL
0.001
0.001
0.002
0.002
PCB 156; Total; ug/L
EPA 8082M
DFG-WPCL
0.001
0.001
0.002
0.002
PCB 157; Total; ug/L
EPA 8082M
DFG-WPCL
0.001
0.001
0.002
0.002
PCB 158; Total; ug/L
EPA 8082M
DFG-WPCL
0.001
0.001
0.002
0.002
PCB 170; Total; ug/L
EPA 8082M
DFG-WPCL
0.001
0.001
0.002
0.002
PCB 174; Total; ug/L
EPA 8082M
DFG-WPCL
0.001
0.001
0.002
0.002
PCB 177; Total; ug/L
EPA 8082M
DFG-WPCL
0.001
0.001
0.002
0.002
PCB 180; Total; ug/L
EPA 8082M
DFG-WPCL
0.001
0.001
0.002
0.002
PCB 183; Total; ug/L
EPA 8082M
DFG-WPCL
0.001
0.001
0.002
0.002
PCB 187; Total; ug/L
EPA 8082M
DFG-WPCL
0.001
0.001
0.002
0.002
PCB 189; Total; ug/L
EPA 8082M
DFG-WPCL
0.001
0.001
0.002
0.002
PCB 194; Total; ug/L
EPA 8082M
DFG-WPCL
0.001
0.001
0.002
0.002
PCB 195; Total; ug/L
EPA 8082M
DFG-WPCL
0.001
0.001
0.002
0.002
PCB 200; Total; ug/L
EPA 8082M
DFG-WPCL
0.001
0.001
0.002
0.002
PCB 201; Total; ug/L
EPA 8082M
DFG-WPCL
0.001
0.001
0.002
0.002
PCB 203; Total; ug/L
EPA 8082M
DFG-WPCL
0.001
0.001
0.002
0.002
PCB 206; Total; ug/L
EPA 8082M
DFG-WPCL
0.001
0.001
0.002
0.002
PCB 209; Total; ug/L
EPA 8082M
DFG-WPCL
0.001
0.001
0.002
0.002
Aldrin; Total; ug/L
EPA 8081BM
DFG-WPCL
0.001
0.001
0.002
0.002
Chlordane, cis-; Total; ug/L
EPA 8081BM
DFG-WPCL
0.001
0.001
0.002
0.002
Chlordane, trans-; Total; ug/L
EPA 8081BM
DFG-WPCL
0.001
0.001
0.002
0.002
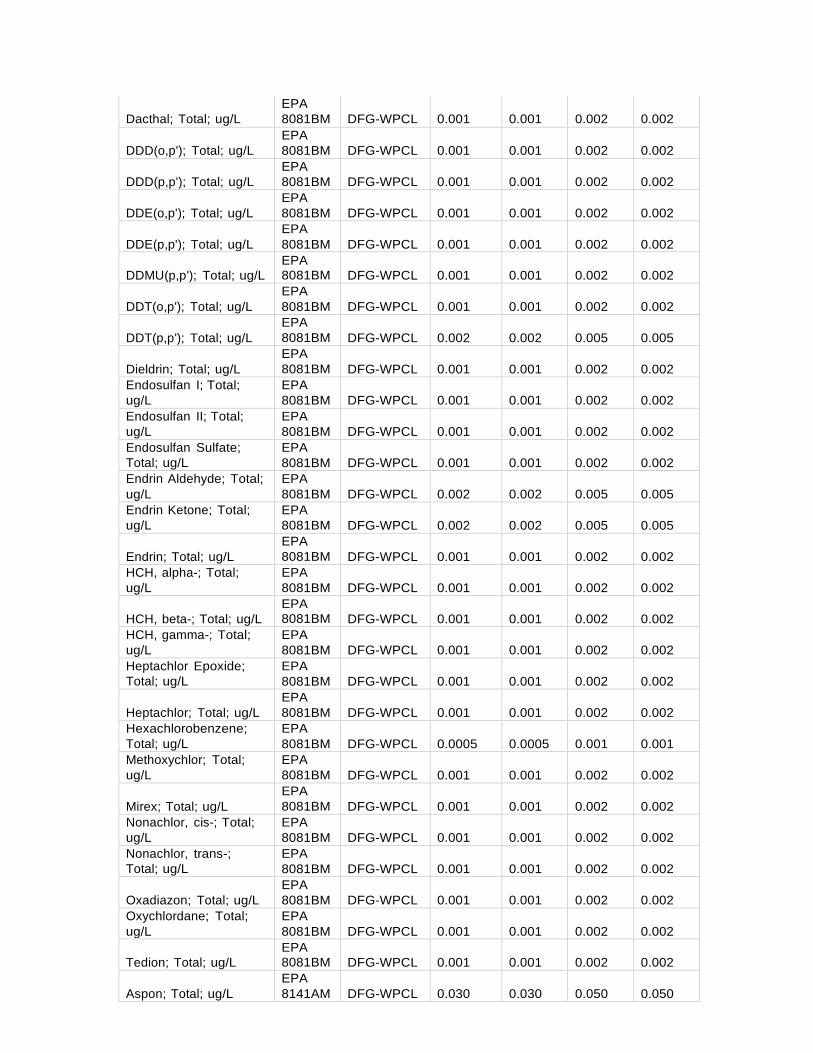
Dacthal; Total; ug/L
EPA 8081BM
DFG-WPCL
0.001
0.001
0.002
0.002
DDD(o,p'); Total; ug/L
EPA 8081BM
DFG-WPCL
0.001
0.001
0.002
0.002
DDD(p,p'); Total; ug/L
EPA 8081BM
DFG-WPCL
0.001
0.001
0.002
0.002
DDE(o,p'); Total; ug/L
EPA 8081BM
DFG-WPCL
0.001
0.001
0.002
0.002
DDE(p,p'); Total; ug/L
EPA 8081BM
DFG-WPCL
0.001
0.001
0.002
0.002
DDMU(p,p'); Total; ug/L
EPA 8081BM
DFG-WPCL
0.001
0.001
0.002
0.002
DDT(o,p'); Total; ug/L
EPA 8081BM
DFG-WPCL
0.001
0.001
0.002
0.002
DDT(p,p'); Total; ug/L
EPA 8081BM
DFG-WPCL
0.002
0.002
0.005
0.005
Dieldrin; Total; ug/L
EPA 8081BM
DFG-WPCL
0.001
0.001
0.002
0.002
Endosulfan I; Total; ug/L
EPA 8081BM
DFG-WPCL
0.001
0.001
0.002
0.002
Endosulfan II; Total; ug/L
EPA 8081BM
DFG-WPCL
0.001
0.001
0.002
0.002
Endosulfan Sulfate; Total; ug/L
EPA 8081BM
DFG-WPCL
0.001
0.001
0.002
0.002
Endrin Aldehyde; Total; ug/L
EPA 8081BM
DFG-WPCL
0.002
0.002
0.005
0.005
Endrin Ketone; Total; ug/L
EPA 8081BM
DFG-WPCL
0.002
0.002
0.005
0.005
Endrin; Total; ug/L
EPA 8081BM
DFG-WPCL
0.001
0.001
0.002
0.002
HCH, alpha-; Total; ug/L
EPA 8081BM
DFG-WPCL
0.001
0.001
0.002
0.002
HCH, beta-; Total; ug/L
EPA 8081BM
DFG-WPCL
0.001
0.001
0.002
0.002
HCH, gamma-; Total; ug/L
EPA 8081BM
DFG-WPCL
0.001
0.001
0.002
0.002
Heptachlor Epoxide; Total; ug/L
EPA 8081BM
DFG-WPCL
0.001
0.001
0.002
0.002
Heptachlor; Total; ug/L
EPA 8081BM
DFG-WPCL
0.001
0.001
0.002
0.002
Hexachlorobenzene; Total; ug/L
EPA 8081BM
DFG-WPCL
0.0005
0.0005
0.001
0.001
Methoxychlor; Total; ug/L
EPA 8081BM
DFG-WPCL
0.001
0.001
0.002
0.002
Mirex; Total; ug/L
EPA 8081BM
DFG-WPCL
0.001
0.001
0.002
0.002
Nonachlor, cis-; Total; ug/L
EPA 8081BM
DFG-WPCL
0.001
0.001
0.002
0.002
Nonachlor, trans-; Total; ug/L
EPA 8081BM
DFG-WPCL
0.001
0.001
0.002
0.002
Oxadiazon; Total; ug/L
EPA 8081BM
DFG-WPCL
0.001
0.001
0.002
0.002
Oxychlordane; Total; ug/L
EPA 8081BM
DFG-WPCL
0.001
0.001
0.002
0.002
Tedion; Total; ug/L
EPA 8081BM
DFG-WPCL
0.001
0.001
0.002
0.002
Aspon; Total; ug/L
EPA 8141AM
DFG-WPCL
0.030
0.030
0.050
0.050
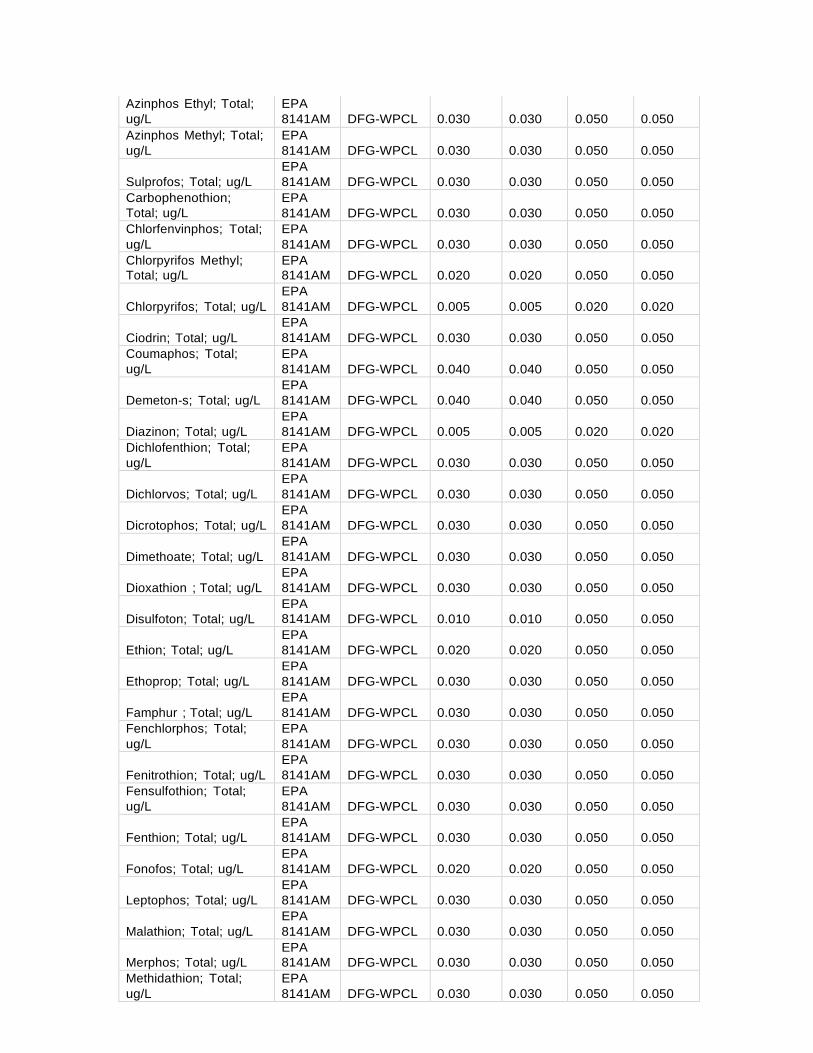
Azinphos Ethyl; Total; ug/L
EPA 8141AM
DFG-WPCL
0.030
0.030
0.050
0.050
Azinphos Methyl; Total; ug/L
EPA 8141AM
DFG-WPCL
0.030
0.030
0.050
0.050
Sulprofos; Total; ug/L
EPA 8141AM
DFG-WPCL
0.030
0.030
0.050
0.050
Carbophenothion; Total; ug/L
EPA 8141AM
DFG-WPCL
0.030
0.030
0.050
0.050
Chlorfenvinphos; Total; ug/L
EPA 8141AM
DFG-WPCL
0.030
0.030
0.050
0.050
Chlorpyrifos Methyl; Total; ug/L
EPA 8141AM
DFG-WPCL
0.020
0.020
0.050
0.050
Chlorpyrifos; Total; ug/L
EPA 8141AM
DFG-WPCL
0.005
0.005
0.020
0.020
Ciodrin; Total; ug/L
EPA 8141AM
DFG-WPCL
0.030
0.030
0.050
0.050
Coumaphos; Total; ug/L
EPA 8141AM
DFG-WPCL
0.040
0.040
0.050
0.050
Demeton-s; Total; ug/L
EPA 8141AM
DFG-WPCL
0.040
0.040
0.050
0.050
Diazinon; Total; ug/L
EPA 8141AM
DFG-WPCL
0.005
0.005
0.020
0.020
Dichlofenthion; Total; ug/L
EPA 8141AM
DFG-WPCL
0.030
0.030
0.050
0.050
Dichlorvos; Total; ug/L
EPA 8141AM
DFG-WPCL
0.030
0.030
0.050
0.050
Dicrotophos; Total; ug/L
EPA 8141AM
DFG-WPCL
0.030
0.030
0.050
0.050
Dimethoate; Total; ug/L
EPA 8141AM
DFG-WPCL
0.030
0.030
0.050
0.050
Dioxathion ; Total; ug/L
EPA 8141AM
DFG-WPCL
0.030
0.030
0.050
0.050
Disulfoton; Total; ug/L
EPA 8141AM
DFG-WPCL
0.010
0.010
0.050
0.050
Ethion; Total; ug/L
EPA 8141AM
DFG-WPCL
0.020
0.020
0.050
0.050
Ethoprop; Total; ug/L
EPA 8141AM
DFG-WPCL
0.030
0.030
0.050
0.050
Famphur ; Total; ug/L
EPA 8141AM
DFG-WPCL
0.030
0.030
0.050
0.050
Fenchlorphos; Total; ug/L
EPA 8141AM
DFG-WPCL
0.030
0.030
0.050
0.050
Fenitrothion; Total; ug/L
EPA 8141AM
DFG-WPCL
0.030
0.030
0.050
0.050
Fensulfothion; Total; ug/L
EPA 8141AM
DFG-WPCL
0.030
0.030
0.050
0.050
Fenthion; Total; ug/L
EPA 8141AM
DFG-WPCL
0.030
0.030
0.050
0.050
Fonofos; Total; ug/L
EPA 8141AM
DFG-WPCL
0.020
0.020
0.050
0.050
Leptophos; Total; ug/L
EPA 8141AM
DFG-WPCL
0.030
0.030
0.050
0.050
Malathion; Total; ug/L
EPA 8141AM
DFG-WPCL
0.030
0.030
0.050
0.050
Merphos; Total; ug/L
EPA 8141AM
DFG-WPCL
0.030
0.030
0.050
0.050
Methidathion; Total; ug/L
EPA 8141AM
DFG-WPCL
0.030
0.030
0.050
0.050
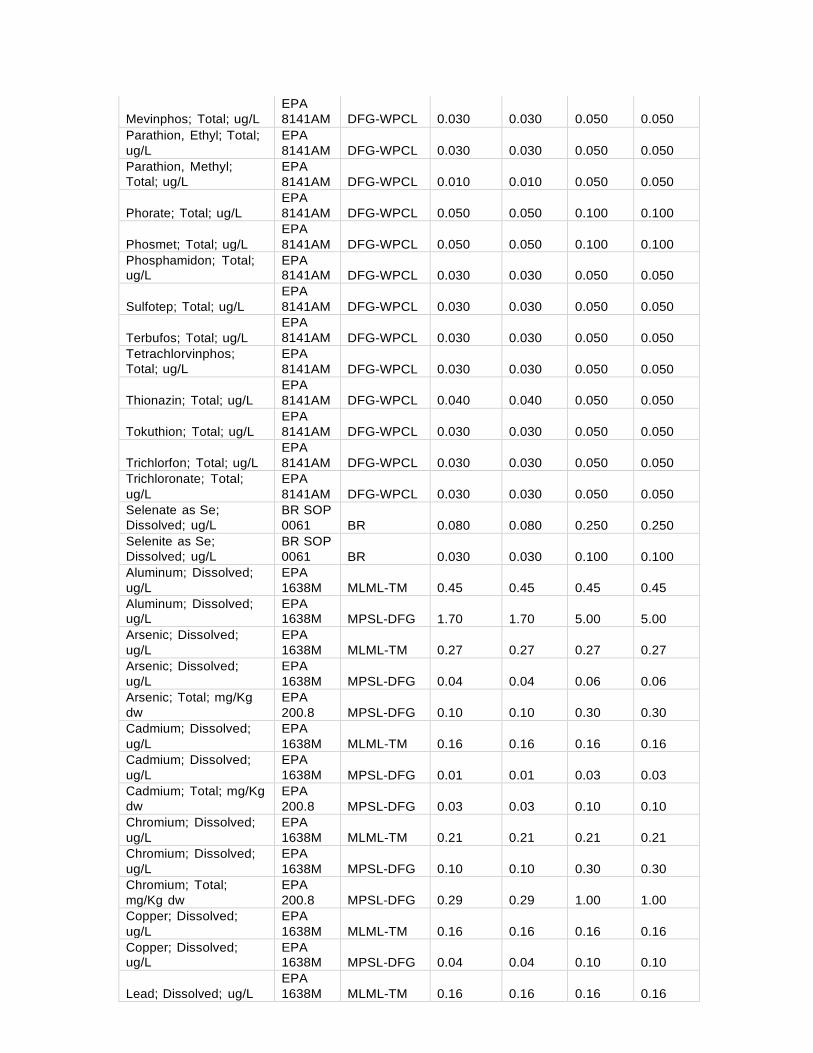
Mevinphos; Total; ug/L
EPA 8141AM
DFG-WPCL
0.030
0.030
0.050
0.050
Parathion, Ethyl; Total; ug/L
EPA 8141AM
DFG-WPCL
0.030
0.030
0.050
0.050
Parathion, Methyl; Total; ug/L
EPA 8141AM
DFG-WPCL
0.010
0.010
0.050
0.050
Phorate; Total; ug/L
EPA 8141AM
DFG-WPCL
0.050
0.050
0.100
0.100
Phosmet; Total; ug/L
EPA 8141AM
DFG-WPCL
0.050
0.050
0.100
0.100
Phosphamidon; Total; ug/L
EPA 8141AM
DFG-WPCL
0.030
0.030
0.050
0.050
Sulfotep; Total; ug/L
EPA 8141AM
DFG-WPCL
0.030
0.030
0.050
0.050
Terbufos; Total; ug/L
EPA 8141AM
DFG-WPCL
0.030
0.030
0.050
0.050
Tetrachlorvinphos; Total; ug/L
EPA 8141AM
DFG-WPCL
0.030
0.030
0.050
0.050
Thionazin; Total; ug/L
EPA 8141AM
DFG-WPCL
0.040
0.040
0.050
0.050
Tokuthion; Total; ug/L
EPA 8141AM
DFG-WPCL
0.030
0.030
0.050
0.050
Trichlorfon; Total; ug/L
EPA 8141AM
DFG-WPCL
0.030
0.030
0.050
0.050
Trichloronate; Total; ug/L
EPA 8141AM
DFG-WPCL
0.030
0.030
0.050
0.050
Selenate as Se; Dissolved; ug/L
BR SOP 0061
BR
0.080
0.080
0.250
0.250
Selenite as Se; Dissolved; ug/L
BR SOP 0061
BR
0.030
0.030
0.100
0.100
Aluminum; Dissolved; ug/L
EPA 1638M
MLML-TM
0.45
0.45
0.45
0.45
Aluminum; Dissolved; ug/L
EPA 1638M
MPSL-DFG
1.70
1.70
5.00
5.00
Arsenic; Dissolved; ug/L
EPA 1638M
MLML-TM
0.27
0.27
0.27
0.27
Arsenic; Dissolved; ug/L
EPA 1638M
MPSL-DFG
0.04
0.04
0.06
0.06
Arsenic; Total; mg/Kg dw
EPA 200.8
MPSL-DFG
0.10
0.10
0.30
0.30
Cadmium; Dissolved; ug/L
EPA 1638M
MLML-TM
0.16
0.16
0.16
0.16
Cadmium; Dissolved; ug/L
EPA 1638M
MPSL-DFG
0.01
0.01
0.03
0.03
Cadmium; Total; mg/Kg dw
EPA 200.8
MPSL-DFG
0.03
0.03
0.10
0.10
Chromium; Dissolved; ug/L
EPA 1638M
MLML-TM
0.21
0.21
0.21
0.21
Chromium; Dissolved; ug/L
EPA 1638M
MPSL-DFG
0.10
0.10
0.30
0.30
Chromium; Total; mg/Kg dw
EPA 200.8
MPSL-DFG
0.29
0.29
1.00
1.00
Copper; Dissolved; ug/L
EPA 1638M
MLML-TM
0.16
0.16
0.16
0.16
Copper; Dissolved; ug/L
EPA 1638M
MPSL-DFG
0.04
0.04
0.10
0.10
Lead; Dissolved; ug/L
EPA 1638M
MLML-TM
0.16
0.16
0.16
0.16
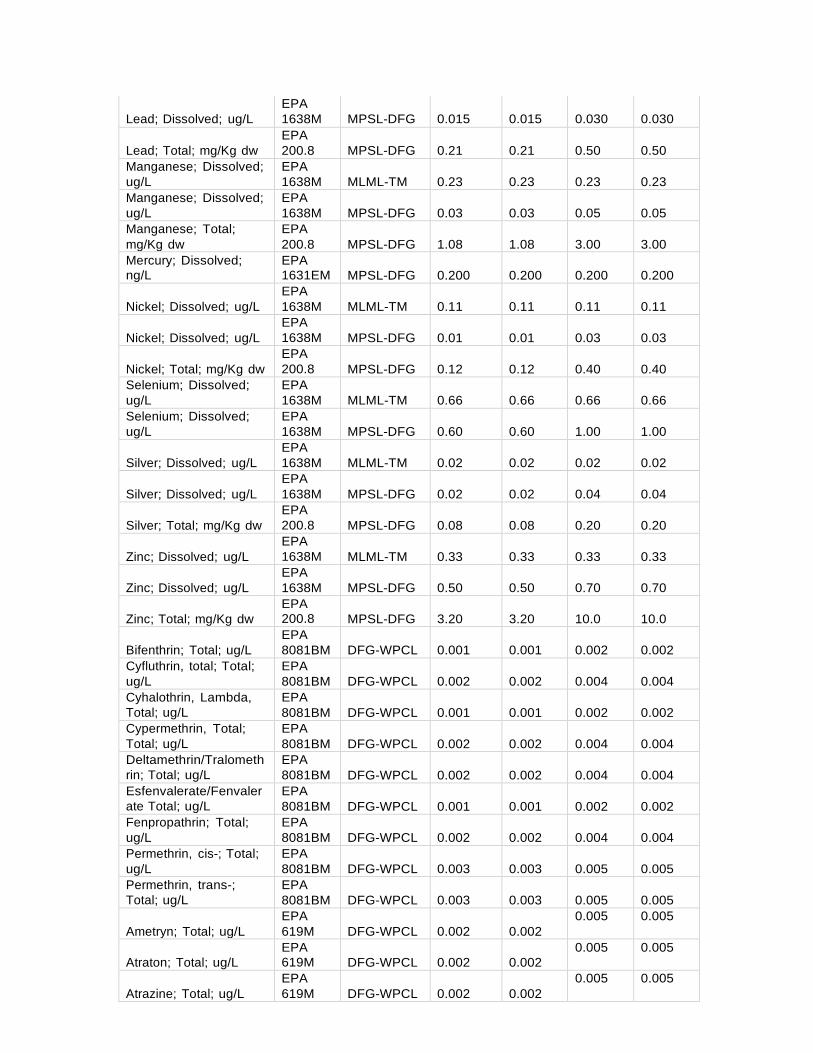
Lead; Dissolved; ug/L
EPA 1638M
MPSL-DFG
0.015
0.015
0.030
0.030
Lead; Total; mg/Kg dw
EPA 200.8
MPSL-DFG
0.21
0.21
0.50
0.50
Manganese; Dissolved; ug/L
EPA 1638M
MLML-TM
0.23
0.23
0.23
0.23
Manganese; Dissolved; ug/L
EPA 1638M
MPSL-DFG
0.03
0.03
0.05
0.05
Manganese; Total; mg/Kg dw
EPA 200.8
MPSL-DFG
1.08
1.08
3.00
3.00
Mercury; Dissolved; ng/L
EPA 1631EM
MPSL-DFG
0.200
0.200
0.200
0.200
Nickel; Dissolved; ug/L
EPA 1638M
MLML-TM
0.11
0.11
0.11
0.11
Nickel; Dissolved; ug/L
EPA 1638M
MPSL-DFG
0.01
0.01
0.03
0.03
Nickel; Total; mg/Kg dw
EPA 200.8
MPSL-DFG
0.12
0.12
0.40
0.40
Selenium; Dissolved; ug/L
EPA 1638M
MLML-TM
0.66
0.66
0.66
0.66
Selenium; Dissolved; ug/L
EPA 1638M
MPSL-DFG
0.60
0.60
1.00
1.00
Silver; Dissolved; ug/L
EPA 1638M
MLML-TM
0.02
0.02
0.02
0.02
Silver; Dissolved; ug/L
EPA 1638M
MPSL-DFG
0.02
0.02
0.04
0.04
Silver; Total; mg/Kg dw
EPA 200.8
MPSL-DFG
0.08
0.08
0.20
0.20
Zinc; Dissolved; ug/L
EPA 1638M
MLML-TM
0.33
0.33
0.33
0.33
Zinc; Dissolved; ug/L
EPA 1638M
MPSL-DFG
0.50
0.50
0.70
0.70
Zinc; Total; mg/Kg dw
EPA 200.8
MPSL-DFG
3.20
3.20
10.0
10.0
Bifenthrin; Total; ug/L
EPA 8081BM
DFG-WPCL
0.001
0.001
0.002
0.002
Cyfluthrin, total; Total; ug/L
EPA 8081BM
DFG-WPCL
0.002
0.002
0.004
0.004
Cyhalothrin, Lambda, Total; ug/L
EPA 8081BM
DFG-WPCL
0.001
0.001
0.002
0.002
Cypermethrin, Total; Total; ug/L
EPA 8081BM
DFG-WPCL
0.002
0.002
0.004
0.004
Deltamethrin/Tralometh rin; Total; ug/L
EPA 8081BM
DFG-WPCL
0.002
0.002
0.004
0.004
Esfenvalerate/Fenvaler ate Total; ug/L
EPA 8081BM
DFG-WPCL
0.001
0.001
0.002
0.002
Fenpropathrin; Total; ug/L
EPA 8081BM
DFG-WPCL
0.002
0.002
0.004
0.004
Permethrin, cis-; Total; ug/L
EPA 8081BM
DFG-WPCL
0.003
0.003
0.005
0.005
Permethrin, trans-; Total; ug/L
EPA 8081BM
DFG-WPCL
0.003
0.003
0.005
0.005
Ametryn; Total; ug/L
EPA 619M
DFG-WPCL
0.002
0.002
0.005 0.005
Atraton; Total; ug/L
EPA 619M
DFG-WPCL
0.002
0.002
0.005 0.005
Atrazine; Total; ug/L
EPA 619M
DFG-WPCL
0.002
0.002
0.005 0.005
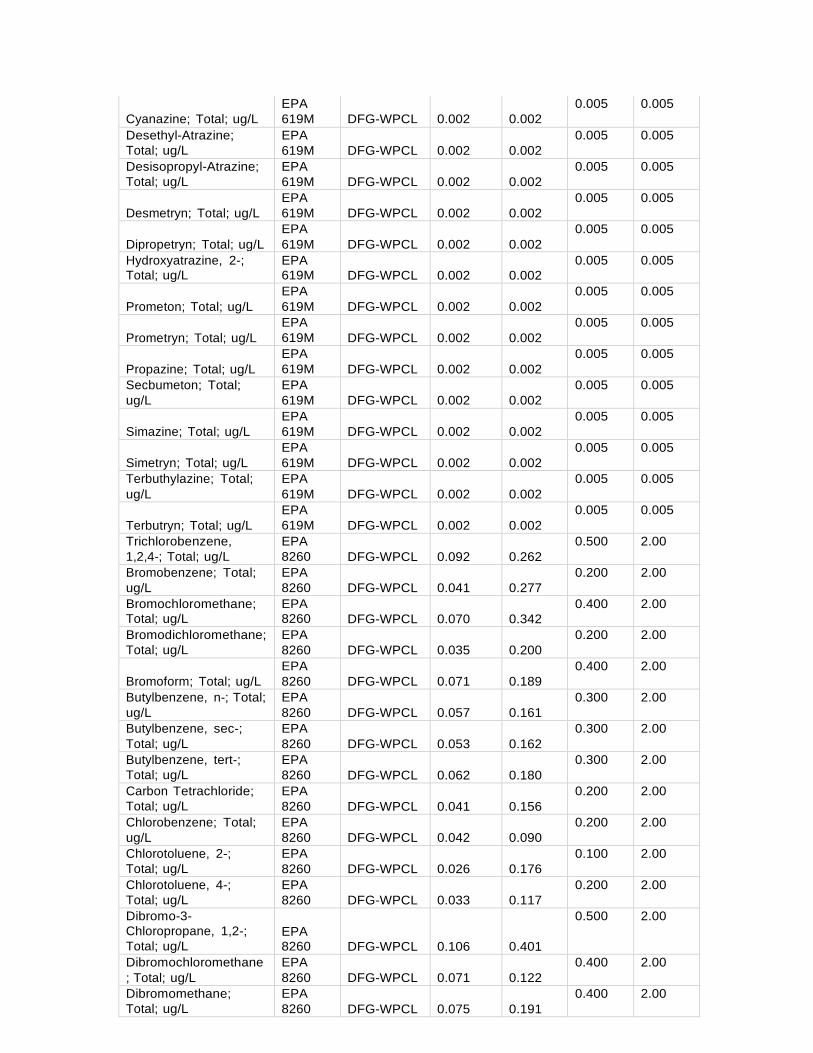
Cyanazine; Total; ug/L
EPA 619M
DFG-WPCL
0.002
0.002
0.005 0.005
Desethyl-Atrazine; Total; ug/L
EPA 619M
DFG-WPCL
0.002
0.002
0.005 0.005
Desisopropyl-Atrazine; Total; ug/L
EPA 619M
DFG-WPCL
0.002
0.002
0.005 0.005
Desmetryn; Total; ug/L
EPA 619M
DFG-WPCL
0.002
0.002
0.005 0.005
Dipropetryn; Total; ug/L
EPA 619M
DFG-WPCL
0.002
0.002
0.005 0.005
Hydroxyatrazine, 2-; Total; ug/L
EPA 619M
DFG-WPCL
0.002
0.002
0.005 0.005
Prometon; Total; ug/L
EPA 619M
DFG-WPCL
0.002
0.002
0.005 0.005
Prometryn; Total; ug/L
EPA 619M
DFG-WPCL
0.002
0.002
0.005 0.005
Propazine; Total; ug/L
EPA 619M
DFG-WPCL
0.002
0.002
0.005 0.005
Secbumeton; Total; ug/L
EPA 619M
DFG-WPCL
0.002
0.002
0.005 0.005
Simazine; Total; ug/L
EPA 619M
DFG-WPCL
0.002
0.002
0.005 0.005
Simetryn; Total; ug/L
EPA 619M
DFG-WPCL
0.002
0.002
0.005 0.005
Terbuthylazine; Total; ug/L
EPA 619M
DFG-WPCL
0.002
0.002
0.005 0.005
Terbutryn; Total; ug/L
EPA 619M
DFG-WPCL
0.002
0.002
0.005 0.005
Trichlorobenzene, 1,2,4-; Total; ug/L
EPA 8260
DFG-WPCL
0.092
0.262
0.500 2.00
Bromobenzene; Total; ug/L
EPA 8260
DFG-WPCL
0.041
0.277
0.200 2.00
Bromochloromethane; Total; ug/L
EPA 8260
DFG-WPCL
0.070
0.342
0.400 2.00
Bromodichloromethane; Total; ug/L
EPA 8260
DFG-WPCL
0.035
0.200
0.200 2.00
Bromoform; Total; ug/L
EPA 8260
DFG-WPCL
0.071
0.189
0.400 2.00
Butylbenzene, n-; Total; ug/L
EPA 8260
DFG-WPCL
0.057
0.161
0.300 2.00
Butylbenzene, sec-; Total; ug/L
EPA 8260
DFG-WPCL
0.053
0.162
0.300 2.00
Butylbenzene, tert-; Total; ug/L
EPA 8260
DFG-WPCL
0.062
0.180
0.300 2.00
Carbon Tetrachloride; Total; ug/L
EPA 8260
DFG-WPCL
0.041
0.156
0.200 2.00
Chlorobenzene; Total; ug/L
EPA 8260
DFG-WPCL
0.042
0.090
0.200 2.00
Chlorotoluene, 2-; Total; ug/L
EPA 8260
DFG-WPCL
0.026
0.176
0.100 2.00
Chlorotoluene, 4-; Total; ug/L
EPA 8260
DFG-WPCL
0.033
0.117
0.200 2.00
Dibromo-3- Chloropropane, 1,2-; Total; ug/L
EPA 8260
DFG-WPCL
0.106
0.401
0.500 2.00
Dibromochloromethane ; Total; ug/L
EPA 8260
DFG-WPCL
0.071
0.122
0.400 2.00
Dibromomethane; Total; ug/L
EPA 8260
DFG-WPCL
0.075
0.191
0.400 2.00
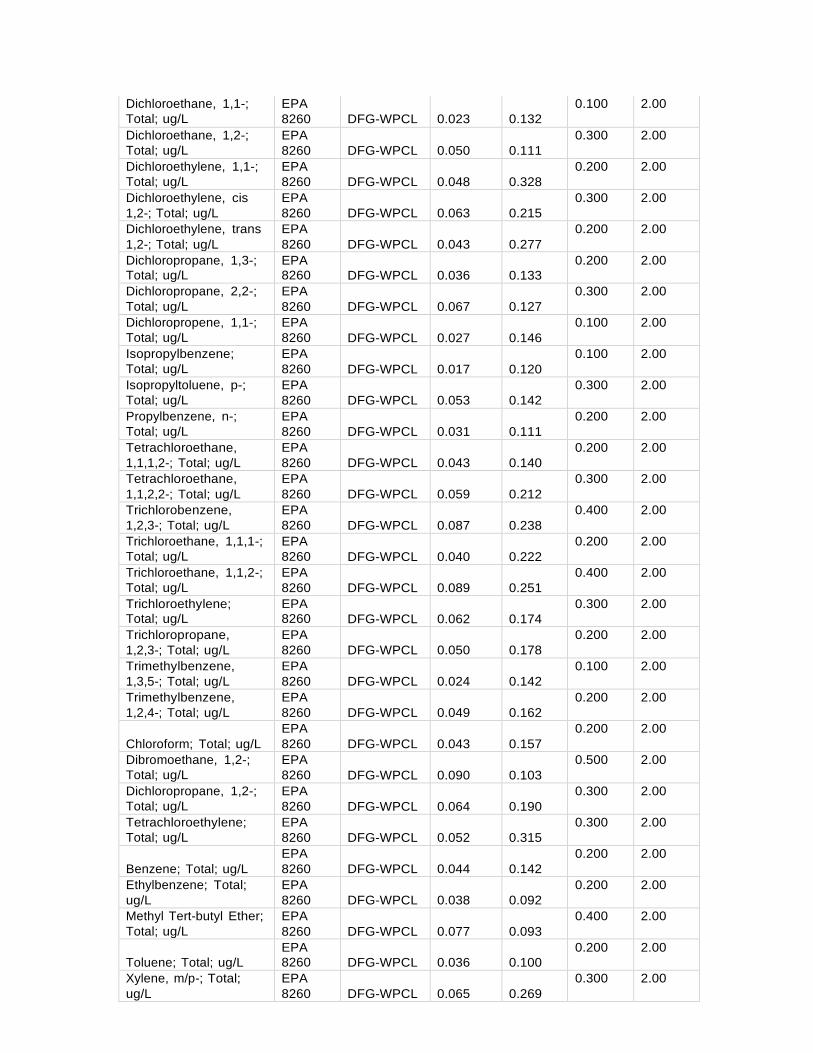
Dichloroethane, 1,1-; Total; ug/L
EPA 8260
DFG-WPCL
0.023
0.132
0.100 2.00
Dichloroethane, 1,2-; Total; ug/L
EPA 8260
DFG-WPCL
0.050
0.111
0.300 2.00
Dichloroethylene, 1,1-; Total; ug/L
EPA 8260
DFG-WPCL
0.048
0.328
0.200 2.00
Dichloroethylene, cis 1,2-; Total; ug/L
EPA 8260
DFG-WPCL
0.063
0.215
0.300 2.00
Dichloroethylene, trans 1,2-; Total; ug/L
EPA 8260
DFG-WPCL
0.043
0.277
0.200 2.00
Dichloropropane, 1,3-; Total; ug/L
EPA 8260
DFG-WPCL
0.036
0.133
0.200 2.00
Dichloropropane, 2,2-; Total; ug/L
EPA 8260
DFG-WPCL
0.067
0.127
0.300 2.00
Dichloropropene, 1,1-; Total; ug/L
EPA 8260
DFG-WPCL
0.027
0.146
0.100 2.00
Isopropylbenzene; Total; ug/L
EPA 8260
DFG-WPCL
0.017
0.120
0.100 2.00
Isopropyltoluene, p-; Total; ug/L
EPA 8260
DFG-WPCL
0.053
0.142
0.300 2.00
Propylbenzene, n-; Total; ug/L
EPA 8260
DFG-WPCL
0.031
0.111
0.200 2.00
Tetrachloroethane, 1,1,1,2-; Total; ug/L
EPA 8260
DFG-WPCL
0.043
0.140
0.200 2.00
Tetrachloroethane, 1,1,2,2-; Total; ug/L
EPA 8260
DFG-WPCL
0.059
0.212
0.300 2.00
Trichlorobenzene, 1,2,3-; Total; ug/L
EPA 8260
DFG-WPCL
0.087
0.238
0.400 2.00
Trichloroethane, 1,1,1-; Total; ug/L
EPA 8260
DFG-WPCL
0.040
0.222
0.200 2.00
Trichloroethane, 1,1,2-; Total; ug/L
EPA 8260
DFG-WPCL
0.089
0.251
0.400 2.00
Trichloroethylene; Total; ug/L
EPA 8260
DFG-WPCL
0.062
0.174
0.300 2.00
Trichloropropane, 1,2,3-; Total; ug/L
EPA 8260
DFG-WPCL
0.050
0.178
0.200 2.00
Trimethylbenzene, 1,3,5-; Total; ug/L
EPA 8260
DFG-WPCL
0.024
0.142
0.100 2.00
Trimethylbenzene, 1,2,4-; Total; ug/L
EPA 8260
DFG-WPCL
0.049
0.162
0.200 2.00
Chloroform; Total; ug/L
EPA 8260
DFG-WPCL
0.043
0.157
0.200 2.00
Dibromoethane, 1,2-; Total; ug/L
EPA 8260
DFG-WPCL
0.090
0.103
0.500 2.00
Dichloropropane, 1,2-; Total; ug/L
EPA 8260
DFG-WPCL
0.064
0.190
0.300 2.00
Tetrachloroethylene; Total; ug/L
EPA 8260
DFG-WPCL
0.052
0.315
0.300 2.00
Benzene; Total; ug/L
EPA 8260
DFG-WPCL
0.044
0.142
0.200 2.00
Ethylbenzene; Total; ug/L
EPA 8260
DFG-WPCL
0.038
0.092
0.200 2.00
Methyl Tert-butyl Ether; Total; ug/L
EPA 8260
DFG-WPCL
0.077
0.093
0.400 2.00
Toluene; Total; ug/L
EPA 8260
DFG-WPCL
0.036
0.100
0.200 2.00
Xylene, m/p-; Total; ug/L
EPA 8260
DFG-WPCL
0.065
0.269
0.300 2.00
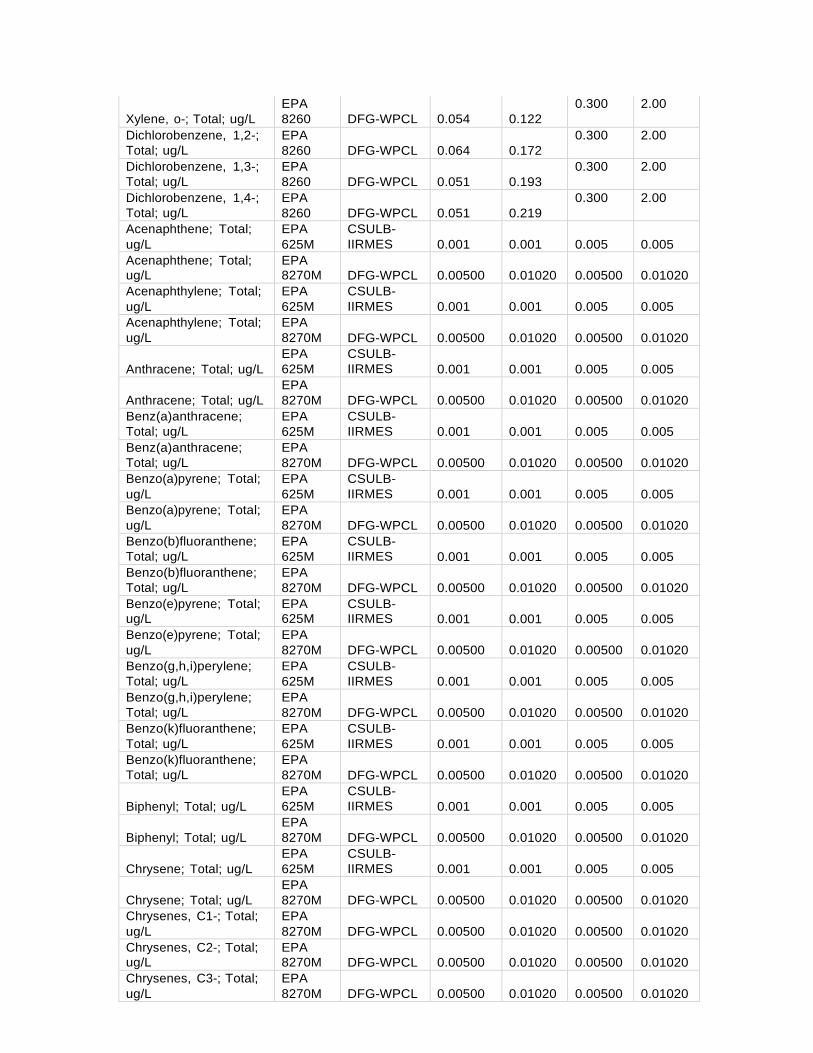
Xylene, o-; Total; ug/L
EPA 8260
DFG-WPCL
0.054
0.122
0.300 2.00
Dichlorobenzene, 1,2-; Total; ug/L
EPA 8260
DFG-WPCL
0.064
0.172
0.300 2.00
Dichlorobenzene, 1,3-; Total; ug/L
EPA 8260
DFG-WPCL
0.051
0.193
0.300 2.00
Dichlorobenzene, 1,4-; Total; ug/L
EPA 8260
DFG-WPCL
0.051
0.219
0.300 2.00
Acenaphthene; Total; ug/L
EPA 625M
CSULB- IIRMES
0.001
0.001
0.005
0.005
Acenaphthene; Total; ug/L
EPA 8270M
DFG-WPCL
0.00500
0.01020
0.00500
0.01020
Acenaphthylene; Total; ug/L
EPA 625M
CSULB- IIRMES
0.001
0.001
0.005
0.005
Acenaphthylene; Total; ug/L
EPA 8270M
DFG-WPCL
0.00500
0.01020
0.00500
0.01020
Anthracene; Total; ug/L
EPA 625M
CSULB- IIRMES
0.001
0.001
0.005
0.005
Anthracene; Total; ug/L
EPA 8270M
DFG-WPCL
0.00500
0.01020
0.00500
0.01020
Benz(a)anthracene; Total; ug/L
EPA 625M
CSULB- IIRMES
0.001
0.001
0.005
0.005
Benz(a)anthracene; Total; ug/L
EPA 8270M
DFG-WPCL
0.00500
0.01020
0.00500
0.01020
Benzo(a)pyrene; Total; ug/L
EPA 625M
CSULB- IIRMES
0.001
0.001
0.005
0.005
Benzo(a)pyrene; Total; ug/L
EPA 8270M
DFG-WPCL
0.00500
0.01020
0.00500
0.01020
Benzo(b)fluoranthene; Total; ug/L
EPA 625M
CSULB- IIRMES
0.001
0.001
0.005
0.005
Benzo(b)fluoranthene; Total; ug/L
EPA 8270M
DFG-WPCL
0.00500
0.01020
0.00500
0.01020
Benzo(e)pyrene; Total; ug/L
EPA 625M
CSULB- IIRMES
0.001
0.001
0.005
0.005
Benzo(e)pyrene; Total; ug/L
EPA 8270M
DFG-WPCL
0.00500
0.01020
0.00500
0.01020
Benzo(g,h,i)perylene; Total; ug/L
EPA 625M
CSULB- IIRMES
0.001
0.001
0.005
0.005
Benzo(g,h,i)perylene; Total; ug/L
EPA 8270M
DFG-WPCL
0.00500
0.01020
0.00500
0.01020
Benzo(k)fluoranthene; Total; ug/L
EPA 625M
CSULB- IIRMES
0.001
0.001
0.005
0.005
Benzo(k)fluoranthene; Total; ug/L
EPA 8270M
DFG-WPCL
0.00500
0.01020
0.00500
0.01020
Biphenyl; Total; ug/L
EPA 625M
CSULB- IIRMES
0.001
0.001
0.005
0.005
Biphenyl; Total; ug/L
EPA 8270M
DFG-WPCL
0.00500
0.01020
0.00500
0.01020
Chrysene; Total; ug/L
EPA 625M
CSULB- IIRMES
0.001
0.001
0.005
0.005
Chrysene; Total; ug/L
EPA 8270M
DFG-WPCL
0.00500
0.01020
0.00500
0.01020
Chrysenes, C1-; Total; ug/L
EPA 8270M
DFG-WPCL
0.00500
0.01020
0.00500
0.01020
Chrysenes, C2-; Total; ug/L
EPA 8270M
DFG-WPCL
0.00500
0.01020
0.00500
0.01020
Chrysenes, C3-; Total; ug/L
EPA 8270M
DFG-WPCL
0.00500
0.01020
0.00500
0.01020
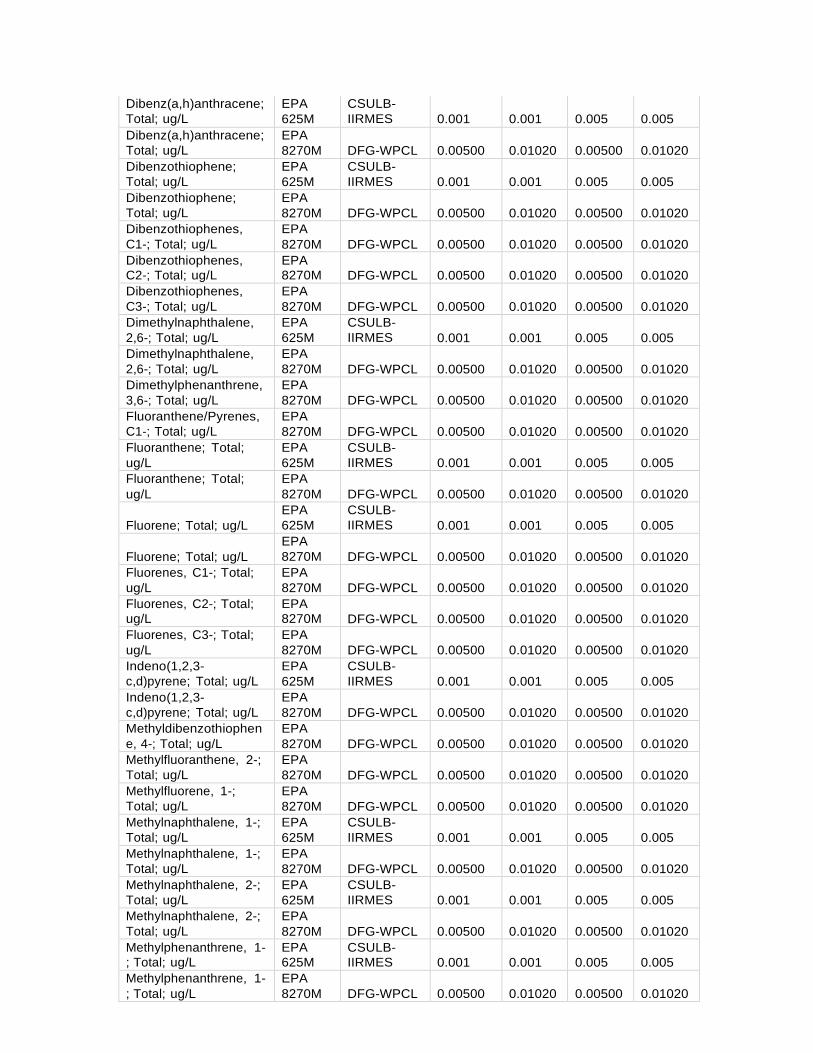
Dibenz(a,h)anthracene; Total; ug/L
EPA 625M
CSULB- IIRMES
0.001
0.001
0.005
0.005
Dibenz(a,h)anthracene; Total; ug/L
EPA 8270M
DFG-WPCL
0.00500
0.01020
0.00500
0.01020
Dibenzothiophene; Total; ug/L
EPA 625M
CSULB- IIRMES
0.001
0.001
0.005
0.005
Dibenzothiophene; Total; ug/L
EPA 8270M
DFG-WPCL
0.00500
0.01020
0.00500
0.01020
Dibenzothiophenes, C1-; Total; ug/L
EPA 8270M
DFG-WPCL
0.00500
0.01020
0.00500
0.01020
Dibenzothiophenes, C2-; Total; ug/L
EPA 8270M
DFG-WPCL
0.00500
0.01020
0.00500
0.01020
Dibenzothiophenes, C3-; Total; ug/L
EPA 8270M
DFG-WPCL
0.00500
0.01020
0.00500
0.01020
Dimethylnaphthalene, 2,6-; Total; ug/L
EPA 625M
CSULB- IIRMES
0.001
0.001
0.005
0.005
Dimethylnaphthalene, 2,6-; Total; ug/L
EPA 8270M
DFG-WPCL
0.00500
0.01020
0.00500
0.01020
Dimethylphenanthrene, 3,6-; Total; ug/L
EPA 8270M
DFG-WPCL
0.00500
0.01020
0.00500
0.01020
Fluoranthene/Pyrenes, C1-; Total; ug/L
EPA 8270M
DFG-WPCL
0.00500
0.01020
0.00500
0.01020
Fluoranthene; Total; ug/L
EPA 625M
CSULB- IIRMES
0.001
0.001
0.005
0.005
Fluoranthene; Total; ug/L
EPA 8270M
DFG-WPCL
0.00500
0.01020
0.00500
0.01020
Fluorene; Total; ug/L
EPA 625M
CSULB- IIRMES
0.001
0.001
0.005
0.005
Fluorene; Total; ug/L
EPA 8270M
DFG-WPCL
0.00500
0.01020
0.00500
0.01020
Fluorenes, C1-; Total; ug/L
EPA 8270M
DFG-WPCL
0.00500
0.01020
0.00500
0.01020
Fluorenes, C2-; Total; ug/L
EPA 8270M
DFG-WPCL
0.00500
0.01020
0.00500
0.01020
Fluorenes, C3-; Total; ug/L
EPA 8270M
DFG-WPCL
0.00500
0.01020
0.00500
0.01020
Indeno(1,2,3- c,d)pyrene; Total; ug/L
EPA 625M
CSULB- IIRMES
0.001
0.001
0.005
0.005
Indeno(1,2,3- c,d)pyrene; Total; ug/L
EPA 8270M
DFG-WPCL
0.00500
0.01020
0.00500
0.01020
Methyldibenzothiophen e, 4-; Total; ug/L
EPA 8270M
DFG-WPCL
0.00500
0.01020
0.00500
0.01020
Methylfluoranthene, 2-; Total; ug/L
EPA 8270M
DFG-WPCL
0.00500
0.01020
0.00500
0.01020
Methylfluorene, 1-; Total; ug/L
EPA 8270M
DFG-WPCL
0.00500
0.01020
0.00500
0.01020
Methylnaphthalene, 1-; Total; ug/L
EPA 625M
CSULB- IIRMES
0.001
0.001
0.005
0.005
Methylnaphthalene, 1-; Total; ug/L
EPA 8270M
DFG-WPCL
0.00500
0.01020
0.00500
0.01020
Methylnaphthalene, 2-; Total; ug/L
EPA 625M
CSULB- IIRMES
0.001
0.001
0.005
0.005
Methylnaphthalene, 2-; Total; ug/L
EPA 8270M
DFG-WPCL
0.00500
0.01020
0.00500
0.01020
Methylphenanthrene, 1- ; Total; ug/L
EPA 625M
CSULB- IIRMES
0.001
0.001
0.005
0.005
Methylphenanthrene, 1- ; Total; ug/L
EPA 8270M
DFG-WPCL
0.00500
0.01020
0.00500
0.01020
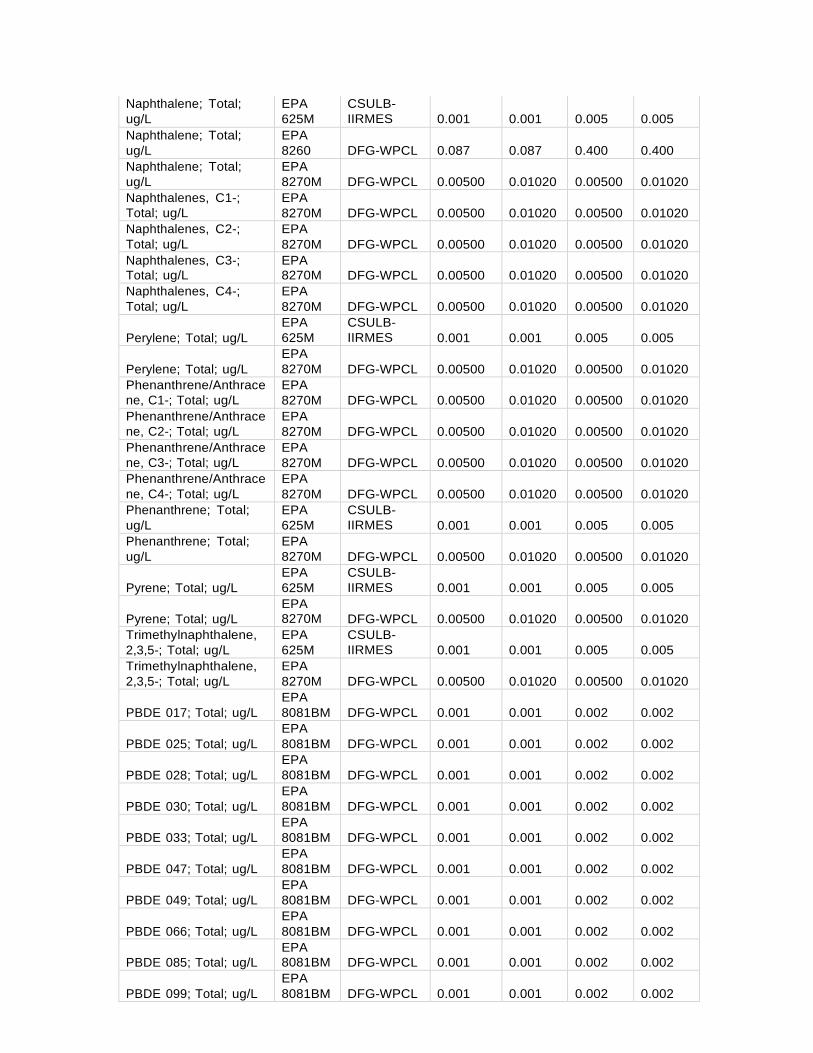
Naphthalene; Total; ug/L
EPA 625M
CSULB- IIRMES
0.001
0.001
0.005
0.005
Naphthalene; Total; ug/L
EPA 8260
DFG-WPCL
0.087
0.087
0.400
0.400
Naphthalene; Total; ug/L
EPA 8270M
DFG-WPCL
0.00500
0.01020
0.00500
0.01020
Naphthalenes, C1-; Total; ug/L
EPA 8270M
DFG-WPCL
0.00500
0.01020
0.00500
0.01020
Naphthalenes, C2-; Total; ug/L
EPA 8270M
DFG-WPCL
0.00500
0.01020
0.00500
0.01020
Naphthalenes, C3-; Total; ug/L
EPA 8270M
DFG-WPCL
0.00500
0.01020
0.00500
0.01020
Naphthalenes, C4-; Total; ug/L
EPA 8270M
DFG-WPCL
0.00500
0.01020
0.00500
0.01020
Perylene; Total; ug/L
EPA 625M
CSULB- IIRMES
0.001
0.001
0.005
0.005
Perylene; Total; ug/L
EPA 8270M
DFG-WPCL
0.00500
0.01020
0.00500
0.01020
Phenanthrene/Anthrace ne, C1-; Total; ug/L
EPA 8270M
DFG-WPCL
0.00500
0.01020
0.00500
0.01020
Phenanthrene/Anthrace ne, C2-; Total; ug/L
EPA 8270M
DFG-WPCL
0.00500
0.01020
0.00500
0.01020
Phenanthrene/Anthrace ne, C3-; Total; ug/L
EPA 8270M
DFG-WPCL
0.00500
0.01020
0.00500
0.01020
Phenanthrene/Anthrace ne, C4-; Total; ug/L
EPA 8270M
DFG-WPCL
0.00500
0.01020
0.00500
0.01020
Phenanthrene; Total; ug/L
EPA 625M
CSULB- IIRMES
0.001
0.001
0.005
0.005
Phenanthrene; Total; ug/L
EPA 8270M
DFG-WPCL
0.00500
0.01020
0.00500
0.01020
Pyrene; Total; ug/L
EPA 625M
CSULB- IIRMES
0.001
0.001
0.005
0.005
Pyrene; Total; ug/L
EPA 8270M
DFG-WPCL
0.00500
0.01020
0.00500
0.01020
Trimethylnaphthalene, 2,3,5-; Total; ug/L
EPA 625M
CSULB- IIRMES
0.001
0.001
0.005
0.005
Trimethylnaphthalene, 2,3,5-; Total; ug/L
EPA 8270M
DFG-WPCL
0.00500
0.01020
0.00500
0.01020
PBDE 017; Total; ug/L
EPA 8081BM
DFG-WPCL
0.001
0.001
0.002
0.002
PBDE 025; Total; ug/L
EPA 8081BM
DFG-WPCL
0.001
0.001
0.002
0.002
PBDE 028; Total; ug/L
EPA 8081BM
DFG-WPCL
0.001
0.001
0.002
0.002
PBDE 030; Total; ug/L
EPA 8081BM
DFG-WPCL
0.001
0.001
0.002
0.002
PBDE 033; Total; ug/L
EPA 8081BM
DFG-WPCL
0.001
0.001
0.002
0.002
PBDE 047; Total; ug/L
EPA 8081BM
DFG-WPCL
0.001
0.001
0.002
0.002
PBDE 049; Total; ug/L
EPA 8081BM
DFG-WPCL
0.001
0.001
0.002
0.002
PBDE 066; Total; ug/L
EPA 8081BM
DFG-WPCL
0.001
0.001
0.002
0.002
PBDE 085; Total; ug/L
EPA 8081BM
DFG-WPCL
0.001
0.001
0.002
0.002
PBDE 099; Total; ug/L
EPA 8081BM
DFG-WPCL
0.001
0.001
0.002
0.002
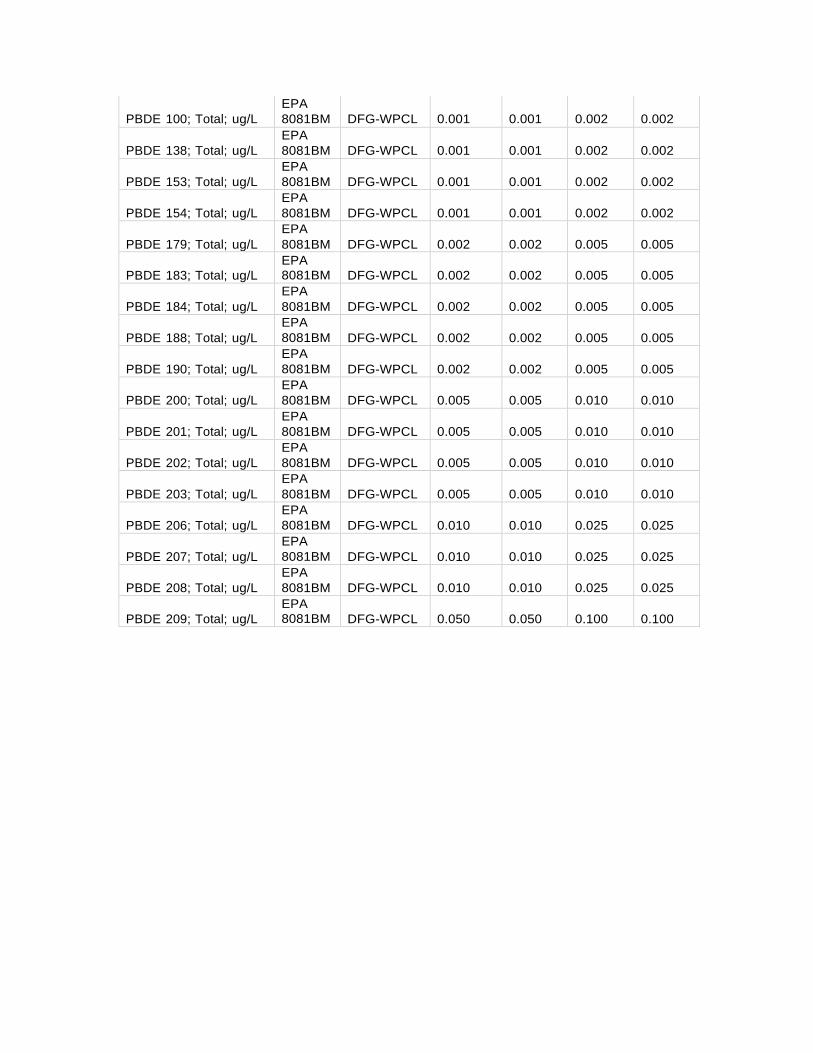
PBDE 100; Total; ug/L
EPA 8081BM
DFG-WPCL
0.001
0.001
0.002
0.002
PBDE 138; Total; ug/L
EPA 8081BM
DFG-WPCL
0.001
0.001
0.002
0.002
PBDE 153; Total; ug/L
EPA 8081BM
DFG-WPCL
0.001
0.001
0.002
0.002
PBDE 154; Total; ug/L
EPA 8081BM
DFG-WPCL
0.001
0.001
0.002
0.002
PBDE 179; Total; ug/L
EPA 8081BM
DFG-WPCL
0.002
0.002
0.005
0.005
PBDE 183; Total; ug/L
EPA 8081BM
DFG-WPCL
0.002
0.002
0.005
0.005
PBDE 184; Total; ug/L
EPA 8081BM
DFG-WPCL
0.002
0.002
0.005
0.005
PBDE 188; Total; ug/L
EPA 8081BM
DFG-WPCL
0.002
0.002
0.005
0.005
PBDE 190; Total; ug/L
EPA 8081BM
DFG-WPCL
0.002
0.002
0.005
0.005
PBDE 200; Total; ug/L
EPA 8081BM
DFG-WPCL
0.005
0.005
0.010
0.010
PBDE 201; Total; ug/L
EPA 8081BM
DFG-WPCL
0.005
0.005
0.010
0.010
PBDE 202; Total; ug/L
EPA 8081BM
DFG-WPCL
0.005
0.005
0.010
0.010
PBDE 203; Total; ug/L
EPA 8081BM
DFG-WPCL
0.005
0.005
0.010
0.010
PBDE 206; Total; ug/L
EPA 8081BM
DFG-WPCL
0.010
0.010
0.025
0.025
PBDE 207; Total; ug/L
EPA 8081BM
DFG-WPCL
0.010
0.010
0.025
0.025
PBDE 208; Total; ug/L
EPA 8081BM
DFG-WPCL
0.010
0.010
0.025
0.025
PBDE 209; Total; ug/L
EPA 8081BM
DFG-WPCL
0.050
0.050
0.100
0.100
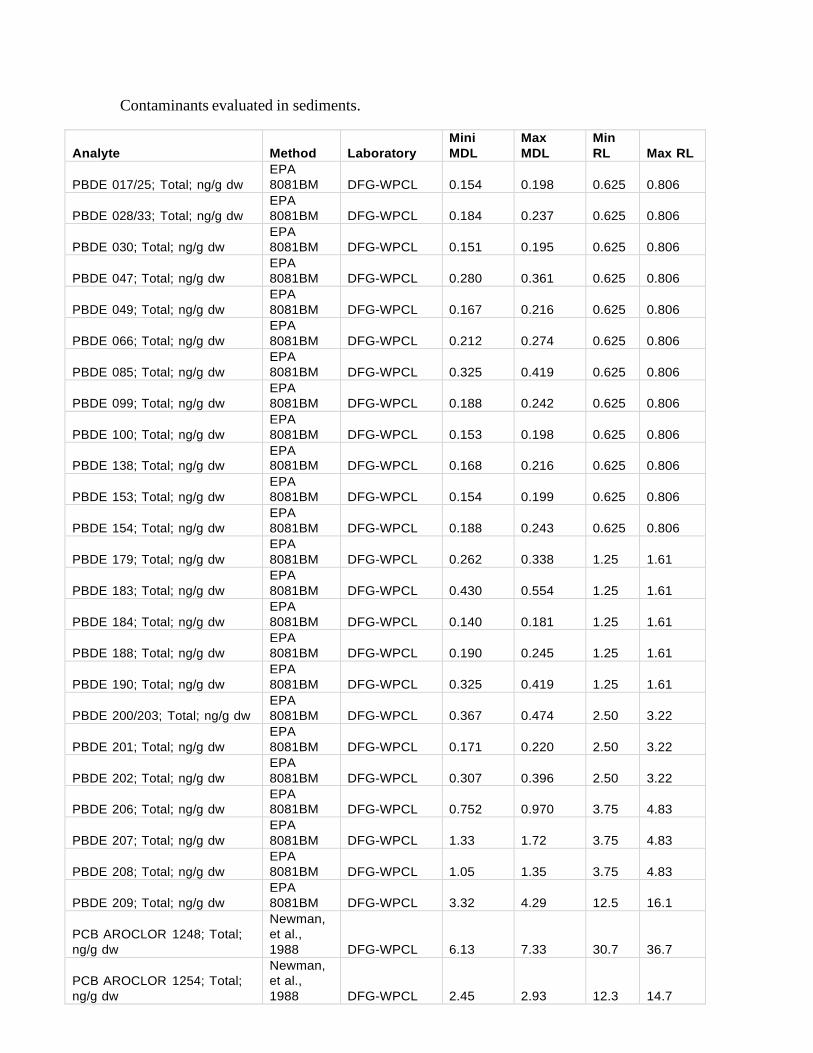
Contaminants evaluated in sediments.
Analyte
Method
Laboratory
Mini MDL
Max MDL
Min RL
Max RL
PBDE 017/25; Total; ng/g dw
EPA 8081BM
DFG-WPCL
0.154
0.198
0.625
0.806
PBDE 028/33; Total; ng/g dw
EPA 8081BM
DFG-WPCL
0.184
0.237
0.625
0.806
PBDE 030; Total; ng/g dw
EPA 8081BM
DFG-WPCL
0.151
0.195
0.625
0.806
PBDE 047; Total; ng/g dw
EPA 8081BM
DFG-WPCL
0.280
0.361
0.625
0.806
PBDE 049; Total; ng/g dw
EPA 8081BM
DFG-WPCL
0.167
0.216
0.625
0.806
PBDE 066; Total; ng/g dw
EPA 8081BM
DFG-WPCL
0.212
0.274
0.625
0.806
PBDE 085; Total; ng/g dw
EPA 8081BM
DFG-WPCL
0.325
0.419
0.625
0.806
PBDE 099; Total; ng/g dw
EPA 8081BM
DFG-WPCL
0.188
0.242
0.625
0.806
PBDE 100; Total; ng/g dw
EPA 8081BM
DFG-WPCL
0.153
0.198
0.625
0.806
PBDE 138; Total; ng/g dw
EPA 8081BM
DFG-WPCL
0.168
0.216
0.625
0.806
PBDE 153; Total; ng/g dw
EPA 8081BM
DFG-WPCL
0.154
0.199
0.625
0.806
PBDE 154; Total; ng/g dw
EPA 8081BM
DFG-WPCL
0.188
0.243
0.625
0.806
PBDE 179; Total; ng/g dw
EPA 8081BM
DFG-WPCL
0.262
0.338
1.25
1.61
PBDE 183; Total; ng/g dw
EPA 8081BM
DFG-WPCL
0.430
0.554
1.25
1.61
PBDE 184; Total; ng/g dw
EPA 8081BM
DFG-WPCL
0.140
0.181
1.25
1.61
PBDE 188; Total; ng/g dw
EPA 8081BM
DFG-WPCL
0.190
0.245
1.25
1.61
PBDE 190; Total; ng/g dw
EPA 8081BM
DFG-WPCL
0.325
0.419
1.25
1.61
PBDE 200/203; Total; ng/g dw
EPA 8081BM
DFG-WPCL
0.367
0.474
2.50
3.22
PBDE 201; Total; ng/g dw
EPA 8081BM
DFG-WPCL
0.171
0.220
2.50
3.22
PBDE 202; Total; ng/g dw
EPA 8081BM
DFG-WPCL
0.307
0.396
2.50
3.22
PBDE 206; Total; ng/g dw
EPA 8081BM
DFG-WPCL
0.752
0.970
3.75
4.83
PBDE 207; Total; ng/g dw
EPA 8081BM
DFG-WPCL
1.33
1.72
3.75
4.83
PBDE 208; Total; ng/g dw
EPA 8081BM
DFG-WPCL
1.05
1.35
3.75
4.83
PBDE 209; Total; ng/g dw
EPA 8081BM
DFG-WPCL
3.32
4.29
12.5
16.1
PCB AROCLOR 1248; Total; ng/g dw
Newman, et al., 1988
DFG-WPCL
6.13
7.33
30.7
36.7
PCB AROCLOR 1254; Total; ng/g dw
Newman, et al., 1988
DFG-WPCL
2.45
2.93
12.3
14.7
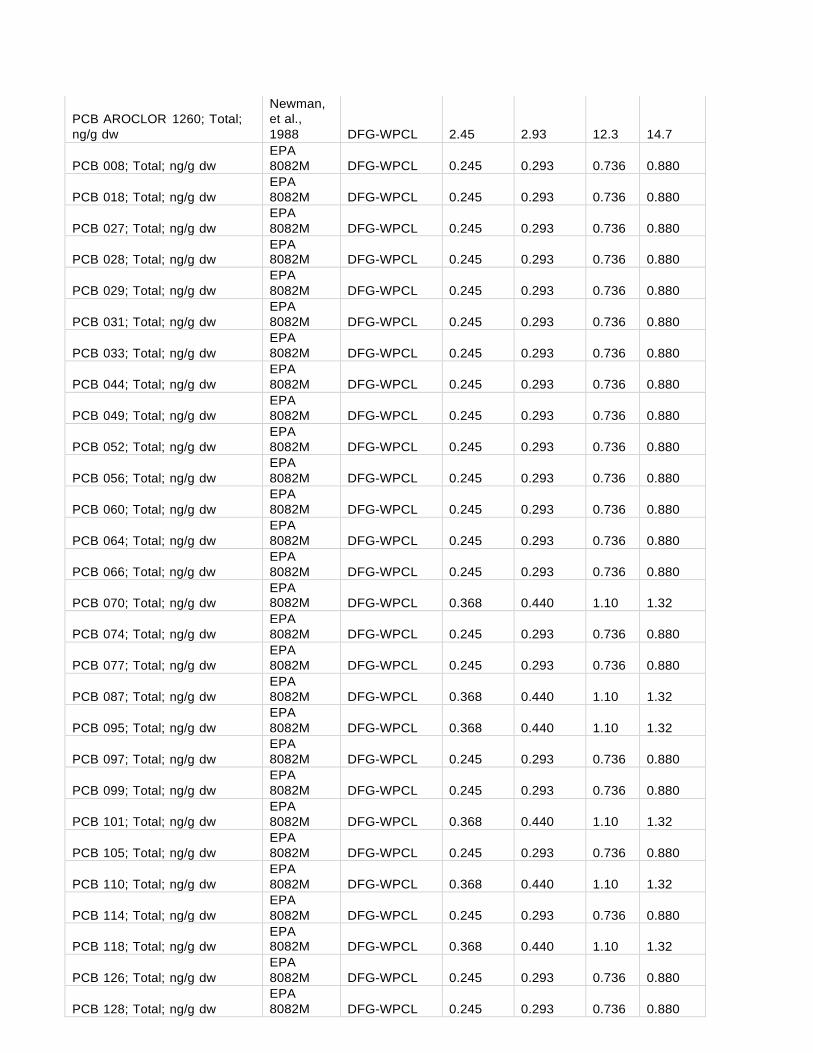
PCB AROCLOR 1260; Total; ng/g dw
Newman, et al., 1988
DFG-WPCL
2.45
2.93
12.3
14.7
PCB 008; Total; ng/g dw
EPA 8082M
DFG-WPCL
0.245
0.293
0.736
0.880
PCB 018; Total; ng/g dw
EPA 8082M
DFG-WPCL
0.245
0.293
0.736
0.880
PCB 027; Total; ng/g dw
EPA 8082M
DFG-WPCL
0.245
0.293
0.736
0.880
PCB 028; Total; ng/g dw
EPA 8082M
DFG-WPCL
0.245
0.293
0.736
0.880
PCB 029; Total; ng/g dw
EPA 8082M
DFG-WPCL
0.245
0.293
0.736
0.880
PCB 031; Total; ng/g dw
EPA 8082M
DFG-WPCL
0.245
0.293
0.736
0.880
PCB 033; Total; ng/g dw
EPA 8082M
DFG-WPCL
0.245
0.293
0.736
0.880
PCB 044; Total; ng/g dw
EPA 8082M
DFG-WPCL
0.245
0.293
0.736
0.880
PCB 049; Total; ng/g dw
EPA 8082M
DFG-WPCL
0.245
0.293
0.736
0.880
PCB 052; Total; ng/g dw
EPA 8082M
DFG-WPCL
0.245
0.293
0.736
0.880
PCB 056; Total; ng/g dw
EPA 8082M
DFG-WPCL
0.245
0.293
0.736
0.880
PCB 060; Total; ng/g dw
EPA 8082M
DFG-WPCL
0.245
0.293
0.736
0.880
PCB 064; Total; ng/g dw
EPA 8082M
DFG-WPCL
0.245
0.293
0.736
0.880
PCB 066; Total; ng/g dw
EPA 8082M
DFG-WPCL
0.245
0.293
0.736
0.880
PCB 070; Total; ng/g dw
EPA 8082M
DFG-WPCL
0.368
0.440
1.10
1.32
PCB 074; Total; ng/g dw
EPA 8082M
DFG-WPCL
0.245
0.293
0.736
0.880
PCB 077; Total; ng/g dw
EPA 8082M
DFG-WPCL
0.245
0.293
0.736
0.880
PCB 087; Total; ng/g dw
EPA 8082M
DFG-WPCL
0.368
0.440
1.10
1.32
PCB 095; Total; ng/g dw
EPA 8082M
DFG-WPCL
0.368
0.440
1.10
1.32
PCB 097; Total; ng/g dw
EPA 8082M
DFG-WPCL
0.245
0.293
0.736
0.880
PCB 099; Total; ng/g dw
EPA 8082M
DFG-WPCL
0.245
0.293
0.736
0.880
PCB 101; Total; ng/g dw
EPA 8082M
DFG-WPCL
0.368
0.440
1.10
1.32
PCB 105; Total; ng/g dw
EPA 8082M
DFG-WPCL
0.245
0.293
0.736
0.880
PCB 110; Total; ng/g dw
EPA 8082M
DFG-WPCL
0.368
0.440
1.10
1.32
PCB 114; Total; ng/g dw
EPA 8082M
DFG-WPCL
0.245
0.293
0.736
0.880
PCB 118; Total; ng/g dw
EPA 8082M
DFG-WPCL
0.368
0.440
1.10
1.32
PCB 126; Total; ng/g dw
EPA 8082M
DFG-WPCL
0.245
0.293
0.736
0.880
PCB 128; Total; ng/g dw
EPA 8082M
DFG-WPCL
0.245
0.293
0.736
0.880
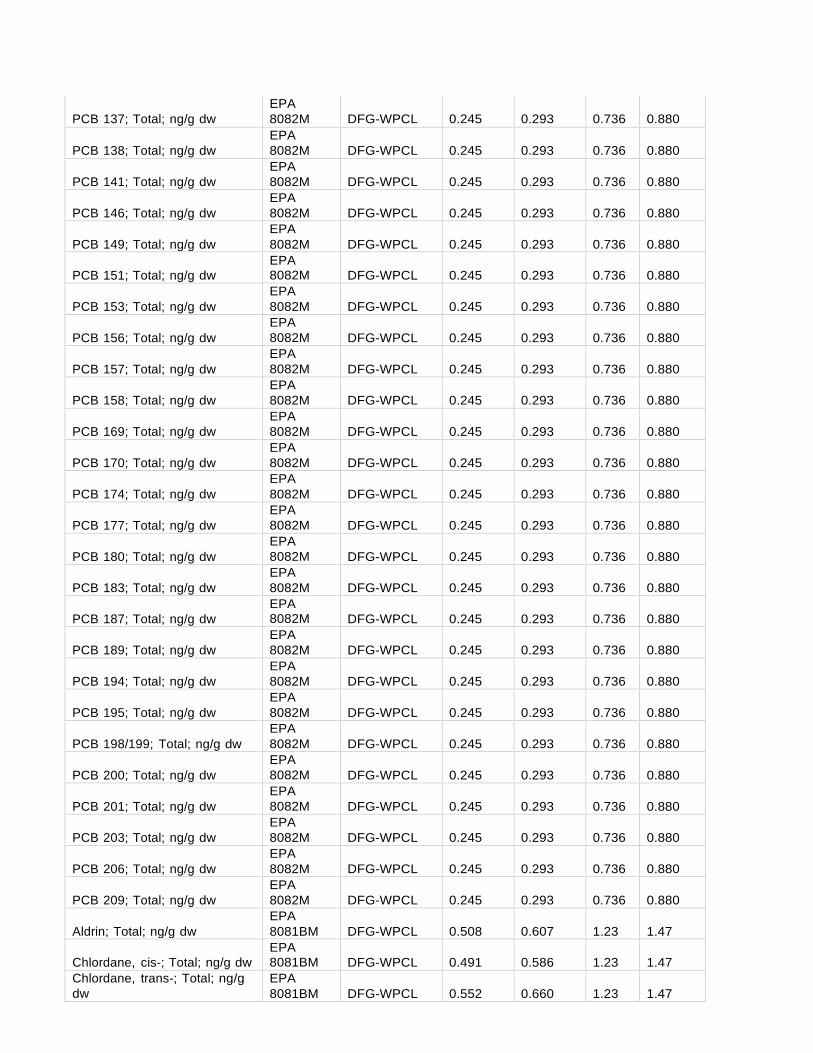
PCB 137; Total; ng/g dw
EPA 8082M
DFG-WPCL
0.245
0.293
0.736
0.880
PCB 138; Total; ng/g dw
EPA 8082M
DFG-WPCL
0.245
0.293
0.736
0.880
PCB 141; Total; ng/g dw
EPA 8082M
DFG-WPCL
0.245
0.293
0.736
0.880
PCB 146; Total; ng/g dw
EPA 8082M
DFG-WPCL
0.245
0.293
0.736
0.880
PCB 149; Total; ng/g dw
EPA 8082M
DFG-WPCL
0.245
0.293
0.736
0.880
PCB 151; Total; ng/g dw
EPA 8082M
DFG-WPCL
0.245
0.293
0.736
0.880
PCB 153; Total; ng/g dw
EPA 8082M
DFG-WPCL
0.245
0.293
0.736
0.880
PCB 156; Total; ng/g dw
EPA 8082M
DFG-WPCL
0.245
0.293
0.736
0.880
PCB 157; Total; ng/g dw
EPA 8082M
DFG-WPCL
0.245
0.293
0.736
0.880
PCB 158; Total; ng/g dw
EPA 8082M
DFG-WPCL
0.245
0.293
0.736
0.880
PCB 169; Total; ng/g dw
EPA 8082M
DFG-WPCL
0.245
0.293
0.736
0.880
PCB 170; Total; ng/g dw
EPA 8082M
DFG-WPCL
0.245
0.293
0.736
0.880
PCB 174; Total; ng/g dw
EPA 8082M
DFG-WPCL
0.245
0.293
0.736
0.880
PCB 177; Total; ng/g dw
EPA 8082M
DFG-WPCL
0.245
0.293
0.736
0.880
PCB 180; Total; ng/g dw
EPA 8082M
DFG-WPCL
0.245
0.293
0.736
0.880
PCB 183; Total; ng/g dw
EPA 8082M
DFG-WPCL
0.245
0.293
0.736
0.880
PCB 187; Total; ng/g dw
EPA 8082M
DFG-WPCL
0.245
0.293
0.736
0.880
PCB 189; Total; ng/g dw
EPA 8082M
DFG-WPCL
0.245
0.293
0.736
0.880
PCB 194; Total; ng/g dw
EPA 8082M
DFG-WPCL
0.245
0.293
0.736
0.880
PCB 195; Total; ng/g dw
EPA 8082M
DFG-WPCL
0.245
0.293
0.736
0.880
PCB 198/199; Total; ng/g dw
EPA 8082M
DFG-WPCL
0.245
0.293
0.736
0.880
PCB 200; Total; ng/g dw
EPA 8082M
DFG-WPCL
0.245
0.293
0.736
0.880
PCB 201; Total; ng/g dw
EPA 8082M
DFG-WPCL
0.245
0.293
0.736
0.880
PCB 203; Total; ng/g dw
EPA 8082M
DFG-WPCL
0.245
0.293
0.736
0.880
PCB 206; Total; ng/g dw
EPA 8082M
DFG-WPCL
0.245
0.293
0.736
0.880
PCB 209; Total; ng/g dw
EPA 8082M
DFG-WPCL
0.245
0.293
0.736
0.880
Aldrin; Total; ng/g dw
EPA 8081BM
DFG-WPCL
0.508
0.607
1.23
1.47
Chlordane, cis-; Total; ng/g dw
EPA 8081BM
DFG-WPCL
0.491
0.586
1.23
1.47
Chlordane, trans-; Total; ng/g dw
EPA 8081BM
DFG-WPCL
0.552
0.660
1.23
1.47
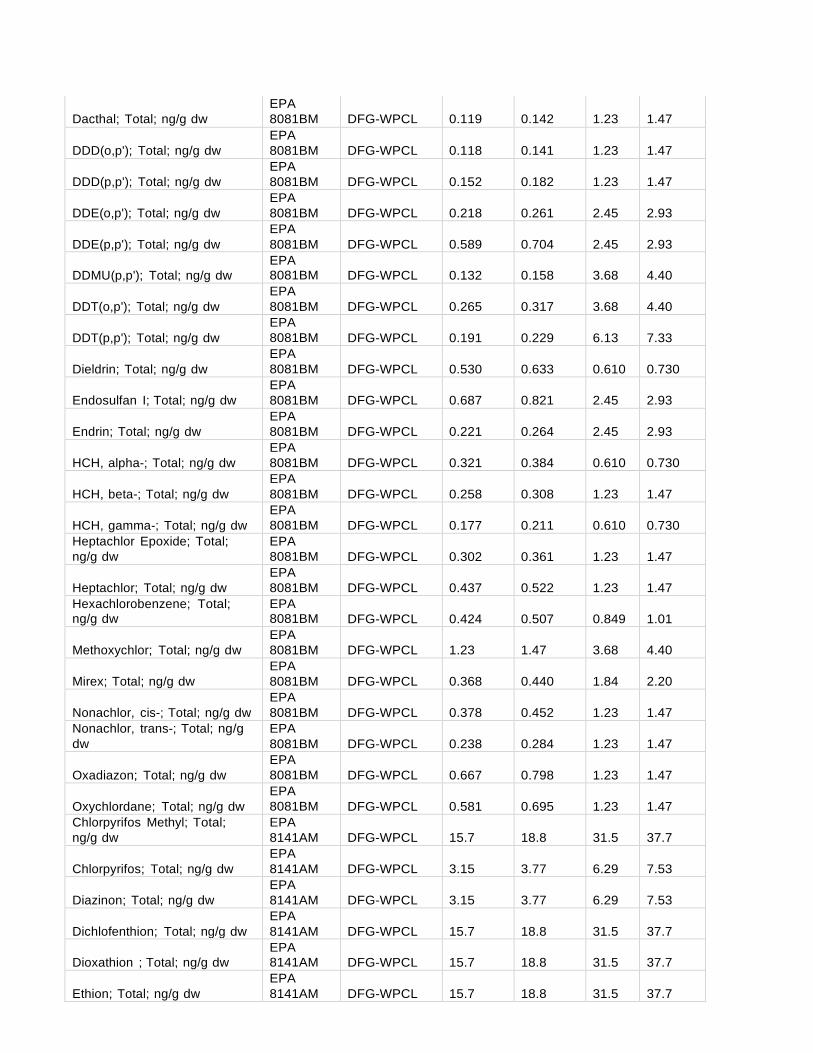
Dacthal; Total; ng/g dw
EPA 8081BM
DFG-WPCL
0.119
0.142
1.23
1.47
DDD(o,p'); Total; ng/g dw
EPA 8081BM
DFG-WPCL
0.118
0.141
1.23
1.47
DDD(p,p'); Total; ng/g dw
EPA 8081BM
DFG-WPCL
0.152
0.182
1.23
1.47
DDE(o,p'); Total; ng/g dw
EPA 8081BM
DFG-WPCL
0.218
0.261
2.45
2.93
DDE(p,p'); Total; ng/g dw
EPA 8081BM
DFG-WPCL
0.589
0.704
2.45
2.93
DDMU(p,p'); Total; ng/g dw
EPA 8081BM
DFG-WPCL
0.132
0.158
3.68
4.40
DDT(o,p'); Total; ng/g dw
EPA 8081BM
DFG-WPCL
0.265
0.317
3.68
4.40
DDT(p,p'); Total; ng/g dw
EPA 8081BM
DFG-WPCL
0.191
0.229
6.13
7.33
Dieldrin; Total; ng/g dw
EPA 8081BM
DFG-WPCL
0.530
0.633
0.610
0.730
Endosulfan I; Total; ng/g dw
EPA 8081BM
DFG-WPCL
0.687
0.821
2.45
2.93
Endrin; Total; ng/g dw
EPA 8081BM
DFG-WPCL
0.221
0.264
2.45
2.93
HCH, alpha-; Total; ng/g dw
EPA 8081BM
DFG-WPCL
0.321
0.384
0.610
0.730
HCH, beta-; Total; ng/g dw
EPA 8081BM
DFG-WPCL
0.258
0.308
1.23
1.47
HCH, gamma-; Total; ng/g dw
EPA 8081BM
DFG-WPCL
0.177
0.211
0.610
0.730
Heptachlor Epoxide; Total; ng/g dw
EPA 8081BM
DFG-WPCL
0.302
0.361
1.23
1.47
Heptachlor; Total; ng/g dw
EPA 8081BM
DFG-WPCL
0.437
0.522
1.23
1.47
Hexachlorobenzene; Total; ng/g dw
EPA 8081BM
DFG-WPCL
0.424
0.507
0.849
1.01
Methoxychlor; Total; ng/g dw
EPA 8081BM
DFG-WPCL
1.23
1.47
3.68
4.40
Mirex; Total; ng/g dw
EPA 8081BM
DFG-WPCL
0.368
0.440
1.84
2.20
Nonachlor, cis-; Total; ng/g dw
EPA 8081BM
DFG-WPCL
0.378
0.452
1.23
1.47
Nonachlor, trans-; Total; ng/g dw
EPA 8081BM
DFG-WPCL
0.238
0.284
1.23
1.47
Oxadiazon; Total; ng/g dw
EPA 8081BM
DFG-WPCL
0.667
0.798
1.23
1.47
Oxychlordane; Total; ng/g dw
EPA 8081BM
DFG-WPCL
0.581
0.695
1.23
1.47
Chlorpyrifos Methyl; Total; ng/g dw
EPA 8141AM
DFG-WPCL
15.7
18.8
31.5
37.7
Chlorpyrifos; Total; ng/g dw
EPA 8141AM
DFG-WPCL
3.15
3.77
6.29
7.53
Diazinon; Total; ng/g dw
EPA 8141AM
DFG-WPCL
3.15
3.77
6.29
7.53
Dichlofenthion; Total; ng/g dw
EPA 8141AM
DFG-WPCL
15.7
18.8
31.5
37.7
Dioxathion ; Total; ng/g dw
EPA 8141AM
DFG-WPCL
15.7
18.8
31.5
37.7
Ethion; Total; ng/g dw
EPA 8141AM
DFG-WPCL
15.7
18.8
31.5
37.7
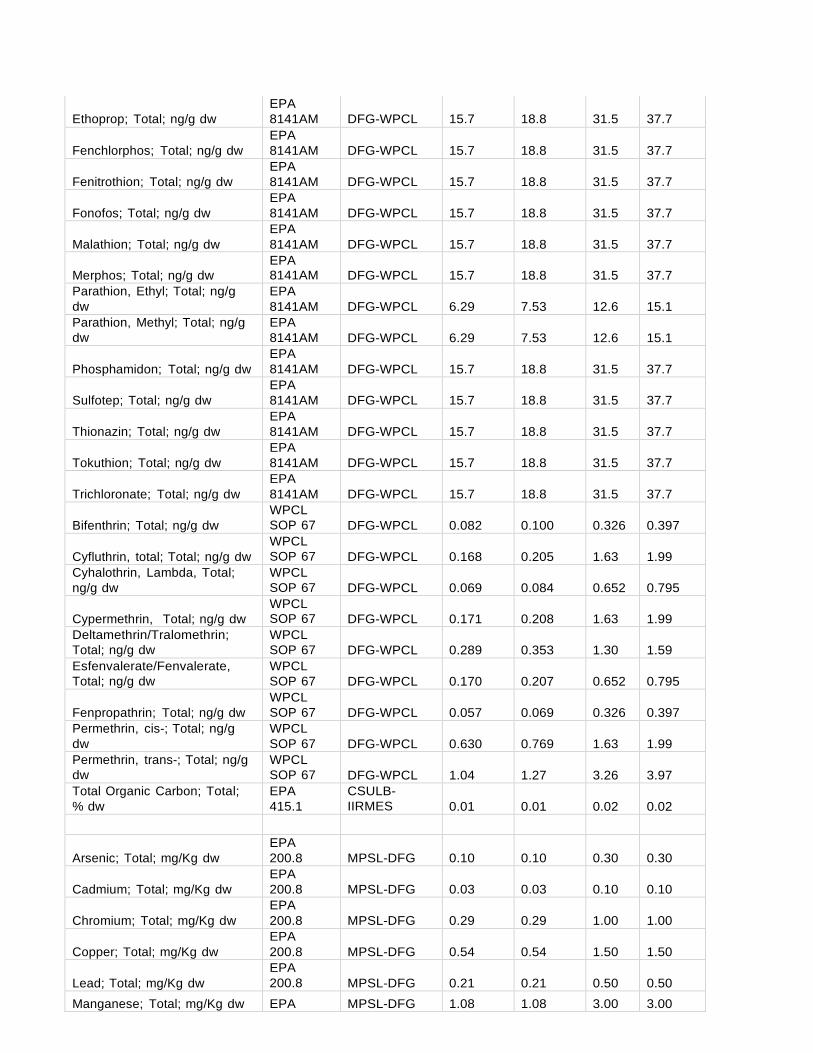
Ethoprop; Total; ng/g dw
EPA 8141AM
DFG-WPCL
15.7
18.8
31.5
37.7
Fenchlorphos; Total; ng/g dw
EPA 8141AM
DFG-WPCL
15.7
18.8
31.5
37.7
Fenitrothion; Total; ng/g dw
EPA 8141AM
DFG-WPCL
15.7
18.8
31.5
37.7
Fonofos; Total; ng/g dw
EPA 8141AM
DFG-WPCL
15.7
18.8
31.5
37.7
Malathion; Total; ng/g dw
EPA 8141AM
DFG-WPCL
15.7
18.8
31.5
37.7
Merphos; Total; ng/g dw
EPA 8141AM
DFG-WPCL
15.7
18.8
31.5
37.7
Parathion, Ethyl; Total; ng/g dw
EPA 8141AM
DFG-WPCL
6.29
7.53
12.6
15.1
Parathion, Methyl; Total; ng/g dw
EPA 8141AM
DFG-WPCL
6.29
7.53
12.6
15.1
Phosphamidon; Total; ng/g dw
EPA 8141AM
DFG-WPCL
15.7
18.8
31.5
37.7
Sulfotep; Total; ng/g dw
EPA 8141AM
DFG-WPCL
15.7
18.8
31.5
37.7
Thionazin; Total; ng/g dw
EPA 8141AM
DFG-WPCL
15.7
18.8
31.5
37.7
Tokuthion; Total; ng/g dw
EPA 8141AM
DFG-WPCL
15.7
18.8
31.5
37.7
Trichloronate; Total; ng/g dw
EPA 8141AM
DFG-WPCL
15.7
18.8
31.5
37.7
Bifenthrin; Total; ng/g dw
WPCL SOP 67
DFG-WPCL
0.082
0.100
0.326
0.397
Cyfluthrin, total; Total; ng/g dw
WPCL SOP 67
DFG-WPCL
0.168
0.205
1.63
1.99
Cyhalothrin, Lambda, Total; ng/g dw
WPCL SOP 67
DFG-WPCL
0.069
0.084
0.652
0.795
Cypermethrin, Total; ng/g dw
WPCL SOP 67
DFG-WPCL
0.171
0.208
1.63
1.99
Deltamethrin/Tralomethrin; Total; ng/g dw
WPCL SOP 67
DFG-WPCL
0.289
0.353
1.30
1.59
Esfenvalerate/Fenvalerate, Total; ng/g dw
WPCL SOP 67
DFG-WPCL
0.170
0.207
0.652
0.795
Fenpropathrin; Total; ng/g dw
WPCL SOP 67
DFG-WPCL
0.057
0.069
0.326
0.397
Permethrin, cis-; Total; ng/g dw
WPCL SOP 67
DFG-WPCL
0.630
0.769
1.63
1.99
Permethrin, trans-; Total; ng/g dw
WPCL SOP 67
DFG-WPCL
1.04
1.27
3.26
3.97
Total Organic Carbon; Total; % dw
EPA 415.1
CSULB- IIRMES
0.01
0.01
0.02
0.02
Arsenic; Total; mg/Kg dw EPA 200.8
MPSL-DFG
0.10
0.10
0.30
0.30
Cadmium; Total; mg/Kg dw
EPA 200.8
MPSL-DFG
0.03
0.03
0.10
0.10
Chromium; Total; mg/Kg dw
EPA 200.8
MPSL-DFG
0.29
0.29
1.00
1.00
Copper; Total; mg/Kg dw
EPA 200.8
MPSL-DFG
0.54
0.54
1.50
1.50
Lead; Total; mg/Kg dw
EPA 200.8
MPSL-DFG
0.21
0.21
0.50
0.50
Manganese; Total; mg/Kg dw EPA MPSL-DFG 1.08 1.08 3.00 3.00
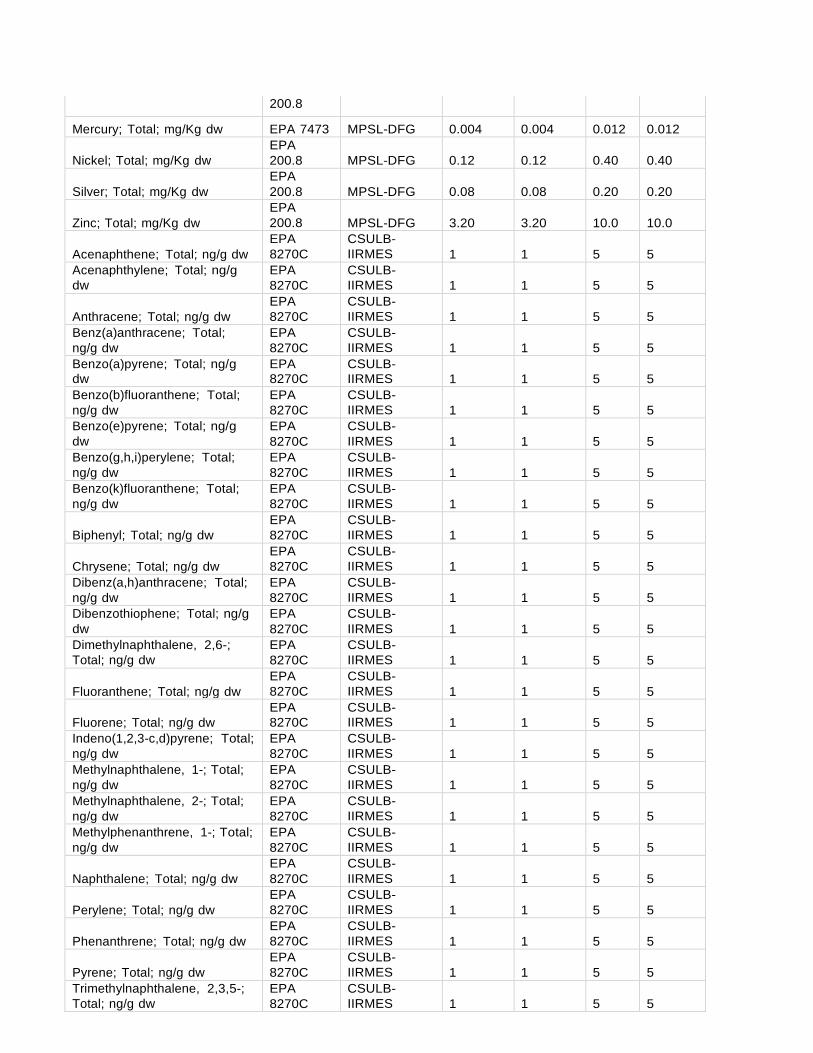
200.8
Mercury; Total; mg/Kg dw EPA 7473 MPSL-DFG 0.004 0.004 0.012 0.012
Nickel; Total; mg/Kg dw EPA 200.8
MPSL-DFG
0.12
0.12
0.40
0.40
Silver; Total; mg/Kg dw
EPA 200.8
MPSL-DFG
0.08
0.08
0.20
0.20
Zinc; Total; mg/Kg dw
EPA 200.8
MPSL-DFG
3.20
3.20
10.0
10.0
Acenaphthene; Total; ng/g dw
EPA 8270C
CSULB- IIRMES
1
1
5
5
Acenaphthylene; Total; ng/g dw
EPA 8270C
CSULB- IIRMES
1
1
5
5
Anthracene; Total; ng/g dw
EPA 8270C
CSULB- IIRMES
1
1
5
5
Benz(a)anthracene; Total; ng/g dw
EPA 8270C
CSULB- IIRMES
1
1
5
5
Benzo(a)pyrene; Total; ng/g dw
EPA 8270C
CSULB- IIRMES
1
1
5
5
Benzo(b)fluoranthene; Total; ng/g dw
EPA 8270C
CSULB- IIRMES
1
1
5
5
Benzo(e)pyrene; Total; ng/g dw
EPA 8270C
CSULB- IIRMES
1
1
5
5
Benzo(g,h,i)perylene; Total; ng/g dw
EPA 8270C
CSULB- IIRMES
1
1
5
5
Benzo(k)fluoranthene; Total; ng/g dw
EPA 8270C
CSULB- IIRMES
1
1
5
5
Biphenyl; Total; ng/g dw
EPA 8270C
CSULB- IIRMES
1
1
5
5
Chrysene; Total; ng/g dw
EPA 8270C
CSULB- IIRMES
1
1
5
5
Dibenz(a,h)anthracene; Total; ng/g dw
EPA 8270C
CSULB- IIRMES
1
1
5
5
Dibenzothiophene; Total; ng/g dw
EPA 8270C
CSULB- IIRMES
1
1
5
5
Dimethylnaphthalene, 2,6-; Total; ng/g dw
EPA 8270C
CSULB- IIRMES
1
1
5
5
Fluoranthene; Total; ng/g dw
EPA 8270C
CSULB- IIRMES
1
1
5
5
Fluorene; Total; ng/g dw
EPA 8270C
CSULB- IIRMES
1
1
5
5
Indeno(1,2,3-c,d)pyrene; Total; ng/g dw
EPA 8270C
CSULB- IIRMES
1
1
5
5
Methylnaphthalene, 1-; Total; ng/g dw
EPA 8270C
CSULB- IIRMES
1
1
5
5
Methylnaphthalene, 2-; Total; ng/g dw
EPA 8270C
CSULB- IIRMES
1
1
5
5
Methylphenanthrene, 1-; Total; ng/g dw
EPA 8270C
CSULB- IIRMES
1
1
5
5
Naphthalene; Total; ng/g dw
EPA 8270C
CSULB- IIRMES
1
1
5
5
Perylene; Total; ng/g dw
EPA 8270C
CSULB- IIRMES
1
1
5
5
Phenanthrene; Total; ng/g dw
EPA 8270C
CSULB- IIRMES
1
1
5
5
Pyrene; Total; ng/g dw
EPA 8270C
CSULB- IIRMES
1
1
5
5
Trimethylnaphthalene, 2,3,5-; Total; ng/g dw
EPA 8270C
CSULB- IIRMES
1
1
5
5
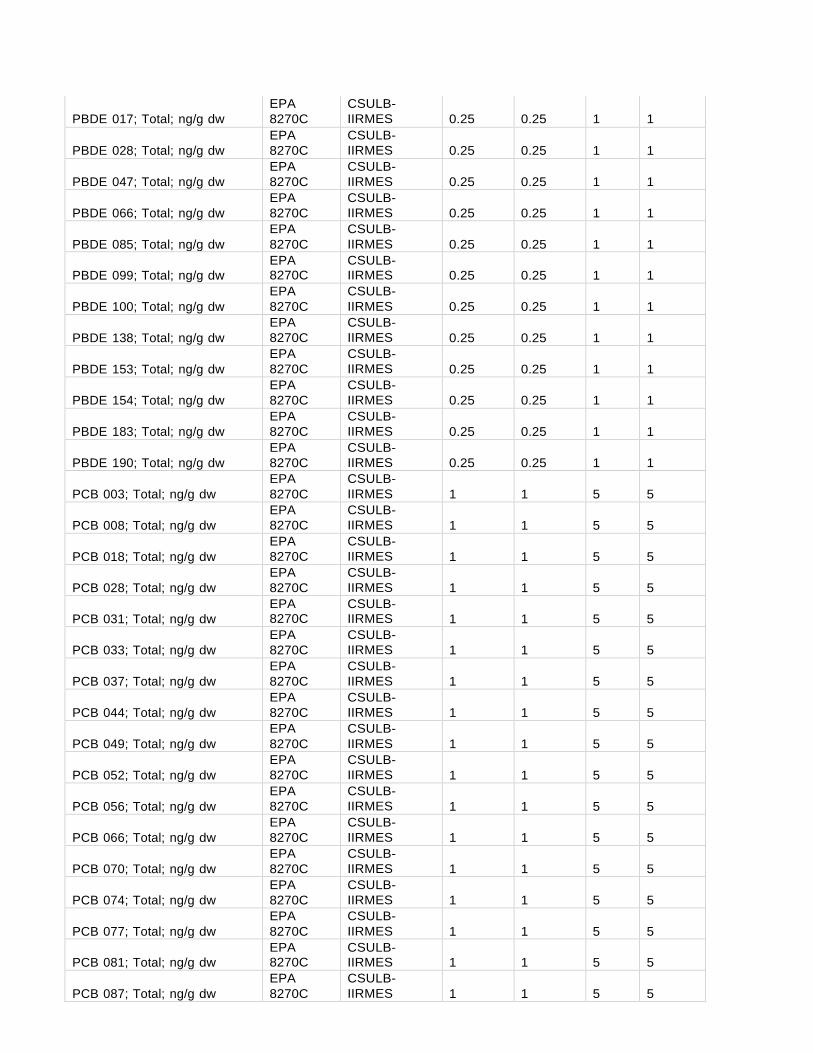
PBDE 017; Total; ng/g dw
EPA 8270C
CSULB- IIRMES
0.25
0.25
1
1
PBDE 028; Total; ng/g dw
EPA 8270C
CSULB- IIRMES
0.25
0.25
1
1
PBDE 047; Total; ng/g dw
EPA 8270C
CSULB- IIRMES
0.25
0.25
1
1
PBDE 066; Total; ng/g dw
EPA 8270C
CSULB- IIRMES
0.25
0.25
1
1
PBDE 085; Total; ng/g dw
EPA 8270C
CSULB- IIRMES
0.25
0.25
1
1
PBDE 099; Total; ng/g dw
EPA 8270C
CSULB- IIRMES
0.25
0.25
1
1
PBDE 100; Total; ng/g dw
EPA 8270C
CSULB- IIRMES
0.25
0.25
1
1
PBDE 138; Total; ng/g dw
EPA 8270C
CSULB- IIRMES
0.25
0.25
1
1
PBDE 153; Total; ng/g dw
EPA 8270C
CSULB- IIRMES
0.25
0.25
1
1
PBDE 154; Total; ng/g dw
EPA 8270C
CSULB- IIRMES
0.25
0.25
1
1
PBDE 183; Total; ng/g dw
EPA 8270C
CSULB- IIRMES
0.25
0.25
1
1
PBDE 190; Total; ng/g dw
EPA 8270C
CSULB- IIRMES
0.25
0.25
1
1
PCB 003; Total; ng/g dw
EPA 8270C
CSULB- IIRMES
1
1
5
5
PCB 008; Total; ng/g dw
EPA 8270C
CSULB- IIRMES
1
1
5
5
PCB 018; Total; ng/g dw
EPA 8270C
CSULB- IIRMES
1
1
5
5
PCB 028; Total; ng/g dw
EPA 8270C
CSULB- IIRMES
1
1
5
5
PCB 031; Total; ng/g dw
EPA 8270C
CSULB- IIRMES
1
1
5
5
PCB 033; Total; ng/g dw
EPA 8270C
CSULB- IIRMES
1
1
5
5
PCB 037; Total; ng/g dw
EPA 8270C
CSULB- IIRMES
1
1
5
5
PCB 044; Total; ng/g dw
EPA 8270C
CSULB- IIRMES
1
1
5
5
PCB 049; Total; ng/g dw
EPA 8270C
CSULB- IIRMES
1
1
5
5
PCB 052; Total; ng/g dw
EPA 8270C
CSULB- IIRMES
1
1
5
5
PCB 056; Total; ng/g dw
EPA 8270C
CSULB- IIRMES
1
1
5
5
PCB 066; Total; ng/g dw
EPA 8270C
CSULB- IIRMES
1
1
5
5
PCB 070; Total; ng/g dw
EPA 8270C
CSULB- IIRMES
1
1
5
5
PCB 074; Total; ng/g dw
EPA 8270C
CSULB- IIRMES
1
1
5
5
PCB 077; Total; ng/g dw
EPA 8270C
CSULB- IIRMES
1
1
5
5
PCB 081; Total; ng/g dw
EPA 8270C
CSULB- IIRMES
1
1
5
5
PCB 087; Total; ng/g dw
EPA 8270C
CSULB- IIRMES
1
1
5
5
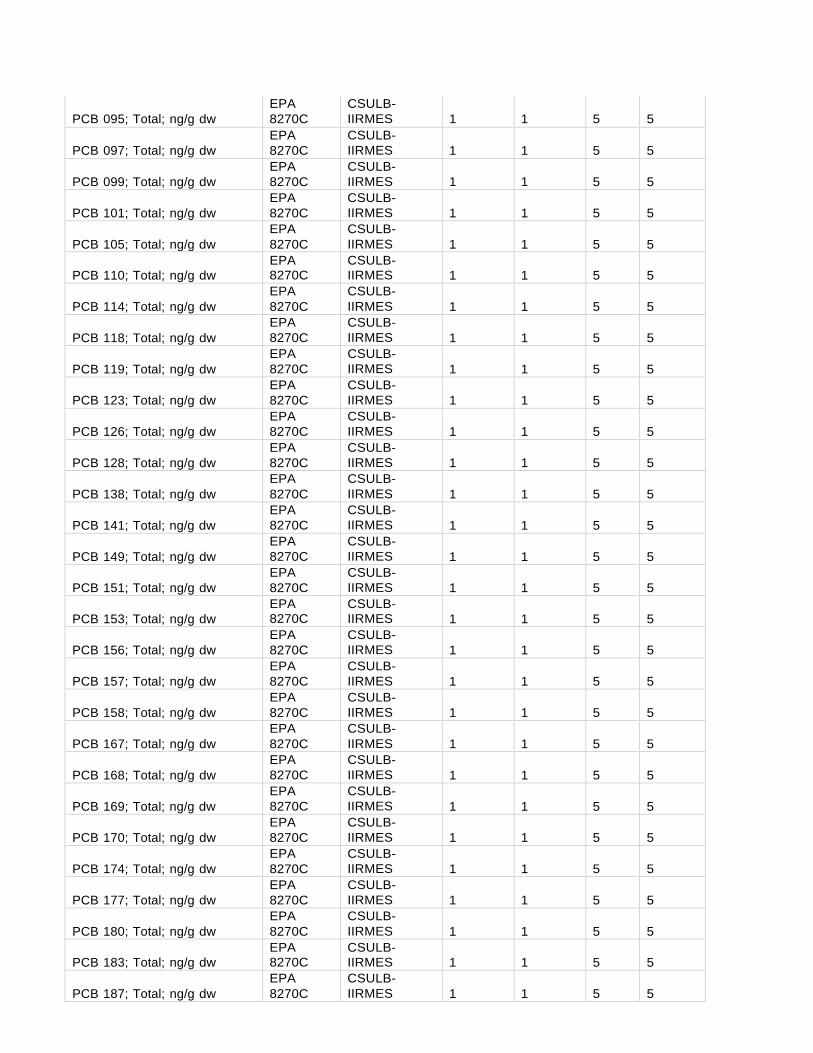
PCB 095; Total; ng/g dw
EPA 8270C
CSULB- IIRMES
1
1
5
5
PCB 097; Total; ng/g dw
EPA 8270C
CSULB- IIRMES
1
1
5
5
PCB 099; Total; ng/g dw
EPA 8270C
CSULB- IIRMES
1
1
5
5
PCB 101; Total; ng/g dw
EPA 8270C
CSULB- IIRMES
1
1
5
5
PCB 105; Total; ng/g dw
EPA 8270C
CSULB- IIRMES
1
1
5
5
PCB 110; Total; ng/g dw
EPA 8270C
CSULB- IIRMES
1
1
5
5
PCB 114; Total; ng/g dw
EPA 8270C
CSULB- IIRMES
1
1
5
5
PCB 118; Total; ng/g dw
EPA 8270C
CSULB- IIRMES
1
1
5
5
PCB 119; Total; ng/g dw
EPA 8270C
CSULB- IIRMES
1
1
5
5
PCB 123; Total; ng/g dw
EPA 8270C
CSULB- IIRMES
1
1
5
5
PCB 126; Total; ng/g dw
EPA 8270C
CSULB- IIRMES
1
1
5
5
PCB 128; Total; ng/g dw
EPA 8270C
CSULB- IIRMES
1
1
5
5
PCB 138; Total; ng/g dw
EPA 8270C
CSULB- IIRMES
1
1
5
5
PCB 141; Total; ng/g dw
EPA 8270C
CSULB- IIRMES
1
1
5
5
PCB 149; Total; ng/g dw
EPA 8270C
CSULB- IIRMES
1
1
5
5
PCB 151; Total; ng/g dw
EPA 8270C
CSULB- IIRMES
1
1
5
5
PCB 153; Total; ng/g dw
EPA 8270C
CSULB- IIRMES
1
1
5
5
PCB 156; Total; ng/g dw
EPA 8270C
CSULB- IIRMES
1
1
5
5
PCB 157; Total; ng/g dw
EPA 8270C
CSULB- IIRMES
1
1
5
5
PCB 158; Total; ng/g dw
EPA 8270C
CSULB- IIRMES
1
1
5
5
PCB 167; Total; ng/g dw
EPA 8270C
CSULB- IIRMES
1
1
5
5
PCB 168; Total; ng/g dw
EPA 8270C
CSULB- IIRMES
1
1
5
5
PCB 169; Total; ng/g dw
EPA 8270C
CSULB- IIRMES
1
1
5
5
PCB 170; Total; ng/g dw
EPA 8270C
CSULB- IIRMES
1
1
5
5
PCB 174; Total; ng/g dw
EPA 8270C
CSULB- IIRMES
1
1
5
5
PCB 177; Total; ng/g dw
EPA 8270C
CSULB- IIRMES
1
1
5
5
PCB 180; Total; ng/g dw
EPA 8270C
CSULB- IIRMES
1
1
5
5
PCB 183; Total; ng/g dw
EPA 8270C
CSULB- IIRMES
1
1
5
5
PCB 187; Total; ng/g dw
EPA 8270C
CSULB- IIRMES
1
1
5
5
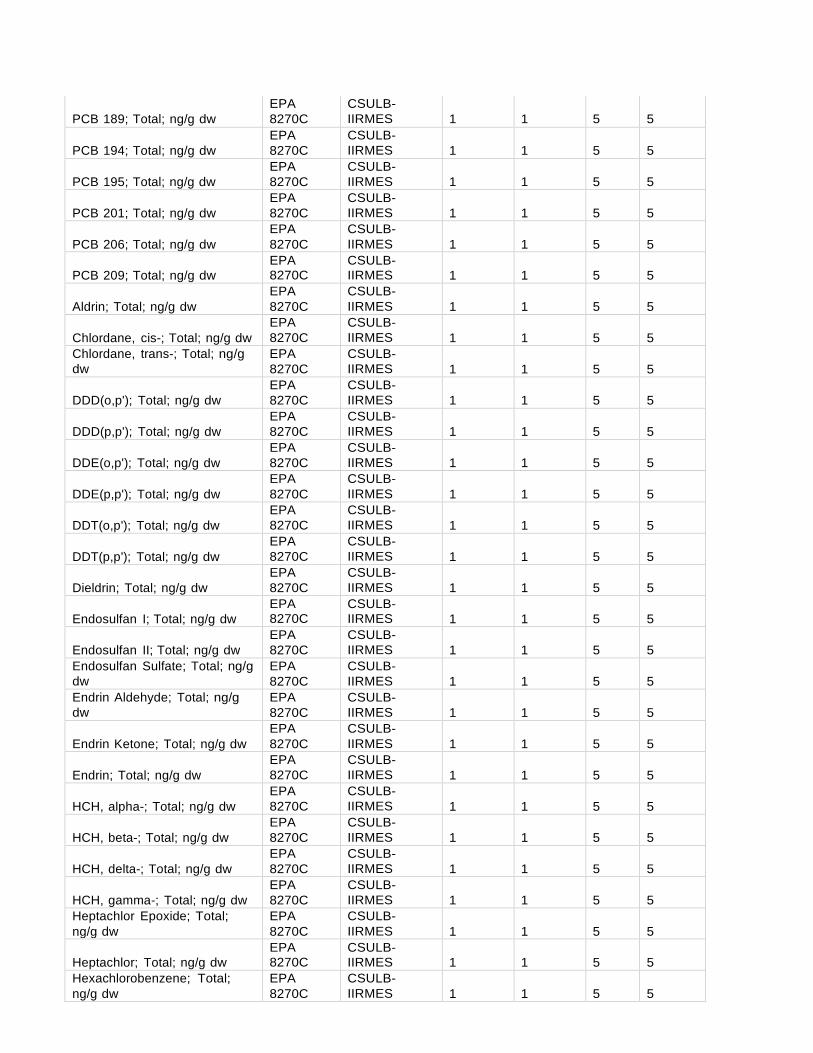
PCB 189; Total; ng/g dw
EPA 8270C
CSULB- IIRMES
1
1
5
5
PCB 194; Total; ng/g dw
EPA 8270C
CSULB- IIRMES
1
1
5
5
PCB 195; Total; ng/g dw
EPA 8270C
CSULB- IIRMES
1
1
5
5
PCB 201; Total; ng/g dw
EPA 8270C
CSULB- IIRMES
1
1
5
5
PCB 206; Total; ng/g dw
EPA 8270C
CSULB- IIRMES
1
1
5
5
PCB 209; Total; ng/g dw
EPA 8270C
CSULB- IIRMES
1
1
5
5
Aldrin; Total; ng/g dw
EPA 8270C
CSULB- IIRMES
1
1
5
5
Chlordane, cis-; Total; ng/g dw
EPA 8270C
CSULB- IIRMES
1
1
5
5
Chlordane, trans-; Total; ng/g dw
EPA 8270C
CSULB- IIRMES
1
1
5
5
DDD(o,p'); Total; ng/g dw
EPA 8270C
CSULB- IIRMES
1
1
5
5
DDD(p,p'); Total; ng/g dw
EPA 8270C
CSULB- IIRMES
1
1
5
5
DDE(o,p'); Total; ng/g dw
EPA 8270C
CSULB- IIRMES
1
1
5
5
DDE(p,p'); Total; ng/g dw
EPA 8270C
CSULB- IIRMES
1
1
5
5
DDT(o,p'); Total; ng/g dw
EPA 8270C
CSULB- IIRMES
1
1
5
5
DDT(p,p'); Total; ng/g dw
EPA 8270C
CSULB- IIRMES
1
1
5
5
Dieldrin; Total; ng/g dw
EPA 8270C
CSULB- IIRMES
1
1
5
5
Endosulfan I; Total; ng/g dw
EPA 8270C
CSULB- IIRMES
1
1
5
5
Endosulfan II; Total; ng/g dw
EPA 8270C
CSULB- IIRMES
1
1
5
5
Endosulfan Sulfate; Total; ng/g dw
EPA 8270C
CSULB- IIRMES
1
1
5
5
Endrin Aldehyde; Total; ng/g dw
EPA 8270C
CSULB- IIRMES
1
1
5
5
Endrin Ketone; Total; ng/g dw
EPA 8270C
CSULB- IIRMES
1
1
5
5
Endrin; Total; ng/g dw
EPA 8270C
CSULB- IIRMES
1
1
5
5
HCH, alpha-; Total; ng/g dw
EPA 8270C
CSULB- IIRMES
1
1
5
5
HCH, beta-; Total; ng/g dw
EPA 8270C
CSULB- IIRMES
1
1
5
5
HCH, delta-; Total; ng/g dw
EPA 8270C
CSULB- IIRMES
1
1
5
5
HCH, gamma-; Total; ng/g dw
EPA 8270C
CSULB- IIRMES
1
1
5
5
Heptachlor Epoxide; Total; ng/g dw
EPA 8270C
CSULB- IIRMES
1
1
5
5
Heptachlor; Total; ng/g dw
EPA 8270C
CSULB- IIRMES
1
1
5
5
Hexachlorobenzene; Total; ng/g dw
EPA 8270C
CSULB- IIRMES
1
1
5
5
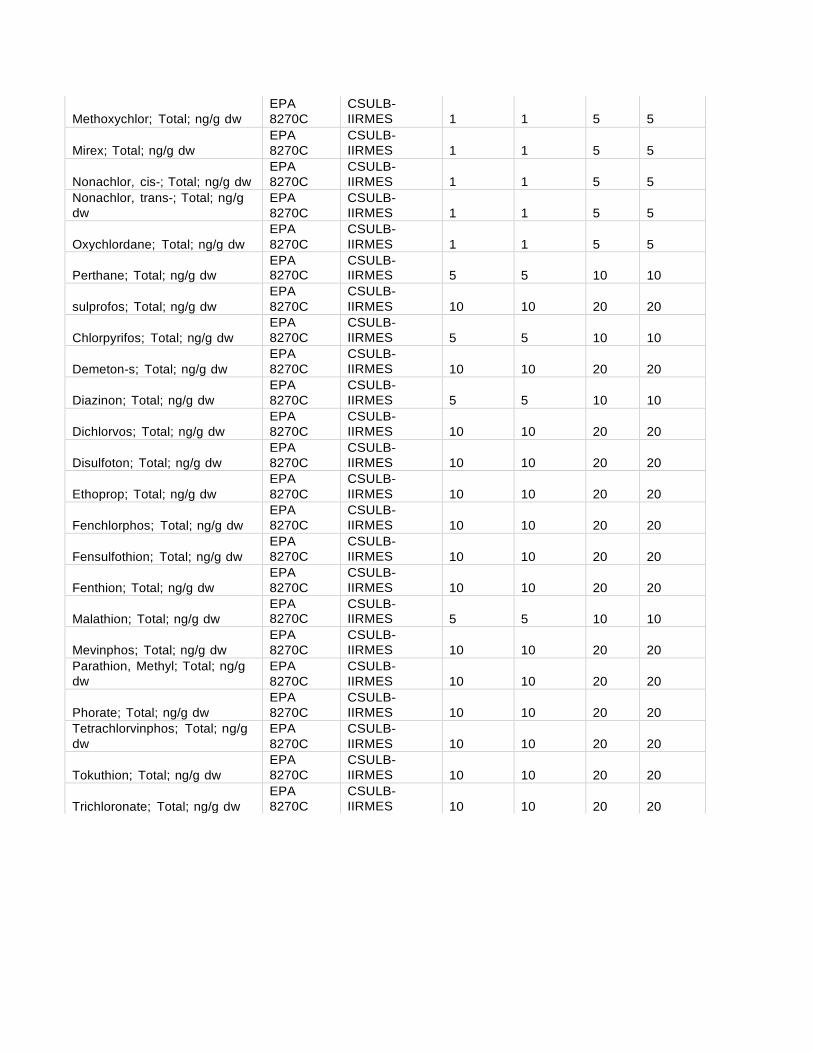
Methoxychlor; Total; ng/g dw
EPA 8270C
CSULB- IIRMES
1
1
5
5
Mirex; Total; ng/g dw
EPA 8270C
CSULB- IIRMES
1
1
5
5
Nonachlor, cis-; Total; ng/g dw
EPA 8270C
CSULB- IIRMES
1
1
5
5
Nonachlor, trans-; Total; ng/g dw
EPA 8270C
CSULB- IIRMES
1
1
5
5
Oxychlordane; Total; ng/g dw
EPA 8270C
CSULB- IIRMES
1
1
5
5
Perthane; Total; ng/g dw
EPA 8270C
CSULB- IIRMES
5
5
10
10
sulprofos; Total; ng/g dw
EPA 8270C
CSULB- IIRMES
10
10
20
20
Chlorpyrifos; Total; ng/g dw
EPA 8270C
CSULB- IIRMES
5
5
10
10
Demeton-s; Total; ng/g dw
EPA 8270C
CSULB- IIRMES
10
10
20
20
Diazinon; Total; ng/g dw
EPA 8270C
CSULB- IIRMES
5
5
10
10
Dichlorvos; Total; ng/g dw
EPA 8270C
CSULB- IIRMES
10
10
20
20
Disulfoton; Total; ng/g dw
EPA 8270C
CSULB- IIRMES
10
10
20
20
Ethoprop; Total; ng/g dw
EPA 8270C
CSULB- IIRMES
10
10
20
20
Fenchlorphos; Total; ng/g dw
EPA 8270C
CSULB- IIRMES
10
10
20
20
Fensulfothion; Total; ng/g dw
EPA 8270C
CSULB- IIRMES
10
10
20
20
Fenthion; Total; ng/g dw
EPA 8270C
CSULB- IIRMES
10
10
20
20
Malathion; Total; ng/g dw
EPA 8270C
CSULB- IIRMES
5
5
10
10
Mevinphos; Total; ng/g dw
EPA 8270C
CSULB- IIRMES
10
10
20
20
Parathion, Methyl; Total; ng/g dw
EPA 8270C
CSULB- IIRMES
10
10
20
20
Phorate; Total; ng/g dw
EPA 8270C
CSULB- IIRMES
10
10
20
20
Tetrachlorvinphos; Total; ng/g dw
EPA 8270C
CSULB- IIRMES
10
10
20
20
Tokuthion; Total; ng/g dw
EPA 8270C
CSULB- IIRMES
10
10
20
20
Trichloronate; Total; ng/g dw
EPA 8270C
CSULB- IIRMES
10
10
20
20
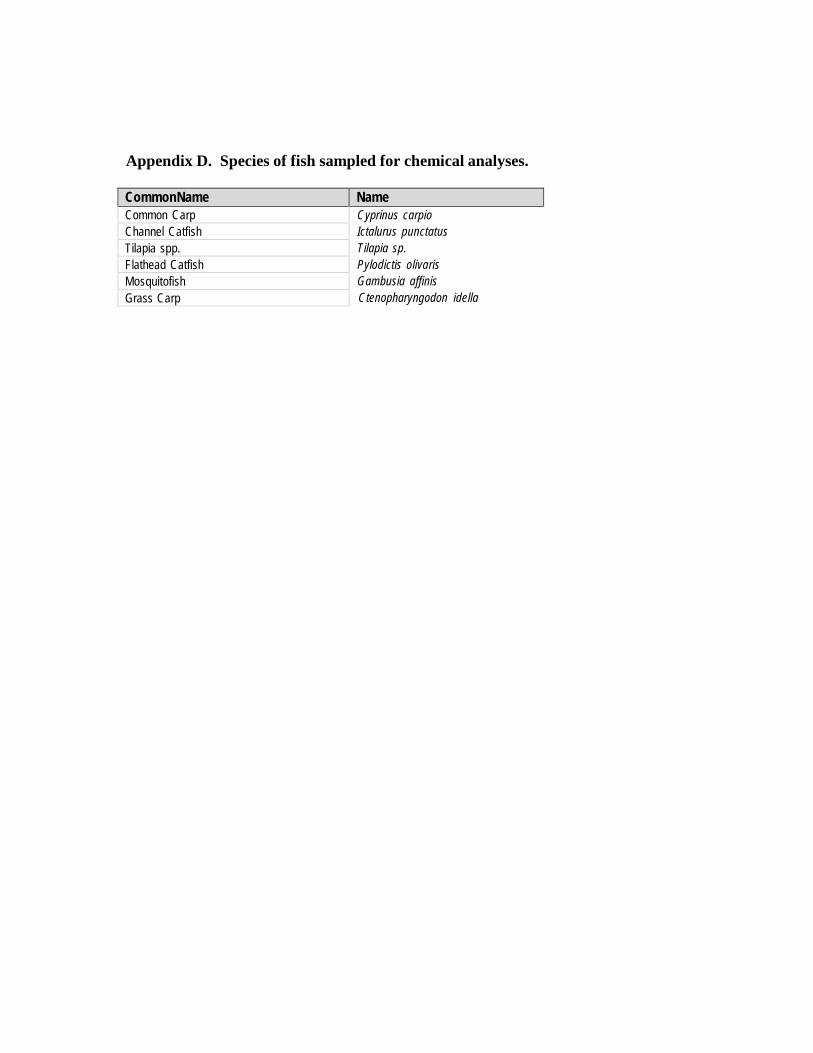
CommonName Name Common Carp Channel Catfish Tilapia spp. Flathead Catfish Mosquitofish Grass Carp
Appendix D. Species of fish sampled for chemical analyses.
Cyprinus carpio Ictalurus punctatus Tilapia sp. Pylodictis olivaris Gambusia affinis Ctenopharyngodon idella
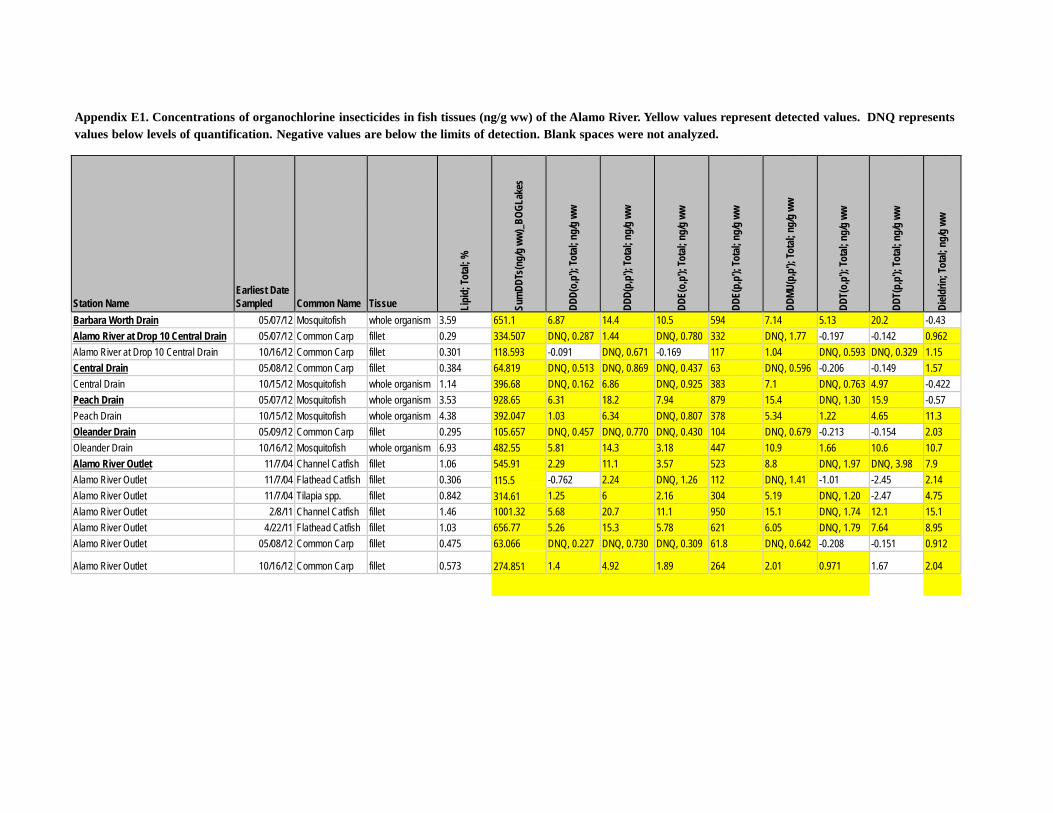
Appendix E1. Concentrations of organochlorine insecticides in fish tissues (ng/g ww) of the Alamo River. Yellow values represent detected values. DNQ represents values below levels of quantification. Negative values are below the limits of detection. Blank spaces were not analyzed.
Station Name
Earliest Date Sampled
Common Name
Tissue
Lipi
d; To
tal;
%
Sum
DDTs
(ng/
g ww
)_BO
GLak
es
DDD(
o,p')
; Tot
al; n
g/g
ww
DDD(
p,p')
; Tot
al; n
g/g
ww
DDE(
o,p')
; Tot
al; n
g/g
ww
DDE(
p,p')
; Tot
al; n
g/g
ww
DDMU
(p,p
'); To
tal;
ng/g
ww
DDT(
o,p')
; Tot
al; n
g/g
ww
DDT(
p,p')
; Tot
al; n
g/g
ww
Dield
rin; T
otal;
ng/
g ww
Barbara Worth Drain 05/07/12 Mosquitofish whole organism 3.59 651.1 6.87 14.4 10.5 594 7.14 5.13 20.2 -0.43 Alamo River at Drop 10 Central Drain 05/07/12 Common Carp fillet 0.29 334.507 DNQ, 0.287 1.44 DNQ, 0.780 332 DNQ, 1.77 -0.197 -0.142 0.962 Alamo River at Drop 10 Central Drain 10/16/12 Common Carp fillet 0.301 118.593 -0.091 DNQ, 0.671 -0.169 117 1.04 DNQ, 0.593 DNQ, 0.329 1.15 Central Drain 05/08/12 Common Carp fillet 0.384 64.819 DNQ, 0.513 DNQ, 0.869 DNQ, 0.437 63 DNQ, 0.596 -0.206 -0.149 1.57 Central Drain 10/15/12 Mosquitofish whole organism 1.14 396.68 DNQ, 0.162 6.86 DNQ, 0.925 383 7.1 DNQ, 0.763 4.97 -0.422 Peach Drain 05/07/12 Mosquitofish whole organism 3.53 928.65 6.31 18.2 7.94 879 15.4 DNQ, 1.30 15.9 -0.57 Peach Drain 10/15/12 Mosquitofish whole organism 4.38 392.047 1.03 6.34 DNQ, 0.807 378 5.34 1.22 4.65 11.3 Oleander Drain 05/09/12 Common Carp fillet 0.295 105.657 DNQ, 0.457 DNQ, 0.770 DNQ, 0.430 104 DNQ, 0.679 -0.213 -0.154 2.03 Oleander Drain 10/16/12 Mosquitofish whole organism 6.93 482.55 5.81 14.3 3.18 447 10.9 1.66 10.6 10.7 Alamo River Outlet 11/7/04 Channel Catfish fillet 1.06 545.91 2.29 11.1 3.57 523 8.8 DNQ, 1.97 DNQ, 3.98 7.9 Alamo River Outlet 11/7/04 Flathead Catfish fillet 0.306 115.5 -0.762 2.24 DNQ, 1.26 112 DNQ, 1.41 -1.01 -2.45 2.14 Alamo River Outlet 11/7/04 Tilapia spp. fillet 0.842 314.61 1.25 6 2.16 304 5.19 DNQ, 1.20 -2.47 4.75 Alamo River Outlet 2/8/11 Channel Catfish fillet 1.46 1001.32 5.68 20.7 11.1 950 15.1 DNQ, 1.74 12.1 15.1 Alamo River Outlet 4/22/11 Flathead Catfish fillet 1.03 656.77 5.26 15.3 5.78 621 6.05 DNQ, 1.79 7.64 8.95 Alamo River Outlet 05/08/12 Common Carp fillet 0.475 63.066 DNQ, 0.227 DNQ, 0.730 DNQ, 0.309 61.8 DNQ, 0.642 -0.208 -0.151 0.912 Alamo River Outlet
10/16/12
Common Carp
fillet
0.573
274.851
1.4
4.92
1.89
264
2.01
0.971
1.67
2.04
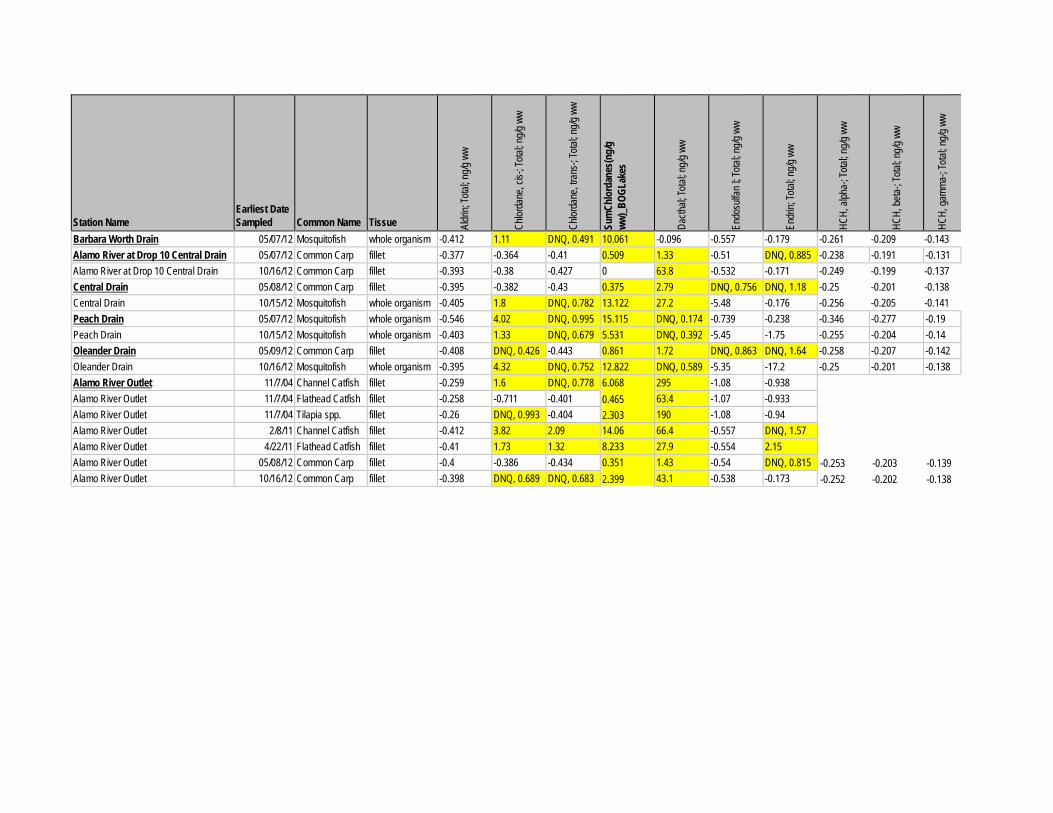
-0.253 -0.203 -0.139 -0.252 -0.202 -0.138
Station Name
Earliest Date Sampled
Common Name
Tissue
Aldr
in; To
tal; n
g/g w
w
Chlor
dane
, cis-
; Tota
l; ng/g
ww
Chlor
dane
, tran
s-; To
tal; n
g/g w
w
Sum
Chlo
rdan
es(n
g/g
ww)_
BOGL
akes
Dacth
al; To
tal; n
g/g w
w
Endo
sulfa
n I; T
otal; n
g/g w
w
Endr
in; To
tal; n
g/g w
w
HCH,
alph
a-; T
otal; n
g/g w
w
HCH,
beta-
; Tota
l; ng/g
ww
HCH,
gamm
a-; T
otal; n
g/g w
w
Barbara Worth Drain 05/07/12 Mosquitofish whole organism -0.412 1.11 DNQ, 0.491 10.061 -0.096 -0.557 -0.179 -0.261 -0.209 -0.143 Alamo River at Drop 10 Central Drain 05/07/12 Common Carp fillet -0.377 -0.364 -0.41 0.509 1.33 -0.51 DNQ, 0.885 -0.238 -0.191 -0.131 Alamo River at Drop 10 Central Drain 10/16/12 Common Carp fillet -0.393 -0.38 -0.427 0 63.8 -0.532 -0.171 -0.249 -0.199 -0.137
-0.25 -0.201 -0.138 -0.256 -0.205 -0.141
Central Drain 05/08/12 Common Carp fillet -0.395 -0.382 -0.43 0.375 2.79 DNQ, 0.756 DNQ, 1.18 Central Drain 10/15/12 Mosquitofish whole organism -0.405 1.8 DNQ, 0.782 13.122 27.2 -5.48 -0.176 Peach Drain 05/07/12 Mosquitofish whole organism -0.546 4.02 DNQ, 0.995 15.115 DNQ, 0.174 -0.739 -0.238 -0.346 -0.277 -0.19 Peach Drain 10/15/12 Mosquitofish whole organism -0.403 1.33 DNQ, 0.679 5.531 DNQ, 0.392 -5.45 -1.75 -0.255 -0.204 -0.14 Oleander Drain 05/09/12 Common Carp fillet -0.408 DNQ, 0.426 -0.443 0.861 1.72 DNQ, 0.863 DNQ, 1.64 -0.258 -0.207 -0.142 Oleander Drain 10/16/12 Mosquitofish whole organism -0.395 4.32 DNQ, 0.752 12.822 DNQ, 0.589 -5.35 -17.2 -0.25 -0.201 -0.138 Alamo River Outlet 11/7/04 Channel Catfish fillet -0.259 1.6 DNQ, 0.778 6.068 295 -1.08 -0.938 Alamo River Outlet 11/7/04 Flathead Catfish fillet -0.258 -0.711 -0.401 0.465
2.303 63.4 -1.07 -0.933
Alamo River Outlet 11/7/04 Tilapia spp. fillet -0.26 DNQ, 0.993 -0.404 190 -1.08 -0.94 Alamo River Outlet 2/8/11 Channel Catfish fillet -0.412 3.82 2.09 14.06 66.4 -0.557 DNQ, 1.57 Alamo River Outlet 4/22/11 Flathead Catfish fillet -0.41 1.73 1.32 8.233 27.9 -0.554 2.15 Alamo River Outlet 05/08/12 Common Carp fillet -0.4 -0.386 -0.434 0.351 1.43 -0.54 DNQ, 0.815 Alamo River Outlet 10/16/12 Common Carp fillet -0.398 DNQ, 0.689 DNQ, 0.683 2.399 43.1 -0.538 -0.173
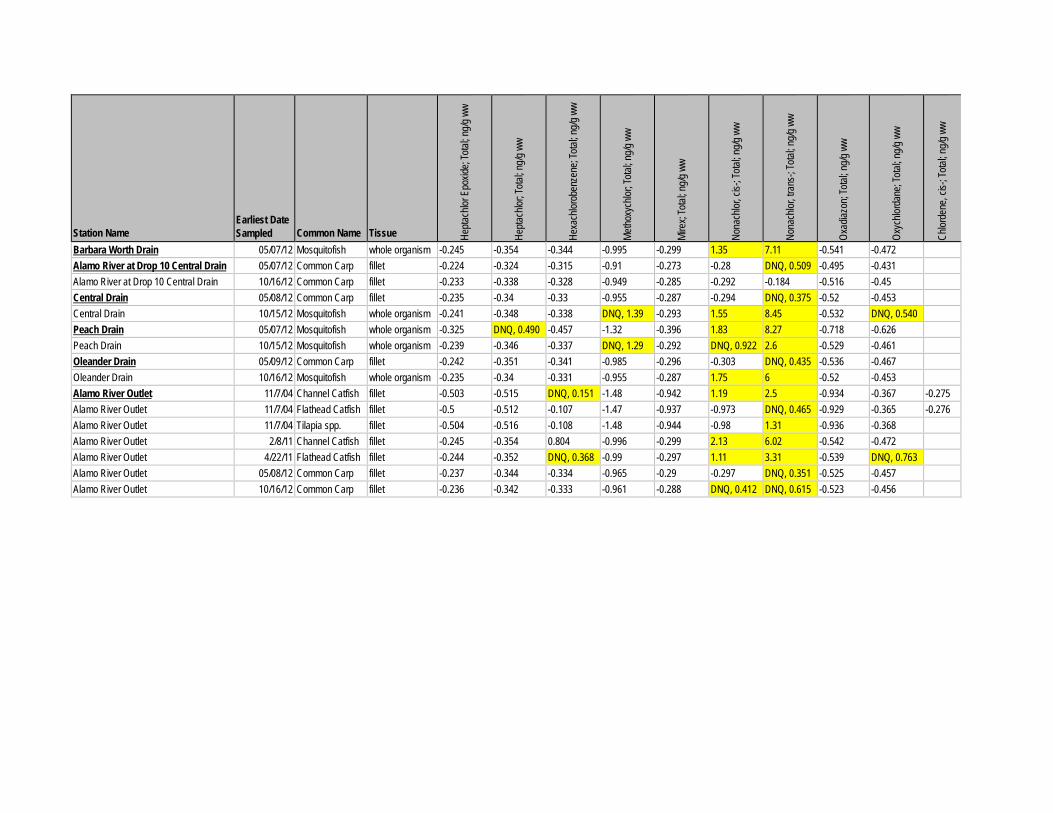
Station Name
Earliest Date Sampled
Common Name
Tissue
Hepta
chlor
Epo
xide;
Total
; ng/g
ww
Hepta
chlor
; Tota
l; ng/g
ww
Hexa
chlor
oben
zene
; Tota
l; ng/g
ww
Metho
xych
lor; T
otal; n
g/g w
w
Mire
x; To
tal; n
g/g w
w
Nona
chlor
, cis-
; Tota
l; ng/g
ww
Nona
chlor
, tran
s-; To
tal; n
g/g w
w
Oxad
iazon
; Tota
l; ng/g
ww
Oxyc
hlord
ane;
Total
; ng/g
ww
Chlor
dene
, cis-
; Tota
l; ng/g
ww
Barbara Worth Drain 05/07/12 Mosquitofish whole organism -0.245 -0.354 -0.344 -0.995 -0.299 1.35 7.11 -0.541 -0.472 Alamo River at Drop 10 Central Drain 05/07/12 Common Carp fillet -0.224 -0.324 -0.315 -0.91 -0.273 -0.28 DNQ, 0.509 -0.495 -0.431 Alamo River at Drop 10 Central Drain 10/16/12 Common Carp fillet -0.233 -0.338 -0.328 -0.949 -0.285 -0.292 -0.184 -0.516 -0.45 Central Drain 05/08/12 Common Carp fillet -0.235 -0.34 -0.33 -0.955 -0.287 -0.294 DNQ, 0.375 -0.52 -0.453 Central Drain 10/15/12 Mosquitofish whole organism -0.241 -0.348 -0.338 DNQ, 1.39 -0.293 1.55 8.45 -0.532 DNQ, 0.540 Peach Drain 05/07/12 Mosquitofish whole organism -0.325 DNQ, 0.490 -0.457 -1.32 -0.396 1.83 8.27 -0.718 -0.626 Peach Drain 10/15/12 Mosquitofish whole organism -0.239 -0.346 -0.337 DNQ, 1.29 -0.292 DNQ, 0.922 2.6 -0.529 -0.461 Oleander Drain 05/09/12 Common Carp fillet -0.242 -0.351 -0.341 -0.985 -0.296 -0.303 DNQ, 0.435 -0.536 -0.467 Oleander Drain 10/16/12 Mosquitofish whole organism -0.235 -0.34 -0.331 -0.955 -0.287 1.75 6 -0.52 -0.453 Alamo River Outlet 11/7/04 Channel Catfish fillet -0.503 -0.515 DNQ, 0.151 -1.48 -0.942 1.19 2.5 -0.934 -0.367 -0.275 Alamo River Outlet 11/7/04 Flathead Catfish fillet -0.5 -0.512 -0.107 -1.47 -0.937 -0.973 DNQ, 0.465 -0.929 -0.365 -0.276 Alamo River Outlet 11/7/04 Tilapia spp. fillet -0.504 -0.516 -0.108 -1.48 -0.944 -0.98 1.31 -0.936 -0.368 Alamo River Outlet 2/8/11 Channel Catfish fillet -0.245 -0.354 0.804 -0.996 -0.299 2.13 6.02 -0.542 -0.472 Alamo River Outlet 4/22/11 Flathead Catfish fillet -0.244 -0.352 DNQ, 0.368 -0.99 -0.297 1.11 3.31 -0.539 DNQ, 0.763 Alamo River Outlet 05/08/12 Common Carp fillet -0.237 -0.344 -0.334 -0.965 -0.29 -0.297 DNQ, 0.351 -0.525 -0.457 Alamo River Outlet 10/16/12 Common Carp fillet -0.236 -0.342 -0.333 -0.961 -0.288 DNQ, 0.412 DNQ, 0.615 -0.523 -0.456
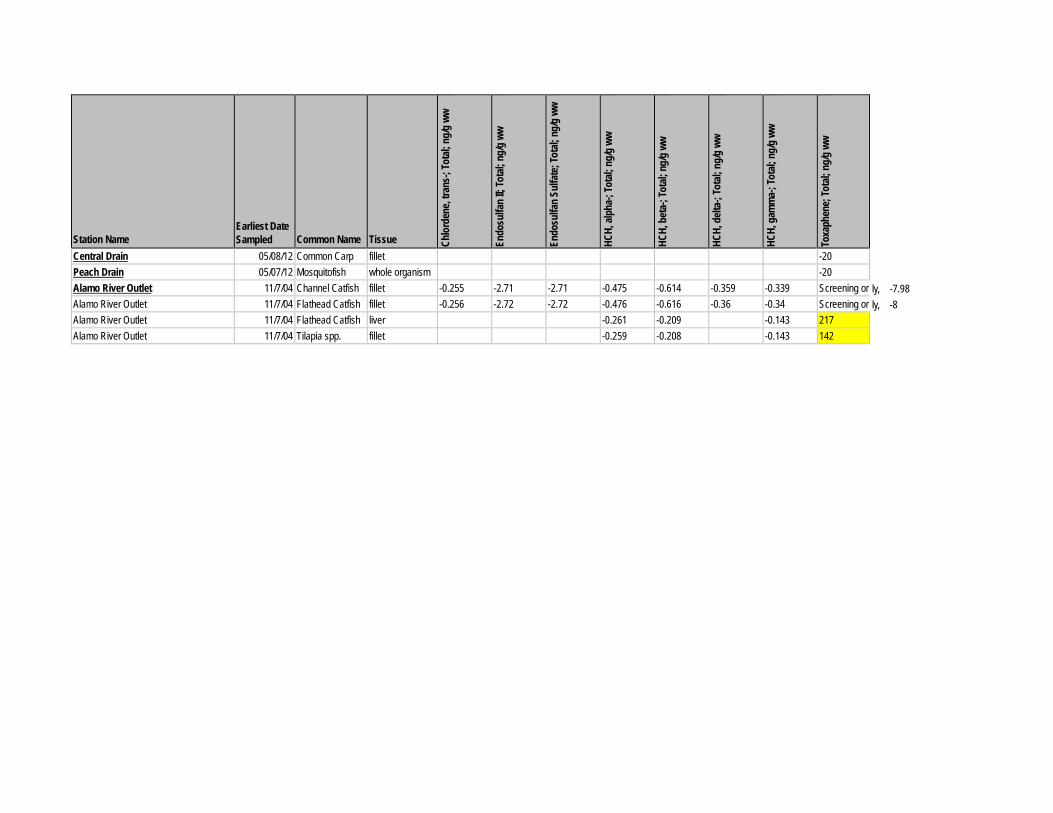
Station Name
Earliest Date Sampled
Common Name
Tissue Ch
lord
ene,
trans
-; To
tal;
ng/g
ww
Endo
sulfa
n II;
Tota
l; ng
/g w
w
Endo
sulfa
n Su
lfate
; Tot
al; n
g/g
ww
HCH,
alph
a-; T
otal;
ng/
g ww
HCH,
bet
a-; T
otal;
ng/
g ww
HCH,
delt
a-; T
otal;
ng/
g ww
HCH,
gam
ma-
; Tot
al; n
g/g
ww
Toxa
phen
e; To
tal;
ng/g
ww
Central Drain 05/08/12 Common Carp fillet -20 Peach Drain 05/07/12 Mosquitofish whole organism -20 Alamo River Outlet 11/7/04 Channel Catfish fillet -0.255 -2.71 -2.71 -0.475 -0.614 -0.359 -0.339 Screening on Alamo River Outlet 11/7/04 Flathead Catfish fillet -0.256 -2.72 -2.72 -0.476 -0.616 -0.36 -0.34 Screening on Alamo River Outlet 11/7/04 Flathead Catfish liver -0.261 -0.209 -0.143 217 Alamo River Outlet 11/7/04 Tilapia spp. fillet -0.259 -0.208 -0.143 142
ly, -7.98 ly, -8
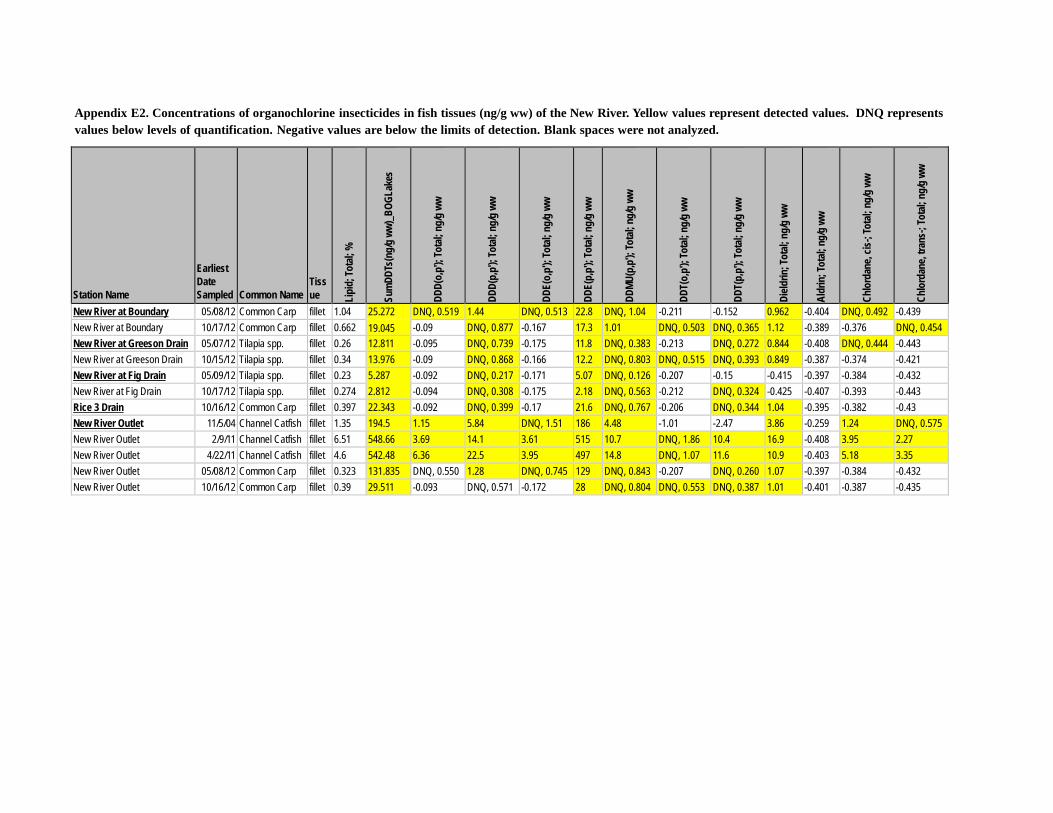
Appendix E2. Concentrations of organochlorine insecticides in fish tissues (ng/g ww) of the New River. Yellow values represent detected values. DNQ represents values below levels of quantification. Negative values are below the limits of detection. Blank spaces were not analyzed.
Station Name
Earliest Date Sampled
Common Name
Tiss ue Li
pid;
Tota
l; %
Sum
DDTs
(ng/
g ww
)_BO
GLak
es
DDD(
o,p')
; Tot
al; n
g/g
ww
DDD(
p,p')
; Tot
al; n
g/g
ww
DDE(
o,p')
; Tot
al; n
g/g
ww
DDE(
p,p')
; Tot
al; n
g/g
ww
DDMU
(p,p
'); To
tal;
ng/g
ww
DDT(
o,p')
; Tot
al; n
g/g
ww
DDT(
p,p')
; Tot
al; n
g/g
ww
Dield
rin; T
otal;
ng/
g ww
Aldr
in; T
otal;
ng/
g ww
Chlo
rdan
e, cis
-; To
tal;
ng/g
ww
Chlo
rdan
e, tra
ns-;
Tota
l; ng
/g w
w
New River at Boundary 05/08/12 Common Carp fillet 1.04 25.272 DNQ, 0.519 1.44 DNQ, 0.513 22.8 DNQ, 1.04 -0.211 -0.152 0.962 -0.404 DNQ, 0.492 -0.439 New River at Boundary 10/17/12 Common Carp fillet 0.662 19.045 -0.09 DNQ, 0.877 -0.167 17.3 1.01 DNQ, 0.503 DNQ, 0.365 1.12 -0.389 -0.376 DNQ, 0.454 New River at Greeson Drain 05/07/12 Tilapia spp. fillet 0.26 12.811 -0.095 DNQ, 0.739 -0.175 11.8 DNQ, 0.383 -0.213 DNQ, 0.272 0.844 -0.408 DNQ, 0.444 -0.443 New River at Greeson Drain 10/15/12 Tilapia spp. fillet 0.34 13.976 -0.09 DNQ, 0.868 -0.166 12.2 DNQ, 0.803 DNQ, 0.515 DNQ, 0.393 0.849 -0.387 -0.374 -0.421 New River at Fig Drain 05/09/12 Tilapia spp. fillet 0.23 5.287
2.812 -0.092 DNQ, 0.217 -0.171 5.07 DNQ, 0.126 -0.207 -0.15 -0.415 -0.397 -0.384 -0.432
New River at Fig Drain 10/17/12 Tilapia spp. fillet 0.274 -0.094 DNQ, 0.308 -0.175 2.18 DNQ, 0.563 -0.212 DNQ, 0.324 -0.425 -0.407 -0.393 -0.443 Rice 3 Drain 10/16/12 Common Carp fillet 0.397 22.343 -0.092 DNQ, 0.399 -0.17 21.6 DNQ, 0.767 -0.206 DNQ, 0.344 1.04 -0.395 -0.382 -0.43 New River Outlet 11/5/04 Channel Catfish fillet 1.35 194.5 1.15 5.84 DNQ, 1.51 186 4.48 -1.01 -2.47 3.86 -0.259 1.24 DNQ, 0.575 New River Outlet 2/9/11 Channel Catfish fillet 6.51 548.66 3.69 14.1 3.61 515 10.7 DNQ, 1.86 10.4 16.9 -0.408 3.95 2.27 New River Outlet 4/22/11 Channel Catfish fillet 4.6 542.48 6.36 22.5 3.95 497 14.8 DNQ, 1.07 11.6 10.9 -0.403 5.18 3.35 New River Outlet 05/08/12 Common Carp fillet 0.323 131.835 DNQ, 0.550 1.28 DNQ, 0.745 129 DNQ, 0.843 -0.207 DNQ, 0.260 1.07 -0.397 -0.384 -0.432 New River Outlet 10/16/12 Common Carp fillet 0.39 29.511 -0.093 DNQ, 0.571 -0.172 28 DNQ, 0.804 DNQ, 0.553 DNQ, 0.387 1.01 -0.401 -0.387 -0.435
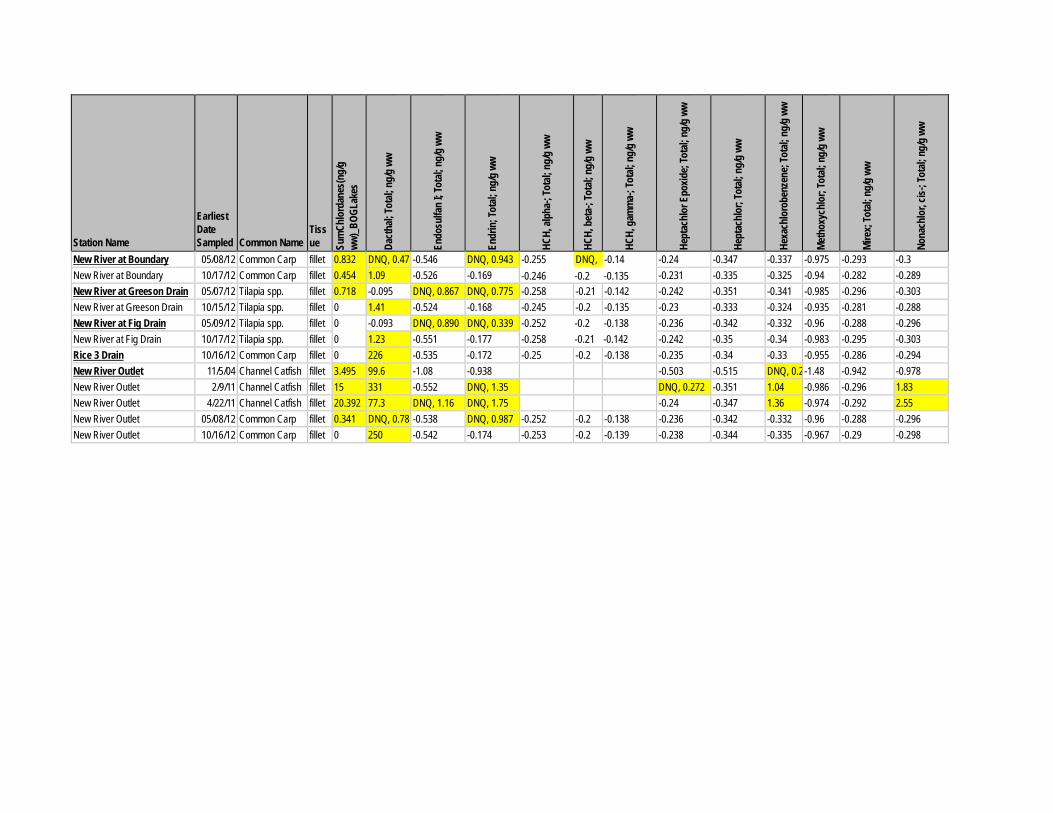
Station Name
Earliest Date Sampled
Common Name
Tiss ue Su
mCh
lord
anes
(ng/
g ww
)_BO
GLak
es
Dact
hal;
Tota
l; ng
/g w
w
Endo
sulfa
n I;
Tota
l; ng
/g w
w
Endr
in; T
otal;
ng/
g ww
HCH,
alph
a-; T
otal;
ng/
g ww
HCH,
bet
a-; T
otal;
ng/
g ww
HC
H, g
amm
a-; T
otal;
ng/
g ww
Hept
achl
or E
poxid
e; To
tal;
ng/g
ww
Hept
achl
or; T
otal;
ng/
g ww
Hexa
chlo
robe
nzen
e; To
tal;
ng/g
ww
Meth
oxyc
hlor
; Tot
al; n
g/g
ww
Mire
x; To
tal;
ng/g
ww
Nona
chlo
r, cis
-; To
tal;
ng/g
ww
New River at Boundary 05/08/12 Common Carp fillet 0.832 0.454
DNQ, 0.47 -0.546 DNQ, 0.943 -0.255 DNQ, -0.14 -0.24 -0.347 -0.337 -0.975 -0.293 -0.3 New River at Boundary 10/17/12 Common Carp fillet 1.09 -0.526 -0.169 -0.246 -0.2 -0.135 -0.231 -0.335 -0.325 -0.94 -0.282 -0.289 New River at Greeson Drain 05/07/12 Tilapia spp. fillet 0.718 -0.095 DNQ, 0.867 DNQ, 0.775 -0.258 -0.21 -0.142 -0.242 -0.351 -0.341 -0.985 -0.296 -0.303 New River at Greeson Drain 10/15/12 Tilapia spp. fillet 0 1.41 -0.524 -0.168 -0.245 -0.2 -0.135 -0.23 -0.333 -0.324 -0.935 -0.281 -0.288 New River at Fig Drain 05/09/12 Tilapia spp. fillet 0
0 -0.093 DNQ, 0.890 DNQ, 0.339 -0.252 -0.2 -0.138
-0.258 -0.21 -0.142 -0.236 -0.342 -0.332 -0.96 -0.288 -0.296
New River at Fig Drain 10/17/12 Tilapia spp. fillet 1.23 -0.551 -0.177 -0.242 -0.35 -0.34 -0.983 -0.295 -0.303 Rice 3 Drain 10/16/12 Common Carp fillet 0 226 -0.535 -0.172 -0.25 -0.2 -0.138 -0.235 -0.34 -0.33 -0.955 -0.286 -0.294 New River Outlet 11/5/04 Channel Catfish fillet 3.495 99.6 -1.08 -0.938 -0.503 -0.515 DNQ, 0.2 -1.48 -0.942 -0.978 New River Outlet 2/9/11 Channel Catfish fillet 15 331 -0.552 DNQ, 1.35 DNQ, 0.272 -0.351 1.04 -0.986 -0.296 1.83 New River Outlet 4/22/11 Channel Catfish fillet 20.392 77.3 DNQ, 1.16 DNQ, 1.75 -0.24 -0.347 1.36 -0.974 -0.292 2.55 New River Outlet 05/08/12 Common Carp fillet 0.341 DNQ, 0.78 -0.538 DNQ, 0.987 -0.252 -0.2 -0.138 -0.236 -0.342 -0.332 -0.96 -0.288 -0.296 New River Outlet 10/16/12 Common Carp fillet 0 250 -0.542 -0.174 -0.253 -0.2 -0.139 -0.238 -0.344 -0.335 -0.967 -0.29 -0.298
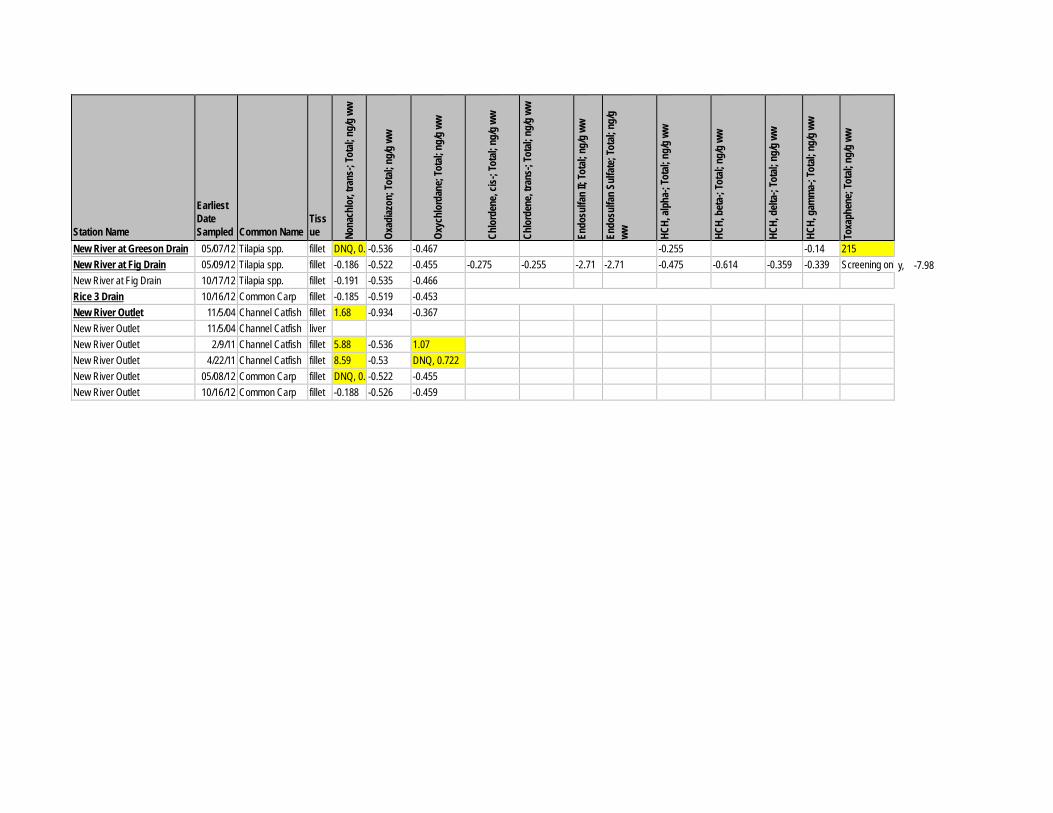
Station Name
Earliest Date Sampled
Common Name
Tiss ue No
nach
lor,
trans
-; To
tal;
ng/g
ww
Oxad
iazon
; Tot
al; n
g/g
ww
Oxyc
hlor
dane
; Tot
al; n
g/g
ww
Chlo
rden
e, cis
-; To
tal;
ng/g
ww
Chlo
rden
e, tra
ns-;
Tota
l; ng
/g w
w
Endo
sulfa
n II;
Tota
l; ng
/g w
w
Endo
sulfa
n Su
lfate
; Tot
al; n
g/g
ww
HCH,
alph
a-; T
otal;
ng/
g ww
HCH,
bet
a-; T
otal;
ng/
g ww
HCH,
delt
a-; T
otal;
ng/
g ww
HCH,
gam
ma-
; Tot
al; n
g/g
ww
Toxa
phen
e; To
tal;
ng/g
ww
New River at Greeson Drain 05/07/12 Tilapia spp. fillet DNQ, 0. -0.536 -0.467 -0.255 -0.14 215 New River at Fig Drain 05/09/12 Tilapia spp. fillet -0.186 -0.522 -0.455 -0.275 -0.255 -2.71 -2.71 -0.475 -0.614 -0.359 -0.339 Screening onl New River at Fig Drain 10/17/12 Tilapia spp. fillet -0.191 -0.535 -0.466 Rice 3 Drain 10/16/12 Common Carp fillet -0.185 -0.519 -0.453 New River Outlet 11/5/04 Channel Catfish fillet 1.68 -0.934 -0.367 New River Outlet 11/5/04 Channel Catfish liver New River Outlet 2/9/11 Channel Catfish fillet 5.88 -0.536 1.07 New River Outlet 4/22/11 Channel Catfish fillet 8.59 -0.53 DNQ, 0.722 New River Outlet 05/08/12 Common Carp fillet DNQ, 0. -0.522 -0.455 New River Outlet 10/16/12 Common Carp fillet -0.188 -0.526 -0.459
y, -7.98
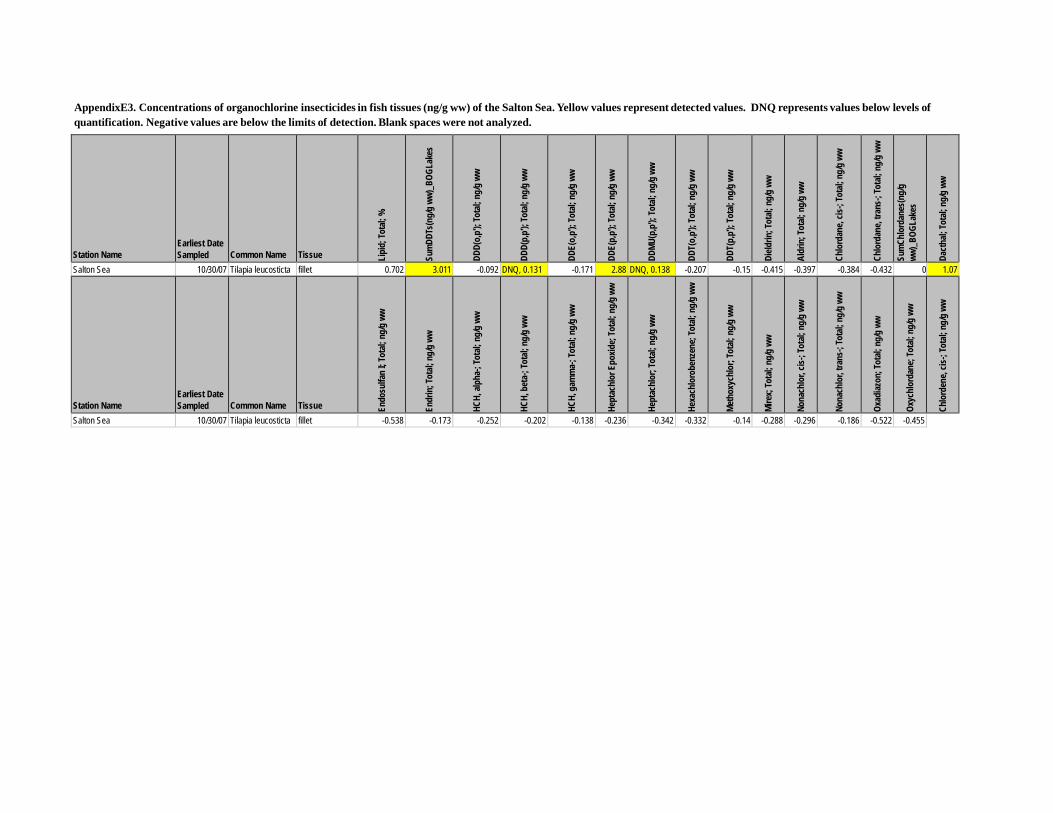
AppendixE3. Concentrations of organochlorine insecticides in fish tissues (ng/g ww) of the Salton Sea. Yellow values represent detected values. DNQ represents values below levels of quantification. Negative values are below the limits of detection. Blank spaces were not analyzed.
Station Name
Earliest Date Sampled
Common Name
Tissue Li
pid;
Tota
l; %
Sum
DDTs
(ng/
g ww
)_BO
GLak
es
DDD(
o,p')
; Tot
al; n
g/g
ww
DDD(
p,p')
; Tot
al; n
g/g
ww
DDE(
o,p')
; Tot
al; n
g/g
ww
DDE(
p,p')
; Tot
al; n
g/g
ww
DDMU
(p,p
'); To
tal;
ng/g
ww
DDT(
o,p')
; Tot
al; n
g/g
ww
DDT(
p,p')
; Tot
al; n
g/g
ww
Dield
rin; T
otal;
ng/
g ww
Aldr
in; T
otal;
ng/
g ww
Chlo
rdan
e, cis
-; To
tal;
ng/g
ww
Chlo
rdan
e, tra
ns-;
Tota
l; ng
/g w
w
Sum
Chlo
rdan
es(n
g/g
ww)_
BOGL
akes
Dact
hal;
Tota
l; ng
/g w
w
Salton Sea 10/30/07 Tilapia leucosticta fillet 0.702 3.011 -0.092 DNQ, 0.131 -0.171 2.88 DNQ, 0.138 -0.207 -0.15 -0.415 -0.397 -0.384 -0.432 0 1.07 Station Name
Earliest Date Sampled
Common Name
Tissue En
dosu
lfan
I; To
tal;
ng/g
ww
Endr
in; T
otal;
ng/
g ww
HCH,
alph
a-; T
otal;
ng/
g ww
HCH,
bet
a-; T
otal;
ng/
g ww
HCH,
gam
ma-
; Tot
al; n
g/g
ww
Hept
achl
or E
poxid
e; To
tal;
ng/g
ww
Hept
achl
or; T
otal;
ng/
g ww
Hexa
chlo
robe
nzen
e; To
tal;
ng/g
ww
Meth
oxyc
hlor
; Tot
al; n
g/g
ww
Mire
x; To
tal;
ng/g
ww
Nona
chlo
r, cis
-; To
tal;
ng/g
ww
Nona
chlo
r, tra
ns-;
Tota
l; ng
/g w
w
Oxad
iazon
; Tot
al; n
g/g
ww
Oxyc
hlor
dane
; Tot
al; n
g/g
ww
Chlo
rden
e, cis
-; To
tal;
ng/g
ww
Salton Sea 10/30/07 Tilapia leucosticta fillet -0.538 -0.173 -0.252 -0.202 -0.138 -0.236 -0.342 -0.332 -0.14 -0.288 -0.296 -0.186 -0.522 -0.455
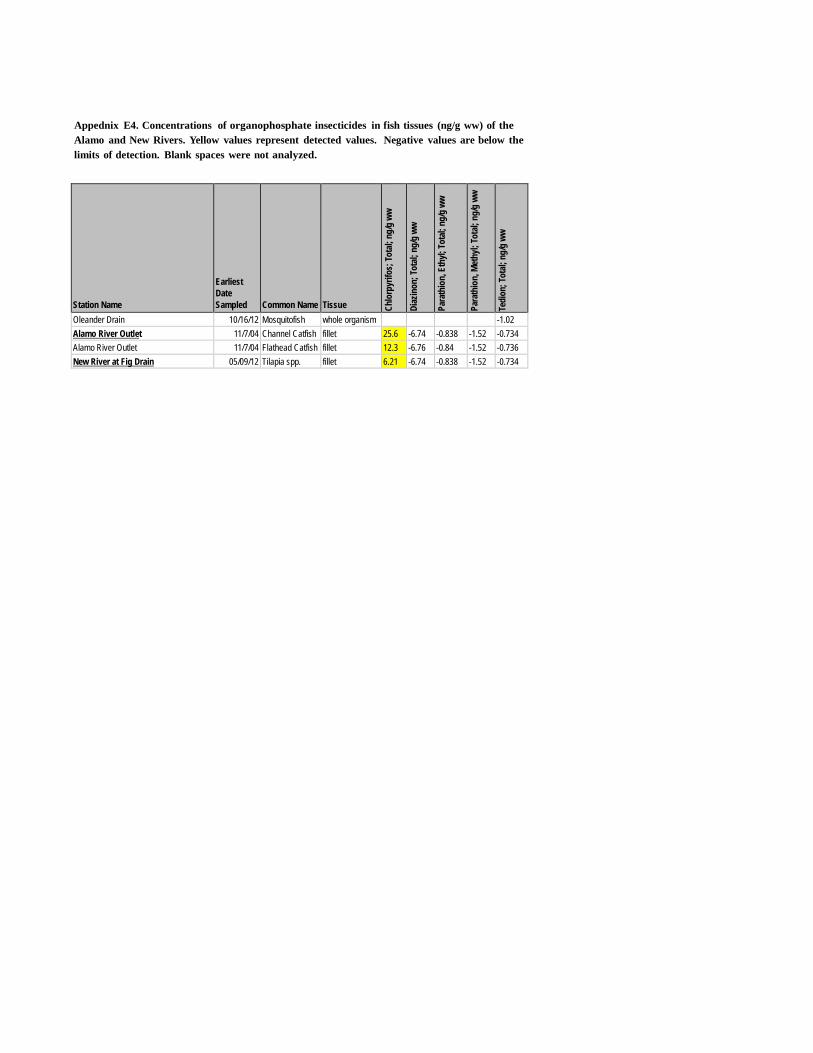
Appednix E4. Concentrations of organophosphate insecticides in fish tissues (ng/g ww) of the Alamo and New Rivers. Yellow values represent detected values. Negative values are below the limits of detection. Blank spaces were not analyzed.
Station Name
Earliest Date Sampled
Common Name
Tissue Ch
lorp
yrifo
s; To
tal;
ng/g
ww
Diaz
inon
; Tot
al; n
g/g
ww
Para
thio
n, E
thyl;
Tota
l; ng
/g w
w
Para
thio
n, M
ethy
l; To
tal;
ng/g
ww
Tedi
on; T
otal;
ng/
g ww
Oleander Drain 10/16/12 Mosquitofish whole organism -1.02 Alamo River Outlet 11/7/04 Channel Catfish fillet 25.6 -6.74 -0.838 -1.52 -0.734 Alamo River Outlet 11/7/04 Flathead Catfish fillet 12.3 -6.76 -0.84 -1.52 -0.736 New River at Fig Drain 05/09/12 Tilapia spp. fillet 6.21 -6.74 -0.838 -1.52 -0.734
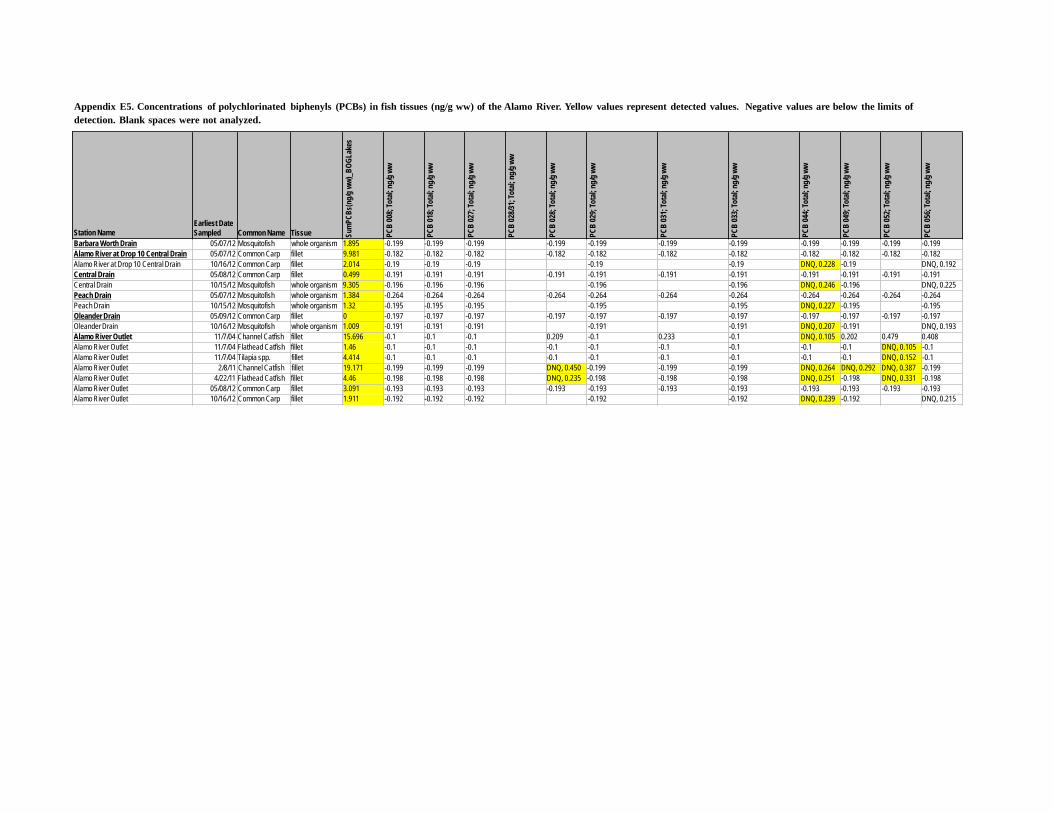
SumP
CBs(
ng/g
ww)
_BOG
Lake
s
PCB
008;
Tota
l; ng/
g ww
PCB
018;
Tota
l; ng/
g ww
PCB
027;
Tota
l; ng/
g ww
PCB
028/3
1; To
tal; n
g/g w
w
PCB
028;
Tota
l; ng/
g ww
PCB
029;
Tota
l; ng/
g ww
PCB
031;
Tota
l; ng/
g ww
PCB
033;
Tota
l; ng/
g ww
PCB
044;
Tota
l; ng/
g ww
PCB
049;
Tota
l; ng/
g ww
PCB
052;
Tota
l; ng/
g ww
PCB
056;
Tota
l; ng/
g ww
Appendix E5. Concentrations of polychlorinated biphenyls (PCBs) in fish tissues (ng/g ww) of the Alamo River. Yellow values represent detected values. Negative values are below the limits of detection. Blank spaces were not analyzed.
Station Name Earliest Date Sampled Common Name Tissue
Barbara Worth Drain 05/07/12 Mosquitofish whole organism 1.895 -0.199 -0.199 -0.199 -0.199 -0.199 -0.199 -0.199 -0.199 -0.199 -0.199 -0.199 Alamo River at Drop 10 Central Drain 05/07/12 Common Carp fillet 9.981 -0.182 -0.182 -0.182 -0.182 -0.182 -0.182 -0.182 -0.182 -0.182 -0.182 -0.182 Alamo River at Drop 10 Central Drain 10/16/12 Common Carp fillet 2.014 -0.19 -0.19 -0.19 -0.19 -0.19 DNQ, 0.228 -0.19 DNQ, 0.192 Central Drain 05/08/12 Common Carp fillet 0.499 -0.191 -0.191 -0.191 -0.191 -0.191 -0.191 -0.191 -0.191 -0.191 -0.191 -0.191 Central Drain 10/15/12 Mosquitofish whole organism 9.305 -0.196 -0.196 -0.196 -0.196 -0.196 DNQ, 0.246 -0.196 DNQ, 0.225 Peach Drain 05/07/12 Mosquitofish whole organism 1.384 -0.264 -0.264 -0.264 -0.264 -0.264 -0.264 -0.264 -0.264 -0.264 -0.264 -0.264 Peach Drain 10/15/12 Mosquitofish whole organism 1.32 -0.195 -0.195 -0.195 -0.195 -0.195 DNQ, 0.227 -0.195 -0.195 Oleander Drain 05/09/12 Common Carp fillet 0 -0.197 -0.197 -0.197 -0.197 -0.197 -0.197 -0.197 -0.197 -0.197 -0.197 -0.197 Oleander Drain 10/16/12 Mosquitofish whole organism 1.009 -0.191 -0.191 -0.191 -0.191 -0.191 DNQ, 0.207 -0.191 DNQ, 0.193 Alamo River Outlet 11/7/04 Channel Catfish fillet 15.696 -0.1 -0.1 -0.1 0.209 -0.1 0.233 -0.1 DNQ, 0.105 0.202 0.479 0.408 Alamo River Outlet 11/7/04 Flathead Catfish fillet 1.46 -0.1 -0.1 -0.1 -0.1 -0.1 -0.1 -0.1 -0.1 -0.1 DNQ, 0.105 -0.1 Alamo River Outlet 11/7/04 Tilapia spp. fillet 4.414 -0.1 -0.1 -0.1 -0.1 -0.1 -0.1 -0.1 -0.1 -0.1 DNQ, 0.152 -0.1 Alamo River Outlet 2/8/11 Channel Catfish fillet 19.171 -0.199 -0.199 -0.199 DNQ, 0.450 -0.199 -0.199 -0.199 DNQ, 0.264 DNQ, 0.292 DNQ, 0.387 -0.199 Alamo River Outlet 4/22/11 Flathead Catfish fillet 4.46 -0.198 -0.198 -0.198 DNQ, 0.235 -0.198 -0.198 -0.198 DNQ, 0.251 -0.198 DNQ, 0.331 -0.198 Alamo River Outlet 05/08/12 Common Carp fillet 3.091 -0.193 -0.193 -0.193 -0.193 -0.193 -0.193 -0.193 -0.193 -0.193 -0.193 -0.193 Alamo River Outlet 10/16/12 Common Carp fillet 1.911 -0.192 -0.192 -0.192 -0.192 -0.192 DNQ, 0.239 -0.192 DNQ, 0.215
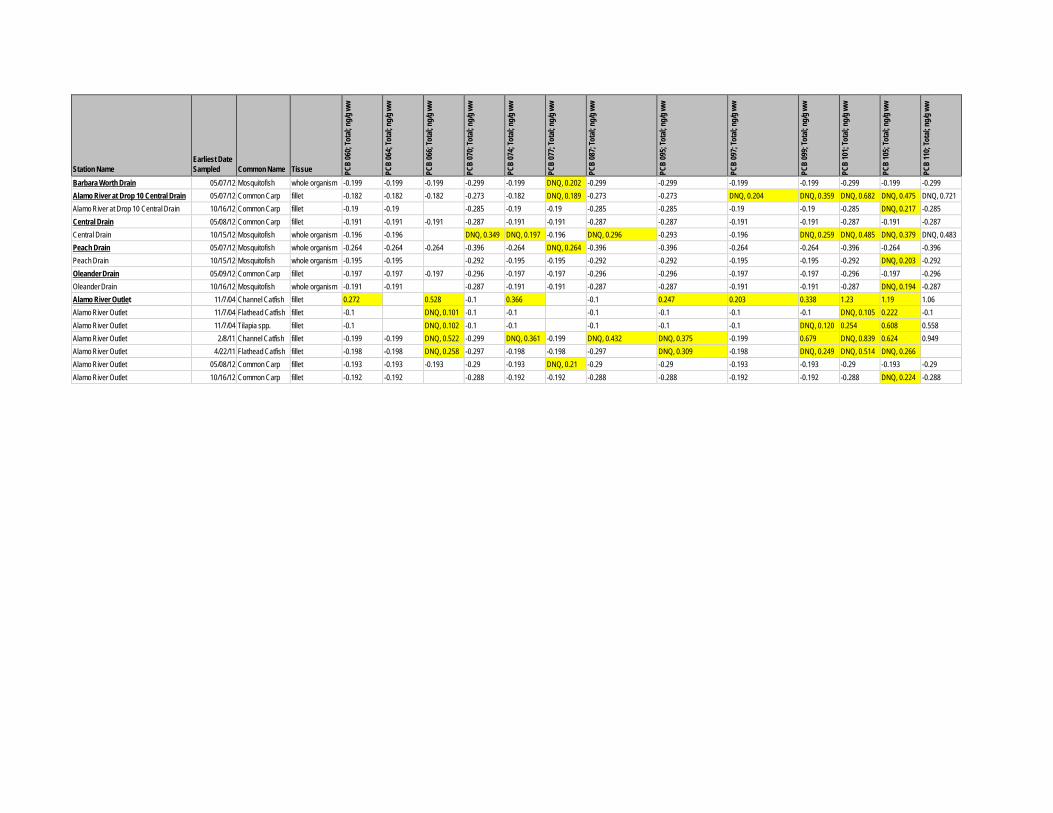
Station Name
Earliest Date Sampled
Common Name
Tissue PC
B 06
0; To
tal; n
g/g w
w
PCB
064;
Tota
l; ng/
g ww
PCB
066;
Tota
l; ng/
g ww
PCB
070;
Tota
l; ng/
g ww
PCB
074;
Tota
l; ng/
g ww
PCB
077;
Tota
l; ng/
g ww
PCB
087;
Tota
l; ng/
g ww
PCB
095;
Tota
l; ng/
g ww
PCB
097;
Tota
l; ng/
g ww
PCB
099;
Tota
l; ng/
g ww
PCB
101;
Tota
l; ng/
g ww
PCB
105;
Tota
l; ng/
g ww
PCB
110;
Tota
l; ng/
g ww
Barbara Worth Drain 05/07/12 Mosquitofish whole organism -0.199 -0.199 -0.199 -0.299 -0.199 DNQ, 0.202 -0.299 -0.299 -0.199 -0.199 -0.299 -0.199 -0.299 Alamo River at Drop 10 Central Drain 05/07/12 Common Carp fillet -0.182 -0.182 -0.182 -0.273 -0.182 DNQ, 0.189 -0.273 -0.273 DNQ, 0.204 DNQ, 0.359 DNQ, 0.682 DNQ, 0.475 DNQ, 0.721 Alamo River at Drop 10 Central Drain 10/16/12 Common Carp fillet -0.19 -0.19 -0.285 -0.19 -0.19 -0.285 -0.285 -0.19 -0.19 -0.285 DNQ, 0.217 -0.285 Central Drain 05/08/12 Common Carp fillet -0.191 -0.191 -0.191 -0.287 -0.191 -0.191 -0.287 -0.287 -0.191 -0.191 -0.287 -0.191 -0.287 Central Drain 10/15/12 Mosquitofish whole organism -0.196 -0.196 DNQ, 0.349 DNQ, 0.197 -0.196 DNQ, 0.296 -0.293 -0.196 DNQ, 0.259 DNQ, 0.485 DNQ, 0.379 DNQ, 0.483 Peach Drain 05/07/12 Mosquitofish whole organism -0.264 -0.264 -0.264 -0.396 -0.264 DNQ, 0.264 -0.396 -0.396 -0.264 -0.264 -0.396 -0.264 -0.396 Peach Drain 10/15/12 Mosquitofish whole organism -0.195 -0.195 -0.292 -0.195 -0.195 -0.292 -0.292 -0.195 -0.195 -0.292 DNQ, 0.203 -0.292 Oleander Drain 05/09/12 Common Carp fillet -0.197 -0.197 -0.197 -0.296 -0.197 -0.197 -0.296 -0.296 -0.197 -0.197 -0.296 -0.197 -0.296 Oleander Drain 10/16/12 Mosquitofish whole organism -0.191 -0.191 -0.287 -0.191 -0.191 -0.287 -0.287 -0.191 -0.191 -0.287 DNQ, 0.194 -0.287 Alamo River Outlet 11/7/04 Channel Catfish fillet 0.272 0.528 -0.1 0.366 -0.1 0.247 0.203 0.338 1.23 1.19 1.06 Alamo River Outlet 11/7/04 Flathead Catfish fillet -0.1 DNQ, 0.101 -0.1 -0.1 -0.1 -0.1 -0.1 -0.1 DNQ, 0.105 0.222 -0.1 Alamo River Outlet 11/7/04 Tilapia spp. fillet -0.1 DNQ, 0.102 -0.1 -0.1 -0.1 -0.1 -0.1 DNQ, 0.120 0.254 0.608 0.558 Alamo River Outlet 2/8/11 Channel Catfish fillet -0.199 -0.199 DNQ, 0.522 -0.299 DNQ, 0.361 -0.199 DNQ, 0.432 DNQ, 0.375 -0.199 0.679 DNQ, 0.839 0.624 0.949 Alamo River Outlet 4/22/11 Flathead Catfish fillet -0.198 -0.198 DNQ, 0.258 -0.297 -0.198 -0.198 -0.297 DNQ, 0.309 -0.198 DNQ, 0.249 DNQ, 0.514 DNQ, 0.266 Alamo River Outlet 05/08/12 Common Carp fillet -0.193 -0.193 -0.193 -0.29 -0.193 DNQ, 0.21 -0.29 -0.29 -0.193 -0.193 -0.29 -0.193 -0.29 Alamo River Outlet 10/16/12 Common Carp fillet -0.192 -0.192 -0.288 -0.192 -0.192 -0.288 -0.288 -0.192 -0.192 -0.288 DNQ, 0.224 -0.288
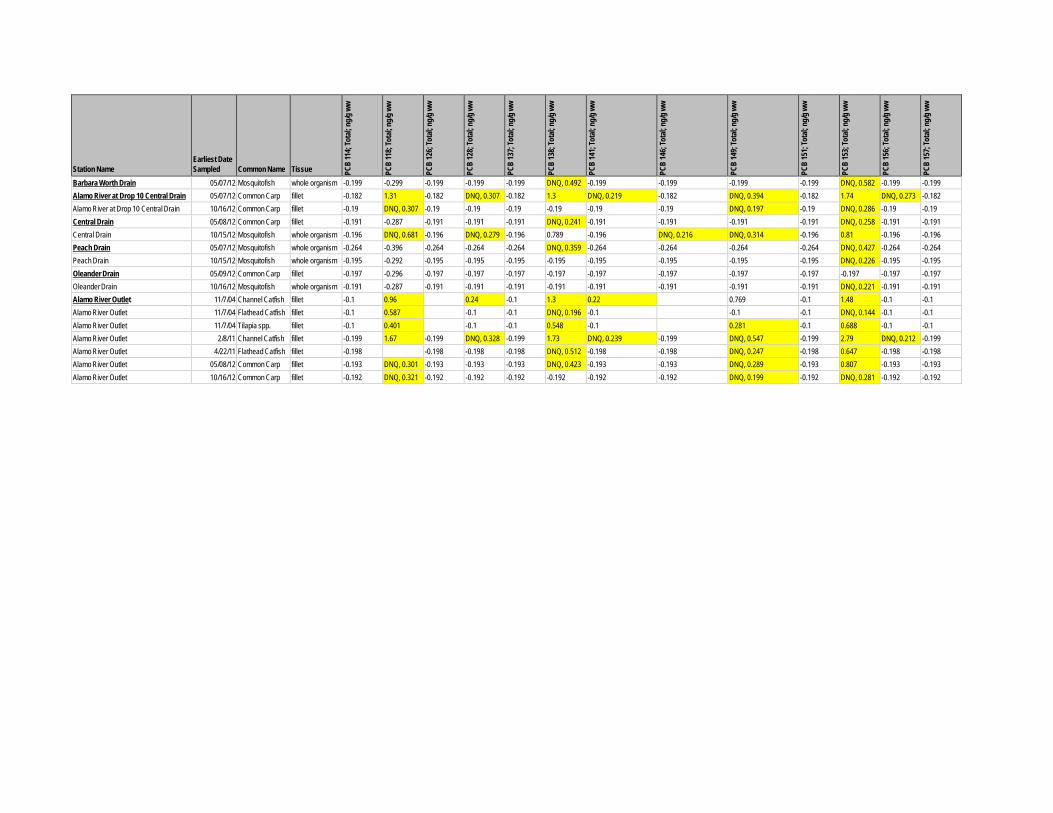
Station Name
Earliest Date Sampled
Common Name
Tissue PC
B 11
4; To
tal; n
g/g w
w
PCB
118;
Tota
l; ng/
g ww
PCB
126;
Tota
l; ng/
g ww
PCB
128;
Tota
l; ng/
g ww
PCB
137;
Tota
l; ng/
g ww
PCB
138;
Tota
l; ng/
g ww
PCB
141;
Tota
l; ng/
g ww
PCB
146;
Tota
l; ng/
g ww
PCB
149;
Tota
l; ng/
g ww
PCB
151;
Tota
l; ng/
g ww
PCB
153;
Tota
l; ng/
g ww
PCB
156;
Tota
l; ng/
g ww
PCB
157;
Tota
l; ng/
g ww
Barbara Worth Drain 05/07/12 Mosquitofish whole organism -0.199 -0.299 -0.199 -0.199 -0.199 DNQ, 0.492 -0.199 -0.199 -0.199 -0.199 DNQ, 0.582 -0.199 -0.199 Alamo River at Drop 10 Central Drain 05/07/12 Common Carp fillet -0.182 1.31 -0.182 DNQ, 0.307 -0.182 1.3 DNQ, 0.219 -0.182 DNQ, 0.394 -0.182 1.74 DNQ, 0.273 -0.182 Alamo River at Drop 10 Central Drain 10/16/12 Common Carp fillet -0.19 DNQ, 0.307 -0.19 -0.19 -0.19 -0.19 -0.19 -0.19 DNQ, 0.197 -0.19 DNQ, 0.286 -0.19 -0.19 Central Drain 05/08/12 Common Carp fillet -0.191 -0.287 -0.191 -0.191 -0.191 DNQ, 0.241 -0.191 -0.191 -0.191 -0.191 DNQ, 0.258 -0.191 -0.191 Central Drain 10/15/12 Mosquitofish whole organism -0.196 DNQ, 0.681 -0.196 DNQ, 0.279 -0.196 0.789 -0.196 DNQ, 0.216 DNQ, 0.314 -0.196 0.81 -0.196 -0.196 Peach Drain 05/07/12 Mosquitofish whole organism -0.264 -0.396 -0.264 -0.264 -0.264 DNQ, 0.359 -0.264 -0.264 -0.264 -0.264 DNQ, 0.427 -0.264 -0.264 Peach Drain 10/15/12 Mosquitofish whole organism -0.195 -0.292 -0.195 -0.195 -0.195 -0.195 -0.195 -0.195 -0.195 -0.195 DNQ, 0.226 -0.195 -0.195 Oleander Drain 05/09/12 Common Carp fillet -0.197 -0.296 -0.197 -0.197 -0.197 -0.197 -0.197 -0.197 -0.197 -0.197 -0.197 -0.197 -0.197 Oleander Drain 10/16/12 Mosquitofish whole organism -0.191 -0.287 -0.191 -0.191 -0.191 -0.191 -0.191 -0.191 -0.191 -0.191 DNQ, 0.221 -0.191 -0.191 Alamo River Outlet 11/7/04 Channel Catfish fillet -0.1 0.96 0.24 -0.1 1.3 0.22 0.769 -0.1 1.48 -0.1 -0.1 Alamo River Outlet 11/7/04 Flathead Catfish fillet -0.1 0.587 -0.1 -0.1 DNQ, 0.196 -0.1 -0.1 -0.1 DNQ, 0.144 -0.1 -0.1 Alamo River Outlet 11/7/04 Tilapia spp. fillet -0.1 0.401 -0.1 -0.1 0.548 -0.1 0.281 -0.1 0.688 -0.1 -0.1 Alamo River Outlet 2/8/11 Channel Catfish fillet -0.199 1.67 -0.199 DNQ, 0.328 -0.199 1.73 DNQ, 0.239 -0.199 DNQ, 0.547 -0.199 2.79 DNQ, 0.212 -0.199 Alamo River Outlet 4/22/11 Flathead Catfish fillet -0.198 -0.198 -0.198 -0.198 DNQ, 0.512 -0.198 -0.198 DNQ, 0.247 -0.198 0.647 -0.198 -0.198 Alamo River Outlet 05/08/12 Common Carp fillet -0.193 DNQ, 0.301 -0.193 -0.193 -0.193 DNQ, 0.423 -0.193 -0.193 DNQ, 0.289 -0.193 0.807 -0.193 -0.193 Alamo River Outlet 10/16/12 Common Carp fillet -0.192 DNQ, 0.321 -0.192 -0.192 -0.192 -0.192 -0.192 -0.192 DNQ, 0.199 -0.192 DNQ, 0.281 -0.192 -0.192
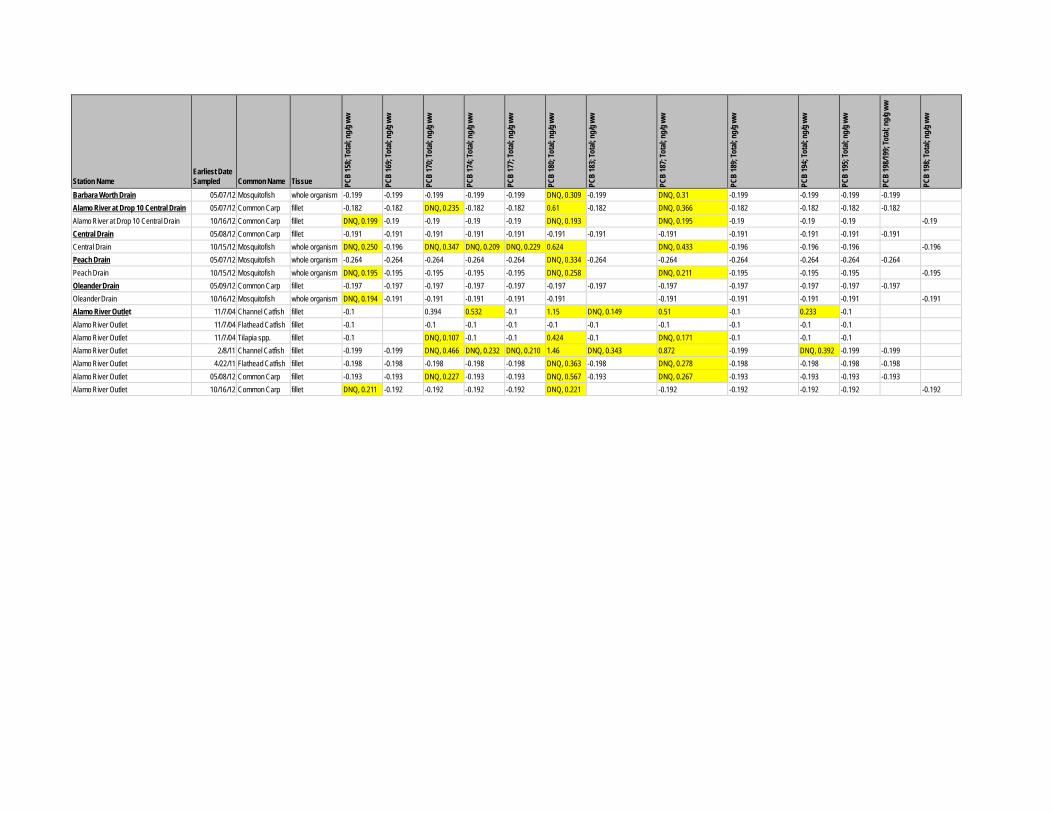
Station Name
Earliest Date Sampled
Common Name
Tissue PC
B 15
8; To
tal; n
g/g w
w
PCB
169;
Tota
l; ng/
g ww
PCB
170;
Tota
l; ng/
g ww
PCB
174;
Tota
l; ng/
g ww
PCB
177;
Tota
l; ng/
g ww
PCB
180;
Tota
l; ng/
g ww
PCB
183;
Tota
l; ng/
g ww
PCB
187;
Tota
l; ng/
g ww
PCB
189;
Tota
l; ng/
g ww
PCB
194;
Tota
l; ng/
g ww
PCB
195;
Tota
l; ng/
g ww
PCB
198/1
99; T
otal;
ng/g
ww
PCB
198;
Tota
l; ng/
g ww
Barbara Worth Drain 05/07/12 Mosquitofish whole organism -0.199 -0.199 -0.199 -0.199 -0.199 DNQ, 0.309 -0.199 DNQ, 0.31 -0.199 -0.199 -0.199 -0.199 Alamo River at Drop 10 Central Drain 05/07/12 Common Carp fillet -0.182 -0.182 DNQ, 0.235 -0.182 -0.182 0.61 -0.182 DNQ, 0.366 -0.182 -0.182 -0.182 -0.182 Alamo River at Drop 10 Central Drain 10/16/12 Common Carp fillet DNQ, 0.199 -0.19 -0.19 -0.19 -0.19 DNQ, 0.193 DNQ, 0.195 -0.19 -0.19 -0.19 -0.19 Central Drain 05/08/12 Common Carp fillet -0.191 -0.191 -0.191 -0.191 -0.191 -0.191 -0.191 -0.191 -0.191 -0.191 -0.191 -0.191 Central Drain 10/15/12 Mosquitofish whole organism DNQ, 0.250 -0.196 DNQ, 0.347 DNQ, 0.209 DNQ, 0.229 0.624 DNQ, 0.433 -0.196 -0.196 -0.196 -0.196 Peach Drain 05/07/12 Mosquitofish whole organism -0.264 -0.264 -0.264 -0.264 -0.264 DNQ, 0.334 -0.264 -0.264 -0.264 -0.264 -0.264 -0.264 Peach Drain 10/15/12 Mosquitofish whole organism DNQ, 0.195 -0.195 -0.195 -0.195 -0.195 DNQ, 0.258 DNQ, 0.211 -0.195 -0.195 -0.195 -0.195 Oleander Drain 05/09/12 Common Carp fillet -0.197 -0.197 -0.197 -0.197 -0.197 -0.197 -0.197 -0.197 -0.197 -0.197 -0.197 -0.197 Oleander Drain 10/16/12 Mosquitofish whole organism DNQ, 0.194 -0.191 -0.191 -0.191 -0.191 -0.191 -0.191 -0.191 -0.191 -0.191 -0.191 Alamo River Outlet 11/7/04 Channel Catfish fillet -0.1 0.394 0.532 -0.1 1.15 DNQ, 0.149 0.51 -0.1 0.233 -0.1 Alamo River Outlet 11/7/04 Flathead Catfish fillet -0.1 -0.1 -0.1 -0.1 -0.1 -0.1 -0.1 -0.1 -0.1 -0.1 Alamo River Outlet 11/7/04 Tilapia spp. fillet -0.1 DNQ, 0.107 -0.1 -0.1 0.424 -0.1 DNQ, 0.171 -0.1 -0.1 -0.1 Alamo River Outlet 2/8/11 Channel Catfish fillet -0.199 -0.199 DNQ, 0.466 DNQ, 0.232 DNQ, 0.210 1.46 DNQ, 0.343 0.872 -0.199 DNQ, 0.392 -0.199 -0.199 Alamo River Outlet 4/22/11 Flathead Catfish fillet -0.198 -0.198 -0.198 -0.198 -0.198 DNQ, 0.363 -0.198 DNQ, 0.278 -0.198 -0.198 -0.198 -0.198 Alamo River Outlet 05/08/12 Common Carp fillet -0.193 -0.193 DNQ, 0.227 -0.193 -0.193 DNQ, 0.567 -0.193 DNQ, 0.267 -0.193 -0.193 -0.193 -0.193 Alamo River Outlet 10/16/12 Common Carp fillet DNQ, 0.211 -0.192 -0.192 -0.192 -0.192 DNQ, 0.221 -0.192 -0.192 -0.192 -0.192 -0.192
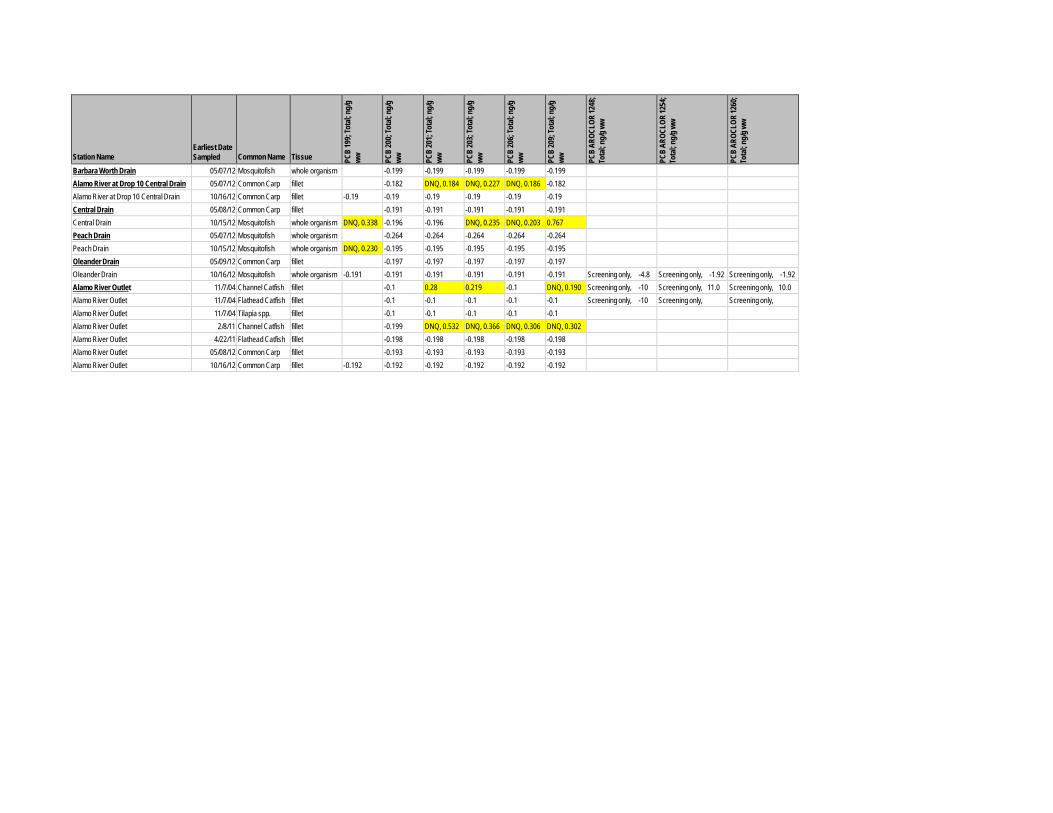
Station Name
Earliest Date Sampled
Common Name
Tissue PC
B 19
9; To
tal; n
g/g
ww
PCB
200;
Tota
l; ng/
g ww
PCB
201;
Tota
l; ng/
g ww
PCB
203;
Tota
l; ng/
g ww
PCB
206;
Tota
l; ng/
g ww
PCB
209;
Tota
l; ng/
g ww
PCB
AROC
LOR
1248
; To
tal; n
g/g w
w
PCB
AROC
LOR
1254
; To
tal; n
g/g w
w
PCB
AROC
LOR
1260
; To
tal; n
g/g w
w
Barbara Worth Drain 05/07/12 Mosquitofish whole organism -0.199 -0.199 -0.199 -0.199 -0.199 Alamo River at Drop 10 Central Drain 05/07/12 Common Carp fillet -0.182 DNQ, 0.184 DNQ, 0.227 DNQ, 0.186 -0.182 Alamo River at Drop 10 Central Drain 10/16/12 Common Carp fillet -0.19 -0.19 -0.19 -0.19 -0.19 -0.19 Central Drain 05/08/12 Common Carp fillet -0.191 -0.191 -0.191 -0.191 -0.191 Central Drain 10/15/12 Mosquitofish whole organism DNQ, 0.338 -0.196 -0.196 DNQ, 0.235 DNQ, 0.203 0.767 Peach Drain 05/07/12 Mosquitofish whole organism -0.264 -0.264 -0.264 -0.264 -0.264 Peach Drain 10/15/12 Mosquitofish whole organism DNQ, 0.230 -0.195 -0.195 -0.195 -0.195 -0.195 Oleander Drain 05/09/12 Common Carp fillet -0.197 -0.197 -0.197 -0.197 -0.197 Oleander Drain 10/16/12 Mosquitofish whole organism -0.191 -0.191 -0.191 -0.191 -0.191 -0.191 Screening only, -4.8 Screening only, -1.92 Screening only, -1.92 Alamo River Outlet 11/7/04 Channel Catfish fillet -0.1 0.28 0.219 -0.1 DNQ, 0.190 Screening only, -10 Screening only, 11.0 Screening only, 10.0 Alamo River Outlet 11/7/04 Flathead Catfish fillet -0.1 -0.1 -0.1 -0.1 -0.1 Screening only, -10 Screening only, Screening only, Alamo River Outlet 11/7/04 Tilapia spp. fillet -0.1 -0.1 -0.1 -0.1 -0.1 Alamo River Outlet 2/8/11 Channel Catfish fillet -0.199 DNQ, 0.532 DNQ, 0.366 DNQ, 0.306 DNQ, 0.302 Alamo River Outlet 4/22/11 Flathead Catfish fillet -0.198 -0.198 -0.198 -0.198 -0.198 Alamo River Outlet 05/08/12 Common Carp fillet -0.193 -0.193 -0.193 -0.193 -0.193 Alamo River Outlet 10/16/12 Common Carp fillet -0.192 -0.192 -0.192 -0.192 -0.192 -0.192
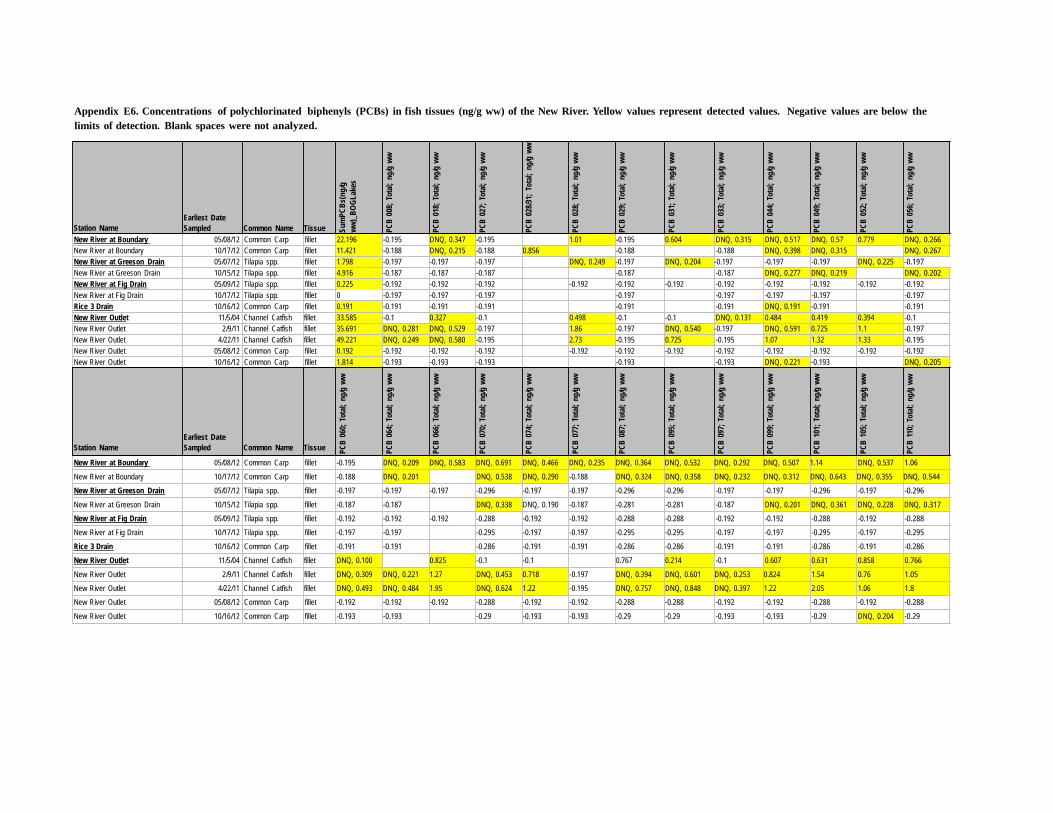
PCB
060;
Tot
al; n
g/g
ww
Sum
PCBs
(ng/
g ww
)_BO
GLak
es
PCB
064;
Tot
al; n
g/g
ww
PCB
008;
Tot
al; n
g/g
ww
PCB
066;
Tot
al; n
g/g
ww
PCB
018;
Tot
al; n
g/g
ww
PCB
070;
Tot
al; n
g/g
ww
PCB
027;
Tot
al; n
g/g
ww
PCB
074;
Tot
al; n
g/g
ww
PCB
028/3
1; T
otal;
ng/
g ww
PCB
077;
Tot
al; n
g/g
ww
PCB
028;
Tot
al; n
g/g
ww
PCB
087;
Tot
al; n
g/g
ww
PCB
029;
Tot
al; n
g/g
ww
PCB
095;
Tot
al; n
g/g
ww
PCB
031;
Tot
al; n
g/g
ww
PCB
097;
Tot
al; n
g/g
ww
PCB
033;
Tot
al; n
g/g
ww
PCB
099;
Tot
al; n
g/g
ww
PCB
044;
Tot
al; n
g/g
ww
PCB
101;
Tot
al; n
g/g
ww
PCB
049;
Tot
al; n
g/g
ww
PCB
105;
Tot
al; n
g/g
ww
PCB
052;
Tot
al; n
g/g
ww
PCB
110;
Tot
al; n
g/g
ww
PCB
056;
Tot
al; n
g/g
ww
Appendix E6. Concentrations of polychlorinated biphenyls (PCBs) in fish tissues (ng/g ww) of the New River. Yellow values represent detected values. Negative values are below the limits of detection. Blank spaces were not analyzed.
Station Name Earliest Date Sampled Common Name Tissue
New River at Boundary 05/08/12 Common Carp fillet 22.196 -0.195 DNQ, 0.347 -0.195 1.01 -0.195 0.604 DNQ, 0.315 DNQ, 0.517 DNQ, 0.57 0.779 DNQ, 0.266 New River at Boundary 10/17/12 Common Carp fillet 11.421 -0.188 DNQ, 0.215 -0.188 0.856 -0.188 -0.188 DNQ, 0.398 DNQ, 0.315 DNQ, 0.267 New River at Greeson Drain 05/07/12 Tilapia spp. fillet 1.798 -0.197 -0.197 -0.197 DNQ, 0.249 -0.197 DNQ, 0.204 -0.197 -0.197 -0.197 DNQ, 0.225 -0.197 New River at Greeson Drain 10/15/12 Tilapia spp. fillet 4.916 -0.187 -0.187 -0.187 -0.187 -0.187 DNQ, 0.277 DNQ, 0.219 DNQ, 0.202 New River at Fig Drain 05/09/12 Tilapia spp. fillet 0.225 -0.192 -0.192 -0.192 -0.192 -0.192 -0.192 -0.192 -0.192 -0.192 -0.192 -0.192 New River at Fig Drain 10/17/12 Tilapia spp. fillet 0 -0.197 -0.197 -0.197 -0.197 -0.197 -0.197 -0.197 -0.197 Rice 3 Drain 10/16/12 Common Carp fillet 0.191 -0.191 -0.191 -0.191 -0.191 -0.191 DNQ, 0.191 -0.191 -0.191 New River Outlet 11/5/04 Channel Catfish fillet 33.585 -0.1 0.327 -0.1 0.498 -0.1 -0.1 DNQ, 0.131 0.484 0.419 0.394 -0.1 New River Outlet 2/9/11 Channel Catfish fillet 35.691 DNQ, 0.281 DNQ, 0.529 -0.197 1.86 -0.197 DNQ, 0.540 -0.197 DNQ, 0.591 0.725 1.1 -0.197 New River Outlet 4/22/11 Channel Catfish fillet 49.221 DNQ, 0.249 DNQ, 0.580 -0.195 2.73 -0.195 0.725 -0.195 1.07 1.32 1.33 -0.195 New River Outlet 05/08/12 Common Carp fillet 0.192 -0.192 -0.192 -0.192 -0.192 -0.192 -0.192 -0.192 -0.192 -0.192 -0.192 -0.192 New River Outlet 10/16/12 Common Carp fillet 1.814 -0.193 -0.193 -0.193 -0.193 -0.193 DNQ, 0.221 -0.193 DNQ, 0.205
Station Name Earliest Date Sampled Common Name Tissue
New River at Boundary 05/08/12 Common Carp fillet -0.195 DNQ, 0.209 DNQ, 0.583 DNQ, 0.691 DNQ, 0.466 DNQ, 0.235 DNQ, 0.364 DNQ, 0.532 DNQ, 0.292 DNQ, 0.507 1.14 DNQ, 0.537 1.06
New River at Boundary 10/17/12 Common Carp fillet -0.188 DNQ, 0.201 DNQ, 0.538 DNQ, 0.290 -0.188 DNQ, 0.324 DNQ, 0.358 DNQ, 0.232 DNQ, 0.312 DNQ, 0.643 DNQ, 0.355 DNQ, 0.544 New River at Greeson Drain 05/07/12 Tilapia spp. fillet -0.197 -0.197 -0.197 -0.296 -0.197 -0.197 -0.296 -0.296 -0.197 -0.197 -0.296 -0.197 -0.296
New River at Greeson Drain 10/15/12 Tilapia spp. fillet -0.187 -0.187 DNQ, 0.338 DNQ, 0.190 -0.187 -0.281 -0.281 -0.187 DNQ, 0.201 DNQ, 0.361 DNQ, 0.228 DNQ, 0.317 New River at Fig Drain 05/09/12 Tilapia spp. fillet -0.192 -0.192 -0.192 -0.288 -0.192 -0.192 -0.288 -0.288 -0.192 -0.192 -0.288 -0.192 -0.288 New River at Fig Drain 10/17/12 Tilapia spp. fillet -0.197 -0.197 -0.295 -0.197 -0.197 -0.295 -0.295 -0.197 -0.197 -0.295 -0.197 -0.295
Rice 3 Drain 10/16/12 Common Carp fillet -0.191 -0.191 -0.286 -0.191 -0.191 -0.286 -0.286 -0.191 -0.191 -0.286 -0.191 -0.286 New River Outlet 11/5/04 Channel Catfish fillet DNQ, 0.100 0.825 -0.1 -0.1 0.767 0.214 -0.1 0.607 0.631 0.858 0.766
New River Outlet 2/9/11 Channel Catfish fillet DNQ, 0.309 DNQ, 0.221 1.27 DNQ, 0.453 0.718 -0.197 DNQ, 0.394 DNQ, 0.601 DNQ, 0.253 0.824 1.54 0.76 1.05 New River Outlet 4/22/11 Channel Catfish fillet DNQ, 0.493 DNQ, 0.484 1.95 DNQ, 0.624 1.22 -0.195 DNQ, 0.757 DNQ, 0.848 DNQ, 0.397 1.22 2.05 1.06 1.8 New River Outlet 05/08/12 Common Carp fillet -0.192 -0.192 -0.192 -0.288 -0.192 -0.192 -0.288 -0.288 -0.192 -0.192 -0.288 -0.192 -0.288
New River Outlet 10/16/12 Common Carp fillet -0.193 -0.193 -0.29 -0.193 -0.193 -0.29 -0.29 -0.193 -0.193 -0.29 DNQ, 0.204 -0.29
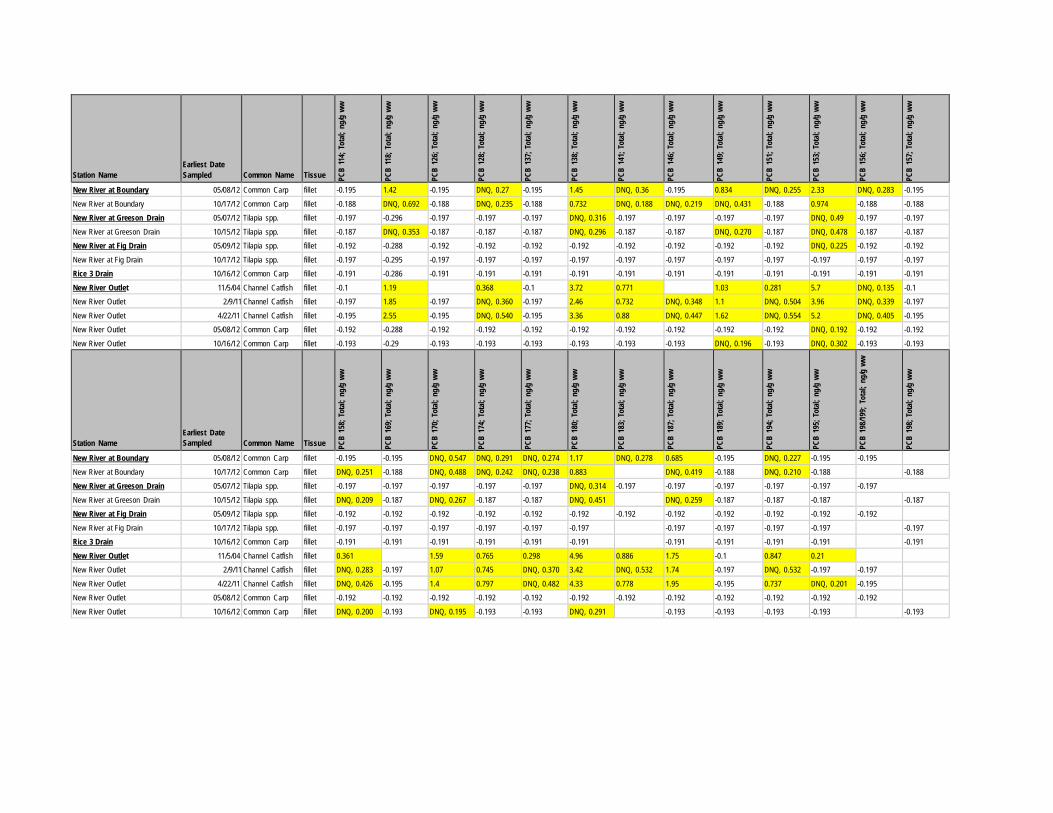
Station Name
Earliest Date Sampled
Common Name
Tissue PC
B 11
4; T
otal;
ng/
g ww
PCB
118;
Tot
al; n
g/g
ww
PCB
126;
Tot
al; n
g/g
ww
PCB
128;
Tot
al; n
g/g
ww
PCB
137;
Tot
al; n
g/g
ww
PCB
138;
Tot
al; n
g/g
ww
PCB
141;
Tot
al; n
g/g
ww
PCB
146;
Tot
al; n
g/g
ww
PCB
149;
Tot
al; n
g/g
ww
PCB
151;
Tot
al; n
g/g
ww
PCB
153;
Tot
al; n
g/g
ww
PCB
156;
Tot
al; n
g/g
ww
PCB
157;
Tot
al; n
g/g
ww
New River at Boundary 05/08/12 Common Carp fillet -0.195 1.42 -0.195 DNQ, 0.27 -0.195 1.45 DNQ, 0.36 -0.195 0.834 DNQ, 0.255 2.33 DNQ, 0.283 -0.195
New River at Boundary 10/17/12 Common Carp fillet -0.188 DNQ, 0.692 -0.188 DNQ, 0.235 -0.188 0.732 DNQ, 0.188 DNQ, 0.219 DNQ, 0.431 -0.188 0.974 -0.188 -0.188 New River at Greeson Drain 05/07/12 Tilapia spp. fillet -0.197 -0.296 -0.197 -0.197 -0.197 DNQ, 0.316 -0.197 -0.197 -0.197 -0.197 DNQ, 0.49 -0.197 -0.197
New River at Greeson Drain 10/15/12 Tilapia spp. fillet -0.187 DNQ, 0.353 -0.187 -0.187 -0.187 DNQ, 0.296 -0.187 -0.187 DNQ, 0.270 -0.187 DNQ, 0.478 -0.187 -0.187 New River at Fig Drain 05/09/12 Tilapia spp. fillet -0.192 -0.288 -0.192 -0.192 -0.192 -0.192 -0.192 -0.192 -0.192 -0.192 DNQ, 0.225 -0.192 -0.192
New River at Fig Drain 10/17/12 Tilapia spp. fillet -0.197 -0.295 -0.197 -0.197 -0.197 -0.197 -0.197 -0.197 -0.197 -0.197 -0.197 -0.197 -0.197 Rice 3 Drain 10/16/12 Common Carp fillet -0.191 -0.286 -0.191 -0.191 -0.191 -0.191 -0.191 -0.191 -0.191 -0.191 -0.191 -0.191 -0.191
New River Outlet 11/5/04 Channel Catfish fillet -0.1 1.19 0.368 -0.1 3.72 0.771 1.03 0.281 5.7 DNQ, 0.135 -0.1 New River Outlet 2/9/11 Channel Catfish fillet -0.197 1.85 -0.197 DNQ, 0.360 -0.197 2.46 0.732 DNQ, 0.348 1.1 DNQ, 0.504 3.96 DNQ, 0.339 -0.197
New River Outlet 4/22/11 Channel Catfish fillet -0.195 2.55 -0.195 DNQ, 0.540 -0.195 3.36 0.88 DNQ, 0.447 1.62 DNQ, 0.554 5.2 DNQ, 0.405 -0.195 New River Outlet 05/08/12 Common Carp fillet -0.192 -0.288 -0.192 -0.192 -0.192 -0.192 -0.192 -0.192 -0.192 -0.192 DNQ, 0.192 -0.192 -0.192
New River Outlet 10/16/12 Common Carp fillet -0.193 -0.29 -0.193 -0.193 -0.193 -0.193 -0.193 -0.193 DNQ, 0.196 -0.193 DNQ, 0.302 -0.193 -0.193 Station Name
Earliest Date Sampled
Common Name
Tissue PC
B 15
8; T
otal;
ng/
g ww
PCB
169;
Tot
al; n
g/g
ww
PCB
170;
Tot
al; n
g/g
ww
PCB
174;
Tot
al; n
g/g
ww
PCB
177;
Tot
al; n
g/g
ww
PCB
180;
Tot
al; n
g/g
ww
PCB
183;
Tot
al; n
g/g
ww
PCB
187;
Tot
al; n
g/g
ww
PCB
189;
Tot
al; n
g/g
ww
PCB
194;
Tot
al; n
g/g
ww
PCB
195;
Tot
al; n
g/g
ww
PCB
198/1
99; T
otal;
ng/
g ww
PCB
198;
Tot
al; n
g/g
ww
New River at Boundary 05/08/12 Common Carp fillet -0.195 -0.195 DNQ, 0.547 DNQ, 0.291 DNQ, 0.274 1.17 DNQ, 0.278 0.685 -0.195 DNQ, 0.227 -0.195 -0.195 New River at Boundary 10/17/12 Common Carp fillet DNQ, 0.251 -0.188 DNQ, 0.488 DNQ, 0.242 DNQ, 0.238 0.883 DNQ, 0.419 -0.188 DNQ, 0.210 -0.188 -0.188 New River at Greeson Drain 05/07/12 Tilapia spp. fillet -0.197 -0.197 -0.197 -0.197 -0.197 DNQ, 0.314 -0.197 -0.197 -0.197 -0.197 -0.197 -0.197
New River at Greeson Drain 10/15/12 Tilapia spp. fillet DNQ, 0.209 -0.187 DNQ, 0.267 -0.187 -0.187 DNQ, 0.451 DNQ, 0.259 -0.187 -0.187 -0.187 -0.187 New River at Fig Drain 05/09/12 Tilapia spp. fillet -0.192 -0.192 -0.192 -0.192 -0.192 -0.192 -0.192 -0.192 -0.192 -0.192 -0.192 -0.192 New River at Fig Drain 10/17/12 Tilapia spp. fillet -0.197 -0.197 -0.197 -0.197 -0.197 -0.197 -0.197 -0.197 -0.197 -0.197 -0.197 Rice 3 Drain 10/16/12 Common Carp fillet -0.191 -0.191 -0.191 -0.191 -0.191 -0.191 -0.191 -0.191 -0.191 -0.191 -0.191
New River Outlet 11/5/04 Channel Catfish fillet 0.361 1.59 0.765 0.298 4.96 0.886 1.75 -0.1 0.847 0.21 New River Outlet 2/9/11 Channel Catfish fillet DNQ, 0.283 -0.197 1.07 0.745 DNQ, 0.370 3.42 DNQ, 0.532 1.74 -0.197 DNQ, 0.532 -0.197 -0.197 New River Outlet 4/22/11 Channel Catfish fillet DNQ, 0.426 -0.195 1.4 0.797 DNQ, 0.482 4.33 0.778 1.95 -0.195 0.737 DNQ, 0.201 -0.195 New River Outlet 05/08/12 Common Carp fillet -0.192 -0.192 -0.192 -0.192 -0.192 -0.192 -0.192 -0.192 -0.192 -0.192 -0.192 -0.192 New River Outlet 10/16/12 Common Carp fillet DNQ, 0.200 -0.193 DNQ, 0.195 -0.193 -0.193 DNQ, 0.291 -0.193 -0.193 -0.193 -0.193 -0.193
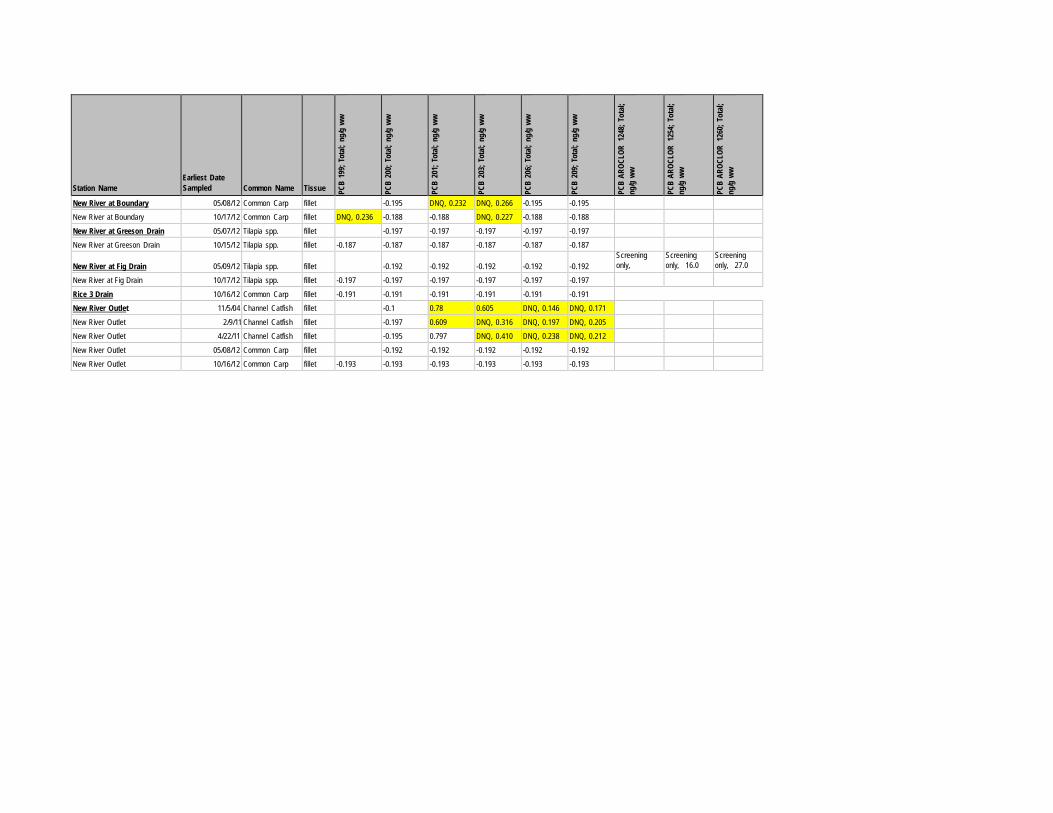
Station Name
Earliest Date Sampled
Common Name
Tissue PC
B 19
9; T
otal;
ng/
g ww
PCB
200;
Tot
al; n
g/g
ww
PCB
201;
Tot
al; n
g/g
ww
PCB
203;
Tot
al; n
g/g
ww
PCB
206;
Tot
al; n
g/g
ww
PCB
209;
Tot
al; n
g/g
ww
PCB
AROC
LOR
124
8; T
otal
; ng
/g w
w
PCB
AROC
LOR
125
4; T
otal
; ng
/g w
w
PCB
AROC
LOR
126
0; T
otal
; ng
/g w
w
New River at Boundary 05/08/12 Common Carp fillet -0.195 DNQ, 0.232 DNQ, 0.266 -0.195 -0.195 New River at Boundary 10/17/12 Common Carp fillet DNQ, 0.236 -0.188 -0.188 DNQ, 0.227 -0.188 -0.188 New River at Greeson Drain 05/07/12 Tilapia spp. fillet -0.197 -0.197 -0.197 -0.197 -0.197 New River at Greeson Drain 10/15/12 Tilapia spp. fillet -0.187 -0.187 -0.187 -0.187 -0.187 -0.187 New River at Fig Drain
05/09/12
Tilapia spp.
fillet
-0.192 -0.192
-0.192
-0.192
-0.192
Screening only,
Screening only, 16.0
Screening only, 27.0
New River at Fig Drain 10/17/12 Tilapia spp. fillet -0.197 -0.197 -0.197 -0.197 -0.197 -0.197 Rice 3 Drain 10/16/12 Common Carp fillet -0.191 -0.191 -0.191 -0.191 -0.191 -0.191 New River Outlet 11/5/04 Channel Catfish fillet -0.1 0.78 0.605 DNQ, 0.146 DNQ, 0.171 New River Outlet 2/9/11 Channel Catfish fillet -0.197 0.609 DNQ, 0.316 DNQ, 0.197 DNQ, 0.205 New River Outlet 4/22/11 Channel Catfish fillet -0.195 0.797 DNQ, 0.410 DNQ, 0.238 DNQ, 0.212 New River Outlet 05/08/12 Common Carp fillet -0.192 -0.192 -0.192 -0.192 -0.192 New River Outlet 10/16/12 Common Carp fillet -0.193 -0.193 -0.193 -0.193 -0.193 -0.193
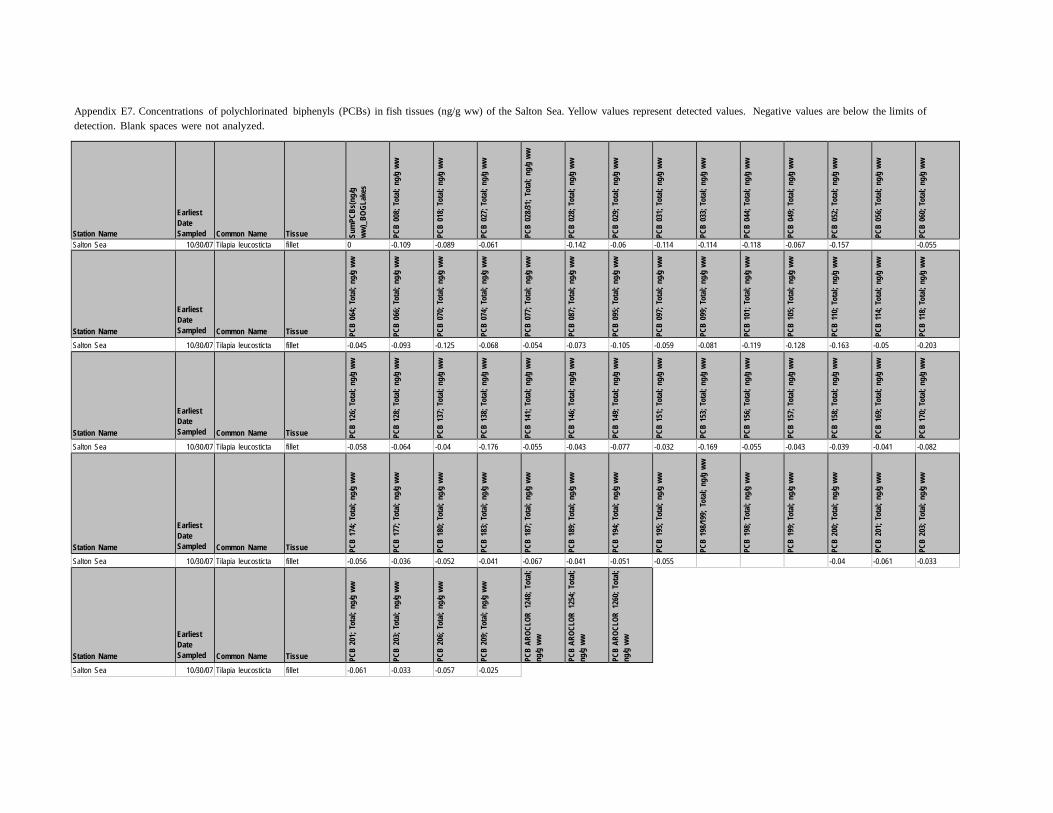
Appendix E7. Concentrations of polychlorinated biphenyls (PCBs) in fish tissues (ng/g ww) of the Salton Sea. Yellow values represent detected values. Negative values are below the limits of detection. Blank spaces were not analyzed.
Station Name
Earliest Date Sampled
Common Name
Tissue Su
mPC
Bs(n
g/g
ww)_
BOGL
akes
PCB
008;
Tot
al; n
g/g
ww
PCB
018;
Tot
al; n
g/g
ww
PCB
027;
Tot
al; n
g/g
ww
PCB
028/3
1; T
otal;
ng/
g ww
PCB
028;
Tot
al; n
g/g
ww
PCB
029;
Tot
al; n
g/g
ww
PCB
031;
Tot
al; n
g/g
ww
PCB
033;
Tot
al; n
g/g
ww
PCB
044;
Tot
al; n
g/g
ww
PCB
049;
Tot
al; n
g/g
ww
PCB
052;
Tot
al; n
g/g
ww
PCB
056;
Tot
al; n
g/g
ww
PCB
060;
Tot
al; n
g/g
ww
Salton Sea 10/30/07 Tilapia leucosticta fillet 0 -0.109 -0.089 -0.061 -0.142 -0.06 -0.114 -0.114 -0.118 -0.067 -0.157 -0.055 Station Name
Earliest Date Sampled
Common Name
Tissue PC
B 06
4; T
otal;
ng/
g ww
PCB
066;
Tot
al; n
g/g
ww
PCB
070;
Tot
al; n
g/g
ww
PCB
074;
Tot
al; n
g/g
ww
PCB
077;
Tot
al; n
g/g
ww
PCB
087;
Tot
al; n
g/g
ww
PCB
095;
Tot
al; n
g/g
ww
PCB
097;
Tot
al; n
g/g
ww
PCB
099;
Tot
al; n
g/g
ww
PCB
101;
Tot
al; n
g/g
ww
PCB
105;
Tot
al; n
g/g
ww
PCB
110;
Tot
al; n
g/g
ww
PCB
114;
Tot
al; n
g/g
ww
PCB
118;
Tot
al; n
g/g
ww
Salton Sea 10/30/07 Tilapia leucosticta fillet -0.045 -0.093 -0.125 -0.068 -0.054 -0.073 -0.105 -0.059 -0.081 -0.119 -0.128 -0.163 -0.05 -0.203 Station Name
Earliest Date Sampled
Common Name
Tissue PC
B 12
6; T
otal;
ng/
g ww
PCB
128;
Tot
al; n
g/g
ww
PCB
137;
Tot
al; n
g/g
ww
PCB
138;
Tot
al; n
g/g
ww
PCB
141;
Tot
al; n
g/g
ww
PCB
146;
Tot
al; n
g/g
ww
PCB
149;
Tot
al; n
g/g
ww
PCB
151;
Tot
al; n
g/g
ww
PCB
153;
Tot
al; n
g/g
ww
PCB
156;
Tot
al; n
g/g
ww
PCB
157;
Tot
al; n
g/g
ww
PCB
158;
Tot
al; n
g/g
ww
PCB
169;
Tot
al; n
g/g
ww
PCB
170;
Tot
al; n
g/g
ww
Salton Sea 10/30/07 Tilapia leucosticta fillet -0.058 -0.064 -0.04 -0.176 -0.055 -0.043 -0.077 -0.032 -0.169 -0.055 -0.043 -0.039 -0.041 -0.082 Station Name
Earliest Date Sampled
Common Name
Tissue PC
B 17
4; T
otal;
ng/
g ww
PCB
177;
Tot
al; n
g/g
ww
PCB
180;
Tot
al; n
g/g
ww
PCB
183;
Tot
al; n
g/g
ww
PCB
187;
Tot
al; n
g/g
ww
PCB
189;
Tot
al; n
g/g
ww
PCB
194;
Tot
al; n
g/g
ww
PCB
195;
Tot
al; n
g/g
ww
PCB
198/1
99; T
otal;
ng/
g ww
PCB
198;
Tot
al; n
g/g
ww
PCB
199;
Tot
al; n
g/g
ww
PCB
200;
Tot
al; n
g/g
ww
PCB
201;
Tot
al; n
g/g
ww
PCB
203;
Tot
al; n
g/g
ww
Salton Sea 10/30/07 Tilapia leucosticta fillet -0.056 -0.036 -0.052 -0.041 -0.067 -0.041 -0.051 -0.055 -0.04 -0.061 -0.033
Station Name
Earliest Date Sampled
Common Name
Tissue PC
B 20
1; T
otal;
ng/
g ww
PCB
203;
Tot
al; n
g/g
ww
PCB
206;
Tot
al; n
g/g
ww
PCB
209;
Tot
al; n
g/g
ww
PCB
AROC
LOR
124
8; T
otal
; ng
/g w
w
PCB
AROC
LOR
125
4; T
otal
; ng
/g w
w
PCB
AROC
LOR
126
0; T
otal
; ng
/g w
w
Salton Sea 10/30/07 Tilapia leucosticta fillet -0.061 -0.033 -0.057 -0.025
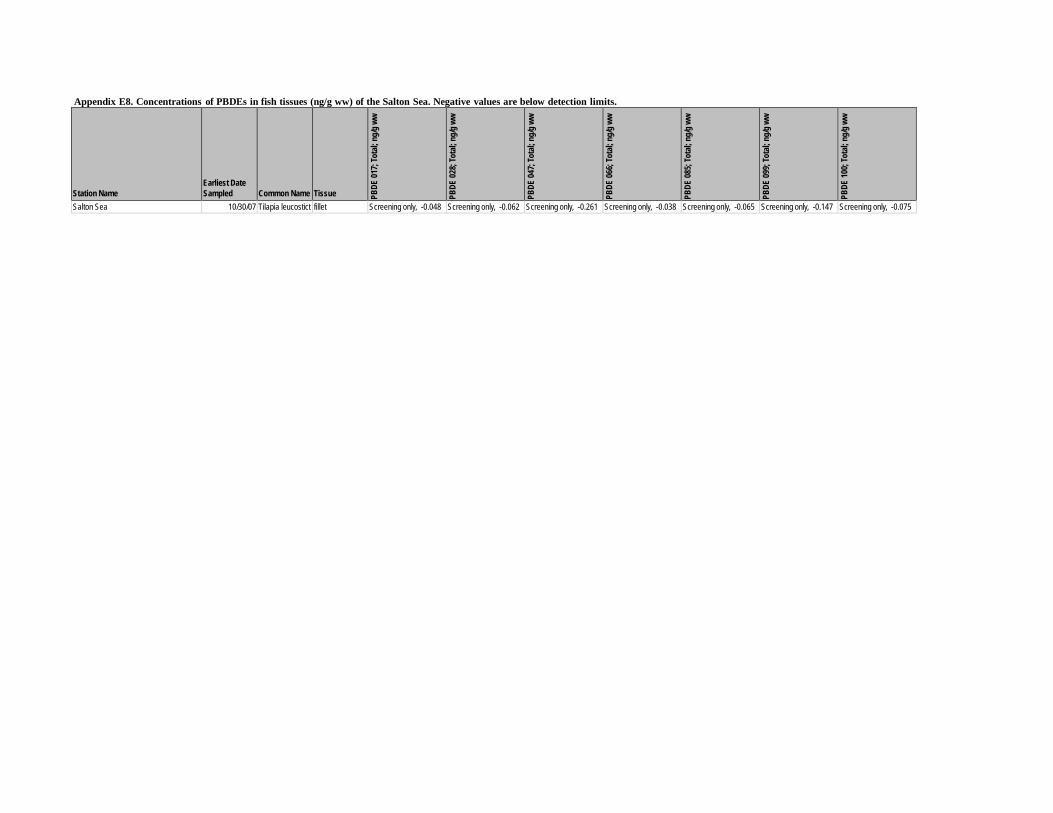
Appendix E8. Concentrations of PBDEs in fish tissues (ng/g ww) of the Salton Sea. Negative values are below detection limits. Station Name
Earliest Date Sampled
Common Name
Tissue PB
DE 01
7; To
tal; n
g/g w
w
PBDE
028;
Tota
l; ng/
g ww
PBDE
047;
Tota
l; ng/
g ww
PBDE
066;
Tota
l; ng/
g ww
PBDE
085;
Tota
l; ng/
g ww
PBDE
099;
Tota
l; ng/
g ww
PBDE
100;
Tota
l; ng/
g ww
Salton Sea 10/30/07 Tilapia leucostict fillet Screening only, -0.048 Screening only, -0.062 Screening only, -0.261 Screening only, -0.038 Screening only, -0.065 Screening only, -0.147 Screening only, -0.075
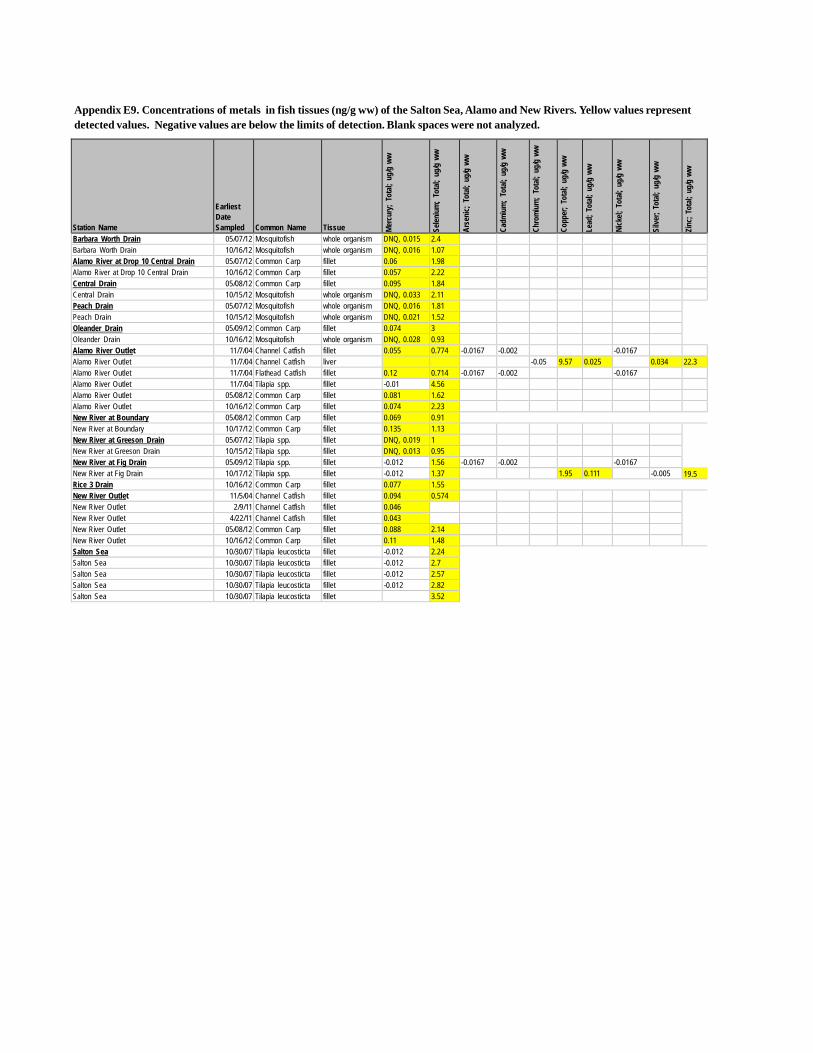
Appendix E9. Concentrations of metals in fish tissues (ng/g ww) of the Salton Sea, Alamo and New Rivers. Yellow values represent detected values. Negative values are below the limits of detection. Blank spaces were not analyzed.
Station Name
Earliest Date Sampled
Common Name
Tissue Me
rcur
y; T
otal;
ug/
g ww
Selen
ium
; To
tal;
ug/g
ww
Arse
nic;
Tot
al; u
g/g
ww
Cadm
ium
; To
tal;
ug/g
ww
Chro
miu
m;
Tota
l; ug
/g w
w
Copp
er; T
otal;
ug/
g ww
Lead
; Tot
al; u
g/g
ww
Nick
el; T
otal;
ug/
g ww
Silve
r; To
tal;
ug/g
ww
Zinc
; Tot
al; u
g/g
ww
Barbara Worth Drain 05/07/12 Mosquitofish whole organism DNQ, 0.015 2.4 Barbara Worth Drain 10/16/12 Mosquitofish whole organism DNQ, 0.016 1.07 Alamo River at Drop 10 Central Drain 05/07/12 Common Carp fillet 0.06 1.98 Alamo River at Drop 10 Central Drain 10/16/12 Common Carp fillet 0.057 2.22 Central Drain 05/08/12 Common Carp fillet 0.095 1.84 Central Drain 10/15/12 Mosquitofish whole organism DNQ, 0.033 2.11 Peach Drain 05/07/12 Mosquitofish whole organism DNQ, 0.016 1.81 Peach Drain 10/15/12 Mosquitofish whole organism DNQ, 0.021 1.52 Oleander Drain 05/09/12 Common Carp fillet 0.074 3 Oleander Drain 10/16/12 Mosquitofish whole organism DNQ, 0.028 0.93 Alamo River Outlet 11/7/04 Channel Catfish fillet 0.055 0.774 -0.0167 -0.002 -0.0167 Alamo River Outlet 11/7/04 Channel Catfish liver -0.05 9.57 0.025 0.034 22.3 Alamo River Outlet 11/7/04 Flathead Catfish fillet 0.12 0.714 -0.0167 -0.002 -0.0167 Alamo River Outlet 11/7/04 Tilapia spp. fillet -0.01 4.56 Alamo River Outlet 05/08/12 Common Carp fillet 0.081 1.62 Alamo River Outlet 10/16/12 Common Carp fillet 0.074 2.23 New River at Boundary 05/08/12 Common Carp fillet 0.069 0.91 New River at Boundary 10/17/12 Common Carp fillet 0.135 1.13 New River at Greeson Drain 05/07/12 Tilapia spp. fillet DNQ, 0.019 1 New River at Greeson Drain 10/15/12 Tilapia spp. fillet DNQ, 0.013 0.95 New River at Fig Drain 05/09/12 Tilapia spp. fillet -0.012 1.56 -0.0167 -0.002 -0.0167 New River at Fig Drain 10/17/12 Tilapia spp. fillet -0.012 1.37 1.95 0.111 -0.005 19.5 Rice 3 Drain 10/16/12 Common Carp fillet 0.077 1.55 New River Outlet 11/5/04 Channel Catfish fillet 0.094 0.574 New River Outlet 2/9/11 Channel Catfish fillet 0.046 New River Outlet 4/22/11 Channel Catfish fillet 0.043 New River Outlet 05/08/12 Common Carp fillet 0.088 2.14 New River Outlet 10/16/12 Common Carp fillet 0.11 1.48 Salton Sea 10/30/07 Tilapia leucosticta fillet -0.012 2.24 Salton Sea 10/30/07 Tilapia leucosticta fillet -0.012 2.7 Salton Sea 10/30/07 Tilapia leucosticta fillet -0.012 2.57 Salton Sea 10/30/07 Tilapia leucosticta fillet -0.012 2.82 Salton Sea 10/30/07 Tilapia leucosticta fillet 3.52
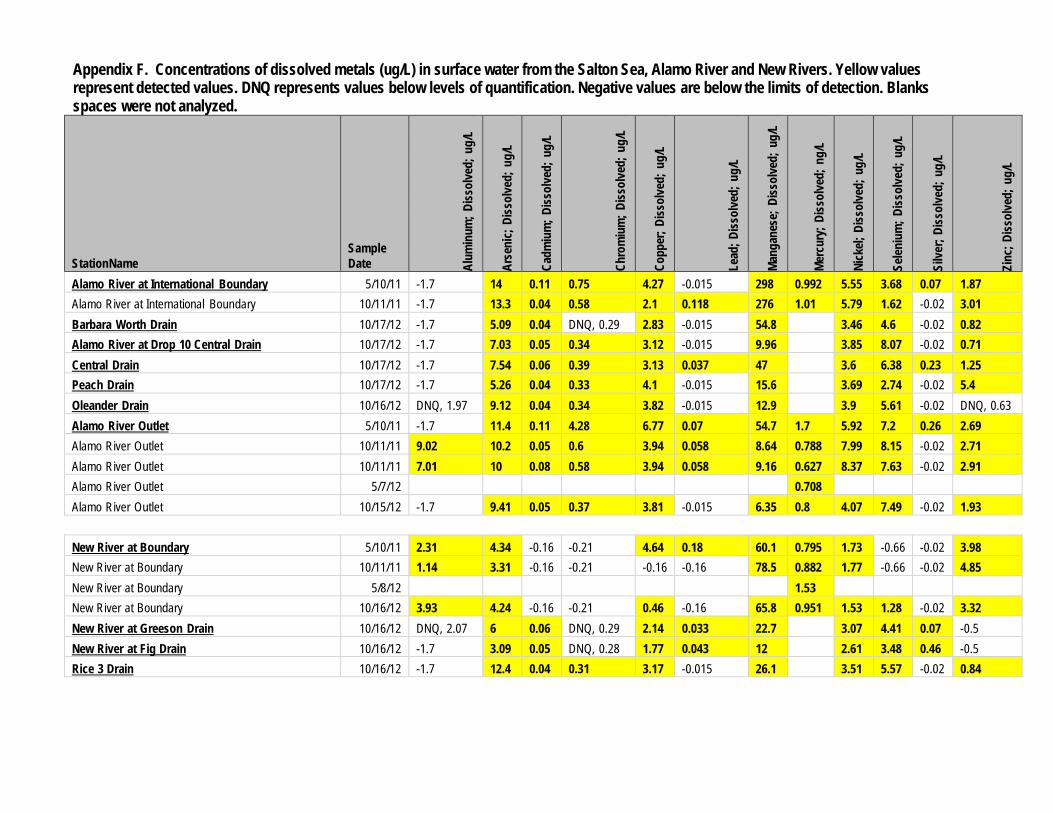
Appendix F. Concentrations of dissolved metals (ug/L) in surface water from the Salton Sea, Alamo River and New Rivers. Yellow values represent detected values. DNQ represents values below levels of quantification. Negative values are below the limits of detection. Blanks spaces were not analyzed.
StationName
Sample Date Al
umin
um; D
issol
ved;
ug/
L
Arse
nic;
Diss
olve
d; u
g/L
Cadm
ium
; Diss
olve
d; u
g/L
Chro
miu
m; D
issol
ved;
ug/
L
Copp
er; D
issol
ved;
ug/
L Le
ad; D
issol
ved;
ug/
L
Mang
anes
e; D
issol
ved;
ug/
L Me
rcur
y; D
issol
ved;
ng/
L
Nick
el; D
issol
ved;
ug/
L
Selen
ium
; Diss
olve
d; u
g/L
Silve
r; Di
ssol
ved;
ug/
L Zi
nc; D
issol
ved;
ug/
L
Alamo River at International Boundary 5/10/11 -1.7 14 0.11 0.75 4.27 -0.015 298 0.992 5.55 3.68 0.07 1.87 Alamo River at International Boundary 10/11/11 -1.7 13.3 0.04 0.58 2.1 0.118 276 1.01 5.79 1.62 -0.02 3.01 Barbara Worth Drain 10/17/12 -1.7 5.09 0.04 DNQ, 0.29 2.83 -0.015 54.8 3.46 4.6 -0.02 0.82 Alamo River at Drop 10 Central Drain 10/17/12 -1.7 7.03 0.05 0.34 3.12 -0.015 9.96 3.85 8.07 -0.02 0.71 Central Drain 10/17/12 -1.7 7.54 0.06 0.39 3.13 0.037 47 3.6 6.38 0.23 1.25 Peach Drain 10/17/12 -1.7 5.26 0.04 0.33 4.1 -0.015 15.6 3.69 2.74 -0.02 5.4 Oleander Drain 10/16/12 DNQ, 1.97 9.12 0.04 0.34 3.82 -0.015 12.9 3.9 5.61 -0.02 DNQ, 0.63 Alamo River Outlet 5/10/11 -1.7 11.4 0.11 4.28 6.77 0.07 54.7 1.7 5.92 7.2 0.26 2.69 Alamo River Outlet 10/11/11 9.02 10.2 0.05 0.6 3.94 0.058 8.64 0.788 7.99 8.15 -0.02 2.71 Alamo River Outlet 10/11/11 7.01 10 0.08 0.58 3.94 0.058 9.16 0.627 8.37 7.63 -0.02 2.91 Alamo River Outlet 5/7/12 0.708 Alamo River Outlet 10/15/12 -1.7 9.41 0.05 0.37 3.81 -0.015 6.35 0.8 4.07 7.49 -0.02 1.93
New River at Boundary 5/10/11 2.31 4.34 -0.16 -0.21 4.64 0.18 60.1 0.795 1.73 -0.66 -0.02 3.98 New River at Boundary 10/11/11 1.14 3.31 -0.16 -0.21 -0.16 -0.16 78.5 0.882 1.77 -0.66 -0.02 4.85 New River at Boundary 5/8/12 1.53 New River at Boundary 10/16/12 3.93 4.24 -0.16 -0.21 0.46 -0.16 65.8 0.951 1.53 1.28 -0.02 3.32 New River at Greeson Drain 10/16/12 DNQ, 2.07 6 0.06 DNQ, 0.29 2.14 0.033 22.7 3.07 4.41 0.07 -0.5 New River at Fig Drain 10/16/12 -1.7 3.09 0.05 DNQ, 0.28 1.77 0.043 12 2.61 3.48 0.46 -0.5 Rice 3 Drain 10/16/12 -1.7 12.4 0.04 0.31 3.17 -0.015 26.1 3.51 5.57 -0.02 0.84
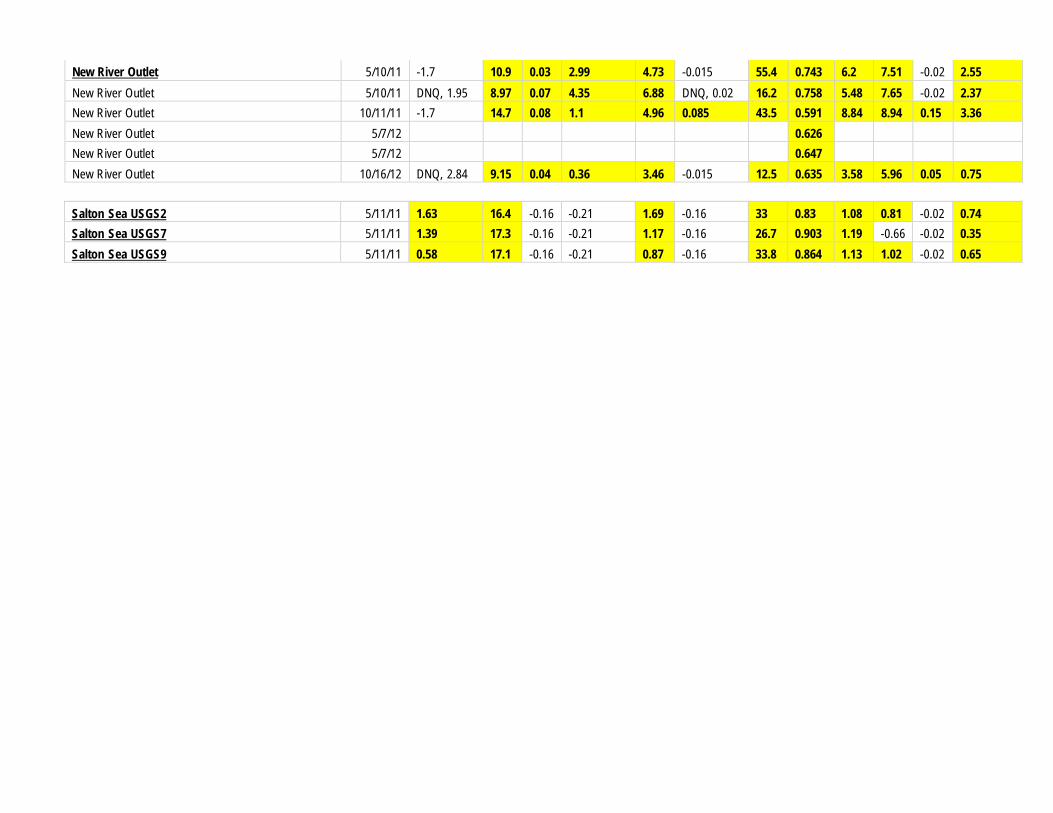
New River Outlet 5/10/11 -1.7 10.9 0.03 2.99 4.73 -0.015 55.4 0.743 6.2 7.51 -0.02 2.55 New River Outlet 5/10/11 DNQ, 1.95 8.97 0.07 4.35 6.88 DNQ, 0.02 16.2 0.758 5.48 7.65 -0.02 2.37 New River Outlet 10/11/11 -1.7 14.7 0.08 1.1 4.96 0.085 43.5 0.591 8.84 8.94 0.15 3.36 New River Outlet 5/7/12 0.626 New River Outlet 5/7/12 0.647 New River Outlet 10/16/12 DNQ, 2.84 9.15 0.04 0.36 3.46 -0.015 12.5 0.635 3.58 5.96 0.05 0.75
Salton Sea USGS2 5/11/11 1.63 16.4 -0.16 -0.21 1.69 -0.16 33 0.83 1.08 0.81 -0.02 0.74 Salton Sea USGS7 5/11/11 1.39 17.3 -0.16 -0.21 1.17 -0.16 26.7 0.903 1.19 -0.66 -0.02 0.35 Salton Sea USGS9 5/11/11 0.58 17.1 -0.16 -0.21 0.87 -0.16 33.8 0.864 1.13 1.02 -0.02 0.65
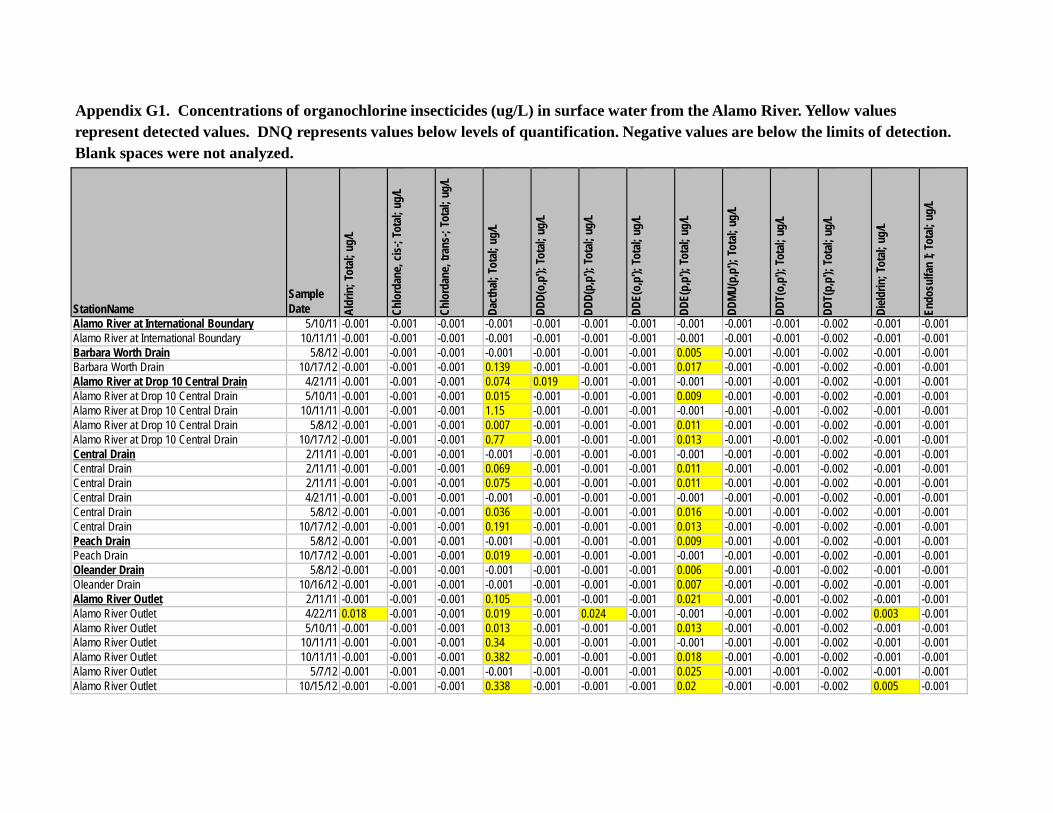
Appendix G1. Concentrations of organochlorine insecticides (ug/L) in surface water from the Alamo River. Yellow values represent detected values. DNQ represents values below levels of quantification. Negative values are below the limits of detection. Blank spaces were not analyzed.
StationName
Sample Date Al
drin
; Tot
al; u
g/L
Chlo
rdan
e, cis
-; To
tal;
ug/L
Chlo
rdan
e, tra
ns-;
Tota
l; ug
/L
Dact
hal;
Tota
l; ug
/L
DDD(
o,p')
; Tot
al; u
g/L
DDD(
p,p')
; Tot
al; u
g/L
DDE(
o,p')
; Tot
al; u
g/L
DDE(
p,p')
; Tot
al; u
g/L
DDMU
(p,p
'); To
tal;
ug/L
DDT(
o,p')
; Tot
al; u
g/L
DDT(
p,p')
; Tot
al; u
g/L
Dield
rin; T
otal;
ug/
L
Endo
sulfa
n I;
Tota
l; ug
/L
Alamo River at International Boundary 5/10/11 -0.001 -0.001 -0.001 -0.001 -0.001 -0.001 -0.001 -0.001 -0.001 -0.001 -0.002 -0.001 -0.001 Alamo River at International Boundary 10/11/11 -0.001 -0.001 -0.001 -0.001 -0.001 -0.001 -0.001 -0.001 -0.001 -0.001 -0.002 -0.001 -0.001 Barbara Worth Drain 5/8/12 -0.001 -0.001 -0.001 -0.001 -0.001 -0.001 -0.001 0.005 -0.001 -0.001 -0.002 -0.001 -0.001 Barbara Worth Drain 10/17/12 -0.001 -0.001 -0.001 0.139 -0.001 -0.001 -0.001 0.017 -0.001 -0.001 -0.002 -0.001 -0.001 Alamo River at Drop 10 Central Drain 4/21/11 -0.001 -0.001 -0.001 0.074 0.019 -0.001 -0.001 -0.001 -0.001 -0.001 -0.002 -0.001 -0.001 Alamo River at Drop 10 Central Drain 5/10/11 -0.001 -0.001 -0.001 0.015 -0.001 -0.001 -0.001 0.009 -0.001 -0.001 -0.002 -0.001 -0.001 Alamo River at Drop 10 Central Drain 10/11/11 -0.001 -0.001 -0.001 1.15 -0.001 -0.001 -0.001 -0.001 -0.001 -0.001 -0.002 -0.001 -0.001 Alamo River at Drop 10 Central Drain 5/8/12 -0.001 -0.001 -0.001 0.007 -0.001 -0.001 -0.001 0.011 -0.001 -0.001 -0.002 -0.001 -0.001 Alamo River at Drop 10 Central Drain 10/17/12 -0.001 -0.001 -0.001 0.77 -0.001 -0.001 -0.001 0.013 -0.001 -0.001 -0.002 -0.001 -0.001 Central Drain 2/11/11 -0.001 -0.001 -0.001 -0.001 -0.001 -0.001 -0.001 -0.001 -0.001 -0.001 -0.002 -0.001 -0.001 Central Drain 2/11/11 -0.001 -0.001 -0.001 0.069 -0.001 -0.001 -0.001 0.011 -0.001 -0.001 -0.002 -0.001 -0.001 Central Drain 2/11/11 -0.001 -0.001 -0.001 0.075 -0.001 -0.001 -0.001 0.011 -0.001 -0.001 -0.002 -0.001 -0.001 Central Drain 4/21/11 -0.001 -0.001 -0.001 -0.001 -0.001 -0.001 -0.001 -0.001 -0.001 -0.001 -0.002 -0.001 -0.001 Central Drain 5/8/12 -0.001 -0.001 -0.001 0.036 -0.001 -0.001 -0.001 0.016 -0.001 -0.001 -0.002 -0.001 -0.001 Central Drain 10/17/12 -0.001 -0.001 -0.001 0.191 -0.001 -0.001 -0.001 0.013 -0.001 -0.001 -0.002 -0.001 -0.001 Peach Drain 5/8/12 -0.001 -0.001 -0.001 -0.001 -0.001 -0.001 -0.001 0.009 -0.001 -0.001 -0.002 -0.001 -0.001 Peach Drain 10/17/12 -0.001 -0.001 -0.001 0.019 -0.001 -0.001 -0.001 -0.001 -0.001 -0.001 -0.002 -0.001 -0.001 Oleander Drain 5/8/12 -0.001 -0.001 -0.001 -0.001 -0.001 -0.001 -0.001 0.006 -0.001 -0.001 -0.002 -0.001 -0.001 Oleander Drain 10/16/12 -0.001 -0.001 -0.001 -0.001 -0.001 -0.001 -0.001 0.007 -0.001 -0.001 -0.002 -0.001 -0.001 Alamo River Outlet 2/11/11 -0.001 -0.001 -0.001 0.105 -0.001 -0.001 -0.001 0.021 -0.001 -0.001 -0.002 -0.001 -0.001 Alamo River Outlet 4/22/11 0.018 -0.001 -0.001 0.019 -0.001 0.024 -0.001 -0.001 -0.001 -0.001 -0.002 0.003 -0.001 Alamo River Outlet 5/10/11 -0.001 -0.001 -0.001 0.013 -0.001 -0.001 -0.001 0.013 -0.001 -0.001 -0.002 -0.001 -0.001 Alamo River Outlet 10/11/11 -0.001 -0.001 -0.001 0.34 -0.001 -0.001 -0.001 -0.001 -0.001 -0.001 -0.002 -0.001 -0.001 Alamo River Outlet 10/11/11 -0.001 -0.001 -0.001 0.382 -0.001 -0.001 -0.001 0.018 -0.001 -0.001 -0.002 -0.001 -0.001 Alamo River Outlet 5/7/12 -0.001 -0.001 -0.001 -0.001 -0.001 -0.001 -0.001 0.025 -0.001 -0.001 -0.002 -0.001 -0.001 Alamo River Outlet 10/15/12 -0.001 -0.001 -0.001 0.338 -0.001 -0.001 -0.001 0.02 -0.001 -0.001 -0.002 0.005 -0.001
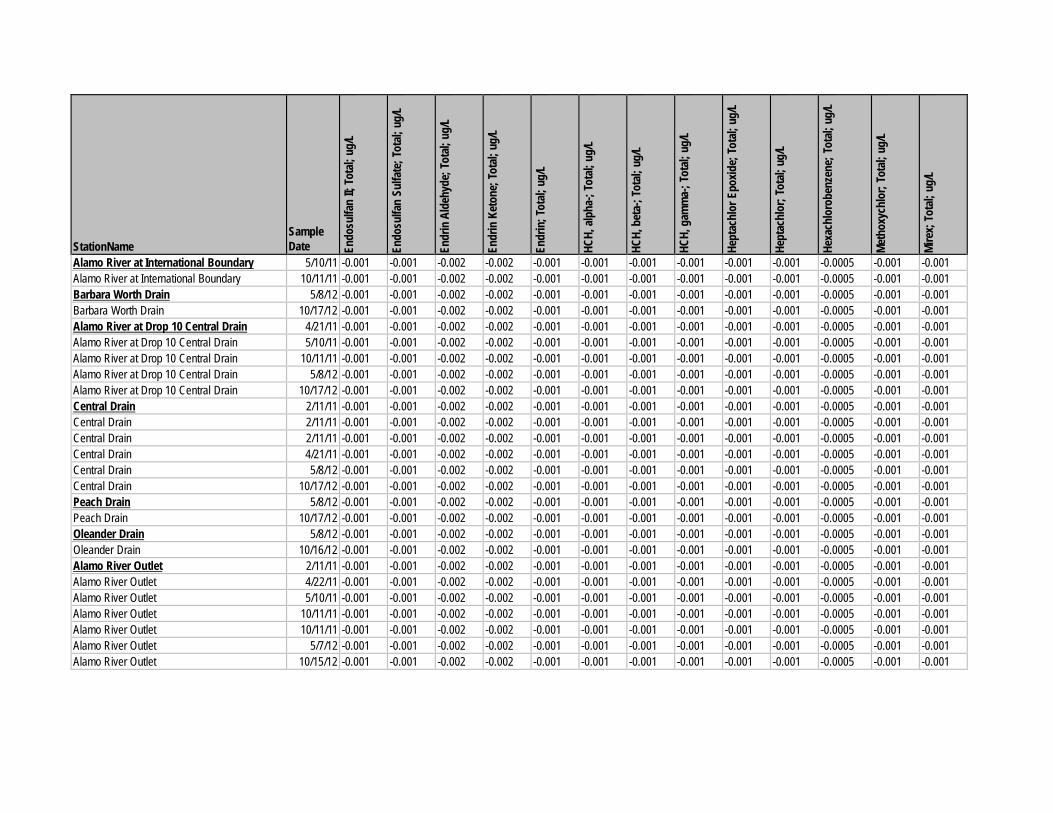
StationName
Sample Date En
dosu
lfan
II; To
tal;
ug/L
Endo
sulfa
n Su
lfate
; Tot
al; u
g/L
Endr
in A
ldeh
yde;
Tota
l; ug
/L
Endr
in K
eton
e; To
tal;
ug/L
Endr
in; T
otal;
ug/
L
HCH,
alp
ha-;
Tota
l; ug
/L
HCH,
bet
a-; T
otal;
ug/
L
HCH,
gam
ma-
; Tot
al; u
g/L
Hept
achl
or E
poxid
e; To
tal;
ug/L
Hept
achl
or; T
otal;
ug/
L
Hexa
chlo
robe
nzen
e; T
otal;
ug/
L
Meth
oxyc
hlor
; Tot
al; u
g/L
Mire
x; To
tal;
ug/L
Alamo River at International Boundary 5/10/11 -0.001 -0.001 -0.002 -0.002 -0.001 -0.001 -0.001 -0.001 -0.001 -0.001 -0.0005 -0.001 -0.001 Alamo River at International Boundary 10/11/11 -0.001 -0.001 -0.002 -0.002 -0.001 -0.001 -0.001 -0.001 -0.001 -0.001 -0.0005 -0.001 -0.001 Barbara Worth Drain 5/8/12 -0.001 -0.001 -0.002 -0.002 -0.001 -0.001 -0.001 -0.001 -0.001 -0.001 -0.0005 -0.001 -0.001 Barbara Worth Drain 10/17/12 -0.001 -0.001 -0.002 -0.002 -0.001 -0.001 -0.001 -0.001 -0.001 -0.001 -0.0005 -0.001 -0.001 Alamo River at Drop 10 Central Drain 4/21/11 -0.001 -0.001 -0.002 -0.002 -0.001 -0.001 -0.001 -0.001 -0.001 -0.001 -0.0005 -0.001 -0.001 Alamo River at Drop 10 Central Drain 5/10/11 -0.001 -0.001 -0.002 -0.002 -0.001 -0.001 -0.001 -0.001 -0.001 -0.001 -0.0005 -0.001 -0.001 Alamo River at Drop 10 Central Drain 10/11/11 -0.001 -0.001 -0.002 -0.002 -0.001 -0.001 -0.001 -0.001 -0.001 -0.001 -0.0005 -0.001 -0.001 Alamo River at Drop 10 Central Drain 5/8/12 -0.001 -0.001 -0.002 -0.002 -0.001 -0.001 -0.001 -0.001 -0.001 -0.001 -0.0005 -0.001 -0.001 Alamo River at Drop 10 Central Drain 10/17/12 -0.001 -0.001 -0.002 -0.002 -0.001 -0.001 -0.001 -0.001 -0.001 -0.001 -0.0005 -0.001 -0.001 Central Drain 2/11/11 -0.001 -0.001 -0.002 -0.002 -0.001 -0.001 -0.001 -0.001 -0.001 -0.001 -0.0005 -0.001 -0.001 Central Drain 2/11/11 -0.001 -0.001 -0.002 -0.002 -0.001 -0.001 -0.001 -0.001 -0.001 -0.001 -0.0005 -0.001 -0.001 Central Drain 2/11/11 -0.001 -0.001 -0.002 -0.002 -0.001 -0.001 -0.001 -0.001 -0.001 -0.001 -0.0005 -0.001 -0.001 Central Drain 4/21/11 -0.001 -0.001 -0.002 -0.002 -0.001 -0.001 -0.001 -0.001 -0.001 -0.001 -0.0005 -0.001 -0.001 Central Drain 5/8/12 -0.001 -0.001 -0.002 -0.002 -0.001 -0.001 -0.001 -0.001 -0.001 -0.001 -0.0005 -0.001 -0.001 Central Drain 10/17/12 -0.001 -0.001 -0.002 -0.002 -0.001 -0.001 -0.001 -0.001 -0.001 -0.001 -0.0005 -0.001 -0.001 Peach Drain 5/8/12 -0.001 -0.001 -0.002 -0.002 -0.001 -0.001 -0.001 -0.001 -0.001 -0.001 -0.0005 -0.001 -0.001 Peach Drain 10/17/12 -0.001 -0.001 -0.002 -0.002 -0.001 -0.001 -0.001 -0.001 -0.001 -0.001 -0.0005 -0.001 -0.001 Oleander Drain 5/8/12 -0.001 -0.001 -0.002 -0.002 -0.001 -0.001 -0.001 -0.001 -0.001 -0.001 -0.0005 -0.001 -0.001 Oleander Drain 10/16/12 -0.001 -0.001 -0.002 -0.002 -0.001 -0.001 -0.001 -0.001 -0.001 -0.001 -0.0005 -0.001 -0.001 Alamo River Outlet 2/11/11 -0.001 -0.001 -0.002 -0.002 -0.001 -0.001 -0.001 -0.001 -0.001 -0.001 -0.0005 -0.001 -0.001 Alamo River Outlet 4/22/11 -0.001 -0.001 -0.002 -0.002 -0.001 -0.001 -0.001 -0.001 -0.001 -0.001 -0.0005 -0.001 -0.001 Alamo River Outlet 5/10/11 -0.001 -0.001 -0.002 -0.002 -0.001 -0.001 -0.001 -0.001 -0.001 -0.001 -0.0005 -0.001 -0.001 Alamo River Outlet 10/11/11 -0.001 -0.001 -0.002 -0.002 -0.001 -0.001 -0.001 -0.001 -0.001 -0.001 -0.0005 -0.001 -0.001 Alamo River Outlet 10/11/11 -0.001 -0.001 -0.002 -0.002 -0.001 -0.001 -0.001 -0.001 -0.001 -0.001 -0.0005 -0.001 -0.001 Alamo River Outlet 5/7/12 -0.001 -0.001 -0.002 -0.002 -0.001 -0.001 -0.001 -0.001 -0.001 -0.001 -0.0005 -0.001 -0.001 Alamo River Outlet 10/15/12 -0.001 -0.001 -0.002 -0.002 -0.001 -0.001 -0.001 -0.001 -0.001 -0.001 -0.0005 -0.001 -0.001
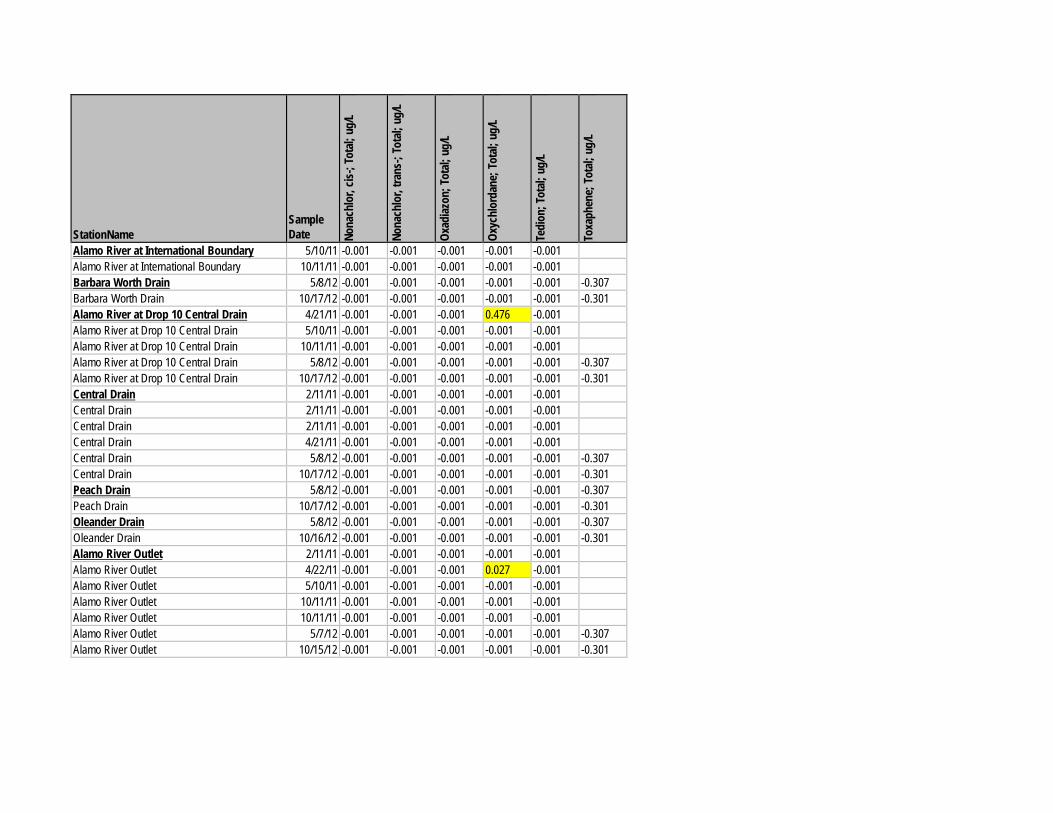
StationName
Sample Date No
nach
lor,
cis-;
Tota
l; ug
/L
Nona
chlo
r, tra
ns-;
Tota
l; ug
/L
Oxad
iazon
; Tot
al; u
g/L
Oxyc
hlor
dane
; Tot
al; u
g/L
Tedi
on; T
otal;
ug/
L
Toxa
phen
e; T
otal;
ug/
L
Alamo River at International Boundary 5/10/11 -0.001 -0.001 -0.001 -0.001 -0.001 Alamo River at International Boundary 10/11/11 -0.001 -0.001 -0.001 -0.001 -0.001 Barbara Worth Drain 5/8/12 -0.001 -0.001 -0.001 -0.001 -0.001 -0.307 Barbara Worth Drain 10/17/12 -0.001 -0.001 -0.001 -0.001 -0.001 -0.301 Alamo River at Drop 10 Central Drain 4/21/11 -0.001 -0.001 -0.001 0.476 -0.001 Alamo River at Drop 10 Central Drain 5/10/11 -0.001 -0.001 -0.001 -0.001 -0.001 Alamo River at Drop 10 Central Drain 10/11/11 -0.001 -0.001 -0.001 -0.001 -0.001 Alamo River at Drop 10 Central Drain 5/8/12 -0.001 -0.001 -0.001 -0.001 -0.001 -0.307 Alamo River at Drop 10 Central Drain 10/17/12 -0.001 -0.001 -0.001 -0.001 -0.001 -0.301 Central Drain 2/11/11 -0.001 -0.001 -0.001 -0.001 -0.001 Central Drain 2/11/11 -0.001 -0.001 -0.001 -0.001 -0.001 Central Drain 2/11/11 -0.001 -0.001 -0.001 -0.001 -0.001 Central Drain 4/21/11 -0.001 -0.001 -0.001 -0.001 -0.001 Central Drain 5/8/12 -0.001 -0.001 -0.001 -0.001 -0.001 -0.307 Central Drain 10/17/12 -0.001 -0.001 -0.001 -0.001 -0.001 -0.301 Peach Drain 5/8/12 -0.001 -0.001 -0.001 -0.001 -0.001 -0.307 Peach Drain 10/17/12 -0.001 -0.001 -0.001 -0.001 -0.001 -0.301 Oleander Drain 5/8/12 -0.001 -0.001 -0.001 -0.001 -0.001 -0.307 Oleander Drain 10/16/12 -0.001 -0.001 -0.001 -0.001 -0.001 -0.301 Alamo River Outlet 2/11/11 -0.001 -0.001 -0.001 -0.001 -0.001 Alamo River Outlet 4/22/11 -0.001 -0.001 -0.001 0.027 -0.001 Alamo River Outlet 5/10/11 -0.001 -0.001 -0.001 -0.001 -0.001 Alamo River Outlet 10/11/11 -0.001 -0.001 -0.001 -0.001 -0.001 Alamo River Outlet 10/11/11 -0.001 -0.001 -0.001 -0.001 -0.001 Alamo River Outlet 5/7/12 -0.001 -0.001 -0.001 -0.001 -0.001 -0.307 Alamo River Outlet 10/15/12 -0.001 -0.001 -0.001 -0.001 -0.001 -0.301
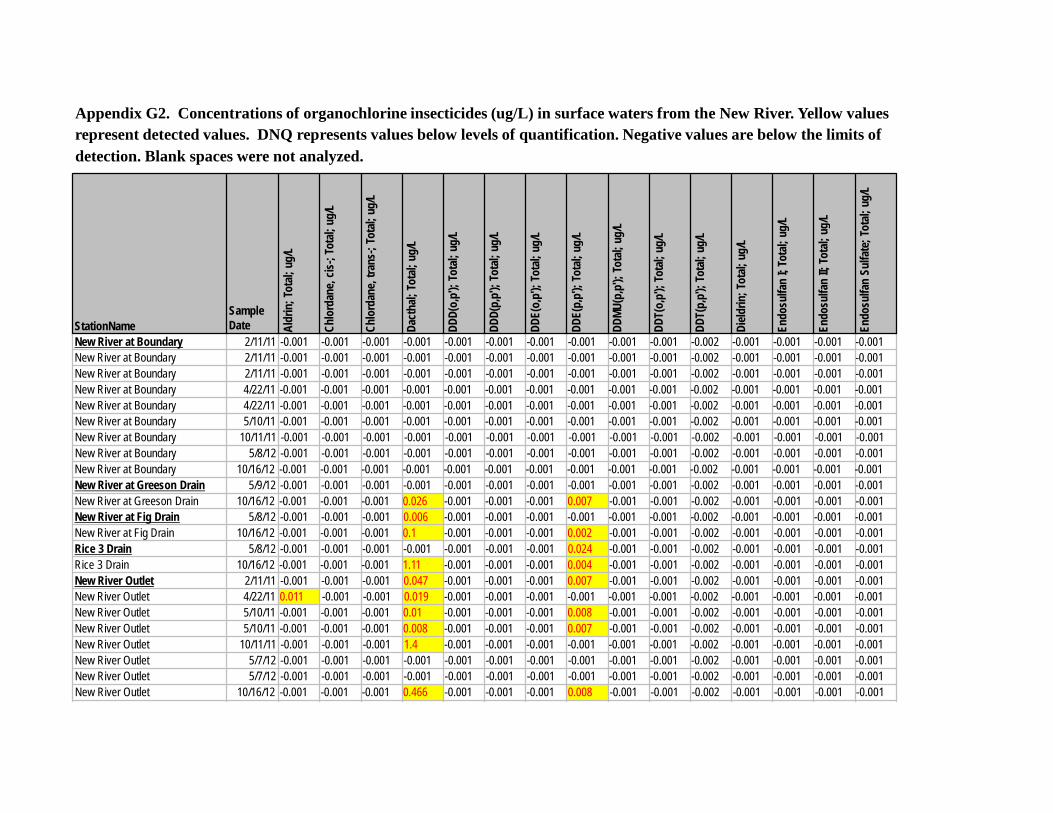
Aldr
in; T
otal;
ug/
L
Chlo
rdan
e, cis
-; To
tal;
ug/L
Chlo
rdan
e, tra
ns-;
Tota
l; ug
/L
Dact
hal;
Tota
l; ug
/L
DDD(
o,p')
; Tot
al; u
g/L
DDD(
p,p')
; Tot
al; u
g/L
DDE(
o,p')
; Tot
al; u
g/L
DDE(
p,p')
; Tot
al; u
g/L
DDMU
(p,p
'); To
tal;
ug/L
DDT(
o,p')
; Tot
al; u
g/L
DDT(
p,p')
; Tot
al; u
g/L
Dield
rin; T
otal;
ug/
L
Endo
sulfa
n I;
Tota
l; ug
/L
Endo
sulfa
n II;
Tota
l; ug
/L
Endo
sulfa
n Su
lfate
; Tot
al; u
g/L
Appendix G2. Concentrations of organochlorine insecticides (ug/L) in surface waters from the New River. Yellow values represent detected values. DNQ represents values below levels of quantification. Negative values are below the limits of detection. Blank spaces were not analyzed.
StationName Sample Date
New River at Boundary 2/11/11 -0.001 -0.001 -0.001 -0.001 -0.001 -0.001 -0.001 -0.001 -0.001 -0.001 -0.002 -0.001 -0.001 -0.001 -0.001 New River at Boundary 2/11/11 -0.001 -0.001 -0.001 -0.001 -0.001 -0.001 -0.001 -0.001 -0.001 -0.001 -0.002 -0.001 -0.001 -0.001 -0.001 New River at Boundary 2/11/11 -0.001 -0.001 -0.001 -0.001 -0.001 -0.001 -0.001 -0.001 -0.001 -0.001 -0.002 -0.001 -0.001 -0.001 -0.001 New River at Boundary 4/22/11 -0.001 -0.001 -0.001 -0.001 -0.001 -0.001 -0.001 -0.001 -0.001 -0.001 -0.002 -0.001 -0.001 -0.001 -0.001 New River at Boundary 4/22/11 -0.001 -0.001 -0.001 -0.001 -0.001 -0.001 -0.001 -0.001 -0.001 -0.001 -0.002 -0.001 -0.001 -0.001 -0.001 New River at Boundary 5/10/11 -0.001 -0.001 -0.001 -0.001 -0.001 -0.001 -0.001 -0.001 -0.001 -0.001 -0.002 -0.001 -0.001 -0.001 -0.001 New River at Boundary 10/11/11 -0.001 -0.001 -0.001 -0.001 -0.001 -0.001 -0.001 -0.001 -0.001 -0.001 -0.002 -0.001 -0.001 -0.001 -0.001 New River at Boundary 5/8/12 -0.001 -0.001 -0.001 -0.001 -0.001 -0.001 -0.001 -0.001 -0.001 -0.001 -0.002 -0.001 -0.001 -0.001 -0.001 New River at Boundary 10/16/12 -0.001 -0.001 -0.001 -0.001 -0.001 -0.001 -0.001 -0.001 -0.001 -0.001 -0.002 -0.001 -0.001 -0.001 -0.001 New River at Greeson Drain 5/9/12 -0.001 -0.001 -0.001 -0.001 -0.001 -0.001 -0.001 -0.001 -0.001 -0.001 -0.002 -0.001 -0.001 -0.001 -0.001 New River at Greeson Drain 10/16/12 -0.001 -0.001 -0.001 0.026 -0.001 -0.001 -0.001 0.007 -0.001 -0.001 -0.002 -0.001 -0.001 -0.001 -0.001 New River at Fig Drain 5/8/12 -0.001 -0.001 -0.001 0.006 -0.001 -0.001 -0.001 -0.001 -0.001 -0.001 -0.002 -0.001 -0.001 -0.001 -0.001 New River at Fig Drain 10/16/12 -0.001 -0.001 -0.001 0.1 -0.001 -0.001 -0.001 0.002 -0.001 -0.001 -0.002 -0.001 -0.001 -0.001 -0.001 Rice 3 Drain 5/8/12 -0.001 -0.001 -0.001 -0.001 -0.001 -0.001 -0.001 0.024 -0.001 -0.001 -0.002 -0.001 -0.001 -0.001 -0.001 Rice 3 Drain 10/16/12 -0.001 -0.001 -0.001 1.11 -0.001 -0.001 -0.001 0.004 -0.001 -0.001 -0.002 -0.001 -0.001 -0.001 -0.001 New River Outlet 2/11/11 -0.001 -0.001 -0.001 0.047 -0.001 -0.001 -0.001 0.007 -0.001 -0.001 -0.002 -0.001 -0.001 -0.001 -0.001 New River Outlet 4/22/11 0.011 -0.001 -0.001 0.019 -0.001 -0.001 -0.001 -0.001 -0.001 -0.001 -0.002 -0.001 -0.001 -0.001 -0.001 New River Outlet 5/10/11 -0.001 -0.001 -0.001 0.01 -0.001 -0.001 -0.001 0.008 -0.001 -0.001 -0.002 -0.001 -0.001 -0.001 -0.001 New River Outlet 5/10/11 -0.001 -0.001 -0.001 0.008 -0.001 -0.001 -0.001 0.007 -0.001 -0.001 -0.002 -0.001 -0.001 -0.001 -0.001 New River Outlet 10/11/11 -0.001 -0.001 -0.001 1.4 -0.001 -0.001 -0.001 -0.001 -0.001 -0.001 -0.002 -0.001 -0.001 -0.001 -0.001 New River Outlet 5/7/12 -0.001 -0.001 -0.001 -0.001 -0.001 -0.001 -0.001 -0.001 -0.001 -0.001 -0.002 -0.001 -0.001 -0.001 -0.001 New River Outlet 5/7/12 -0.001 -0.001 -0.001 -0.001 -0.001 -0.001 -0.001 -0.001 -0.001 -0.001 -0.002 -0.001 -0.001 -0.001 -0.001 New River Outlet 10/16/12 -0.001 -0.001 -0.001 0.466 -0.001 -0.001 -0.001 0.008 -0.001 -0.001 -0.002 -0.001 -0.001 -0.001 -0.001
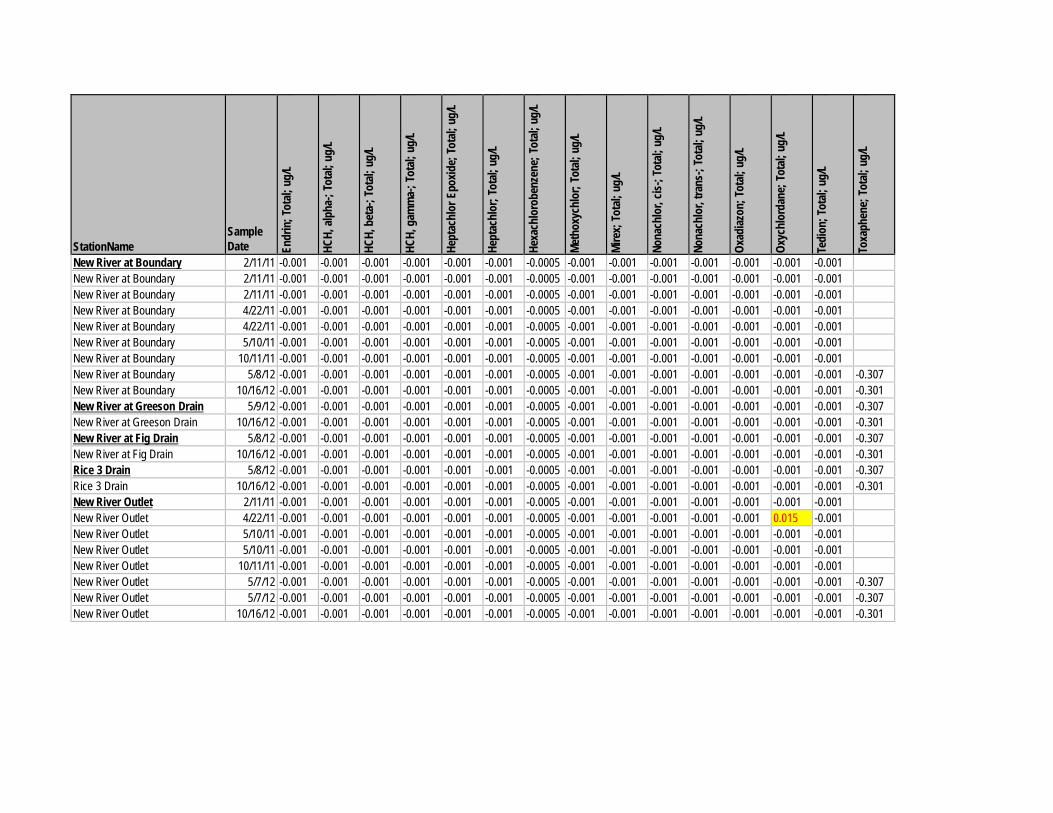
StationName
Sample Date En
drin
; Tot
al; u
g/L
HCH,
alp
ha-;
Tota
l; ug
/L
HCH,
bet
a-; T
otal;
ug/
L
HCH,
gam
ma-
; Tot
al; u
g/L
Hept
achl
or E
poxid
e; To
tal;
ug/L
Hept
achl
or; T
otal;
ug/
L
Hexa
chlo
robe
nzen
e; T
otal;
ug/
L
Meth
oxyc
hlor
; Tot
al; u
g/L
Mire
x; To
tal;
ug/L
Nona
chlo
r, cis
-; To
tal;
ug/L
Nona
chlo
r, tra
ns-;
Tota
l; ug
/L
Oxad
iazon
; Tot
al; u
g/L
Oxyc
hlor
dane
; Tot
al; u
g/L
Tedi
on; T
otal;
ug/
L
Toxa
phen
e; T
otal;
ug/
L
New River at Boundary 2/11/11 -0.001 -0.001 -0.001 -0.001 -0.001 -0.001 -0.0005 -0.001 -0.001 -0.001 -0.001 -0.001 -0.001 -0.001 New River at Boundary 2/11/11 -0.001 -0.001 -0.001 -0.001 -0.001 -0.001 -0.0005 -0.001 -0.001 -0.001 -0.001 -0.001 -0.001 -0.001 New River at Boundary 2/11/11 -0.001 -0.001 -0.001 -0.001 -0.001 -0.001 -0.0005 -0.001 -0.001 -0.001 -0.001 -0.001 -0.001 -0.001 New River at Boundary 4/22/11 -0.001 -0.001 -0.001 -0.001 -0.001 -0.001 -0.0005 -0.001 -0.001 -0.001 -0.001 -0.001 -0.001 -0.001 New River at Boundary 4/22/11 -0.001 -0.001 -0.001 -0.001 -0.001 -0.001 -0.0005 -0.001 -0.001 -0.001 -0.001 -0.001 -0.001 -0.001 New River at Boundary 5/10/11 -0.001 -0.001 -0.001 -0.001 -0.001 -0.001 -0.0005 -0.001 -0.001 -0.001 -0.001 -0.001 -0.001 -0.001 New River at Boundary 10/11/11 -0.001 -0.001 -0.001 -0.001 -0.001 -0.001 -0.0005 -0.001 -0.001 -0.001 -0.001 -0.001 -0.001 -0.001 New River at Boundary 5/8/12 -0.001 -0.001 -0.001 -0.001 -0.001 -0.001 -0.0005 -0.001 -0.001 -0.001 -0.001 -0.001 -0.001 -0.001 -0.307 New River at Boundary 10/16/12 -0.001 -0.001 -0.001 -0.001 -0.001 -0.001 -0.0005 -0.001 -0.001 -0.001 -0.001 -0.001 -0.001 -0.001 -0.301 New River at Greeson Drain 5/9/12 -0.001 -0.001 -0.001 -0.001 -0.001 -0.001 -0.0005 -0.001 -0.001 -0.001 -0.001 -0.001 -0.001 -0.001 -0.307 New River at Greeson Drain 10/16/12 -0.001 -0.001 -0.001 -0.001 -0.001 -0.001 -0.0005 -0.001 -0.001 -0.001 -0.001 -0.001 -0.001 -0.001 -0.301 New River at Fig Drain 5/8/12 -0.001 -0.001 -0.001 -0.001 -0.001 -0.001 -0.0005 -0.001 -0.001 -0.001 -0.001 -0.001 -0.001 -0.001 -0.307 New River at Fig Drain 10/16/12 -0.001 -0.001 -0.001 -0.001 -0.001 -0.001 -0.0005 -0.001 -0.001 -0.001 -0.001 -0.001 -0.001 -0.001 -0.301 Rice 3 Drain 5/8/12 -0.001 -0.001 -0.001 -0.001 -0.001 -0.001 -0.0005 -0.001 -0.001 -0.001 -0.001 -0.001 -0.001 -0.001 -0.307 Rice 3 Drain 10/16/12 -0.001 -0.001 -0.001 -0.001 -0.001 -0.001 -0.0005 -0.001 -0.001 -0.001 -0.001 -0.001 -0.001 -0.001 -0.301 New River Outlet 2/11/11 -0.001 -0.001 -0.001 -0.001 -0.001 -0.001 -0.0005 -0.001 -0.001 -0.001 -0.001 -0.001 -0.001 -0.001 New River Outlet 4/22/11 -0.001 -0.001 -0.001 -0.001 -0.001 -0.001 -0.0005 -0.001 -0.001 -0.001 -0.001 -0.001 0.015 -0.001 New River Outlet 5/10/11 -0.001 -0.001 -0.001 -0.001 -0.001 -0.001 -0.0005 -0.001 -0.001 -0.001 -0.001 -0.001 -0.001 -0.001 New River Outlet 5/10/11 -0.001 -0.001 -0.001 -0.001 -0.001 -0.001 -0.0005 -0.001 -0.001 -0.001 -0.001 -0.001 -0.001 -0.001 New River Outlet 10/11/11 -0.001 -0.001 -0.001 -0.001 -0.001 -0.001 -0.0005 -0.001 -0.001 -0.001 -0.001 -0.001 -0.001 -0.001 New River Outlet 5/7/12 -0.001 -0.001 -0.001 -0.001 -0.001 -0.001 -0.0005 -0.001 -0.001 -0.001 -0.001 -0.001 -0.001 -0.001 -0.307 New River Outlet 5/7/12 -0.001 -0.001 -0.001 -0.001 -0.001 -0.001 -0.0005 -0.001 -0.001 -0.001 -0.001 -0.001 -0.001 -0.001 -0.307 New River Outlet 10/16/12 -0.001 -0.001 -0.001 -0.001 -0.001 -0.001 -0.0005 -0.001 -0.001 -0.001 -0.001 -0.001 -0.001 -0.001 -0.301
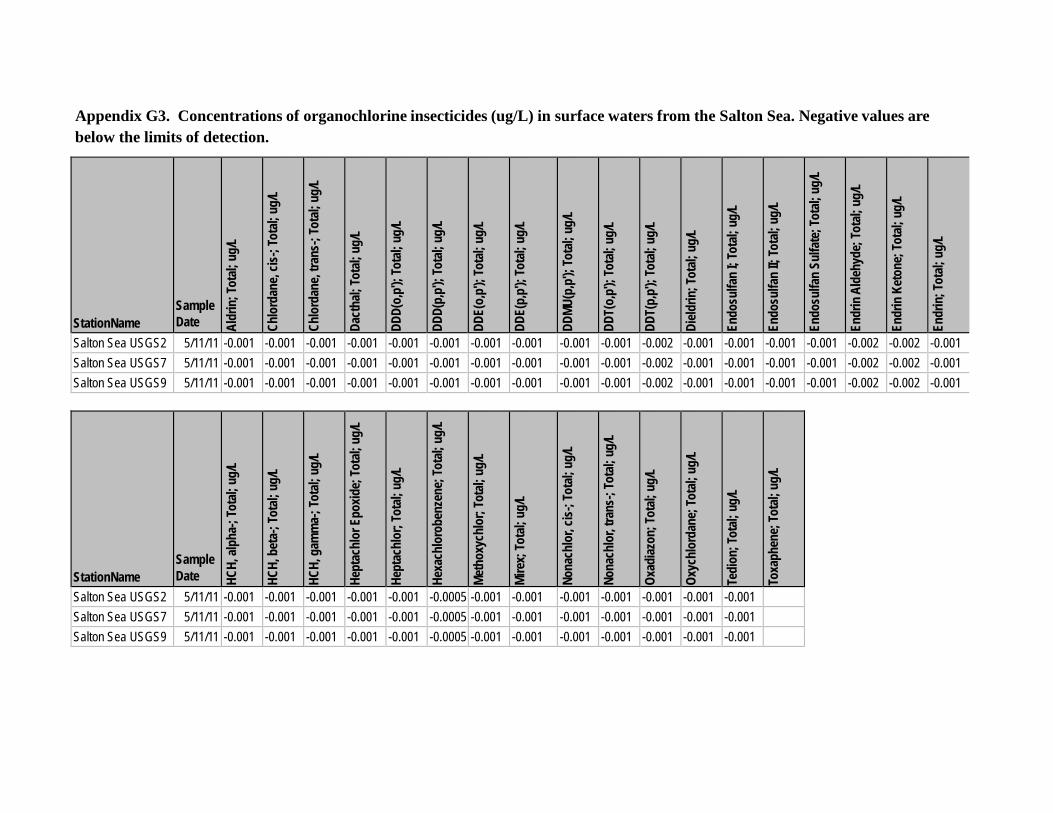
Appendix G3. Concentrations of organochlorine insecticides (ug/L) in surface waters from the Salton Sea. Negative values are below the limits of detection.
StationName
Sample Date Al
drin
; Tot
al; u
g/L
Chlo
rdan
e, cis
-; To
tal;
ug/L
Chlo
rdan
e, tra
ns-;
Tota
l; ug
/L
Dact
hal;
Tota
l; ug
/L
DDD(
o,p')
; Tot
al; u
g/L
DDD(
p,p')
; Tot
al; u
g/L
DDE(
o,p')
; Tot
al; u
g/L
DDE(
p,p')
; Tot
al; u
g/L
DDMU
(p,p
'); To
tal;
ug/L
DDT(
o,p')
; Tot
al; u
g/L
DDT(
p,p')
; Tot
al; u
g/L
Dield
rin; T
otal;
ug/
L
Endo
sulfa
n I;
Tota
l; ug
/L
Endo
sulfa
n II;
Tota
l; ug
/L
Endo
sulfa
n Su
lfate
; Tot
al; u
g/L
Endr
in A
ldeh
yde;
Tota
l; ug
/L
Endr
in K
eton
e; To
tal;
ug/L
Endr
in; T
otal;
ug/
L
Salton Sea USGS2 5/11/11 -0.001 -0.001 -0.001 -0.001 -0.001 -0.001 -0.001 -0.001 -0.001 -0.001 -0.002 -0.001 -0.001 -0.001 -0.001 -0.002 -0.002 -0.001 Salton Sea USGS7 5/11/11 -0.001 -0.001 -0.001 -0.001 -0.001 -0.001 -0.001 -0.001 -0.001 -0.001 -0.002 -0.001 -0.001 -0.001 -0.001 -0.002 -0.002 -0.001 Salton Sea USGS9 5/11/11 -0.001 -0.001 -0.001 -0.001 -0.001 -0.001 -0.001 -0.001 -0.001 -0.001 -0.002 -0.001 -0.001 -0.001 -0.001 -0.002 -0.002 -0.001
StationName
Sample Date HC
H, al
pha-
; Tot
al; u
g/L
HCH,
bet
a-; T
otal;
ug/
L
HCH,
gam
ma-
; Tot
al; u
g/L
Hept
achl
or E
poxid
e; To
tal;
ug/L
Hept
achl
or; T
otal;
ug/
L
Hexa
chlo
robe
nzen
e; To
tal;
ug/L
Meth
oxyc
hlor
; Tot
al; u
g/L
Mire
x; To
tal;
ug/L
Nona
chlo
r, cis
-; To
tal;
ug/L
Nona
chlo
r, tra
ns-;
Tota
l; ug
/L
Oxad
iazon
; Tot
al; u
g/L
Oxyc
hlor
dane
; Tot
al; u
g/L
Tedi
on; T
otal;
ug/
L
Toxa
phen
e; To
tal;
ug/L
Salton Sea USGS2 5/11/11 -0.001 -0.001 -0.001 -0.001 -0.001 -0.0005 -0.001 -0.001 -0.001 -0.001 -0.001 -0.001 -0.001 Salton Sea USGS7 5/11/11 -0.001 -0.001 -0.001 -0.001 -0.001 -0.0005 -0.001 -0.001 -0.001 -0.001 -0.001 -0.001 -0.001 Salton Sea USGS9 5/11/11 -0.001 -0.001 -0.001 -0.001 -0.001 -0.0005 -0.001 -0.001 -0.001 -0.001 -0.001 -0.001 -0.001
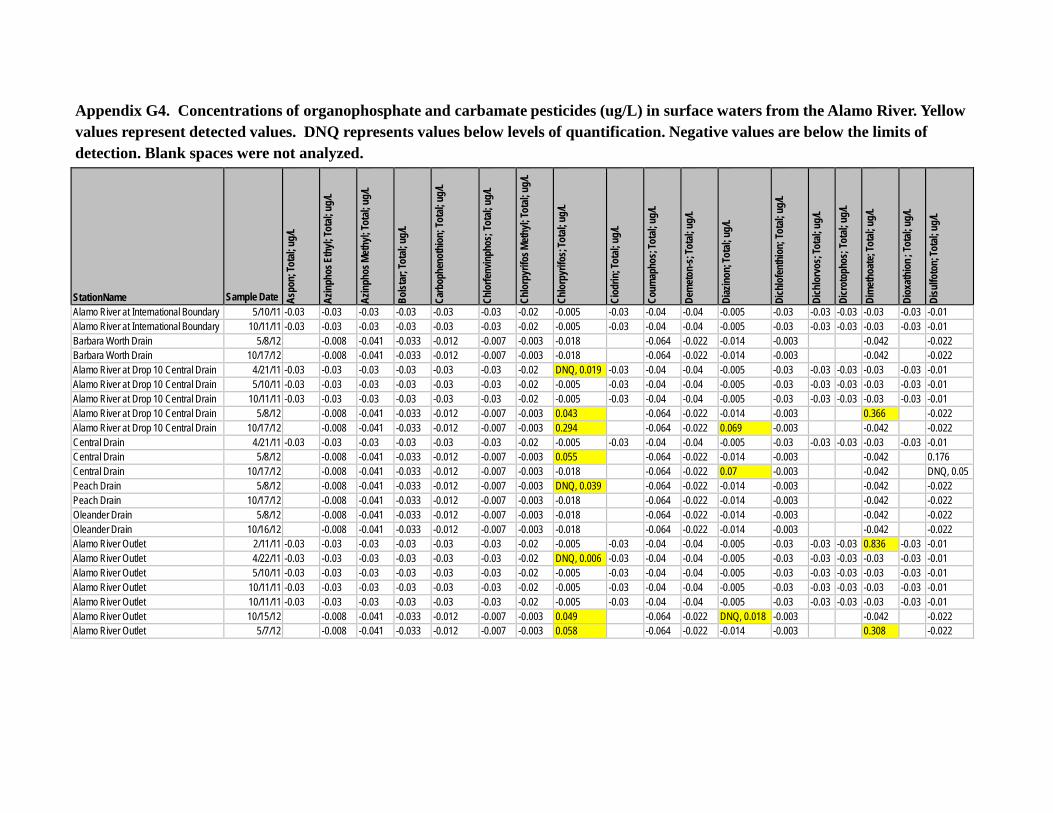
Appendix G4. Concentrations of organophosphate and carbamate pesticides (ug/L) in surface waters from the Alamo River. Yellow values represent detected values. DNQ represents values below levels of quantification. Negative values are below the limits of detection. Blank spaces were not analyzed.
StationName
Sample Date As
pon;
Tota
l; ug/
L
Azin
phos
Ethy
l; Tot
al; ug
/L
Azin
phos
Met
hyl; T
otal;
ug/L
Bolst
ar; T
otal;
ug/L
Carb
ophe
noth
ion;
Tota
l; ug/
L
Chlo
rfenv
inph
os; T
otal;
ug/L
Chlo
rpyr
ifos M
ethy
l; Tot
al; ug
/L
Chlo
rpyr
ifos;
Tota
l; ug/
L
Ciod
rin; T
otal;
ug/L
Coum
apho
s; To
tal; u
g/L
Dem
eton
-s; T
otal;
ug/L
Diaz
inon
; Tot
al; ug
/L
Dich
lofe
nthi
on; T
otal;
ug/L
Dich
lorv
os; T
otal;
ug/L
Dicr
otop
hos;
Tota
l; ug/
L
Dim
etho
ate;
Tota
l; ug/
L
Diox
athi
on ; T
otal;
ug/L
Disu
lfoto
n; To
tal; u
g/L
Alamo River at International Boundary 5/10/11 -0.03 -0.03 -0.03 -0.03 -0.03 -0.03 -0.02 -0.005 -0.03 -0.04 -0.04 -0.005 -0.03 -0.03 -0.03 -0.03 -0.03 -0.01 Alamo River at International Boundary 10/11/11 -0.03 -0.03 -0.03 -0.03 -0.03 -0.03 -0.02 -0.005 -0.03 -0.04 -0.04 -0.005 -0.03 -0.03 -0.03 -0.03 -0.03 -0.01 Barbara Worth Drain 5/8/12 -0.008 -0.041 -0.033 -0.012 -0.007 -0.003 -0.018 -0.064 -0.022 -0.014 -0.003 -0.042 -0.022 Barbara Worth Drain 10/17/12 -0.008 -0.041 -0.033 -0.012 -0.007 -0.003 -0.018 -0.064 -0.022 -0.014 -0.003 -0.042 -0.022 Alamo River at Drop 10 Central Drain 4/21/11 -0.03 -0.03 -0.03 -0.03 -0.03 -0.03 -0.02 DNQ, 0.019 -0.03 -0.04 -0.04 -0.005 -0.03 -0.03 -0.03 -0.03 -0.03 -0.01 Alamo River at Drop 10 Central Drain 5/10/11 -0.03 -0.03 -0.03 -0.03 -0.03 -0.03 -0.02 -0.005 -0.03 -0.04 -0.04 -0.005 -0.03 -0.03 -0.03 -0.03 -0.03 -0.01 Alamo River at Drop 10 Central Drain 10/11/11 -0.03 -0.03 -0.03 -0.03 -0.03 -0.03 -0.02 -0.005 -0.03 -0.04 -0.04 -0.005 -0.03 -0.03 -0.03 -0.03 -0.03 -0.01 Alamo River at Drop 10 Central Drain 5/8/12 -0.008 -0.041 -0.033 -0.012 -0.007 -0.003 0.043 -0.064 -0.022 -0.014 -0.003 0.366 -0.022 Alamo River at Drop 10 Central Drain 10/17/12 -0.008 -0.041 -0.033 -0.012 -0.007 -0.003 0.294 -0.064 -0.022 0.069 -0.003 -0.042 -0.022 Central Drain 4/21/11 -0.03 -0.03 -0.03 -0.03 -0.03 -0.03 -0.02 -0.005 -0.03 -0.04 -0.04 -0.005 -0.03 -0.03 -0.03 -0.03 -0.03 -0.01 Central Drain 5/8/12 -0.008 -0.041 -0.033 -0.012 -0.007 -0.003 0.055 -0.064 -0.022 -0.014 -0.003 -0.042 0.176 Central Drain 10/17/12 -0.008 -0.041 -0.033 -0.012 -0.007 -0.003 -0.018 -0.064 -0.022 0.07 -0.003 -0.042 DNQ, 0.05 Peach Drain 5/8/12 -0.008 -0.041 -0.033 -0.012 -0.007 -0.003 DNQ, 0.039 -0.064 -0.022 -0.014 -0.003 -0.042 -0.022 Peach Drain 10/17/12 -0.008 -0.041 -0.033 -0.012 -0.007 -0.003 -0.018 -0.064 -0.022 -0.014 -0.003 -0.042 -0.022 Oleander Drain 5/8/12 -0.008 -0.041 -0.033 -0.012 -0.007 -0.003 -0.018 -0.064 -0.022 -0.014 -0.003 -0.042 -0.022 Oleander Drain 10/16/12 -0.008 -0.041 -0.033 -0.012 -0.007 -0.003 -0.018 -0.064 -0.022 -0.014 -0.003 -0.042 -0.022 Alamo River Outlet 2/11/11 -0.03 -0.03 -0.03 -0.03 -0.03 -0.03 -0.02 -0.005 -0.03 -0.04 -0.04 -0.005 -0.03 -0.03 -0.03 0.836 -0.03 -0.01 Alamo River Outlet 4/22/11 -0.03 -0.03 -0.03 -0.03 -0.03 -0.03 -0.02 DNQ, 0.006 -0.03 -0.04 -0.04 -0.005 -0.03 -0.03 -0.03 -0.03 -0.03 -0.01 Alamo River Outlet 5/10/11 -0.03 -0.03 -0.03 -0.03 -0.03 -0.03 -0.02 -0.005 -0.03 -0.04 -0.04 -0.005 -0.03 -0.03 -0.03 -0.03 -0.03 -0.01 Alamo River Outlet 10/11/11 -0.03 -0.03 -0.03 -0.03 -0.03 -0.03 -0.02 -0.005 -0.03 -0.04 -0.04 -0.005 -0.03 -0.03 -0.03 -0.03 -0.03 -0.01 Alamo River Outlet 10/11/11 -0.03 -0.03 -0.03 -0.03 -0.03 -0.03 -0.02 -0.005 -0.03 -0.04 -0.04 -0.005 -0.03 -0.03 -0.03 -0.03 -0.03 -0.01 Alamo River Outlet 10/15/12 -0.008 -0.041 -0.033 -0.012 -0.007 -0.003 0.049 -0.064 -0.022 DNQ, 0.018 -0.003 -0.042 -0.022 Alamo River Outlet 5/7/12 -0.008 -0.041 -0.033 -0.012 -0.007 -0.003 0.058 -0.064 -0.022 -0.014 -0.003 0.308 -0.022
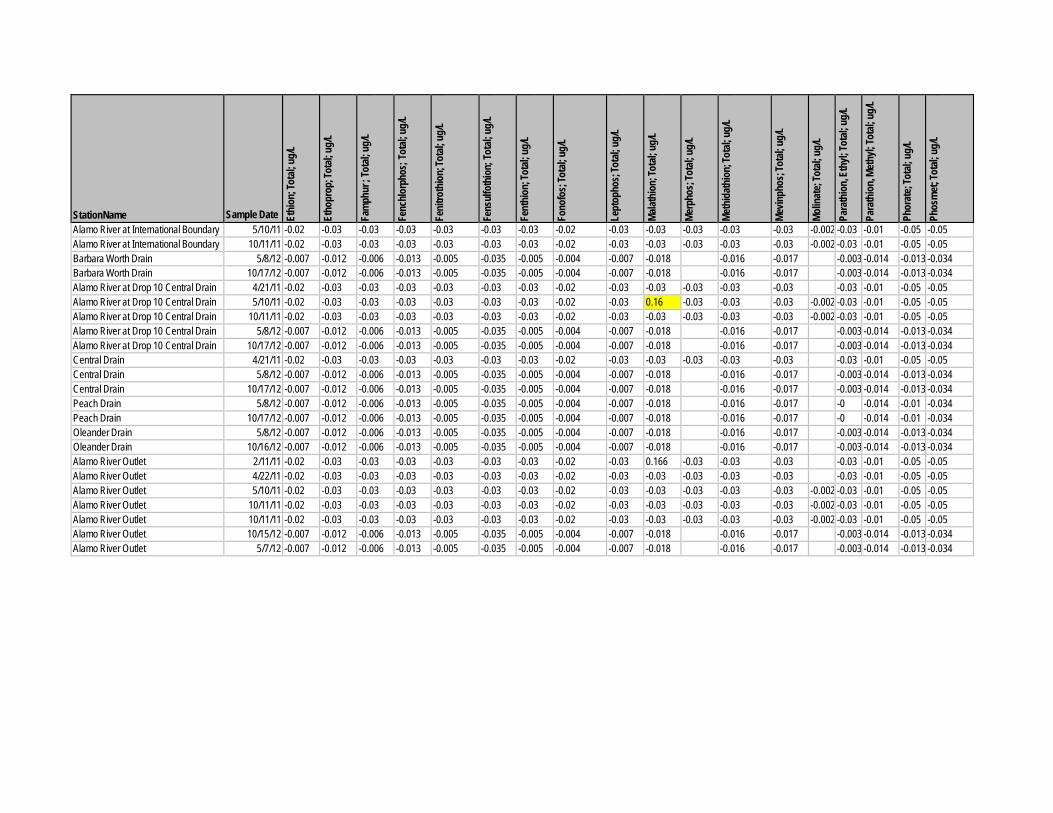
StationName
Sample Date Et
hion
; Tot
al; ug
/L
Etho
prop
; Tot
al; ug
/L
Fam
phur
; Tot
al; ug
/L
Fenc
hlorp
hos;
Tota
l; ug/
L
Feni
troth
ion;
Tota
l; ug/
L
Fens
ulfot
hion
; Tot
al; ug
/L
Fent
hion
; Tot
al; ug
/L
Fono
fos;
Tota
l; ug/
L
Lept
opho
s; To
tal; u
g/L
Malat
hion
; Tot
al; ug
/L
Merp
hos;
Tota
l; ug/
L
Meth
idat
hion
; Tot
al; ug
/L
Mevin
phos
; Tot
al; ug
/L
Molin
ate;
Tota
l; ug/
L
Para
thio
n, Et
hyl; T
otal;
ug/L
Para
thio
n, M
ethy
l; Tot
al; ug
/L
Phor
ate;
Tota
l; ug/
L
Phos
met
; Tot
al; ug
/L
Alamo River at International Boundary 5/10/11 -0.02 -0.03 -0.03 -0.03 -0.03 -0.03 -0.03 -0.02 -0.03 -0.03 -0.03 -0.03 -0.03 -0.002 -0.03 -0.01 -0.05 -0.05 Alamo River at International Boundary 10/11/11 -0.02 -0.03 -0.03 -0.03 -0.03 -0.03 -0.03 -0.02 -0.03 -0.03 -0.03 -0.03 -0.03 -0.002 -0.03 -0.01 -0.05 -0.05 Barbara Worth Drain 5/8/12 -0.007 -0.012 -0.006 -0.013 -0.005 -0.035 -0.005 -0.004 -0.007 -0.018 -0.016 -0.017 -0.003 -0.014 -0.013 -0.034 Barbara Worth Drain 10/17/12 -0.007 -0.012 -0.006 -0.013 -0.005 -0.035 -0.005 -0.004 -0.007 -0.018 -0.016 -0.017 -0.003 -0.014 -0.013 -0.034 Alamo River at Drop 10 Central Drain 4/21/11 -0.02 -0.03 -0.03 -0.03 -0.03 -0.03 -0.03 -0.02 -0.03 -0.03 -0.03 -0.03 -0.03 -0.03 -0.01 -0.05 -0.05 Alamo River at Drop 10 Central Drain 5/10/11 -0.02 -0.03 -0.03 -0.03 -0.03 -0.03 -0.03 -0.02 -0.03 0.16 -0.03 -0.03 -0.03 -0.002 -0.03 -0.01 -0.05 -0.05 Alamo River at Drop 10 Central Drain 10/11/11 -0.02 -0.03 -0.03 -0.03 -0.03 -0.03 -0.03 -0.02 -0.03 -0.03 -0.03 -0.03 -0.03 -0.002 -0.03 -0.01 -0.05 -0.05 Alamo River at Drop 10 Central Drain 5/8/12 -0.007 -0.012 -0.006 -0.013 -0.005 -0.035 -0.005 -0.004 -0.007 -0.018 -0.016 -0.017 -0.003 -0.014 -0.013 -0.034 Alamo River at Drop 10 Central Drain 10/17/12 -0.007 -0.012 -0.006 -0.013 -0.005 -0.035 -0.005 -0.004 -0.007 -0.018 -0.016 -0.017 -0.003 -0.014 -0.013 -0.034 Central Drain 4/21/11 -0.02 -0.03 -0.03 -0.03 -0.03 -0.03 -0.03 -0.02 -0.03 -0.03 -0.03 -0.03 -0.03 -0.03 -0.01 -0.05 -0.05 Central Drain 5/8/12 -0.007 -0.012 -0.006 -0.013 -0.005 -0.035 -0.005 -0.004 -0.007 -0.018 -0.016 -0.017 -0.003 -0.014 -0.013 -0.034 Central Drain 10/17/12 -0.007 -0.012 -0.006 -0.013 -0.005 -0.035 -0.005 -0.004 -0.007 -0.018 -0.016 -0.017 -0.003 -0.014 -0.013 -0.034 Peach Drain 5/8/12 -0.007 -0.012 -0.006 -0.013 -0.005 -0.035 -0.005 -0.004 -0.007 -0.018 -0.016 -0.017 -0 -0.014 -0.01 -0.034 Peach Drain 10/17/12 -0.007 -0.012 -0.006 -0.013 -0.005 -0.035 -0.005 -0.004 -0.007 -0.018 -0.016 -0.017 -0 -0.014 -0.01 -0.034 Oleander Drain 5/8/12 -0.007 -0.012 -0.006 -0.013 -0.005 -0.035 -0.005 -0.004 -0.007 -0.018 -0.016 -0.017 -0.003 -0.014 -0.013 -0.034 Oleander Drain 10/16/12 -0.007 -0.012 -0.006 -0.013 -0.005 -0.035 -0.005 -0.004 -0.007 -0.018 -0.016 -0.017 -0.003 -0.014 -0.013 -0.034 Alamo River Outlet 2/11/11 -0.02 -0.03 -0.03 -0.03 -0.03 -0.03 -0.03 -0.02 -0.03 0.166 -0.03 -0.03 -0.03 -0.03 -0.01 -0.05 -0.05 Alamo River Outlet 4/22/11 -0.02 -0.03 -0.03 -0.03 -0.03 -0.03 -0.03 -0.02 -0.03 -0.03 -0.03 -0.03 -0.03 -0.03 -0.01 -0.05 -0.05 Alamo River Outlet 5/10/11 -0.02 -0.03 -0.03 -0.03 -0.03 -0.03 -0.03 -0.02 -0.03 -0.03 -0.03 -0.03 -0.03 -0.002 -0.03 -0.01 -0.05 -0.05 Alamo River Outlet 10/11/11 -0.02 -0.03 -0.03 -0.03 -0.03 -0.03 -0.03 -0.02 -0.03 -0.03 -0.03 -0.03 -0.03 -0.002 -0.03 -0.01 -0.05 -0.05 Alamo River Outlet 10/11/11 -0.02 -0.03 -0.03 -0.03 -0.03 -0.03 -0.03 -0.02 -0.03 -0.03 -0.03 -0.03 -0.03 -0.002 -0.03 -0.01 -0.05 -0.05 Alamo River Outlet 10/15/12 -0.007 -0.012 -0.006 -0.013 -0.005 -0.035 -0.005 -0.004 -0.007 -0.018 -0.016 -0.017 -0.003 -0.014 -0.013 -0.034 Alamo River Outlet 5/7/12 -0.007 -0.012 -0.006 -0.013 -0.005 -0.035 -0.005 -0.004 -0.007 -0.018 -0.016 -0.017 -0.003 -0.014 -0.013 -0.034
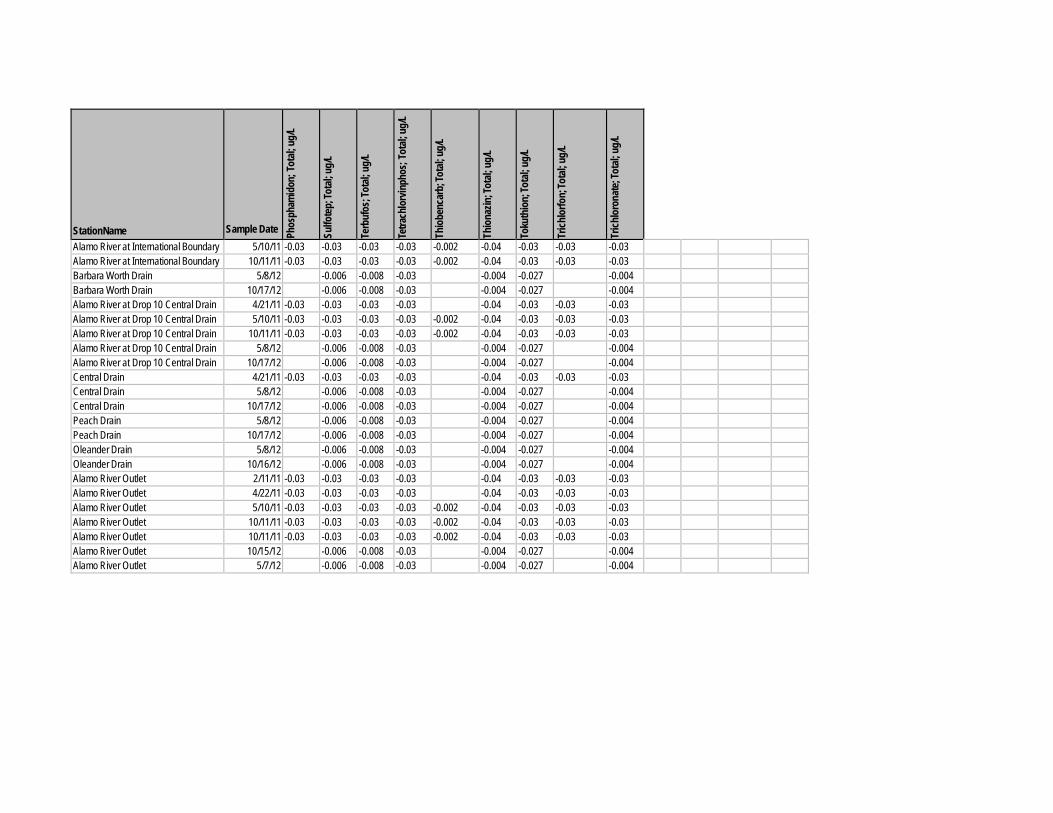
StationName
Sample Date Ph
osph
amid
on; T
otal;
ug/L
Sulfo
tep;
Tota
l; ug/
L
Terb
ufos
; Tot
al; ug
/L
Tetra
chlo
rvin
phos
; Tot
al; ug
/L
Thio
benc
arb;
Tota
l; ug/
L
Thio
nazin
; Tot
al; ug
/L
Toku
thio
n; To
tal; u
g/L
Trich
lorfo
n; To
tal; u
g/L
Trich
loro
nate
; Tot
al; ug
/L
Alamo River at International Boundary 5/10/11 -0.03 -0.03 -0.03 -0.03 -0.002 -0.04 -0.03 -0.03 -0.03 Alamo River at International Boundary 10/11/11 -0.03 -0.03 -0.03 -0.03 -0.002 -0.04 -0.03 -0.03 -0.03 Barbara Worth Drain 5/8/12 -0.006 -0.008 -0.03 -0.004 -0.027 -0.004 Barbara Worth Drain 10/17/12 -0.006 -0.008 -0.03 -0.004 -0.027 -0.004 Alamo River at Drop 10 Central Drain 4/21/11 -0.03 -0.03 -0.03 -0.03 -0.04 -0.03 -0.03 -0.03 Alamo River at Drop 10 Central Drain 5/10/11 -0.03 -0.03 -0.03 -0.03 -0.002 -0.04 -0.03 -0.03 -0.03 Alamo River at Drop 10 Central Drain 10/11/11 -0.03 -0.03 -0.03 -0.03 -0.002 -0.04 -0.03 -0.03 -0.03 Alamo River at Drop 10 Central Drain 5/8/12 -0.006 -0.008 -0.03 -0.004 -0.027 -0.004 Alamo River at Drop 10 Central Drain 10/17/12 -0.006 -0.008 -0.03 -0.004 -0.027 -0.004 Central Drain 4/21/11 -0.03 -0.03 -0.03 -0.03 -0.04 -0.03 -0.03 -0.03 Central Drain 5/8/12 -0.006 -0.008 -0.03 -0.004 -0.027 -0.004 Central Drain 10/17/12 -0.006 -0.008 -0.03 -0.004 -0.027 -0.004 Peach Drain 5/8/12 -0.006 -0.008 -0.03 -0.004 -0.027 -0.004 Peach Drain 10/17/12 -0.006 -0.008 -0.03 -0.004 -0.027 -0.004 Oleander Drain 5/8/12 -0.006 -0.008 -0.03 -0.004 -0.027 -0.004 Oleander Drain 10/16/12 -0.006 -0.008 -0.03 -0.004 -0.027 -0.004 Alamo River Outlet 2/11/11 -0.03 -0.03 -0.03 -0.03 -0.04 -0.03 -0.03 -0.03 Alamo River Outlet 4/22/11 -0.03 -0.03 -0.03 -0.03 -0.04 -0.03 -0.03 -0.03 Alamo River Outlet 5/10/11 -0.03 -0.03 -0.03 -0.03 -0.002 -0.04 -0.03 -0.03 -0.03 Alamo River Outlet 10/11/11 -0.03 -0.03 -0.03 -0.03 -0.002 -0.04 -0.03 -0.03 -0.03 Alamo River Outlet 10/11/11 -0.03 -0.03 -0.03 -0.03 -0.002 -0.04 -0.03 -0.03 -0.03 Alamo River Outlet 10/15/12 -0.006 -0.008 -0.03 -0.004 -0.027 -0.004 Alamo River Outlet 5/7/12 -0.006 -0.008 -0.03 -0.004 -0.027 -0.004
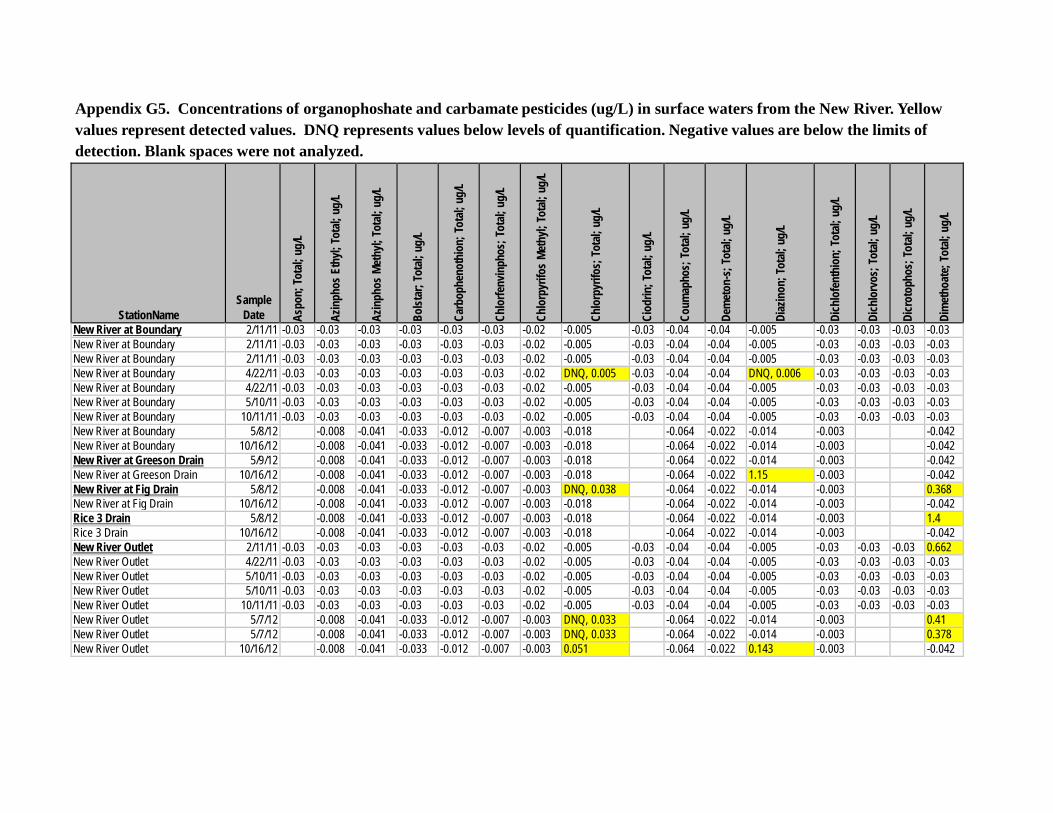
Appendix G5. Concentrations of organophoshate and carbamate pesticides (ug/L) in surface waters from the New River. Yellow values represent detected values. DNQ represents values below levels of quantification. Negative values are below the limits of detection. Blank spaces were not analyzed.
StationName
Sample Date As
pon;
Tota
l; ug
/L
Azin
phos
Eth
yl; To
tal;
ug/L
Azin
phos
Met
hyl;
Tota
l; ug
/L
Bolst
ar; T
otal;
ug/
L
Carb
ophe
noth
ion;
Tot
al; u
g/L
Chlo
rfenv
inph
os; T
otal;
ug/
L
Chlo
rpyr
ifos
Meth
yl; To
tal;
ug/L
Chlo
rpyr
ifos;
Tot
al; u
g/L
Ciod
rin; T
otal;
ug/
L
Coum
apho
s; T
otal;
ug/
L
Dem
eton
-s; T
otal;
ug/
L
Diaz
inon
; Tot
al; u
g/L
Dich
lofe
nthi
on; T
otal;
ug/
L
Dich
lorv
os; T
otal;
ug/
L
Dicr
otop
hos;
Tota
l; ug
/L
Dim
etho
ate;
Tot
al; u
g/L
New River at Boundary 2/11/11 -0.03 -0.03 -0.03 -0.03 -0.03 -0.03 -0.02 -0.005 -0.03 -0.04 -0.04 -0.005 -0.03 -0.03 -0.03 -0.03 New River at Boundary 2/11/11 -0.03 -0.03 -0.03 -0.03 -0.03 -0.03 -0.02 -0.005 -0.03 -0.04 -0.04 -0.005 -0.03 -0.03 -0.03 -0.03 New River at Boundary 2/11/11 -0.03 -0.03 -0.03 -0.03 -0.03 -0.03 -0.02 -0.005 -0.03 -0.04 -0.04 -0.005 -0.03 -0.03 -0.03 -0.03 New River at Boundary 4/22/11 -0.03 -0.03 -0.03 -0.03 -0.03 -0.03 -0.02 DNQ, 0.005 -0.03 -0.04 -0.04 DNQ, 0.006 -0.03 -0.03 -0.03 -0.03 New River at Boundary 4/22/11 -0.03 -0.03 -0.03 -0.03 -0.03 -0.03 -0.02 -0.005 -0.03 -0.04 -0.04 -0.005 -0.03 -0.03 -0.03 -0.03 New River at Boundary 5/10/11 -0.03 -0.03 -0.03 -0.03 -0.03 -0.03 -0.02 -0.005 -0.03 -0.04 -0.04 -0.005 -0.03 -0.03 -0.03 -0.03 New River at Boundary 10/11/11 -0.03 -0.03 -0.03 -0.03 -0.03 -0.03 -0.02 -0.005 -0.03 -0.04 -0.04 -0.005 -0.03 -0.03 -0.03 -0.03 New River at Boundary 5/8/12 -0.008 -0.041 -0.033 -0.012 -0.007 -0.003 -0.018 -0.064 -0.022 -0.014 -0.003 -0.042 New River at Boundary 10/16/12 -0.008 -0.041 -0.033 -0.012 -0.007 -0.003 -0.018 -0.064 -0.022 -0.014 -0.003 -0.042 New River at Greeson Drain 5/9/12 -0.008 -0.041 -0.033 -0.012 -0.007 -0.003 -0.018 -0.064 -0.022 -0.014 -0.003 -0.042 New River at Greeson Drain 10/16/12 -0.008 -0.041 -0.033 -0.012 -0.007 -0.003 -0.018 -0.064 -0.022 1.15 -0.003 -0.042 New River at Fig Drain 5/8/12 -0.008 -0.041 -0.033 -0.012 -0.007 -0.003 DNQ, 0.038 -0.064 -0.022 -0.014 -0.003 0.368 New River at Fig Drain 10/16/12 -0.008 -0.041 -0.033 -0.012 -0.007 -0.003 -0.018 -0.064 -0.022 -0.014 -0.003 -0.042 Rice 3 Drain 5/8/12 -0.008 -0.041 -0.033 -0.012 -0.007 -0.003 -0.018 -0.064 -0.022 -0.014 -0.003 1.4 Rice 3 Drain 10/16/12 -0.008 -0.041 -0.033 -0.012 -0.007 -0.003 -0.018 -0.064 -0.022 -0.014 -0.003 -0.042 New River Outlet 2/11/11 -0.03 -0.03 -0.03 -0.03 -0.03 -0.03 -0.02 -0.005 -0.03 -0.04 -0.04 -0.005 -0.03 -0.03 -0.03 0.662 New River Outlet 4/22/11 -0.03 -0.03 -0.03 -0.03 -0.03 -0.03 -0.02 -0.005 -0.03 -0.04 -0.04 -0.005 -0.03 -0.03 -0.03 -0.03 New River Outlet 5/10/11 -0.03 -0.03 -0.03 -0.03 -0.03 -0.03 -0.02 -0.005 -0.03 -0.04 -0.04 -0.005 -0.03 -0.03 -0.03 -0.03 New River Outlet 5/10/11 -0.03 -0.03 -0.03 -0.03 -0.03 -0.03 -0.02 -0.005 -0.03 -0.04 -0.04 -0.005 -0.03 -0.03 -0.03 -0.03 New River Outlet 10/11/11 -0.03 -0.03 -0.03 -0.03 -0.03 -0.03 -0.02 -0.005 -0.03 -0.04 -0.04 -0.005 -0.03 -0.03 -0.03 -0.03 New River Outlet 5/7/12 -0.008 -0.041 -0.033 -0.012 -0.007 -0.003 DNQ, 0.033 -0.064 -0.022 -0.014 -0.003 0.41 New River Outlet 5/7/12 -0.008 -0.041 -0.033 -0.012 -0.007 -0.003 DNQ, 0.033 -0.064 -0.022 -0.014 -0.003 0.378 New River Outlet 10/16/12 -0.008 -0.041 -0.033 -0.012 -0.007 -0.003 0.051 -0.064 -0.022 0.143 -0.003 -0.042
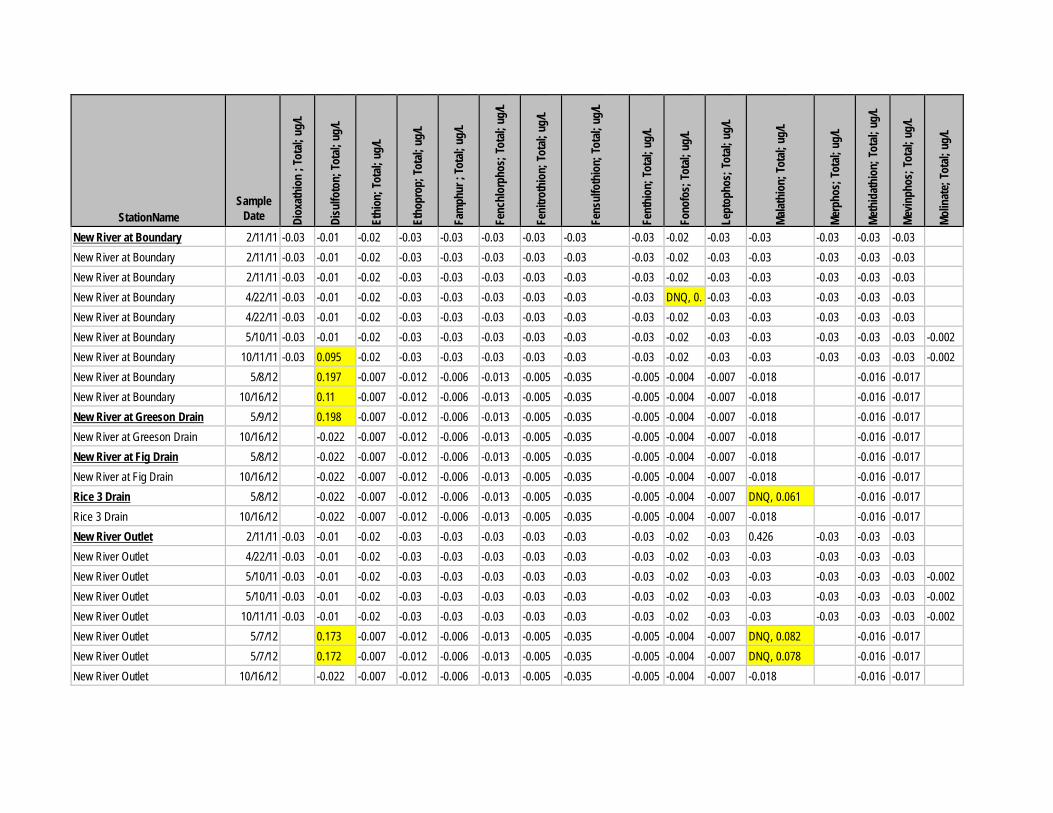
StationName
Sample Date
Diox
athi
on ;
Tota
l; ug
/L
Disu
lfoto
n; T
otal;
ug/
L
Ethi
on; T
otal;
ug/
L
Etho
prop
; Tot
al; u
g/L
Fam
phur
; To
tal;
ug/L
Fenc
hlor
phos
; Tot
al; u
g/L
Feni
troth
ion;
Tot
al; u
g/L
Fens
ulfo
thio
n; T
otal;
ug/
L
Fent
hion
; Tot
al; u
g/L
Fono
fos;
Tota
l; ug
/L
Lept
opho
s; To
tal;
ug/L
Malat
hion
; Tot
al; u
g/L
Merp
hos;
Tota
l; ug
/L
Meth
idat
hion
; Tot
al; u
g/L
Mevin
phos
; Tot
al; u
g/L
Molin
ate;
Tota
l; ug
/L
New River at Boundary 2/11/11 -0.03 -0.01 -0.02 -0.03 -0.03 -0.03 -0.03 -0.03 -0.03 -0.02 -0.03 -0.03 -0.03 -0.03 -0.03 New River at Boundary 2/11/11 -0.03 -0.01 -0.02 -0.03 -0.03 -0.03 -0.03 -0.03 -0.03 -0.02 -0.03 -0.03 -0.03 -0.03 -0.03 New River at Boundary 2/11/11 -0.03 -0.01 -0.02 -0.03 -0.03 -0.03 -0.03 -0.03 -0.03 -0.02 -0.03 -0.03 -0.03 -0.03 -0.03 New River at Boundary 4/22/11 -0.03 -0.01 -0.02 -0.03 -0.03 -0.03 -0.03 -0.03 -0.03 DNQ, 0. -0.03 -0.03 -0.03 -0.03 -0.03 New River at Boundary 4/22/11 -0.03 -0.01 -0.02 -0.03 -0.03 -0.03 -0.03 -0.03 -0.03 -0.02 -0.03 -0.03 -0.03 -0.03 -0.03 New River at Boundary 5/10/11 -0.03 -0.01 -0.02 -0.03 -0.03 -0.03 -0.03 -0.03 -0.03 -0.02 -0.03 -0.03 -0.03 -0.03 -0.03 -0.002 New River at Boundary 10/11/11 -0.03 0.095 -0.02 -0.03 -0.03 -0.03 -0.03 -0.03 -0.03 -0.02 -0.03 -0.03 -0.03 -0.03 -0.03 -0.002 New River at Boundary 5/8/12 0.197 -0.007 -0.012 -0.006 -0.013 -0.005 -0.035 -0.005 -0.004 -0.007 -0.018 -0.016 -0.017 New River at Boundary 10/16/12 0.11 -0.007 -0.012 -0.006 -0.013 -0.005 -0.035 -0.005 -0.004 -0.007 -0.018 -0.016 -0.017 New River at Greeson Drain 5/9/12 0.198 -0.007 -0.012 -0.006 -0.013 -0.005 -0.035 -0.005 -0.004 -0.007 -0.018 -0.016 -0.017 New River at Greeson Drain 10/16/12 -0.022 -0.007 -0.012 -0.006 -0.013 -0.005 -0.035 -0.005 -0.004 -0.007 -0.018 -0.016 -0.017 New River at Fig Drain 5/8/12 -0.022 -0.007 -0.012 -0.006 -0.013 -0.005 -0.035 -0.005 -0.004 -0.007 -0.018 -0.016 -0.017 New River at Fig Drain 10/16/12 -0.022 -0.007 -0.012 -0.006 -0.013 -0.005 -0.035 -0.005 -0.004 -0.007 -0.018 -0.016 -0.017 Rice 3 Drain 5/8/12 -0.022 -0.007 -0.012 -0.006 -0.013 -0.005 -0.035 -0.005 -0.004 -0.007 DNQ, 0.061 -0.016 -0.017 Rice 3 Drain 10/16/12 -0.022 -0.007 -0.012 -0.006 -0.013 -0.005 -0.035 -0.005 -0.004 -0.007 -0.018 -0.016 -0.017 New River Outlet 2/11/11 -0.03 -0.01 -0.02 -0.03 -0.03 -0.03 -0.03 -0.03 -0.03 -0.02 -0.03 0.426 -0.03 -0.03 -0.03 New River Outlet 4/22/11 -0.03 -0.01 -0.02 -0.03 -0.03 -0.03 -0.03 -0.03 -0.03 -0.02 -0.03 -0.03 -0.03 -0.03 -0.03 New River Outlet 5/10/11 -0.03 -0.01 -0.02 -0.03 -0.03 -0.03 -0.03 -0.03 -0.03 -0.02 -0.03 -0.03 -0.03 -0.03 -0.03 -0.002 New River Outlet 5/10/11 -0.03 -0.01 -0.02 -0.03 -0.03 -0.03 -0.03 -0.03 -0.03 -0.02 -0.03 -0.03 -0.03 -0.03 -0.03 -0.002 New River Outlet 10/11/11 -0.03 -0.01 -0.02 -0.03 -0.03 -0.03 -0.03 -0.03 -0.03 -0.02 -0.03 -0.03 -0.03 -0.03 -0.03 -0.002 New River Outlet 5/7/12 0.173 -0.007 -0.012 -0.006 -0.013 -0.005 -0.035 -0.005 -0.004 -0.007 DNQ, 0.082 -0.016 -0.017 New River Outlet 5/7/12 0.172 -0.007 -0.012 -0.006 -0.013 -0.005 -0.035 -0.005 -0.004 -0.007 DNQ, 0.078 -0.016 -0.017 New River Outlet 10/16/12 -0.022 -0.007 -0.012 -0.006 -0.013 -0.005 -0.035 -0.005 -0.004 -0.007 -0.018 -0.016 -0.017
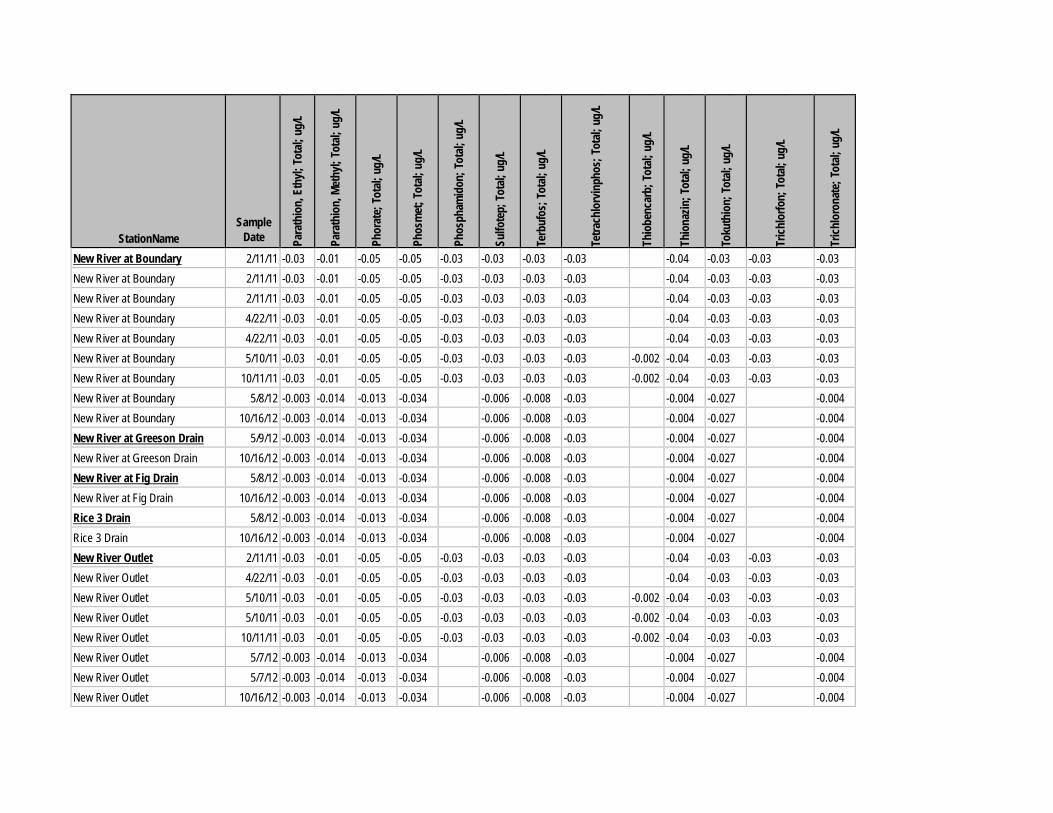
StationName
Sample Date
Para
thio
n, E
thyl;
Tota
l; ug
/L
Para
thio
n, M
ethy
l; To
tal;
ug/L
Phor
ate;
Tota
l; ug
/L
Phos
met
; Tot
al; u
g/L
Phos
pham
idon
; Tot
al; u
g/L
Sulfo
tep;
Tota
l; ug
/L
Terb
ufos
; Tot
al; u
g/L
Tetra
chlo
rvin
phos
; Tot
al; u
g/L
Thio
benc
arb;
Tota
l; ug
/L
Thio
nazin
; Tot
al; u
g/L
Toku
thio
n; T
otal;
ug/
L
Trich
lorfo
n; To
tal;
ug/L
Trich
loro
nate
; Tot
al; u
g/L
New River at Boundary 2/11/11 -0.03 -0.01 -0.05 -0.05 -0.03 -0.03 -0.03 -0.03 -0.04 -0.03 -0.03 -0.03 New River at Boundary 2/11/11 -0.03 -0.01 -0.05 -0.05 -0.03 -0.03 -0.03 -0.03 -0.04 -0.03 -0.03 -0.03 New River at Boundary 2/11/11 -0.03 -0.01 -0.05 -0.05 -0.03 -0.03 -0.03 -0.03 -0.04 -0.03 -0.03 -0.03 New River at Boundary 4/22/11 -0.03 -0.01 -0.05 -0.05 -0.03 -0.03 -0.03 -0.03 -0.04 -0.03 -0.03 -0.03 New River at Boundary 4/22/11 -0.03 -0.01 -0.05 -0.05 -0.03 -0.03 -0.03 -0.03 -0.04 -0.03 -0.03 -0.03 New River at Boundary 5/10/11 -0.03 -0.01 -0.05 -0.05 -0.03 -0.03 -0.03 -0.03 -0.002 -0.04 -0.03 -0.03 -0.03 New River at Boundary 10/11/11 -0.03 -0.01 -0.05 -0.05 -0.03 -0.03 -0.03 -0.03 -0.002 -0.04 -0.03 -0.03 -0.03 New River at Boundary 5/8/12 -0.003 -0.014 -0.013 -0.034 -0.006 -0.008 -0.03 -0.004 -0.027 -0.004 New River at Boundary 10/16/12 -0.003 -0.014 -0.013 -0.034 -0.006 -0.008 -0.03 -0.004 -0.027 -0.004 New River at Greeson Drain 5/9/12 -0.003 -0.014 -0.013 -0.034 -0.006 -0.008 -0.03 -0.004 -0.027 -0.004 New River at Greeson Drain 10/16/12 -0.003 -0.014 -0.013 -0.034 -0.006 -0.008 -0.03 -0.004 -0.027 -0.004 New River at Fig Drain 5/8/12 -0.003 -0.014 -0.013 -0.034 -0.006 -0.008 -0.03 -0.004 -0.027 -0.004 New River at Fig Drain 10/16/12 -0.003 -0.014 -0.013 -0.034 -0.006 -0.008 -0.03 -0.004 -0.027 -0.004 Rice 3 Drain 5/8/12 -0.003 -0.014 -0.013 -0.034 -0.006 -0.008 -0.03 -0.004 -0.027 -0.004 Rice 3 Drain 10/16/12 -0.003 -0.014 -0.013 -0.034 -0.006 -0.008 -0.03 -0.004 -0.027 -0.004 New River Outlet 2/11/11 -0.03 -0.01 -0.05 -0.05 -0.03 -0.03 -0.03 -0.03 -0.04 -0.03 -0.03 -0.03 New River Outlet 4/22/11 -0.03 -0.01 -0.05 -0.05 -0.03 -0.03 -0.03 -0.03 -0.04 -0.03 -0.03 -0.03 New River Outlet 5/10/11 -0.03 -0.01 -0.05 -0.05 -0.03 -0.03 -0.03 -0.03 -0.002 -0.04 -0.03 -0.03 -0.03 New River Outlet 5/10/11 -0.03 -0.01 -0.05 -0.05 -0.03 -0.03 -0.03 -0.03 -0.002 -0.04 -0.03 -0.03 -0.03 New River Outlet 10/11/11 -0.03 -0.01 -0.05 -0.05 -0.03 -0.03 -0.03 -0.03 -0.002 -0.04 -0.03 -0.03 -0.03 New River Outlet 5/7/12 -0.003 -0.014 -0.013 -0.034 -0.006 -0.008 -0.03 -0.004 -0.027 -0.004 New River Outlet 5/7/12 -0.003 -0.014 -0.013 -0.034 -0.006 -0.008 -0.03 -0.004 -0.027 -0.004 New River Outlet 10/16/12 -0.003 -0.014 -0.013 -0.034 -0.006 -0.008 -0.03 -0.004 -0.027 -0.004
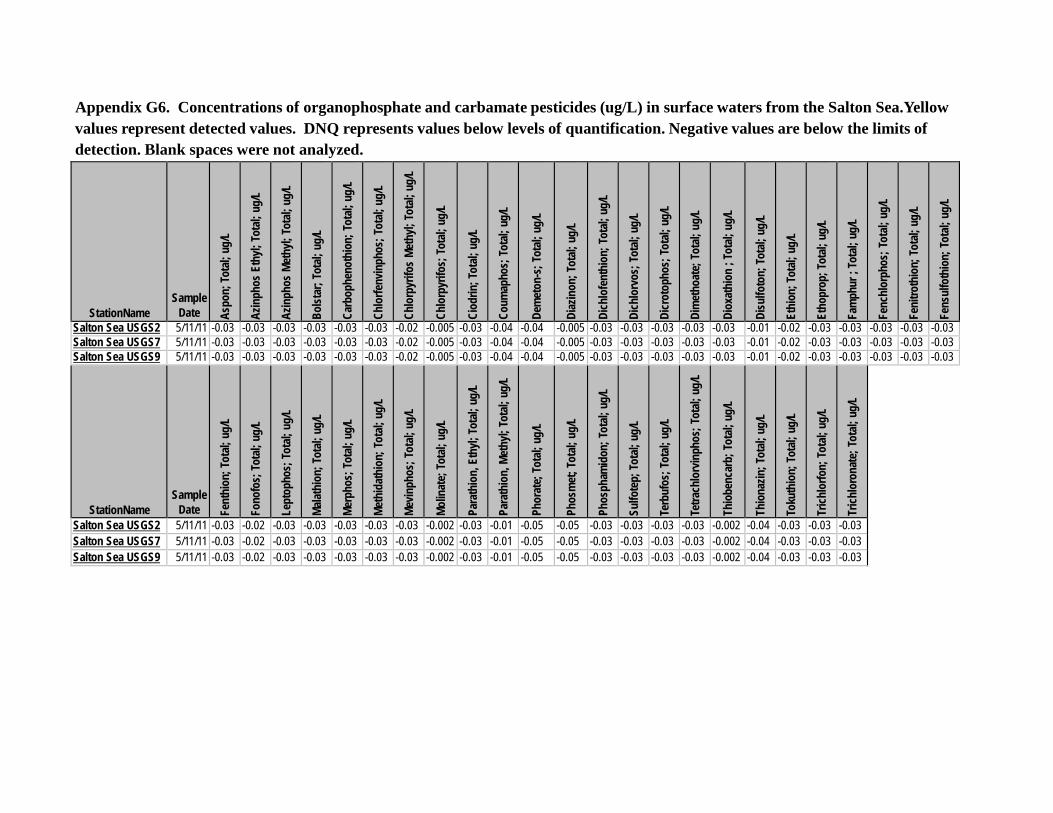
Appendix G6. Concentrations of organophosphate and carbamate pesticides (ug/L) in surface waters from the Salton Sea.Yellow values represent detected values. DNQ represents values below levels of quantification. Negative values are below the limits of detection. Blank spaces were not analyzed.
StationName
Sample
Date Aspo
n; To
tal;
ug/L
Az
inph
os E
thyl;
Tota
l; ug
/L
Azin
phos
Met
hyl;
Tota
l; ug
/L
Bolst
ar; T
otal;
ug/
L Ca
rbop
heno
thio
n; T
otal;
ug/
L Ch
lorfe
nvin
phos
; Tot
al; u
g/L
Chlo
rpyr
ifos
Meth
yl; To
tal;
ug/L
Ch
lorp
yrifo
s; T
otal;
ug/
L Ci
odrin
; Tot
al; u
g/L
Coum
apho
s; T
otal;
ug/
L De
met
on-s
; Tot
al; u
g/L
Diaz
inon
; Tot
al; u
g/L
Dich
lofe
nthi
on; T
otal;
ug/
L Di
chlo
rvos
; Tot
al; u
g/L
Dicr
otop
hos;
Tota
l; ug
/L
Dim
etho
ate;
Tot
al; u
g/L
Diox
athi
on ;
Tota
l; ug
/L
Disu
lfoto
n; T
otal;
ug/
L Et
hion
; Tot
al; u
g/L
Etho
prop
; Tot
al; u
g/L
Fam
phur
; To
tal;
ug/L
Fe
nchl
orph
os; T
otal;
ug/
L Fe
nitro
thio
n; T
otal;
ug/
L Fe
nsul
foth
ion;
Tot
al; u
g/L
Salton Sea USGS2 5/11/11 -0.03 -0.03 -0.03 -0.03 -0.03 -0.03 -0.02 -0.005 -0.03 -0.04 -0.04 -0.005 -0.03 -0.03 -0.03 -0.03 -0.03 -0.01 -0.02 -0.03 -0.03 -0.03 -0.03 -0.03 Salton Sea USGS7 5/11/11 -0.03 -0.03 -0.03 -0.03 -0.03 -0.03 -0.02 -0.005 -0.03 -0.04 -0.04 -0.005 -0.03 -0.03 -0.03 -0.03 -0.03 -0.01 -0.02 -0.03 -0.03 -0.03 -0.03 -0.03 Salton Sea USGS9 5/11/11 -0.03 -0.03 -0.03 -0.03 -0.03 -0.03 -0.02 -0.005 -0.03 -0.04 -0.04 -0.005 -0.03 -0.03 -0.03 -0.03 -0.03 -0.01 -0.02 -0.03 -0.03 -0.03 -0.03 -0.03
StationName
Sample
Date Fent
hion
; Tot
al; u
g/L
Fono
fos;
Tota
l; ug
/L
Lept
opho
s; To
tal;
ug/L
Ma
lathi
on; T
otal;
ug/
L Me
rpho
s; To
tal;
ug/L
Me
thid
athi
on; T
otal;
ug/
L Me
vinph
os; T
otal;
ug/
L Mo
linat
e; To
tal;
ug/L
Pa
rath
ion,
Eth
yl; To
tal;
ug/L
Pa
rath
ion,
Met
hyl;
Tota
l; ug
/L
Phor
ate;
Tota
l; ug
/L
Phos
met
; Tot
al; u
g/L
Phos
pham
idon
; Tot
al; u
g/L
Sulfo
tep;
Tota
l; ug
/L
Terb
ufos
; Tot
al; u
g/L
Tetra
chlo
rvin
phos
; Tot
al; u
g/L
Thio
benc
arb;
Tota
l; ug
/L
Thio
nazin
; Tot
al; u
g/L
Toku
thio
n; T
otal;
ug/
L Tr
ichlo
rfon;
Tota
l; ug
/L
Trich
loro
nate
; Tot
al; u
g/L
Salton Sea USGS2 5/11/11 -0.03 -0.02 -0.03 -0.03 -0.03 -0.03 -0.03 -0.002 -0.03 -0.01 -0.05 -0.05 -0.03 -0.03 -0.03 -0.03 -0.002 -0.04 -0.03 -0.03 -0.03 Salton Sea USGS7 5/11/11 -0.03 -0.02 -0.03 -0.03 -0.03 -0.03 -0.03 -0.002 -0.03 -0.01 -0.05 -0.05 -0.03 -0.03 -0.03 -0.03 -0.002 -0.04 -0.03 -0.03 -0.03 Salton Sea USGS9 5/11/11 -0.03 -0.02 -0.03 -0.03 -0.03 -0.03 -0.03 -0.002 -0.03 -0.01 -0.05 -0.05 -0.03 -0.03 -0.03 -0.03 -0.002 -0.04 -0.03 -0.03 -0.03
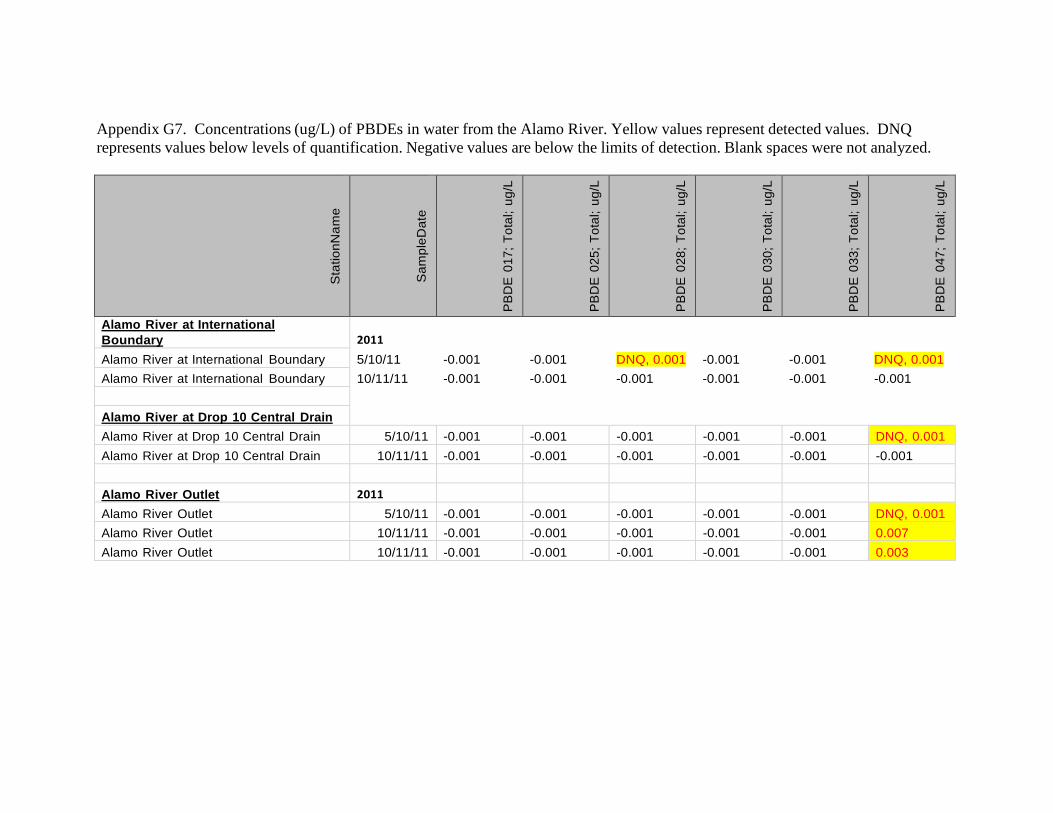
Appendix G7. Concentrations (ug/L) of PBDEs in water from the Alamo River. Yellow values represent detected values. DNQ represents values below levels of quantification. Negative values are below the limits of detection. Blank spaces were not analyzed.
S
tatio
nNam
e
Sam
pleD
ate
PB
DE
017
; Tot
al; u
g/L
PB
DE
025
; Tot
al; u
g/L
PB
DE
028
; Tot
al; u
g/L
PB
DE
030
; Tot
al; u
g/L
PB
DE
033
; Tot
al; u
g/L
PB
DE
047
; Tot
al; u
g/L
Alamo River at International Boundary
2011 5/10/11 -0.001 -0.001 DNQ, 0.001 -0.001 -0.001 DNQ, 0.001 10/11/11 -0.001 -0.001 -0.001 -0.001 -0.001 -0.001
Alamo River at International Boundary Alamo River at International Boundary
Alamo River at Drop 10 Central Drain Alamo River at Drop 10 Central Drain 5/10/11 -0.001 -0.001 -0.001 -0.001 -0.001 DNQ, 0.001 Alamo River at Drop 10 Central Drain 10/11/11 -0.001 -0.001 -0.001 -0.001 -0.001 -0.001
Alamo River Outlet 2011 Alamo River Outlet 5/10/11 -0.001 -0.001 -0.001 -0.001 -0.001 DNQ, 0.001 Alamo River Outlet 10/11/11 -0.001 -0.001 -0.001 -0.001 -0.001 0.007 Alamo River Outlet 10/11/11 -0.001 -0.001 -0.001 -0.001 -0.001 0.003
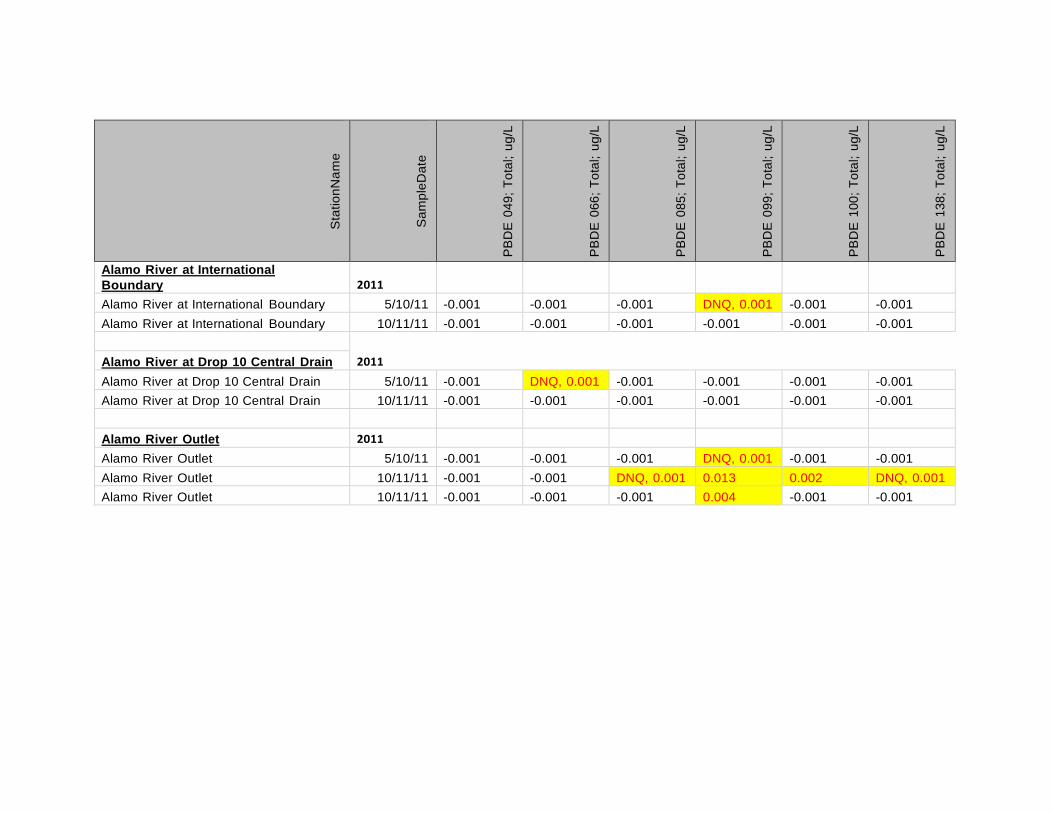
S
tatio
nNam
e
Sam
pleD
ate
PB
DE
049
; Tot
al; u
g/L
PB
DE
066
; Tot
al; u
g/L
PB
DE
085
; Tot
al; u
g/L
PB
DE
099
; Tot
al; u
g/L
PB
DE
100
; Tot
al; u
g/L
PB
DE
138
; Tot
al; u
g/L
Alamo River at International Boundary
2011
Alamo River at International Boundary 5/10/11 -0.001 -0.001 -0.001 DNQ, 0.001 -0.001 -0.001 Alamo River at International Boundary 10/11/11 -0.001 -0.001 -0.001 -0.001 -0.001 -0.001
2011 Alamo River at Drop 10 Central Drain Alamo River at Drop 10 Central Drain 5/10/11 -0.001 DNQ, 0.001 -0.001 -0.001 -0.001 -0.001 Alamo River at Drop 10 Central Drain 10/11/11 -0.001 -0.001 -0.001 -0.001 -0.001 -0.001
Alamo River Outlet 2011 Alamo River Outlet 5/10/11 -0.001 -0.001 -0.001 DNQ, 0.001 -0.001 -0.001 Alamo River Outlet 10/11/11 -0.001 -0.001 DNQ, 0.001 0.013 0.002 DNQ, 0.001 Alamo River Outlet 10/11/11 -0.001 -0.001 -0.001 0.004 -0.001 -0.001
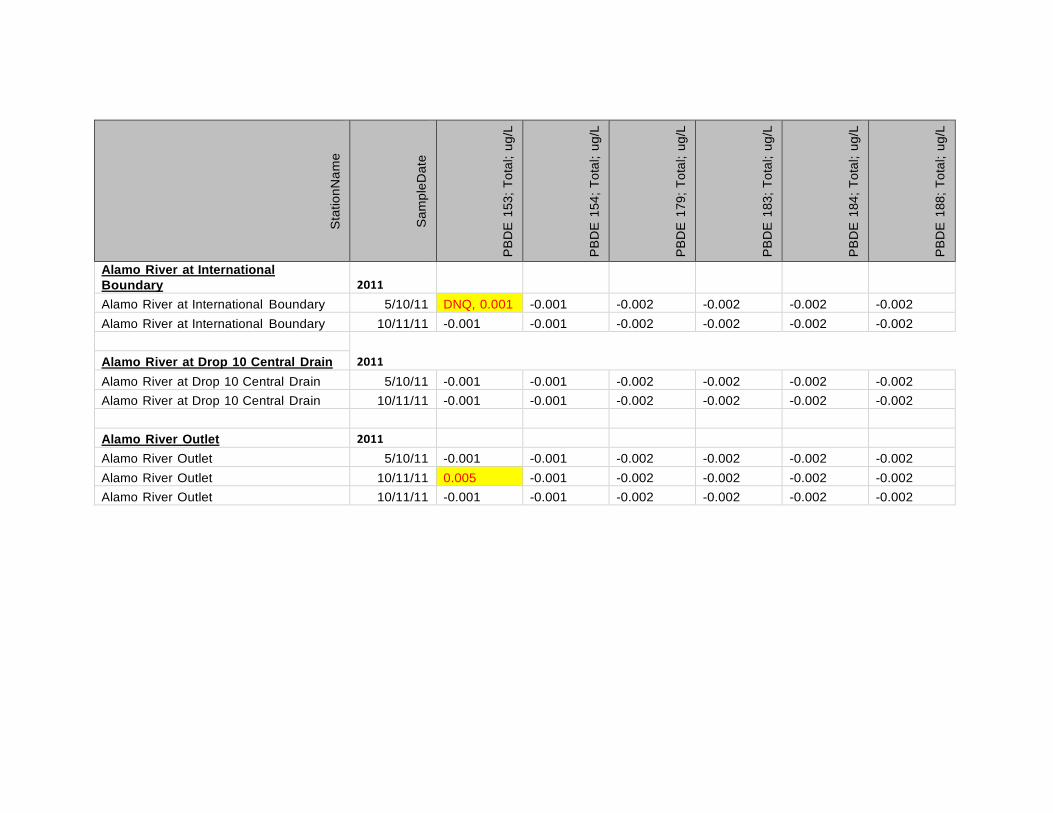
S
tatio
nNam
e
Sam
pleD
ate
PB
DE
153
; Tot
al; u
g/L
PB
DE
154
; Tot
al; u
g/L
PB
DE
179
; Tot
al; u
g/L
PB
DE
183
; Tot
al; u
g/L
PB
DE
184
; Tot
al; u
g/L
PB
DE
188
; Tot
al; u
g/L
Alamo River at International Boundary
2011
Alamo River at International Boundary 5/10/11 DNQ, 0.001 -0.001 -0.002 -0.002 -0.002 -0.002 Alamo River at International Boundary 10/11/11 -0.001 -0.001 -0.002 -0.002 -0.002 -0.002
2011 Alamo River at Drop 10 Central Drain Alamo River at Drop 10 Central Drain 5/10/11 -0.001 -0.001 -0.002 -0.002 -0.002 -0.002 Alamo River at Drop 10 Central Drain 10/11/11 -0.001 -0.001 -0.002 -0.002 -0.002 -0.002
Alamo River Outlet 2011 Alamo River Outlet 5/10/11 -0.001 -0.001 -0.002 -0.002 -0.002 -0.002 Alamo River Outlet 10/11/11 0.005 -0.001 -0.002 -0.002 -0.002 -0.002 Alamo River Outlet 10/11/11 -0.001 -0.001 -0.002 -0.002 -0.002 -0.002
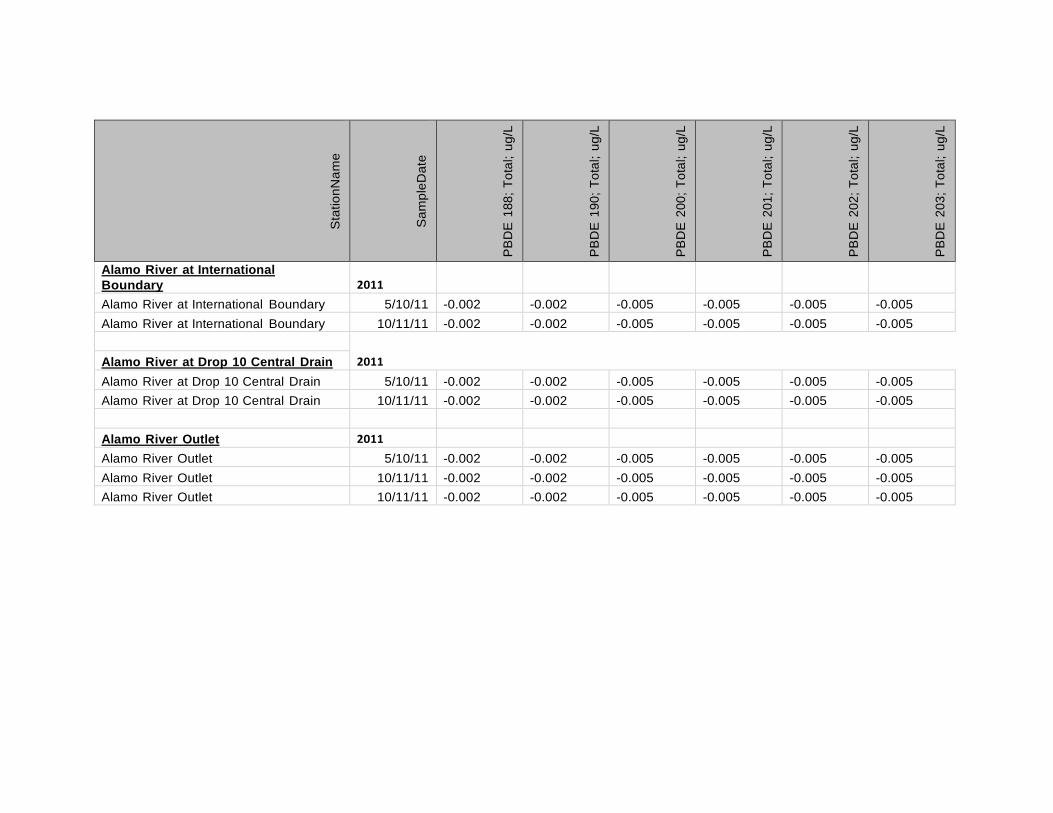
S
tatio
nNam
e
Sam
pleD
ate
PB
DE
188
; Tot
al; u
g/L
PB
DE
190
; Tot
al; u
g/L
PB
DE
200
; Tot
al; u
g/L
PB
DE
201
; Tot
al; u
g/L
PB
DE
202
; Tot
al; u
g/L
PB
DE
203
; Tot
al; u
g/L
Alamo River at International Boundary
2011
Alamo River at International Boundary 5/10/11 -0.002 -0.002 -0.005 -0.005 -0.005 -0.005 Alamo River at International Boundary 10/11/11 -0.002 -0.002 -0.005 -0.005 -0.005 -0.005
2011 Alamo River at Drop 10 Central Drain Alamo River at Drop 10 Central Drain 5/10/11 -0.002 -0.002 -0.005 -0.005 -0.005 -0.005 Alamo River at Drop 10 Central Drain 10/11/11 -0.002 -0.002 -0.005 -0.005 -0.005 -0.005
Alamo River Outlet 2011 Alamo River Outlet 5/10/11 -0.002 -0.002 -0.005 -0.005 -0.005 -0.005 Alamo River Outlet 10/11/11 -0.002 -0.002 -0.005 -0.005 -0.005 -0.005 Alamo River Outlet 10/11/11 -0.002 -0.002 -0.005 -0.005 -0.005 -0.005
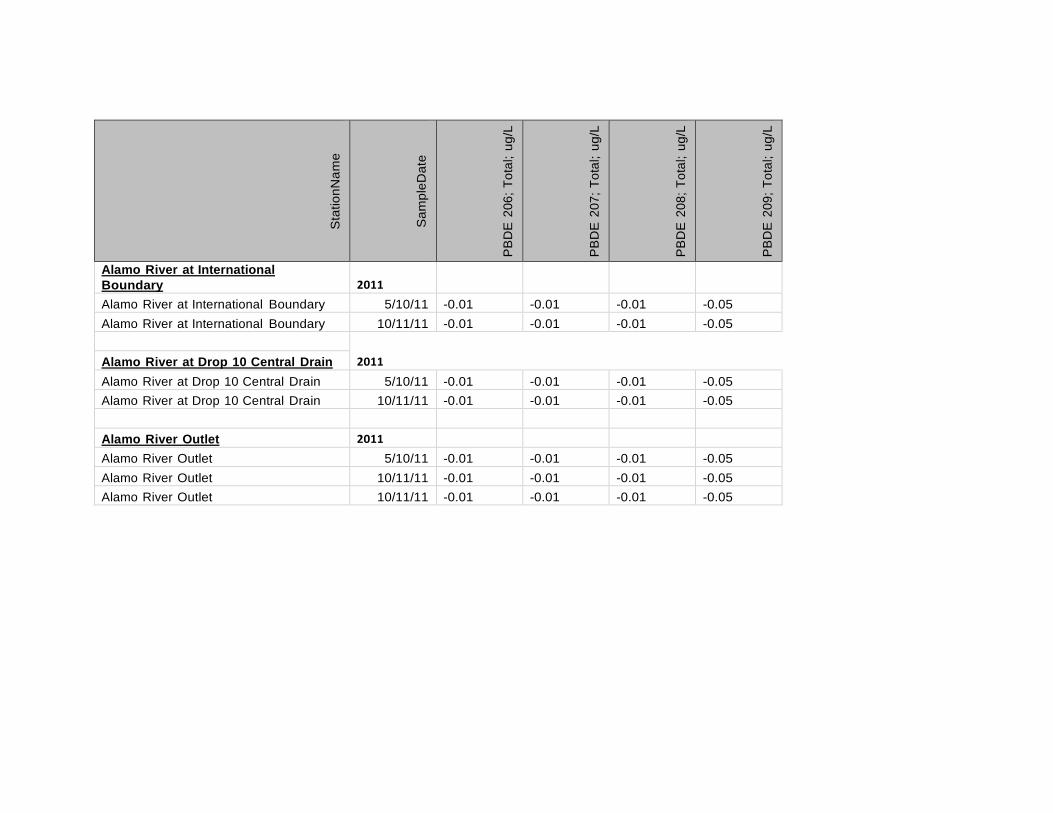
S
tatio
nNam
e
Sam
pleD
ate
PB
DE
206
; Tot
al; u
g/L
PB
DE
207
; Tot
al; u
g/L
PB
DE
208
; Tot
al; u
g/L
PB
DE
209
; Tot
al; u
g/L
Alamo River at International Boundary
2011
Alamo River at International Boundary 5/10/11 -0.01 -0.01 -0.01 -0.05 Alamo River at International Boundary 10/11/11 -0.01 -0.01 -0.01 -0.05
2011 Alamo River at Drop 10 Central Drain Alamo River at Drop 10 Central Drain 5/10/11 -0.01 -0.01 -0.01 -0.05 Alamo River at Drop 10 Central Drain 10/11/11 -0.01 -0.01 -0.01 -0.05
Alamo River Outlet 2011 Alamo River Outlet 5/10/11 -0.01 -0.01 -0.01 -0.05 Alamo River Outlet 10/11/11 -0.01 -0.01 -0.01 -0.05 Alamo River Outlet 10/11/11 -0.01 -0.01 -0.01 -0.05
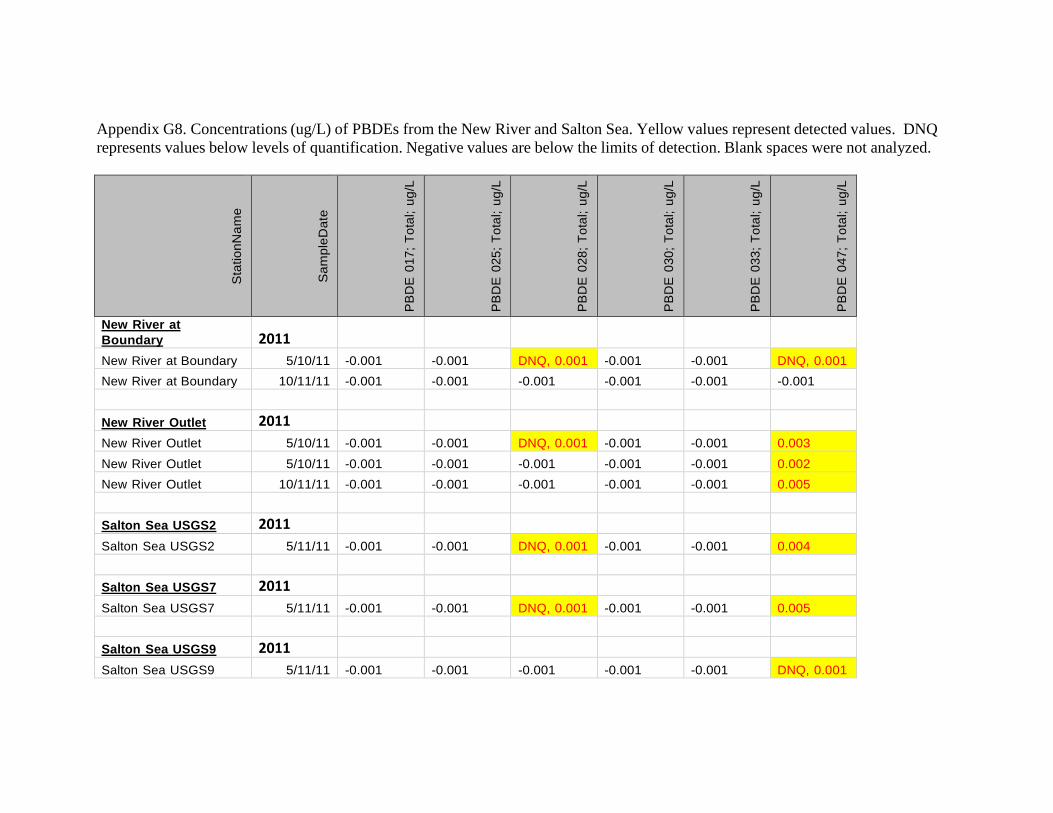
Appendix G8. Concentrations (ug/L) of PBDEs from the New River and Salton Sea. Yellow values represent detected values. DNQ represents values below levels of quantification. Negative values are below the limits of detection. Blank spaces were not analyzed.
S
tatio
nNam
e
Sam
pleD
ate
PB
DE
017
; Tot
al; u
g/L
PB
DE
025
; Tot
al; u
g/L
PB
DE
028
; Tot
al; u
g/L
PB
DE
030
; Tot
al; u
g/L
PB
DE
033
; Tot
al; u
g/L
PB
DE
047
; Tot
al; u
g/L
New River at Boundary
2011
New River at Boundary 5/10/11 -0.001 -0.001 DNQ, 0.001 -0.001 -0.001 DNQ, 0.001 New River at Boundary 10/11/11 -0.001 -0.001 -0.001 -0.001 -0.001 -0.001
New River Outlet 2011
New River Outlet 5/10/11 -0.001 -0.001 DNQ, 0.001 -0.001 -0.001 0.003 New River Outlet 5/10/11 -0.001 -0.001 -0.001 -0.001 -0.001 0.002 New River Outlet 10/11/11 -0.001 -0.001 -0.001 -0.001 -0.001 0.005
Salton Sea USGS2 2011
Salton Sea USGS2 5/11/11 -0.001 -0.001 DNQ, 0.001 -0.001 -0.001 0.004 Salton Sea USGS7 2011
Salton Sea USGS7 5/11/11 -0.001 -0.001 DNQ, 0.001 -0.001 -0.001 0.005 Salton Sea USGS9 2011
Salton Sea USGS9 5/11/11 -0.001 -0.001 -0.001 -0.001 -0.001 DNQ, 0.001
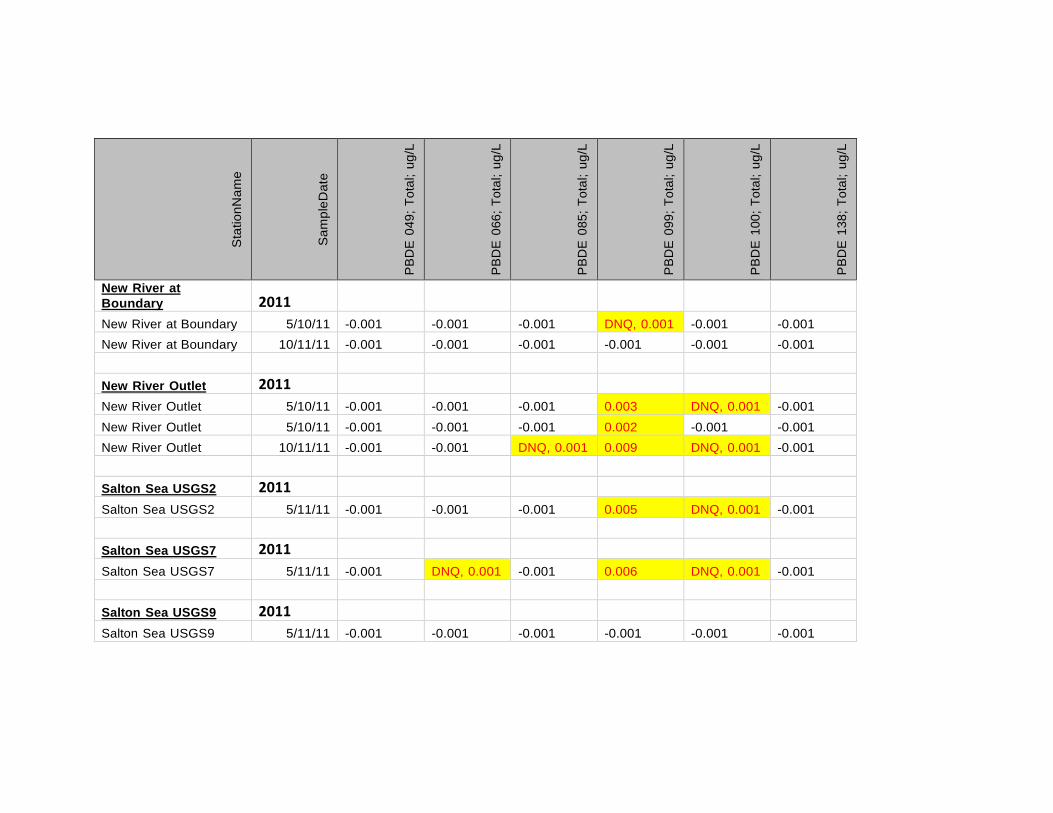
S
tatio
nNam
e
Sam
pleD
ate
PB
DE
049
; Tot
al; u
g/L
PB
DE
066
; Tot
al; u
g/L
PB
DE
085
; Tot
al; u
g/L
PB
DE
099
; Tot
al; u
g/L
PB
DE
100
; Tot
al; u
g/L
PB
DE
138
; Tot
al; u
g/L
New River at Boundary
2011
New River at Boundary 5/10/11 -0.001 -0.001 -0.001 DNQ, 0.001 -0.001 -0.001 New River at Boundary 10/11/11 -0.001 -0.001 -0.001 -0.001 -0.001 -0.001
New River Outlet 2011
New River Outlet 5/10/11 -0.001 -0.001 -0.001 0.003 DNQ, 0.001 -0.001 New River Outlet 5/10/11 -0.001 -0.001 -0.001 0.002 -0.001 -0.001 New River Outlet 10/11/11 -0.001 -0.001 DNQ, 0.001 0.009 DNQ, 0.001 -0.001
Salton Sea USGS2 2011
Salton Sea USGS2 5/11/11 -0.001 -0.001 -0.001 0.005 DNQ, 0.001 -0.001 Salton Sea USGS7 2011
Salton Sea USGS7 5/11/11 -0.001 DNQ, 0.001 -0.001 0.006 DNQ, 0.001 -0.001 Salton Sea USGS9 2011
Salton Sea USGS9 5/11/11 -0.001 -0.001 -0.001 -0.001 -0.001 -0.001
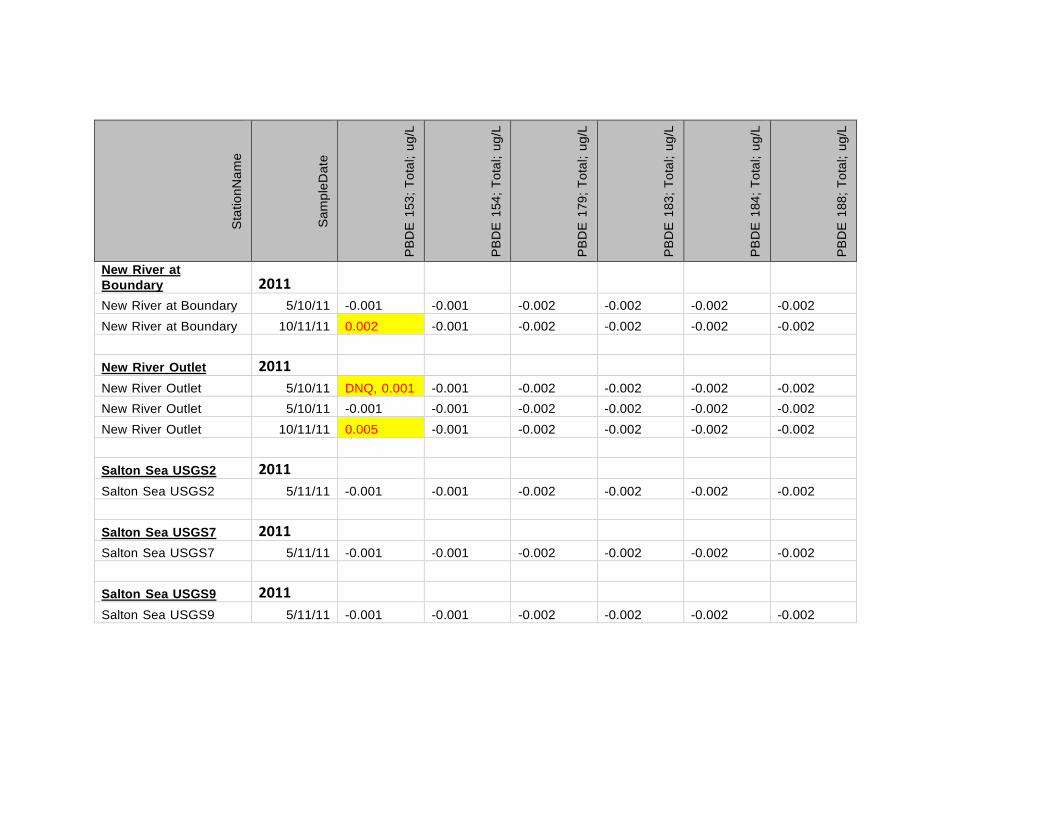
S
tatio
nNam
e
Sam
pleD
ate
PB
DE
153
; Tot
al; u
g/L
PB
DE
154
; Tot
al; u
g/L
PB
DE
179
; Tot
al; u
g/L
PB
DE
183
; Tot
al; u
g/L
PB
DE
184
; Tot
al; u
g/L
PB
DE
188
; Tot
al; u
g/L
New River at Boundary
2011
New River at Boundary 5/10/11 -0.001 -0.001 -0.002 -0.002 -0.002 -0.002 New River at Boundary 10/11/11 0.002 -0.001 -0.002 -0.002 -0.002 -0.002
New River Outlet 2011
New River Outlet 5/10/11 DNQ, 0.001 -0.001 -0.002 -0.002 -0.002 -0.002 New River Outlet 5/10/11 -0.001 -0.001 -0.002 -0.002 -0.002 -0.002 New River Outlet 10/11/11 0.005 -0.001 -0.002 -0.002 -0.002 -0.002
Salton Sea USGS2 2011
Salton Sea USGS2 5/11/11 -0.001 -0.001 -0.002 -0.002 -0.002 -0.002
Salton Sea USGS7 2011
Salton Sea USGS7 5/11/11 -0.001 -0.001 -0.002 -0.002 -0.002 -0.002 Salton Sea USGS9 2011
Salton Sea USGS9 5/11/11 -0.001 -0.001 -0.002 -0.002 -0.002 -0.002
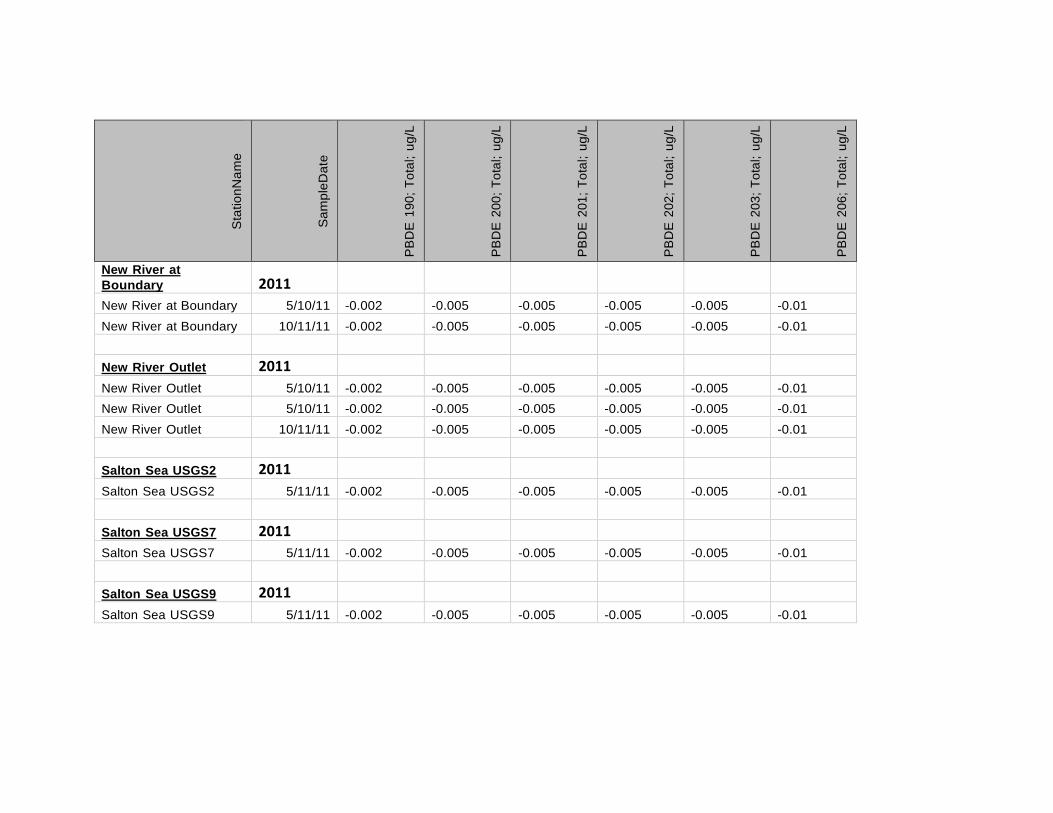
S
tatio
nNam
e
Sam
pleD
ate
PB
DE
190
; Tot
al; u
g/L
PB
DE
200
; Tot
al; u
g/L
PB
DE
201
; Tot
al; u
g/L
PB
DE
202
; Tot
al; u
g/L
PB
DE
203
; Tot
al; u
g/L
PB
DE
206
; Tot
al; u
g/L
New River at Boundary
2011
New River at Boundary 5/10/11 -0.002 -0.005 -0.005 -0.005 -0.005 -0.01 New River at Boundary 10/11/11 -0.002 -0.005 -0.005 -0.005 -0.005 -0.01
New River Outlet 2011
New River Outlet 5/10/11 -0.002 -0.005 -0.005 -0.005 -0.005 -0.01 New River Outlet 5/10/11 -0.002 -0.005 -0.005 -0.005 -0.005 -0.01 New River Outlet 10/11/11 -0.002 -0.005 -0.005 -0.005 -0.005 -0.01
Salton Sea USGS2 2011
Salton Sea USGS2 5/11/11 -0.002 -0.005 -0.005 -0.005 -0.005 -0.01
Salton Sea USGS7 2011
Salton Sea USGS7 5/11/11 -0.002 -0.005 -0.005 -0.005 -0.005 -0.01 Salton Sea USGS9 2011
Salton Sea USGS9 5/11/11 -0.002 -0.005 -0.005 -0.005 -0.005 -0.01
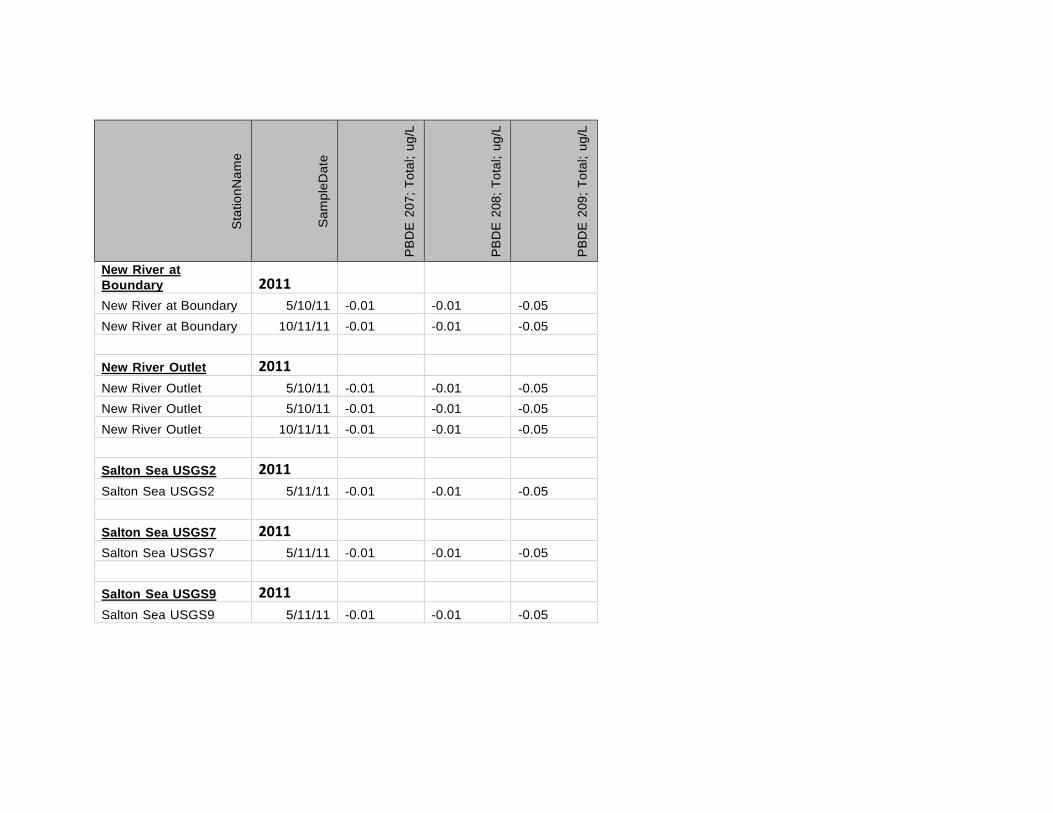
S
tatio
nNam
e
Sam
pleD
ate
PB
DE
207
; Tot
al; u
g/L
PB
DE
208
; Tot
al; u
g/L
PB
DE
209
; Tot
al; u
g/L
New River at Boundary
2011
New River at Boundary 5/10/11 -0.01 -0.01 -0.05 New River at Boundary 10/11/11 -0.01 -0.01 -0.05
New River Outlet 2011
New River Outlet 5/10/11 -0.01 -0.01 -0.05 New River Outlet 5/10/11 -0.01 -0.01 -0.05 New River Outlet 10/11/11 -0.01 -0.01 -0.05
Salton Sea USGS2 2011
Salton Sea USGS2 5/11/11 -0.01 -0.01 -0.05
Salton Sea USGS7 2011
Salton Sea USGS7 5/11/11 -0.01 -0.01 -0.05 Salton Sea USGS9 2011
Salton Sea USGS9 5/11/11 -0.01 -0.01 -0.05
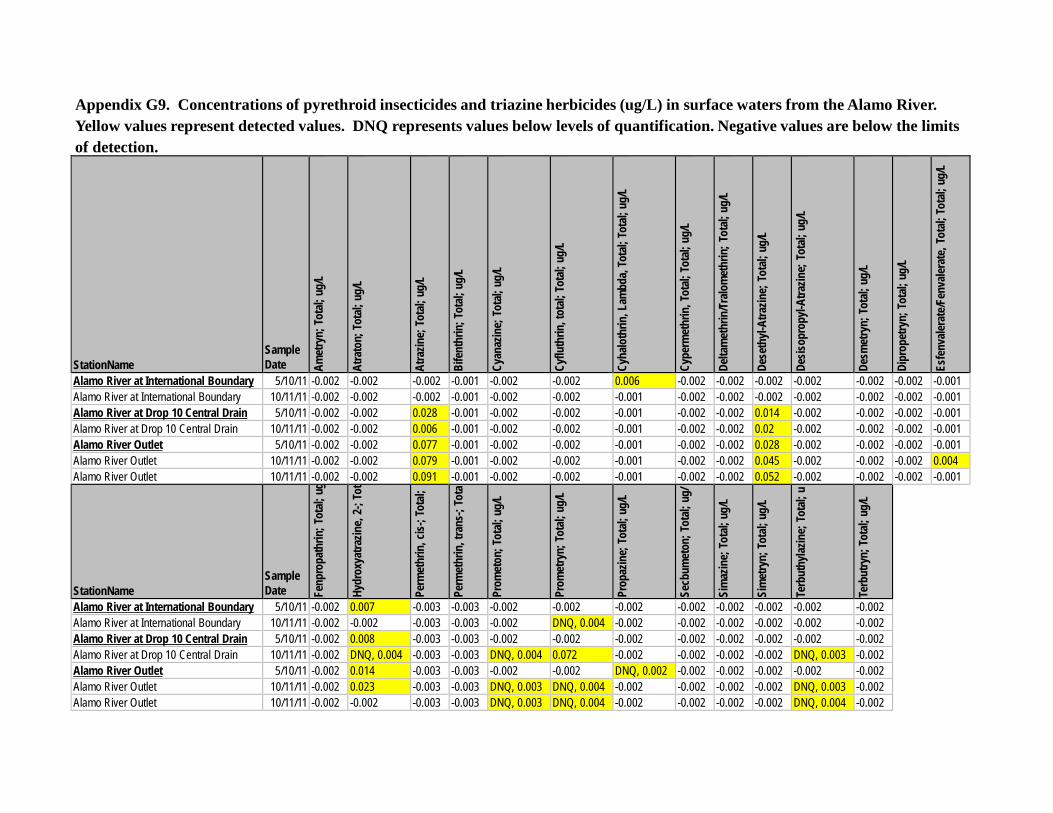
StationName
Sample Date Am
etry
n; To
tal;
ug/L
Atra
ton;
Tota
l; ug
/L
Atra
zine;
Tota
l; ug
/L
Bife
nthr
in; T
otal;
ug/
L
Cyan
azin
e; T
otal;
ug/
L
Cyflu
thrin
, tot
al; To
tal;
ug/L
Cyha
loth
rin, L
ambd
a, To
tal;
Tota
l; ug
/L
Cype
rmet
hrin
, Tot
al; To
tal;
ug/L
Delta
met
hrin
/Tralo
met
hrin
; Tot
al; u
g/L
Dese
thyl-
Atra
zine;
Tot
al; u
g/L
Desis
opro
pyl-A
trazin
e; T
otal;
ug/
L
Desm
etry
n; T
otal;
ug/
L
Dipr
opet
ryn;
Tot
al; u
g/L
Esfe
nvale
rate
/Fen
valer
ate,
Tota
l; To
tal;
ug/L
Alamo River at International Boundary 5/10/11 -0.002 -0.002 -0.002 -0.001 -0.002 -0.002 0.006 -0.002 -0.002 -0.002 -0.002 -0.002 -0.002 -0.001 Alamo River at International Boundary 10/11/11 -0.002 -0.002 -0.002 -0.001 -0.002 -0.002 -0.001 -0.002 -0.002 -0.002 -0.002 -0.002 -0.002 -0.001 Alamo River at Drop 10 Central Drain 5/10/11 -0.002 -0.002 0.028 -0.001 -0.002 -0.002 -0.001 -0.002 -0.002 0.014 -0.002 -0.002 -0.002 -0.001 Alamo River at Drop 10 Central Drain 10/11/11 -0.002 -0.002 0.006 -0.001 -0.002 -0.002 -0.001 -0.002 -0.002 0.02 -0.002 -0.002 -0.002 -0.001 Alamo River Outlet 5/10/11 -0.002 -0.002 0.077 -0.001 -0.002 -0.002 -0.001 -0.002 -0.002 0.028 -0.002 -0.002 -0.002 -0.001 Alamo River Outlet 10/11/11 -0.002 -0.002 0.079 -0.001 -0.002 -0.002 -0.001 -0.002 -0.002 0.045 -0.002 -0.002 -0.002 0.004 Alamo River Outlet 10/11/11 -0.002 -0.002 0.091 -0.001 -0.002 -0.002 -0.001 -0.002 -0.002 0.052 -0.002 -0.002 -0.002 -0.001 StationName
Sample Date Fe
npro
path
rin; T
otal;
ug
Hydr
oxya
trazin
e, 2-
; Tot
Perm
ethr
in, c
is-; T
otal;
Perm
ethr
in, t
rans
-; To
ta
Prom
eton
; Tot
al; u
g/L
Prom
etry
n; To
tal;
ug/L
Prop
azin
e; T
otal;
ug/
L
Secb
umet
on; T
otal;
ug/
Sim
azin
e; To
tal;
ug/L
Sim
etry
n; To
tal;
ug/L
Terb
uthy
lazin
e; T
otal;
u
Terb
utry
n; To
tal;
ug/L
Alamo River at International Boundary 5/10/11 -0.002 0.007 -0.003 -0.003 -0.002 -0.002 -0.002 -0.002 -0.002 -0.002 -0.002 -0.002 Alamo River at International Boundary 10/11/11 -0.002 -0.002 -0.003 -0.003 -0.002 DNQ, 0.004 -0.002 -0.002 -0.002 -0.002 -0.002 -0.002 Alamo River at Drop 10 Central Drain 5/10/11 -0.002 0.008 -0.003 -0.003 -0.002 -0.002 -0.002 -0.002 -0.002 -0.002 -0.002 -0.002 Alamo River at Drop 10 Central Drain 10/11/11 -0.002 DNQ, 0.004 -0.003 -0.003 DNQ, 0.004 0.072 -0.002 -0.002 -0.002 -0.002 DNQ, 0.003 -0.002 Alamo River Outlet 5/10/11 -0.002 0.014 -0.003 -0.003 -0.002 -0.002 DNQ, 0.002 -0.002 -0.002 -0.002 -0.002 -0.002 Alamo River Outlet 10/11/11 -0.002 0.023 -0.003 -0.003 DNQ, 0.003 DNQ, 0.004 -0.002 -0.002 -0.002 -0.002 DNQ, 0.003 -0.002 Alamo River Outlet 10/11/11 -0.002 -0.002 -0.003 -0.003 DNQ, 0.003 DNQ, 0.004 -0.002 -0.002 -0.002 -0.002 DNQ, 0.004 -0.002
Appendix G9. Concentrations of pyrethroid insecticides and triazine herbicides (ug/L) in surface waters from the Alamo River. Yellow values represent detected values. DNQ represents values below levels of quantification. Negative values are below the limits of detection.
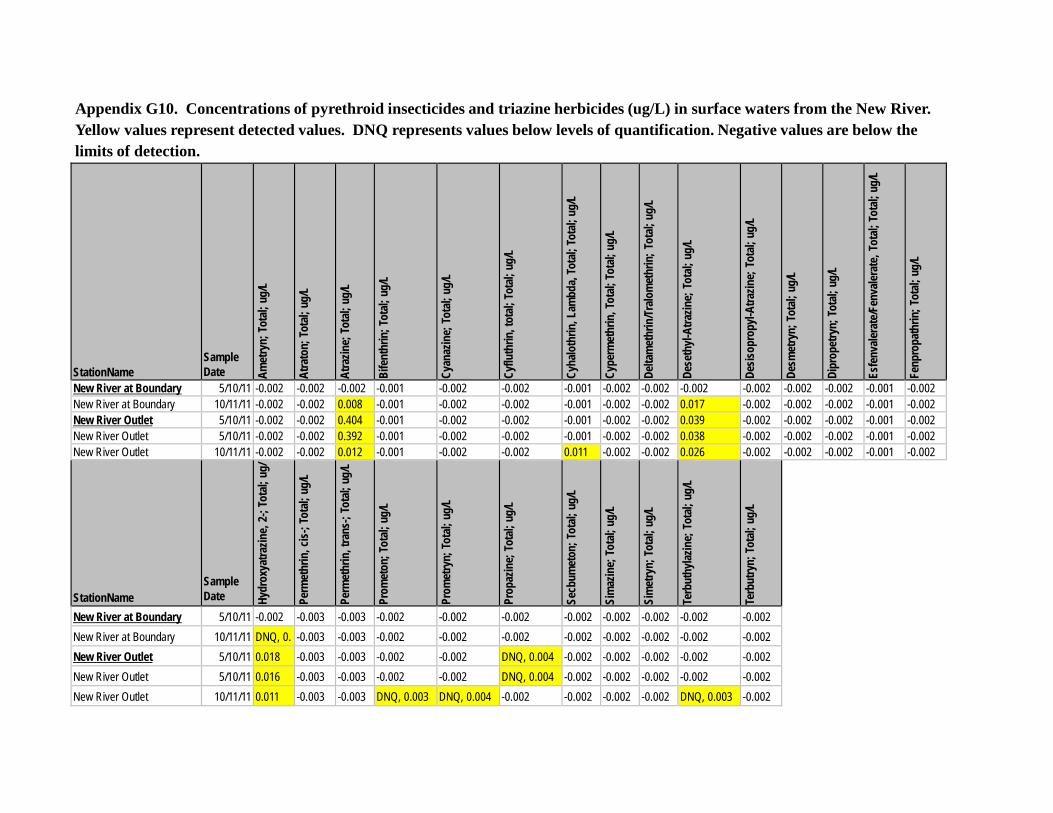
Appendix G10. Concentrations of pyrethroid insecticides and triazine herbicides (ug/L) in surface waters from the New River. Yellow values represent detected values. DNQ represents values below levels of quantification. Negative values are below the limits of detection.
StationName
Sample Date Am
etry
n; To
tal;
ug/L
Atra
ton;
Tota
l; ug
/L
Atra
zine;
Tota
l; ug
/L
Bife
nthr
in; T
otal;
ug/
L
Cyan
azin
e; T
otal;
ug/
L
Cyflu
thrin
, tot
al; To
tal;
ug/L
Cyha
loth
rin, L
ambd
a, To
tal;
Tota
l; ug
/L
Cype
rmet
hrin
, Tot
al; To
tal;
ug/L
Delta
met
hrin
/Tralo
met
hrin
; Tot
al; u
g/L
Dese
thyl-
Atra
zine;
Tot
al; u
g/L
Desis
opro
pyl-A
trazin
e; T
otal;
ug/
L
Desm
etry
n; T
otal;
ug/
L
Dipr
opet
ryn;
Tot
al; u
g/L
Esfe
nvale
rate
/Fen
valer
ate,
Tota
l; To
tal;
ug/L
Fenp
ropa
thrin
; Tot
al; u
g/L
New River at Boundary 5/10/11 -0.002 -0.002 -0.002 -0.001 -0.002 -0.002 -0.001 -0.002 -0.002 -0.002 -0.002 -0.002 -0.002 -0.001 -0.002 New River at Boundary 10/11/11 -0.002 -0.002 0.008 -0.001 -0.002 -0.002 -0.001 -0.002 -0.002 0.017 -0.002 -0.002 -0.002 -0.001 -0.002 New River Outlet 5/10/11 -0.002 -0.002 0.404 -0.001 -0.002 -0.002 -0.001 -0.002 -0.002 0.039 -0.002 -0.002 -0.002 -0.001 -0.002 New River Outlet 5/10/11 -0.002 -0.002 0.392 -0.001 -0.002 -0.002 -0.001 -0.002 -0.002 0.038 -0.002 -0.002 -0.002 -0.001 -0.002 New River Outlet 10/11/11 -0.002 -0.002 0.012 -0.001 -0.002 -0.002 0.011 -0.002 -0.002 0.026 -0.002 -0.002 -0.002 -0.001 -0.002 StationName
Sample Date Hy
drox
yatra
zine,
2-; T
otal;
ug/
Perm
ethr
in, c
is-; T
otal;
ug/
L
Perm
ethr
in, t
rans
-; To
tal;
ug/L
Prom
eton
; Tot
al; u
g/L
Prom
etry
n; To
tal;
ug/L
Prop
azin
e; T
otal;
ug/
L
Secb
umet
on; T
otal;
ug/
L
Sim
azin
e; To
tal;
ug/L
Sim
etry
n; To
tal;
ug/L
Terb
uthy
lazin
e; T
otal;
ug/
L
Terb
utry
n; To
tal;
ug/L
New River at Boundary 5/10/11 -0.002 -0.003 -0.003 -0.002 -0.002 -0.002 -0.002 -0.002 -0.002 -0.002 -0.002 New River at Boundary 10/11/11 DNQ, 0. -0.003 -0.003 -0.002 -0.002 -0.002 -0.002 -0.002 -0.002 -0.002 -0.002 New River Outlet 5/10/11 0.018 -0.003 -0.003 -0.002 -0.002 DNQ, 0.004 -0.002 -0.002 -0.002 -0.002 -0.002 New River Outlet 5/10/11 0.016 -0.003 -0.003 -0.002 -0.002 DNQ, 0.004 -0.002 -0.002 -0.002 -0.002 -0.002 New River Outlet 10/11/11 0.011 -0.003 -0.003 DNQ, 0.003 DNQ, 0.004 -0.002 -0.002 -0.002 -0.002 DNQ, 0.003 -0.002
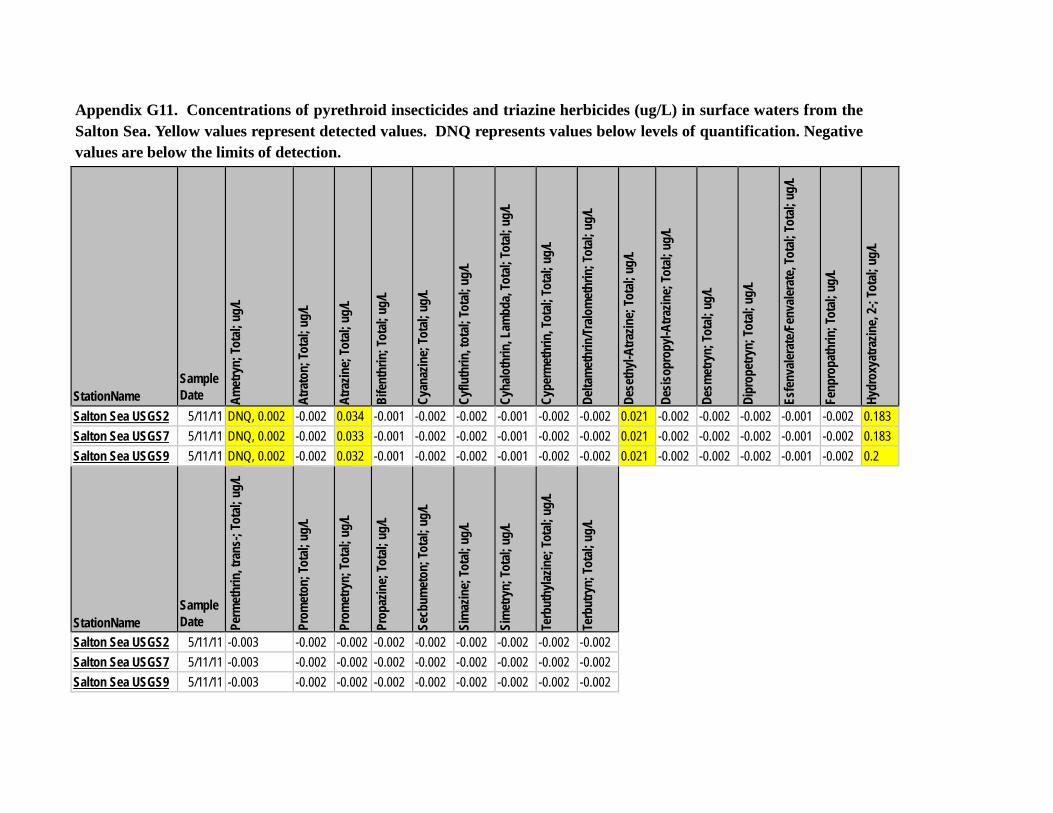
Appendix G11. Concentrations of pyrethroid insecticides and triazine herbicides (ug/L) in surface waters from the Salton Sea. Yellow values represent detected values. DNQ represents values below levels of quantification. Negative values are below the limits of detection.
StationName
Sample Date Am
etry
n; To
tal;
ug/L
Atra
ton;
Tota
l; ug
/L
Atra
zine;
Tota
l; ug
/L
Bife
nthr
in; T
otal;
ug/
L
Cyan
azin
e; To
tal;
ug/L
Cyflu
thrin
, tot
al; To
tal;
ug/L
Cyha
loth
rin, L
ambd
a, To
tal;
Tota
l; ug
/L
Cype
rmet
hrin
, Tot
al; To
tal;
ug/L
Delta
met
hrin
/Tralo
met
hrin
; Tot
al; u
g/L
Dese
thyl-
Atra
zine;
Tota
l; ug
/L
Desis
opro
pyl-A
trazin
e; To
tal;
ug/L
Desm
etry
n; To
tal;
ug/L
Dipr
opet
ryn;
Tota
l; ug
/L
Esfe
nvale
rate
/Fen
valer
ate,
Tota
l; To
tal;
ug/L
Fenp
ropa
thrin
; Tot
al; u
g/L
Hydr
oxya
trazin
e, 2-
; Tot
al; u
g/L
Salton Sea USGS2 5/11/11 DNQ, 0.002 -0.002 0.034 -0.001 -0.002 -0.002 -0.001 -0.002 -0.002 0.021 -0.002 -0.002 -0.002 -0.001 -0.002 0.183 Salton Sea USGS7 5/11/11 DNQ, 0.002 -0.002 0.033 -0.001 -0.002 -0.002 -0.001 -0.002 -0.002 0.021 -0.002 -0.002 -0.002 -0.001 -0.002 0.183 Salton Sea USGS9 5/11/11 DNQ, 0.002 -0.002 0.032 -0.001 -0.002 -0.002 -0.001 -0.002 -0.002 0.021 -0.002 -0.002 -0.002 -0.001 -0.002 0.2 StationName
Sample Date Pe
rmet
hrin
, tra
ns-;
Tota
l; ug
/L
Prom
eton
; Tot
al; u
g/L
Prom
etry
n; To
tal;
ug/L
Prop
azin
e; To
tal;
ug/L
Secb
umet
on; T
otal;
ug/
L
Sim
azin
e; To
tal;
ug/L
Sim
etry
n; To
tal;
ug/L
Terb
uthy
lazin
e; To
tal;
ug/L
Terb
utry
n; To
tal;
ug/L
Salton Sea USGS2 5/11/11 -0.003 -0.002 -0.002 -0.002 -0.002 -0.002 -0.002 -0.002 -0.002 Salton Sea USGS7 5/11/11 -0.003 -0.002 -0.002 -0.002 -0.002 -0.002 -0.002 -0.002 -0.002 Salton Sea USGS9 5/11/11 -0.003 -0.002 -0.002 -0.002 -0.002 -0.002 -0.002 -0.002 -0.002
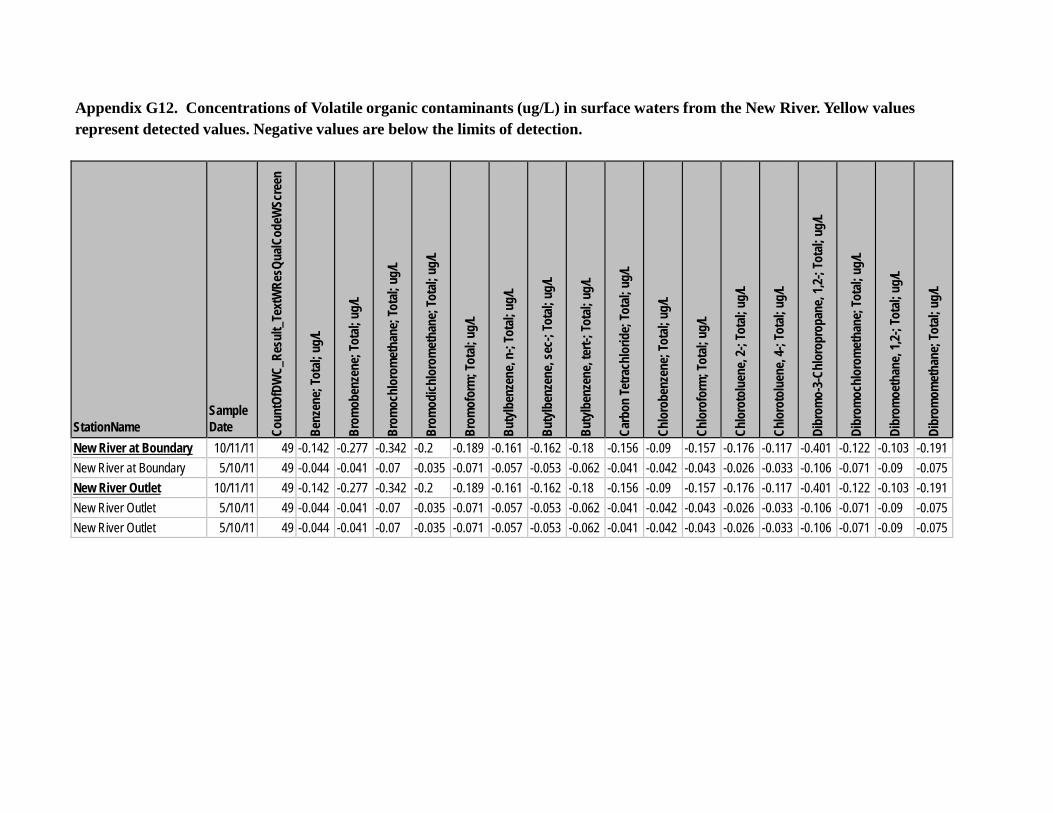
Appendix G12. Concentrations of Volatile organic contaminants (ug/L) in surface waters from the New River. Yellow values represent detected values. Negative values are below the limits of detection.
StationName
Sample Date Co
untO
fDW
C_Re
sult_
Text
WRe
sQua
lCod
eWSc
reen
Benz
ene;
Tota
l; ug
/L
Brom
oben
zene
; Tot
al; u
g/L
Brom
ochl
orom
etha
ne; T
otal;
ug/
L
Brom
odich
loro
met
hane
; Tot
al; u
g/L
Brom
ofor
m; T
otal;
ug/
L
Buty
lben
zene
, n-;
Tota
l; ug
/L
Buty
lben
zene
, sec
-; To
tal;
ug/L
Buty
lben
zene
, ter
t-; To
tal;
ug/L
Carb
on Te
trach
lorid
e; To
tal;
ug/L
Chlo
robe
nzen
e; To
tal;
ug/L
Chlo
rofo
rm; T
otal;
ug/
L
Chlo
roto
luen
e, 2-
; Tot
al; u
g/L
Chlo
roto
luen
e, 4-
; Tot
al; u
g/L
Dibr
omo-
3-Ch
loro
prop
ane,
1,2-;
Tota
l; ug
/L
Dibr
omoc
hlor
omet
hane
; Tot
al; u
g/L
Dibr
omoe
than
e, 1,2
-; To
tal;
ug/L
Dibr
omom
etha
ne; T
otal;
ug/
L
New River at Boundary 10/11/11 49 -0.142 -0.277 -0.342 -0.2 -0.189 -0.161 -0.162 -0.18 -0.156 -0.09 -0.157 -0.176 -0.117 -0.401 -0.122 -0.103 -0.191 New River at Boundary 5/10/11 49 -0.044 -0.041 -0.07 -0.035 -0.071 -0.057 -0.053 -0.062 -0.041 -0.042 -0.043 -0.026 -0.033 -0.106 -0.071 -0.09 -0.075 New River Outlet 10/11/11 49 -0.142 -0.277 -0.342 -0.2 -0.189 -0.161 -0.162 -0.18 -0.156 -0.09 -0.157 -0.176 -0.117 -0.401 -0.122 -0.103 -0.191 New River Outlet 5/10/11 49 -0.044 -0.041 -0.07 -0.035 -0.071 -0.057 -0.053 -0.062 -0.041 -0.042 -0.043 -0.026 -0.033 -0.106 -0.071 -0.09 -0.075 New River Outlet 5/10/11 49 -0.044 -0.041 -0.07 -0.035 -0.071 -0.057 -0.053 -0.062 -0.041 -0.042 -0.043 -0.026 -0.033 -0.106 -0.071 -0.09 -0.075
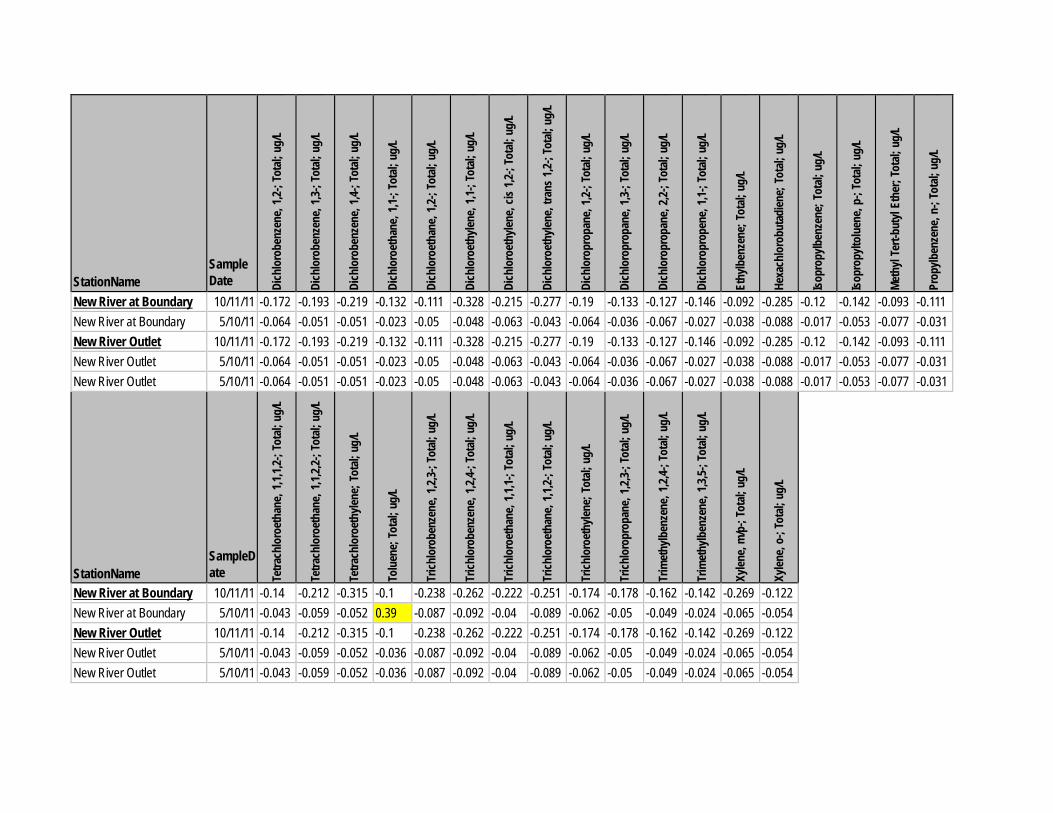
StationName
Sample Date Di
chlo
robe
nzen
e, 1,2
-; To
tal;
ug/L
Dich
loro
benz
ene,
1,3-;
Tota
l; ug
/L
Dich
loro
benz
ene,
1,4-;
Tota
l; ug
/L
Dich
loro
etha
ne, 1
,1-; T
otal;
ug/
L
Dich
loro
etha
ne, 1
,2-; T
otal;
ug/
L
Dich
loro
ethy
lene,
1,1-;
Tota
l; ug
/L
Dich
loro
ethy
lene,
cis 1,
2-; T
otal;
ug/
L
Dich
loro
ethy
lene,
trans
1,2-
; Tot
al; u
g/L
Dich
loro
prop
ane,
1,2-;
Tota
l; ug
/L
Dich
loro
prop
ane,
1,3-;
Tota
l; ug
/L
Dich
loro
prop
ane,
2,2-;
Tota
l; ug
/L
Dich
loro
prop
ene,
1,1-;
Tota
l; ug
/L
Ethy
lben
zene
; Tot
al; u
g/L
Hexa
chlo
robu
tadi
ene;
Tot
al; u
g/L
Isopr
opylb
enze
ne; T
otal;
ug/
L
Isopr
opylt
olue
ne, p
-; To
tal;
ug/L
Meth
yl Te
rt-bu
tyl E
ther
; Tot
al; u
g/L
Prop
ylben
zene
, n-;
Tota
l; ug
/L
New River at Boundary 10/11/11 -0.172 -0.193 -0.219 -0.132 -0.111 -0.328 -0.215 -0.277 -0.19 -0.133 -0.127 -0.146 -0.092 -0.285 -0.12 -0.142 -0.093 -0.111 New River at Boundary 5/10/11 -0.064 -0.051 -0.051 -0.023 -0.05 -0.048 -0.063 -0.043 -0.064 -0.036 -0.067 -0.027 -0.038 -0.088 -0.017 -0.053 -0.077 -0.031 New River Outlet 10/11/11 -0.172 -0.193 -0.219 -0.132 -0.111 -0.328 -0.215 -0.277 -0.19 -0.133 -0.127 -0.146 -0.092 -0.285 -0.12 -0.142 -0.093 -0.111 New River Outlet 5/10/11 -0.064 -0.051 -0.051 -0.023 -0.05 -0.048 -0.063 -0.043 -0.064 -0.036 -0.067 -0.027 -0.038 -0.088 -0.017 -0.053 -0.077 -0.031 New River Outlet 5/10/11 -0.064 -0.051 -0.051 -0.023 -0.05 -0.048 -0.063 -0.043 -0.064 -0.036 -0.067 -0.027 -0.038 -0.088 -0.017 -0.053 -0.077 -0.031 StationName
SampleD ate Te
trach
loro
etha
ne, 1
,1,1,2
-; To
tal;
ug/L
Tetra
chlo
roet
hane
, 1,1,
2,2-;
Tota
l; ug
/L
Tetra
chlo
roet
hylen
e; T
otal;
ug/
L
Tolu
ene;
Tota
l; ug
/L
Trich
loro
benz
ene,
1,2,3-
; Tot
al; u
g/L
Trich
loro
benz
ene,
1,2,4-
; Tot
al; u
g/L
Trich
loro
etha
ne, 1
,1,1-
; Tot
al; u
g/L
Trich
loro
etha
ne, 1
,1,2-
; Tot
al; u
g/L
Trich
loro
ethy
lene;
Tot
al; u
g/L
Trich
loro
prop
ane,
1,2,3-
; Tot
al; u
g/L
Trim
ethy
lben
zene
, 1,2,
4-; T
otal;
ug/
L
Trim
ethy
lben
zene
, 1,3,
5-; T
otal;
ug/
L
Xylen
e, m
/p-;
Tota
l; ug
/L
Xylen
e, o-
; Tot
al; u
g/L
New River at Boundary 10/11/11 -0.14 -0.212 -0.315 -0.1 -0.238 -0.262 -0.222 -0.251 -0.174 -0.178 -0.162 -0.142 -0.269 -0.122 New River at Boundary 5/10/11 -0.043 -0.059 -0.052 0.39 -0.087 -0.092 -0.04 -0.089 -0.062 -0.05 -0.049 -0.024 -0.065 -0.054 New River Outlet 10/11/11 -0.14 -0.212 -0.315 -0.1 -0.238 -0.262 -0.222 -0.251 -0.174 -0.178 -0.162 -0.142 -0.269 -0.122 New River Outlet 5/10/11 -0.043 -0.059 -0.052 -0.036 -0.087 -0.092 -0.04 -0.089 -0.062 -0.05 -0.049 -0.024 -0.065 -0.054 New River Outlet 5/10/11 -0.043 -0.059 -0.052 -0.036 -0.087 -0.092 -0.04 -0.089 -0.062 -0.05 -0.049 -0.024 -0.065 -0.054
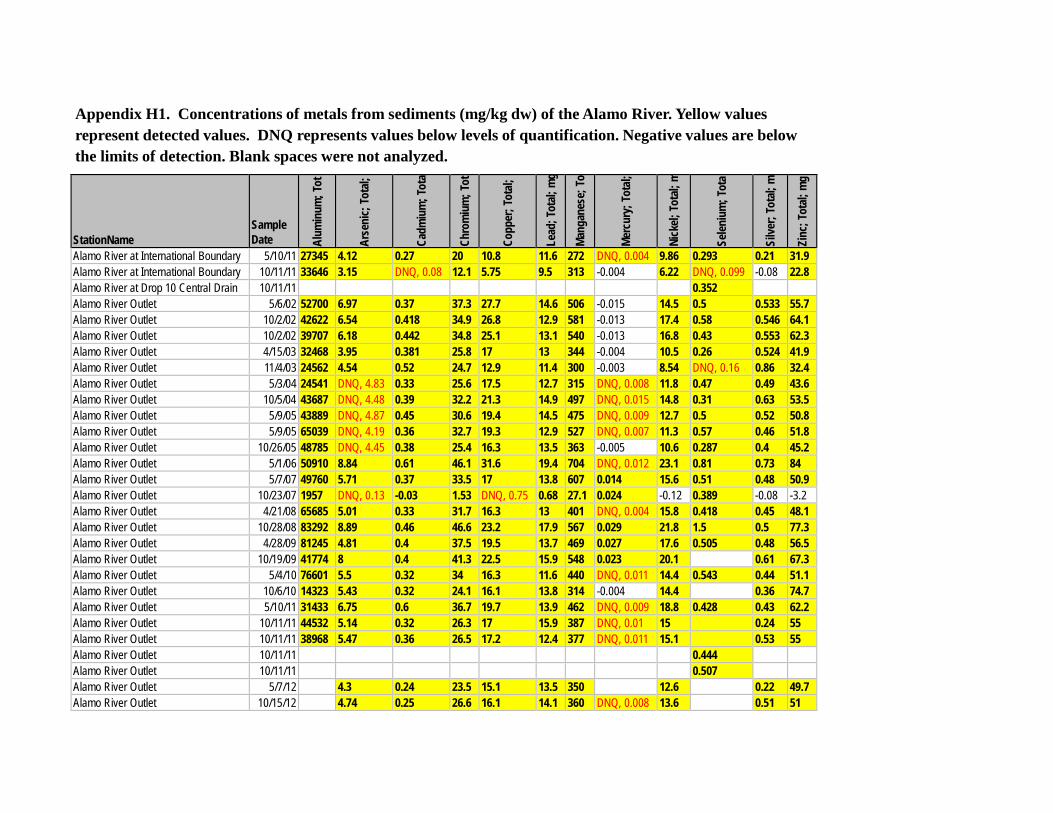
Appendix H1. Concentrations of metals from sediments (mg/kg dw) of the Alamo River. Yellow values represent detected values. DNQ represents values below levels of quantification. Negative values are below the limits of detection. Blank spaces were not analyzed.
StationName
Sample Date Al
umin
um; T
ot
Arse
nic;
Tota
l;
Cadm
ium
; Tot
a
Chro
miu
m; T
ot
Copp
er; T
otal;
Lead
; Tot
al; m
g Ma
ngan
ese;
To
Merc
ury;
Tota
l;
Nick
el; To
tal;
m
Selen
ium
; Tot
a
Silve
r; To
tal;
m
Zinc
; Tot
al; m
g
Alamo River at International Boundary 5/10/11 27345 4.12 0.27 20 10.8 11.6 272 DNQ, 0.004 9.86 0.293 0.21 31.9 Alamo River at International Boundary 10/11/11 33646 3.15 DNQ, 0.08 12.1 5.75 9.5 313 -0.004 6.22 DNQ, 0.099 -0.08 22.8 Alamo River at Drop 10 Central Drain 10/11/11 0.352 Alamo River Outlet 5/6/02 52700 6.97 0.37 37.3 27.7 14.6 506 -0.015 14.5 0.5 0.533 55.7 Alamo River Outlet 10/2/02 42622 6.54 0.418 34.9 26.8 12.9 581 -0.013 17.4 0.58 0.546 64.1 Alamo River Outlet 10/2/02 39707 6.18 0.442 34.8 25.1 13.1 540 -0.013 16.8 0.43 0.553 62.3 Alamo River Outlet 4/15/03 32468 3.95 0.381 25.8 17 13 344 -0.004 10.5 0.26 0.524 41.9 Alamo River Outlet 11/4/03 24562 4.54 0.52 24.7 12.9 11.4 300 -0.003 8.54 DNQ, 0.16 0.86 32.4 Alamo River Outlet 5/3/04 24541 DNQ, 4.83 0.33 25.6 17.5 12.7 315 DNQ, 0.008 11.8 0.47 0.49 43.6 Alamo River Outlet 10/5/04 43687 DNQ, 4.48 0.39 32.2 21.3 14.9 497 DNQ, 0.015 14.8 0.31 0.63 53.5 Alamo River Outlet 5/9/05 43889 DNQ, 4.87 0.45 30.6 19.4 14.5 475 DNQ, 0.009 12.7 0.5 0.52 50.8 Alamo River Outlet 5/9/05 65039 DNQ, 4.19 0.36 32.7 19.3 12.9 527 DNQ, 0.007 11.3 0.57 0.46 51.8 Alamo River Outlet 10/26/05 48785 DNQ, 4.45 0.38 25.4 16.3 13.5 363 -0.005 10.6 0.287 0.4 45.2 Alamo River Outlet 5/1/06 50910 8.84 0.61 46.1 31.6 19.4 704 DNQ, 0.012 23.1 0.81 0.73 84 Alamo River Outlet 5/7/07 49760 5.71 0.37 33.5 17 13.8 607 0.014 15.6 0.51 0.48 50.9 Alamo River Outlet 10/23/07 1957 DNQ, 0.13 -0.03 1.53 DNQ, 0.75 0.68 27.1 0.024 -0.12 0.389 -0.08 -3.2 Alamo River Outlet 4/21/08 65685 5.01 0.33 31.7 16.3 13 401 DNQ, 0.004 15.8 0.418 0.45 48.1 Alamo River Outlet 10/28/08 83292 8.89 0.46 46.6 23.2 17.9 567 0.029 21.8 1.5 0.5 77.3 Alamo River Outlet 4/28/09 81245 4.81 0.4 37.5 19.5 13.7 469 0.027 17.6 0.505 0.48 56.5 Alamo River Outlet 10/19/09 41774 8 0.4 41.3 22.5 15.9 548 0.023 20.1 0.61 67.3 Alamo River Outlet 5/4/10 76601 5.5 0.32 34 16.3 11.6 440 DNQ, 0.011 14.4 0.543 0.44 51.1 Alamo River Outlet 10/6/10 14323 5.43 0.32 24.1 16.1 13.8 314 -0.004 14.4 0.36 74.7 Alamo River Outlet 5/10/11 31433 6.75 0.6 36.7 19.7 13.9 462 DNQ, 0.009 18.8 0.428 0.43 62.2 Alamo River Outlet 10/11/11 44532 5.14 0.32 26.3 17 15.9 387 DNQ, 0.01 15 0.24 55 Alamo River Outlet 10/11/11 38968 5.47 0.36 26.5 17.2 12.4 377 DNQ, 0.011 15.1 0.53 55 Alamo River Outlet 10/11/11 0.444 Alamo River Outlet 10/11/11 0.507 Alamo River Outlet 5/7/12 4.3 0.24 23.5 15.1 13.5 350 12.6 0.22 49.7 Alamo River Outlet 10/15/12 4.74 0.25 26.6 16.1 14.1 360 DNQ, 0.008 13.6 0.51 51
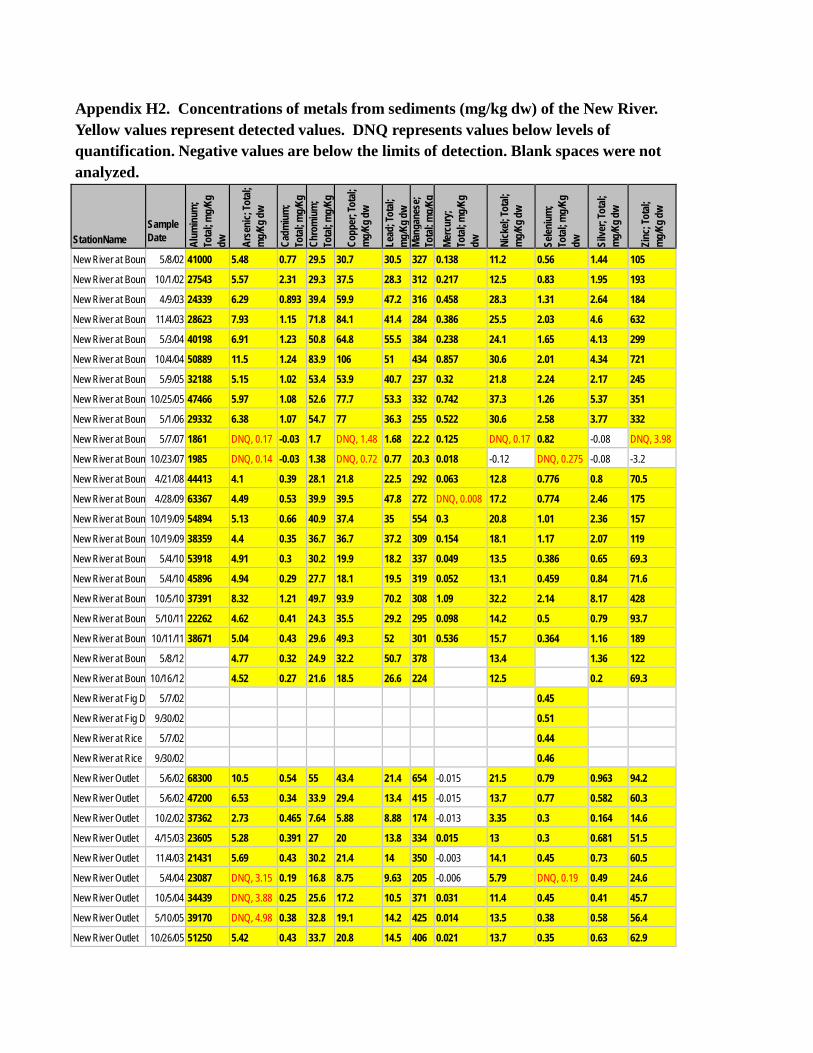
Appendix H2. Concentrations of metals from sediments (mg/kg dw) of the New River. Yellow values represent detected values. DNQ represents values below levels of quantification. Negative values are below the limits of detection. Blank spaces were not analyzed.
StationName
Sample Date Al
umin
um;
Tota
l; mg/
Kg
dw
Arse
nic;
Tota
l; m
g/Kg
dw
Cadm
ium
; To
tal; m
g/Kg
Ch
rom
ium
; To
tal; m
g/Kg
Co
pper
; Tot
al;
mg/
Kg dw
Lead
; Tot
al;
mg/
Kg dw
Ma
ngan
ese;
To
tal; m
g/Kg
Merc
ury;
To
tal; m
g/Kg
dw
Ni
ckel;
Tota
l; m
g/Kg
dw
Selen
ium
; To
tal; m
g/Kg
dw
Silve
r; To
tal;
mg/
Kg dw
Zi
nc; T
otal;
m
g/Kg
dw
New River at Boun 5/8/02 41000 5.48 0.77 29.5 30.7 30.5 327 0.138 11.2 0.56 1.44 105
New River at Boun 10/1/02 27543 5.57 2.31 29.3 37.5 28.3 312 0.217 12.5 0.83 1.95 193
New River at Boun 4/9/03 24339 6.29 0.893 39.4 59.9 47.2 316 0.458 28.3 1.31 2.64 184
New River at Boun 11/4/03 28623 7.93 1.15 71.8 84.1 41.4 284 0.386 25.5 2.03 4.6 632
New River at Boun 5/3/04 40198 6.91 1.23 50.8 64.8 55.5 384 0.238 24.1 1.65 4.13 299
New River at Boun 10/4/04 50889 11.5 1.24 83.9 106 51 434 0.857 30.6 2.01 4.34 721
New River at Boun 5/9/05 32188 5.15 1.02 53.4 53.9 40.7 237 0.32 21.8 2.24 2.17 245
New River at Boun 10/25/05 47466 5.97 1.08 52.6 77.7 53.3 332 0.742 37.3 1.26 5.37 351
New River at Boun 5/1/06 29332 6.38 1.07 54.7 77 36.3 255 0.522 30.6 2.58 3.77 332
New River at Boun 5/7/07 1861 DNQ, 0.17 -0.03 1.7 DNQ, 1.48 1.68 22.2 0.125 DNQ, 0.17 0.82 -0.08 DNQ, 3.98
New River at Boun 10/23/07 1985 DNQ, 0.14 -0.03 1.38 DNQ, 0.72 0.77 20.3 0.018 -0.12 DNQ, 0.275 -0.08 -3.2
New River at Boun 4/21/08 44413 4.1 0.39 28.1 21.8 22.5 292 0.063 12.8 0.776 0.8 70.5
New River at Boun 4/28/09 63367 4.49 0.53 39.9 39.5 47.8 272 DNQ, 0.008 17.2 0.774 2.46 175
New River at Boun 10/19/09 54894 5.13 0.66 40.9 37.4 35 554 0.3 20.8 1.01 2.36 157
New River at Boun 10/19/09 38359 4.4 0.35 36.7 36.7 37.2 309 0.154 18.1 1.17 2.07 119
New River at Boun 5/4/10 53918 4.91 0.3 30.2 19.9 18.2 337 0.049 13.5 0.386 0.65 69.3
New River at Boun 5/4/10 45896 4.94 0.29 27.7 18.1 19.5 319 0.052 13.1 0.459 0.84 71.6
New River at Boun 10/5/10 37391 8.32 1.21 49.7 93.9 70.2 308 1.09 32.2 2.14 8.17 428
New River at Boun 5/10/11 22262 4.62 0.41 24.3 35.5 29.2 295 0.098 14.2 0.5 0.79 93.7
New River at Boun 10/11/11 38671 5.04 0.43 29.6 49.3 52 301 0.536 15.7 0.364 1.16 189
New River at Boun 5/8/12 4.77 0.32 24.9 32.2 50.7 378 13.4 1.36 122
New River at Boun 10/16/12 4.52 0.27 21.6 18.5 26.6 224 12.5 0.2 69.3
New River at Fig D 5/7/02 0.45 New River at Fig D 9/30/02 0.51 New River at Rice 5/7/02 0.44 New River at Rice 9/30/02 0.46 New River Outlet 5/6/02 68300 10.5 0.54 55 43.4 21.4 654 -0.015 21.5 0.79 0.963 94.2
New River Outlet 5/6/02 47200 6.53 0.34 33.9 29.4 13.4 415 -0.015 13.7 0.77 0.582 60.3
New River Outlet 10/2/02 37362 2.73 0.465 7.64 5.88 8.88 174 -0.013 3.35 0.3 0.164 14.6
New River Outlet 4/15/03 23605 5.28 0.391 27 20 13.8 334 0.015 13 0.3 0.681 51.5
New River Outlet 11/4/03 21431 5.69 0.43 30.2 21.4 14 350 -0.003 14.1 0.45 0.73 60.5
New River Outlet 5/4/04 23087 DNQ, 3.15 0.19 16.8 8.75 9.63 205 -0.006 5.79 DNQ, 0.19 0.49 24.6
New River Outlet 10/5/04 34439 DNQ, 3.88 0.25 25.6 17.2 10.5 371 0.031 11.4 0.45 0.41 45.7
New River Outlet 5/10/05 39170 DNQ, 4.98 0.38 32.8 19.1 14.2 425 0.014 13.5 0.38 0.58 56.4
New River Outlet 10/26/05 51250 5.42 0.43 33.7 20.8 14.5 406 0.021 13.7 0.35 0.63 62.9
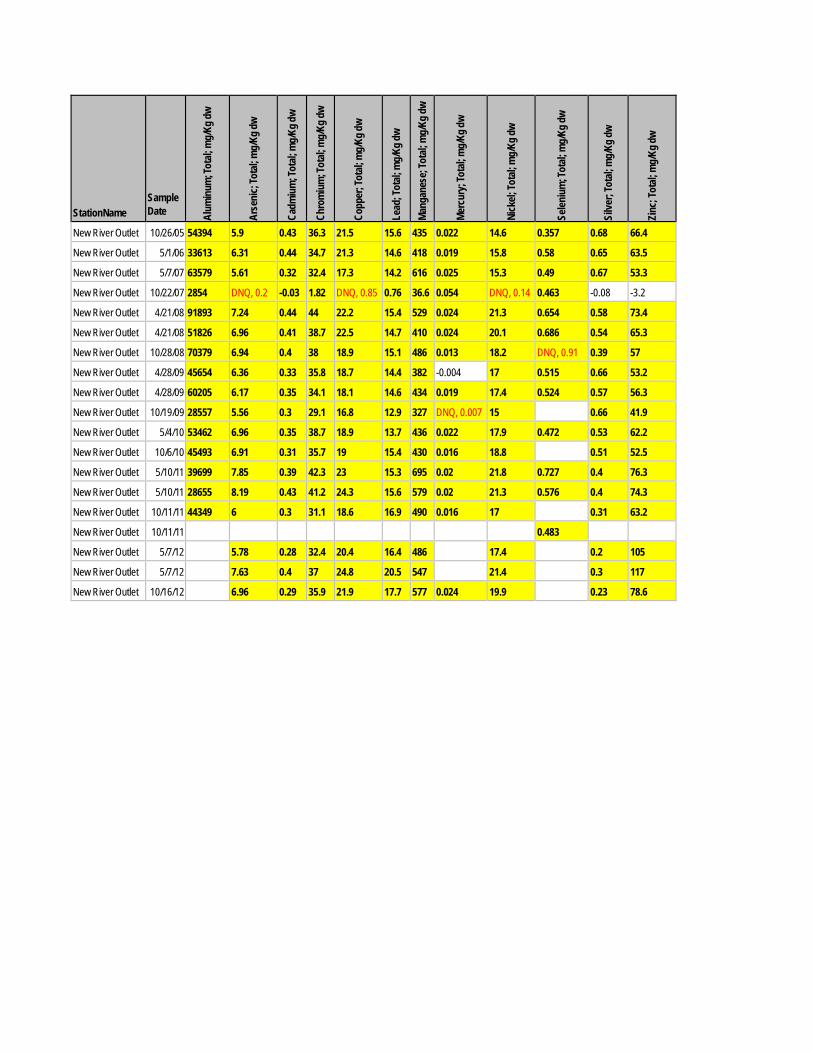
StationName
Sample Date Al
umin
um; T
otal;
mg/
Kg dw
Arse
nic;
Tota
l; mg/
Kg dw
Cadm
ium
; Tot
al; m
g/Kg
dw
Chro
miu
m; T
otal;
mg/
Kg dw
Copp
er; T
otal;
mg/
Kg dw
Lead
; Tot
al; m
g/Kg
dw
Mang
anes
e; To
tal; m
g/Kg
dw
Merc
ury;
Tota
l; mg/
Kg dw
Nick
el; To
tal; m
g/Kg
dw
Selen
ium
; Tot
al; m
g/Kg
dw
Silve
r; To
tal; m
g/Kg
dw
Zinc
; Tot
al; m
g/Kg
dw
New River Outlet 10/26/05 54394 5.9 0.43 36.3 21.5 15.6 435 0.022 14.6 0.357 0.68 66.4
New River Outlet 5/1/06 33613 6.31 0.44 34.7 21.3 14.6 418 0.019 15.8 0.58 0.65 63.5
New River Outlet 5/7/07 63579 5.61 0.32 32.4 17.3 14.2 616 0.025 15.3 0.49 0.67 53.3
New River Outlet 10/22/07 2854 DNQ, 0.2 -0.03 1.82 DNQ, 0.85 0.76 36.6 0.054 DNQ, 0.14 0.463 -0.08 -3.2
New River Outlet 4/21/08 91893 7.24 0.44 44 22.2 15.4 529 0.024 21.3 0.654 0.58 73.4
New River Outlet 4/21/08 51826 6.96 0.41 38.7 22.5 14.7 410 0.024 20.1 0.686 0.54 65.3
New River Outlet 10/28/08 70379 6.94 0.4 38 18.9 15.1 486 0.013 18.2 DNQ, 0.91 0.39 57
New River Outlet 4/28/09 45654 6.36 0.33 35.8 18.7 14.4 382 -0.004 17 0.515 0.66 53.2
New River Outlet 4/28/09 60205 6.17 0.35 34.1 18.1 14.6 434 0.019 17.4 0.524 0.57 56.3
New River Outlet 10/19/09 28557 5.56 0.3 29.1 16.8 12.9 327 DNQ, 0.007 15 0.66 41.9
New River Outlet 5/4/10 53462 6.96 0.35 38.7 18.9 13.7 436 0.022 17.9 0.472 0.53 62.2
New River Outlet 10/6/10 45493 6.91 0.31 35.7 19 15.4 430 0.016 18.8 0.51 52.5
New River Outlet 5/10/11 39699 7.85 0.39 42.3 23 15.3 695 0.02 21.8 0.727 0.4 76.3
New River Outlet 5/10/11 28655 8.19 0.43 41.2 24.3 15.6 579 0.02 21.3 0.576 0.4 74.3
New River Outlet 10/11/11 44349 6 0.3 31.1 18.6 16.9 490 0.016 17 0.31 63.2
New River Outlet 10/11/11 0.483 New River Outlet 5/7/12 5.78 0.28 32.4 20.4 16.4 486 17.4 0.2 105
New River Outlet 5/7/12 7.63 0.4 37 24.8 20.5 547 21.4 0.3 117
New River Outlet 10/16/12 6.96 0.29 35.9 21.9 17.7 577 0.024 19.9 0.23 78.6
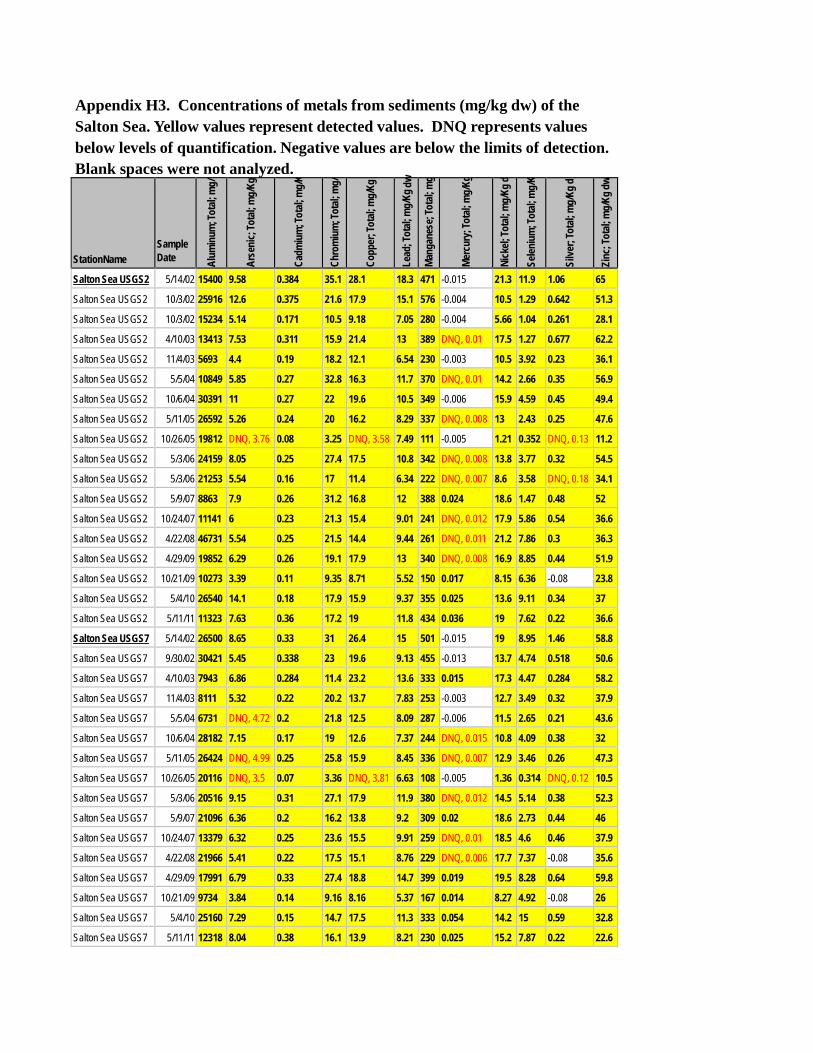
StationName
Sample Date
Alum
inum
; Tot
al; m
g/
Arse
nic;
Tota
l; mg/
Kg
Cadm
ium
; Tot
al; m
g/K
Chro
miu
m; T
otal;
mg/
Copp
er; T
otal;
mg/
Kg
Lead
; Tot
al; m
g/Kg
Mang
anes
e; To
tal; m
g
Merc
ury;
Tota
l; mg/
Kg
Nick
el; To
tal; m
g/Kg
d Se
leniu
m; T
otal;
mg/
K
Silve
r; To
tal; m
g/Kg
d
Zinc
; Tot
al; m
g/Kg
dw
Salton Sea USGS2 5/14/02 15400 9.58 0.384 35.1 28.1 18.3 471 -0.015 21.3 11.9 1.06 65
Salton Sea USGS2 10/3/02 25916 12.6 0.375 21.6 17.9 15.1 576 -0.004 10.5 1.29 0.642 51.3
Salton Sea USGS2 10/3/02 15234 5.14 0.171 10.5 9.18 7.05 280 -0.004 5.66 1.04 0.261 28.1
Salton Sea USGS2 4/10/03 13413 7.53 0.311 15.9 21.4 13 389 DNQ, 0.01 17.5 1.27 0.677 62.2
Salton Sea USGS2 11/4/03 5693 4.4 0.19 18.2 12.1 6.54 230 -0.003 10.5 3.92 0.23 36.1
Salton Sea USGS2 5/5/04 10849 5.85 0.27 32.8 16.3 11.7 370 DNQ, 0.01 14.2 2.66 0.35 56.9
Salton Sea USGS2 10/6/04 30391 11 0.27 22 19.6 10.5 349 -0.006 15.9 4.59 0.45 49.4
Salton Sea USGS2 5/11/05 26592 5.26 0.24 20 16.2 8.29 337 DNQ, 0.008 13 2.43 0.25 47.6
Salton Sea USGS2 10/26/05 19812 DNQ, 3.76 0.08 3.25 DNQ, 3.58 7.49 111 -0.005 1.21 0.352 DNQ, 0.13 11.2
Salton Sea USGS2 5/3/06 24159 8.05 0.25 27.4 17.5 10.8 342 DNQ, 0.008 13.8 3.77 0.32 54.5
Salton Sea USGS2 5/3/06 21253 5.54 0.16 17 11.4 6.34 222 DNQ, 0.007 8.6 3.58 DNQ, 0.18 34.1
Salton Sea USGS2 5/9/07 8863 7.9 0.26 31.2 16.8 12 388 0.024 18.6 1.47 0.48 52
Salton Sea USGS2 10/24/07 11141 6 0.23 21.3 15.4 9.01 241 DNQ, 0.012 17.9 5.86 0.54 36.6
Salton Sea USGS2 4/22/08 46731 5.54 0.25 21.5 14.4 9.44 261 DNQ, 0.011 21.2 7.86 0.3 36.3
Salton Sea USGS2 4/29/09 19852 6.29 0.26 19.1 17.9 13 340 DNQ, 0.008 16.9 8.85 0.44 51.9
Salton Sea USGS2 10/21/09 10273 3.39 0.11 9.35 8.71 5.52 150 0.017 8.15 6.36 -0.08 23.8
Salton Sea USGS2 5/4/10 26540 14.1 0.18 17.9 15.9 9.37 355 0.025 13.6 9.11 0.34 37
Salton Sea USGS2 5/11/11 11323 7.63 0.36 17.2 19 11.8 434 0.036 19 7.62 0.22 36.6
Salton Sea USGS7 5/14/02 26500 8.65 0.33 31 26.4 15 501 -0.015 19 8.95 1.46 58.8
Salton Sea USGS7 9/30/02 30421 5.45 0.338 23 19.6 9.13 455 -0.013 13.7 4.74 0.518 50.6
Salton Sea USGS7 4/10/03 7943 6.86 0.284 11.4 23.2 13.6 333 0.015 17.3 4.47 0.284 58.2
Salton Sea USGS7 11/4/03 8111 5.32 0.22 20.2 13.7 7.83 253 -0.003 12.7 3.49 0.32 37.9
Salton Sea USGS7 5/5/04 6731 DNQ, 4.72 0.2 21.8 12.5 8.09 287 -0.006 11.5 2.65 0.21 43.6
Salton Sea USGS7 10/6/04 28182 7.15 0.17 19 12.6 7.37 244 DNQ, 0.015 10.8 4.09 0.38 32
Salton Sea USGS7 5/11/05 26424 DNQ, 4.99 0.25 25.8 15.9 8.45 336 DNQ, 0.007 12.9 3.46 0.26 47.3
Salton Sea USGS7 10/26/05 20116 DNQ, 3.5 0.07 3.36 DNQ, 3.81 6.63 108 -0.005 1.36 0.314 DNQ, 0.12 10.5
Salton Sea USGS7 5/3/06 20516 9.15 0.31 27.1 17.9 11.9 380 DNQ, 0.012 14.5 5.14 0.38 52.3
Salton Sea USGS7 5/9/07 21096 6.36 0.2 16.2 13.8 9.2 309 0.02 18.6 2.73 0.44 46
Salton Sea USGS7 10/24/07 13379 6.32 0.25 23.6 15.5 9.91 259 DNQ, 0.01 18.5 4.6 0.46 37.9
Salton Sea USGS7 4/22/08 21966 5.41 0.22 17.5 15.1 8.76 229 DNQ, 0.006 17.7 7.37 -0.08 35.6
Salton Sea USGS7 4/29/09 17991 6.79 0.33 27.4 18.8 14.7 399 0.019 19.5 8.28 0.64 59.8
Salton Sea USGS7 10/21/09 9734 3.84 0.14 9.16 8.16 5.37 167 0.014 8.27 4.92 -0.08 26
Salton Sea USGS7 5/4/10 25160 7.29 0.15 14.7 17.5 11.3 333 0.054 14.2 15 0.59 32.8
Salton Sea USGS7 5/11/11 12318 8.04 0.38 16.1 13.9 8.21 230 0.025 15.2 7.87 0.22 22.6
dw
Appendix H3. Concentrations of metals from sediments (mg/kg dw) of the Salton Sea. Yellow values represent detected values. DNQ represents values below levels of quantification. Negative values are below the limits of detection. Blank spaces were not analyzed.
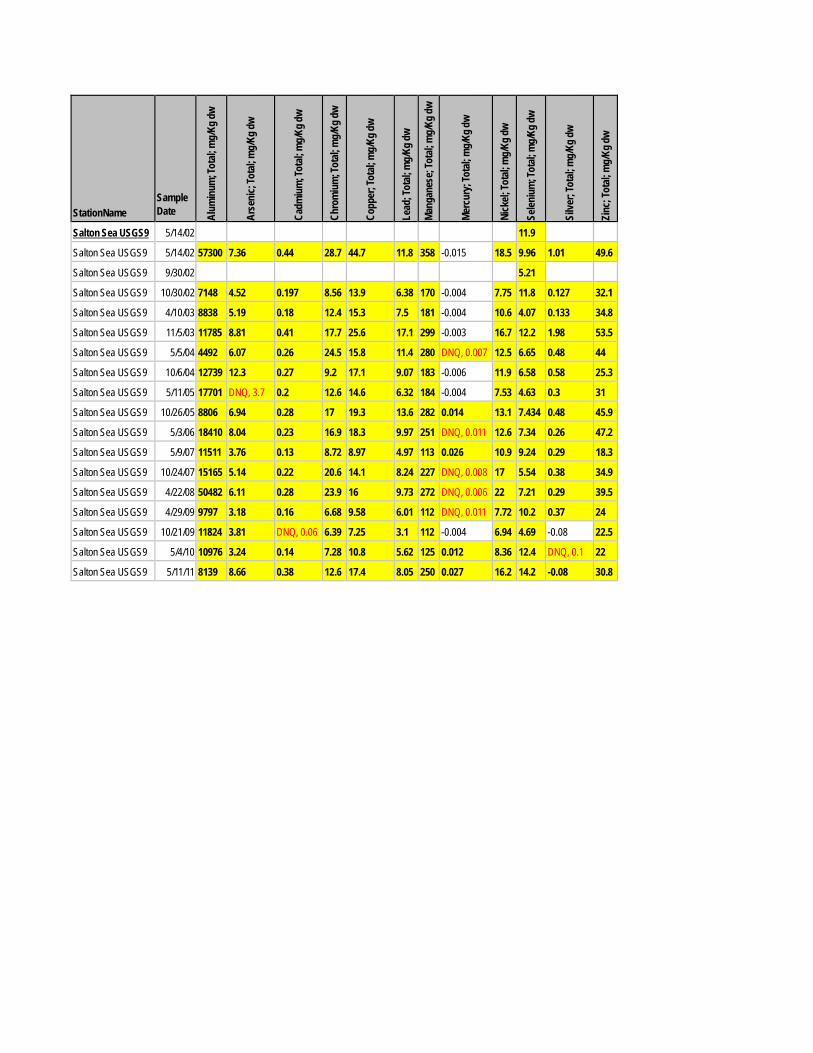
StationName
Sample Date
Alum
inum
; Tot
al; m
g/Kg
dw
Arse
nic;
Tota
l; mg/
Kg dw
Cadm
ium
; Tot
al; m
g/Kg
dw
Chro
miu
m; T
otal;
mg/
Kg dw
Copp
er; T
otal;
mg/
Kg dw
Lead
; Tot
al; m
g/Kg
dw
Mang
anes
e; To
tal; m
g/Kg
dw
Merc
ury;
Tota
l; mg/
Kg dw
Nick
el; To
tal; m
g/Kg
dw
Selen
ium
; Tot
al; m
g/Kg
dw
Silve
r; To
tal; m
g/Kg
dw
Zinc
; Tot
al; m
g/Kg
dw
Salton Sea USGS9 5/14/02 11.9 Salton Sea USGS9 5/14/02 57300 7.36 0.44 28.7 44.7 11.8 358 -0.015 18.5 9.96 1.01 49.6
Salton Sea USGS9 9/30/02 5.21 Salton Sea USGS9 10/30/02 7148 4.52 0.197 8.56 13.9 6.38 170 -0.004 7.75 11.8 0.127 32.1
Salton Sea USGS9 4/10/03 8838 5.19 0.18 12.4 15.3 7.5 181 -0.004 10.6 4.07 0.133 34.8
Salton Sea USGS9 11/5/03 11785 8.81 0.41 17.7 25.6 17.1 299 -0.003 16.7 12.2 1.98 53.5
Salton Sea USGS9 5/5/04 4492 6.07 0.26 24.5 15.8 11.4 280 DNQ, 0.007 12.5 6.65 0.48 44
Salton Sea USGS9 10/6/04 12739 12.3 0.27 9.2 17.1 9.07 183 -0.006 11.9 6.58 0.58 25.3
Salton Sea USGS9 5/11/05 17701 DNQ, 3.7 0.2 12.6 14.6 6.32 184 -0.004 7.53 4.63 0.3 31
Salton Sea USGS9 10/26/05 8806 6.94 0.28 17 19.3 13.6 282 0.014 13.1 7.434 0.48 45.9
Salton Sea USGS9 5/3/06 18410 8.04 0.23 16.9 18.3 9.97 251 DNQ, 0.011 12.6 7.34 0.26 47.2
Salton Sea USGS9 5/9/07 11511 3.76 0.13 8.72 8.97 4.97 113 0.026 10.9 9.24 0.29 18.3
Salton Sea USGS9 10/24/07 15165 5.14 0.22 20.6 14.1 8.24 227 DNQ, 0.008 17 5.54 0.38 34.9
Salton Sea USGS9 4/22/08 50482 6.11 0.28 23.9 16 9.73 272 DNQ, 0.006 22 7.21 0.29 39.5
Salton Sea USGS9 4/29/09 9797 3.18 0.16 6.68 9.58 6.01 112 DNQ, 0.011 7.72 10.2 0.37 24
Salton Sea USGS9 10/21/09 11824 3.81 DNQ, 0.06 6.39 7.25 3.1 112 -0.004 6.94 4.69 -0.08 22.5
Salton Sea USGS9 5/4/10 10976 3.24 0.14 7.28 10.8 5.62 125 0.012 8.36 12.4 DNQ, 0.1 22
Salton Sea USGS9 5/11/11 8139 8.66 0.38 12.6 17.4 8.05 250 0.027 16.2 14.2 -0.08 30.8
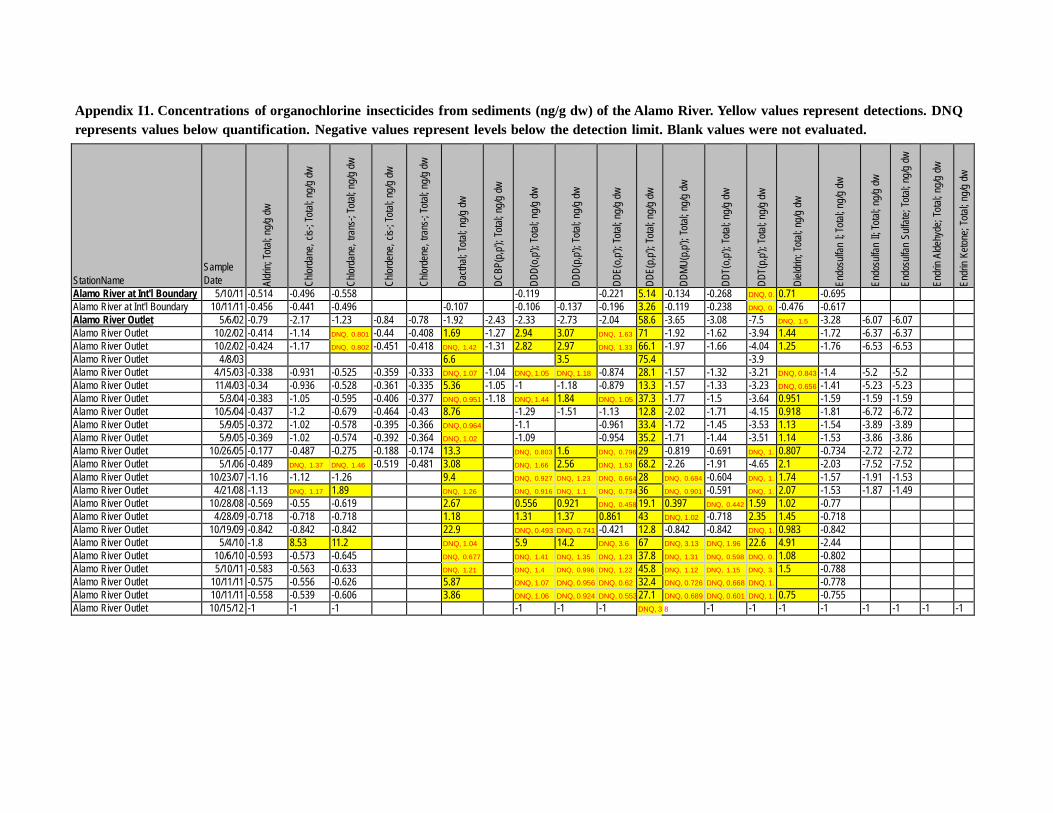
Appendix I1. Concentrations of organochlorine insecticides from sediments (ng/g dw) of the Alamo River. Yellow values represent detections. DNQ represents values below quantification. Negative values represent levels below the detection limit. Blank values were not evaluated.
StationName
Sample Date Al
drin;
Total
; ng/g
dw
Chlor
dane
, cis-
; Tota
l; ng/g
dw
Chlor
dane
, tra
ns-;
Total
; ng/g
dw
Chlor
dene
, cis-
; Tota
l; ng/g
dw
Chlor
dene
, tra
ns-;
Total
; ng/g
dw
Dacth
al; To
tal; n
g/g d
w
DCBP
(p,p'
); To
tal; n
g/g d
w
DDD(
o,p');
Total
; ng/g
dw
DDD(
p,p');
Total
; ng/g
dw
DDE(
o,p');
Total
; ng/g
dw
DDE(
p,p');
Total
; ng/g
dw
DDMU
(p,p'
); To
tal; n
g/g d
w
DDT(
o,p');
Total
; ng/g
dw
DDT(
p,p');
Total
; ng/g
dw
Dield
rin; T
otal; n
g/g d
w
Endo
sulfa
n I; T
otal; n
g/g d
w
Endo
sulfa
n II;
Total
; ng/g
dw
Endo
sulfa
n Su
lfate;
Total
; ng/g
dw
Endr
in Al
dehy
de; T
otal; n
g/g d
w
Endr
in Ke
tone;
Total
; ng/g
dw
Alamo River at Int'l Boundary 5/10/11 -0.514 -0.496 -0.558 -0.119 -0.221 5.14 -0.134 -0.268 DNQ, 0. 0.71 -0.695 Alamo River at Int'l Boundary 10/11/11 -0.456 -0.441 -0.496 -0.107 -0.106 -0.137 -0.196 3.26 -0.119 -0.238 DNQ, 0. -0.476 -0.617 Alamo River Outlet 5/6/02 -0.79 -2.17 -1.23 -0.84 -0.78 -1.92 -2.43 -2.33 -2.73 -2.04 58.6 -3.65 -3.08 -7.5 DNQ, 1.5 -3.28 -6.07 -6.07 Alamo River Outlet 10/2/02 -0.414 -1.14 DNQ, 0.801 -0.44 -0.408 1.69 -1.27 2.94 3.07 DNQ, 1.63 71 -1.92 -1.62 -3.94 1.44 -1.72 -6.37 -6.37 Alamo River Outlet 10/2/02 -0.424 -1.17 DNQ, 0.802 -0.451 -0.418 DNQ, 1.42 -1.31 2.82 2.97 DNQ, 1.33 66.1 -1.97 -1.66 -4.04 1.25 -1.76 -6.53 -6.53 Alamo River Outlet 4/8/03 6.6 3.5 75.4 -3.9 Alamo River Outlet 4/15/03 -0.338 -0.931 -0.525 -0.359 -0.333 DNQ, 1.07 -1.04 DNQ, 1.05 DNQ, 1.18 -0.874 28.1 -1.57 -1.32 -3.21 DNQ, 0.843 -1.4 -5.2 -5.2 Alamo River Outlet 11/4/03 -0.34 -0.936 -0.528 -0.361 -0.335 5.36 -1.05 -1 -1.18 -0.879 13.3 -1.57 -1.33 -3.23 DNQ, 0.656 -1.41 -5.23 -5.23 Alamo River Outlet 5/3/04 -0.383 -1.05 -0.595 -0.406 -0.377 DNQ, 0.951 -1.18 DNQ, 1.44 1.84 DNQ, 1.05 37.3 -1.77 -1.5 -3.64 0.951 -1.59 -1.59 -1.59 Alamo River Outlet 10/5/04 -0.437 -1.2 -0.679 -0.464 -0.43 8.76 -1.29 -1.51 -1.13 12.8 -2.02 -1.71 -4.15 0.918 -1.81 -6.72 -6.72 Alamo River Outlet 5/9/05 -0.372 -1.02 -0.578 -0.395 -0.366 DNQ, 0.964 -1.1 -0.961 33.4 -1.72 -1.45 -3.53 1.13 -1.54 -3.89 -3.89 Alamo River Outlet 5/9/05 -0.369 -1.02 -0.574 -0.392 -0.364 DNQ, 1.02 -1.09 -0.954 35.2 -1.71 -1.44 -3.51 1.14 -1.53 -3.86 -3.86 Alamo River Outlet 10/26/05 -0.177 -0.487 -0.275 -0.188 -0.174 13.3 DNQ, 0.803 1.6 DNQ, 0.796 29 -0.819 -0.691 DNQ, 1. 0.807 -0.734 -2.72 -2.72 Alamo River Outlet 5/1/06 -0.489 DNQ, 1.37 DNQ, 1.46 -0.519 -0.481 3.08 DNQ, 1.66 2.56 DNQ, 1.53 68.2 -2.26 -1.91 -4.65 2.1 -2.03 -7.52 -7.52 Alamo River Outlet 10/23/07 -1.16 -1.12 -1.26 9.4 DNQ, 0.927 DNQ, 1.23 DNQ, 0.664 28 DNQ, 0.684 -0.604 DNQ, 1. 1.74 -1.57 -1.91 -1.53 Alamo River Outlet 4/21/08 -1.13 DNQ, 1.17 1.89 DNQ, 1.26 DNQ, 0.916 DNQ, 1.1 DNQ, 0.734 36 DNQ, 0.901 -0.591 DNQ, 1. 2.07 -1.53 -1.87 -1.49 Alamo River Outlet 10/28/08 -0.569 -0.55 -0.619 2.67 0.556 0.921 DNQ, 0.458 19.1 0.397 DNQ, 0.442 1.59 1.02 -0.77 Alamo River Outlet 4/28/09 -0.718 -0.718 -0.718 1.18 1.31 1.37 0.861 43 DNQ, 1.02 -0.718 2.35 1.45 -0.718 Alamo River Outlet 10/19/09 -0.842 -0.842 -0.842 22.9 DNQ, 0.493 DNQ, 0.741 -0.421 12.8 -0.842 -0.842 DNQ, 1. 0.983 -0.842 Alamo River Outlet 5/4/10 -1.8 8.53 11.2 DNQ, 1.04 5.9 14.2 DNQ, 3.6 67 DNQ, 3.13 DNQ, 1.96 22.6 4.91 -2.44 Alamo River Outlet 10/6/10 -0.593 -0.573 -0.645 DNQ, 0.677 DNQ, 1.41 DNQ, 1.35 DNQ, 1.23 37.8 DNQ, 1.31 DNQ, 0.598 DNQ, 0. 1.08 -0.802 Alamo River Outlet 5/10/11 -0.583 -0.563 -0.633 DNQ, 1.21 DNQ, 1.4 DNQ, 0.996 DNQ, 1.22 45.8 DNQ, 1.12 DNQ, 1.15 DNQ, 3. 1.5 -0.788 Alamo River Outlet 10/11/11 -0.575 -0.556 -0.626 5.87 DNQ, 1.07 DNQ, 0.956 DNQ, 0.62 32.4 DNQ, 0.726 DNQ, 0.668 DNQ, 1. -0.778 Alamo River Outlet 10/11/11 -0.558 -0.539 -0.606 3.86 DNQ, 1.06 DNQ, 0.924 DNQ, 0.553 27.1 DNQ, 0.689 DNQ, 0.601 DNQ, 1. 0.75 -0.755 Alamo River Outlet 10/15/12 -1 -1 -1 -1 -1 -1 DNQ, 3. 8 -1 -1 -1 -1 -1 -1 -1 -1
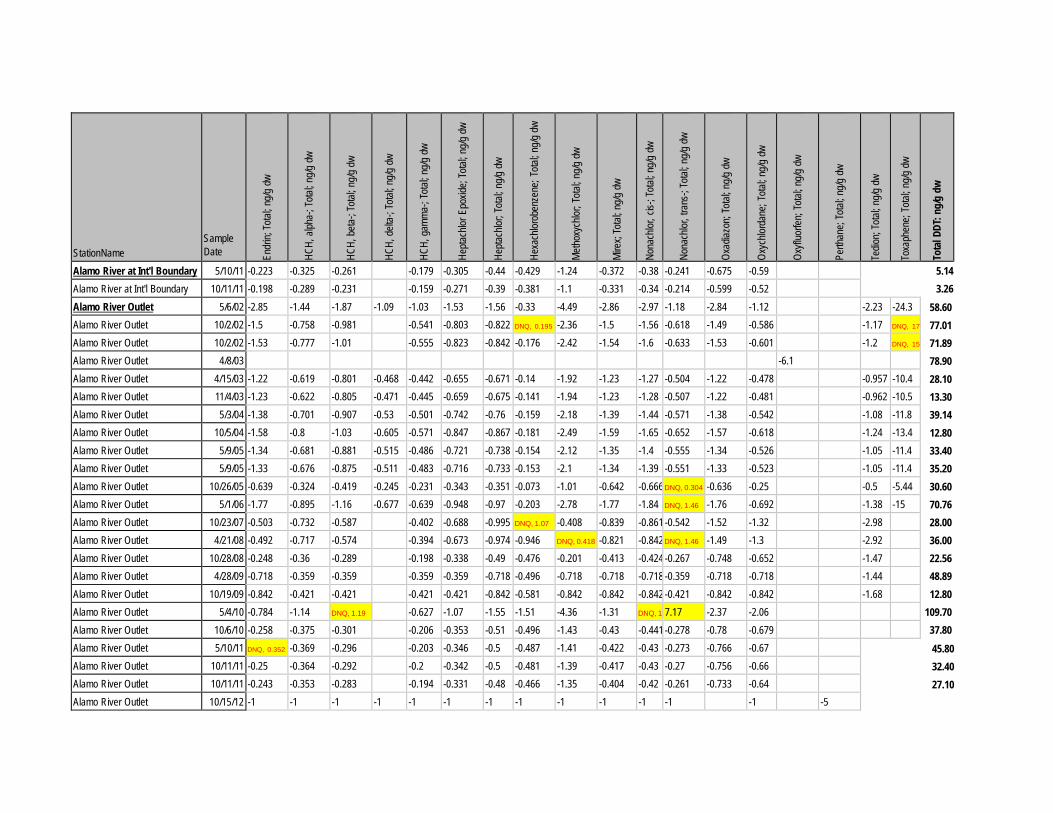
StationName
Sample Date En
drin;
Total
; ng/g
dw
HCH,
alph
a-; T
otal; n
g/g d
w
HCH,
beta
-; To
tal; n
g/g d
w
HCH,
delt
a-; T
otal; n
g/g d
w
HCH,
gam
ma-;
Total
; ng/g
dw
Hepta
chlor
Epo
xide;
Total
; ng/g
dw
Hepta
chlor
; Tota
l; ng/g
dw
Hexa
chlor
oben
zene
; Tota
l; ng/g
dw
Metho
xych
lor; T
otal; n
g/g d
w
Mire
x; To
tal; n
g/g d
w
Nona
chlor
, cis-
; Tota
l; ng/g
dw
Nona
chlor
, tra
ns-;
Total
; ng/g
dw
Oxad
iazon
; Tota
l; ng/g
dw
Oxyc
hlord
ane;
Total
; ng/g
dw
Oxyfl
uorfe
n; To
tal; n
g/g d
w
Perth
ane;
Total
; ng/g
dw
Tedio
n; To
tal; n
g/g d
w To
xaph
ene;
Total
; ng/g
dw
Tota
l DDT
: ng/
g dw
Alamo River at Int'l Boundary 5/10/11 -0.223 -0.325 -0.261 -0.179 -0.305 -0.44 -0.429 -1.24 -0.372 -0.38 -0.241 -0.675 -0.59 5.14 3.26 Alamo River at Int'l Boundary 10/11/11 -0.198 -0.289 -0.231 -0.159 -0.271 -0.39 -0.381 -1.1 -0.331 -0.34 -0.214 -0.599 -0.52
Alamo River Outlet 5/6/02 -2.85 -1.44 -1.87 -1.09 -1.03 -1.53 -1.56 -0.33 -4.49 -2.86 -2.97 -1.18 -2.84 -1.12 -2.23 -24.3 58.60 77.01 71.89 78.90 28.10 13.30 39.14 12.80 33.40 35.20 30.60 70.76 28.00 36.00 22.56 48.89 12.80
109.70 37.80
Alamo River Outlet 10/2/02 -1.5 -0.758 -0.981 -0.541 -0.803 -0.822 DNQ, 0.195 -2.36 -1.5 -1.56 -0.618 -1.49 -0.586 -1.17
DNQ, 17
Alamo River Outlet 10/2/02 -1.53 -0.777 -1.01 -0.555 -0.823 -0.842 -0.176 -2.42 -1.54 -1.6 -0.633 -1.53 -0.601 -1.2 DNQ, 15
Alamo River Outlet 4/8/03 -6.1 Alamo River Outlet 4/15/03 -1.22 -0.619 -0.801 -0.468 -0.442 -0.655 -0.671 -0.14 -1.92 -1.23 -1.27 -0.504 -1.22 -0.478 -0.957 -10.4 Alamo River Outlet 11/4/03 -1.23 -0.622 -0.805 -0.471 -0.445 -0.659 -0.675 -0.141 -1.94 -1.23 -1.28 -0.507 -1.22 -0.481 -0.962 -10.5 Alamo River Outlet 5/3/04 -1.38 -0.701 -0.907 -0.53 -0.501 -0.742 -0.76 -0.159 -2.18 -1.39 -1.44 -0.571 -1.38 -0.542 -1.08 -11.8 Alamo River Outlet 10/5/04 -1.58 -0.8 -1.03 -0.605 -0.571 -0.847 -0.867 -0.181 -2.49 -1.59 -1.65 -0.652 -1.57 -0.618 -1.24 -13.4 Alamo River Outlet 5/9/05 -1.34 -0.681 -0.881 -0.515 -0.486 -0.721 -0.738 -0.154 -2.12 -1.35 -1.4 -0.555 -1.34 -0.526 -1.05 -11.4 Alamo River Outlet 5/9/05 -1.33 -0.676 -0.875 -0.511 -0.483 -0.716 -0.733 -0.153 -2.1 -1.34 -1.39 -0.551 -1.33 -0.523 -1.05 -11.4 Alamo River Outlet 10/26/05 -0.639 -0.324 -0.419 -0.245 -0.231 -0.343 -0.351 -0.073 -1.01 -0.642 -0.666 DNQ, 0.304 -0.636 -0.25 -0.5 -5.44 Alamo River Outlet 5/1/06 -1.77 -0.895 -1.16 -0.677 -0.639 -0.948 -0.97 -0.203 -2.78 -1.77 -1.84 DNQ, 1.46 -1.76 -0.692 -1.38 -15 Alamo River Outlet 10/23/07 -0.503 -0.732 -0.587 -0.402 -0.688 -0.995 DNQ, 1.07 -0.408 -0.839 -0.861 -0.542 -1.52 -1.32 -2.98 Alamo River Outlet 4/21/08 -0.492 -0.717 -0.574 -0.394 -0.673 -0.974 -0.946 DNQ, 0.418 -0.821 -0.842 DNQ, 1.46 -1.49 -1.3 -2.92 Alamo River Outlet 10/28/08 -0.248 -0.36 -0.289 -0.198 -0.338 -0.49 -0.476 -0.201 -0.413 -0.424 -0.267 -0.748 -0.652 -1.47 Alamo River Outlet 4/28/09 -0.718 -0.359 -0.359 -0.359 -0.359 -0.718 -0.496 -0.718 -0.718 -0.718 -0.359 -0.718 -0.718 -1.44 Alamo River Outlet 10/19/09 -0.842 -0.421 -0.421 -0.421 -0.421 -0.842 -0.581 -0.842 -0.842 -0.842 -0.421 -0.842 -0.842 -1.68 Alamo River Outlet 5/4/10 -0.784 -1.14 DNQ, 1.19 -0.627 -1.07 -1.55 -1.51 -4.36 -1.31 DNQ, 1 7.17 -2.37 -2.06 Alamo River Outlet 10/6/10 -0.258 -0.375 -0.301 -0.206 -0.353 -0.51 -0.496 -1.43 -0.43 -0.441 -0.278 -0.78 -0.679 Alamo River Outlet 5/10/11 DNQ, 0.352 -0.369 -0.296 -0.203 -0.346 -0.5 -0.487 -1.41 -0.422 -0.43 -0.273 -0.766 -0.67 Alamo River Outlet 10/11/11 -0.25 -0.364 -0.292 -0.2 -0.342 -0.5 -0.481 -1.39 -0.417 -0.43 -0.27 -0.756 -0.66 Alamo River Outlet 10/11/11 -0.243 -0.353 -0.283 -0.194 -0.331 -0.48 -0.466 -1.35 -0.404 -0.42 -0.261 -0.733 -0.64 Alamo River Outlet 10/15/12 -1 -1 -1 -1 -1 -1 -1 -1 -1 -1 -1 -1 -1 -5
45.80 32.40 27.10
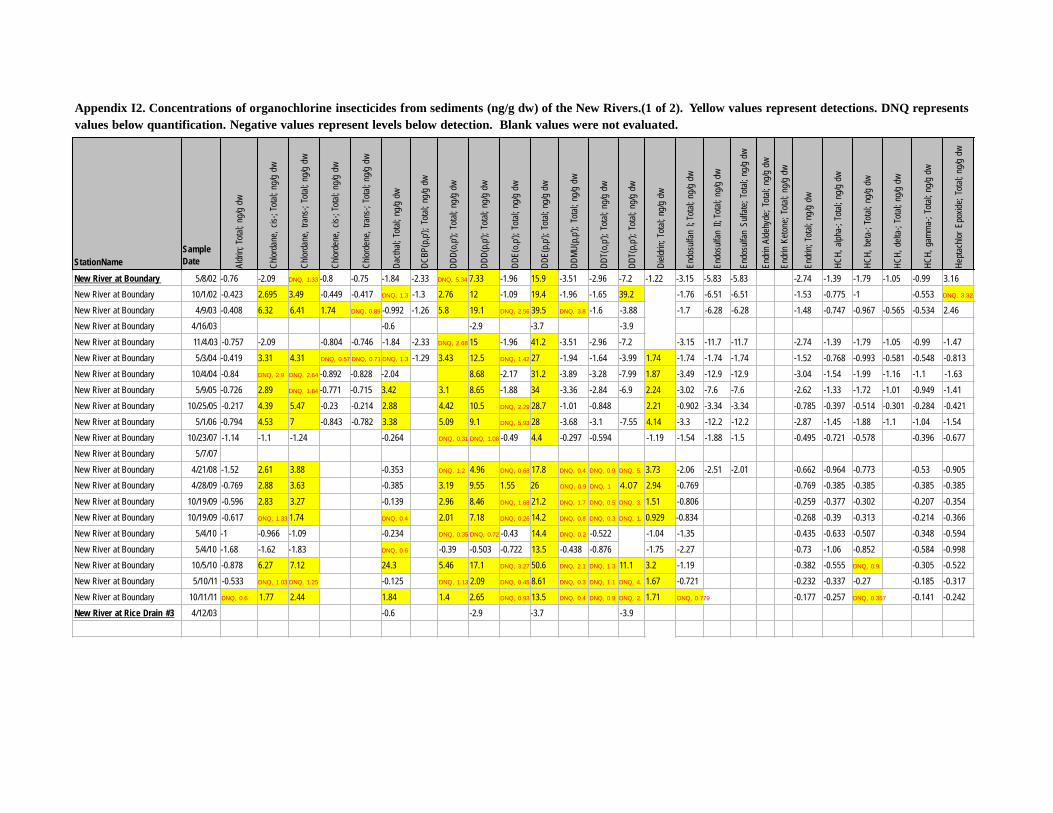
Aldr
in; T
otal;
ng/g
dw
Chlor
dane
, cis-
; Tota
l; ng
/g dw
Chlor
dane
, tra
ns-;
Total
; ng/g
dw
Chlor
dene
, cis-
; Tota
l; ng
/g dw
Chlor
dene
, tra
ns-;
Total
; ng/g
dw
Dacth
al; T
otal;
ng/g
dw
DCBP
(p,p'
); To
tal; n
g/g d
w
DDD(
o,p');
Total
; ng/g
dw
DDD(
p,p');
Total
; ng/g
dw
DDE(
o,p');
Total
; ng/g
dw
DDE(
p,p');
Total
; ng/g
dw
DDMU
(p,p'
); To
tal; n
g/g d
w
DDT(
o,p');
Total
; ng/g
dw
DDT(
p,p');
Total
; ng/g
dw
Dield
rin; T
otal;
ng/g
dw
Endo
sulfa
n I; T
otal;
ng/g
dw
Endo
sulfa
n II;
Total
; ng/g
dw
Endo
sulfa
n Su
lfate;
Tota
l; ng
/g dw
Endr
in Al
dehy
de; T
otal;
ng/g
dw
Endr
in Ke
tone;
Total
; ng/g
dw
Endr
in; T
otal;
ng/g
dw
HCH,
alph
a-; T
otal;
ng/g
dw
HCH,
beta
-; To
tal; n
g/g d
w
HCH,
delt
a-; T
otal;
ng/g
dw
HCH,
gam
ma-
; Tota
l; ng
/g dw
Hepta
chlor
Epo
xide;
Total
; ng/g
dw
Appendix I2. Concentrations of organochlorine insecticides from sediments (ng/g dw) of the New Rivers.(1 of 2). Yellow values represent detections. DNQ represents values below quantification. Negative values represent levels below detection. Blank values were not evaluated.
StationName Sample Date
New River at Boundary 5/8/02 -0.76 -2.09 DNQ, 1.33 -0.8 -0.75 -1.84 -2.33 DNQ, 5.34 7.33 -1.96 15.9 -3.51 -2.96 -7.2 -1.22 -3.15 -5.83 -5.83 -2.74 -1.39 -1.79 -1.05 -0.99 3.16 New River at Boundary 10/1/02 -0.423 2.695 3.49 -0.449 -0.417 DNQ, 1.3 -1.3 2.76 12 -1.09 19.4 -1.96 -1.65 39.2 -1.76 -6.51 -6.51 -1.53 -0.775 -1 -0.553 DNQ, 3.32
New River at Boundary 4/9/03 -0.408 6.32 6.41 1.74 DNQ, 0.89 -0.992 -1.26 5.8 19.1 DNQ, 2.56 39.5 DNQ, 3.8 -1.6 -3.88 -1.7 -6.28 -6.28 -1.48 -0.747 -0.967 -0.565 -0.534 2.46 New River at Boundary 4/16/03 -0.6 -2.9 -3.7 -3.9 New River at Boundary 11/4/03 -0.757 -2.09 -0.804 -0.746 -1.84 -2.33 DNQ, 2.68 15 -1.96 41.2 -3.51 -2.96 -7.2 -3.15 -11.7 -11.7 -2.74 -1.39 -1.79 -1.05 -0.99 -1.47 New River at Boundary 5/3/04 -0.419 3.31 4.31 DNQ, 0.57 DNQ, 0.71 DNQ, 1.3 -1.29 3.43 12.5 DNQ, 1.42 27 -1.94 -1.64 -3.99 1.74 -1.74 -1.74 -1.74 -1.52 -0.768 -0.993 -0.581 -0.548 -0.813 New River at Boundary 10/4/04 -0.84 DNQ, 2.9 DNQ, 2.64 -0.892 -0.828 -2.04 8.68 -2.17 31.2 -3.89 -3.28 -7.99 1.87 -3.49 -12.9 -12.9 -3.04 -1.54 -1.99 -1.16 -1.1 -1.63 New River at Boundary 5/9/05 -0.726 2.89 DNQ, 1.84 -0.771 -0.715 3.42 3.1 8.65 -1.88 34 -3.36 -2.84 -6.9 2.24 -3.02 -7.6 -7.6 -2.62 -1.33 -1.72 -1.01 -0.949 -1.41 New River at Boundary 10/25/05 -0.217 4.39 5.47 -0.23 -0.214 2.88 4.42 10.5 DNQ, 2.29 28.7 -1.01 -0.848 2.21 -0.902 -3.34 -3.34 -0.785 -0.397 -0.514 -0.301 -0.284 -0.421 New River at Boundary 5/1/06 -0.794 4.53 7 -0.843 -0.782 3.38 5.09 9.1 DNQ, 5.93 28 -3.68 -3.1 -7.55 4.14 -3.3 -12.2 -12.2 -2.87 -1.45 -1.88 -1.1 -1.04 -1.54 New River at Boundary 10/23/07 -1.14 -1.1 -1.24 -0.264 DNQ, 0.31 DNQ, 1.08 -0.49 4.4 -0.297 -0.594 -1.19 -1.54 -1.88 -1.5 -0.495 -0.721 -0.578 -0.396 -0.677 New River at Boundary 5/7/07 New River at Boundary 4/21/08 -1.52 2.61 3.88 -0.353 DNQ, 1.2 4.96 DNQ, 0.68 17.8 DNQ, 0.4 DNQ, 0.9 DNQ, 5. 3.73 -2.06 -2.51 -2.01 -0.662 -0.964 -0.773 -0.53 -0.905 New River at Boundary 4/28/09 -0.769 2.88 3.63 -0.385 3.19 9.55 1.55 26 DNQ, 0.9 DNQ, 1 4.07 2.94 -0.769 -0.769 -0.385 -0.385 -0.385 -0.385 New River at Boundary 10/19/09 -0.596 2.83 3.27 -0.139 2.96 8.46 DNQ, 1.68 21.2 DNQ, 1.7 DNQ, 0.5 DNQ, 3. 1.51 -0.806 -0.259 -0.377 -0.302 -0.207 -0.354 New River at Boundary 10/19/09 -0.617 DNQ, 1.33 1.74 DNQ, 0.4 2.01 7.18 DNQ, 0.26 14.2 DNQ, 0.8 DNQ, 0.3 DNQ, 1. 0.929 -0.834 -0.268 -0.39 -0.313 -0.214 -0.366 New River at Boundary 5/4/10 -1 -0.966 -1.09 -0.234 DNQ, 0.35 DNQ, 0.72 -0.43 14.4 DNQ, 0.2 -0.522 -1.04 -1.35 -0.435 -0.633 -0.507 -0.348 -0.594 New River at Boundary 5/4/10 -1.68 -1.62 -1.83 DNQ, 0.6 -0.39 -0.503 -0.722 13.5 -0.438 -0.876 -1.75 -2.27 -0.73 -1.06 -0.852 -0.584 -0.998 New River at Boundary 10/5/10 -0.878 6.27 7.12 24.3 5.46 17.1 DNQ, 3.27 50.6 DNQ, 2.1 DNQ, 1.3 11.1 3.2 -1.19 -0.382 -0.555 DNQ, 0.9 -0.305 -0.522 New River at Boundary 5/10/11 -0.533 DNQ, 1.03 DNQ, 1.25 -0.125 DNQ, 1.13 2.09 DNQ, 0.45 8.61 DNQ, 0.3 DNQ, 1.1 DNQ, 4. 1.67 -0.721 -0.232 -0.337 -0.27 -0.185 -0.317 New River at Boundary 10/11/11 DNQ, 0.6 1.77 2.44 1.84 1.4 2.65 DNQ, 0.93 13.5 DNQ, 0.4 DNQ, 0.9 DNQ, 2. 1.71 DNQ, 0.779 -0.177 -0.257 DNQ, 0.357 -0.141 -0.242 New River at Rice Drain #3 4/12/03 -0.6 -2.9 -3.7 -3.9
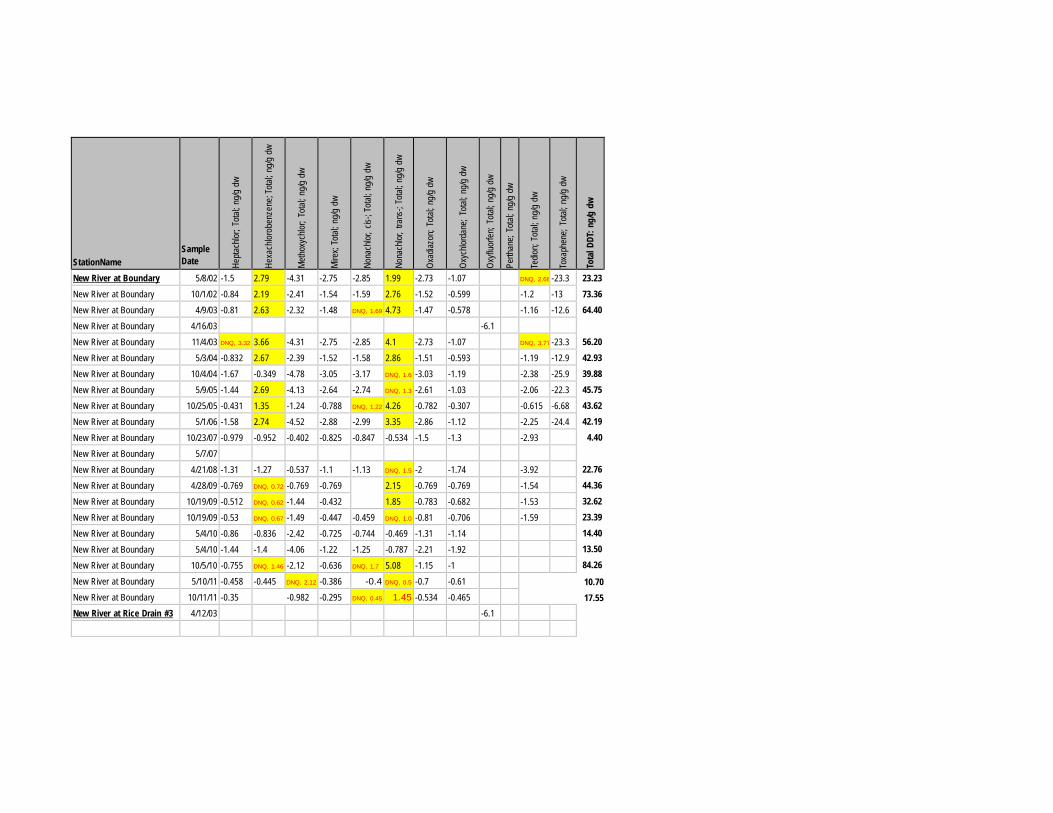
StationName
Sample Date He
ptach
lor; T
otal;
ng/g
dw
Hexa
chlor
oben
zene
; Tota
l; ng
/g dw
Metho
xych
lor; T
otal;
ng/g
dw
Mire
x; To
tal; n
g/g d
w
Nona
chlor
, cis-
; Tota
l; ng
/g dw
Nona
chlor
, tra
ns-;
Total
; ng/g
dw
Oxad
iazon
; Tota
l; ng
/g dw
Oxyc
hlord
ane;
Total
; ng/g
dw
Oxyfl
uorfe
n; To
tal; n
g/g d
w
Perth
ane;
Total
; ng/g
dw
Tedio
n; To
tal; n
g/g d
w
Toxa
phen
e; To
tal; n
g/g d
w
Tota
l DDT
: ng/
g dw
New River at Boundary 5/8/02 -1.5 2.79 -4.31 -2.75 -2.85 1.99 -2.73 -1.07 DNQ, 2.68 -23.3 23.23 73.36 64.40
56.20 42.93 39.88 45.75 43.62 42.19
4.40
22.76 44.36 32.62 23.39 14.40 13.50 84.26
New River at Boundary 10/1/02 -0.84 2.19 -2.41 -1.54 -1.59 2.76 -1.52 -0.599 -1.2 -13 New River at Boundary 4/9/03 -0.81 2.63 -2.32 -1.48 DNQ, 1.69 4.73 -1.47 -0.578 -1.16 -12.6 New River at Boundary 4/16/03 -6.1 New River at Boundary 11/4/03 DNQ, 3.32 3.66 -4.31 -2.75 -2.85 4.1 -2.73 -1.07 DNQ, 3.77 -23.3 New River at Boundary 5/3/04 -0.832 2.67 -2.39 -1.52 -1.58 2.86 -1.51 -0.593 -1.19 -12.9 New River at Boundary 10/4/04 -1.67 -0.349 -4.78 -3.05 -3.17 DNQ, 1.6 -3.03 -1.19 -2.38 -25.9 New River at Boundary 5/9/05 -1.44 2.69 -4.13 -2.64 -2.74 DNQ, 1.3 -2.61 -1.03 -2.06 -22.3 New River at Boundary 10/25/05 -0.431 1.35 -1.24 -0.788 DNQ, 1.22 4.26 -0.782 -0.307 -0.615 -6.68 New River at Boundary 5/1/06 -1.58 2.74 -4.52 -2.88 -2.99 3.35 -2.86 -1.12 -2.25 -24.4 New River at Boundary 10/23/07 -0.979 -0.952 -0.402 -0.825 -0.847 -0.534 -1.5 -1.3 -2.93 New River at Boundary 5/7/07 New River at Boundary 4/21/08 -1.31 -1.27 -0.537 -1.1 -1.13 DNQ, 1.5 -2 -1.74 -3.92 New River at Boundary 4/28/09 -0.769 DNQ, 0.72 -0.769 -0.769 2.15 -0.769 -0.769 -1.54 New River at Boundary 10/19/09 -0.512 DNQ, 0.62 -1.44 -0.432 1.85 -0.783 -0.682 -1.53 New River at Boundary 10/19/09 -0.53 DNQ, 0.67 -1.49 -0.447 -0.459 DNQ, 1.0 -0.81 -0.706 -1.59 New River at Boundary 5/4/10 -0.86 -0.836 -2.42 -0.725 -0.744 -0.469 -1.31 -1.14 New River at Boundary 5/4/10 -1.44 -1.4 -4.06 -1.22 -1.25 -0.787 -2.21 -1.92 New River at Boundary 10/5/10 -0.755 DNQ, 1.46 -2.12 -0.636 DNQ, 1.7 5.08 -1.15 -1 New River at Boundary 5/10/11 -0.458 -0.445 DNQ, 2.12 -0.386 -0.4 DNQ, 0.5 -0.7 -0.61 10.70
17.55 New River at Boundary 10/11/11 -0.35 -0.982 -0.295 DNQ, 0.45 1.45 -0.534 -0.465 New River at Rice Drain #3 4/12/03 -6.1
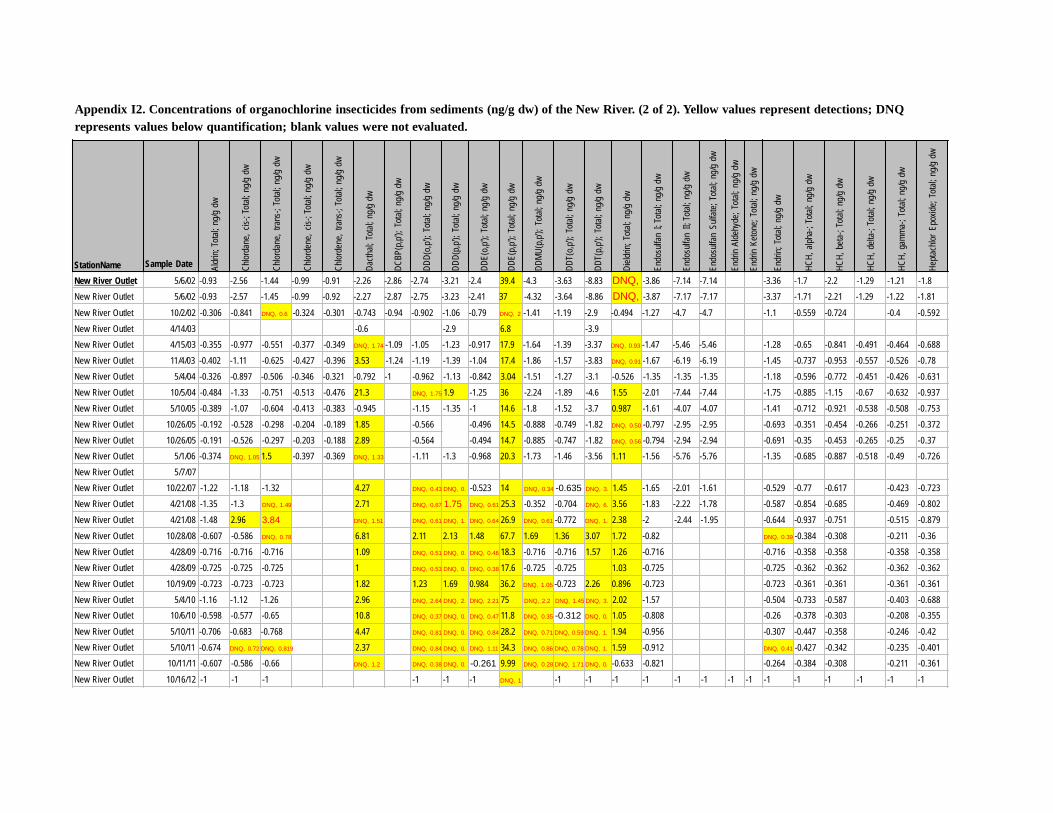
Aldr
in; T
otal;
ng/g
dw
Chlor
dane
, cis-
; Tota
l; ng
/g dw
Chlor
dane
, tra
ns-;
Total
; ng/g
dw
Chlor
dene
, cis-
; Tota
l; ng
/g dw
Chlor
dene
, tra
ns-;
Total
; ng/g
dw
Dacth
al; T
otal;
ng/g
dw
DCBP
(p,p'
); To
tal; n
g/g d
w
DDD(
o,p');
Total
; ng/g
dw
DDD(
p,p');
Total
; ng/g
dw
DDE(
o,p');
Total
; ng/g
dw
DDE(
p,p');
Total
; ng/g
dw
DDMU
(p,p'
); To
tal; n
g/g d
w
DDT(
o,p');
Total
; ng/g
dw
DDT(
p,p');
Total
; ng/g
dw
Dield
rin; T
otal;
ng/g
dw
Endo
sulfa
n I; T
otal;
ng/g
dw
Endo
sulfa
n II;
Total
; ng/g
dw
Endo
sulfa
n Su
lfate;
Tota
l; ng
/g dw
Endr
in Al
dehy
de; T
otal;
ng/g
dw
Endr
in Ke
tone;
Total
; ng/g
dw
Endr
in; T
otal;
ng/g
dw
HCH,
alph
a-; T
otal;
ng/g
dw
HCH,
beta
-; To
tal; n
g/g d
w
HCH,
delt
a-; T
otal;
ng/g
dw
HCH,
gam
ma-
; Tota
l; ng
/g dw
Hepta
chlor
Epo
xide;
Total
; ng/g
dw
Appendix I2. Concentrations of organochlorine insecticides from sediments (ng/g dw) of the New River. (2 of 2). Yellow values represent detections; DNQ represents values below quantification; blank values were not evaluated.
StationName Sample Date New River Outlet 5/6/02 -0.93 -2.56 -1.44 -0.99 -0.91 -2.26 -2.86 -2.74 -3.21 -2.4 39.4 -4.3 -3.63 -8.83 DNQ, -3.86 -7.14 -7.14 -3.36 -1.7 -2.2 -1.29 -1.21 -1.8 New River Outlet 5/6/02 -0.93 -2.57 -1.45 -0.99 -0.92 -2.27 -2.87 -2.75 -3.23 -2.41 37 -4.32 -3.64 -8.86 DNQ, -3.87 -7.17 -7.17 -3.37 -1.71 -2.21 -1.29 -1.22 -1.81
New River Outlet 10/2/02 -0.306 -0.841 DNQ, 0.6 -0.324 -0.301 -0.743 -0.94 -0.902 -1.06 -0.79 DNQ, 2 -1.41 -1.19 -2.9 -0.494 -1.27 -4.7 -4.7 -1.1 -0.559 -0.724 -0.4 -0.592 New River Outlet 4/14/03 -0.6 -2.9 6.8 -3.9 New River Outlet 4/15/03 -0.355 -0.977 -0.551 -0.377 -0.349 DNQ, 1.74 -1.09 -1.05 -1.23 -0.917 17.9 -1.64 -1.39 -3.37 DNQ, 0.93 -1.47 -5.46 -5.46 -1.28 -0.65 -0.841 -0.491 -0.464 -0.688 New River Outlet 11/4/03 -0.402 -1.11 -0.625 -0.427 -0.396 3.53 -1.24 -1.19 -1.39 -1.04 17.4 -1.86 -1.57 -3.83 DNQ, 0.91 -1.67 -6.19 -6.19 -1.45 -0.737 -0.953 -0.557 -0.526 -0.78 New River Outlet 5/4/04 -0.326 -0.897 -0.506 -0.346 -0.321 -0.792 -1 -0.962 -1.13 -0.842 3.04 -1.51 -1.27 -3.1 -0.526 -1.35 -1.35 -1.35 -1.18 -0.596 -0.772 -0.451 -0.426 -0.631 New River Outlet 10/5/04 -0.484 -1.33 -0.751 -0.513 -0.476 21.3 DNQ, 1.75 1.9 -1.25 36 -2.24 -1.89 -4.6 1.55 -2.01 -7.44 -7.44 -1.75 -0.885 -1.15 -0.67 -0.632 -0.937 New River Outlet 5/10/05 -0.389 -1.07 -0.604 -0.413 -0.383 -0.945 -1.15 -1.35 -1 14.6 -1.8 -1.52 -3.7 0.987 -1.61 -4.07 -4.07 -1.41 -0.712 -0.921 -0.538 -0.508 -0.753 New River Outlet 10/26/05 -0.192 -0.528 -0.298 -0.204 -0.189 1.85 -0.566 -0.496 14.5 -0.888 -0.749 -1.82 DNQ, 0.50 -0.797 -2.95 -2.95 -0.693 -0.351 -0.454 -0.266 -0.251 -0.372 New River Outlet 10/26/05 -0.191 -0.526 -0.297 -0.203 -0.188 2.89 -0.564 -0.494 14.7 -0.885 -0.747 -1.82 DNQ, 0.56 -0.794 -2.94 -2.94 -0.691 -0.35 -0.453 -0.265 -0.25 -0.37 New River Outlet 5/1/06 -0.374 DNQ, 1.05 1.5 -0.397 -0.369 DNQ, 1.33 -1.11 -1.3 -0.968 20.3 -1.73 -1.46 -3.56 1.11 -1.56 -5.76 -5.76 -1.35 -0.685 -0.887 -0.518 -0.49 -0.726 New River Outlet 5/7/07 New River Outlet 10/22/07 -1.22 -1.18 -1.32 4.27 DNQ, 0.43 DNQ, 0. -0.523 14 DNQ, 0.34 -0.635 DNQ, 3. 1.45 -1.65 -2.01 -1.61 -0.529 -0.77 -0.617 -0.423 -0.723 New River Outlet 4/21/08 -1.35 -1.3 DNQ, 1.49 2.71 DNQ, 0.67 1.75 DNQ, 0.61 25.3 -0.352 -0.704 DNQ, 6. 3.56 -1.83 -2.22 -1.78 -0.587 -0.854 -0.685 -0.469 -0.802 New River Outlet 4/21/08 -1.48 2.96 3.84 DNQ, 1.51 DNQ, 0.61 DNQ, 1. DNQ, 0.64 26.9 DNQ, 0.61 -0.772 DNQ, 1. 2.38 -2 -2.44 -1.95 -0.644 -0.937 -0.751 -0.515 -0.879 New River Outlet 10/28/08 -0.607 -0.586 DNQ, 0.78 6.81 2.11 2.13 1.48 67.7 1.69 1.36 3.07 1.72 -0.82 DNQ, 0.39 -0.384 -0.308 -0.211 -0.36 New River Outlet 4/28/09 -0.716 -0.716 -0.716 1.09 DNQ, 0.51 DNQ, 0. DNQ, 0.46 18.3 -0.716 -0.716 1.57 1.26 -0.716 -0.716 -0.358 -0.358 -0.358 -0.358 New River Outlet 4/28/09 -0.725 -0.725 -0.725 1 DNQ, 0.53 DNQ, 0. DNQ, 0.38 17.6 -0.725 -0.725 1.03 -0.725 -0.725 -0.362 -0.362 -0.362 -0.362 New River Outlet 10/19/09 -0.723 -0.723 -0.723 1.82 1.23 1.69 0.984 36.2 DNQ, 1.05 -0.723 2.26 0.896 -0.723 -0.723 -0.361 -0.361 -0.361 -0.361 New River Outlet 5/4/10 -1.16 -1.12 -1.26 2.96 DNQ, 2.64 DNQ, 2. DNQ, 2.21 75 DNQ, 2.2 DNQ, 1.45 DNQ, 3. 2.02 -1.57 -0.504 -0.733 -0.587 -0.403 -0.688 New River Outlet 10/6/10 -0.598 -0.577 -0.65 10.8 DNQ, 0.37 DNQ, 0. DNQ, 0.47 11.8 DNQ, 0.35 -0.312 DNQ, 0. 1.05 -0.808 -0.26 -0.378 -0.303 -0.208 -0.355 New River Outlet 5/10/11 -0.706 -0.683 -0.768 4.47 DNQ, 0.81 DNQ, 0. DNQ, 0.84 28.2 DNQ, 0.71 DNQ, 0.59 DNQ, 1. 1.94 -0.956 -0.307 -0.447 -0.358 -0.246 -0.42 New River Outlet 5/10/11 -0.674 DNQ, 0.72 DNQ, 0.819 2.37 DNQ, 0.84 DNQ, 0. DNQ, 1.11 34.3 DNQ, 0.86 DNQ, 0.78 DNQ, 1. 1.59 -0.912 DNQ, 0.41 -0.427 -0.342 -0.235 -0.401 New River Outlet 10/11/11 -0.607 -0.586 -0.66 DNQ, 1.2 DNQ, 0.38 DNQ, 0. -0.261 9.99 DNQ, 0.28 DNQ, 1.71 DNQ, 0. -0.633 -0.821 -0.264 -0.384 -0.308 -0.211 -0.361
New River Outlet 10/16/12 -1 -1 -1 -1 -1 -1 DNQ, 1 -1 -1 -1 -1 -1 -1 -1 -1 -1 -1 -1 -1 -1 -1
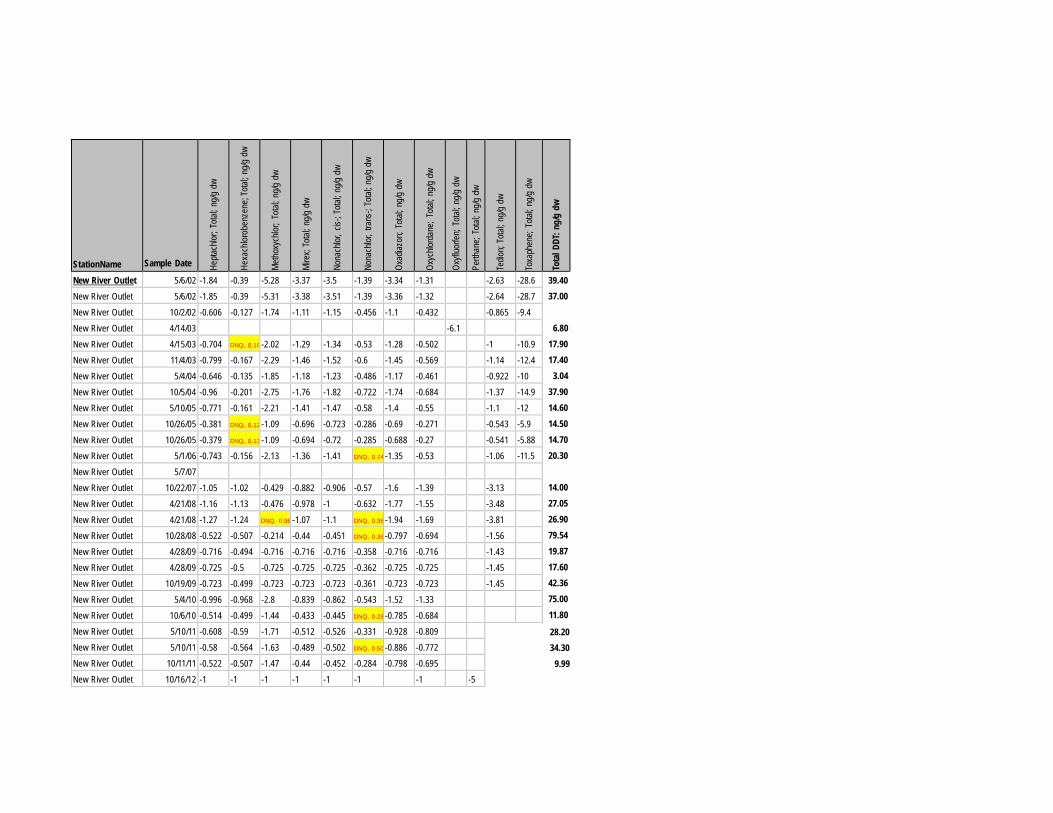
StationName
Sample Date He
ptach
lor; T
otal;
ng/g
dw
Hexa
chlor
oben
zene
; Tota
l; ng
/g dw
Metho
xych
lor; T
otal;
ng/g
dw
Mire
x; To
tal; n
g/g d
w
Nona
chlor
, cis-
; Tota
l; ng
/g dw
Nona
chlor
, tra
ns-;
Total
; ng/g
dw
Oxad
iazon
; Tota
l; ng
/g dw
Oxyc
hlord
ane;
Total
; ng/g
dw
Oxyfl
uorfe
n; To
tal; n
g/g d
w
Perth
ane;
Total
; ng/g
dw
Tedio
n; To
tal; n
g/g d
w
Toxa
phen
e; To
tal; n
g/g d
w
Tota
l DDT
: ng/
g dw
New River Outlet 5/6/02 -1.84 -0.39 -5.28 -3.37 -3.5 -1.39 -3.34 -1.31 -2.63 -28.6 39.40 37.00
6.80
17.90 17.40
3.04 37.90 14.60 14.50 14.70 20.30
14.00 27.05 26.90 79.54 19.87 17.60 42.36 75.00 11.80
New River Outlet 5/6/02 -1.85 -0.39 -5.31 -3.38 -3.51 -1.39 -3.36 -1.32 -2.64 -28.7 New River Outlet 10/2/02 -0.606 -0.127 -1.74 -1.11 -1.15 -0.456 -1.1 -0.432 -0.865 -9.4 New River Outlet 4/14/03 -6.1 New River Outlet 4/15/03 -0.704 DNQ, 0.19 -2.02 -1.29 -1.34 -0.53 -1.28 -0.502 -1 -10.9 New River Outlet 11/4/03 -0.799 -0.167 -2.29 -1.46 -1.52 -0.6 -1.45 -0.569 -1.14 -12.4 New River Outlet 5/4/04 -0.646 -0.135 -1.85 -1.18 -1.23 -0.486 -1.17 -0.461 -0.922 -10 New River Outlet 10/5/04 -0.96 -0.201 -2.75 -1.76 -1.82 -0.722 -1.74 -0.684 -1.37 -14.9 New River Outlet 5/10/05 -0.771 -0.161 -2.21 -1.41 -1.47 -0.58 -1.4 -0.55 -1.1 -12 New River Outlet 10/26/05 -0.381 DNQ, 0.12 -1.09 -0.696 -0.723 -0.286 -0.69 -0.271 -0.543 -5.9 New River Outlet 10/26/05 -0.379 DNQ, 0.13 -1.09 -0.694 -0.72 -0.285 -0.688 -0.27 -0.541 -5.88 New River Outlet 5/1/06 -0.743 -0.156 -2.13 -1.36 -1.41 DNQ, 0.74 -1.35 -0.53 -1.06 -11.5 New River Outlet 5/7/07 New River Outlet 10/22/07 -1.05 -1.02 -0.429 -0.882 -0.906 -0.57 -1.6 -1.39 -3.13 New River Outlet 4/21/08 -1.16 -1.13 -0.476 -0.978 -1 -0.632 -1.77 -1.55 -3.48 New River Outlet 4/21/08 -1.27 -1.24 DNQ, 0.96 -1.07 -1.1 DNQ, 0.98 -1.94 -1.69 -3.81 New River Outlet 10/28/08 -0.522 -0.507 -0.214 -0.44 -0.451 DNQ, 0.36 -0.797 -0.694 -1.56 New River Outlet 4/28/09 -0.716 -0.494 -0.716 -0.716 -0.716 -0.358 -0.716 -0.716 -1.43 New River Outlet 4/28/09 -0.725 -0.5 -0.725 -0.725 -0.725 -0.362 -0.725 -0.725 -1.45 New River Outlet 10/19/09 -0.723 -0.499 -0.723 -0.723 -0.723 -0.361 -0.723 -0.723 -1.45 New River Outlet 5/4/10 -0.996 -0.968 -2.8 -0.839 -0.862 -0.543 -1.52 -1.33 New River Outlet 10/6/10 -0.514 -0.499 -1.44 -0.433 -0.445 DNQ, 0.28 -0.785 -0.684 New River Outlet 5/10/11 -0.608 -0.59 -1.71 -0.512 -0.526 -0.331 -0.928 -0.809 New River Outlet 5/10/11 -0.58 -0.564 -1.63 -0.489 -0.502 DNQ, 0.50 -0.886 -0.772 New River Outlet 10/11/11 -0.522 -0.507 -1.47 -0.44 -0.452 -0.284 -0.798 -0.695 New River Outlet 10/16/12 -1 -1 -1 -1 -1 -1 -1 -5
28.20 34.30
9.99
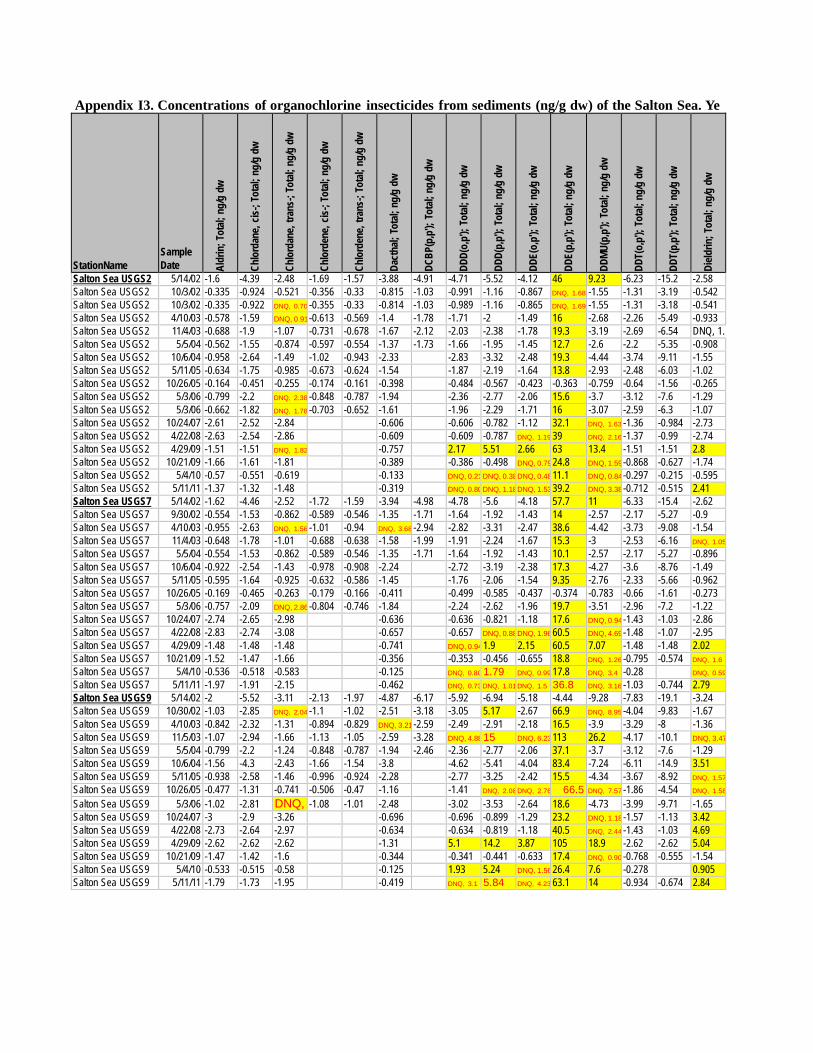
Appendix I3. Concentrations of organochlorine insecticides from sediments (ng/g dw) of the Salton Sea. Ye StationName
Sample Date Al
drin
; Tot
al; n
g/g
dw
Chlo
rdan
e, cis
-; To
tal;
ng/g
dw
Chlo
rdan
e, tra
ns-;
Tota
l; ng
/g d
w
Chlo
rden
e, cis
-; To
tal;
ng/g
dw
Chlo
rden
e, tra
ns-;
Tota
l; ng
/g d
w
Dact
hal;
Tota
l; ng
/g d
w
DCBP
(p,p
'); T
otal;
ng/
g dw
DDD(
o,p')
; Tot
al; n
g/g
dw
DDD(
p,p')
; Tot
al; n
g/g
dw
DDE(
o,p')
; Tot
al; n
g/g
dw
DDE(
p,p')
; Tot
al; n
g/g
dw
DDMU
(p,p
'); T
otal;
ng/
g dw
DDT(
o,p')
; Tot
al; n
g/g
dw
DDT(
p,p')
; Tot
al; n
g/g
dw
Dield
rin; T
otal;
ng/
g dw
Salton Sea USGS2 5/14/02 -1.6 -4.39 -2.48 -1.69 -1.57 -3.88 -4.91 -4.71 -5.52 -4.12 46 9.23 -6.23 -15.2 -2.58 Salton Sea USGS2 10/3/02 -0.335 -0.924 -0.521 -0.356 -0.33 -0.815 -1.03 -0.991 -1.16 -0.867 DNQ, 1.68 -1.55 -1.31 -3.19 -0.542 Salton Sea USGS2 10/3/02 -0.335 -0.922 DNQ, 0.70 -0.355 -0.33 -0.814 -1.03 -0.989 -1.16 -0.865 DNQ, 1.69 -1.55 -1.31 -3.18 -0.541 Salton Sea USGS2 4/10/03 -0.578 -1.59 DNQ, 0.91 -0.613 -0.569 -1.4 -1.78 -1.71 -2 -1.49 16 -2.68 -2.26 -5.49 -0.933 Salton Sea USGS2 11/4/03 -0.688 -1.9 -1.07 -0.731 -0.678 -1.67 -2.12 -2.03 -2.38 -1.78 19.3 -3.19 -2.69 -6.54 DNQ, 1. Salton Sea USGS2 5/5/04 -0.562 -1.55 -0.874 -0.597 -0.554 -1.37 -1.73 -1.66 -1.95 -1.45 12.7 -2.6 -2.2 -5.35 -0.908 Salton Sea USGS2 10/6/04 -0.958 -2.64 -1.49 -1.02 -0.943 -2.33 -2.83 -3.32 -2.48 19.3 -4.44 -3.74 -9.11 -1.55 Salton Sea USGS2 5/11/05 -0.634 -1.75 -0.985 -0.673 -0.624 -1.54 -1.87 -2.19 -1.64 13.8 -2.93 -2.48 -6.03 -1.02 Salton Sea USGS2 10/26/05 -0.164 -0.451 -0.255 -0.174 -0.161 -0.398 -0.484 -0.567 -0.423 -0.363 -0.759 -0.64 -1.56 -0.265 Salton Sea USGS2 5/3/06 -0.799 -2.2 DNQ, 2.38 -0.848 -0.787 -1.94 -2.36 -2.77 -2.06 15.6 -3.7 -3.12 -7.6 -1.29 Salton Sea USGS2 5/3/06 -0.662 -1.82 DNQ, 1.78 -0.703 -0.652 -1.61 -1.96 -2.29 -1.71 16 -3.07 -2.59 -6.3 -1.07 Salton Sea USGS2 10/24/07 -2.61 -2.52 -2.84 -0.606 -0.606 -0.782 -1.12 32.1 DNQ, 1.63 -1.36 -0.984 -2.73 Salton Sea USGS2 4/22/08 -2.63 -2.54 -2.86 -0.609 -0.609 -0.787 DNQ, 1.19 39 DNQ, 2.16 -1.37 -0.99 -2.74 Salton Sea USGS2 4/29/09 -1.51 -1.51 DNQ, 1.82 -0.757 2.17 5.51 2.66 63 13.4 -1.51 -1.51 2.8 Salton Sea USGS2 10/21/09 -1.66 -1.61 -1.81 -0.389 -0.386 -0.498 DNQ, 0.79 24.8 DNQ, 1.59 -0.868 -0.627 -1.74 Salton Sea USGS2 5/4/10 -0.57 -0.551 -0.619 -0.133 DNQ, 0.21 DNQ, 0.38 DNQ, 0.48 11.1 DNQ, 0.84 -0.297 -0.215 -0.595 Salton Sea USGS2 5/11/11 -1.37 -1.32 -1.48 -0.319 DNQ, 0.80 DNQ, 1.18 DNQ, 1.53 39.2 DNQ, 3.38 -0.712 -0.515 2.41 Salton Sea USGS7 5/14/02 -1.62 -4.46 -2.52 -1.72 -1.59 -3.94 -4.98 -4.78 -5.6 -4.18 57.7 11 -6.33 -15.4 -2.62 Salton Sea USGS7 9/30/02 -0.554 -1.53 -0.862 -0.589 -0.546 -1.35 -1.71 -1.64 -1.92 -1.43 14 -2.57 -2.17 -5.27 -0.9 Salton Sea USGS7 4/10/03 -0.955 -2.63 DNQ, 1.56 -1.01 -0.94 DNQ, 3.68 -2.94 -2.82 -3.31 -2.47 38.6 -4.42 -3.73 -9.08 -1.54 Salton Sea USGS7 11/4/03 -0.648 -1.78 -1.01 -0.688 -0.638 -1.58 -1.99 -1.91 -2.24 -1.67 15.3 -3 -2.53 -6.16 DNQ, 1.05
Salton Sea USGS7 5/5/04 -0.554 -1.53 -0.862 -0.589 -0.546 -1.35 -1.71 -1.64 -1.92 -1.43 10.1 -2.57 -2.17 -5.27 -0.896 Salton Sea USGS7 10/6/04 -0.922 -2.54 -1.43 -0.978 -0.908 -2.24 -2.72 -3.19 -2.38 17.3 -4.27 -3.6 -8.76 -1.49 Salton Sea USGS7 5/11/05 -0.595 -1.64 -0.925 -0.632 -0.586 -1.45 -1.76 -2.06 -1.54 9.35 -2.76 -2.33 -5.66 -0.962 Salton Sea USGS7 10/26/05 -0.169 -0.465 -0.263 -0.179 -0.166 -0.411 -0.499 -0.585 -0.437 -0.374 -0.783 -0.66 -1.61 -0.273 Salton Sea USGS7 5/3/06 -0.757 -2.09 DNQ, 2.86 -0.804 -0.746 -1.84 -2.24 -2.62 -1.96 19.7 -3.51 -2.96 -7.2 -1.22 Salton Sea USGS7 10/24/07 -2.74 -2.65 -2.98 -0.636 -0.636 -0.821 -1.18 17.6 DNQ, 0.94 -1.43 -1.03 -2.86 Salton Sea USGS7 4/22/08 -2.83 -2.74 -3.08 -0.657 -0.657 DNQ, 0.88 DNQ, 1.96 60.5 DNQ, 4.69 -1.48 -1.07 -2.95 Salton Sea USGS7 4/29/09 -1.48 -1.48 -1.48 -0.741 DNQ, 0.94 1.9 2.15 60.5 7.07 -1.48 -1.48 2.02 Salton Sea USGS7 10/21/09 -1.52 -1.47 -1.66 -0.356 -0.353 -0.456 -0.655 18.8 DNQ, 1.26 -0.795 -0.574 DNQ, 1.6
Salton Sea USGS7 5/4/10 -0.536 -0.518 -0.583 -0.125 DNQ, 0.80 1.79 DNQ, 0.99 17.8 DNQ, 3.4 -0.28 DNQ, 0.59
Salton Sea USGS7 5/11/11 -1.97 -1.91 -2.15 -0.462 DNQ, 0.73 DNQ, 1.01 DNQ, 1.5 36.8 DNQ, 3.16 -1.03 -0.744 2.79 Salton Sea USGS9 5/14/02 -2 -5.52 -3.11 -2.13 -1.97 -4.87 -6.17 -5.92 -6.94 -5.18 -4.44 -9.28 -7.83 -19.1 -3.24 Salton Sea USGS9 10/30/02 -1.03 -2.85 DNQ, 2.04 -1.1 -1.02 -2.51 -3.18 -3.05 5.17 -2.67 66.9 DNQ, 8.95 -4.04 -9.83 -1.67 Salton Sea USGS9 4/10/03 -0.842 -2.32 -1.31 -0.894 -0.829 DNQ, 3.21 -2.59 -2.49 -2.91 -2.18 16.5 -3.9 -3.29 -8 -1.36 Salton Sea USGS9 11/5/03 -1.07 -2.94 -1.66 -1.13 -1.05 -2.59 -3.28 DNQ, 4.88 15 DNQ, 6.23 113 26.2 -4.17 -10.1 DNQ, 3.47
Salton Sea USGS9 5/5/04 -0.799 -2.2 -1.24 -0.848 -0.787 -1.94 -2.46 -2.36 -2.77 -2.06 37.1 -3.7 -3.12 -7.6 -1.29 Salton Sea USGS9 10/6/04 -1.56 -4.3 -2.43 -1.66 -1.54 -3.8 -4.62 -5.41 -4.04 83.4 -7.24 -6.11 -14.9 3.51 Salton Sea USGS9 5/11/05 -0.938 -2.58 -1.46 -0.996 -0.924 -2.28 -2.77 -3.25 -2.42 15.5 -4.34 -3.67 -8.92 DNQ, 1.57
Salton Sea USGS9 10/26/05 -0.477 -1.31 -0.741 -0.506 -0.47 -1.16 -1.41 DNQ, 2.08 DNQ, 2.76 66.5 DNQ, 7.57 -1.86 -4.54 DNQ, 1.58
Salton Sea USGS9 5/3/06 -1.02 -2.81 DNQ, -1.08 -1.01 -2.48 -3.02 -3.53 -2.64 18.6 -4.73 -3.99 -9.71 -1.65 Salton Sea USGS9 10/24/07 -3 -2.9 -3.26 -0.696 -0.696 -0.899 -1.29 23.2 DNQ, 1.18 -1.57 -1.13 3.42 Salton Sea USGS9 4/22/08 -2.73 -2.64 -2.97 -0.634 -0.634 -0.819 -1.18 40.5 DNQ, 2.44 -1.43 -1.03 4.69 Salton Sea USGS9 4/29/09 -2.62 -2.62 -2.62 -1.31 5.1 14.2 3.87 105 18.9 -2.62 -2.62 5.04 Salton Sea USGS9 10/21/09 -1.47 -1.42 -1.6 -0.344 -0.341 -0.441 -0.633 17.4 DNQ, 0.90 -0.768 -0.555 -1.54 Salton Sea USGS9 5/4/10 -0.533 -0.515 -0.58 -0.125 1.93 5.24 DNQ, 1.56 26.4 7.6 -0.278 0.905 Salton Sea USGS9 5/11/11 -1.79 -1.73 -1.95 -0.419 DNQ, 3.1 5.84 DNQ, 4.23 63.1 14 -0.934 -0.674 2.84
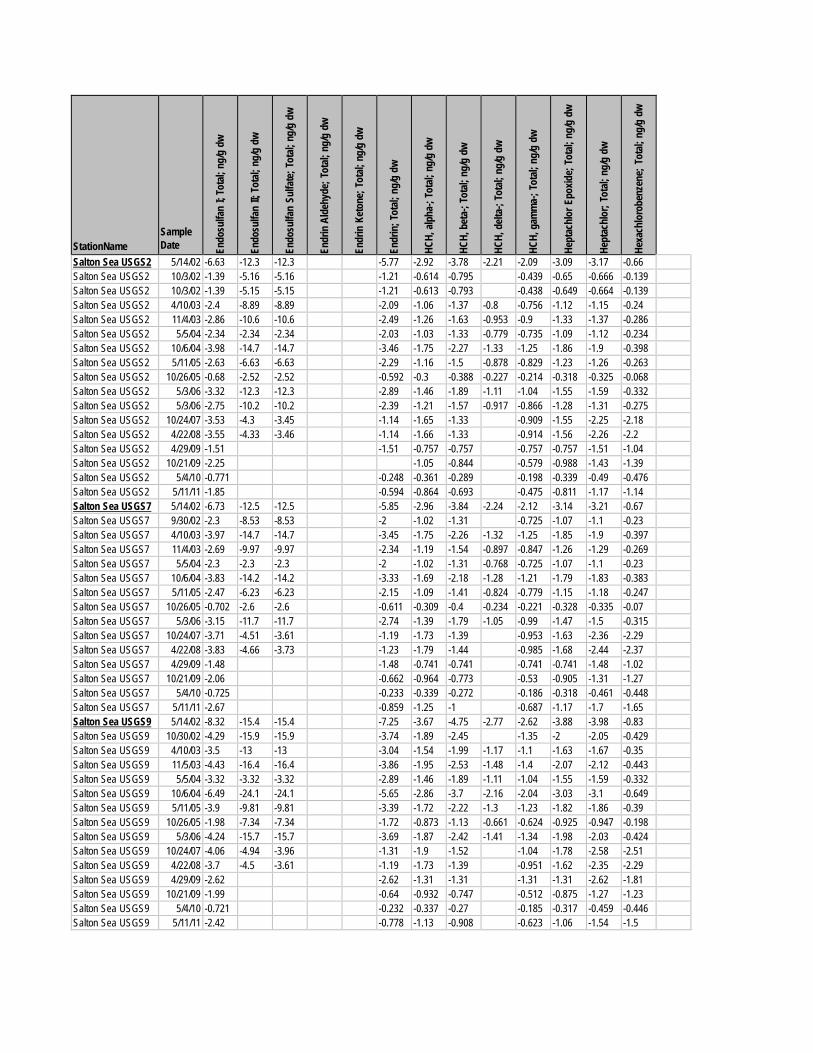
StationName
Sample Date En
dosu
lfan
I; To
tal;
ng/g
dw
Endo
sulfa
n II;
Tota
l; ng
/g d
w
Endo
sulfa
n Su
lfate
; Tot
al; n
g/g
dw
Endr
in A
ldeh
yde;
Tot
al; n
g/g
dw
Endr
in K
eton
e; T
otal;
ng/
g dw
Endr
in; T
otal;
ng/
g dw
HCH,
alp
ha-;
Tota
l; ng
/g d
w
HCH,
bet
a-; T
otal;
ng/
g dw
HCH,
delt
a-; T
otal;
ng/
g dw
HCH,
gam
ma-
; Tot
al; n
g/g
dw
Hept
achl
or E
poxid
e; T
otal;
ng/
g dw
Hept
achl
or; T
otal;
ng/
g dw
Hexa
chlo
robe
nzen
e; T
otal;
ng/
g dw
Salton Sea USGS2 5/14/02 -6.63 -12.3 -12.3 -5.77 -2.92 -3.78 -2.21 -2.09 -3.09 -3.17 -0.66 Salton Sea USGS2 10/3/02 -1.39 -5.16 -5.16 -1.21 -0.614 -0.795 -0.439 -0.65 -0.666 -0.139 Salton Sea USGS2 10/3/02 -1.39 -5.15 -5.15 -1.21 -0.613 -0.793 -0.438 -0.649 -0.664 -0.139 Salton Sea USGS2 4/10/03 -2.4 -8.89 -8.89 -2.09 -1.06 -1.37 -0.8 -0.756 -1.12 -1.15 -0.24 Salton Sea USGS2 11/4/03 -2.86 -10.6 -10.6 -2.49 -1.26 -1.63 -0.953 -0.9 -1.33 -1.37 -0.286 Salton Sea USGS2 5/5/04 -2.34 -2.34 -2.34 -2.03 -1.03 -1.33 -0.779 -0.735 -1.09 -1.12 -0.234 Salton Sea USGS2 10/6/04 -3.98 -14.7 -14.7 -3.46 -1.75 -2.27 -1.33 -1.25 -1.86 -1.9 -0.398 Salton Sea USGS2 5/11/05 -2.63 -6.63 -6.63 -2.29 -1.16 -1.5 -0.878 -0.829 -1.23 -1.26 -0.263 Salton Sea USGS2 10/26/05 -0.68 -2.52 -2.52 -0.592 -0.3 -0.388 -0.227 -0.214 -0.318 -0.325 -0.068 Salton Sea USGS2 5/3/06 -3.32 -12.3 -12.3 -2.89 -1.46 -1.89 -1.11 -1.04 -1.55 -1.59 -0.332 Salton Sea USGS2 5/3/06 -2.75 -10.2 -10.2 -2.39 -1.21 -1.57 -0.917 -0.866 -1.28 -1.31 -0.275 Salton Sea USGS2 10/24/07 -3.53 -4.3 -3.45 -1.14 -1.65 -1.33 -0.909 -1.55 -2.25 -2.18 Salton Sea USGS2 4/22/08 -3.55 -4.33 -3.46 -1.14 -1.66 -1.33 -0.914 -1.56 -2.26 -2.2 Salton Sea USGS2 4/29/09 -1.51 -1.51 -0.757 -0.757 -0.757 -0.757 -1.51 -1.04 Salton Sea USGS2 10/21/09 -2.25 -1.05 -0.844 -0.579 -0.988 -1.43 -1.39 Salton Sea USGS2 5/4/10 -0.771 -0.248 -0.361 -0.289 -0.198 -0.339 -0.49 -0.476 Salton Sea USGS2 5/11/11 -1.85 -0.594 -0.864 -0.693 -0.475 -0.811 -1.17 -1.14 Salton Sea USGS7 5/14/02 -6.73 -12.5 -12.5 -5.85 -2.96 -3.84 -2.24 -2.12 -3.14 -3.21 -0.67 Salton Sea USGS7 9/30/02 -2.3 -8.53 -8.53 -2 -1.02 -1.31 -0.725 -1.07 -1.1 -0.23 Salton Sea USGS7 4/10/03 -3.97 -14.7 -14.7 -3.45 -1.75 -2.26 -1.32 -1.25 -1.85 -1.9 -0.397 Salton Sea USGS7 11/4/03 -2.69 -9.97 -9.97 -2.34 -1.19 -1.54 -0.897 -0.847 -1.26 -1.29 -0.269 Salton Sea USGS7 5/5/04 -2.3 -2.3 -2.3 -2 -1.02 -1.31 -0.768 -0.725 -1.07 -1.1 -0.23 Salton Sea USGS7 10/6/04 -3.83 -14.2 -14.2 -3.33 -1.69 -2.18 -1.28 -1.21 -1.79 -1.83 -0.383 Salton Sea USGS7 5/11/05 -2.47 -6.23 -6.23 -2.15 -1.09 -1.41 -0.824 -0.779 -1.15 -1.18 -0.247 Salton Sea USGS7 10/26/05 -0.702 -2.6 -2.6 -0.611 -0.309 -0.4 -0.234 -0.221 -0.328 -0.335 -0.07 Salton Sea USGS7 5/3/06 -3.15 -11.7 -11.7 -2.74 -1.39 -1.79 -1.05 -0.99 -1.47 -1.5 -0.315 Salton Sea USGS7 10/24/07 -3.71 -4.51 -3.61 -1.19 -1.73 -1.39 -0.953 -1.63 -2.36 -2.29 Salton Sea USGS7 4/22/08 -3.83 -4.66 -3.73 -1.23 -1.79 -1.44 -0.985 -1.68 -2.44 -2.37 Salton Sea USGS7 4/29/09 -1.48 -1.48 -0.741 -0.741 -0.741 -0.741 -1.48 -1.02 Salton Sea USGS7 10/21/09 -2.06 -0.662 -0.964 -0.773 -0.53 -0.905 -1.31 -1.27 Salton Sea USGS7 5/4/10 -0.725 -0.233 -0.339 -0.272 -0.186 -0.318 -0.461 -0.448 Salton Sea USGS7 5/11/11 -2.67 -0.859 -1.25 -1 -0.687 -1.17 -1.7 -1.65 Salton Sea USGS9 5/14/02 -8.32 -15.4 -15.4 -7.25 -3.67 -4.75 -2.77 -2.62 -3.88 -3.98 -0.83 Salton Sea USGS9 10/30/02 -4.29 -15.9 -15.9 -3.74 -1.89 -2.45 -1.35 -2 -2.05 -0.429 Salton Sea USGS9 4/10/03 -3.5 -13 -13 -3.04 -1.54 -1.99 -1.17 -1.1 -1.63 -1.67 -0.35 Salton Sea USGS9 11/5/03 -4.43 -16.4 -16.4 -3.86 -1.95 -2.53 -1.48 -1.4 -2.07 -2.12 -0.443 Salton Sea USGS9 5/5/04 -3.32 -3.32 -3.32 -2.89 -1.46 -1.89 -1.11 -1.04 -1.55 -1.59 -0.332 Salton Sea USGS9 10/6/04 -6.49 -24.1 -24.1 -5.65 -2.86 -3.7 -2.16 -2.04 -3.03 -3.1 -0.649 Salton Sea USGS9 5/11/05 -3.9 -9.81 -9.81 -3.39 -1.72 -2.22 -1.3 -1.23 -1.82 -1.86 -0.39 Salton Sea USGS9 10/26/05 -1.98 -7.34 -7.34 -1.72 -0.873 -1.13 -0.661 -0.624 -0.925 -0.947 -0.198 Salton Sea USGS9 5/3/06 -4.24 -15.7 -15.7 -3.69 -1.87 -2.42 -1.41 -1.34 -1.98 -2.03 -0.424 Salton Sea USGS9 10/24/07 -4.06 -4.94 -3.96 -1.31 -1.9 -1.52 -1.04 -1.78 -2.58 -2.51 Salton Sea USGS9 4/22/08 -3.7 -4.5 -3.61 -1.19 -1.73 -1.39 -0.951 -1.62 -2.35 -2.29 Salton Sea USGS9 4/29/09 -2.62 -2.62 -1.31 -1.31 -1.31 -1.31 -2.62 -1.81 Salton Sea USGS9 10/21/09 -1.99 -0.64 -0.932 -0.747 -0.512 -0.875 -1.27 -1.23 Salton Sea USGS9 5/4/10 -0.721 -0.232 -0.337 -0.27 -0.185 -0.317 -0.459 -0.446 Salton Sea USGS9 5/11/11 -2.42 -0.778 -1.13 -0.908 -0.623 -1.06 -1.54 -1.5
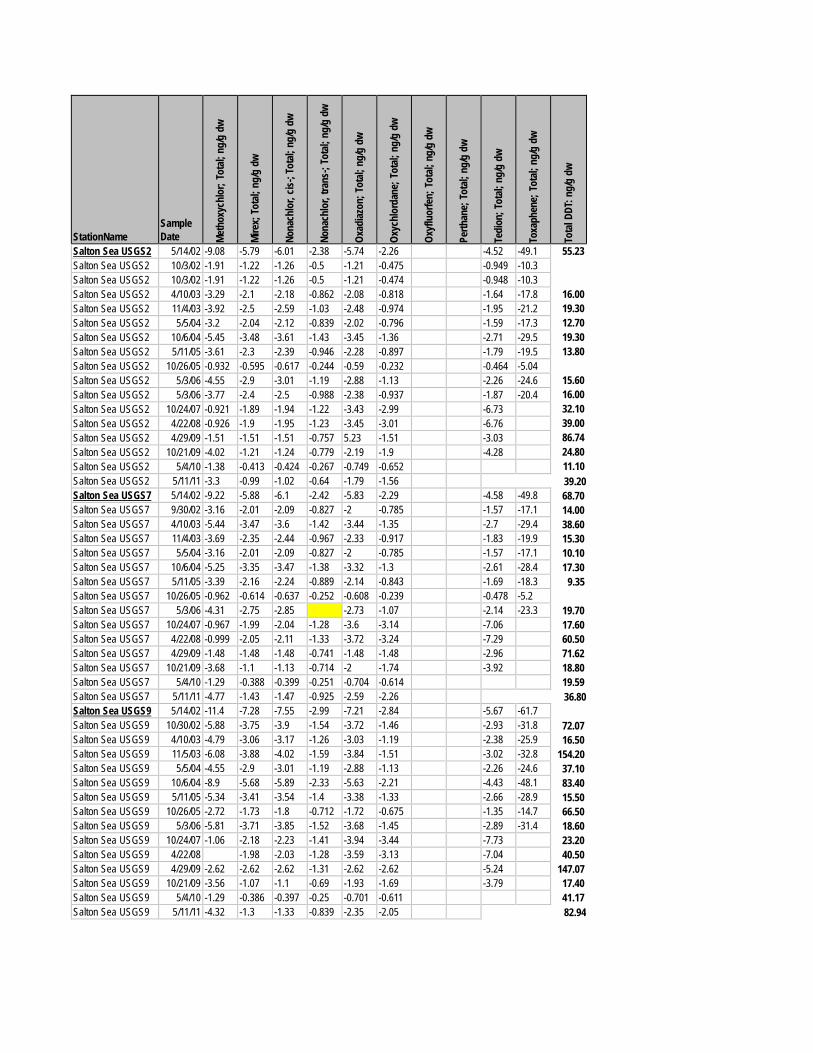
StationName
Sample Date Me
thox
ychl
or; T
otal;
ng/
g dw
Mire
x; T
otal;
ng/
g dw
Nona
chlo
r, cis
-; To
tal;
ng/g
dw
Nona
chlo
r, tra
ns-;
Tota
l; ng
/g d
w
Oxad
iazon
; Tot
al; n
g/g
dw
Oxyc
hlor
dane
; Tot
al; n
g/g
dw
Oxyf
luor
fen;
Tot
al; n
g/g
dw
Perth
ane;
Tot
al; n
g/g
dw
Tedi
on; T
otal;
ng/
g dw
Toxa
phen
e; T
otal;
ng/
g dw
Tota
l DDT
: ng/
g dw
Salton Sea USGS2 5/14/02 -9.08 -5.79 -6.01 -2.38 -5.74 -2.26 -4.52 -49.1 55.23
16.00 19.30 12.70 19.30 13.80
15.60 16.00 32.10 39.00 86.74 24.80 11.10
Salton Sea USGS2 10/3/02 -1.91 -1.22 -1.26 -0.5 -1.21 -0.475 -0.949 -10.3 Salton Sea USGS2 10/3/02 -1.91 -1.22 -1.26 -0.5 -1.21 -0.474 -0.948 -10.3 Salton Sea USGS2 4/10/03 -3.29 -2.1 -2.18 -0.862 -2.08 -0.818 -1.64 -17.8 Salton Sea USGS2 11/4/03 -3.92 -2.5 -2.59 -1.03 -2.48 -0.974 -1.95 -21.2 Salton Sea USGS2 5/5/04 -3.2 -2.04 -2.12 -0.839 -2.02 -0.796 -1.59 -17.3 Salton Sea USGS2 10/6/04 -5.45 -3.48 -3.61 -1.43 -3.45 -1.36 -2.71 -29.5 Salton Sea USGS2 5/11/05 -3.61 -2.3 -2.39 -0.946 -2.28 -0.897 -1.79 -19.5 Salton Sea USGS2 10/26/05 -0.932 -0.595 -0.617 -0.244 -0.59 -0.232 -0.464 -5.04 Salton Sea USGS2 5/3/06 -4.55 -2.9 -3.01 -1.19 -2.88 -1.13 -2.26 -24.6 Salton Sea USGS2 5/3/06 -3.77 -2.4 -2.5 -0.988 -2.38 -0.937 -1.87 -20.4 Salton Sea USGS2 10/24/07 -0.921 -1.89 -1.94 -1.22 -3.43 -2.99 -6.73 Salton Sea USGS2 4/22/08 -0.926 -1.9 -1.95 -1.23 -3.45 -3.01 -6.76 Salton Sea USGS2 4/29/09 -1.51 -1.51 -1.51 -0.757 5.23 -1.51 -3.03 Salton Sea USGS2 10/21/09 -4.02 -1.21 -1.24 -0.779 -2.19 -1.9 -4.28 Salton Sea USGS2 5/4/10 -1.38 -0.413 -0.424 -0.267 -0.749 -0.652 Salton Sea USGS2 5/11/11 -3.3 -0.99 -1.02 -0.64 -1.79 -1.56 39.20 Salton Sea USGS7 5/14/02 -9.22 -5.88 -6.1 -2.42 -5.83 -2.29 -4.58 -49.8 68.70
14.00 38.60 15.30 10.10 17.30
9.35
19.70 17.60 60.50 71.62 18.80 19.59
Salton Sea USGS7 9/30/02 -3.16 -2.01 -2.09 -0.827 -2 -0.785 -1.57 -17.1 Salton Sea USGS7 4/10/03 -5.44 -3.47 -3.6 -1.42 -3.44 -1.35 -2.7 -29.4 Salton Sea USGS7 11/4/03 -3.69 -2.35 -2.44 -0.967 -2.33 -0.917 -1.83 -19.9 Salton Sea USGS7 5/5/04 -3.16 -2.01 -2.09 -0.827 -2 -0.785 -1.57 -17.1 Salton Sea USGS7 10/6/04 -5.25 -3.35 -3.47 -1.38 -3.32 -1.3 -2.61 -28.4 Salton Sea USGS7 5/11/05 -3.39 -2.16 -2.24 -0.889 -2.14 -0.843 -1.69 -18.3 Salton Sea USGS7 10/26/05 -0.962 -0.614 -0.637 -0.252 -0.608 -0.239 -0.478 -5.2 Salton Sea USGS7 5/3/06 -4.31 -2.75 -2.85 -2.73 -1.07 -2.14 -23.3 Salton Sea USGS7 10/24/07 -0.967 -1.99 -2.04 -1.28 -3.6 -3.14 -7.06 Salton Sea USGS7 4/22/08 -0.999 -2.05 -2.11 -1.33 -3.72 -3.24 -7.29 Salton Sea USGS7 4/29/09 -1.48 -1.48 -1.48 -0.741 -1.48 -1.48 -2.96 Salton Sea USGS7 10/21/09 -3.68 -1.1 -1.13 -0.714 -2 -1.74 -3.92 Salton Sea USGS7 5/4/10 -1.29 -0.388 -0.399 -0.251 -0.704 -0.614 Salton Sea USGS7 5/11/11 -4.77 -1.43 -1.47 -0.925 -2.59 -2.26 36.80 Salton Sea USGS9 5/14/02 -11.4 -7.28 -7.55 -2.99 -7.21 -2.84 -5.67 -61.7
72.07 16.50
154.20 37.10 83.40 15.50 66.50 18.60 23.20 40.50
147.07 17.40 41.17
Salton Sea USGS9 10/30/02 -5.88 -3.75 -3.9 -1.54 -3.72 -1.46 -2.93 -31.8 Salton Sea USGS9 4/10/03 -4.79 -3.06 -3.17 -1.26 -3.03 -1.19 -2.38 -25.9 Salton Sea USGS9 11/5/03 -6.08 -3.88 -4.02 -1.59 -3.84 -1.51 -3.02 -32.8 Salton Sea USGS9 5/5/04 -4.55 -2.9 -3.01 -1.19 -2.88 -1.13 -2.26 -24.6 Salton Sea USGS9 10/6/04 -8.9 -5.68 -5.89 -2.33 -5.63 -2.21 -4.43 -48.1 Salton Sea USGS9 5/11/05 -5.34 -3.41 -3.54 -1.4 -3.38 -1.33 -2.66 -28.9 Salton Sea USGS9 10/26/05 -2.72 -1.73 -1.8 -0.712 -1.72 -0.675 -1.35 -14.7 Salton Sea USGS9 5/3/06 -5.81 -3.71 -3.85 -1.52 -3.68 -1.45 -2.89 -31.4 Salton Sea USGS9 10/24/07 -1.06 -2.18 -2.23 -1.41 -3.94 -3.44 -7.73 Salton Sea USGS9 4/22/08 -1.98 -2.03 -1.28 -3.59 -3.13 -7.04 Salton Sea USGS9 4/29/09 -2.62 -2.62 -2.62 -1.31 -2.62 -2.62 -5.24 Salton Sea USGS9 10/21/09 -3.56 -1.07 -1.1 -0.69 -1.93 -1.69 -3.79 Salton Sea USGS9 5/4/10 -1.29 -0.386 -0.397 -0.25 -0.701 -0.611 Salton Sea USGS9 5/11/11 -4.32 -1.3 -1.33 -0.839 -2.35 -2.05 82.94
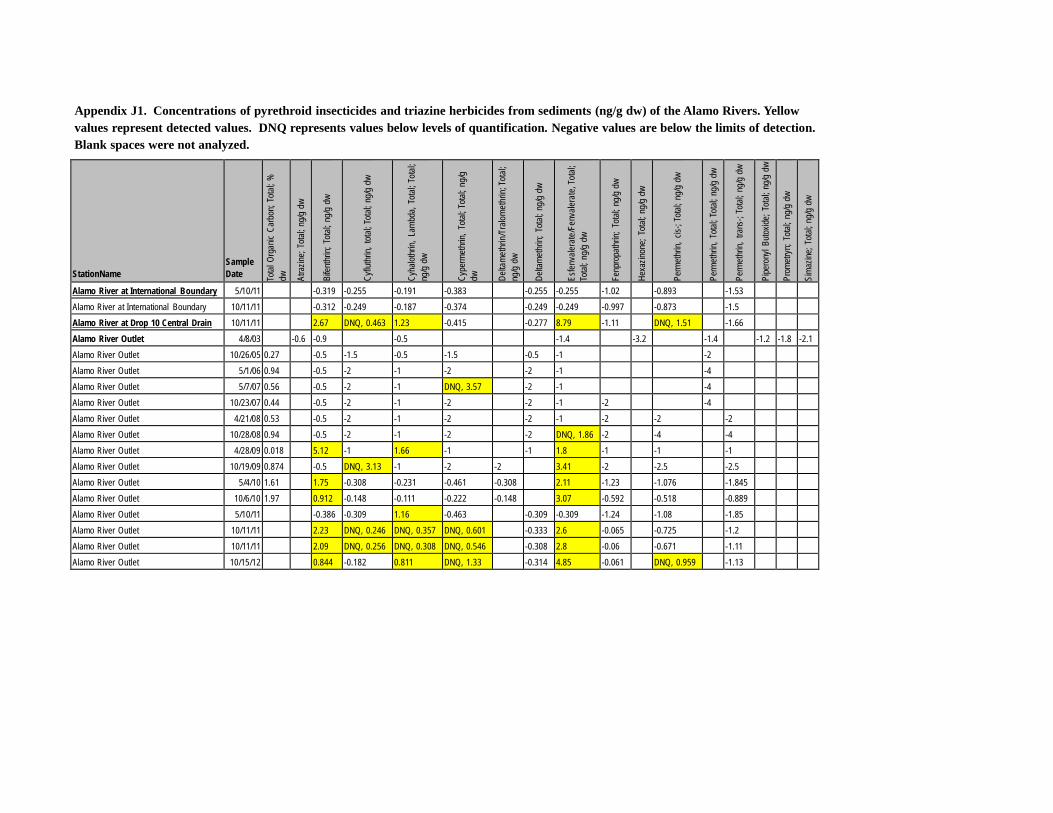
Appendix J1. Concentrations of pyrethroid insecticides and triazine herbicides from sediments (ng/g dw) of the Alamo Rivers. Yellow values represent detected values. DNQ represents values below levels of quantification. Negative values are below the limits of detection. Blank spaces were not analyzed.
StationName
Sample Date To
tal O
rgan
ic Ca
rbon
; Tota
l; %
dw
Atra
zine;
Total
; ng/g
dw
Bifen
thrin;
Tota
l; ng
/g dw
Cyflu
thrin,
total
; Tota
l; ng
/g dw
Cyha
lothr
in, L
ambd
a, To
tal; T
otal;
ng
/g dw
Cype
rmeth
rin, T
otal;
Total
; ng/
g dw
Delta
met
hrin/
Tralo
met
hrin;
Tota
l; ng
/g dw
De
ltame
thrin;
Tota
l; ng
/g dw
Esfe
nvale
rate
/Fen
valer
ate,
Total
; To
tal; n
g/g d
w
Fenp
ropa
thrin;
Tota
l; ng
/g dw
Hexa
zinon
e; To
tal; n
g/g d
w
Perm
ethrin
, cis-
; Tota
l; ng
/g dw
Perm
ethrin
, Tota
l; To
tal; n
g/g d
w Pe
rmeth
rin, t
rans
-; To
tal; n
g/g d
w
Pipe
rony
l Buto
xide;
Total
; ng/g
dw
Prom
etryn
; Tota
l; ng
/g dw
Sima
zine;
Total
; ng/g
dw
Alamo River at International Boundary 5/10/11 -0.319 -0.255 -0.191 -0.383 -0.255 -0.255 -1.02 -0.893 -1.53 Alamo River at International Boundary 10/11/11 -0.312 -0.249 -0.187 -0.374 -0.249 -0.249 -0.997 -0.873 -1.5 Alamo River at Drop 10 Central Drain 10/11/11 2.67 DNQ, 0.463 1.23 -0.415 -0.277 8.79 -1.11 DNQ, 1.51 -1.66 Alamo River Outlet 4/8/03 -0.6 -0.9 -0.5 -1.4 -3.2 -1.4 -1.2 -1.8 -2.1 Alamo River Outlet 10/26/05 0.27 -0.5 -1.5 -0.5 -1.5 -0.5 -1 -2 Alamo River Outlet 5/1/06 0.94 -0.5 -2 -1 -2 -2 -1 -4 Alamo River Outlet 5/7/07 0.56 -0.5 -2 -1 DNQ, 3.57 -2 -1 -4 Alamo River Outlet 10/23/07 0.44 -0.5 -2 -1 -2 -2 -1 -2 -4 Alamo River Outlet 4/21/08 0.53 -0.5 -2 -1 -2 -2 -1 -2 -2 -2 Alamo River Outlet 10/28/08 0.94 -0.5 -2 -1 -2 -2 DNQ, 1.86 -2 -4 -4 Alamo River Outlet 4/28/09 0.018 5.12 -1 1.66 -1 -1 1.8 -1 -1 -1 Alamo River Outlet 10/19/09 0.874 -0.5 DNQ, 3.13 -1 -2 -2 3.41 -2 -2.5 -2.5 Alamo River Outlet 5/4/10 1.61 1.75 -0.308 -0.231 -0.461 -0.308 2.11 -1.23 -1.076 -1.845 Alamo River Outlet 10/6/10 1.97 0.912 -0.148 -0.111 -0.222 -0.148 3.07 -0.592 -0.518 -0.889 Alamo River Outlet 5/10/11 -0.386 -0.309 1.16 -0.463 -0.309 -0.309 -1.24 -1.08 -1.85 Alamo River Outlet 10/11/11 2.23 DNQ, 0.246 DNQ, 0.357 DNQ, 0.601 -0.333 2.6 -0.065 -0.725 -1.2 Alamo River Outlet 10/11/11 2.09 DNQ, 0.256 DNQ, 0.308 DNQ, 0.546 -0.308 2.8 -0.06 -0.671 -1.11 Alamo River Outlet 10/15/12 0.844 -0.182 0.811 DNQ, 1.33 -0.314 4.85 -0.061 DNQ, 0.959 -1.13
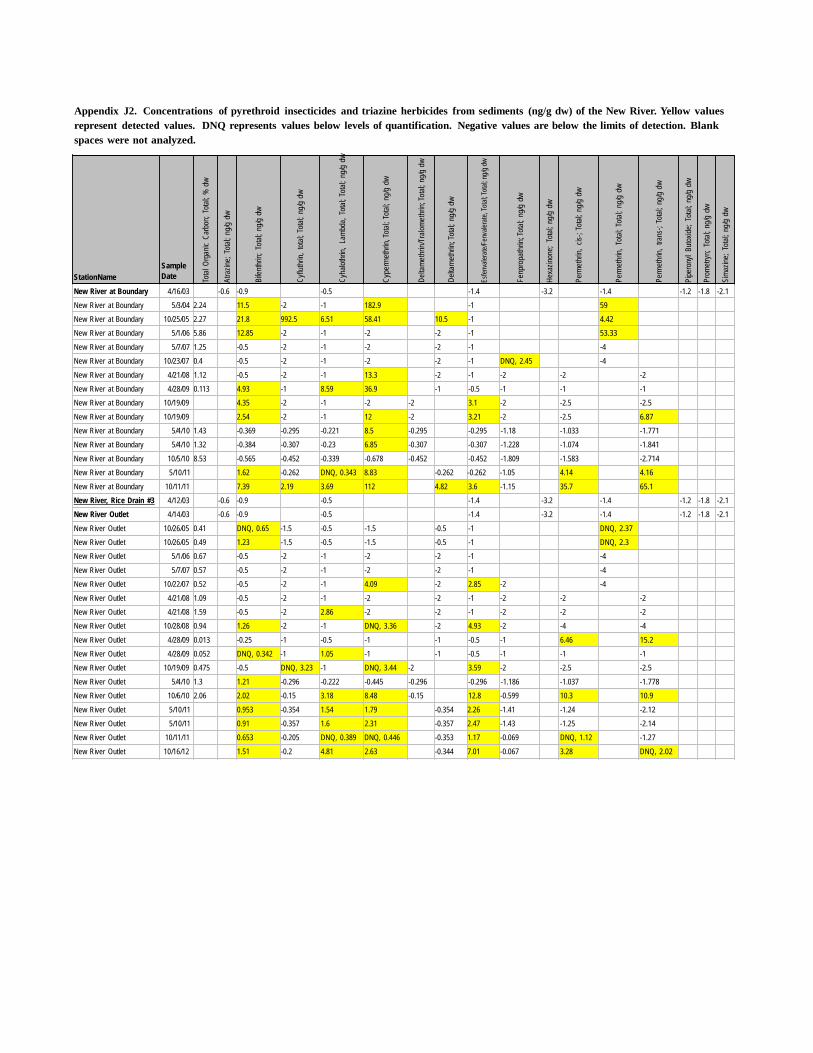
Total
Org
anic
Carb
on; T
otal;
% d
w
Atra
zine;
Total
; ng/g
dw
Bifen
thrin;
Tot
al; n
g/g d
w
Cyflu
thrin,
total
; Tota
l; ng
/g dw
Cyha
lothr
in, L
ambd
a, To
tal; T
otal;
ng/g
dw
Cype
rmet
hrin,
Total
; Tota
l; ng
/g d
w
Delta
met
hrin/
Tralo
met
hrin;
Total
; ng/g
dw
Delta
met
hrin;
Total
; ng/g
dw
Esfen
valer
ate/F
enva
lerate
, Tota
l; Tota
l; ng/g
dw
Fenp
ropa
thrin
; Tota
l; ng
/g dw
Hexa
zinon
e; To
tal; n
g/g d
w
Perm
ethrin
, cis
-; To
tal; n
g/g d
w
Perm
ethrin
, Tota
l; To
tal; n
g/g d
w
Perm
ethrin
, tra
ns-;
Total
; ng/g
dw
Pipe
rony
l Buto
xide;
Total
; ng/g
dw
Prom
etryn
; Tota
l; ng
/g d
w
Sima
zine;
Total
; ng/g
dw
Appendix J2. Concentrations of pyrethroid insecticides and triazine herbicides from sediments (ng/g dw) of the New River. Yellow values represent detected values. DNQ represents values below levels of quantification. Negative values are below the limits of detection. Blank spaces were not analyzed.
StationName Sample Date
New River at Boundary 4/16/03 -0.6 -0.9 -0.5 -1.4 -3.2 -1.4 -1.2 -1.8 -2.1 New River at Boundary 5/3/04 2.24 11.5 -2 -1 182.9 -1 59 New River at Boundary 10/25/05 2.27 21.8 992.5 6.51 58.41 10.5 -1 4.42 New River at Boundary 5/1/06 5.86 12.85 -2 -1 -2 -2 -1 53.33
New River at Boundary 5/7/07 1.25 -0.5 -2 -1 -2 -2 -1 -4 New River at Boundary 10/23/07 0.4 -0.5 -2 -1 -2 -2 -1 DNQ, 2.45 -4
New River at Boundary 4/21/08 1.12 -0.5 -2 -1 13.3 -2 -1 -2 -2 -2 New River at Boundary 4/28/09 0.113 4.93 -1 8.59 36.9 -1 -0.5 -1 -1 -1 New River at Boundary 10/19/09 4.35 -2 -1 -2 -2 3.1 -2 -2.5 -2.5
New River at Boundary 10/19/09 2.54 -2 -1 12 -2 3.21 -2 -2.5 6.87 New River at Boundary 5/4/10 1.43 -0.369 -0.295 -0.221 8.5 -0.295 -0.295 -1.18 -1.033 -1.771 New River at Boundary 5/4/10 1.32 -0.384 -0.307 -0.23 6.85 -0.307 -0.307 -1.228 -1.074 -1.841
New River at Boundary 10/5/10 8.53 -0.565 -0.452 -0.339 -0.678 -0.452 -0.452 -1.809 -1.583 -2.714 New River at Boundary 5/10/11 1.62 -0.262 DNQ, 0.343 8.83 -0.262 -0.262 -1.05 4.14 4.16
New River at Boundary 10/11/11 7.39 2.19 3.69 112 4.82 3.6 -1.15 35.7 65.1 New River, Rice Drain #3 4/12/03 -0.6 -0.9 -0.5 -1.4 -3.2 -1.4 -1.2 -1.8 -2.1 New River Outlet 4/14/03 -0.6 -0.9 -0.5 -1.4 -3.2 -1.4 -1.2 -1.8 -2.1
New River Outlet 10/26/05 0.41 DNQ, 0.65 -1.5 -0.5 -1.5 -0.5 -1 DNQ, 2.37 New River Outlet 10/26/05 0.49 1.23 -1.5 -0.5 -1.5 -0.5 -1 DNQ, 2.3 New River Outlet 5/1/06 0.67 -0.5 -2 -1 -2 -2 -1 -4
New River Outlet 5/7/07 0.57 -0.5 -2 -1 -2 -2 -1 -4 New River Outlet 10/22/07 0.52 -0.5 -2 -1 4.09 -2 2.85 -2 -4
New River Outlet 4/21/08 1.09 -0.5 -2 -1 -2 -2 -1 -2 -2 -2 New River Outlet 4/21/08 1.59 -0.5 -2 2.86 -2 -2 -1 -2 -2 -2 New River Outlet 10/28/08 0.94 1.26 -2 -1 DNQ, 3.36 -2 4.93 -2 -4 -4
New River Outlet 4/28/09 0.013 -0.25 -1 -0.5 -1 -1 -0.5 -1 6.46 15.2 New River Outlet 4/28/09 0.052 DNQ, 0.342 -1 1.05 -1 -1 -0.5 -1 -1 -1 New River Outlet 10/19/09 0.475 -0.5 DNQ, 3.23 -1 DNQ, 3.44 -2 3.59 -2 -2.5 -2.5
New River Outlet 5/4/10 1.3 1.21 -0.296 -0.222 -0.445 -0.296 -0.296 -1.186 -1.037 -1.778 New River Outlet 10/6/10 2.06 2.02 -0.15 3.18 8.48 -0.15 12.8 -0.599 10.3 10.9
New River Outlet 5/10/11 0.953 -0.354 1.54 1.79 -0.354 2.26 -1.41 -1.24 -2.12 New River Outlet 5/10/11 0.91 -0.357 1.6 2.31 -0.357 2.47 -1.43 -1.25 -2.14 New River Outlet 10/11/11 0.653 -0.205 DNQ, 0.389 DNQ, 0.446 -0.353 1.17 -0.069 DNQ, 1.12 -1.27
New River Outlet 10/16/12 1.51 -0.2 4.81 2.63 -0.344 7.01 -0.067 3.28 DNQ, 2.02
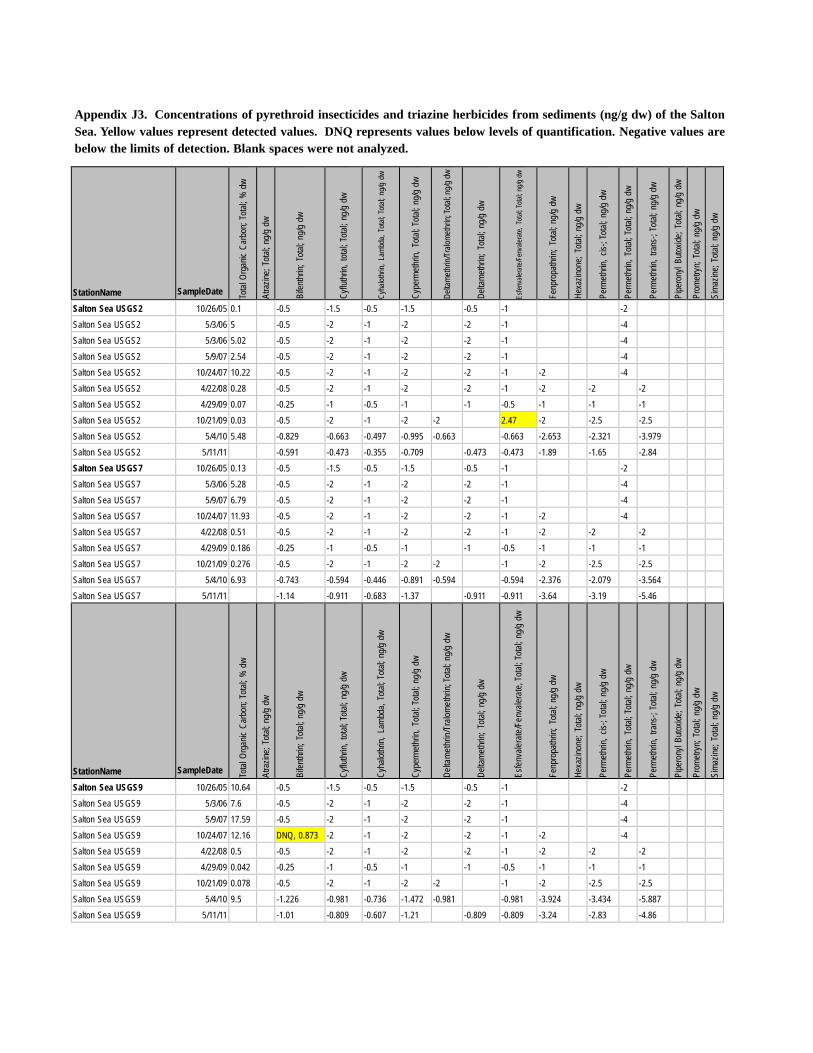
Appendix J3. Concentrations of pyrethroid insecticides and triazine herbicides from sediments (ng/g dw) of the Salton Sea. Yellow values represent detected values. DNQ represents values below levels of quantification. Negative values are below the limits of detection. Blank spaces were not analyzed.
StationName
SampleDate To
tal O
rgan
ic Ca
rbon
; Tota
l; %
dw
Atra
zine;
Total
; ng/g
dw
Bifen
thrin;
Tota
l; ng
/g dw
Cyflu
thrin,
total
; Tota
l; ng
/g dw
Cyha
lothr
in, L
ambd
a, To
tal; T
otal;
ng/g
dw
Cype
rmeth
rin, T
otal;
Total
; ng/g
dw
Delta
methr
in/Tr
alome
thrin;
Total
; ng/g
dw
Delta
methr
in; T
otal;
ng/g
dw
Esfen
valer
ate/F
enva
lerate
, Tota
l; Tota
l; ng
/g dw
Fenp
ropa
thrin;
Tota
l; ng
/g dw
Hexa
zinon
e; To
tal; n
g/g d
w Pe
rmeth
rin, c
is-; T
otal;
ng/g
dw
Perm
ethrin
, Tota
l; To
tal; n
g/g d
w Pe
rmeth
rin, t
rans
-; To
tal; n
g/g d
w
Pipe
rony
l Buto
xide;
Total
; ng/g
dw
Prom
etryn
; Tota
l; ng
/g dw
Sima
zine;
Total
; ng/g
dw
Salton Sea USGS2 10/26/05 0.1 -0.5 -1.5 -0.5 -1.5 -0.5 -1 -2 Salton Sea USGS2 5/3/06 5 -0.5 -2 -1 -2 -2 -1 -4 Salton Sea USGS2 5/3/06 5.02 -0.5 -2 -1 -2 -2 -1 -4 Salton Sea USGS2 5/9/07 2.54 -0.5 -2 -1 -2 -2 -1 -4 Salton Sea USGS2 10/24/07 10.22 -0.5 -2 -1 -2 -2 -1 -2 -4 Salton Sea USGS2 4/22/08 0.28 -0.5 -2 -1 -2 -2 -1 -2 -2 -2 Salton Sea USGS2 4/29/09 0.07 -0.25 -1 -0.5 -1 -1 -0.5 -1 -1 -1 Salton Sea USGS2 10/21/09 0.03 -0.5 -2 -1 -2 -2 2.47 -2 -2.5 -2.5 Salton Sea USGS2 5/4/10 5.48 -0.829 -0.663 -0.497 -0.995 -0.663 -0.663 -2.653 -2.321 -3.979 Salton Sea USGS2 5/11/11 -0.591 -0.473 -0.355 -0.709 -0.473 -0.473 -1.89 -1.65 -2.84 Salton Sea USGS7 10/26/05 0.13 -0.5 -1.5 -0.5 -1.5 -0.5 -1 -2 Salton Sea USGS7 5/3/06 5.28 -0.5 -2 -1 -2 -2 -1 -4 Salton Sea USGS7 5/9/07 6.79 -0.5 -2 -1 -2 -2 -1 -4 Salton Sea USGS7 10/24/07 11.93 -0.5 -2 -1 -2 -2 -1 -2 -4 Salton Sea USGS7 4/22/08 0.51 -0.5 -2 -1 -2 -2 -1 -2 -2 -2 Salton Sea USGS7 4/29/09 0.186 -0.25 -1 -0.5 -1 -1 -0.5 -1 -1 -1 Salton Sea USGS7 10/21/09 0.276 -0.5 -2 -1 -2 -2 -1 -2 -2.5 -2.5 Salton Sea USGS7 5/4/10 6.93 -0.743 -0.594 -0.446 -0.891 -0.594 -0.594 -2.376 -2.079 -3.564 Salton Sea USGS7 5/11/11 -1.14 -0.911 -0.683 -1.37 -0.911 -0.911 -3.64 -3.19 -5.46 StationName
SampleDate To
tal O
rgan
ic Ca
rbon
; Tota
l; %
dw
Atra
zine;
Total
; ng/g
dw
Bifen
thrin;
Tota
l; ng
/g dw
Cyflu
thrin,
total
; Tota
l; ng
/g dw
Cyha
lothr
in, L
ambd
a, To
tal; T
otal;
ng/g
dw
Cype
rmeth
rin, T
otal;
Total
; ng/g
dw
Delta
met
hrin/
Tralo
met
hrin;
Total
; ng/g
dw
Delta
methr
in; T
otal;
ng/g
dw
Esfe
nvale
rate
/Fen
valer
ate,
Total
; Tota
l; ng
/g dw
Fenp
ropa
thrin;
Tota
l; ng
/g dw
Hexa
zinon
e; To
tal; n
g/g d
w Pe
rmeth
rin, c
is-; T
otal;
ng/g
dw
Perm
ethrin
, Tota
l; To
tal; n
g/g d
w Pe
rmeth
rin, t
rans
-; To
tal; n
g/g d
w
Pipe
rony
l Buto
xide;
Total
; ng/g
dw
Prom
etryn
; Tota
l; ng
/g dw
Sima
zine;
Total
; ng/g
dw
Salton Sea USGS9 10/26/05 10.64 -0.5 -1.5 -0.5 -1.5 -0.5 -1 -2 Salton Sea USGS9 5/3/06 7.6 -0.5 -2 -1 -2 -2 -1 -4 Salton Sea USGS9 5/9/07 17.59 -0.5 -2 -1 -2 -2 -1 -4 Salton Sea USGS9 10/24/07 12.16 DNQ, 0.873 -2 -1 -2 -2 -1 -2 -4 Salton Sea USGS9 4/22/08 0.5 -0.5 -2 -1 -2 -2 -1 -2 -2 -2 Salton Sea USGS9 4/29/09 0.042 -0.25 -1 -0.5 -1 -1 -0.5 -1 -1 -1 Salton Sea USGS9 10/21/09 0.078 -0.5 -2 -1 -2 -2 -1 -2 -2.5 -2.5 Salton Sea USGS9 5/4/10 9.5 -1.226 -0.981 -0.736 -1.472 -0.981 -0.981 -3.924 -3.434 -5.887 Salton Sea USGS9 5/11/11 -1.01 -0.809 -0.607 -1.21 -0.809 -0.809 -3.24 -2.83 -4.86
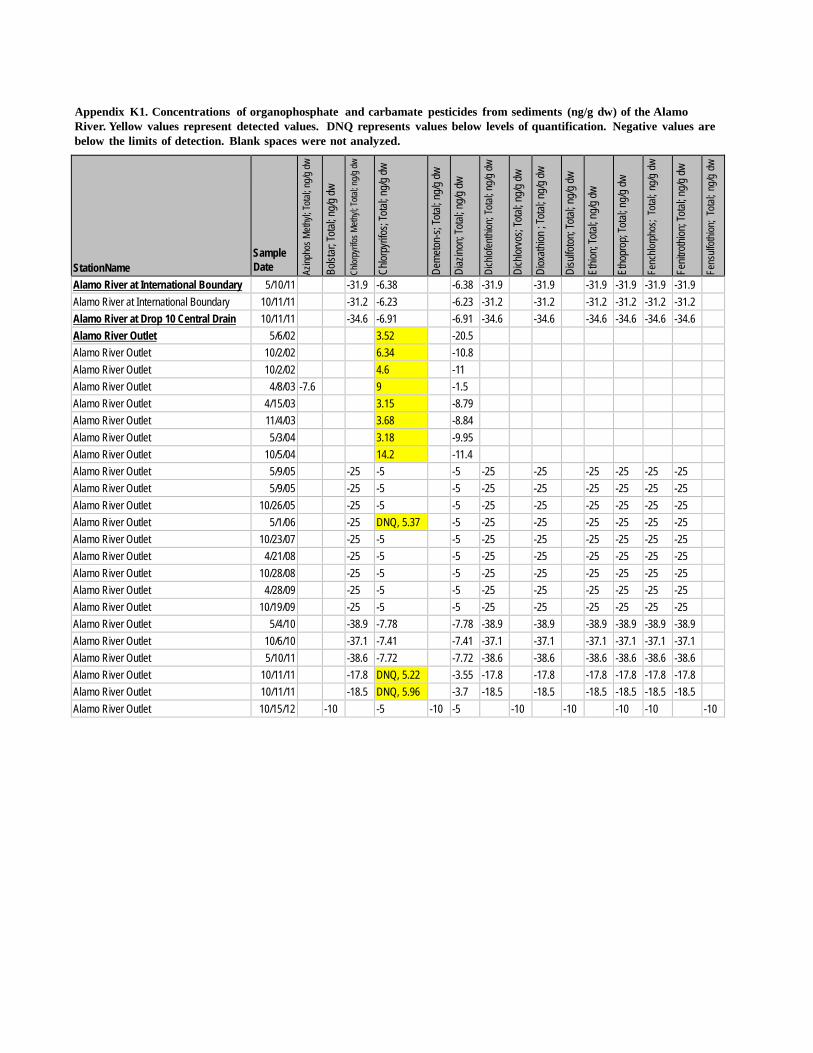
Appendix K1. Concentrations of organophosphate and carbamate pesticides from sediments (ng/g dw) of the Alamo River. Yellow values represent detected values. DNQ represents values below levels of quantification. Negative values are below the limits of detection. Blank spaces were not analyzed.
StationName
Sample Date Az
inpho
s Meth
yl; To
tal; n
g/g d
w
Bolst
ar; T
otal; n
g/g dw
Chlor
pyrifo
s Meth
yl; To
tal; n
g/g dw
Chlor
pyrifo
s; To
tal; n
g/g dw
Deme
ton-s;
Total
; ng/g
dw
Diaz
inon;
Total
; ng/g
dw
Dich
lofen
thion
; Tota
l; ng/g
dw
Dich
lorvo
s; To
tal; n
g/g dw
Diox
athion
; Tota
l; ng/g
dw
Disu
lfoton
; Tota
l; ng/g
dw
Ethio
n; To
tal; n
g/g dw
Etho
prop
; Tota
l; ng/g
dw
Fenc
hlorp
hos;
Total
; ng/g
dw
Fenit
rothi
on; T
otal; n
g/g dw
Fens
ulfoth
ion; T
otal;
ng/g
dw
Alamo River at International Boundary 5/10/11 -31.9 -6.38 -6.38 -31.9 -31.9 -31.9 -31.9 -31.9 -31.9 Alamo River at International Boundary 10/11/11 -31.2 -6.23 -6.23 -31.2 -31.2 -31.2 -31.2 -31.2 -31.2 Alamo River at Drop 10 Central Drain 10/11/11 -34.6 -6.91 -6.91 -34.6 -34.6 -34.6 -34.6 -34.6 -34.6 Alamo River Outlet 5/6/02 3.52 -20.5 Alamo River Outlet 10/2/02 6.34 -10.8 Alamo River Outlet 10/2/02 4.6 -11 Alamo River Outlet 4/8/03 -7.6 9 -1.5 Alamo River Outlet 4/15/03 3.15 -8.79 Alamo River Outlet 11/4/03 3.68 -8.84 Alamo River Outlet 5/3/04 3.18 -9.95 Alamo River Outlet 10/5/04 14.2 -11.4 Alamo River Outlet 5/9/05 -25 -5 -5 -25 -25 -25 -25 -25 -25 Alamo River Outlet 5/9/05 -25 -5 -5 -25 -25 -25 -25 -25 -25 Alamo River Outlet 10/26/05 -25 -5 -5 -25 -25 -25 -25 -25 -25 Alamo River Outlet 5/1/06 -25 DNQ, 5.37 -5 -25 -25 -25 -25 -25 -25 Alamo River Outlet 10/23/07 -25 -5 -5 -25 -25 -25 -25 -25 -25 Alamo River Outlet 4/21/08 -25 -5 -5 -25 -25 -25 -25 -25 -25 Alamo River Outlet 10/28/08 -25 -5 -5 -25 -25 -25 -25 -25 -25 Alamo River Outlet 4/28/09 -25 -5 -5 -25 -25 -25 -25 -25 -25 Alamo River Outlet 10/19/09 -25 -5 -5 -25 -25 -25 -25 -25 -25 Alamo River Outlet 5/4/10 -38.9 -7.78 -7.78 -38.9 -38.9 -38.9 -38.9 -38.9 -38.9 Alamo River Outlet 10/6/10 -37.1 -7.41 -7.41 -37.1 -37.1 -37.1 -37.1 -37.1 -37.1 Alamo River Outlet 5/10/11 -38.6 -7.72 -7.72 -38.6 -38.6 -38.6 -38.6 -38.6 -38.6 Alamo River Outlet 10/11/11 -17.8 DNQ, 5.22 -3.55 -17.8 -17.8 -17.8 -17.8 -17.8 -17.8 Alamo River Outlet 10/11/11 -18.5 DNQ, 5.96 -3.7 -18.5 -18.5 -18.5 -18.5 -18.5 -18.5 Alamo River Outlet 10/15/12 -10 -5 -10 -5 -10 -10 -10 -10 -10
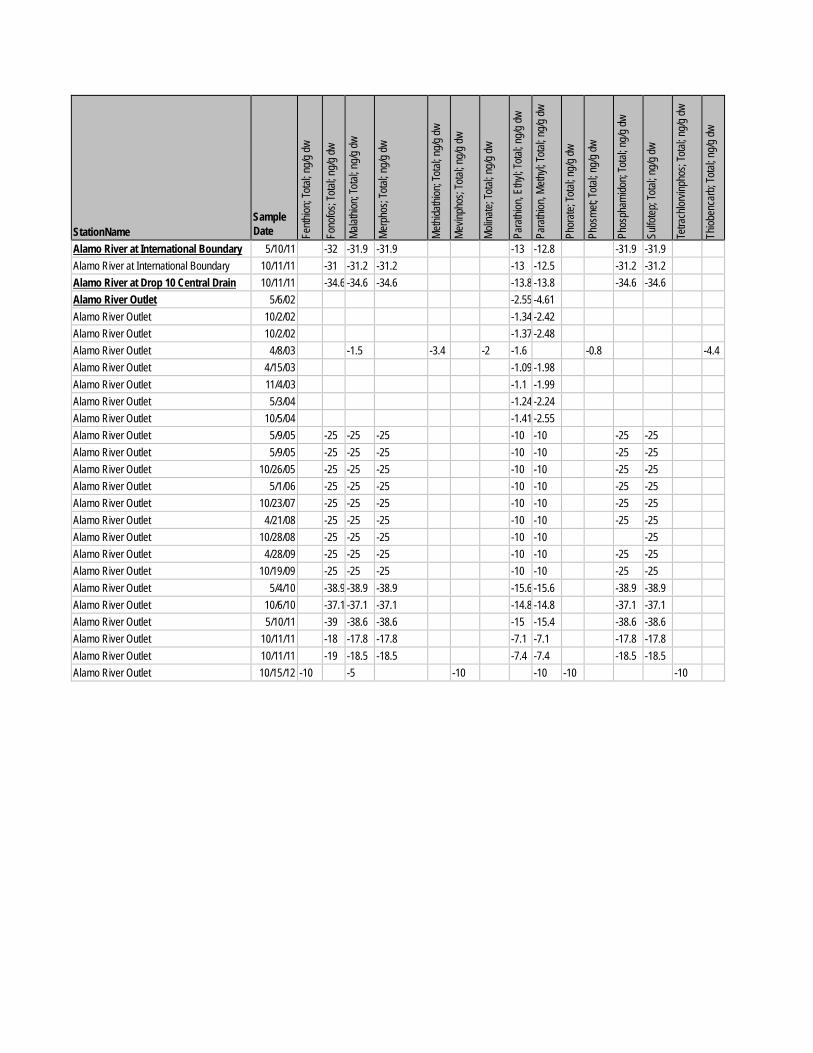
StationName
Sample Date Fe
nthion
; Tota
l; ng/g
dw
Fono
fos; T
otal; n
g/g dw
Malat
hion;
Total
; ng/g
dw
Merp
hos;
Total
; ng/g
dw
Methi
dathi
on; T
otal; n
g/g dw
Mevin
phos
; Tota
l; ng/g
dw
Molin
ate; T
otal; n
g/g dw
Para
thion
, Ethy
l; Tota
l; ng/g
dw
Para
thion
, Meth
yl; To
tal; n
g/g dw
Phor
ate; T
otal; n
g/g dw
Phos
met; T
otal; n
g/g dw
Phos
pham
idon;
Total
; ng/g
dw
Sulfo
tep; T
otal; n
g/g dw
Tetra
chlor
vinph
os; T
otal; n
g/g dw
Thiob
enca
rb; T
otal; n
g/g dw
Alamo River at International Boundary 5/10/11 -32 -31.9 -31.9 -13 -12.8 -31.9 -31.9 Alamo River at International Boundary 10/11/11 -31 -31.2 -31.2 -13 -12.5 -31.2 -31.2 Alamo River at Drop 10 Central Drain 10/11/11 -34.6 -34.6 -34.6 -13.8 -13.8 -34.6 -34.6 Alamo River Outlet 5/6/02 -2.55 -4.61 Alamo River Outlet 10/2/02 -1.34 -2.42 Alamo River Outlet 10/2/02 -1.37 -2.48 Alamo River Outlet 4/8/03 -1.5 -3.4 -2 -1.6 -0.8 -4.4 Alamo River Outlet 4/15/03 -1.09 -1.98 Alamo River Outlet 11/4/03 -1.1 -1.99 Alamo River Outlet 5/3/04 -1.24 -2.24 Alamo River Outlet 10/5/04 -1.41 -2.55 Alamo River Outlet 5/9/05 -25 -25 -25 -10 -10 -25 -25 Alamo River Outlet 5/9/05 -25 -25 -25 -10 -10 -25 -25 Alamo River Outlet 10/26/05 -25 -25 -25 -10 -10 -25 -25 Alamo River Outlet 5/1/06 -25 -25 -25 -10 -10 -25 -25 Alamo River Outlet 10/23/07 -25 -25 -25 -10 -10 -25 -25 Alamo River Outlet 4/21/08 -25 -25 -25 -10 -10 -25 -25 Alamo River Outlet 10/28/08 -25 -25 -25 -10 -10 -25 Alamo River Outlet 4/28/09 -25 -25 -25 -10 -10 -25 -25 Alamo River Outlet 10/19/09 -25 -25 -25 -10 -10 -25 -25 Alamo River Outlet 5/4/10 -38.9 -38.9 -38.9 -15.6 -15.6 -38.9 -38.9 Alamo River Outlet 10/6/10 -37.1 -37.1 -37.1 -14.8 -14.8 -37.1 -37.1 Alamo River Outlet 5/10/11 -39 -38.6 -38.6 -15 -15.4 -38.6 -38.6 Alamo River Outlet 10/11/11 -18 -17.8 -17.8 -7.1 -7.1 -17.8 -17.8 Alamo River Outlet 10/11/11 -19 -18.5 -18.5 -7.4 -7.4 -18.5 -18.5 Alamo River Outlet 10/15/12 -10 -5 -10 -10 -10 -10
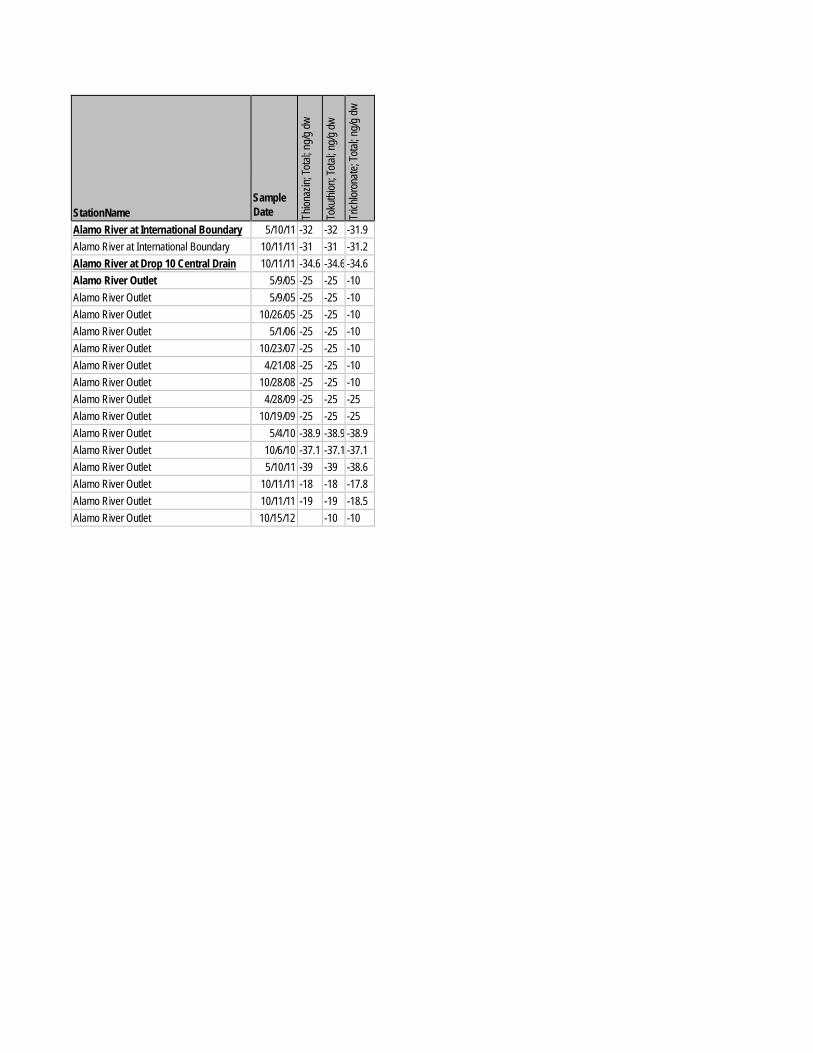
StationName
Sample Date Th
ionaz
in; To
tal; n
g/g dw
Toku
thion
; Tota
l; ng/g
dw
Trich
loron
ate; T
otal; n
g/g dw
Alamo River at International Boundary 5/10/11 -32 -32 -31.9 Alamo River at International Boundary 10/11/11 -31 -31 -31.2 Alamo River at Drop 10 Central Drain 10/11/11 -34.6 -34.6 -34.6 Alamo River Outlet 5/9/05 -25 -25 -10 Alamo River Outlet 5/9/05 -25 -25 -10 Alamo River Outlet 10/26/05 -25 -25 -10 Alamo River Outlet 5/1/06 -25 -25 -10 Alamo River Outlet 10/23/07 -25 -25 -10 Alamo River Outlet 4/21/08 -25 -25 -10 Alamo River Outlet 10/28/08 -25 -25 -10 Alamo River Outlet 4/28/09 -25 -25 -25 Alamo River Outlet 10/19/09 -25 -25 -25 Alamo River Outlet 5/4/10 -38.9 -38.9 -38.9 Alamo River Outlet 10/6/10 -37.1 -37.1 -37.1 Alamo River Outlet 5/10/11 -39 -39 -38.6 Alamo River Outlet 10/11/11 -18 -18 -17.8 Alamo River Outlet 10/11/11 -19 -19 -18.5 Alamo River Outlet 10/15/12 -10 -10
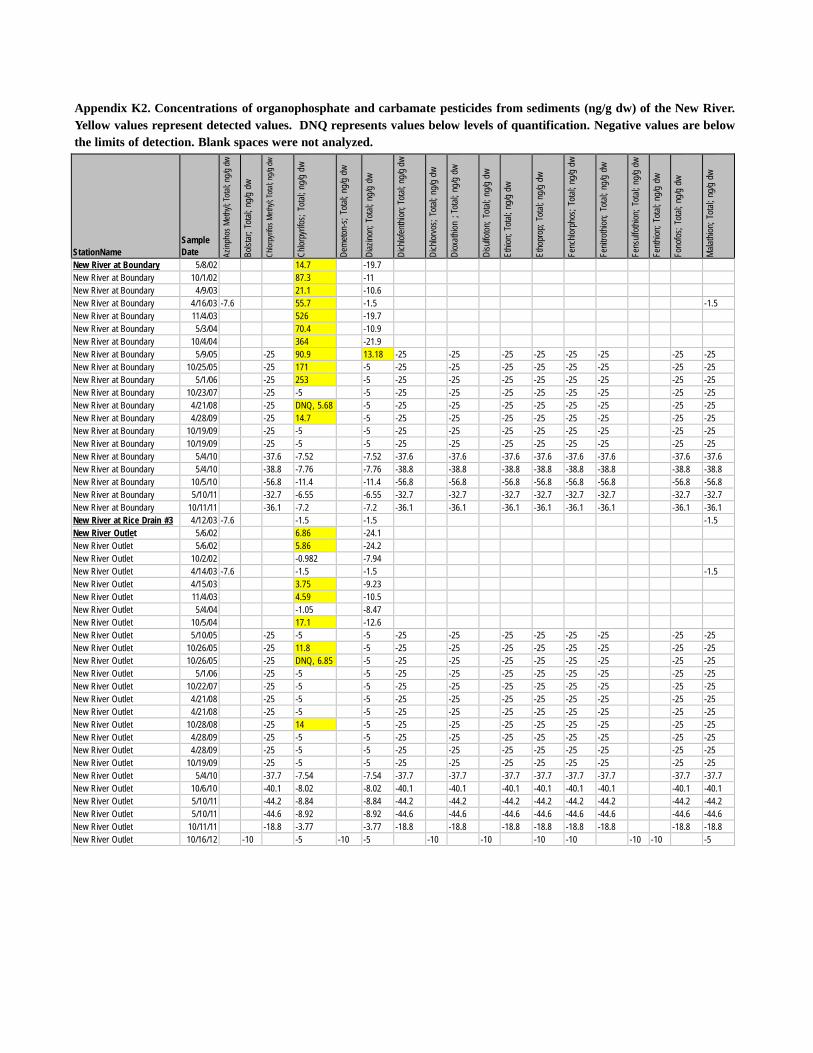
Appendix K2. Concentrations of organophosphate and carbamate pesticides from sediments (ng/g dw) of the New River. Yellow values represent detected values. DNQ represents values below levels of quantification. Negative values are below the limits of detection. Blank spaces were not analyzed.
StationName
Sample Date Az
inpho
s Meth
yl; To
tal; n
g/g d
w
Bolst
ar; T
otal;
ng/g
dw
Chlor
pyrifo
s Meth
yl; To
tal; n
g/g dw
Chlor
pyrifo
s; To
tal; n
g/g d
w
Dem
eton-
s; To
tal; n
g/g d
w
Diaz
inon;
Total
; ng/g
dw
Dich
lofen
thion
; Tota
l; ng/g
dw
Dich
lorvo
s; To
tal; n
g/g d
w
Diox
athion
; To
tal; n
g/g d
w
Disu
lfoton
; Tota
l; ng
/g dw
Ethio
n; To
tal; n
g/g d
w
Etho
prop
; Tota
l; ng
/g dw
Fenc
hlorp
hos;
Total
; ng/g
dw
Fenit
rothi
on; T
otal;
ng/g
dw
Fens
ulfoth
ion; T
otal;
ng/g
dw
Fenth
ion; T
otal;
ng/g
dw
Fono
fos; T
otal;
ng/g
dw
Malat
hion;
Total
; ng/g
dw
New River at Boundary 5/8/02 14.7 -19.7 New River at Boundary 10/1/02 87.3 -11 New River at Boundary 4/9/03 21.1 -10.6 New River at Boundary 4/16/03 -7.6 55.7 -1.5 -1.5 New River at Boundary 11/4/03 526 -19.7 New River at Boundary 5/3/04 70.4 -10.9 New River at Boundary 10/4/04 364 -21.9 New River at Boundary 5/9/05 -25 90.9 13.18 -25 -25 -25 -25 -25 -25 -25 -25 New River at Boundary 10/25/05 -25 171 -5 -25 -25 -25 -25 -25 -25 -25 -25 New River at Boundary 5/1/06 -25 253 -5 -25 -25 -25 -25 -25 -25 -25 -25 New River at Boundary 10/23/07 -25 -5 -5 -25 -25 -25 -25 -25 -25 -25 -25 New River at Boundary 4/21/08 -25 DNQ, 5.68 -5 -25 -25 -25 -25 -25 -25 -25 -25 New River at Boundary 4/28/09 -25 14.7 -5 -25 -25 -25 -25 -25 -25 -25 -25 New River at Boundary 10/19/09 -25 -5 -5 -25 -25 -25 -25 -25 -25 -25 -25 New River at Boundary 10/19/09 -25 -5 -5 -25 -25 -25 -25 -25 -25 -25 -25 New River at Boundary 5/4/10 -37.6 -7.52 -7.52 -37.6 -37.6 -37.6 -37.6 -37.6 -37.6 -37.6 -37.6 New River at Boundary 5/4/10 -38.8 -7.76 -7.76 -38.8 -38.8 -38.8 -38.8 -38.8 -38.8 -38.8 -38.8 New River at Boundary 10/5/10 -56.8 -11.4 -11.4 -56.8 -56.8 -56.8 -56.8 -56.8 -56.8 -56.8 -56.8 New River at Boundary 5/10/11 -32.7 -6.55 -6.55 -32.7 -32.7 -32.7 -32.7 -32.7 -32.7 -32.7 -32.7 New River at Boundary 10/11/11 -36.1 -7.2 -7.2 -36.1 -36.1 -36.1 -36.1 -36.1 -36.1 -36.1 -36.1 New River at Rice Drain #3 4/12/03 -7.6 -1.5 -1.5 -1.5 New River Outlet 5/6/02 6.86 -24.1 New River Outlet 5/6/02 5.86 -24.2 New River Outlet 10/2/02 -0.982 -7.94 New River Outlet 4/14/03 -7.6 -1.5 -1.5 -1.5 New River Outlet 4/15/03 3.75 -9.23 New River Outlet 11/4/03 4.59 -10.5 New River Outlet 5/4/04 -1.05 -8.47 New River Outlet 10/5/04 17.1 -12.6 New River Outlet 5/10/05 -25 -5 -5 -25 -25 -25 -25 -25 -25 -25 -25 New River Outlet 10/26/05 -25 11.8 -5 -25 -25 -25 -25 -25 -25 -25 -25 New River Outlet 10/26/05 -25 DNQ, 6.85 -5 -25 -25 -25 -25 -25 -25 -25 -25 New River Outlet 5/1/06 -25 -5 -5 -25 -25 -25 -25 -25 -25 -25 -25 New River Outlet 10/22/07 -25 -5 -5 -25 -25 -25 -25 -25 -25 -25 -25 New River Outlet 4/21/08 -25 -5 -5 -25 -25 -25 -25 -25 -25 -25 -25 New River Outlet 4/21/08 -25 -5 -5 -25 -25 -25 -25 -25 -25 -25 -25 New River Outlet 10/28/08 -25 14 -5 -25 -25 -25 -25 -25 -25 -25 -25 New River Outlet 4/28/09 -25 -5 -5 -25 -25 -25 -25 -25 -25 -25 -25 New River Outlet 4/28/09 -25 -5 -5 -25 -25 -25 -25 -25 -25 -25 -25 New River Outlet 10/19/09 -25 -5 -5 -25 -25 -25 -25 -25 -25 -25 -25 New River Outlet 5/4/10 -37.7 -7.54 -7.54 -37.7 -37.7 -37.7 -37.7 -37.7 -37.7 -37.7 -37.7 New River Outlet 10/6/10 -40.1 -8.02 -8.02 -40.1 -40.1 -40.1 -40.1 -40.1 -40.1 -40.1 -40.1 New River Outlet 5/10/11 -44.2 -8.84 -8.84 -44.2 -44.2 -44.2 -44.2 -44.2 -44.2 -44.2 -44.2 New River Outlet 5/10/11 -44.6 -8.92 -8.92 -44.6 -44.6 -44.6 -44.6 -44.6 -44.6 -44.6 -44.6 New River Outlet 10/11/11 -18.8 -3.77 -3.77 -18.8 -18.8 -18.8 -18.8 -18.8 -18.8 -18.8 -18.8 New River Outlet 10/16/12 -10 -5 -10 -5 -10 -10 -10 -10 -10 -10 -5
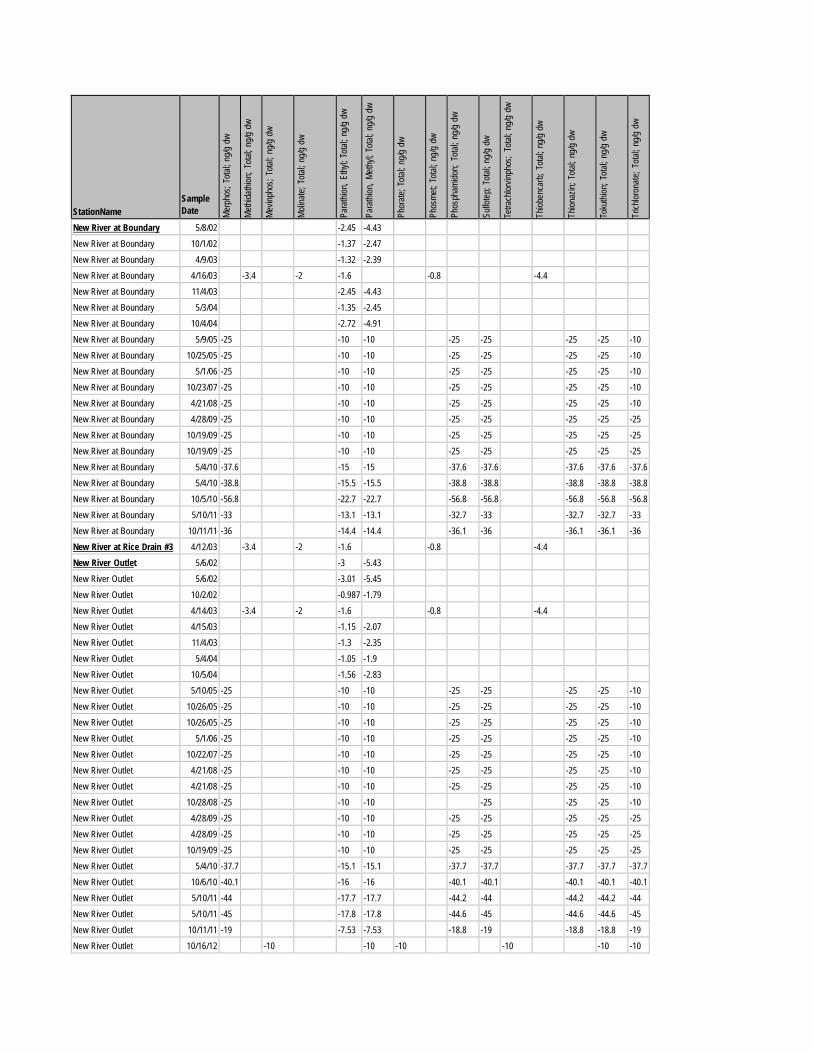
StationName
Sample Date Me
rpho
s; To
tal; n
g/g d
w
Methi
dathi
on; T
otal;
ng/g
dw
Mevin
phos
; Tota
l; ng
/g dw
Molin
ate; T
otal;
ng/g
dw
Para
thion
, Ethy
l; To
tal; n
g/g d
w
Para
thion
, Meth
yl; T
otal;
ng/g
dw
Phor
ate; T
otal;
ng/g
dw
Phos
met;
Total
; ng/g
dw
Phos
pham
idon;
Total
; ng/g
dw
Sulfo
tep;
Total
; ng/g
dw
Tetra
chlor
vinph
os;
Total
; ng/g
dw
Thiob
enca
rb; T
otal;
ng/g
dw
Thion
azin;
Tota
l; ng
/g d
w
Toku
thion
; Tota
l; ng
/g dw
Trich
loron
ate; T
otal;
ng/g
dw
New River at Boundary 5/8/02 -2.45 -4.43 New River at Boundary 10/1/02 -1.37 -2.47 New River at Boundary 4/9/03 -1.32 -2.39 New River at Boundary 4/16/03 -3.4 -2 -1.6 -0.8 -4.4 New River at Boundary 11/4/03 -2.45 -4.43 New River at Boundary 5/3/04 -1.35 -2.45 New River at Boundary 10/4/04 -2.72 -4.91 New River at Boundary 5/9/05 -25 -10 -10 -25 -25 -25 -25 -10 New River at Boundary 10/25/05 -25 -10 -10 -25 -25 -25 -25 -10 New River at Boundary 5/1/06 -25 -10 -10 -25 -25 -25 -25 -10 New River at Boundary 10/23/07 -25 -10 -10 -25 -25 -25 -25 -10 New River at Boundary 4/21/08 -25 -10 -10 -25 -25 -25 -25 -10 New River at Boundary 4/28/09 -25 -10 -10 -25 -25 -25 -25 -25 New River at Boundary 10/19/09 -25 -10 -10 -25 -25 -25 -25 -25 New River at Boundary 10/19/09 -25 -10 -10 -25 -25 -25 -25 -25 New River at Boundary 5/4/10 -37.6 -15 -15 -37.6 -37.6 -37.6 -37.6 -37.6 New River at Boundary 5/4/10 -38.8 -15.5 -15.5 -38.8 -38.8 -38.8 -38.8 -38.8 New River at Boundary 10/5/10 -56.8 -22.7 -22.7 -56.8 -56.8 -56.8 -56.8 -56.8 New River at Boundary 5/10/11 -33 -13.1 -13.1 -32.7 -33 -32.7 -32.7 -33 New River at Boundary 10/11/11 -36 -14.4 -14.4 -36.1 -36 -36.1 -36.1 -36 New River at Rice Drain #3 4/12/03 -3.4 -2 -1.6 -0.8 -4.4 New River Outlet 5/6/02 -3 -5.43 New River Outlet 5/6/02 -3.01 -5.45 New River Outlet 10/2/02 -0.987 -1.79 New River Outlet 4/14/03 -3.4 -2 -1.6 -0.8 -4.4 New River Outlet 4/15/03 -1.15 -2.07 New River Outlet 11/4/03 -1.3 -2.35 New River Outlet 5/4/04 -1.05 -1.9 New River Outlet 10/5/04 -1.56 -2.83 New River Outlet 5/10/05 -25 -10 -10 -25 -25 -25 -25 -10 New River Outlet 10/26/05 -25 -10 -10 -25 -25 -25 -25 -10 New River Outlet 10/26/05 -25 -10 -10 -25 -25 -25 -25 -10 New River Outlet 5/1/06 -25 -10 -10 -25 -25 -25 -25 -10 New River Outlet 10/22/07 -25 -10 -10 -25 -25 -25 -25 -10 New River Outlet 4/21/08 -25 -10 -10 -25 -25 -25 -25 -10 New River Outlet 4/21/08 -25 -10 -10 -25 -25 -25 -25 -10 New River Outlet 10/28/08 -25 -10 -10 -25 -25 -25 -10 New River Outlet 4/28/09 -25 -10 -10 -25 -25 -25 -25 -25 New River Outlet 4/28/09 -25 -10 -10 -25 -25 -25 -25 -25 New River Outlet 10/19/09 -25 -10 -10 -25 -25 -25 -25 -25 New River Outlet 5/4/10 -37.7 -15.1 -15.1 -37.7 -37.7 -37.7 -37.7 -37.7 New River Outlet 10/6/10 -40.1 -16 -16 -40.1 -40.1 -40.1 -40.1 -40.1 New River Outlet 5/10/11 -44 -17.7 -17.7 -44.2 -44 -44.2 -44.2 -44 New River Outlet 5/10/11 -45 -17.8 -17.8 -44.6 -45 -44.6 -44.6 -45 New River Outlet 10/11/11 -19 -7.53 -7.53 -18.8 -19 -18.8 -18.8 -19 New River Outlet 10/16/12 -10 -10 -10 -10 -10 -10
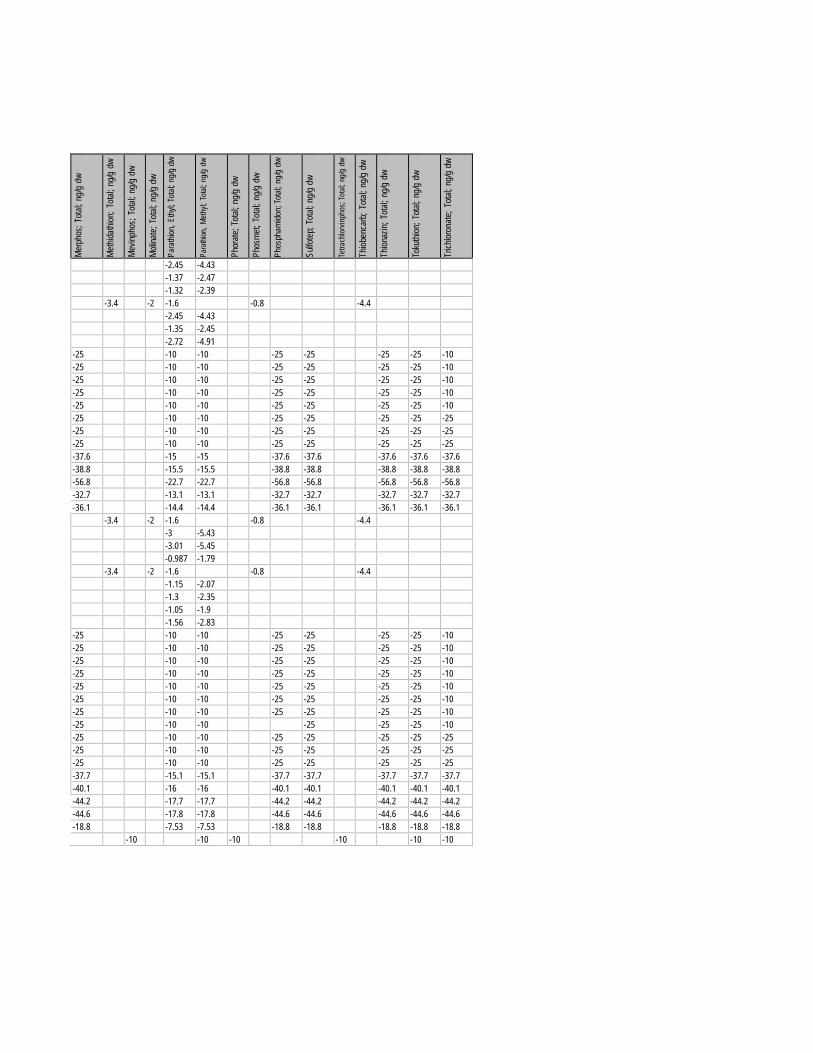
Merp
hos;
Total
; ng/g
dw
Methi
dathi
on; T
otal;
ng/g
dw
Mevin
phos
; Tota
l; ng
/g dw
Molin
ate; T
otal;
ng/g
dw
Para
thion
, Ethy
l; Tota
l; ng
/g dw
Para
thion
, Meth
yl; T
otal;
ng/g
dw
Phor
ate; T
otal;
ng/g
dw
Phos
met;
Total
; ng/g
dw
Phos
pham
idon;
Total
; ng/g
dw
Sulfo
tep;
Total
; ng/g
dw
Tetra
chlor
vinph
os; T
otal;
ng/g
dw
Thiob
enca
rb; T
otal;
ng/g
dw
Thion
azin;
Tota
l; ng
/g d
w
Toku
thion
; Tota
l; ng
/g dw
Trich
loron
ate; T
otal;
ng/g
dw
-2.45 -4.43 -1.37 -2.47 -1.32 -2.39 -3.4 -2 -1.6 -0.8 -4.4 -2.45 -4.43 -1.35 -2.45 -2.72 -4.91 -25 -10 -10 -25 -25 -25 -25 -10 -25 -10 -10 -25 -25 -25 -25 -10 -25 -10 -10 -25 -25 -25 -25 -10 -25 -10 -10 -25 -25 -25 -25 -10 -25 -10 -10 -25 -25 -25 -25 -10 -25 -10 -10 -25 -25 -25 -25 -25 -25 -10 -10 -25 -25 -25 -25 -25 -25 -10 -10 -25 -25 -25 -25 -25 -37.6 -15 -15 -37.6 -37.6 -37.6 -37.6 -37.6 -38.8 -15.5 -15.5 -38.8 -38.8 -38.8 -38.8 -38.8 -56.8 -22.7 -22.7 -56.8 -56.8 -56.8 -56.8 -56.8 -32.7 -13.1 -13.1 -32.7 -32.7 -32.7 -32.7 -32.7 -36.1 -14.4 -14.4 -36.1 -36.1 -36.1 -36.1 -36.1
-3.4 -2 -1.6 -0.8 -4.4 -3 -5.43 -3.01 -5.45 -0.987 -1.79 -3.4 -2 -1.6 -0.8 -4.4 -1.15 -2.07 -1.3 -2.35 -1.05 -1.9 -1.56 -2.83 -25 -10 -10 -25 -25 -25 -25 -10 -25 -10 -10 -25 -25 -25 -25 -10 -25 -10 -10 -25 -25 -25 -25 -10 -25 -10 -10 -25 -25 -25 -25 -10 -25 -10 -10 -25 -25 -25 -25 -10 -25 -10 -10 -25 -25 -25 -25 -10 -25 -10 -10 -25 -25 -25 -25 -10 -25 -10 -10 -25 -25 -25 -10 -25 -10 -10 -25 -25 -25 -25 -25 -25 -10 -10 -25 -25 -25 -25 -25 -25 -10 -10 -25 -25 -25 -25 -25 -37.7 -15.1 -15.1 -37.7 -37.7 -37.7 -37.7 -37.7 -40.1 -16 -16 -40.1 -40.1 -40.1 -40.1 -40.1 -44.2 -17.7 -17.7 -44.2 -44.2 -44.2 -44.2 -44.2 -44.6 -17.8 -17.8 -44.6 -44.6 -44.6 -44.6 -44.6 -18.8 -7.53 -7.53 -18.8 -18.8 -18.8 -18.8 -18.8
-10 -10 -10 -10 -10 -10
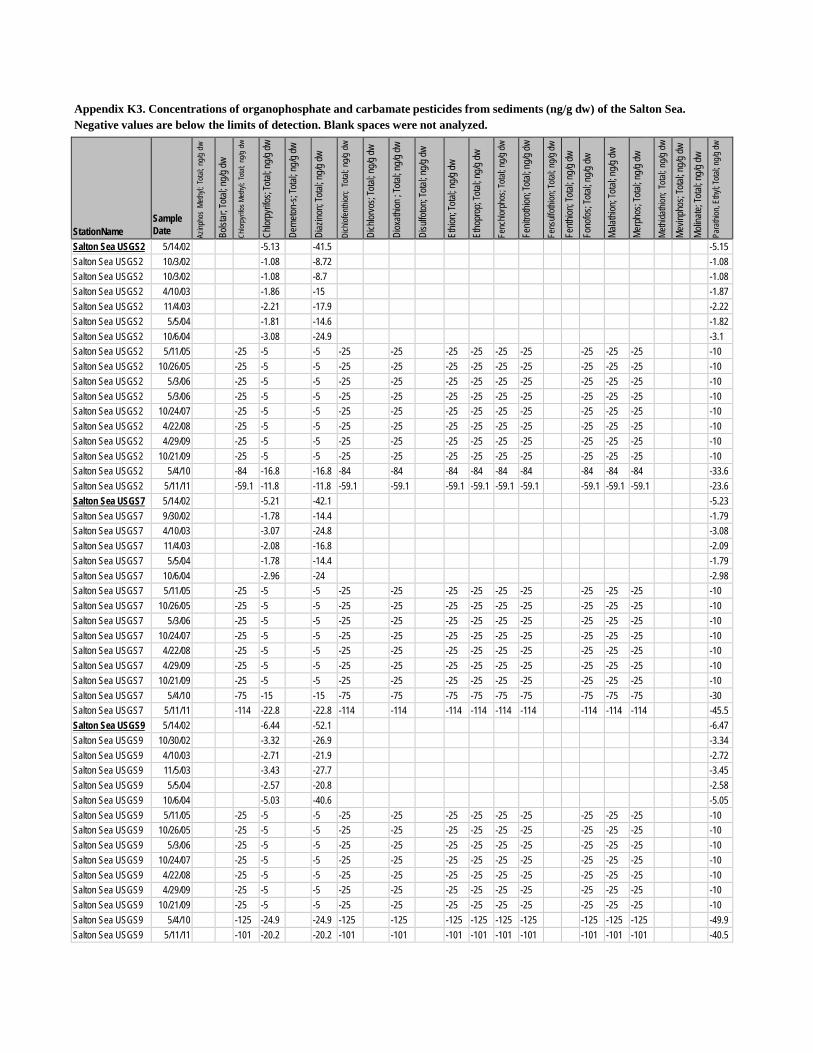
Appendix K3. Concentrations of organophosphate and carbamate pesticides from sediments (ng/g dw) of the Salton Sea. Negative values are below the limits of detection. Blank spaces were not analyzed.
StationName
Sample Date Az
inpho
s Me
thyl;
Total
; ng/g
dw
Bolst
ar; T
otal; n
g/g dw
Chlor
pyrif
os M
ethyl;
Tota
l; ng
/g dw
Chlor
pyrifo
s; To
tal; n
g/g dw
Deme
ton-s;
Total
; ng/g
dw
Diaz
inon;
Total
; ng/g
dw
Dich
lofen
thion
; To
tal; n
g/g d
w
Dich
lorvo
s; To
tal; n
g/g dw
Diox
athion
; Tota
l; ng/g
dw
Disu
lfoton
; Tota
l; ng/g
dw
Ethio
n; To
tal; n
g/g dw
Etho
prop
; Tota
l; ng/g
dw
Fenc
hlorp
hos;
Total
; ng/g
dw
Fenit
rothi
on; T
otal; n
g/g dw
Fens
ulfoth
ion; T
otal; n
g/g dw
Fenth
ion; T
otal; n
g/g dw
Fono
fos; T
otal; n
g/g dw
Malat
hion;
Total
; ng/g
dw
Merp
hos;
Total
; ng/g
dw
Methi
dathi
on; T
otal;
ng/g
dw
Mevin
phos
; Tota
l; ng/g
dw
Molin
ate; T
otal; n
g/g dw
Para
thion
, Ethy
l; Tota
l; ng/g
dw
Salton Sea USGS2 5/14/02 -5.13 -41.5 -5.15 Salton Sea USGS2 10/3/02 -1.08 -8.72 -1.08 Salton Sea USGS2 10/3/02 -1.08 -8.7 -1.08 Salton Sea USGS2 4/10/03 -1.86 -15 -1.87 Salton Sea USGS2 11/4/03 -2.21 -17.9 -2.22 Salton Sea USGS2 5/5/04 -1.81 -14.6 -1.82 Salton Sea USGS2 10/6/04 -3.08 -24.9 -3.1 Salton Sea USGS2 5/11/05 -25 -5 -5 -25 -25 -25 -25 -25 -25 -25 -25 -25 -10 Salton Sea USGS2 10/26/05 -25 -5 -5 -25 -25 -25 -25 -25 -25 -25 -25 -25 -10 Salton Sea USGS2 5/3/06 -25 -5 -5 -25 -25 -25 -25 -25 -25 -25 -25 -25 -10 Salton Sea USGS2 5/3/06 -25 -5 -5 -25 -25 -25 -25 -25 -25 -25 -25 -25 -10 Salton Sea USGS2 10/24/07 -25 -5 -5 -25 -25 -25 -25 -25 -25 -25 -25 -25 -10 Salton Sea USGS2 4/22/08 -25 -5 -5 -25 -25 -25 -25 -25 -25 -25 -25 -25 -10 Salton Sea USGS2 4/29/09 -25 -5 -5 -25 -25 -25 -25 -25 -25 -25 -25 -25 -10 Salton Sea USGS2 10/21/09 -25 -5 -5 -25 -25 -25 -25 -25 -25 -25 -25 -25 -10 Salton Sea USGS2 5/4/10 -84 -16.8 -16.8 -84 -84 -84 -84 -84 -84 -84 -84 -84 -33.6 Salton Sea USGS2 5/11/11 -59.1 -11.8 -11.8 -59.1 -59.1 -59.1 -59.1 -59.1 -59.1 -59.1 -59.1 -59.1 -23.6 Salton Sea USGS7 5/14/02 -5.21 -42.1 -5.23 Salton Sea USGS7 9/30/02 -1.78 -14.4 -1.79 Salton Sea USGS7 4/10/03 -3.07 -24.8 -3.08 Salton Sea USGS7 11/4/03 -2.08 -16.8 -2.09 Salton Sea USGS7 5/5/04 -1.78 -14.4 -1.79 Salton Sea USGS7 10/6/04 -2.96 -24 -2.98 Salton Sea USGS7 5/11/05 -25 -5 -5 -25 -25 -25 -25 -25 -25 -25 -25 -25 -10 Salton Sea USGS7 10/26/05 -25 -5 -5 -25 -25 -25 -25 -25 -25 -25 -25 -25 -10 Salton Sea USGS7 5/3/06 -25 -5 -5 -25 -25 -25 -25 -25 -25 -25 -25 -25 -10 Salton Sea USGS7 10/24/07 -25 -5 -5 -25 -25 -25 -25 -25 -25 -25 -25 -25 -10 Salton Sea USGS7 4/22/08 -25 -5 -5 -25 -25 -25 -25 -25 -25 -25 -25 -25 -10 Salton Sea USGS7 4/29/09 -25 -5 -5 -25 -25 -25 -25 -25 -25 -25 -25 -25 -10 Salton Sea USGS7 10/21/09 -25 -5 -5 -25 -25 -25 -25 -25 -25 -25 -25 -25 -10 Salton Sea USGS7 5/4/10 -75 -15 -15 -75 -75 -75 -75 -75 -75 -75 -75 -75 -30 Salton Sea USGS7 5/11/11 -114 -22.8 -22.8 -114 -114 -114 -114 -114 -114 -114 -114 -114 -45.5 Salton Sea USGS9 5/14/02 -6.44 -52.1 -6.47 Salton Sea USGS9 10/30/02 -3.32 -26.9 -3.34 Salton Sea USGS9 4/10/03 -2.71 -21.9 -2.72 Salton Sea USGS9 11/5/03 -3.43 -27.7 -3.45 Salton Sea USGS9 5/5/04 -2.57 -20.8 -2.58 Salton Sea USGS9 10/6/04 -5.03 -40.6 -5.05 Salton Sea USGS9 5/11/05 -25 -5 -5 -25 -25 -25 -25 -25 -25 -25 -25 -25 -10 Salton Sea USGS9 10/26/05 -25 -5 -5 -25 -25 -25 -25 -25 -25 -25 -25 -25 -10 Salton Sea USGS9 5/3/06 -25 -5 -5 -25 -25 -25 -25 -25 -25 -25 -25 -25 -10 Salton Sea USGS9 10/24/07 -25 -5 -5 -25 -25 -25 -25 -25 -25 -25 -25 -25 -10 Salton Sea USGS9 4/22/08 -25 -5 -5 -25 -25 -25 -25 -25 -25 -25 -25 -25 -10 Salton Sea USGS9 4/29/09 -25 -5 -5 -25 -25 -25 -25 -25 -25 -25 -25 -25 -10 Salton Sea USGS9 10/21/09 -25 -5 -5 -25 -25 -25 -25 -25 -25 -25 -25 -25 -10 Salton Sea USGS9 5/4/10 -125 -24.9 -24.9 -125 -125 -125 -125 -125 -125 -125 -125 -125 -49.9 Salton Sea USGS9 5/11/11 -101 -20.2 -20.2 -101 -101 -101 -101 -101 -101 -101 -101 -101 -40.5
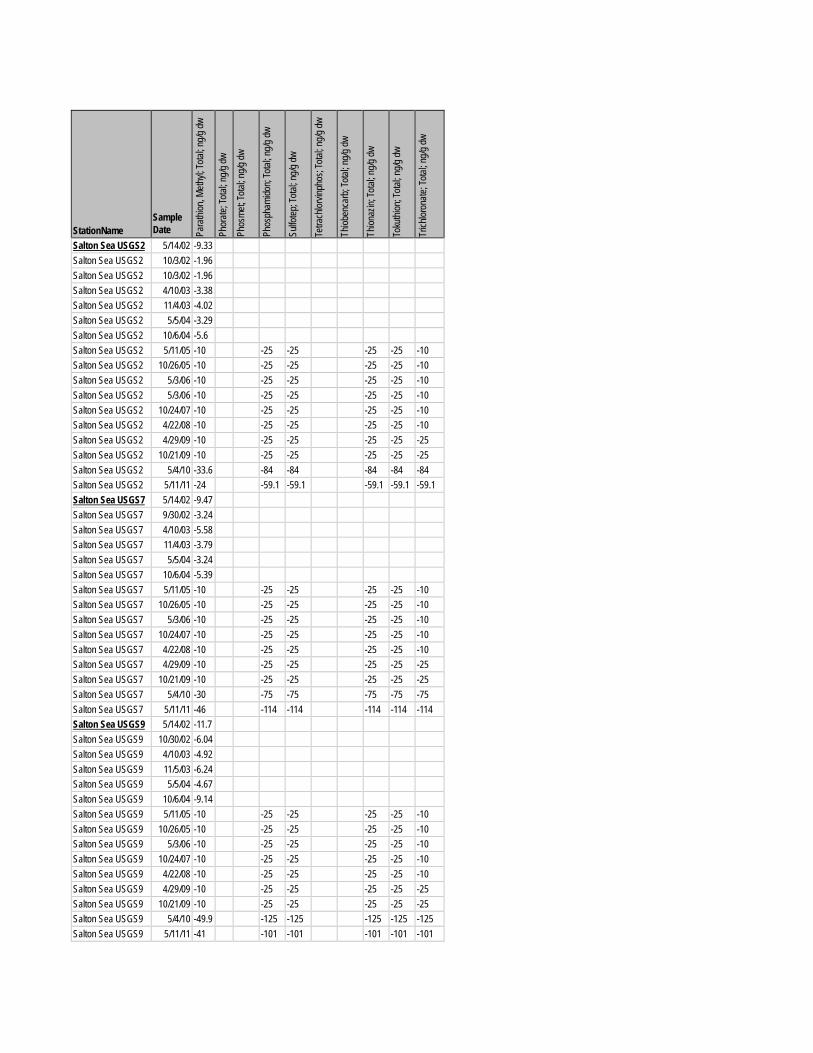
StationName
Sample Date Pa
rathi
on, M
ethyl;
Total
; ng/g
dw
Phor
ate; T
otal; n
g/g dw
Phos
met; T
otal; n
g/g dw
Phos
pham
idon;
Total
; ng/g
dw
Sulfo
tep; T
otal; n
g/g dw
Tetra
chlor
vinph
os; T
otal; n
g/g dw
Thiob
enca
rb; T
otal; n
g/g dw
Thion
azin;
Total
; ng/g
dw
Toku
thion
; Tota
l; ng/g
dw
Trich
loron
ate; T
otal; n
g/g dw
Salton Sea USGS2 5/14/02 -9.33 Salton Sea USGS2 10/3/02 -1.96 Salton Sea USGS2 10/3/02 -1.96 Salton Sea USGS2 4/10/03 -3.38 Salton Sea USGS2 11/4/03 -4.02 Salton Sea USGS2 5/5/04 -3.29 Salton Sea USGS2 10/6/04 -5.6 Salton Sea USGS2 5/11/05 -10 -25 -25 -25 -25 -10 Salton Sea USGS2 10/26/05 -10 -25 -25 -25 -25 -10 Salton Sea USGS2 5/3/06 -10 -25 -25 -25 -25 -10 Salton Sea USGS2 5/3/06 -10 -25 -25 -25 -25 -10 Salton Sea USGS2 10/24/07 -10 -25 -25 -25 -25 -10 Salton Sea USGS2 4/22/08 -10 -25 -25 -25 -25 -10 Salton Sea USGS2 4/29/09 -10 -25 -25 -25 -25 -25 Salton Sea USGS2 10/21/09 -10 -25 -25 -25 -25 -25 Salton Sea USGS2 5/4/10 -33.6 -84 -84 -84 -84 -84 Salton Sea USGS2 5/11/11 -24 -59.1 -59.1 -59.1 -59.1 -59.1 Salton Sea USGS7 5/14/02 -9.47 Salton Sea USGS7 9/30/02 -3.24 Salton Sea USGS7 4/10/03 -5.58 Salton Sea USGS7 11/4/03 -3.79 Salton Sea USGS7 5/5/04 -3.24 Salton Sea USGS7 10/6/04 -5.39 Salton Sea USGS7 5/11/05 -10 -25 -25 -25 -25 -10 Salton Sea USGS7 10/26/05 -10 -25 -25 -25 -25 -10 Salton Sea USGS7 5/3/06 -10 -25 -25 -25 -25 -10 Salton Sea USGS7 10/24/07 -10 -25 -25 -25 -25 -10 Salton Sea USGS7 4/22/08 -10 -25 -25 -25 -25 -10 Salton Sea USGS7 4/29/09 -10 -25 -25 -25 -25 -25 Salton Sea USGS7 10/21/09 -10 -25 -25 -25 -25 -25 Salton Sea USGS7 5/4/10 -30 -75 -75 -75 -75 -75 Salton Sea USGS7 5/11/11 -46 -114 -114 -114 -114 -114 Salton Sea USGS9 5/14/02 -11.7 Salton Sea USGS9 10/30/02 -6.04 Salton Sea USGS9 4/10/03 -4.92 Salton Sea USGS9 11/5/03 -6.24 Salton Sea USGS9 5/5/04 -4.67 Salton Sea USGS9 10/6/04 -9.14 Salton Sea USGS9 5/11/05 -10 -25 -25 -25 -25 -10 Salton Sea USGS9 10/26/05 -10 -25 -25 -25 -25 -10 Salton Sea USGS9 5/3/06 -10 -25 -25 -25 -25 -10 Salton Sea USGS9 10/24/07 -10 -25 -25 -25 -25 -10 Salton Sea USGS9 4/22/08 -10 -25 -25 -25 -25 -10 Salton Sea USGS9 4/29/09 -10 -25 -25 -25 -25 -25 Salton Sea USGS9 10/21/09 -10 -25 -25 -25 -25 -25 Salton Sea USGS9 5/4/10 -49.9 -125 -125 -125 -125 -125 Salton Sea USGS9 5/11/11 -41 -101 -101 -101 -101 -101
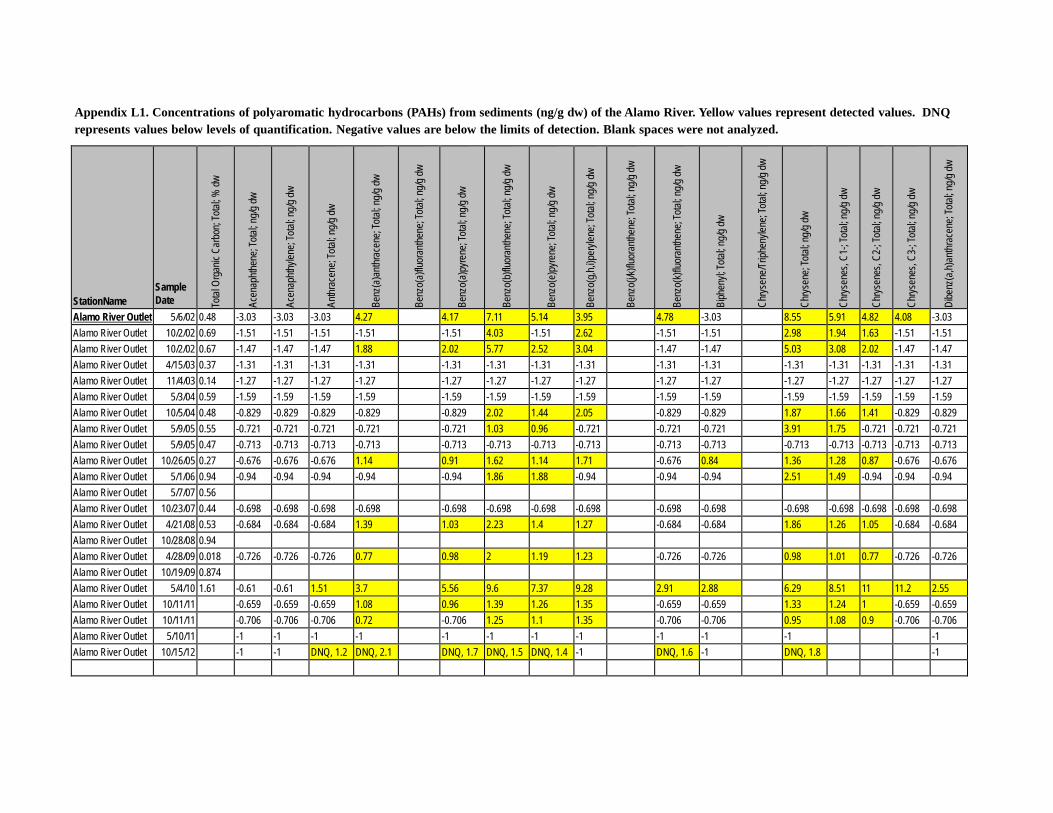
Appendix L1. Concentrations of polyaromatic hydrocarbons (PAHs) from sediments (ng/g dw) of the Alamo River. Yellow values represent detected values. DNQ represents values below levels of quantification. Negative values are below the limits of detection. Blank spaces were not analyzed.
StationName
Sample Date To
tal O
rgan
ic Ca
rbon
; Tota
l; % dw
Acen
aphth
ene;
Total
; ng/g
dw
Acen
aphth
ylene
; Tota
l; ng/g
dw
Anthr
acen
e; To
tal; n
g/g dw
Benz
(a)a
nthra
cene
; Tota
l; ng/g
dw
Benz
o(a)
fluor
anthe
ne; T
otal; n
g/g dw
Benz
o(a)
pyre
ne; T
otal; n
g/g dw
Benz
o(b)
fluor
anthe
ne; T
otal; n
g/g dw
Benz
o(e)
pyre
ne; T
otal; n
g/g dw
Benz
o(g,h
,i)per
ylene
; Tota
l; ng/g
dw
Benz
o(j/k
)fluor
anthe
ne; T
otal; n
g/g dw
Benz
o(k)f
luora
nthen
e; To
tal; n
g/g dw
Biph
enyl;
Total
; ng/g
dw
Chrys
ene/T
riphe
nylen
e; To
tal; n
g/g dw
Chrys
ene;
Total
; ng/g
dw
Chrys
enes
, C1-
; Tota
l; ng/g
dw
Chrys
enes
, C2-
; Tota
l; ng/g
dw
Chrys
enes
, C3-
; Tota
l; ng/g
dw
Dibe
nz(a
,h)an
thrac
ene;
Total
; ng/g
dw
Alamo River Outlet 5/6/02 0.48 -3.03 -3.03 -3.03 4.27 4.17 7.11 5.14 3.95 4.78 -3.03 8.55 5.91 4.82 4.08 -3.03 Alamo River Outlet 10/2/02 0.69 -1.51 -1.51 -1.51 -1.51 -1.51 4.03 -1.51 2.62 -1.51 -1.51 2.98 1.94 1.63 -1.51 -1.51 Alamo River Outlet 10/2/02 0.67 -1.47 -1.47 -1.47 1.88 2.02 5.77 2.52 3.04 -1.47 -1.47 5.03 3.08 2.02 -1.47 -1.47 Alamo River Outlet 4/15/03 0.37 -1.31 -1.31 -1.31 -1.31 -1.31 -1.31 -1.31 -1.31 -1.31 -1.31 -1.31 -1.31 -1.31 -1.31 -1.31 Alamo River Outlet 11/4/03 0.14 -1.27 -1.27 -1.27 -1.27 -1.27 -1.27 -1.27 -1.27 -1.27 -1.27 -1.27 -1.27 -1.27 -1.27 -1.27 Alamo River Outlet 5/3/04 0.59 -1.59 -1.59 -1.59 -1.59 -1.59 -1.59 -1.59 -1.59 -1.59 -1.59 -1.59 -1.59 -1.59 -1.59 -1.59 Alamo River Outlet 10/5/04 0.48 -0.829 -0.829 -0.829 -0.829 -0.829 2.02 1.44 2.05 -0.829 -0.829 1.87 1.66 1.41 -0.829 -0.829 Alamo River Outlet 5/9/05 0.55 -0.721 -0.721 -0.721 -0.721 -0.721 1.03 0.96 -0.721 -0.721 -0.721 3.91 1.75 -0.721 -0.721 -0.721 Alamo River Outlet 5/9/05 0.47 -0.713 -0.713 -0.713 -0.713 -0.713 -0.713 -0.713 -0.713 -0.713 -0.713 -0.713 -0.713 -0.713 -0.713 -0.713 Alamo River Outlet 10/26/05 0.27 -0.676 -0.676 -0.676 1.14 0.91 1.62 1.14 1.71 -0.676 0.84 1.36 1.28 0.87 -0.676 -0.676 Alamo River Outlet 5/1/06 0.94 -0.94 -0.94 -0.94 -0.94 -0.94 1.86 1.88 -0.94 -0.94 -0.94 2.51 1.49 -0.94 -0.94 -0.94 Alamo River Outlet 5/7/07 0.56 Alamo River Outlet 10/23/07 0.44 -0.698 -0.698 -0.698 -0.698 -0.698 -0.698 -0.698 -0.698 -0.698 -0.698 -0.698 -0.698 -0.698 -0.698 -0.698 Alamo River Outlet 4/21/08 0.53 -0.684 -0.684 -0.684 1.39 1.03 2.23 1.4 1.27 -0.684 -0.684 1.86 1.26 1.05 -0.684 -0.684 Alamo River Outlet 10/28/08 0.94 Alamo River Outlet 4/28/09 0.018 -0.726 -0.726 -0.726 0.77 0.98 2 1.19 1.23 -0.726 -0.726 0.98 1.01 0.77 -0.726 -0.726 Alamo River Outlet 10/19/09 0.874 Alamo River Outlet 5/4/10 1.61 -0.61 -0.61 1.51 3.7 5.56 9.6 7.37 9.28 2.91 2.88 6.29 8.51 11 11.2 2.55 Alamo River Outlet 10/11/11 -0.659 -0.659 -0.659 1.08 0.96 1.39 1.26 1.35 -0.659 -0.659 1.33 1.24 1 -0.659 -0.659 Alamo River Outlet 10/11/11 -0.706 -0.706 -0.706 0.72 -0.706 1.25 1.1 1.35 -0.706 -0.706 0.95 1.08 0.9 -0.706 -0.706 Alamo River Outlet 5/10/11 -1 -1 -1 -1 -1 -1 -1 -1 -1 -1 -1 -1 Alamo River Outlet 10/15/12 -1 -1 DNQ, 1.2 DNQ, 2.1 DNQ, 1.7 DNQ, 1.5 DNQ, 1.4 -1 DNQ, 1.6 -1 DNQ, 1.8 -1
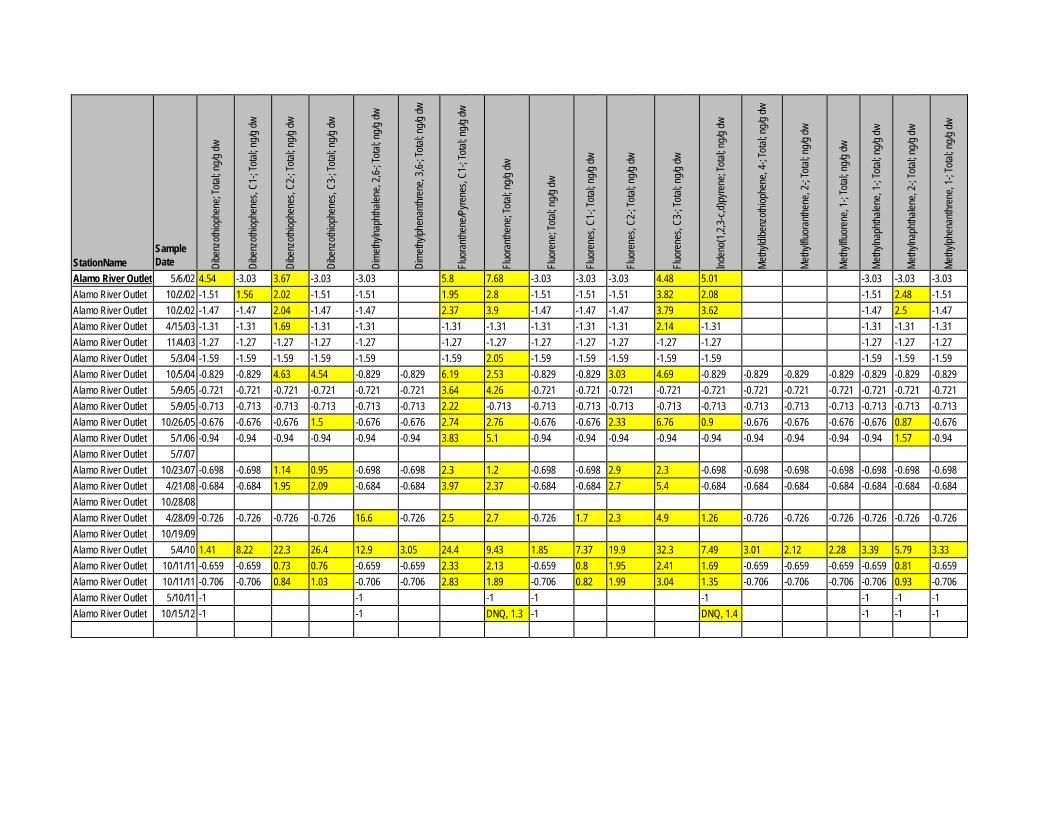
StationName
Sample Date Di
benz
othiop
hene
; Tota
l; ng/g
dw
Dibe
nzoth
iophe
nes,
C1-;
Total
; ng/g
dw
Dibe
nzoth
iophe
nes,
C2-;
Total
; ng/g
dw
Dibe
nzoth
iophe
nes,
C3-;
Total
; ng/g
dw
Dime
thylna
phtha
lene,
2,6-;
Total
; ng/g
dw
Dime
thylph
enan
thren
e, 3,6
-; Tota
l; ng/g
dw
Fluor
anthe
ne/P
yrene
s, C1
-; To
tal; n
g/g dw
Fluor
anthe
ne; T
otal; n
g/g dw
Fluor
ene;
Total
; ng/g
dw
Fluor
enes
, C1-
; Tota
l; ng/g
dw
Fluor
enes
, C2-
; Tota
l; ng/g
dw
Fluor
enes
, C3-
; Tota
l; ng/g
dw
Inden
o(1,2
,3-c,d
)pyre
ne; T
otal; n
g/g dw
Methy
ldibe
nzoth
iophe
ne, 4
-; Tota
l; ng/g
dw
Methy
lfluor
anthe
ne, 2
-; To
tal; n
g/g dw
Methy
lfluor
ene,
1-; T
otal; n
g/g dw
Methy
lnaph
thalen
e, 1-
; Tota
l; ng/g
dw
Methy
lnaph
thalen
e, 2-
; Tota
l; ng/g
dw
Methy
lphen
anthr
ene,
1-; T
otal; n
g/g dw
Alamo River Outlet 5/6/02 4.54 -3.03 3.67 -3.03 -3.03 5.8 7.68 -3.03 -3.03 -3.03 4.48 5.01 -3.03 -3.03 -3.03 Alamo River Outlet 10/2/02 -1.51 1.56 2.02 -1.51 -1.51 1.95 2.8 -1.51 -1.51 -1.51 3.82 2.08 -1.51 2.48 -1.51 Alamo River Outlet 10/2/02 -1.47 -1.47 2.04 -1.47 -1.47 2.37 3.9 -1.47 -1.47 -1.47 3.79 3.62 -1.47 2.5 -1.47 Alamo River Outlet 4/15/03 -1.31 -1.31 1.69 -1.31 -1.31 -1.31 -1.31 -1.31 -1.31 -1.31 2.14 -1.31 -1.31 -1.31 -1.31 Alamo River Outlet 11/4/03 -1.27 -1.27 -1.27 -1.27 -1.27 -1.27 -1.27 -1.27 -1.27 -1.27 -1.27 -1.27 -1.27 -1.27 -1.27 Alamo River Outlet 5/3/04 -1.59 -1.59 -1.59 -1.59 -1.59 -1.59 2.05 -1.59 -1.59 -1.59 -1.59 -1.59 -1.59 -1.59 -1.59 Alamo River Outlet 10/5/04 -0.829 -0.829 4.63 4.54 -0.829 -0.829 6.19 2.53 -0.829 -0.829 3.03 4.69 -0.829 -0.829 -0.829 -0.829 -0.829 -0.829 -0.829 Alamo River Outlet 5/9/05 -0.721 -0.721 -0.721 -0.721 -0.721 -0.721 3.64 4.26 -0.721 -0.721 -0.721 -0.721 -0.721 -0.721 -0.721 -0.721 -0.721 -0.721 -0.721 Alamo River Outlet 5/9/05 -0.713 -0.713 -0.713 -0.713 -0.713 -0.713 2.22 -0.713 -0.713 -0.713 -0.713 -0.713 -0.713 -0.713 -0.713 -0.713 -0.713 -0.713 -0.713 Alamo River Outlet 10/26/05 -0.676 -0.676 -0.676 1.5 -0.676 -0.676 2.74 2.76 -0.676 -0.676 2.33 6.76 0.9 -0.676 -0.676 -0.676 -0.676 0.87 -0.676 Alamo River Outlet 5/1/06 -0.94 -0.94 -0.94 -0.94 -0.94 -0.94 3.83 5.1 -0.94 -0.94 -0.94 -0.94 -0.94 -0.94 -0.94 -0.94 -0.94 1.57 -0.94 Alamo River Outlet 5/7/07 Alamo River Outlet 10/23/07 -0.698 -0.698 1.14 0.95 -0.698 -0.698 2.3 1.2 -0.698 -0.698 2.9 2.3 -0.698 -0.698 -0.698 -0.698 -0.698 -0.698 -0.698 Alamo River Outlet 4/21/08 -0.684 -0.684 1.95 2.09 -0.684 -0.684 3.97 2.37 -0.684 -0.684 2.7 5.4 -0.684 -0.684 -0.684 -0.684 -0.684 -0.684 -0.684 Alamo River Outlet 10/28/08 Alamo River Outlet 4/28/09 -0.726 -0.726 -0.726 -0.726 16.6 -0.726 2.5 2.7 -0.726 1.7 2.3 4.9 1.26 -0.726 -0.726 -0.726 -0.726 -0.726 -0.726 Alamo River Outlet 10/19/09 Alamo River Outlet 5/4/10 1.41 8.22 22.3 26.4 12.9 3.05 24.4 9.43 1.85 7.37 19.9 32.3 7.49 3.01 2.12 2.28 3.39 5.79 3.33 Alamo River Outlet 10/11/11 -0.659 -0.659 0.73 0.76 -0.659 -0.659 2.33 2.13 -0.659 0.8 1.95 2.41 1.69 -0.659 -0.659 -0.659 -0.659 0.81 -0.659 Alamo River Outlet 10/11/11 -0.706 -0.706 0.84 1.03 -0.706 -0.706 2.83 1.89 -0.706 0.82 1.99 3.04 1.35 -0.706 -0.706 -0.706 -0.706 0.93 -0.706 Alamo River Outlet 5/10/11 -1 -1 -1 -1 -1 -1 -1 -1 Alamo River Outlet 10/15/12 -1 -1 DNQ, 1.3 -1 DNQ, 1.4 -1 -1 -1
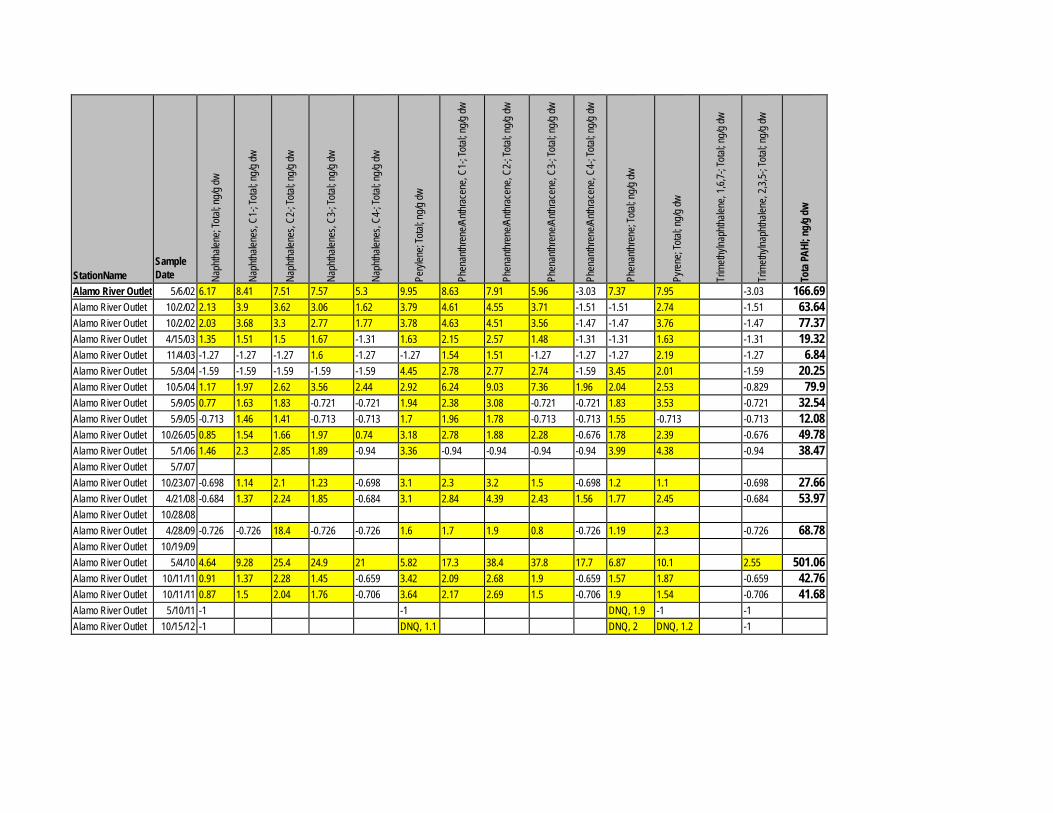
StationName
Sample Date Na
phtha
lene;
Total
; ng/g
dw
Naph
thalen
es, C
1-; T
otal; n
g/g dw
Naph
thalen
es, C
2-; T
otal; n
g/g dw
Naph
thalen
es, C
3-; T
otal; n
g/g dw
Naph
thalen
es, C
4-; T
otal; n
g/g dw
Peryl
ene;
Total
; ng/g
dw
Phen
anthr
ene/A
nthra
cene
, C1-
; Tota
l; ng/g
dw
Phen
anthr
ene/A
nthra
cene
, C2-
; Tota
l; ng/g
dw
Phen
anthr
ene/A
nthra
cene
, C3-
; Tota
l; ng/g
dw
Phen
anthr
ene/A
nthra
cene
, C4-
; Tota
l; ng/g
dw
Phen
anthr
ene;
Total
; ng/g
dw
Pyre
ne; T
otal; n
g/g dw
Trim
ethyln
aphth
alene
, 1,6,
7-; T
otal; n
g/g dw
Trim
ethyln
aphth
alene
, 2,3,
5-; T
otal; n
g/g dw
Tota
PAHl
; ng/
g dw
Alamo River Outlet 5/6/02 6.17 8.41 7.51 7.57 5.3 9.95 8.63 7.91 5.96 -3.03 7.37 7.95 -3.03 166.69 Alamo River Outlet 10/2/02 2.13 3.9 3.62 3.06 1.62 3.79 4.61 4.55 3.71 -1.51 -1.51 2.74 -1.51 63.64 Alamo River Outlet 10/2/02 2.03 3.68 3.3 2.77 1.77 3.78 4.63 4.51 3.56 -1.47 -1.47 3.76 -1.47 77.37 Alamo River Outlet 4/15/03 1.35 1.51 1.5 1.67 -1.31 1.63 2.15 2.57 1.48 -1.31 -1.31 1.63 -1.31 19.32 Alamo River Outlet 11/4/03 -1.27 -1.27 -1.27 1.6 -1.27 -1.27 1.54 1.51 -1.27 -1.27 -1.27 2.19 -1.27 6.84 Alamo River Outlet 5/3/04 -1.59 -1.59 -1.59 -1.59 -1.59 4.45 2.78 2.77 2.74 -1.59 3.45 2.01 -1.59 20.25 Alamo River Outlet 10/5/04 1.17 1.97 2.62 3.56 2.44 2.92 6.24 9.03 7.36 1.96 2.04 2.53 -0.829 79.9 Alamo River Outlet 5/9/05 0.77 1.63 1.83 -0.721 -0.721 1.94 2.38 3.08 -0.721 -0.721 1.83 3.53 -0.721 32.54 Alamo River Outlet 5/9/05 -0.713 1.46 1.41 -0.713 -0.713 1.7 1.96 1.78 -0.713 -0.713 1.55 -0.713 -0.713 12.08 Alamo River Outlet 10/26/05 0.85 1.54 1.66 1.97 0.74 3.18 2.78 1.88 2.28 -0.676 1.78 2.39 -0.676 49.78 Alamo River Outlet 5/1/06 1.46 2.3 2.85 1.89 -0.94 3.36 -0.94 -0.94 -0.94 -0.94 3.99 4.38 -0.94 38.47 Alamo River Outlet 5/7/07 Alamo River Outlet 10/23/07 -0.698 1.14 2.1 1.23 -0.698 3.1 2.3 3.2 1.5 -0.698 1.2 1.1 -0.698 27.66 Alamo River Outlet 4/21/08 -0.684 1.37 2.24 1.85 -0.684 3.1 2.84 4.39 2.43 1.56 1.77 2.45 -0.684 53.97 Alamo River Outlet 10/28/08 Alamo River Outlet 4/28/09 -0.726 -0.726 18.4 -0.726 -0.726 1.6 1.7 1.9 0.8 -0.726 1.19 2.3 -0.726 68.78 Alamo River Outlet 10/19/09 Alamo River Outlet 5/4/10 4.64 9.28 25.4 24.9 21 5.82 17.3 38.4 37.8 17.7 6.87 10.1 2.55 501.06 Alamo River Outlet 10/11/11 0.91 1.37 2.28 1.45 -0.659 3.42 2.09 2.68 1.9 -0.659 1.57 1.87 -0.659 42.76 Alamo River Outlet 10/11/11 0.87 1.5 2.04 1.76 -0.706 3.64 2.17 2.69 1.5 -0.706 1.9 1.54 -0.706 41.68 Alamo River Outlet 5/10/11 -1 -1 DNQ, 1.9 -1 -1 Alamo River Outlet 10/15/12 -1 DNQ, 1.1 DNQ, 2 DNQ, 1.2 -1
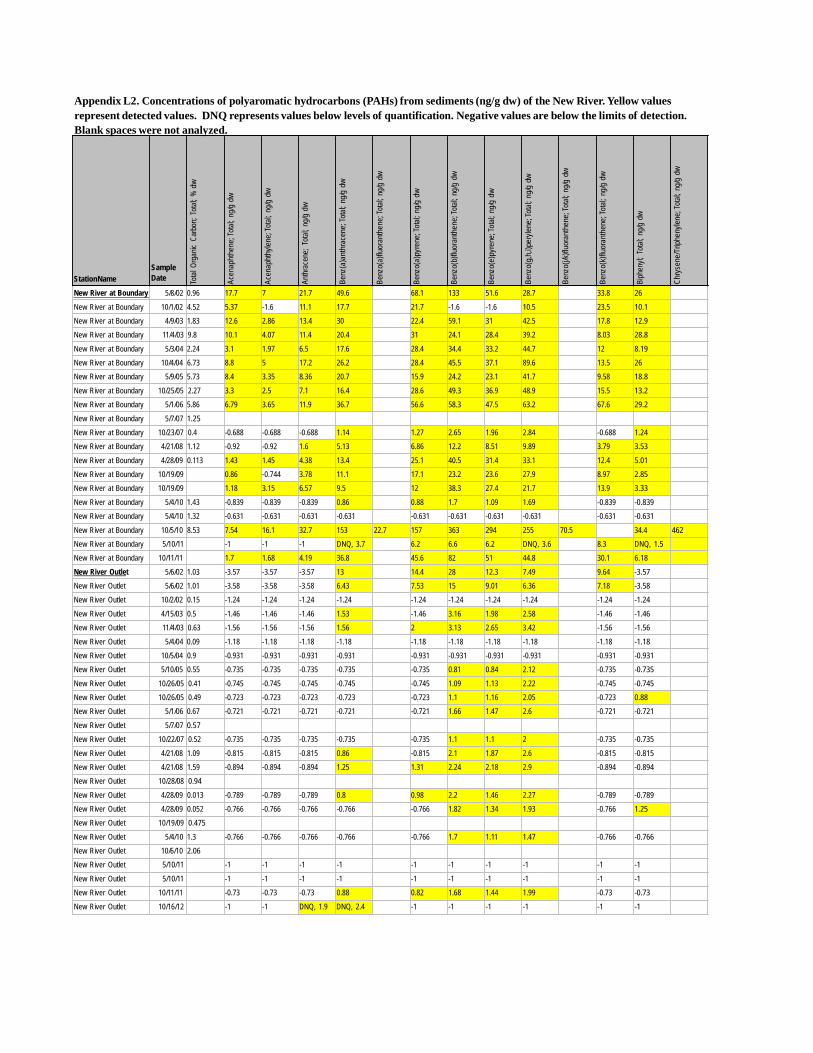
Total
Org
anic
Carb
on; T
otal;
% d
w
Acen
apht
hene
; Tota
l; ng
/g dw
Acen
apht
hylen
e; To
tal; n
g/g d
w
Anthr
acen
e; To
tal; n
g/g d
w
Benz
(a)a
nthr
acen
e; To
tal; n
g/g d
w
Benz
o(a)
fluor
anth
ene;
Total
; ng/g
dw
Benz
o(a)
pyre
ne; T
otal;
ng/g
dw
Benz
o(b)
fluor
anth
ene;
Total
; ng/g
dw
Benz
o(e)
pyre
ne; T
otal;
ng/g
dw
Benz
o(g,
h,i)p
eryle
ne; T
otal;
ng/g
dw
Benz
o(j/k
)fluo
rant
hene
; Tot
al; n
g/g d
w
Benz
o(k)
fluor
anth
ene;
Total
; ng/g
dw
Biph
enyl;
Tota
l; ng
/g d
w
Chry
sene
/Trip
heny
lene;
Total
; ng/g
dw
Appendix L2. Concentrations of polyaromatic hydrocarbons (PAHs) from sediments (ng/g dw) of the New River. Yellow values represent detected values. DNQ represents values below levels of quantification. Negative values are below the limits of detection. Blank spaces were not analyzed.
StationName Sample Date
New River at Boundary 5/8/02 0.96 17.7 7 21.7 49.6 68.1 133 51.6 28.7 33.8 26
New River at Boundary 10/1/02 4.52 5.37 -1.6 11.1 17.7 21.7 -1.6 -1.6 10.5 23.5 10.1 New River at Boundary 4/9/03 1.83 12.6 2.86 13.4 30 22.4 59.1 31 42.5 17.8 12.9 New River at Boundary 11/4/03 9.8 10.1 4.07 11.4 20.4 31 24.1 28.4 39.2 8.03 28.8
New River at Boundary 5/3/04 2.24 3.1 1.97 6.5 17.6 28.4 34.4 33.2 44.7 12 8.19 New River at Boundary 10/4/04 6.73 8.8 5 17.2 26.2 28.4 45.5 37.1 89.6 13.5 26 New River at Boundary 5/9/05 5.73 8.4 3.35 8.36 20.7 15.9 24.2 23.1 41.7 9.58 18.8
New River at Boundary 10/25/05 2.27 3.3 2.5 7.1 16.4 28.6 49.3 36.9 48.9 15.5 13.2 New River at Boundary 5/1/06 5.86 6.79 3.65 11.9 36.7 56.6 58.3 47.5 63.2 67.6 29.2
New River at Boundary 5/7/07 1.25 New River at Boundary 10/23/07 0.4 -0.688 -0.688 -0.688 1.14 1.27 2.65 1.96 2.84 -0.688 1.24 New River at Boundary 4/21/08 1.12 -0.92 -0.92 1.6 5.13 6.86 12.2 8.51 9.89 3.79 3.53
New River at Boundary 4/28/09 0.113 1.43 1.45 4.38 13.4 25.1 40.5 31.4 33.1 12.4 5.01 New River at Boundary 10/19/09 0.86 -0.744 3.78 11.1 17.1 23.2 23.6 27.9 8.97 2.85 New River at Boundary 10/19/09 1.18 3.15 6.57 9.5 12 38.3 27.4 21.7 13.9 3.33
New River at Boundary 5/4/10 1.43 -0.839 -0.839 -0.839 0.86 0.88 1.7 1.09 1.69 -0.839 -0.839 New River at Boundary 5/4/10 1.32 -0.631 -0.631 -0.631 -0.631 -0.631 -0.631 -0.631 -0.631 -0.631 -0.631
New River at Boundary 10/5/10 8.53 7.54 16.1 32.7 153 22.7 157 363 294 255 70.5 34.4 462 New River at Boundary 5/10/11 -1 -1 -1 DNQ, 3.7 6.2 6.6 6.2 DNQ, 3.6 8.3 DNQ, 1.5 New River at Boundary 10/11/11 1.7 1.68 4.19 36.8 45.6 82 51 44.8 30.1 6.18
New River Outlet 5/6/02 1.03 -3.57 -3.57 -3.57 13 14.4 28 12.3 7.49 9.64 -3.57 New River Outlet 5/6/02 1.01 -3.58 -3.58 -3.58 6.43 7.53 15 9.01 6.36 7.18 -3.58 New River Outlet 10/2/02 0.15 -1.24 -1.24 -1.24 -1.24 -1.24 -1.24 -1.24 -1.24 -1.24 -1.24
New River Outlet 4/15/03 0.5 -1.46 -1.46 -1.46 1.53 -1.46 3.16 1.98 2.58 -1.46 -1.46 New River Outlet 11/4/03 0.63 -1.56 -1.56 -1.56 1.56 2 3.13 2.65 3.42 -1.56 -1.56
New River Outlet 5/4/04 0.09 -1.18 -1.18 -1.18 -1.18 -1.18 -1.18 -1.18 -1.18 -1.18 -1.18 New River Outlet 10/5/04 0.9 -0.931 -0.931 -0.931 -0.931 -0.931 -0.931 -0.931 -0.931 -0.931 -0.931 New River Outlet 5/10/05 0.55 -0.735 -0.735 -0.735 -0.735 -0.735 0.81 0.84 2.12 -0.735 -0.735
New River Outlet 10/26/05 0.41 -0.745 -0.745 -0.745 -0.745 -0.745 1.09 1.13 2.22 -0.745 -0.745 New River Outlet 10/26/05 0.49 -0.723 -0.723 -0.723 -0.723 -0.723 1.1 1.16 2.05 -0.723 0.88 New River Outlet 5/1/06 0.67 -0.721 -0.721 -0.721 -0.721 -0.721 1.66 1.47 2.6 -0.721 -0.721
New River Outlet 5/7/07 0.57 New River Outlet 10/22/07 0.52 -0.735 -0.735 -0.735 -0.735 -0.735 1.1 1.1 2 -0.735 -0.735
New River Outlet 4/21/08 1.09 -0.815 -0.815 -0.815 0.86 -0.815 2.1 1.87 2.6 -0.815 -0.815 New River Outlet 4/21/08 1.59 -0.894 -0.894 -0.894 1.25 1.31 2.24 2.18 2.9 -0.894 -0.894 New River Outlet 10/28/08 0.94
New River Outlet 4/28/09 0.013 -0.789 -0.789 -0.789 0.8 0.98 2.2 1.46 2.27 -0.789 -0.789 New River Outlet 4/28/09 0.052 -0.766 -0.766 -0.766 -0.766 -0.766 1.82 1.34 1.93 -0.766 1.25 New River Outlet 10/19/09 0.475
New River Outlet 5/4/10 1.3 -0.766 -0.766 -0.766 -0.766 -0.766 1.7 1.11 1.47 -0.766 -0.766 New River Outlet 10/6/10 2.06 New River Outlet 5/10/11 -1 -1 -1 -1 -1 -1 -1 -1 -1 -1
New River Outlet 5/10/11 -1 -1 -1 -1 -1 -1 -1 -1 -1 -1 New River Outlet 10/11/11 -0.73 -0.73 -0.73 0.88 0.82 1.68 1.44 1.99 -0.73 -0.73
New River Outlet 10/16/12 -1 -1 DNQ, 1.9 DNQ, 2.4 -1 -1 -1 -1 -1 -1
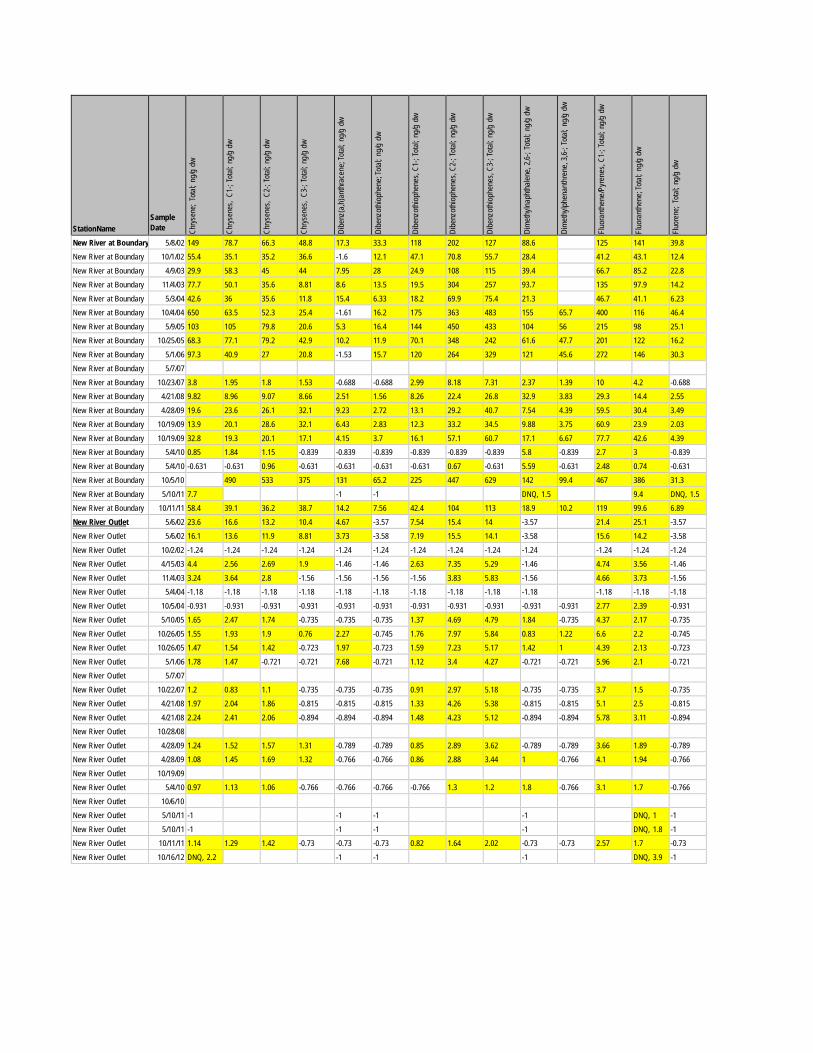
StationName
Sample Date Ch
rysen
e; To
tal; n
g/g d
w
Chrys
enes
, C1
-; To
tal; n
g/g d
w
Chrys
enes
, C2
-; To
tal; n
g/g d
w
Chrys
enes
, C3
-; To
tal; n
g/g d
w
Dibe
nz(a
,h)a
nthr
acen
e; To
tal; n
g/g d
w
Dibe
nzot
hioph
ene;
Total
; ng/g
dw
Dibe
nzot
hioph
enes
, C1-
; Tota
l; ng
/g d
w
Dibe
nzot
hioph
enes
, C2-
; Tota
l; ng
/g d
w
Dibe
nzot
hioph
enes
, C3-
; Tota
l; ng
/g d
w
Dim
ethy
lnaph
thale
ne, 2
,6-; T
otal;
ng/g
dw
Dim
ethy
lphen
anth
rene
, 3,6-
; Tota
l; ng
/g dw
Fluo
rant
hene
/Pyr
enes
, C1-
; Tota
l; ng
/g d
w
Fluo
rant
hene
; Tota
l; ng
/g d
w
Fluor
ene;
Total
; ng/g
dw
New River at Boundary 5/8/02 149 78.7 66.3 48.8 17.3 33.3 118 202 127 88.6 125 141 39.8 New River at Boundary 10/1/02 55.4 35.1 35.2 36.6 -1.6 12.1 47.1 70.8 55.7 28.4 41.2 43.1 12.4
New River at Boundary 4/9/03 29.9 58.3 45 44 7.95 28 24.9 108 115 39.4 66.7 85.2 22.8 New River at Boundary 11/4/03 77.7 50.1 35.6 8.81 8.6 13.5 19.5 304 257 93.7 135 97.9 14.2
New River at Boundary 5/3/04 42.6 36 35.6 11.8 15.4 6.33 18.2 69.9 75.4 21.3 46.7 41.1 6.23 New River at Boundary 10/4/04 650 63.5 52.3 25.4 -1.61 16.2 175 363 483 155 65.7 400 116 46.4
New River at Boundary 5/9/05 103 105 79.8 20.6 5.3 16.4 144 450 433 104 56 215 98 25.1 New River at Boundary 10/25/05 68.3 77.1 79.2 42.9 10.2 11.9 70.1 348 242 61.6 47.7 201 122 16.2
New River at Boundary 5/1/06 97.3 40.9 27 20.8 -1.53 15.7 120 264 329 121 45.6 272 146 30.3 New River at Boundary 5/7/07 New River at Boundary 10/23/07 3.8 1.95 1.8 1.53 -0.688 -0.688 2.99 8.18 7.31 2.37 1.39 10 4.2 -0.688 New River at Boundary 4/21/08 9.82 8.96 9.07 8.66 2.51 1.56 8.26 22.4 26.8 32.9 3.83 29.3 14.4 2.55
New River at Boundary 4/28/09 19.6 23.6 26.1 32.1 9.23 2.72 13.1 29.2 40.7 7.54 4.39 59.5 30.4 3.49 New River at Boundary 10/19/09 13.9 20.1 28.6 32.1 6.43 2.83 12.3 33.2 34.5 9.88 3.75 60.9 23.9 2.03
New River at Boundary 10/19/09 32.8 19.3 20.1 17.1 4.15 3.7 16.1 57.1 60.7 17.1 6.67 77.7 42.6 4.39 New River at Boundary 5/4/10 0.85 1.84 1.15 -0.839 -0.839 -0.839 -0.839 -0.839 -0.839 5.8 -0.839 2.7 3 -0.839
New River at Boundary 5/4/10 -0.631 -0.631 0.96 -0.631 -0.631 -0.631 -0.631 0.67 -0.631 5.59 -0.631 2.48 0.74 -0.631 New River at Boundary 10/5/10 490 533 375 131 65.2 225 447 629 142 99.4 467 386 31.3
New River at Boundary 5/10/11 7.7 -1 -1 DNQ, 1.5 9.4 DNQ, 1.5 New River at Boundary 10/11/11 58.4 39.1 36.2 38.7 14.2 7.56 42.4 104 113 18.9 10.2 119 99.6 6.89
New River Outlet 5/6/02 23.6 16.6 13.2 10.4 4.67 -3.57 7.54 15.4 14 -3.57 21.4 25.1 -3.57 New River Outlet 5/6/02 16.1 13.6 11.9 8.81 3.73 -3.58 7.19 15.5 14.1 -3.58 15.6 14.2 -3.58
New River Outlet 10/2/02 -1.24 -1.24 -1.24 -1.24 -1.24 -1.24 -1.24 -1.24 -1.24 -1.24 -1.24 -1.24 -1.24 New River Outlet 4/15/03 4.4 2.56 2.69 1.9 -1.46 -1.46 2.63 7.35 5.29 -1.46 4.74 3.56 -1.46
New River Outlet 11/4/03 3.24 3.64 2.8 -1.56 -1.56 -1.56 -1.56 3.83 5.83 -1.56 4.66 3.73 -1.56 New River Outlet 5/4/04 -1.18 -1.18 -1.18 -1.18 -1.18 -1.18 -1.18 -1.18 -1.18 -1.18 -1.18 -1.18 -1.18
New River Outlet 10/5/04 -0.931 -0.931 -0.931 -0.931 -0.931 -0.931 -0.931 -0.931 -0.931 -0.931 -0.931 2.77 2.39 -0.931 New River Outlet 5/10/05 1.65 2.47 1.74 -0.735 -0.735 -0.735 1.37 4.69 4.79 1.84 -0.735 4.37 2.17 -0.735
New River Outlet 10/26/05 1.55 1.93 1.9 0.76 2.27 -0.745 1.76 7.97 5.84 0.83 1.22 6.6 2.2 -0.745 New River Outlet 10/26/05 1.47 1.54 1.42 -0.723 1.97 -0.723 1.59 7.23 5.17 1.42 1 4.39 2.13 -0.723
New River Outlet 5/1/06 1.78 1.47 -0.721 -0.721 7.68 -0.721 1.12 3.4 4.27 -0.721 -0.721 5.96 2.1 -0.721 New River Outlet 5/7/07 New River Outlet 10/22/07 1.2 0.83 1.1 -0.735 -0.735 -0.735 0.91 2.97 5.18 -0.735 -0.735 3.7 1.5 -0.735 New River Outlet 4/21/08 1.97 2.04 1.86 -0.815 -0.815 -0.815 1.33 4.26 5.38 -0.815 -0.815 5.1 2.5 -0.815
New River Outlet 4/21/08 2.24 2.41 2.06 -0.894 -0.894 -0.894 1.48 4.23 5.12 -0.894 -0.894 5.78 3.11 -0.894 New River Outlet 10/28/08 New River Outlet 4/28/09 1.24 1.52 1.57 1.31 -0.789 -0.789 0.85 2.89 3.62 -0.789 -0.789 3.66 1.89 -0.789 New River Outlet 4/28/09 1.08 1.45 1.69 1.32 -0.766 -0.766 0.86 2.88 3.44 1 -0.766 4.1 1.94 -0.766
New River Outlet 10/19/09 New River Outlet 5/4/10 0.97 1.13 1.06 -0.766 -0.766 -0.766 -0.766 1.3 1.2 1.8 -0.766 3.1 1.7 -0.766
New River Outlet 10/6/10 New River Outlet 5/10/11 -1 -1 -1 -1 DNQ, 1 -1
New River Outlet 5/10/11 -1 -1 -1 -1 DNQ, 1.8 -1 New River Outlet 10/11/11 1.14 1.29 1.42 -0.73 -0.73 -0.73 0.82 1.64 2.02 -0.73 -0.73 2.57 1.7 -0.73
New River Outlet 10/16/12 DNQ, 2.2 -1 -1 -1 DNQ, 3.9 -1
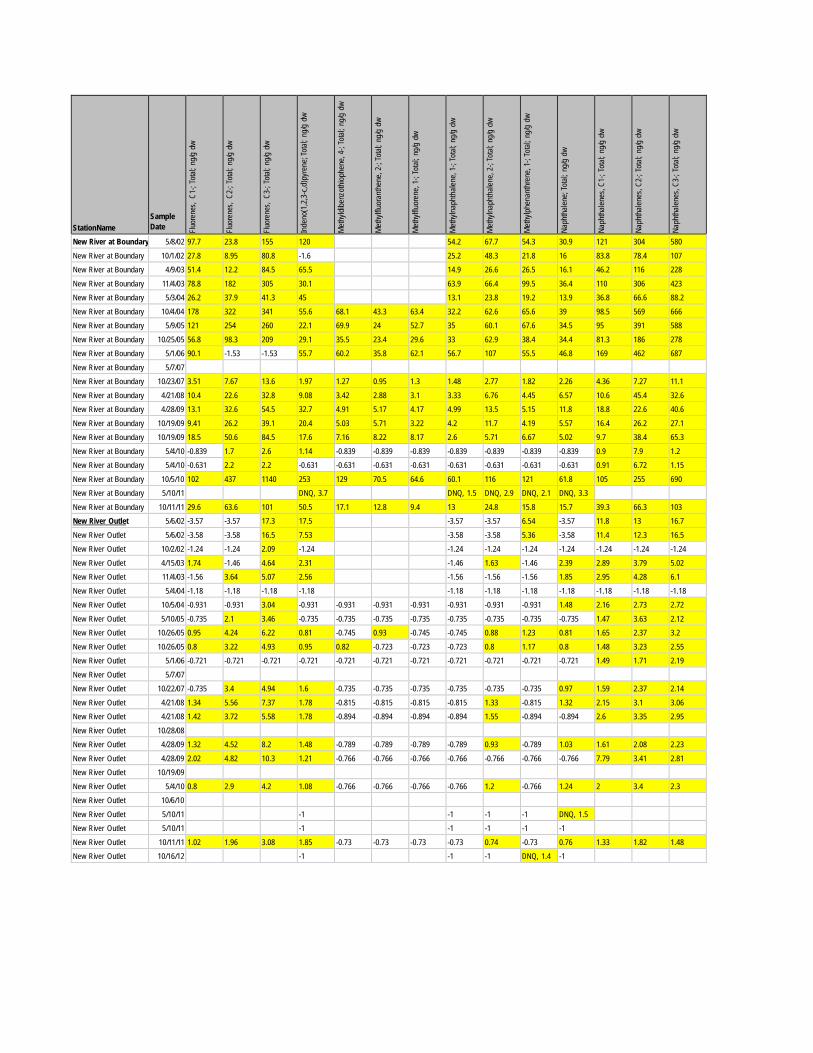
StationName
Sample Date Flu
oren
es, C
1-; T
otal;
ng/g
dw
Fluor
enes
, C2-
; Tota
l; ng
/g d
w
Fluor
enes
, C3-
; Tota
l; ng
/g d
w
Inde
no(1
,2,3
-c,d
)pyr
ene;
Total
; ng/g
dw
Met
hyldi
benz
othio
phen
e, 4
-; To
tal; n
g/g d
w
Met
hylflu
oran
then
e, 2
-; To
tal; n
g/g d
w
Met
hylflu
oren
e, 1
-; To
tal; n
g/g d
w
Met
hylna
phth
alene
, 1-;
Total
; ng/g
dw
Met
hylna
phth
alene
, 2-;
Total
; ng/g
dw
Met
hylph
enan
thre
ne, 1
-; To
tal; n
g/g d
w
Naph
thale
ne; T
otal;
ng/g
dw
Naph
thale
nes,
C1-;
Total
; ng/g
dw
Naph
thale
nes,
C2-;
Total
; ng/g
dw
Naph
thale
nes,
C3-;
Total
; ng/g
dw
New River at Boundary 5/8/02 97.7 23.8 155 120 54.2 67.7 54.3 30.9 121 304 580
New River at Boundary 10/1/02 27.8 8.95 80.8 -1.6 25.2 48.3 21.8 16 83.8 78.4 107 New River at Boundary 4/9/03 51.4 12.2 84.5 65.5 14.9 26.6 26.5 16.1 46.2 116 228
New River at Boundary 11/4/03 78.8 182 305 30.1 63.9 66.4 99.5 36.4 110 306 423 New River at Boundary 5/3/04 26.2 37.9 41.3 45 13.1 23.8 19.2 13.9 36.8 66.6 88.2
New River at Boundary 10/4/04 178 322 341 55.6 68.1 43.3 63.4 32.2 62.6 65.6 39 98.5 569 666 New River at Boundary 5/9/05 121 254 260 22.1 69.9 24 52.7 35 60.1 67.6 34.5 95 391 588
New River at Boundary 10/25/05 56.8 98.3 209 29.1 35.5 23.4 29.6 33 62.9 38.4 34.4 81.3 186 278 New River at Boundary 5/1/06 90.1 -1.53 -1.53 55.7 60.2 35.8 62.1 56.7 107 55.5 46.8 169 462 687
New River at Boundary 5/7/07 New River at Boundary 10/23/07 3.51 7.67 13.6 1.97 1.27 0.95 1.3 1.48 2.77 1.82 2.26 4.36 7.27 11.1
New River at Boundary 4/21/08 10.4 22.6 32.8 9.08 3.42 2.88 3.1 3.33 6.76 4.45 6.57 10.6 45.4 32.6 New River at Boundary 4/28/09 13.1 32.6 54.5 32.7 4.91 5.17 4.17 4.99 13.5 5.15 11.8 18.8 22.6 40.6
New River at Boundary 10/19/09 9.41 26.2 39.1 20.4 5.03 5.71 3.22 4.2 11.7 4.19 5.57 16.4 26.2 27.1 New River at Boundary 10/19/09 18.5 50.6 84.5 17.6 7.16 8.22 8.17 2.6 5.71 6.67 5.02 9.7 38.4 65.3
New River at Boundary 5/4/10 -0.839 1.7 2.6 1.14 -0.839 -0.839 -0.839 -0.839 -0.839 -0.839 -0.839 0.9 7.9 1.2 New River at Boundary 5/4/10 -0.631 2.2 2.2 -0.631 -0.631 -0.631 -0.631 -0.631 -0.631 -0.631 -0.631 0.91 6.72 1.15
New River at Boundary 10/5/10 102 437 1140 253 129 70.5 64.6 60.1 116 121 61.8 105 255 690 New River at Boundary 5/10/11 DNQ, 3.7 DNQ, 1.5 DNQ, 2.9 DNQ, 2.1 DNQ, 3.3 New River at Boundary 10/11/11 29.6 63.6 101 50.5 17.1 12.8 9.4 13 24.8 15.8 15.7 39.3 66.3 103 New River Outlet 5/6/02 -3.57 -3.57 17.3 17.5 -3.57 -3.57 6.54 -3.57 11.8 13 16.7
New River Outlet 5/6/02 -3.58 -3.58 16.5 7.53 -3.58 -3.58 5.36 -3.58 11.4 12.3 16.5 New River Outlet 10/2/02 -1.24 -1.24 2.09 -1.24 -1.24 -1.24 -1.24 -1.24 -1.24 -1.24 -1.24
New River Outlet 4/15/03 1.74 -1.46 4.64 2.31 -1.46 1.63 -1.46 2.39 2.89 3.79 5.02 New River Outlet 11/4/03 -1.56 3.64 5.07 2.56 -1.56 -1.56 -1.56 1.85 2.95 4.28 6.1
New River Outlet 5/4/04 -1.18 -1.18 -1.18 -1.18 -1.18 -1.18 -1.18 -1.18 -1.18 -1.18 -1.18 New River Outlet 10/5/04 -0.931 -0.931 3.04 -0.931 -0.931 -0.931 -0.931 -0.931 -0.931 -0.931 1.48 2.16 2.73 2.72
New River Outlet 5/10/05 -0.735 2.1 3.46 -0.735 -0.735 -0.735 -0.735 -0.735 -0.735 -0.735 -0.735 1.47 3.63 2.12 New River Outlet 10/26/05 0.95 4.24 6.22 0.81 -0.745 0.93 -0.745 -0.745 0.88 1.23 0.81 1.65 2.37 3.2
New River Outlet 10/26/05 0.8 3.22 4.93 0.95 0.82 -0.723 -0.723 -0.723 0.8 1.17 0.8 1.48 3.23 2.55 New River Outlet 5/1/06 -0.721 -0.721 -0.721 -0.721 -0.721 -0.721 -0.721 -0.721 -0.721 -0.721 -0.721 1.49 1.71 2.19
New River Outlet 5/7/07 New River Outlet 10/22/07 -0.735 3.4 4.94 1.6 -0.735 -0.735 -0.735 -0.735 -0.735 -0.735 0.97 1.59 2.37 2.14
New River Outlet 4/21/08 1.34 5.56 7.37 1.78 -0.815 -0.815 -0.815 -0.815 1.33 -0.815 1.32 2.15 3.1 3.06 New River Outlet 4/21/08 1.42 3.72 5.58 1.78 -0.894 -0.894 -0.894 -0.894 1.55 -0.894 -0.894 2.6 3.35 2.95
New River Outlet 10/28/08 New River Outlet 4/28/09 1.32 4.52 8.2 1.48 -0.789 -0.789 -0.789 -0.789 0.93 -0.789 1.03 1.61 2.08 2.23
New River Outlet 4/28/09 2.02 4.82 10.3 1.21 -0.766 -0.766 -0.766 -0.766 -0.766 -0.766 -0.766 7.79 3.41 2.81 New River Outlet 10/19/09 New River Outlet 5/4/10 0.8 2.9 4.2 1.08 -0.766 -0.766 -0.766 -0.766 1.2 -0.766 1.24 2 3.4 2.3 New River Outlet 10/6/10 New River Outlet 5/10/11 -1 -1 -1 -1 DNQ, 1.5 New River Outlet 5/10/11 -1 -1 -1 -1 -1 New River Outlet 10/11/11 1.02 1.96 3.08 1.85 -0.73 -0.73 -0.73 -0.73 0.74 -0.73 0.76 1.33 1.82 1.48 New River Outlet 10/16/12 -1 -1 -1 DNQ, 1.4 -1
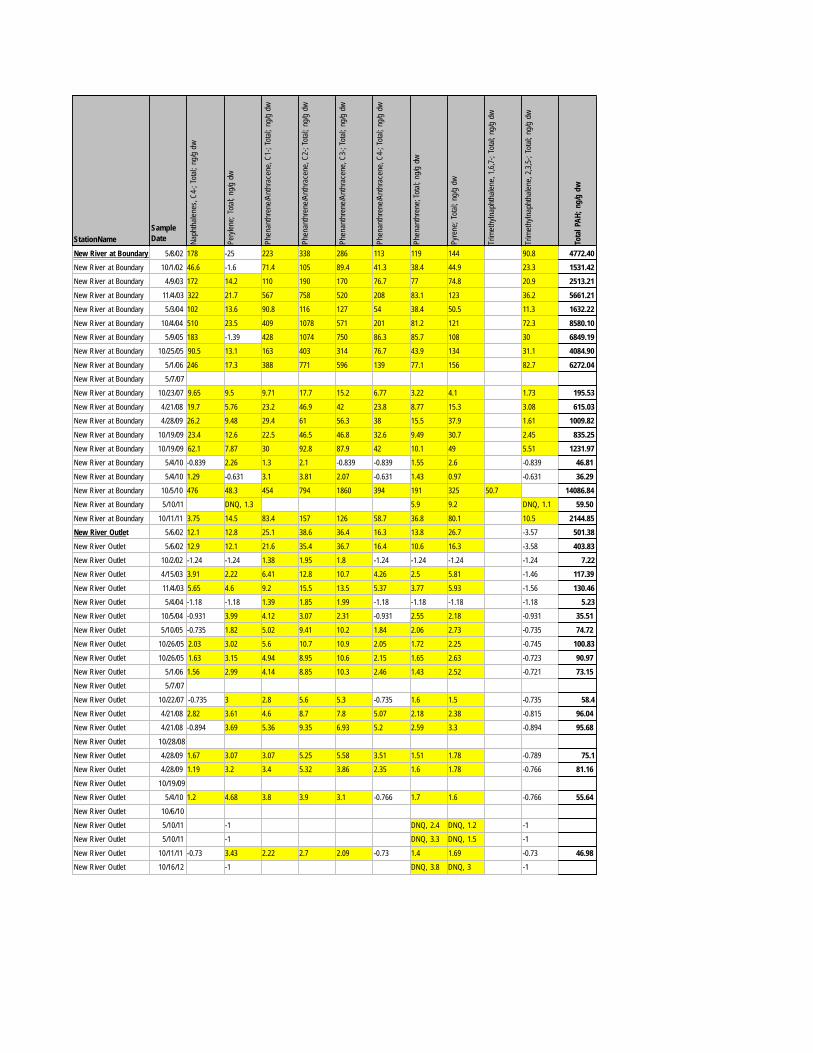
Naph
thale
nes,
C4-;
Total
; ng/g
dw
Pery
lene;
Total
; ng/g
dw
Phen
anth
rene
/Ant
hrac
ene,
C1-
; Tota
l; ng
/g dw
Phen
anth
rene
/Ant
hrac
ene,
C2-
; Tota
l; ng
/g dw
Phen
anth
rene
/Ant
hrac
ene,
C3-
; Tota
l; ng
/g dw
Phen
anth
rene
/Ant
hrac
ene,
C4-
; Tota
l; ng
/g dw
Phen
anth
rene
; Tota
l; ng
/g d
w
Pyre
ne; T
otal;
ng/g
dw
Trim
ethy
lnaph
thale
ne, 1
,6,7-
; Tot
al; n
g/g d
w
Trim
ethy
lnaph
thale
ne, 2
,3,5-
; Tot
al; n
g/g d
w
Tota
l PAH
; ng/
g dw
StationName Sample Date
New River at Boundary 5/8/02 178 -25 223 338 286 113 119 144 90.8 4772.40 New River at Boundary 10/1/02 46.6 -1.6 71.4 105 89.4 41.3 38.4 44.9 23.3 1531.42 New River at Boundary 4/9/03 172 14.2 110 190 170 76.7 77 74.8 20.9 2513.21
New River at Boundary 11/4/03 322 21.7 567 758 520 208 83.1 123 36.2 5661.21 New River at Boundary 5/3/04 102 13.6 90.8 116 127 54 38.4 50.5 11.3 1632.22
New River at Boundary 10/4/04 510 23.5 409 1078 571 201 81.2 121 72.3 8580.10 New River at Boundary 5/9/05 183 -1.39 428 1074 750 86.3 85.7 108 30 6849.19 New River at Boundary 10/25/05 90.5 13.1 163 403 314 76.7 43.9 134 31.1 4084.90
New River at Boundary 5/1/06 246 17.3 388 771 596 139 77.1 156 82.7 6272.04 New River at Boundary 5/7/07 New River at Boundary 10/23/07 9.65 9.5 9.71 17.7 15.2 6.77 3.22 4.1 1.73 195.53
New River at Boundary 4/21/08 19.7 5.76 23.2 46.9 42 23.8 8.77 15.3 3.08 615.03 New River at Boundary 4/28/09 26.2 9.48 29.4 61 56.3 38 15.5 37.9 1.61 1009.82
New River at Boundary 10/19/09 23.4 12.6 22.5 46.5 46.8 32.6 9.49 30.7 2.45 835.25 New River at Boundary 10/19/09 62.1 7.87 30 92.8 87.9 42 10.1 49 5.51 1231.97 New River at Boundary 5/4/10 -0.839 2.26 1.3 2.1 -0.839 -0.839 1.55 2.6 -0.839 46.81
New River at Boundary 5/4/10 1.29 -0.631 3.1 3.81 2.07 -0.631 1.43 0.97 -0.631 36.29 New River at Boundary 10/5/10 476 48.3 454 794 1860 394 191 325 50.7 14086.84 New River at Boundary 5/10/11 DNQ, 1.3 5.9 9.2 DNQ, 1.1 59.50
New River at Boundary 10/11/11 3.75 14.5 83.4 157 126 58.7 36.8 80.1 10.5 2144.85 New River Outlet 5/6/02 12.1 12.8 25.1 38.6 36.4 16.3 13.8 26.7 -3.57 501.38
New River Outlet 5/6/02 12.9 12.1 21.6 35.4 36.7 16.4 10.6 16.3 -3.58 403.83 New River Outlet 10/2/02 -1.24 -1.24 1.38 1.95 1.8 -1.24 -1.24 -1.24 -1.24 7.22 New River Outlet 4/15/03 3.91 2.22 6.41 12.8 10.7 4.26 2.5 5.81 -1.46 117.39
New River Outlet 11/4/03 5.65 4.6 9.2 15.5 13.5 5.37 3.77 5.93 -1.56 130.46 New River Outlet 5/4/04 -1.18 -1.18 1.39 1.85 1.99 -1.18 -1.18 -1.18 -1.18 5.23 New River Outlet 10/5/04 -0.931 3.99 4.12 3.07 2.31 -0.931 2.55 2.18 -0.931 35.51
New River Outlet 5/10/05 -0.735 1.82 5.02 9.41 10.2 1.84 2.06 2.73 -0.735 74.72 New River Outlet 10/26/05 2.03 3.02 5.6 10.7 10.9 2.05 1.72 2.25 -0.745 100.83
New River Outlet 10/26/05 1.63 3.15 4.94 8.95 10.6 2.15 1.65 2.63 -0.723 90.97 New River Outlet 5/1/06 1.56 2.99 4.14 8.85 10.3 2.46 1.43 2.52 -0.721 73.15 New River Outlet 5/7/07
New River Outlet 10/22/07 -0.735 3 2.8 5.6 5.3 -0.735 1.6 1.5 -0.735 58.4 New River Outlet 4/21/08 2.82 3.61 4.6 8.7 7.8 5.07 2.18 2.38 -0.815 96.04 New River Outlet 4/21/08 -0.894 3.69 5.36 9.35 6.93 5.2 2.59 3.3 -0.894 95.68
New River Outlet 10/28/08 New River Outlet 4/28/09 1.67 3.07 3.07 5.25 5.58 3.51 1.51 1.78 -0.789 75.1 New River Outlet 4/28/09 1.19 3.2 3.4 5.32 3.86 2.35 1.6 1.78 -0.766 81.16
New River Outlet 10/19/09 New River Outlet 5/4/10 1.2 4.68 3.8 3.9 3.1 -0.766 1.7 1.6 -0.766 55.64
New River Outlet 10/6/10 New River Outlet 5/10/11 -1 DNQ, 2.4 DNQ, 1.2 -1 New River Outlet 5/10/11 -1 DNQ, 3.3 DNQ, 1.5 -1
New River Outlet 10/11/11 -0.73 3.43 2.22 2.7 2.09 -0.73 1.4 1.69 -0.73 46.98 New River Outlet 10/16/12 -1 DNQ, 3.8 DNQ, 3 -1
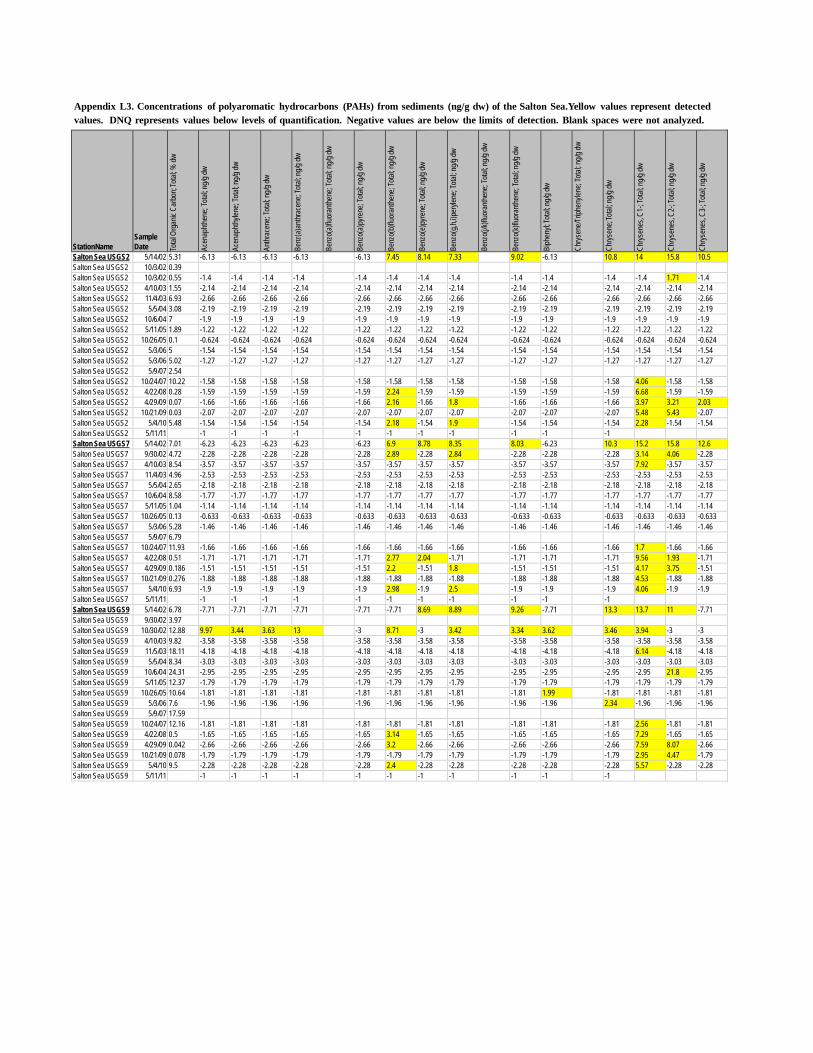
Appendix L3. Concentrations of polyaromatic hydrocarbons (PAHs) from sediments (ng/g dw) of the Salton Sea.Yellow values represent detected values. DNQ represents values below levels of quantification. Negative values are below the limits of detection. Blank spaces were not analyzed.
StationName
Sample Date To
tal O
rgan
ic Ca
rbon
; Tota
l; % dw
Acen
aphth
ene;
Total
; ng/g
dw
Acen
aphth
ylene
; Tota
l; ng/g
dw
Anthr
acen
e; To
tal; n
g/g dw
Benz
(a)a
nthra
cene
; Tota
l; ng/g
dw
Benz
o(a)
fluor
anthe
ne; T
otal; n
g/g dw
Benz
o(a)
pyre
ne; T
otal; n
g/g dw
Benz
o(b)
fluor
anthe
ne; T
otal; n
g/g dw
Benz
o(e)
pyre
ne; T
otal; n
g/g dw
Benz
o(g,h
,i)pe
rylen
e; To
tal; n
g/g dw
Benz
o(j/k
)fluor
anthe
ne; T
otal; n
g/g dw
Benz
o(k)f
luora
nthen
e; To
tal; n
g/g dw
Biph
enyl;
Total
; ng/g
dw
Chrys
ene/T
riphe
nylen
e; To
tal; n
g/g dw
Chrys
ene;
Total
; ng/g
dw
Chrys
enes
, C1-
; Tota
l; ng/g
dw
Chrys
enes
, C2-
; Tota
l; ng/g
dw
Chrys
enes
, C3-
; Tota
l; ng/g
dw
Salton Sea USGS2 5/14/02 5.31 -6.13 -6.13 -6.13 -6.13 -6.13 7.45 8.14 7.33 9.02 -6.13 10.8 14 15.8 10.5 Salton Sea USGS2 10/3/02 0.39 Salton Sea USGS2 10/3/02 0.55 -1.4 -1.4 -1.4 -1.4 -1.4 -1.4 -1.4 -1.4 -1.4 -1.4 -1.4 -1.4 1.71 -1.4 Salton Sea USGS2 4/10/03 1.55 -2.14 -2.14 -2.14 -2.14 -2.14 -2.14 -2.14 -2.14 -2.14 -2.14 -2.14 -2.14 -2.14 -2.14 Salton Sea USGS2 11/4/03 6.93 -2.66 -2.66 -2.66 -2.66 -2.66 -2.66 -2.66 -2.66 -2.66 -2.66 -2.66 -2.66 -2.66 -2.66 Salton Sea USGS2 5/5/04 3.08 -2.19 -2.19 -2.19 -2.19 -2.19 -2.19 -2.19 -2.19 -2.19 -2.19 -2.19 -2.19 -2.19 -2.19 Salton Sea USGS2 10/6/04 7 -1.9 -1.9 -1.9 -1.9 -1.9 -1.9 -1.9 -1.9 -1.9 -1.9 -1.9 -1.9 -1.9 -1.9 Salton Sea USGS2 5/11/05 1.89 -1.22 -1.22 -1.22 -1.22 -1.22 -1.22 -1.22 -1.22 -1.22 -1.22 -1.22 -1.22 -1.22 -1.22 Salton Sea USGS2 10/26/05 0.1 -0.624 -0.624 -0.624 -0.624 -0.624 -0.624 -0.624 -0.624 -0.624 -0.624 -0.624 -0.624 -0.624 -0.624 Salton Sea USGS2 5/3/06 5 -1.54 -1.54 -1.54 -1.54 -1.54 -1.54 -1.54 -1.54 -1.54 -1.54 -1.54 -1.54 -1.54 -1.54 Salton Sea USGS2 5/3/06 5.02 -1.27 -1.27 -1.27 -1.27 -1.27 -1.27 -1.27 -1.27 -1.27 -1.27 -1.27 -1.27 -1.27 -1.27 Salton Sea USGS2 5/9/07 2.54 Salton Sea USGS2 10/24/07 10.22 -1.58 -1.58 -1.58 -1.58 -1.58 -1.58 -1.58 -1.58 -1.58 -1.58 -1.58 4.06 -1.58 -1.58 Salton Sea USGS2 4/22/08 0.28 -1.59 -1.59 -1.59 -1.59 -1.59 2.24 -1.59 -1.59 -1.59 -1.59 -1.59 6.68 -1.59 -1.59 Salton Sea USGS2 4/29/09 0.07 -1.66 -1.66 -1.66 -1.66 -1.66 2.16 -1.66 1.8 -1.66 -1.66 -1.66 3.97 3.21 2.03 Salton Sea USGS2 10/21/09 0.03 -2.07 -2.07 -2.07 -2.07 -2.07 -2.07 -2.07 -2.07 -2.07 -2.07 -2.07 5.48 5.43 -2.07 Salton Sea USGS2 5/4/10 5.48 -1.54 -1.54 -1.54 -1.54 -1.54 2.18 -1.54 1.9 -1.54 -1.54 -1.54 2.28 -1.54 -1.54 Salton Sea USGS2 5/11/11 -1 -1 -1 -1 -1 -1 -1 -1 -1 -1 -1 Salton Sea USGS7 5/14/02 7.01 -6.23 -6.23 -6.23 -6.23 -6.23 6.9 8.78 8.35 8.03 -6.23 10.3 15.2 15.8 12.6 Salton Sea USGS7 9/30/02 4.72 -2.28 -2.28 -2.28 -2.28 -2.28 2.89 -2.28 2.84 -2.28 -2.28 -2.28 3.14 4.06 -2.28 Salton Sea USGS7 4/10/03 8.54 -3.57 -3.57 -3.57 -3.57 -3.57 -3.57 -3.57 -3.57 -3.57 -3.57 -3.57 7.92 -3.57 -3.57 Salton Sea USGS7 11/4/03 4.96 -2.53 -2.53 -2.53 -2.53 -2.53 -2.53 -2.53 -2.53 -2.53 -2.53 -2.53 -2.53 -2.53 -2.53 Salton Sea USGS7 5/5/04 2.65 -2.18 -2.18 -2.18 -2.18 -2.18 -2.18 -2.18 -2.18 -2.18 -2.18 -2.18 -2.18 -2.18 -2.18 Salton Sea USGS7 10/6/04 8.58 -1.77 -1.77 -1.77 -1.77 -1.77 -1.77 -1.77 -1.77 -1.77 -1.77 -1.77 -1.77 -1.77 -1.77 Salton Sea USGS7 5/11/05 1.04 -1.14 -1.14 -1.14 -1.14 -1.14 -1.14 -1.14 -1.14 -1.14 -1.14 -1.14 -1.14 -1.14 -1.14 Salton Sea USGS7 10/26/05 0.13 -0.633 -0.633 -0.633 -0.633 -0.633 -0.633 -0.633 -0.633 -0.633 -0.633 -0.633 -0.633 -0.633 -0.633 Salton Sea USGS7 5/3/06 5.28 -1.46 -1.46 -1.46 -1.46 -1.46 -1.46 -1.46 -1.46 -1.46 -1.46 -1.46 -1.46 -1.46 -1.46 Salton Sea USGS7 5/9/07 6.79 Salton Sea USGS7 10/24/07 11.93 -1.66 -1.66 -1.66 -1.66 -1.66 -1.66 -1.66 -1.66 -1.66 -1.66 -1.66 1.7 -1.66 -1.66 Salton Sea USGS7 4/22/08 0.51 -1.71 -1.71 -1.71 -1.71 -1.71 2.77 2.04 -1.71 -1.71 -1.71 -1.71 9.56 1.93 -1.71 Salton Sea USGS7 4/29/09 0.186 -1.51 -1.51 -1.51 -1.51 -1.51 2.2 -1.51 1.8 -1.51 -1.51 -1.51 4.17 3.75 -1.51 Salton Sea USGS7 10/21/09 0.276 -1.88 -1.88 -1.88 -1.88 -1.88 -1.88 -1.88 -1.88 -1.88 -1.88 -1.88 4.53 -1.88 -1.88 Salton Sea USGS7 5/4/10 6.93 -1.9 -1.9 -1.9 -1.9 -1.9 2.98 -1.9 2.5 -1.9 -1.9 -1.9 4.06 -1.9 -1.9 Salton Sea USGS7 5/11/11 -1 -1 -1 -1 -1 -1 -1 -1 -1 -1 -1 Salton Sea USGS9 5/14/02 6.78 -7.71 -7.71 -7.71 -7.71 -7.71 -7.71 8.69 8.89 9.26 -7.71 13.3 13.7 11 -7.71 Salton Sea USGS9 9/30/02 3.97 Salton Sea USGS9 10/30/02 12.88 9.97 3.44 3.63 13 -3 8.71 -3 3.42 3.34 3.62 3.46 3.94 -3 -3 Salton Sea USGS9 4/10/03 9.82 -3.58 -3.58 -3.58 -3.58 -3.58 -3.58 -3.58 -3.58 -3.58 -3.58 -3.58 -3.58 -3.58 -3.58 Salton Sea USGS9 11/5/03 18.11 -4.18 -4.18 -4.18 -4.18 -4.18 -4.18 -4.18 -4.18 -4.18 -4.18 -4.18 6.14 -4.18 -4.18 Salton Sea USGS9 5/5/04 8.34 -3.03 -3.03 -3.03 -3.03 -3.03 -3.03 -3.03 -3.03 -3.03 -3.03 -3.03 -3.03 -3.03 -3.03 Salton Sea USGS9 10/6/04 24.31 -2.95 -2.95 -2.95 -2.95 -2.95 -2.95 -2.95 -2.95 -2.95 -2.95 -2.95 -2.95 21.8 -2.95 Salton Sea USGS9 5/11/05 12.37 -1.79 -1.79 -1.79 -1.79 -1.79 -1.79 -1.79 -1.79 -1.79 -1.79 -1.79 -1.79 -1.79 -1.79 Salton Sea USGS9 10/26/05 10.64 -1.81 -1.81 -1.81 -1.81 -1.81 -1.81 -1.81 -1.81 -1.81 1.99 -1.81 -1.81 -1.81 -1.81 Salton Sea USGS9 5/3/06 7.6 -1.96 -1.96 -1.96 -1.96 -1.96 -1.96 -1.96 -1.96 -1.96 -1.96 2.34 -1.96 -1.96 -1.96 Salton Sea USGS9 5/9/07 17.59 Salton Sea USGS9 10/24/07 12.16 -1.81 -1.81 -1.81 -1.81 -1.81 -1.81 -1.81 -1.81 -1.81 -1.81 -1.81 2.56 -1.81 -1.81 Salton Sea USGS9 4/22/08 0.5 -1.65 -1.65 -1.65 -1.65 -1.65 3.14 -1.65 -1.65 -1.65 -1.65 -1.65 7.29 -1.65 -1.65 Salton Sea USGS9 4/29/09 0.042 -2.66 -2.66 -2.66 -2.66 -2.66 3.2 -2.66 -2.66 -2.66 -2.66 -2.66 7.59 8.07 -2.66 Salton Sea USGS9 10/21/09 0.078 -1.79 -1.79 -1.79 -1.79 -1.79 -1.79 -1.79 -1.79 -1.79 -1.79 -1.79 2.95 4.47 -1.79 Salton Sea USGS9 5/4/10 9.5 -2.28 -2.28 -2.28 -2.28 -2.28 2.4 -2.28 -2.28 -2.28 -2.28 -2.28 5.57 -2.28 -2.28 Salton Sea USGS9 5/11/11 -1 -1 -1 -1 -1 -1 -1 -1 -1 -1 -1
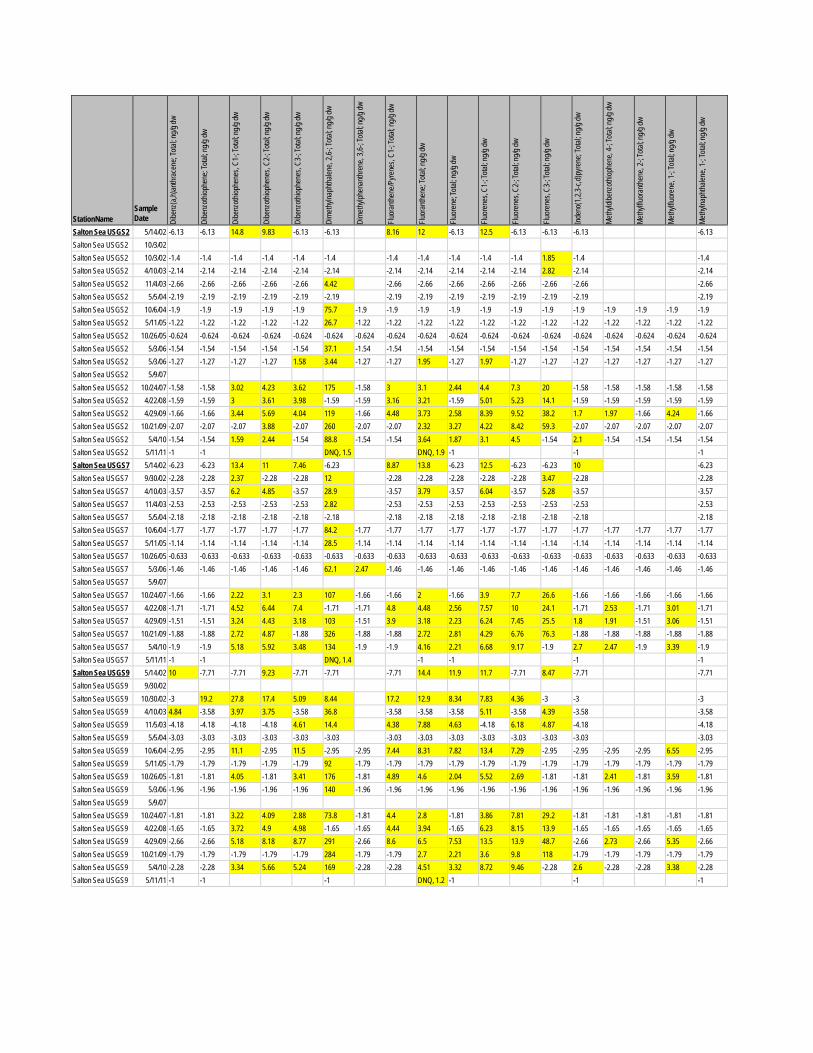
StationName
Sample Date Di
benz
(a,h)
anthr
acen
e; To
tal; n
g/g dw
Dibe
nzoth
iophe
ne; T
otal; n
g/g dw
Dibe
nzoth
iophe
nes,
C1-; T
otal; n
g/g dw
Dibe
nzoth
iophe
nes,
C2-; T
otal; n
g/g dw
Dibe
nzoth
iophe
nes,
C3-; T
otal; n
g/g dw
Dime
thylna
phtha
lene,
2,6-;
Total
; ng/g
dw
Dime
thylph
enan
thren
e, 3,6
-; Tot
al; ng
/g dw
Fluor
anthe
ne/P
yrene
s, C1
-; Tota
l; ng/g
dw
Fluor
anthe
ne; T
otal; n
g/g dw
Fluor
ene;
Total
; ng/g
dw
Fluor
enes
, C1-
; Tota
l; ng/g
dw
Fluor
enes
, C2-
; Tota
l; ng/g
dw
Fluor
enes
, C3-
; Tota
l; ng/g
dw
Inden
o(1,2
,3-c,d
)pyre
ne; T
otal; n
g/g dw
Methy
ldibe
nzoth
iophe
ne, 4
-; To
tal; n
g/g dw
Methy
lfluor
anthe
ne, 2
-; To
tal; n
g/g dw
Methy
lfluor
ene,
1-; T
otal;
ng/g
dw
Methy
lnaph
thalen
e, 1-
; Tot
al; ng
/g dw
Salton Sea USGS2 5/14/02 -6.13 -6.13 14.8 9.83 -6.13 -6.13 8.16 12 -6.13 12.5 -6.13 -6.13 -6.13 -6.13 Salton Sea USGS2 10/3/02 Salton Sea USGS2 10/3/02 -1.4 -1.4 -1.4 -1.4 -1.4 -1.4 -1.4 -1.4 -1.4 -1.4 -1.4 1.85 -1.4 -1.4 Salton Sea USGS2 4/10/03 -2.14 -2.14 -2.14 -2.14 -2.14 -2.14 -2.14 -2.14 -2.14 -2.14 -2.14 2.82 -2.14 -2.14 Salton Sea USGS2 11/4/03 -2.66 -2.66 -2.66 -2.66 -2.66 4.42 -2.66 -2.66 -2.66 -2.66 -2.66 -2.66 -2.66 -2.66 Salton Sea USGS2 5/5/04 -2.19 -2.19 -2.19 -2.19 -2.19 -2.19 -2.19 -2.19 -2.19 -2.19 -2.19 -2.19 -2.19 -2.19 Salton Sea USGS2 10/6/04 -1.9 -1.9 -1.9 -1.9 -1.9 75.7 -1.9 -1.9 -1.9 -1.9 -1.9 -1.9 -1.9 -1.9 -1.9 -1.9 -1.9 -1.9 Salton Sea USGS2 5/11/05 -1.22 -1.22 -1.22 -1.22 -1.22 26.7 -1.22 -1.22 -1.22 -1.22 -1.22 -1.22 -1.22 -1.22 -1.22 -1.22 -1.22 -1.22 Salton Sea USGS2 10/26/05 -0.624 -0.624 -0.624 -0.624 -0.624 -0.624 -0.624 -0.624 -0.624 -0.624 -0.624 -0.624 -0.624 -0.624 -0.624 -0.624 -0.624 -0.624 Salton Sea USGS2 5/3/06 -1.54 -1.54 -1.54 -1.54 -1.54 37.1 -1.54 -1.54 -1.54 -1.54 -1.54 -1.54 -1.54 -1.54 -1.54 -1.54 -1.54 -1.54 Salton Sea USGS2 5/3/06 -1.27 -1.27 -1.27 -1.27 1.58 3.44 -1.27 -1.27 1.95 -1.27 1.97 -1.27 -1.27 -1.27 -1.27 -1.27 -1.27 -1.27 Salton Sea USGS2 5/9/07 Salton Sea USGS2 10/24/07 -1.58 -1.58 3.02 4.23 3.62 175 -1.58 3 3.1 2.44 4.4 7.3 20 -1.58 -1.58 -1.58 -1.58 -1.58 Salton Sea USGS2 4/22/08 -1.59 -1.59 3 3.61 3.98 -1.59 -1.59 3.16 3.21 -1.59 5.01 5.23 14.1 -1.59 -1.59 -1.59 -1.59 -1.59 Salton Sea USGS2 4/29/09 -1.66 -1.66 3.44 5.69 4.04 119 -1.66 4.48 3.73 2.58 8.39 9.52 38.2 1.7 1.97 -1.66 4.24 -1.66 Salton Sea USGS2 10/21/09 -2.07 -2.07 -2.07 3.88 -2.07 260 -2.07 -2.07 2.32 3.27 4.22 8.42 59.3 -2.07 -2.07 -2.07 -2.07 -2.07 Salton Sea USGS2 5/4/10 -1.54 -1.54 1.59 2.44 -1.54 88.8 -1.54 -1.54 3.64 1.87 3.1 4.5 -1.54 2.1 -1.54 -1.54 -1.54 -1.54 Salton Sea USGS2 5/11/11 -1 -1 DNQ, 1.5 DNQ, 1.9 -1 -1 -1 Salton Sea USGS7 5/14/02 -6.23 -6.23 13.4 11 7.46 -6.23 8.87 13.8 -6.23 12.5 -6.23 -6.23 10 -6.23 Salton Sea USGS7 9/30/02 -2.28 -2.28 2.37 -2.28 -2.28 12 -2.28 -2.28 -2.28 -2.28 -2.28 3.47 -2.28 -2.28 Salton Sea USGS7 4/10/03 -3.57 -3.57 6.2 4.85 -3.57 28.9 -3.57 3.79 -3.57 6.04 -3.57 5.28 -3.57 -3.57 Salton Sea USGS7 11/4/03 -2.53 -2.53 -2.53 -2.53 -2.53 2.82 -2.53 -2.53 -2.53 -2.53 -2.53 -2.53 -2.53 -2.53 Salton Sea USGS7 5/5/04 -2.18 -2.18 -2.18 -2.18 -2.18 -2.18 -2.18 -2.18 -2.18 -2.18 -2.18 -2.18 -2.18 -2.18 Salton Sea USGS7 10/6/04 -1.77 -1.77 -1.77 -1.77 -1.77 84.2 -1.77 -1.77 -1.77 -1.77 -1.77 -1.77 -1.77 -1.77 -1.77 -1.77 -1.77 -1.77 Salton Sea USGS7 5/11/05 -1.14 -1.14 -1.14 -1.14 -1.14 28.5 -1.14 -1.14 -1.14 -1.14 -1.14 -1.14 -1.14 -1.14 -1.14 -1.14 -1.14 -1.14 Salton Sea USGS7 10/26/05 -0.633 -0.633 -0.633 -0.633 -0.633 -0.633 -0.633 -0.633 -0.633 -0.633 -0.633 -0.633 -0.633 -0.633 -0.633 -0.633 -0.633 -0.633 Salton Sea USGS7 5/3/06 -1.46 -1.46 -1.46 -1.46 -1.46 62.1 2.47 -1.46 -1.46 -1.46 -1.46 -1.46 -1.46 -1.46 -1.46 -1.46 -1.46 -1.46 Salton Sea USGS7 5/9/07 Salton Sea USGS7 10/24/07 -1.66 -1.66 2.22 3.1 2.3 107 -1.66 -1.66 2 -1.66 3.9 7.7 26.6 -1.66 -1.66 -1.66 -1.66 -1.66 Salton Sea USGS7 4/22/08 -1.71 -1.71 4.52 6.44 7.4 -1.71 -1.71 4.8 4.48 2.56 7.57 10 24.1 -1.71 2.53 -1.71 3.01 -1.71 Salton Sea USGS7 4/29/09 -1.51 -1.51 3.24 4.43 3.18 103 -1.51 3.9 3.18 2.23 6.24 7.45 25.5 1.8 1.91 -1.51 3.06 -1.51 Salton Sea USGS7 10/21/09 -1.88 -1.88 2.72 4.87 -1.88 326 -1.88 -1.88 2.72 2.81 4.29 6.76 76.3 -1.88 -1.88 -1.88 -1.88 -1.88 Salton Sea USGS7 5/4/10 -1.9 -1.9 5.18 5.92 3.48 134 -1.9 -1.9 4.16 2.21 6.68 9.17 -1.9 2.7 2.47 -1.9 3.39 -1.9 Salton Sea USGS7 5/11/11 -1 -1 DNQ, 1.4 -1 -1 -1 -1 Salton Sea USGS9 5/14/02 10 -7.71 -7.71 9.23 -7.71 -7.71 -7.71 14.4 11.9 11.7 -7.71 8.47 -7.71 -7.71 Salton Sea USGS9 9/30/02 Salton Sea USGS9 10/30/02 -3 19.2 27.8 17.4 5.09 8.44 17.2 12.9 8.34 7.83 4.36 -3 -3 -3 Salton Sea USGS9 4/10/03 4.84 -3.58 3.97 3.75 -3.58 36.8 -3.58 -3.58 -3.58 5.11 -3.58 4.39 -3.58 -3.58 Salton Sea USGS9 11/5/03 -4.18 -4.18 -4.18 -4.18 4.61 14.4 4.38 7.88 4.63 -4.18 6.18 4.87 -4.18 -4.18 Salton Sea USGS9 5/5/04 -3.03 -3.03 -3.03 -3.03 -3.03 -3.03 -3.03 -3.03 -3.03 -3.03 -3.03 -3.03 -3.03 -3.03 Salton Sea USGS9 10/6/04 -2.95 -2.95 11.1 -2.95 11.5 -2.95 -2.95 7.44 8.31 7.82 13.4 7.29 -2.95 -2.95 -2.95 -2.95 6.55 -2.95 Salton Sea USGS9 5/11/05 -1.79 -1.79 -1.79 -1.79 -1.79 92 -1.79 -1.79 -1.79 -1.79 -1.79 -1.79 -1.79 -1.79 -1.79 -1.79 -1.79 -1.79 Salton Sea USGS9 10/26/05 -1.81 -1.81 4.05 -1.81 3.41 176 -1.81 4.89 4.6 2.04 5.52 2.69 -1.81 -1.81 2.41 -1.81 3.59 -1.81 Salton Sea USGS9 5/3/06 -1.96 -1.96 -1.96 -1.96 -1.96 140 -1.96 -1.96 -1.96 -1.96 -1.96 -1.96 -1.96 -1.96 -1.96 -1.96 -1.96 -1.96 Salton Sea USGS9 5/9/07 Salton Sea USGS9 10/24/07 -1.81 -1.81 3.22 4.09 2.88 73.8 -1.81 4.4 2.8 -1.81 3.86 7.81 29.2 -1.81 -1.81 -1.81 -1.81 -1.81 Salton Sea USGS9 4/22/08 -1.65 -1.65 3.72 4.9 4.98 -1.65 -1.65 4.44 3.94 -1.65 6.23 8.15 13.9 -1.65 -1.65 -1.65 -1.65 -1.65 Salton Sea USGS9 4/29/09 -2.66 -2.66 5.18 8.18 8.77 291 -2.66 8.6 6.5 7.53 13.5 13.9 48.7 -2.66 2.73 -2.66 5.35 -2.66 Salton Sea USGS9 10/21/09 -1.79 -1.79 -1.79 -1.79 -1.79 284 -1.79 -1.79 2.7 2.21 3.6 9.8 118 -1.79 -1.79 -1.79 -1.79 -1.79 Salton Sea USGS9 5/4/10 -2.28 -2.28 3.34 5.66 5.24 169 -2.28 -2.28 4.51 3.32 8.72 9.46 -2.28 2.6 -2.28 -2.28 3.38 -2.28 Salton Sea USGS9 5/11/11 -1 -1 -1 DNQ, 1.2 -1 -1 -1
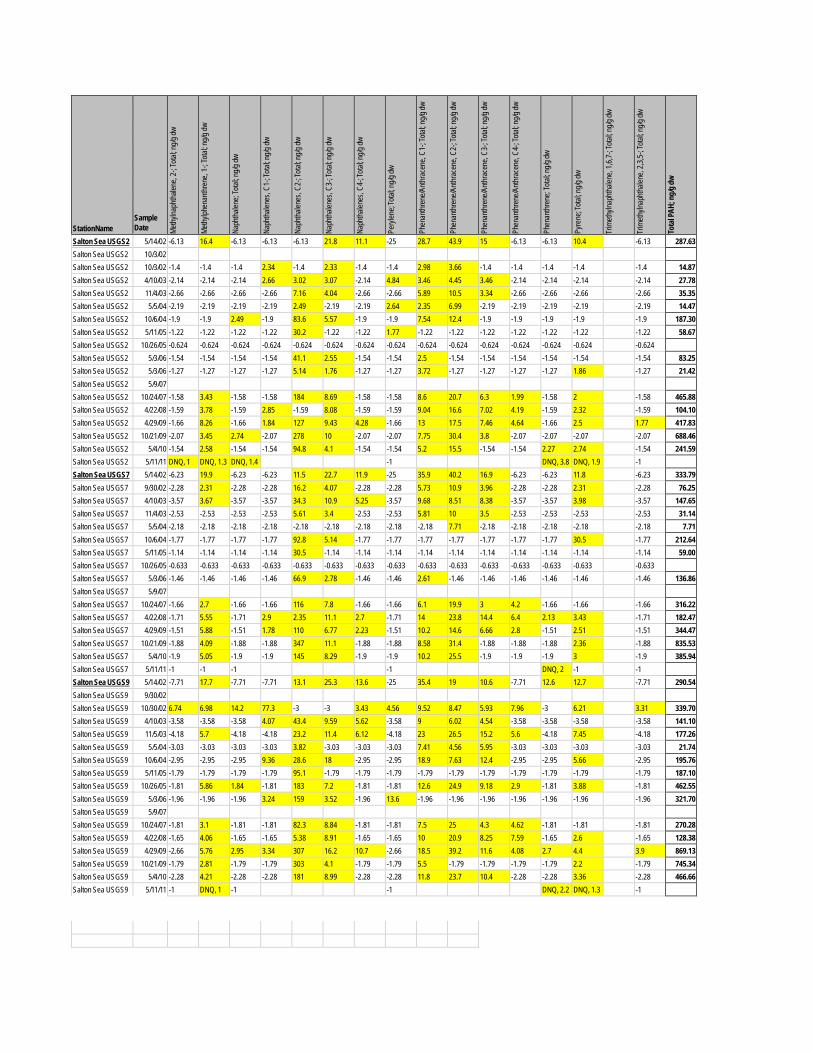
StationName
Sample Date Me
thylna
phtha
lene,
2-; T
otal;
ng/g
dw
Methy
lphen
anthr
ene,
1-; T
otal; n
g/g dw
Naph
thalen
e; To
tal; n
g/g dw
Naph
thalen
es, C
1-; T
otal;
ng/g
dw
Naph
thalen
es, C
2-; T
otal;
ng/g
dw
Naph
thalen
es, C
3-; T
otal;
ng/g
dw
Naph
thalen
es, C
4-; T
otal;
ng/g
dw
Pery
lene;
Total
; ng/g
dw
Phen
anthr
ene/A
nthra
cene
, C1-
; Tota
l; ng/g
dw
Phen
anthr
ene/A
nthra
cene
, C2-
; Tota
l; ng/g
dw
Phen
anthr
ene/A
nthra
cene
, C3-
; Tota
l; ng/g
dw
Phen
anthr
ene/A
nthra
cene
, C4-
; Tota
l; ng/g
dw
Phen
anthr
ene;
Total
; ng/g
dw
Pyre
ne; T
otal; n
g/g dw
Trim
ethyln
aphth
alene
, 1,6,
7-; T
otal; n
g/g dw
Trim
ethyln
aphth
alene
, 2,3,
5-; T
otal; n
g/g dw
Tota
l PAH
; ng/
g dw
Salton Sea USGS2 5/14/02 -6.13 16.4 -6.13 -6.13 -6.13 21.8 11.1 -25 28.7 43.9 15 -6.13 -6.13 10.4 -6.13 287.63 Salton Sea USGS2 10/3/02 Salton Sea USGS2 10/3/02 -1.4 -1.4 -1.4 2.34 -1.4 2.33 -1.4 -1.4 2.98 3.66 -1.4 -1.4 -1.4 -1.4 -1.4 14.87 Salton Sea USGS2 4/10/03 -2.14 -2.14 -2.14 2.66 3.02 3.07 -2.14 4.84 3.46 4.45 3.46 -2.14 -2.14 -2.14 -2.14 27.78 Salton Sea USGS2 11/4/03 -2.66 -2.66 -2.66 -2.66 7.16 4.04 -2.66 -2.66 5.89 10.5 3.34 -2.66 -2.66 -2.66 -2.66 35.35 Salton Sea USGS2 5/5/04 -2.19 -2.19 -2.19 -2.19 2.49 -2.19 -2.19 2.64 2.35 6.99 -2.19 -2.19 -2.19 -2.19 -2.19 14.47 Salton Sea USGS2 10/6/04 -1.9 -1.9 2.49 -1.9 83.6 5.57 -1.9 -1.9 7.54 12.4 -1.9 -1.9 -1.9 -1.9 -1.9 187.30 Salton Sea USGS2 5/11/05 -1.22 -1.22 -1.22 -1.22 30.2 -1.22 -1.22 1.77 -1.22 -1.22 -1.22 -1.22 -1.22 -1.22 -1.22 58.67 Salton Sea USGS2 10/26/05 -0.624 -0.624 -0.624 -0.624 -0.624 -0.624 -0.624 -0.624 -0.624 -0.624 -0.624 -0.624 -0.624 -0.624 -0.624 Salton Sea USGS2 5/3/06 -1.54 -1.54 -1.54 -1.54 41.1 2.55 -1.54 -1.54 2.5 -1.54 -1.54 -1.54 -1.54 -1.54 -1.54 83.25 Salton Sea USGS2 5/3/06 -1.27 -1.27 -1.27 -1.27 5.14 1.76 -1.27 -1.27 3.72 -1.27 -1.27 -1.27 -1.27 1.86 -1.27 21.42 Salton Sea USGS2 5/9/07 Salton Sea USGS2 10/24/07 -1.58 3.43 -1.58 -1.58 184 8.69 -1.58 -1.58 8.6 20.7 6.3 1.99 -1.58 2 -1.58 465.88 Salton Sea USGS2 4/22/08 -1.59 3.78 -1.59 2.85 -1.59 8.08 -1.59 -1.59 9.04 16.6 7.02 4.19 -1.59 2.32 -1.59 104.10 Salton Sea USGS2 4/29/09 -1.66 8.26 -1.66 1.84 127 9.43 4.28 -1.66 13 17.5 7.46 4.64 -1.66 2.5 1.77 417.83 Salton Sea USGS2 10/21/09 -2.07 3.45 2.74 -2.07 278 10 -2.07 -2.07 7.75 30.4 3.8 -2.07 -2.07 -2.07 -2.07 688.46 Salton Sea USGS2 5/4/10 -1.54 2.58 -1.54 -1.54 94.8 4.1 -1.54 -1.54 5.2 15.5 -1.54 -1.54 2.27 2.74 -1.54 241.59 Salton Sea USGS2 5/11/11 DNQ, 1 DNQ, 1.3 DNQ, 1.4 -1 DNQ, 3.8 DNQ, 1.9 -1 Salton Sea USGS7 5/14/02 -6.23 19.9 -6.23 -6.23 11.5 22.7 11.9 -25 35.9 40.2 16.9 -6.23 -6.23 11.8 -6.23 333.79 Salton Sea USGS7 9/30/02 -2.28 2.31 -2.28 -2.28 16.2 4.07 -2.28 -2.28 5.73 10.9 3.96 -2.28 -2.28 2.31 -2.28 76.25 Salton Sea USGS7 4/10/03 -3.57 3.67 -3.57 -3.57 34.3 10.9 5.25 -3.57 9.68 8.51 8.38 -3.57 -3.57 3.98 -3.57 147.65 Salton Sea USGS7 11/4/03 -2.53 -2.53 -2.53 -2.53 5.61 3.4 -2.53 -2.53 5.81 10 3.5 -2.53 -2.53 -2.53 -2.53 31.14 Salton Sea USGS7 5/5/04 -2.18 -2.18 -2.18 -2.18 -2.18 -2.18 -2.18 -2.18 -2.18 7.71 -2.18 -2.18 -2.18 -2.18 -2.18 7.71 Salton Sea USGS7 10/6/04 -1.77 -1.77 -1.77 -1.77 92.8 5.14 -1.77 -1.77 -1.77 -1.77 -1.77 -1.77 -1.77 30.5 -1.77 212.64 Salton Sea USGS7 5/11/05 -1.14 -1.14 -1.14 -1.14 30.5 -1.14 -1.14 -1.14 -1.14 -1.14 -1.14 -1.14 -1.14 -1.14 -1.14 59.00 Salton Sea USGS7 10/26/05 -0.633 -0.633 -0.633 -0.633 -0.633 -0.633 -0.633 -0.633 -0.633 -0.633 -0.633 -0.633 -0.633 -0.633 -0.633 Salton Sea USGS7 5/3/06 -1.46 -1.46 -1.46 -1.46 66.9 2.78 -1.46 -1.46 2.61 -1.46 -1.46 -1.46 -1.46 -1.46 -1.46 136.86 Salton Sea USGS7 5/9/07 Salton Sea USGS7 10/24/07 -1.66 2.7 -1.66 -1.66 116 7.8 -1.66 -1.66 6.1 19.9 3 4.2 -1.66 -1.66 -1.66 316.22 Salton Sea USGS7 4/22/08 -1.71 5.55 -1.71 2.9 2.35 11.1 2.7 -1.71 14 23.8 14.4 6.4 2.13 3.43 -1.71 182.47 Salton Sea USGS7 4/29/09 -1.51 5.88 -1.51 1.78 110 6.77 2.23 -1.51 10.2 14.6 6.66 2.8 -1.51 2.51 -1.51 344.47 Salton Sea USGS7 10/21/09 -1.88 4.09 -1.88 -1.88 347 11.1 -1.88 -1.88 8.58 31.4 -1.88 -1.88 -1.88 2.36 -1.88 835.53 Salton Sea USGS7 5/4/10 -1.9 5.05 -1.9 -1.9 145 8.29 -1.9 -1.9 10.2 25.5 -1.9 -1.9 -1.9 3 -1.9 385.94 Salton Sea USGS7 5/11/11 -1 -1 -1 -1 DNQ, 2 -1 -1 Salton Sea USGS9 5/14/02 -7.71 17.7 -7.71 -7.71 13.1 25.3 13.6 -25 35.4 19 10.6 -7.71 12.6 12.7 -7.71 290.54 Salton Sea USGS9 9/30/02 Salton Sea USGS9 10/30/02 6.74 6.98 14.2 77.3 -3 -3 3.43 4.56 9.52 8.47 5.93 7.96 -3 6.21 3.31 339.70 Salton Sea USGS9 4/10/03 -3.58 -3.58 -3.58 4.07 43.4 9.59 5.62 -3.58 9 6.02 4.54 -3.58 -3.58 -3.58 -3.58 141.10 Salton Sea USGS9 11/5/03 -4.18 5.7 -4.18 -4.18 23.2 11.4 6.12 -4.18 23 26.5 15.2 5.6 -4.18 7.45 -4.18 177.26 Salton Sea USGS9 5/5/04 -3.03 -3.03 -3.03 -3.03 3.82 -3.03 -3.03 -3.03 7.41 4.56 5.95 -3.03 -3.03 -3.03 -3.03 21.74 Salton Sea USGS9 10/6/04 -2.95 -2.95 -2.95 9.36 28.6 18 -2.95 -2.95 18.9 7.63 12.4 -2.95 -2.95 5.66 -2.95 195.76 Salton Sea USGS9 5/11/05 -1.79 -1.79 -1.79 -1.79 95.1 -1.79 -1.79 -1.79 -1.79 -1.79 -1.79 -1.79 -1.79 -1.79 -1.79 187.10 Salton Sea USGS9 10/26/05 -1.81 5.86 1.84 -1.81 183 7.2 -1.81 -1.81 12.6 24.9 9.18 2.9 -1.81 3.88 -1.81 462.55 Salton Sea USGS9 5/3/06 -1.96 -1.96 -1.96 3.24 159 3.52 -1.96 13.6 -1.96 -1.96 -1.96 -1.96 -1.96 -1.96 -1.96 321.70 Salton Sea USGS9 5/9/07 Salton Sea USGS9 10/24/07 -1.81 3.1 -1.81 -1.81 82.3 8.84 -1.81 -1.81 7.5 25 4.3 4.62 -1.81 -1.81 -1.81 270.28 Salton Sea USGS9 4/22/08 -1.65 4.06 -1.65 -1.65 5.38 8.91 -1.65 -1.65 10 20.9 8.25 7.59 -1.65 2.6 -1.65 128.38 Salton Sea USGS9 4/29/09 -2.66 5.76 2.95 3.34 307 16.2 10.7 -2.66 18.5 39.2 11.6 4.08 2.7 4.4 3.9 869.13 Salton Sea USGS9 10/21/09 -1.79 2.81 -1.79 -1.79 303 4.1 -1.79 -1.79 5.5 -1.79 -1.79 -1.79 -1.79 2.2 -1.79 745.34 Salton Sea USGS9 5/4/10 -2.28 4.21 -2.28 -2.28 181 8.99 -2.28 -2.28 11.8 23.7 10.4 -2.28 -2.28 3.36 -2.28 466.66 Salton Sea USGS9 5/11/11 -1 DNQ, 1 -1 -1 DNQ, 2.2 DNQ, 1.3 -1
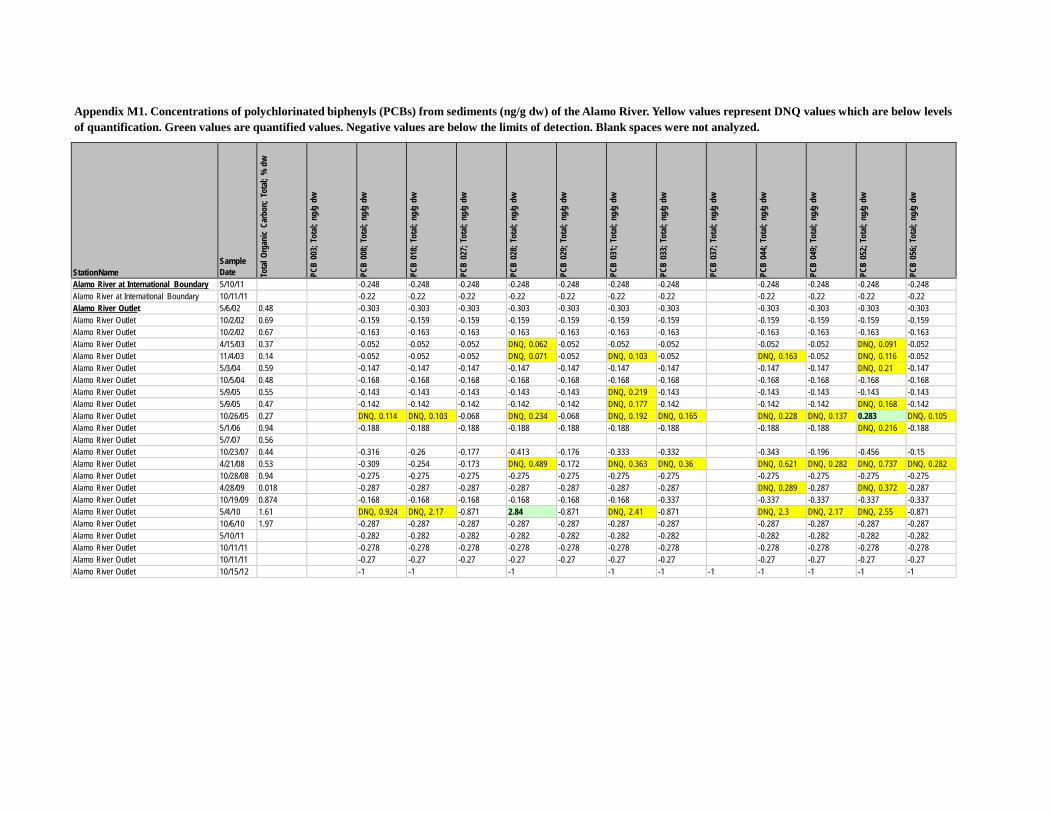
Appendix M1. Concentrations of polychlorinated biphenyls (PCBs) from sediments (ng/g dw) of the Alamo River. Yellow values represent DNQ values which are below levels of quantification. Green values are quantified values. Negative values are below the limits of detection. Blank spaces were not analyzed.
StationName
Sample Date To
tal O
rgan
ic Ca
rbon
; Tot
al; %
dw
PCB
003;
Tot
al; n
g/g
dw
PCB
008;
Tot
al; n
g/g
dw
PCB
018;
Tot
al; n
g/g
dw
PCB
027;
Tot
al; n
g/g
dw
PCB
028;
Tot
al; n
g/g
dw
PCB
029;
Tot
al; n
g/g
dw
PCB
031;
Tot
al; n
g/g
dw
PCB
033;
Tot
al; n
g/g
dw
PCB
037;
Tot
al; n
g/g
dw
PCB
044;
Tot
al; n
g/g
dw
PCB
049;
Tot
al; n
g/g
dw
PCB
052;
Tot
al; n
g/g
dw
PCB
056;
Tot
al; n
g/g
dw
Alamo River at International Boundary 5/10/11 -0.248 -0.248 -0.248 -0.248 -0.248 -0.248 -0.248 -0.248 -0.248 -0.248 -0.248 Alamo River at International Boundary 10/11/11 -0.22 -0.22 -0.22 -0.22 -0.22 -0.22 -0.22 -0.22 -0.22 -0.22 -0.22 Alamo River Outlet 5/6/02 0.48 -0.303 -0.303 -0.303 -0.303 -0.303 -0.303 -0.303 -0.303 -0.303 -0.303 -0.303 Alamo River Outlet 10/2/02 0.69 -0.159 -0.159 -0.159 -0.159 -0.159 -0.159 -0.159 -0.159 -0.159 -0.159 -0.159 Alamo River Outlet 10/2/02 0.67 -0.163 -0.163 -0.163 -0.163 -0.163 -0.163 -0.163 -0.163 -0.163 -0.163 -0.163 Alamo River Outlet 4/15/03 0.37 -0.052 -0.052 -0.052 DNQ, 0.062 -0.052 -0.052 -0.052 -0.052 -0.052 DNQ, 0.091 -0.052 Alamo River Outlet 11/4/03 0.14 -0.052 -0.052 -0.052 DNQ, 0.071 -0.052 DNQ, 0.103 -0.052 DNQ, 0.163 -0.052 DNQ, 0.116 -0.052 Alamo River Outlet 5/3/04 0.59 -0.147 -0.147 -0.147 -0.147 -0.147 -0.147 -0.147 -0.147 -0.147 DNQ, 0.21 -0.147 Alamo River Outlet 10/5/04 0.48 -0.168 -0.168 -0.168 -0.168 -0.168 -0.168 -0.168 -0.168 -0.168 -0.168 -0.168 Alamo River Outlet 5/9/05 0.55 -0.143 -0.143 -0.143 -0.143 -0.143 DNQ, 0.219 -0.143 -0.143 -0.143 -0.143 -0.143 Alamo River Outlet 5/9/05 0.47 -0.142 -0.142 -0.142 -0.142 -0.142 DNQ, 0.177 -0.142 -0.142 -0.142 DNQ, 0.168 -0.142 Alamo River Outlet 10/26/05 0.27 DNQ, 0.114 DNQ, 0.103 -0.068 DNQ, 0.234 -0.068 DNQ, 0.192 DNQ, 0.165 DNQ, 0.228 DNQ, 0.137 0.283 DNQ, 0.105 Alamo River Outlet 5/1/06 0.94 -0.188 -0.188 -0.188 -0.188 -0.188 -0.188 -0.188 -0.188 -0.188 DNQ, 0.216 -0.188 Alamo River Outlet 5/7/07 0.56 Alamo River Outlet 10/23/07 0.44 -0.316 -0.26 -0.177 -0.413 -0.176 -0.333 -0.332 -0.343 -0.196 -0.456 -0.15 Alamo River Outlet 4/21/08 0.53 -0.309 -0.254 -0.173 DNQ, 0.489 -0.172 DNQ, 0.363 DNQ, 0.36 DNQ, 0.621 DNQ, 0.282 DNQ, 0.737 DNQ, 0.282 Alamo River Outlet 10/28/08 0.94 -0.275 -0.275 -0.275 -0.275 -0.275 -0.275 -0.275 -0.275 -0.275 -0.275 -0.275 Alamo River Outlet 4/28/09 0.018 -0.287 -0.287 -0.287 -0.287 -0.287 -0.287 -0.287 DNQ, 0.289 -0.287 DNQ, 0.372 -0.287 Alamo River Outlet 10/19/09 0.874 -0.168 -0.168 -0.168 -0.168 -0.168 -0.168 -0.337 -0.337 -0.337 -0.337 -0.337 Alamo River Outlet 5/4/10 1.61 DNQ, 0.924 DNQ, 2.17 -0.871 2.84 -0.871 DNQ, 2.41 -0.871 DNQ, 2.3 DNQ, 2.17 DNQ, 2.55 -0.871 Alamo River Outlet 10/6/10 1.97 -0.287 -0.287 -0.287 -0.287 -0.287 -0.287 -0.287 -0.287 -0.287 -0.287 -0.287 Alamo River Outlet 5/10/11 -0.282 -0.282 -0.282 -0.282 -0.282 -0.282 -0.282 -0.282 -0.282 -0.282 -0.282 Alamo River Outlet 10/11/11 -0.278 -0.278 -0.278 -0.278 -0.278 -0.278 -0.278 -0.278 -0.278 -0.278 -0.278 Alamo River Outlet 10/11/11 -0.27 -0.27 -0.27 -0.27 -0.27 -0.27 -0.27 -0.27 -0.27 -0.27 -0.27 Alamo River Outlet 10/15/12 -1 -1 -1 -1 -1 -1 -1 -1 -1 -1
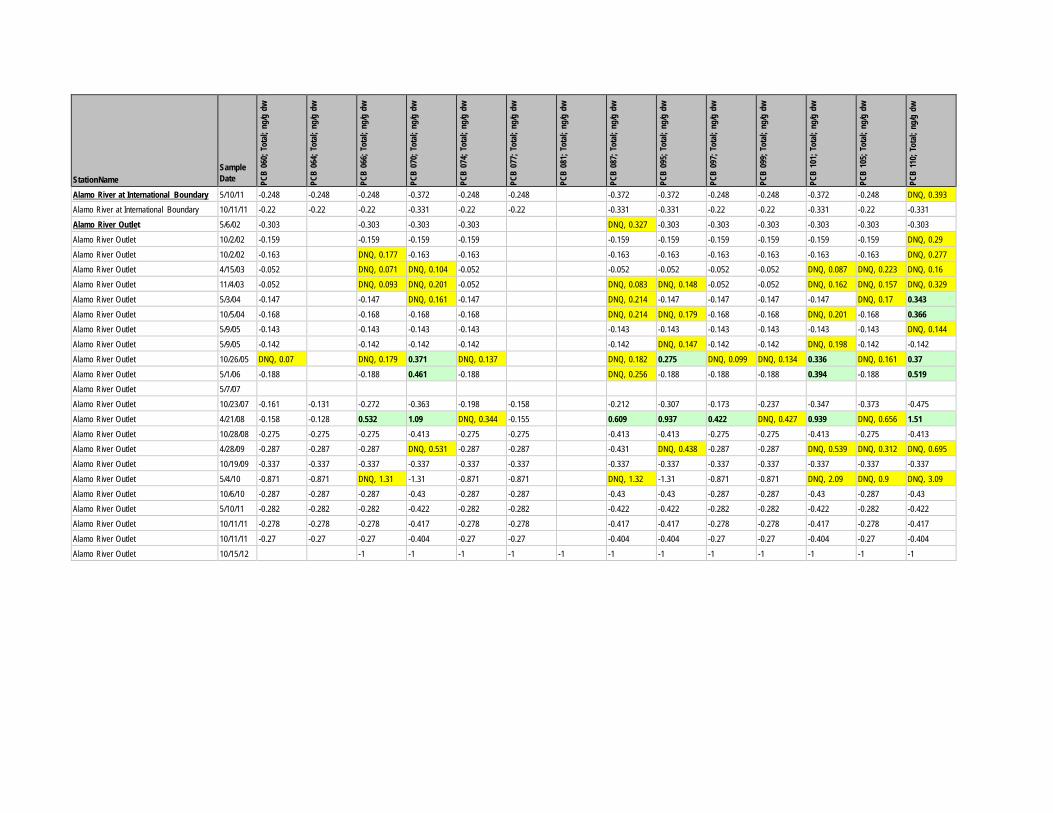
StationName
Sample Date PC
B 06
0; T
otal;
ng/
g dw
PCB
064;
Tot
al; n
g/g
dw
PCB
066;
Tot
al; n
g/g
dw
PCB
070;
Tot
al; n
g/g
dw
PCB
074;
Tot
al; n
g/g
dw
PCB
077;
Tot
al; n
g/g
dw
PCB
081;
Tot
al; n
g/g
dw
PCB
087;
Tot
al; n
g/g
dw
PCB
095;
Tot
al; n
g/g
dw
PCB
097;
Tot
al; n
g/g
dw
PCB
099;
Tot
al; n
g/g
dw
PCB
101;
Tot
al; n
g/g
dw
PCB
105;
Tot
al; n
g/g
dw
PCB
110;
Tot
al; n
g/g
dw
Alamo River at International Boundary 5/10/11 -0.248 -0.248 -0.248 -0.372 -0.248 -0.248 -0.372 -0.372 -0.248 -0.248 -0.372 -0.248 DNQ, 0.393 Alamo River at International Boundary 10/11/11 -0.22 -0.22 -0.22 -0.331 -0.22 -0.22 -0.331 -0.331 -0.22 -0.22 -0.331 -0.22 -0.331 Alamo River Outlet 5/6/02 -0.303 -0.303 -0.303 -0.303 DNQ, 0.327 -0.303 -0.303 -0.303 -0.303 -0.303 -0.303 Alamo River Outlet 10/2/02 -0.159 -0.159 -0.159 -0.159 -0.159 -0.159 -0.159 -0.159 -0.159 -0.159 DNQ, 0.29 Alamo River Outlet 10/2/02 -0.163 DNQ, 0.177 -0.163 -0.163 -0.163 -0.163 -0.163 -0.163 -0.163 -0.163 DNQ, 0.277 Alamo River Outlet 4/15/03 -0.052 DNQ, 0.071 DNQ, 0.104 -0.052 -0.052 -0.052 -0.052 -0.052 DNQ, 0.087 DNQ, 0.223 DNQ, 0.16 Alamo River Outlet 11/4/03 -0.052 DNQ, 0.093 DNQ, 0.201 -0.052 DNQ, 0.083 DNQ, 0.148 -0.052 -0.052 DNQ, 0.162 DNQ, 0.157 DNQ, 0.329 Alamo River Outlet 5/3/04 -0.147 -0.147 DNQ, 0.161 -0.147 DNQ, 0.214 -0.147 -0.147 -0.147 -0.147 DNQ, 0.17 0.343 Alamo River Outlet 10/5/04 -0.168 -0.168 -0.168 -0.168 DNQ, 0.214 DNQ, 0.179 -0.168 -0.168 DNQ, 0.201 -0.168 0.366 Alamo River Outlet 5/9/05 -0.143 -0.143 -0.143 -0.143 -0.143 -0.143 -0.143 -0.143 -0.143 -0.143 DNQ, 0.144 Alamo River Outlet 5/9/05 -0.142 -0.142 -0.142 -0.142 -0.142 DNQ, 0.147 -0.142 -0.142 DNQ, 0.198 -0.142 -0.142 Alamo River Outlet 10/26/05 DNQ, 0.07 DNQ, 0.179 0.371 DNQ, 0.137 DNQ, 0.182 0.275 DNQ, 0.099 DNQ, 0.134 0.336 DNQ, 0.161 0.37 Alamo River Outlet 5/1/06 -0.188 -0.188 0.461 -0.188 DNQ, 0.256 -0.188 -0.188 -0.188 0.394 -0.188 0.519 Alamo River Outlet 5/7/07 Alamo River Outlet 10/23/07 -0.161 -0.131 -0.272 -0.363 -0.198 -0.158 -0.212 -0.307 -0.173 -0.237 -0.347 -0.373 -0.475 Alamo River Outlet 4/21/08 -0.158 -0.128 0.532 1.09 DNQ, 0.344 -0.155 0.609 0.937 0.422 DNQ, 0.427 0.939 DNQ, 0.656 1.51 Alamo River Outlet 10/28/08 -0.275 -0.275 -0.275 -0.413 -0.275 -0.275 -0.413 -0.413 -0.275 -0.275 -0.413 -0.275 -0.413 Alamo River Outlet 4/28/09 -0.287 -0.287 -0.287 DNQ, 0.531 -0.287 -0.287 -0.431 DNQ, 0.438 -0.287 -0.287 DNQ, 0.539 DNQ, 0.312 DNQ, 0.695 Alamo River Outlet 10/19/09 -0.337 -0.337 -0.337 -0.337 -0.337 -0.337 -0.337 -0.337 -0.337 -0.337 -0.337 -0.337 -0.337 Alamo River Outlet 5/4/10 -0.871 -0.871 DNQ, 1.31 -1.31 -0.871 -0.871 DNQ, 1.32 -1.31 -0.871 -0.871 DNQ, 2.09 DNQ, 0.9 DNQ, 3.09 Alamo River Outlet 10/6/10 -0.287 -0.287 -0.287 -0.43 -0.287 -0.287 -0.43 -0.43 -0.287 -0.287 -0.43 -0.287 -0.43 Alamo River Outlet 5/10/11 -0.282 -0.282 -0.282 -0.422 -0.282 -0.282 -0.422 -0.422 -0.282 -0.282 -0.422 -0.282 -0.422 Alamo River Outlet 10/11/11 -0.278 -0.278 -0.278 -0.417 -0.278 -0.278 -0.417 -0.417 -0.278 -0.278 -0.417 -0.278 -0.417 Alamo River Outlet 10/11/11 -0.27 -0.27 -0.27 -0.404 -0.27 -0.27 -0.404 -0.404 -0.27 -0.27 -0.404 -0.27 -0.404 Alamo River Outlet 10/15/12 -1 -1 -1 -1 -1 -1 -1 -1 -1 -1 -1 -1
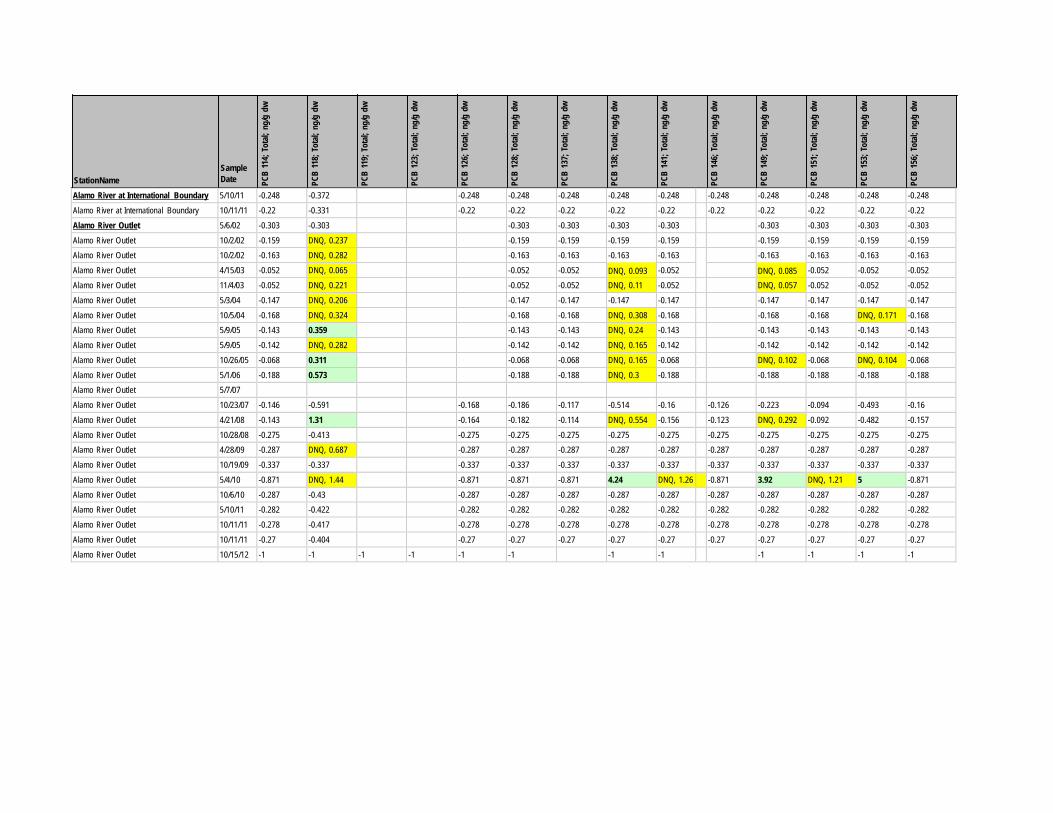
PCB
114;
Tot
al; n
g/g
dw
PCB
118;
Tot
al; n
g/g
dw
PCB
119;
Tot
al; n
g/g
dw
PCB
123;
Tot
al; n
g/g
dw
PCB
126;
Tot
al; n
g/g
dw
PCB
128;
Tot
al; n
g/g
dw
PCB
137;
Tot
al; n
g/g
dw
PCB
138;
Tot
al; n
g/g
dw
PCB
141;
Tot
al; n
g/g
dw
PCB
146;
Tot
al; n
g/g
dw
PCB
149;
Tot
al; n
g/g
dw
PCB
151;
Tot
al; n
g/g
dw
PCB
153;
Tot
al; n
g/g
dw
PCB
156;
Tot
al; n
g/g
dw
StationName Sample Date
Alamo River at International Boundary 5/10/11 -0.248 -0.372 -0.248 -0.248 -0.248 -0.248 -0.248 -0.248 -0.248 -0.248 -0.248 -0.248 Alamo River at International Boundary 10/11/11 -0.22 -0.331 -0.22 -0.22 -0.22 -0.22 -0.22 -0.22 -0.22 -0.22 -0.22 -0.22 Alamo River Outlet 5/6/02 -0.303 -0.303 -0.303 -0.303 -0.303 -0.303 -0.303 -0.303 -0.303 -0.303 Alamo River Outlet 10/2/02 -0.159 DNQ, 0.237 -0.159 -0.159 -0.159 -0.159 -0.159 -0.159 -0.159 -0.159 Alamo River Outlet 10/2/02 -0.163 DNQ, 0.282 -0.163 -0.163 -0.163 -0.163 -0.163 -0.163 -0.163 -0.163 Alamo River Outlet 4/15/03 -0.052 DNQ, 0.065 -0.052 -0.052 DNQ, 0.093 -0.052 DNQ, 0.085 -0.052 -0.052 -0.052 Alamo River Outlet 11/4/03 -0.052 DNQ, 0.221 -0.052 -0.052 DNQ, 0.11 -0.052 DNQ, 0.057 -0.052 -0.052 -0.052 Alamo River Outlet 5/3/04 -0.147 DNQ, 0.206 -0.147 -0.147 -0.147 -0.147 -0.147 -0.147 -0.147 -0.147 Alamo River Outlet 10/5/04 -0.168 DNQ, 0.324 -0.168 -0.168 DNQ, 0.308 -0.168 -0.168 -0.168 DNQ, 0.171 -0.168 Alamo River Outlet 5/9/05 -0.143 0.359 -0.143 -0.143 DNQ, 0.24 -0.143 -0.143 -0.143 -0.143 -0.143 Alamo River Outlet 5/9/05 -0.142 DNQ, 0.282 -0.142 -0.142 DNQ, 0.165 -0.142 -0.142 -0.142 -0.142 -0.142 Alamo River Outlet 10/26/05 -0.068 0.311 -0.068 -0.068 DNQ, 0.165 -0.068 DNQ, 0.102 -0.068 DNQ, 0.104 -0.068 Alamo River Outlet 5/1/06 -0.188 0.573 -0.188 -0.188 DNQ, 0.3 -0.188 -0.188 -0.188 -0.188 -0.188 Alamo River Outlet 5/7/07 Alamo River Outlet 10/23/07 -0.146 -0.591 -0.168 -0.186 -0.117 -0.514 -0.16 -0.126 -0.223 -0.094 -0.493 -0.16 Alamo River Outlet 4/21/08 -0.143 1.31 -0.164 -0.182 -0.114 DNQ, 0.554 -0.156 -0.123 DNQ, 0.292 -0.092 -0.482 -0.157 Alamo River Outlet 10/28/08 -0.275 -0.413 -0.275 -0.275 -0.275 -0.275 -0.275 -0.275 -0.275 -0.275 -0.275 -0.275 Alamo River Outlet 4/28/09 -0.287 DNQ, 0.687 -0.287 -0.287 -0.287 -0.287 -0.287 -0.287 -0.287 -0.287 -0.287 -0.287 Alamo River Outlet 10/19/09 -0.337 -0.337 -0.337 -0.337 -0.337 -0.337 -0.337 -0.337 -0.337 -0.337 -0.337 -0.337 Alamo River Outlet 5/4/10 -0.871 DNQ, 1.44 -0.871 -0.871 -0.871 4.24 DNQ, 1.26 -0.871 3.92 DNQ, 1.21 5 -0.871 Alamo River Outlet 10/6/10 -0.287 -0.43 -0.287 -0.287 -0.287 -0.287 -0.287 -0.287 -0.287 -0.287 -0.287 -0.287 Alamo River Outlet 5/10/11 -0.282 -0.422 -0.282 -0.282 -0.282 -0.282 -0.282 -0.282 -0.282 -0.282 -0.282 -0.282 Alamo River Outlet 10/11/11 -0.278 -0.417 -0.278 -0.278 -0.278 -0.278 -0.278 -0.278 -0.278 -0.278 -0.278 -0.278 Alamo River Outlet 10/11/11 -0.27 -0.404 -0.27 -0.27 -0.27 -0.27 -0.27 -0.27 -0.27 -0.27 -0.27 -0.27 Alamo River Outlet 10/15/12 -1 -1 -1 -1 -1 -1 -1 -1 -1 -1 -1 -1
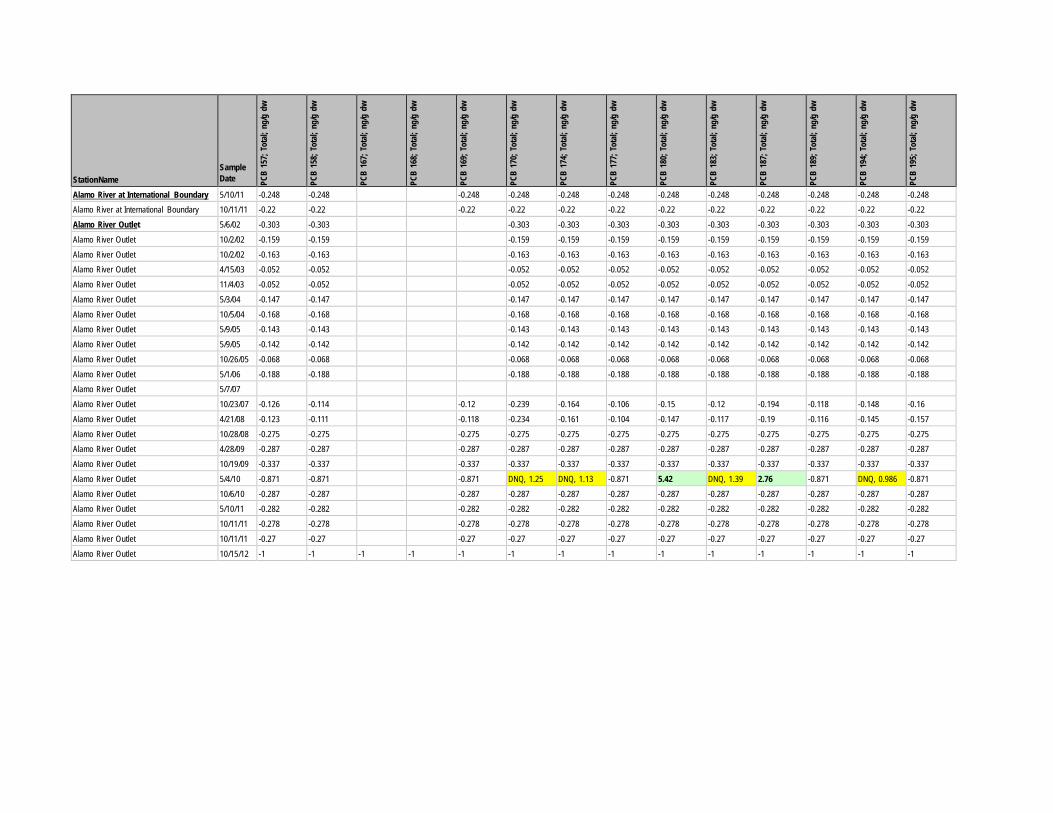
StationName
Sample Date PC
B 15
7; T
otal;
ng/
g dw
PCB
158;
Tot
al; n
g/g
dw
PCB
167;
Tot
al; n
g/g
dw
PCB
168;
Tot
al; n
g/g
dw
PCB
169;
Tot
al; n
g/g
dw
PCB
170;
Tot
al; n
g/g
dw
PCB
174;
Tot
al; n
g/g
dw
PCB
177;
Tot
al; n
g/g
dw
PCB
180;
Tot
al; n
g/g
dw
PCB
183;
Tot
al; n
g/g
dw
PCB
187;
Tot
al; n
g/g
dw
PCB
189;
Tot
al; n
g/g
dw
PCB
194;
Tot
al; n
g/g
dw
PCB
195;
Tot
al; n
g/g
dw
Alamo River at International Boundary 5/10/11 -0.248 -0.248 -0.248 -0.248 -0.248 -0.248 -0.248 -0.248 -0.248 -0.248 -0.248 -0.248 Alamo River at International Boundary 10/11/11 -0.22 -0.22 -0.22 -0.22 -0.22 -0.22 -0.22 -0.22 -0.22 -0.22 -0.22 -0.22 Alamo River Outlet 5/6/02 -0.303 -0.303 -0.303 -0.303 -0.303 -0.303 -0.303 -0.303 -0.303 -0.303 -0.303 Alamo River Outlet 10/2/02 -0.159 -0.159 -0.159 -0.159 -0.159 -0.159 -0.159 -0.159 -0.159 -0.159 -0.159 Alamo River Outlet 10/2/02 -0.163 -0.163 -0.163 -0.163 -0.163 -0.163 -0.163 -0.163 -0.163 -0.163 -0.163 Alamo River Outlet 4/15/03 -0.052 -0.052 -0.052 -0.052 -0.052 -0.052 -0.052 -0.052 -0.052 -0.052 -0.052 Alamo River Outlet 11/4/03 -0.052 -0.052 -0.052 -0.052 -0.052 -0.052 -0.052 -0.052 -0.052 -0.052 -0.052 Alamo River Outlet 5/3/04 -0.147 -0.147 -0.147 -0.147 -0.147 -0.147 -0.147 -0.147 -0.147 -0.147 -0.147 Alamo River Outlet 10/5/04 -0.168 -0.168 -0.168 -0.168 -0.168 -0.168 -0.168 -0.168 -0.168 -0.168 -0.168 Alamo River Outlet 5/9/05 -0.143 -0.143 -0.143 -0.143 -0.143 -0.143 -0.143 -0.143 -0.143 -0.143 -0.143 Alamo River Outlet 5/9/05 -0.142 -0.142 -0.142 -0.142 -0.142 -0.142 -0.142 -0.142 -0.142 -0.142 -0.142 Alamo River Outlet 10/26/05 -0.068 -0.068 -0.068 -0.068 -0.068 -0.068 -0.068 -0.068 -0.068 -0.068 -0.068 Alamo River Outlet 5/1/06 -0.188 -0.188 -0.188 -0.188 -0.188 -0.188 -0.188 -0.188 -0.188 -0.188 -0.188 Alamo River Outlet 5/7/07 Alamo River Outlet 10/23/07 -0.126 -0.114 -0.12 -0.239 -0.164 -0.106 -0.15 -0.12 -0.194 -0.118 -0.148 -0.16 Alamo River Outlet 4/21/08 -0.123 -0.111 -0.118 -0.234 -0.161 -0.104 -0.147 -0.117 -0.19 -0.116 -0.145 -0.157 Alamo River Outlet 10/28/08 -0.275 -0.275 -0.275 -0.275 -0.275 -0.275 -0.275 -0.275 -0.275 -0.275 -0.275 -0.275 Alamo River Outlet 4/28/09 -0.287 -0.287 -0.287 -0.287 -0.287 -0.287 -0.287 -0.287 -0.287 -0.287 -0.287 -0.287 Alamo River Outlet 10/19/09 -0.337 -0.337 -0.337 -0.337 -0.337 -0.337 -0.337 -0.337 -0.337 -0.337 -0.337 -0.337 Alamo River Outlet 5/4/10 -0.871 -0.871 -0.871 DNQ, 1.25 DNQ, 1.13 -0.871 5.42 DNQ, 1.39 2.76 -0.871 DNQ, 0.986 -0.871 Alamo River Outlet 10/6/10 -0.287 -0.287 -0.287 -0.287 -0.287 -0.287 -0.287 -0.287 -0.287 -0.287 -0.287 -0.287 Alamo River Outlet 5/10/11 -0.282 -0.282 -0.282 -0.282 -0.282 -0.282 -0.282 -0.282 -0.282 -0.282 -0.282 -0.282 Alamo River Outlet 10/11/11 -0.278 -0.278 -0.278 -0.278 -0.278 -0.278 -0.278 -0.278 -0.278 -0.278 -0.278 -0.278 Alamo River Outlet 10/11/11 -0.27 -0.27 -0.27 -0.27 -0.27 -0.27 -0.27 -0.27 -0.27 -0.27 -0.27 -0.27 Alamo River Outlet 10/15/12 -1 -1 -1 -1 -1 -1 -1 -1 -1 -1 -1 -1 -1 -1
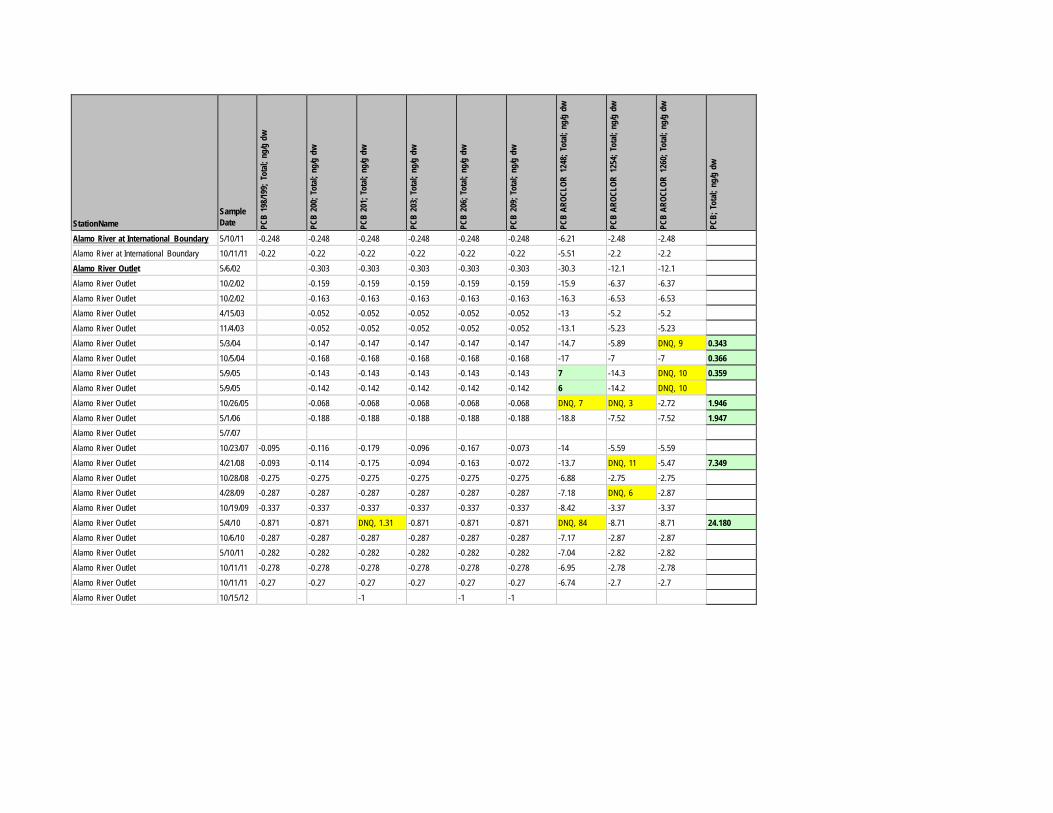
StationName
Sample Date PC
B 19
8/199
; Tot
al; n
g/g
dw
PCB
200;
Tot
al; n
g/g
dw
PCB
201;
Tot
al; n
g/g
dw
PCB
203;
Tot
al; n
g/g
dw
PCB
206;
Tot
al; n
g/g
dw
PCB
209;
Tot
al; n
g/g
dw
PCB
AROC
LOR
1248
; Tot
al; n
g/g
dw
PCB
AROC
LOR
1254
; Tot
al; n
g/g
dw
PCB
AROC
LOR
1260
; Tot
al; n
g/g
dw
PCB;
Tot
al; n
g/g
dw
Alamo River at International Boundary 5/10/11 -0.248 -0.248 -0.248 -0.248 -0.248 -0.248 -6.21 -2.48 -2.48 Alamo River at International Boundary 10/11/11 -0.22 -0.22 -0.22 -0.22 -0.22 -0.22 -5.51 -2.2 -2.2 Alamo River Outlet 5/6/02 -0.303 -0.303 -0.303 -0.303 -0.303 -30.3 -12.1 -12.1 Alamo River Outlet 10/2/02 -0.159 -0.159 -0.159 -0.159 -0.159 -15.9 -6.37 -6.37 Alamo River Outlet 10/2/02 -0.163 -0.163 -0.163 -0.163 -0.163 -16.3 -6.53 -6.53 Alamo River Outlet 4/15/03 -0.052 -0.052 -0.052 -0.052 -0.052 -13 -5.2 -5.2 Alamo River Outlet 11/4/03 -0.052 -0.052 -0.052 -0.052 -0.052 -13.1 -5.23 -5.23 Alamo River Outlet 5/3/04 -0.147 -0.147 -0.147 -0.147 -0.147 -14.7 -5.89 DNQ, 9 0.343 Alamo River Outlet 10/5/04 -0.168 -0.168 -0.168 -0.168 -0.168 -17 -7 -7 0.366 Alamo River Outlet 5/9/05 -0.143 -0.143 -0.143 -0.143 -0.143 7 -14.3 DNQ, 10 0.359 Alamo River Outlet 5/9/05 -0.142 -0.142 -0.142 -0.142 -0.142 6 -14.2 DNQ, 10 Alamo River Outlet 10/26/05 -0.068 -0.068 -0.068 -0.068 -0.068 DNQ, 7 DNQ, 3 -2.72 1.946 Alamo River Outlet 5/1/06 -0.188 -0.188 -0.188 -0.188 -0.188 -18.8 -7.52 -7.52 1.947 Alamo River Outlet 5/7/07 Alamo River Outlet 10/23/07 -0.095 -0.116 -0.179 -0.096 -0.167 -0.073 -14 -5.59 -5.59 Alamo River Outlet 4/21/08 -0.093 -0.114 -0.175 -0.094 -0.163 -0.072 -13.7 DNQ, 11 -5.47 7.349 Alamo River Outlet 10/28/08 -0.275 -0.275 -0.275 -0.275 -0.275 -0.275 -6.88 -2.75 -2.75 Alamo River Outlet 4/28/09 -0.287 -0.287 -0.287 -0.287 -0.287 -0.287 -7.18 DNQ, 6 -2.87 Alamo River Outlet 10/19/09 -0.337 -0.337 -0.337 -0.337 -0.337 -0.337 -8.42 -3.37 -3.37 Alamo River Outlet 5/4/10 -0.871 -0.871 DNQ, 1.31 -0.871 -0.871 -0.871 DNQ, 84 -8.71 -8.71 24.180 Alamo River Outlet 10/6/10 -0.287 -0.287 -0.287 -0.287 -0.287 -0.287 -7.17 -2.87 -2.87 Alamo River Outlet 5/10/11 -0.282 -0.282 -0.282 -0.282 -0.282 -0.282 -7.04 -2.82 -2.82 Alamo River Outlet 10/11/11 -0.278 -0.278 -0.278 -0.278 -0.278 -0.278 -6.95 -2.78 -2.78 Alamo River Outlet 10/11/11 -0.27 -0.27 -0.27 -0.27 -0.27 -0.27 -6.74 -2.7 -2.7 Alamo River Outlet 10/15/12 -1 -1 -1
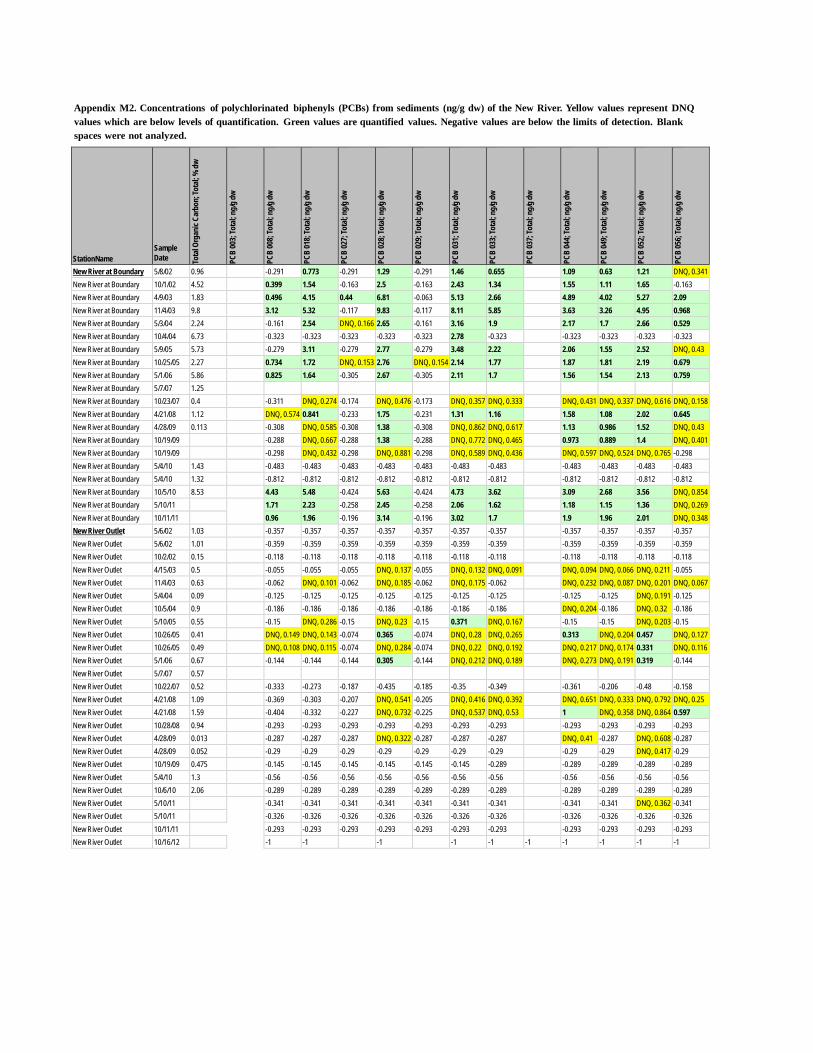
Appendix M2. Concentrations of polychlorinated biphenyls (PCBs) from sediments (ng/g dw) of the New River. Yellow values represent DNQ values which are below levels of quantification. Green values are quantified values. Negative values are below the limits of detection. Blank spaces were not analyzed.
StationName
Sample Date To
tal O
rgan
ic Ca
rbon
; Tot
al; %
dw
PCB
003;
Tota
l; ng/
g dw
PCB
008;
Tota
l; ng/
g dw
PCB
018;
Tota
l; ng/
g dw
PCB
027;
Tota
l; ng/
g dw
PCB
028;
Tota
l; ng/
g dw
PCB
029;
Tota
l; ng/
g dw
PCB
031;
Tota
l; ng/
g dw
PCB
033;
Tota
l; ng/
g dw
PCB
037;
Tota
l; ng/
g dw
PCB
044;
Tota
l; ng/
g dw
PCB
049;
Tota
l; ng/
g dw
PCB
052;
Tota
l; ng/
g dw
PCB
056;
Tota
l; ng/
g dw
New River at Boundary 5/8/02 0.96 -0.291 0.773 -0.291 1.29 -0.291 1.46 0.655 1.09 0.63 1.21 DNQ, 0.341 New River at Boundary 10/1/02 4.52 0.399 1.54 -0.163 2.5 -0.163 2.43 1.34 1.55 1.11 1.65 -0.163 New River at Boundary 4/9/03 1.83 0.496 4.15 0.44 6.81 -0.063 5.13 2.66 4.89 4.02 5.27 2.09 New River at Boundary 11/4/03 9.8 3.12 5.32 -0.117 9.83 -0.117 8.11 5.85 3.63 3.26 4.95 0.968 New River at Boundary 5/3/04 2.24 -0.161 2.54 DNQ, 0.166 2.65 -0.161 3.16 1.9 2.17 1.7 2.66 0.529 New River at Boundary 10/4/04 6.73 -0.323 -0.323 -0.323 -0.323 -0.323 2.78 -0.323 -0.323 -0.323 -0.323 -0.323 New River at Boundary 5/9/05 5.73 -0.279 3.11 -0.279 2.77 -0.279 3.48 2.22 2.06 1.55 2.52 DNQ, 0.43 New River at Boundary 10/25/05 2.27 0.734 1.72 DNQ, 0.153 2.76 DNQ, 0.154 2.14 1.77 1.87 1.81 2.19 0.679 New River at Boundary 5/1/06 5.86 0.825 1.64 -0.305 2.67 -0.305 2.11 1.7 1.56 1.54 2.13 0.759 New River at Boundary 5/7/07 1.25 New River at Boundary 10/23/07 0.4 -0.311 DNQ, 0.274 -0.174 DNQ, 0.476 -0.173 DNQ, 0.357 DNQ, 0.333 DNQ, 0.431 DNQ, 0.337 DNQ, 0.616 DNQ, 0.158 New River at Boundary 4/21/08 1.12 DNQ, 0.574 0.841 -0.233 1.75 -0.231 1.31 1.16 1.58 1.08 2.02 0.645 New River at Boundary 4/28/09 0.113 -0.308 DNQ, 0.585 -0.308 1.38 -0.308 DNQ, 0.862 DNQ, 0.617 1.13 0.986 1.52 DNQ, 0.43 New River at Boundary 10/19/09 -0.288 DNQ, 0.667 -0.288 1.38 -0.288 DNQ, 0.772 DNQ, 0.465 0.973 0.889 1.4 DNQ, 0.401 New River at Boundary 10/19/09 -0.298 DNQ, 0.432 -0.298 DNQ, 0.881 -0.298 DNQ, 0.589 DNQ, 0.436 DNQ, 0.597 DNQ, 0.524 DNQ, 0.765 -0.298 New River at Boundary 5/4/10 1.43 -0.483 -0.483 -0.483 -0.483 -0.483 -0.483 -0.483 -0.483 -0.483 -0.483 -0.483 New River at Boundary 5/4/10 1.32 -0.812 -0.812 -0.812 -0.812 -0.812 -0.812 -0.812 -0.812 -0.812 -0.812 -0.812 New River at Boundary 10/5/10 8.53 4.43 5.48 -0.424 5.63 -0.424 4.73 3.62 3.09 2.68 3.56 DNQ, 0.854 New River at Boundary 5/10/11 1.71 2.23 -0.258 2.45 -0.258 2.06 1.62 1.18 1.15 1.36 DNQ, 0.269 New River at Boundary 10/11/11 0.96 1.96 -0.196 3.14 -0.196 3.02 1.7 1.9 1.96 2.01 DNQ, 0.348 New River Outlet 5/6/02 1.03 -0.357 -0.357 -0.357 -0.357 -0.357 -0.357 -0.357 -0.357 -0.357 -0.357 -0.357 New River Outlet 5/6/02 1.01 -0.359 -0.359 -0.359 -0.359 -0.359 -0.359 -0.359 -0.359 -0.359 -0.359 -0.359 New River Outlet 10/2/02 0.15 -0.118 -0.118 -0.118 -0.118 -0.118 -0.118 -0.118 -0.118 -0.118 -0.118 -0.118 New River Outlet 4/15/03 0.5 -0.055 -0.055 -0.055 DNQ, 0.137 -0.055 DNQ, 0.132 DNQ, 0.091 DNQ, 0.094 DNQ, 0.066 DNQ, 0.211 -0.055 New River Outlet 11/4/03 0.63 -0.062 DNQ, 0.101 -0.062 DNQ, 0.185 -0.062 DNQ, 0.175 -0.062 DNQ, 0.232 DNQ, 0.087 DNQ, 0.201 DNQ, 0.067 New River Outlet 5/4/04 0.09 -0.125 -0.125 -0.125 -0.125 -0.125 -0.125 -0.125 -0.125 -0.125 DNQ, 0.191 -0.125 New River Outlet 10/5/04 0.9 -0.186 -0.186 -0.186 -0.186 -0.186 -0.186 -0.186 DNQ, 0.204 -0.186 DNQ, 0.32 -0.186 New River Outlet 5/10/05 0.55 -0.15 DNQ, 0.286 -0.15 DNQ, 0.23 -0.15 0.371 DNQ, 0.167 -0.15 -0.15 DNQ, 0.203 -0.15 New River Outlet 10/26/05 0.41 DNQ, 0.149 DNQ, 0.143 -0.074 0.365 -0.074 DNQ, 0.28 DNQ, 0.265 0.313 DNQ, 0.204 0.457 DNQ, 0.127 New River Outlet 10/26/05 0.49 DNQ, 0.108 DNQ, 0.115 -0.074 DNQ, 0.284 -0.074 DNQ, 0.22 DNQ, 0.192 DNQ, 0.217 DNQ, 0.174 0.331 DNQ, 0.116 New River Outlet 5/1/06 0.67 -0.144 -0.144 -0.144 0.305 -0.144 DNQ, 0.212 DNQ, 0.189 DNQ, 0.273 DNQ, 0.191 0.319 -0.144 New River Outlet 5/7/07 0.57 New River Outlet 10/22/07 0.52 -0.333 -0.273 -0.187 -0.435 -0.185 -0.35 -0.349 -0.361 -0.206 -0.48 -0.158 New River Outlet 4/21/08 1.09 -0.369 -0.303 -0.207 DNQ, 0.541 -0.205 DNQ, 0.416 DNQ, 0.392 DNQ, 0.651 DNQ, 0.333 DNQ, 0.792 DNQ, 0.25 New River Outlet 4/21/08 1.59 -0.404 -0.332 -0.227 DNQ, 0.732 -0.225 DNQ, 0.537 DNQ, 0.53 1 DNQ, 0.358 DNQ, 0.864 0.597 New River Outlet 10/28/08 0.94 -0.293 -0.293 -0.293 -0.293 -0.293 -0.293 -0.293 -0.293 -0.293 -0.293 -0.293 New River Outlet 4/28/09 0.013 -0.287 -0.287 -0.287 DNQ, 0.322 -0.287 -0.287 -0.287 DNQ, 0.41 -0.287 DNQ, 0.608 -0.287 New River Outlet 4/28/09 0.052 -0.29 -0.29 -0.29 -0.29 -0.29 -0.29 -0.29 -0.29 -0.29 DNQ, 0.417 -0.29 New River Outlet 10/19/09 0.475 -0.145 -0.145 -0.145 -0.145 -0.145 -0.145 -0.289 -0.289 -0.289 -0.289 -0.289 New River Outlet 5/4/10 1.3 -0.56 -0.56 -0.56 -0.56 -0.56 -0.56 -0.56 -0.56 -0.56 -0.56 -0.56 New River Outlet 10/6/10 2.06 -0.289 -0.289 -0.289 -0.289 -0.289 -0.289 -0.289 -0.289 -0.289 -0.289 -0.289 New River Outlet 5/10/11 -0.341 -0.341 -0.341 -0.341 -0.341 -0.341 -0.341 -0.341 -0.341 DNQ, 0.362 -0.341 New River Outlet 5/10/11 -0.326 -0.326 -0.326 -0.326 -0.326 -0.326 -0.326 -0.326 -0.326 -0.326 -0.326 New River Outlet 10/11/11 -0.293 -0.293 -0.293 -0.293 -0.293 -0.293 -0.293 -0.293 -0.293 -0.293 -0.293 New River Outlet 10/16/12 -1 -1 -1 -1 -1 -1 -1 -1 -1 -1
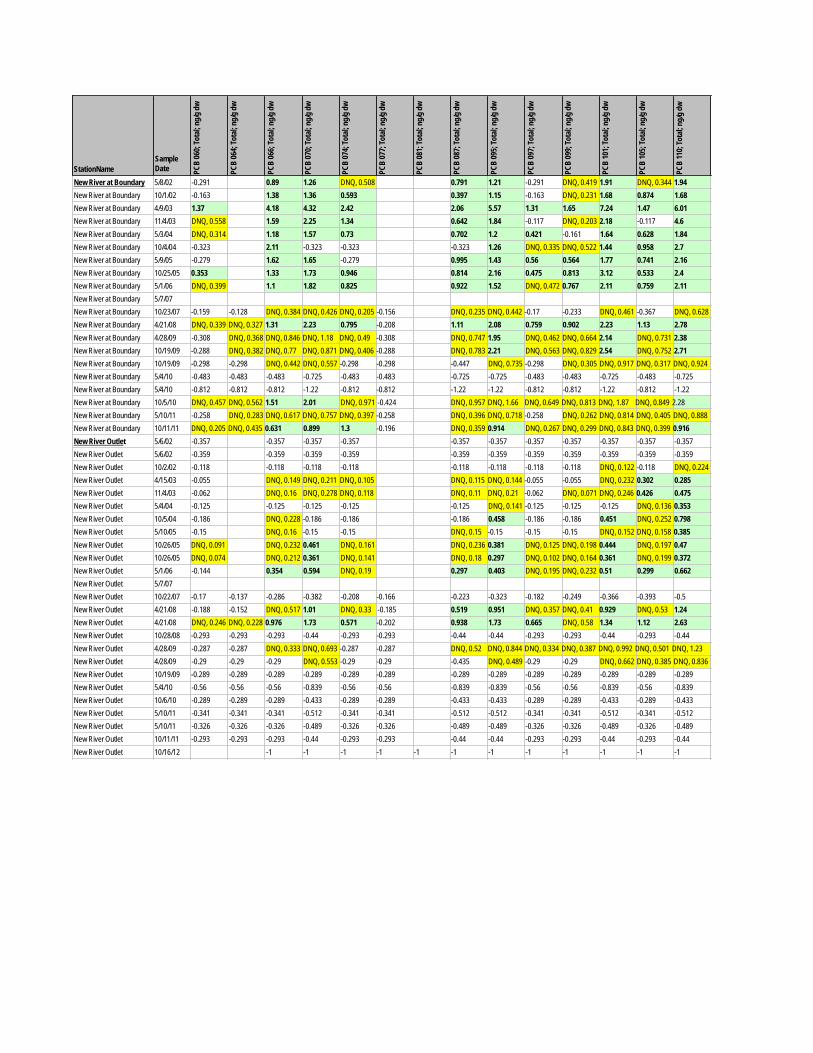
PCB
060;
Tota
l; ng/
g dw
PCB
064;
Tota
l; ng/
g dw
PCB
066;
Tota
l; ng/
g dw
PCB
070;
Tota
l; ng/
g dw
PCB
074;
Tota
l; ng/
g dw
PCB
077;
Tota
l; ng/
g dw
PCB
081;
Tota
l; ng/
g dw
PCB
087;
Tota
l; ng/
g dw
PCB
095;
Tota
l; ng/
g dw
PCB
097;
Tota
l; ng/
g dw
PCB
099;
Tota
l; ng/
g dw
PCB
101;
Tota
l; ng/
g dw
PCB
105;
Tota
l; ng/
g dw
PCB
110;
Tota
l; ng/
g dw
StationName Sample Date
New River at Boundary 5/8/02 -0.291 0.89 1.26 DNQ, 0.508 0.791 1.21 -0.291 DNQ, 0.419 1.91 DNQ, 0.344 1.94 New River at Boundary 10/1/02 -0.163 1.38 1.36 0.593 0.397 1.15 -0.163 DNQ, 0.231 1.68 0.874 1.68 New River at Boundary 4/9/03 1.37 4.18 4.32 2.42 2.06 5.57 1.31 1.65 7.24 1.47 6.01 New River at Boundary 11/4/03 DNQ, 0.558 1.59 2.25 1.34 0.642 1.84 -0.117 DNQ, 0.203 2.18 -0.117 4.6 New River at Boundary 5/3/04 DNQ, 0.314 1.18 1.57 0.73 0.702 1.2 0.421 -0.161 1.64 0.628 1.84 New River at Boundary 10/4/04 -0.323 2.11 -0.323 -0.323 -0.323 1.26 DNQ, 0.335 DNQ, 0.522 1.44 0.958 2.7 New River at Boundary 5/9/05 -0.279 1.62 1.65 -0.279 0.995 1.43 0.56 0.564 1.77 0.741 2.16 New River at Boundary 10/25/05 0.353 1.33 1.73 0.946 0.814 2.16 0.475 0.813 3.12 0.533 2.4 New River at Boundary 5/1/06 DNQ, 0.399 1.1 1.82 0.825 0.922 1.52 DNQ, 0.472 0.767 2.11 0.759 2.11 New River at Boundary 5/7/07 New River at Boundary 10/23/07 -0.159 -0.128 DNQ, 0.384 DNQ, 0.426 DNQ, 0.205 -0.156 DNQ, 0.235 DNQ, 0.442 -0.17 -0.233 DNQ, 0.461 -0.367 DNQ, 0.628 New River at Boundary 4/21/08 DNQ, 0.339 DNQ, 0.327 1.31 2.23 0.795 -0.208 1.11 2.08 0.759 0.902 2.23 1.13 2.78 New River at Boundary 4/28/09 -0.308 DNQ, 0.368 DNQ, 0.846 DNQ, 1.18 DNQ, 0.49 -0.308 DNQ, 0.747 1.95 DNQ, 0.462 DNQ, 0.664 2.14 DNQ, 0.731 2.38 New River at Boundary 10/19/09 -0.288 DNQ, 0.382 DNQ, 0.77 DNQ, 0.871 DNQ, 0.406 -0.288 DNQ, 0.783 2.21 DNQ, 0.563 DNQ, 0.829 2.54 DNQ, 0.752 2.71 New River at Boundary 10/19/09 -0.298 -0.298 DNQ, 0.442 DNQ, 0.557 -0.298 -0.298 -0.447 DNQ, 0.735 -0.298 DNQ, 0.305 DNQ, 0.917 DNQ, 0.317 DNQ, 0.924 New River at Boundary 5/4/10 -0.483 -0.483 -0.483 -0.725 -0.483 -0.483 -0.725 -0.725 -0.483 -0.483 -0.725 -0.483 -0.725 New River at Boundary 5/4/10 -0.812 -0.812 -0.812 -1.22 -0.812 -0.812 -1.22 -1.22 -0.812 -0.812 -1.22 -0.812 -1.22 New River at Boundary 10/5/10 DNQ, 0.457 DNQ, 0.562 1.51 2.01 DNQ, 0.971 -0.424 DNQ, 0.957 DNQ, 1.66 DNQ, 0.649 DNQ, 0.813 DNQ, 1.87 DNQ, 0.849 2.28 New River at Boundary 5/10/11 -0.258 DNQ, 0.283 DNQ, 0.617 DNQ, 0.757 DNQ, 0.397 -0.258 DNQ, 0.396 DNQ, 0.718 -0.258 DNQ, 0.262 DNQ, 0.814 DNQ, 0.405 DNQ, 0.888 New River at Boundary 10/11/11 DNQ, 0.205 DNQ, 0.435 0.631 0.899 1.3 -0.196 DNQ, 0.359 0.914 DNQ, 0.267 DNQ, 0.299 DNQ, 0.843 DNQ, 0.399 0.916 New River Outlet 5/6/02 -0.357 -0.357 -0.357 -0.357 -0.357 -0.357 -0.357 -0.357 -0.357 -0.357 -0.357 New River Outlet 5/6/02 -0.359 -0.359 -0.359 -0.359 -0.359 -0.359 -0.359 -0.359 -0.359 -0.359 -0.359 New River Outlet 10/2/02 -0.118 -0.118 -0.118 -0.118 -0.118 -0.118 -0.118 -0.118 DNQ, 0.122 -0.118 DNQ, 0.224 New River Outlet 4/15/03 -0.055 DNQ, 0.149 DNQ, 0.211 DNQ, 0.105 DNQ, 0.115 DNQ, 0.144 -0.055 -0.055 DNQ, 0.232 0.302 0.285 New River Outlet 11/4/03 -0.062 DNQ, 0.16 DNQ, 0.278 DNQ, 0.118 DNQ, 0.11 DNQ, 0.21 -0.062 DNQ, 0.071 DNQ, 0.246 0.426 0.475 New River Outlet 5/4/04 -0.125 -0.125 -0.125 -0.125 -0.125 DNQ, 0.141 -0.125 -0.125 -0.125 DNQ, 0.136 0.353 New River Outlet 10/5/04 -0.186 DNQ, 0.228 -0.186 -0.186 -0.186 0.458 -0.186 -0.186 0.451 DNQ, 0.252 0.798 New River Outlet 5/10/05 -0.15 DNQ, 0.16 -0.15 -0.15 DNQ, 0.15 -0.15 -0.15 -0.15 DNQ, 0.152 DNQ, 0.158 0.385 New River Outlet 10/26/05 DNQ, 0.091 DNQ, 0.232 0.461 DNQ, 0.161 DNQ, 0.236 0.381 DNQ, 0.125 DNQ, 0.198 0.444 DNQ, 0.197 0.47 New River Outlet 10/26/05 DNQ, 0.074 DNQ, 0.212 0.361 DNQ, 0.141 DNQ, 0.18 0.297 DNQ, 0.102 DNQ, 0.164 0.361 DNQ, 0.199 0.372 New River Outlet 5/1/06 -0.144 0.354 0.594 DNQ, 0.19 0.297 0.403 DNQ, 0.195 DNQ, 0.232 0.51 0.299 0.662 New River Outlet 5/7/07 New River Outlet 10/22/07 -0.17 -0.137 -0.286 -0.382 -0.208 -0.166 -0.223 -0.323 -0.182 -0.249 -0.366 -0.393 -0.5 New River Outlet 4/21/08 -0.188 -0.152 DNQ, 0.517 1.01 DNQ, 0.33 -0.185 0.519 0.951 DNQ, 0.357 DNQ, 0.41 0.929 DNQ, 0.53 1.24 New River Outlet 4/21/08 DNQ, 0.246 DNQ, 0.228 0.976 1.73 0.571 -0.202 0.938 1.73 0.665 DNQ, 0.58 1.34 1.12 2.63 New River Outlet 10/28/08 -0.293 -0.293 -0.293 -0.44 -0.293 -0.293 -0.44 -0.44 -0.293 -0.293 -0.44 -0.293 -0.44 New River Outlet 4/28/09 -0.287 -0.287 DNQ, 0.333 DNQ, 0.693 -0.287 -0.287 DNQ, 0.52 DNQ, 0.844 DNQ, 0.334 DNQ, 0.387 DNQ, 0.992 DNQ, 0.501 DNQ, 1.23 New River Outlet 4/28/09 -0.29 -0.29 -0.29 DNQ, 0.553 -0.29 -0.29 -0.435 DNQ, 0.489 -0.29 -0.29 DNQ, 0.662 DNQ, 0.385 DNQ, 0.836 New River Outlet 10/19/09 -0.289 -0.289 -0.289 -0.289 -0.289 -0.289 -0.289 -0.289 -0.289 -0.289 -0.289 -0.289 -0.289 New River Outlet 5/4/10 -0.56 -0.56 -0.56 -0.839 -0.56 -0.56 -0.839 -0.839 -0.56 -0.56 -0.839 -0.56 -0.839 New River Outlet 10/6/10 -0.289 -0.289 -0.289 -0.433 -0.289 -0.289 -0.433 -0.433 -0.289 -0.289 -0.433 -0.289 -0.433 New River Outlet 5/10/11 -0.341 -0.341 -0.341 -0.512 -0.341 -0.341 -0.512 -0.512 -0.341 -0.341 -0.512 -0.341 -0.512 New River Outlet 5/10/11 -0.326 -0.326 -0.326 -0.489 -0.326 -0.326 -0.489 -0.489 -0.326 -0.326 -0.489 -0.326 -0.489 New River Outlet 10/11/11 -0.293 -0.293 -0.293 -0.44 -0.293 -0.293 -0.44 -0.44 -0.293 -0.293 -0.44 -0.293 -0.44 New River Outlet 10/16/12 -1 -1 -1 -1 -1 -1 -1 -1 -1 -1 -1 -1
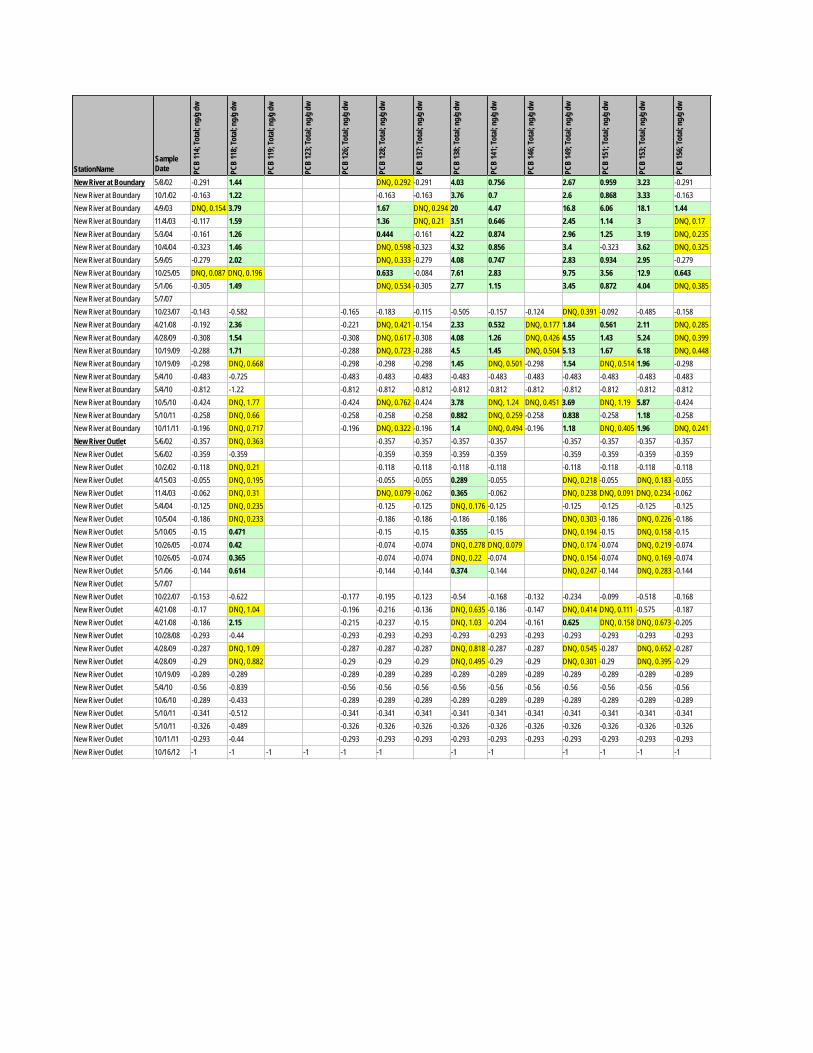
PCB
114;
Tota
l; ng/
g dw
PCB
118;
Tota
l; ng/
g dw
PCB
119;
Tota
l; ng/
g dw
PCB
123;
Tota
l; ng/
g dw
PCB
126;
Tota
l; ng/
g dw
PCB
128;
Tota
l; ng/
g dw
PCB
137;
Tota
l; ng/
g dw
PCB
138;
Tota
l; ng/
g dw
PCB
141;
Tota
l; ng/
g dw
PCB
146;
Tota
l; ng/
g dw
PCB
149;
Tota
l; ng/
g dw
PCB
151;
Tota
l; ng/
g dw
PCB
153;
Tota
l; ng/
g dw
PCB
156;
Tota
l; ng/
g dw
StationName Sample Date
New River at Boundary 5/8/02 -0.291 1.44 DNQ, 0.292 -0.291 4.03 0.756 2.67 0.959 3.23 -0.291 New River at Boundary 10/1/02 -0.163 1.22 -0.163 -0.163 3.76 0.7 2.6 0.868 3.33 -0.163 New River at Boundary 4/9/03 DNQ, 0.154 3.79 1.67 DNQ, 0.294 20 4.47 16.8 6.06 18.1 1.44 New River at Boundary 11/4/03 -0.117 1.59 1.36 DNQ, 0.21 3.51 0.646 2.45 1.14 3 DNQ, 0.17 New River at Boundary 5/3/04 -0.161 1.26 0.444 -0.161 4.22 0.874 2.96 1.25 3.19 DNQ, 0.235 New River at Boundary 10/4/04 -0.323 1.46 DNQ, 0.598 -0.323 4.32 0.856 3.4 -0.323 3.62 DNQ, 0.325 New River at Boundary 5/9/05 -0.279 2.02 DNQ, 0.333 -0.279 4.08 0.747 2.83 0.934 2.95 -0.279 New River at Boundary 10/25/05 DNQ, 0.087 DNQ, 0.196 0.633 -0.084 7.61 2.83 9.75 3.56 12.9 0.643 New River at Boundary 5/1/06 -0.305 1.49 DNQ, 0.534 -0.305 2.77 1.15 3.45 0.872 4.04 DNQ, 0.385 New River at Boundary 5/7/07 New River at Boundary 10/23/07 -0.143 -0.582 -0.165 -0.183 -0.115 -0.505 -0.157 -0.124 DNQ, 0.391 -0.092 -0.485 -0.158 New River at Boundary 4/21/08 -0.192 2.36 -0.221 DNQ, 0.421 -0.154 2.33 0.532 DNQ, 0.177 1.84 0.561 2.11 DNQ, 0.285 New River at Boundary 4/28/09 -0.308 1.54 -0.308 DNQ, 0.617 -0.308 4.08 1.26 DNQ, 0.426 4.55 1.43 5.24 DNQ, 0.399 New River at Boundary 10/19/09 -0.288 1.71 -0.288 DNQ, 0.723 -0.288 4.5 1.45 DNQ, 0.504 5.13 1.67 6.18 DNQ, 0.448 New River at Boundary 10/19/09 -0.298 DNQ, 0.668 -0.298 -0.298 -0.298 1.45 DNQ, 0.501 -0.298 1.54 DNQ, 0.514 1.96 -0.298 New River at Boundary 5/4/10 -0.483 -0.725 -0.483 -0.483 -0.483 -0.483 -0.483 -0.483 -0.483 -0.483 -0.483 -0.483 New River at Boundary 5/4/10 -0.812 -1.22 -0.812 -0.812 -0.812 -0.812 -0.812 -0.812 -0.812 -0.812 -0.812 -0.812 New River at Boundary 10/5/10 -0.424 DNQ, 1.77 -0.424 DNQ, 0.762 -0.424 3.78 DNQ, 1.24 DNQ, 0.451 3.69 DNQ, 1.19 5.87 -0.424 New River at Boundary 5/10/11 -0.258 DNQ, 0.66 -0.258 -0.258 -0.258 0.882 DNQ, 0.259 -0.258 0.838 -0.258 1.18 -0.258 New River at Boundary 10/11/11 -0.196 DNQ, 0.717 -0.196 DNQ, 0.322 -0.196 1.4 DNQ, 0.494 -0.196 1.18 DNQ, 0.405 1.96 DNQ, 0.241 New River Outlet 5/6/02 -0.357 DNQ, 0.363 -0.357 -0.357 -0.357 -0.357 -0.357 -0.357 -0.357 -0.357 New River Outlet 5/6/02 -0.359 -0.359 -0.359 -0.359 -0.359 -0.359 -0.359 -0.359 -0.359 -0.359 New River Outlet 10/2/02 -0.118 DNQ, 0.21 -0.118 -0.118 -0.118 -0.118 -0.118 -0.118 -0.118 -0.118 New River Outlet 4/15/03 -0.055 DNQ, 0.195 -0.055 -0.055 0.289 -0.055 DNQ, 0.218 -0.055 DNQ, 0.183 -0.055 New River Outlet 11/4/03 -0.062 DNQ, 0.31 DNQ, 0.079 -0.062 0.365 -0.062 DNQ, 0.238 DNQ, 0.091 DNQ, 0.234 -0.062 New River Outlet 5/4/04 -0.125 DNQ, 0.235 -0.125 -0.125 DNQ, 0.176 -0.125 -0.125 -0.125 -0.125 -0.125 New River Outlet 10/5/04 -0.186 DNQ, 0.233 -0.186 -0.186 -0.186 -0.186 DNQ, 0.303 -0.186 DNQ, 0.226 -0.186 New River Outlet 5/10/05 -0.15 0.471 -0.15 -0.15 0.355 -0.15 DNQ, 0.194 -0.15 DNQ, 0.158 -0.15 New River Outlet 10/26/05 -0.074 0.42 -0.074 -0.074 DNQ, 0.278 DNQ, 0.079 DNQ, 0.174 -0.074 DNQ, 0.219 -0.074 New River Outlet 10/26/05 -0.074 0.365 -0.074 -0.074 DNQ, 0.22 -0.074 DNQ, 0.154 -0.074 DNQ, 0.169 -0.074 New River Outlet 5/1/06 -0.144 0.614 -0.144 -0.144 0.374 -0.144 DNQ, 0.247 -0.144 DNQ, 0.283 -0.144 New River Outlet 5/7/07 New River Outlet 10/22/07 -0.153 -0.622 -0.177 -0.195 -0.123 -0.54 -0.168 -0.132 -0.234 -0.099 -0.518 -0.168 New River Outlet 4/21/08 -0.17 DNQ, 1.04 -0.196 -0.216 -0.136 DNQ, 0.635 -0.186 -0.147 DNQ, 0.414 DNQ, 0.111 -0.575 -0.187 New River Outlet 4/21/08 -0.186 2.15 -0.215 -0.237 -0.15 DNQ, 1.03 -0.204 -0.161 0.625 DNQ, 0.158 DNQ, 0.673 -0.205 New River Outlet 10/28/08 -0.293 -0.44 -0.293 -0.293 -0.293 -0.293 -0.293 -0.293 -0.293 -0.293 -0.293 -0.293 New River Outlet 4/28/09 -0.287 DNQ, 1.09 -0.287 -0.287 -0.287 DNQ, 0.818 -0.287 -0.287 DNQ, 0.545 -0.287 DNQ, 0.652 -0.287 New River Outlet 4/28/09 -0.29 DNQ, 0.882 -0.29 -0.29 -0.29 DNQ, 0.495 -0.29 -0.29 DNQ, 0.301 -0.29 DNQ, 0.395 -0.29 New River Outlet 10/19/09 -0.289 -0.289 -0.289 -0.289 -0.289 -0.289 -0.289 -0.289 -0.289 -0.289 -0.289 -0.289 New River Outlet 5/4/10 -0.56 -0.839 -0.56 -0.56 -0.56 -0.56 -0.56 -0.56 -0.56 -0.56 -0.56 -0.56 New River Outlet 10/6/10 -0.289 -0.433 -0.289 -0.289 -0.289 -0.289 -0.289 -0.289 -0.289 -0.289 -0.289 -0.289 New River Outlet 5/10/11 -0.341 -0.512 -0.341 -0.341 -0.341 -0.341 -0.341 -0.341 -0.341 -0.341 -0.341 -0.341 New River Outlet 5/10/11 -0.326 -0.489 -0.326 -0.326 -0.326 -0.326 -0.326 -0.326 -0.326 -0.326 -0.326 -0.326 New River Outlet 10/11/11 -0.293 -0.44 -0.293 -0.293 -0.293 -0.293 -0.293 -0.293 -0.293 -0.293 -0.293 -0.293 New River Outlet 10/16/12 -1 -1 -1 -1 -1 -1 -1 -1 -1 -1 -1 -1
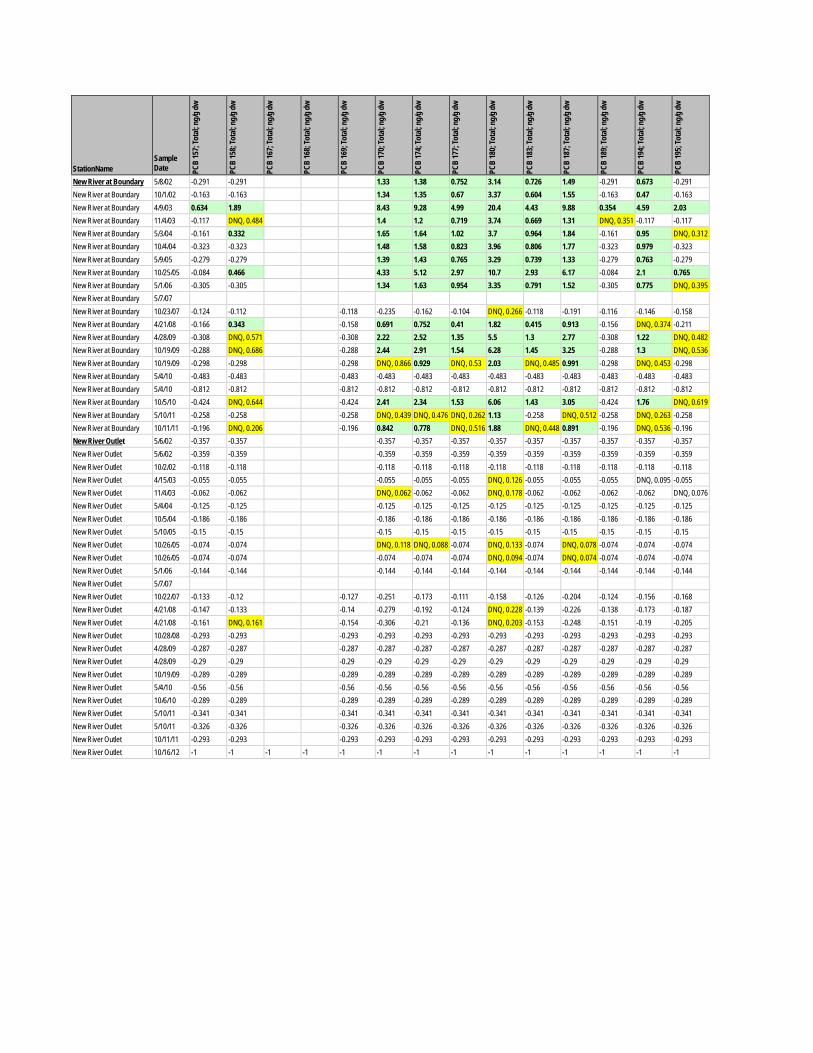
StationName
Sample Date PC
B 15
7; To
tal; n
g/g d
w
PCB
158;
Tota
l; ng/
g dw
PCB
167;
Tota
l; ng/
g dw
PCB
168;
Tota
l; ng/
g dw
PCB
169;
Tota
l; ng/
g dw
PCB
170;
Tota
l; ng/
g dw
PCB
174;
Tota
l; ng/
g dw
PCB
177;
Tota
l; ng/
g dw
PCB
180;
Tota
l; ng/
g dw
PCB
183;
Tota
l; ng/
g dw
PCB
187;
Tota
l; ng/
g dw
PCB
189;
Tota
l; ng/
g dw
PCB
194;
Tota
l; ng/
g dw
PCB
195;
Tota
l; ng/
g dw
New River at Boundary 5/8/02 -0.291 -0.291 1.33 1.38 0.752 3.14 0.726 1.49 -0.291 0.673 -0.291 New River at Boundary 10/1/02 -0.163 -0.163 1.34 1.35 0.67 3.37 0.604 1.55 -0.163 0.47 -0.163 New River at Boundary 4/9/03 0.634 1.89 8.43 9.28 4.99 20.4 4.43 9.88 0.354 4.59 2.03 New River at Boundary 11/4/03 -0.117 DNQ, 0.484 1.4 1.2 0.719 3.74 0.669 1.31 DNQ, 0.351 -0.117 -0.117 New River at Boundary 5/3/04 -0.161 0.332 1.65 1.64 1.02 3.7 0.964 1.84 -0.161 0.95 DNQ, 0.312 New River at Boundary 10/4/04 -0.323 -0.323 1.48 1.58 0.823 3.96 0.806 1.77 -0.323 0.979 -0.323 New River at Boundary 5/9/05 -0.279 -0.279 1.39 1.43 0.765 3.29 0.739 1.33 -0.279 0.763 -0.279 New River at Boundary 10/25/05 -0.084 0.466 4.33 5.12 2.97 10.7 2.93 6.17 -0.084 2.1 0.765 New River at Boundary 5/1/06 -0.305 -0.305 1.34 1.63 0.954 3.35 0.791 1.52 -0.305 0.775 DNQ, 0.395 New River at Boundary 5/7/07 New River at Boundary 10/23/07 -0.124 -0.112 -0.118 -0.235 -0.162 -0.104 DNQ, 0.266 -0.118 -0.191 -0.116 -0.146 -0.158 New River at Boundary 4/21/08 -0.166 0.343 -0.158 0.691 0.752 0.41 1.82 0.415 0.913 -0.156 DNQ, 0.374 -0.211 New River at Boundary 4/28/09 -0.308 DNQ, 0.571 -0.308 2.22 2.52 1.35 5.5 1.3 2.77 -0.308 1.22 DNQ, 0.482 New River at Boundary 10/19/09 -0.288 DNQ, 0.686 -0.288 2.44 2.91 1.54 6.28 1.45 3.25 -0.288 1.3 DNQ, 0.536 New River at Boundary 10/19/09 -0.298 -0.298 -0.298 DNQ, 0.866 0.929 DNQ, 0.53 2.03 DNQ, 0.485 0.991 -0.298 DNQ, 0.453 -0.298 New River at Boundary 5/4/10 -0.483 -0.483 -0.483 -0.483 -0.483 -0.483 -0.483 -0.483 -0.483 -0.483 -0.483 -0.483 New River at Boundary 5/4/10 -0.812 -0.812 -0.812 -0.812 -0.812 -0.812 -0.812 -0.812 -0.812 -0.812 -0.812 -0.812 New River at Boundary 10/5/10 -0.424 DNQ, 0.644 -0.424 2.41 2.34 1.53 6.06 1.43 3.05 -0.424 1.76 DNQ, 0.619 New River at Boundary 5/10/11 -0.258 -0.258 -0.258 DNQ, 0.439 DNQ, 0.476 DNQ, 0.262 1.13 -0.258 DNQ, 0.512 -0.258 DNQ, 0.263 -0.258 New River at Boundary 10/11/11 -0.196 DNQ, 0.206 -0.196 0.842 0.778 DNQ, 0.516 1.88 DNQ, 0.448 0.891 -0.196 DNQ, 0.536 -0.196 New River Outlet 5/6/02 -0.357 -0.357 -0.357 -0.357 -0.357 -0.357 -0.357 -0.357 -0.357 -0.357 -0.357 New River Outlet 5/6/02 -0.359 -0.359 -0.359 -0.359 -0.359 -0.359 -0.359 -0.359 -0.359 -0.359 -0.359 New River Outlet 10/2/02 -0.118 -0.118 -0.118 -0.118 -0.118 -0.118 -0.118 -0.118 -0.118 -0.118 -0.118 New River Outlet 4/15/03 -0.055 -0.055 -0.055 -0.055 -0.055 DNQ, 0.126 -0.055 -0.055 -0.055 DNQ, 0.095 -0.055 New River Outlet 11/4/03 -0.062 -0.062 DNQ, 0.062 -0.062 -0.062 DNQ, 0.178 -0.062 -0.062 -0.062 -0.062 DNQ, 0.076 New River Outlet 5/4/04 -0.125 -0.125 -0.125 -0.125 -0.125 -0.125 -0.125 -0.125 -0.125 -0.125 -0.125 New River Outlet 10/5/04 -0.186 -0.186 -0.186 -0.186 -0.186 -0.186 -0.186 -0.186 -0.186 -0.186 -0.186 New River Outlet 5/10/05 -0.15 -0.15 -0.15 -0.15 -0.15 -0.15 -0.15 -0.15 -0.15 -0.15 -0.15 New River Outlet 10/26/05 -0.074 -0.074 DNQ, 0.118 DNQ, 0.088 -0.074 DNQ, 0.133 -0.074 DNQ, 0.078 -0.074 -0.074 -0.074 New River Outlet 10/26/05 -0.074 -0.074 -0.074 -0.074 -0.074 DNQ, 0.094 -0.074 DNQ, 0.074 -0.074 -0.074 -0.074 New River Outlet 5/1/06 -0.144 -0.144 -0.144 -0.144 -0.144 -0.144 -0.144 -0.144 -0.144 -0.144 -0.144 New River Outlet 5/7/07 New River Outlet 10/22/07 -0.133 -0.12 -0.127 -0.251 -0.173 -0.111 -0.158 -0.126 -0.204 -0.124 -0.156 -0.168 New River Outlet 4/21/08 -0.147 -0.133 -0.14 -0.279 -0.192 -0.124 DNQ, 0.228 -0.139 -0.226 -0.138 -0.173 -0.187 New River Outlet 4/21/08 -0.161 DNQ, 0.161 -0.154 -0.306 -0.21 -0.136 DNQ, 0.203 -0.153 -0.248 -0.151 -0.19 -0.205 New River Outlet 10/28/08 -0.293 -0.293 -0.293 -0.293 -0.293 -0.293 -0.293 -0.293 -0.293 -0.293 -0.293 -0.293 New River Outlet 4/28/09 -0.287 -0.287 -0.287 -0.287 -0.287 -0.287 -0.287 -0.287 -0.287 -0.287 -0.287 -0.287 New River Outlet 4/28/09 -0.29 -0.29 -0.29 -0.29 -0.29 -0.29 -0.29 -0.29 -0.29 -0.29 -0.29 -0.29 New River Outlet 10/19/09 -0.289 -0.289 -0.289 -0.289 -0.289 -0.289 -0.289 -0.289 -0.289 -0.289 -0.289 -0.289 New River Outlet 5/4/10 -0.56 -0.56 -0.56 -0.56 -0.56 -0.56 -0.56 -0.56 -0.56 -0.56 -0.56 -0.56 New River Outlet 10/6/10 -0.289 -0.289 -0.289 -0.289 -0.289 -0.289 -0.289 -0.289 -0.289 -0.289 -0.289 -0.289 New River Outlet 5/10/11 -0.341 -0.341 -0.341 -0.341 -0.341 -0.341 -0.341 -0.341 -0.341 -0.341 -0.341 -0.341 New River Outlet 5/10/11 -0.326 -0.326 -0.326 -0.326 -0.326 -0.326 -0.326 -0.326 -0.326 -0.326 -0.326 -0.326 New River Outlet 10/11/11 -0.293 -0.293 -0.293 -0.293 -0.293 -0.293 -0.293 -0.293 -0.293 -0.293 -0.293 -0.293 New River Outlet 10/16/12 -1 -1 -1 -1 -1 -1 -1 -1 -1 -1 -1 -1 -1 -1
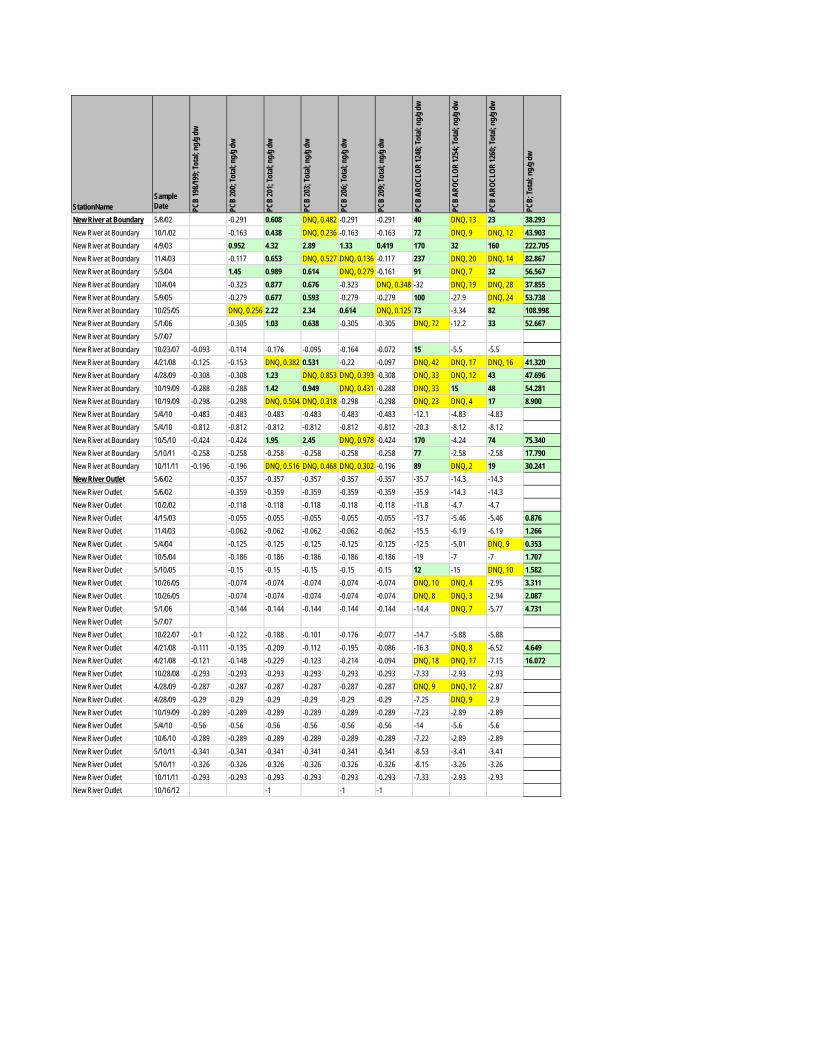
StationName
Sample Date PC
B 19
8/199
; Tot
al; ng
/g dw
PCB
200;
Tota
l; ng/
g dw
PCB
201;
Tota
l; ng/
g dw
PCB
203;
Tota
l; ng/
g dw
PCB
206;
Tota
l; ng/
g dw
PCB
209;
Tota
l; ng/
g dw
PCB
AROC
LOR
1248
; Tot
al; ng
/g dw
PCB
AROC
LOR
1254
; Tot
al; ng
/g dw
PCB
AROC
LOR
1260
; Tot
al; ng
/g dw
PCB;
Tota
l; ng/
g dw
New River at Boundary 5/8/02 -0.291 0.608 DNQ, 0.482 -0.291 -0.291 40 DNQ, 13 23 38.293 New River at Boundary 10/1/02 -0.163 0.438 DNQ, 0.236 -0.163 -0.163 72 DNQ, 9 DNQ, 12 43.903 New River at Boundary 4/9/03 0.952 4.32 2.89 1.33 0.419 170 32 160 222.705 New River at Boundary 11/4/03 -0.117 0.653 DNQ, 0.527 DNQ, 0.136 -0.117 237 DNQ, 20 DNQ, 14 82.867 New River at Boundary 5/3/04 1.45 0.989 0.614 DNQ, 0.279 -0.161 91 DNQ, 7 32 56.567 New River at Boundary 10/4/04 -0.323 0.877 0.676 -0.323 DNQ, 0.348 -32 DNQ, 19 DNQ, 28 37.855 New River at Boundary 5/9/05 -0.279 0.677 0.593 -0.279 -0.279 100 -27.9 DNQ, 24 53.738 New River at Boundary 10/25/05 DNQ, 0.256 2.22 2.34 0.614 DNQ, 0.125 73 -3.34 82 108.998 New River at Boundary 5/1/06 -0.305 1.03 0.638 -0.305 -0.305 DNQ, 72 -12.2 33 52.667 New River at Boundary 5/7/07 New River at Boundary 10/23/07 -0.093 -0.114 -0.176 -0.095 -0.164 -0.072 15 -5.5 -5.5 New River at Boundary 4/21/08 -0.125 -0.153 DNQ, 0.382 0.531 -0.22 -0.097 DNQ, 42 DNQ, 17 DNQ, 16 41.320 New River at Boundary 4/28/09 -0.308 -0.308 1.23 DNQ, 0.853 DNQ, 0.393 -0.308 DNQ, 33 DNQ, 12 43 47.696 New River at Boundary 10/19/09 -0.288 -0.288 1.42 0.949 DNQ, 0.431 -0.288 DNQ, 33 15 48 54.281 New River at Boundary 10/19/09 -0.298 -0.298 DNQ, 0.504 DNQ, 0.318 -0.298 -0.298 DNQ, 23 DNQ, 4 17 8.900 New River at Boundary 5/4/10 -0.483 -0.483 -0.483 -0.483 -0.483 -0.483 -12.1 -4.83 -4.83 New River at Boundary 5/4/10 -0.812 -0.812 -0.812 -0.812 -0.812 -0.812 -20.3 -8.12 -8.12 New River at Boundary 10/5/10 -0.424 -0.424 1.95 2.45 DNQ, 0.978 -0.424 170 -4.24 74 75.340 New River at Boundary 5/10/11 -0.258 -0.258 -0.258 -0.258 -0.258 -0.258 77 -2.58 -2.58 17.790 New River at Boundary 10/11/11 -0.196 -0.196 DNQ, 0.516 DNQ, 0.468 DNQ, 0.302 -0.196 89 DNQ, 2 19 30.241 New River Outlet 5/6/02 -0.357 -0.357 -0.357 -0.357 -0.357 -35.7 -14.3 -14.3 New River Outlet 5/6/02 -0.359 -0.359 -0.359 -0.359 -0.359 -35.9 -14.3 -14.3 New River Outlet 10/2/02 -0.118 -0.118 -0.118 -0.118 -0.118 -11.8 -4.7 -4.7 New River Outlet 4/15/03 -0.055 -0.055 -0.055 -0.055 -0.055 -13.7 -5.46 -5.46 0.876 New River Outlet 11/4/03 -0.062 -0.062 -0.062 -0.062 -0.062 -15.5 -6.19 -6.19 1.266 New River Outlet 5/4/04 -0.125 -0.125 -0.125 -0.125 -0.125 -12.5 -5.01 DNQ, 9 0.353 New River Outlet 10/5/04 -0.186 -0.186 -0.186 -0.186 -0.186 -19 -7 -7 1.707 New River Outlet 5/10/05 -0.15 -0.15 -0.15 -0.15 -0.15 12 -15 DNQ, 10 1.582 New River Outlet 10/26/05 -0.074 -0.074 -0.074 -0.074 -0.074 DNQ, 10 DNQ, 4 -2.95 3.311 New River Outlet 10/26/05 -0.074 -0.074 -0.074 -0.074 -0.074 DNQ, 8 DNQ, 3 -2.94 2.087 New River Outlet 5/1/06 -0.144 -0.144 -0.144 -0.144 -0.144 -14.4 DNQ, 7 -5.77 4.731 New River Outlet 5/7/07 New River Outlet 10/22/07 -0.1 -0.122 -0.188 -0.101 -0.176 -0.077 -14.7 -5.88 -5.88 New River Outlet 4/21/08 -0.111 -0.135 -0.209 -0.112 -0.195 -0.086 -16.3 DNQ, 8 -6.52 4.649 New River Outlet 4/21/08 -0.121 -0.148 -0.229 -0.123 -0.214 -0.094 DNQ, 18 DNQ, 17 -7.15 16.072 New River Outlet 10/28/08 -0.293 -0.293 -0.293 -0.293 -0.293 -0.293 -7.33 -2.93 -2.93 New River Outlet 4/28/09 -0.287 -0.287 -0.287 -0.287 -0.287 -0.287 DNQ, 9 DNQ, 12 -2.87 New River Outlet 4/28/09 -0.29 -0.29 -0.29 -0.29 -0.29 -0.29 -7.25 DNQ, 9 -2.9 New River Outlet 10/19/09 -0.289 -0.289 -0.289 -0.289 -0.289 -0.289 -7.23 -2.89 -2.89 New River Outlet 5/4/10 -0.56 -0.56 -0.56 -0.56 -0.56 -0.56 -14 -5.6 -5.6 New River Outlet 10/6/10 -0.289 -0.289 -0.289 -0.289 -0.289 -0.289 -7.22 -2.89 -2.89 New River Outlet 5/10/11 -0.341 -0.341 -0.341 -0.341 -0.341 -0.341 -8.53 -3.41 -3.41 New River Outlet 5/10/11 -0.326 -0.326 -0.326 -0.326 -0.326 -0.326 -8.15 -3.26 -3.26 New River Outlet 10/11/11 -0.293 -0.293 -0.293 -0.293 -0.293 -0.293 -7.33 -2.93 -2.93 New River Outlet 10/16/12 -1 -1 -1
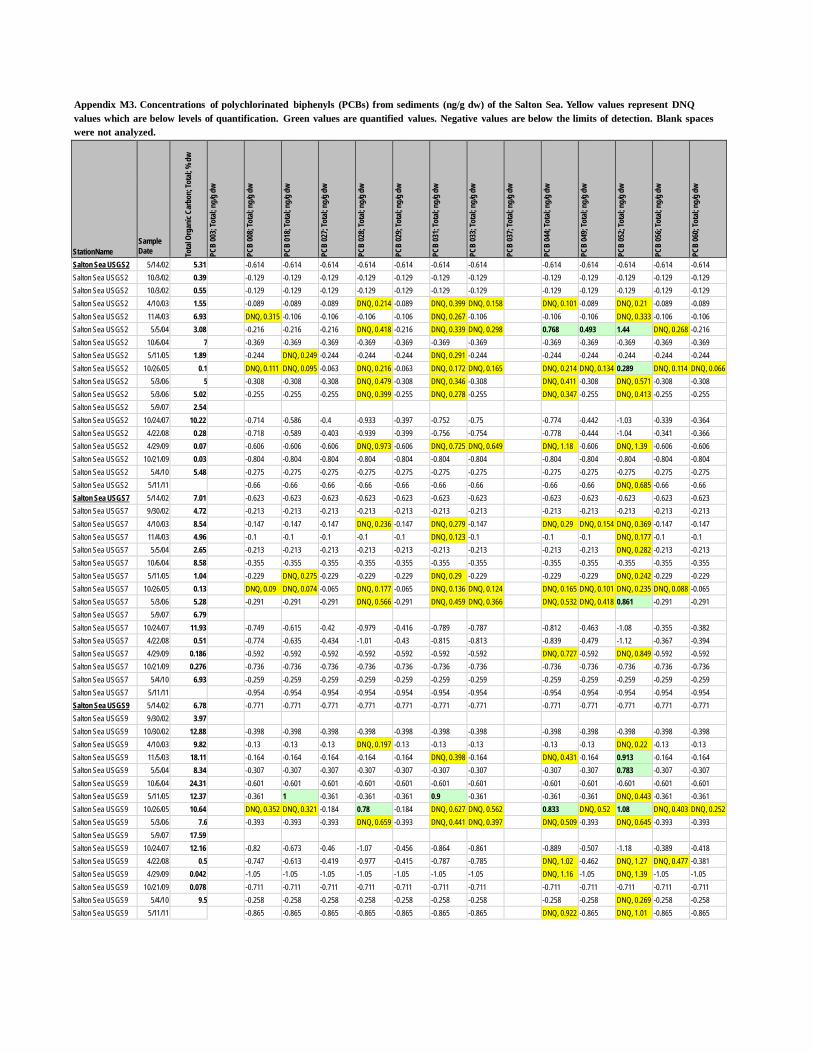
Appendix M3. Concentrations of polychlorinated biphenyls (PCBs) from sediments (ng/g dw) of the Salton Sea. Yellow values represent DNQ values which are below levels of quantification. Green values are quantified values. Negative values are below the limits of detection. Blank spaces were not analyzed. StationName
Sample Date To
tal O
rgan
ic Ca
rbon
; Tot
al; %
dw
PCB
003;
Tota
l; ng/
g dw
PCB
008;
Tota
l; ng/
g dw
PCB
018;
Tota
l; ng/
g dw
PCB
027;
Tota
l; ng/
g dw
PCB
028;
Tota
l; ng/
g dw
PCB
029;
Tota
l; ng/
g dw
PCB
031;
Tota
l; ng/
g dw
PCB
033;
Tota
l; ng/
g dw
PCB
037;
Tota
l; ng/
g dw
PCB
044;
Tota
l; ng/
g dw
PCB
049;
Tota
l; ng/
g dw
PCB
052;
Tota
l; ng/
g dw
PCB
056;
Tota
l; ng/
g dw
PCB
060;
Tota
l; ng/
g dw
Salton Sea USGS2 5/14/02 5.31 -0.614 -0.614 -0.614 -0.614 -0.614 -0.614 -0.614 -0.614 -0.614 -0.614 -0.614 -0.614 Salton Sea USGS2 10/3/02 0.39 -0.129 -0.129 -0.129 -0.129 -0.129 -0.129 -0.129 -0.129 -0.129 -0.129 -0.129 -0.129 Salton Sea USGS2 10/3/02 0.55 -0.129 -0.129 -0.129 -0.129 -0.129 -0.129 -0.129 -0.129 -0.129 -0.129 -0.129 -0.129 Salton Sea USGS2 4/10/03 1.55 -0.089 -0.089 -0.089 DNQ, 0.214 -0.089 DNQ, 0.399 DNQ, 0.158 DNQ, 0.101 -0.089 DNQ, 0.21 -0.089 -0.089 Salton Sea USGS2 11/4/03 6.93 DNQ, 0.315 -0.106 -0.106 -0.106 -0.106 DNQ, 0.267 -0.106 -0.106 -0.106 DNQ, 0.333 -0.106 -0.106 Salton Sea USGS2 5/5/04 3.08 -0.216 -0.216 -0.216 DNQ, 0.418 -0.216 DNQ, 0.339 DNQ, 0.298 0.768 0.493 1.44 DNQ, 0.268 -0.216 Salton Sea USGS2 10/6/04 7 -0.369 -0.369 -0.369 -0.369 -0.369 -0.369 -0.369 -0.369 -0.369 -0.369 -0.369 -0.369 Salton Sea USGS2 5/11/05 1.89 -0.244 DNQ, 0.249 -0.244 -0.244 -0.244 DNQ, 0.291 -0.244 -0.244 -0.244 -0.244 -0.244 -0.244 Salton Sea USGS2 10/26/05 0.1 DNQ, 0.111 DNQ, 0.095 -0.063 DNQ, 0.216 -0.063 DNQ, 0.172 DNQ, 0.165 DNQ, 0.214 DNQ, 0.134 0.289 DNQ, 0.114 DNQ, 0.066 Salton Sea USGS2 5/3/06 5 -0.308 -0.308 -0.308 DNQ, 0.479 -0.308 DNQ, 0.346 -0.308 DNQ, 0.411 -0.308 DNQ, 0.571 -0.308 -0.308 Salton Sea USGS2 5/3/06 5.02 -0.255 -0.255 -0.255 DNQ, 0.399 -0.255 DNQ, 0.278 -0.255 DNQ, 0.347 -0.255 DNQ, 0.413 -0.255 -0.255 Salton Sea USGS2 5/9/07 2.54 Salton Sea USGS2 10/24/07 10.22 -0.714 -0.586 -0.4 -0.933 -0.397 -0.752 -0.75 -0.774 -0.442 -1.03 -0.339 -0.364 Salton Sea USGS2 4/22/08 0.28 -0.718 -0.589 -0.403 -0.939 -0.399 -0.756 -0.754 -0.778 -0.444 -1.04 -0.341 -0.366 Salton Sea USGS2 4/29/09 0.07 -0.606 -0.606 -0.606 DNQ, 0.973 -0.606 DNQ, 0.725 DNQ, 0.649 DNQ, 1.18 -0.606 DNQ, 1.39 -0.606 -0.606 Salton Sea USGS2 10/21/09 0.03 -0.804 -0.804 -0.804 -0.804 -0.804 -0.804 -0.804 -0.804 -0.804 -0.804 -0.804 -0.804 Salton Sea USGS2 5/4/10 5.48 -0.275 -0.275 -0.275 -0.275 -0.275 -0.275 -0.275 -0.275 -0.275 -0.275 -0.275 -0.275 Salton Sea USGS2 5/11/11 -0.66 -0.66 -0.66 -0.66 -0.66 -0.66 -0.66 -0.66 -0.66 DNQ, 0.685 -0.66 -0.66 Salton Sea USGS7 5/14/02 7.01 -0.623 -0.623 -0.623 -0.623 -0.623 -0.623 -0.623 -0.623 -0.623 -0.623 -0.623 -0.623 Salton Sea USGS7 9/30/02 4.72 -0.213 -0.213 -0.213 -0.213 -0.213 -0.213 -0.213 -0.213 -0.213 -0.213 -0.213 -0.213 Salton Sea USGS7 4/10/03 8.54 -0.147 -0.147 -0.147 DNQ, 0.236 -0.147 DNQ, 0.279 -0.147 DNQ, 0.29 DNQ, 0.154 DNQ, 0.369 -0.147 -0.147 Salton Sea USGS7 11/4/03 4.96 -0.1 -0.1 -0.1 -0.1 -0.1 DNQ, 0.123 -0.1 -0.1 -0.1 DNQ, 0.177 -0.1 -0.1 Salton Sea USGS7 5/5/04 2.65 -0.213 -0.213 -0.213 -0.213 -0.213 -0.213 -0.213 -0.213 -0.213 DNQ, 0.282 -0.213 -0.213 Salton Sea USGS7 10/6/04 8.58 -0.355 -0.355 -0.355 -0.355 -0.355 -0.355 -0.355 -0.355 -0.355 -0.355 -0.355 -0.355 Salton Sea USGS7 5/11/05 1.04 -0.229 DNQ, 0.275 -0.229 -0.229 -0.229 DNQ, 0.29 -0.229 -0.229 -0.229 DNQ, 0.242 -0.229 -0.229 Salton Sea USGS7 10/26/05 0.13 DNQ, 0.09 DNQ, 0.074 -0.065 DNQ, 0.177 -0.065 DNQ, 0.136 DNQ, 0.124 DNQ, 0.165 DNQ, 0.101 DNQ, 0.235 DNQ, 0.088 -0.065 Salton Sea USGS7 5/3/06 5.28 -0.291 -0.291 -0.291 DNQ, 0.566 -0.291 DNQ, 0.459 DNQ, 0.366 DNQ, 0.532 DNQ, 0.418 0.861 -0.291 -0.291 Salton Sea USGS7 5/9/07 6.79 Salton Sea USGS7 10/24/07 11.93 -0.749 -0.615 -0.42 -0.979 -0.416 -0.789 -0.787 -0.812 -0.463 -1.08 -0.355 -0.382 Salton Sea USGS7 4/22/08 0.51 -0.774 -0.635 -0.434 -1.01 -0.43 -0.815 -0.813 -0.839 -0.479 -1.12 -0.367 -0.394 Salton Sea USGS7 4/29/09 0.186 -0.592 -0.592 -0.592 -0.592 -0.592 -0.592 -0.592 DNQ, 0.727 -0.592 DNQ, 0.849 -0.592 -0.592 Salton Sea USGS7 10/21/09 0.276 -0.736 -0.736 -0.736 -0.736 -0.736 -0.736 -0.736 -0.736 -0.736 -0.736 -0.736 -0.736 Salton Sea USGS7 5/4/10 6.93 -0.259 -0.259 -0.259 -0.259 -0.259 -0.259 -0.259 -0.259 -0.259 -0.259 -0.259 -0.259 Salton Sea USGS7 5/11/11 -0.954 -0.954 -0.954 -0.954 -0.954 -0.954 -0.954 -0.954 -0.954 -0.954 -0.954 -0.954 Salton Sea USGS9 5/14/02 6.78 -0.771 -0.771 -0.771 -0.771 -0.771 -0.771 -0.771 -0.771 -0.771 -0.771 -0.771 -0.771 Salton Sea USGS9 9/30/02 3.97 Salton Sea USGS9 10/30/02 12.88 -0.398 -0.398 -0.398 -0.398 -0.398 -0.398 -0.398 -0.398 -0.398 -0.398 -0.398 -0.398 Salton Sea USGS9 4/10/03 9.82 -0.13 -0.13 -0.13 DNQ, 0.197 -0.13 -0.13 -0.13 -0.13 -0.13 DNQ, 0.22 -0.13 -0.13 Salton Sea USGS9 11/5/03 18.11 -0.164 -0.164 -0.164 -0.164 -0.164 DNQ, 0.398 -0.164 DNQ, 0.431 -0.164 0.913 -0.164 -0.164 Salton Sea USGS9 5/5/04 8.34 -0.307 -0.307 -0.307 -0.307 -0.307 -0.307 -0.307 -0.307 -0.307 0.783 -0.307 -0.307 Salton Sea USGS9 10/6/04 24.31 -0.601 -0.601 -0.601 -0.601 -0.601 -0.601 -0.601 -0.601 -0.601 -0.601 -0.601 -0.601 Salton Sea USGS9 5/11/05 12.37 -0.361 1 -0.361 -0.361 -0.361 0.9 -0.361 -0.361 -0.361 DNQ, 0.443 -0.361 -0.361 Salton Sea USGS9 10/26/05 10.64 DNQ, 0.352 DNQ, 0.321 -0.184 0.78 -0.184 DNQ, 0.627 DNQ, 0.562 0.833 DNQ, 0.52 1.08 DNQ, 0.403 DNQ, 0.252 Salton Sea USGS9 5/3/06 7.6 -0.393 -0.393 -0.393 DNQ, 0.659 -0.393 DNQ, 0.441 DNQ, 0.397 DNQ, 0.509 -0.393 DNQ, 0.645 -0.393 -0.393 Salton Sea USGS9 5/9/07 17.59 Salton Sea USGS9 10/24/07 12.16 -0.82 -0.673 -0.46 -1.07 -0.456 -0.864 -0.861 -0.889 -0.507 -1.18 -0.389 -0.418 Salton Sea USGS9 4/22/08 0.5 -0.747 -0.613 -0.419 -0.977 -0.415 -0.787 -0.785 DNQ, 1.02 -0.462 DNQ, 1.27 DNQ, 0.477 -0.381 Salton Sea USGS9 4/29/09 0.042 -1.05 -1.05 -1.05 -1.05 -1.05 -1.05 -1.05 DNQ, 1.16 -1.05 DNQ, 1.39 -1.05 -1.05 Salton Sea USGS9 10/21/09 0.078 -0.711 -0.711 -0.711 -0.711 -0.711 -0.711 -0.711 -0.711 -0.711 -0.711 -0.711 -0.711 Salton Sea USGS9 5/4/10 9.5 -0.258 -0.258 -0.258 -0.258 -0.258 -0.258 -0.258 -0.258 -0.258 DNQ, 0.269 -0.258 -0.258 Salton Sea USGS9 5/11/11 -0.865 -0.865 -0.865 -0.865 -0.865 -0.865 -0.865 DNQ, 0.922 -0.865 DNQ, 1.01 -0.865 -0.865
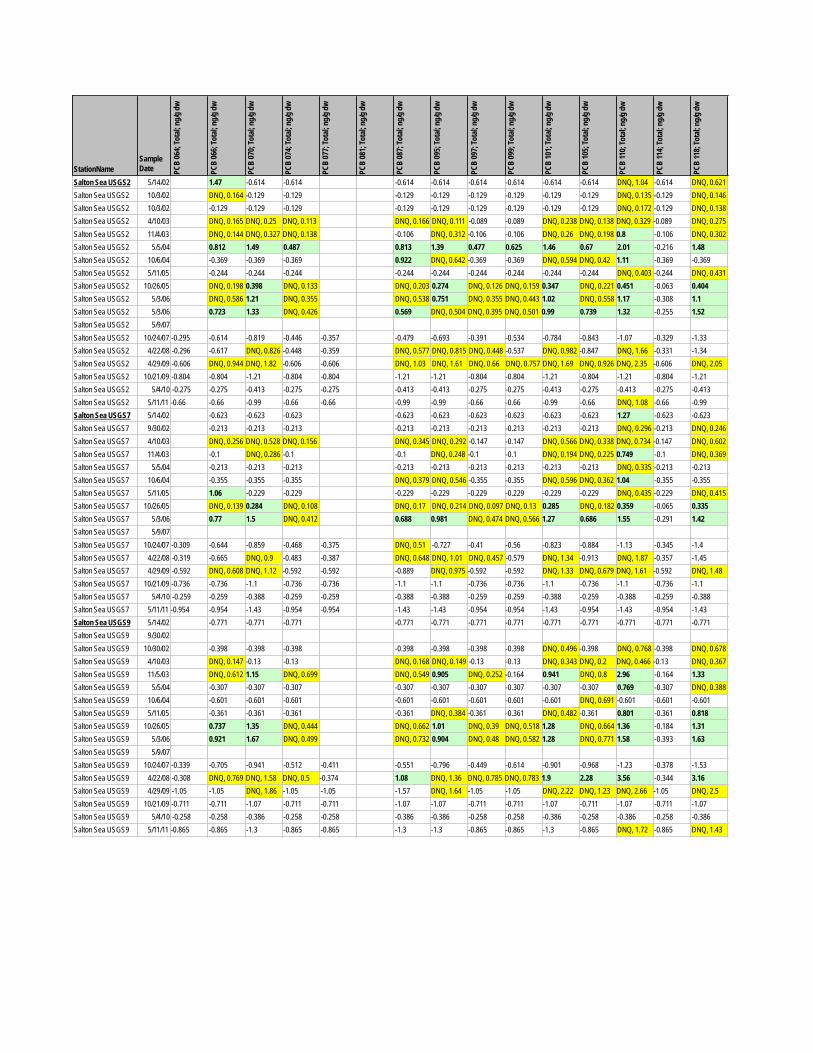
PCB
064;
Tota
l; ng/
g dw
PCB
066;
Tota
l; ng/
g dw
PCB
070;
Tota
l; ng/
g dw
PCB
074;
Tota
l; ng/
g dw
PCB
077;
Tota
l; ng/
g dw
PCB
081;
Tota
l; ng/
g dw
PCB
087;
Tota
l; ng/
g dw
PCB
095;
Tota
l; ng/
g dw
PCB
097;
Tota
l; ng/
g dw
PCB
099;
Tota
l; ng/
g dw
PCB
101;
Tota
l; ng/
g dw
PCB
105;
Tota
l; ng/
g dw
PCB
110;
Tota
l; ng/
g dw
PCB
114;
Tota
l; ng/
g dw
PCB
118;
Tota
l; ng/
g dw
StationName Sample Date
Salton Sea USGS2 5/14/02 1.47 -0.614 -0.614 -0.614 -0.614 -0.614 -0.614 -0.614 -0.614 DNQ, 1.04 -0.614 DNQ, 0.621 Salton Sea USGS2 10/3/02 DNQ, 0.164 -0.129 -0.129 -0.129 -0.129 -0.129 -0.129 -0.129 -0.129 DNQ, 0.135 -0.129 DNQ, 0.146 Salton Sea USGS2 10/3/02 -0.129 -0.129 -0.129 -0.129 -0.129 -0.129 -0.129 -0.129 -0.129 DNQ, 0.172 -0.129 DNQ, 0.138 Salton Sea USGS2 4/10/03 DNQ, 0.165 DNQ, 0.25 DNQ, 0.113 DNQ, 0.166 DNQ, 0.111 -0.089 -0.089 DNQ, 0.238 DNQ, 0.138 DNQ, 0.329 -0.089 DNQ, 0.275 Salton Sea USGS2 11/4/03 DNQ, 0.144 DNQ, 0.327 DNQ, 0.138 -0.106 DNQ, 0.312 -0.106 -0.106 DNQ, 0.26 DNQ, 0.198 0.8 -0.106 DNQ, 0.302 Salton Sea USGS2 5/5/04 0.812 1.49 0.487 0.813 1.39 0.477 0.625 1.46 0.67 2.01 -0.216 1.48 Salton Sea USGS2 10/6/04 -0.369 -0.369 -0.369 0.922 DNQ, 0.642 -0.369 -0.369 DNQ, 0.594 DNQ, 0.42 1.11 -0.369 -0.369 Salton Sea USGS2 5/11/05 -0.244 -0.244 -0.244 -0.244 -0.244 -0.244 -0.244 -0.244 -0.244 DNQ, 0.403 -0.244 DNQ, 0.431 Salton Sea USGS2 10/26/05 DNQ, 0.198 0.398 DNQ, 0.133 DNQ, 0.203 0.274 DNQ, 0.126 DNQ, 0.159 0.347 DNQ, 0.221 0.451 -0.063 0.404 Salton Sea USGS2 5/3/06 DNQ, 0.586 1.21 DNQ, 0.355 DNQ, 0.538 0.751 DNQ, 0.355 DNQ, 0.443 1.02 DNQ, 0.558 1.17 -0.308 1.1 Salton Sea USGS2 5/3/06 0.723 1.33 DNQ, 0.426 0.569 DNQ, 0.504 DNQ, 0.395 DNQ, 0.501 0.99 0.739 1.32 -0.255 1.52 Salton Sea USGS2 5/9/07 Salton Sea USGS2 10/24/07 -0.295 -0.614 -0.819 -0.446 -0.357 -0.479 -0.693 -0.391 -0.534 -0.784 -0.843 -1.07 -0.329 -1.33 Salton Sea USGS2 4/22/08 -0.296 -0.617 DNQ, 0.826 -0.448 -0.359 DNQ, 0.577 DNQ, 0.815 DNQ, 0.448 -0.537 DNQ, 0.982 -0.847 DNQ, 1.66 -0.331 -1.34 Salton Sea USGS2 4/29/09 -0.606 DNQ, 0.944 DNQ, 1.82 -0.606 -0.606 DNQ, 1.03 DNQ, 1.61 DNQ, 0.66 DNQ, 0.757 DNQ, 1.69 DNQ, 0.926 DNQ, 2.35 -0.606 DNQ, 2.05 Salton Sea USGS2 10/21/09 -0.804 -0.804 -1.21 -0.804 -0.804 -1.21 -1.21 -0.804 -0.804 -1.21 -0.804 -1.21 -0.804 -1.21 Salton Sea USGS2 5/4/10 -0.275 -0.275 -0.413 -0.275 -0.275 -0.413 -0.413 -0.275 -0.275 -0.413 -0.275 -0.413 -0.275 -0.413 Salton Sea USGS2 5/11/11 -0.66 -0.66 -0.99 -0.66 -0.66 -0.99 -0.99 -0.66 -0.66 -0.99 -0.66 DNQ, 1.08 -0.66 -0.99 Salton Sea USGS7 5/14/02 -0.623 -0.623 -0.623 -0.623 -0.623 -0.623 -0.623 -0.623 -0.623 1.27 -0.623 -0.623 Salton Sea USGS7 9/30/02 -0.213 -0.213 -0.213 -0.213 -0.213 -0.213 -0.213 -0.213 -0.213 DNQ, 0.296 -0.213 DNQ, 0.246 Salton Sea USGS7 4/10/03 DNQ, 0.256 DNQ, 0.528 DNQ, 0.156 DNQ, 0.345 DNQ, 0.292 -0.147 -0.147 DNQ, 0.566 DNQ, 0.338 DNQ, 0.734 -0.147 DNQ, 0.602 Salton Sea USGS7 11/4/03 -0.1 DNQ, 0.286 -0.1 -0.1 DNQ, 0.248 -0.1 -0.1 DNQ, 0.194 DNQ, 0.225 0.749 -0.1 DNQ, 0.369 Salton Sea USGS7 5/5/04 -0.213 -0.213 -0.213 -0.213 -0.213 -0.213 -0.213 -0.213 -0.213 DNQ, 0.335 -0.213 -0.213 Salton Sea USGS7 10/6/04 -0.355 -0.355 -0.355 DNQ, 0.379 DNQ, 0.546 -0.355 -0.355 DNQ, 0.596 DNQ, 0.362 1.04 -0.355 -0.355 Salton Sea USGS7 5/11/05 1.06 -0.229 -0.229 -0.229 -0.229 -0.229 -0.229 -0.229 -0.229 DNQ, 0.435 -0.229 DNQ, 0.415 Salton Sea USGS7 10/26/05 DNQ, 0.139 0.284 DNQ, 0.108 DNQ, 0.17 DNQ, 0.214 DNQ, 0.097 DNQ, 0.13 0.285 DNQ, 0.182 0.359 -0.065 0.335 Salton Sea USGS7 5/3/06 0.77 1.5 DNQ, 0.412 0.688 0.981 DNQ, 0.474 DNQ, 0.566 1.27 0.686 1.55 -0.291 1.42 Salton Sea USGS7 5/9/07 Salton Sea USGS7 10/24/07 -0.309 -0.644 -0.859 -0.468 -0.375 DNQ, 0.51 -0.727 -0.41 -0.56 -0.823 -0.884 -1.13 -0.345 -1.4 Salton Sea USGS7 4/22/08 -0.319 -0.665 DNQ, 0.9 -0.483 -0.387 DNQ, 0.648 DNQ, 1.01 DNQ, 0.457 -0.579 DNQ, 1.34 -0.913 DNQ, 1.87 -0.357 -1.45 Salton Sea USGS7 4/29/09 -0.592 DNQ, 0.608 DNQ, 1.12 -0.592 -0.592 -0.889 DNQ, 0.975 -0.592 -0.592 DNQ, 1.33 DNQ, 0.679 DNQ, 1.61 -0.592 DNQ, 1.48 Salton Sea USGS7 10/21/09 -0.736 -0.736 -1.1 -0.736 -0.736 -1.1 -1.1 -0.736 -0.736 -1.1 -0.736 -1.1 -0.736 -1.1 Salton Sea USGS7 5/4/10 -0.259 -0.259 -0.388 -0.259 -0.259 -0.388 -0.388 -0.259 -0.259 -0.388 -0.259 -0.388 -0.259 -0.388 Salton Sea USGS7 5/11/11 -0.954 -0.954 -1.43 -0.954 -0.954 -1.43 -1.43 -0.954 -0.954 -1.43 -0.954 -1.43 -0.954 -1.43 Salton Sea USGS9 5/14/02 -0.771 -0.771 -0.771 -0.771 -0.771 -0.771 -0.771 -0.771 -0.771 -0.771 -0.771 -0.771 Salton Sea USGS9 9/30/02 Salton Sea USGS9 10/30/02 -0.398 -0.398 -0.398 -0.398 -0.398 -0.398 -0.398 DNQ, 0.496 -0.398 DNQ, 0.768 -0.398 DNQ, 0.678 Salton Sea USGS9 4/10/03 DNQ, 0.147 -0.13 -0.13 DNQ, 0.168 DNQ, 0.149 -0.13 -0.13 DNQ, 0.343 DNQ, 0.2 DNQ, 0.466 -0.13 DNQ, 0.367 Salton Sea USGS9 11/5/03 DNQ, 0.612 1.15 DNQ, 0.699 DNQ, 0.549 0.905 DNQ, 0.252 -0.164 0.941 DNQ, 0.8 2.96 -0.164 1.33 Salton Sea USGS9 5/5/04 -0.307 -0.307 -0.307 -0.307 -0.307 -0.307 -0.307 -0.307 -0.307 0.769 -0.307 DNQ, 0.388 Salton Sea USGS9 10/6/04 -0.601 -0.601 -0.601 -0.601 -0.601 -0.601 -0.601 -0.601 DNQ, 0.691 -0.601 -0.601 -0.601 Salton Sea USGS9 5/11/05 -0.361 -0.361 -0.361 -0.361 DNQ, 0.384 -0.361 -0.361 DNQ, 0.482 -0.361 0.801 -0.361 0.818 Salton Sea USGS9 10/26/05 0.737 1.35 DNQ, 0.444 DNQ, 0.662 1.01 DNQ, 0.39 DNQ, 0.518 1.28 DNQ, 0.664 1.36 -0.184 1.31 Salton Sea USGS9 5/3/06 0.921 1.67 DNQ, 0.499 DNQ, 0.732 0.904 DNQ, 0.48 DNQ, 0.582 1.28 DNQ, 0.771 1.58 -0.393 1.63 Salton Sea USGS9 5/9/07 Salton Sea USGS9 10/24/07 -0.339 -0.705 -0.941 -0.512 -0.411 -0.551 -0.796 -0.449 -0.614 -0.901 -0.968 -1.23 -0.378 -1.53 Salton Sea USGS9 4/22/08 -0.308 DNQ, 0.769 DNQ, 1.58 DNQ, 0.5 -0.374 1.08 DNQ, 1.36 DNQ, 0.785 DNQ, 0.783 1.9 2.28 3.56 -0.344 3.16 Salton Sea USGS9 4/29/09 -1.05 -1.05 DNQ, 1.86 -1.05 -1.05 -1.57 DNQ, 1.64 -1.05 -1.05 DNQ, 2.22 DNQ, 1.23 DNQ, 2.66 -1.05 DNQ, 2.5 Salton Sea USGS9 10/21/09 -0.711 -0.711 -1.07 -0.711 -0.711 -1.07 -1.07 -0.711 -0.711 -1.07 -0.711 -1.07 -0.711 -1.07 Salton Sea USGS9 5/4/10 -0.258 -0.258 -0.386 -0.258 -0.258 -0.386 -0.386 -0.258 -0.258 -0.386 -0.258 -0.386 -0.258 -0.386 Salton Sea USGS9 5/11/11 -0.865 -0.865 -1.3 -0.865 -0.865 -1.3 -1.3 -0.865 -0.865 -1.3 -0.865 DNQ, 1.72 -0.865 DNQ, 1.43
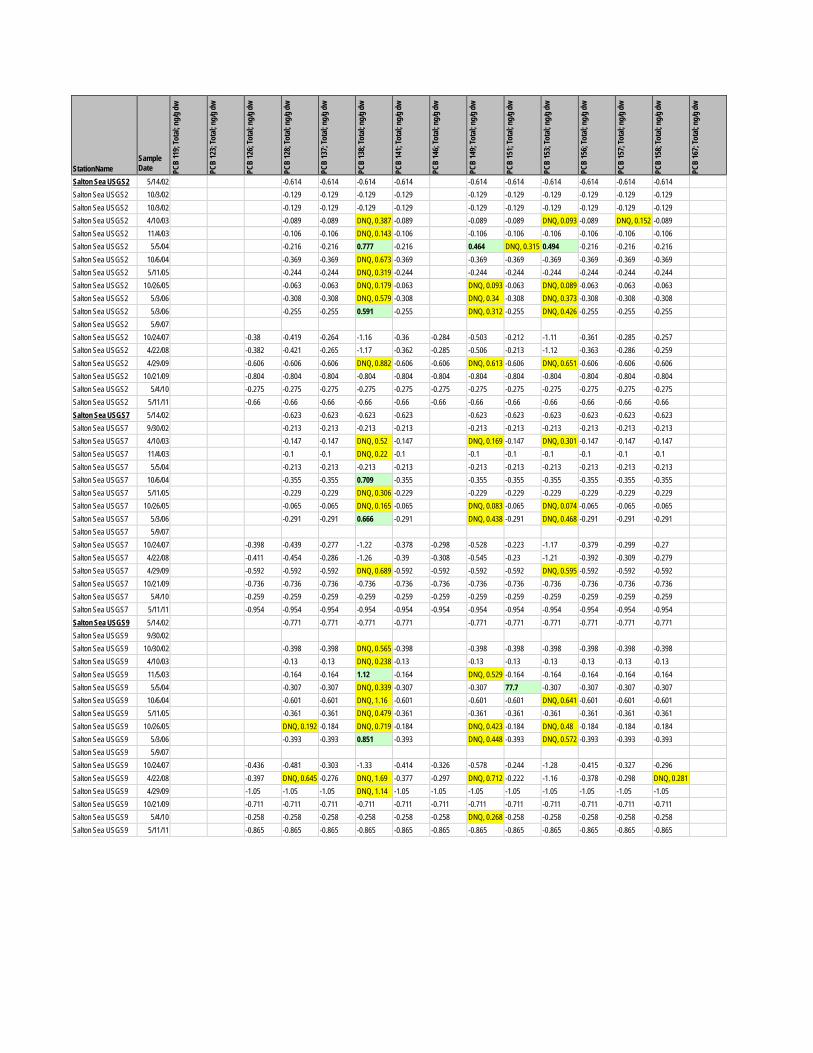
StationName
Sample Date PC
B 11
9; To
tal; n
g/g d
w
PCB
123;
Tota
l; ng/
g dw
PCB
126;
Tota
l; ng/
g dw
PCB
128;
Tota
l; ng/
g dw
PCB
137;
Tota
l; ng/
g dw
PCB
138;
Tota
l; ng/
g dw
PCB
141;
Tota
l; ng/
g dw
PCB
146;
Tota
l; ng/
g dw
PCB
149;
Tota
l; ng/
g dw
PCB
151;
Tota
l; ng/
g dw
PCB
153;
Tota
l; ng/
g dw
PCB
156;
Tota
l; ng/
g dw
PCB
157;
Tota
l; ng/
g dw
PCB
158;
Tota
l; ng/
g dw
PCB
167;
Tota
l; ng/
g dw
Salton Sea USGS2 5/14/02 -0.614 -0.614 -0.614 -0.614 -0.614 -0.614 -0.614 -0.614 -0.614 -0.614 Salton Sea USGS2 10/3/02 -0.129 -0.129 -0.129 -0.129 -0.129 -0.129 -0.129 -0.129 -0.129 -0.129 Salton Sea USGS2 10/3/02 -0.129 -0.129 -0.129 -0.129 -0.129 -0.129 -0.129 -0.129 -0.129 -0.129 Salton Sea USGS2 4/10/03 -0.089 -0.089 DNQ, 0.387 -0.089 -0.089 -0.089 DNQ, 0.093 -0.089 DNQ, 0.152 -0.089 Salton Sea USGS2 11/4/03 -0.106 -0.106 DNQ, 0.143 -0.106 -0.106 -0.106 -0.106 -0.106 -0.106 -0.106 Salton Sea USGS2 5/5/04 -0.216 -0.216 0.777 -0.216 0.464 DNQ, 0.315 0.494 -0.216 -0.216 -0.216 Salton Sea USGS2 10/6/04 -0.369 -0.369 DNQ, 0.673 -0.369 -0.369 -0.369 -0.369 -0.369 -0.369 -0.369 Salton Sea USGS2 5/11/05 -0.244 -0.244 DNQ, 0.319 -0.244 -0.244 -0.244 -0.244 -0.244 -0.244 -0.244 Salton Sea USGS2 10/26/05 -0.063 -0.063 DNQ, 0.179 -0.063 DNQ, 0.093 -0.063 DNQ, 0.089 -0.063 -0.063 -0.063 Salton Sea USGS2 5/3/06 -0.308 -0.308 DNQ, 0.579 -0.308 DNQ, 0.34 -0.308 DNQ, 0.373 -0.308 -0.308 -0.308 Salton Sea USGS2 5/3/06 -0.255 -0.255 0.591 -0.255 DNQ, 0.312 -0.255 DNQ, 0.426 -0.255 -0.255 -0.255 Salton Sea USGS2 5/9/07 Salton Sea USGS2 10/24/07 -0.38 -0.419 -0.264 -1.16 -0.36 -0.284 -0.503 -0.212 -1.11 -0.361 -0.285 -0.257 Salton Sea USGS2 4/22/08 -0.382 -0.421 -0.265 -1.17 -0.362 -0.285 -0.506 -0.213 -1.12 -0.363 -0.286 -0.259 Salton Sea USGS2 4/29/09 -0.606 -0.606 -0.606 DNQ, 0.882 -0.606 -0.606 DNQ, 0.613 -0.606 DNQ, 0.651 -0.606 -0.606 -0.606 Salton Sea USGS2 10/21/09 -0.804 -0.804 -0.804 -0.804 -0.804 -0.804 -0.804 -0.804 -0.804 -0.804 -0.804 -0.804 Salton Sea USGS2 5/4/10 -0.275 -0.275 -0.275 -0.275 -0.275 -0.275 -0.275 -0.275 -0.275 -0.275 -0.275 -0.275 Salton Sea USGS2 5/11/11 -0.66 -0.66 -0.66 -0.66 -0.66 -0.66 -0.66 -0.66 -0.66 -0.66 -0.66 -0.66 Salton Sea USGS7 5/14/02 -0.623 -0.623 -0.623 -0.623 -0.623 -0.623 -0.623 -0.623 -0.623 -0.623 Salton Sea USGS7 9/30/02 -0.213 -0.213 -0.213 -0.213 -0.213 -0.213 -0.213 -0.213 -0.213 -0.213 Salton Sea USGS7 4/10/03 -0.147 -0.147 DNQ, 0.52 -0.147 DNQ, 0.169 -0.147 DNQ, 0.301 -0.147 -0.147 -0.147 Salton Sea USGS7 11/4/03 -0.1 -0.1 DNQ, 0.22 -0.1 -0.1 -0.1 -0.1 -0.1 -0.1 -0.1 Salton Sea USGS7 5/5/04 -0.213 -0.213 -0.213 -0.213 -0.213 -0.213 -0.213 -0.213 -0.213 -0.213 Salton Sea USGS7 10/6/04 -0.355 -0.355 0.709 -0.355 -0.355 -0.355 -0.355 -0.355 -0.355 -0.355 Salton Sea USGS7 5/11/05 -0.229 -0.229 DNQ, 0.306 -0.229 -0.229 -0.229 -0.229 -0.229 -0.229 -0.229 Salton Sea USGS7 10/26/05 -0.065 -0.065 DNQ, 0.165 -0.065 DNQ, 0.083 -0.065 DNQ, 0.074 -0.065 -0.065 -0.065 Salton Sea USGS7 5/3/06 -0.291 -0.291 0.666 -0.291 DNQ, 0.438 -0.291 DNQ, 0.468 -0.291 -0.291 -0.291 Salton Sea USGS7 5/9/07 Salton Sea USGS7 10/24/07 -0.398 -0.439 -0.277 -1.22 -0.378 -0.298 -0.528 -0.223 -1.17 -0.379 -0.299 -0.27 Salton Sea USGS7 4/22/08 -0.411 -0.454 -0.286 -1.26 -0.39 -0.308 -0.545 -0.23 -1.21 -0.392 -0.309 -0.279 Salton Sea USGS7 4/29/09 -0.592 -0.592 -0.592 DNQ, 0.689 -0.592 -0.592 -0.592 -0.592 DNQ, 0.595 -0.592 -0.592 -0.592 Salton Sea USGS7 10/21/09 -0.736 -0.736 -0.736 -0.736 -0.736 -0.736 -0.736 -0.736 -0.736 -0.736 -0.736 -0.736 Salton Sea USGS7 5/4/10 -0.259 -0.259 -0.259 -0.259 -0.259 -0.259 -0.259 -0.259 -0.259 -0.259 -0.259 -0.259 Salton Sea USGS7 5/11/11 -0.954 -0.954 -0.954 -0.954 -0.954 -0.954 -0.954 -0.954 -0.954 -0.954 -0.954 -0.954 Salton Sea USGS9 5/14/02 -0.771 -0.771 -0.771 -0.771 -0.771 -0.771 -0.771 -0.771 -0.771 -0.771 Salton Sea USGS9 9/30/02 Salton Sea USGS9 10/30/02 -0.398 -0.398 DNQ, 0.565 -0.398 -0.398 -0.398 -0.398 -0.398 -0.398 -0.398 Salton Sea USGS9 4/10/03 -0.13 -0.13 DNQ, 0.238 -0.13 -0.13 -0.13 -0.13 -0.13 -0.13 -0.13 Salton Sea USGS9 11/5/03 -0.164 -0.164 1.12 -0.164 DNQ, 0.529 -0.164 -0.164 -0.164 -0.164 -0.164 Salton Sea USGS9 5/5/04 -0.307 -0.307 DNQ, 0.339 -0.307 -0.307 77.7 -0.307 -0.307 -0.307 -0.307 Salton Sea USGS9 10/6/04 -0.601 -0.601 DNQ, 1.16 -0.601 -0.601 -0.601 DNQ, 0.641 -0.601 -0.601 -0.601 Salton Sea USGS9 5/11/05 -0.361 -0.361 DNQ, 0.479 -0.361 -0.361 -0.361 -0.361 -0.361 -0.361 -0.361 Salton Sea USGS9 10/26/05 DNQ, 0.192 -0.184 DNQ, 0.719 -0.184 DNQ, 0.423 -0.184 DNQ, 0.48 -0.184 -0.184 -0.184 Salton Sea USGS9 5/3/06 -0.393 -0.393 0.851 -0.393 DNQ, 0.448 -0.393 DNQ, 0.572 -0.393 -0.393 -0.393 Salton Sea USGS9 5/9/07 Salton Sea USGS9 10/24/07 -0.436 -0.481 -0.303 -1.33 -0.414 -0.326 -0.578 -0.244 -1.28 -0.415 -0.327 -0.296 Salton Sea USGS9 4/22/08 -0.397 DNQ, 0.645 -0.276 DNQ, 1.69 -0.377 -0.297 DNQ, 0.712 -0.222 -1.16 -0.378 -0.298 DNQ, 0.281 Salton Sea USGS9 4/29/09 -1.05 -1.05 -1.05 DNQ, 1.14 -1.05 -1.05 -1.05 -1.05 -1.05 -1.05 -1.05 -1.05 Salton Sea USGS9 10/21/09 -0.711 -0.711 -0.711 -0.711 -0.711 -0.711 -0.711 -0.711 -0.711 -0.711 -0.711 -0.711 Salton Sea USGS9 5/4/10 -0.258 -0.258 -0.258 -0.258 -0.258 -0.258 DNQ, 0.268 -0.258 -0.258 -0.258 -0.258 -0.258 Salton Sea USGS9 5/11/11 -0.865 -0.865 -0.865 -0.865 -0.865 -0.865 -0.865 -0.865 -0.865 -0.865 -0.865 -0.865
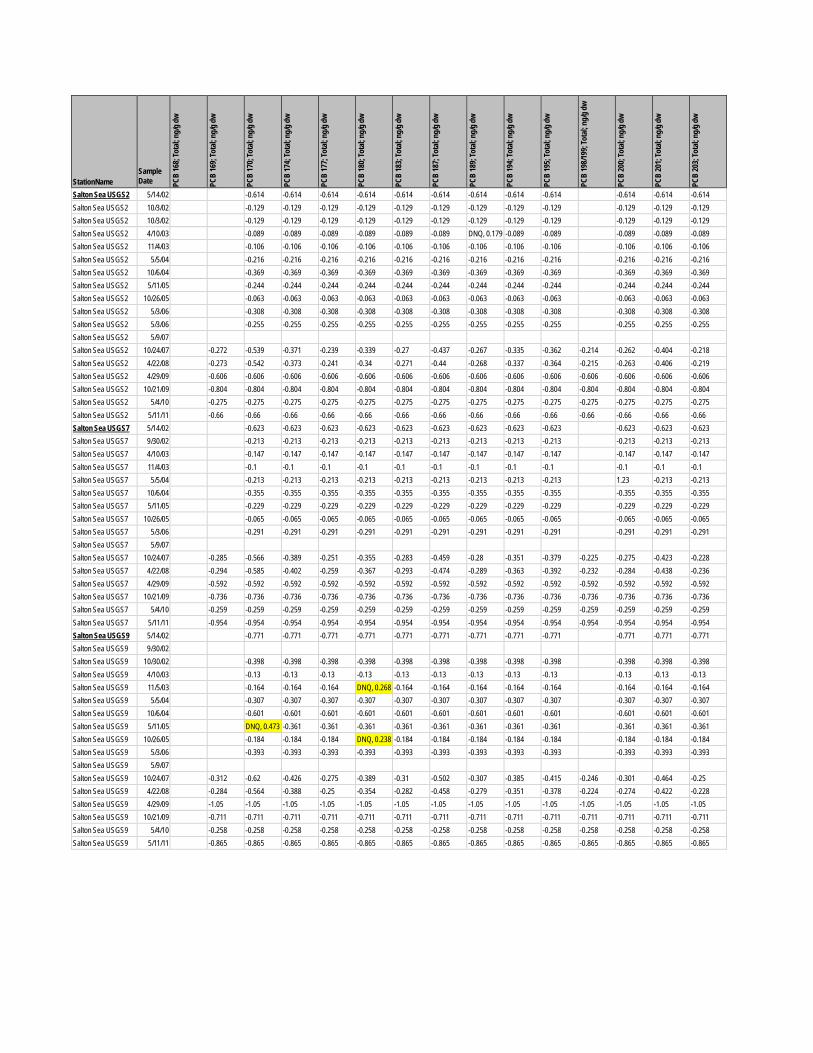
StationName
Sample Date PC
B 16
8; To
tal; n
g/g d
w
PCB
169;
Tota
l; ng/
g dw
PCB
170;
Tota
l; ng/
g dw
PCB
174;
Tota
l; ng/
g dw
PCB
177;
Tota
l; ng/
g dw
PCB
180;
Tota
l; ng/
g dw
PCB
183;
Tota
l; ng/
g dw
PCB
187;
Tota
l; ng/
g dw
PCB
189;
Tota
l; ng/
g dw
PCB
194;
Tota
l; ng/
g dw
PCB
195;
Tota
l; ng/
g dw
PCB
198/1
99; T
otal;
ng/g
dw
PCB
200;
Tota
l; ng/
g dw
PCB
201;
Tota
l; ng/
g dw
PCB
203;
Tota
l; ng/
g dw
Salton Sea USGS2 5/14/02 -0.614 -0.614 -0.614 -0.614 -0.614 -0.614 -0.614 -0.614 -0.614 -0.614 -0.614 -0.614 Salton Sea USGS2 10/3/02 -0.129 -0.129 -0.129 -0.129 -0.129 -0.129 -0.129 -0.129 -0.129 -0.129 -0.129 -0.129 Salton Sea USGS2 10/3/02 -0.129 -0.129 -0.129 -0.129 -0.129 -0.129 -0.129 -0.129 -0.129 -0.129 -0.129 -0.129 Salton Sea USGS2 4/10/03 -0.089 -0.089 -0.089 -0.089 -0.089 -0.089 DNQ, 0.179 -0.089 -0.089 -0.089 -0.089 -0.089 Salton Sea USGS2 11/4/03 -0.106 -0.106 -0.106 -0.106 -0.106 -0.106 -0.106 -0.106 -0.106 -0.106 -0.106 -0.106 Salton Sea USGS2 5/5/04 -0.216 -0.216 -0.216 -0.216 -0.216 -0.216 -0.216 -0.216 -0.216 -0.216 -0.216 -0.216 Salton Sea USGS2 10/6/04 -0.369 -0.369 -0.369 -0.369 -0.369 -0.369 -0.369 -0.369 -0.369 -0.369 -0.369 -0.369 Salton Sea USGS2 5/11/05 -0.244 -0.244 -0.244 -0.244 -0.244 -0.244 -0.244 -0.244 -0.244 -0.244 -0.244 -0.244 Salton Sea USGS2 10/26/05 -0.063 -0.063 -0.063 -0.063 -0.063 -0.063 -0.063 -0.063 -0.063 -0.063 -0.063 -0.063 Salton Sea USGS2 5/3/06 -0.308 -0.308 -0.308 -0.308 -0.308 -0.308 -0.308 -0.308 -0.308 -0.308 -0.308 -0.308 Salton Sea USGS2 5/3/06 -0.255 -0.255 -0.255 -0.255 -0.255 -0.255 -0.255 -0.255 -0.255 -0.255 -0.255 -0.255 Salton Sea USGS2 5/9/07 Salton Sea USGS2 10/24/07 -0.272 -0.539 -0.371 -0.239 -0.339 -0.27 -0.437 -0.267 -0.335 -0.362 -0.214 -0.262 -0.404 -0.218 Salton Sea USGS2 4/22/08 -0.273 -0.542 -0.373 -0.241 -0.34 -0.271 -0.44 -0.268 -0.337 -0.364 -0.215 -0.263 -0.406 -0.219 Salton Sea USGS2 4/29/09 -0.606 -0.606 -0.606 -0.606 -0.606 -0.606 -0.606 -0.606 -0.606 -0.606 -0.606 -0.606 -0.606 -0.606 Salton Sea USGS2 10/21/09 -0.804 -0.804 -0.804 -0.804 -0.804 -0.804 -0.804 -0.804 -0.804 -0.804 -0.804 -0.804 -0.804 -0.804 Salton Sea USGS2 5/4/10 -0.275 -0.275 -0.275 -0.275 -0.275 -0.275 -0.275 -0.275 -0.275 -0.275 -0.275 -0.275 -0.275 -0.275 Salton Sea USGS2 5/11/11 -0.66 -0.66 -0.66 -0.66 -0.66 -0.66 -0.66 -0.66 -0.66 -0.66 -0.66 -0.66 -0.66 -0.66 Salton Sea USGS7 5/14/02 -0.623 -0.623 -0.623 -0.623 -0.623 -0.623 -0.623 -0.623 -0.623 -0.623 -0.623 -0.623 Salton Sea USGS7 9/30/02 -0.213 -0.213 -0.213 -0.213 -0.213 -0.213 -0.213 -0.213 -0.213 -0.213 -0.213 -0.213 Salton Sea USGS7 4/10/03 -0.147 -0.147 -0.147 -0.147 -0.147 -0.147 -0.147 -0.147 -0.147 -0.147 -0.147 -0.147 Salton Sea USGS7 11/4/03 -0.1 -0.1 -0.1 -0.1 -0.1 -0.1 -0.1 -0.1 -0.1 -0.1 -0.1 -0.1 Salton Sea USGS7 5/5/04 -0.213 -0.213 -0.213 -0.213 -0.213 -0.213 -0.213 -0.213 -0.213 1.23 -0.213 -0.213 Salton Sea USGS7 10/6/04 -0.355 -0.355 -0.355 -0.355 -0.355 -0.355 -0.355 -0.355 -0.355 -0.355 -0.355 -0.355 Salton Sea USGS7 5/11/05 -0.229 -0.229 -0.229 -0.229 -0.229 -0.229 -0.229 -0.229 -0.229 -0.229 -0.229 -0.229 Salton Sea USGS7 10/26/05 -0.065 -0.065 -0.065 -0.065 -0.065 -0.065 -0.065 -0.065 -0.065 -0.065 -0.065 -0.065 Salton Sea USGS7 5/3/06 -0.291 -0.291 -0.291 -0.291 -0.291 -0.291 -0.291 -0.291 -0.291 -0.291 -0.291 -0.291 Salton Sea USGS7 5/9/07 Salton Sea USGS7 10/24/07 -0.285 -0.566 -0.389 -0.251 -0.355 -0.283 -0.459 -0.28 -0.351 -0.379 -0.225 -0.275 -0.423 -0.228 Salton Sea USGS7 4/22/08 -0.294 -0.585 -0.402 -0.259 -0.367 -0.293 -0.474 -0.289 -0.363 -0.392 -0.232 -0.284 -0.438 -0.236 Salton Sea USGS7 4/29/09 -0.592 -0.592 -0.592 -0.592 -0.592 -0.592 -0.592 -0.592 -0.592 -0.592 -0.592 -0.592 -0.592 -0.592 Salton Sea USGS7 10/21/09 -0.736 -0.736 -0.736 -0.736 -0.736 -0.736 -0.736 -0.736 -0.736 -0.736 -0.736 -0.736 -0.736 -0.736 Salton Sea USGS7 5/4/10 -0.259 -0.259 -0.259 -0.259 -0.259 -0.259 -0.259 -0.259 -0.259 -0.259 -0.259 -0.259 -0.259 -0.259 Salton Sea USGS7 5/11/11 -0.954 -0.954 -0.954 -0.954 -0.954 -0.954 -0.954 -0.954 -0.954 -0.954 -0.954 -0.954 -0.954 -0.954 Salton Sea USGS9 5/14/02 -0.771 -0.771 -0.771 -0.771 -0.771 -0.771 -0.771 -0.771 -0.771 -0.771 -0.771 -0.771 Salton Sea USGS9 9/30/02 Salton Sea USGS9 10/30/02 -0.398 -0.398 -0.398 -0.398 -0.398 -0.398 -0.398 -0.398 -0.398 -0.398 -0.398 -0.398 Salton Sea USGS9 4/10/03 -0.13 -0.13 -0.13 -0.13 -0.13 -0.13 -0.13 -0.13 -0.13 -0.13 -0.13 -0.13 Salton Sea USGS9 11/5/03 -0.164 -0.164 -0.164 DNQ, 0.268 -0.164 -0.164 -0.164 -0.164 -0.164 -0.164 -0.164 -0.164 Salton Sea USGS9 5/5/04 -0.307 -0.307 -0.307 -0.307 -0.307 -0.307 -0.307 -0.307 -0.307 -0.307 -0.307 -0.307 Salton Sea USGS9 10/6/04 -0.601 -0.601 -0.601 -0.601 -0.601 -0.601 -0.601 -0.601 -0.601 -0.601 -0.601 -0.601 Salton Sea USGS9 5/11/05 DNQ, 0.473 -0.361 -0.361 -0.361 -0.361 -0.361 -0.361 -0.361 -0.361 -0.361 -0.361 -0.361 Salton Sea USGS9 10/26/05 -0.184 -0.184 -0.184 DNQ, 0.238 -0.184 -0.184 -0.184 -0.184 -0.184 -0.184 -0.184 -0.184 Salton Sea USGS9 5/3/06 -0.393 -0.393 -0.393 -0.393 -0.393 -0.393 -0.393 -0.393 -0.393 -0.393 -0.393 -0.393 Salton Sea USGS9 5/9/07 Salton Sea USGS9 10/24/07 -0.312 -0.62 -0.426 -0.275 -0.389 -0.31 -0.502 -0.307 -0.385 -0.415 -0.246 -0.301 -0.464 -0.25 Salton Sea USGS9 4/22/08 -0.284 -0.564 -0.388 -0.25 -0.354 -0.282 -0.458 -0.279 -0.351 -0.378 -0.224 -0.274 -0.422 -0.228 Salton Sea USGS9 4/29/09 -1.05 -1.05 -1.05 -1.05 -1.05 -1.05 -1.05 -1.05 -1.05 -1.05 -1.05 -1.05 -1.05 -1.05 Salton Sea USGS9 10/21/09 -0.711 -0.711 -0.711 -0.711 -0.711 -0.711 -0.711 -0.711 -0.711 -0.711 -0.711 -0.711 -0.711 -0.711 Salton Sea USGS9 5/4/10 -0.258 -0.258 -0.258 -0.258 -0.258 -0.258 -0.258 -0.258 -0.258 -0.258 -0.258 -0.258 -0.258 -0.258 Salton Sea USGS9 5/11/11 -0.865 -0.865 -0.865 -0.865 -0.865 -0.865 -0.865 -0.865 -0.865 -0.865 -0.865 -0.865 -0.865 -0.865
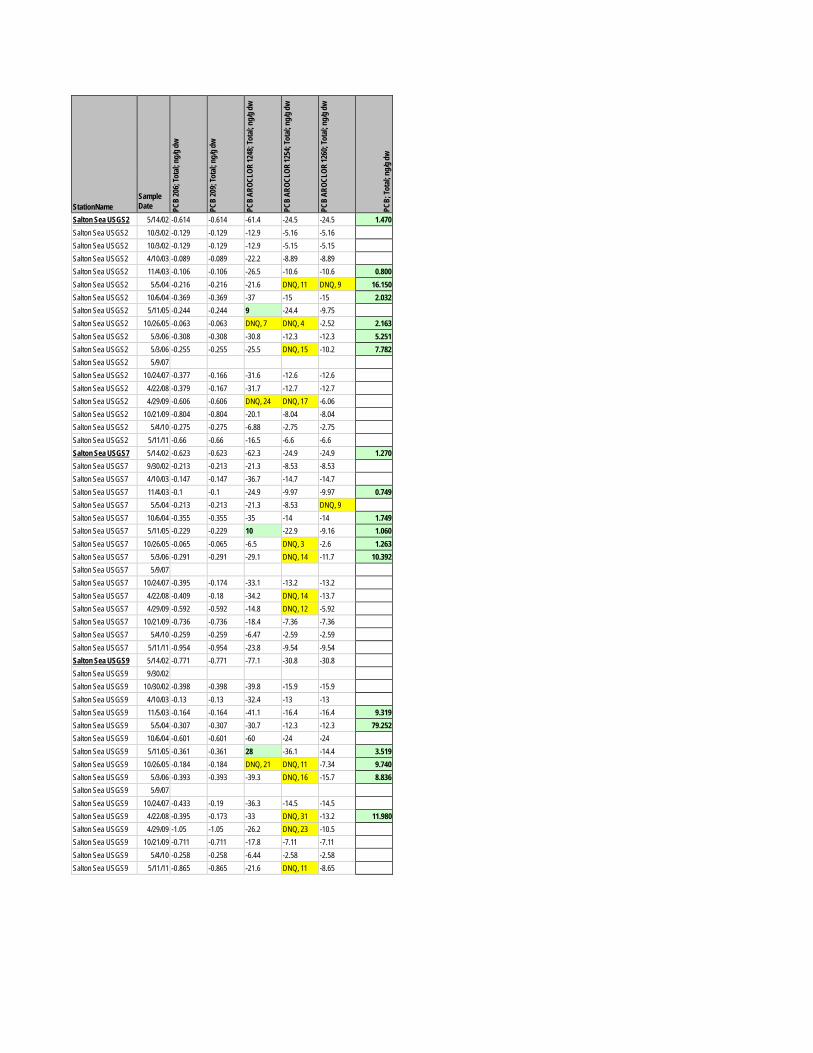
StationName
Sample Date PC
B 20
6; To
tal; n
g/g d
w
PCB
209;
Tota
l; ng/
g dw
PCB
AROC
LOR
1248
; Tot
al; ng
/g dw
PCB
AROC
LOR
1254
; Tot
al; ng
/g dw
PCB
AROC
LOR
1260
; Tot
al; ng
/g dw
PCB;
Tota
l; ng/
g dw
Salton Sea USGS2 5/14/02 -0.614 -0.614 -61.4 -24.5 -24.5 1.470 Salton Sea USGS2 10/3/02 -0.129 -0.129 -12.9 -5.16 -5.16 Salton Sea USGS2 10/3/02 -0.129 -0.129 -12.9 -5.15 -5.15 Salton Sea USGS2 4/10/03 -0.089 -0.089 -22.2 -8.89 -8.89 Salton Sea USGS2 11/4/03 -0.106 -0.106 -26.5 -10.6 -10.6 0.800 Salton Sea USGS2 5/5/04 -0.216 -0.216 -21.6 DNQ, 11 DNQ, 9 16.150 Salton Sea USGS2 10/6/04 -0.369 -0.369 -37 -15 -15 2.032 Salton Sea USGS2 5/11/05 -0.244 -0.244 9 -24.4 -9.75 Salton Sea USGS2 10/26/05 -0.063 -0.063 DNQ, 7 DNQ, 4 -2.52 2.163 Salton Sea USGS2 5/3/06 -0.308 -0.308 -30.8 -12.3 -12.3 5.251 Salton Sea USGS2 5/3/06 -0.255 -0.255 -25.5 DNQ, 15 -10.2 7.782 Salton Sea USGS2 5/9/07 Salton Sea USGS2 10/24/07 -0.377 -0.166 -31.6 -12.6 -12.6 Salton Sea USGS2 4/22/08 -0.379 -0.167 -31.7 -12.7 -12.7 Salton Sea USGS2 4/29/09 -0.606 -0.606 DNQ, 24 DNQ, 17 -6.06 Salton Sea USGS2 10/21/09 -0.804 -0.804 -20.1 -8.04 -8.04 Salton Sea USGS2 5/4/10 -0.275 -0.275 -6.88 -2.75 -2.75 Salton Sea USGS2 5/11/11 -0.66 -0.66 -16.5 -6.6 -6.6 Salton Sea USGS7 5/14/02 -0.623 -0.623 -62.3 -24.9 -24.9 1.270 Salton Sea USGS7 9/30/02 -0.213 -0.213 -21.3 -8.53 -8.53 Salton Sea USGS7 4/10/03 -0.147 -0.147 -36.7 -14.7 -14.7 Salton Sea USGS7 11/4/03 -0.1 -0.1 -24.9 -9.97 -9.97 0.749 Salton Sea USGS7 5/5/04 -0.213 -0.213 -21.3 -8.53 DNQ, 9 Salton Sea USGS7 10/6/04 -0.355 -0.355 -35 -14 -14 1.749 Salton Sea USGS7 5/11/05 -0.229 -0.229 10 -22.9 -9.16 1.060 Salton Sea USGS7 10/26/05 -0.065 -0.065 -6.5 DNQ, 3 -2.6 1.263 Salton Sea USGS7 5/3/06 -0.291 -0.291 -29.1 DNQ, 14 -11.7 10.392 Salton Sea USGS7 5/9/07 Salton Sea USGS7 10/24/07 -0.395 -0.174 -33.1 -13.2 -13.2 Salton Sea USGS7 4/22/08 -0.409 -0.18 -34.2 DNQ, 14 -13.7 Salton Sea USGS7 4/29/09 -0.592 -0.592 -14.8 DNQ, 12 -5.92 Salton Sea USGS7 10/21/09 -0.736 -0.736 -18.4 -7.36 -7.36 Salton Sea USGS7 5/4/10 -0.259 -0.259 -6.47 -2.59 -2.59 Salton Sea USGS7 5/11/11 -0.954 -0.954 -23.8 -9.54 -9.54 Salton Sea USGS9 5/14/02 -0.771 -0.771 -77.1 -30.8 -30.8 Salton Sea USGS9 9/30/02 Salton Sea USGS9 10/30/02 -0.398 -0.398 -39.8 -15.9 -15.9 Salton Sea USGS9 4/10/03 -0.13 -0.13 -32.4 -13 -13 Salton Sea USGS9 11/5/03 -0.164 -0.164 -41.1 -16.4 -16.4 9.319 Salton Sea USGS9 5/5/04 -0.307 -0.307 -30.7 -12.3 -12.3 79.252 Salton Sea USGS9 10/6/04 -0.601 -0.601 -60 -24 -24 Salton Sea USGS9 5/11/05 -0.361 -0.361 28 -36.1 -14.4 3.519 Salton Sea USGS9 10/26/05 -0.184 -0.184 DNQ, 21 DNQ, 11 -7.34 9.740 Salton Sea USGS9 5/3/06 -0.393 -0.393 -39.3 DNQ, 16 -15.7 8.836 Salton Sea USGS9 5/9/07 Salton Sea USGS9 10/24/07 -0.433 -0.19 -36.3 -14.5 -14.5 Salton Sea USGS9 4/22/08 -0.395 -0.173 -33 DNQ, 31 -13.2 11.980 Salton Sea USGS9 4/29/09 -1.05 -1.05 -26.2 DNQ, 23 -10.5 Salton Sea USGS9 10/21/09 -0.711 -0.711 -17.8 -7.11 -7.11 Salton Sea USGS9 5/4/10 -0.258 -0.258 -6.44 -2.58 -2.58 Salton Sea USGS9 5/11/11 -0.865 -0.865 -21.6 DNQ, 11 -8.65
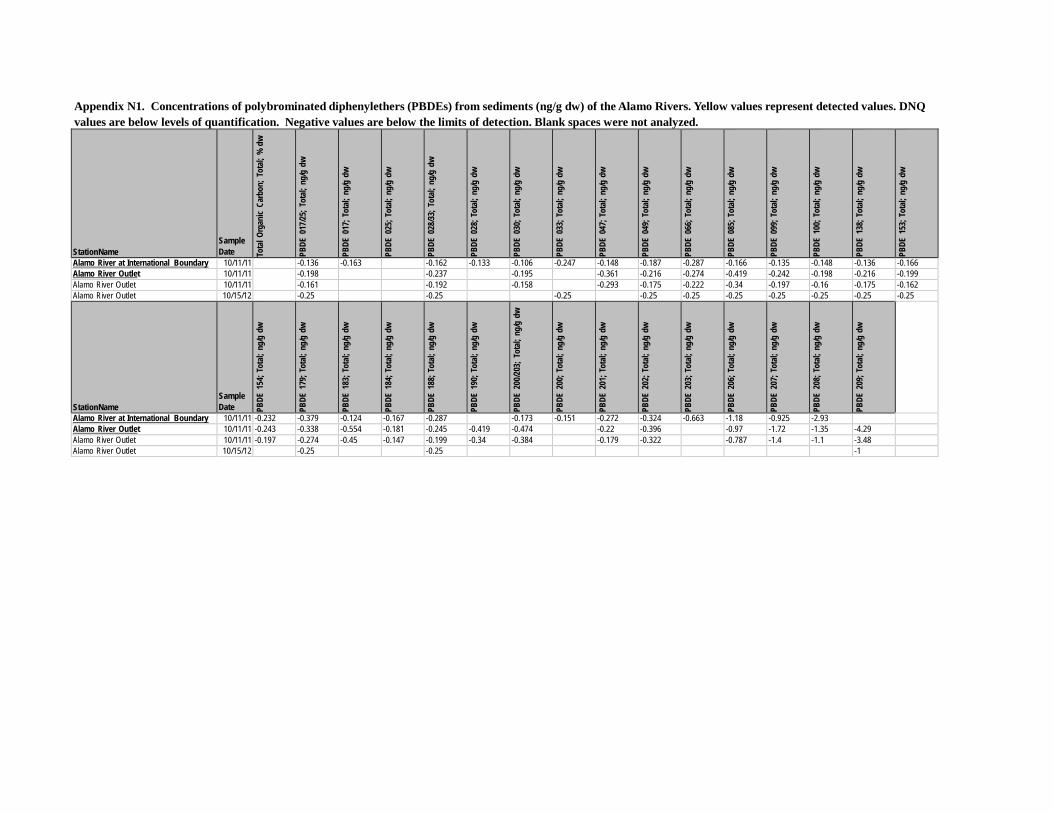
Appendix N1. Concentrations of polybrominated diphenylethers (PBDEs) from sediments (ng/g dw) of the Alamo Rivers. Yellow values represent detected values. DNQ values are below levels of quantification. Negative values are below the limits of detection. Blank spaces were not analyzed.
StationName
Sample Date To
tal O
rgan
ic Ca
rbon
; Tot
al; %
dw
PBDE
017
/25; T
otal;
ng/
g dw
PBDE
017
; Tot
al; n
g/g
dw
PBDE
025
; Tot
al; n
g/g
dw
PBDE
028
/33; T
otal;
ng/
g dw
PBDE
028
; Tot
al; n
g/g
dw
PBDE
030
; Tot
al; n
g/g
dw
PBDE
033
; Tot
al; n
g/g
dw
PBDE
047
; Tot
al; n
g/g
dw
PBDE
049
; Tot
al; n
g/g
dw
PBDE
066
; Tot
al; n
g/g
dw
PBDE
085
; Tot
al; n
g/g
dw
PBDE
099
; Tot
al; n
g/g
dw
PBDE
100
; Tot
al; n
g/g
dw
PBDE
138
; Tot
al; n
g/g
dw
PBDE
153
; Tot
al; n
g/g
dw
Alamo River at International Boundary 10/11/11 -0.136 -0.163 -0.162 -0.133 -0.106 -0.247 -0.148 -0.187 -0.287 -0.166 -0.135 -0.148 -0.136 -0.166 Alamo River Outlet 10/11/11 -0.198 -0.237 -0.195 -0.361 -0.216 -0.274 -0.419 -0.242 -0.198 -0.216 -0.199 Alamo River Outlet 10/11/11 -0.161 -0.192 -0.158 -0.293 -0.175 -0.222 -0.34 -0.197 -0.16 -0.175 -0.162 Alamo River Outlet 10/15/12 -0.25 -0.25 -0.25 -0.25 -0.25 -0.25 -0.25 -0.25 -0.25 -0.25
StationName
Sample Date PB
DE 1
54; T
otal;
ng/
g dw
PBDE
179
; Tot
al; n
g/g
dw
PBDE
183
; Tot
al; n
g/g
dw
PBDE
184
; Tot
al; n
g/g
dw
PBDE
188
; Tot
al; n
g/g
dw
PBDE
190
; Tot
al; n
g/g
dw
PBDE
200
/203;
Tot
al; n
g/g
dw
PBDE
200
; Tot
al; n
g/g
dw
PBDE
201
; Tot
al; n
g/g
dw
PBDE
202
; Tot
al; n
g/g
dw
PBDE
203
; Tot
al; n
g/g
dw
PBDE
206
; Tot
al; n
g/g
dw
PBDE
207
; Tot
al; n
g/g
dw
PBDE
208
; Tot
al; n
g/g
dw
PBDE
209
; Tot
al; n
g/g
dw
Alamo River at International Boundary 10/11/11 -0.232 -0.379 -0.124 -0.167 -0.287 -0.173 -0.151 -0.272 -0.324 -0.663 -1.18 -0.925 -2.93 Alamo River Outlet 10/11/11 -0.243 -0.338 -0.554 -0.181 -0.245 -0.419 -0.474 -0.22 -0.396 -0.97 -1.72 -1.35 -4.29 Alamo River Outlet 10/11/11 -0.197 -0.274 -0.45 -0.147 -0.199 -0.34 -0.384 -0.179 -0.322 -0.787 -1.4 -1.1 -3.48 Alamo River Outlet 10/15/12 -0.25 -0.25 -1
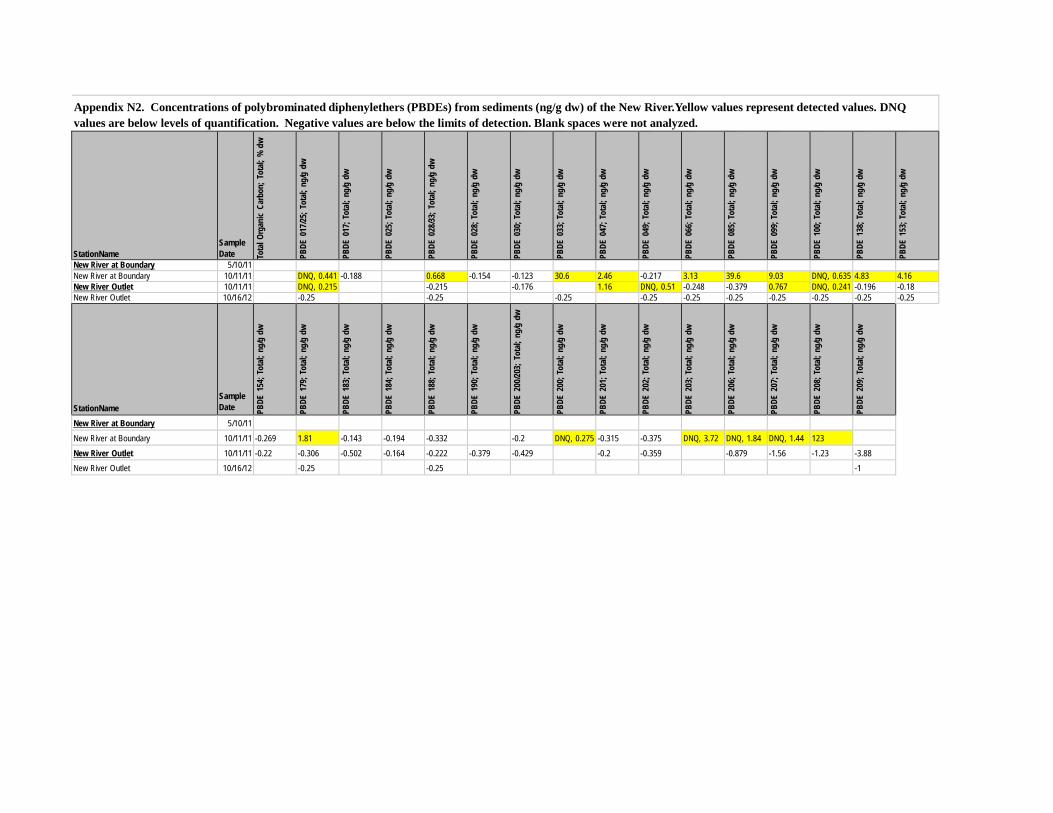
Appendix N2. Concentrations of polybrominated diphenylethers (PBDEs) from sediments (ng/g dw) of the New River.Yellow values represent detected values. DNQ values are below levels of quantification. Negative values are below the limits of detection. Blank spaces were not analyzed. StationName
Sample Date To
tal O
rgan
ic Ca
rbon
; Tot
al; %
dw
PBDE
017
/25; T
otal;
ng/
g dw
PBDE
017
; Tot
al; n
g/g
dw
PBDE
025
; Tot
al; n
g/g
dw
PBDE
028
/33; T
otal;
ng/
g dw
PBDE
028
; Tot
al; n
g/g
dw
PBDE
030
; Tot
al; n
g/g
dw
PBDE
033
; Tot
al; n
g/g
dw
PBDE
047
; Tot
al; n
g/g
dw
PBDE
049
; Tot
al; n
g/g
dw
PBDE
066
; Tot
al; n
g/g
dw
PBDE
085
; Tot
al; n
g/g
dw
PBDE
099
; Tot
al; n
g/g
dw
PBDE
100
; Tot
al; n
g/g
dw
PBDE
138
; Tot
al; n
g/g
dw
PBDE
153
; Tot
al; n
g/g
dw
New River at Boundary 5/10/11 New River at Boundary 10/11/11 DNQ, 0.441 -0.188 0.668 -0.154 -0.123 30.6 2.46 -0.217 3.13 39.6 9.03 DNQ, 0.635 4.83 4.16 New River Outlet 10/11/11 DNQ, 0.215 -0.215 -0.176 1.16 DNQ, 0.51 -0.248 -0.379 0.767 DNQ, 0.241 -0.196 -0.18 New River Outlet 10/16/12 -0.25 -0.25 -0.25 -0.25 -0.25 -0.25 -0.25 -0.25 -0.25 -0.25 StationName
Sample Date PB
DE 1
54; T
otal;
ng/
g dw
PBDE
179
; Tot
al; n
g/g
dw
PBDE
183
; Tot
al; n
g/g
dw
PBDE
184
; Tot
al; n
g/g
dw
PBDE
188
; Tot
al; n
g/g
dw
PBDE
190
; Tot
al; n
g/g
dw
PBDE
200
/203;
Tot
al; n
g/g
dw
PBDE
200
; Tot
al; n
g/g
dw
PBDE
201
; Tot
al; n
g/g
dw
PBDE
202
; Tot
al; n
g/g
dw
PBDE
203
; Tot
al; n
g/g
dw
PBDE
206
; Tot
al; n
g/g
dw
PBDE
207
; Tot
al; n
g/g
dw
PBDE
208
; Tot
al; n
g/g
dw
PBDE
209
; Tot
al; n
g/g
dw
New River at Boundary 5/10/11 New River at Boundary 10/11/11 -0.269 1.81 -0.143 -0.194 -0.332 -0.2 DNQ, 0.275 -0.315 -0.375 DNQ, 3.72 DNQ, 1.84 DNQ, 1.44 123 New River Outlet 10/11/11 -0.22 -0.306 -0.502 -0.164 -0.222 -0.379 -0.429 -0.2 -0.359 -0.879 -1.56 -1.23 -3.88 New River Outlet 10/16/12 -0.25 -0.25 -1