Embed Size (px)
Citation preview
1
WAITING FOR NAPOLEON?
DEMOCRACY AND RECIPROCITY
ACROSS SOCIAL GROUPS
Devesh Rustagi and Marcella Veronesi∗
Abstract
What explains large and persistent differences in reciprocity across social groups? This paper exploits variation in historical experience of democracy over space and time in Switzerland to highlight its strong positive association with reciprocity today. Individuals from regions that experienced democracy since the Middle Ages display stronger reciprocity than individuals from regions that acquired democracy only after the invasion by Napoleon. Because historical democracy was widespread in Swiss German but limited in Swiss French speaking regions, individuals from these groups differ widely in their reciprocity. The difference, however, disappears when we compare Swiss Germans and Swiss French from regions without historical democracy. These results are not capturing current institutions, beliefs, migration, historical dynasties, language and other group specific characteristics. Further results suggest that the emergence of historical democracy was due to idiosyncratic events and that its effect on reciprocity persists due to intergenerational transmission.
JEL: C93, D02, N43, H41, Z10
Keywords: Democracy, reciprocity, social groups, public goods game, intergenerational transmission, Switzerland, von Zaehringen.
∗ Rustagi: Goethe University Frankfurt, Faculty of Economics and Business Administration, Theodor W-Adorno Platz 4, D - 60323 Frankfurt am Main, Germany. Email: [email protected]. Veronesi: University of Verona, Department of Economics, Via Cantarane 24, 37129 Verona, Italy; and Center for Development and Cooperation (NADEL), ETH Zurich. Email: [email protected]. We acknowledge financial support from the Professorship of Environmental Policy and Economics at ETH Zurich, funds from Prof. Dr. Willi Zimmermann, and Alfons and Gertrud Kassel-Stiftung. We are grateful to seminar participants at Bocconi University, Development Workshop at Mannheim, ETH Zurich, Goethe University Frankfurt, University of Geneva, HEC Lausanne, University of Marburg, LMU Munich, University of Lund, Nagoya City University, Social Norms Workshop at University of East Anglia, 11th NCBEE Conference, 3rd International Meeting on Experimental and Behavioral Social Sciences, 57th SIE Conference, 5th AERE Conference, 5th IAERE Conference, and 22nd EAERE Conference for helpful comments. Our special thanks also to Simon Hess, Nicola Fuchs-Schündeln, Saumitra Jha, Michael Kosfeld, Peter Martinsson, Emilia Soldani, Rajesh Ramachandran, Noam Yuchtman, and Marco Zanoli for helpful discussions.

2
I. Introduction
Reciprocity is viewed as playing an important role for a variety of social and economic
outcomes.1 These include public goods provision, teamwork in organizations, functioning of
incentives, charitable giving, tax compliance, and support for redistributive policies.2 Defined
as a tendency to respond to acts perceived to be kind with kindness and those perceived to be
mean with meanness, reciprocity differs fundamentally from behavior that is due to benefits
from repeated interaction and reputation formation (Fehr and Gächter 2000, Sobel 2005,
DellaVigna 2009).3 Further evidence shows that reciprocity differs widely across groups and
forms a key element of social capital that is viewed as fundamental for collective action and
economic development (Putnam et al. 1993, Platteau 2000, Bowles and Gintis 2002, Guiso et
al. 2011). Yet, our understanding of what social and economic conditions drive differences in
reciprocity and why do these differences persist over time remains poor. In this paper, we
exploit spatial and temporal variation in historical experience of democracy to study how this
associates with reciprocity today across individuals from different social groups.
The interplay between democracy and reciprocity is discussed widely in the social
sciences (Putnam et al. 1993, Rodrik 2000, Uslaner 2003, Tabellini 2010). According to these
studies, democratic institutions are hypothesized to foster reciprocity via allowing for greater
participation in decision-making and constraints on the executive. This encourages
individuals to interact, deliberate, and learn to compromise, thereby changing the type of
people we are by making us less selfish and more public-spirited. As Rodrik (2000) points
out when “individuals meet and deliberate, they come to understand each other’s view-points,
develop empathy, recognize the value of moderation, internalize the common interest, and
de-emphasize narrow self-interest”. Tabellini (2010) and Platteau (2000) further argue that
when the power of the elite is constrained by checks and balances, it fosters participation by
bringing together individuals from different interest groups for a common cause. In contrast,
in autocratic regimes, strong hierarchy of privileges that are accessible only to a small group
of people are likely to foster opportunistic free riding as opposed to a disposition for
reciprocity. In summary, exposure to democracy is hypothesized to encourage individuals to
1 See for instance Putnam 1993, Ostrom et al. 1999, Platteau 2000, Fehr and Gächter 2000, Sobel 2005, DellaVigna 2009. For motivations underlying reciprocity see theoretical contributions by Fehr and Schmidt 1999, Bolton and Ockenfels 2000, Dufwenberg and Kirchsteiger 2004, Falk and Fischbacher 2006. 2 For example: Frey and Meier 2004, Bandiera et al. 2005, Rustagi et al. 2010, Bowles and Polonia-Reyes 2012. 3 Reciprocity is different from altruism, which is a form of unconditional kindness that does not “emerge as a response to altruism received” (Fehr and Gächter 2000). Reciprocity is also considered as one of the key motives underlying trust and trustworthiness (Fehr 2009).

3
set aside narrow self-interest and instead develop values of reciprocity. These values could
then persist over time due to intergenerational transmission (Bisin and Verdier 2011).
Although field and laboratory studies show that stronger cooperation emerges when
democratic participation is possible (Bardhan 2000, Frey 1998, Dal Bo et al. 2010, Sutter et
al. 2010), thus far the connection to reciprocity is only suggestive. We attempt to fill this gap
by conducting our study in Switzerland, which provides a unique natural laboratory.
Switzerland offers large variation in the experience of historical democracy as well as
linguistic groups. We show that individuals from regions that experienced democracy since
the Middle Ages display stronger reciprocity today than individuals from regions who
experienced democracy only after the invasion by Napoleon (see Figure 1). Because
historical democracy was widespread in Swiss German than Swiss French speaking regions,
we observe a strong gap in reciprocity across individuals from these two regions today (see
Figure 2). Moreover, the gap disappears once we compare Swiss Germans and Swiss French
from regions without historical democracy. These results are not capturing current
institutions, beliefs, migration, dynasty, language and other group specific characteristics.
The Swiss setting is ideal for our study because of differences across space and time in
the experience of historical democracy that included in its ambit both urban and rural areas.
Starting 13th century, many rural and urban areas of Switzerland developed early forms of
democracy that offered local people opportunities for self-governance, for instance via the
election of council members and voting on policies in public assemblies. In contrast, the
remaining areas were subjected to feudalistic institutions, where individuals could neither
elect their council members nor vote on public policies. Instead, in these areas council
members were either appointed or elected from among patrician families, at times even for
life. This created a mosaic of landscapes with and without opportunities for self-governance
even within a canton whose boundaries today are mostly coterminous with historical cantonal
boundaries in the 16th century.4 This situation persisted for hundreds of years until Napoleon
invaded Switzerland in 1798 and issued the Act of Mediation in 1803 allowing every region
the possibility of self-governance. We refer to the experience of democracy in the period
preceding 1803 as ‘historical’ and the period thereafter as ‘modern’. While modern
institutions of democracy vary only at the cantonal level, historical democracy varies even
within cantons, allowing us to use canton fixed effects to separate historical from modern
institutions of democracy and to account for historical differences across cantons.
4 A canton is an administrative unit in Switzerland that is equivalent to a state.

4
Measuring reciprocity using real world interactions is challenging because behavior that
seems consistent with reciprocity might be actually be due to confounding motives arising
from repeated interaction and reputation formation benefits (Fehr and Gächter 2000, Sobel
2005, DellaVigna 2009). Moreover, individuals from different groups might have the same
disposition for reciprocity and yet behave differently because of differences in their beliefs
about the cooperation of others. For instance, reciprocators with optimistic beliefs about the
cooperation of others are expected to cooperate but reciprocators with pessimistic beliefs are
expected to defect. In such situations, one might wrongly infer a reciprocator with pessimistic
beliefs as a free rider resulting in measuring multiple equilibria rather than the difference in
reciprocity per se. This concern is accentuated when the comparison is across individuals
from diverse groups, as different groups might coordinate on different equilibria. To resolve
these challenges, we use a controlled behavioral experiment to measure reciprocity.
Following Fischbacher et al. (2001) and Fischbacher and Gächter (2010), we implement
a standard one-shot anonymous public goods game in the strategy method to preclude future
material benefits as well as beliefs from playing a role.5 The experiment is conducted online
among a representative sample of Swiss Germans and Swiss French. In the experiment,
individuals are paired in a two-person experimental group. Each player has to decide on his /
her contribution to a public good conditional on a set of contribution decisions of another
player. Individuals who are reciprocators are expected to match their contribution in the
contribution of the other player, whereas free riders are expected to contribute zero in every
decision regardless of what the other player does. Following the literature, we use the
Spearman correlation between self and other players’ contribution as a revealed measure of
reciprocity – the stronger the Spearman correlation, the stronger is the disposition for
reciprocity. The average reciprocity in our sample is 0.65 (s.d. 0.55).
Since different areas in Switzerland acquired historical democracy at different points in
time, we develop measures of historical democracy at both the extensive and the intensive
margin. Our data show that Swiss Germans are nearly four times more likely to be from
municipalities with historical democracy than Swiss French and also with a longer duration
by over 200 years. Following aforementioned studies (Platteau 2000, Rodrik 2000, Tabellini
2010), postulating a positive association between democracy and reciprocity, we expect
Swiss Germans to have stronger reciprocity than Swiss French.
Our results confirm this. The propensity for reciprocity among Swiss Germans is 0.73, 5 This experiment has been used in a variety of countries to measure reciprocity and has also been validated in studies by Rustagi et al. (2010) and Kosfeld and Rustagi (2015).
5
while that among Swiss French is only 0.41. The gap remains large in magnitude at 0.29
points and is highly significant even when we control for a rich set of individual, municipal
and cantonal level covariates or even canton fixed effects. This means that for each additional
10 Swiss Francs contributed by the other player, Swiss Germans contribute 2.1 Swiss Francs
more than Swiss French, which is 57 percent of the contribution by Swiss French.
If this gap is due to group specific differences in historical democracy, then it should
disappear when historical democracy is lacking. We check this via a falsification test in
which we restrict our sample to Swiss Germans and Swiss French who are from
municipalities that did not experience historical democracy. The magnitude of the gap in
reciprocity drops from 0.29 to 0.04 and is no longer statistically significant.
The above results point towards a positive association between reciprocity and historical
democracy. However, these results could be capturing the effect of omitted variables and
might also be prone to reverse causality. We address these concerns in several steps. First, we
include a rich set of individual and municipal / cantonal controls that are hypothesized in the
literature to matter for reciprocity. These include age, education, gender, household income,
religion, politics, geography, income inequality, GDP per capita, share of foreigners, and an
index of business competition. Second, we also consider the historical counterpart of these
variables to ensure that we are not capturing differences in historical development and
education. Third, we introduce a variety of fixed effects to ensure that our estimates are not
capturing differences in canton specific factors (such as modern democracy), historical
dynasties with which the municipalities were associated at different points in time, as well as
social groups, for instance by dropping Swiss French altogether from our sample. Fourth, we
show that our results hold when an epidemiological approach is considered (Fernandez
2010). Fifth, we confirm our findings using an alternative dataset – the Swiss Household
Panel – where reciprocity is measured using data on values such as how justifiable it is to
cheat on taxes, lie in own interest, and claim state benefits not entitled to (Guiso et al. 2011).
We find that individuals from municipalities with historical democracy display higher
reciprocity by 0.42 points. This difference is not just statistically significant at the 1 percent
level, but it is also economically significant, especially given that the average reciprocity
among individuals from municipalities without historical democracy is 0.42. Moreover, one
standard deviation increase in the duration of historical experience (244 years) is associated
with an increase in reciprocity by 0.22 points. This implies that for each additional 10 Swiss
Francs contributed by the other player, individuals from municipalities with historical
democracy contribute 3.6 Swiss Francs more than individuals from municipalities without,

6
which is over 100 percent of the contribution by the latter. Similar estimates are obtained
when we introduce fixed effects for cantons, historical dynasties, and social groups.
Following Oster (2016) we find that selection on unobservables would have to be at least
twice as large as selection on observables for our results to be entirely attributed to a
selection bias.
An open question is why did some areas acquire democracy but others did not. Swiss
historiography concurs that the emergence of historical democracy was not systematic but
rather due to idiosyncratic events. One event with wider consequences was the abrupt
extinction of the Zaehringen dynasty when its last duke died of natural causes without an
heir. This led the German king to grant imperial immediacy to areas under the Zaehringen
rule. Historians consider this to be a watershed event that gave municipalities the impetus to
eventually move towards democracy (Zschokke 1860, McCrackan 1908, Eugster 2015,
Schultheiss 2015). The extinction of the Zaehringen line offers plausibly exogenous variation
in the emergence of democracy, especially after verifying that areas with and without the
Zaehringen rule do not differ in climate and soil suitability indices for agricultural crops in
the pre-1500 period, as well as in altitude and rugged land (Galor and Özak 2016). Our
results show a large, positive, and significant association of historical democracy with the
Zaehringen rule in the Middle Ages.
We use the extinction of the Zaehringen as an instrument for historical democracy. The
exclusion restriction is that the Zaehringen rule did not have any direct effect on reciprocity.
We show that when historical democracy is lacking, areas with and without the Zaehringen
rule do not differ in their reciprocity. Also, the association of the Zaehringen rule with
reciprocity disappears completely when we explicitly control for historical democracy. The
instrumental variables estimates of the effect of historical democracy on reciprocity is also
strongly positive, statistically significant, and similar in magnitude to its OLS counterpart.
These findings raise questions over the long run nature of the association between
historical democracy and reciprocity. We provide suggestive evidence on the role of inter-
generational transmission by examining whether the family background of an individual
matters in explaining the variation in reciprocity. For this purpose, we collect data on the
region of birth and region of stay of parents and grandparents of individuals in our sample.
We then build indices to characterize individuals on their degree of Swiss German family
background. Our results show that individuals with stronger Swiss German parental or
grandparental background display stronger reciprocity.

7
Our study connects to the literature showing the long-term effect of important historical
events, such as slavery, Jewish persecution in the middle ages, and the introduction of plough
in agriculture on trust, violence, and honesty today (Tabellini 2010, Nunn and Wantchekon
2011, Voigtländer and Voth 2012, Alesina et al. 2013, Jha 2013, Grosjean 2014, Becker et al.
2016, Lowes et al. 2017). We contribute to this literature by studying the association between
historical democracy and reciprocity. A paper closely related to ours is by Guiso et al. (2016)
who examine the association of free city-state experience in Italy in the Middle Ages with the
number of non-profit organizations, presence of an organ donation organization, and cheating
in math test today. Our paper distinguishes itself from previous studies in several ways. First,
unlike the free city experience, which as its name implies was restricted only to cities,
historical democracy in Switzerland was comprehensive in covering both rural and urban
areas. Second, we go beyond previous studies by conducting not just between but also within
state analysis. This allows us to highlight the importance of historical democracy over and
above current institutions of democracy, as well as other canton specific differences. Third, in
a similar vein, we exploit variation in historical democracy within historical dynasties and
social groups to account for dynasty and group specific factors. Fourth, our measure of
reciprocity is from a controlled experimental environment, which precludes confounding
motives arising from future interaction benefits and beliefs about the contribution of others.
As highlighted by Fehr and Gächter (2000), Sobel (2005), and DellaVigna (2009), this step is
necessary to distinguish reciprocity from alternative explanations. Fifth, we exploit the
plausibly exogenous extinction of the house of Zaehringen to shed some light on the
emergence of democracy (see for instance Aidt and Franck 2015). Finally, our study also
points towards the role of intergenerational transmission as a plausible channel behind the
persistence of historical effects.
The paper is organized as follows. Section II describes the field setting and historical
background. Section III describes data including our measures of social groups, historical
democracy, and experimental measures of reciprocity. Sections IV and V present results on
the association of reciprocity with social groups and historical democracy including the role
of intergeneration transmission as a plausible channel. Section VI offers concluding remarks.

8
II. Field Setting
A. Social Groups
The Swiss setting allows us to study differences in reciprocity across individuals from
different social groups using a within country and also a within canton setting.
Switzerland is home to four main native European languages: German, French, Italian,
and Romance that comprise 64, 23, 8, and 0.5 percent of the Swiss population (Swiss Federal
Statistical Office, see Figure 3)6. The focus of this study is on the speakers of German and
French, which are also the official languages in 25 out of the 26 states of Switzerland that are
called cantons. The share of these two groups in the Swiss population is 87 percent and has
remained stable both within and across cantons since the foundation of modern Switzerland
in 1848 (Swiss Federal Statistical Office).
Our focus on linguistic groups as social groups draws from studies in sociology and
economics outside of and within Switzerland that show language to be a powerful marker of
identity (Gumperz 1982, Giles and Johnson 1987, Clyne 1995, Eugster et al. 2011, Clots-
Figueras and Massella 2013). In fact, differences between Swiss Germans and Swiss French
are regularly emphasized in the Swiss media. For instance, a newspaper called Südostschweiz
(2000) described these two groups as “two fronts that stand opposite to each other”.
Reflecting a similar view, a Swiss weekly magazine Die Weltwoche wrote (2004)
“Switzerland consists of two halves: On the left hand side is the casual west (Swiss French),
on the right hand side the stricter east (Swiss German)”, and again (2007) “It is unequivocal
among political geographers that there exists a dividing line which separates our country
(Switzerland) into two mental regions”.
The linguistic diversity of Switzerland dates back to the 7th century, when Germanic
tribes called the Alemanni occupied the northern and eastern part of Switzerland. The
westward movement of the Alemanni in the 7-8th century resulted in the formation of a
language frontier between the German and the French speaking parts that is now called
Roestigraben. This historically determined language border passes through three bilingual
cantons: Valais, Fribourg, and Bern (Figure 3).7 Notably, this within canton variation in
6 See www.bfs.admin.ch 7 Within canton variation in language in the remaining cantons is negligible. For instance, in the Swiss Household Panel comprising thousands of Swiss households, the share of French speakers in the most populous German-speaking canton (Zurich) is a mere 0.006 percent. Similarly, the share of German speakers in the most populous French-speaking canton (Vaud) is only 0.01 percent. The shares are either the same or even smaller in the remaining cantons; in 13 out of 26 cantons, it is even zero.

9
linguistic groups is not commensurate with geographical (Eugster et al. 2012) or genetic
variation (Buhler et al. 2012).8
The Swiss setting thus offers us the possibility to study the association of linguistic
groups with reciprocity, controlling for country and at times canton specific factors. Note that
differences in reciprocity across linguistic groups are unlikely to be due to differences in
language per se because both German and French have Tu and Vos differentiation and are
also no pronoun drop languages (Galor and Özek 2016).
B. Historical Democracy
Switzerland offers a unique setting with respect to variation in historical democracy over
space and time. This variation exists within historical as well as modern cantonal boundaries,
and also within social groups. Moreover, this phenomenon is not restricted to cities but also
includes in its ambit rural areas.
The first Swiss federal constitution offering cantons the rights to extensive self-
governance was adopted in 1848. However, the historical antecedent of these rights date back
to the Middle Ages. Before the 13th century, several noble houses appointed by the Holy
Roman Emperor, such as von Zaehringen, Kyburg, Habsburg, and Savoy, managed large
parts of Switzerland as their feudal property. But starting 13th century, idiosyncratic events,
in particular the extinction of the House of Zaehringen, led to many such areas acquiring
imperial immediacy (Reichsunmittelbarkeit) from the emperor.9 This freed many feudal areas
from the authority of local nobles and offered its residents limited opportunities for self-
governance. Over time, some of these areas managed to bolster self-governance by acquiring
considerable rights and powers, for instance to levy taxes, possess a seal, administer justice,
and appoint their own council and magistrate (Zschokke 1860, McCrackan 1908, Kamm
2017, Landolt 2017a, 2017b, Stadler 2017, Suter 2017, Zahnd 2017). These rights were
defended via the formation of an alliance called the Old Swiss Confederacy, which
comprised 13 members and several allies.10 In contrast, the remaining areas of Switzerland
8 The main geographical border formed by the Alps runs along the southwest-northeast axis, whereas the language divide runs along the north-south axis. Similarly, genetic differentiation in Switzerland besides being very small is not across linguistic groups but geographical boundaries created by the Alps. For this reason we do not include Swiss Italians in our sample, as these are found across the Alps. Another reason is that Swiss Italians are largely confined to a single canton (Ticino). 9 In some cases this was the German king who eventually became the emperor in the following years. 10 The 13 members included the rural cantons of Uri, Schwyz, Unterwalden (Obwalden and Nidwalden), Glarus, Zug, and Appenzell (Inner and Outer Rhodes), and the city cantons of Zurich, Bern, Lucerne, Fribourg, Solothurn, Basel (City and Country), and Schaffhausen.
10
mostly came to be administered as subjugated territories of the Old Swiss Confederacy. This
created a mosaic of areas with and without historical democracy even within cantons, whose
boundaries today are mostly coterminous with cantonal boundaries in the 16th century.
While most members and allies of the Old Swiss Confederacy handled communal
obligations through deliberation and consensus, barring a few exceptions, most subjugated
areas had little say in decision-making. This status remained for the most part uninterrupted
for hundreds of years until the invasion of Switzerland by Napoleon in 1798, which resulted
in the dissolution of the Old Swiss Confederacy and the liberation of its subjugated
territories. The Act of Mediation issued by Napoleon in 1803 made every member and ally of
the Old Swiss Confederacy as well as their subjugated territories full members of Switzerland
and allowed them to have their own representative governments (Frankhauser 2009).
That being said, it would be a mistake to view medieval Switzerland as a place where
modern democratic principles, as in equal rights for all, were enshrined. However, as
McCracken (1908) notes relative to other areas of Europe during the Middle Ages “…early
Swiss were, nevertheless, the best democrats of their day, unconscious, but practical
exponents of the virtues of self-governance” and that “...the Swiss States, both country
districts and towns, were organized upon democratic principles”.
The emergence of historical democracy in the urban and rural areas of Switzerland was
due to idiosyncratic events. In some areas democracy set foot due to the opening of the
Gotthard pass connecting Switzerland to Germany and Italy, which made previously remote
places strategic transit locations for wars against Lombard cities, pope Innocent IV, and to
limit the Habsburg expansion (Heinemann 2003, Schelbert 2014, Stadler 2011, 2017).
However, in most areas it was the extinction of the Zaehringen dynasty from the absence of
an heir, which led to the emergence of historical democracy (McCrackan 1908, Eugster 2015,
Schultheiss 2015). As McCrackan (1908) notes “the extinction of the house of Zaehringen
came most opportunely, for it is entirely within the range of possibility, that, otherwise, the
state they had erected, might have become a principality, or even a monarchy, as enduring as
any of those which surround Switzerland today.”
Broadly speaking, historical democracy in Switzerland was implemented via voting in
public assemblies and election of city councils. In rural areas, such as the cantons of Uri and
Schwyz, eligible male citizens voted directly on laws and decrees in open-air assemblies
called Landsgemeinden (Stadler 2008). This form of democracy was well established by the
14th century in the rural cantons and even survived into modernity (late 19th-20th century)
until the introduction of anonymous voting in all but two rural cantons (Stadler 2008). In the

11
cities, historical democracy involved widening of the power base via limiting steadily the
clout of bishops and aristocrats in the appointment of city councils and via the creation of
large assemblies comprising 200-300 individuals that offered citizens a larger role in
governance (Berner 2006, Holenstein 2014).11
Regardless of the way historical democracy was practiced in Switzerland, it involved
elements of both deliberation as well as constraint on the executive. Involving people to
either vote directly on policies or offering citizens a larger say in decision making via the
institution of greater councils shows stronger presence of deliberation and constraint on the
power of aristocrats (Holenstein 2014). For instance, in one of the public assemblies, a
referendum forbid powerful monasteries from using the common grazing land for free and
ordered them to pay the same tax per cow as local farmers or else be excluded from using the
common (McCrackan 1908). Similarly, in many cities council members were prevented from
holding on to the municipal offices for life or bequeath these to their children (McCrackan
1908, Schultheiss 2015, Zahnd 2017).
Because historical democracy varies within cantons but modern democracy varies at the
cantonal level, we are able to disentangle their effects on reciprocity by introducing cantons
fixed effects. In addition, there is also within group variation in historical democracy, which
allows us to control for group specific differences. In addition, it also lets us construct
falsification tests that investigate whether the gap in reciprocity across Swiss Germans and
Swiss French exists even when both are from municipalities without historical democracy.
III. Data and Descriptive Statistics
We collect data from several different sources. Data to measure reciprocity were collected at
individual household level using a behavioral experiment. This was followed by an in-depth
post-experiment survey with the same individuals to collect data on native language, socio-
demographic characteristics, migration, and family background. These individuals were
selected in a representative manner by the institute for opinion research LINK, the largest
survey agency in Switzerland.
We match these individual level data with data we collected on historical democracy
at the municipal level using the online Historical Lexicon of Switzerland (e-HLS) and a book
by Gasser (1932), current and historical municipality / canton specific covariates from the
11 In the Middle ages, the Swiss city states were much smaller than their Italian counterparts. For instance, in 1600-1700 the population of Zurich was around 8000, while that of Lucerne was 4000.
12
Swiss Federal Statistical Office, data on a competition index by Credit Suisse, data on soil
and climate suitability by Swiss Federal Office for Agriculture12, and data on historical
dynasties on the basis of maps by Ammann and Schib (1958) and Putzger (2004). We refer to
this dataset as our experimental sample. It comprises 262 Swiss individuals covering 174
municipalities from 23 cantons.13 We discuss our sample construction strategy in Appendix
A.I, whereby we show that individuals and municipalities that are in our sample have similar
characteristics as individuals and municipalities that are not (Tables A1-A5). These
characteristics include gender, age, education, household income, religious and political
orientation, altitude, and Gini index of income inequality. In addition, we also use wave 13 of
the Swiss Household Panel (SHP) as an alternative data source. The SHP has 1,859 Swiss
individuals from the same municipalities that are covered in our experimental sample. Note
that SHP does not have experimental measures of reciprocity but values that are closely
connected to reciprocity (see section IV.A). In both the samples, our focus is on Swiss
nationals. Below we describe our measures of social group, historical democracy, and
reciprocity, followed by descriptive statistics.
A. Social Groups
We use the native language(s) of an individual to identify the social group to which an
individual belongs. This was elicited via the post-experiment survey in which multiple
answers were allowed. Individuals could choose from Swiss German, High German, French,
Italian, and other; while choosing the latter individuals had to state the language in an empty
box. Our sample comprises 195 Swiss Germans (74 percent) and 67 Swiss French (26
percent); these shares reflect the share of the two linguistic groups in the Swiss population
excluding Swiss Italians, which are 75 and 25 percent, respectively.14 To further verify that
the native language captures an important dimension of an individual’s social group, we find
that over 90 percent of our respondents identify with the beliefs and values of their linguistic
12 https://map.geo.admin.ch 13 Other than the canton of Ticino, which we deliberately excluded because it is exclusively Swiss Italian speaking, the remaining two excluded cantons are Appenzell-Innerrhoden and Nidwalden - the smallest cantons in Switzerland by population. 14 93 percent of the individuals in our sample (243 individuals) speak only one native language, either Swiss German or Swiss French. Of the remaining 7 percent (19 individuals), 80 percent (15 individuals) speak Swiss German as well as a non-Swiss native language (for example, Russian). We assign these individuals to the Swiss German group. The remaining four individuals speak both Swiss German and Swiss French and are assigned to the group that corresponds with the official language of the canton of birth. Our results are robust even when we assign these individuals to the other group. Note that for 99 percent of the individuals in our sample the native language corresponds with the official language of the municipality.
13
group and that these responses do not differ by groups. In another question, we also
ascertained the extent to which individuals from the two linguistic groups consider
themselves as Swiss and find no difference in this dimension (p-value = 0.75).
B. Historical Democracy
We measure historical democracy at the municipal level, which is the smallest administrative
unit in Switzerland at which individuals live and socially interact. Our primary data sources
for historical democracy are the online Historical Lexicon of Switzerland (e-HLS) and the
study by Gasser (1932). We complement these sources with books on the history of
Switzerland by Zschokke (1860) and McCrackan (1908). Our measures consider both
whether a municipality experienced historical democracy or not, as well as the duration of
this experience. Accordingly, we have two measures:
Experience is a dummy variable, which takes the value of one if a municipality allowed
individuals stronger opportunities for self-governance from the Middle Ages until 1803, zero
otherwise. Table 1 reports summary statistics and shows that 54 percent of the respondents in
our sample are from municipalities with historical democracy.
Duration is a continuous variable, which is measured as the difference in years between 1803
and the date a municipality acquired historical democracy. For the rural areas, we use the
date when Landsgemeinde got established. For the urban areas, we use the date starting
which the city could elect its own council. For some subjugated areas these dates are not
available, so we use the date around which they came to be administered by the members of
the Old Swiss Confederacy or their allies, as this was the time when major changes in self-
governance took place. Table 1 shows that the average duration of historical democracy in
our sample is about 258 years (2.58 hundreds of years).
C. Measuring Reciprocity
Measuring reciprocity using observational data is challenging. In the field, individuals might
behave in a manner that appears to be consistent with reciprocity but is actually due to
benefits from repeated interaction and reputation formation (Fehr and Gächter 2000, Sobel
2005, and DellaVigna 2009). Also, it is plausible that individuals from different social groups
have the same propensity for reciprocity and yet differ in their behavior because of

14
differences in their beliefs about the behavior of others (Fischbacher and Gächter 2010). For
example, in a prisoner’s dilemma, reciprocators from groups with pessimistic beliefs about
the cooperation of others might defect, whereas reciprocators from groups with optimistic
beliefs about the cooperation of others might cooperate, resulting in multiple equilibria. This
could result in the misclassification of reciprocators with pessimistic beliefs as free riders.
These challenges warrant the use of a behavioral experiment.
Following previous studies (Fischbacher et al. 2001, Fischbacher and Gächter 2010), we
invite individuals to take part in a one-shot anonymous public goods game that is
implemented in the strategy method. This allows us to circumvent problems arising from
confounding of reciprocity with other motives and beliefs. This method has been used in
several field settings (see for instance Kocher et al. 2008, Herrmann and Thöni 2009, Rustagi
et al. 2010) and has also been externally validated by Rustagi et al. (2010) and Kosfeld and
Rustagi (2015). The experimental instructions and procedures are in Appendix B.
Behavioral experiment. – In the experiment, two players are randomly assigned to an
experimental group. Each player receives an endowment of 100 CHF (Swiss Francs) and has
to decide on his/her contribution to the public good. Players could contribute any amount
from 0 to 100 in units of 10 CHF. Any amount in the public good is increased by 1.5 times
and then distributed equally between the two players, regardless of their contribution.
Formally, the payoff of player i, where i �{1, 2}, is given by:
(1) Πi
= 100 – Ci + 0.75(C1 + C2),
where 100 is the endowment received at the start of the game, Ci is the contribution of player
i to the public good, 0.75 is the marginal per capita return from the public good, and C1 + C2
is the total contribution to the public good. Given the marginal per capita return, each Swiss
Franc contributed by a player to the public good yields only 0.75 back. Thus, it is
individually rational for a player to contribute nothing to the public good. However, because
2*0.75 > 1, it is socially optimal to contribute the entire endowment. This creates a
cooperation dilemma.
The game involved two decisions: unconditional and conditional. In the unconditional
decision, players decided simultaneously on their contribution to the public good and thus
beliefs play a role. In the conditional decision, we implemented the strategy method, whereby
each player had to decide on his/her contribution for each of the 11 possible contribution
15
decisions of the other player, thereby making beliefs redundant. A die was rolled to
determine the player for whom the conditional decision is relevant, which is then matched
with the unconditional decision of the other player to determine payoffs.
Measures of reciprocity. – If individuals are motivated only by their own payoff then they
should contribute zero in each of the 11 conditional decisions. However, if individuals have a
disposition for reciprocity then they should increase their contribution in response to the
increasing contribution of the other player. Following Fischbacher et al. (2001) and
Fischbacher and Gächter (2010), we use the Spearman correlation between self and the other
players’ contribution in the conditional decision as a measure of an individuals’ reciprocity -
the higher the Spearman correlation the higher is the propensity for reciprocity. The average
propensity to reciprocate in our sample is 0.65 points (s.d. 0.55) (panel C, Table 1).
We also categorize individuals into types following the guidelines proposed by
Fischbacher et al. (2001) and Fischbacher and Gächter (2010). Individuals for whom the p-
value of the Spearman correlation is ≤ 0.001 are classified as “reciprocators”. Individuals
who contribute zero in all the 11 decisions are categorized as “free riders”, those who
contribute 100 in all the decisions as “altruists”, and those who contribute the same amount
that is different from zero and 100 in all the decisions as “flat” contributors. Individuals who
do not fall into any of the above three categories are classified as “other types”. We find that
66 percent of the individuals in our sample are reciprocators, 7 percent are free riders, 4
percent are altruists, 5 percent are flat contributors, and the remaining 18 percent are
unclassifiable “other” types. As an alternative dependent variable, we construct a dummy for
reciprocity, which equals one if an individual is a reciprocator and zero otherwise.
In addition to the experiment described above, we also conducted a second follow up
experiment, which is described in section V.G. One of the two experiments was randomly
selected to determine the payoff.15 After the experiments, individuals took part in an in-depth
post-experimental survey. Both the experiment and the post-experiment survey were pre-
tested for respondents’ understanding of the experiment, questions, and the duration of the
study. We also made sure that native language speakers from within Switzerland wrote the
instructions. In addition, before the actual decision, individuals had to answer three control
questions on game comprehension correctly. We use this to gauge an individuals’
understanding of the experiment and to ensure that we are not simply capturing noise. 15 We pay a random sub-sample of participants following procedures by Bettinger and Slonim (2007). 40 people were randomly selected for payment, of which 50 percent are Swiss Germans and 30 percent Swiss French. On average, subjects earned CHF 135.

16
D. Descriptive Statistics
We present our descriptive results in two steps. First we discuss the correlation between
social groups and historical democracy, followed by the association of reciprocity with social
groups and historical democracy.
Our data show that 67 percent of the Swiss Germans are from municipalities with
historical democracy, but the corresponding share is only 16 percent for Swiss French. When
we consider the duration of historical democracy, we find that it averages 319 years for Swiss
Germans and 82 years for Swiss French. This means that Swiss Germans are nearly four
times more likely to be from municipalities with historical democracy than Swiss French and
also for a longer duration by about 240 years. These differences are highly significant (p-
values < 0.001). The gap in historical democracy across the two groups remains large even
when we control for covariates (Table A6 in Appendix A).
In line with the literature postulating a positive association between democracy and
reciprocity, we expect Swiss Germans to have stronger reciprocity than Swiss French.
Accordingly, we first show in Figure 2a that reciprocity is indeed higher among individuals
from municipalities with historical democracy (0.83 points) than municipalities without (0.42
points). Figure 2b shows that the propensity for reciprocity is much higher among Swiss
Germans (0.73 points) than Swiss French (0.41 points). The magnitude of these differences is
large and significant at the 1 percent level.
We test econometrically the association of reciprocity first with social groups and then
historical democracy in the following sections.
IV. Social Groups and Reciprocity
We tease out systematically the difference in reciprocity across the two social groups using
ordinary least squares (OLS) of the following form:
(2) !!"# = !! + !!!!"!"# + !!!"#!! + !!!"!!!+!!!"#,
where Rimk is the reciprocity of individual i from municipality m in canton k. It is measured as
the Spearman correlation between own and other players’ contribution in the conditional
decision of the public goods game. Our key variable of interest is SG, which is measured as a
binary variable that equals one if an individual i’s native language is Swiss German and zero
otherwise (Swiss French). To ensure that our Swiss German dummy is not capturing the

17
effect of other plausibly correlated variables, we include a number of control variables that
are hypothesized to matter for reciprocity in the literature. X is a vector of individual socio-
demographic characteristics, such as age, education, gender, household income, religion, and
politics. M is a vector of municipality specific variables including altitude and Gini
coefficient for income inequality, and cantonal level GDP per capita. !!"# is an idiosyncratic
error term clustered at the cantonal level. Owing to the small number of clusters (n = 23), the
standard errors could be biased downwards leading to a higher probability of Type I error.
Therefore, we also estimate standard errors using the wild cluster bootstrap-t procedure by
Cameron et al. (2008).
A. Main Results
Table 2 reports results from the estimation of equation 2 (Table A7 in Appendix A shows
coefficients on controls). For the coefficient on the Swiss German dummy, we additionally
report in square brackets p-values obtained using the wild cluster bootstrap procedure.
Column 1 is without control variables and shows that the Swiss German dummy has a
positive coefficient (0.32), which is significant at the 1 percent level. In column 2, we exploit
our rich dataset and control for a host of important individual level covariates. The
coefficient on the Swiss Germany dummy retains its magnitude as well as significance. In
column 3, we additionally account for differences in geography, inequality and economic
environment at municipal and cantonal level. As before, the coefficient on the Swiss
Germany dummy remains remarkably robust. With respect to Swiss French as the benchmark
category, Swiss Germans display stronger reciprocity by 0.29 points. This difference is
economically large, especially given that the average reciprocity among the Swiss French is
0.41 points. It is also nearly one-half of the average reciprocity in our full sample (0.65
points). In monetary terms, for each additional 10 Swiss Francs contributed by the other
player, Swiss Germans contribute 2.1 Swiss Francs more than Swiss French, which is 57
percent of the contribution by Swiss French.16
We implement a number of robustness checks on the association between social groups
and reciprocity. We first show that the gap is not due to differences in cantonal level
institutions. As mentioned before, because within canton variation in linguistic groups occurs
only in the three Roestigraben cantons, we exploit this sub-sample and introduce canton fixed 16 This is computed from a regression of contribution by an individual on the contribution by the other player in the public goods game, after controlling for the full set of covariates. The average contribution for Swiss Germans and Swiss French are 6.1 and 3.7 Swiss Francs, respectively.

18
effects to control for cantonal specific differences in institutions. The results reported in
column 1 of Table A8 shows that the Swiss Germany dummy has a positive coefficient,
which is significant at the 5 percent level. In column 2, when we drop these three cantons
from our sample, the coefficient on the Swiss German dummy turns out to be 0.31 (s.e. 0.07),
which is similar in magnitude and significance to our main result. To mitigate further the
scope of influential cantons, we show that our results hold when we drop the highly
urbanized cantons of Zurich in column 3 and Geneva in column 4. In addition, when we drop
one canton at a time the coefficient on the Swiss German dummy varies from 0.26 to 0.33,
and remains highly significant.
We also reproduce our main results using alternative measures of reciprocity and social
groups in Table A9. We start by using as our dependent variable a dummy for whether an
individual is a reciprocator or not. Column 1 reports the results and shows that Swiss
Germans are, on average, 18 percentage points more likely to have a disposition for
reciprocity than Swiss French. We then change the way we measure social groups by taking
into consideration the extent to which an individual identifies as belonging to one’s own and
other linguistic groups. Following Aron et al. (1991), we show respondents five Venn-like
diagrams with different degrees of overlap between the respondent and the social group,
ranging from 1 (no overlap) to 5 (complete overlap) (see Figure A1, Appendix A). Each
respondent faces four such diagrams, one each for Swiss German, Swiss French, Swiss
Italian, and foreigner. We focus on the ‘degree of Swiss German identity’ and study how this
associates with reciprocity using the ‘degree of Swiss French identity’ as a benchmark, after
controlling for the degrees of Swiss Italian and foreigner identity. Column 2 reports the
results and shows that the coefficient on the degree of Swiss German identity is 0.052, which
is significant at the 5 percent level. A one standard deviation increase in the degree of Swiss
German identity (1.14) is associated with an increase in reciprocity by 0.06 points.
We also show in Tables A10 and A11 that we are not capturing other cantonal and
municipal level differences. These include current share of foreigners, an index of business
competition, and proxies of historical development and human capital. Lastly, we add several
individual level controls in Table A12, including a dummy variable for naturalized Swiss
citizen and whether an individual has migrated within Switzerland or not17, Big Five
personality traits, and game comprehension, measured as the number of correct responses to 17 Migration in our sample occurs only within Switzerland and within a linguistic group, and is therefore not problematic, as individuals are assigned to social groups on the basis of their native language. The only exception is three individuals who have residence across the linguistic groups. Dropping these individuals does not change our results.
19
control questions. Thus far, our measure of reciprocity is unable to distinguish between free
riders, altruists, and flat contributors, as the Spearman correlation is zero for these three
types. We show that our results hold when we drop altruists and flat contributors in column 5
or introduce dummy variables for these two types as additional controls in column 6.
We also reproduce our main results using the wave 13 of the Swiss Household Panel
(SHP) as an alternative data source. We do not have experimental measures of reciprocity for
respondents in this sample, so we use data on values that are associated with reciprocity, such
as cheating on tax declaration, lying in own interest, and claiming state benefits not entitled
to (Knack and Keefer 1997, Guiso et al. 2011)18. Individuals are asked to report the extent to
which they think that each of the three items can be justified on a scale from 0 to 10, where 0
means “never justified” and 10 “always justified”. For the ease of interpretation, we invert
the scale so that a higher score reflects stronger values. Because the three responses are
correlated, we extract their underlying principal component and regress this on the Swiss
German dummy controlling for the same set of covariates as in equation 2. The results are
reported in columns 1-3 of Table A13 and show that without or with controls Swiss Germans
have values that are over 40 percentage points higher than Swiss French and that these
differences are also statistically significant at 1 the percent level.
B. Falsification Tests If the gap in reciprocity between the social groups is capturing differential experience of
historical democracy then it should disappear when historical democracy is altogether
lacking. We test this by comparing Swiss Germans and Swiss French who are from
municipalities without the historical experience of democracy. Column 1 in Table 3 shows
that the gap in reciprocity between Swiss Germans and Swiss French drops from 0.29
(column 3, Table 2) to 0.04 and is no longer statistically significant (p-value = 0.66).19 We
ensure that this result is not due to some peculiarity of our sub-sample in column 2. When we
replace Swiss Germans from municipalities without historical democracy with Swiss
18 Swiss Household Panel does not include the full list of questions on values asked in the World Values Survey, such as accepting a bribe, speeding over the limit, and throw away litter in a public space. 19 We also conduct an analogous test where we compare Swiss French from municipalities with historical democracy but Swiss Germans from municipalities without. If our hypothesis that historical democracy shaped reciprocity is correct then the sign on the Swiss German dummy should flip from positive to negative. We find that this is indeed the case: the coefficient on Swiss German dummy is -0.293 and is even statistically significant. The absolute magnitude of the difference is comparable to the gap we obtain in our main result (Column 3, Table 2). This can be interpreted as suggesting that democracy has a positive association with reciprocity regardless of the social group.

20
Germans from the same canton but from municipalities with historical democracy, the gap in
reciprocity reemerges and is also statistically significant at the 1 percent level. Together these
results confirm that the strong gap in reciprocity across social groups is most likely due to
their differential historical experience of democracy.
V. Historical Democracy and Reciprocity
We examine econometrically the association of reciprocity with historical democracy.
Towards the end of the section, we also discuss reasons behind the persistence of this
association, the emergence of democracy, and alternative interpretations.
The exposure to historical democracy might come from an individuals’ municipality of
residence as well as the municipality of birth. Since for over 90 percent of the respondents
(both Swiss Germans and Swiss French) these two overlap, we present our main results using
measures of historical democracy from the municipality of residence. Subsequently, while
conducting robustness checks, we use the sub-sample of Swiss migrants and present results
that consider measures from the municipality of birth using an epidemiological approach.
Following previous studies that establish the association between historical events and
behavior today (see for instance Tabellini 2010, Nunn and Wantchekon 2011, Voigtländer
and Voth 2012, Alesina et al. 2013, Becker et al. 2016, Guiso et al. 2016), we investigate the
association between historical democracy and reciprocity using the following OLS
specification:
(3) !!"# = !!!+!!!!"!" + !!!"#!! + !!!!!!+!!"!! + !!"# , where R is the reciprocity of individual i from municipality m and canton k, measured as the
Spearman correlation between own and other players’ contribution in the conditional
decision of the public goods game. HD is a measure of historical democracy from the
resident municipality. The coefficient of interest is !!, which captures the association
between an individual’s reciprocity today and historical democracy from his / her resident
municipality. We present results using both the experience of historical democracy and the
duration of this experience.
X and M are vectors of individual and municipality / canton specific controls that are
listed in panel E of Table 1 and are hypothesized to matter for reciprocity in the literature.
These include at the individual level age, education, gender, household income, religion and
politics; altitude and Gini of income inequality at the municipal level; and GDP per capita at
21
the cantonal level. FE is a vector of canton, dynasty, and group fixed effects that capture
canton, dynasty, and group specific factors that may affect reciprocity. Given the potential for
within canton and spatial correlation of errors, we report standard errors that are clustered on
the canton including p-values using the wild cluster bootstrap procedure (Camerer et al.
2008), as well as standard errors adjusted for spatial correlation (Conley 1999).
A. Benchmark Estimates
Table 4 report benchmark estimates without fixed effects on the association of reciprocity
with historical democracy using experience in panel A and duration in panel B (for
coefficients on covariates see Table A14a-b, Appendix A). Below the coefficient on
reciprocity, we additionally report p-values from the wild cluster bootstrap procedure (in
square brackets) and standard errors adjusted for spatial clustering (in curly brackets).
Column 1 is without control variables and shows that the coefficient on experience is 0.41
while that on duration is 0.085, which are significant at the 1 percent level. The coefficients
remain robust in magnitude and significance when we introduce individual level covariates in
column 2 and municipal level variables alongside cantonal level GDP per capita in column 3.
Given that the average reciprocity among individuals from municipalities without historical
democracy is 0.42, the coefficient on experience in column 3 implies that individuals from
municipalities with historical democracy display twice the reciprocity of individuals from
municipalities without. Moreover, one standard deviation increase in duration (2.44) is
associated with a rise in propensity for reciprocity by 0.22 points.20 These estimates are not
due to influential cantons, for when we drop one canton at a time in Table A15, the
coefficient on experience ranges from 0.38 to 0.45 while that on duration from 0.078 to
0.093; they always remain highly significant. These results imply that for each additional 10
Swiss Francs contributed by the other player individuals from municipality with historical
democracy contribute 7.1, whereas individuals from municipalities without contribute 3.6
Swiss Francs, reflecting a difference of 103 percent over the base.
We examine the possibility that other cantonal level differences today as well as in the
past are driving the strong positive association between reciprocity and historical democracy.
Following Alesina et al. (1999) and Francois et al. (2011) who highlight the importance of
20 We also tested for a specification with a quadratic term of duration. While the coefficient on duration remains large and statistically significant, the coefficient on duration squared is very small and statistically insignificant. We conducted similar tests for other cantonal and municipal level variables, such as historical population. As before, our results remain robust whereas the coefficients on the squared terms are small and statistically insignificant.
22
ethnic diversity and competition, we introduce in Table 4 share of foreigners (column 4) and
an index of business competition (column 5).21 Tabellini (2010) shows that values associated
with reciprocity are affected by historical development and historical education. Accordingly,
we consider proxies of these variables from the time when modern Switzerland was found.
Because we do not have measures of GDP per capita from the historical period, we use as our
main proxy the unemployment rate in 1888 (column 6) and consider additional proxies in
Table A16 of Appendix A. These include population from the period before the invasion of
Switzerland by Napoleon in 1798, and measures from 1850 on population and population
density. For proxies of historical education, we include in column 7 of Table 4 enrollment in
primary and secondary schools in 1888. Finally, in column 8, we include the index of modern
democracy constructed by Stutzer (1999) and extended by Fischer (2009), acknowledging
that it is endogenous.22 The motivation is to test whether the effect of historical institutions
on reciprocity today is channelized via modern institutions of democracy or not. The
coefficients on added covariates, such as competition index, unemployment rate, and modern
democracy have the expected sign and are also statistically significant. Nonetheless, the
coefficients on experience and duration remain remarkably robust in both magnitude and
significance. These results suggest that historical institutions of democracy matter for
reciprocity over and above modern institutions despite the fact that the historical institutions
themselves are long gone, and so must have left their mark by shaping values that were
transmitted over time across generations.
B. Fixed Effects Estimates
The above results show a strong positive association between reciprocity and historical
democracy, which is robust to many contemporaneous and historical controls. However, we
cannot rule out that this association is not capturing the effect of a number of other factors
that vary across cantons. In addition, it could be that our estimates are capturing differences
in historical dynasties with which our municipalities were associated in the past. For instance,
Becker et al. (2011) show that even if whole empires themselves perish, they can have long-
lasting effects on trust and corruption. Another possibility is that we are capturing some
systematic differences across social groups. We mitigate these concerns in Table 5 by
21 We use data on locational quality index prepared by Credit Suisse on the attractiveness of Swiss Cantons and economic regions to business (see Holdener et al. 2013). 22 The modern democracy index scores institutions of direct legislation in all the 26 cantons of Switzerland. It is based on a number of requirements on constitutional initiative, statutory initiative, fiscal referendum, and statutory referendum. The index varies from 1-6, where 1 means weak and 6 strong.

23
introducing fixed effects for cantons in panel A, historical dynasties in panels B-C, and social
groups in panels D-E. Each column reports the coefficient on historical democracy from a
separate regression using experience in columns 1-3 and duration in columns 4-6.
Canton fixed effects
Panel A shows the association of reciprocity with historical democracy after controlling only
for canton fixed effects. The coefficient on experience and duration without any additional
individual or municipal level controls are 0.40 and 0.081, respectively, both of which are
significant at the 1 percent level. When we augment this specification with individual level
controls in column 2 and municipal level controls in column 3, the coefficients increase
slightly to 0.42 and 0.09 but remain highly significant. These estimates are very similar to the
ones without canton fixed effects (Table 4) and suggest that canton specific factors are not
driving the association between reciprocity and historical democracy. This is not surprising
after having seen in Table 4 that the coefficients on measures of historical democracy are
robust to the introduction of a variety of important cantonal level variables.
Dynasty fixed effects We consider two different dynasty fixed effects corresponding with two different time
periods: Middle Ages and the period just before the invasion of Switzerland by Napoleon.
In the 13th century, the Holy Roman Emperor placed most areas in Switzerland under the
authority of one of the four major noble houses: Zaehringen, Kyburg, Habsburg, and Savoy.
The remaining areas were either under lesser-known nobles or prince bishoprics or under a
common league / tithing. We assign municipalities in our sample to each of these five
categories using maps by Ammann and Schib (1958) and Putzger (2004) and then investigate
whether the association between reciprocity and historical democracy exists even after
introducing fixed effects for these dynasties. Panel B reports the estimates and shows that
without or with controls the coefficients on experience and duration are positive and highly
significant. In the specification with the full set of controls, the size of the coefficient on
experience is 0.41 (column 3) while that on duration is 0.089 (column 6). These estimates
are, as before, similar to those reported in Table 4 and clearly suggest that our estimates are
not capturing dynasty specific differences from the Middle Ages.
By 1415, Switzerland was mostly free of major noble dynasties. Instead, from this
period onwards, the members and allies of the Old Swiss Confederacy developed a complex
system of dependencies, which were managed either by a single member or jointly by two,

24
three, and at times even eight members. This system lasted until the invasion of Switzerland
by Napoleon in 1798, which led to the dissolution of the Old Swiss Confederacy. We match
each municipality in our sample with the original member or ally with which it was
associated until 1798. Municipalities that were jointly administered by two or more members
are assigned to a category of their own. Panel C shows that in the specification with the full
set of controls the coefficients on experience and duration are 0.38 and 0.082 and retain their
high level of significance.
We also consider a sub-sample of municipalities that were under the rule of the city-state
of Bern (the largest city state north of the Alps covering nearly 25 percent of the Swiss area)
for over 250 years (from 1536-1798). Column 1 of Table A17 shows that the coefficients on
experience (0.58) and duration (0.12) turn out to be slightly larger than our previous
estimates but remain statistically significant at the 1 percent level. Our results also hold when
we confine our sample to individuals from municipalities within the modern cantonal
boundaries of Bern (column 2) or when we drop the city of Bern (column 3).
Group fixed effects If our estimates are capturing some systematic differences across social groups then the scope
of this concern is plausibly larger when the variation in historical democracy that we exploit
is between groups but smaller when it is within groups. Accordingly, we report within group
estimates obtained after controlling for social groups in panel D. In the specification with full
set of controls, the coefficients on experience and duration are 0.38 and 0.081, which are
significant at the 1 percent level. These estimates are remarkably similar to those reported in
Table 4 and suggest that our results are not capturing group specific differences. Panel E
shows that we obtain similar results when we restrict our sample to Swiss Germans only,
which is akin to introducing a Swiss German fixed effect.
Thus far, we have considered each fixed effect at a time. When we introduce all the three
main fixed effects at the same time (canton, dynasty ca. 1200, and social group), the
coefficients on experience and duration turn out to be 0.36 (s.e. 0.07) and 0.077 (s.e. 0.012);
these are highly significant. These results confirm that our benchmark estimates in Table 4
are not capturing differences across cantons, dynasties, and social groups.
C. Additional Municipal and Individual Level Controls
It is assuring that our results are robust to the introduction of a variety of cantonal level
controls and fixed effects. However, this does not rule out the possibility that some other

25
municipality or individual level difference is driving the positive correlation of reciprocity
with historical democracy. We now test whether our results are robust to the inclusion of
additional municipal and individual level control variables. For this purpose, we use the
specification in column 3, Table 4. However, all of our results hold even when we choose
alternative specifications that control for canton or dynasty or group fixed effects.
Table A18 includes additional controls at the municipal level such as the share of
foreigners and an index of business competition, followed by proxies for current and historic
levels of economic development. Because there is no data on GDP per capita at the municipal
level today or in the past, we use current unemployment rate and population density from the
time of founding of modern Switzerland (1850) as proxies.23 Finally, we also consider the
distance of a municipality from the local cantonal capital that was the center of power in the
Middle Ages. The motivation is that during the Middle Ages, the authority of the state in
areas further away from the capital could have been weaker allowing such areas to exercise
more self-governance. Table A19 includes additional controls at the individual level like a
dummy for naturalized Swiss citizen, a dummy for migrant from within Switzerland, Big
Five personality traits, and a measure of game comprehension (number of control questions
answered completely). In both the tables, the coefficients on experience and duration remain
all throughout robust in magnitude and significance. The coefficient on experience is above
0.40 while that on duration stays above 0.08. These results suggest that the positive
association between reciprocity and historical democracy is most likely not capturing the
effect of other municipal and individual level characteristics.
D. Other Robustness Checks
Epidemiological approach. – In Table A20 we present results using measures of historical
democracy from the birth municipality for our sub-sample of migrants. Using an
epidemiological approach (Fernandez 2010, Algan and Cahuc 2014), we show that migrants
from birth municipalities with historical democracy exhibit stronger reciprocity than migrants
from birth municipalities without, after accounting for resident canton fixed effects,
individual and municipal level controls. The coefficients on experience and duration are 0.56
and 0.12, which are slightly larger than the estimates we obtain using the full sample, but are
also highly significant.
23 The oldest population data we have is from 1600-1700, but it is available only for a sub-set of municipalities. When we use this measure, the coefficients on experience and duration remain positive and highly significant.
26
Sub-sample analysis. – In the Middle Ages, historical democracy was not practiced in a
uniform manner in Switzerland but differed largely along the lines of rural and urban areas.
Another distinction that warrants attention is that only male citizens were allowed to
participate in decision-making. Although these differences could have affected reciprocity,
Table A21 shows that the coefficients on experience and duration do not differ by rural-urban
(columns 1-2) or male-female (columns 3-4) categories. In Table A22, we show that our
results hold when we restrict our sample to the three Roestigraben cantons. As before, the
difference is larger than what we obtain in the full sample (column 1) but survives even when
these cantons are dropped (column 2). Finally, we also show in column 3 that altruists and
flat contributors are not driving our results by dropping them altogether from the sample.
Alternative dependent variable. – We also reproduce our main results using a dummy
variable for reciprocity as an alternative dependent variable. Table A23 reports the results
and shows that the coefficients on both experience and duration turn out to be positive and
highly significant. Individuals from municipalities with historical democracy are over 36
percentage points more likely to display a propensity for reciprocity than individuals from
municipalities without. Moreover, one standard deviation increase in duration is associated
with a rise in the likelihood of being a reciprocator by over 19 percentage points. Given that
the share of reciprocators in our sample is 65 percent, these magnitudes are large.
Selection on unobservables. – In addition for the specification with the full set of controls
(column 3, Table 4), we perform a bounding exercise to consider the sensitivity of the
findings to unobserved selection as proposed by Oster (2016). We find that the selection on
unobservables would have to be over two times as large as the selection on observables to
zero out the estimated effect.
E. Results using Swiss Household Panel
In Table A24, Appendix A we reproduce our main results from Table 4 using data from the
Swiss Household Panel. Note that we use as our dependent variable the principal component
of values related to reciprocity, such as whether it is justifiable to cheat on tax declaration,
lye in own interest, and claim state benefits not entitled to. Our results show that without or
with controls there exists a strong positive and statistically significant association of the
principal component of values with experience (panel A) and duration (panel B) of historical
democracy. The magnitude of the coefficient on experience implies that with respect to

27
municipalities without the historical experience of democracy, values are higher on average
by 32 percentage points in areas with experience. Similarly, a one standard deviation increase
in duration is associated with an increase in the principal component of values by 0.15
percentage points. These results hold even when we introduce different fixed effects.
F. Discussion
Why did some areas acquire democracy but others did not? As discussed in section II,
historical circumstances under which the municipalities acquired democracy were often
idiosyncratic. As we discuss below, these cast doubts on reverse causality from reciprocity to
democracy. In particular, one historical circumstance – the extinction of the House of
Zaehringen – offers us quasi-experimental variation in historical democracy. We use this
event to report intention to treat (ITT) and instrumental variable estimates (IV), whereby we
use the extinction of the Zaehringen as an instrument for historical democracy.
The Zaehringen were among the powerful noble dynasties in the Middle Ages that
controlled large swathes of land in Switzerland. But, the dynasty came to an abrupt end in
1218 when its last duke died of natural causes without an heir. This led the German king to
grant imperial immediacy to areas under the Zaehringen rule. Historians consider this to be a
watershed event that gave municipalities the impetus to move towards democracy (Zschokke
1860, McCrackan 1908, Eugster 2015). For instance, Eugster (2015) points out that the
extinction of the Zaehringen “…served as an essential prerequisite for the tendency towards
more municipal autonomy of the 13th and 14th century.”
Though the timing of the extinction of the Zaehringen is plausibly exogenous, the
Zaehringen rule in itself is not. Therefore, any pre-existing differences across areas with and
without the Zaehringen rule could induce selection bias. The bias is expected to be weaker if
the Zaehringen were assigned these areas than when these were selectively acquired by the
Zaehringen themselves. Although historical records concur that emperors Henry IV and
Lothair assigned Zaehringen the territories, this argument holds water as long as the emperors
themselves did not grant the Zaehringen more productive areas. We believe this is highly
unlikely because favoring Zaehringen over other contemporary dynasties could have resulted
in a rift with the nobility, whose support the emperors needed in the Middle Ages.
Nevertheless, we test for the scope of pre-existing differences by comparing
municipalities that were under the Zaehringen rule with municipalities that were under other
dynasties that ruled concurrently on the Swiss plateau. Bearing in mind that in the Middle
28
Ages, pre-existing differences are likely to be based on factor endowments in agriculture, we
follow Alesina et al. (2013) and Galor and Özak (2016) and consider a number of proxies
reflecting crop suitability. These include municipal level climate and soil suitability indices
for a variety of cereal and fodder crops that could have been grown in Switzerland in pre-
1500 period. The former captures differences in cultivation options on the basis of climatic
conditions, while the later captures different elements of the landscape characterized by
bedrock, slope and gradient. The data for these indices were obtained from the Swiss Federal
Office for Agriculture. Table A25 reports the results and shows that there is no difference in
either climate (column 1) or crop suitability (column 2) across the dynasties. We further test
these results by comparing two additional municipal level characteristics: average altitude
and share of waste / rugged land. Columns 3-4 report the results. As before, there is no
difference in any of these characteristics between municipalities from different dynasties.
This evidence can be interpreted as suggesting that pre-existing differences in agricultural
productivity and geographical attributes across areas with and without the Zaehringen rule
were most likely lacking.
We start by reporting intention-to-treat (ITT) estimate in Table A26. Column 1
includes our full set of controls and shows that the coefficient on the Zaehringen dummy
turns out to be 0.12 and is significant at the 5 percent level.24 The size of the coefficient
implies that individuals from municipalities that were associated with Zaehringen rule in the
past have higher reciprocity by 0.12 points than individuals from municipalities that were
associated with other dynasties.
The instrumental variables estimates of the effect of historical democracy on
reciprocity require that the Zaehringen rule did not have any direct effect on reciprocity. We
offer two pieces of evidence in support of this. First, once we directly control for historical
democracy via experience in column 2 and duration in column 3 of Table A26, the
coefficient on Zaehringen dummy drops considerably in magnitude from 0.12 (column 1) to
0.008 (column 2) and -0.02 (column 3); it is also now no longer statistically significant. In
contrast, the coefficients on experience and duration remain robust in magnitude and
significance. Second, if being under the Zaehringen rule itself led to higher reciprocity then
we should observe a positive and significant association between the Zaehringen dummy and
reciprocity even when historical democracy is lacking. Instead, as Figure A2 shows the
difference in reciprocity across dynasties is small and statistically insignificant. A regression- 24 Our results hold even when we control for other dynastic dummies. In this case, the coefficient on Zaehringen dummy is 0.15 and is significant at the 10 percent level.

29
based test confirms this and shows that the coefficient on Zaehringen dummy is not
significantly different from the coefficients on Kyburg and Habsburg dummies (p-value =
0.64), casting doubts that the Zaehringen rule was special relative to other dynasties.
Panel A of Table A27 reports first-stage estimates of the association of Zaehringen
dummy with experience in columns 1-2 and duration in columns 3-4. Without or with
controls there is a strong positive association between historical democracy and the
Zaehringen dummy, which is also highly significant. Municipalities with Zaehringen rule are
nearly 30 percentage points more likely to have historical democracy and for a longer
duration by nearly 160 years than municipalities without. Given that 54 percent of the
municipalities in our sample were exposed to historical democracy for 258 years, these
differences are large in magnitude. The F-statistics are also large (> 19), confirming that the
instrument is relevant.
Panel B reports second-stage estimates of the effect of historical democracy on
reciprocity. Both experience and duration have positive coefficients that are also statistically
significant at the 5 percent level. The coefficients in specifications with full set of controls
are 0.45 on experience and 0.076 on duration, which are remarkably similar to their OLS
counterparts in column 3 of Table 4. These results confirm the positive association of
historical democracy with reciprocity.
G. Alternative Interpretations
We rule out the alternative interpretation that the differences in reciprocity across social
groups that we observe is actually due to Swiss French playing an out-group game. Although
in expectation Swiss French are more likely to be matched with Swiss Germans because the
latter form the majority group in Switzerland, our data suggests that this explanation is not at
work. These data comes from a second experiment, which is similar to the experiment
described in section III except for one key difference – we now reveal the linguistic group of
the other player. Specifically, we randomly matched an individual from a linguistic group to
another individual either of the same (in-group) or a different linguistic group (out-group).
For example, some Swiss French were randomly matched with other Swiss French, while the
remaining were randomly matched with Swiss Germans. All individuals who took part in the
first experiment also took part in the second experiment. Our results reveal no difference in
reciprocity when an individual is randomly assigned to an in-group or an out-group
treatment, either among Swiss French (p-value = 0.95) or among Swiss Germans (p-value =

30
0.87). A related concern that Swiss French display lower reciprocity because they are a
minority in Switzerland is also ruled out, as we do not find any difference in reciprocity
across Swiss French from cantons where they are in absolute majority (Vaud, Neuchatel,
Geneva, and Jura) to cantons where they are in relative majority (Fribourg and Valais) or
where they are in minority (Bern) (p-value = 0.69).
H. Plausible Channel
What could have led to the persistence of the effect of historical democracy on reciprocity
even until today? One plausible channel is the intergenerational transmission of values,
which could have led to the formation of distinct group specific cultures (Bisin and Verdier
2011, Algan and Cahuc 2014). Our results from the epidemiological approach already
suggest that reciprocity persists even when individuals move. In this section, we investigate
the role of family background in the transmission of reciprocity.
Our data does not allow us to test directly for intergenerational transmission, as we do
not observe the reciprocity of parents and grandparents in the experiment. So, we investigate
whether our measure of reciprocity changes in response to changes in the degree of parental
and grandparental linguistic background. Bisin and Verdier (2011) posit three distinct
processes for the transmission of values from parents to children: direct socialization of
children by parents, indirect socialization via parents choosing the social environment of their
children (school and neighborhood), and assortative mating. We focus on the combined effect
of the three processes because of high correlation among them.25
To proxy for the family background of an individual, we use two dimensions: the
linguistic region in which individuals’ parents or grandparents were born (region of birth)
and spent most of their time (region of stay).26 Data were collected via the post-experimental
survey, where individuals could choose from the following options: Swiss German, Swiss
French, Swiss Italian, and other (outside Switzerland). We build a quantitative score for each
individual to measure the strength of parental / grandparental background an individual is
exposed to without taking the individuals’ language into consideration. For the parental
background, the scoring rule is such that each individual can have from zero to four points
25 For instance, parents’ / grandparents’ region of birth and region of stay can be used as proxies for direct and indirect socialization, respectively. In our sample, the correlation between region of birth and region of stay is 0.89 for grandparents, and 0.84 for parents. Similarly, by comparing mothers’ and fathers’ regions of birth and stay, we could also infer assortative mating. The correlation is 0.99 between their regions of stay and 0.76 between their regions of birth. 26 Unfortunately, we do not have these data on the municipality of parents and grandparents.

31
(maximum two points each from mother’s and father’s regions of birth and stay). For the
grandparental background, each individual can have from zero to eight points (maximum
four points each from maternal grandparents’ and paternal grandparents’ regions of birth and
stay). The higher the score, the higher is the exposure an individual has to the linguistic
background of parents and grandparents. Because of little overlap, the Swiss German and
Swiss French family backgrounds are strongly negatively correlated with each other.27 In line
with our previous analysis, we report results using the Swiss German parental and
grandparental background and hypothesize these to have a positive association with
reciprocity. An additional advantage of this approach is that it allows us to address the
concern arising from differences in pure and mixed heritage across linguistic groups.
We estimate the association of reciprocity separately with parental and grandparental
background. Columns 1-2 in Table 6 report the results using parental and grandparental
background respectively. Because parental and grandparental estimates use different scales,
we also report standardized coefficients for easy comparison in the row below the
unstandardized coefficients. We find that the stronger the Swiss German family background,
the stronger is reciprocity among individuals. A one standard deviation increase in Swiss
German parental background (1.71) and Swiss German grandparental background (3.30) is
associated with an increase in reciprocal behavior by 0.10 and 0.07 points, respectively.28
These results can also be broadly interpreted as demonstrating the role of
intergenerational transmission in the persistence of reciprocity over time.
VI. Conclusions
Evidence in economics suggests large variation in reciprocity across social groups and its
implications for a variety of economic outcomes. Yet, our understanding of the determinants
of reciprocity and how it is fostered is still poor. We investigate the association of historical
democracy with reciprocity today and also shed some light on plausible mechanisms that
could explain the emergence of historical democracy in the Middle Ages and the persistence
of its effect on reciprocity over time. 27 Only nine individuals have an overlap in Swiss German and Swiss French parental background, and 33 individuals in grandparental background. 28 We believe that this difference in transmission of reciprocity across generations is due to differences in historical democracy. Consequently, we study whether the association still holds when we restrict our sample to those municipalities that were not exposed to historical democracy. The results show that the coefficients on parental as well as grandparental background disappear altogether and are close to zero in magnitude. This is despite the fact that in this sample Swiss Germans have a stronger Swiss German grandparental and parental background by 5.6 and 3.38 points than Swiss French (out of a maximum possible is 8 and 4).

32
Our study takes place in Switzerland, whereby we exploit variation in historical
democracy over space and time and match this with variation in linguistic social groups.
Reciprocity is elicited using a one-shot anonymous public goods game in the strategy method
to control for benefits from repeated interaction, reputation formation, as well as beliefs
about the contribution of others.
We find that the linguistic social groups differ in their exposure to historical democracy:
Swiss Germans are four times more likely to be from municipalities with historical
democracy than Swiss French and also for longer duration. In line with this difference, our
first set of results show a large gap in reciprocity across social groups: Swiss Germans
display significantly higher reciprocity than Swiss French. Moreover, the gap disappears
completely when we compare Swiss Germans and Swiss French from municipalities without
historical democracy. We find a strong positive association between historical democracy and
reciprocity, which holds even when we control for a variety of fixed effects including
cantons, dynasties, and social groups.
In addition, we exploit the extinction of the Zaehringen dynasty from the absence of an
heir as a plausibly exogenous shock to show a strong positive association between historical
democracy and the Zaehringen rule, as well as between historical democracy and reciprocity
today. Lastly, we also offer suggestive evidence on the role of intergenerational transmission
in the persistence of these effects by showing that stronger Swiss German parental and
grandparental background is associated with stronger disposition for reciprocity. Our findings
are in line with previous studies that document, inter alia, a strong and persistent effect of
historical experiences on preferences and beliefs today.

33
REFERENCES
Aidt, T. S., and R. Franck. 2015. “Democratization Under the Threat of Revolution:
Evidence From the Great Reform Act of 1832.” Econometrica, 83, 505-547.
Alesina, A., R. Baqir, and W. Easterly. 1999. “Public Goods and Ethnic Divisions.”
Quarterly Journal of Economics, 114, 1243-1284.
Alesina, A., P. Giuliano, and N. Nunn. 2013. “On the Origins of Gender Roles: Women and
the Plough.” Quarterly Journal of Economics, 128(2), 469-530.
Algan, Y., and P. Cahuc. 2014. “Trust, Growth and Well-being: New Evidence and Policy
Implications,” In S. N. Durlauf and P. Aghion (eds.), Handbook of Economic Growth,
Volume 2, 49-120.
Ammann, H., and K. Schib. 1958. Historischer Atlas der Schweiz, Aarau.
Aron, A., E. N. Aron, M. Tudor, and G. Nelson. 1991. “Close Relationships as Including
the Other in the Self.” Journal of Personality and Social Psychology, 60, 241-253.
Bandiera, O., I. Barankay, and I. Rasul. 2005. “Social Preferences and the Response to
Incentives: Evidence from Personnel Data.” Quarterly Journal of Economics, 120(3), 917-
962.
Bardhan, P. 2000. “Irrigation and Cooperation: An Empirical Analysis of 48 Irrigation
Communities in South India.” Economic Development and cultural change, 48, 847-865.
Becker, S., O. K. Boeckh, C. Hainz, and L. Woessmann. 2016. “The Empire Is Dead,
Long Live the Empire! Long-Run Persistence of Trust and Corruption in the Bureaucracy.”
Economic Journal, 126(590), 40-74.
Berner, H. 2006. “Grosser Rat (Ancien Regime)”. Historisches Lexikon der Schweiz (31
January).
Bettinger, E. and R. Slonim. 2007. “Patience in Children: Evidence from Experimental
Economics.” Journal of Public Economics, 91(1-2), 343-363.
Bisin, A. and T. Verdier. 2011. “The Economics of Cultural Transmission and
Socialization.” In J. Benhabib, A. Bisin, and M. Jackson (eds.), Handbook of Social
Economics, Volume 1A, 339-416. The Netherlands: North-Holland.
Bolton, G. E. and A. Ockenfels. 2000. “ERC: A Theory of Equity, Reciprocity and
Competition.” American Economic Review, 90, 166-193.
Bowles, S., and H. Gintis. 2002. “The Inheritance of Inequality.” Journal of Economic
Perspectives, 16(3), 3-30.
34
Bowles, S., and S. Polania-Reyes. 2012. “Economic Incentives and Social Preferences:
Substitutes or Complements?” Journal of Economic Literature, 50, 368-425.
Buhler, S., J. M. Nunes, G. Nicoloso, J. M. Tiercy, and A. S. Mazas. 2012. “The
Heterogeneous HLA Genetic Makeup of the Swiss Population.” PLOS One, 7, 1-12.
Cameron, C., J. B. Gelbach, and D. L. Miller. 2008. “Bootstrap-baased Improvements for
Inference with Clustered Errors.” Review of Economics and Statistics, 90(3), 414-427.
Clots-Figueras, I. and P. Masella. 2013. “Education, Language and Identity.” Economic
Journal, 123, F332–F357.
Clyne, M. 1995. The German Language in a Changing Europe. Cambridge: Cambridge
University Press.
Conley, T. G. 1999. “GMM Estimation with Cross Sectional Dependence.” Journal of
Econometrics, 92, 1–45.
Dal Bo, P., A. Foster, and L. Putterman. 2010. “Institutions and Behavior: Experimental
Evidence on the Effects of Democracy.” American Economic Review, 100, 2205-2229.
DellaVigna, S. 2009. “Psychology and Economics: Evidence from the Field.” Journal of
Economic Literature, 47, 315-372.
Dufwenberg, M. and G. Kirchsteiger. 2004. “A Theory of Sequential Reciprocity.” Games
and Economic Behavior, 268-298.
Eugster, E. 2015. “Zähringen, von” Historisches Lexikon der Schweiz (1 January).
Eugster, B., R. Lalive, A. Steinhauer, and J. Zweimuller. 2011. “The Demand for Social
Insurance: Does Culture Matter?” Economic Journal, 121, 413-448.
Fehr, E. 2009. “On the Economics and Biology of Trust.”Journal of the European Economic
Association, 7, 235-266.
Falk, A. and U. Fischbacher. 2006. “A Theory of Reciprocity.” Games and Economic
Behavior, 54, 293-315.
Fehr, E., and S. Gächter. 2000. “Fairness and Retaliation: The Economics of Reciprocity.”
Journal of Economic Perspectives, 14, 159-181.
Fehr, E. and K. Schmidt. 1999. “A Theory of Fairness, Competition, and Cooperation,”
Quarterly Journal of Economics, 114, 817-868.
Fernandez, R. 2010. “Does Culture Matter?” In J. Benhabib, A. Bisin and M.O Jackson
(eds), Handbook of Social Economics, Volume 1, 481-510.
Fischbacher, U. and S. Gächter. 2010. “Social Preferences, Beliefs, and the Dynamics of
Free Riding in Public Goods Experiments.” American Economic Review, 100, 541-556.
Fischbacher, U., S. Gächter, and E. Fehr. 2001. “Are People Conditionally Cooperative:
35
Evidence From a Public Goods Experiment.” Economic Letters, 71, 397-401.
Fischer, J. 2009. “Development of Direct Democracy in Swiss Cantons between 1997 and
2003.” MPRA Paper no. 16140.
Francois, P., T. Fujiwara, and T. van Ypersele. 2011. “Competition Builds Trust. Working
Paper. ”
Frankhauser, A. 2009. “Mediationsakte”. Historisches Lexikon der Schweiz (12 August).
Frey, B. S. 1998. “Institutions and Morale: The Crowding-out Effect.” In A. Ben-Ner and L.
Putterman (eds.), Economics, Values, and Organization, 437-460. New York: Cambridge
University Press.
Frey, B. S., and S. Meier. 2004. “Social Comparisons and Pro-social Behavior: Testing
“Conditional Cooperation” in a Field Experiment.” American Economic Review, 94, 1717-
1722.
Galor, O. and Özak, O. 2016. “The Agricultural Origins of Time Preferences.”American
Economic Review, 106, 3064-3103.
Gasser, A. 1932. Die Territoriale Entwicklung der Schweizerischen Eidgenossenschaft 1291-
1797. Aarau: Sauerlaender.
Giles, H. and P. Johnson. 1987. “Ethnolinguistic Identity Theory: A Social Psychological
Approach to Language Maintenance.” International Journal of the Sociology of Language,
68, 69–99.
Grossjean, P. 2014. “A History of Violence: The Culture of Honor and Homicide in the US
South.” Journal of the European Economic Association, 12, 1285-1316.
Guiso, L., P. Sapienza, and L. Zingales. 2011. “Civic Capital as the Missing Link”, In J.
Benhabib, A. Bisin, and M. Jackson (eds.), Handbook of Social Economics, Volume 1A, 339-
416. The Netherlands: North-Holland.
Guiso, L., P. Sapienza, and L. Zingales. 2016. “Long Term Persistence.” Journal of the
European Economic Association, 14(6), 1401-1436.
Gumperz, J. J. 1982. Language and Social Identity. Cambridge: Cambridge University
Press.
Heinemann, H. 2003. “Friedrich II”, Historical Lexicon of Switzerland (May 19).
Herrmann, B. and C. Thöni. 2009. “Measuring Conditional Cooperation: A Replication
Study in Russia.” Experimental Economics, 12, 87-92.
Holdener, V., F. Hürzeler, T. Rühl, A. Schnell, and N. Sydow. 2013. “Locational Quality
of the Swiss Cantons and Regions.” Credit Suisse Global Research. Special Issues Regions,
September.
36
Holenstein, A. 2014. “Räte”. Historisches Lexikon der Schweiz (9 December).
Jha, S. 2013. “Trade, Institutions and Ethnic Tolerance: Evidence from South Asia.”
American Political Science Review, 107, 806-832.
Kamm, R. 2017. “Glarus (Kanton): Kommunale Bewegung und Staatlichkeit”, Section
2.2.4, Historisches Lexikon der Schweiz (30 May).
Knack, S. and P. Keefer. 1997. “Does Social Capital Have an Economic Payoff? A Cross-
Country Investigation.” Quarterly Journal of Economics, 112, 1251-1288.
Kocher, M. G., T. Cherry, S. Kroll, R. J. Netzer, and M. Sutter. 2008. “Conditional
Cooperation on Three Continents.” Economics Letters, 101, 175-178.
Kosfeld, M., and D. Rustagi. 2015. “Leader Punishment and Cooperation in Groups:
Experimental Field Evidence from Commons Management in Ethiopia.” American
Economic Review, 105, 747-783.
Landolt, O. 2017a. “Schwyz (Kanton): Die Entstehung des Landes Schwyz”, Section 2.2,
Historisches Lexikon der Schweiz (26 June).
Landolt, O. 2017b. “Schaffhausen (Gemeinde): Herrschaft, Politik, und Verfassung vom
Hochmittelalter bis zum Ende des 18 Jahrhundert”, Section 2, Historisches Lexikon der
Schweiz (26 June).
Lowes, S., N. Nathan, J. A. Robinson, and J. Weigel. 2017. “The Evolution of Culture and
Institutions: Evidence from the Kuba Kingdom,” Econometrica, 85(4), 1065-1091.
McCrackan, W. D. 1908. The Rise of the Swiss Republic: A History. New York: Henry Holt
and Company.
Nunn, N., and L. Wantchekon. 2011. “The Slave Trade and the Origins of Mistrust in
Africa.” American Economic review, 101, 3221-3252.
Oster, E. 2016. “Unobservable Selection and Coefficient Stability: Theory and Evidence,”
Journal of Business & Economic Statistics, 1-18.
Ostrom, E., J. Burger, C. B. Field, R. B. Norgaard, and D. Policansky. 1999. “Revisiting
the Commons: Local Lessons, Global Challenges.” Science, 284, 278-282.
Platteau, J.-P. 2000. Institutions, Social Norms, and Economic Development. Academic
Publishers & Routledge.
Putnam, R., R. Leonardi, and R. Y. Nanetti. 1993. Making Democracy Work: Civic
Traditions in Modern Italy. New York: Simon & Schuster.
Putzger. 2004. Historischer Weltatlas, Schweizer Ausgabe, Berlin.
Rodrik, D. 2000. “Do Democratic Transitions Produce Bad Economic Outcomes.” American
Economic Review Papers and Proceedings, 95, 50-55.
37
Rustagi, D., S. Engel, and M. Kosfeld. 2010. “Conditional Cooperation and Costly
Monitoring Explain Success in Forest Commons Management.” Science, 330, 961-965.
Schelbert, L. 2014. Historical Dictionary of Switzerland. Second Edition. Rowman &
Littlefield, UK..
Schultheiss, M. 2015. “Zürich (Gemeinde): Die Stadt wird Selbständig”, Section 2.1,
Historisches Lexikon der Schweiz (25 January).
Sobel, J. 2005. “Interdependent Preferences and Reciprocity”. Journal of Economic
Literature, XLIII, 392-436.
Stadler, H. 2008. “Landsgemeinde” Historisches Lexikon der Schweiz (11 November).
Stadler, H. 2011. “Schöllenen”. Historisches Lexikon der Schweiz (11 April).
Stadler, H. 2017. “Uri (Kanton): Die Entstehung des Landes Uri und die Eidgenossenschaft
im Spätemittelater”, Section 2.2, Historisches Lexikon der Schweiz (22 May).
Stutzer, A. 1999. “Demokratienindizes für die Kantone der Schweiz.” Working Paper 23,
University of Zurich.
Suter, M. 2017. “Zürich (Kanton): Herrschaft, Politik, und Verfassung vom Hochmittelalter
bis zum Ende des 18 Jahrhundert”, Section 2, Historisches Lexikon der Schweiz (30 May).
Sutter, M., S. Haigner, and M. Kocher. 2010. “Choosing the Carrot or the Stick:
Endogenous Institutional Choice in Social Dilemma Situations.” Review of Economic
Studies, 77, 1540-1566.
Tabellini, G. 2010. “Culture and Institutions: Economic Development in the Regions of
Europe.” Journal of the European Economic Association, 8, 677-716.
Uslaner, E. 2003. “Trust, Democracy and Governance: Can Government Policies Influence
Generalized Trust?” In M. Hooghe and D. Stolle (eds.), Generating Social Capital: Civil
Society and Institutions in Comparative Perspective, Houndmills: Palgrave Macmillan.
Voigtländer, N., and H. J. Voth. 2012. “Persecution Perpetuated: The Medieval Origins of
Anti-Semitic Violence in Nazi Germany.” Quarterly Journal of Economics, 127, 1339-1392.
Zahnd, U. M. 2017. Bern (Kanton): Kommunale Bewegung und Territorialbildung im
Spätemittelalter”, Section 2.2, Historisches Lexikon der Schweiz (29 May).
Zschokke, H. 1860. History of Switzerland. Translated by Shaw, F.G. New York: Hurst and
Company Publishers.
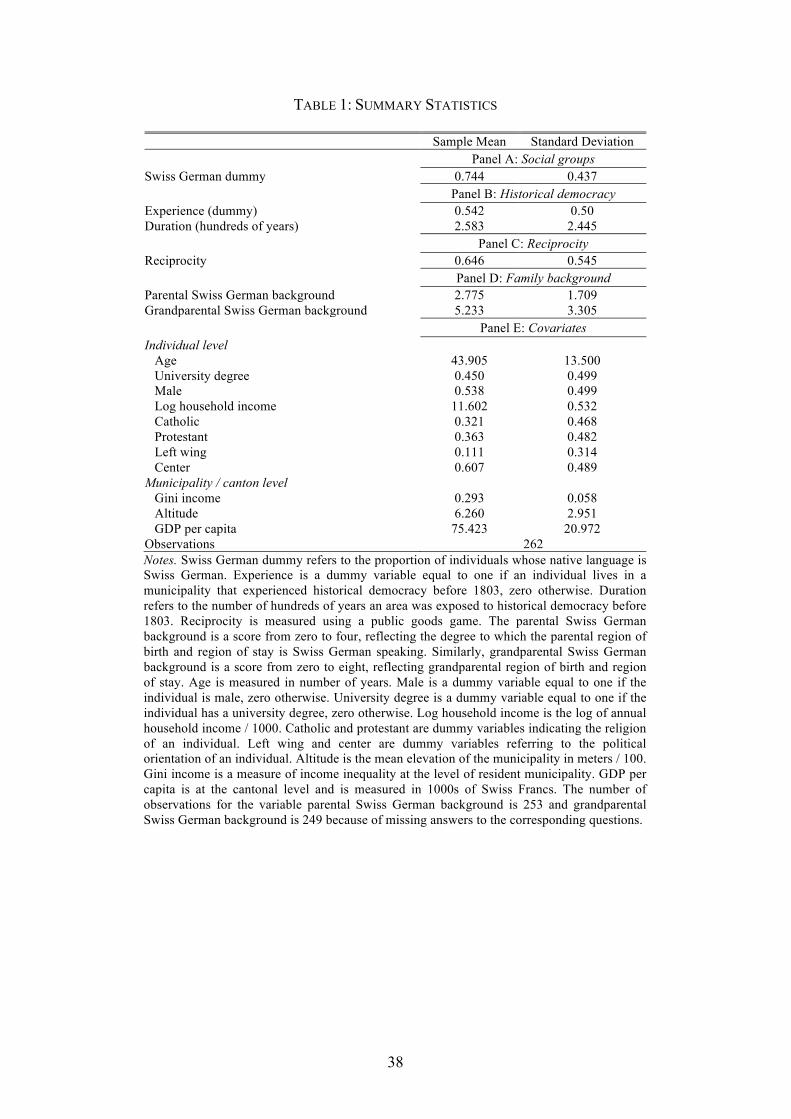
38
TABLE 1: SUMMARY STATISTICS
Sample Mean Standard Deviation Panel A: Social groups Swiss German dummy 0.744 0.437 Panel B: Historical democracy Experience (dummy) 0.542 0.50 Duration (hundreds of years) 2.583 2.445 Panel C: Reciprocity Reciprocity 0.646 0.545 Panel D: Family background Parental Swiss German background 2.775 1.709 Grandparental Swiss German background 5.233 3.305 Panel E: Covariates Individual level Age 43.905 13.500 University degree 0.450 0.499 Male 0.538 0.499 Log household income 11.602 0.532 Catholic 0.321 0.468 Protestant 0.363 0.482 Left wing 0.111 0.314 Center 0.607 0.489 Municipality / canton level Gini income 0.293 0.058 Altitude 6.260 2.951 GDP per capita 75.423 20.972 Observations 262 Notes. Swiss German dummy refers to the proportion of individuals whose native language is Swiss German. Experience is a dummy variable equal to one if an individual lives in a municipality that experienced historical democracy before 1803, zero otherwise. Duration refers to the number of hundreds of years an area was exposed to historical democracy before 1803. Reciprocity is measured using a public goods game. The parental Swiss German background is a score from zero to four, reflecting the degree to which the parental region of birth and region of stay is Swiss German speaking. Similarly, grandparental Swiss German background is a score from zero to eight, reflecting grandparental region of birth and region of stay. Age is measured in number of years. Male is a dummy variable equal to one if the individual is male, zero otherwise. University degree is a dummy variable equal to one if the individual has a university degree, zero otherwise. Log household income is the log of annual household income / 1000. Catholic and protestant are dummy variables indicating the religion of an individual. Left wing and center are dummy variables referring to the political orientation of an individual. Altitude is the mean elevation of the municipality in meters / 100. Gini income is a measure of income inequality at the level of resident municipality. GDP per capita is at the cantonal level and is measured in 1000s of Swiss Francs. The number of observations for the variable parental Swiss German background is 253 and grandparental Swiss German background is 249 because of missing answers to the corresponding questions.

39
TABLE 2: SOCIAL GROUPS AND RECIPROCITY
Dependent variable: Reciprocity No controls
(1)
Individual controls
(2)
Full set of controls
(3) Swiss German 0.319*** 0.316*** 0.291*** (0.070) (0.069) (0.068) [0.000] [0.000] [0.000] Individual controls No Yes Yes Municipal controls No No Yes GDP per capita No No Yes Observations 262 262 262 R-squared 0.07 0.10 0.11 Notes. OLS coefficients with robust standard errors clustered at the cantonal level in parentheses. Square brackets report p-values from the wild cluster bootstrap procedure proposed by Cameron et al. (2008) with 1,000 replications. Table A7 in Appendix A reports coefficients on covariates. *** indicate significance at the 1% level.
TABLE 3: SOCIAL GROUPS AND RECIPROCITY: FALSIFICATION TEST
Dependent variable: Reciprocity
Swiss French and Swiss Germans from municipalities without historical democracy
(1)
Swiss French from municipalities without but Swiss Germans with
historical democracy (2)
Swiss German 0.042 0.507*** (0.095) (0.061)
[0.637] [0.000] Individual controls Yes Yes Municipal controls Yes Yes GDP per capita Yes Yes Observations 120 152 Number of cantons 14 14 R-squared 0.15 0.28 Notes. OLS coefficients with robust standard errors clustered at the cantonal level in parentheses. Square brackets report p-values from the wild cluster bootstrap procedure proposed by Cameron et al. (2008). Column 1 compares differences in reciprocity across Swiss Germans and Swiss French from municipalities without historical democracy. Column 2 replaces Swiss Germans from municipalities without historical democracy with Swiss Germans from municipalities with historical democracy but from the same canton. Individual and municipal level controls include the variables listed in Panel E of Table 1. *** indicates significance at the 1% level.

40
TABLE 4: HISTORICAL DEMOCRACY AND RECIPROCITY
Dependent variable: Reciprocity No
controls (1)
Individual controls
(2)
Municipal controls
(3)
Share of foreigners
(4)
Comp. index
(5)
Unemploy-ment 1888
(6)
Schooling 1888 (7)
Modern democracy
(8) Panel A: Experience
Historical democracy 0.410*** (0.045) [0.000] {0.064}
0.405*** (0.055) [0.000] {0.070}
0.424*** (0.056) [0.000] {0.070}
0.433*** (0.062) [0.000] {0.074}
0.396*** (0.056) [0.000] {0.069}
0.407*** (0.057) [0.000] {0.074}
0.416*** (0.061) [0.000] {0.074}
0.409*** (0.055) [0.000] {0.068}
Share of foreigners 0.002 (0.004)
Competition index 0.056*** (0.019)
Unemployment 1888 -2.468** (0.969)
Primary school 1888 0.141 (0.170)
Secondary school 1888 0.325 (0.429)
Modern democracy 0.028* (0.014)
R-squared 0.14 0.16 0.19 0.19 0.20 0.20 0.19 0.19 Panel A: Duration Historical democracy 0.085***
(0.008) [0.000] {0.013}
0.084*** (0.011) [0.000] {0.015}
0.089*** (0.011) [0.000] {0.014}
0.091*** (0.012) [0.000] {0.015}
0.084*** (0.011) [0.000] {0.014}
0.086*** (0.011) [0.000] {0.015}
0.087*** (0.012) [0.000] {0.015}
0.086*** (0.010) [0.000] {0.014}
Share of foreigners 0.003 (0.004)
Competition index 0.046** (0.018)
Unemployment 1888 -2.193* (1.091)
Primary school 1888 0.068 (0.176)
Secondary school 1888 0.196 (0.448)
Modern democracy 0.034** (0.013)
R-squared 0.14 0.17 0.20 0.20 0.20 0.20 0.20 0.20 Individual controls No Yes Yes Yes Yes Yes Yes Yes Municipal controls No No Yes Yes Yes Yes Yes Yes GDP per capita No No Yes Yes Yes Yes Yes Yes Observations 262 262 262 262 262 262 262 262 Notes. OLS coefficients with robust standard errors clustered at the cantonal level in parentheses. We additional report in square brackets p-values from wild cluster bootstrap procedure (Cameron et al. 2008) and in curly brackets standard errors adjusted for spatial clustering with a threshold of 100 Km (Conley 1999). Our results are robust to alternative thresholds at 10, 25, 50, and 200 km. Columns 4-8 introduce additional controls at the cantonal level. These are current share of foreigners in column 4 and competition index in column 5; unemployment rate in 1888 in column 6, school enrollment in 1888 in column 7, and index of modern democracy in column 8. Data on share of foreigners, unemployment rate and school enrollment in 1888 are from the Swiss Federal Statistical Office, and on competition index by Credit Suisse (see Holdener 2013). The index of modern democracy is from 2003. It varies from one to six and is based on studies by Stutzer (1999) and Fischer (2009). Individual and municipal controls include the variables in Panel E of Table 1. Tables A14a-b in Appendix A report coefficients on covariates. ***, **, * indicate significance at the 1%, 5%, and 10% levels, respectively.
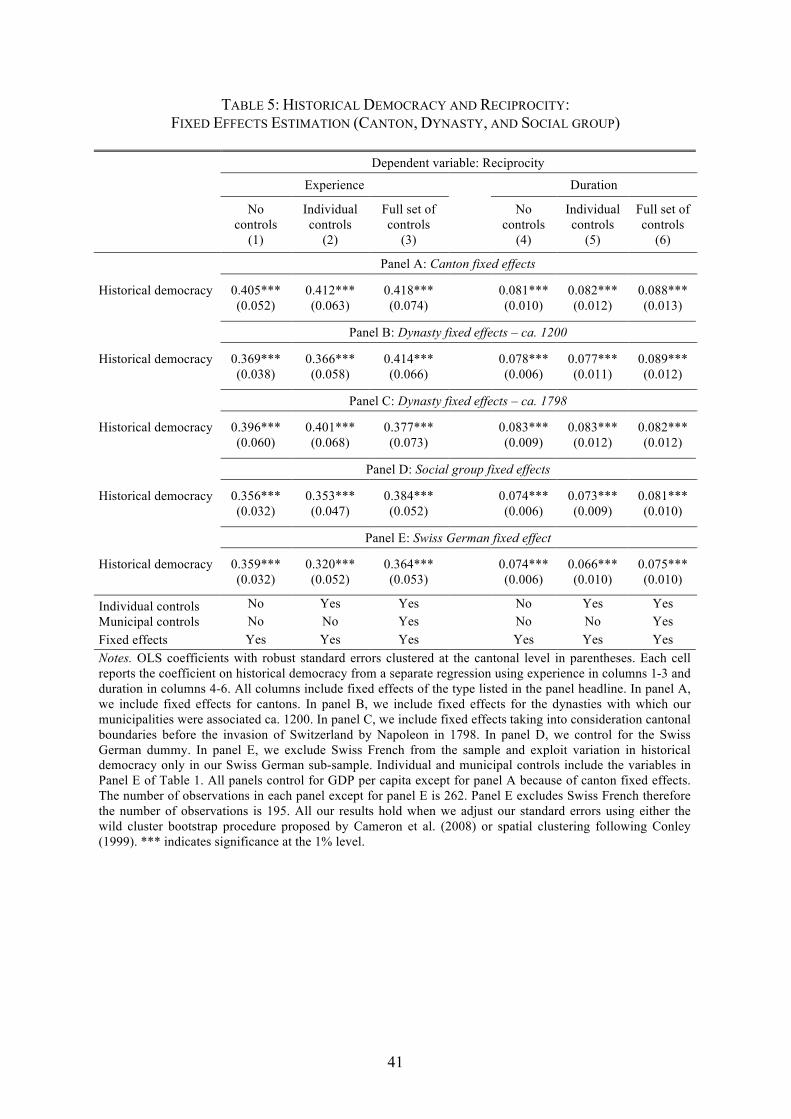
41
TABLE 5: HISTORICAL DEMOCRACY AND RECIPROCITY: FIXED EFFECTS ESTIMATION (CANTON, DYNASTY, AND SOCIAL GROUP)
Dependent variable: Reciprocity
Experience Duration
No controls
(1)
Individual controls
(2)
Full set of controls
(3)
No controls
(4)
Individual controls
(5)
Full set of controls
(6) Panel A: Canton fixed effects
Historical democracy 0.405*** 0.412*** 0.418*** 0.081*** 0.082*** 0.088*** (0.052) (0.063) (0.074) (0.010) (0.012) (0.013)
Panel B: Dynasty fixed effects – ca. 1200
Historical democracy 0.369*** 0.366*** 0.414*** 0.078*** 0.077*** 0.089*** (0.038) (0.058) (0.066) (0.006) (0.011) (0.012)
Panel C: Dynasty fixed effects – ca. 1798
Historical democracy 0.396*** 0.401*** 0.377*** 0.083*** 0.083*** 0.082*** (0.060) (0.068) (0.073) (0.009) (0.012) (0.012)
Panel D: Social group fixed effects
Historical democracy 0.356*** 0.353*** 0.384*** 0.074*** 0.073*** 0.081*** (0.032) (0.047) (0.052) (0.006) (0.009) (0.010)
Panel E: Swiss German fixed effect
Historical democracy 0.359*** 0.320*** 0.364*** 0.074*** 0.066*** 0.075*** (0.032) (0.052) (0.053) (0.006) (0.010) (0.010)
Individual controls No Yes Yes No Yes Yes Municipal controls No No Yes No No Yes Fixed effects Yes Yes Yes Yes Yes Yes Notes. OLS coefficients with robust standard errors clustered at the cantonal level in parentheses. Each cell reports the coefficient on historical democracy from a separate regression using experience in columns 1-3 and duration in columns 4-6. All columns include fixed effects of the type listed in the panel headline. In panel A, we include fixed effects for cantons. In panel B, we include fixed effects for the dynasties with which our municipalities were associated ca. 1200. In panel C, we include fixed effects taking into consideration cantonal boundaries before the invasion of Switzerland by Napoleon in 1798. In panel D, we control for the Swiss German dummy. In panel E, we exclude Swiss French from the sample and exploit variation in historical democracy only in our Swiss German sub-sample. Individual and municipal controls include the variables in Panel E of Table 1. All panels control for GDP per capita except for panel A because of canton fixed effects. The number of observations in each panel except for panel E is 262. Panel E excludes Swiss French therefore the number of observations is 195. All our results hold when we adjust our standard errors using either the wild cluster bootstrap procedure proposed by Cameron et al. (2008) or spatial clustering following Conley (1999). *** indicates significance at the 1% level.
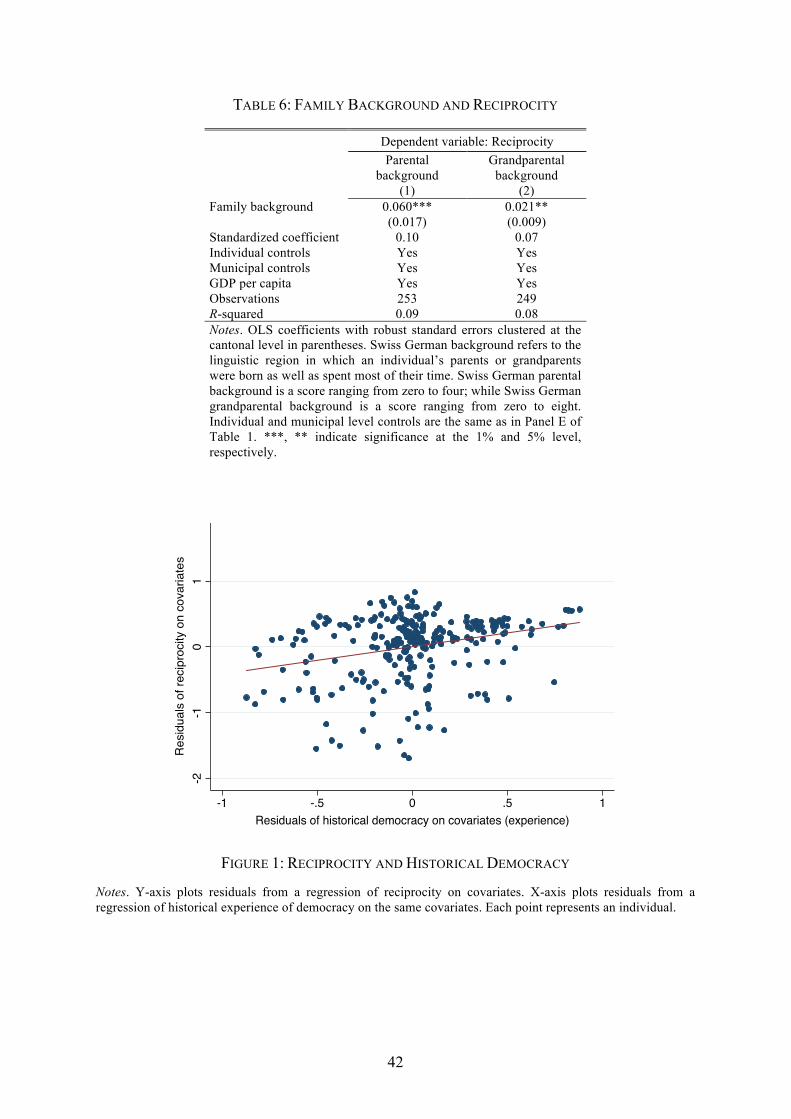
42
TABLE 6: FAMILY BACKGROUND AND RECIPROCITY
Dependent variable: Reciprocity Parental
background (1)
Grandparental background
(2) Family background 0.060*** 0.021**
(0.017) (0.009) Standardized coefficient 0.10 0.07 Individual controls Yes Yes Municipal controls Yes Yes GDP per capita Yes Yes Observations 253 249 R-squared 0.09 0.08 Notes. OLS coefficients with robust standard errors clustered at the cantonal level in parentheses. Swiss German background refers to the linguistic region in which an individual’s parents or grandparents were born as well as spent most of their time. Swiss German parental background is a score ranging from zero to four; while Swiss German grandparental background is a score ranging from zero to eight. Individual and municipal level controls are the same as in Panel E of Table 1. ***, ** indicate significance at the 1% and 5% level, respectively.
FIGURE 1: RECIPROCITY AND HISTORICAL DEMOCRACY
Notes. Y-axis plots residuals from a regression of reciprocity on covariates. X-axis plots residuals from a regression of historical experience of democracy on the same covariates. Each point represents an individual.
-2-1
01
2R
esid
uals
of r
ecip
roci
ty o
n co
varia
tes
-1 -.5 0 .5 1Residuals of historical democracy on covariates (experience)

43
FIGURE 2A FIGURE 2B
FIGURE 2: RECIPROCITY BY HISTORICAL DEMOCRACY AND SOCIAL GROUPS
Notes. Y-axis plots reciprocity, measured as the Spearman correlation between self and other players’ contribution in the conditional decision of the public goods game.
FIGURE 3: GEOGRAPHICAL DISTRIBUTION OF SWITZERLAND’S OFFICIAL LANGUAGES Source: Swiss Federal Statistical Office (2000)
0.2
.4.6
.81
Rec
ipro
city
0 1Historical democracy (experience)
0.2
.4.6
.81
Rec
ipro
city
Swiss German Swiss French
! 1
ONLINE APPENDIX
WAITING FOR NAPOLEON?
DEMOCRACY AND RECIPROCITY
ACROSS SOCIAL GROUPS
DEVESH RUSTAGI AND MARCELLA VERONESI
APPENDIX A
I. SAMPLE CONSTRUCTION AND DESCRIPTION
We highlight below the representativeness of our sample at both individual and municipal level.
A. Scope of selection at the individual level
We contacted 1,003 Swiss individual households to take part in our online experiment.1 These
individuals were randomly selected from within each of the three main linguistic groups and the
26 cantons of Switzerland by the institute for opinion research LINK. Of these, 303 individuals
completed our study implying a response rate of 30 percent. We test for the scope of selection by
comparing individuals that did and did not take part in our study along a number of important
covariates. Because our focus is on Swiss Germans and Swiss French we conduct this analysis
by dropping Swiss Italians altogether. This should not affect our results because individuals were
randomly selected from within a linguistic group and Swiss Italians are confined to the canton of
Ticino.2 This leaves us with a final sample of 262 individuals who participated in our study and
627 individuals who did not. Table A1 reports in columns 1-2 the mean of each covariate for
these two groups of individuals. Column 3 reports p-values of the difference estimated using a
regression of socio-demographic characteristics on a dummy variable for participation. It is !!!!!!!!!!!!!!!!!!!!!!!!!!!!!!!!!!!!!!!!!!!!!!!!!!!!!!!!1 According to the Swiss Federal Statistical Office (2014), 84 percent of adult German speakers and 82 percent of adult French speakers used Internet in the first quarter of 2014. However, the shares are 100 percent if adult population only up to the age of 50 years is considered. 2 Nonetheless the results do not change even if we include Swiss Italians in the analysis.

! 2
evident from the table that there are no differences in these characteristics across participants and
non-participants mitigating the selection concern.
TABLE A1: SAMPLE COMPARISON AT THE INDIVIDUAL LEVEL
Participants Mean (s.d.)
Non-participants Mean (s.d.) p-value
(1) (2) (3) Age 41.905 40.793 0.267
(13.500) (15.158)
University degree 0.450 0.367 0.139
(0.498) (0.482)
Male 0.538 0.493 0.273
(0.499) (0.500)
Income 125.031 123.895 0.783
(65.161) (72.290)
Catholic 0.321 0.365 0.189
(0.468) (0.482)
Protestant 0.363 0.349 0.656
(0.482) (0.477)
Left wing 0.111 0.094 0.229
(0.314) (0.292)
Centre 0.607 0.603 0.865
(0.489) (0.490)
Gini income 0.293 0.297 0.401 (0.058) (0.065) Altitude 6.260 6.475 0.315 (2.951) (3.264) GDP 75.429 74.215 0.298 (20.968) (18.393) Observations 262 627 Notes. Columns 1-2 report the mean and the standard deviation (s.d.) of the socio-demographic characteristics for the sub-sample of individuals that agreed to participate in our study and those who did not. Column 3 reports p-values from an OLS regression of each socio-demographic characteristic on a dummy variable for participation. Standard errors are estimated using the wild cluster bootstrap procedure (Cameron et al. 2008).

! 3
B. Scope of selection at the individual level within linguistic groups
We also consider the scope of selection within a linguistic group by comparing participants and
non-participants within groups. Table A2 reports the p-value from an OLS regression of socio-
demographic characteristics on a dummy variable for participation within a linguistic group.
With the exceptions of left wing (significant at the 5% level) and Gini coefficient of income
inequality (significant at the 10% level) in the sub-sample of Swiss French, all other differences
are statistically insignificant.
TABLE A2: SAMPLE COMPARISON AT THE INDIVIDUAL LEVEL BY SOCIAL GROUPS
Swiss Germans Swiss French (1) (2)
Age 0.327 0.659
University degree 0.239 0.106
Male 0.102 0.461
Income 0.821 0.964
Catholic 0.281 0.649
Protestant 0.703 0.193
Left wing 0.394 0.027
Centre 0.153 0.151
Gini income 0.731 0.079
Altitude 0.377 0.884
GDP 0.553 0.551
Observations 625 264
Notes. Columns 1-2 report p-values from an OLS regression of each socio-demographic characteristic on a dummy variable for participation. Standard errors are estimated using the wild cluster bootstrap procedure (Cameron et al. 2008).

! 4
C. Scope of selection at the municipal level
Since historical democracy is measured at the municipal level, we also test for selection at the
municipal level. Note that though the municipalities were randomly selected, not all individuals
from initially selected municipalities took part in the study. Therefore, in Table A3 we compare
participants’ municipalities in our sample with non-participants’ municipalities along a number
of important characteristics. The data for these characteristics were obtained using the Swiss
Federal Statistical Office. We find that there are no significant differences in municipality level
characteristics between the two groups.
TABLE A3: SAMPLE COMPARISON AT THE MUNICIPAL LEVEL
Participants’ municipalities
Mean (s.d.)
Non-participants’ municipalities
Mean (s.d.) p-value (1) (2) (3)
Age 20-64 61.824 61.530 0.227
(2.544) (2.720)
Tertiary degree 19.680 20.295 0.399
(6.531) (7.406)
Male 0.498 0.499 0.186
(0.012) (0.013)
Income 125.527 130.286 0.557
(62.144) (68.444)
Catholic 42.574 43.280 0.723
(22.617) (24.258)
Protestant 37.914 38.140 0.873
(21.881) (22.777)
Left wing 25.945 24.721 0.105
(11.357) (10.371)
Centre 39.625 40.139 0.655
(13.042) (12.627)
Gini income 0.285 0.290 0.473 (0.062) (0.071) Altitude 6.572 6.936 0.261 (3.322) (3.884) Observations 174 344 Notes. Columns 1-2 report at the municipal level the mean and the standard deviation (s.d.) of the socio-demographic characteristics for the municipalities of participants and non-participants. Column 3 reports p-values from an OLS regression of each socio-demographic characteristic on a dummy variable for participation. Standard errors are estimated using the wild cluster bootstrap procedure (Cameron et al. 2008). The total number of observations is 518 except for religion and age (512), education (502), male (497), and income (385) because of missing data for some municipalities. Data are from the Swiss Federal Statistical Office, except for income that is from wave 13 of the Swiss Household Panel. Note that we exclude GDP per capita because it is measured at the cantonal level.
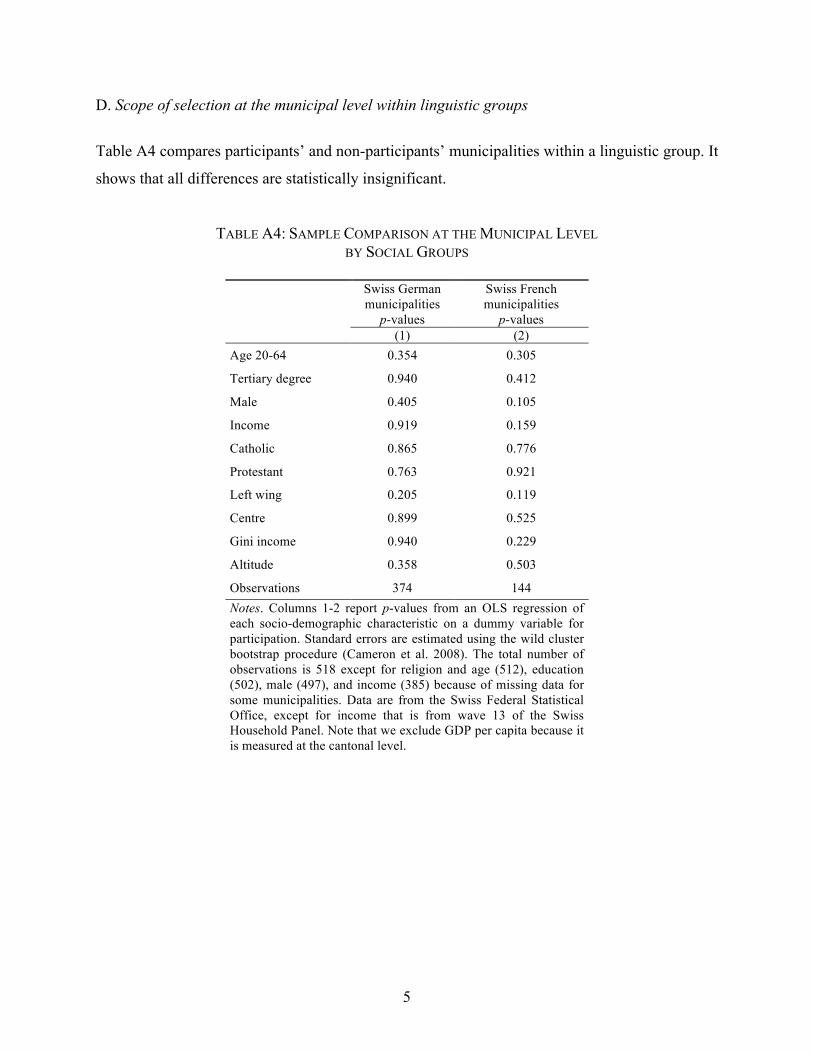
! 5
D. Scope of selection at the municipal level within linguistic groups
Table A4 compares participants’ and non-participants’ municipalities within a linguistic group. It
shows that all differences are statistically insignificant.
TABLE A4: SAMPLE COMPARISON AT THE MUNICIPAL LEVEL BY SOCIAL GROUPS
Swiss German municipalities
p-values
Swiss French municipalities
p-values (1) (2)
Age 20-64 0.354 0.305
Tertiary degree 0.940 0.412
Male 0.405 0.105
Income 0.919 0.159
Catholic 0.865 0.776
Protestant 0.763 0.921
Left wing 0.205 0.119
Centre 0.899 0.525
Gini income 0.940 0.229
Altitude 0.358 0.503
Observations 374 144 Notes. Columns 1-2 report p-values from an OLS regression of each socio-demographic characteristic on a dummy variable for participation. Standard errors are estimated using the wild cluster bootstrap procedure (Cameron et al. 2008). The total number of observations is 518 except for religion and age (512), education (502), male (497), and income (385) because of missing data for some municipalities. Data are from the Swiss Federal Statistical Office, except for income that is from wave 13 of the Swiss Household Panel. Note that we exclude GDP per capita because it is measured at the cantonal level.

! 6
E. Scope of selection at the municipal level – comparison with the Swiss Household Panel
We also verify that the municipalities in our sample are not only representative of the originally
randomly selected sample but also of wave 13 (year 2011) of the Swiss Household Panel. Table
A5 shows that there are not significant differences between the two samples.
TABLE A5: SAMPLE COMPARISON AT THE MUNICIPAL LEVEL USING SWISS HOUSEHOLD PANEL
Municipalities in our sample Mean (s.d.)
Municipalities in SHP sample
Mean (s.d.) p-value (1) (2) (3)
Age 48.765 48.533 0.851
(11.702) (13.024)
University degree 0.186 0.162 0.323
(0.293) (0.289)
Male 0.479 0.491 0.433
(0.256) (0.277)
Income 125.761 126.269 0.942
(60.468) (187.063)
Catholic 0.333 0.298 0.173
(0.346) (0.354)
Protestant 0.355 0.366 0.721
(0.335) (0.373)
Left wing 0.158 0.153 0.778
(0.226) (0.258)
Centre 0.179 0.162 0.527
(0.316) (0.300)
Gini income 0.285 0.284 0.880 (0.062) (0.069) Altitude 6.572 7.017 0.172 (3.322) (3.927) Observations 174 1,197 1,371 Notes. Columns 1-2 report the mean of the socio-demographic characteristics for the sample of municipalities in our final sample and in wave 13 of the Swiss Household Panel (SHP), respectively. Column 3 reports p-values from an OLS regression of each socio-demographic characteristic on a dummy variable equal to one if a municipality is in our sample, and zero if a municipality is in wave 13 of the Swiss Household Panel. Standard errors are estimated using the wild cluster bootstrap procedure (Cameron et al. 2008). Note that we exclude GDP per capita because it is measured at the cantonal level.

! 7
II. SOCIAL GROUPS AND HISTORICAL DEMOCRACY
Table A6 shows that Swiss Germans are much more likely to have the historical experience of
democracy and for a longer duration than Swiss French, even after controlling for covariates.
TABLE A6: SOCIAL GROUPS AND HISTORICAL DEMOCRACY
Dependent variable: Historical democracy Experience Duration (1) (2) Swiss German 0.491*** 2.300*** (0.096) (0.516) Other covariates Yes Yes Observations 262 262 R-squared 0.321 0.307 Notes. OLS coefficients with robust standard errors clustered at the cantonal level in parentheses. All columns include as “other covariates” age, education, male, log household income, catholic, protestant, left wing and center, altitude and Gini coefficient for income inequality at the municipal level, and GDP per capita at the cantonal level. These variables are described in panel E of Table 1 of the main paper. *** indicates significance at the 1% level.
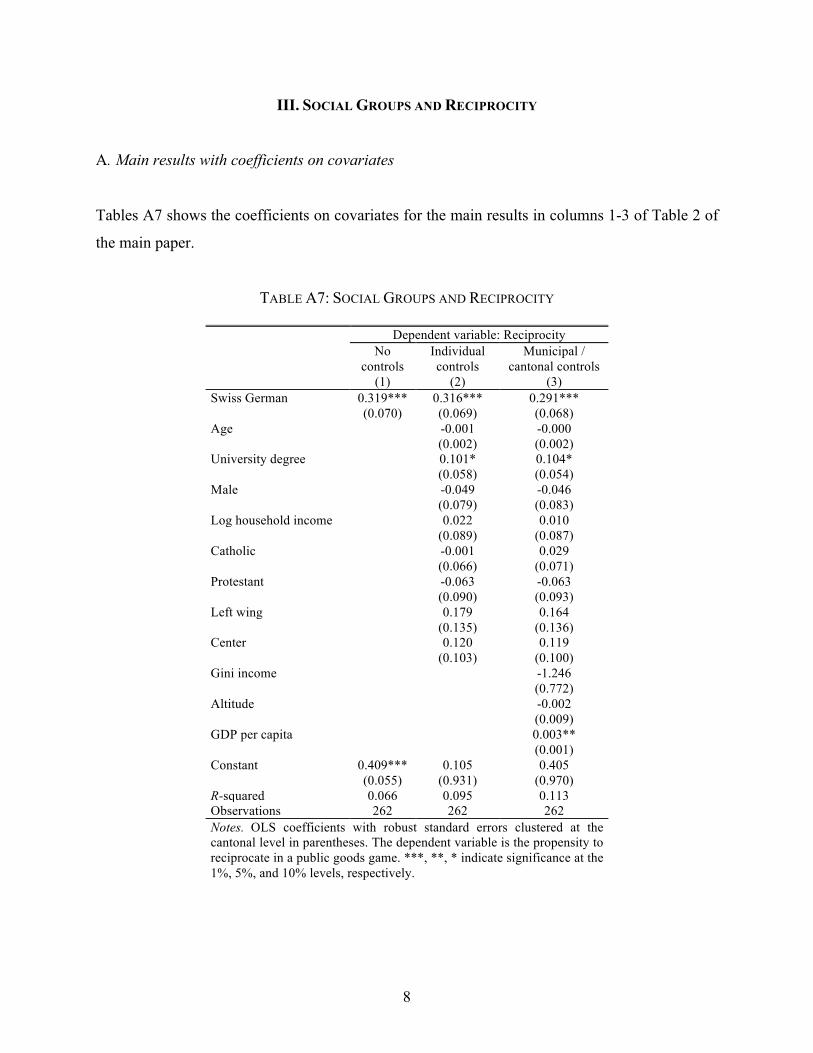
! 8
III. SOCIAL GROUPS AND RECIPROCITY
A. Main results with coefficients on covariates
Tables A7 shows the coefficients on covariates for the main results in columns 1-3 of Table 2 of
the main paper.
TABLE A7: SOCIAL GROUPS AND RECIPROCITY
Dependent variable: Reciprocity No
controls (1)
Individual controls
(2)
Municipal / cantonal controls
(3) Swiss German 0.319*** 0.316*** 0.291*** (0.070) (0.069) (0.068) Age -0.001 -0.000 (0.002) (0.002) University degree 0.101* 0.104* (0.058) (0.054) Male -0.049 -0.046 (0.079) (0.083) Log household income 0.022 0.010 (0.089) (0.087) Catholic -0.001 0.029 (0.066) (0.071) Protestant -0.063 -0.063 (0.090) (0.093) Left wing 0.179 0.164 (0.135) (0.136) Center 0.120 0.119 (0.103) (0.100) Gini income -1.246 (0.772) Altitude -0.002 (0.009) GDP per capita 0.003** (0.001) Constant 0.409*** 0.105 0.405 (0.055) (0.931) (0.970) R-squared 0.066 0.095 0.113 Observations 262 262 262 Notes. OLS coefficients with robust standard errors clustered at the cantonal level in parentheses. The dependent variable is the propensity to reciprocate in a public goods game. ***, **, * indicate significance at the 1%, 5%, and 10% levels, respectively.

! 9
B. Additional robustness checks
Tables A8-A12 present additional robustness checks that we conducted on the association
between social groups and reciprocity.
TABLE A8: SOCIAL GROUPS AND RECIPROCITY: ROBUSTNESS CHECKS
Dependent variable: Reciprocity Roestigraben
sample Drop
Roestigraben sample
Drop Zurich
Drop Geneva
(1) (2) (3) (4) Swiss German 0.538** 0.305*** 0.270*** 0.285*** (0.260) (0.063) (0.076) (0.076) Other covariates Yes Yes Yes Yes Observations 62 200 221 252 R-squared 0.273 0.169 0.095 0.113 Notes. OLS coefficients with robust standard errors clustered at the cantonal level in parentheses. The dependent variable is the propensity to reciprocate in a public goods game. Column 1 includes only Roestigraben cantons (Bern, Fribourg, and Valais). Column 2 excludes Roestigraben cantons. Columns 3 and 4 exclude the cantons of Zurich and Geneva, respectively. All columns include as “other covariates” age, education, male, log household income, catholic, protestant, left wing and center, altitude and Gini coefficient for income inequality at the municipal level, and GDP per capita at the cantonal level. These variables are described in panel E of Table 1 of the main paper. Column 1 also includes canton fixed effects and therefore excludes GDP per capita. It also excludes left wing orientation because of little variation within a canton. ***, ** indicate significance at the 1% and 5% levels, respectively.
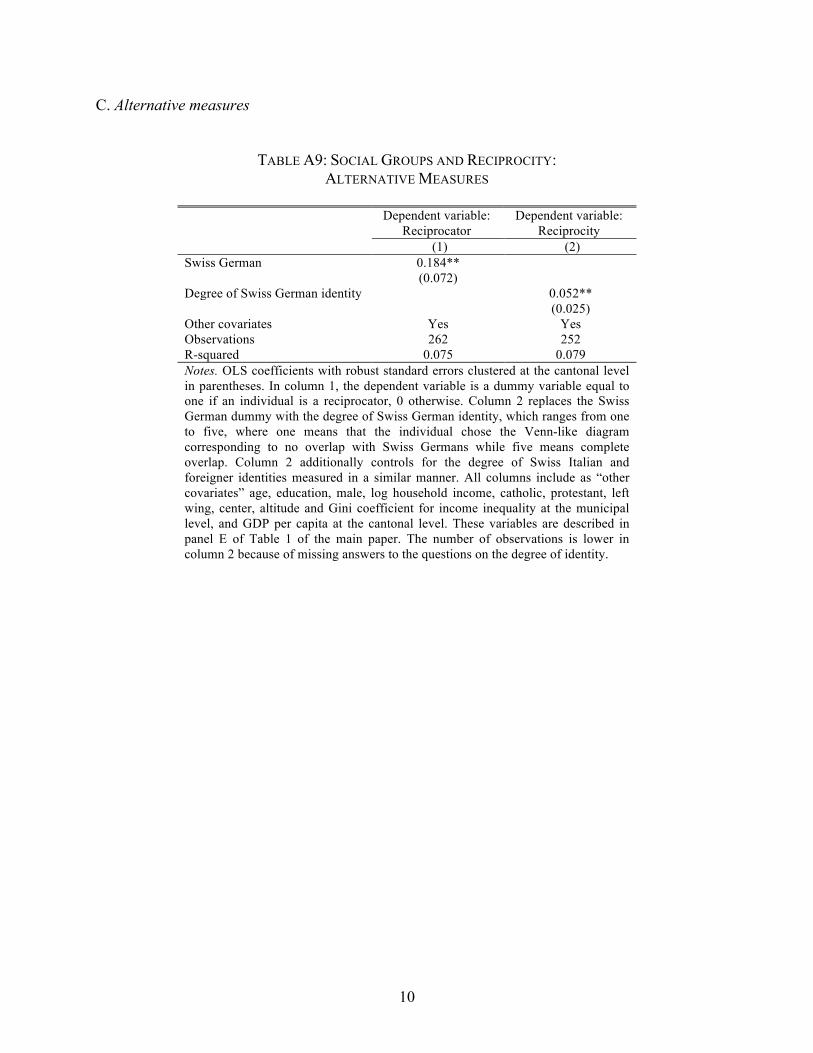
! 10
C. Alternative measures
TABLE A9: SOCIAL GROUPS AND RECIPROCITY: ALTERNATIVE MEASURES
Dependent variable:
Reciprocator Dependent variable:
Reciprocity (1) (2) Swiss German 0.184** (0.072) Degree of Swiss German identity 0.052** (0.025) Other covariates Yes Yes Observations 262 252 R-squared 0.075 0.079 Notes. OLS coefficients with robust standard errors clustered at the cantonal level in parentheses. In column 1, the dependent variable is a dummy variable equal to one if an individual is a reciprocator, 0 otherwise. Column 2 replaces the Swiss German dummy with the degree of Swiss German identity, which ranges from one to five, where one means that the individual chose the Venn-like diagram corresponding to no overlap with Swiss Germans while five means complete overlap. Column 2 additionally controls for the degree of Swiss Italian and foreigner identities measured in a similar manner. All columns include as “other covariates” age, education, male, log household income, catholic, protestant, left wing, center, altitude and Gini coefficient for income inequality at the municipal level, and GDP per capita at the cantonal level. These variables are described in panel E of Table 1 of the main paper. The number of observations is lower in column 2 because of missing answers to the questions on the degree of identity.
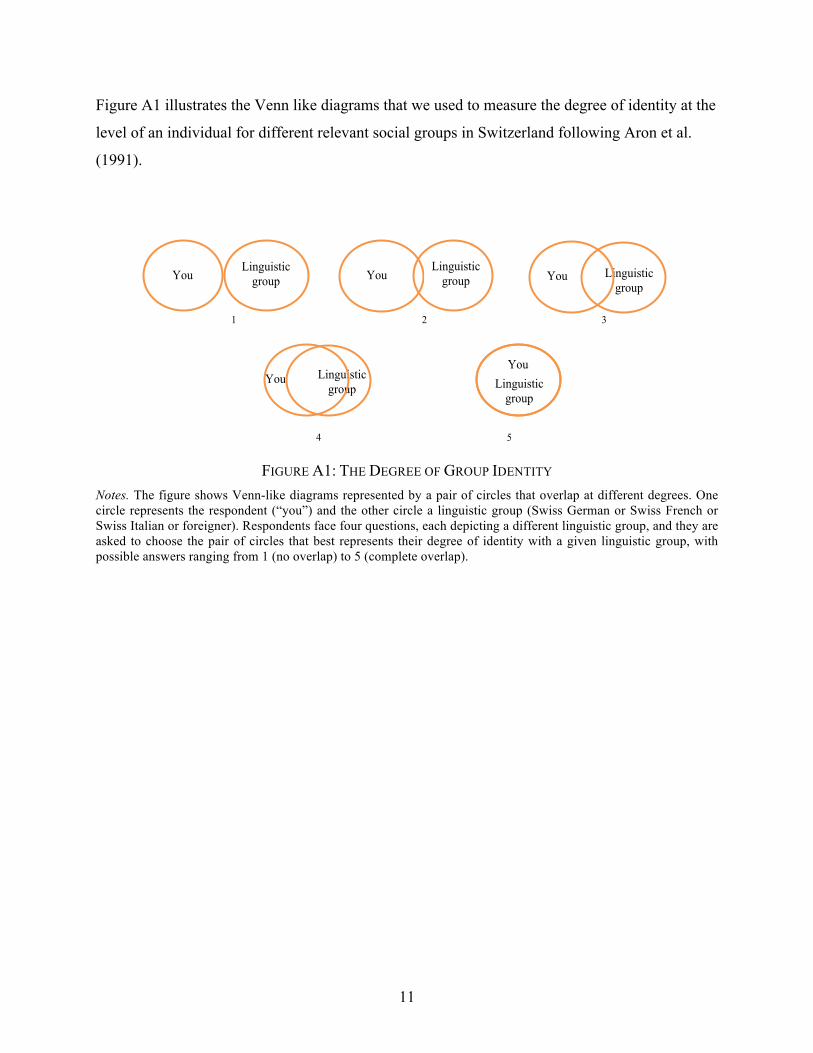
! 11
Figure A1 illustrates the Venn like diagrams that we used to measure the degree of identity at the
level of an individual for different relevant social groups in Switzerland following Aron et al.
(1991).
FIGURE A1: THE DEGREE OF GROUP IDENTITY
Notes. The figure shows Venn-like diagrams represented by a pair of circles that overlap at different degrees. One circle represents the respondent (“you”) and the other circle a linguistic group (Swiss German or Swiss French or Swiss Italian or foreigner). Respondents face four questions, each depicting a different linguistic group, and they are asked to choose the pair of circles that best represents their degree of identity with a given linguistic group, with possible answers ranging from 1 (no overlap) to 5 (complete overlap).
1 2 3
4 5
You Linguistic
group You Linguistic
group You Linguistic group
You Linguisticgroup
You Linguistic
group
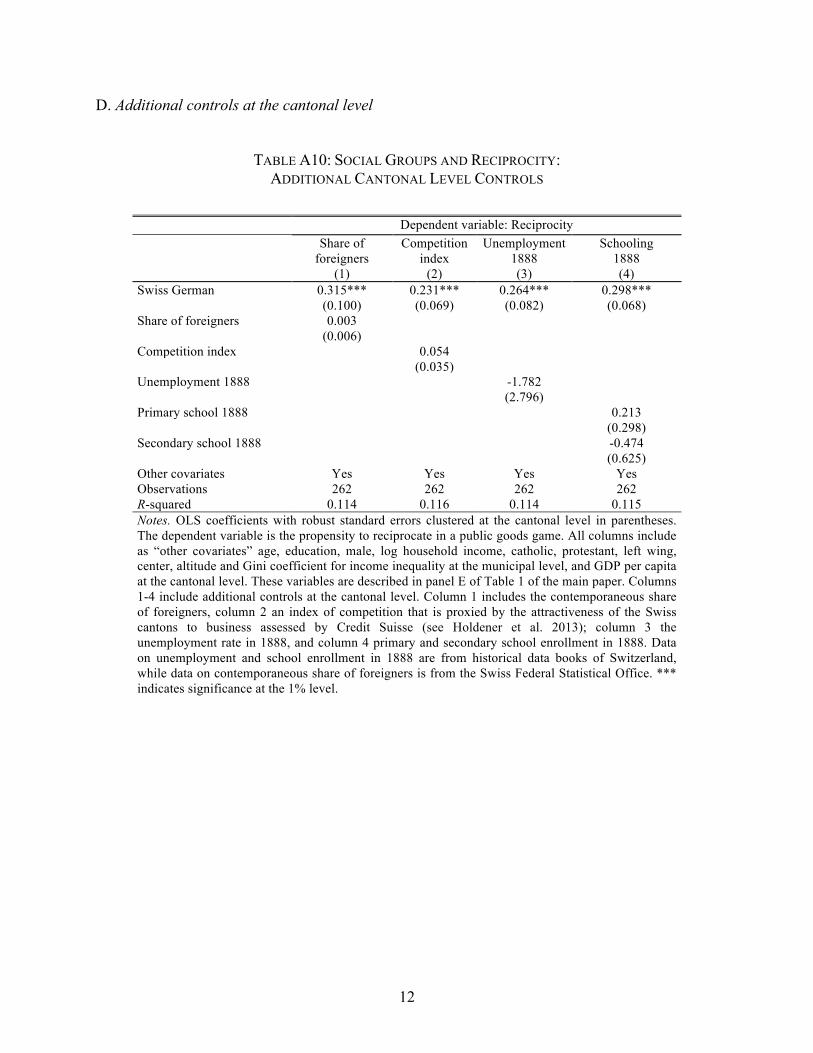
! 12
D. Additional controls at the cantonal level
TABLE A10: SOCIAL GROUPS AND RECIPROCITY:
ADDITIONAL CANTONAL LEVEL CONTROLS
Dependent variable: Reciprocity Share of
foreigners Competition
index Unemployment
1888 Schooling
1888 (1) (2) (3) (4) Swiss German 0.315*** 0.231*** 0.264*** 0.298*** (0.100) (0.069) (0.082) (0.068) Share of foreigners 0.003 (0.006) Competition index 0.054 (0.035) Unemployment 1888 -1.782 (2.796) Primary school 1888 0.213 (0.298) Secondary school 1888 -0.474 (0.625) Other covariates Yes Yes Yes Yes Observations 262 262 262 262 R-squared 0.114 0.116 0.114 0.115 Notes. OLS coefficients with robust standard errors clustered at the cantonal level in parentheses. The dependent variable is the propensity to reciprocate in a public goods game. All columns include as “other covariates” age, education, male, log household income, catholic, protestant, left wing, center, altitude and Gini coefficient for income inequality at the municipal level, and GDP per capita at the cantonal level. These variables are described in panel E of Table 1 of the main paper. Columns 1-4 include additional controls at the cantonal level. Column 1 includes the contemporaneous share of foreigners, column 2 an index of competition that is proxied by the attractiveness of the Swiss cantons to business assessed by Credit Suisse (see Holdener et al. 2013); column 3 the unemployment rate in 1888, and column 4 primary and secondary school enrollment in 1888. Data on unemployment and school enrollment in 1888 are from historical data books of Switzerland, while data on contemporaneous share of foreigners is from the Swiss Federal Statistical Office. *** indicates significance at the 1% level.

! 13
E. Additional controls at the municipal level
TABLE A11: HISTORICAL DEMOCRACY AND RECIPROCITY: ADDITIONAL MUNICIPAL LEVEL CONTROLS
Dependent variable: Reciprocity Share of
foreigners Competition
index Unemployment
rate Population
density 1850 (1) (2) (3) (4) Swiss German 0.293*** 0.229*** 0.346*** 0.294*** (0.074) (0.072) (0.069) (0.068) Share of foreigners 0.000 (0.002) Competition index 0.043 (0.031) Unemployment rate 0.024 (0.017) Population density 1850 -0.000 (0.000) Other covariates Yes Yes Yes Yes Observations 262 262 262 259 R-squared 0.113 0.117 0.115 0.114 Notes. OLS coefficients with robust standard errors clustered at the cantonal level in parentheses. The dependent variable is the propensity to reciprocate in a public goods game. All columns include as “other covariates” age, education, male, log household income, catholic, protestant, left wing and center, altitude and Gini coefficient for income inequality at the municipal level, and GDP per capita at the cantonal level These variables are described in panel E of Table 1 of the main paper. Columns 1-5 include additional controls at the municipal level. Column 1 includes the share of foreigners; column 2 includes an index of competition that is proxied by the attractiveness of the Swiss cantons to business assessed by Credit Suisse (see Holdener et al. 2013); column 3 includes unemployment rate today; and column 4 includes population density in 1850. The number of observations is lower in column 4 because of missing information on population density in 1850 for three municipalities. *** indicates significance at the 1% level.
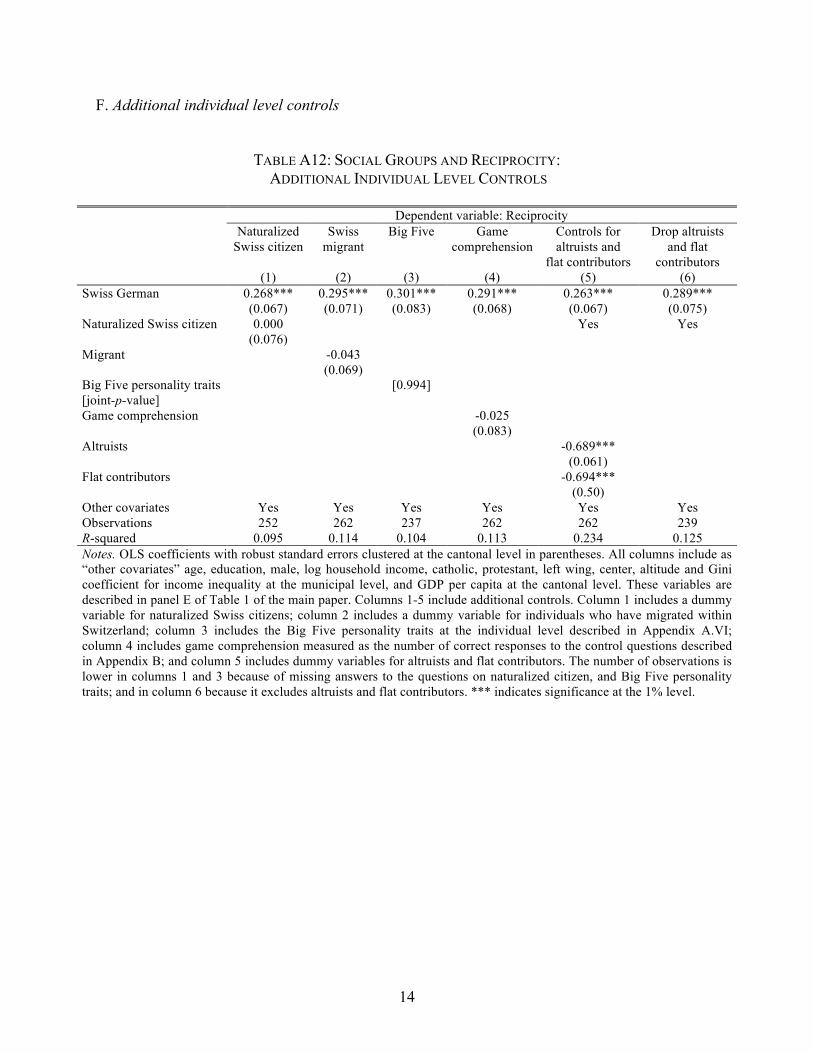
! 14
F. Additional individual level controls
TABLE A12: SOCIAL GROUPS AND RECIPROCITY: ADDITIONAL INDIVIDUAL LEVEL CONTROLS
Dependent variable: Reciprocity Naturalized
Swiss citizen Swiss
migrant Big Five Game
comprehension Controls for altruists and
flat contributors
Drop altruists and flat
contributors (1) (2) (3) (4) (5) (6) Swiss German 0.268*** 0.295*** 0.301*** 0.291*** 0.263*** 0.289*** (0.067) (0.071) (0.083) (0.068) (0.067) (0.075) Naturalized Swiss citizen 0.000 Yes Yes (0.076) Migrant -0.043 (0.069) Big Five personality traits [0.994] [joint-p-value] Game comprehension -0.025 (0.083) Altruists -0.689*** (0.061) Flat contributors -0.694*** (0.50) Other covariates Yes Yes Yes Yes Yes Yes Observations 252 262 237 262 262 239 R-squared 0.095 0.114 0.104 0.113 0.234 0.125 Notes. OLS coefficients with robust standard errors clustered at the cantonal level in parentheses. All columns include as “other covariates” age, education, male, log household income, catholic, protestant, left wing, center, altitude and Gini coefficient for income inequality at the municipal level, and GDP per capita at the cantonal level. These variables are described in panel E of Table 1 of the main paper. Columns 1-5 include additional controls. Column 1 includes a dummy variable for naturalized Swiss citizens; column 2 includes a dummy variable for individuals who have migrated within Switzerland; column 3 includes the Big Five personality traits at the individual level described in Appendix A.VI; column 4 includes game comprehension measured as the number of correct responses to the control questions described in Appendix B; and column 5 includes dummy variables for altruists and flat contributors. The number of observations is lower in columns 1 and 3 because of missing answers to the questions on naturalized citizen, and Big Five personality traits; and in column 6 because it excludes altruists and flat contributors. *** indicates significance at the 1% level.
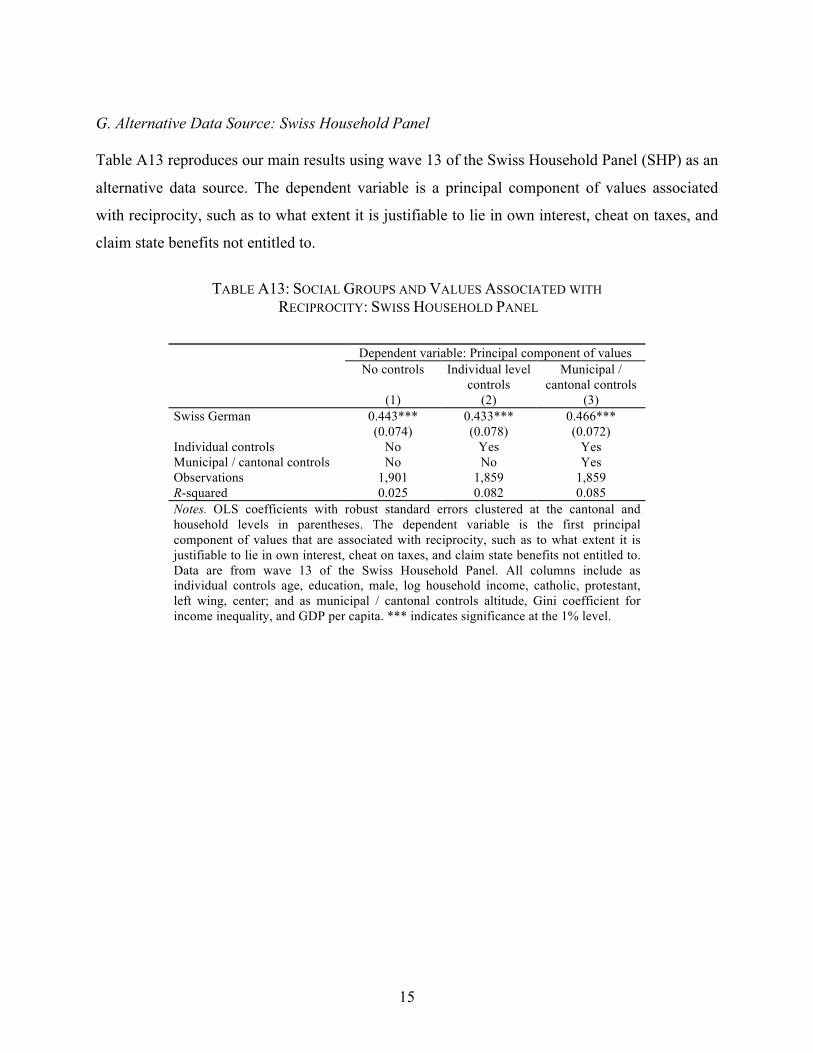
! 15
G. Alternative Data Source: Swiss Household Panel Table A13 reproduces our main results using wave 13 of the Swiss Household Panel (SHP) as an
alternative data source. The dependent variable is a principal component of values associated
with reciprocity, such as to what extent it is justifiable to lie in own interest, cheat on taxes, and
claim state benefits not entitled to.
TABLE A13: SOCIAL GROUPS AND VALUES ASSOCIATED WITH
RECIPROCITY: SWISS HOUSEHOLD PANEL
Dependent variable: Principal component of values No controls Individual level
controls Municipal /
cantonal controls (1) (2) (3) Swiss German 0.443*** 0.433*** 0.466*** (0.074) (0.078) (0.072) Individual controls No Yes Yes Municipal / cantonal controls No No Yes Observations 1,901 1,859 1,859 R-squared 0.025 0.082 0.085 Notes. OLS coefficients with robust standard errors clustered at the cantonal and household levels in parentheses. The dependent variable is the first principal component of values that are associated with reciprocity, such as to what extent it is justifiable to lie in own interest, cheat on taxes, and claim state benefits not entitled to. Data are from wave 13 of the Swiss Household Panel. All columns include as individual controls age, education, male, log household income, catholic, protestant, left wing, center; and as municipal / cantonal controls altitude, Gini coefficient for income inequality, and GDP per capita. *** indicates significance at the 1% level.
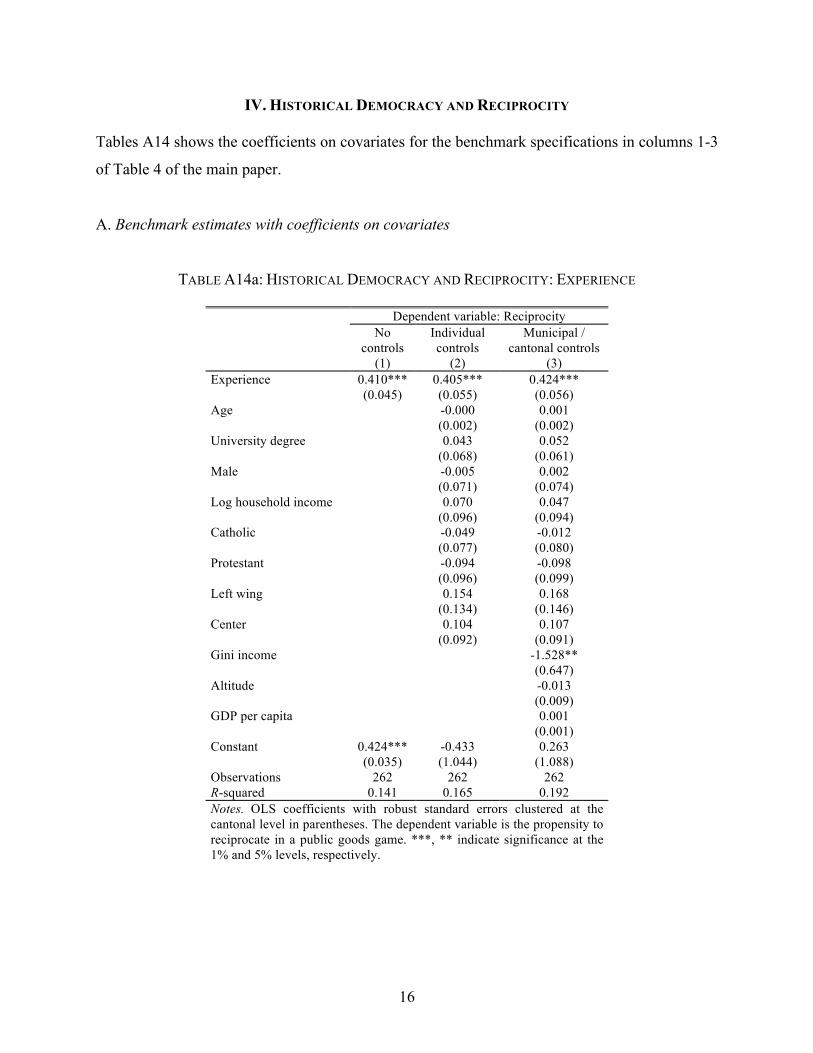
! 16
IV. HISTORICAL DEMOCRACY AND RECIPROCITY Tables A14 shows the coefficients on covariates for the benchmark specifications in columns 1-3
of Table 4 of the main paper.
A. Benchmark estimates with coefficients on covariates
TABLE A14a: HISTORICAL DEMOCRACY AND RECIPROCITY: EXPERIENCE
Dependent variable: Reciprocity No
controls (1)
Individual controls
(2)
Municipal / cantonal controls
(3) Experience 0.410*** 0.405*** 0.424*** (0.045) (0.055) (0.056) Age -0.000 0.001 (0.002) (0.002) University degree 0.043 0.052 (0.068) (0.061) Male -0.005 0.002 (0.071) (0.074) Log household income 0.070 0.047 (0.096) (0.094) Catholic -0.049 -0.012 (0.077) (0.080) Protestant -0.094 -0.098 (0.096) (0.099) Left wing 0.154 0.168 (0.134) (0.146) Center 0.104 0.107 (0.092) (0.091) Gini income -1.528** (0.647) Altitude -0.013 (0.009) GDP per capita 0.001 (0.001) Constant 0.424*** -0.433 0.263 (0.035) (1.044) (1.088) Observations 262 262 262 R-squared 0.141 0.165 0.192 Notes. OLS coefficients with robust standard errors clustered at the cantonal level in parentheses. The dependent variable is the propensity to reciprocate in a public goods game. ***, ** indicate significance at the 1% and 5% levels, respectively.

! 17
TABLE A14b: HISTORICAL DEMOCRACY AND RECIPROCITY: DURATION
Dependent variable: Reciprocity No
controls (1)
Individual controls
(2)
Municipal / cantonal controls
(3) Duration 0.085*** 0.084*** 0.089*** (0.008) (0.011) (0.011) Age 0.000 0.001 (0.002) (0.002) University degree 0.041 0.051 (0.066) (0.060) Male -0.011 -0.003 (0.071) (0.073) Log household income 0.076 0.053 (0.097) (0.095) Catholic -0.043 -0.007 (0.076) (0.077) Protestant -0.097 -0.104 (0.095) (0.097) Left wing 0.134 0.147 (0.134) (0.147) Center 0.108 0.108 (0.090) (0.088) Gini income -1.697** (0.646) Altitude -0.011 (0.008) GDP per capita 0.001 (0.001) Constant 0.428*** -0.505 0.214 (0.035) (1.057) (1.101) Observations 262 262 262 R-squared 0.144 0.168 0.199 Notes. OLS coefficients with robust standard errors clustered at the cantonal level in parentheses. The dependent variable is the propensity to reciprocate in a public goods game. ***, ** indicate significance at the 1% and 5% levels, respectively.
B. Dropping one canton at a time
Table A15 reports coefficients on experience (column 1) and duration (column 2) obtained after
dropping one canton at a time.

! 18
TABLE A15: HISTORICAL DEMOCRACY AND RECIPROCITY: DROPPING ONE CANTON AT A TIME
Dependent variable: Reciprocity Canton dropped Experience Duration (1) (2) Zurich 0.421*** 0.078*** (0.063) (0.012) Bern 0.382*** 0.082*** (0.051) (0.010) Lucerne 0.425*** 0.089*** (0.062) (0.011) Uri 0.419*** 0.088*** (0.056) (0.011) Schwyz 0.408*** 0.086*** (0.057) (0.010) Obwalden 0.426*** 0.089*** (0.056) (0.011) Glarus 0.427*** 0.089*** (0.056) (0.011) Zug 0.428*** 0.090*** (0.057) (0.010) Fribourg 0.405*** 0.085*** (0.053) (0.010) Solothurn 0.429*** 0.089*** (0.056) (0.011) Basel city 0.414*** 0.087*** (0.058) (0.011) Basel land 0.427*** 0.089*** (0.058) (0.011) Schaffhausen 0.420*** 0.088*** (0.057) (0.011) Appenzell IR 0.429*** 0.089*** (0.056) (0.010) St. Gallen 0.447*** 0.091*** (0.057) (0.012) Grisons 0.428*** 0.088*** (0.056) (0.011) Aargau 0.422*** 0.089*** (0.057) (0.011) Thurgau 0.441*** 0.092*** (0.054) (0.010) Vaud 0.415*** 0.087*** (0.063) (0.012) Valais 0.429*** 0.090*** (0.061) (0.012) Neuchatel 0.447*** 0.093*** (0.052) (0.010) Geneva 0.427*** 0.089*** (0.060) (0.011) Jura 0.423*** 0.089*** (0.057) (0.011) Notes. OLS coefficients with robust standard errors clustered at the cantonal level in parentheses. The dependent variable is the propensity to reciprocate in a public goods game. All columns control for covariates listed in panel E of Table 1, main paper. *** indicates significance at the 1% level.

! 19
C. Additional historical proxies at the cantonal level
TABLE A16: HISTORICAL DEMOCRACY AND RECIPROCITY: ADDITIONAL HISTORICAL PROXIES AT THE CANTONAL LEVEL
Dependent variable: Reciprocity Population before
1798 (1)
Population 1850 (2)
Population density 1850 (3)
Panel A: Experience Historical democracy 0.435*** 0.423*** 0.423*** (0.057) (0.056) (0.056) Population before 1798 -0.000 (0.000) Population 1850 -0.0002** (0.0001) Population density 1850 -0.000 (0.000) R-squared 0.199 0.194 0.192 Panel A: Duration Historical democracy 0.091*** 0.089*** 0.089*** (0.010) (0.010) (0.011) Population before 1798 -0.000 (0.000) Population 1850 -0.0002*** (0.0001) Population density 1850 -0.000 (0.000) R-squared 0.206 0.202 0.199 Other covariates Yes Yes Yes Observations 262 262 262 Notes. OLS coefficients with robust standard errors clustered at the cantonal level in parentheses. All columns include as “other covariates” age, education, male, log household income, catholic, protestant, left wing, center, altitude and Gini coefficient for income inequality at the municipal level, and GDP per capita at the cantonal level. These variables are described in panel E of Table 1 of the main paper. Columns 1-3 include additional controls: Column 1 includes population before 1798; column 2 includes population in 1850, and column 3 includes population density in 1850. ***, ** indicate significance at the 1% and 5% levels, respectively.
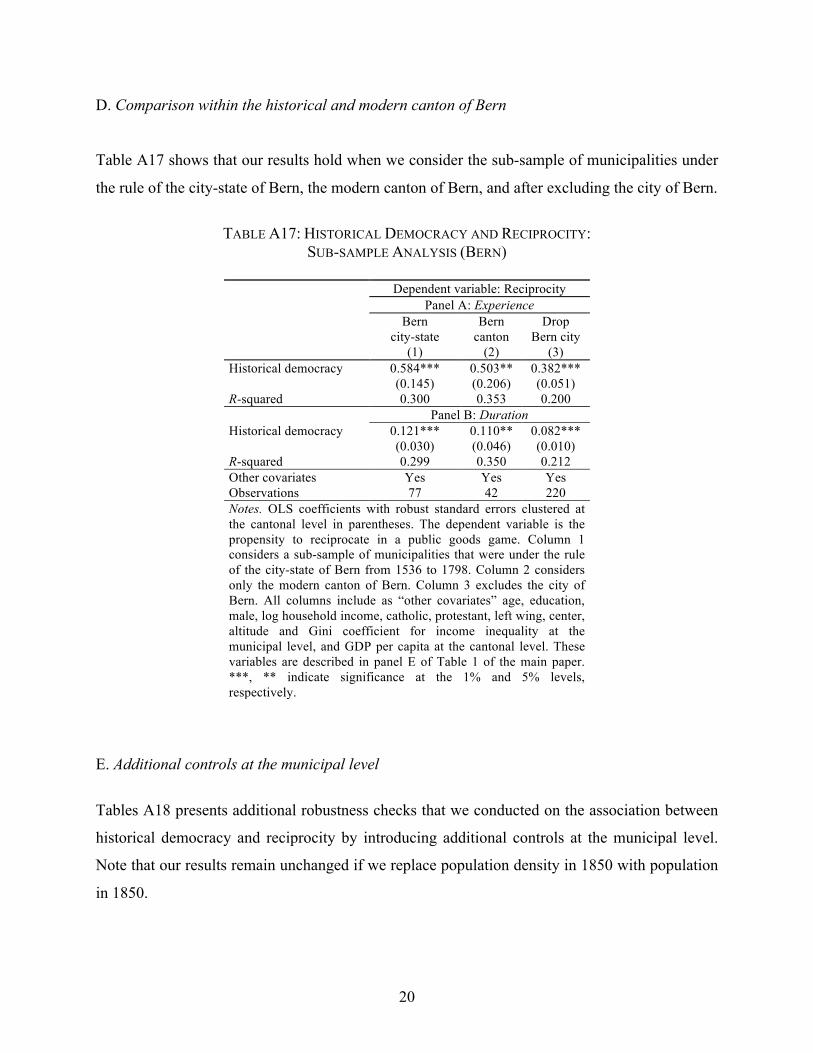
! 20
D. Comparison within the historical and modern canton of Bern
Table A17 shows that our results hold when we consider the sub-sample of municipalities under
the rule of the city-state of Bern, the modern canton of Bern, and after excluding the city of Bern.
TABLE A17: HISTORICAL DEMOCRACY AND RECIPROCITY:
SUB-SAMPLE ANALYSIS (BERN)
Dependent variable: Reciprocity Panel A: Experience Bern
city-state Bern
canton Drop
Bern city (1) (2) (3) Historical democracy 0.584*** 0.503** 0.382*** (0.145) (0.206) (0.051) R-squared 0.300 0.353 0.200 Panel B: Duration Historical democracy 0.121*** 0.110** 0.082*** (0.030) (0.046) (0.010) R-squared 0.299 0.350 0.212 Other covariates Yes Yes Yes Observations 77 42 220 Notes. OLS coefficients with robust standard errors clustered at the cantonal level in parentheses. The dependent variable is the propensity to reciprocate in a public goods game. Column 1 considers a sub-sample of municipalities that were under the rule of the city-state of Bern from 1536 to 1798. Column 2 considers only the modern canton of Bern. Column 3 excludes the city of Bern. All columns include as “other covariates” age, education, male, log household income, catholic, protestant, left wing, center, altitude and Gini coefficient for income inequality at the municipal level, and GDP per capita at the cantonal level. These variables are described in panel E of Table 1 of the main paper. ***, ** indicate significance at the 1% and 5% levels, respectively.
E. Additional controls at the municipal level
Tables A18 presents additional robustness checks that we conducted on the association between
historical democracy and reciprocity by introducing additional controls at the municipal level.
Note that our results remain unchanged if we replace population density in 1850 with population
in 1850.
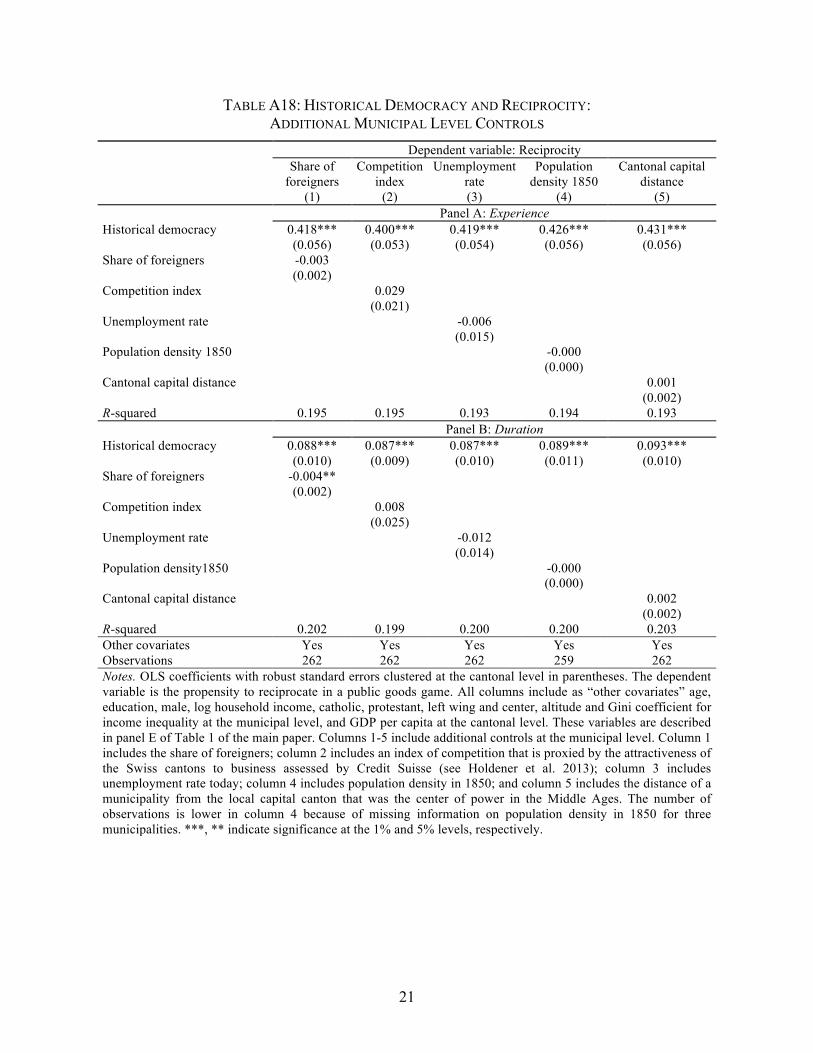
! 21
TABLE A18: HISTORICAL DEMOCRACY AND RECIPROCITY: ADDITIONAL MUNICIPAL LEVEL CONTROLS
Dependent variable: Reciprocity Share of
foreigners Competition
index Unemployment
rate Population
density 1850 Cantonal capital
distance (1) (2) (3) (4) (5) Panel A: Experience Historical democracy 0.418*** 0.400*** 0.419*** 0.426*** 0.431*** (0.056) (0.053) (0.054) (0.056) (0.056) Share of foreigners -0.003 (0.002) Competition index 0.029 (0.021) Unemployment rate -0.006 (0.015) Population density 1850 -0.000 (0.000) Cantonal capital distance 0.001 (0.002) R-squared 0.195 0.195 0.193 0.194 0.193 Panel B: Duration Historical democracy 0.088*** 0.087*** 0.087*** 0.089*** 0.093*** (0.010) (0.009) (0.010) (0.011) (0.010) Share of foreigners -0.004** (0.002) Competition index 0.008 (0.025) Unemployment rate -0.012 (0.014) Population density1850 -0.000 (0.000) Cantonal capital distance 0.002 (0.002) R-squared 0.202 0.199 0.200 0.200 0.203 Other covariates Yes Yes Yes Yes Yes Observations 262 262 262 259 262 Notes. OLS coefficients with robust standard errors clustered at the cantonal level in parentheses. The dependent variable is the propensity to reciprocate in a public goods game. All columns include as “other covariates” age, education, male, log household income, catholic, protestant, left wing and center, altitude and Gini coefficient for income inequality at the municipal level, and GDP per capita at the cantonal level. These variables are described in panel E of Table 1 of the main paper. Columns 1-5 include additional controls at the municipal level. Column 1 includes the share of foreigners; column 2 includes an index of competition that is proxied by the attractiveness of the Swiss cantons to business assessed by Credit Suisse (see Holdener et al. 2013); column 3 includes unemployment rate today; column 4 includes population density in 1850; and column 5 includes the distance of a municipality from the local capital canton that was the center of power in the Middle Ages. The number of observations is lower in column 4 because of missing information on population density in 1850 for three municipalities. ***, ** indicate significance at the 1% and 5% levels, respectively.

! 22
F. Additional controls at the individual level
Table A19 presents additional robustness checks that we conducted on the relationship between
historical democracy and reciprocity by introducing additional controls at the individual level.
TABLE A19: HISTORICAL DEMOCRACY AND RECIPROCITY:
ADDITIONAL INDIVIDUAL LEVEL CONTROLS
Dependent variable: Reciprocity Panel A: Experience Naturalized
Swiss citizen
Migrant Big Five personality
traits
Game comprehension
(1) (2) (3) (4) Historical democracy 0.406*** 0.424*** 0.427*** 0.425*** (0.058) (0.055) (0.053) (0.056) Naturalized Swiss citizen 0.037 (0.065) Migrant 0.006 (0.055) Game comprehension -0.033 (0.075) R-squared 0.178 0.192 0.183 0.193 Panel B: Duration Historical democracy 0.084*** 0.089*** 0.090*** 0.089*** (0.011) (0.010) (0.011) (0.011) Naturalized Swiss citizen 0.017 (0.062) Migrant 0.002 (0.055) Game comprehension -0.015 (0.069) R-squared 0.182 0.199 0.189 0.199 Other covariates Yes Yes Yes Yes Observations 252 262 237 262 Notes. OLS coefficients with robust standard errors clustered at the cantonal level in parentheses. The dependent variable is the propensity to reciprocate in a public goods game. All columns include as “other covariates” age, education, male, log household income, catholic, protestant, left wing, center, altitude and Gini coefficient for income inequality at the municipal level, and GDP per capita at the cantonal level. These variables are described in panel E of Table 1 of the main paper. Column 1 includes a dummy variable equal to one if individuals are naturalized Swiss citizens, 0 otherwise; column 2 includes a dummy variable if individuals have migrated, 0 otherwise; column 3 includes the Big Five personality traits at the individual level described in Appendix A.VI; and column 4 includes a game comprehension variable measured as the number of correct responses to the control questions described in Appendix B. The number of observations is lower in columns 1 and 3 because of missing answers to the questions on naturalized citizen and Big Five personality traits. *** indicates significance at the 1% level.
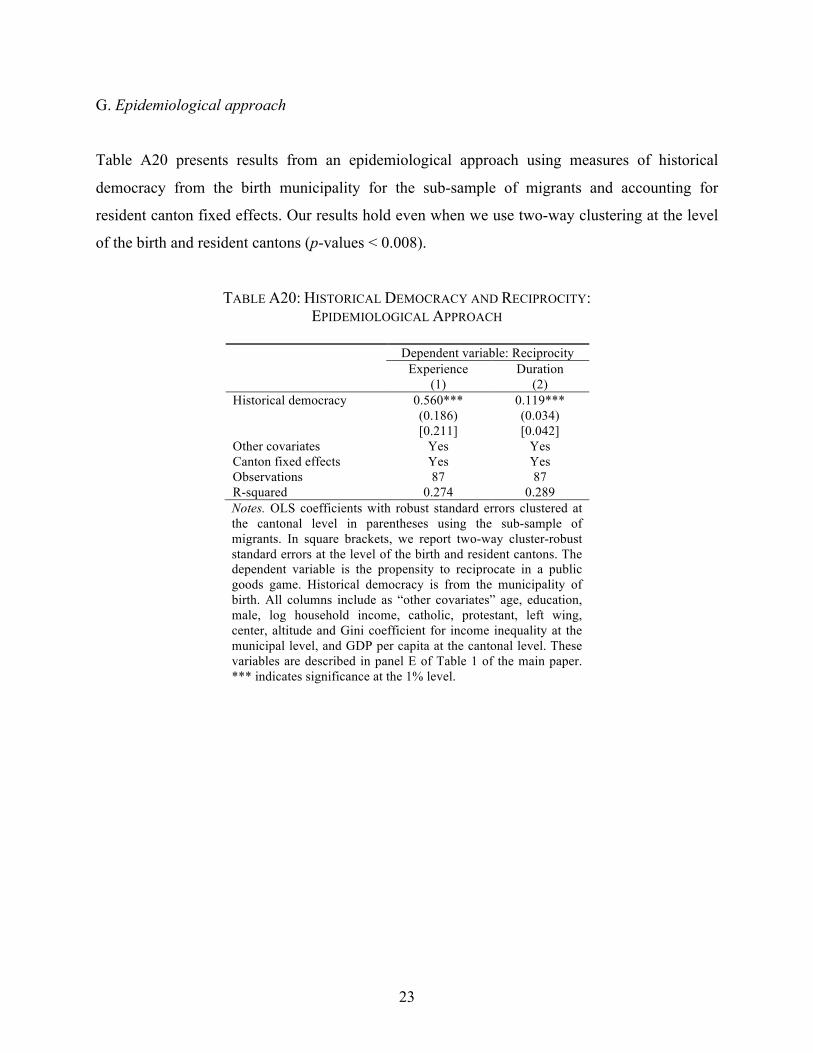
! 23
G. Epidemiological approach
Table A20 presents results from an epidemiological approach using measures of historical
democracy from the birth municipality for the sub-sample of migrants and accounting for
resident canton fixed effects. Our results hold even when we use two-way clustering at the level
of the birth and resident cantons (p-values < 0.008).
TABLE A20: HISTORICAL DEMOCRACY AND RECIPROCITY: EPIDEMIOLOGICAL APPROACH
Dependent variable: Reciprocity Experience
(1) Duration
(2) Historical democracy 0.560*** 0.119*** (0.186) (0.034) [0.211] [0.042] Other covariates Yes Yes Canton fixed effects Yes Yes Observations 87 87 R-squared 0.274 0.289 Notes. OLS coefficients with robust standard errors clustered at the cantonal level in parentheses using the sub-sample of migrants. In square brackets, we report two-way cluster-robust standard errors at the level of the birth and resident cantons. The dependent variable is the propensity to reciprocate in a public goods game. Historical democracy is from the municipality of birth. All columns include as “other covariates” age, education, male, log household income, catholic, protestant, left wing, center, altitude and Gini coefficient for income inequality at the municipal level, and GDP per capita at the cantonal level. These variables are described in panel E of Table 1 of the main paper. *** indicates significance at the 1% level.
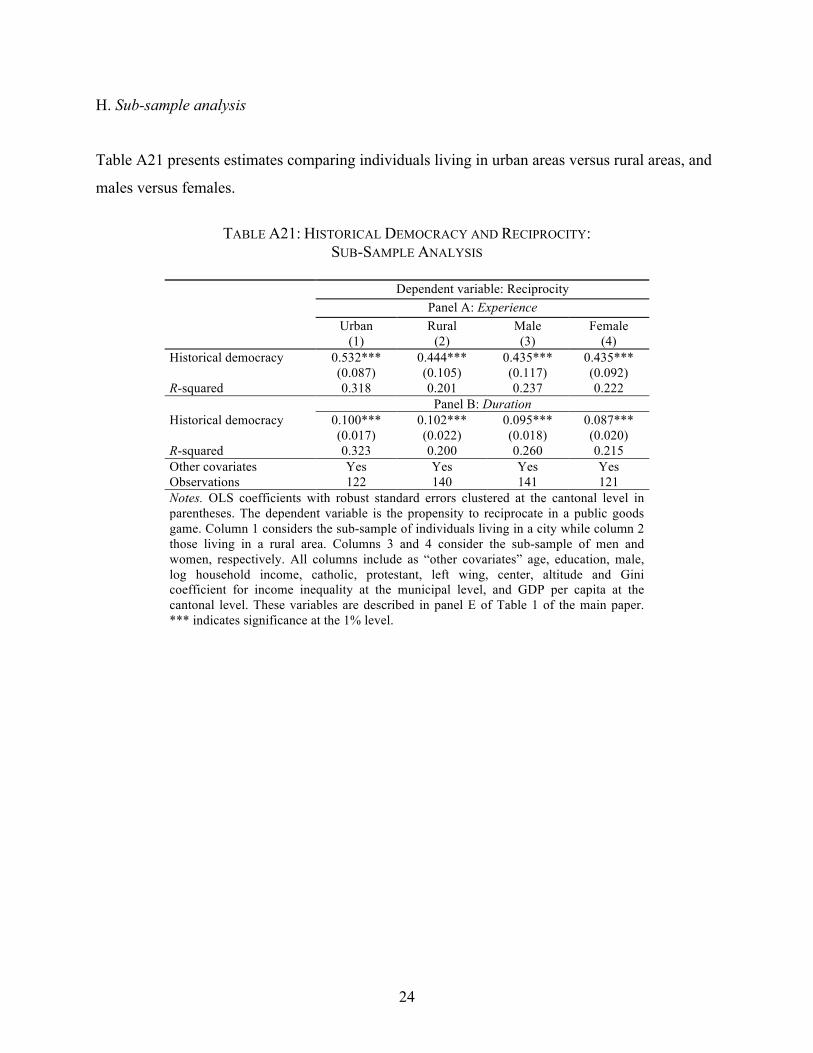
! 24
H. Sub-sample analysis
Table A21 presents estimates comparing individuals living in urban areas versus rural areas, and
males versus females.
TABLE A21: HISTORICAL DEMOCRACY AND RECIPROCITY:
SUB-SAMPLE ANALYSIS
Dependent variable: Reciprocity Panel A: Experience Urban Rural Male Female (1) (2) (3) (4) Historical democracy 0.532*** 0.444*** 0.435*** 0.435*** (0.087) (0.105) (0.117) (0.092) R-squared 0.318 0.201 0.237 0.222 Panel B: Duration Historical democracy 0.100*** 0.102*** 0.095*** 0.087*** (0.017) (0.022) (0.018) (0.020) R-squared 0.323 0.200 0.260 0.215 Other covariates Yes Yes Yes Yes Observations 122 140 141 121 Notes. OLS coefficients with robust standard errors clustered at the cantonal level in parentheses. The dependent variable is the propensity to reciprocate in a public goods game. Column 1 considers the sub-sample of individuals living in a city while column 2 those living in a rural area. Columns 3 and 4 consider the sub-sample of men and women, respectively. All columns include as “other covariates” age, education, male, log household income, catholic, protestant, left wing, center, altitude and Gini coefficient for income inequality at the municipal level, and GDP per capita at the cantonal level. These variables are described in panel E of Table 1 of the main paper. *** indicates significance at the 1% level.

! 25
Table A22 presents estimates from our sub-sample of Roestigraben cantons, followed by
dropping these cantons, and then dropping individuals who are altruists and flat contributors. The
latter two types are dropped because they have the same Spearman coefficient as free riders. .
TABLE A22: HISTORICAL DEMOCRACY AND RECIPROCITY:
ROESTIGRABEN SAMPLE AND ALTRUISTS / FLAT CONTRIBUTORS
Dependent variable: Reciprocity Roestigraben
sample (1)
Drop Roestigraben cantons
(2)
Drop altruists and flat contributors
(3) Panel A: Experience Historical democracy 0.610*** 0.365*** 0.394*** (0.141) (0.055) (0.061) R-squared 0.409 0.212 0.190 Panel B: Duration Historical democracy 0.132*** 0.078*** 0.082*** (0.030) (0.012) (0.013) R-squared 0.416 0.224 0.193 Other covariates Yes Yes Yes Observations 62 200 239 Notes. OLS coefficients with robust standard errors clustered at the cantonal level in parentheses. The dependent variable is the propensity to reciprocate in a public goods game. The number of observations changes because column 1 includes only three cantons from the Roestigraben (Bern, Fribourg, and Valais), column 2 drops these three cantons, and column 3 drops altruists and flat contributors. All columns include as “other covariates” age, education, male, log household income, catholic, protestant, left wing, center, altitude and Gini coefficient for income inequality at the municipal level, and GDP per capita at the cantonal level. These variables are described in panel E of Table 1 of the main paper. Column 1 also includes canton fixed effects and therefore excludes GDP per capita. It also excludes left wing orientation because of little variation within a canton. *** indicates significance at the 1% level.
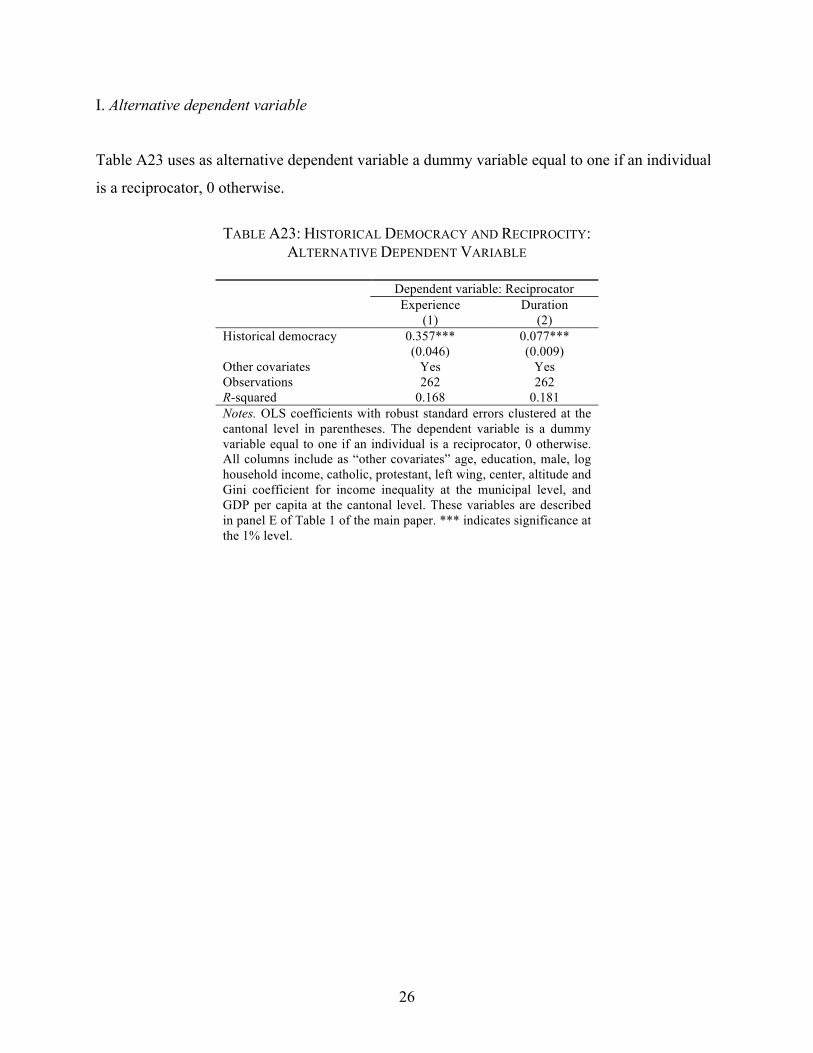
! 26
I. Alternative dependent variable
Table A23 uses as alternative dependent variable a dummy variable equal to one if an individual
is a reciprocator, 0 otherwise.
TABLE A23: HISTORICAL DEMOCRACY AND RECIPROCITY:
ALTERNATIVE DEPENDENT VARIABLE
Dependent variable: Reciprocator Experience
(1) Duration
(2) Historical democracy 0.357*** 0.077*** (0.046) (0.009) Other covariates Yes Yes Observations 262 262 R-squared 0.168 0.181 Notes. OLS coefficients with robust standard errors clustered at the cantonal level in parentheses. The dependent variable is a dummy variable equal to one if an individual is a reciprocator, 0 otherwise. All columns include as “other covariates” age, education, male, log household income, catholic, protestant, left wing, center, altitude and Gini coefficient for income inequality at the municipal level, and GDP per capita at the cantonal level. These variables are described in panel E of Table 1 of the main paper. *** indicates significance at the 1% level.

! 27
J. Alternative data source: Swiss Household Panel
Table A24 presents our main results using wave 13 of the Swiss Household Panel (SHP) as an
alternative data source. The dependent variable is a principal component of values associated
with reciprocity, such as to what extent it is justifiable to lie in own interest, cheat on taxes, and
claim state benefits not entitled to.
TABLE A24: HISTORICAL DEMOCRACY AND VALUES ASSOCIATED WITH RECIPROCITY:
SWISS HOUSEHOLD PANEL
Dependent variable: Principal component of values Panel A: Experience No controls Individual level
controls Municipal / cantonal
level controls (1) (2) (3) Historical democracy 0.278*** 0.280*** 0.325*** (0.095) (0.094) (0.088) R-squared 0.011 0.069 0.073 Panel B: Duration Historical democracy 0.050*** 0.052*** 0.062*** (0.019) (0.018) (0.016) R-squared 0.010 0.068 0.073 Other covariates Yes Yes Yes Observations 1,901 1,859 1,859 Notes. OLS coefficients with robust standard errors clustered at the cantonal and household level in parentheses. The dependent variable is the first principal component of values that are associated with reciprocity, such as to what extent it is justifiable to lie in own interest, cheat on taxes, and claim state benefits not entitled to. Data are from wave 13 of the Swiss Household Panel. All columns include as “other covariates” age, education, male, log household income, catholic, protestant, left wing and center, altitude and Gini coefficient for income inequality at the municipal level, and GDP per capita at the cantonal level. These variables are described in panel E of Table 1 of the main paper. *** indicates significance at the 1% level.

! 28
V. HISTORICAL DEMOCRACY AND RECIPROCITY: DISCUSSION
A. Pre-existing differences across areas with and without Zaehringen rule
Table A25 compares municipalities with Zaehringen rule in the Middle Ages with municipalities
under the rule of concurrent dynasties across a number of characteristics. Each column reports
results from a regression of the covariate listed in the column heading on dummy variables for
Kyburg and Habsburg with respect to Zaehringen as a benchmark category. The results clearly
show that there are no differences in any of these characteristics across different dynasties that
ruled concurrently with the Zaehringen on the Swiss plateau. These results mitigate selection
concerns arising from pre-existing differences.
TABLE A25: PRE-EXISTING DIFFERENCES ACROSS AREAS WITH AND WITHOUT ZAEHRINGEN RULE
Climate suitability (1)
Soil suitability (2)
Altitude (3)
Waste land (4)
Kyburg 0.803 (1.148)
-0.178 (3.129)
0.207 (0.607)
0.360 (1.371)
Habsburg 0.795 (0.983)
-2.218 (3.062)
-0.389 (0.503)
-1.358 (0.827)
Constant 4.282*** (0.761)
11.026*** (2.657)
5.677*** (0.460)
2.808*** (0.829)
R-squared 0.012 0.020 0.012 0.013 Other covariates No No No No Observations 163 163 163 163 Notes. OLS coefficients with robust standard errors clustered at the cantonal level in parentheses. The sample refers to the individuals from municipalities that were under Kyburg, Habsburg, or Zaehringen rule in the Middle Ages. The dependent variables are as follows: in column 1 it is climate suitability index by the Swiss Federal Office for Agriculture. It represents climatic conditions and restrictions for agriculture, highlighting differences in cultivation options. In column 2 it is soil suitability index prepared by the Swiss Federal Office for Agriculture. It is a categorical variable where each category represents a different element of the landscape characterized by bedrock, slope and gradient. In column 3 it is the average elevation of a municipality in meters / 100. In column 4 it is the percentage of waste land in a municipality (synonymous with rocky and mountainous land with steep slopes not fit for human use). Kyburg, Habsburg, and Zaehringen are dummy variables equal to one if an individual is from a municipality that was under the Kyburg, Habsburg, and Zaehringen rule, respectively. The benchmark category included in the constant is Zaehringen. Similar results are obtained when we control for covariates in all four columns or use ordered-probit estimation for columns 1 and 2. *** indicates significance at the 1% level.

! 29
B. Intention to treat estimates (ITT)
Table A26 reports ITT estimates of the association between the Zaehringen dummy and
reciprocity. Column 1 shows that the Zaehringen dummy has a large positive and significant
coefficient. This result implies that individuals from municipalities that were under the
Zaehringen rule display higher reciprocity by 0.12 points.
TABLE A26: INTENTION TO TREAT ESTIMATES AND TESTS FOR THE EXCLUSION RESTRICTION
Dependent variable: Reciprocity (1) (2) (3) Zaehringen 0.121**
(0.056) 0.008
(0.057) -0.022 (0.037)
Historical democracy experience 0.422*** (0.057)
Historical democracy duration 0.090*** (0.010)
Individual controls Yes Yes Yes Municipal controls Yes Yes Yes Observations 262 262 262 Notes. OLS coefficients with robust standard errors clustered at the cantonal level in parentheses. The dependent variable is the propensity to reciprocate in a public goods game. Zaehringen is a dummy variable equal to one if an individual is from a municipality that was under the Zaehringen rule in the Middle Ages. Individual level controls include age, education, male, household income, catholic, protestant, center and left. Municipal controls include altitude, Gini (income), and cantonal level GPD per capita. These variables are described in panel E of Table 1 of the main paper. ***, ** indicate significance at the 1% and 5% levels, respectively.
C. Instrumental variables estimates
We discuss two results in support of the exclusion restriction. First, the coefficient on Zaehringen
dummy drops to nearly zero and becomes statistically insignificant when we additionally control
for historical democracy via experience in column 2 and duration in column 3 of Table A26. In
contrast, the coefficients on experience and duration remain large and highly significant. Second,
Figure A2 shows average reciprocity across individuals from municipalities associated with
different dynasties when historical experience is lacking. As is evident from the figure, there is
no difference in reciprocity.
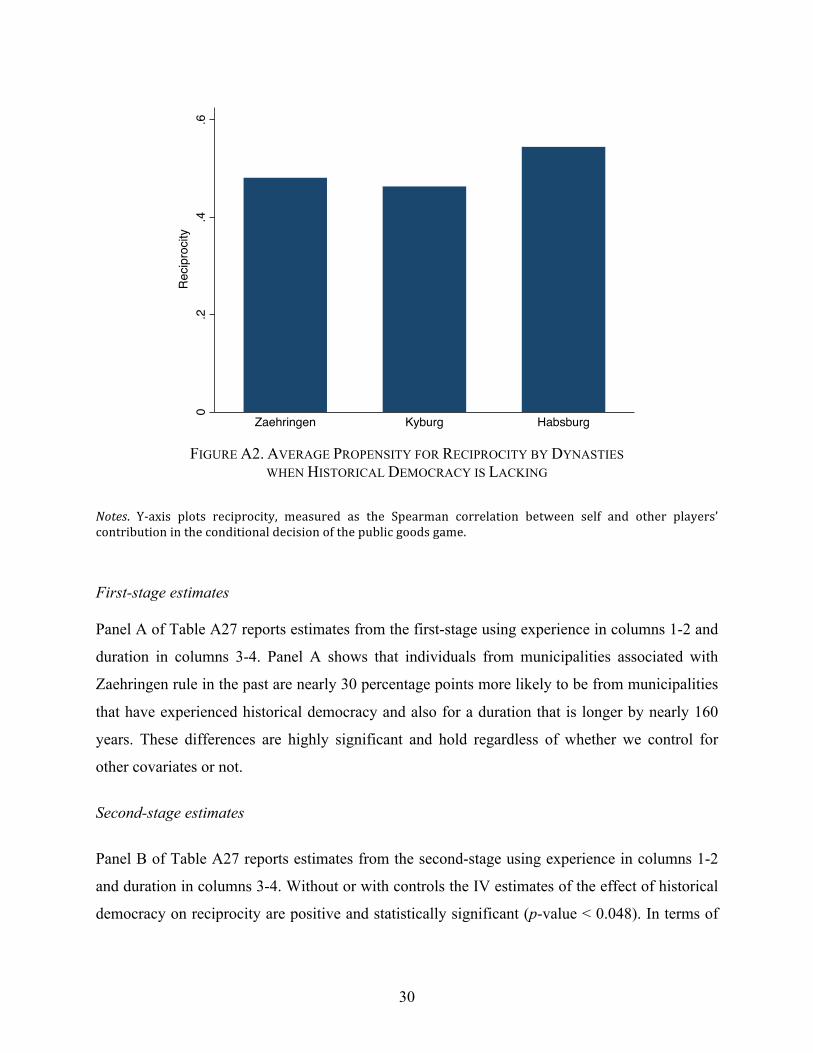
! 30
FIGURE A2. AVERAGE PROPENSITY FOR RECIPROCITY BY DYNASTIES
WHEN HISTORICAL DEMOCRACY IS LACKING Notes.! Y$axis! plots! reciprocity,! measured! as! the! Spearman! correlation! between! self! and! other! players’!contribution!in!the!conditional!decision!of!the!public!goods!game.!!
First-stage estimates Panel A of Table A27 reports estimates from the first-stage using experience in columns 1-2 and
duration in columns 3-4. Panel A shows that individuals from municipalities associated with
Zaehringen rule in the past are nearly 30 percentage points more likely to be from municipalities
that have experienced historical democracy and also for a duration that is longer by nearly 160
years. These differences are highly significant and hold regardless of whether we control for
other covariates or not.
Second-stage estimates
Panel B of Table A27 reports estimates from the second-stage using experience in columns 1-2
and duration in columns 3-4. Without or with controls the IV estimates of the effect of historical
democracy on reciprocity are positive and statistically significant (p-value < 0.048). In terms of
0.2
.4.6
Reciprocity
Zaehringen Kyburg Habsburg

! 31
magnitude they are very much similar to their OLS counterparts (0.42 for experience and 0.089
for duration).
TABLE A27: INSTRUMENTAL VARIABLE ESTIMATES
Experience Duration (1) (2) (3) (4) Panel A: First-stage estimates Dependent variable: Historical experience of democracy Zaehringen 0.305***
(0.061) 0.269*** (0.061)
1.759*** (0.309)
1.588*** (0.301)
F-statistics 24.95 19.48 32.50 27.92 Panel B: Second-stage estimates Dependent variable: Reciprocity Historical democracy 0.557***
(0.203) 0.450** (0.226)
0.097*** (0.035)
0.076** (0.039)
Individual controls No Yes No Yes Municipal / cantonal controls No Yes No Yes Observations 262 262 262 262 Notes. OLS coefficients with robust standard errors clustered at the cantonal level in parentheses. Individual level controls include age, education, male, household income, catholic, protestant, center and left wing. Municipal and cantonal controls include altitude and Gini (income) at the municipal level, and GPD per capita at the cantonal level. These variables are described in panel E of Table 1 of the main paper. In panel A, the dependent variable is equal to one if an individual is from a municipality with historical democracy, 0 otherwise. In panel B, the dependent variable is the propensity to reciprocate in a public goods game. Zaehringen is a dummy variable equal to one if an individual is from a municipality that was under the Zaehringen rule in the Middle Ages. ***, ** indicate significance at the 1% and 5% levels, respectively.

! 32
VI. BIG FIVE PERSONALITY TRAITS In our post-experimental survey, we follow a common approach in the literature to elicit the Big
Five personality traits (e.g., Winkelmann and Winkelmann 2008; Boyce et al. 2010; Heineck and
Anger 2010; Boyce and Wood 2011). Individuals face a question that includes 15 different items
related to their personality as follows: “Please, say how well do the following statements
describe your personality (where 1 means “agree,” 2 “neither agree nor disagree,” and 3
“agree”).”
I see myself as someone who…
1: does a thorough job
2: is communicative, talkative
3: is sometimes somewhat rude to others
4: is original, comes up with new ideas
5: worries a lot
6: has a forgiving nature
7: tends to be lazy
8: is outgoing, sociable
9: values artistic experiences
10: gets nervous easily
11: does things effectively and efficiently
12: is reserved
13: is considerate and kind to others
14: has an active imagination
15: is relaxed, handles stress well
Items 4, 9, and 14 are used to measure openness to experience; items 1, 7 (reverse coded), and 11
to measure conscientiousness; items 2, 8, and 12 (reverse coded) to measure extraversion; items
3 (reverse coded), 6, and 13 to measure agreeableness; and items 5, 10, and 15 (reverse coded) to
measure neuroticism. In the analysis, we standardize the score with a mean of zero and standard
deviation of one. Table A28 shows the descriptive statistics of the Big Five personality traits by
social group. On average Swiss Germans are significantly more open to experience than Swiss
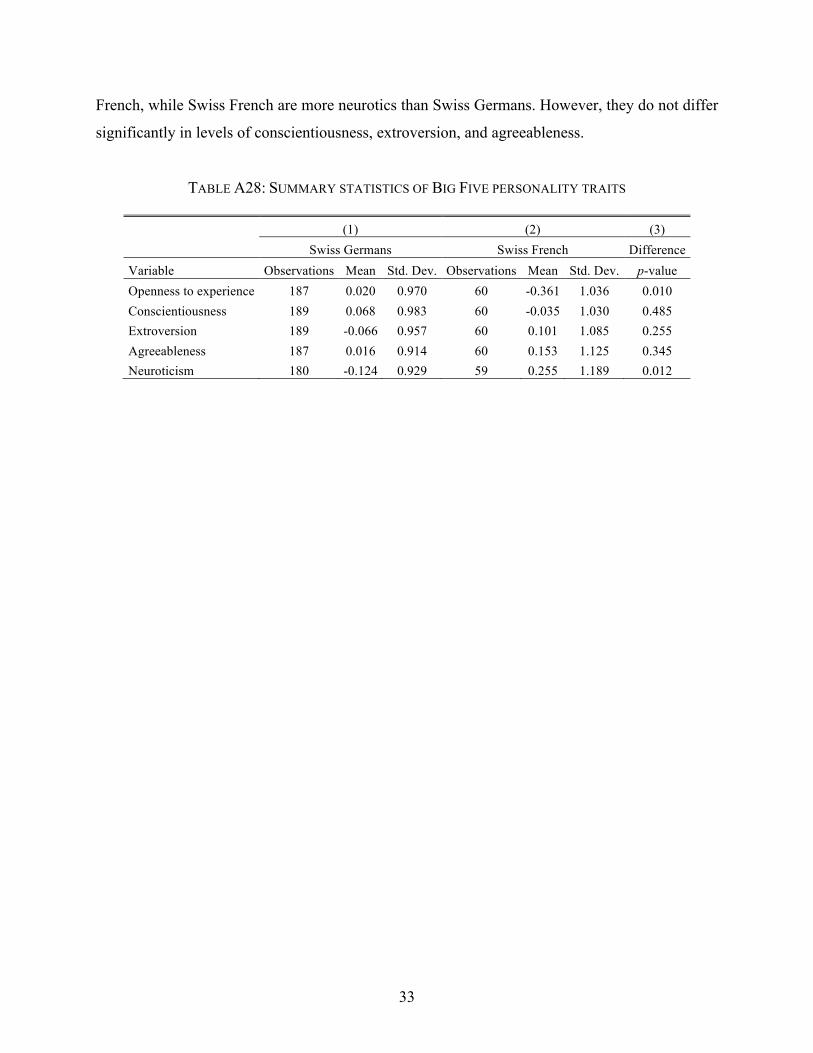
! 33
French, while Swiss French are more neurotics than Swiss Germans. However, they do not differ
significantly in levels of conscientiousness, extroversion, and agreeableness.
TABLE A28: SUMMARY STATISTICS OF BIG FIVE PERSONALITY TRAITS
(1) (2) (3) Swiss Germans Swiss French Difference Variable Observations Mean Std. Dev. Observations Mean Std. Dev. p-value Openness to experience 187 0.020 0.970 60 -0.361 1.036 0.010 Conscientiousness 189 0.068 0.983 60 -0.035 1.030 0.485 Extroversion 189 -0.066 0.957 60 0.101 1.085 0.255 Agreeableness 187 0.016 0.914 60 0.153 1.125 0.345 Neuroticism 180 -0.124 0.929 59 0.255 1.189 0.012

! 34
APPENDIX B: EXPERIMENTAL INSTRUCTIONS Introduction You are taking part in a research by ETH Zurich. This is a research about decision-making by individuals. The contents will be kept highly confidential and will be only used for scientific purposes. Whatever decisions you take will be ANONYMOUS. You will take part in THREE studies. Depending on your and other players’ decisions in these studies, you can earn up to 175 Swiss Francs. Therefore, please read the instructions carefully. In the end, we will use a lottery to select 40 participants and pay them the exact amount earned by them in one of the three studies. We will get in touch with the selected participants to transfer the money. Please take all the decisions without consulting anyone else. Please, do not use the back and forward button of the browser. Basic Instructions We will now introduce you to the basic situation in which you have to take a decision. You will confront this situation in all the three studies. You are a member of a group comprising two players A and B. YOU ARE ALWAYS PLAYER A Player B is not a computer, but a real person. You don’t know who player B is. Similarly, player B does not know who you are. You are also not known to us. Each player gets 100 Francs at the start of the study. You have to decide what to do with this money. You can either keep the Francs in your “private account” or you can invest them in a “common fund”. Francs not invested in the common fund are automatically transferred to your private account. Earnings from the private account: For each Franc you keep in the private account, you get exactly 1 Franc. For example, if you put 50 Francs in your private account, you will earn exactly 50 Francs. Except for you, no one else has access to earnings from your private account.

! 35
Earnings from the common fund: For each Franc that you invest in the common fund you get 0.75 Francs and player B also gets 0.75 Francs. Of course, you also get 0.75 Francs for each token invested by player B. Earnings from the common fund = total number of Francs invested in the common fund by you and player B multiplied by 0.75. Example, if the sum of Francs invested by you and player B in the common fund is 200, you and player B earn 200 x 0.75 = 150 Francs each from the common fund. Total earnings = earnings from the private account + earnings from the common fund

! 36
Control questions Now we will ask you to answer two questions to help you understand the instructions better. Please answer the following questions carefully. Question 1: Out of 100 Francs, player A and B invest 10 Francs each in the common fund. How much does each player earn from the common fund? What are the total earnings of player A? What are the total earnings of player B?
Question 2: Out of 100 Francs, Player A invests zero Francs in the common fund, but player B invests 40 Francs. How much does each player earn from the common fund? What are the total earnings of player A? What are the total earnings of player B?
STUDY 1 Study 1 contains the decision situation we have just described to you. You will get 100 Francs. You can put them into your private account or you can invest them into a common fund. You will have to take two types of decisions. We will call them Decision I and Decision II.
Decision I: You will have to decide how many out of 100 Francs to invest into the common fund. You can ONLY invest in multiples of 10. Example: 0, 10, 20, 30 and so on till 100. You will have to enter the amount in a box like this:
After this, you will have to guess how many Francs player B whose identity you DO NOT know would invest into the common fund? You will have to enter the amount in a box like this:

! 37
Decision II: You will have to indicate the amount of Francs you would like to invest into the common fund for each possible investment by player B. This will become clear to you, if you look at the table on the screen below (please, do not fill in the table as yet):
Player B (Anonymous)
Player A (You)
Player B (Anonymous)
Player A (You)
0
60
10
70
20
80
30
90
40
100
50
You will have to enter your decision into the box next to the contribution of player B. For example: How many Francs would you like to invest into the common fund if player B invests zero Francs in the common fund? How many Francs would you like to invest into the common fund if player B invests 10 Francs…and so on till 100 Francs. You will have to make an entry into each box. Make sure that no box is empty. After all participants have taken their decisions I and II, we will use a lottery to select one of the two decisions to determine your payoffs in study 1. You are now taking part in study 1. It will be conducted only once. Decision I: Out of 100 Francs, how many would you like to invest into the common fund? Please enter the amount into the box below:

! 38
How many Francs do you think player B whose identity you DO NOT know would invest into the common fund? Please enter the amount into the box below: Decision II: How many Francs would you like to invest into the common fund for each possible investment by player B? Please choose between the amounts 0, 10, 20, 30, 40, 50 and so on till 100. Make sure that you fill each empty box.
Player B (Anonymous)
Player A (You)
Player B (Anonymous)
Player A (You)
0
60
10
70
20
80
30
90
40
100
50

! 39
REFERENCES Aron, A., E. N. Aron, M. Tudor, and G. Nelson. 1991. “Close Relationships as Including the
Other in the Self.” Journal of Personality and Social Psychology, 60, 241-253.
Boyce, C. J., G. D. A. Brown, and S. C. Moore. 2010. “Money and Happiness: Rank of
Income, Not Income, Affects Life Satisfaction.” Psychological Science, 21, 471–475.
Boyce, C. J., and A. M. Wood. 2011. “Personality and the Marginal Utility of Income:
Personality Interacts with Increases in Household Income to Determine Life Satisfaction.”
Journal of Economic Behavior and Organization, 78, 183-191.
Cameron, C., J. B. Gelbach, and D. L. Miller. 2008. “Bootstrap-based Improvements for
Inference with Clustered Errors.” Review of Economics and Statistics, 90(3), 414-427.
Heineck, G., and S. Anger. 2010. “The Returns to Cognitive Abilities and Personality Traits in
Germany.” Labour Economics, 17, 535-546.
Holdener, V., F. Hürzeler, T. Rühl, A. Schnell, and N. Sydow. 2013. “Locational Quality of
the Swiss Cantons and Regions.” Credit Suisse Global Research. Special Issues Regions,
September.
Winkelmann, L., and R. Winkelmann. 2008. “Personality, Work, and Satisfaction: Evidence
from the German Socio-Economic Panel.” Journal of Positive Psychology, 3, 266–275.


![HES UserGuide Oct10[1]](https://img.pdfslide.us/doc/110x75/55cf981d550346d03395a8eb/hes-userguide-oct101.jpg)


![[Workshop] Implementation of screening (Oct10)](https://img.pdfslide.us/doc/110x75/5413f8d08d7f7299698b4757/workshop-implementation-of-screening-oct10.jpg)