Embed Size (px)
Citation preview
htt
p:/
/in
tro
.fe
hrl
.org
FINAL
SUMMARY
REPORT
INTRO is supported by fundingunder the Sixth Research FrameworkProgramme of the European Union
INTELLIGENT ROADS


Editors:WORK-PACKAGE AND TASK LEADER AND EDITOR
MAIN AUTHOR:Mayke Deuss, FEHRL
CONTRIBUTORS:Rigobert Opitz (ROC, Germany)Andrew Winder (Egis Mobilité, France)Stefan Deix (Arsenal Research, Austria)Alex Wright (TRL, UK) Edward Chung (EPFL-Lavoc, Switzerland)Bengt Wälivaara (VTI, Sweden)Leif Sjögren (VTI, Sweden)
REVIEWED BY:Rigobert Opitz (ROC, Germany)Kerstin Robertsson (VTI, Sweden)Sigvard Tim (VTI, Sweden)
with the participation of
1

Contents Executive Summary................................................................................................................... 5 1 Introduction......................................................................................................................... 8 2 Current Knowledge and Implementation Strategies ........................................................ 10
2.1 Consolidated state of the art and user needs............................................................. 10 2.1.1 User needs......................................................................................................... 10 2.1.2 Architecture........................................................................................................ 10 2.1.3 State of the art: technologies & sensors ............................................................ 12
2.2 Scenarios, structure and potential short-term trends related to road transport in Europe.................................................................................................................................. 12
2.2.1 Overview of scenarios and trends ..................................................................... 13 2.2.2 Trends and drivers of change ............................................................................ 13 2.2.3 Scenarios ........................................................................................................... 14 2.2.4 Links between scenarios and INTRO ................................................................ 15
3 Applications to support infrastructure management......................................................... 16 3.1 Methods for measurement of pavement condition using probe vehicles ................... 16 3.2 Assessment of methods to identify pavement condition using current and novel in situ sensors................................................................................................................................. 19
3.2.1 Pavement health monitoring system.................................................................. 20 3.2.2 Monitoring of bearing capacity during spring thaw ............................................ 21 3.2.3 Bridge health monitoring system ....................................................................... 22 3.2.4 Innovative technologies for determining the deterioration process of pavements 24
4 Applications to support safety warnings........................................................................... 26 4.1 Model for estimating expectable braking distance ..................................................... 26
4.1.1 High friction tests (“summer”) ............................................................................ 28 4.1.2 Low friction tests (“winter”)................................................................................. 29
4.2 Data model for road safety related data ..................................................................... 30 4.3 Simulator study, evaluation of impact on safety ......................................................... 33
5 Applications to support traffic management ..................................................................... 37 5.1 Traffic indicator needs: single source and data fusion estimation models................. 37
5.1.1 Travel time prediction using floating car data .................................................... 37 5.1.2 Data fusion......................................................................................................... 39
5.2 Integration of weather effects for traffic indicators forecasting................................... 40 5.3 Safety indicators for monitoring traffic safety ............................................................. 41
5.3.1 Safety indicators developed............................................................................... 43 5.3.2 Data fusion of safety indicators.......................................................................... 43 5.3.3 Methodology to determine threshold values for safety indicators ..................... 44
6 A Vision of Intelligent Roads ............................................................................................ 45 7 Conclusions...................................................................................................................... 48 8 References ....................................................................................................................... 50
2
List of figures Figure 1: Layered architecture for INTRO (green sections are part of the INTRO project) .... 12 Figure 2: Intelligent road solutions – effects circumstances, visions and solutions ................ 13 Figure 3: PUMA, the CAN bus logger used in Sweden........................................................... 17 Figure 4: IRIS 1000 Data Acquisition Unit............................................................................... 17 Figure 5: Repeated driver behaviour and related CAN- sensor data from rural road. ............ 18 Figure 6: Repeated driver behaviour and related CAN- sensor data from urban roads ......... 19 Figure 7: Kyowa strain gauge.................................................................................................. 20 Figure 8: Lonay site WIM station ............................................................................................. 20 Figure 9: Moisture sensors in unbound pavement at the test site Kindsjön............................ 21 Figure 10: Bridge Reichsbrücke, Vienna................................................................................. 23 Figure 12: MuST optical fibre as used in the test .................................................................... 24 Figure 13: Examples of Mote sensors ..................................................................................... 25 Figure 14: Measured deceleration curve and approximation .................................................. 27 Figure 15: Braking distance model flowchart .......................................................................... 27 Figure 16: Test tracks and vehicles involved in “summer” tests ............................................. 28 Figure 17: Test tracks and vehicles involved in “winter” tests................................................. 29 Figure 18: Overview of system architecture ............................................................................ 30 Figure 19: Server: Databases and Interfaces (red lines)......................................................... 32 Figure 20: The VTI Driving Simulator III. The arrows indicate possible movements. ............. 33 Figure 21: The HMI solutions used in the test......................................................................... 34 Figure 22: Situation with moose running into the road............................................................ 35 Figure 23: Visual representation of different road surfaces .................................................... 36 Figure 24: Illustration of θ functions....................................................................................... 39 Figure 25: Weather traffic measuring station schema (Poland) .............................................. 40 Figure 26: A4-A86 Weaving section in France........................................................................ 42 Figure 27: Intelligent road solutions – effects, circumstances, visions and solutions ............. 45 Figure 28: Scheduled benefits from some main emerging technologies areas ...................... 46
3

List of abbreviations ABS Anti-Lock Braking System AM Ante Meridiem AVI Automatic Vehicle Identification CAN Control Area Network DAU Data Acquisition Units DTA Dynamic Traffic Assignment ELPV Enhanced Longitudinal Profile Variance ESP Electronic Stability Program EU European Union FEHRL Forum of European National Highway Research Laboratories FOS Fibre Optic Sensors GIS Geographic Information Technology GPS Global Positioning System HGV Heavy Goods Vehicle HMI Human Machine Interface INTRO Intelligent Roads ITS Intelligent Transport System NIRA Software by NIRA Dynamics PCV Passenger-Carrying Vehicle PM Post Meridiem ROADSTAR Road Surface Tester of Arsenal Research SKAT PRISMA solution’s Software for Road and Traffic division UK United Kingdom VTI Swedish National Road and Transport Research Institute WIM Weight in Motion xFCD Extended Floating Car Data
4

Executive Summary The Intelligent Roads (INTRO) project is aimed at demonstrating how safety, capacity, road operation and maintenance problems can be alleviated by the use of existing sensor technology in a harmonized way, to add “intelligence” to road networks. It is a three-year R&D activity with funding under the 6th Framework Program of the European Commission (Directorate-General for Research). Further information can be found on the overall aims and activities of the project at the INTRO website: http://intro.fehrl.org. The INTRO project was organized in six work packages of which two dealt with management and dissemination. INTRO Work Package 1 reviewed a selection of current technologies, practices and experiences. It focused on four main themes, namely user needs, architecture development for an intelligent transport system (ITS), an overview of selected relevant related projects and an overview of key technologies and systems related to intelligent roads. Interviews were held to assess the key problems faced by a variety of different road operators and managers across Europe. Results of the interviews show that some operators do not have their network fully fitted with intelligent systems. In several cases, the operators are waiting for evaluation of existing solutions and equipment from research projects, such as INTRO, in order to help them choose equipment to deploy. Other operators have already deployed significant intelligent transport infrastructure and are waiting for innovative solutions to help them improve their systems. ITS architectures come in different forms and levels, ranging from specific structures, such as the layout of a communication system or the design principles for an individual ITS element, to high-level concepts representing the underlying framework of a whole project. Architectures are described in terms of elements, functions, procedures, interfaces, actors and interactions. Different architectural approaches are possible and in use. Work Package 1 also examined possible scenarios for road transport and looked at future needs in Europe for private and commercial transport on road networks. Scenarios try to describe all the possible situations of external and internal factors influence on the “intelligent road” systems. They also try to give an answer how the systems demonstrated and recommended by the INTRO project can adapt and react to each of the scenarios. Work Package 2 focused on the traffic safety aspects. Low friction road sections cannot be perceived by drivers, thus constituting great danger in everyday road traffic. Therefore, the research in INTRO related to safety focused on friction issues. The use of extended floating car data (xFCD) in combination with static data is one subject that INTRO has tested. Models for stopping and braking distances have been developed. The human machine interface (HMI) to inform the driver about low friction sections has been investigated and an interface has been proposed. This was done by tests in the VTI simulator. Since different test vehicles have been used, the values of the parameters for low and high friction cannot be directly compared. Therefore, it is not possible to draw the conclusion that common set of parameters can be used with the model for estimating the braking distance in both “summer” and “winter” conditions with only reference friction value as input. Results from the HMI tests indicate quite clearly that the recommended speed display in combination with a timing of six seconds leads to the most favourable driving behaviour with respect to traffic safety. Speed is reduced when a warning is given, and to a certain extent also when no warning is present. Drivers reduced their speed more when a low friction warning is accompanied by a road surface that looks slippery than in a situation where the look of the road surface does not change. This can be seen as an indication of certain mistrust in the warning system. However, drivers test brake only rarely to check whether the system informed them correctly or not.
5

Work Package 3 was concerned with the applications to support infrastructure management. The efficient operation and maintenance of the road network relies on the availability of accurate and up to date information on road condition. The INTRO project focused on using new sensors, both in situ and moving sensors (probe vehicles) to get new information that can be added to the traditional monitoring schemes. This new information also is of a dynamic nature that can be used for real time warning support. This Work Package dealt with the use of probe vehicles in urban and rural areas to get information on road condition. Sensors mounted in the pavement to give information on condition was also tested, both in road and bridge situations. The outcomes of the trials with probe vehicles showed that this concept is probably not well suited for the urban and inner city environments. It is very difficult to separate exceptions in the CAN bus data arising from road defects, from those caused by road junctions, parked cars etc. However, the trial on rural roads showed a better perspective. A range of in situ sensors and possible applications were identified by INTRO. Examples of these are (traditional) strain gauges and fibre optics, temperature sensors and accelerometers. Special attention was given to the ‘Mote’ technology. This technology, originally developed in the military field, combines some of the identified sensors with wireless communication technology. Temperature sensors were used in a trial for monitoring of bearing capacity during spring thaw. The trial was carried out to improve the usability of low volume roads during thawing season. A problem in regions with cold climate is the need to close weak road sections with high levels of water during spring thawing seasons. A very good correlation between relative strain and frost thaw was found in the trial. This kind of correlation is a first step to a general model for predicting the seasonal variation of bearing capacity on minor low volume roads. This will be a very useful tool for the road authorities. This model and the information about frost thaw together can help the road authorities to make a more objective and time precise decision about load restrictions on minor roads. In bridge health monitoring systems, wireless sensor networks have the potential to change the perception of structural health monitoring, because of many advantages. Decreasing hardware costs, thanks to the economized cabling, enable disperse deployment. Furthermore, ubiquitous intelligent sensors can accomplish various tasks. For the technology to be able to monitor the structural condition, a specific level of sensor sensitivity and sampling rate is needed. This will deduce significant objective parameters Permanent monitoring of bridges by use of in situ sensors is a promising technique to support maintenance and guarantee safety and reliability. To support future deployment scenarios by strategic research activities it is important to define standards and norms. Furthermore, it is important to emphasize frequency dissemination. To successfully implement the permanent monitoring, the confidence of the road operators needs to grow. Mote technology sensors used in tests for innovative technologies do not permit a reliable comparison with other devices, such as optical fibre and strain gauges. However, Motes technology does have a very important potential considering the communication aspects. If Motes are placed in a pavement and form a complete grid of sensors, they could provide information about the pavement deformations and deterioration process. It is necessary to improve Motes accuracy for road application. This could perhaps be obtained with the new generation of Motes that was released at the end of 2007. Work Package 4 focused on developing methodologies for predicting traffic conditions and for monitoring traffic safety. These methodologies will use data measured from traffic sensors and floating car data. Data fusion methodologies on combining data from multi sources to predict travel time and traffic safety are investigated. The effect of weather on traffic conditions was also an important factor in this part of the INTRO project. Another factor that was addressed in this part is the development of safety indicators to monitor traffic safety using traffic sensor data.
6

It is shown how estimates of link flows can be obtained using probe vehicle data as the primary source of information for a Dynamic Traffic Assignment (DTA) model. Even though no measurements of the link flows are available to compare with the estimated flows, the results are encouraging and demonstrate that the calibrated model accurately matches the historical travel times. This is an interesting finding in terms of traffic management applications, as travel times are one of the most important outputs of DTA and traffic estimation and prediction models. Visibility conditions have different influence on speed in different driving situations. In clear condition, drivers drive slower when they are behind another vehicle than when they overtake. In 60 meters of visibility conditions, there is no significant difference in speed between these two situations. However, drivers drive faster when they are behind another vehicle than when they overtake in 30 meters of visibility conditions. An explanation for this is that when drivers are driving behind a car in 30 meters of visibility, they have a visual frame. However, when they overtake they lose this visual frame. The INTRO project has demonstrated that safety indicators are one possible active safety system that could be used. Drivers could be warned of the risk and take actions to reduce and mitigate the risk, when the traffic condition is deemed as risky. One of the tasks of Work Package 5 was to develop a consolidated overview of the visions of the future with respect to use of the road transport systems and with specific relevance to intelligent roads. Technologies, existing or in development, allow an outline to be drafted of how the infrastructure will look during the next 30 years. Many technologies, unknown today, will have the potential to improve the infrastructures ability to measure, analyse, communicate, interact, or to drive. Progressively, technologies and developments clustered in the INTRO vision will enter our everyday life. One vision cannot fit in all types of network or road system functions. Within the INTRO vision of future intelligent roads, different vision facets are developed to fit with various road types and conditions encountered in Europe: urban motorway, urban radial road, interurban motorway, interurban road and rural road.
7

1 Introduction The unacceptably high number of accidents on European roads together with an increasing public demand for improved road capacity and comfort sets entirely new demands on road infrastructure. The costs of maintaining and developing the capacity of European road networks are ever increasing due to anticipated increases in freight transport demand and increased axle loads and traffic volumes.
The INTRO project aims to address the problems of road safety and capacity combining sensing technologies and local databases with real-time networking technologies. This will improve both road safety and capacity by providing rapid feedback of emerging problems to maintenance authorities and road users. Activities in INTRO were focussed on the following objectives:
Novel methods of surface safety monitoring: • Integration and testing of real-time warning systems at network level to achieve a
significant decrease in the number of accidents due to ”surprise effects” from sudden local changes in weather (e.g.: onset of ice and rain) resulting in low friction and hence skidding.
• Increasing drivers´ attention to low road friction by only a few percent may result in significantly higher reduction of accident rates due to its non-linear relationship.
• To reach these objectives Europe’s most advanced driving simulator will be used to optimise for driver responses to new types of information.
Traffic and safety monitoring • Combination of different sensor data (infrastructure or in-vehicle based, weather,
surface, etc.) will enable the estimations of entirely new real-time safety parameters and performance indicators to be used in traffic monitoring and early warning systems. This will result in a significant increase of traffic flow, decreased journey times and prevention of accidents, e.g. rear end collisions.
Intelligent pavement and intelligent vehicles • Innovative use and combination of new and existing sensor technologies in
pavements and bridges in order to prevent accidents, enhance traffic flows and significantly extend the lifetimes of existing infrastructure.
• A prolonged lifetime of high capacity roads could thus be obtained using novel methods for early warning detection of deterioration and damage of road surfaces.
Clustering and dissemination of results • A synergistic clustering action led by FEHRL (Forum of European National Highway
Research Laboratories) integrated results and shaped current and emerging practice with other national and international projects using the extensive network of the FEHRL institutes.
• Dissemination of results to users at a pan-European level was given a high priority in the project. This led to guidelines and implementation strategies for Intelligent Road Systems with a particular focus on the needs of Accession Countries and new member states.
Project work structure The INTRO project focused on applying and combining existing and new sensor technologies in a holistic way in order to significantly increase capacity and safety as well as improving the well being of road users. Accordingly the activities in INTRO are divided into six work packages, which are complementary and necessary in order to attain the project objectives:
8

Work package 1 Intelligent road systems: Current knowledge and implementation strategies Work package 2 Novel methods of surface safety monitoring: Work package 3 Pavement conditions from intelligent pavements and intelligent vehicles Work package 4 Traffic and safety monitoring Work package 5 Clustering, dissemination and implementation Work package 6 Management WP1 sought to consolidate the current knowledge and needs for intelligent roads related to safety and capacity improvements in technical Work Packages 2-4 as well as assessing the implementation potential of project results. Technical work packages 2-4, employed different research strategies using a problem driven innovative technological concepts combined with pilot tests in order to provide a holistic way to solve problems identified. WP 5 provided a strong connection to WP1-4 seeking to disseminate the results of the project and explore future visions, with special regards for the needs of the project network. Scope of the report This report is a final summary report and is part of Work Package 5. The aim of this report is to incorporate the main findings of all the Work Packages. It is hoped that the use of an overall report with all the major findings will facilitate a co-ordinated use of the findings. It is expected that the results of this project will be used at national level to guide policy to improve existing practice. Appropriate legislation at national or local level may then be drafted to formal implementation of the project results. The report is based on the texts of most deliverables published in the INTRO project. More detailed information on the findings can be found in these deliverables. The reference list at the end of this report gives an overview of the INTRO deliverables. The findings and results of the project are presented in the following structure. Firstly, it covers the outcomes of Work Package 1. It describes the state of the art and user needs for intelligent roads. Furthermore, it covers the analysis of scenarios, trends and drivers of change and the links between scenarios and the INTRO project. The second part of the report focuses on the applications to support infrastructure management. The research done in Work Package 3 focuses on using new sensors, both in situ and moving sensors, to get new information that can be added to the traditional monitoring schemes. Chapter 4 describes the work done in Work Package 2. It focuses on applications to support safety warnings. It also includes the development of the braking distance model used as input for other research done in the INTRO project. The next part of the report deals with applications to support traffic management, covered in Work Package 4. This Work Package focused on developing methodologies for predicting traffic conditions and for monitoring traffic safety. The final part of this report focuses on a vision of intelligent roads that was developed for the INTRO project. The report is intended to target groups that get in contact with traffic management and road operation on a regular basis. The report gives a general view of the outcomes of the INTRO project. The more technical details of the INTRO project can be found in the individual deliverables. Therefore, people who read this report do not have to be technically grounded in the world of transport and road operation.
9

2 Current Knowledge and Implementation Strategies
2.1 Consolidated state of the art and user needs INTRO Deliverable 1.1 Intelligent Road Systems – Consolidated State of the Art and User Needs reviews a selection of current technologies, practices and experiences. It also studies the needs of key users. It is a reference document that covers four main themes. Firstly, it provides a feedback on user needs. Structured interviews with a selection of road operators and traffic managers in Europe were held. This feedback allowed the INTRO project to ensure that its outputs can be tailored to meet the needs of these users. Secondly, a brief section on architecture development for ITS, including the proposed INTRO architecture, was added. Thirdly, an overview was made of selected relevant related projects, their activities and key results, in order to identify potential issues, findings and experiences related to INTRO’s work. Lastly, an overview was made of key technologies and systems related to intelligent roads.
2.1.1 User needs A wide variety of different users require consideration when planning intelligent road infrastructure and services. The main groups to consider are the road users and the road service suppliers, managers, funders and legislators. Another group to keep in mind is the intermediate users group, service providers and manufacturers other than operators/traffic managers responsible for the road. There are widely differing groups of user needs related to the main aims of the INTRO project. An example of this is driver awareness of sudden changes in road safety conditions. Other examples include driver and road operator information on pavement condition, bridge and tunnel safety and on road capacity and real-time information for road operators based on traffic data and safety status. Stakeholder interviews were designed to assess the key problems faced by a variety of different road operators and managers across Europe.The interviews also considered the solutions that they are implementing, planning or envisaging. They also assess the extent to which these are matched by the activities in the INTRO project. The questionnaire concentrated on general problems, measures and solutions proposed by the interview respondents. These include measures that have been implemented, are underway or planned or measures that simply are desired in the long term. Further focus was on the work of the three technical work packages in the INTRO project, asking what problems and solutions they have relating to each one. Results of the interviews show that some operators do not have their network fully fitted with intelligent infrastructure and are waiting for evaluation of existing solutions and equipment from research projects, such as INTRO, in order to help them choose equipment to deploy. Other operators have already deployed significant intelligent transport infrastructure and are waiting for innovative solutions to help them improve their systems. INTRO appears to conform quite well to the operators’ needs and expectations in terms of research themes. One main concern mentioned by operators that is not considered in INTRO is how to improve traffic flow on roads that experience recurrent and almost continuous congestion. Lastly, budget allocation is an important factor for most public operators. They regret that most of the time, credits coming from enforcement measures are not re-invested into safety equipment, but are used for other goals by national authorities.
2.1.2 Architecture The question, how to structure and build Intelligent Transport System (ITS), leads to the question of a practical and optimised architecture for traffic and road infrastructure
10

management and control. An ITS architecture is, in simple terms, a plan or picture describing the functions of each ITS element and how they interact with each other. The purpose of this plan is to provide guidelines for the planning, design or implementation of an ITS application. ITS architectures come in different forms and levels, ranging from specific structures, such as the layout of a communication system or the design principles for an individual ITS element, to high-level concepts representing the underlying framework of a whole project. Architectures are described in terms of elements, functions, procedures, interfaces, actors and interactions. Different architectural approaches are possible and in use. The following application fields concerning traffic and infrastructure are addressed by the overall approach of “Intelligent Roads”:
• Traffic Data Collection • Traffic Management and Control • Road Surface Condition Monitoring • Communication Networking
To generate the required performance multiple functions are necessary, covering different technologies and technical solutions:
• Driver Information • Infrastructure Protection • Safety Control & Enforcement • Emergency Response • Vehicle Probes and in situ sensors
The architecture presented in figure 1 is based on a top down approach using different layers:
• Space & Airborne Layer (Intelligent Monitoring and communication) • Traffic, Vehicle and User Layer (Intelligent Vehicle) • Road Infrastructure Layer (Intelligent Road) • Road Surface Monitoring Layer (Intelligent Pavement) • Management and Control Systems (Intelligent Centres)
The different work packages of the INTRO project address important aspects of the overall architecture, as marked and shown in the following diagram.
11

Figure 1: Layered architecture for INTRO (green sections are part of the INTRO project)
2.1.3 State of the art: technologies & sensors A review of sensors for vehicle, traffic and road status detection and registration systems with different sensors was made, also considering new technologies. The study includes important work like analysis and recommendation of technologies and systems – some product examples are also given. It addresses the following areas:
• Technologies for traffic and road condition measurement, control and surveillance systems
• Sensor technologies analysis and evaluation It should be noted that this review does not claim to cover every relevant technology and sensors, but it is a collection of key examples provided by the INTRO partners that are considered relevant to the technical work packages of this project. More detailed information on the results can be found in Deliverable 1.1: Intelligent Road Systems – Consolidated State of the Art and User Needs.
2.2 Scenarios, structure and potential short-term trends related to road transport in Europe
Deliverable 1.2 focuses on examining possible scenarios for road transport and looks at future needs in Europe for private and commercial transport on road networks. It explores the core challenges in safety, capacity and economy as well as short-term trends. Most transport commentators and experts, including partners within the INTRO project, generally accept that the expected overall trend and future scenario for roads will be:
12

• Increasing traffic on the one hand, combined with higher costs for fuel and road operation on the other hand; and
• more awareness and higher necessity for improved safety and economy. The degree to which these things will happen is open to debate, and is subject to many social, political and economic factors. However, these developments will generally lead to a situation whereby road networks will evolve from being an “inactive” pavement or concrete layer to an “interactive and communicative combined material and information road layer” including sensing and intelligence in cooperation with traffic in general and intelligent vehicles in particular.
2.2.1 Overview of scenarios and trends The perception, description of different situations and related parameters and their dynamics and changes over time and space is meant by “scenarios and trends”. Figure 2 summarizes the scenarios, trends and visions covered in Deliverable 1.2. Three “extreme” scenarios are shown as the corners of the triangle. Realistically, the future will not be one of these “extremes”, but somewhere in between them. Feeding demands and other factors into these visions at the top of the figure are the drivers for change and at the bottom the set of visions for intelligent road which originate both from the drivers and from the socio-political scenario mix.
Figure 2: Intelligent road solutions – effects circumstances, visions and solutions
2.2.2 Trends and drivers of change “Trends” look at different drivers of change. Different trends in different domains have to be considered in the anticipation of future:
• Technological developments on a microscopic level (sensors, processors and interfaces)
• Technological developments on a system level (vehicle design, automated vehicle systems, intelligent infrastructure, wireless short and medium range communication, etc.)
• Lifestyle and population changes • Economic developments and management of energy combined with changes in costs
13

• Environmental issues, including renewable energy use, as well as increasing temperature, pollution controls and climate change
• Safety issues, including accident rates and severity, control measures, education and attitudes, etc.
• Changes in production processes and freight transport in general. The key trends are:
• Energy change: Conventional fuel resources are finite and in the future petrol and diesel for road transport will become increasingly scarce, leading to dramatic increases in costs.
• Vehicle change: Single vehicles have already evolved from being purely “mechanical” to being “electromechanical”, with computer control. This is likely to evolve further to become an “interactive information, communication and sensor/actuator controlled driving system”, increasingly supporting the driver and automating the driving process on different levels.
• Road and traffic change: Road infrastructure, at least for key parts of the network with heavy traffic flows, is likely to change to intelligence-embedded layers. Furthermore, infrastructure will be more protected from deterioration.
• Interactivity between vehicles and the whole dynamic traffic flow on different levels will increase step by step to achieve more safe and co-operation controlled driving. The current traffic management centres should be completed by in situ and ad hoc traffic co-ordination and control systems, including enforcement of violations.
• Infrastructure operation change: Infrastructure cost allocation and schemes will change. In the future, users are likely to be increasingly charged according to driving patterns, time slots, demand and supply of road space and infrastructure maintenance and operation costs.
• Goods transport (heavy goods vehicles (HGV) on roads): If current trends continue, freight transport and quantities of HGVs on road networks will dramatically increase, unless considerable measures for stabilisation are introduced.
• Driving access change (restrictions and/or tolling): Availability and access to the road networks, or at least the busiest parts, will eventually change from a more or less open unlimited road system to a limited, rationed or pay-by-use access system.
• Safety change: Increased control and traffic management is almost certain in the future. This will result in traffic flow becoming smoother and safer. Driving would thus become more homogeneous and efficient, and a convergence of main international traffic rules is possible in the future.
• Environment and climate change: There is a two-way relationship between roads and the environment. On the one hand, there are the ways in which roads and traffic affect the environment. On the other hand, there is the question how the environment and climate can affect transport, and in particular roads.
• Technological drivers of change: Technological change is usually developed either to satisfy user desires, such as improved specification of cars, or government objectives, such as enforcement or pricing.
2.2.3 Scenarios Scenario development is not about predicting the future, but by looking at a range of plausible future frameworks, concerning issues such as transport, government, and society in general and the environment, and exploring what the impact of each scenario would be on the road transport sector in general, and the role of intelligent road systems in particular. Scenarios try to describe all the possible situations of external and internal factors influence on the “intelligent road” systems. They also try to give an answer how the systems demonstrated and recommended by the INTRO project can adapt or react to each of the scenarios. The role of intelligent road systems in the future could vary enormously according to the degree of control society is willing to accept in order to reduce the negative impacts of transport.
14

2.2.4 Links between scenarios and INTRO Surface safety monitoring (Work Package 2) The combination of different sensor data will enable the estimations of entirely new real-time safety parameters and performance indicators to be used in traffic monitoring and early warning systems. This will result in better methods for accident prevention. The correlation between friction and stopping distance will in particular be emphasised for surface safety parameters. Thanks to real-time data acquisition systems and dynamic information systems the road user’s safety and the information about the pavement surface condition will improve. The use of real-time weather data combined with road surface and accident databases will be of use to prevent accidents due to dangerous sections during certain weather conditions. The usability of a driver information system, warnings for unforeseen low friction and consequently an increase of stopping distance has been evaluated in this work package using simulator studies. For these studies, a human machine interface (HMI) was developed. Intelligent pavements and vehicles (Work Package 3) Road status monitoring is expected to increase significantly by means of in situ measurements combined with floating car data for distributed statistic patterns. Primary and secondary roads were covered. This is an important development as comprehensive road monitoring infrastructure can normally only be justified on busy and strategic routes. However, secondary roads comprise the majority of most networks, and increased monitoring by means of probe vehicles will be a cost-effective measure, enabling more efficient targeted maintenance, leading to road authorities optimising their resources. Traffic and safety monitoring (Work Package 4) The cost of installing fixed location sensors on the road network is very high and the trend is moving towards using mobile sensors such as a probe vehicle. The use of these mobile sensors is of lower cost, and they have the potential to provide a more comprehensive coverage of the road network. In the near future, when a high proportion of probe vehicles travel on the road network, it will be possible to send all the data collected on board of each vehicle to a server. Algorithms are developed to estimate the performance of the network, such as congestion level, amount of emission and travel time. This information will be useful to the road operator to select the best management strategy to deal with the traffic demand. With a rich and comprehensive data it is also possible to monitor the level of safety on the road network. In situations in which the traffic situation is judged as unsafe, action can be taken to reduce the risks. For example, scenarios such as high-speed difference between vehicles, high density and high-speed situation, and a platoon of vehicles travelling at very small headways could lead to unsafe situations. In these cases an alert could be send to drivers, so they will take extra precaution. More details on trends and scenarios can be found in INTRO Deliverable 1.2 Report on scenarios, structure and potential short-term trends (relating to road transport in Europe).
15

3 Applications to support infrastructure management The efficient operation and maintenance of the road network relies on the availability of accurate and up to date data information on road condition. The INTRO research focus on using new sensors, both in situ and moving sensors in the shape of probe vehicles to get new information that can be added to the traditional monitoring schemes. This new information is also of a dynamic nature that can be used for real time warning support. This chapter describes the use of probe vehicles in urban and rural areas to get information on road condition. Sensors mounted in the pavement to give information on condition is also tested, both in road and bridge environment.
3.1 Methods for measurement of pavement condition using probe vehicles
At present, specialist equipment is used in order to assess pavement condition and safety. Since these surveys are expensive and the specialist equipment is rare, the surveys are only carried out once or twice a year. Even though the information provided is highly accurate, the low frequency of the surveys can cause problems for the road operators. Rapidly deteriorating defects might go unnoticed until they are well developed and therefore more costly to maintain than would have been the case had they been detected sooner. Nowadays the vehicle industry provides standard production vehicles with a wide range of sensors, including GPS and better future communication links. These sensors are used by systems such as ABS, Adaptive Cruise Control and Active Suspension. The majority of modern vehicles share data from such sensors across different parts of the vehicle using the Control Area Network (CAN) and FlexRay. The information obtained by the sensors may be of use in maintenance and condition monitoring of road networks too. There is potential to either deliver the data from the CAN, for real-time assessment, or store the data for offline assessment of pavement condition in data loggers. The sensors are, however, not dedicated to this specific task. It is therefore likely that the information gathered by these sensors is less accurate than the information provided by the specialist equipment. Standard production vehicles could potentially be a cheap, abundant source of condition information for network managers. These vehicles would be referred to as “probe vehicles”. One of the tasks of the INTRO project is to demonstrate methods for the measurement of pavement condition using data extracted from probe vehicles. It was recommended that trials were undertaken to assess the potential for the use of data provided by typical sensors fitted to probe vehicles. Two trials were carried out, one in Sweden and another in the United Kingdom. Deliverable 3.1 of the INTRO project describes the collection, analysis and use of data from probe vehicles for the measurement of pavement condition. In Sweden, data was collected using two delivery service cars, equipped with the so-called Puma units, see figure 3. These Puma Data Acquisition Units store the CAN data, and the data can be extracted to a PC. The probe vehicles were monitored over a period of four weeks, with CAN data being recorded. It was found that all of the routes covered by the probe vehicles were in urban, and mostly inner city, environments in Göteborg.
16

Figure 3: PUMA, the CAN bus logger used in Sweden
From the Swedish trial it can be concluded that logging CAN bus data with the Puma Data Acquisition Units worked well. The equipment installed in the vehicles was simple and did not disturb the drivers. Furthermore, the technique to collect the CAN bus data worked very well with the GPS equipment. However, setting up the equipment can be unpredictable; in the initial tests three parameters were not stored due to a software bug. The UK trial used two standard vehicles; they employ many of the systems and sensors that are of interest in this work. An IRIS 1000 Data Acquisition Unit (DAU) was semi-permanently installed in the two vehicles. The DAU was set up such that logging commenced when the ignition was turned on, and ended when the ignition was turned off. Therefore the journeys of the drivers were automatically recorded without the requirement for any special action by the user. Although personal road vehicles, passenger-carrying vehicles (PCV) and heavy good vehicles (HGV) share many common systems and sensors, a number of sensors are specific to each type of vehicle. Due to differences in size, weight and number of axles the data collected from a system common to all types of vehicle may appear intrinsically different. It is also plausible that the vehicle type that provides data of most use will be different for each application of the data identified. Therefore, this trial also included one PCV, a bus operating on two or three different routes.This vehicle was also installed with a Data Acquisition Unit. Plans to collect data from an HGV vehicle were rejected after consultations with two potentially willing and interested parties revealed that the specifications of their vehicles were not suitable for the project’s needs.
Figure 4: IRIS 1000 Data Acquisition Unit
Of the data streams available from the car, the most useful were those that directly measured the vehicle’s dynamics, such as lateral acceleration, wheel speeds, steering angle and GPS positioning. The methods developed to identify poor pavement condition required knowledge
17

of the vehicle’s steering wheel angle and since this was not available for the bus, it was not possible to use the data collected from this vehicle to develop any analyse of road surface condition. However, it was possible to use GPS data from the bus, and this was used to show that the GPS was accurate enough to identify the location of road sections of interest. It has been possible to demonstrate a relationship between areas of poor surface condition and irregularities in the logged CAN data on rural roads, motorways and other major roads, by adopting a simple, first principles, approach to vehicle dynamics. Simple rules have been developed that predict the expected lateral forces and wheel speeds affecting the vehicle when driving normally in an instantaneously circular path. Logged exceptions to the prediction of lateral forces have been shown to occur in locations that correlate with the location of ‘poor’ roads surfaces. Strong correlation was also demonstrated between wheel speed deviations and the UK measure of ride quality. In the UK, ride quality is assessed using Enhanced Longitudinal Profile Variance (ELPV). Three ELPV values are calculated, to represent different features of riding quality – 3m, 10m and 30m, where the 3m ELPV reflects the presence of small undulations in the road and the 30m ELPV reflects long wavelength undulations (e.g. subsidence). Some correlation was also found between lateral acceleration deviations and rutting. A conclusion that can be drawn from the trials is that the “Intelligent Vehicle” concept, the use of probe vehicles, is probably not well suited for the urban and inner city environments. It is very difficult to separate exceptions in the CAN bus data arising from road defects, from those caused by road junctions, parked cars etc. An assessment of the repeatability of the measurements in the Swedish trial underlines this conclusion. Figure 5 shows data from repeated probe vehicle journeys carried out in a semi-rural area. Here the data shows that the vehicle and driver behaviour is similar in every case but one. However, Figure 6, which shows the results from repeat runs in an urban road area, shows much more variation between the journeys. There is much more braking and acceleration, which was especially the case for runs made in rush-hour traffic.
1.277 1.2775 1.278 1.2785
x 106
6.385
6.3855
6.386
6.3865
6.387
6.3875
6.388
6.3885
6.389x 10
6GPS (RT90)
0 2000 4000−3
−2
−1
0
1
2
3
4
Distance [m]
Acc
eler
atio
n [m
/s2 ]
Lateral acceleration
0 2000 4000−20
−10
0
10
20Yaw rate
Distance [m]
Rat
e [d
eg/s
]
0 2000 40000
20
40
60
80
100
120Rear left wheel speed
Distance [m]
Spe
ed [k
m/h
]
0 2000 40000
20
40
60
80
100
120Rear right wheel speed
Spe
ed [k
m/h
]
Distance [m]0 2000 4000
0
10
20
30
40
50
60
70Brake sensor
Distance [m]
Dis
tanc
e [%
]
0 2000 40000
5
10
15
20
25
30
35Brake pressure
Distance [m]
Pre
ssur
e [b
ar]
Figure 5: Repeated driver behaviour and related CAN- sensor data from rural road.
18
1.265 1.27 1.275
x 106
6.397
6.398
6.399
6.4
6.401
6.402
6.403
6.404x 10
6GPS (RT90)
0 5000 10000 15000−4
−2
0
2
4
Distance [m]
Acc
eler
atio
n [m
/s2 ]
Lateral acceleration
0 5000 10000 15000−30
−20
−10
0
10
20
30
40Yaw rate
Distance [m]
Rat
e [d
eg/s
]
0 5000 10000 150000
20
40
60
80
100
120Rear left wheel speed
Distance [m]
Spe
ed [k
m/h
]
0 5000 10000 150000
20
40
60
80
100
120Rear right wheel speed
Spe
ed [k
m/h
]
Distance [m]0 5000 10000 15000
0
20
40
60
80
100Brake sensor
Distance [m]
Dis
tanc
e [%
]
0 5000 10000 150000
5
10
15
20
25
30Brake pressure
Distance [m]
Pre
ssur
e [b
ar]
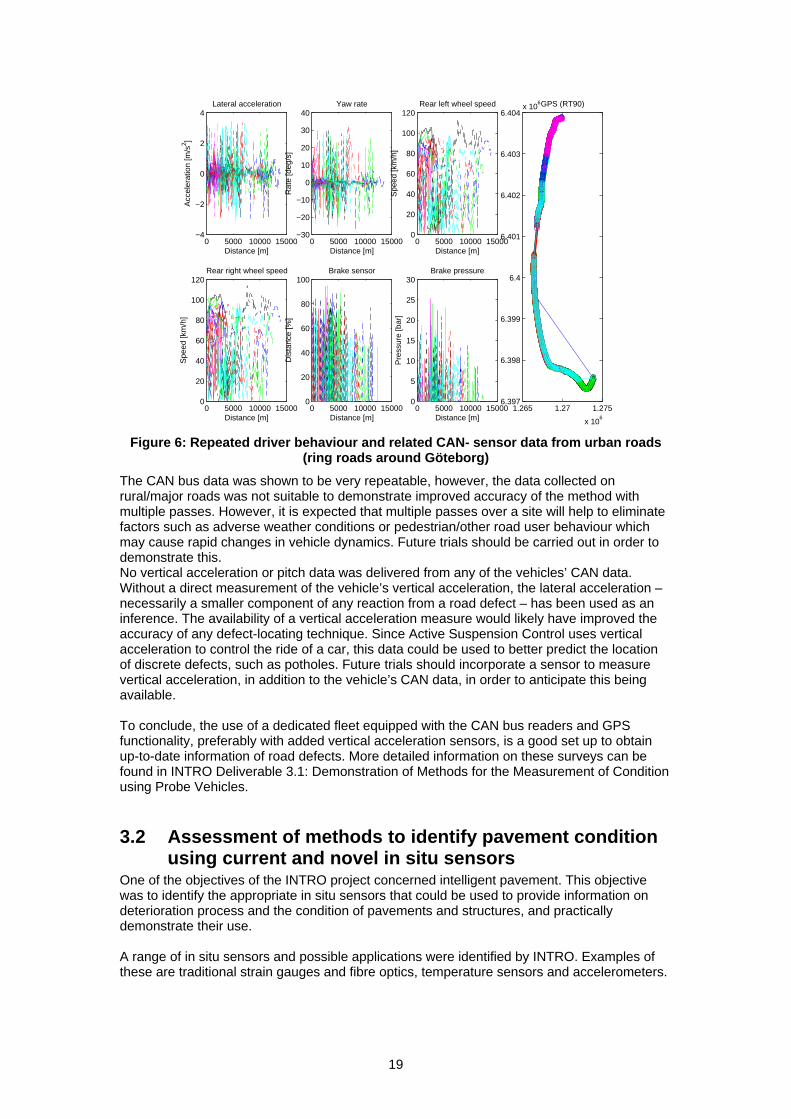
Figure 6: Repeated driver behaviour and related CAN- sensor data from urban roads
(ring roads around Göteborg)
The CAN bus data was shown to be very repeatable, however, the data collected on rural/major roads was not suitable to demonstrate improved accuracy of the method with multiple passes. However, it is expected that multiple passes over a site will help to eliminate factors such as adverse weather conditions or pedestrian/other road user behaviour which may cause rapid changes in vehicle dynamics. Future trials should be carried out in order to demonstrate this. No vertical acceleration or pitch data was delivered from any of the vehicles’ CAN data. Without a direct measurement of the vehicle’s vertical acceleration, the lateral acceleration – necessarily a smaller component of any reaction from a road defect – has been used as an inference. The availability of a vertical acceleration measure would likely have improved the accuracy of any defect-locating technique. Since Active Suspension Control uses vertical acceleration to control the ride of a car, this data could be used to better predict the location of discrete defects, such as potholes. Future trials should incorporate a sensor to measure vertical acceleration, in addition to the vehicle’s CAN data, in order to anticipate this being available. To conclude, the use of a dedicated fleet equipped with the CAN bus readers and GPS functionality, preferably with added vertical acceleration sensors, is a good set up to obtain up-to-date information of road defects. More detailed information on these surveys can be found in INTRO Deliverable 3.1: Demonstration of Methods for the Measurement of Condition using Probe Vehicles.
3.2 Assessment of methods to identify pavement condition using current and novel in situ sensors
One of the objectives of the INTRO project concerned intelligent pavement. This objective was to identify the appropriate in situ sensors that could be used to provide information on deterioration process and the condition of pavements and structures, and practically demonstrate their use. A range of in situ sensors and possible applications were identified by INTRO. Examples of these are traditional strain gauges and fibre optics, temperature sensors and accelerometers.
19

Special attention has been given to the ‘Mote’ technology. This technology, originally developed in the military field, combines some of the identified sensors with wireless communication technology. To demonstrate the use of the in situ sensors in combination with data analysis techniques, three trials were carried out; one in Switzerland, one in Sweden and another in Austria. Each test focused on certain techniques. The trial carried out in Lonay and Lausanne, Switzerland, focussed on a pavement health monitoring system. In Kindsjön, Sweden, the trial focussed on the determination of bearing capacity due to frost heave. And finally, the trial at Vienna Reichsbrücke, Austria, focussed on a bridge health monitoring system.
3.2.1 Pavement health monitoring system In Switzerland, trials have been carried out at two locations (Lonay and Lausanne) by measuring both strain gauges deformation at the bottom of the asphalt layers and weigh in motion (WIM). A separate analysis of the different data has preceded investigation of the possible correlations between asphalt layer deformations measured by strain gauges and axle load impacts of vehicles measured by WIM outputs.
Figure 7: Kyowa strain gauge
Figure 8: Lonay site WIM station
On the one hand, the WIM station provided accurate information on dynamic axle weight, speed and dimension of the truck. On the other hand, the strain gauges provided information over the deformation at the bottom of the asphalt layers. These sensors need to be installed at this interface, for fatigue assessment of the pavement. This means that the strain gauges need to be installed during the laying phase of the asphalt. Consequently, strain gauges are not easily installed in an existing pavement. In contrast, the WIM station is installed in the surface of the pavement. Thus, it can be easily installed in an existing pavement without significant deterioration. The expected lifetime and the current data acquisition of the two types of sensors also differ. The WIM station lifetime is expected to be at least as long as the lifetime of the pavement and a calibration is easy to be performed, for instance by calibration trucks. Concerning the data acquisition, the system is currently well developed and it is not necessary to go on the test site in order to retrieve data. The expected lifetime of strain gauges, however, is highly dependent of the temperature, load and humidity. This could be a main disadvantage of a road layer embedded in the pavement sensor system. The data acquisition is currently performed by using a laptop on the test site. However, a system with long distance communication could be developed in order to be able to retrieve the data from other locations. The measurements presented in Deliverable 3.2 show that a correlation between asphalt layer deformations measured by strain gauges and WIM data can be found. By measuring the strain at the bottom of the asphalt layer, it is possible to get information about the load of the truck. By using this information about the load and the measured deformation, the residual lifetime of the pavement could be calculated and compared with the threshold fixed by the road administration. This method can be effective and help road operators of highways with very important information on the actual load from trucks leading to better management. Even though the idea has real potential, there are some points that need to be developed further in order to achieve this. Firstly, regular calibration will be necessary. Secondly, the correlation
20

between load and deformation is very hard to be determined. Since more factors such as type of tyre, axle configuration and tyre pressure need to be taken into account; more accurate factors will lead to a better correlation. Lastly, the influence of weather conditions on the correlation needs to be investigated further. To conclude, the most preferred solution will be a specific “WIM station”, preferably placed at the bottom of the asphalt layer. The load sensors could, for instance, be replaced by deformation sensors. This specific measurement device will have to be installed during the laying phase. Reliability of this system and data acquisition procedure will have to be investigated.
3.2.2 Monitoring of bearing capacity during spring thaw An objective of the INTRO project that can be placed under the “intelligent pavement” objective is the improvement of the usability of low volume roads during thawing seasons. A problem in regions with cold climate is the need to close weak road sections with high levels of waters during spring thawing seasons. This causes significant economic losses for the forest industry since timber cannot be transported during several weeks. Road closures during this period cause the Swedish forest industry costs of 80 million Euro a year due to delays in the supply of timber. In Finland, half of the gravel road network suffers from thaw damage. It is estimated that every day with weight restrictions in Finland costs 0.2 Euro. Norway experiences similar problems. In Iceland, a typical winter involves several freeze/thaw cycles and weight restrictions occur even during mid-winter. A trial was carried out on a typical minor road at the Swedish test site Kindsjön. For this kind of minor roads the frost thaw period is the critical period due to reduced bearing capacity. Spring-thaw load restrictions can be imposed in order to avoid severe pavement deterioration. Currently, the load restrictions or road closures for heavy traffic is mainly based on subjective decisions of the local road authority. These decisions are based on local knowledge about pavement conditions, traffic volume and previous experience of spring thaw conditions. New equipment or new methods might enable flexible and temporary lifting of such restrictions when the pavement regains its strength during a period of time, even if it is only for a few hours. This will be of great importance for improved use of the roads, especially for the logging and paper industries that are major users of this kind of roads for timber transports. The collection of measured data of frost depth and frost thaw can be of help for the local road authority to make a more objective decision on load restrictions.
Figure 9: Moisture sensors in unbound pavement at the test site Kindsjön
The test was conducted on a typical Swedish minor road with very low volume of traffic. However, there can be periods with severe heavy traffic, for instance timber trucks. The road was built several years ago and the original design did not take the load of heavy vehicles that are used today into account. The test site was instrumented for measuring frost depth and thaw, pavement moisture and horizontal asphalt strain. The weather condition, including air and surface temperature, was also monitored. More details on this trial can be found in
21

INTRO Deliverable 3.2: Report on assessment of methods to identify pavement condition using current and novel in situ sensors. The result of the measurement at the test site shows good correlation between the pavement strain and the frost thaw depth. Thus, for low volume roads, like the test site, the frost depth and spring thaw is a good indicator of the bearing capacity of the pavement. The used instrument, (“Tjäl2004”), is a useful tool for road authorities in their task to regulate the heavy load traffic during the spring thaw period. The information obtained by the Tjäl2004 can be easily accessed online and distributed to road users and authorities. It is a new more flexible approach to load restrictions and road closing. Thanks to the online information the authorities can, on short notice, open and close the roads for short periods. This solution requires good communication between the road authorities and the road users, especially the users with heavy loads such as the logging and paper industries. A very good correlation between relatively strain and frost thaw was found in the trial. This kind of correlation is a first step to a general model for predicting the seasonal variation of bearing capacity on minor low volume roads. This will be a very useful tool for the road authorities. This model and the information about frost thaw together helps the road authorities with making a more objective decision about load restrictions on minor roads. The results of this trial are only taken from one pavement at one test site. More trials on different sites need to be carried out to validate the method of using frost depth to regulate load restrictions. The results so far have been very promising. This analysis was based on a trial on a road with thin asphalt pavement. However, the same approach could be used on gravel roads. The analysis should, then, be more focussed on the correlation between frost thaw and moisture.
3.2.3 Bridge health monitoring system Our bridges are a key factor for the traffic infrastructure and are important for a vital economic development and prosperity of the respective area or nation. Regarding the legislation and existing technical rules, the road/railway bridge authority is responsible for infrastructure development and, later on, for safe operation and regular maintenance. Inspection and maintenance is required to ensure safety and reliability of bridges in the traffic network. A continuous measurement of the road authorities can change from a preventive time-based to a predictive condition-based maintenance strategy. This shift reduces both the risk of a serious failure and the overall maintenance costs by excluding unnecessary inspection activities. The trial in Vienna researched whether permanent vibration monitoring is a good approach to maintain bridge safety or not. Moreover, it looked at the effect temperature has on natural frequencies of civil structures. It also looked at the difference in terms of sensitivity or accuracy when “wireless Mote technology” is used instead of wired accelerometers. A key feature of vibration technologies is to detect changes in the modal parameters, which are frequencies, mode shapes and damping coefficients, versus a reference measurement/simulation. The frequency-spectrum is temperature dependent. Thus, the development of a temperature dependent model will aid in observing the structural behaviour in terms of long time in situ monitoring. The Reichsbrücke is located in Vienna, Austria and it crosses the Danube River, connecting the northern district with the city. The bridge was instrumented with a permanent monitoring system, which consists of 4 triaxal, three axle, accelerometers, 4 strain gauges and 6 temperature sensors. The location of the sensors can be seen in Figure 11.
22

Figure 10: Bridge Reichsbrücke, Vienna
A major part of data processing is carried out automatically by software that was created specially for this purpose. The extraction of eigenfrequencies is one part of the automatic evaluation. It was shown that the measured eigenfrequencies of a healthy structure scatter due to known and unknown reasons. The known influences were incorporated into a frequency prediction model that gives an estimation of frequencies based on the operational condition of the bridge.
T T
Sensors: triaxial accelerometer + structural temperature strain gauge air temperature T
Figure 11: Sensor locations Frequency scattering has been observed during the trial in Vienna. The reasons of the frequency dissemination during normal bridge operation have been analyzed and the influence of temperature and traffic load has been shown. Frequency prediction models have been stated by evaluating the functional relationship between temperature and strain caused by traffic load and particular eigenfrequencies. The temperature has a major influence on the eigenfrequencies, whereas the influence of traffic load was less. The frequency prediction model “temperature+strain” was used. The use of this frequency prediction model reduced the dissemination level. The presence of systematic errors in the remainder of the scatter indicates a missing parameter for the prediction model. For future deployment it is important to prepare standards and norms. Moreover, it is of great importance to emphasize dissemination. At the moment the confidence of the road operators needs to grow. A strategic project monitoring a critical infrastructure, something that is at the end of its lifecycle could support a broader implementation. Secondly, a project conducting a full cost-benefit analysis or recommending optimization possibilities could increase the confidence. The international trend of maintaining structures will develop from a system fully relying on visual inspections and scheduled measures to a condition based maintenance planning. The latter will be based on objective structural health monitoring results. Wireless sensor networks have the potential to change the perception of structural health monitoring, because there are many advantages. Decreasing hardware costs, thanks to the economized cabling, enable disperse deployment. Furthermore, ubiquitous intelligent sensors can accomplish various tasks. For the technology to be able to monitor structurally, a specific level of sensor sensitivity and available sampling rate is needed. This will deduce significant objective parameters
23
To conclude, permanent monitoring of bridges by use of in situ sensors is a promising technique to support maintenance and guarantee safety and reliability. To support future deployment scenarios by strategic research activities it is important to define standards and norms. Furthermore, it is important to emphasize dissemination. To successfully implement the permanent monitoring, the confidence of the road operators needs to grow.
3.2.4 Innovative technologies for determining the deterioration process of pavements
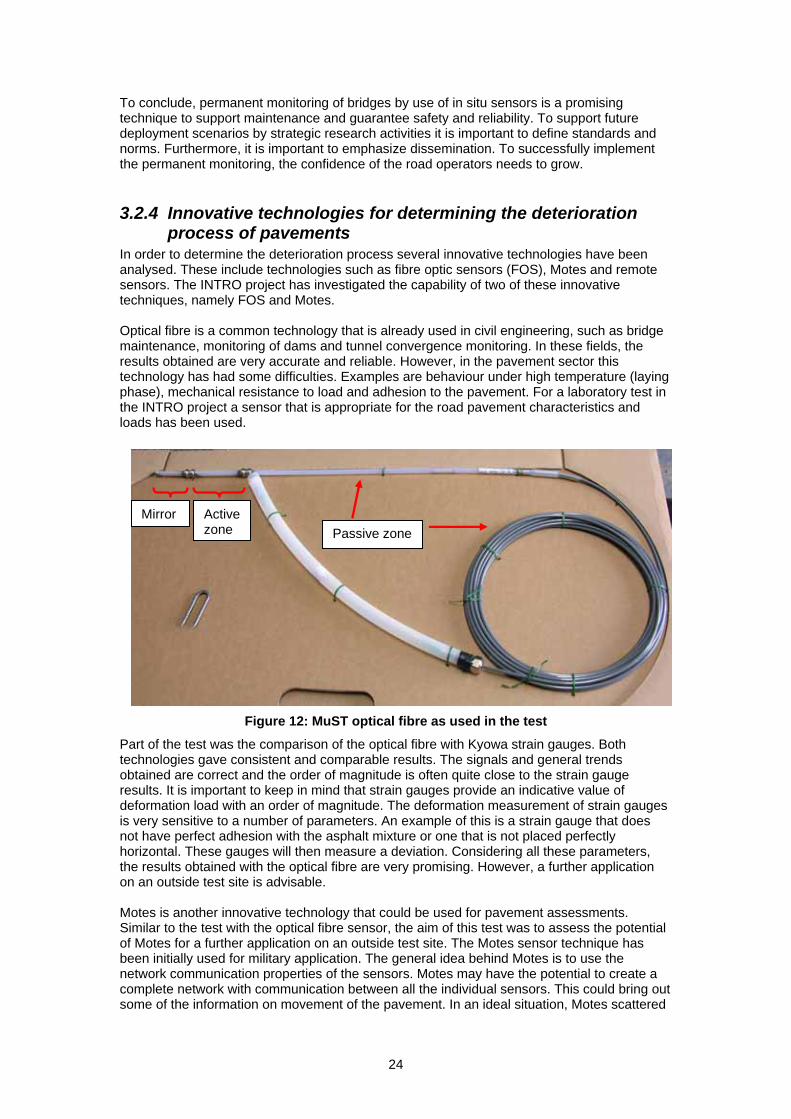
In order to determine the deterioration process several innovative technologies have been analysed. These include technologies such as fibre optic sensors (FOS), Motes and remote sensors. The INTRO project has investigated the capability of two of these innovative techniques, namely FOS and Motes. Optical fibre is a common technology that is already used in civil engineering, such as bridge maintenance, monitoring of dams and tunnel convergence monitoring. In these fields, the results obtained are very accurate and reliable. However, in the pavement sector this technology has had some difficulties. Examples are behaviour under high temperature (laying phase), mechanical resistance to load and adhesion to the pavement. For a laboratory test in the INTRO project a sensor that is appropriate for the road pavement characteristics and loads has been used.
Mirror Active zone Passive zone
Figure 12: MuST optical fibre as used in the test
Part of the test was the comparison of the optical fibre with Kyowa strain gauges. Both technologies gave consistent and comparable results. The signals and general trends obtained are correct and the order of magnitude is often quite close to the strain gauge results. It is important to keep in mind that strain gauges provide an indicative value of deformation load with an order of magnitude. The deformation measurement of strain gauges is very sensitive to a number of parameters. An example of this is a strain gauge that does not have perfect adhesion with the asphalt mixture or one that is not placed perfectly horizontal. These gauges will then measure a deviation. Considering all these parameters, the results obtained with the optical fibre are very promising. However, a further application on an outside test site is advisable. Motes is another innovative technology that could be used for pavement assessments. Similar to the test with the optical fibre sensor, the aim of this test was to assess the potential of Motes for a further application on an outside test site. The Motes sensor technique has been initially used for military application. The general idea behind Motes is to use the network communication properties of the sensors. Motes may have the potential to create a complete network with communication between all the individual sensors. This could bring out some of the information on movement of the pavement. In an ideal situation, Motes scattered
24
in the pavement during the construction would permit assessment of the movement and deterioration of that pavement.
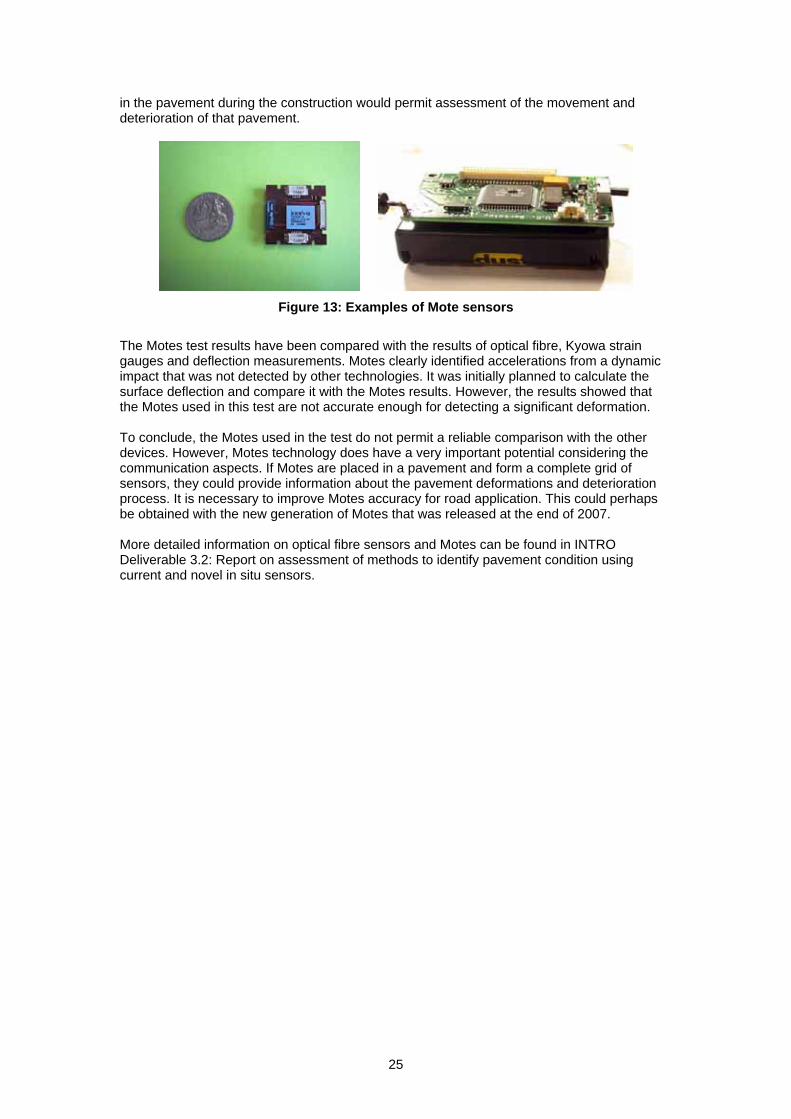
Figure 13: Examples of Mote sensors
The Motes test results have been compared with the results of optical fibre, Kyowa strain gauges and deflection measurements. Motes clearly identified accelerations from a dynamic impact that was not detected by other technologies. It was initially planned to calculate the surface deflection and compare it with the Motes results. However, the results showed that the Motes used in this test are not accurate enough for detecting a significant deformation. To conclude, the Motes used in the test do not permit a reliable comparison with the other devices. However, Motes technology does have a very important potential considering the communication aspects. If Motes are placed in a pavement and form a complete grid of sensors, they could provide information about the pavement deformations and deterioration process. It is necessary to improve Motes accuracy for road application. This could perhaps be obtained with the new generation of Motes that was released at the end of 2007. More detailed information on optical fibre sensors and Motes can be found in INTRO Deliverable 3.2: Report on assessment of methods to identify pavement condition using current and novel in situ sensors.
25

4 Applications to support safety warnings Low friction road sections cannot always be easily perceived by drivers, thus constituting great danger in everyday road traffic. Therefore, the research in INTRO related to safety is focused on friction issues. The use of extended floating car data (xFCD) in combination with static data is one subject that INTRO has tested. The data from the floating car is focused on friction. Models for stopping distances have been developed. The human machine interface (HMI) has been investigated and an interface has been proposed. This was done using tests in the VTI simulator. A complete set up, merging static and dynamic information and sending out warnings to drivers has been shown. The warnings have at least two responders, the driver and the road manager.
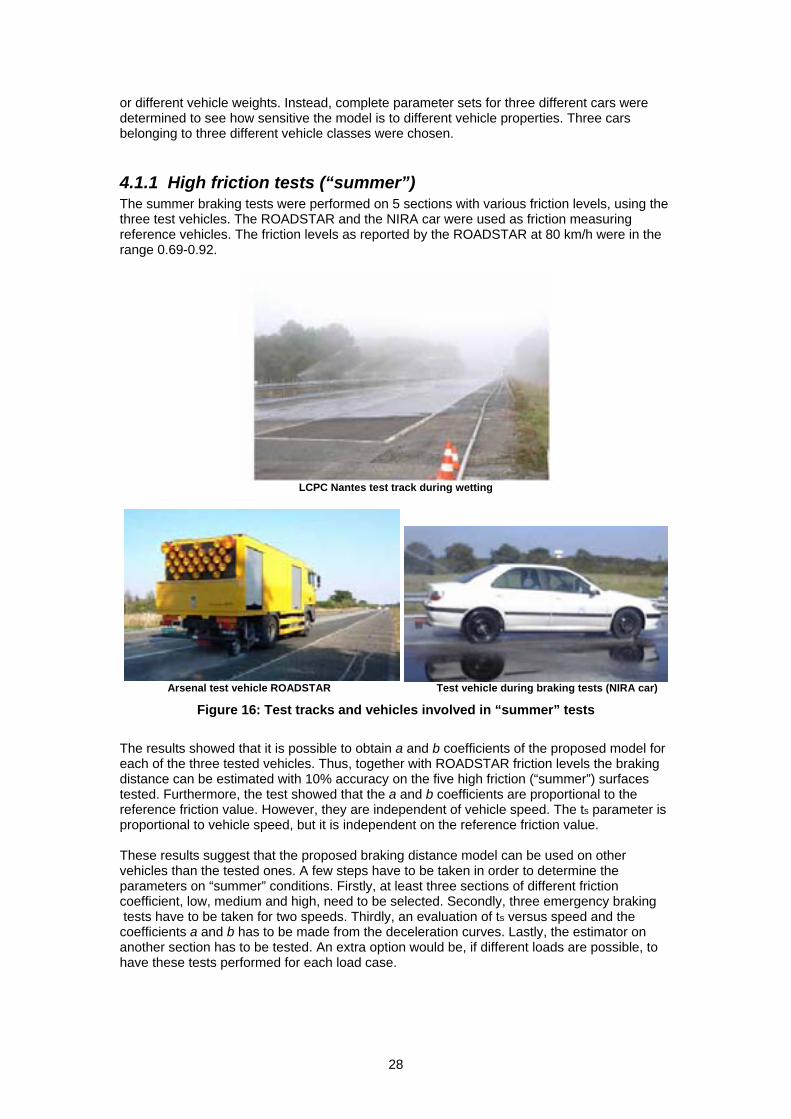
4.1 Model for estimating expectable braking distance Pavement skid-resistance is an essential factor of road safety. It is defined as the maximum value of the coefficient of friction between a wheel and the pavement surface. As the friction coefficient itself may be a concept that is too abstract for the driver to understand during driving, it would be desirable to have a more intuitive measure of the available grip between tyres and the road. It has been one of the purposes of the INTRO project to link pavement skid-resistance to vehicle braking distance. It should be noted that even if the relationship between skid-resistance and braking distance is intuitive, its quantification is not straightforward. Braking distance depends on more factors than pavement skid-resistance alone. These factors include e.g. vehicle types, braking system and type of tyre. A realistic model to predict braking distance had to be developed. The model has to be simple enough to be easily implemented in a warning system. A procedure to estimate the braking distance of a passenger vehicle using a reference friction value as input has been developed. The procedure has been tested and validated on both high and low friction surfaces (summer and winter conditions) using two different types of vehicles. The first type of vehicle makes use of a fifth wheel to monitor the tyre/road friction. Examples of this type of vehicles are Arsenal’s ROADSTAR and VTI’s BV12, see figure 16 and 17. The second type is a passenger vehicle equipped with a prototype friction-estimation method developed by a Swedish Company, NIRA Dynamics AB. This method provides maximum tyre/road friction from the knowledge of wheel slip and friction forces mobilised during car movements. Vehicles equipped with this technology are referred to as “NIRA cars” further in this report. The braking distance is defined as the distance passed by the vehicle from the moment the driver puts pressure on the brake pedal until the moment the vehicle comes to a complete stop. One of the factors that determine the braking distance is the pressure that is applied on the brake pedal. Therefore, it can be said that the braking distance is driver dependent. The model developed and validated in the INTRO project concerns a panic braking situation where maximum possible pressure is applied on the brake pedal. The total stopping time comprises both the braking distance and the distance travelled in the time between the moment the driver reacts to an emergency and the moment the driver starts hitting the brakes. It is, therefore, important to realize that the stopping distance can be much longer than the actual braking distance. The proposed braking distance model is based on a simplification of the deceleration curves in two regions: a transient and a stabilized region. This is shown in Figure 14. Key values of the model are transient time ts, and coefficients a and b, where the coefficients represent the link between the vehicle and the reference vehicle. The transient time ts is affected by the choice of brake system of the vehicle, but could also depend on the vehicle’s weight and the type of tyres.
26

Figure 14: Measured deceleration curve and approximation
Since part of the INTRO project deals with slippery risks due to water, snow or ice, the model has two components: “summer” and “winter”. This is shown in Figure 15. Theoretically, both components must use the same input. However, their development was executed as two separate sub-tasks. This is because the physical phenomena during tire/wet road and tyre/ snowy or icy road contacts are not the same. This difference can have significant consequences on a, b and ts determination. The “summer” part covered wet asphalt surfaces with friction values ranging from intermediate to high. On the other hand, the “winter” part covered icy and snowy surfaces with low to intermediate friction levels. Ideally, there should have been a crossover between the intermediate friction intervals of “summer” and “winter” surfaces to see whether wet surfaces and snow surfaces with the same friction coefficient results in identical parameter values, or if there is a fundamental difference. Unfortunately this was not possible.
Deceleration-curve approximation
µmax
ts
a
b
Summer part Winter part
µmax
ts
a
b
Estimated braking-distance
Braking speed
Probe car
Summer friction-monitoring device
Probe car
Winter friction-monitoring device
Braking speed Braking speed
Braking system Braking system
Deceleration-curve approximation
µmax
ts
a
b
Summer part Winter part
µmax
ts
a
b
Estimated braking-distance
Braking speed
Probe car
Summer friction-monitoring device
Probe car
Winter friction-monitoring device
Braking speed Braking speed
Braking system Braking system
Figure 15: Braking distance model flowchart
The parameters of the model were determined in a test. It has to be said that only one type of tyre, an all season tyre, was used for this trial. Furthermore it was not possible to distinguish between the individual effects on the parameter values from using different braking systems,
27
or different vehicle weights. Instead, complete parameter sets for three different cars were determined to see how sensitive the model is to different vehicle properties. Three cars belonging to three different vehicle classes were chosen.
4.1.1 High friction tests (“summer”) The summer braking tests were performed on 5 sections with various friction levels, using the three test vehicles. The ROADSTAR and the NIRA car were used as friction measuring reference vehicles. The friction levels as reported by the ROADSTAR at 80 km/h were in the range 0.69-0.92.
LCPC Nantes test track during wetting
Arsenal test vehicle ROADSTAR Test vehicle during braking tests (NIRA car)
Figure 16: Test tracks and vehicles involved in “summer” tests
The results showed that it is possible to obtain a and b coefficients of the proposed model for each of the three tested vehicles. Thus, together with ROADSTAR friction levels the braking distance can be estimated with 10% accuracy on the five high friction (“summer”) surfaces tested. Furthermore, the test showed that the a and b coefficients are proportional to the reference friction value. However, they are independent of vehicle speed. The ts parameter is proportional to vehicle speed, but it is independent on the reference friction value. These results suggest that the proposed braking distance model can be used on other vehicles than the tested ones. A few steps have to be taken in order to determine the parameters on “summer” conditions. Firstly, at least three sections of different friction coefficient, low, medium and high, need to be selected. Secondly, three emergency braking tests have to be taken for two speeds. Thirdly, an evaluation of ts versus speed and the coefficients a and b has to be made from the deceleration curves. Lastly, the estimator on another section has to be tested. An extra option would be, if different loads are possible, to have these tests performed for each load case.
28

4.1.2 Low friction tests (“winter”) The “winter” braking tests were performed on two different surfaces, polished ice and packed snow, using the NIRA car. The BV12 and the NIRA car were used as friction measuring reference vehicles. The friction level reported by the BV12 at 15% slip at various speeds had an average of 0.11-0.015 on ice and 0.37-0.02 on snow. The NIRA car reported a friction level of 0.41-0.09 on snow.
Ice track at Colmis test centre
VTI test vehicle BV12 NIRA car with speed sensor mounted at the front
Figure 17: Test tracks and vehicles involved in “winter” tests
In the “winter” tests, it was possible to obtain a and b coefficients of the proposed model for braking with the NIRA car on ice. Thus, together with BV12, friction levels at 15% slip the braking distance could be estimated within 20% accuracy. Together with NIRA friction levels at the braking, distance can be estimated within 28% accuracy. Furthermore, it was possible to obtain a and b coefficients of the proposed model for braking with the NIRA car on snow. Thus, together with BV12, friction levels at 15% slip the braking distance can be estimated within 10% accuracy. The best fit is obtained by the use of the same value for a and b. This value is the same for both ice and snow. This suggests that, for low friction at least, this is not friction dependent. No dependence on vehicle speed was found for the ts parameter. No friction dependence on the ts parameter could be established, since only two test surfaces were available. Although, it can be said that ts takes a low value on ice and a higher one on snow. To conclude, the values of the parameters for low and high friction cannot be directly compared, because different test vehicles have been used. Therefore, it is not possible to draw the conclusion that a common set of parameters can be used with the model for estimating the braking distance in both “summer” and “winter” conditions with only a reference friction value as input. Additional input regarding the road conditions (ice, snow, wet or dry) is needed. More testing is needed, using surfaces with a friction level somewhere between pure polished ice and packed snow, as well as really low friction asphalt surfaces. This will lead to a conclusion whether a reference friction value is enough for braking distance estimation or not. More detailed information on the braking distance can be found in INTRO deliverable 2.1: Model for estimating expectable braking distance.
29

4.2 Data model for road safety related data One of the purposes of the INTRO project is to increase the safety of European roads. Road safety related to skidding may be improved with the help of an intelligent combination of sensor technologies and central databases utilizing real-time networking technologies. Road maintenance authorities will be able to react in a more flexible way to unfavourable road conditions. One of the aspects of INTRO Work Package 2 “Surface Safety Monitoring” was to develop a data model for road safety related data. This model forms the basis for processing static and dynamic data that contain road safety information. An example of dynamic data is extended floating car data (xFCD). Dynamic data could include various types of content; in the INTRO project it is current road friction information, whereas static data, for instance, is information about road geometry. On the one hand, the requirements of the model consist in clearly structured storage and processing of data. On the other hand, it involves high-performance delivery of data to any kind of end user. In the INTRO project, two representative types of end users are specified. The first type is drivers of vehicles with mobile communication to a central server. Authorities responsible for road maintenance are the second type of end users.
Figure 18: Overview of system architecture
In Figure 18, it is shown that road safety information will eventually play a central role in the “real-time information to driver” and “GIS-interface road condition” pilot projects. Currently, several data models in the field of traffic information are in use for very specific fields of application. Data models from navigation data providers or from the Geographic Information Technology (GIS) field are well known examples. EU projects such as EuroRoadS and NextMAP have developed data models. The EuroRoadS model is a quality model that aims to ensure quality from the moment the data is collected until its final delivery to the end user. In the NextMAP project, required data content, geo-objects and geometric precision were examined for the benefit of various assistance systems. Most of the existing data models are highly specialized, while other models are either clandestine or proprietary. From this point of view, there is currently no authoritative or readily acceptable data model that meets the special requirements of INTRO. Data models that deal with dynamic data have special demands. Specific requirements of users of decision support systems, road maintenance authorities and those of end users of a road safety information
30

service have to be considered when defining an appropriate data model. Interfaces that ensure a high degree of compatibility have to be developed. In the INTRO project, a data model was developed that processes both static data, such as GPS coordinates and road condition parameters, and dynamic data, (Extended Floating Car Data), on a central server. When this information is processed, the final results are sent in real-time, in the form of Warning Distances and Hot Spots, to potential end users. Hot Spots are segments of bad road conditions. They form the basis of early danger detection by road maintenance authorities, and thus preventive measures can be taken. For future users of high-quality traffic telematic services it is important that the data is up to date. This means that, for future road condition services, road condition parameters must be collected on a regular basis. Highly accurate information can only be transferred to the end user in real-time if current data is available. The acceptance level of a system like this drops rapidly if road safety information does not reach the end user in time or is completely lost. Other important user requirements are completely and extensively available databases. High-quality information must be featured at all stages of the digital road network in order for road maintenance authorities and end users of telematic services to benefit from it. This applies to high and low level road networks as well as to all necessary attributes, such as road condition parameters. The handling of dynamic data proved to be an innovative challenge in this context. At first, the constantly changing dynamic parameters, Extended Floating Car Data, have to be integrated using appropriate Net-Matching Processes located on the central server. Next, the parameters are matched with already integrated static data. Special algorithms are executed on the server. These calculations result in Warning Distances that allow the end user to react in a timely manner to road conditions. Another result is Hot Spots information, which will be available for road maintenance authorities via a GIS-interface. Suitable interfaces were defined in order to integrate, to export static and dynamic data, as well as to make this data available. One of the objects of INTRO Work Package 2 was the creation of a Digital Road Network. The Digital Road Network for Traffic Telematic Services is the central content level where the complete static and dynamic contents are located. In the reference system, the geometric aspect of the traffic network is mapped using the simplest possible structure. This ensures that the basis is modelled using simple lines, edges, as well as the topological correlation to these lines, nodes. This is called network topology based on edges and nodes. In order to model all static and dynamic aspects, four databases were created to manage the entire content. These four databases are the Road Network Database, the Street Segment Database, the Attribute Database and the Service Database. These four databases could be technically implemented into one database in the future.
31

Figure 19: Server: Databases and Interfaces (red lines)
The Road Network database is subject to a constant update process, which can only be carried out via specific tools. In this project, the SKAT straßennetz (PRISMA solution’s Software for Road and Traffic division) is used to process the Digital Road Network. SKAT facilitates the administration of the Digital Road Network. Complete changes in the flow of traffic, changes in street names, changes of responsibility and the like can be implemented. A consequential history log feature ensures that transactions can at any time be fully restored and reconstructed. Processing procedures are saved directly in the Road Network Database. Figure 19 shows an outline of PRISMA solution’s software for road and traffic division, SKAT straβennetz. This proved to be a very efficient tool and interface to static and dynamic data. The use of this software guaranteed efficient administration of the Digital Road Network at time during the project. To conclude, the creation of a data model for road safety posed an innovative challenge for all parties concerned. The integration of dynamic Extended Floating Car Data into the data model was an important consideration while designing databases capable of meeting already defined user and data model requirements. It is important that this logic is implied while designing such a model; otherwise databases created from this model will fail to meet expectations. Data saved in such databases will not be convertible to useful information. For this reason, each stage of this study was carefully monitored, from the collection and evaluation of data and the efficient and flexible construction of databases to the tools used to process static and dynamic data. In addition, quality criteria were put in place to supervise the handling of sensitive information. With this information, it is expected that the project can make a valuable contribution to the safety of all road users as well as a reduction of traffic related fatalities. Real-time information poses a great challenge for all database designers. However, in the INTRO project, the consortium now has a model that meets and supports every necessary requirement. A more detailed description of this project can be found in INTRO Deliverable 2.2: Data model for road safety related data.
32

4.3 Simulator study, evaluation of impact on safety The main aim of the simulator study in the INTRO project was to investigate how a low friction warning system in vehicles would influence traffic safety, and to identify the interface with the highest potential to increase traffic safety in low friction conditions. The braking distance model which was determined in other tasks within Work Package 2, see chapter 3.1, was used as a base for the low friction warnings in this test. The study was conducted in Simulator III at VTI, a high-tech moving-based driving simulator with linear motion in lateral direction. The simulator has three rear-view mirrors and a frontal viewing angle of 120°.
Figure 20: The VTI Driving Simulator III. The arrows indicate possible movements.
The two main between-subjects factors were the human-machine interface (HMI design) with three levels and timing of the warning with two levels. The HMI solutions were designed to be rather different from each other, while using the same modalities. One solution is based on presenting the actual and a future stopping distance. This solution, therefore, leaves the decision of a “safe” stopping distance to the driver. The second solution is based on presenting a “recommended maximum speed”. This implies that the maximum safe stopping distance is determined by the system. It is based on posted speed limit. The resulting recommended speed is displayed. The third solution tells the driver only whether there is going to be low friction or not, without giving more detailed information. A control group drove without any low friction warning system.
Stopping distance Recommended maximum speed
33

Qualitative information
Figure 21: The HMI solutions used in the test
The warning appeared with time headway of 3 seconds, short timing, or 6 seconds, long timing, until the driver reached the position where the recommended speed became lower than the posted speed limit. The different HMI solutions were presented to the participants as follows: Stopping distance It was important to consider that the stopping distance should not only include the actual stopping distance, but also inform the driver in some way that it is going to change in the future. It should not involve the driver’s having to monitor the display for changes over a prolonged period of time (which could provoke dangerous distraction incidents). The stopping distance was displayed within the speedometer as presented in Figure 21. The length of the yellow bar represents the actual stopping distance, while the length of the blue bar represents the stopping distance either 3 or 6 seconds from now (depending on timing condition). The length of the bars changed continuously, depending on the friction values on the road. The bars indicating the stopping distance did not have a scale. This was to avoid that drivers would rely on absolute numbers, but rather let them learn over time which stopping distance length feels “comfortable”. Recommended maximum speed The representation of a recommended maximum speed, see Figure 21, takes the concept of stopping distance one step further, because for this case a recommended maximum stopping distance has to be decided upon by the experimenters (or, for production, by the system designers or users via an interface). An advantage with a recommended max speed was, that it was not necessary to present data for “just now” and “in a few seconds”, but the recommended speed implied that the driver had to adjust his/her speed, such that an adequate speed was reached a few seconds after presenting the recommended speed display. In the simulator study the car was able to get information about the posted speed limit from the environment. Therefore it was decided never to display a recommended speed above the current speed limit on the road. The presented recommended speed could, however, lie above the actual speed. In order to reduce the incentive to drive exactly at the highest recommended maximum speed it was decided to blur the transition between “safe” and “unsafe” speed by letting the colour shift smoothly from green to red. This was done to motivate the driver to keep a “safety margin” to the red area, bearing in mind that the recommended speed can decrease. The blurred area reached from -5 km/h to +5 km/h around the computed maximum recommended speed. Qualitative Warning for Low Friction The qualitative warning for low friction was the standard “slippery road” sign, which was illuminated x seconds before the driver reached the slippery patch (Figure 21). The needed in-data for this display were the actual vehicle speed, the computed recommended speed, and the timing group (whether the current participant belonged to those with short timing or long timing). When the recommended speed did not equal the posted
34
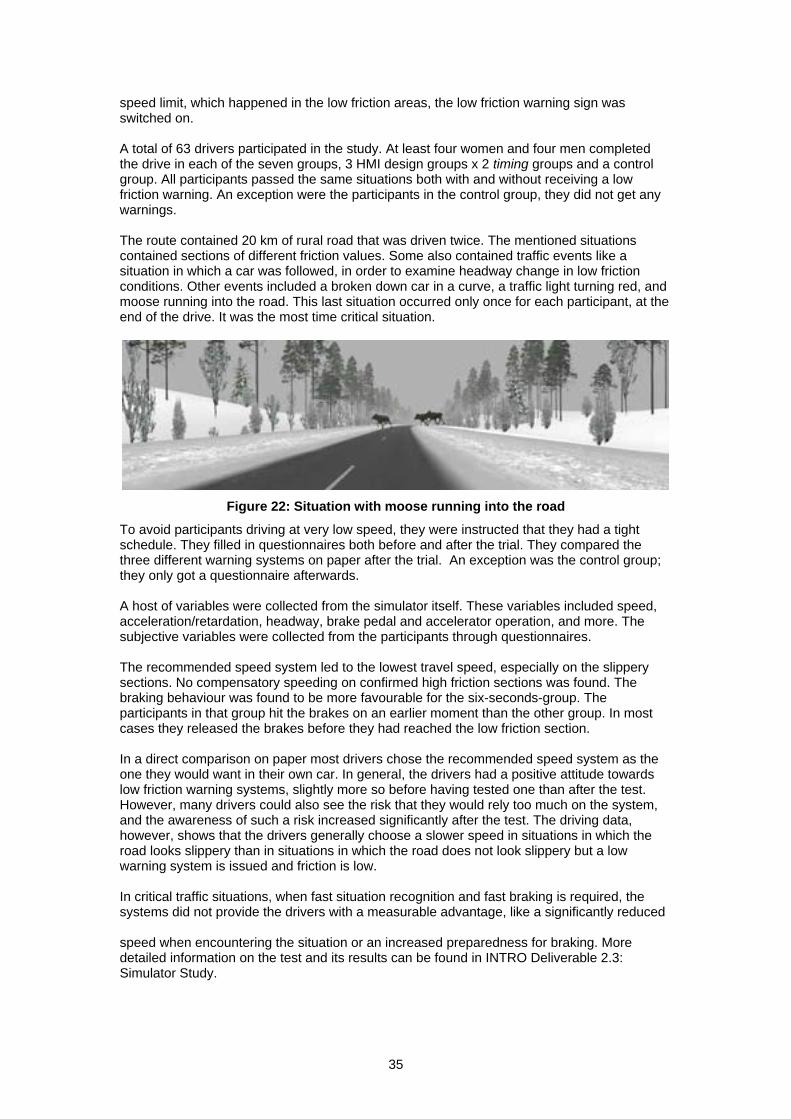
speed limit, which happened in the low friction areas, the low friction warning sign was switched on. A total of 63 drivers participated in the study. At least four women and four men completed the drive in each of the seven groups, 3 HMI design groups x 2 timing groups and a control group. All participants passed the same situations both with and without receiving a low friction warning. An exception were the participants in the control group, they did not get any warnings. The route contained 20 km of rural road that was driven twice. The mentioned situations contained sections of different friction values. Some also contained traffic events like a situation in which a car was followed, in order to examine headway change in low friction conditions. Other events included a broken down car in a curve, a traffic light turning red, and moose running into the road. This last situation occurred only once for each participant, at the end of the drive. It was the most time critical situation.
Figure 22: Situation with moose running into the road
To avoid participants driving at very low speed, they were instructed that they had a tight schedule. They filled in questionnaires both before and after the trial. They compared the three different warning systems on paper after the trial. An exception was the control group; they only got a questionnaire afterwards. A host of variables were collected from the simulator itself. These variables included speed, acceleration/retardation, headway, brake pedal and accelerator operation, and more. The subjective variables were collected from the participants through questionnaires. The recommended speed system led to the lowest travel speed, especially on the slippery sections. No compensatory speeding on confirmed high friction sections was found. The braking behaviour was found to be more favourable for the six-seconds-group. The participants in that group hit the brakes on an earlier moment than the other group. In most cases they released the brakes before they had reached the low friction section. In a direct comparison on paper most drivers chose the recommended speed system as the one they would want in their own car. In general, the drivers had a positive attitude towards low friction warning systems, slightly more so before having tested one than after the test. However, many drivers could also see the risk that they would rely too much on the system, and the awareness of such a risk increased significantly after the test. The driving data, however, shows that the drivers generally choose a slower speed in situations in which the road looks slippery than in situations in which the road does not look slippery but a low warning system is issued and friction is low. In critical traffic situations, when fast situation recognition and fast braking is required, the systems did not provide the drivers with a measurable advantage, like a significantly reduced speed when encountering the situation or an increased preparedness for braking. More detailed information on the test and its results can be found in INTRO Deliverable 2.3: Simulator Study.
35

The results indicate quite clearly that the recommended speed display in combination with a timing of six seconds leads to the most favourable driving behaviour with respect to traffic safety. Speed is reduced when a warning is given, and to a certain extent also when no warning is present. This can be seen as a carry-over effect. In most cases in the six seconds timing condition group, the drivers had already released the brake pedal when they reached the slippery surface section. This is a positive reaction, since braking on low friction should be avoided. The subjective results obtained from the questionnaires go hand in hand with the results derived from the driving behaviour. Drivers reduce their speed more when a low friction warning is accompanied by a road surface that looks slippery than in a situation where the look of the road surface does not change. This can be seen as an indication of certain mistrust in the warning system. However, drivers test brake only rarely to check whether the system informed them correctly or not. A very important question is how drivers will adapt their behaviour to a low friction warning system in the long run. Special emphasis should be put on an investigation of possible compensatory speeding in locations with confirmed high friction. However, other aspects, such as whether drivers tend to drive more on low friction roads or even whether they drive more in adverse weather conditions in general or not, have to be examined too. Further research is necessary to see how false alarms and misses influence system acceptance and driving behaviour. Misses are probably more safety critical than false alarms, but if the drivers do not trust the system, acceptance will be low.
Asphalt over ice patches Completely icy surface
Icy surface with tracks Icy surface with tracks
Figure 23: Visual representation of different road surfaces
36

5 Applications to support traffic management Efficient traffic management relies on up-to-date information about the state of the road network. More traffic data sources and other data sources become available. Thus, a more accurate estimation and prediction of road traffic conditions utilising all data sources is essential to reduce congestion and increase traffic safety. This part of the INTRO project focuses on developing methodologies for predicting traffic conditions and for monitoring traffic safety. These methodologies use data measured from traffic sensors and floating car data. Data fusion methodologies on combining data from multi sources to predict travel time and traffic safety are investigated. The effect of weather on traffic conditions is also an important factor in this part of the INTRO project. Another factor that is addressed in this part is the development of safety indicators to monitor traffic safety using traffic sensor data.
5.1 Traffic indicator needs: single source and data fusion estimation models
As preparation for the project, an inventory of traffic and safety indicators, methods for their computation or estimation and existing data sources for sensor-based measurement of traffic parameters has been compiled. One indicator related to road network global conditions (stopping distance), one indicator related to supply (road capacity), two indicators related to demand-supply interaction (traffic density and travel time) and three indicators directly related to safety (accident risk or accident rate, macroscopic accident probability and microscopic speed in homogeneity) have been identified and discussed.
5.1.1 Travel time prediction using floating car data Floating car, also referred to as probe car, principle is vehicles equipped with positioning equipment, such as GPS, to log the position of the car and other data collected on board. Fixed-point traffic sensors collect traffic data of all vehicles passing through the sensors. On the other hand, the floating car data system collects continuous trajectory data of the equipped vehicle. A fleet of probe vehicles is needed to generate enough data for traffic management such as travel time prediction. Taxis are the most common fleet used for probe vehicles surveys. The data collected by the on board unit transmits the vehicle ID and positions and, since privacy is a sensitive issue, some trials experimented with unidentified probe vehicle data. The unidentified probe vehicle system transmits only the position and the speed of the vehicle, but not the vehicle ID. Thus, when all the data from an unidentified probe vehicle fleet is combined, there will be a network with speed values at different locations in the network. Methodologies to predict travel time are different for identified and unidentified probe vehicles. The project Deliverable 4.1: Performance indicators need and derivation: single and multisource solutions, describes two travel time prediction models, one for identified and one for unidentified probe vehicle data. Identified probe vehicles A data analysis was carried out which was based on data from the FLEET system in Vienna. This system has been operational since 2004. A taxi fleet of 800 vehicles equipped with GPS receivers delivers positions and time stamps to a taxi management centre at an interval of 15 to 30 seconds. The taxi management centre data is transmitted and evaluated at 15 minutes intervals. The message data from the probe vehicles is cleaned in a three-step process in order to reduce spatial and temporal errors. First step is the projecting of trip data, message points, to the road graph by a map-matching algorithm. Secondly, an optimised shortest path algorithm is applied for route search in cases when only starting and stopping points of trips are known or when GPS messages are sparse. The algorithm uses several labels in order to reduce spatial errors of routing. After routing, the average velocity of each trip can be calculated. Lastly, a travel time calculation algorithm calculates the estimated speed value for every road
37

on a route. The average speed for the route is distributed to each road on the route. In order to take different speed levels of the roads into account, average route velocity is distributed for each road. This will be proportional to the roads free or historical speed. The investigation of route speeds has shown that variance plays an important role in the interpretation of results from route speed measurements. Average route speed on intra-urban roads can be estimated using time series modelling and linear Kalman filtering. Therefore, estimated route speed can be regarded as the relevant factor that is linked with other traffic parameters such as traffic density and traffic flow. As route speeds from a taxi fleet only constitute a small sample of experienced drivers, the accuracy of route speed measurements has to be compared to an external reference. Automatic vehicle identification (AVI) measurements based on license plate recognition were used to evaluate if the measured route speeds represent the route speeds of the average driver. Route speed data that have been filtered with a Kalman filter are similar to the average route speed of vehicles measured by AVI. The difference between average probe vehicle route speed and average AVI route speed on one lane was +5.1 km/h on one route and +5.8 km/h on another. Unidentified probe vehicles In INTRO Deliverable 4.1 a new method is proposed to estimate travel times on links from unidentified probe observations of position and velocity. The new method is based on modelling the velocity profile as a continuous function along each link in a network. Contrary, in existing travel time estimation methods the velocity profile is a constant function. To spatially model the profile, a priori velocity profiles for sparse and dense traffic conditions are established using historical data. Each new observation from an unidentified probe vehicle is then combined with these a priori profiles, using linear interpolation, to obtain a current velocity profile. Various approaches to define travel time estimates from these individual velocity profiles are investigated and compared. Theθ function associated with the observation of speed, v at position, x is used to obtain the current speed profile using the equation:
( ) ( ) ( ) ( )( )f x g x h x g xθ θ≡ + ⋅ − = v
( )xg corresponds to historical speed profile for light traffic conditions;
( )xh corresponds to historical speed profile for heavy traffic conditions; θ is a parameter for linear interpolation Figure 24 illustrates the θ function with M(x), the maximum velocity curve, and m(x), the minimum velocity curve. The star denotes an observation from an unidentified vehicle. The blue line denotes the θ function associated with the observation, computed by linear interpolation between the surrounding a priori functions for light and heavy traffic conditions.
38

Figure 24: Illustration of θ functions
The results based on simulated data show that the new method generally reduces the relative error in travel time estimations, in comparison to existing methods based on piecewise constant velocity profiles. However, implementation details, especially the handling of low velocities, may strongly affect results, particularly in very congested traffic situations.
5.1.2 Data fusion Increasing availability of data sources, such as sensors, databases and traffic experts´ knowledge, make the synthesis tremendously difficult. To make the data sets fully useful, data sources need more complex processing techniques. This is to take into account the data qualities and imperfections of each source. One solution is based on data fusion. Data fusion approach is especially appealing in heterogeneous data sources settings. In INTRO Deliverable 4.1, the focus is on data fusion for two traffic performance indicators: travel time and traffic density. The data fusion processes developed in the INTRO project aim to provide a consistent and comprehensive picture of network conditions. Firstly, it is shown that the combination of toll travel times of different links can result in a more reliable reference travel time. Toll data is a very rich source data as far as each vehicle is a probe: The toll ticket is stamped with the current time when it is taken at the entrance barrier and when it is given back at the exit barrier. From this source one can get time spent in motorway sections by all vehicles and via specific designed filtering algorithms, one can derive travel time. Secondly, results are obtained for travel time estimation by the fusion of loop detector data and toll collection data. The integration of toll collection data into the cumulative traffic counts method, which is normally based on loop detector data only, improves both the accuracy and the robustness of travel time estimation. Overall, the INTRO research shows potential of toll collection data for travel time purposes, both for reference travel time computation and for travel time estimation. The results need to be confirmed and evaluated. This needs to be done on a larger sample of real situations including various distributions of available toll travel times. Finally, travel time and link flows fusion, under heterogeneous data source configurations, are also examined. The outlined combining strategies improve the quality of the estimation. They
39

also provide a comprehensive travel estimate using probe vehicle data as the primary source of information for a Dynamic Traffic Assignment (DTA) model. INTRO Deliverable 4.1 shows how estimates of link flows can be obtained using probe vehicle data as the primary source of information for a DTA model. Even though, no measurements of the link flows are available to compare with the estimated flows, the results are encouraging and demonstrate that the calibrated model accurately matches the historical travel times. This is an interesting finding in terms of traffic management applications, as travel times are one of the most important outputs of DTA and traffic estimation and prediction models. Conventional loop detector surveillance systems are expensive and tedious to install, maintain and operate. Therefore, more network operators and cities use emerging data collection systems, such as probe vehicles, instead of the conventional systems. The issue of using such data for traffic management purposes becomes increasingly relevant because of this. The ability to use such data for calibration and operation of traffic estimation and prediction systems may be an important driving force for these technologies and change the way traffic data is collected and used. In summary, data fusion has proven to be very useful for estimating and predicting traffic indicators. The main innovation is the use of alternative traffic data sources such as toll collection data combined with more general data, such as probe vehicle data.
5.2 Integration of weather effects for traffic indicators forecasting
One of the main objectives of INTRO Deliverable 4.2 was to quantify the relationship between weather and traffic flow variables. Many analyses were made based on the Swiss and Polish traffic and weather data. The influence of rain and snow precipitation on speed, traffic density, lane distribution and headways was tested. Also the connections between heavy vehicles numbers in a flow and weather parameters were discussed.
Figure 25: Weather traffic measuring station schema (Poland)
The results of the surveys carried out in Switzerland and Poland showed mean speed reduction flow for rainy and snowy conditions. With respect to time headways, the results showed that proportion of the traffic with short headways decreases during precipitation. The reduction is even greater on the fast lanes than on the slow lanes.
40

It was also proven that the road type has a big influence on drivers’ behaviour, especially during inclement weather conditions when road surface condition and visibility is decreasing. The tests did not show any big differences in the lane occupation percentage between days with fine weather and rainy or snowy days. Overall the results of this survey show the variety in which weather affects traffic variables such as speed and headway. The real flow speed reduction percentage under different weather conditions was calculated for different road types and a disparity of the results based on real data and theoretical literature was shown. Differences in average travel time between different weather types are very clear. Travel times extended in rainy and snowy conditions and the general traffic conditions also deteriorate. So in general, all conclusions from the database analysis have been confirmed. It is also interesting to do further research on the relationship between the weather state and speed of traffic jams arising. The parameter that should be researched further is the precipitation intensity and its influence on the traffic. This is because the test carried out in INTRO Deliverable 4.2 only proves the weather state influence in general. Unfortunately, such experiments demand a good database with precipitation intensity classification and visibility measurements. Such a database is being developed in Poland at the moment; so further research will be possible. Some experiments were carried out in a driving simulator to study the weather influence on the driver’s behaviour. Different visibility conditions, such as fog and clear weather, were tested. The parameters of time headway and time to collision were tested for different drivers and situations. These tests confirmed the results of the previous experiments and surveys. They also showed the necessity to take visibility and overtaking and lane changing into account. Visibility conditions have different influence on speed in different driving situations. In clear condition, drivers drive slower when they are behind another vehicle than when they overtake. In 60 meters of visibility conditions, there is no significant difference in speed between these two situations. However, drivers drive faster when they are behind another vehicle than when they overtake in 30 meters of visibility conditions. An explanation for this is that when drivers are driving behind a car in 30 meters of visibility, they have a visual frame. However, when they overtake they lose this visual frame. Drivers drive with similar headway times on secondary roads and on motorways, whether they are driving behind a car or overtaking. However, differences can be seen in the different visibility conditions. In 60 meters visibility conditions, the headway time drivers drive with is longer than in the other two conditions. In 30 meters of visibility conditions, the headway times are longer than in clear conditions. The visibility conditions have more impact on headway times on secondary road sections than on motorway sections. On motorways drivers drive with similar headway times in all three visibility conditions. More detailed information of these weather data related surveys can be found in INTRO Deliverable 4.2: Integration of weather effects for traffic indicators forecasting.
5.3 Safety indicators for monitoring traffic safety Road traffic accidents in EU countries annually claim over 40,000 lives and leave more than 1,8 million people injured. It is clear that a passive safety system alone is not sufficient enough to drastically reduce traffic accidents. More traffic and other data sources become available now. Therefore, more accurate estimations and predictions of road traffic conditions are needed to increase traffic safety and reduce congestion. These estimations and predictions will have to use all data sources for safety systems that help avoiding and preventing accidents. Traffic monitoring is one strand of the INTRO project.
41

French and Swiss motorway accident databases were analyzed. This was to determine the most common type of accidents, the time of day with the highest accident rate, accidents per vehicle/km, etc. A study of the Swiss accident database showed that the accident rate between 1AM and 5AM is 3 to 5 times as high as the daytime average. The accident rate is also significantly higher during the weekend, especially on Sundays. The most common type of accident in the Vaud canton of Switzerland is a one-vehicle accident, an accident in which a single vehicle collides with a fixed object. In order to base a safety indicator or a safety model on empirical traffic and accident data, a correlation between driving conditions and injury accidents has been extensively studied on a French urban motorway section, which included a weaving section. The studied driving conditions include the time of day (night-time versus daytime), the weather condition (rain versus no rain), the infrastructure design (bend versus straight sections), and the traffic conditions.
Figure 26: A4-A86 Weaving section in France
The impact of factors, such as nighttimes, rain and bends, on accidents was computed, and this constituted a part of the safety model. Between 02:00 and 03:00 hours, the accident rate is 9 times higher than during the daytime and between 21:00 and 08:00 it is 1.5 times higher than at other times. The accident rate for rainy conditions is 2 times higher than normal, whereas a rainy condition and a curve combined leads to a 3.9 times higher accident rate. The analysis of the types of first accidents shows that the top 3 most common types of accidents include collisions with barrier (31%), side collision (29%) and rear-end collision (26%)
42

5.3.1 Safety indicators developed None of the safety indicators reviewed in INTRO Deliverable 4.3 is actually validated and applied. However, some general outcomes from the literature can be summarized. On motorways, high speed varieties, big difference in speed between upstream and downstream measuring stations and high relative speed are correlated to accidents. Many researchers suggest that a real-time warning system based on safety indicators could reduce the risk of accidents. Safety indicators, both microscopic and macroscopic, were developed for the INTRO project. The microscopic safety indicators use individual traffic data, whereas macroscopic safety indicators use aggregated traffic data. The safety indicators developed include:
• Individual braking time risk – calculates the time it takes for an individual to brake • Platoon braking time risk – calculates the risk of collision in a platoon • Speed and density homogeneity • Risk associated with lane changing • Icrash - a rear-end collision risk indicator for a high speed high density situation • Differential safety indicator – principally looking at disruptive lane changes • Unsafe density parameter – an indicator derived from microscopic simulation
Before deciding what thresholds to use for the safety indicators, it is important to know what traffic conditions the safety indicators are sensitive to and how sensitive they are. Two safety indicators, J-value and Time-to-collision, were tested using data collected from Vaud canton, Switzerland. J-value is also called Platoon Braking Time Risk. In other words, J-value measures the risk in case with an insufficient time gap between vehicles. The risk is accumulative and resets to zero when G-value, Individual Braking Time Risk, is zero. Both J-value and Time-to-collision were dependent on traffic flow. Thus, traffic flow should be taken into account when setting thresholds for these safety indicators. Time-to-collision does not take deceleration into account; therefore time-to-collision distribution does not depend on weather conditions. However, for the same traffic flow, J-value distribution varies under different weather conditions. In rainy conditions, and when traffic flow is high, more vehicles are in a higher risk category than under fine weather conditions. Road occupancy plays a major role for safety indicators, for both urban motorways and rural motorways. A high occupancy leads to lane changes accidents, especially on urban weaving section motorways, where some lane changes are mandatory. Inappropriate speed, for the occupancy level, plays an important role for safety indicators on rural motorways. However, on urban motorways, where the observed speed rarely is very high, the stake of high speeds is limited to certain types of accidents, such as one-vehicle accidents and accidents during the night. Relative velocity seems to play an important role on urban motorways, particularly in the case of sudden speed decreasing. The most dangerous traffic scenarios, based on speed and occupancy, are correlated to a sudden strong decrease of speed. On rural motorways, a strong sudden change in speed is also linked to accidents. The role of difference in speed between lanes is more complex to understand. The absence of a speed difference between the “fast” lane and the “slow” lane is linked to an abnormal, dangerous situation.
5.3.2 Data fusion of safety indicators The main goals of the data fusion process described in INTRO Deliverable 4.3 are an improvement in the quality of road safety indicators and their ability to characterize road safety conditions. The application of data fusion requires information concerning the quality of the data output by the safety indicators. In case such information is not available, the quality may be estimated by using validation samples.
43

The specificity of the data fusion process for safety indicators is that most of the safety indicators are derived from the same traffic data. Therefore, the combining process is performed on the same data provided by one source. The expected benefit of this process is not only an increase in accuracy but also a robustness of the whole risk detection process. A priori diagnosis is required by simultaneously using the various safety indicators, recognized for their performances in certain configurations of operation. The problem then consists of carrying out this combination process for a large spectrum of traffic situations.
5.3.3 Methodology to determine threshold values for safety indicators Traffic data classified into traffic regimes are analyzed to determine the relation between traffic situations under each scenario. Three methods for setting the thresholds are proposed, the extreme value method, major-in-high risk method and the flow-based method. By applying one of these methods into traffic situations from a traffic regime, the thresholds for the safety indicators for each traffic scenario can be determined. To reduce false alarm, alert could be raised only when thresholds of more than one safety indicator are exceeded. To conclude, INTRO Deliverable 4.3 has demonstrated that safety indicators are one possible active safety system that could be used. When the traffic condition is deemed as risky, drivers could be warned of the risk and take actions to reduce and mitigate the risk. Future research will consider what information to provide to drivers and how the traffic management system could be improved, taking the traffic risk into account.
44

6 A Vision of Intelligent Roads One of the tasks within the INTRO project was to develop a consolidated overview of the visions of the future with respect to use of the road transport systems and with specific relevance to Intelligent Roads. Existing visions, policies and research agendas were analysed, for instance the European transport policy for 2010 – White Paper. The detailed results of this survey can be found in INTRO Deliverable 5.3 “A vision of intelligent roads”. The scenario proposed by INTRO depicts the most probable world in which we might travel in 30 years; it is based on the extensive analysis of existing visions and on the experience of INTRO partners. It is strongly based on the current trends and it pictures a realistic future. Scenarios, trends and visions covered in the report were merged with the three Vision 2030 scenarios (Highways Agency in England). Realistically, the future will be somewhere in-between these extremes, within the presented triangle. Feeding into these visions at the top of the figure are the drivers for change and at the bottom are a set of visions for the intelligent road which emanate both from the drivers and from the socio-political scenario mix.
Figure 27: Intelligent road solutions – effects, circumstances, visions and solutions
according to INTRO Deliverable 1.2
Technologies, existing or in development, allow an outline to be drafted of how the infrastructure will look during the next 30 years. Many technologies, unknown today, will have the potential to improve the infrastructure’s ability to measure, analyse, communicate, interact, or to drive. Progressively, technologies and developments clustered in the INTRO vision will enter our everyday life. There is obviously a huge potential for emerging technologies in the following main areas:
• Communication and remote data collection/operation • Embedded sensors and sensor fusion • New materials, better properties • New software and processing principles for higher system complexities • Cybernetic and holistic approaches
45

These technologies improve many aspects of the road infrastructure, traffic systems and operation parameters as is summarised in the following figure, including:
• Increased traffic safety • Higher road pavement quality, better planning and design of infrastructure • More efficient road and infrastructure management • Fewer road construction sites and road works • Energy saving and traffic economy improvement • Positive environmental effects (decreasing emission/material consumption) • Improved accessibility and better traffic throughput • Improved quality for road users • Overall optimisation
Figure 28: Scheduled benefits from some main emerging technologies areas (great potential for “intelligent road applications”)
One vision cannot fit in all types of network or road system functions. Within the INTRO vision of future intelligent roads, different vision facets are developed to fit with examples of road types and conditions encountered in Europe: Urban motorway, urban radial road, interurban motorway, interurban road and rural road. On the European urban motorways safety issues will be addressed by advanced methods for surface and road condition monitoring. The issues will also be addressed by traffic monitoring and incident management, and through interactions between infrastructure and vehicles. Additional services will be available for users travelling on these roads. These roads will be maintained and managed in a more sustainable manner. Optimised pavement monitoring, enhanced modelling systems will allow an optimised lifecycle management. Roads and bridges will be self-controlling and protecting. Lastly, a reliable environmental monitoring will dynamically support access and traffic flow control. Capacity management is an important issue on these busy motorways. New sources of traffic data, including area
46

tracking and tracing of traffic, will be developed on such networks in order to achieve an active traffic and dynamic capacity management. Urban roads will also face safety problems. The developments described for urban motorways will also apply to urban roads. However, this environment is less adapted to systems that allow real-time monitoring of the surface and road condition. Life cycle schemes and strategies will be optimised for these roads. Dynamic access management and active traffic management will ensure the maximum road capacity. European interurban motorways were characterised by both low accident rates and some potential for serious accidents involving heavy vehicles in tunnels or in bad weather. Many safety measures can be expected on this type of road. The interurban motorways network has a vital role in European mobility. It must, therefore, be managed in the most sustainable and efficient way. These roads will be self sufficient and self-controlling. On interurban roads, congestion problems are rare. Therefore, traffic management will only be in use on critical sections. However, the dynamic access and flow control will also be important methods on these roads. Finally, since most methods are not very economic for rural roads, several cost effective solutions will be used. These methods include floating car data. Dynamic and interactive signing will support the road user’s safety. Mobile devices will be the principal dissemination method for pre- and on-trip information.
47

7 Conclusions To conclude, it was the aim of the INTRO project to focus on applying and combining existing and new sensor technologies and new promising approaches in a holistic way in order to significantly increase capacity and safety as well as improving the well-being of road users. The several objectives defined to reach this goal were surveyed and discussed in the Work Packages. The novel methods of surface safety monitoring objectives were the main objectives of Work Package 2. To increase the driver awareness of sudden changes in road safety conditions, several tests were held. Firstly, a model for estimating expectable braking distance was developed and tested. This model was used as input for the other tests held in this work package. The results from the high and low friction tests showed that it is not possible to draw the conclusion that a common set of parameters can be used with the model for estimating the braking distance in both “summer” and “winter” conditions with only a reference friction value as input. Additional input regarding the road conditions (ice, snow, wet or dry) is needed. More testing is needed, using surfaces with a friction level somewhere between pure polished ice and packed snow, as well as really low friction asphalt surfaces. This will lead to a conclusion whether a reference friction value is enough for braking distance estimation or not. The creation of a data model for road safety posed an innovative challenge for all parties concerned. The integration of dynamic Extended Floating Car Data into the data model was an important consideration while designing databases capable of meeting already defined user and data model requirements. Real-time information poses a great challenge for all database designers. However, in the INTRO project, the consortium now has a model that meets and supports every necessary requirement. The models were implemented in the simulator study that tested a real-time warning system for low friction. The results of this test indicate quite clearly that a recommended speed display in combination with a timing of six seconds leads to the most favourable driving behaviour with respect to traffic safety. Speed is reduces when a warning is given, and to a certain extent also when no warning is present. Further research is necessary to see how false alarms and misses influence system acceptance and driving behaviour. The behaviour of the drivers on the long term also needs further research. The traffic and safety monitoring objective was met in Work Package 4. Several tests with combinations of different data were carried out. The tests with identified and unidentified probe vehicles showed that: data fusion has proven to be very useful for estimating and predicting traffic indicators. The main innovation is the use of alternative traffic data sources such as toll collection data combined with more general data, such as probe vehicle data. Some experiments were carried out in a driving simulator to study the weather influence on the driver’s behaviour. Different visibility conditions, such as fog and clear weather, were tested. The parameters of time headway and time to collision were tested for different drivers and situations. These tests confirmed the results of the previous experiments and surveys. They also showed the necessity to take visibility and overtaking and lane changing into account. Work Package 4 also demonstrated that safety indicators are one possible active safety system that could be used. When the traffic condition is deemed as risky, drivers could be warned of the risk and take actions to reduce and mitigate the risk. Future research will consider what information to provide to drivers and how the traffic management system could be improved, taking the traffic risk into account. The third and final set of objectives concerned intelligent pavement and intelligent vehicles, and was dealt with in Work Package 3.
48

The tests with the intelligent vehicles showed that the use of a dedicated fleet equipped with the CAN bus readers and GPS functionality, preferably with added vertical acceleration sensors, is a good set up to obtain up-to-date information of road defects. Probe vehicles are cheaper and easier useable than the specific technologies used for assessing the condition of the road surface. However, the information from the probe vehicles is less accurate. Another conclusion that can be drawn from the trials is that the “Intelligent Vehicle” concept, the use of probe vehicles, is probably not well suited for the urban and inner city environments. It is very difficult to separate exceptions in the CAN bus data arising from road defects, from those caused by road junctions, parked cars etc. The tests of in situ sensors focussing on pavement health monitoring system compared data from in pavement embedded strain gauges with data from a WIM station. The conclusion is that the most preferred solution will be a specific WIM station, preferably placed at the bottom of the asphalt layer. The load sensors could, for instance, be replaced by deformation sensors. This specific measurement device will have to be installed during the laying phase. Reliability of this system and data acquisition procedure will have to be investigated. The test focussing on the bearing capacity of minor roads during spring thaw showed that there was a very good correlation between relatively strain and frost thaw. This kind of correlation is a first step to a general model for predicting the seasonal variation of bearing capacity on minor low volume roads. This will be a very useful tool for the road authorities. This model and the information about frost thaw together helps the road authorities with making a more objective decision about load restrictions on minor roads. The results of this trial are only taken from one pavement at one test site. More trials on different sites need to be carried out to validate the method of using frost depth to regulate load restrictions. The results so far have been very promising. This analysis was based on a trial on a road with thin asphalt pavement. However, the same approach could be used on gravel roads. The analysis should, then, be more focussed on the correlation between frost thaw and moisture.
49

8 References Opitz R and Winder A (2005): INTRO Deliverable 1.1 Intelligent Road Systems –
Consolidated State of the Art and User Needs, INTRO project number 012344 Opitz R and Winder A (2006): INTRO Deliverable 1.2 Report on Scenarios, Structure and
Potential Short-Term Trends relating to Road Transport in Europe, INTRO project number 012344
Opitz R and Winder A (2008): INTRO Deliverable 1.3 INTRO Implementation Strategies, INTRO project number 012344
Do M et al. (2006): INTRO Deliverable 2.1 Model for Estimating Expectable Braking Distance, INTRO project number 012344
Schönberg T (2007): INTRO Deliverable 2.2 Data Model for Road Safety Related Data, INTRO project number 012344
Kircher K (2007): INTRO Deliverable 2.3 Simulation Study, INTRO project number 012344 Deix S (2008): INTRO Deliverable 2.4 Report on Technical Implementation and Users
Feedback, INTRO project number 012344 Benbow E et al. (2007): INTRO Deliverable 3.1 Demonstration of Methods for the
Measurement of Conditions using Probe Vehicles, INTRO project number 012344 Vos E (2008): INTRO Deliverable 3.2 Report on Assessment of Methods to identify
Pavement Condition using Current and Novel In Situ Sensors, INTRO project number 012344
Benbow E et al. (2008): INTRO Deliverable 3.3 Use of Combined Probe Vehicle and In Situ Measurements. Proposals for Best Practice Implementation, INTRO project number 012344
Chung E (2007): INTRO Deliverable 4.1 Performance Indicators Needs and Derivation: Single and Multisource Solutions, INTRO project number 012344
Karkowski M (2007): INTRO Deliverable 4.2 Integration of Weather Effects for Traffic Indicators Forecasting, INTRO project number 012344
Chung E (2007): INTRO Deliverable 4.3 Safety Indicators for Monitoring Traffic Safety, INTRO project number 012344
Cocu X (2007): INTRO Deliverable 5.3 A Vision of Intelligent Roads, INTRO project number 012344
50


arsenal Research, Austriawww.arsenal.ac.at
TKTI, Lithuaniawww.tkti.lt
BRRC, Belgiumwww.brrc.be
INRR, Luxembourg
CRBL, BulgariaRWS DWW, Netherlandswww.minvenw.nl/rws/dww
IGH, Croatiawww.igh.hr
NPRA, Norwaywww.vegvesen.no
CDV, Czech Republicwww.cdv.cz
IBDiM, Polandwww.ibdim.edu.pl
DRI, Denmarkwww.roadinstitute.dk
LNEC, Portugalwww-ext.lnec.pt
TECER, Estoniawww.teed.ee
CESTRIN
CESTRIN, Romaniawww.cestrin.ro
LCPC, Francewww.lcpc.fr
IP, Serbia-Montenegro www.highway.co.yu
BASt, Germanywww.bast.de
VUD,Slovakiawww.vud.sk
KEDE, GreeceZAG,Sloveniawww.zag.si
KTI, Hungarywww.kti.hu
CEDEX, Spainwww.cedex.es
ICERA, Icelandwww.vegagerdin.is
VTI, Swedenwww.vti.se
NRA, Irelandwww.nra.ie
LAVOC, Switzerlandlavoc.epfl.ch
LATV
IJAS VALSTS CELILATVIJAS STATE ROAD
S
LAD, Latviawww.lad.lv
TRL, United Kingdomwww.trl.co.uk
ANAS, Italywww.enteanas.it
Derzhdor NDI, Ukrainewww.trl.co.uk
Fehrl is a registered International Associationwith a permanent Secretariat based inBrussels. Formed in 1989 as the Forum ofEuropean National Highway ResearchLaboratories, FEHRL is governed by theDirectors of each of the national institutes.At present, FEHRL comprises 30 national laboratories from the member states of theEuropean Union, the EFTA countries and therest of Europe.
For More Information:
FEHRLBlvd de la Woluwe 421200 BrusselsBELGIUMPhone : +32 (0) 2 775 82 45Fax : +32 (0) 2 775 82 54E-mail : [email protected]: http://www.fehrl.org