Embed Size (px)
Citation preview

SHRIMP PANEL
January 19, 2016Miami, FL

THE SHRIMP PANEL
2
John Sackton Sree Alturi
Bill Hoenig Robbins McIntosh
Alan WeitzerMike Seidel
Ray Jones Brendan Curran
David Pearce
SandroCoglitore
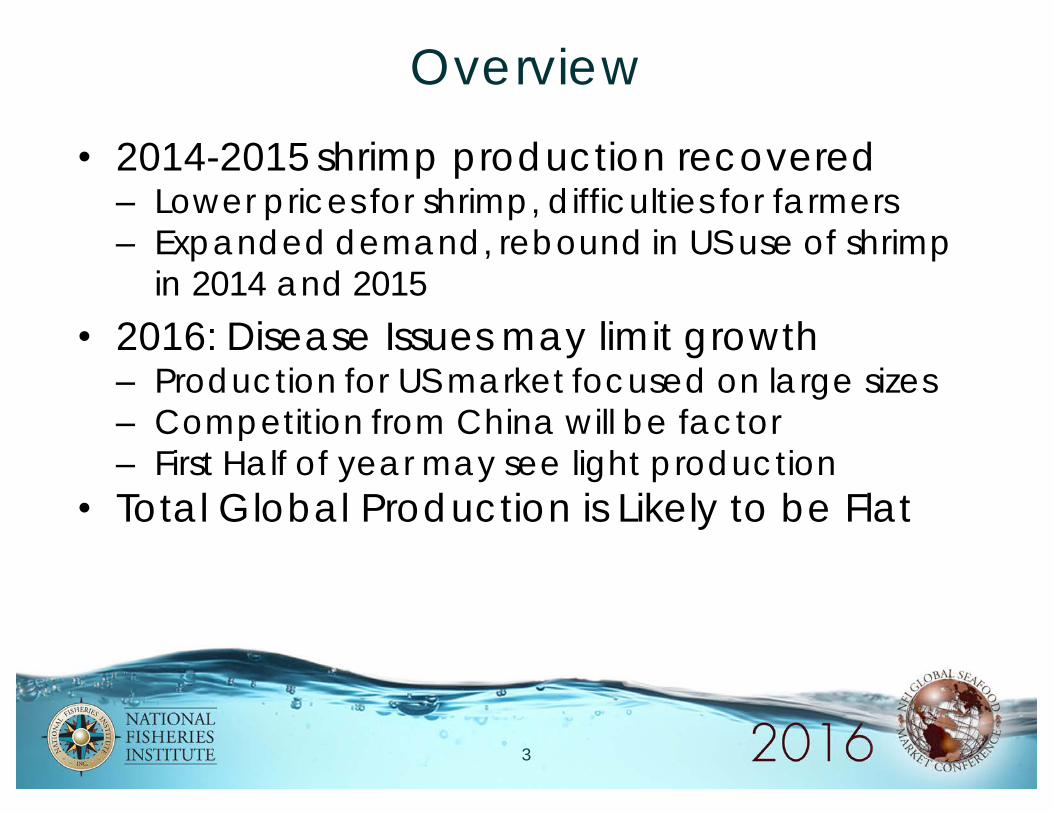
Overview• 2014-2015 shrimp production recovered– Lower prices for shrimp, difficulties for farmers– Expanded demand, rebound in US use of shrimp
in 2014 and 2015• 2016: Disease Issues may limit growth– Production for US market focused on large sizes– Competition from China will be factor– First Half of year may see light production
• Total Global Production is Likely to be Flat
3
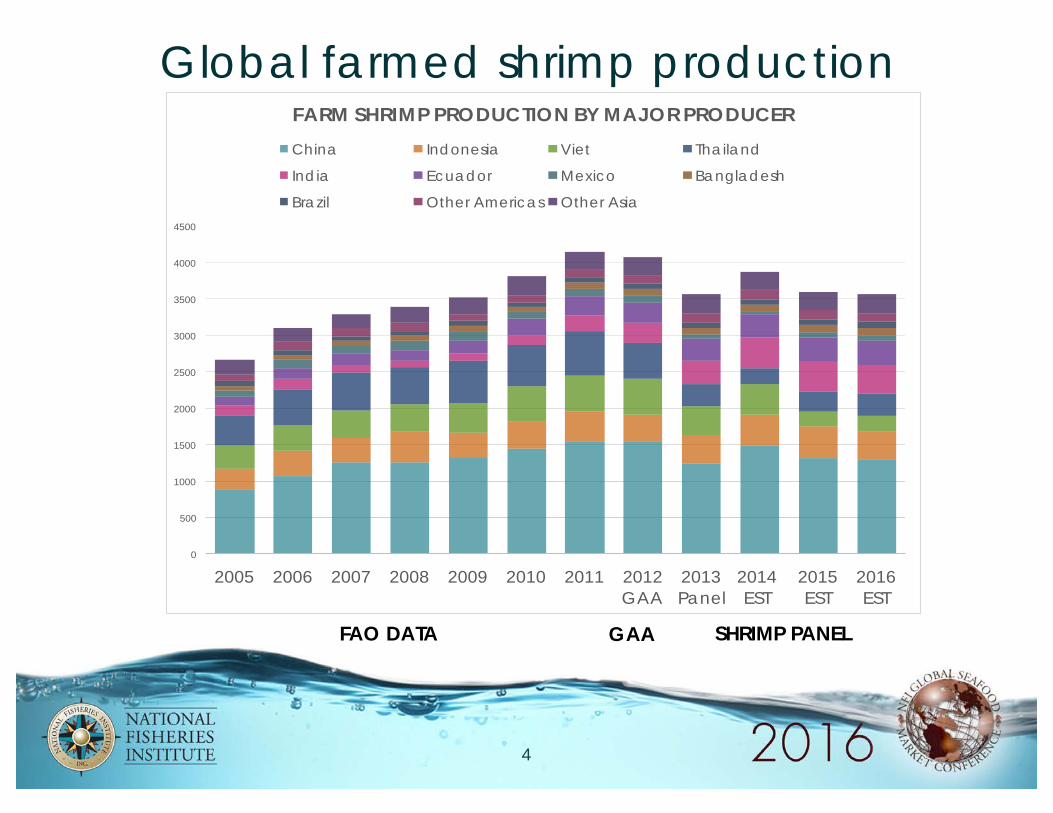
Global farmed shrimp production
FAO DATA GAA SHRIMP PANEL
4
0
500
1000
1500
2000
2500
3000
3500
4000
4500
2005 2006 2007 2008 2009 2010 2011 2012 GAA
2013 Panel
2014 EST
2015 EST
2016 EST
FARM SHRIMP PRODUCTION BY MAJOR PRODUCERChina Indonesia Viet Thailand
India Ecuador Mexico Bangladesh
Brazil Other Americas Other Asia

Farmed Shrimp Exports
Note: China, Indo, Malaysia may include double-countingData: GTIS
0
200000
400000
600000
800000
1000000
1200000
1400000
1600000
2010 2011 2012 2013 2014 2015 Est
Exports of Six Major Shrimp Producers THAILAND INDIA ECUADOR CHINA INDONESIA MALAYSIA
5

US demand
US Customs Data
0
200,000,000
400,000,000
600,000,000
800,000,000
1,000,000,000
1,200,000,000
1,400,000,000
2011 2012 2013 2014 2015
POUN
DS
US Imports of Shrimp, All Types Jan-Nov THAILAND INDIA INDONESIA ECUADOR VIETNAM CHINA (MAINLAND)
MEXICO MALAYSIA PERU HONDURAS GUYANA PANAMA
NICARAGUA BANGLADESH GUATEMALA OTHER
6

Growth of shrimp volume may level off in 2016
• Production, major global exports, and US imports all show same pattern:– Losses due to disease in 2012, 2013– Recovery in volume in 2014 – Maintenance of volume in 2015
• 2016 US Imports will depend on India, Ecuador, and Indonesia, supplemented by Thailand, Vietnam, and Mexico.
Should production falter there are few places to make it up with expansion, as happened in 2014.
7

Shrimp disease from EMS to EHP• Recovery of shrimp volume in 2014-2015
largely due to new production areas; plus more control of EMS
• However deepening disease issues could mean a risk of decrease in overall supplies
• Extent of disease impacted producing areas is not likely to expand
• Current hot spots: White spot in India; EHP in China, EMS in Central America
8

How Should Buyers Understand Shrimp Diseases
• Disease issues occur in every growing area• Impacts include reduced growth, mortality,
higher costs • EMS is seen as an environmental problem,
not simply an animal mortality problem• EMS/EHP solutions include animal husbandry,
pond and environmental management; where these are poor, disease impacts will continue
9

10
No growth in supply forecast for 2016
Panel Global Production Estimates
10
0
500
1000
1500
2000
2500
3000
3500
4000
2014 EST 2015 EST 2016 EST
CHINA INDONESIA VIET THAILAND INDIA ECUADOR
MEXICO BANGLADESH BRAZIL OTHER AMERICAS OTHER ASIA

Why do our projections differ from 7.7% Annual growth rate at GAA
• We are forecasting slightly decreasing supplies in the first half of the year from 2 of the 3 major producers: Indonesia and India.
• Ecuador Should Remain Flat• This will not be fully compensated for by growth in
Thailand, Mexico, or Vietnam.• Between September 2015 and January 2016, the
evidence of production difficulties due to disease, weather and in some cases delayed reaction to low prices, has become more pronounced.
1111

India
2010-2014 Indian Gov’t Data; 2015-2016 Panel Estimates
0
50
100
150
200
250
300
350
400
450
500
2010 2011 2012 2013 Panel 2014 EST 2015 EST 2016 EST
000'
S M
ETRI
C TO
NS
12

Indonesia / Vietnam / Malaysia
Data from FAO, Panel Estimates
0
100
200
300
400
500
600
700
2010 2011 2012 2013 PANEL
2014 EST 2015 EST 2016 EST
000'
S M
ETRI
C TO
NS
INDONESIA VIETNAM MALAYSIA
13
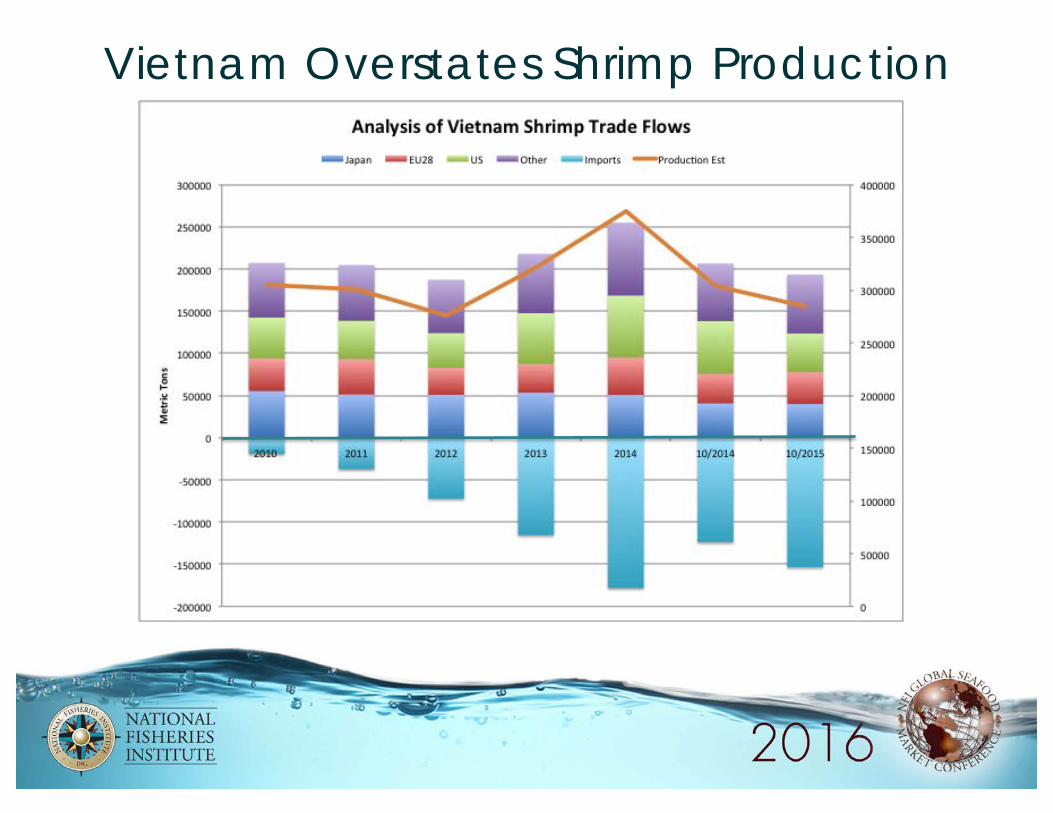
Vietnam Overstates Shrimp Production

Thailand
Data from Industry Estimates, Thai Frozen Food Assoc., Gov’t Data
0
100
200
300
400
500
600
700
2010 2011 2012 2013 Panel 2014 EST 2015 EST 2016 EST
000'
S M
ETRI
C T
ON
S
15

China production
Industry Estimates Based on Feed Sales
0
100
200
300
400
500
600
700
800
900
1000
2010 2011 2012 2013Panel 2014EST 2015EST 2016EST
000's
Metricto
ns
China
16

Ecuador
Government Export Data 2010-2014; Industry Estimates 2015-2016
0.00
50.00
100.00
150.00
200.00
250.00
300.00
350.00
2010 2011 2012 2013Panel 2014EST 2015EST 2016EST
000's
metricto
ns
EcuadorProduction
17

18
Mexico and Central America
Government and Industry Data
0
20
40
60
80
100
120
140
160
180
2010 2011 2012 2013Panel 2014EST 2015EST 2016EST
000'smetricto
ns
MexicoandCentralAmericaMexico Honduras Nicaragua Guatamala Panama

US Gulf production
Source: NMFS
0
20,000
40,000
60,000
80,000
100,000
120,000
140,000
2010 2011 2012 2013 2014 2015*
000'
S PO
UND
S Gulf Domestic Shrimp Landings
FL AL MS LA TX
19

US share of total exports
Source: GTIS
20
0.0%
10.0%
20.0%
30.0%
40.0%
50.0%
60.0%
70.0%
India Ecuador Thailand Indonesia Malaysia China Vietnam
Percent Shipped to US by Major Exporters2011 2012 2013 2014 08/2015
20

Summary of Asian production outlook
Shrimp Panel Industry Estimates
1600
1700
1800
1900
2000
2100
2200
2300
0
500
1000
1500
2000
2500
2011 2012 2013 2014 2015 Est 2016 Est
000'
s M
etric
Tons
Asian production declined in 2015 and will be flat or barely higher in 2016
THAILAND VIETNAM INDIA INDONESIA CHINA MALAYSIA TOTAL
21

Panel estimates shrimp production declined in 2015, and will barely recover in 2016
Industry and Panelist estimates; 2011-2012 FAO data; 2013-2016 Panel
0
200
400
600
800
1000
1200
1400
1600
1800
2000
0
200
400
600
800
1000
1200
1400
1600
1800
2000
2011 2012 2013 2014 2015 2016
000'
S M
ETRI
C T
ON
S
Panel Predictions for 2016 Major Country Production THAILAND INDIA INDONESIA ECUADOR VIETNAM MEXICO TOTALS
22

EU warmwater shrimp imports declined 6.5% thru Sept 2015
Source: Eurostat
155
160
165
170
175
180
185
190
195
200
2013 2014 2015
000'
MET
RIC
TO
NS
EU Warmwater Shrimp Imports
23

Japan
Japan Customs Data
0
20000
40000
60000
80000
100000
120000
140000
160000
180000
200000
2010 2011 2012 2013 2014 11/2014 11/2015
MET
RIC
TO
NS
Japan Farmed Shrimp Imports (Major Countries) VIETNAM INDIA INDONESIA CHINA THAILAND MYANMAR
MALAYSIA PHILIPPINES BANGLADESH SRI LANKA ECUADOR
24
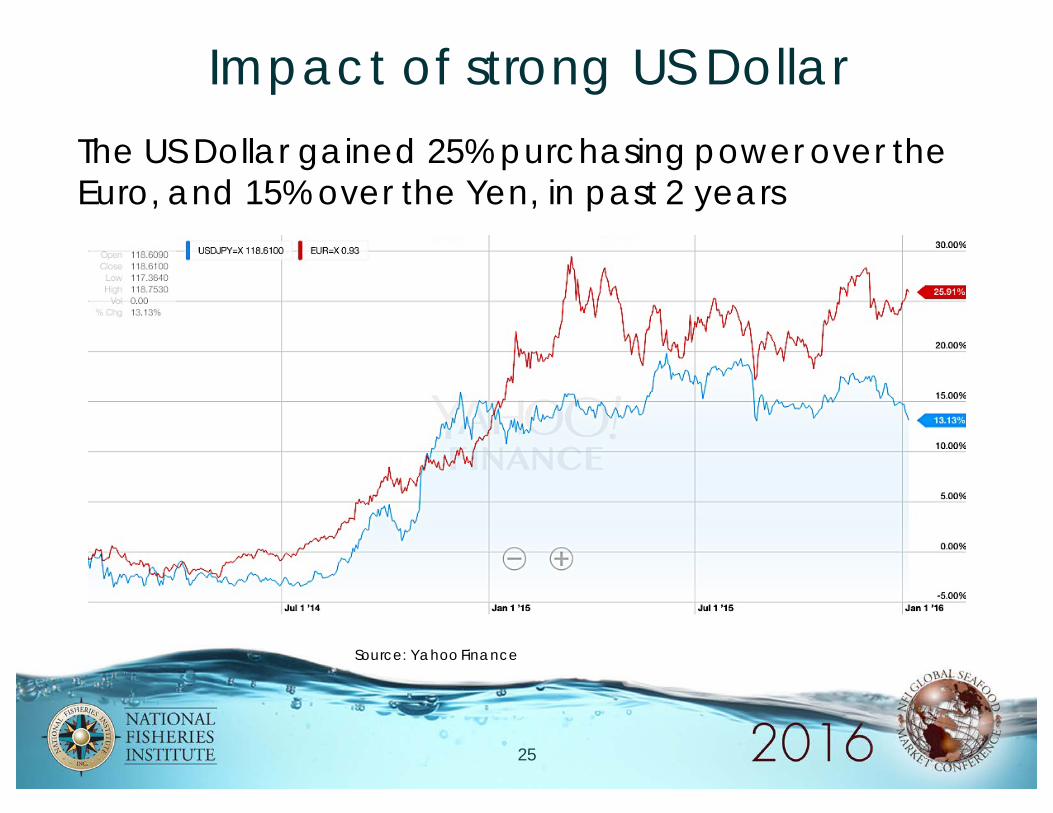
Impact of strong US DollarThe US Dollar gained 25% purchasing power over the Euro, and 15% over the Yen, in past 2 years
Source: Yahoo Finance
25

Relative market shareStrong dollar has allowed US to Increase global share of shrimp at same time total production is declining
Seafood Datasearch, Panel Estimates, Gov’t Trade Data
38.5%
47.6%
44.2%
46.8%
34.6%
28.4%
35.8%
33.8%
26.9%
24.0%
19.9% 19.3%
10.0%
15.0%
20.0%
25.0%
30.0%
35.0%
40.0%
45.0%
50.0%
2013 2014 08/2014 08/2015
Relative Global Market Share from Major Farmed Shrimp ProducersUS EU JAPAN
26
Market risk factors other than supply
• China (Vietnam) demand– Crackdown on Gray Market– Change in demand for imports
• Continued Currency Volatility• El Niño impacts make production more
uncertain:– Ecuador, Central America, Indonesia
27
US retail demand• US retail demand for shrimp accelerated in
2015 with higher sales volume, lower prices,and more household penetration.
28

US retail demand
Source: retail scan data via Nielsen
250,000,000
260,000,000
270,000,000
280,000,000
290,000,000
300,000,000
310,000,000
$1,800,000,000
$1,900,000,000
$2,000,000,000
$2,100,000,000
$2,200,000,000
$2,300,000,000
$2,400,000,000
$2,500,000,000
CY 2011 CY 2012 CY 2013 CY 2014 52 Wk Nov 2015
VO
LUM
E IN
PO
UND
SAXI
S TITL
E
SALE
S IN
DO
LLA
RSA
XIS T
ITLE
All Retail: Shrimp Sales and VolumeDOLLAR SALES VOLUME LBS
29
2015 est(sept)
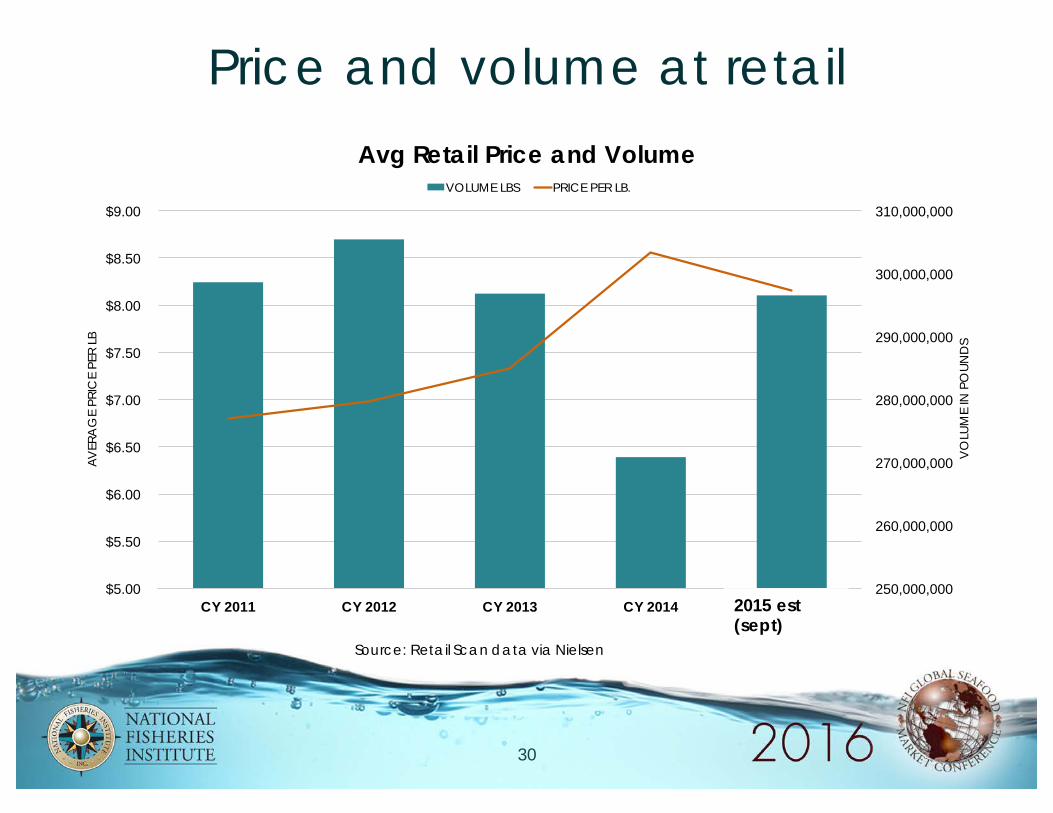
Price and volume at retail
Source: Retail Scan data via Nielsen
250,000,000
260,000,000
270,000,000
280,000,000
290,000,000
300,000,000
310,000,000
$5.00
$5.50
$6.00
$6.50
$7.00
$7.50
$8.00
$8.50
$9.00
CY 2011 CY 2012 CY 2013 CY 2014 52 Wk Nov 2015
VO
LUM
E IN
PO
UND
S
AVER
AG
E PR
ICE
PER
LB
Avg Retail Price and Volume VOLUME LBS PRICE PER LB.
30
2015 est(sept)

Shrimp household penetration
Source: Retail Scan Data via Nielsen
46.346.2
44.8
43.5
45.1
$6.79 $6.98
$7.33
$8.56
$8.16
42.0
42.5
43.0
43.5
44.0
44.5
45.0
45.5
46.0
46.5
$-
$1.00
$2.00
$3.00
$4.00
$5.00
$6.00
$7.00
$8.00
$9.00
CY 2011 CY 2012 CY 2013 CY 2014 52 Wk Nov 2015
PERC
ENT
OF
HO
USEH
OLD
S BU
YIN
G A
T RE
TAIL
AV
G D
OLL
ARS
PER
LB
Household Penetration and Shrimp Avg Retail Price PRICE PER LB. HOUSEHOLD PERCENT
31
2015 est(sept)

Retail momentum continued into December
• Favorable retail trends continued into December• For 12 weeks ending 12/21 vs Year Ago
– Dollar sales +4%– Unit sales +16%– Non-promoted unit price -16%
• For the 52 week period ending 12/21– Dollar sales +7%– Unit sales +14%– Non-promoted unit price -6.5%
• Retailer promotions on shrimp have improved
Source: Industry Estimates; Nielsen
32
US foodservice demand• Favorable trends in foodservice in 2015• Foodservice buyers sensitive to price
changes– Independent restaurants adjust size up or down– Long term trend to prefer large sizes
33

A 10-year trend of shrimp sizing sold by foodservice
Data Source: Collection of data from foodservice and shrimp suppliers
Most radical changes are growth in 16/20, 21/25, 26/30 and declines in 36/40, 51/60 and 71/90.
Above chart depicts “share” of sizes sold. Sizes less than U-15, 91-110, 110-130,130-150, 200-300 and 300-500 are not shown as each independently represent <2% of share with no radical gains/losses in the ten year period 2006-2015. Due to rounding some summarized data might be slightly +/- 100%.
34

Price changes impact customer behavior
Data Source: Collection of data from foodservice and shrimp suppliers. Price changes UB reports.
Between 2006 and 2015 share in the 51-90 range declines by 26 points; while 26/30 share grows 17 points, 21/25 grows 11 points and 16/20 grow 5 points. 41/50 stays constant.
2008:Share reduced 8 points in 41-60 range and did not move to 61-90 count range. Share shifts to 21-35 range.
2009:As prices drop, share loss of 7 points in 36-50 range. Share shifts to 21-30 range. 2010 & 2011: Nominal shifts throughout all sizes. 2012:As prices drop, share of 26/30 and 36/40 decline and 21/25 and 31/35 increase. 2013:Even while prices increase 26/30 and 31/35 share increase 2-3 times, while 21/25 lose share.2014:As prices further increase share shifts from larger sizes to smaller sizes.2015:Large price drops provide 3x growth for 16-25 range.
35

Certain customer types tend to shift shrimp sizes more than others
• Foodservice Independent Operators classified asCasual, Family, and Mexican seem to shift size the most,particularly influenced by market price changes.
• Foodservice Independent Operators classified as FineDining, as well as Italian have the largest share of 16-20,and tend not to shift sizes when markets change.
• 21-25 and 26-30 have gained the most appeal forFoodservice Operators classified as Casual, includingRegional and National Chains.
36

Larger shrimp have declined more in price since 2014
Source: Urner Barry
2.5
3.5
4.5
5.5
6.5
7.5
8.5
Jan-11 Jul-11 Jan-12 Jul-12 Jan-13 Jul-13 Jan-14 Jul-14 Jan-15 Jul-15 Jan-16
$/LB
. HSLO % Change Log Scale
HSLO ASIAN, WHITE, 16-20 COUNT HSLO ASIAN, WHITE, 21-25 COUNT HSLO C&SA, WHITE, 41-50 COUNT HSLO C&SA, WHITE, 61-70 COUNT
Over time, large sizes have adjusted lower; in current dollars
-50% -40% -30% -20% -10%
0% 10% 20% 30% 40% 50% 60%
Jan-11 Jul-11 Jan-12 Jul-12 Jan-13 Jul-13 Jan-14 Jul-14 Jan-15 Jul-15 Jan-16
HSLO % Change Log Scale HSLO ASIAN, WHITE, 16-20 COUNT HSLO ASIAN, WHITE, 21-25 COUNT HSLO C&SA, WHITE, 41-50 COUNT HSLO C&SA, WHITE, 61-70 COUNT
Over time, large sizes have adjusted lower; in current dollars
37
Indications of Holiday, Lent expectations
• What have been preliminary feedback onholiday sales at retail and foodservice?
• What are expectations for Lent
38

What are the critical dates and markers for 2016 shrimp availability
• First half– Indonesia production– Ecuador production– Lack of Central American production
• April / May:– Volume of production• India, Thailand
• June:– China (strength and size of first harvest) and Vietnam
production• Second half of year:– India, Thailand, Vietnam, Mexico
39

Price Ladder
Source: Urner Barry Comtell
$2.00
$2.50
$3.00
$3.50
$4.00
$4.50
$5.00
$5.50
$6.00
$6.50
$7.00
$7.50
$8.00
HLSO U-15 HLSO 16-20 HLSO 21-25 HLSO 26-30
HLSO 31-35 HLSO 41-50 HLSO 51-60
40

Ecuador Head-on
Source: Urner Barry Comtell
1.95
2.45
2.95
3.45
3.95
4.45
4.95
5.45
5.95
HEAD-ON 30-40 HEAD-ON 40-50 HEAD-ON 60-70
41
Questions for 2016• US shrimp demand–Retail promotions– Foodservice traffic
• Timing of Heavy Production– First half vs. second half
42

Audience Questions (1)• What is your role in the Shrimp Industry
– Importer– Producer– Buyer– Distributor– Retail user– Foodservice user– Other
43

Audience Questions (2)• Which represents the biggest unknown
factor about 2016 shrimp market– Total global production– Impact of disease– Impact of Weather, El Nino– China’s economic performance– Strength of US currency– Strength of consumer demand– Competitiveness of Japan and Europe
44

Audience Questions (3)• What factors most concern you about the
seafood/shrimp business climate in 2016– Another supply shock– Price volatility– US economic recession, lack of demand– Increased costs of financing, importing– Political interference with trade– Overseas economic turmoil– None of the above
45

Audience Questions (4)• What changes do you see in shrimp /
seafood in 2016– US Consumption will Grow– US Consumption will Decline– Import sources of Shrimp will Resemble 2015– Import sources of Shrimp will Change in 2016
46

Time for Questions & Discussion
47


![[XLS] · Web view9789681663926 33648 1 91000 9789681666583 36077 1 17000 9788437061726 70270 1 124000 9789872302221 78120 1 38000 9788495939173 41233 1 160000 9788416830350 253541](https://img.pdfslide.us/doc/110x75/5bb449e909d3f28c2a8cb5b4/xls-web-view9789681663926-33648-1-91000-9789681666583-36077-1-17000-9788437061726.jpg)