Embed Size (px)
Citation preview

Carollo Engineers 4600 East Washington Street, Ste. 500 • Phoenix, AZ 85034 602-263-9500 (Ph) 602-265-1422 (Fax) carollo.com
Water Cost‐of‐Service Study FINAL
SEPTEMBER 2017

City of Scottsdale i Final - Water Cost-of-Service Study
CONTENTS Executive Summary _________________________________________________________________ 1
Overview _______________________________________________________________________ 1 Cost-of-Service Study _____________________________________________________________ 1 Results and Recommendations _______________________________________________________ 2
1 Introduction ___________________________________________________________________ 4 Purpose ________________________________________________________________________ 4 Background on the City of Scottsdale _________________________________________________ 4
2 Project Objectives _____________________________________________________________ 11 Forward-looking Statement ________________________________________________________ 11
3 Cost of Service Review _________________________________________________________ 12 Step-by-Step Approach __________________________________________________________ 12
4 Revenue Requirement Analysis ____________________________________________________ 14 Scottsdale Water Budget Category Analysis __________________________________________ 15 Projected Revenues Under current Rates ______________________________________________ 21 Recommended Revenue Requirements ________________________________________________ 23
5 Functional Cost Allocation _______________________________________________________ 25 Water System Cost Categories _____________________________________________________ 26 Customer Class Distribution of Costs _________________________________________________ 28
6 Water Demand Analysis ________________________________________________________ 30 7 Rate Design __________________________________________________________________ 32
Fixed Monthly Base Fee ___________________________________________________________ 32 Fire Protection Charges ___________________________________________________________ 34 Commodity Rates ________________________________________________________________ 35 Customer Impacts ________________________________________________________________ 43 Demand Reduction Surcharge Rates _________________________________________________ 44
Appendix A – Historical Demand Summary ______________________________________________ 49 Appendix B – Projected Water Accounts and Demands ____________________________________ 51 Appendix C – Revenue Requirement Analysis ____________________________________________ 57 Appendix D – Debt Service Payment Schedules __________________________________________ 64 Appendix E – Functional Cost Allocation ________________________________________________ 66

City of Scottsdale ii Final - Water Cost-of-Service Study
TABLES Table E-1 Current and Proposed Monthly Base Fees ........................................................................................ 2
Table E-2 Proposed Rate Structure Breakpoints ................................................................................................. 3
Table E-3 Current and Proposed Water Commodity Rates ............................................................................. 3
Table 1-1 Current Monthly Base Fee .................................................................................................................... 6
Table 1-2 Current Single Family Residential Commodity Rates and Tier Allocations ................................. 7
Table 1-3 Current Multifamily Residential/Non-residential Rates and Tier Allocations ............................. 7
Table 1-4 Outside City Surcharge Calculation ................................................................................................... 8
Table 1-5 Proposed Water Hauling Capital RECOVERY Fee .......................................................................... 9
Table 1-6 Current and Proposed Bulk Water Rates .......................................................................................... 9
Table 1-7 Current Water Development Fees .................................................................................................... 10
Table 4-1 Offsetting Revenues and Operating Expenditures ........................................................................ 17
Table 4-2 Cost Escalation Factors ........................................................................................................................ 18
Table 4-3 Reserve Balance Summary (Prior to Any Rate Increases) ............................................................. 21
Table 4-4 Revenue Requirement Summary (Prior to Any Rate Increases) ................................................... 22
Table 4-5 Recommended Revenue Increases and Resulting Cash Flows....................................................... 24
Table 5-1 Fixed Asset Allocation ......................................................................................................................... 27
Table 5-2 Full Revenue Requirement Functional Allocation ............................................................................. 28
Table 6-1 Historical FY 2015/16 Water Demands and Customer Class Profile....................................... 30
Table 6-2 Projected FY 2017/18 Demand by Customer Class ..................................................................... 31
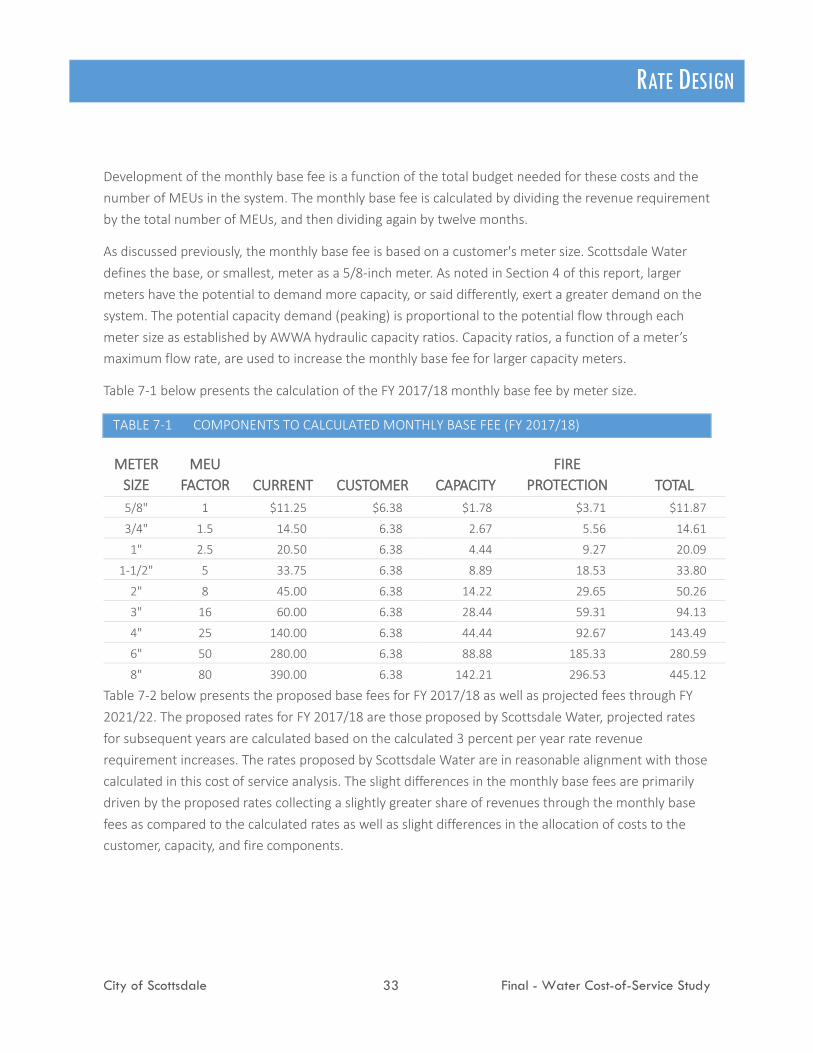
Table 7-1 Components to Calculated Monthly Base Fee (FY 2017/18) ..................................................... 33
Table 7-2 Current and Proposed Monthly Base Fees ...................................................................................... 34
Table 7-3 Private Fire Charge per Meter Equivalent ...................................................................................... 35
Table 7-4 Single Family Residential Peak Factors by Tier .............................................................................. 37
Table 7-5 Proposed Rate Structure Breakpoints ............................................................................................... 38

City of Scottsdale iii Final - Water Cost-of-Service Study
Table 7-6 Consumption by Tier............................................................................................................................. 39
Table 7-7 FY 2017/18 Unit Cost Calculations .................................................................................................. 40
Table 7-8 Proposed Single Family Residential Water Commodity Rate Projections ................................ 41
Table 7-9 Proposed Multifamily Residential & Non-residential Water Rate Projections......................... 41
Table 7-10 Cost Allocation Change by Customer Class ................................................................................ 42
Table 7-11 Monthly Bill Comparison for Proposed Rates ............................................................................. 43
Table 7-12 Demand Reduction Rates With Call for 10 Percent Cutback ................................................. 47
Table 7-13 Demand Reduction Rates With Call for 20 Percent Cutback ................................................. 48
FIGURES Figure 1-1 City of Scottsdale Water System ................................................................................................... 5
Figure 4-1 Project Costs and Escalation .......................................................................................................... 19
Figure 4-2 Capital Funding ................................................................................................................................ 20
Figure 7-1 Monthly Consumption Profile ......................................................................................................... 36

City of Scottsdale iv Final - Water Cost-of-Service Study
GLOSSARY
TERM DESCRIPTION
AF Acre-foot / Acre-feet, 1 AF = 326,000 gallons
AFY Acre-feet per year
AVG Average
AWS Assured Water Supply
AWT Advanced Water Treatment
AWWA American Water Works Association
BOR Bureau of Reclamation
CAGRD Central Arizona Groundwater Replenishment District
CAP Central Arizona Project
CAWCD Central Arizona Water Conservation District
CCI Construction Cost Index
CIP Capital Improvement Plan
CWIP Construction Work-in-Progress
DCP Drought Contingency Plan
DCP+ Drought Contingency Plan Plus
DMP Drought Management Plan
EDU Equivalent Demand Unit
ENR Engineering News Record
FY Fiscal Year
MEU Meter Equivalent Units – relate the capacity required to serve each connection to the system based on the expected maximum flow from meters of each size
MG Million gallons, 1 MG = 3.07 acre feet
MGD Million gallons per day
MHI Median Household Income
MPC Municipal Property Corporation
O&M Operations and Maintenance
PAYGO Pay-As-You-Go
RWDS Reclaimed Water Distribution System
SRP Salt River Project
SFR Single Family Residential

EXECUTIVE SUMMARY
City of Scottsdale 1 Final - Water Cost-of-Service Study
EXECUTIVE SUMMARY
OVERVIEW The City of Scottsdale’s Division of Water Resources, the Scottsdale Water utility, provides water and wastewater services to over 230,000 residents with a system that currently spans 185 square miles. Scottsdale Water has more than 2,000 miles of water transmission and distribution pipelines and more than 1,400 miles of sewer collection pipelines and 43 lift stations. To meet customer water demands, Scottsdale Water accesses 43 storage reservoirs, existing groundwater, reclaimed water, water from the Salt and Verde River watersheds, and water from the Colorado River through the Central Arizona Project (CAP). In fiscal year 2015/16, Scottsdale Water delivered an average of 60.5 million gallons of water a day to its customers. Based on the current trends and land uses, Scottsdale Water’s population in 2040 is estimated to approach 296,000.
In order to meet the continuing needs of existing customers as well as future customers, Scottsdale Water must continue to reinvest in its infrastructure and adapt to changing conditions. In doing so, Scottsdale Water must also maintain utility rates that fund ongoing operations and capital needs, as well as equitably recover costs from system users.
COST-OF-SERVICE STUDY The City of Scottsdale engaged Carollo Engineers to conduct a Water Cost-of-Service Study (Study) for Fiscal Year (FY) 2017/18. This Study builds on a previous cost-of-service study that was used to establish the current rate structure, which was implemented on July 1, 2012, and updated since that time, as well as provides a near-term financial outlook for Scottsdale Water. A cost-of-service study is generally split into four components:
1. Revenue Requirement Analysis - Forecast of annual expenditures, bond obligations, and utility revenues.
2. Functional Cost Analysis - Review of system cost drivers, including system requirements to meet peak summer water demands.
3. Water Demand Analysis - Evaluation of the water usage patterns, water production, and purchase requirements.
4. Rate Design - Update of the water rates to equitably and proportionally recover costs from system users.

EXECUTIVE SUMMARY
City of Scottsdale 2 Final - Water Cost-of-Service Study
Although each component serves a unique and separate purpose, they are all interconnected and establish the basis for the proposed rates.
RESULTS AND RECOMMENDATIONS Based on the analysis as presented within this Water Cost-of-Service Study, Carollo recommends that the City implement the water rates as proposed by Scottsdale Water, which align with the existing rate structure and are substantiated by this cost of service study. Moreover, the current rate structure continues to reflect the cost of providing water service to Scottsdale Water’s customers. Given historical volatility in water demands and the potential of future regulatory restrictions, it is recommended that the City also adopt the proposed demand reduction rate surcharges that may be implemented in future periods as necessary and directed by City Council. These demand reduction rates are designed to provide revenues sufficient to continue to meet Scottsdale Water’s expenditures and debt obligations, despite reductions in demand/sales due to regulatory water curtailment requirements or other low demand periods.
The current and FY 2017/18 proposed water rates for all customer classes are set forth in the following tables. Additionally, future year rates are projected based on the current financial forecast.
TABLE E-1 CURRENT AND PROPOSED MONTHLY BASE FEES
METER SIZE CURRENT
FY 2017/18
FY 2018/19
FY 2019/20
FY 2020/21
FY 2021/22
5/8" $11.25 $11.90 $12.26 $12.75 $13.26 $13.79
3/4" 14.50 15.40 15.86 16.50 17.16 17.84
1" 20.50 21.75 22.40 23.30 24.23 25.20
1-1/2" 33.75 35.75 36.82 38.30 39.83 41.42
2" 45.00 47.75 49.18 51.15 53.20 55.32
3" 60.00 95.00 97.85 101.76 105.83 110.07
4" 140.00 148.50 152.96 159.07 165.44 172.05
6" 280.00 297.00 305.91 318.15 330.87 344.11
8" 390.00 413.50 425.91 442.94 460.66 479.09
The usage allotment by tier and the resulting commodity rates are specific to each customer class in order to proportionally recover costs from each customer. The rates proposed by Scottsdale Water include an update to the Tier 3 breakpoint for single family residential customers, and to the Tier 2 breakpoint for multifamily and non-residential customers to bring the breakpoint for Tiers 1, 2, and 3
EXECUTIVE SUMMARY
City of Scottsdale 3 Final - Water Cost-of-Service Study
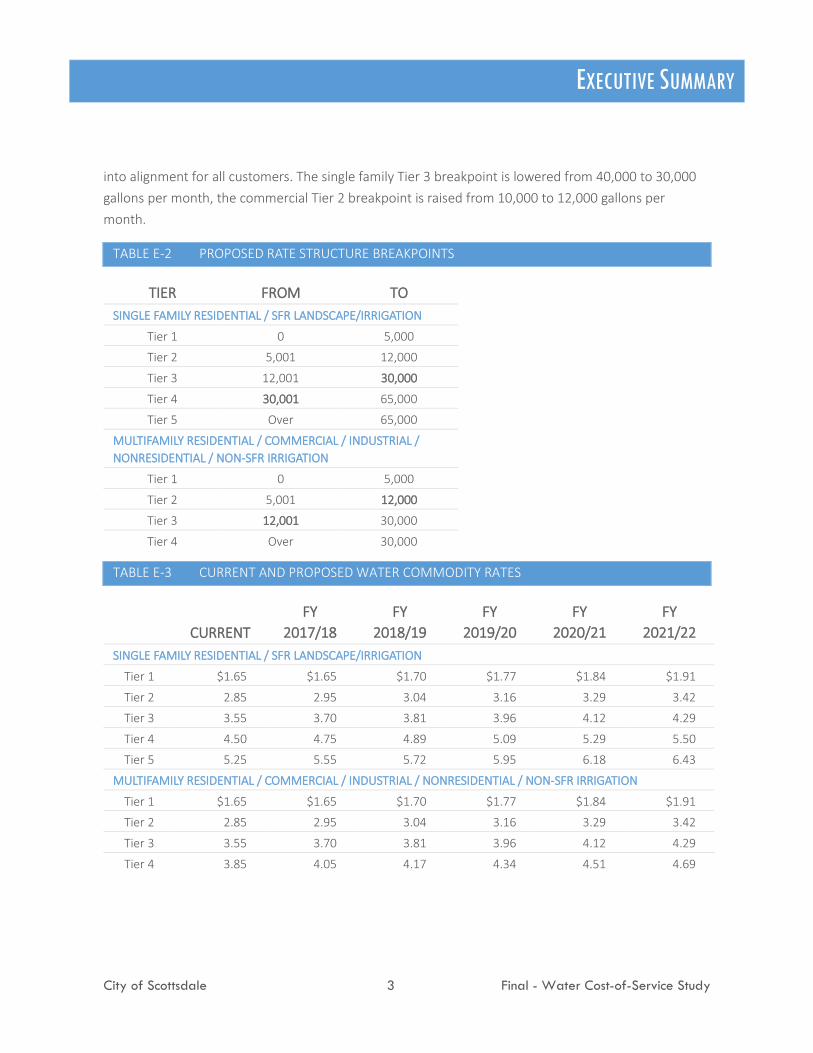
into alignment for all customers. The single family Tier 3 breakpoint is lowered from 40,000 to 30,000 gallons per month, the commercial Tier 2 breakpoint is raised from 10,000 to 12,000 gallons per month.
TABLE E-2 PROPOSED RATE STRUCTURE BREAKPOINTS
TIER FROM TO SINGLE FAMILY RESIDENTIAL / SFR LANDSCAPE/IRRIGATION
Tier 1 0 5,000
Tier 2 5,001 12,000
Tier 3 12,001 30,000
Tier 4 30,001 65,000
Tier 5 Over 65,000
MULTIFAMILY RESIDENTIAL / COMMERCIAL / INDUSTRIAL / NONRESIDENTIAL / NON-SFR IRRIGATION
Tier 1 0 5,000
Tier 2 5,001 12,000
Tier 3 12,001 30,000
Tier 4 Over 30,000
TABLE E-3 CURRENT AND PROPOSED WATER COMMODITY RATES
CURRENT FY
2017/18 FY
2018/19 FY
2019/20 FY
2020/21 FY
2021/22 SINGLE FAMILY RESIDENTIAL / SFR LANDSCAPE/IRRIGATION
Tier 1 $1.65 $1.65 $1.70 $1.77 $1.84 $1.91
Tier 2 2.85 2.95 3.04 3.16 3.29 3.42
Tier 3 3.55 3.70 3.81 3.96 4.12 4.29
Tier 4 4.50 4.75 4.89 5.09 5.29 5.50
Tier 5 5.25 5.55 5.72 5.95 6.18 6.43
MULTIFAMILY RESIDENTIAL / COMMERCIAL / INDUSTRIAL / NONRESIDENTIAL / NON-SFR IRRIGATION
Tier 1 $1.65 $1.65 $1.70 $1.77 $1.84 $1.91
Tier 2 2.85 2.95 3.04 3.16 3.29 3.42
Tier 3 3.55 3.70 3.81 3.96 4.12 4.29
Tier 4 3.85 4.05 4.17 4.34 4.51 4.69
INTRODUCTION
City of Scottsdale 4 Final - Water Cost-of-Service Study
1 INTRODUCTION
PURPOSE The City of Scottsdale engaged Carollo Engineers to conduct a Cost-of-Service Study (Study) for its water utility, Scottsdale Water. This Study includes a cost-of-service analysis and proposes demand reduction rate surcharge adjustments to meet the ongoing revenue needs of Scottsdale Water. Scottsdale Water, like many southwestern water providers, has been challenged by ongoing drought conditions.
Scottsdale Water commissioned Carollo to analyze its current revenue requirements and develop updated rates that proportionally recover costs from system users and are designed to balance conservation goals with revenue needs. To develop these rates, Carollo completed a review of Scottsdale Water’s revenue needs, customer usage patterns, capital improvement plans (CIP), and other future cost drivers. This Study documents the four-step approach Carollo used in developing the proposed rates, presents the rates and the overall impact to Scottsdale Water’s financial projections, and provides further detail of the methodology and assumptions used to develop the financial plan.
BACKGROUND ON THE CITY OF SCOTTSDALE Scottsdale Water’s total water supply includes surface water and groundwater sources, as well as an increasing amount of recycled water. In 2016, Scottsdale Water delivered an average of 67.5 million gallons per day to its water users. Customers may receive water from a single source of water or from a combination of water sources, depending on the time of year, the weather, and customer demand. The utility’s main surface water supply is from the Colorado River. This water is transported through the Central Arizona Project canal to the Scottsdale CAP Water Treatment Plant. Scottsdale Water also receives surface water from the Salt River Project (SRP), which comes from the Verde and Salt Rivers. Water is transported by SRP to the Chaparral Water Treatment Plant. Both facilities employ state of the art technology to deliver superior water quality for the customers. In addition to these two main surface water sources, Scottsdale uses groundwater from aquifers deep below ground. The water is pumped from the ground through one of Scottsdale Water’s wells and then disinfected prior to entering the drinking water distribution system. The water from these wells may receive other forms of treatment prior to disinfection and distribution. Scottsdale also uses underground aquifers to store surface water (so some groundwater was previously surface water) and highly treated, ultrapure

INTRODUCTION
City of Scottsdale 5 Final - Water Cost-of-Service Study
recycled water. Elevations increase over 2,500 feet, rising generally from the south to the north and east, greatly affecting electricity, maintenance, and water distribution costs.
FIGURE 1-1 CITY OF SCOTTSDALE WATER SYSTEM
Image source: City of Scottsdale Infrastructure Improvement Plan, 2013
INTRODUCTION
City of Scottsdale 6 Final - Water Cost-of-Service Study
The water system is also flexible in that the water supplies from the north may be conveyed to the south and vice versa. Scottsdale Water also serves a small number of customers outside the City limits. Additionally Scottsdale Water has agreements with the Tonto Hills Domestic Water Improvement District and Carefree Water Company to treat and deliver CAP water.
Customer Profile Based on FY 2015/16 customer data, the majority of Scottsdale Water’s accounts are single family residential customers (90 percent), followed by multifamily residential and commercial customers (10 percent). Scottsdale Water’s customer class consumption profile reflects the differences between each class' average water usage. In FY 2015/16, single family residential customers consumed 60 percent of Scottsdale Water’s total delivered water, with multifamily residential and commercial customers consuming 19 and 21 percent, respectively.
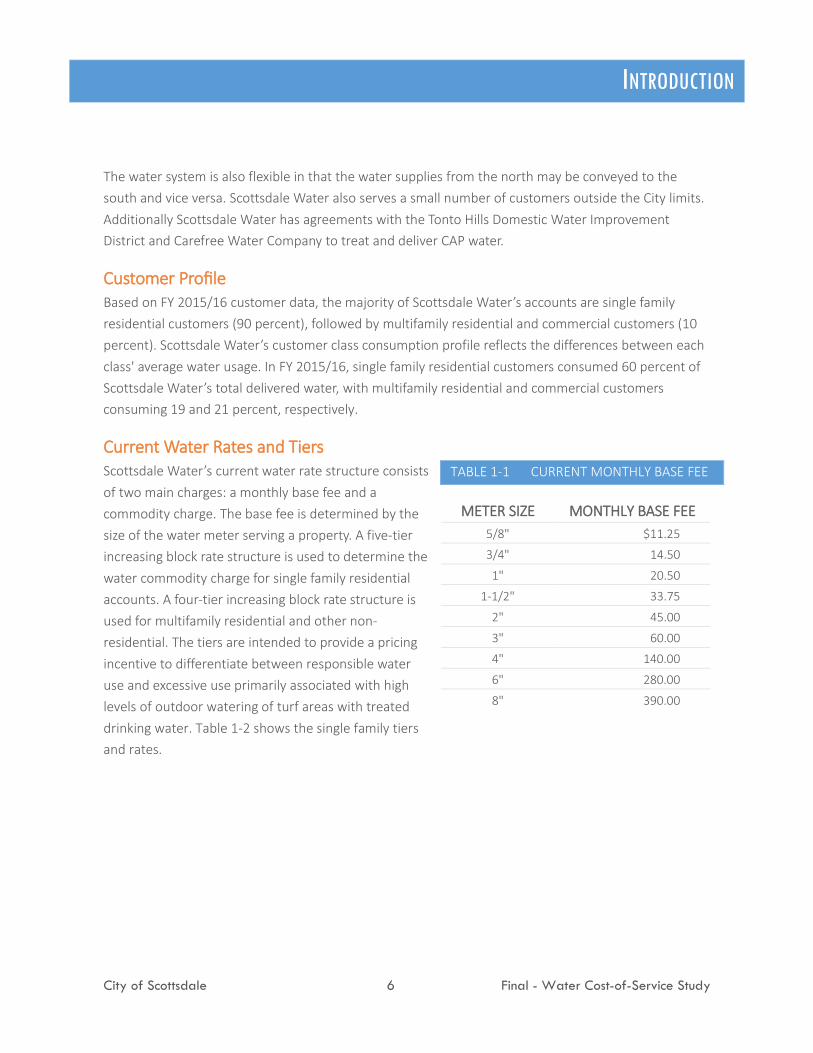
Current Water Rates and Tiers Scottsdale Water’s current water rate structure consists of two main charges: a monthly base fee and a commodity charge. The base fee is determined by the size of the water meter serving a property. A five-tier increasing block rate structure is used to determine the water commodity charge for single family residential accounts. A four-tier increasing block rate structure is used for multifamily residential and other non-residential. The tiers are intended to provide a pricing incentive to differentiate between responsible water use and excessive use primarily associated with high levels of outdoor watering of turf areas with treated drinking water. Table 1-2 shows the single family tiers and rates.
TABLE 1-1 CURRENT MONTHLY BASE FEE
METER SIZE MONTHLY BASE FEE 5/8" $11.25
3/4" 14.50
1" 20.50
1-1/2" 33.75
2" 45.00
3" 60.00
4" 140.00
6" 280.00
8" 390.00

INTRODUCTION
City of Scottsdale 7 Final - Water Cost-of-Service Study
TABLE 1-2 CURRENT SINGLE FAMILY RESIDENTIAL COMMODITY RATES AND TIER ALLOCATIONS
TIER RATE FROM TO 1 $1.65 0 5,000
2 2.85 5001 12,000
3 3.55 12,001 40,000
4 4.50 40,001 65,000
5 5.25 Over 65,000 1. Rates are per 1,000 gallons.
For multifamily residential and commercial accounts, a four-tiered commodity rate structure is applied to each customer's monthly usage. Table 1-3 summarizes Scottsdale Water’s current water rate structure for multifamily and nonresidential customers.
TABLE 1-3 CURRENT MULTIFAMILY RESIDENTIAL/NON-RESIDENTIAL RATES AND TIER ALLOCATIONS
TIER RATE FROM TO 1 $1.65 0 5,000
2 2.85 5001 10,000
3 3.55 10,001 30,000
4 3.85 Over 30,000
1. Rates are per 1,000 gallons.
Outside City Surcharge Carollo recommends increasing the outside city surcharge from 10 percent to 15 percent based on the calculated cost of infrastructure, operations, and other support services, which is in excess of 15 percent. Based on discussion with Scottsdale Water staff, Scottsdale Water must operate, maintain, and repair facilities outside the City boundaries to serve these customers. Water delivered to these customers passes through Scottsdale Water’s system and then through these extended facilities. As a result, the fully loaded cost to provide service to outside city customers could be as much as 49 percent higher than for inside city customers, as shown in Table 1-4 below. As such, a surcharge higher than the proposed 15 percent could be substantiated.

INTRODUCTION
City of Scottsdale 8 Final - Water Cost-of-Service Study
TABLE 1-4 OUTSIDE CITY SURCHARGE CALCULATION
Costs Eligible for Outside City Surcharge Amortization of Transmission Mains (12" and Larger) $592,000 Maintenance of Transmission Mains (12" and Larger) 14,000 Total Surcharge Eligible Costs $606,000
Revenues without Surcharge $1,247,000 Revenues from Maximum Surcharge 606,000 Total Revenues with Maximum Surcharge $1,853,000
Maximum Surcharge Percentage (to recover all eligible costs) 49%
The maximum surcharge amount of 49 percent has been calculated based on the costs to construct and maintain the water transmission mains with diameters of 12 inches or larger in the outside city service area. The percentage surcharge is calculated by dividing the revenues from the maximum surcharge, $606,000, by the amount of revenues expected from outside city customers without a surcharge, $1,247,000.
Amortized construction costs were estimated based on a 50 year amortization period and a 6 percent interest rate. Maintenance costs were estimated using an estimate of pipeline maintenance costs provided by City staff and the share of pipes by length located in the outside city service area. Smaller pipelines, those with diameters of 8 inched and below, are not included in the surcharge calculation since the normal rates cover the costs associated with localized distribution facilities.
Water Hauling Capital Recovery Fees
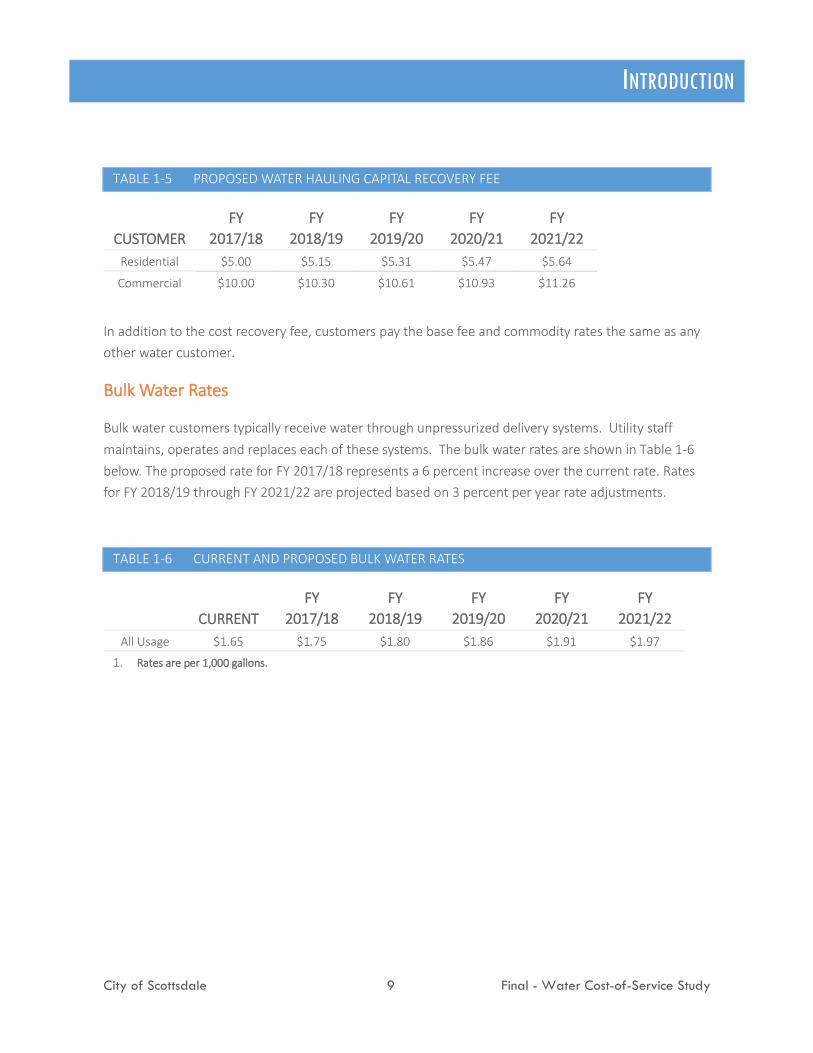
In order to meet the continuing needs of water hauling customers, Scottsdale Water has invested in a $0.5 million Water Station (Station) to facilitate connection to the system. Water hauling customers typically transport the water for use by customers outside the city limits who have not paid a water development fee. Therefore, the water hauling fees now includes a capital recovery component to recover the investment Scottsdale Water has made to construct the Station and the other water system infrastructure needed to produce and transmit water to the Station. The proposed water hauling capital recovery fees are shown in Table 1-5 below. Fees for FY 2018/19 through FY 2021/22 are projected based on 3 percent per year rate adjustments.
INTRODUCTION
City of Scottsdale 9 Final - Water Cost-of-Service Study
TABLE 1-5 PROPOSED WATER HAULING CAPITAL RECOVERY FEE
CUSTOMER FY
2017/18 FY
2018/19 FY
2019/20 FY
2020/21 FY
2021/22 Residential $5.00 $5.15 $5.31 $5.47 $5.64
Commercial $10.00 $10.30 $10.61 $10.93 $11.26
In addition to the cost recovery fee, customers pay the base fee and commodity rates the same as any other water customer.
Bulk Water Rates
Bulk water customers typically receive water through unpressurized delivery systems. Utility staff maintains, operates and replaces each of these systems. The bulk water rates are shown in Table 1-6 below. The proposed rate for FY 2017/18 represents a 6 percent increase over the current rate. Rates for FY 2018/19 through FY 2021/22 are projected based on 3 percent per year rate adjustments.
TABLE 1-6 CURRENT AND PROPOSED BULK WATER RATES
CURRENT
FY 2017/18
FY 2018/19
FY 2019/20
FY 2020/21
FY 2021/22
All Usage $1.65 $1.75 $1.80 $1.86 $1.91 $1.97
1. Rates are per 1,000 gallons.

INTRODUCTION
City of Scottsdale 10 Final - Water Cost-of-Service Study
Development Fees One mechanism used by Scottsdale Water to fund the infrastructure needed to accommodate new growth is the assessment of development fees. Development fees are one-time payments that represent the proportionate share of infrastructure capital costs needed to accommodate new Equivalent Demand Units (EDU). Carollo did not review the development fees as part of this study. However, the City implemented the fees in 2013 in order to comply with Arizona development fee requirements.
TABLE 1-7 CURRENT WATER DEVELOPMENT FEES
METER SIZE MEUS PER METER DEVELOPMENT FEE 5/8", 3/4", 1" 1.0 $3,365
1 1/2" 5.0 16,825
2" 8.0 26,920
3" Compound 16.0 53,840
3" Turbine 22.0 74,030
4" Compound 25.0 84,125
4" Turbine 42.0 141,330
6" Compound 50.0 168,250
6" Turbine 86.0 291,073
8" Compound 80.0 269,200

PROJECT OBJECTIVES
City of Scottsdale 11 Final - Water Cost-of-Service Study
2 PROJECT OBJECTIVES Scottsdale Water retained Carollo to perform an update to the 2011 Cost‐of‐Service Study. The update is designed to be an independent analysis and evaluation of the existing rate‐setting process and methodology for cost recovery, allocations, and calculations, and to make recommendations and refinements. The goal of this Study is to evaluate the rate‐setting process and include the following objectives:
Review the appropriateness of the existing financial plan of Scottsdale Water which documents the utility's financial sufficiency and ability to meet operation and maintenance (O&M) costs and CIP needs.
Evaluate and develop policy considerations of the existing water rate methodology to achieve the goals and objectives of Scottsdale Water, including ease of understanding and promoting water use efficiency/conservation.
Calculate and document the functionalization, classification, and allocation of costs–including capital reserves–among appropriate customer classes consistent with industry standards.
Provide a rate design framework that proportionately aligns demands, allocations, and costs associated with Scottsdale Water’s operations, service classes, and pricing tiers.
Comprehensive Rate Design Rates are typically designed to achieve multiple objectives. While industry standards provide a basis for testing reasonableness, Scottsdale Water must illustrate how its rates reasonably and proportionally recover costs from system users. Within the cost‐of‐service approach, the City's policy guidelines can influence rate structure design elements that are distinct to Scottsdale Water and the community. Within Scottsdale Water’s rate structure, these policies encompass the entire structure, including the selection of the rate design (inclining block rates). With its rate structure, Scottsdale Water is able to satisfy its policy objectives and cost‐of‐service requirements.
FORWARD‐LOOKING STATEMENT The calculations and forecasts of this analysis are based on the reasonable projections of existing service costs, water demands, and system operations with information available and on existing cost‐of‐service proportionality requirements. Significant changes in Scottsdale Water’s operations, changes in Arizona law, or further regulatory actions in regard to water use may require Scottsdale to revisit the cost‐of‐service analysis.

COST OF SERVICE REVIEW
City of Scottsdale 12 Final - Water Cost-of-Service Study
3 COST OF SERVICE REVIEW
STEP-BY-STEP APPROACH Rate analyses are performed to recover system revenues in order to sufficiently fund utility O&M, reserves for future replacement and enhancement capital needs, and other operational costs incurred.
When conducting the cost-of-service analysis, Carollo used a four-step approach, taking into consideration relevant legal standards and industry guidelines. Each step in this process shapes the subsequent step, ultimately resulting in a fair, equitable, and well-documented rate calculation. While the process is shown in a linear step-by-step approach, this is really an iterative process where the ultimate objective is to balance revenues with costs. The process presented below is advocated by the American Water Works Association (AWWA), a national industry trade group that makes recommendations on generally accepted practices in the water industry, and consistent with industry standards established by the AWWA Principles of Water Rates, Fees and Charges: Manual of Water Supply Practices M1 (M1 Manual).
Step 1: Revenue Requirement Analysis The revenue requirement analysis is the first step, serving as the initial diagnostic of the utility’s financial health. The revenue requirement analysis evaluates the utility’s expenses and other operating requirements, such as debt service and applicable coverage ratios, and establishes a baseline revenue need that must be recovered through rates in order to fund Scottsdale Water’s expenditures.
Water Demand AnalysisForecasts water sales based on historical billings, modifications to the rate structure, and any regulatory restrictions
Revenue Requirement AnalysisCompares existing revenues of the utility to its operating, capital, and debt obligations to establish the adequacy of the existing cost recovery levels
Functional Cost AnalysisIdentifies and apportions annual revenue requirements to functional rate components based on its application of the utility system
Rate DesignConsiders both the level and structure of the rate design to collect the distributed revenue requirements from each class of service

COST OF SERVICE REVIEW
City of Scottsdale 13 Final - Water Cost-of-Service Study
As these expenses increase over time due to cost escalation and changes in operating conditions, the revenue requirement analysis determines if projected revenues from user rates are adequate to recover the utility’s costs. If revenues fall short of the revenue requirement at any point in the projection, it signals that the agency is in need of a revenue increase.
Step 2: Functional Cost Analysis After determining a utility’s revenue requirement, the next step is the allocation of costs to functional categories (i.e., cost components), effectively known as the cost-of-service analysis because of its role in developing a cost to serve each customer class and tier. The optimal goal of the cost-of-service analysis is to delineate how much of the utility’s costs benefit each customer class and how much each customer class burdens a utility’s system and water resources. In order to achieve this, costs are categorized by placing all of the expenses in an earmarked “bucket,” such as customer service, which accounts for general support and administrative costs like customer billing. This process allows costs to be proportionally distributed to each customer class based on its respective demand on the system and then establishes rates unique to each customer class. The rate calculation that follows is as simple as dividing the bucket by the appropriate units (units of water, accounts, etc.) for each customer class and tier.
Step 3: Water Demand Analysis Forecasting water sales is a critical component in the rate setting process. As part of the budget process, Scottsdale Water forecasts the expected water usage based on historical demand, proposed changes to rates, regulatory impacts, and weather. These forecasted water demands are then compared against forecasted revenue requirements, and rates are developed to recover Scottsdale Water’s costs. In other words, future demands are based on historic sales and factored for considerations like conservation and weather. Rates are then generated so that estimated sales revenues match associated costs.
Step 4: Rate Design The final part of the analysis is the rate design. The rate design process establishes a rate structure that proportionately recovers costs from customer classes and customers within each customer class. The final rate structure and rate recommendations are designed to (1) fund the utility’s long- and short-term projected costs of providing service, (2) proportionally allocate costs to system customers, and (3) provide a reasonable and prudent balance of revenue stability while encouraging conservation.

REVENUE REQUIREMENT ANALYSIS
City of Scottsdale 14 Final - Water Cost-of-Service Study
4 REVENUE REQUIREMENT ANALYSIS The revenue requirement analysis is the first test of a utility’s fiscal health. This analysis evaluates the adequacy of current rate levels and sets the basis for near- and long-term rate planning.
A revenue requirement analysis was completed by building on Scottsdale Water’s existing rate model. The analysis includes Scottsdale Water’s five-year operating and maintenance cost projections, budgeted CAP expenditures and other future expenses, information related to current reserve fund balances, other future revenues, and other miscellaneous financial information.
Once the revenue requirement is established by compiling all of the utility's cost drivers, two tests are typically utilized to define the annual revenues necessary to recover Scottsdale Water’s costs.
The cash flow sufficiency test defines the amount of annual revenues that must be collected in order to meet annual expenditure obligations of the utility. The cash flow obligations of Scottsdale Water include:
• Operating, maintenance, and various non-operating expenses
• Debt service payments
• Rate-funded capital expenditures
• Reserve funding
Offsetting these cash flow obligations are various sources of revenue, most notably:
• Customer rate revenues
• Miscellaneous operating and non-operating revenues
• Development fee revenues used for growth-related debt service
• Use of surplus reserve balances
Use of surplus reserve balances is not an explicit revenue source such as rate revenue but is accounted for in the year-end net cash flow. For example, if the forecast results in negative year-end cash flow then the operating reserve will be drawn down by an equal amount. However, continually relying on such reserves is not fiscally prudent and financially sustainable; therefore, such reserves are generally not relied upon as part of this Study. The result of the cash flow sufficiency test is defining the amount of rate revenues needed to meet Scottsdale Water’s cash flow needs. Rates are set to generate the revenue to cover cash flow for two reasons: (1) they are controlled by the City Council and are the largest source of revenue whereas, (2) other revenue sources are typically limited by either external constraints, scale, or subject to potential fluctuations due to factors such as customer growth for development fees.
The second test is the debt service coverage test. Many utilities use bonded indebtedness to fund a portion of their capital expenses. Debt service coverage is dictated by the utility's bond covenants and establishes a threshold above basic debt service that the utility must collect in revenues.
REVENUE REQUIREMENT ANALYSIS
City of Scottsdale 15 Final - Water Cost-of-Service Study
The debt service coverage test is necessary because when a utility issues debt it agrees to certain terms and conditions in relation to the repayment of the debt. Debt coverage is often one of those stipulations and might add an additional expense to the utility if revenues are not sufficiently in excess of expenditures. Debt coverage refers to the collection of revenues to meet all operating expenses and debt service obligations plus an additional multiple of that debt service.
Scottsdale Water’s existing debt instruments include Municipal Property Corporation (MPC) bonds and Revenue bonds, which are secured by excise taxes and require a minimum debt coverage ratio of 1.2x. Due to Scottsdale Water’s practice of cash funding capital expenditures in combination with debt, actual coverage levels within Scottsdale Water have been achieved at closer to 2.0x. The current analysis sets the target debt service coverage ratio at 1.2x.
The revenue requirement analysis summarizes the various costs by budget category, and compares the current revenue structure against these costs. Any shortfall between revenues and expenses forms the basis for any needed rate revenue increases.
SCOTTSDALE WATER BUDGET CATEGORY ANALYSIS
Water Supply and Costs1 The utility’s largest renewable water supply originates from the Colorado River and is managed and delivered by the Central Arizona Water Conservation District (CAWCD) through the CAP canal. The City of Scottsdale has access to more than 81,271 acre feet (AF) of CAP supply annually, which comprises approximately 70 percent of the total water supply utilized by Scottsdale Water. This supply is treated by Scottsdale Water’s existing CAP Water Treatment Plant. The United States Bureau of Reclamation (BOR) studies the Colorado River supply conditions year-round and publishes its findings in regular reports. The potential for a shortage on the Colorado River system has been discussed and reviewed for years, and recent studies have indicated the potential for CAP water deliveries to be reduced may occur prior to 2019. This could change if above-normal runoff conditions occur in the interim. If the Colorado River should experience a shortage, water deliveries to the CAP would be reduced to the State of Arizona by 320,000 AF as an initial stage of reduction. Under this condition, some sub-contract holders, including Scottsdale Water would be affected, and supply to agricultural users would be reduced.
The SRP water supplies originate from the Salt and Verde River systems. These systems are fed from precipitation and snow pack in northeastern and central Arizona. The water is stored in a series of reservoirs and delivered to Scottsdale Water through SRP’s canal to Scottsdale Water’s Chaparral Water
1 City Of Scottsdale Drought Management Plan

REVENUE REQUIREMENT ANALYSIS
City of Scottsdale 16 Final - Water Cost-of-Service Study
Treatment Plant. SRP’s water supply also consists of an allocation of groundwater pumped from wells located on lands within the SRP service area. The SRP supply is available for use only on lands within its service area, known as “On-Project” lands. SRP’s available groundwater and surface water supplies vary from year to year, sometimes significantly. SRP lands are located in the southern portion of Scottsdale Water’s service area. Scottsdale Water’s remaining service area is referred to as “Off-Project.” Under normal supply conditions, Scottsdale Water’s SRP lands, 6,071 acres, are entitled to a total of 3 AF per acre of surface water and groundwater, which during normal flow years is 18,213 AF per year. The average water demand on Scottsdale Water’s SRP lands averages approximately 2.5 AF per acre in recent years. When shortages develop on the SRP system, normal delivered volumes are typically reduced corresponding to the shortage. Shortages have occurred within SRP over the last several decades, most recently during the FY 2003/04 time frame, which saw an allocation reduction to approximately 2 AF per acre. Carollo met with Scottsdale Water staff to gain an understanding and basis for allocating each of Scottsdale Water’s local and imported supplies and operating and maintenance costs.
Groundwater
Scottsdale meets the majority of its customer's water demands with surface water and has met the Arizona Department of Water Resources safe yield requirements since 2006. Beginning in 2020, safe yield will require that for every gallon of groundwater withdrawn from the aquifer, another gallon must be recharged back into the aquifer. Scottsdale Water still utilizes groundwater for operational performance, to meet peak demand, conduct groundwater remediation, and as backup for surface water supply during shortage conditions or other surface water supply interruptions.
Due to emphasized and prolonged use of renewable surface water supplies and Scottsdale Water’s water recharge efforts, Scottsdale Water’s groundwater supplies are significantly less impacted by drought; however, during chronic drought episodes Scottsdale Water may be required to increase planned groundwater pumping to meet customer demands if surface water supplies are reduced.
Recycled Water and Conservation It should be noted that reclaimed water is also an important component in the overall portfolio of Scottsdale's water resources. Planning for the use of reclaimed water within the City is accomplished within the framework of integrated water resource management with its focus on meeting irrigation demands, maintaining the goal of safe yield, and maximizing recharge opportunities. Through its recent 2012 Water Reuse Master Plan Update, Scottsdale Water has implemented strategic efforts in order to maximize their capability to locally reuse and recharge reclaimed water. Scottsdale Water’s obligation to deliver reclaimed water to non-potable customers via the Reclaimed Water Distribution System (RWDS) includes the use of untreated CAP canal water; therefore, during a drought episode, there may be a need to monitor the potential service impacts to this portion of the customer base.
Scottsdale Water strives to achieve a resilient water portfolio that not only supplies water for basic health and human safety, but meets outdoor irrigation demands during the peak of the summer usage period.

REVENUE REQUIREMENT ANALYSIS
City of Scottsdale 17 Final - Water Cost-of-Service Study
Accordingly, Scottsdale Water provides reclaimed water for non-domestic usage and maintains a general conservation program.
Existing Operating Expenditures For sound financial operations of Scottsdale Water’s system, the revenues generated must be sufficient to meet the expenditures or cash obligations of the utility. The revenue needs are defined as the amount of revenues that must be recovered through water rates in order to cover annual expenditures, less any offsetting revenues. Offsetting revenues may include interest earnings and other non-operating revenues, such as lease revenues, late payment charges, account initiation fees, or other miscellaneous revenues and receipts. Based on Scottsdale Water’s estimated FY 2016/17 expenditures, the table below identifies the projected expenditures and offsetting revenues for FY 2017/18.
TABLE 4-1 OFFSETTING REVENUES AND OPERATING EXPENDITURES
DESCRIPTION FY 2017/18 NOTES OFFSETTING REVENUES
Department Indirect & Other Revenue $1,750 Includes interest revenue, department indirects, contractual
Development Fees 1,800
Total Offsetting Revenues $3,550
OPERATING EXPENDITURES
Operating Expenses $50,864
Includes employee salaries & wages (including benefits), purchased water, electricity, treatment filter media, maintenance.
Operating Transfers 11,000 Includes franchise fee, city-wide indirect allocations, AWT operating transfer.
Debt Service 21,650 MPC bonds and Revenue bonds.
Total Operating Expenditures $83,514 1. All values in thousand dollars.
Operating Needs Operating needs are expenditures that Scottsdale Water incurs in the day-to-day operations of its system, such as employee salaries and benefits, raw water purchases, electricity, and treatment filter media. Other costs in the operating budget include citywide indirect costs for services such as accounting, human resources, legal counsel, etc.
Scottsdale Water’s FY 2017/18 projected operating budget served as the basis for forecasting future operating expenses. The budget was compared to prior year actual financial information to identify any anomalies or one-time expenditures not appropriate for forecasting in future years. Scottsdale Water staff also reviewed the budget for costs that might need to be adjusted due to future operational changes.

REVENUE REQUIREMENT ANALYSIS
City of Scottsdale 18 Final - Water Cost-of-Service Study
Unless manually calculated, future years were forecasted using general cost inflation factors appropriate for the type of expense. These escalation factors, provided in Table 4-2, were assigned on a line-item basis.
TABLE 4-2 COST ESCALATION FACTORS
COST ESCALATOR DESCRIPTION
Labor Cost Inflation Labor rates are assumed to increase at the long-term average of about 3 percent per year.
Construction Cost Inflation
Although capital cost inflation is commonly linked to the Engineering News Record (ENR) Construction Cost Index (CCI), the inflation rate assumes the ENR’s long-term average of 3 percent.
Power Inflation
This escalator applies to costs such as electricity and fuel, which typically exhibit annual increases higher than general inflation; it is set at 1 percent for FY 2017/18, and between 3 and 5 percent thereafter.
General Cost Inflation This escalator applies to most expenses in the operating expense forecast; it averages about 2 percent per year.
Purchased Water Costs
This escalator is applied to replenishment and raw water purchased from CAWCD and SRP. The year-over year change in purchased raw water costs varies based on the rates and fees implemented by the CAP, CAGRD, and other water purveyors. Over the next five years, water purchase costs are expected to increase by an average of about 10 percent per year.
Chemical Cost Inflation
Chemical costs are expected to decrease by about 3.7 percent in FY 2017/18 due to inventory levels, after that time, they are projected to increase by about 5.5 percent per year.
Operating expenses are projected to increase to $60.2 million in FY 2020/21, representing an 18.5 percent overall increase from the FY 2017/18 budgeted level of $50.8 million, and an average annual increase of approximately 3.5 percent. The largest driver for these increases is the purchase cost of raw water.
Debt Service Existing debt service payments are established in Scottsdale Water’s debt repayment schedules. Currently, Scottsdale Water’s annual payment for existing debt service is approximately $21.7 million in FY 2017/18. A full listing of Scottsdale Water’s existing debt schedule is provided in Appendix D.
Debt Service Coverage As discussed previously, Scottsdale Water’s bonds are structured as MPC and Revenue bonds that rely on pledged excise tax revenues for coverage. In order to promote continued fiscal sustainability and maintain favorable credit ratings, Scottsdale Water targets an internal debt coverage ratio of 1.2x. The target coverage ratio means that Scottsdale Water’s adjusted net revenues shall amount to at least 120 percent
REVENUE REQUIREMENT ANALYSIS
City of Scottsdale 19 Final - Water Cost-of-Service Study
of the annual debt service. Annual debt service includes the annual principal and interest payments on outstanding debt in any given year.
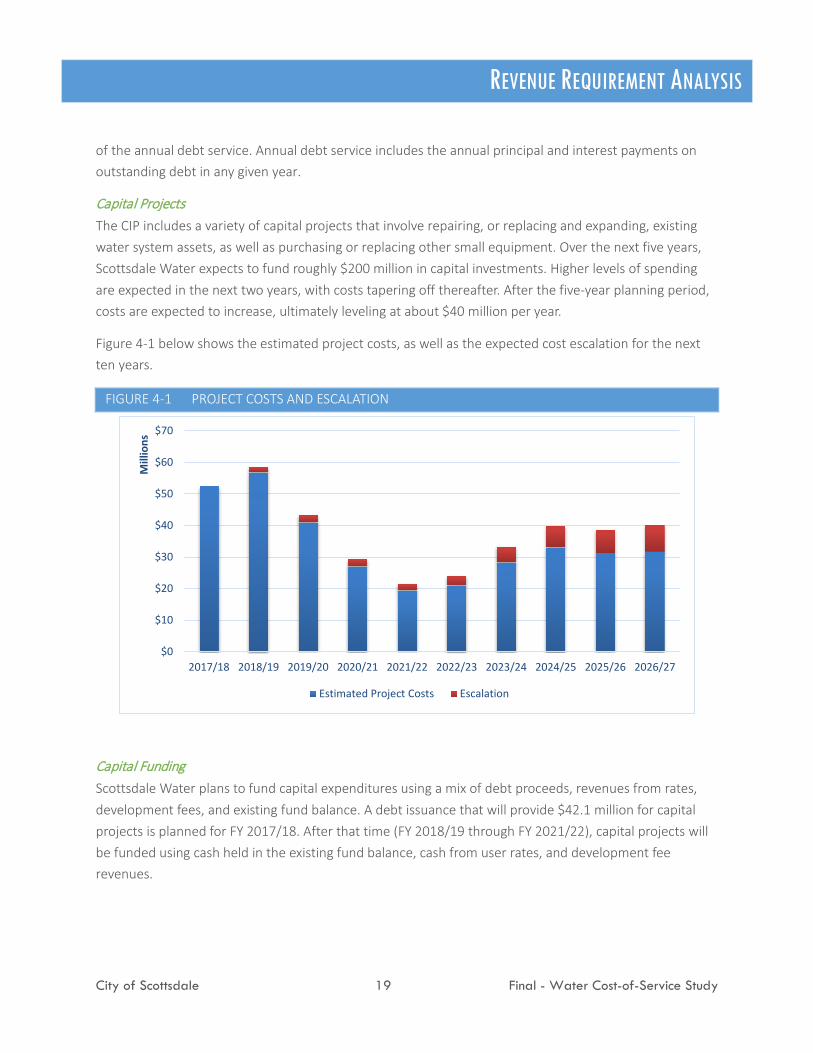
Capital Projects The CIP includes a variety of capital projects that involve repairing, or replacing and expanding, existing water system assets, as well as purchasing or replacing other small equipment. Over the next five years, Scottsdale Water expects to fund roughly $200 million in capital investments. Higher levels of spending are expected in the next two years, with costs tapering off thereafter. After the five-year planning period, costs are expected to increase, ultimately leveling at about $40 million per year.
Figure 4-1 below shows the estimated project costs, as well as the expected cost escalation for the next ten years.
FIGURE 4-1 PROJECT COSTS AND ESCALATION
Capital Funding Scottsdale Water plans to fund capital expenditures using a mix of debt proceeds, revenues from rates, development fees, and existing fund balance. A debt issuance that will provide $42.1 million for capital projects is planned for FY 2017/18. After that time (FY 2018/19 through FY 2021/22), capital projects will be funded using cash held in the existing fund balance, cash from user rates, and development fee revenues.
$0
$10
$20
$30
$40
$50
$60
$70
2017/18 2018/19 2019/20 2020/21 2021/22 2022/23 2023/24 2024/25 2025/26 2026/27
Mill
ions
Estimated Project Costs Escalation

REVENUE REQUIREMENT ANALYSIS
City of Scottsdale 20 Final - Water Cost-of-Service Study
Figure 4-2 below shows the analyzed capital funding strategy for the five-year study period.
FIGURE 4-2 CAPITAL FUNDING
Reserves In addition to the operating expenses outlined in this Study, Scottsdale Water has revenue requirements related to maintaining adequate water reserve funds. Each of the reserve funds is described below.
Scottsdale Water should continue to monitor revenues and reserve levels on an annual basis. The reserve target may also be adjusted further as Scottsdale Water policy dictates to minimize rates or to smooth future rate increases. Should Scottsdale Water reach and maintain desired reserve levels, it is recommended that Scottsdale Water implement a reserve policy to formally define desired funding levels, needs, and uses.
Operating Reserve The City of Scottsdale’s comprehensive financial policies dictate that the water fund should maintain an operating reserve between 60 and 90 days of budgeted operating expenses excluding debt service. The revenue requirement analysis targets a minimum operating fund balance equal to 70 days of operating expenses. This minimum fund balance is adjusted annually to take into account changes to Scottsdale Water’s operating expenditures.
$0
$10
$20
$30
$40
$50
$60
$70
2017/18 2018/19 2019/20 2020/21 2021/22
Mill
ions
Development Fees Current Revenues Fund Balance New Bond Issuances

REVENUE REQUIREMENT ANALYSIS
City of Scottsdale 21 Final - Water Cost-of-Service Study
Replacement and Extension Reserve The Replacement and Extension Reserve is a capital reserve held by Scottsdale Water that is used to provide a source of funds for capital projects in the event of an emergency. The revenue requirement analysis targeted a minimum capital fund balance of approximately 2 percent of the original cost of Scottsdale Water’s capital assets, as dictated by the City’s policy.
Capital/Rate Stabilization The balance of Scottsdale Water’s cash assets is held as unrestricted cash in the water fund and is available for rate stabilization or to pay for capital projects. The current balance of these funds is $83.2 million (projected for FY 2016/17 year-end) with and ending FY 2017/18 balance of $91.0 million.
Table 4-3 shows the projected ending balances for each of Scottsdale Water’s reserves.
TABLE 4-3 RESERVE BALANCE SUMMARY (PRIOR TO ANY RATE INCREASES)
DESCRIPTION FY
2017/18 FY
2018/19 FY
2019/20 FY
2020/21 FY
2021/22 Operating Reserve $11,297,000 $11,691,000 $11,987,000 $12,628,000 $13,251,000 Replacement and Extension Reserve 28,561,000 29,700,000 30,519,000 31,061,000 31,450,000 Cash In Reserve $39,858,000 $41,391,000 $42,506,000 $43,689,000 $44,701,000 Balance for Capital/Rate Stabilization (PAYGO)
91,081,000 52,107,000 30,604,000 22,855,000 23,175,000
Total Cash Balance $130,939,000 $93,498,000 $73,110,000 $66,544,000 $67,876,000
PROJECTED REVENUES UNDER CURRENT RATES Scottsdale Water collects most of its revenues through user service charges, including monthly base fees and commodity charges. These revenues make up roughly 90 percent of Scottsdale Water’s operating revenues.
The forecasted annual retail demand for the study period is 67,800 AF per year.
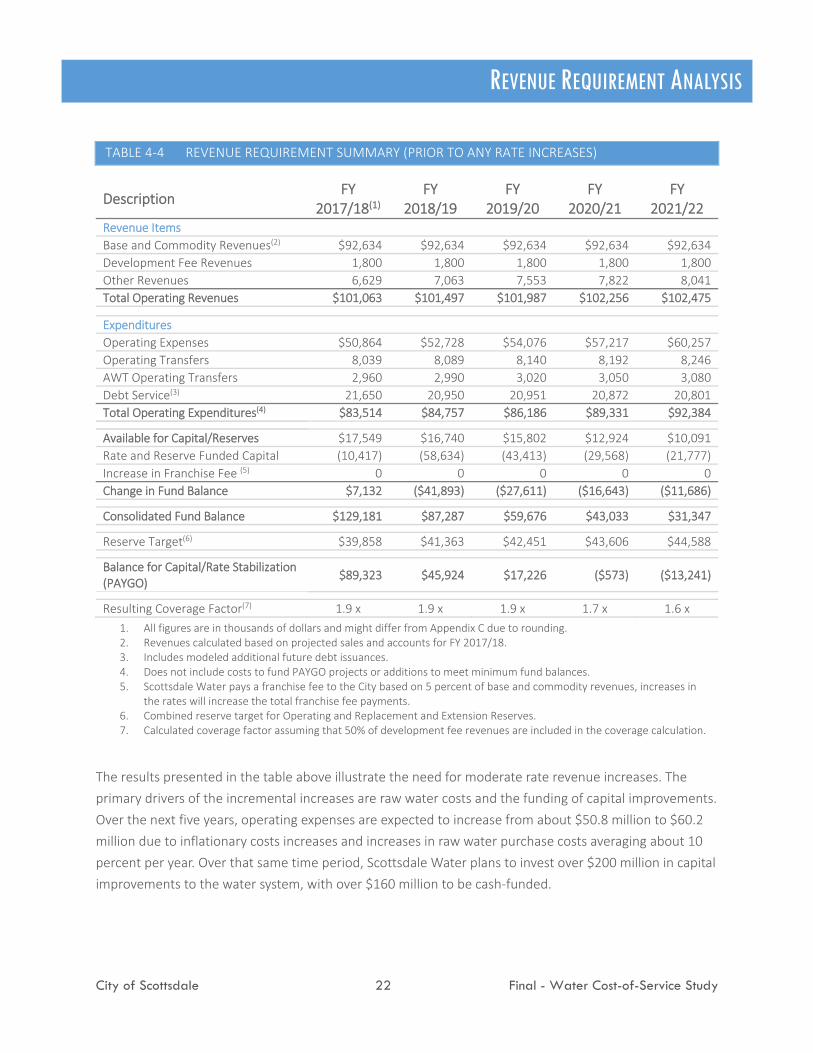
Table 4-4 outlines Scottsdale Water’s projected revenue and expense forecast for the next five years prior to any rate increases. Absent rate increases, Scottsdale Water will run budget deficits after FY 2018/19, and would not be able to meet its rate-funded capital targets without significant use of cash on hand and decreasing reserve levels in FY 2020/21 and FY 2021/22.
REVENUE REQUIREMENT ANALYSIS
City of Scottsdale 22 Final - Water Cost-of-Service Study
TABLE 4‐4 REVENUE REQUIREMENT SUMMARY (PRIOR TO ANY RATE INCREASES)
Description FY 2017/18(1)
FY 2018/19
FY 2019/20
FY 2020/21
FY 2021/22
Revenue Items Base and Commodity Revenues(2) $92,634 $92,634 $92,634 $92,634 $92,634 Development Fee Revenues 1,800 1,800 1,800 1,800 1,800
Other Revenues 6,629 7,063 7,553 7,822 8,041
Total Operating Revenues $101,063 $101,497 $101,987 $102,256 $102,475
Expenditures Operating Expenses $50,864 $52,728 $54,076 $57,217 $60,257 Operating Transfers 8,039 8,089 8,140 8,192 8,246
AWT Operating Transfers 2,960 2,990 3,020 3,050 3,080
Debt Service(3) 21,650 20,950 20,951 20,872 20,801
Total Operating Expenditures(4) $83,514 $84,757 $86,186 $89,331 $92,384
Available for Capital/Reserves $17,549 $16,740 $15,802 $12,924 $10,091 Rate and Reserve Funded Capital (10,417) (58,634) (43,413) (29,568) (21,777)
Increase in Franchise Fee (5) 0 0 0 0 0 Change in Fund Balance $7,132 ($41,893) ($27,611) ($16,643) ($11,686)
Consolidated Fund Balance $129,181 $87,287 $59,676 $43,033 $31,347
Reserve Target(6) $39,858 $41,363 $42,451 $43,606 $44,588
Balance for Capital/Rate Stabilization (PAYGO)
$89,323 $45,924 $17,226 ($573) ($13,241)
Resulting Coverage Factor(7) 1.9 x 1.9 x 1.9 x 1.7 x 1.6 x1. All figures are in thousands of dollars and might differ from Appendix C due to rounding. 2. Revenues calculated based on projected sales and accounts for FY 2017/18. 3. Includes modeled additional future debt issuances. 4. Does not include costs to fund PAYGO projects or additions to meet minimum fund balances. 5. Scottsdale Water pays a franchise fee to the City based on 5 percent of base and commodity revenues, increases in
the rates will increase the total franchise fee payments. 6. Combined reserve target for Operating and Replacement and Extension Reserves. 7. Calculated coverage factor assuming that 50% of development fee revenues are included in the coverage calculation.
The results presented in the table above illustrate the need for moderate rate revenue increases. The primary drivers of the incremental increases are raw water costs and the funding of capital improvements. Over the next five years, operating expenses are expected to increase from about $50.8 million to $60.2 million due to inflationary costs increases and increases in raw water purchase costs averaging about 10 percent per year. Over that same time period, Scottsdale Water plans to invest over $200 million in capital improvements to the water system, with over $160 million to be cash‐funded.

REVENUE REQUIREMENT ANALYSIS
City of Scottsdale 23 Final - Water Cost-of-Service Study
RECOMMENDED REVENUE REQUIREMENTS Based on the results of this analysis, it is recommended that Scottsdale Water increase revenues annually in order to meet projected revenue needs. Based on current projections, revenues will not adequately fund expenses or reserves in the coming years. As FY 2016/17 is the current fiscal year, and given the necessary noticing and implementation requirements, the proposed revenue increases will be effective beginning November 2017. The rate increase will not be in effect for the entire FY 2017/18 period.
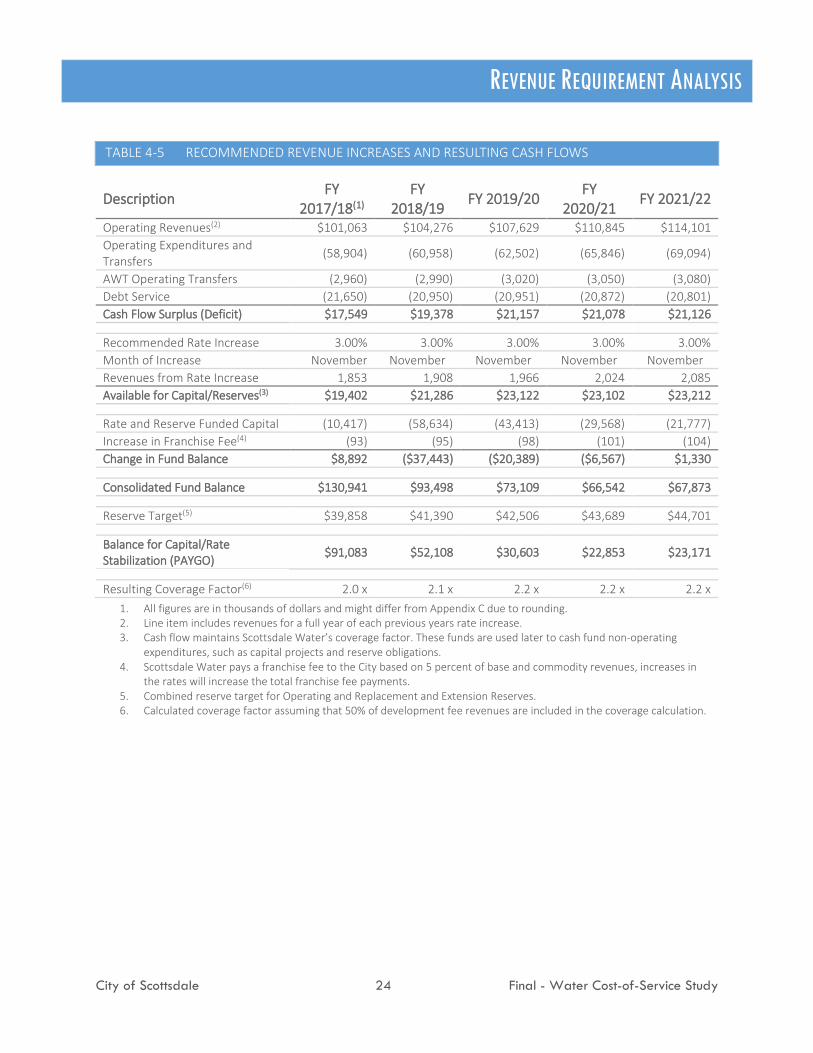
Scottsdale Water’s past planning and management has placed the utility in a good financial position. Use of existing fund balance to fund CIP projects over the next three years, coupled with relatively low outstanding debt will allow Scottsdale Water to continue to cover costs with only modest rate increases. As shown in Table 4-5 below, rate increases at the inflationary level of 3 percent per year, will be sufficient to cover ongoing costs and fund the capital improvement plan, barring any unexpected and substantial revenue losses or cost increases.
While Scottsdale Water is forecasted to generate positive cash flow of over $15 million per year, these funds are not to be considered excess. Any resulting positive cash flow will be utilized to either fund identified PAYGO capital projects or to rebuild reserves. Secondarily, this positive cash flow helps to maintain Scottsdale Water’s debt service coverage ratio.
REVENUE REQUIREMENT ANALYSIS
City of Scottsdale 24 Final - Water Cost-of-Service Study
TABLE 4-5 RECOMMENDED REVENUE INCREASES AND RESULTING CASH FLOWS
Description FY 2017/18(1)
FY 2018/19 FY 2019/20 FY
2020/21 FY 2021/22
Operating Revenues(2) $101,063 $104,276 $107,629 $110,845 $114,101 Operating Expenditures and Transfers
(58,904) (60,958) (62,502) (65,846) (69,094)
AWT Operating Transfers (2,960) (2,990) (3,020) (3,050) (3,080) Debt Service (21,650) (20,950) (20,951) (20,872) (20,801) Cash Flow Surplus (Deficit) $17,549 $19,378 $21,157 $21,078 $21,126
Recommended Rate Increase 3.00% 3.00% 3.00% 3.00% 3.00% Month of Increase November November November November November Revenues from Rate Increase 1,853 1,908 1,966 2,024 2,085 Available for Capital/Reserves(3) $19,402 $21,286 $23,122 $23,102 $23,212
Rate and Reserve Funded Capital (10,417) (58,634) (43,413) (29,568) (21,777) Increase in Franchise Fee(4) (93) (95) (98) (101) (104) Change in Fund Balance $8,892 ($37,443) ($20,389) ($6,567) $1,330
Consolidated Fund Balance $130,941 $93,498 $73,109 $66,542 $67,873 Reserve Target(5) $39,858 $41,390 $42,506 $43,689 $44,701
Balance for Capital/Rate Stabilization (PAYGO)
$91,083 $52,108 $30,603 $22,853 $23,171
Resulting Coverage Factor(6) 2.0 x 2.1 x 2.2 x 2.2 x 2.2 x 1. All figures are in thousands of dollars and might differ from Appendix C due to rounding. 2. Line item includes revenues for a full year of each previous years rate increase. 3. Cash flow maintains Scottsdale Water’s coverage factor. These funds are used later to cash fund non-operating
expenditures, such as capital projects and reserve obligations. 4. Scottsdale Water pays a franchise fee to the City based on 5 percent of base and commodity revenues, increases in
the rates will increase the total franchise fee payments. 5. Combined reserve target for Operating and Replacement and Extension Reserves. 6. Calculated coverage factor assuming that 50% of development fee revenues are included in the coverage calculation.
FUNCTIONAL COST ALLOCATION
City of Scottsdale 25 Final - Water Cost-of-Service Study
5 FUNCTIONAL COST ALLOCATION With Scottsdale Water’s revenue requirements outlined—including needed rate increases—the next step is to link each cost item with a specific service to the system that it supports. This is commonly referred to as the cost-of-service analysis, or the functional cost allocation, because it connects each cost of Scottsdale Water with a functional category or purpose that it funds. For instance, expenses related to the billing system are allocated under the umbrella of the customer service function, while baseline raw water purchases go to support the base demand function.
The costs incurred are generally responsive to the specific service requirements or cost drivers imposed on the system and its water resources by its customers. The principal service requirements that drive costs include the annual volume of water consumed, the peak water demands incurred, and the number or customers or meter equivalents in the system. Accordingly, these service requirements are the basis for the selection of the categories utilized in the functional allocation process.
The AWWA M1 Manual outlines the two most widely used methods for allocation of costs— the base-extra capacity method and the commodity-demand methodology. Both methods recognize that the cost of serving a customer depends not only on the total volume of water used, but also on the rate of use or peak-demand requirements.
Similar to the previous cost-of-service study, the proposed rates presented within this Study are developed using a base-extra capacity method. In using the base-extra capacity method, costs are typically separated into four cost components: (1) Base (average), (2) Extra Capacity, (3) Customer, and (4) Fire. As noted in the AWWA M1 Manual, in detailed rate studies, some of these elements might be broken down further into two or more subcomponents.
Based on Scottsdale Water’s expenditures and system characteristics, the Customer (fixed monthly) component is separated into two subcomponents: (1) Customer (accounts) and (2) Capacity (meter equivalent units (MEU)). Capacity-related costs are also included in the Base cost component described below.
This bifurcation of the Customer component is done to better identify and allocate costs that vary based on capacity needs (as defined by the size of the meter) from those that should be equally shared by each customer account. Similarly, Extra Capacity was split into three subcomponents: (1) Peak Month, (2) Peak Day, and (3) Peak Hour. These are designed to better distinguish that not all demand (and peaking) is equal. These calculated peaking factors, based on Scottsdale Water’s system, are used to allocate the cost of providing extra capacity in the system needed to serve those who use more. Different facilities, such as distribution and storage facilities, and the operation and maintenance costs associated with those

FUNCTIONAL COST ALLOCATION
City of Scottsdale 26 Final - Water Cost-of-Service Study
facilities, are designed to meet the peaking demands of customers. Therefore, extra-capacity costs include the operations and maintenance costs and capital costs associated with meeting peak customer demand.
WATER SYSTEM COST CATEGORIES Carollo developed a detailed cost allocation that serves as the foundation for the proposed rate adjustments. Carollo met with Scottsdale Water staff (finance and engineering) to prepare a detailed evaluation and calculation of system capacity and utilization. This process served as the basis for allocating each line item and to forecast how potential operational shifts would impact the cost of service.
As the first step in the evaluation process, a functional allocation was developed by analyzing Scottsdale Water’s budget on a line-by-line basis and allocating each expense to the appropriate functional cost category. The revenue requirements, discussed previously, were then allocated to functional cost categories. The following are the functional cost categories based on the AWWA base-extra capacity methodology:
Functional Cost Components:
• Customer: Customer costs are fixed expenses that relate to operational support activities, including accounting, billing, customer service, and administrative and technical support. These expenditures are essentially common to all customers, regardless of the meter size serving a property.
• Base: Costs allocated to the Base function are those associated with providing the basic level of water service. It is assumed that allocated costs benefit usage uniformly and do not vary based on the peak or overall volume of water. This category also includes meter and capacity-related costs, such as meter maintenance and peaking charges, that are included based on the meter’s hydraulic capacity (measured in gallons per minute).
• Peak Month Usage: Costs associated with providing the extra system capacity to meet the extra demand associated with months with higher usage.
• Peak Day Usage: Similar to Peak Month Usage, these are the costs of providing the extra capacity to meet peak day demands.
• Peak Hour: Costs associated with providing the necessary capacity to meet spikes in usage during the day.
• Fire Protection: As the system is partially designed around fire flows, a portion of the incremental fire flow capacity is allocated to fire protection. This category includes both public and private fire protection. Public fire protection is the shared cost of providing fire protection through Scottsdale Water’s 11,052 fire hydrants. Private fire protection is the cost associated with upsizing a fire meter in order to provide additional capacity for increased flow in the need of fire protection – this increased flow is called fire flow.

FUNCTIONAL COST ALLOCATION
City of Scottsdale 27 Final - Water Cost-of-Service Study
This functional allocation process provides a reasonable, appropriate, and industry-standard basis for proportionately distributing costs to system customers based on cost causation principles — e.g., their usage patterns — and is grounded in cost-of-service principles and standards.
This methodology and process also provides the basis for the tiered rate structure. Peak costs are allocated into the outer tiers so that they are collected from the customers with higher usage, who are the drivers of the consumption peaking.
The allocation of fixed asset categories across functional categories provides the allocation of the system which is generally called the plant-in-service or fixed asset allocation. Instinctively the fixed asset allocation provides the percentages of the system that is “responsible” for providing each of the above utility functions. The following table provides the fixed asset allocation for Scottsdale Water.
TABLE 5-1 FIXED ASSET ALLOCATION
ASSET DESCRIPTION CUSTOMER
BASE USAGE
PEAK MONTH
PEAK DAY
PEAK HOUR FIRE
AS ALL OTHER1
Land 100.0%
Meters & Services 100.0%
Structures & Buildings
25.0% 39.0% 10.0% 5.0% 21.0%
Treatment 52.0% 13.0% 6.0% 29.0%
Reservoirs 32.0% 8.0% 4.0% 18.0% 38.0%
Wells 52.0% 13.0% 6.0% 29.0%
Water Rights 52.0% 13.0% 6.0% 29.0%
Pump Stations 33.0% 8.0% 4.0% 18.0% 36.0%
Transmission & Distribution
36.0% 9.0% 5.0% 20.0% 30.0%
Hydrants 100.0%
Miscellaneous 100.0%
CWIP 100.0%
Fixed Asset Allocation
6.0% 47.0% 12.0% 6.0% 26.0% 4.0% -
1. As All Other allocation is reallocated across the other functional components.
The above allocation represents the functional allocation of the existing system assets and the “fixed asset” allocation that can be applied to the budget and revenue requirement line items. To continue, the next step in the functional allocation process is the allocation of the revenue requirement. The budgeted revenue requirements for FY 2017/18 were reviewed on a line-item by line-item basis and allocated to each of the functional components discussed above. Allocating the revenue requirement to the various functional components determines the amount of revenue needed to be collected to cover the costs

FUNCTIONAL COST ALLOCATION
City of Scottsdale 28 Final - Water Cost-of-Service Study
associated with each component. A detailed table showing the allocation of each line item is included in Appendix E.
In addition to allocating costs across the functional components, costs were also allocated between the fixed and variable charge of the rate structure. This allocation was done to account for the fact that some customers have an “upsized” meter due to an increased need for fire protection. By allocating costs between the two rate components (i.e., base and volumetric), costs can be more equitably recovered to account for this upsizing in meters.2 The table below summarizes the revenue requirement functional allocation.
Table 5-2 provides the functional allocation of FY 2017/18 costs by category to the specific component of the rates through which those functionalized costs are recovered. Detail of this allocation is shown in the rate calculations of Appendix E.
TABLE 5-2 FULL REVENUE REQUIREMENT FUNCTIONAL ALLOCATION
FY 2017/18 ALLOCATION CUSTOMER
BASE USAGE
PEAK MONTH
PEAK DAY
PEAK HOUR FIRE TOTAL
Base Fee Allocation
$6,871 $4,521 $0 $0 $0 $9,427 $20,819
33.00% 21.72% 0.00% 0.00% 0.00% 45.28% 100%
Commodity Rate Allocation
$0 $36,578 $10,275 $5,137 $22,604 $0 $74,594
0.00% 49.04% 13.77% 6.89% 30.30% 0.00% 100%
Total Allocation(1)
$6,871 $41,099 $10,275 $5,137 $22,604 $9,427 $95,413
7.20% 43.07% 10.77% 5.38% 23.69% 9.88% 100% 1. Dollar values in thousands, totals may be off due to rounding.
The above allocation process is then allocated across customer classes to determine the appropriate amount of revenue to collect from each class. This process is called the customer allocation and is the next step in the cost-of-service analysis.
CUSTOMER CLASS DISTRIBUTION OF COSTS The costs allocated to each functional category were then distributed across each functional component based upon each customer class's proportionate usage of the system. The costs are allocated to the functional components in the following way:
2 Through discussion with City staff, the majority of meters that were upsized to provide improved fire protection were mostly single family residential customers.

FUNCTIONAL COST ALLOCATION
City of Scottsdale 29 Final - Water Cost-of-Service Study
• Customer: Costs are allocated based on each customer class’s share of the total number of accounts. Costs are distributed using this metric because customer costs are the same no matter the size or usage patterns of an individual customer. An example to illustrate this logic is the cost of mailing out bills and postage. It costs the same to mail a bill to a single family residential customer as it does to mail a bill to the largest commercial customer. Therefore, costs are allocated on an account by account basis.
• Base Usage: Costs are allocated based on the annualized winter usage for each of the defined customer classes. Annualized winter usage is used because it best represents the “base” usage that a customer would use for essential water use – essential water use meaning the amount of water used for health and safety reasons. It is important to note that annualized winter usage is a calculated customer statistic and represents the usage over the winter months.
• Peak Month/Day/Hour Usage: Costs are allocated based on the incremental summer usage. Incremental summer usage is defined as the difference between total annual usage (actual usage from the customer statistics) and annualized winter usage.
• Fire Protection: For the customer allocation process, fire protection costs are allocated based on the number of MEUs. This method of allocation accounts for the fire flow driven components of the water system by passing costs onto customers based on their potential demands on the system. Additionally, the costs of public fire protection (hydrants) are considered a public benefit to be shared among all users.
Using the above-stated allocation methods, costs are assigned to different customer classes. Three different customer classes were assigned to the customer base for Scottsdale Water. Costs were allocated to single family residential and commercial customers. Commercial customers are all customers except single family.

WATER DEMAND ANALYSIS
City of Scottsdale 30 Final - Water Cost-of-Service Study
6 WATER DEMAND ANALYSIS As an update to the 2011 Cost-of-Service Study, Carollo analyzed Scottsdale Water’s billing records from FY 2009/10 through FY 2015/16. To forecast future water demands, a combination of the FY 2015/16 billings and more recent consumption records were used to forecast the FY 2017/18 water demands and customer class usage profiles. Based on conservation trends and current water demands, the total forecasted water demand for FY 2017/18 is 60.5 million gallons per day (MGD).
Based on billing records from FY 2009/10 through FY 2015/16, Table 6-1 provides summary customer statistics by customer class, including the number of accounts, MEUs, and water demands. An MEU is based on the size and capacity of the meter and is an estimation of the potential demand, or capacity requirement, that the meter will place on Scottsdale Water. For example, Scottsdale Water’s smallest meter (5/8-inch) is counted as one MEU and has a maximum capacity of 20 gallons per minute (gpm). A 1-inch meter, however, has a maximum capacity of 50 gpm, based on the same water pressure, or 2.5 times that of the 5/8-inch meter. Consequently, a customer with a 1-inch meter would have one account and 2.5 MEUs.
Scottsdale Water has experienced some growth but has not realized the growth levels expected by the planning department in recent years. The Study’s projections are based on the conservative assumption that the number of accounts and MEUs in each customer class remains constant throughout the Study period. Additionally, annual usage is projected to remain equal to the actual sales from FY 2016/17.
TABLE 6-1 HISTORICAL FY 2015/16 WATER DEMANDS AND CUSTOMER CLASS PROFILE
CUSTOMER CLASS
NUMBER OF
ACCOUNTS
METER EQUIVALENT
UNITS
TOTAL USAGE (MGD)
ANNUALIZED SUMMER
USAGE (MGD)
SUMMER PEAKING FACTOR
(SUMMER/AVG) Single Family Residential 78,948 153,368 36.3 42.9 1.18
Multifamily Residential & Commercial 10,767 58,570 24.2 28.7 1.19
Total 89,715 211,937 60.5 71.6 1.18
WATER DEMAND ANALYSIS
City of Scottsdale 31 Final - Water Cost-of-Service Study
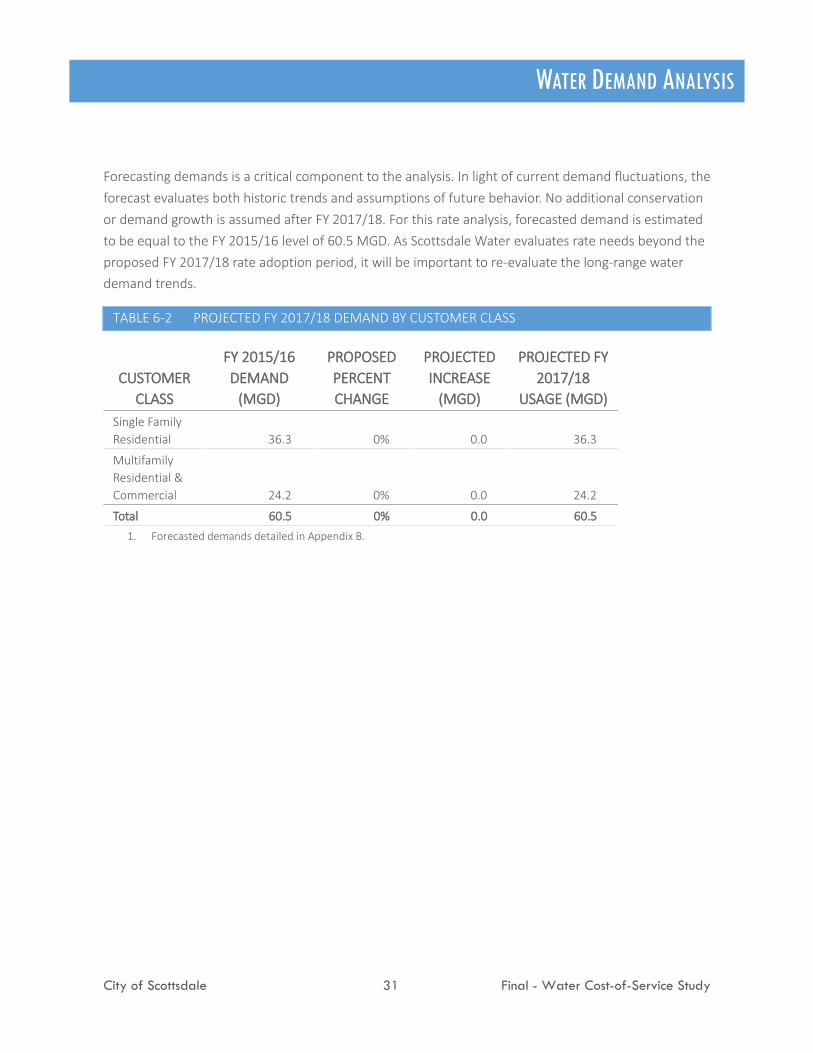
Forecasting demands is a critical component to the analysis. In light of current demand fluctuations, the forecast evaluates both historic trends and assumptions of future behavior. No additional conservation or demand growth is assumed after FY 2017/18. For this rate analysis, forecasted demand is estimated to be equal to the FY 2015/16 level of 60.5 MGD. As Scottsdale Water evaluates rate needs beyond the proposed FY 2017/18 rate adoption period, it will be important to re-evaluate the long-range water demand trends.
TABLE 6-2 PROJECTED FY 2017/18 DEMAND BY CUSTOMER CLASS
CUSTOMER CLASS
FY 2015/16 DEMAND
(MGD)
PROPOSED PERCENT CHANGE
PROJECTED INCREASE
(MGD)
PROJECTED FY 2017/18
USAGE (MGD) Single Family Residential 36.3 0% 0.0 36.3
Multifamily Residential & Commercial 24.2 0% 0.0 24.2
Total 60.5 0% 0.0 60.5 1. Forecasted demands detailed in Appendix B.

RATE DESIGN
City of Scottsdale 32 Final - Water Cost-of-Service Study
7 RATE DESIGN The rate design analysis brings together all of the pieces described thus far in the revenue requirement analysis, the functional cost allocation, and the water demand analysis. The expenses allocated to each functional category and then to each customer class need to be fairly, equitably, and proportionally recovered through nuanced and balanced rates. The goal of the rate design analysis is simple: to develop a rate structure that collects revenue from each customer class and each customer in accordance with the proportionate benefits received from and the burdens placed on the water system and water resources — i.e., there must be a cost and revenue nexus.
Scottsdale Water’s existing structure provides a foundation for equitably and proportionately recovering costs from Scottsdale Water’s customers and reflects Scottsdale Water’s cost structure.
As previously explained, Scottsdale Water’s service rates and charges are separated into monthly fixed charges and variable commodity charges. Fixed charges are designed to recover the cost from system users based on their reserved capacity within the system regardless of day-to-day use of the system. Fixed charge revenue is intended to defray a portion of the fixed costs that do not change with demand on a year-to-year basis, at least not in the short-term. These costs typically include debt service, repairing and refurbishing the water system, and administrative costs such as utility billing. Commodity charges recover system costs from users based on the actual water used. Scottsdale Water’s commodity charges are designed to recover the system costs to produce, purchase, treat, and distribute water to Scottsdale Water’s customers, including indirect costs to support these activities.
FIXED MONTHLY BASE FEE Scottsdale Water’s current monthly base fee is based on meter size, which is the most common method for developing fixed charges. Meter size serves as an estimate of the potential demand that a customer can place on the system; Scottsdale Water incurs fixed costs to create, operate, and maintain that capacity. This approach recognizes that regardless of a customer's actual demands, that customer has reserved capacity within the system that Scottsdale Water must operate and maintain. The customer is therefore responsible for a share of Scottsdale Water’s fixed costs in proportion to reserved capacity.
RATE DESIGN
City of Scottsdale 33 Final - Water Cost-of-Service Study
Development of the monthly base fee is a function of the total budget needed for these costs and the number of MEUs in the system. The monthly base fee is calculated by dividing the revenue requirement by the total number of MEUs, and then dividing again by twelve months.
As discussed previously, the monthly base fee is based on a customer's meter size. Scottsdale Water defines the base, or smallest, meter as a 5/8-inch meter. As noted in Section 4 of this report, larger meters have the potential to demand more capacity, or said differently, exert a greater demand on the system. The potential capacity demand (peaking) is proportional to the potential flow through each meter size as established by AWWA hydraulic capacity ratios. Capacity ratios, a function of a meter’s maximum flow rate, are used to increase the monthly base fee for larger capacity meters.
Table 7-1 below presents the calculation of the FY 2017/18 monthly base fee by meter size.
TABLE 7-1 COMPONENTS TO CALCULATED MONTHLY BASE FEE (FY 2017/18)
METER SIZE
MEU FACTOR CURRENT CUSTOMER CAPACITY
FIRE PROTECTION TOTAL
5/8" 1 $11.25 $6.38 $1.78 $3.71 $11.87
3/4" 1.5 14.50 6.38 2.67 5.56 14.61
1" 2.5 20.50 6.38 4.44 9.27 20.09
1-1/2" 5 33.75 6.38 8.89 18.53 33.80
2" 8 45.00 6.38 14.22 29.65 50.26
3" 16 60.00 6.38 28.44 59.31 94.13
4" 25 140.00 6.38 44.44 92.67 143.49
6" 50 280.00 6.38 88.88 185.33 280.59
8" 80 390.00 6.38 142.21 296.53 445.12
Table 7-2 below presents the proposed base fees for FY 2017/18 as well as projected fees through FY 2021/22. The proposed rates for FY 2017/18 are those proposed by Scottsdale Water, projected rates for subsequent years are calculated based on the calculated 3 percent per year rate revenue requirement increases. The rates proposed by Scottsdale Water are in reasonable alignment with those calculated in this cost of service analysis. The slight differences in the monthly base fees are primarily driven by the proposed rates collecting a slightly greater share of revenues through the monthly base fees as compared to the calculated rates as well as slight differences in the allocation of costs to the customer, capacity, and fire components.

RATE DESIGN
City of Scottsdale 34 Final - Water Cost-of-Service Study
TABLE 7-2 CURRENT AND PROPOSED MONTHLY BASE FEES
METER SIZE CURRENT
FY 2017/18
FY 2018/19
FY 2019/20
FY 2020/21
FY 2021/22
5/8" $11.25 $11.90 $12.26 $12.75 $13.26 $13.79
3/4" 14.50 15.40 15.86 16.50 17.16 17.84
1" 20.50 21.75 22.40 23.30 24.23 25.20
1-1/2" 33.75 35.75 36.82 38.30 39.83 41.42
2" 45.00 47.75 49.18 51.15 53.20 55.32
3" 60.00 95.00 97.85 101.76 105.83 110.07
4" 140.00 148.50 152.96 159.07 165.44 172.05
6" 280.00 297.00 305.91 318.15 330.87 344.11
8" 390.00 413.50 425.91 442.94 460.66 479.09
FIRE PROTECTION CHARGES In addition to providing clean and reliable drinking water, Scottsdale Water’s system also provides system capacity for fire suppression. In addition to providing distribution system capacity, Scottsdale Water must also provide storage and conveyance capacity necessary for emergency water flows. For most users, the costs to provide and maintain this capacity are recovered from through their monthly base fees, as their domestic meter also provides water for fire protection. In addition to those standard connections, Scottsdale Water serves 3,370 private fire protection connections.
The private fire protection connections include both metered and unmetered connections to the water system. Because the size of all of the connections is not known at this time, the City has proposed a flat monthly fee of $2.00 per account to recoup the costs associated with this service. The charge is expected to generate about $81,000 in per year. Table 7-3 below shows the proposed fire protection charge as well as projected charges through FY 2021/22 based on the 3 percent per year rate revenue increases.

RATE DESIGN
City of Scottsdale 35 Final - Water Cost-of-Service Study
TABLE 7-3 PRIVATE FIRE CHARGE PER METER EQUIVALENT
CURRENT PROPOSED FY 2017/18
FY 2018/19
FY 2019/20
FY 2020/21
FY 2021/22
Monthly Fee N/A $2.00 $2.06 $2.12 $2.19 $2.25
COMMODITY RATES As with the other components of Scottsdale Water’s rate structure, the commodity rates were updated as part of this Study based on the current and projected costs to provide water service to each customer and customer class.
Tiered Rate Structure Scottsdale Water’s tiered rate structure is built upon the idea that peak usage results in increasing costs for Scottsdale Water, unique from the costs incurred for basic (i.e., average) service. Additionally, it indirectly incentivizes conservation by sending a price signal to customers that if they use more water they have to pay a higher price. As users increase their demand, the Scottsdale Water must continue to produce and import more water at an increased cost compared with base demand, as well as size, operate, and maintain larger facilities to meet the higher demand. Built on the foundation of the base-extra capacity methodology, these additional costs are covered through Scottsdale Water’s tiered rate system. Every unit of water begins with a base unit cost intended to recover Scottsdale Water’s basic production, conveyance, and distribution costs. The concept of proportionality requires that cost allocations consider both the average quantity of water consumed (base) and the peak rate at which it is consumed (peaking). Use of peaking is consistent with the cost of providing service because a water system is designed to handle peak demands, and the additional costs associated with designing, constructing and maintaining facilities required to meet these peak demands. These incremental costs are allocated to those customers whose usage requires the need to size, operate, and maintain facilities to meet peak demand. Thus, under a tiered rate structure the incremental production costs for peak and excessive usage are recovered in the upper tiers.
Scottsdale Water uses three main sources of water supply: groundwater; imported water from the CAP and SRP; and recycled water. Additionally, conservation is a major element of Scottsdale Water’s supply planning, as it frees capacity for new or excess usage and can help to reduce Scottsdale Water’s imported water supplies. The three sources of supply and the direct and indirect costs to treat and deliver the water to the retail customers are increasingly expensive. Absent higher customer demands, Scottsdale Water would be less reliant on these more expensive water supply costs. As a result, the existing and proposed commodity rate structure allocates higher cost supplies and some conservation

RATE DESIGN
City of Scottsdale 36 Final - Water Cost-of-Service Study
costs to high volume users. Scottsdale Water allocates supply costs first to customer classes and then to each tier within the respective customer class according to peaking factors. Every user “peaks” on the system in some way, either through seasonal peaking when their demand spikes in the hot summer months, or through diurnal peaking when their demand spikes in the morning and early evening. Peaking factors account for this behavior based on how significant the peaking behavior is. Scottsdale Water’s low-volume users have modest peaking, meaning their demands throughout the course of the year are relatively stable and consistent. Customers in Tiers 3, 4, and 5 have higher peaking factors as their usage is calculated relative to other customers. These peaking factors allow fair, equitable, and proportionate distribution of water supply and production costs to each customer class and tier. While efforts were taken to define various customer classes that group customers based upon consistent usage patterns, some individual customers may vary moderately from the peaking behavior displayed by the class as a whole; however, the system is operated in aggregate and the proposed rates are reflective of this collective demand.
Consumption Patterns Figure 7-1 shows Scottsdale Water’s monthly usage in MGD for FY 2015/16. As shown, the Scottsdale Water experiences a significant peak in demand in the summer months due to increased outdoor water usage. In August, the peak month, average usage is 79 MGD, compared to just 43 MGD in February, the minimum month. Because the system is sized to meet demand in the peak months, those costs can be recovered through the increased rates for usage in the upper tiers.
FIGURE 7-1 MONTHLY CONSUMPTION PROFILE
0
10
20
30
40
50
60
70
80
90
Aver
age
MG
D
Monthly MGD Minimum Month Annual Average

RATE DESIGN
City of Scottsdale 37 Final - Water Cost-of-Service Study
Similar to the system as a whole, usage within each tier exhibits a seasonal peak. Tier 1 exhibits the lowest peak factor because much of the Tier 1 usage is not discretionary. Tier 2 through Tier 5 each exhibit incrementally higher peak factors as the amount of discretionary or outdoor usage increases with each tier. These differences in peaking for each tier form the basis for the incrementally higher rates charged for usage within each tier. Table 7-4 below presents the peak factors for each tier based on FY 2015/16 consumption data.
TABLE 7-4 SINGLE FAMILY RESIDENTIAL PEAK FACTORS BY TIER
TIER MINIMUM
MONTH (MG) AVERAGE
MONTH (MG) MAX MONTH
(MG) AVG/MIN
PEAK FACTOR MAX/MIN PEAK
FACTOR Tier 1 370.0 386.0 394.0 1.04 1.06
Tier 2 242.0 327.0 378.0 1.35 1.56
Tier 3 243.0 454.0 635.0 1.87 2.61
Tier 4 351.0 625.0 939.0 1.78 2.68
Tier 5 11.0 49.0 101.0 4.45 9.18
Tier Analysis As part of the Study, Carollo evaluated the tier breaks for reasonableness. It is important that there is a nexus between the water used in each tier and the cost of providing that water. This nexus is demonstrated in the beginning of this section. Carollo evaluated the demand patterns of each class to assess the application of the existing tier breaks in relation to how customers will consume water and how water will be provided. Another critical part of the tier analysis was forecasting how much demand will occur in each tier. This forecast can have a significant impact on revenues, as over-forecasting use in the upper tiers would cause the utility's revenue to be susceptible to volatile demand.
The rates proposed by Scottsdale Water include an update to the Tier 3 breakpoint for single family residential customers, and to the Tier 2 breakpoint for multifamily and non-residential customers to bring the breakpoint for Tiers 1, 2, and 3 into alignment for all customers. The single family Tier 3 breakpoint is lowered from 40,000 to 30,000 gallons per month, the commercial Tier 2 breakpoint is raised from 10,000 to 12,000 gallons per month. Table 7-5 below presents the proposed tier breakpoints.

RATE DESIGN
City of Scottsdale 38 Final - Water Cost-of-Service Study
TABLE 7-5 PROPOSED RATE STRUCTURE BREAKPOINTS
TIER FROM TO SINGLE FAMILY RESIDENTIAL (IN GALLONS)
Tier 1 0 5,000
Tier 2 5,001 12,000
Tier 3 12,001 30,000
Tier 4 30,001 65,000
Tier 5 Over 65,000
MULTIFAMILY & COMMERCIAL (IN GALLONS)
Tier 1 0 5,000
Tier 2 5,001 12,000
Tier 3 12,001 30,000
Tier 4 Over 30,000
Single Family Residential Tiers
Scottsdale Water’s proposed tier breaks provide a reasonable basis for allocating peaking costs within this specific customer class. In both the winter and summer months, a majority of the single family residential demands occur in Tiers 1, 2, and 3. A discernable peaking pattern is shown, in which the volume of water consumed increases significantly in the summer. Tiers 4 and 5 capture the increased peak demands and provide a structure for recovering infrastructure and supply costs required to meet these peak demands.
Multifamily Residential, Non-Residential, and Fire Service Tiers
Nonresidential customers are provided a four-tiered water structure, similar to residential customers (detailed above). It is, however, important that Scottsdale Water continually revisit these allocations and adjust them as necessary in order to continue to equitably recover costs from its nonresidential customers.
Table 7-6 below shows the total water consumed and percentage of water consumed within each tier for single family and multifamily and non-residential customers based on FY 2015/16 deliveries and the updated tier breakpoints.

RATE DESIGN
City of Scottsdale 39 Final - Water Cost-of-Service Study
TABLE 7-6 CONSUMPTION BY TIER
TIER TOTAL TIER
CONSUMPTION PERCENTAGE OF CONSUMPTION
SINGLE FAMILY RESIDENTIAL
Tier 1 4,111,000 31% Tier 2 3,520,000 27% Tier 3 4,255,000 32% Tier 4 788,000 6% Tier 5 588,000 4%
MULTIFAMILY & COMMERCIAL
Tier 1 510,000 6% Tier 2 409,000 5% Tier 3 1,192,000 14% Tier 4 6,708,000 76%
Demand within each tier is forecasted based on an analysis of the historical customer consumption data provided by Scottsdale Water.
Rate Adjustments The proposed FY 2017/18 Scottsdale Water rates remain consistent with cost-of-service-based rate-making principles and proportionality requirements. Under this methodology each functional cost is divided by the number of billing units (in MG) of projected water sales in the tier or tiers to which that functional cost is attributed.
To calculate the costs attributable to each tier, Table 7-7 shows the commodity rate functional cost components (base and peak) and divides them across the projected sales of units of water. Each functional category includes usage in a specific tier or tiers, and thus, the usage in that tier or tiers forms the denominator for allocating the cost in that category. The combined unit costs allocated to each tier can then be calculated, arriving at a unit cost for each customer and applicable tier.

RATE DESIGN
City of Scottsdale 40 Final - Water Cost-of-Service Study
TABLE 7-7 FY 2017/18 UNIT COST CALCULATIONS
DESCRIPTION TOTAL SINGLE FAMILY RESIDENTIAL
MULTIFAMILY RESIDENTIAL & NON-RESIDENTIAL
REVENUE REQUIREMENT (IN $1,000)
Base $36,578,000 $21,968,000 $14,610,000
Peak Month $10,275,000 $5,017,000 $5,257,000
Peak Day $5,137,000 $2,509,000 $2,629,000
Peak Hour $22,604,000 $11,038,000 $11,566,000
DEMAND (1,000 GALLONS)
Tier 1 4,111,000 510,000
Tier 2 3,520,000 409,000
Tier 3 4,255,000 1,192,000
Tier 4 788,000 6,708,000
Tier 5 588,000 N/A
Total Demand 13,262,000 8,819,000
RATE ($/1,000 GALLONS)
Tier 1 $1.66 $1.66
Tier 2 $3.00 $3.00
Tier 3 $3.77 $3.77
Tier 4 $4.83 $4.10
Tier 5 $5.66 N/A
The proposed rates for FY 2017/18 are those proposed by Scottsdale Water, projected rates for subsequent years are calculated based on the calculated 3 percent per year rate revenue requirement increases. The rates proposed by Scottsdale Water are in close alignment with those calculated in this cost of service analysis. The slight differences in the volumetric rates are primarily driven by the proposed rates collecting a slightly greater share of revenues through the monthly base fees as compared to the calculated rates.
Table 7-8 provides the proposed single family residential commodity rates for FY 2017/18 as well as projected rates through FY 2021/22.

RATE DESIGN
City of Scottsdale 41 Final - Water Cost-of-Service Study
TABLE 7-8 PROPOSED SINGLE FAMILY RESIDENTIAL WATER COMMODITY RATE PROJECTIONS
TIER CURRENT PROPOSED FY 2017/18
FY 2018/19
FY 2019/20
FY 2020/21
FY 2021/22
Tier 1 $1.65 $1.65 $1.70 $1.77 $1.84 $1.91
Tier 2 2.85 2.95 3.04 3.16 3.29 3.42
Tier 3 3.55 3.70 3.81 3.96 4.12 4.29
Tier 4 4.50 4.75 4.89 5.09 5.29 5.50
Tier 5 5.25 5.55 5.72 5.95 6.18 6.43
It is important to understand the relationship of tier break points and rates. Specifically, once a single family residential user enters Tier 5, they are using over 65,000 gallons in a month. The proposed rates represent the significant additional capacity built into the system to provide this peak demand. Overall, the proposed rates reflect the additional cost of providing and servicing this additional capacity relative to the level of service (source of supply and capacity reservation).
The following proposed nonresidential rates reflect the updated cost of service and water demands for multifamily and non-residential customers.
TABLE 7-9 PROPOSED MULTIFAMILY RESIDENTIAL & NON-RESIDENTIAL WATER RATE PROJECTIONS
TIER CURRENT PROPOSED FY 2017/18
FY 2018/19
FY 2019/20
FY 2020/21
FY 2021/22
Tier 1 $1.65 $1.65 $1.70 $1.77 $1.84 $1.91
Tier 2 2.85 2.95 3.04 3.16 3.29 3.42
Tier 3 3.55 3.70 3.81 3.96 4.12 4.29
Tier 4 3.85 4.05 4.17 4.34 4.51 4.69

RATE DESIGN
City of Scottsdale 42 Final - Water Cost-of-Service Study
Comparison of Calculated and Proposed Rates When comparing the calculated cost of service allocation with the existing cost allocation based on the existing rates, there are minor changes in the percentage of costs allocated to each customer class. Table 7-10 shows these results. The calculated percentages for the proposed rates are based on applying the proposed rates to the customers and usage for FY 2017/18. Revenues allocations for the calculated rates are based on applying those same customers and usage to the calculated rates. The discrepancy between the proposed and calculated allocations primarily due to the proposed rates collecting a slightly greater share of revenues through the monthly base fees as compared to the calculated rates. Table 7-10 shows the revenues for a full year at the proposed or calculated rates. Actual revenues for FY 2017/18 may be lower due to the scheduled November rate implementation.
TABLE 7-10 COST ALLOCATION CHANGE BY CUSTOMER CLASS
CUSTOMER CLASS PROPOSED RATES
ALLOCATION CALCULATED RATES
ALLOCATION DIFFERENCE Single Family Residential $57,068,000 $56,672,000 0.7% Multifamily Residential & Commercial $38,345,000 $38,741,000 -1.0% Total $95,413,000 $95,413,000 0.0%
Based on the results of the comparison, the proposed rate adjustments reasonably reflect the calculated cost of service.

RATE DESIGN
City of Scottsdale 43 Final - Water Cost-of-Service Study
CUSTOMER IMPACTS Sample monthly bill impacts are presented in Table 7-11 below for FY 2017/18 and FY 2018/19. The 17,000 gallons sample represents a low-volume user who stays within Tiers 1 through 3. The 50,000 gallons sample reflects a mid- to high-volume user with consumption in Tiers 1 through 4.
TABLE 7-11 MONTHLY BILL COMPARISON FOR PROPOSED RATES
BILL COMPONENT 17,000 GAL 50,000 GAL
CURRENT PROPOSED
2017/18 PROJECTED
2018/19 CURRENT PROPOSED
2017/18 PROJECTED
2018/19
Base Fee (5/8") $11.25 $11.90 $12.26 $11.25 $11.90 $12.26
Commodity Charge1 45.95 47.40 48.83 172.60 190.50 196.16
Tier 1 8.25 8.25 8.50 8.25 8.25 8.50
Tier 2 19.95 20.65 21.28 19.95 20.65 21.28
Tier 3 17.75 18.50 19.05 99.40 66.60 68.58
Tier 4 0.00 0.00 0.00 45.00 95.00 97.80
Tier 5 0.00 0.00 0.00 0.00 0.00 0.00
Total Monthly Bill $57.20 $59.30 $61.09 $183.85 $202.40 $208.42
% Difference 4% 3% 10% 3%
Monthly change $2.10 $1.79 $18.55 $6.02
Bill as % of median household income2 1.0% 1.1% 1.1% 3.3% 3.7% 3.8%
$ per person/day3 $0.04 $0.04 $0.04 $0.13 $0.14 $0.14 1. Sum of Tiers 1 – 5. 2. Assumes $66,399 as the medium household income (MHI)3 3. Assumes 4-person household size.
3 2015-based Scottsdale Demographic and Income Comparison Profile, ESRI 2016

RATE DESIGN
City of Scottsdale 44 Final - Water Cost-of-Service Study
DEMAND REDUCTION SURCHARGE RATES In light of the current water availability uncertainty and need for financial resiliency, Carollo developed Demand Reduction Surcharges Rates for Scottsdale Water. Demand Reduction Surcharges Rates are rates that may be imposed by Scottsdale Water following levels of extreme water demand reductions due to supply restrictions caused by drought or system outages on the CAP or SRP systems. The Demand Reduction Surcharge Rates presented below would take the place of the utility’s commodity rates, if implemented, during drought or other conditions leading to decreased demands.
The objective of these rates is to recover system costs if customers’ potable water usage declines as a result of expanded or future water shortage conditions. As discussed previously, many of Scottsdale Water’s costs are fixed, in that they do not fluctuate with changes in water demands. Included in these fixed charges is a portion of the purchased water costs, specifically, the CAP energy rate and CAP Drought Contingency Plan (DCP) rates per AF delivered. While Scottsdale Water would attempt to identify other cost savings, additional expenditures are likely to offset any savings or potentially increase total expenditures as Scottsdale Water’s conservation programs are implemented.
The CAP’s DCP outlines expected reductions in Scottsdale Water’s entitlements based on the elevation of Lake Mead. Those reductions range from 854 acre-feet per year (AFY) at an elevation of 1,075 feet to 3,524 AFY at 1,025 feet. Scottsdale Water’s current full entitlement is 81,271 AFY. Given the relatively small reductions in entitlements, it is not expected that Scottsdale Water would need to seek other sources of supply in the event that reductions are put in place. Rather, the expected conservation by Scottsdale Water customers will lower demands in an amount sufficient to allow them to be covered by existing supplies.
Drought Management Plan (DMP) The City of Scottsdale has been proactive in the planning of long-term, sustainable water supplies for its community and has secured a diverse and resilient water supply portfolio. These supplies reduce the vulnerability of the community to the risks associated with potential external factors that may present future supply reductions or limitations. A water shortage can occur when a source of supply is reduced to a level at which it is unable to support an existing demand condition. This can be the result of a natural circumstance or an interruption of supply that is outside the control of Scottsdale Water. The duration can vary from a matter of weeks to several months or years. Scottsdale Water has, as part of its normal water planning, analyzed water demand characteristics during periods of both normal and reduced water supply. Understanding the dynamics of demand management is important, as supply reductions or interruptions can present serious challenges to maintaining the health, safety, and economic well-being of the community. Through its strategic planning efforts and the development of a

RATE DESIGN
City of Scottsdale 45 Final - Water Cost-of-Service Study
diverse water supply portfolio, Scottsdale has taken steps to protect its customers from the adverse effects of drought for years to come. The DMP provides guidelines that can be used to manage water supply and water use during an episode of reduced supply availability. These are based on the establishment of priorities that are designed to consider customer needs, protect the health and safety of the community, preserve environmental resources, and avoid adverse impacts to public activity. The plan should be updated approximately every 5 years consistent with the Water Master Plan update. 4
The utility’s portfolio of water resources provides for a continuous, sustainable water supply which can be delivered to customers at a reasonable cost. The utility’s water supplies are consistent with the state regulatory requirements for a long-term 100-year Assured Water Supply (AWS). The development of the current water resources portfolio is based on a strategic long-term direction emphasizing the increased use of renewable supplies rather than mining groundwater in order to meet the utility’s water demands. In addition to surface water supplies, reclaimed water supplies are also included in the renewable water resource portfolio, however the DMP will focus on potable water supplies. Scottsdale Water’s potable water resources portfolio consists of three water supplies. Each of these supply sources has its own set of delivery and use restrictions based on regulatory, contractual, and operational limitations that impact where and how they can be used to meet the community’s needs.
As presented previously in Section 6 of this report, Scottsdale Water is forecasted to have retail water sales of roughly 22,090 MG (67,800 AF) in FY 2017/18. Based on an extreme water curtailment period, Scottsdale Water estimated two potential demand reduction scenarios. Forecast demands for each scenario have been developed based on Scottsdale Water calling on customers to conserve 10 or 20 percent; demands are then further reduced based on price elasticity.
Elasticity of Demand Elasticity is a measure of the responsiveness of customers to a change in price. As price increases, goods would see a decrease in demand in proportion to the relative elasticity of that good. While water is a relatively inelastic good—it is an essential service for domestic and commercial needs, and crucial for health and sanitation—it does have some elastic uses, such as landscaping. Therefore, a modest decrease in demand is expected in response to an increase in unit price.
For this analysis, price elasticities of -0.3 and -0.1 were used for single family residential customers and all other customers, respectively. For example, a price elasticity factor of -0.3 means that with a 100
4 City of Scottsdale Drought Management Plan

RATE DESIGN
City of Scottsdale 46 Final - Water Cost-of-Service Study
percent increase in price, Scottsdale Water could expect a 30 percent reduction in demands. The difference in elasticity is due to the ability of single family residential customers to change their demand with greater ease. Many multifamily residential customers are already efficient with water usage, and are less able to cut back demand. Similarly, commercial enterprises will have less ability to cut back demand in the short-term, while they may be able to adopt water-saving technology in the long-term if the price increase is significant enough.
These factors can be interpreted as an adjustment on the change in unit price. With an elasticity of -0.3, this analysis predicts that for every 1 percent increase in price, there is a corresponding drop in demand of 0.3 percent. For a 9 percent increase in price, demands are expected to drop by 2.7 percent.
When calculating rates, it is critical to take price elasticity into account, particularly for rate increases that exceed the standard inflation rate. Rates may be able to achieve funding goals when modeling revenue needs, but if elasticity is sufficient enough to drive demand down, it could lead to a shortfall. As a result, this analysis has taken into account the impact of price elasticity of demand to bolster the rate design.
Demand Reduction Scenarios Demand Reduction Stage 1 equates to a slight reduction in demands (0 to 5 MGD). Scottsdale Water is currently in this stage, and the proposed rates have been designed to make up for the associated revenue shortfall.
Demand Reduction Stage 2 is based on a 5 to 15 MGD reduction below FY 2017/18 levels. Under this scenario, Scottsdale Water would call on its customers to reduce demands to a level 10 percent below the projected FY 2017/18 usage levels. When price elasticity is considered, the realized level of conservation could reach approximately 15 percent or about 12,100 AF. Based on the proposed rates for FY 2017/18, this level of conservation would result in a revenue shortfall of $8.5 million. Under this scenario, Scottsdale Water could expect CAP cost savings of about $1.1 million, however it is assumed that in order to implement this level of conservation, Scottsdale Water would need to incur $250,000 for public outreach and education. Thus, the net change to rate revenue requirements under this scenario would be a reduction of about $880,000.
Demand Reduction Stage 3 is based on a 15 to 30 MGD reduction below FY 2017/18 levels. Under this scenario, Scottsdale Water would call on its customers to reduce demands to a level 20 percent below the projected FY 2017/18 usage levels. When price elasticity is considered, the realized level of conservation could reach approximately 25 percent or about 20,200 AF. Based on the proposed rates for FY 2017/18, this level of conservation would result in a revenue shortfall of $16.6 million. Under this scenario, Scottsdale Water could expect CAP cost savings of about $1.9 million, however it is assumed

RATE DESIGN
City of Scottsdale 47 Final - Water Cost-of-Service Study
that in order to implement this level of conservation, Scottsdale Water would need to incur $250,000 for public outreach and education. Thus, the net change to rate revenue requirements under this scenario would be a reduction of about $1,600,000.
The conditions that may lead to Stage 4 (>30 MGD) are unlikely; during this stage Scottsdale Water will evaluate the potential for substantially reducing water use through more structured mandatory water use restrictions. Discretionary uses of water by customers may be eliminated and the public awareness of the critical level of the shortage will be heightened.
The tables below present the proposed Demand Reduction Surcharge Rates for each demand reduction stage. The rates presented would take the place of the proposed rates, if implemented, during times of reduced demands. Each set of rates is only applicable one at a time (not cumulative).
TABLE 7-12 DEMAND REDUCTION RATES WITH CALL FOR 10 PERCENT CUTBACK
TIER FY
2017/18 FY
2018/19 FY
2019/20 FY
2020/21 FY
2021/22 SINGLE FAMILY RESIDENTIAL
Tier 1 $1.92 $1.97 $2.03 $2.09 $2.16
Tier 2 3.58 3.68 3.79 3.91 4.02
Tier 3 4.53 4.67 4.81 4.95 5.10
Tier 4 5.85 6.02 6.20 6.39 6.58
Tier 5 6.87 7.08 7.29 7.51 7.73 MULTIFAMILY AND NON-RESIDENTIAL
Tier 1 $1.92 $1.97 $2.03 $2.09 $2.16
Tier 2 3.58 3.68 3.79 3.91 4.02
Tier 3 4.53 4.67 4.81 4.95 5.10
Tier 4 4.94 5.09 5.24 5.40 5.56
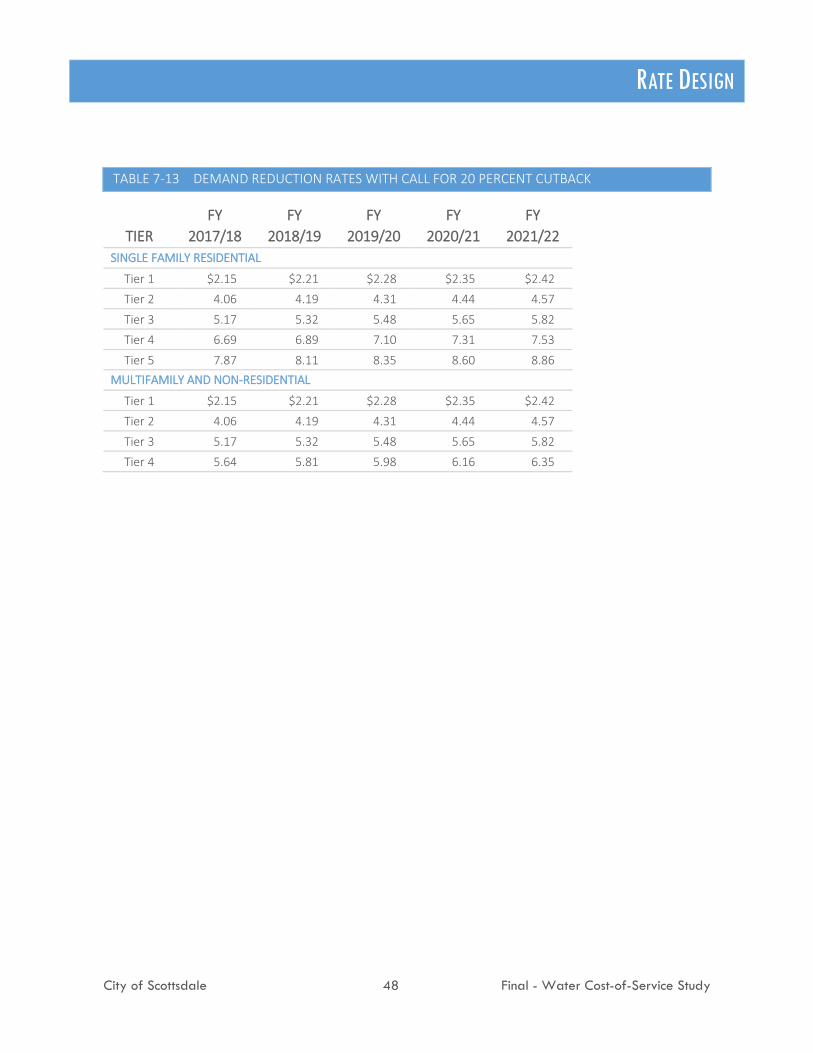
RATE DESIGN
City of Scottsdale 48 Final - Water Cost-of-Service Study
TABLE 7-13 DEMAND REDUCTION RATES WITH CALL FOR 20 PERCENT CUTBACK
TIER FY
2017/18 FY
2018/19 FY
2019/20 FY
2020/21 FY
2021/22 SINGLE FAMILY RESIDENTIAL
Tier 1 $2.15 $2.21 $2.28 $2.35 $2.42
Tier 2 4.06 4.19 4.31 4.44 4.57
Tier 3 5.17 5.32 5.48 5.65 5.82
Tier 4 6.69 6.89 7.10 7.31 7.53
Tier 5 7.87 8.11 8.35 8.60 8.86 MULTIFAMILY AND NON-RESIDENTIAL
Tier 1 $2.15 $2.21 $2.28 $2.35 $2.42
Tier 2 4.06 4.19 4.31 4.44 4.57
Tier 3 5.17 5.32 5.48 5.65 5.82
Tier 4 5.64 5.81 5.98 6.16 6.35

City of Scottsdale 49 Final - Water Cost-of-Service Study
Appendix A – Historical Demand Summary The following table details the historic demand by customer class over the past four fiscal years.
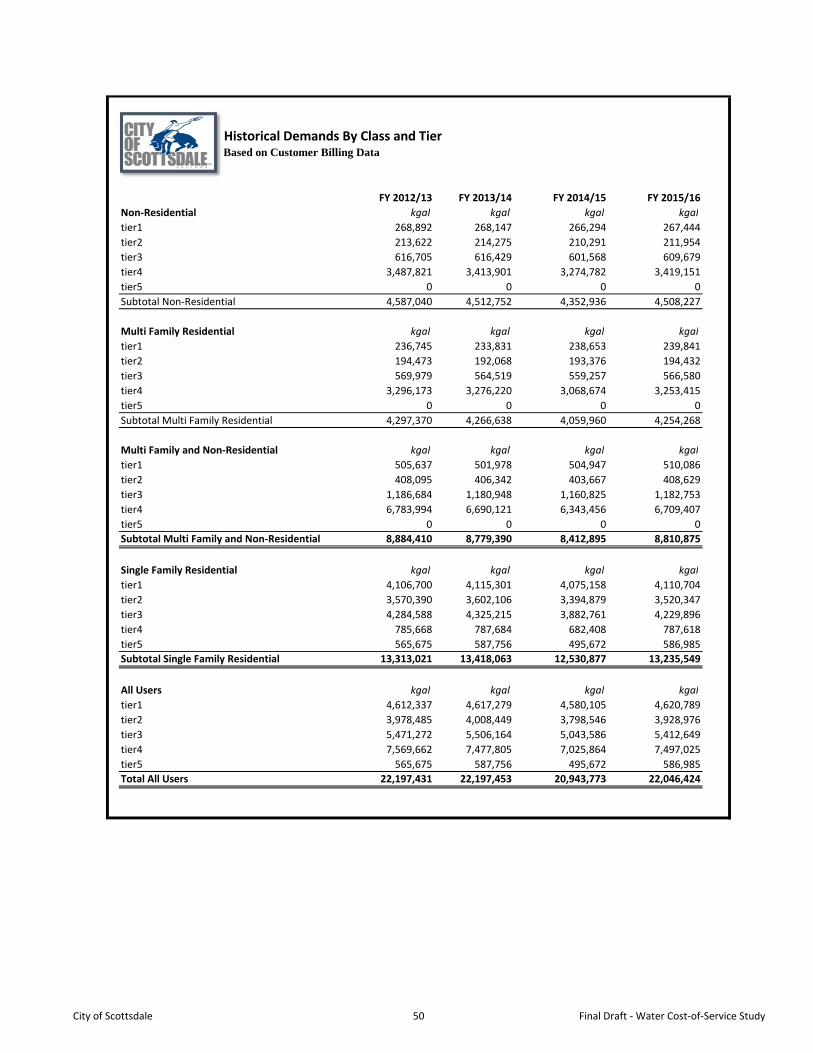
Historical Demands By Class and TierBased on Customer Billing Data
FY 2012/13 FY 2013/14 FY 2014/15 FY 2015/16
Non‐Residential kgal kgal kgal kgal
tier1 268,892 268,147 266,294 267,444
tier2 213,622 214,275 210,291 211,954
tier3 616,705 616,429 601,568 609,679
tier4 3,487,821 3,413,901 3,274,782 3,419,151
tier5 0 0 0 0
Subtotal Non‐Residential 4,587,040 4,512,752 4,352,936 4,508,227
Multi Family Residential kgal kgal kgal kgal
tier1 236,745 233,831 238,653 239,841
tier2 194,473 192,068 193,376 194,432
tier3 569,979 564,519 559,257 566,580
tier4 3,296,173 3,276,220 3,068,674 3,253,415
tier5 0 0 0 0
Subtotal Multi Family Residential 4,297,370 4,266,638 4,059,960 4,254,268
Multi Family and Non‐Residential kgal kgal kgal kgal
tier1 505,637 501,978 504,947 510,086
tier2 408,095 406,342 403,667 408,629
tier3 1,186,684 1,180,948 1,160,825 1,182,753
tier4 6,783,994 6,690,121 6,343,456 6,709,407
tier5 0 0 0 0
Subtotal Multi Family and Non‐Residential 8,884,410 8,779,390 8,412,895 8,810,875
Single Family Residential kgal kgal kgal kgal
tier1 4,106,700 4,115,301 4,075,158 4,110,704
tier2 3,570,390 3,602,106 3,394,879 3,520,347
tier3 4,284,588 4,325,215 3,882,761 4,229,896
tier4 785,668 787,684 682,408 787,618
tier5 565,675 587,756 495,672 586,985
Subtotal Single Family Residential 13,313,021 13,418,063 12,530,877 13,235,549
All Users kgal kgal kgal kgal
tier1 4,612,337 4,617,279 4,580,105 4,620,789
tier2 3,978,485 4,008,449 3,798,546 3,928,976
tier3 5,471,272 5,506,164 5,043,586 5,412,649
tier4 7,569,662 7,477,805 7,025,864 7,497,025
tier5 565,675 587,756 495,672 586,985
Total All Users 22,197,431 22,197,453 20,943,773 22,046,424
City of Scottsdale 50 Final Draft ‐ Water Cost‐of‐Service Study

City of Scottsdale 51 Final - Water Cost-of-Service Study
Appendix B – Projected Water Accounts and Demands The following tables show the projected number of accounts and projected water demands by tier for each customer class. The first table shows a summary for all customer classes.

Usage is shown in 1,000,000 gal unless otherwise noted.
All Meter Sizes Customer ClassEach year constant
2016 ‐ 2022
Number of Accounts
5/8" 18,774
3/4" 20,819
1" 42,847
1.5" 3,393
2" 3,469
3" 242
4" 99
6" 65
8" 6
Total Number of Accounts 89,715
Total Number of MEs 211,937
Proposed Tier Breakdown
Tier 1 Usage 4,621
Tier 2 Usage 3,929
Tier 3 Usage 5,447
Tier 4 Usage 7,496
Tier 5 Usage 588
Total Usage 22,081
Seasonal Usage
Summer 13,060
Winter 9,021
Total Usage 22,081
Note: Five year forcast assumed no growth in account or usage as growth has
been minimal in recent years, based on historic demands.
City of Scottsdale 52 Final Draft - Water Cost-of-Service Study

Usage is shown in 1,000,000 gal unless otherwise noted.
Note: Five year forcast assumed no growth in account or usage as growth has
been minimal in recent years, based on historic demands.
Single Family Customer ClassEach year constant
2016 ‐ 2022
Number of Accounts
5/8" Single‐Family 17,881
3/4" Single‐Family 19,957
1" Single‐Family 40,133
1.5" Single‐Family 873
2" Single‐Family 103
3" Single‐Family 2
4" Single‐Family ‐
6" Single‐Family ‐
8" Single‐Family ‐
Total Number of Accounts 78,948
Total Number of MEs Single‐Family 153,368
Proposed Tier Breakdown
Tier 1 Usage Single‐Family 4,111
Tier 2 Usage Single‐Family 3,520
Tier 3 Usage Single‐Family 4,255
Tier 4 Usage Single‐Family 788
Tier 5 Usage Single‐Family 588
Total Usage 13,262
Seasonal Usage
Summer Single‐Family 7,825
Winter Single‐Family 5,437
Total Usage 13,262
City of Scottsdale 53 Final Draft - Water Cost-of-Service Study
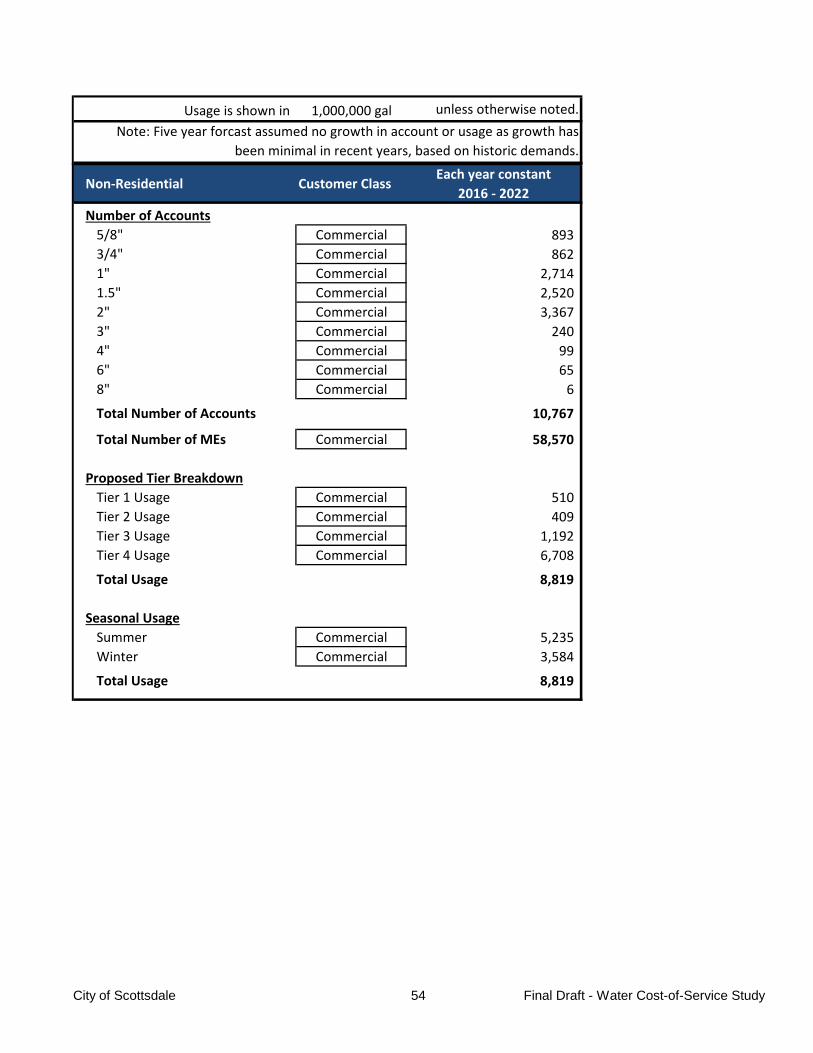
Usage is shown in 1,000,000 gal unless otherwise noted.
Note: Five year forcast assumed no growth in account or usage as growth has
been minimal in recent years, based on historic demands.
Non‐Residential Customer ClassEach year constant
2016 ‐ 2022
Number of Accounts
5/8" Commercial 893
3/4" Commercial 862
1" Commercial 2,714
1.5" Commercial 2,520
2" Commercial 3,367
3" Commercial 240
4" Commercial 99
6" Commercial 65
8" Commercial 6
Total Number of Accounts 10,767
Total Number of MEs Commercial 58,570
Proposed Tier Breakdown
Tier 1 Usage Commercial 510
Tier 2 Usage Commercial 409
Tier 3 Usage Commercial 1,192
Tier 4 Usage Commercial 6,708
Total Usage 8,819
Seasonal Usage
Summer Commercial 5,235
Winter Commercial 3,584
Total Usage 8,819
City of Scottsdale 54 Final Draft - Water Cost-of-Service Study

Usage is shown in 1,000,000 gal unless otherwise noted.
Note: Five year forcast assumed no growth in account or usage as growth has
been minimal in recent years, based on historic demands.
Each year constant
2016 ‐ 2022
Meter Size Total Annual Use (Million Gals)
5/8" 2,035
3/4" 2,616
1" 8,075
1.5" 426
2" 106
3" 4
4" ‐
6" ‐
8" ‐
Total 13,262
Meter Size Monthly Average per Account (Gals)
5/8" 9,000
3/4" 11,000
1" 17,000
1.5" 41,000
2" 86,000
3" 159,000
4"
6"
8"
Total 14,000
Single Family Residential
Use By Meter Size
City of Scottsdale 55 Final Draft - Water Cost-of-Service Study

Usage is shown in 1,000,000 gal unless otherwise noted.
Note: Five year forcast assumed no growth in account or usage as growth has
been minimal in recent years, based on historic demands.
Non‐Residential
Use By Meter Size
Each year constant
2016 ‐ 2022
Meter Size Total Annual Use (Million Gals)
5/8" 115
3/4" 102
1" 675
1.5" 1,556
2" 4,577
3" 571
4" 647
6" 522
8" 55
Total 8,819
Meter Size Monthly Average per Account (Gals)
5/8" 11,000
3/4" 10,000
1" 21,000
1.5" 51,000
2" 113,000
3" 198,000
4" 547,000
6" 665,000
8" 766,000
Total 68,000
City of Scottsdale 56 Final Draft - Water Cost-of-Service Study

City of Scottsdale 57 Final - Water Cost-of-Service Study
Appendix C – Revenue Requirement Analysis Based on the O&M tables, the Revenue Requirement tables detail the total sources and uses of funds prior to the rate increases, as well as the calculations and results of the cash flow and coverage tests. The results of the revenue requirements are used to define the total revenue necessary to collect from rates. The final table provides a cash flow for the water fund with the rate increases.

*Values shown in 1,000,000
Note Includes Funds 600, 602, 626, 627 2015/16 2016/17 2017/18 2018/19 2019/20 2020/21 2021/222016 2017 2018 2019 2020 2021 2022
Water Funds Summary ‐ Pre Rate Increase
Sources of Funds
Beginning Budgetary Cash Balance $125.8 $135.9 $122.0 $130.9 $93.5 $73.1 $66.5
1 Base and Usage Revenues ‐ Pre Increase 90.3 90.1 92.6 95.4 98.3 101.2 104.3
2 Other Rate Revenues 1.4 1.3 1.2 1.3 1.3 1.3 1.3
3 Non‐potable Revenues 2.3 1.9 3.6 3.7 3.8 3.9 3.9
3 Interest Earnings 0.8 0.6 0.7 1.0 1.4 1.6 1.7
3 Miscellaneous Revenue 2.6 0.4 0.8 0.8 0.8 0.9 0.9
3 Development Fee Revenues 3.3 3.0 1.8 1.8 1.8 1.8 1.8
4 New Bond Issues ‐ ‐ 42.1 ‐ ‐ ‐ ‐
3 Department Indirects 0.4 0.5 0.2 0.3 0.3 0.3 0.3
Total Sources $226.9 $233.7 $265.2 $235.2 $201.1 $184.0 $180.6
Uses of Funds
5 Operating Expenses $46.0 $49.2 $50.9 $52.7 $54.1 $57.2 $60.3
5 Operating Transfers 7.6 8.1 8.0 8.2 8.4 8.6 8.8
5 AWT Operating Transfers 2.6 2.7 3.0 3.0 3.0 3.0 3.1
6 Debt Service 18.3 18.0 21.7 21.0 21.0 20.9 20.8
7 Capital Improvements 16.5 33.6 52.5 58.6 43.4 29.6 21.8
Total Uses $91.0 $111.7 $136.0 $143.5 $129.9 $119.3 $114.8
Ending Cash Balance $135.9 $122.0 $129.2 $91.7 $71.2 $64.6 $65.9
Change in Fund Balance $10.0 ($13.8) $7.1 ($39.3) ($22.3) ($8.5) ($0.7)
Less Reserves:
8 Operating Reserve $11.3 $11.3 $11.3 $11.7 $12.0 $12.6 $13.3
9 Replacement & Extension Reserve 26.3 27.5 28.6 29.7 30.5 31.1 31.5
Water Revenue Bond Reserve ‐ ‐ ‐ ‐ ‐ ‐ ‐
10 Capital/Rate Stabilization Balance $98.3 $83.2 $89.3 $50.3 $28.7 $20.9 $21.2
Numbers may vary from final numbers used in City financials.
Water Forecast
City of Scottsdale 58 Final Draft - Water Cost-of-Service Study
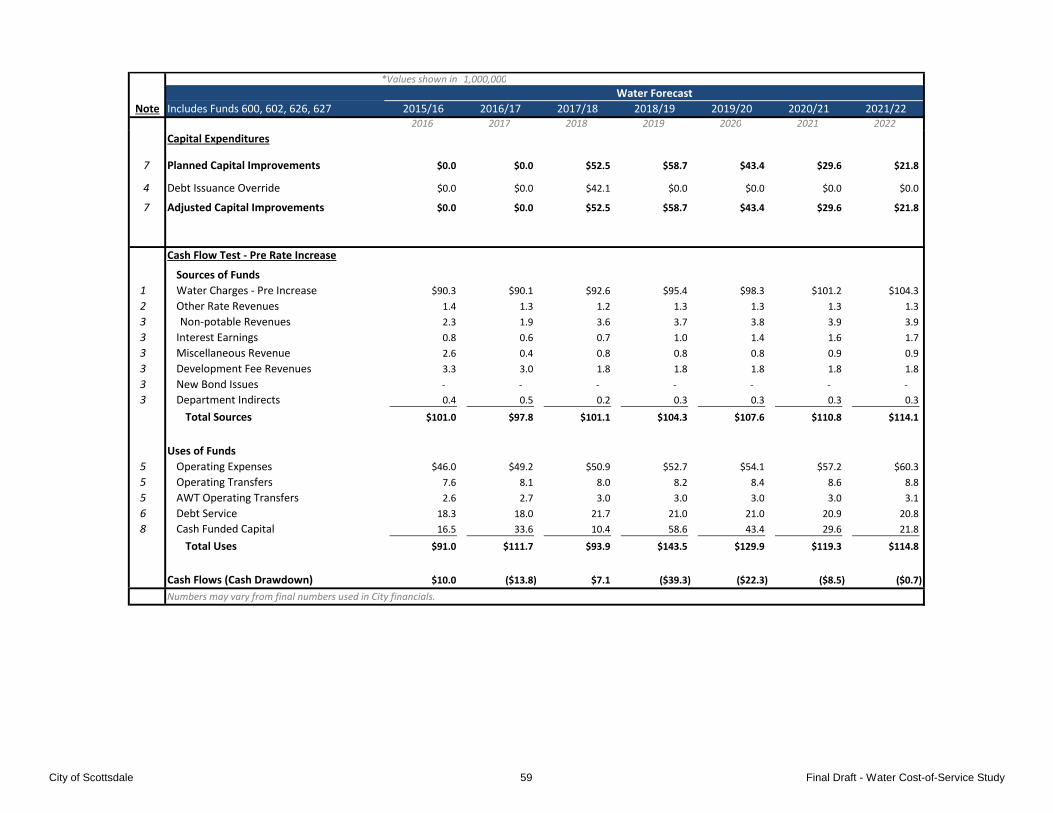
*Values shown in 1,000,000
Note Includes Funds 600, 602, 626, 627 2015/16 2016/17 2017/18 2018/19 2019/20 2020/21 2021/222016 2017 2018 2019 2020 2021 2022
Water Forecast
Capital Expenditures
7 Planned Capital Improvements $0.0 $0.0 $52.5 $58.7 $43.4 $29.6 $21.8
4 Debt Issuance Override $0.0 $0.0 $42.1 $0.0 $0.0 $0.0 $0.0
7 Adjusted Capital Improvements $0.0 $0.0 $52.5 $58.7 $43.4 $29.6 $21.8
Cash Flow Test ‐ Pre Rate Increase
Sources of Funds
1 Water Charges ‐ Pre Increase $90.3 $90.1 $92.6 $95.4 $98.3 $101.2 $104.3
2 Other Rate Revenues 1.4 1.3 1.2 1.3 1.3 1.3 1.3
3 Non‐potable Revenues 2.3 1.9 3.6 3.7 3.8 3.9 3.9
3 Interest Earnings 0.8 0.6 0.7 1.0 1.4 1.6 1.7
3 Miscellaneous Revenue 2.6 0.4 0.8 0.8 0.8 0.9 0.9
3 Development Fee Revenues 3.3 3.0 1.8 1.8 1.8 1.8 1.8
3 New Bond Issues ‐ ‐ ‐ ‐ ‐ ‐ ‐
3 Department Indirects 0.4 0.5 0.2 0.3 0.3 0.3 0.3
Total Sources $101.0 $97.8 $101.1 $104.3 $107.6 $110.8 $114.1
Uses of Funds
5 Operating Expenses $46.0 $49.2 $50.9 $52.7 $54.1 $57.2 $60.3
5 Operating Transfers 7.6 8.1 8.0 8.2 8.4 8.6 8.8
5 AWT Operating Transfers 2.6 2.7 3.0 3.0 3.0 3.0 3.1
6 Debt Service 18.3 18.0 21.7 21.0 21.0 20.9 20.8
8 Cash Funded Capital 16.5 33.6 10.4 58.6 43.4 29.6 21.8
Total Uses $91.0 $111.7 $93.9 $143.5 $129.9 $119.3 $114.8
Cash Flows (Cash Drawdown) $10.0 ($13.8) $7.1 ($39.3) ($22.3) ($8.5) ($0.7)
Numbers may vary from final numbers used in City financials.
City of Scottsdale 59 Final Draft - Water Cost-of-Service Study

*Values shown in 1,000,000
Note Includes Funds 600, 602, 626, 627 2015/16 2016/17 2017/18 2018/19 2019/20 2020/21 2021/222016 2017 2018 2019 2020 2021 2022
Water Forecast
Debt Coverage Test Pre Rate Increase
11 Coverage Target 1.2 1.2 1.2 1.2 1.2 1.2 1.2
12 Development Fees Included in Coverage Test 50%
13 Operating Revenues $97.8 $94.8 $99.3 $102.5 $105.8 $109.0 $112.3
12 Development Fees Included in Coverage 1.6 1.5 0.9 0.9 0.9 0.9 0.9
5 Less: Operating Expenses & Transfers (53.6) (57.3) (58.9) (61.0) (62.5) (65.8) (69.1)
14 Net Revenues 45.8 39.0 41.3 42.4 44.2 44.1 44.1
6 Debt Service (18.3) (18.0) (21.7) (21.0) (21.0) (20.9) (20.8)
15 Target Coverage (3.7) (3.6) (4.3) (4.2) (4.2) (4.2) (4.2)
Debt Coverage Surplus (Deficit) $23.9 $17.4 $15.3 $17.3 $19.1 $19.1 $19.1
16
Net Revenues/Debt Service
Debt Coverage Ratio 2.5 x 2.2 x 1.9 x 2.0 x 2.1 x 2.1 x 2.1 x
Numbers may vary from final numbers used in City financials.
City of Scottsdale 60 Final Draft - Water Cost-of-Service Study

*Values shown in 1,000,000
Note Includes Funds 600, 602, 626, 627 2015/16 2016/17 2017/18 2018/19 2019/20 2020/21 2021/222016 2017 2018 2019 2020 2021 2022
Water Forecast
Rate Increase Calculation
17 Required Rate Increase Revenues $0.0 $13.8 $0.0 $39.3 $22.3 $8.5 $0.7
18 Month of Adoption November November November November November November November
19 Rate Increase Override 0% 3% 3% 3% 3% 3%
19 Implemented Rate Increase 0% 0% 3% 3% 3% 3% 3%
Pre‐Increase Revenues $101.0 $97.8 $101.1 $104.3 $107.6 $110.8 $114.1
20 Revenues from Full Year Increase $0.0 $0.0 $2.8 $2.9 $2.9 $3.0 $3.1
20 Less: Rate Increase Delay ‐ ‐ (0.9) (1.0) (1.0) (1.0) (1.0)
20 Resulting Revenues From Increase $0.0 $0.0 $1.9 $1.9 $2.0 $2.0 $2.1
Total Revenues With Increase $101.0 $97.8 $102.9 $106.2 $109.6 $112.9 $116.2
Less: Expenditures (91.0) (111.7) (93.9) (143.5) (129.9) (119.3) (114.8)
21 Less: Increase in Franchise Fee ‐ ‐ (0.1) (0.1) (0.1) (0.1) (0.1)
22 Available for Capital (Use of Reserves) $10.0 ($13.8) $8.9 ($37.4) ($20.4) ($6.6) $1.3
23 Coverage 2.5 x 2.2 x 2.0 x 2.1 x 2.2 x 2.2 x 2.2 x
Numbers may vary from final numbers used in City financials.
City of Scottsdale 61 Final Draft - Water Cost-of-Service Study

*Values shown in 1,000,000
Note Includes Funds 600, 602, 626, 627 2015/16 2016/17 2017/18 2018/19 2019/20 2020/21 2021/222016 2017 2018 2019 2020 2021 2022
Water Forecast
Water Funds Summary ‐ With Rate Increase Note: Projections based on Operations and Budgets as of 2016
Sources of Funds
Beginning Budgetary Cash Balance $125.8 $135.9 $122.0 $130.9 $93.5 $73.1 $66.5
1 Water Charges ‐ Pre Increase 90.3 90.1 92.6 95.4 98.3 101.2 104.3
20 Revenues From Rate Increase ‐ ‐ 1.9 1.9 2.0 2.0 2.1
2 Other Rate Revenues 1.4 1.3 1.2 1.3 1.3 1.3 1.3
3 Non‐potable Revenues 2.3 1.9 3.6 3.7 3.8 3.9 3.9
3 Interest Earnings 0.8 0.6 0.7 1.0 1.4 1.6 1.7
3 Miscellaneous Revenue 2.6 0.4 0.8 0.8 0.8 0.9 0.9
3 Development Fee Revenues 3.3 3.0 1.8 1.8 1.8 1.8 1.8
4 New Bond Issues ‐ ‐ 42.1 ‐ ‐ ‐ ‐
3 Department Indirects 0.4 0.5 0.2 0.3 0.3 0.3 0.3
Total Sources $226.9 $233.7 $267.1 $237.1 $203.1 $186.0 $182.7
Uses of Funds
5 Operating Expenses $46.0 $49.2 $50.9 $52.7 $54.1 $57.2 $60.3
21 Increase in Franchise Fee ‐ ‐ 0.1 0.1 0.1 0.1 0.1
5 Operating Transfers 7.6 8.1 8.0 8.2 8.4 8.6 8.8
5 AWT Operating Transfers 2.6 2.7 3.0 3.0 3.0 3.0 3.1
6 Debt Service 18.3 18.0 21.7 21.0 21.0 20.9 20.8
7 Capital Improvements 16.5 33.6 52.5 58.6 43.4 29.6 21.8
Total Uses $91.0 $111.7 $136.1 $143.6 $130.0 $119.4 $114.9
Ending Cash Balance $135.9 $122.0 $130.9 $93.5 $73.1 $66.5 $67.9
Change in Fund Balance $10.0 ($13.8) $8.9 ($37.4) ($20.4) ($6.6) $1.3
Less Reserves:
8 Operating Reserve $11.3 $11.3 $11.3 $11.7 $12.0 $12.6 $13.3
9 Replacement & Extension Reserve 26.3 27.5 28.6 29.7 30.5 31.1 31.5
Water Revenue Bond Reserve ‐ ‐ ‐ ‐ ‐ ‐ ‐
24 Capital/Rate Stabilization Balance $98.3 $83.2 $91.1 $52.1 $30.6 $22.9 $23.2
Numbers may vary from final numbers used in City financials.
City of Scottsdale 62 Final Draft - Water Cost-of-Service Study
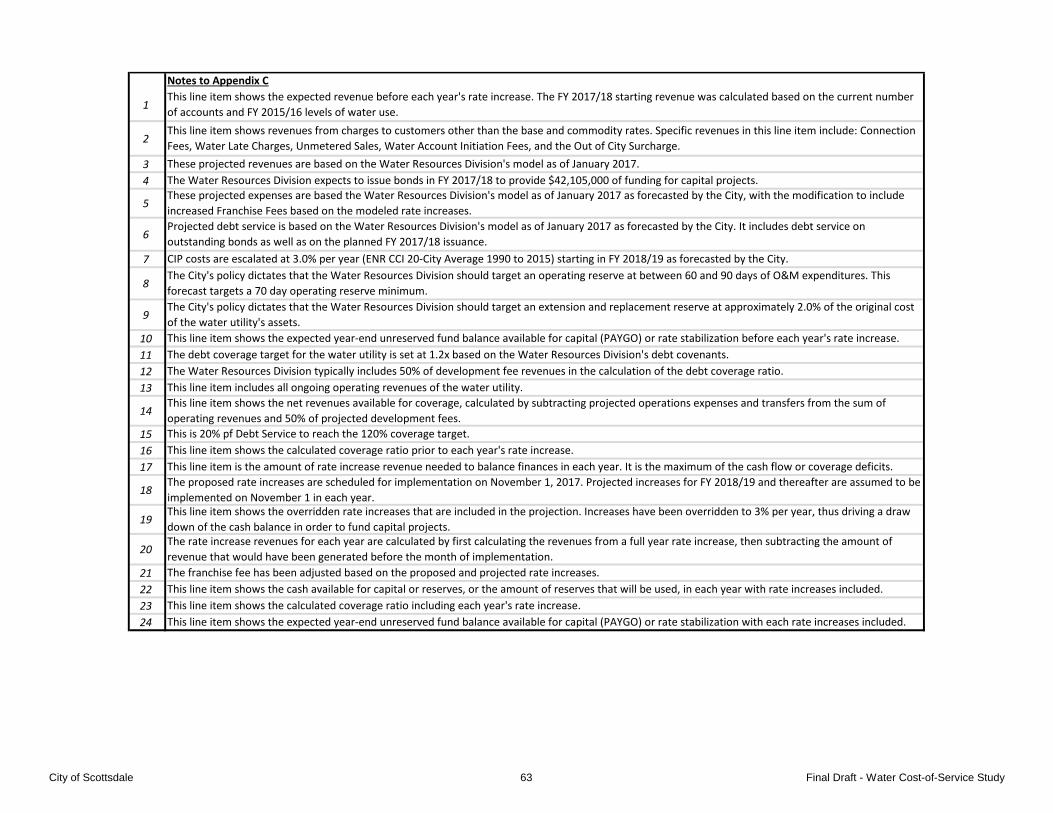
Notes to Appendix C
1
2
3
4
5
6
7
8
9
10
11
12
13
14
15
16
17
18
19
20
21
22
23
24
This line item shows the overridden rate increases that are included in the projection. Increases have been overridden to 3% per year, thus driving a draw
down of the cash balance in order to fund capital projects.The rate increase revenues for each year are calculated by first calculating the revenues from a full year rate increase, then subtracting the amount of
revenue that would have been generated before the month of implementation.
The franchise fee has been adjusted based on the proposed and projected rate increases.
This line item shows the cash available for capital or reserves, or the amount of reserves that will be used, in each year with rate increases included.
This line item shows the calculated coverage ratio including each year's rate increase.
This line item shows the expected year‐end unreserved fund balance available for capital (PAYGO) or rate stabilization with each rate increases included.
This line item shows the calculated coverage ratio prior to each year's rate increase.
This line item is the amount of rate increase revenue needed to balance finances in each year. It is the maximum of the cash flow or coverage deficits.
The proposed rate increases are scheduled for implementation on November 1, 2017. Projected increases for FY 2018/19 and thereafter are assumed to be
implemented on November 1 in each year.
The debt coverage target for the water utility is set at 1.2x based on the Water Resources Division's debt covenants.
The Water Resources Division typically includes 50% of development fee revenues in the calculation of the debt coverage ratio.
This line item includes all ongoing operating revenues of the water utility.
This line item shows the net revenues available for coverage, calculated by subtracting projected operations expenses and transfers from the sum of
operating revenues and 50% of projected development fees.
This is 20% pf Debt Service to reach the 120% coverage target.
Projected debt service is based on the Water Resources Division's model as of January 2017 as forecasted by the City. It includes debt service on
outstanding bonds as well as on the planned FY 2017/18 issuance.
CIP costs are escalated at 3.0% per year (ENR CCI 20‐City Average 1990 to 2015) starting in FY 2018/19 as forecasted by the City.
The City's policy dictates that the Water Resources Division should target an operating reserve at between 60 and 90 days of O&M expenditures. This
forecast targets a 70 day operating reserve minimum.
The City's policy dictates that the Water Resources Division should target an extension and replacement reserve at approximately 2.0% of the original cost
of the water utility's assets.
This line item shows the expected year‐end unreserved fund balance available for capital (PAYGO) or rate stabilization before each year's rate increase.
This line item shows the expected revenue before each year's rate increase. The FY 2017/18 starting revenue was calculated based on the current number
of accounts and FY 2015/16 levels of water use.
This line item shows revenues from charges to customers other than the base and commodity rates. Specific revenues in this line item include: Connection
Fees, Water Late Charges, Unmetered Sales, Water Account Initiation Fees, and the Out of City Surcharge.
These projected revenues are based on the Water Resources Division's model as of January 2017.
The Water Resources Division expects to issue bonds in FY 2017/18 to provide $42,105,000 of funding for capital projects.
These projected expenses are based the Water Resources Division's model as of January 2017 as forecasted by the City, with the modification to include
increased Franchise Fees based on the modeled rate increases.
City of Scottsdale 63 Final Draft - Water Cost-of-Service Study

City of Scottsdale 64 Final - Water Cost-of-Service Study
Appendix D – Debt Service Payment Schedules The following table shows the debt service payment schedules for each of the outstanding bond issues, as well as for projected future bond issues through FY 2021/22. The debt service payments are split to show both principal and interest.
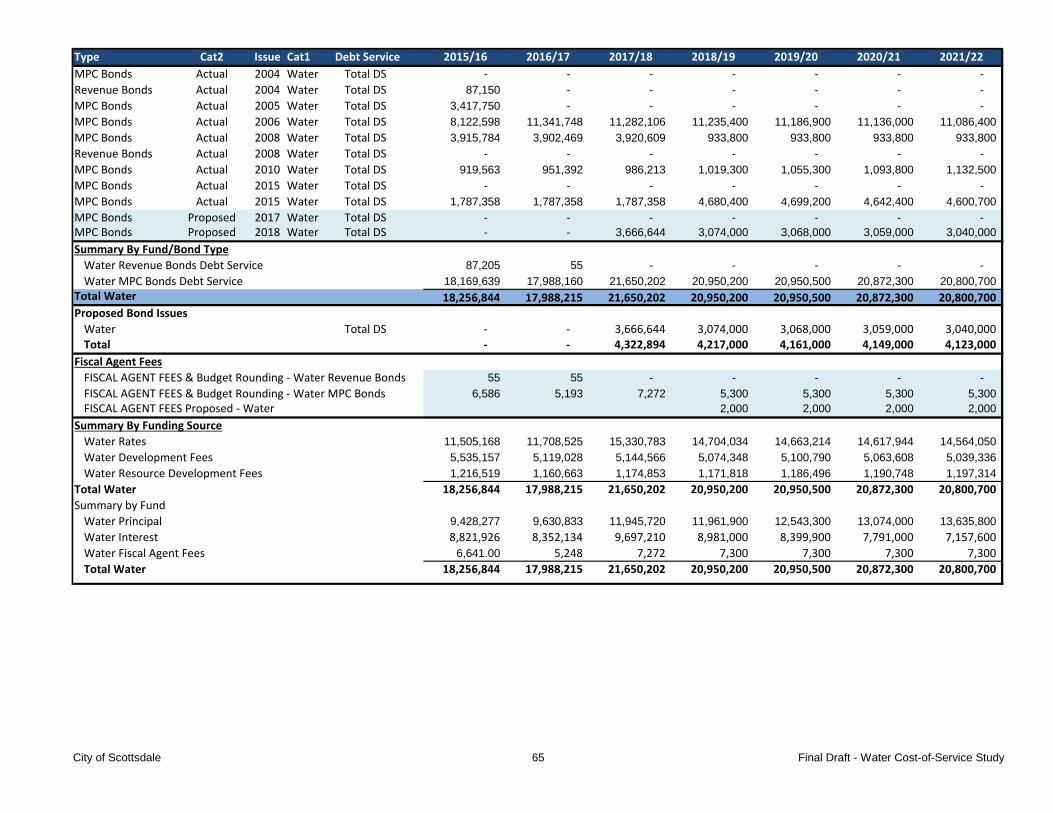
Type Cat2 Issue Cat1 Debt Service 2015/16 2016/17 2017/18 2018/19 2019/20 2020/21 2021/22
MPC Bonds Actual 2004 Water Total DS - - - - - - - Revenue Bonds Actual 2004 Water Total DS 87,150 - - - - - - MPC Bonds Actual 2005 Water Total DS 3,417,750 - - - - - - MPC Bonds Actual 2006 Water Total DS 8,122,598 11,341,748 11,282,106 11,235,400 11,186,900 11,136,000 11,086,400 MPC Bonds Actual 2008 Water Total DS 3,915,784 3,902,469 3,920,609 933,800 933,800 933,800 933,800 Revenue Bonds Actual 2008 Water Total DS - - - - - - - MPC Bonds Actual 2010 Water Total DS 919,563 951,392 986,213 1,019,300 1,055,300 1,093,800 1,132,500 MPC Bonds Actual 2015 Water Total DS - - - - - - - MPC Bonds Actual 2015 Water Total DS 1,787,358 1,787,358 1,787,358 4,680,400 4,699,200 4,642,400 4,600,700 MPC Bonds Proposed 2017 Water Total DS - - - - - - - MPC Bonds Proposed 2018 Water Total DS - - 3,666,644 3,074,000 3,068,000 3,059,000 3,040,000 Summary By Fund/Bond Type
Water Revenue Bonds Debt Service 87,205 55 - - - - - Water MPC Bonds Debt Service 18,169,639 17,988,160 21,650,202 20,950,200 20,950,500 20,872,300 20,800,700
Total Water 18,256,844 17,988,215 21,650,202 20,950,200 20,950,500 20,872,300 20,800,700 Proposed Bond Issues
Water Total DS ‐ ‐ 3,666,644 3,074,000 3,068,000 3,059,000 3,040,000 Total ‐ ‐ 4,322,894 4,217,000 4,161,000 4,149,000 4,123,000
Fiscal Agent Fees
FISCAL AGENT FEES & Budget Rounding ‐ Water Revenue Bonds 55 55 - - - - - FISCAL AGENT FEES & Budget Rounding ‐ Water MPC Bonds 6,586 5,193 7,272 5,300 5,300 5,300 5,300 FISCAL AGENT FEES Proposed ‐ Water 2,000 2,000 2,000 2,000
Summary By Funding Source
Water Rates 11,505,168 11,708,525 15,330,783 14,704,034 14,663,214 14,617,944 14,564,050 Water Development Fees 5,535,157 5,119,028 5,144,566 5,074,348 5,100,790 5,063,608 5,039,336 Water Resource Development Fees 1,216,519 1,160,663 1,174,853 1,171,818 1,186,496 1,190,748 1,197,314
Total Water 18,256,844 17,988,215 21,650,202 20,950,200 20,950,500 20,872,300 20,800,700
Summary by Fund
Water Principal 9,428,277 9,630,833 11,945,720 11,961,900 12,543,300 13,074,000 13,635,800 Water Interest 8,821,926 8,352,134 9,697,210 8,981,000 8,399,900 7,791,000 7,157,600
Water Fiscal Agent Fees 6,641.00 5,248 7,272 7,300 7,300 7,300 7,300
Total Water 18,256,844 17,988,215 21,650,202 20,950,200 20,950,500 20,872,300 20,800,700
City of Scottsdale 65 Final Draft - Water Cost-of-Service Study
City of Scottsdale 66 Final - Water Cost-of-Service Study
Appendix E – Functional Cost Allocation The functional allocation tables are provide the allocation percentages used to allocate fixed assets and O&M expenses to the rate components. The total allocated costs are summed for each rate component to determine the overall allocation percentages to apply to the revenue requirements.

Fixed Asset Allocation Asset Value Customer Base Peak Month Peak Day Peak Hour Fire Pumping As All Other Total
Land 39,650,797$ 100% 100%
Meters & Services 18,497,512$ 100% 0% 100%
Structures & Buildings 111,645,769$ 25% 39% 10% 5% 21% 0% 100%
Treatment 404,705,018$ 52% 13% 6% 29% 0% 100%
Reservoirs 52,578,007$ 32% 8% 4% 18% 38% 0% 100%
Wells 74,706,909$ 52% 13% 6% 29% 0% 100%
Water Rights 87,171,705$ 52% 13% 6% 29% 0% 100%
Pump Stations 178,397,502$ 33% 8% 4% 18% 36% 0% 100%
Transmission & Distribution 478,608,030$ 36% 9% 5% 20% 30% 0% 100%
Hydrants 16,455,347$ 100% 0% 100%
Miscellaneous 11,979,432$ 100% 0% 100%
CWIP ‐$ 100% 100%
Total Fixed Assets to be Allocated 1,474,396,029$ 58,388,386$ 588,482,135$ 147,120,534$ 73,560,267$ 323,665,174$ 243,528,736$ ‐$ 39,650,797$
Redistribution of As All Other 1,613,629 16,263,365 4,065,841 2,032,921 8,944,851 6,730,190 ‐ (39,650,797)
Total Allocated Fixed Assets Correct 60,002,015$ 604,745,500$ 151,186,375$ 75,593,188$ 332,610,025$ 250,258,926$ ‐$ ‐$
Fixed Asset Allocation 4% 41% 10% 5% 23% 17%
Allocations Customer Base Peak Month Peak Day Peak Hour Fire Pumping As All Other Total
Fixed Assets 4% 41% 10% 5% 23% 17% 0% 0% 100%
Customer Only 100% 0% 100%
Base Only 100% 0% 100%
Peak Month Only 100% 0% 100%
Peak Day Only 100% 0% 100%
Peak Hour Only 100% 0% 100%
Fire Only 100% 0% 100%
Pumping Only 100% 0% 100%
Base/Peak 52% 13% 6% 29% 0% 100%
As All Other 100% 100%
User Input 100% 100%
City of Scottsdale 67 Final Draft - Water Cost-of-Service Study

Rev Req Allocation Customer Base Peak Month Peak Day Peak Hour Fire Pumping As All Other Total
Operations 58,903,643$ [Operating] 9% 45% 11% 6% 25% 4% 0% 0% 100%
Increase in Franchise Fee 92,634$ Fixed Assets 4% 41% 10% 5% 23% 17% 0% 0% 100%
AWT Operating Transfers 2,960,000$ Fixed Assets 4% 41% 10% 5% 23% 17% 0% 0% 100%
Debt Service 21,650,202$ Fixed Assets 4% 41% 10% 5% 23% 17% 0% 0% 100%
Cash Funded Capital 10,417,135$ Fixed Assets 4% 41% 10% 5% 23% 17% 0% 0% 100%
Cash Available for Capital 8,892,178$ Fixed Assets 4% 41% 10% 5% 23% 17% 0% 0% 100%
Less: Offsetting Revenues
Non Potable Revenues (1,243,400)$ Base/Peak 0% 52% 13% 6% 29% 0% 0% 0% 100%
Non Potable Revenues (3,636,100)$ Base/Peak 0% 52% 13% 6% 29% 0% 0% 0% 100%
Interest Earnings (698,594)$ As All Other 0% 0% 0% 0% 0% 0% 0% 100% 100%
Miscellaneous Revenue (802,000)$ As All Other 0% 0% 0% 0% 0% 0% 0% 100% 100%
Development Fee Revenues (1,800,000)$ Fixed Assets 4% 41% 10% 5% 23% 17% 0% 0% 100%
AWT ‐$ As All Other 0% 0% 0% 0% 0% 0% 0% 100% 100%
AWT Operating Transfers ‐$ Fixed Assets 4% 41% 10% 5% 23% 17% 0% 0% 100%
‐$ Fixed Assets 4% 41% 10% 5% 23% 17% 0% 0% 100%
Department Indirects (249,000)$ As All Other 0% 0% 0% 0% 0% 0% 0% 100% 100%
Adjustment for Rate Increase Delay 926,340$ As All Other 0% 0% 0% 0% 0% 0% 0% 100% 100%
Subtotal: Rate Revenues to be Collected 95,413,038$ 6,930,418$ 41,453,338$ 10,363,335$ 5,181,667$ 22,799,336$ 9,508,198$ ‐$ (823,254)$
Reallocation of "As All Other" (59,286) (354,613) (88,653) (44,327) (195,037) (81,338) ‐ 823,254
Total Allocation 95,413,038$ 6,871,132$ 41,098,725$ 10,274,681$ 5,137,341$ 22,604,299$ 9,426,860$ ‐$ ‐$
Total System Allocation 7.2% 43.1% 10.8% 5.4% 23.7% 9.9% 0.0% 0.0%
Fixed/Variable Charge Allocation Customer Base Peak Month Peak Day Peak Hour Fire Pumping As All Other Total
Fixed Charge ‐$ ‐$ ‐$ ‐$ ‐$ ‐$ ‐$ ‐$
Reallocation of "As All Other" ‐ ‐ ‐ ‐ ‐ ‐ ‐ ‐
Total Allocated to Fixed Charge ‐$ 0% ‐$ ‐$ ‐$ ‐$ ‐$ ‐$ ‐$ ‐$
Fixed Charge Percentage 0% 0% 0% 0% 0% 0% 0% 0
Variable Charge 6,930,418$ 41,453,338$ 10,363,335$ 5,181,667$ 22,799,336$ 9,508,198$ ‐$ (823,254)$
Reallocation of "As All Other" (59,286) (354,613) (88,653) (44,327) (195,037) (81,338) ‐ 823,254
Total Allocated to Variable Charge 95,413,038$ 100% 6,871,132$ 41,098,725$ 10,274,681$ 5,137,341$ 22,604,299$ 9,426,860$ ‐$ ‐$
Variable Charge Percentage 100% 100% 100% 100% 100% 100% 0%
Total To be Collected 95,413,038$ 6,871,132$ 41,098,725$ 10,274,681$ 5,137,341$ 22,604,299$ 9,426,860$ ‐$ ‐$
7.2% 43.1% 10.8% 5.4% 23.7% 9.9% 0.0% 0.0%
City of Scottsdale 68 Final Draft - Water Cost-of-Service Study
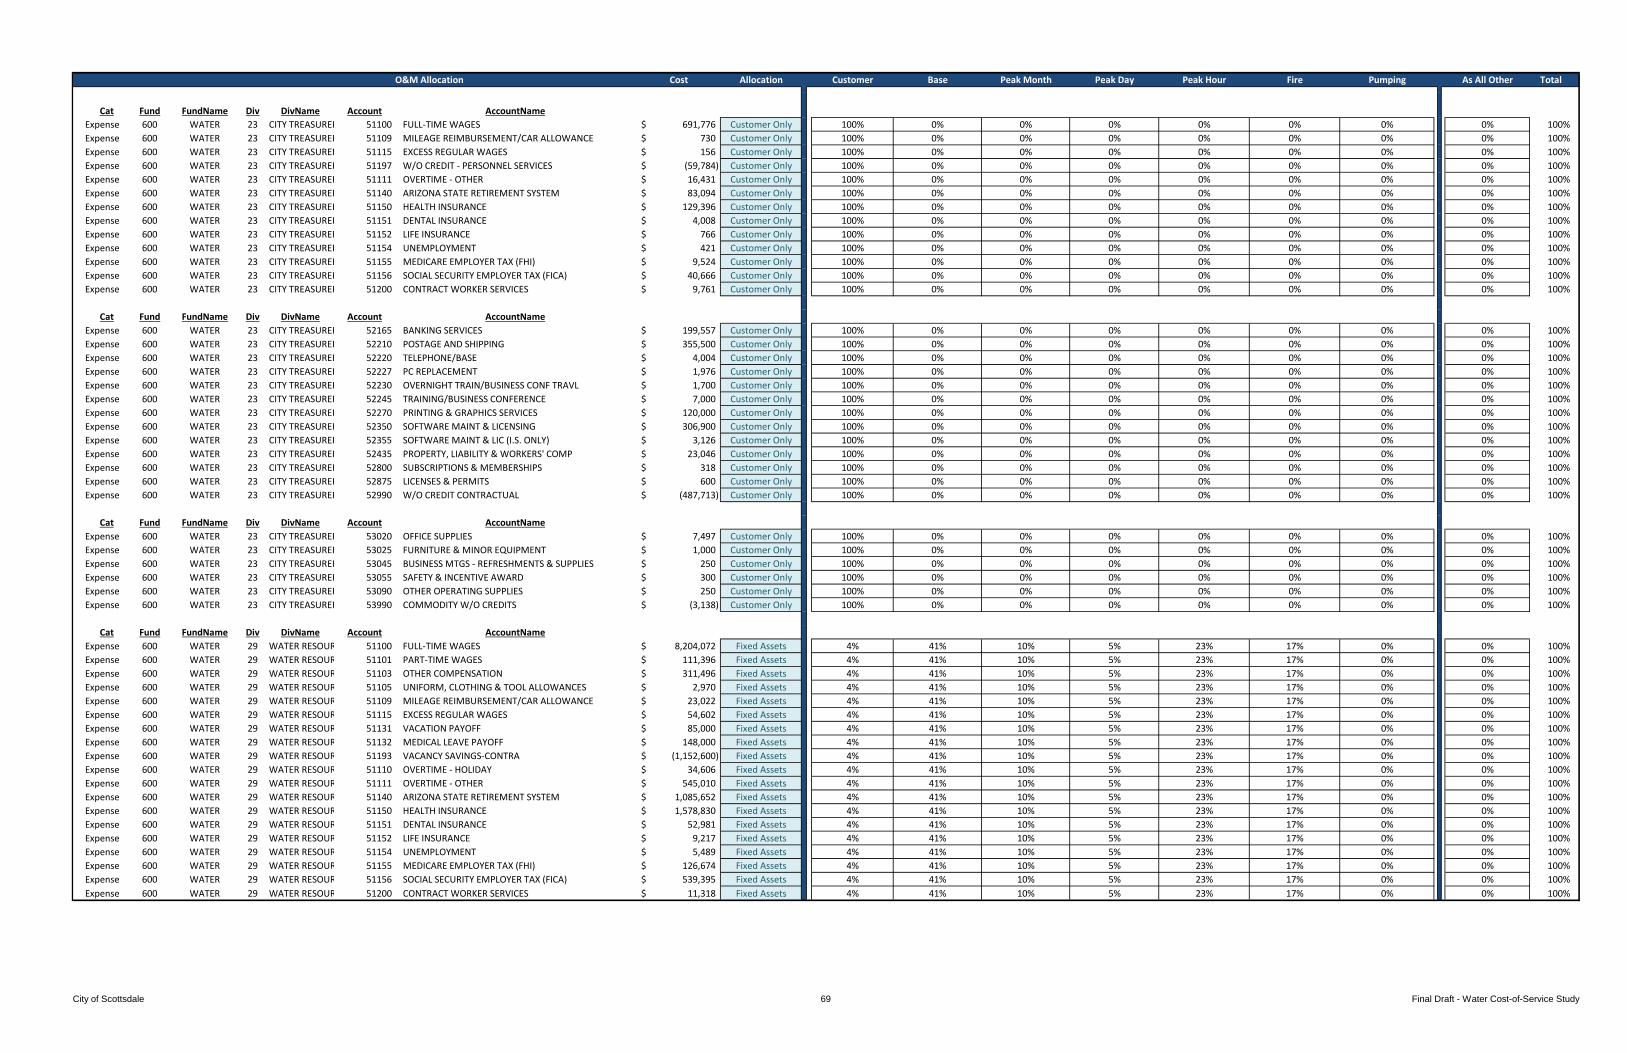
O&M Allocation Cost Allocation Customer Base Peak Month Peak Day Peak Hour Fire Pumping As All Other Total
Cat Fund FundName Div DivName Account AccountName
Expense 600 WATER 23 CITY TREASURER 51100 FULL‐TIME WAGES 691,776$ Customer Only 100% 0% 0% 0% 0% 0% 0% 0% 100%
Expense 600 WATER 23 CITY TREASURER 51109 MILEAGE REIMBURSEMENT/CAR ALLOWANCE 730$ Customer Only 100% 0% 0% 0% 0% 0% 0% 0% 100%
Expense 600 WATER 23 CITY TREASURER 51115 EXCESS REGULAR WAGES 156$ Customer Only 100% 0% 0% 0% 0% 0% 0% 0% 100%
Expense 600 WATER 23 CITY TREASURER 51197 W/O CREDIT ‐ PERSONNEL SERVICES (59,784)$ Customer Only 100% 0% 0% 0% 0% 0% 0% 0% 100%
Expense 600 WATER 23 CITY TREASURER 51111 OVERTIME ‐ OTHER 16,431$ Customer Only 100% 0% 0% 0% 0% 0% 0% 0% 100%
Expense 600 WATER 23 CITY TREASURER 51140 ARIZONA STATE RETIREMENT SYSTEM 83,094$ Customer Only 100% 0% 0% 0% 0% 0% 0% 0% 100%
Expense 600 WATER 23 CITY TREASURER 51150 HEALTH INSURANCE 129,396$ Customer Only 100% 0% 0% 0% 0% 0% 0% 0% 100%
Expense 600 WATER 23 CITY TREASURER 51151 DENTAL INSURANCE 4,008$ Customer Only 100% 0% 0% 0% 0% 0% 0% 0% 100%
Expense 600 WATER 23 CITY TREASURER 51152 LIFE INSURANCE 766$ Customer Only 100% 0% 0% 0% 0% 0% 0% 0% 100%
Expense 600 WATER 23 CITY TREASURER 51154 UNEMPLOYMENT 421$ Customer Only 100% 0% 0% 0% 0% 0% 0% 0% 100%
Expense 600 WATER 23 CITY TREASURER 51155 MEDICARE EMPLOYER TAX (FHI) 9,524$ Customer Only 100% 0% 0% 0% 0% 0% 0% 0% 100%
Expense 600 WATER 23 CITY TREASURER 51156 SOCIAL SECURITY EMPLOYER TAX (FICA) 40,666$ Customer Only 100% 0% 0% 0% 0% 0% 0% 0% 100%
Expense 600 WATER 23 CITY TREASURER 51200 CONTRACT WORKER SERVICES 9,761$ Customer Only 100% 0% 0% 0% 0% 0% 0% 0% 100%
Cat Fund FundName Div DivName Account AccountName
Expense 600 WATER 23 CITY TREASURER 52165 BANKING SERVICES 199,557$ Customer Only 100% 0% 0% 0% 0% 0% 0% 0% 100%
Expense 600 WATER 23 CITY TREASURER 52210 POSTAGE AND SHIPPING 355,500$ Customer Only 100% 0% 0% 0% 0% 0% 0% 0% 100%
Expense 600 WATER 23 CITY TREASURER 52220 TELEPHONE/BASE 4,004$ Customer Only 100% 0% 0% 0% 0% 0% 0% 0% 100%
Expense 600 WATER 23 CITY TREASURER 52227 PC REPLACEMENT 1,976$ Customer Only 100% 0% 0% 0% 0% 0% 0% 0% 100%
Expense 600 WATER 23 CITY TREASURER 52230 OVERNIGHT TRAIN/BUSINESS CONF TRAVL 1,700$ Customer Only 100% 0% 0% 0% 0% 0% 0% 0% 100%
Expense 600 WATER 23 CITY TREASURER 52245 TRAINING/BUSINESS CONFERENCE 7,000$ Customer Only 100% 0% 0% 0% 0% 0% 0% 0% 100%
Expense 600 WATER 23 CITY TREASURER 52270 PRINTING & GRAPHICS SERVICES 120,000$ Customer Only 100% 0% 0% 0% 0% 0% 0% 0% 100%
Expense 600 WATER 23 CITY TREASURER 52350 SOFTWARE MAINT & LICENSING 306,900$ Customer Only 100% 0% 0% 0% 0% 0% 0% 0% 100%
Expense 600 WATER 23 CITY TREASURER 52355 SOFTWARE MAINT & LIC (I.S. ONLY) 3,126$ Customer Only 100% 0% 0% 0% 0% 0% 0% 0% 100%
Expense 600 WATER 23 CITY TREASURER 52435 PROPERTY, LIABILITY & WORKERS' COMP 23,046$ Customer Only 100% 0% 0% 0% 0% 0% 0% 0% 100%
Expense 600 WATER 23 CITY TREASURER 52800 SUBSCRIPTIONS & MEMBERSHIPS 318$ Customer Only 100% 0% 0% 0% 0% 0% 0% 0% 100%
Expense 600 WATER 23 CITY TREASURER 52875 LICENSES & PERMITS 600$ Customer Only 100% 0% 0% 0% 0% 0% 0% 0% 100%
Expense 600 WATER 23 CITY TREASURER 52990 W/O CREDIT CONTRACTUAL (487,713)$ Customer Only 100% 0% 0% 0% 0% 0% 0% 0% 100%
Cat Fund FundName Div DivName Account AccountName
Expense 600 WATER 23 CITY TREASURER 53020 OFFICE SUPPLIES 7,497$ Customer Only 100% 0% 0% 0% 0% 0% 0% 0% 100%
Expense 600 WATER 23 CITY TREASURER 53025 FURNITURE & MINOR EQUIPMENT 1,000$ Customer Only 100% 0% 0% 0% 0% 0% 0% 0% 100%
Expense 600 WATER 23 CITY TREASURER 53045 BUSINESS MTGS ‐ REFRESHMENTS & SUPPLIES 250$ Customer Only 100% 0% 0% 0% 0% 0% 0% 0% 100%
Expense 600 WATER 23 CITY TREASURER 53055 SAFETY & INCENTIVE AWARD 300$ Customer Only 100% 0% 0% 0% 0% 0% 0% 0% 100%
Expense 600 WATER 23 CITY TREASURER 53090 OTHER OPERATING SUPPLIES 250$ Customer Only 100% 0% 0% 0% 0% 0% 0% 0% 100%
Expense 600 WATER 23 CITY TREASURER 53990 COMMODITY W/O CREDITS (3,138)$ Customer Only 100% 0% 0% 0% 0% 0% 0% 0% 100%
Cat Fund FundName Div DivName Account AccountName
Expense 600 WATER 29 WATER RESOUR 51100 FULL‐TIME WAGES 8,204,072$ Fixed Assets 4% 41% 10% 5% 23% 17% 0% 0% 100%
Expense 600 WATER 29 WATER RESOUR 51101 PART‐TIME WAGES 111,396$ Fixed Assets 4% 41% 10% 5% 23% 17% 0% 0% 100%
Expense 600 WATER 29 WATER RESOUR 51103 OTHER COMPENSATION 311,496$ Fixed Assets 4% 41% 10% 5% 23% 17% 0% 0% 100%
Expense 600 WATER 29 WATER RESOUR 51105 UNIFORM, CLOTHING & TOOL ALLOWANCES 2,970$ Fixed Assets 4% 41% 10% 5% 23% 17% 0% 0% 100%
Expense 600 WATER 29 WATER RESOUR 51109 MILEAGE REIMBURSEMENT/CAR ALLOWANCE 23,022$ Fixed Assets 4% 41% 10% 5% 23% 17% 0% 0% 100%
Expense 600 WATER 29 WATER RESOUR 51115 EXCESS REGULAR WAGES 54,602$ Fixed Assets 4% 41% 10% 5% 23% 17% 0% 0% 100%
Expense 600 WATER 29 WATER RESOUR 51131 VACATION PAYOFF 85,000$ Fixed Assets 4% 41% 10% 5% 23% 17% 0% 0% 100%
Expense 600 WATER 29 WATER RESOUR 51132 MEDICAL LEAVE PAYOFF 148,000$ Fixed Assets 4% 41% 10% 5% 23% 17% 0% 0% 100%
Expense 600 WATER 29 WATER RESOUR 51193 VACANCY SAVINGS‐CONTRA (1,152,600)$ Fixed Assets 4% 41% 10% 5% 23% 17% 0% 0% 100%
Expense 600 WATER 29 WATER RESOUR 51110 OVERTIME ‐ HOLIDAY 34,606$ Fixed Assets 4% 41% 10% 5% 23% 17% 0% 0% 100%
Expense 600 WATER 29 WATER RESOUR 51111 OVERTIME ‐ OTHER 545,010$ Fixed Assets 4% 41% 10% 5% 23% 17% 0% 0% 100%
Expense 600 WATER 29 WATER RESOUR 51140 ARIZONA STATE RETIREMENT SYSTEM 1,085,652$ Fixed Assets 4% 41% 10% 5% 23% 17% 0% 0% 100%
Expense 600 WATER 29 WATER RESOUR 51150 HEALTH INSURANCE 1,578,830$ Fixed Assets 4% 41% 10% 5% 23% 17% 0% 0% 100%
Expense 600 WATER 29 WATER RESOUR 51151 DENTAL INSURANCE 52,981$ Fixed Assets 4% 41% 10% 5% 23% 17% 0% 0% 100%
Expense 600 WATER 29 WATER RESOUR 51152 LIFE INSURANCE 9,217$ Fixed Assets 4% 41% 10% 5% 23% 17% 0% 0% 100%
Expense 600 WATER 29 WATER RESOUR 51154 UNEMPLOYMENT 5,489$ Fixed Assets 4% 41% 10% 5% 23% 17% 0% 0% 100%
Expense 600 WATER 29 WATER RESOUR 51155 MEDICARE EMPLOYER TAX (FHI) 126,674$ Fixed Assets 4% 41% 10% 5% 23% 17% 0% 0% 100%
Expense 600 WATER 29 WATER RESOUR 51156 SOCIAL SECURITY EMPLOYER TAX (FICA) 539,395$ Fixed Assets 4% 41% 10% 5% 23% 17% 0% 0% 100%
Expense 600 WATER 29 WATER RESOUR 51200 CONTRACT WORKER SERVICES 11,318$ Fixed Assets 4% 41% 10% 5% 23% 17% 0% 0% 100%
City of Scottsdale 69 Final Draft - Water Cost-of-Service Study

O&M Allocation Cost Allocation Customer Base Peak Month Peak Day Peak Hour Fire Pumping As All Other Total
Cat Fund FundName Div DivName Account AccountName
Expense 600 WATER 29 WATER RESOUR 52130 CONSULTANTS 117,000$ Customer Only 100% 0% 0% 0% 0% 0% 0% 0% 100%
Expense 600 WATER 29 WATER RESOUR 52137 SECURITY 580,000$ Customer Only 100% 0% 0% 0% 0% 0% 0% 0% 100%
Expense 600 WATER 29 WATER RESOUR 52140 LEGAL SERVICES ‐ ATTORNEYS 9,000$ As All Other 0% 0% 0% 0% 0% 0% 0% 100% 100%
Expense 600 WATER 29 WATER RESOUR 52151 LABORATORY TESTING 25,000$ Base/Peak 0% 52% 13% 6% 29% 0% 0% 0% 100%
Expense 600 WATER 29 WATER RESOUR 52185 ADVERTISING 31,000$ Customer Only 100% 0% 0% 0% 0% 0% 0% 0% 100%
Expense 600 WATER 29 WATER RESOUR 52190 OTHER PROFESSIONAL SERVICES 814,883$ Customer Only 100% 0% 0% 0% 0% 0% 0% 0% 100%
Expense 600 WATER 29 WATER RESOUR 52210 POSTAGE AND SHIPPING 14,000$ Customer Only 100% 0% 0% 0% 0% 0% 0% 0% 100%
Expense 600 WATER 29 WATER RESOUR 52220 TELEPHONE/BASE 64,792$ Customer Only 100% 0% 0% 0% 0% 0% 0% 0% 100%
Expense 600 WATER 29 WATER RESOUR 52225 CELLULAR PHONES 21,131$ Customer Only 100% 0% 0% 0% 0% 0% 0% 0% 100%
Expense 600 WATER 29 WATER RESOUR 52226 SPECIALTY LINES ‐ COMMUNICATIONS 155,444$ Customer Only 100% 0% 0% 0% 0% 0% 0% 0% 100%
Expense 600 WATER 29 WATER RESOUR 52227 PC REPLACEMENT 117,785$ Customer Only 100% 0% 0% 0% 0% 0% 0% 0% 100%
Expense 600 WATER 29 WATER RESOUR 52230 OVERNIGHT TRAIN/BUSINESS CONF TRAVL 40,125$ Customer Only 100% 0% 0% 0% 0% 0% 0% 0% 100%
Expense 600 WATER 29 WATER RESOUR 52245 TRAINING/BUSINESS CONFERENCE 23,915$ Customer Only 100% 0% 0% 0% 0% 0% 0% 0% 100%
Expense 600 WATER 29 WATER RESOUR 52250 SPONSORED TRAINING 115,275$ Customer Only 100% 0% 0% 0% 0% 0% 0% 0% 100%
Expense 600 WATER 29 WATER RESOUR 52270 PRINTING & GRAPHICS SERVICES 39,800$ Customer Only 100% 0% 0% 0% 0% 0% 0% 0% 100%
Expense 600 WATER 29 WATER RESOUR 52275 PHOTOCOPY CHARGES 16,676$ Customer Only 100% 0% 0% 0% 0% 0% 0% 0% 100%
Expense 600 WATER 29 WATER RESOUR 52323 LANDSCAPING 142,900$ Customer Only 100% 0% 0% 0% 0% 0% 0% 0% 100%
Expense 600 WATER 29 WATER RESOUR 52340 MAINTENANCE, OFF EQUIP & FURNITURE 4,500$ Base/Peak 0% 52% 13% 6% 29% 0% 0% 0% 100%
Expense 600 WATER 29 WATER RESOUR 52350 SOFTWARE MAINT & LICENSING 137,986$ Base/Peak 0% 52% 13% 6% 29% 0% 0% 0% 100%
Expense 600 WATER 29 WATER RESOUR 52355 SOFTWARE MAINT & LIC (I.S. ONLY) 34,520$ Base/Peak 0% 52% 13% 6% 29% 0% 0% 0% 100%
Expense 600 WATER 29 WATER RESOUR 52360 MAINT ‐ MACHINERY, EQUIP & AUTOS 995,952$ Base/Peak 0% 52% 13% 6% 29% 0% 0% 0% 100%
Expense 600 WATER 29 WATER RESOUR 52361 MAINTENANCE PRVS 5,000$ Base/Peak 0% 52% 13% 6% 29% 0% 0% 0% 100%
Expense 600 WATER 29 WATER RESOUR 52362 MAINTENANCE IRRIGATION 50,000$ Base/Peak 0% 52% 13% 6% 29% 0% 0% 0% 100%
Expense 600 WATER 29 WATER RESOUR 52363 SERVICE INTERRUPTION REPAIRS 50,400$ Base/Peak 0% 52% 13% 6% 29% 0% 0% 0% 100%
Expense 600 WATER 29 WATER RESOUR 52380 UNIFORM CLEANING 55,000$ Base/Peak 0% 52% 13% 6% 29% 0% 0% 0% 100%
Expense 600 WATER 29 WATER RESOUR 52435 PROPERTY, LIABILITY & WORKERS' COMP 498,218$ Base/Peak 0% 52% 13% 6% 29% 0% 0% 0% 100%
Expense 600 WATER 29 WATER RESOUR 52510 LAND RENTS 13,680$ Base/Peak 0% 52% 13% 6% 29% 0% 0% 0% 100%
Expense 600 WATER 29 WATER RESOUR 52590 OTHER RENTALS 25,650$ Base/Peak 0% 52% 13% 6% 29% 0% 0% 0% 100%
Expense 600 WATER 29 WATER RESOUR 52671 FLEET ‐ MAINTENANCE & REPAIR (M&R) 497,976$ Base/Peak 0% 52% 13% 6% 29% 0% 0% 0% 100%
Expense 600 WATER 29 WATER RESOUR 52672 FLEET ‐ FUEL 210,048$ Base/Peak 0% 52% 13% 6% 29% 0% 0% 0% 100%
Expense 600 WATER 29 WATER RESOUR 52675 FLEET ‐ REPLACEMENT 370,572$ Base/Peak 0% 52% 13% 6% 29% 0% 0% 0% 100%
Expense 600 WATER 29 WATER RESOUR 52711 ELECTRIC 9,273,012$ Base/Peak 0% 52% 13% 6% 29% 0% 0% 0% 100%
Expense 600 WATER 29 WATER RESOUR 52712 GAS 27,000$ Base/Peak 0% 52% 13% 6% 29% 0% 0% 0% 100%
Expense 600 WATER 29 WATER RESOUR 52713 WATER 23,100$ Base/Peak 0% 52% 13% 6% 29% 0% 0% 0% 100%
Expense 600 WATER 29 WATER RESOUR 52714 SEWER 4,200$ Base/Peak 0% 52% 13% 6% 29% 0% 0% 0% 100%
Expense 600 WATER 29 WATER RESOUR 52715 SOLID WASTE 3,900$ Base/Peak 0% 52% 13% 6% 29% 0% 0% 0% 100%
Expense 600 WATER 29 WATER RESOUR 52800 SUBSCRIPTIONS & MEMBERSHIPS 32,988$ Base/Peak 0% 52% 13% 6% 29% 0% 0% 0% 100%
Expense 600 WATER 29 WATER RESOUR 52805 CITY MEMBERSHIPS 193,450$ Base/Peak 0% 52% 13% 6% 29% 0% 0% 0% 100%
Expense 600 WATER 29 WATER RESOUR 52820 DAMAGE CLAIMS 6,500$ Base/Peak 0% 52% 13% 6% 29% 0% 0% 0% 100%
Expense 600 WATER 29 WATER RESOUR 52828 PROPERTY OWNER REIMBURSEMENTS 400$ Base/Peak 0% 52% 13% 6% 29% 0% 0% 0% 100%
Expense 600 WATER 29 WATER RESOUR 52829 PUBLIC EDUCATION OUTREACH 5,250$ Base/Peak 0% 52% 13% 6% 29% 0% 0% 0% 100%
Expense 600 WATER 29 WATER RESOUR 52830 RECORDING FEES 1,000$ Base/Peak 0% 52% 13% 6% 29% 0% 0% 0% 100%
Expense 600 WATER 29 WATER RESOUR 52831 PAPERLESS BILL INCENTIVE (07/17) 100,000$ Base/Peak 0% 52% 13% 6% 29% 0% 0% 0% 100%
Expense 600 WATER 29 WATER RESOUR 52870 LANDFILL CONTRACT 17,150$ Base/Peak 0% 52% 13% 6% 29% 0% 0% 0% 100%
Expense 600 WATER 29 WATER RESOUR 52875 LICENSES & PERMITS 88,100$ Base/Peak 0% 52% 13% 6% 29% 0% 0% 0% 100%
Expense 600 WATER 29 WATER RESOUR 52885 SPECIAL CONT WATER CONSERVATION 240,000$ Base/Peak 0% 52% 13% 6% 29% 0% 0% 0% 100%
Merit 600 WATER 29 WATER RESOUR 52890 OTHER CONTRACTUAL SERVICES 53,232$ Base/Peak 0% 52% 13% 6% 29% 0% 0% 0% 100%
City of Scottsdale 70 Final Draft - Water Cost-of-Service Study
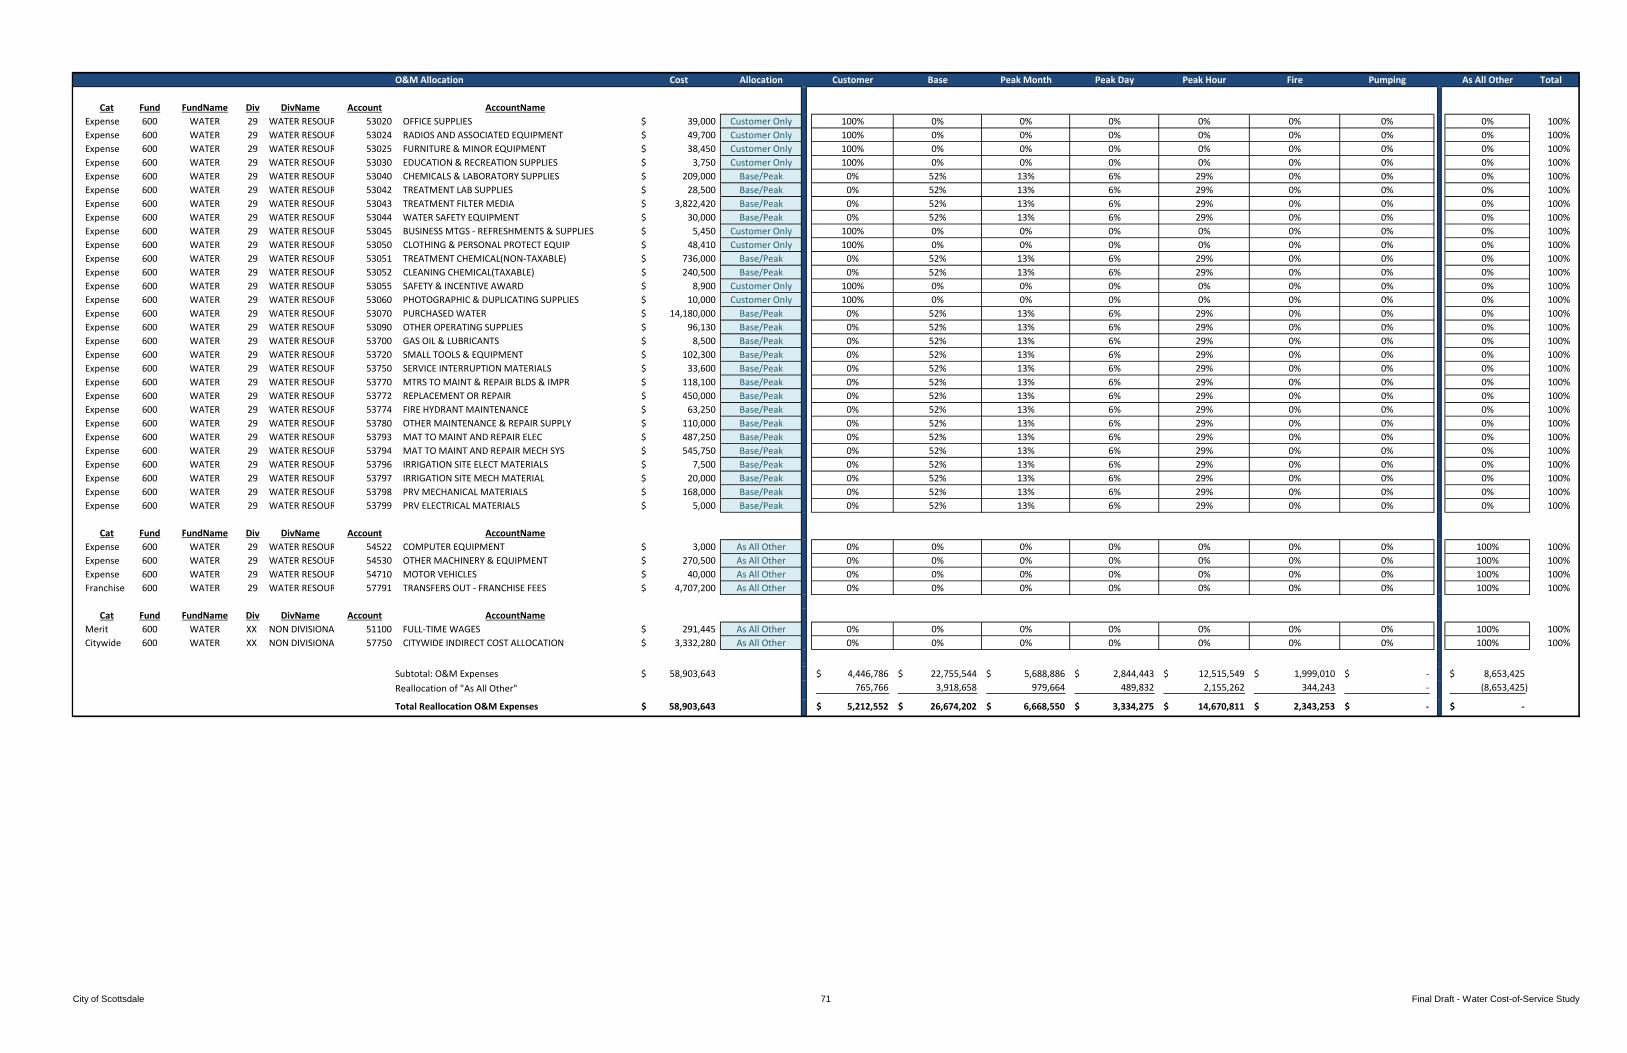
O&M Allocation Cost Allocation Customer Base Peak Month Peak Day Peak Hour Fire Pumping As All Other Total
Cat Fund FundName Div DivName Account AccountName
Expense 600 WATER 29 WATER RESOUR 53020 OFFICE SUPPLIES 39,000$ Customer Only 100% 0% 0% 0% 0% 0% 0% 0% 100%
Expense 600 WATER 29 WATER RESOUR 53024 RADIOS AND ASSOCIATED EQUIPMENT 49,700$ Customer Only 100% 0% 0% 0% 0% 0% 0% 0% 100%
Expense 600 WATER 29 WATER RESOUR 53025 FURNITURE & MINOR EQUIPMENT 38,450$ Customer Only 100% 0% 0% 0% 0% 0% 0% 0% 100%
Expense 600 WATER 29 WATER RESOUR 53030 EDUCATION & RECREATION SUPPLIES 3,750$ Customer Only 100% 0% 0% 0% 0% 0% 0% 0% 100%
Expense 600 WATER 29 WATER RESOUR 53040 CHEMICALS & LABORATORY SUPPLIES 209,000$ Base/Peak 0% 52% 13% 6% 29% 0% 0% 0% 100%
Expense 600 WATER 29 WATER RESOUR 53042 TREATMENT LAB SUPPLIES 28,500$ Base/Peak 0% 52% 13% 6% 29% 0% 0% 0% 100%
Expense 600 WATER 29 WATER RESOUR 53043 TREATMENT FILTER MEDIA 3,822,420$ Base/Peak 0% 52% 13% 6% 29% 0% 0% 0% 100%
Expense 600 WATER 29 WATER RESOUR 53044 WATER SAFETY EQUIPMENT 30,000$ Base/Peak 0% 52% 13% 6% 29% 0% 0% 0% 100%
Expense 600 WATER 29 WATER RESOUR 53045 BUSINESS MTGS ‐ REFRESHMENTS & SUPPLIES 5,450$ Customer Only 100% 0% 0% 0% 0% 0% 0% 0% 100%
Expense 600 WATER 29 WATER RESOUR 53050 CLOTHING & PERSONAL PROTECT EQUIP 48,410$ Customer Only 100% 0% 0% 0% 0% 0% 0% 0% 100%
Expense 600 WATER 29 WATER RESOUR 53051 TREATMENT CHEMICAL(NON‐TAXABLE) 736,000$ Base/Peak 0% 52% 13% 6% 29% 0% 0% 0% 100%
Expense 600 WATER 29 WATER RESOUR 53052 CLEANING CHEMICAL(TAXABLE) 240,500$ Base/Peak 0% 52% 13% 6% 29% 0% 0% 0% 100%
Expense 600 WATER 29 WATER RESOUR 53055 SAFETY & INCENTIVE AWARD 8,900$ Customer Only 100% 0% 0% 0% 0% 0% 0% 0% 100%
Expense 600 WATER 29 WATER RESOUR 53060 PHOTOGRAPHIC & DUPLICATING SUPPLIES 10,000$ Customer Only 100% 0% 0% 0% 0% 0% 0% 0% 100%
Expense 600 WATER 29 WATER RESOUR 53070 PURCHASED WATER 14,180,000$ Base/Peak 0% 52% 13% 6% 29% 0% 0% 0% 100%
Expense 600 WATER 29 WATER RESOUR 53090 OTHER OPERATING SUPPLIES 96,130$ Base/Peak 0% 52% 13% 6% 29% 0% 0% 0% 100%
Expense 600 WATER 29 WATER RESOUR 53700 GAS OIL & LUBRICANTS 8,500$ Base/Peak 0% 52% 13% 6% 29% 0% 0% 0% 100%
Expense 600 WATER 29 WATER RESOUR 53720 SMALL TOOLS & EQUIPMENT 102,300$ Base/Peak 0% 52% 13% 6% 29% 0% 0% 0% 100%
Expense 600 WATER 29 WATER RESOUR 53750 SERVICE INTERRUPTION MATERIALS 33,600$ Base/Peak 0% 52% 13% 6% 29% 0% 0% 0% 100%
Expense 600 WATER 29 WATER RESOUR 53770 MTRS TO MAINT & REPAIR BLDS & IMPR 118,100$ Base/Peak 0% 52% 13% 6% 29% 0% 0% 0% 100%
Expense 600 WATER 29 WATER RESOUR 53772 REPLACEMENT OR REPAIR 450,000$ Base/Peak 0% 52% 13% 6% 29% 0% 0% 0% 100%
Expense 600 WATER 29 WATER RESOUR 53774 FIRE HYDRANT MAINTENANCE 63,250$ Base/Peak 0% 52% 13% 6% 29% 0% 0% 0% 100%
Expense 600 WATER 29 WATER RESOUR 53780 OTHER MAINTENANCE & REPAIR SUPPLY 110,000$ Base/Peak 0% 52% 13% 6% 29% 0% 0% 0% 100%
Expense 600 WATER 29 WATER RESOUR 53793 MAT TO MAINT AND REPAIR ELEC 487,250$ Base/Peak 0% 52% 13% 6% 29% 0% 0% 0% 100%
Expense 600 WATER 29 WATER RESOUR 53794 MAT TO MAINT AND REPAIR MECH SYS 545,750$ Base/Peak 0% 52% 13% 6% 29% 0% 0% 0% 100%
Expense 600 WATER 29 WATER RESOUR 53796 IRRIGATION SITE ELECT MATERIALS 7,500$ Base/Peak 0% 52% 13% 6% 29% 0% 0% 0% 100%
Expense 600 WATER 29 WATER RESOUR 53797 IRRIGATION SITE MECH MATERIAL 20,000$ Base/Peak 0% 52% 13% 6% 29% 0% 0% 0% 100%
Expense 600 WATER 29 WATER RESOUR 53798 PRV MECHANICAL MATERIALS 168,000$ Base/Peak 0% 52% 13% 6% 29% 0% 0% 0% 100%
Expense 600 WATER 29 WATER RESOUR 53799 PRV ELECTRICAL MATERIALS 5,000$ Base/Peak 0% 52% 13% 6% 29% 0% 0% 0% 100%
Cat Fund FundName Div DivName Account AccountName
Expense 600 WATER 29 WATER RESOUR 54522 COMPUTER EQUIPMENT 3,000$ As All Other 0% 0% 0% 0% 0% 0% 0% 100% 100%
Expense 600 WATER 29 WATER RESOUR 54530 OTHER MACHINERY & EQUIPMENT 270,500$ As All Other 0% 0% 0% 0% 0% 0% 0% 100% 100%
Expense 600 WATER 29 WATER RESOUR 54710 MOTOR VEHICLES 40,000$ As All Other 0% 0% 0% 0% 0% 0% 0% 100% 100%
Franchise 600 WATER 29 WATER RESOUR 57791 TRANSFERS OUT ‐ FRANCHISE FEES 4,707,200$ As All Other 0% 0% 0% 0% 0% 0% 0% 100% 100%
Cat Fund FundName Div DivName Account AccountName
Merit 600 WATER XX NON DIVISIONA 51100 FULL‐TIME WAGES 291,445$ As All Other 0% 0% 0% 0% 0% 0% 0% 100% 100%
Citywide 600 WATER XX NON DIVISIONA 57750 CITYWIDE INDIRECT COST ALLOCATION 3,332,280$ As All Other 0% 0% 0% 0% 0% 0% 0% 100% 100%
Subtotal: O&M Expenses 58,903,643$ 4,446,786$ 22,755,544$ 5,688,886$ 2,844,443$ 12,515,549$ 1,999,010$ ‐$ 8,653,425$
Reallocation of "As All Other" 765,766 3,918,658 979,664 489,832 2,155,262 344,243 ‐ (8,653,425)
Total Reallocation O&M Expenses 58,903,643$ 5,212,552$ 26,674,202$ 6,668,550$ 3,334,275$ 14,670,811$ 2,343,253$ ‐$ ‐$
City of Scottsdale 71 Final Draft - Water Cost-of-Service Study