Embed Size (px)
Citation preview
Sauk Lake (Southwest Bay) Excess Nutrient Total Maximum Daily Load
Prepared for Sauk River Watershed District
Prepared by Minnesota Pollution Control Agency October 2016
wq-iw8-53e
2
Table of Contents TABLE OF CONTENTS ................................................................................................................................ 2
EXECUTIVE SUMMARY ............................................................................................................................. 4
1. INTRODUCTION..................................................................................................................................... 6
Purpose ................................................................................................................................................................. 6
Problem identification ........................................................................................................................................... 6
2. TARGET IDENTIFICATION AND DETERMINATION OF ENDPOINTS ............................................... 6
Minnesota water quality standards and endpoints ................................................................................................ 6
3. WATERSHED AND LAKE CHARACTERIZATION ................................................................................. 7
Sauk Lake (Southwest Bay) Watershed .................................................................................................................. 7
Land use ................................................................................................................................................................ 9
Geology and Soils ................................................................................................................................................ 10
Precipitation and Runoff ...................................................................................................................................... 10
Historical water quality data ................................................................................................................................ 11
4. NUTRIENT SOURCE ASSESSMENT .................................................................................................... 13
Introduction ......................................................................................................................................................... 13
Point Sources ....................................................................................................................................................... 14
Atmospheric deposition ....................................................................................................................................... 14
Internal Loading ................................................................................................................................................... 14
Septic Systems ..................................................................................................................................................... 14
Tributaries ........................................................................................................................................................... 14
Local Watershed .................................................................................................................................................. 15
Natural Background ............................................................................................................................................. 15
5. LINKING WATER QUALITY TARGETS AND SOURCES ..................................................................... 15
Introduction ......................................................................................................................................................... 15
Model options, setup and calibration .................................................................................................................. 16
Results ................................................................................................................................................................. 16
6. TMDL DEVELOPMENT ........................................................................................................................ 18
Introduction ......................................................................................................................................................... 18
Total loading capacity .......................................................................................................................................... 18
Wasteload allocations ......................................................................................................................................... 18
3
Load allocations ................................................................................................................................................... 18
Margin of safety .................................................................................................................................................. 19
Loading capacity .................................................................................................................................................. 19
Lake Response Variables ...................................................................................................................................... 20
Seasonal and Annual Variation ............................................................................................................................ 21
Reserve Capacity ................................................................................................................................................. 22
7. IMPLEMENTATION ACTIVITIES ......................................................................................................... 22
Introduction ......................................................................................................................................................... 22
BMP Guidance Based on Agro-ecoregion ............................................................................................................. 22
Vegetative management practices ....................................................................................................................... 24
Primary Tillage Practices ...................................................................................................................................... 24
Nutrient Management Practices .......................................................................................................................... 24
Structural Practices .............................................................................................................................................. 24
Stream and Channel Restoration ......................................................................................................................... 25
Prioritization ........................................................................................................................................................ 25
Adaptive Management ........................................................................................................................................ 26
8. REASONABLE ASSURANCE ................................................................................................................ 27
Introduction ......................................................................................................................................................... 27
Sauk River Watershed District ............................................................................................................................. 28
Stearns County Comprehensive Local Water Management Plan .......................................................................... 28
Stearns County Soil and Water Conservation District........................................................................................... 29
Monitoring .......................................................................................................................................................... 29
9. PUBLIC PARTICIPATION ..................................................................................................................... 31
10. REFERENCES ...................................................................................................................................... 31
4
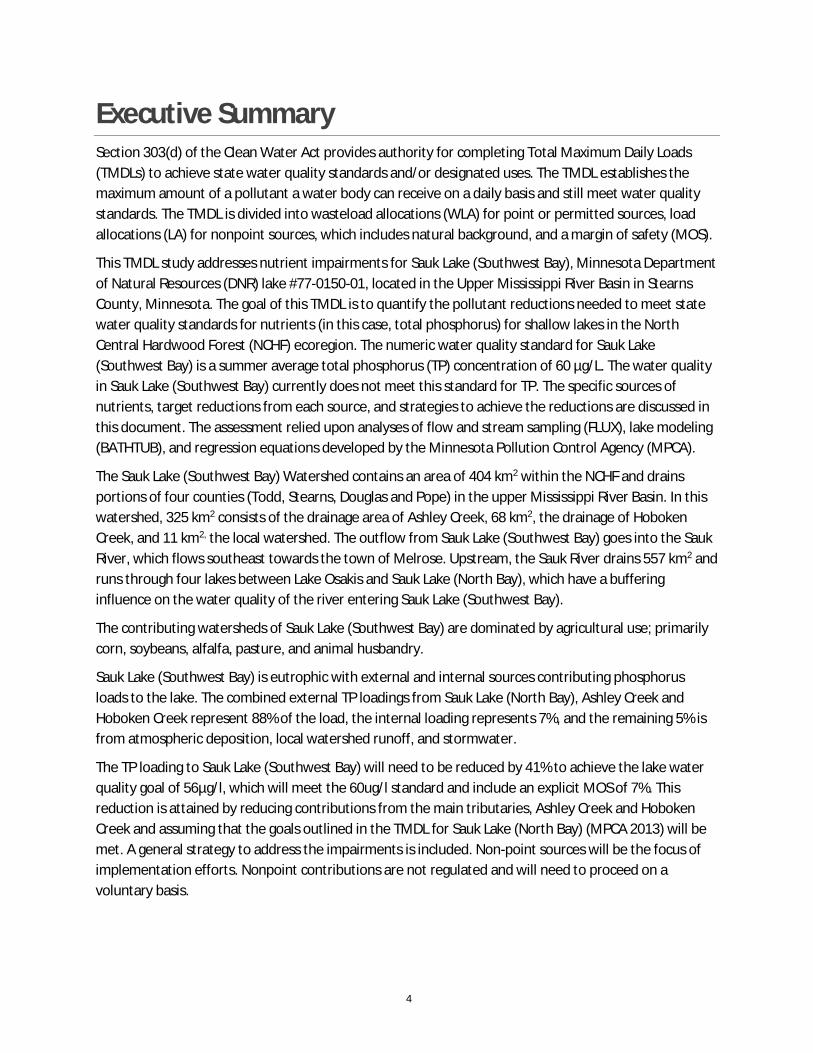
Executive Summary Section 303(d) of the Clean Water Act provides authority for completing Total Maximum Daily Loads (TMDLs) to achieve state water quality standards and/or designated uses. The TMDL establishes the maximum amount of a pollutant a water body can receive on a daily basis and still meet water quality standards. The TMDL is divided into wasteload allocations (WLA) for point or permitted sources, load allocations (LA) for nonpoint sources, which includes natural background, and a margin of safety (MOS).
This TMDL study addresses nutrient impairments for Sauk Lake (Southwest Bay), Minnesota Department of Natural Resources (DNR) lake #77-0150-01, located in the Upper Mississippi River Basin in Stearns County, Minnesota. The goal of this TMDL is to quantify the pollutant reductions needed to meet state water quality standards for nutrients (in this case, total phosphorus) for shallow lakes in the North Central Hardwood Forest (NCHF) ecoregion. The numeric water quality standard for Sauk Lake (Southwest Bay) is a summer average total phosphorus (TP) concentration of 60 µg/L. The water quality in Sauk Lake (Southwest Bay) currently does not meet this standard for TP. The specific sources of nutrients, target reductions from each source, and strategies to achieve the reductions are discussed in this document. The assessment relied upon analyses of flow and stream sampling (FLUX), lake modeling (BATHTUB), and regression equations developed by the Minnesota Pollution Control Agency (MPCA).
The Sauk Lake (Southwest Bay) Watershed contains an area of 404 km2 within the NCHF and drains portions of four counties (Todd, Stearns, Douglas and Pope) in the upper Mississippi River Basin. In this watershed, 325 km2 consists of the drainage area of Ashley Creek, 68 km2, the drainage of Hoboken Creek, and 11 km2, the local watershed. The outflow from Sauk Lake (Southwest Bay) goes into the Sauk River, which flows southeast towards the town of Melrose. Upstream, the Sauk River drains 557 km2 and runs through four lakes between Lake Osakis and Sauk Lake (North Bay), which have a buffering influence on the water quality of the river entering Sauk Lake (Southwest Bay).
The contributing watersheds of Sauk Lake (Southwest Bay) are dominated by agricultural use; primarily corn, soybeans, alfalfa, pasture, and animal husbandry.
Sauk Lake (Southwest Bay) is eutrophic with external and internal sources contributing phosphorus loads to the lake. The combined external TP loadings from Sauk Lake (North Bay), Ashley Creek and Hoboken Creek represent 88% of the load, the internal loading represents 7%, and the remaining 5% is from atmospheric deposition, local watershed runoff, and stormwater.
The TP loading to Sauk Lake (Southwest Bay) will need to be reduced by 41% to achieve the lake water quality goal of 56µg/l, which will meet the 60ug/l standard and include an explicit MOS of 7%. This reduction is attained by reducing contributions from the main tributaries, Ashley Creek and Hoboken Creek and assuming that the goals outlined in the TMDL for Sauk Lake (North Bay) (MPCA 2013) will be met. A general strategy to address the impairments is included. Non-point sources will be the focus of implementation efforts. Nonpoint contributions are not regulated and will need to proceed on a voluntary basis.
5
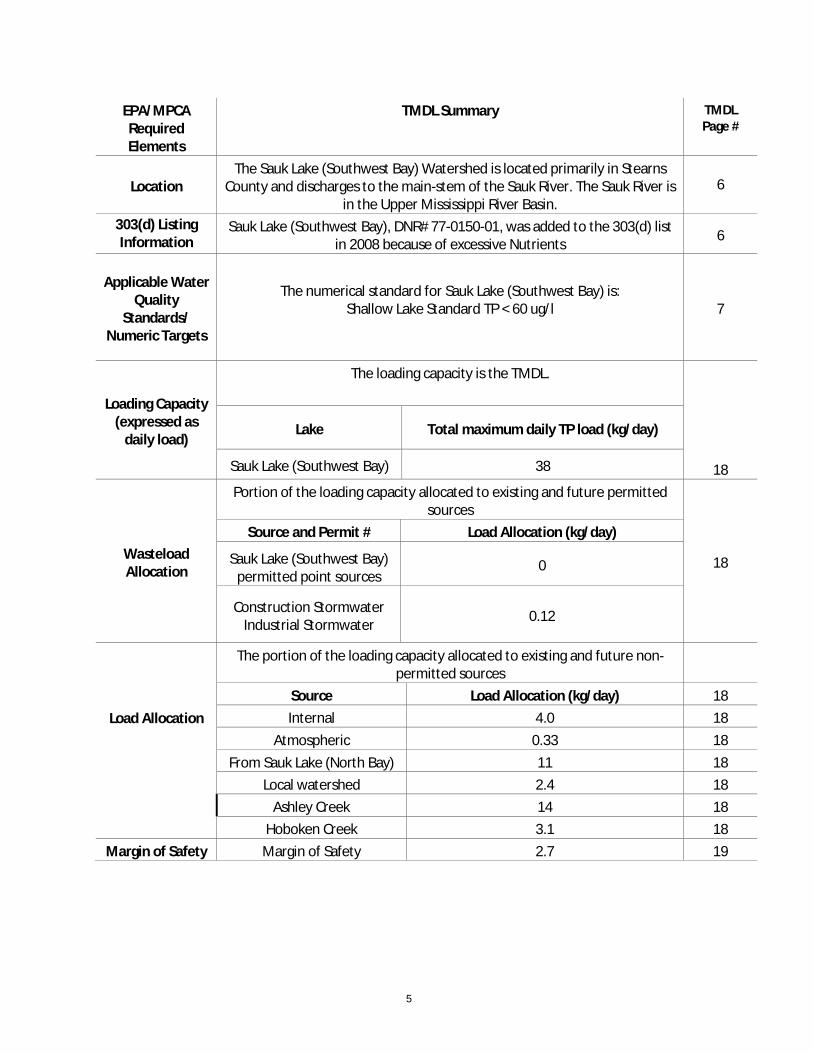
EPA/MPCA Required Elements
TMDL Summary TMDL Page #
Location The Sauk Lake (Southwest Bay) Watershed is located primarily in Stearns
County and discharges to the main-stem of the Sauk River. The Sauk River is in the Upper Mississippi River Basin.
6
303(d) Listing Information
Sauk Lake (Southwest Bay), DNR# 77-0150-01, was added to the 303(d) list in 2008 because of excessive Nutrients 6
Applicable Water Quality
Standards/ Numeric Targets
The numerical standard for Sauk Lake (Southwest Bay) is: Shallow Lake Standard TP < 60 ug/l
7
Loading Capacity (expressed as
daily load)
The loading capacity is the TMDL.
18
Lake Total maximum daily TP load (kg/day)
Sauk Lake (Southwest Bay) 38
Wasteload Allocation
Portion of the loading capacity allocated to existing and future permitted sources
18
Source and Permit # Load Allocation (kg/day)
Sauk Lake (Southwest Bay) permitted point sources
0
Construction Stormwater Industrial Stormwater 0.12
Load Allocation
The portion of the loading capacity allocated to existing and future non-permitted sources
Source Load Allocation (kg/day) 18 Internal 4.0 18
Atmospheric 0.33 18 From Sauk Lake (North Bay) 11 18
Local watershed 2.4 18 Ashley Creek 14 18 Hoboken Creek 3.1 18
Margin of Safety Margin of Safety 2.7 19
6
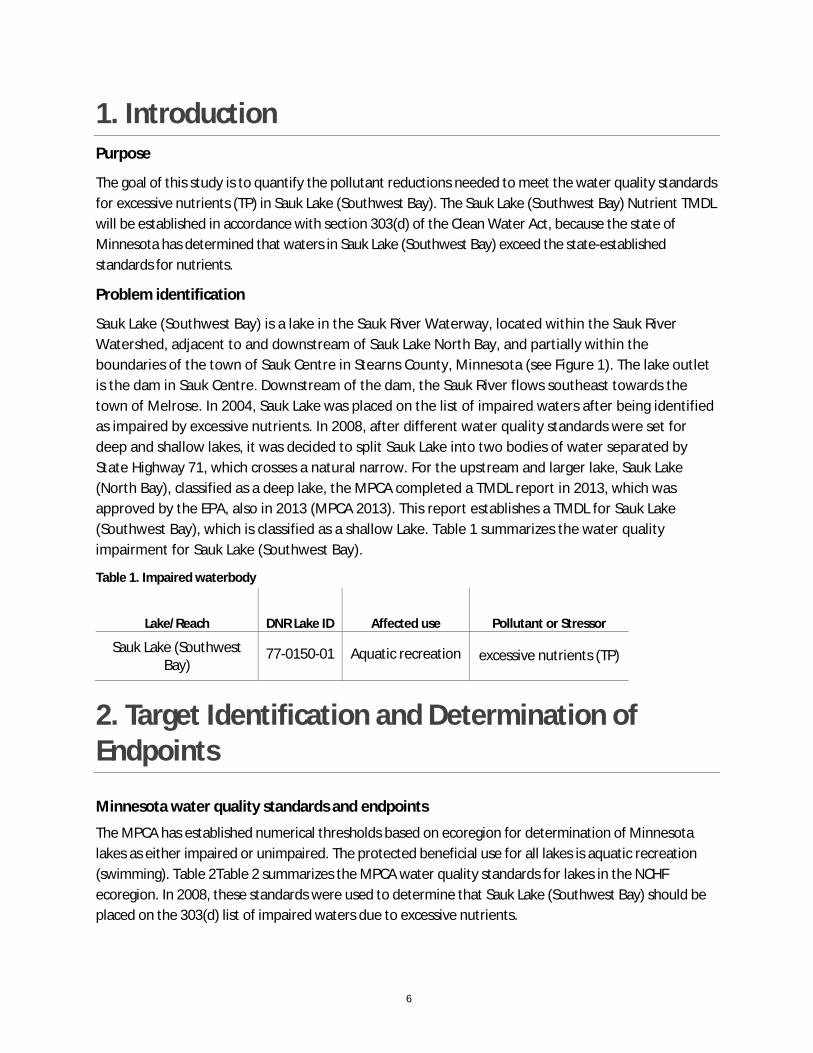
1. Introduction Purpose
The goal of this study is to quantify the pollutant reductions needed to meet the water quality standards for excessive nutrients (TP) in Sauk Lake (Southwest Bay). The Sauk Lake (Southwest Bay) Nutrient TMDL will be established in accordance with section 303(d) of the Clean Water Act, because the state of Minnesota has determined that waters in Sauk Lake (Southwest Bay) exceed the state-established standards for nutrients.
Problem identification
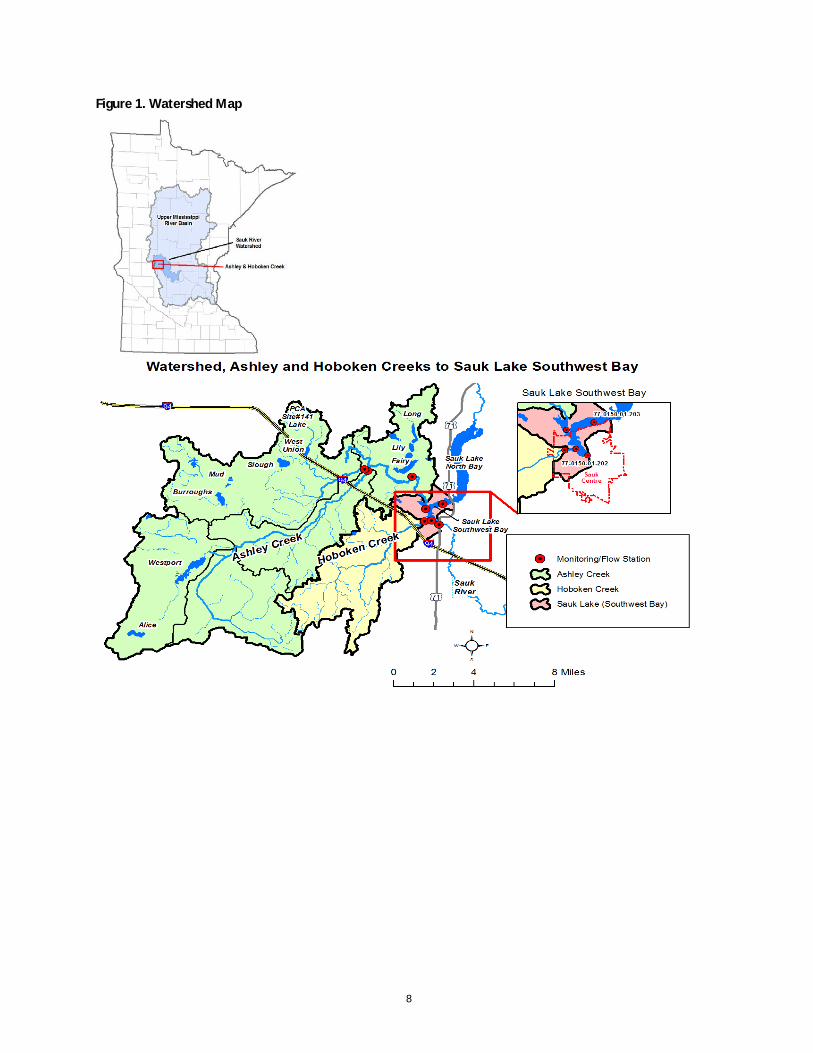
Sauk Lake (Southwest Bay) is a lake in the Sauk River Waterway, located within the Sauk River Watershed, adjacent to and downstream of Sauk Lake North Bay, and partially within the boundaries of the town of Sauk Centre in Stearns County, Minnesota (see Figure 1). The lake outlet is the dam in Sauk Centre. Downstream of the dam, the Sauk River flows southeast towards the town of Melrose. In 2004, Sauk Lake was placed on the list of impaired waters after being identified as impaired by excessive nutrients. In 2008, after different water quality standards were set for deep and shallow lakes, it was decided to split Sauk Lake into two bodies of water separated by State Highway 71, which crosses a natural narrow. For the upstream and larger lake, Sauk Lake (North Bay), classified as a deep lake, the MPCA completed a TMDL report in 2013, which was approved by the EPA, also in 2013 (MPCA 2013). This report establishes a TMDL for Sauk Lake (Southwest Bay), which is classified as a shallow Lake. Table 1 summarizes the water quality impairment for Sauk Lake (Southwest Bay).
Table 1. Impaired waterbody
Lake/Reach DNR Lake ID Affected use Pollutant or Stressor
Sauk Lake (Southwest Bay)
77-0150-01
Aquatic recreation
excessive nutrients (TP)
2. Target Identification and Determination of Endpoints
Minnesota water quality standards and endpoints
The MPCA has established numerical thresholds based on ecoregion for determination of Minnesota lakes as either impaired or unimpaired. The protected beneficial use for all lakes is aquatic recreation (swimming). Table 2Table 2 summarizes the MPCA water quality standards for lakes in the NCHF ecoregion. In 2008, these standards were used to determine that Sauk Lake (Southwest Bay) should be placed on the 303(d) list of impaired waters due to excessive nutrients.
7
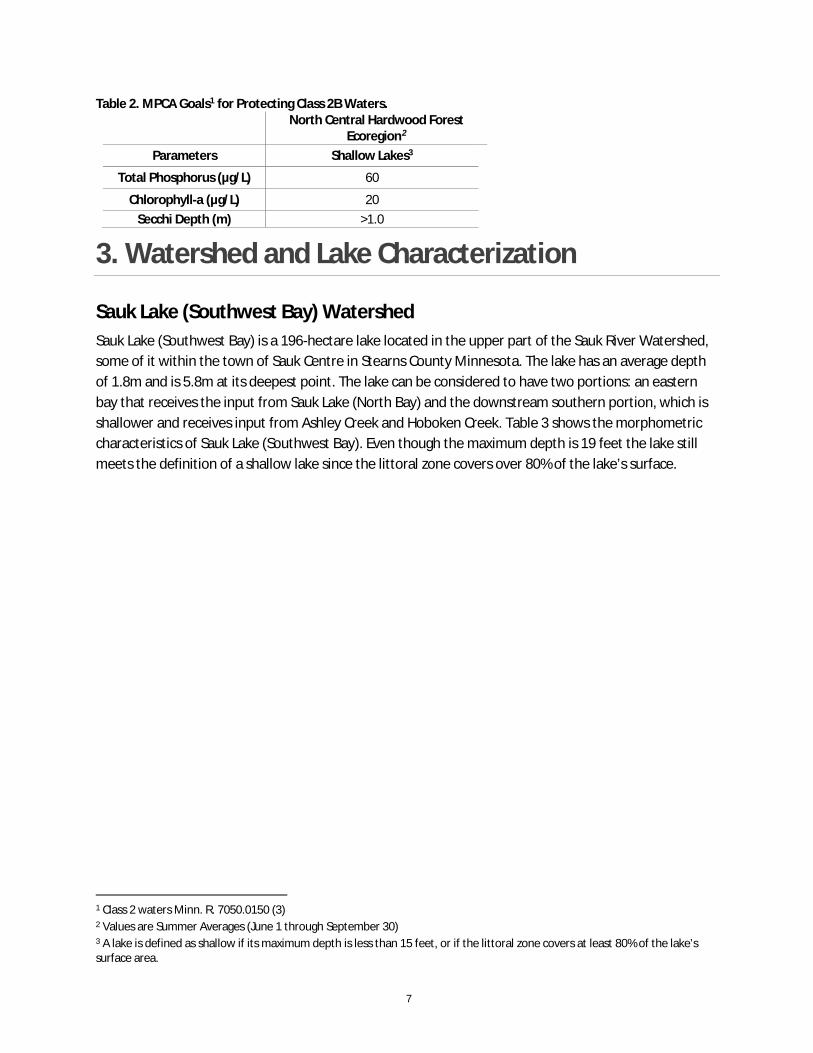
Table 2. MPCA Goals1 for Protecting Class 2B Waters.
North Central Hardwood Forest Ecoregion2
Parameters Shallow Lakes3
Total Phosphorus (µg/L) 60
Chlorophyll-a (µg/L) 20 Secchi Depth (m) >1.0
3. Watershed and Lake Characterization
Sauk Lake (Southwest Bay) Watershed Sauk Lake (Southwest Bay) is a 196-hectare lake located in the upper part of the Sauk River Watershed, some of it within the town of Sauk Centre in Stearns County Minnesota. The lake has an average depth of 1.8m and is 5.8m at its deepest point. The lake can be considered to have two portions: an eastern bay that receives the input from Sauk Lake (North Bay) and the downstream southern portion, which is shallower and receives input from Ashley Creek and Hoboken Creek. Table 3 shows the morphometric characteristics of Sauk Lake (Southwest Bay). Even though the maximum depth is 19 feet the lake still meets the definition of a shallow lake since the littoral zone covers over 80% of the lake’s surface.
1 Class 2 waters Minn. R. 7050.0150 (3) 2 Values are Summer Averages (June 1 through September 30) 3 A lake is defined as shallow if its maximum depth is less than 15 feet, or if the littoral zone covers at least 80% of the lake’s surface area.
8
Figure 1. Watershed Map
9
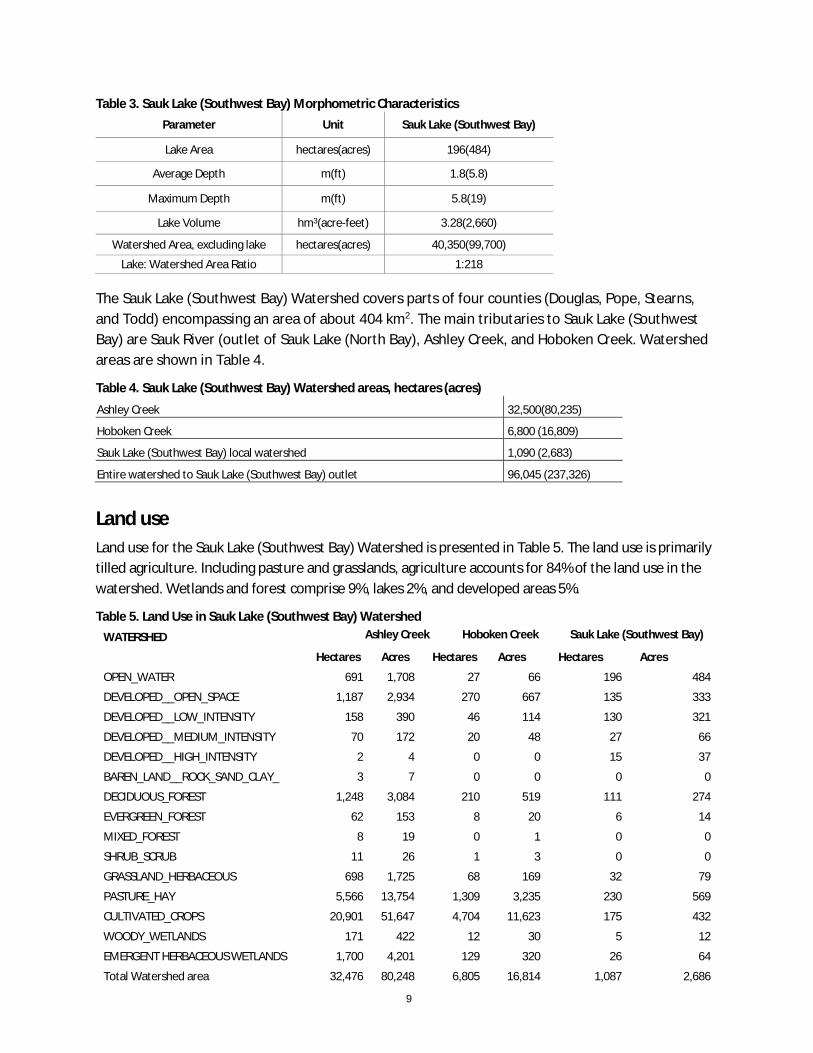
Table 3. Sauk Lake (Southwest Bay) Morphometric Characteristics Parameter Unit Sauk Lake (Southwest Bay)
Lake Area hectares(acres) 196(484)
Average Depth m(ft) 1.8(5.8)
Maximum Depth m(ft) 5.8(19)
Lake Volume hm3(acre-feet) 3.28(2,660)
Watershed Area, excluding lake hectares(acres) 40,350(99,700)
Lake: Watershed Area Ratio 1:218
The Sauk Lake (Southwest Bay) Watershed covers parts of four counties (Douglas, Pope, Stearns, and Todd) encompassing an area of about 404 km2. The main tributaries to Sauk Lake (Southwest Bay) are Sauk River (outlet of Sauk Lake (North Bay), Ashley Creek, and Hoboken Creek. Watershed areas are shown in Table 4.
Table 4. Sauk Lake (Southwest Bay) Watershed areas, hectares (acres) Ashley Creek 32,500(80,235)
Hoboken Creek 6,800 (16,809)
Sauk Lake (Southwest Bay) local watershed 1,090 (2,683)
Entire watershed to Sauk Lake (Southwest Bay) outlet 96,045 (237,326)
Land use Land use for the Sauk Lake (Southwest Bay) Watershed is presented in Table 5. The land use is primarily tilled agriculture. Including pasture and grasslands, agriculture accounts for 84% of the land use in the watershed. Wetlands and forest comprise 9%, lakes 2%, and developed areas 5%.
Table 5. Land Use in Sauk Lake (Southwest Bay) Watershed WATERSHED Ashley Creek Hoboken Creek Sauk Lake (Southwest Bay)
Hectares Acres Hectares Acres Hectares Acres
OPEN_WATER 691 1,708 27 66 196 484
DEVELOPED__OPEN_SPACE 1,187 2,934 270 667 135 333
DEVELOPED__LOW_INTENSITY 158 390 46 114 130 321
DEVELOPED__MEDIUM_INTENSITY 70 172 20 48 27 66
DEVELOPED__HIGH_INTENSITY 2 4 0 0 15 37
BAREN_LAND__ROCK_SAND_CLAY_ 3 7 0 0 0 0
DECIDUOUS_FOREST 1,248 3,084 210 519 111 274
EVERGREEN_FOREST 62 153 8 20 6 14
MIXED_FOREST 8 19 0 1 0 0
SHRUB_SCRUB 11 26 1 3 0 0
GRASSLAND_HERBACEOUS 698 1,725 68 169 32 79
PASTURE_HAY 5,566 13,754 1,309 3,235 230 569
CULTIVATED_CROPS 20,901 51,647 4,704 11,623 175 432
WOODY_WETLANDS 171 422 12 30 5 12
EMERGENT HERBACEOUS WETLANDS 1,700 4,201 129 320 26 64
Total Watershed area 32,476 80,248 6,805 16,814 1,087 2,686
10
Geology and Soils The Sauk River Watershed District (SRWD) contains a variety of soil types and geologic features due in part to the large size of the District, as well as the glacial activity which occurred to form the area. The Sauk River flows in an interglacial stream that was created by a bed of glacial outwash.
The Sauk River Watershed lies in the central portion of Minnesota’s NCHF Ecoregion (Omernik 1988). The NCHF is dominated by glacial sediments deposited by the Des Moines Lobe of the Wisconsin glaciation approximately 12,000 years ago. Glacial till and drift dominate the landscape with outwash deposits in much of the river valley. Outwash deposits are predominately sand and gravel. Soils are classified as Mollisols and Alfisols. Till and drift contain high clay and silt fractions. The soils of the watershed are sandy or loamy, and underlie a level-to-rolling savannah consisting of prairie grass and oak openings. Many of the soil associations within the watershed are poorly drained and result in numerous wetland areas.
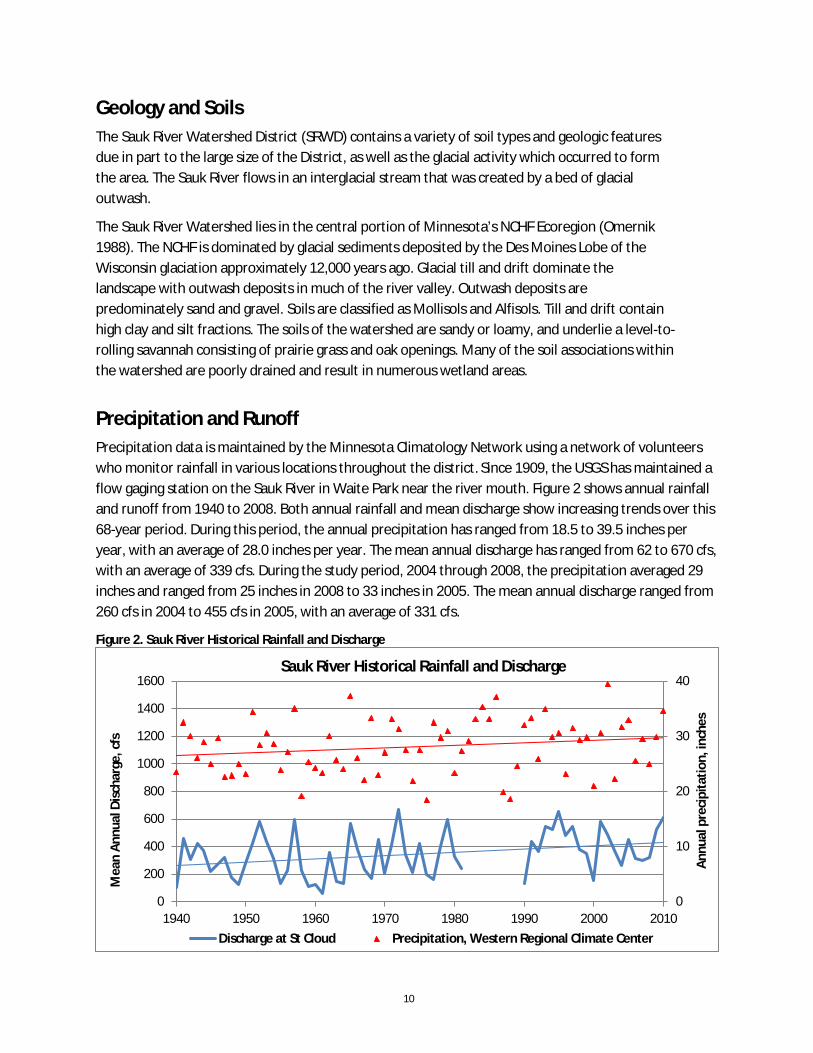
Precipitation and Runoff Precipitation data is maintained by the Minnesota Climatology Network using a network of volunteers who monitor rainfall in various locations throughout the district. Since 1909, the USGS has maintained a flow gaging station on the Sauk River in Waite Park near the river mouth. Figure 2 shows annual rainfall and runoff from 1940 to 2008. Both annual rainfall and mean discharge show increasing trends over this 68-year period. During this period, the annual precipitation has ranged from 18.5 to 39.5 inches per year, with an average of 28.0 inches per year. The mean annual discharge has ranged from 62 to 670 cfs, with an average of 339 cfs. During the study period, 2004 through 2008, the precipitation averaged 29 inches and ranged from 25 inches in 2008 to 33 inches in 2005. The mean annual discharge ranged from 260 cfs in 2004 to 455 cfs in 2005, with an average of 331 cfs.
Figure 2. Sauk River Historical Rainfall and Discharge
0
10
20
30
40
0
200
400
600
800
1000
1200
1400
1600
1940 1950 1960 1970 1980 1990 2000 2010
Annu
al p
reci
pita
tion,
inch
es
Mea
n An
nual
Dis
char
ge, c
fs
Sauk River Historical Rainfall and Discharge
Discharge at St Cloud Precipitation, Western Regional Climate Center
11
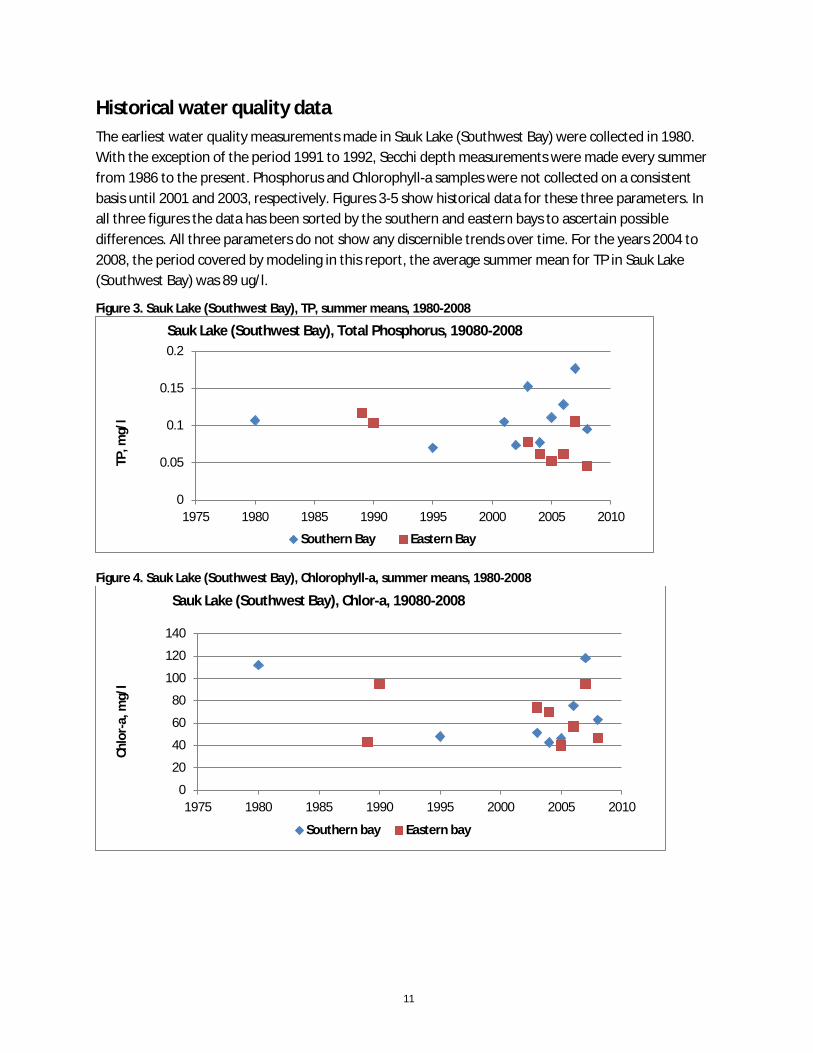
Historical water quality data The earliest water quality measurements made in Sauk Lake (Southwest Bay) were collected in 1980. With the exception of the period 1991 to 1992, Secchi depth measurements were made every summer from 1986 to the present. Phosphorus and Chlorophyll-a samples were not collected on a consistent basis until 2001 and 2003, respectively. Figures 3-5 show historical data for these three parameters. In all three figures the data has been sorted by the southern and eastern bays to ascertain possible differences. All three parameters do not show any discernible trends over time. For the years 2004 to 2008, the period covered by modeling in this report, the average summer mean for TP in Sauk Lake (Southwest Bay) was 89 ug/l.
Figure 3. Sauk Lake (Southwest Bay), TP, summer means, 1980-2008
Figure 4. Sauk Lake (Southwest Bay), Chlorophyll-a, summer means, 1980-2008
0
0.05
0.1
0.15
0.2
1975 1980 1985 1990 1995 2000 2005 2010
TP, m
g/l
Sauk Lake (Southwest Bay), Total Phosphorus, 19080-2008
Southern Bay Eastern Bay
0
20
40
60
80
100
120
140
1975 1980 1985 1990 1995 2000 2005 2010
Chlo
r-a,
mg/
l
Sauk Lake (Southwest Bay), Chlor-a, 19080-2008
Southern bay Eastern bay
12
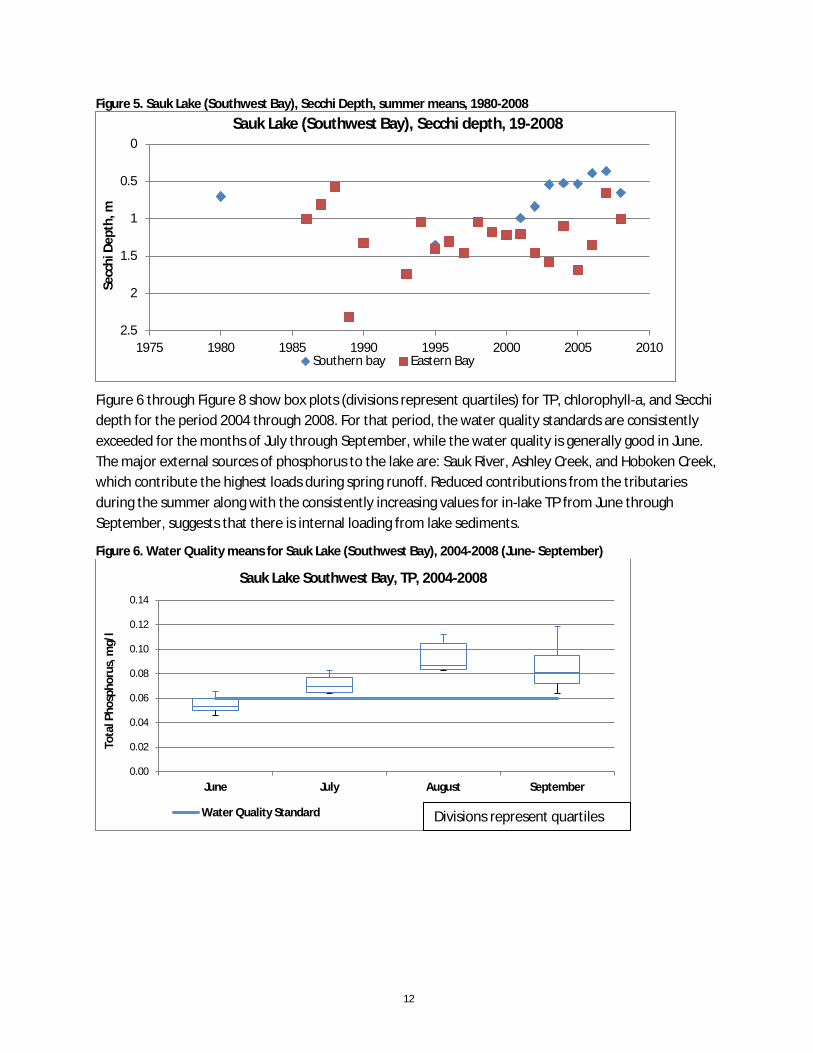
Figure 5. Sauk Lake (Southwest Bay), Secchi Depth, summer means, 1980-2008
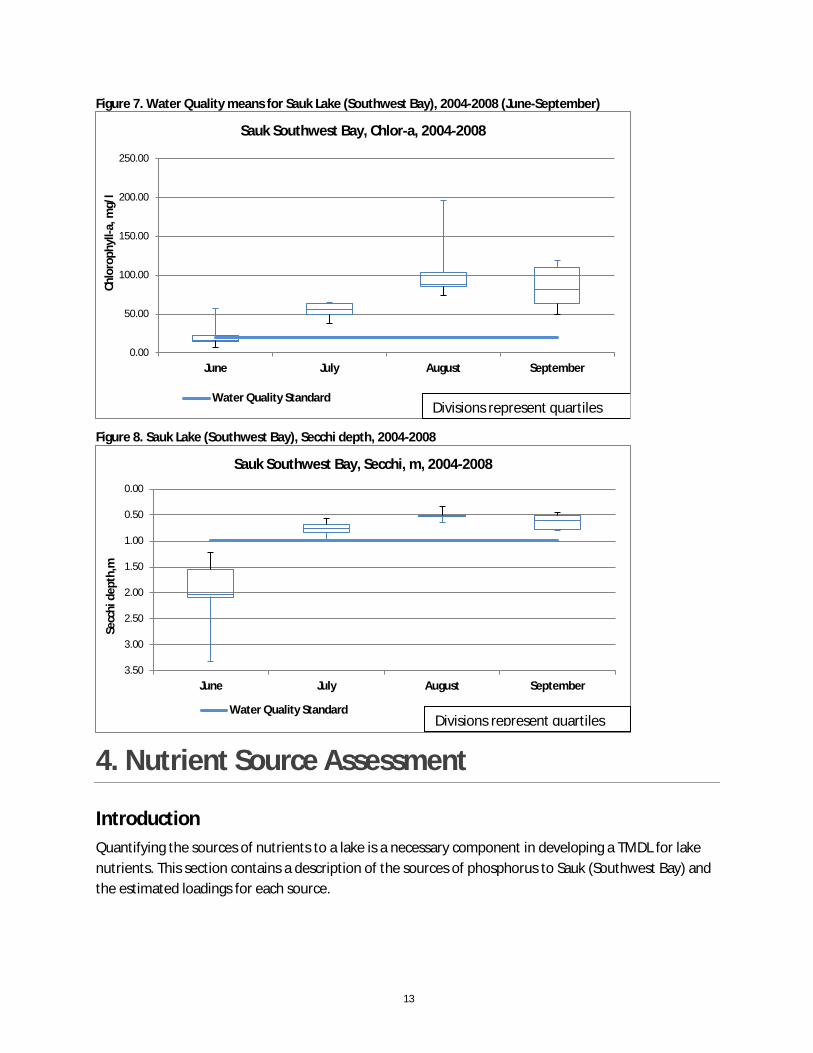
Figure 6 through Figure 8 show box plots (divisions represent quartiles) for TP, chlorophyll-a, and Secchi depth for the period 2004 through 2008. For that period, the water quality standards are consistently exceeded for the months of July through September, while the water quality is generally good in June. The major external sources of phosphorus to the lake are: Sauk River, Ashley Creek, and Hoboken Creek, which contribute the highest loads during spring runoff. Reduced contributions from the tributaries during the summer along with the consistently increasing values for in-lake TP from June through September, suggests that there is internal loading from lake sediments.
Figure 6. Water Quality means for Sauk Lake (Southwest Bay), 2004-2008 (June- September)
0
0.5
1
1.5
2
2.51975 1980 1985 1990 1995 2000 2005 2010
Secc
hi D
epth
, mSauk Lake (Southwest Bay), Secchi depth, 19-2008
Southern bay Eastern Bay
0.00
0.02
0.04
0.06
0.08
0.10
0.12
0.14
June July August September
Tota
l Pho
spho
rus,
mg/
l
Sauk Lake Southwest Bay, TP, 2004-2008
Water Quality Standard Divisions represent quartiles
13
Figure 7. Water Quality means for Sauk Lake (Southwest Bay), 2004-2008 (June-September)
Figure 8. Sauk Lake (Southwest Bay), Secchi depth, 2004-2008
4. Nutrient Source Assessment
Introduction Quantifying the sources of nutrients to a lake is a necessary component in developing a TMDL for lake nutrients. This section contains a description of the sources of phosphorus to Sauk (Southwest Bay) and the estimated loadings for each source.
0.00
50.00
100.00
150.00
200.00
250.00
June July August September
Chlo
roph
yll-a
, mg/
l
Sauk Southwest Bay, Chlor-a, 2004-2008
Water Quality StandardDivisions represent quartiles
0.00
0.50
1.00
1.50
2.00
2.50
3.00
3.50June July August September
Secc
hi d
epth
,m
Sauk Southwest Bay, Secchi, m, 2004-2008
Water Quality StandardDivisions represent quartiles
14
Point Sources There are no permitted stormwater or municipal wastewater effluent sources in the Sauk Lake (Southwest Bay) Watershed. There is one permitted industrial wastewater discharger to Hoboken Creek, a petroleum storage facility. This facility has authority to discharge tank condensate and waters used for cleaning. The discharge is not expected to contain phosphorus, therefore a WLA is not needed for this facility. For this TMDL, to comply with established TMDL protocols, 0.1% of the total watershed load will be assigned to both industrial stormwater and construction stormwater.
Atmospheric deposition Precipitation contains phosphorus that can ultimately end up in the lakes as a result of direct input on the lake surface. Although atmospheric inputs must be accounted for in development of a nutrient budget, direct inputs to the lake surface are impossible to control. For use in this analysis, an atmospheric loading rate of 69 kg/km2/yr is assumed, which corresponds with the average value suggested in the BATHTUB lake response model (Walker 1996). Using this loading rate, Sauk Lake (Southwest Bay) receives 23 kg of TP from atmospheric deposition during the June to September period.
Internal Loading Internal loading refers to the recycling and re-suspension into the water column of phosphorus contained in lake bed sediments and organic matter. In 2007, Barr Engineering Company conducted a study (Barr 2007) to determine the amount of phosphorus loading being contributed to the water column by release from bottom sediments during anoxic conditions. They collected sediment cores in Sauk Lake (Southwest Bay) to determine the spatial distribution of phosphorus in the lake bottom sediments. The study estimated that, for 2007, 1435 kg of phosphorus was released to the top two meters in Sauk Lake (Southwest Bay).
Septic Systems During the mid-1990s, a septic system survey was done under contract with SRWD. It was found that 70% of the septic systems around Sauk Lake were out of compliance. Currently, all lake shore properties within the city of Sauk Centre are hooked up to a sewer system. The lake shore septic systems that are not within city boundaries that were failing at the time of the survey have since been brought into compliance (communication with SRWD, Stearns County Environmental Services May 2012). Thus, these septic systems do not appear to be a source of nutrients to the lake. By law, septic systems cannot discharge to surface waters; hence, for this TMDL, septic systems are assigned an allowable load of zero kilograms per year.
Tributaries To represent the phosphorus contribution from Sauk Lake (North Bay) the average load from that source was determined by the value for advective outflow resulting from the modeling done for the Sauk Lake (North Bay) TMDL (MPCA 2013). For Hoboken Creek and Ashley Creek, FLUX was used to estimate
15
average annual phosphorus loads to the lake. For both creeks the data used in these calculations were from 2004 through 2008 to be consistent with the data used for estimating lake concentrations. However, for Ashley creek, data for 2004 through 2006 was not available. The resulting FLUX derived flow weighted mean concentrations were 188 ug/l and 294 ug/l for Ashley Creek and Hoboken Creek respectively.
Local Watershed The local watershed contains 1273 acres of urban developed area and 1410 acres of rural/semi-developed area. To represent this source, the contributing areas, rainfall runoff amounts, and phosphorus concentrations were entered into BATHTUB. The concentration values used for TP were 300ug/l for urban areas and 200ug/l for rural/semi-developed areas. These values are on the high end of ranges reported in recent studies (MPCA 2008).
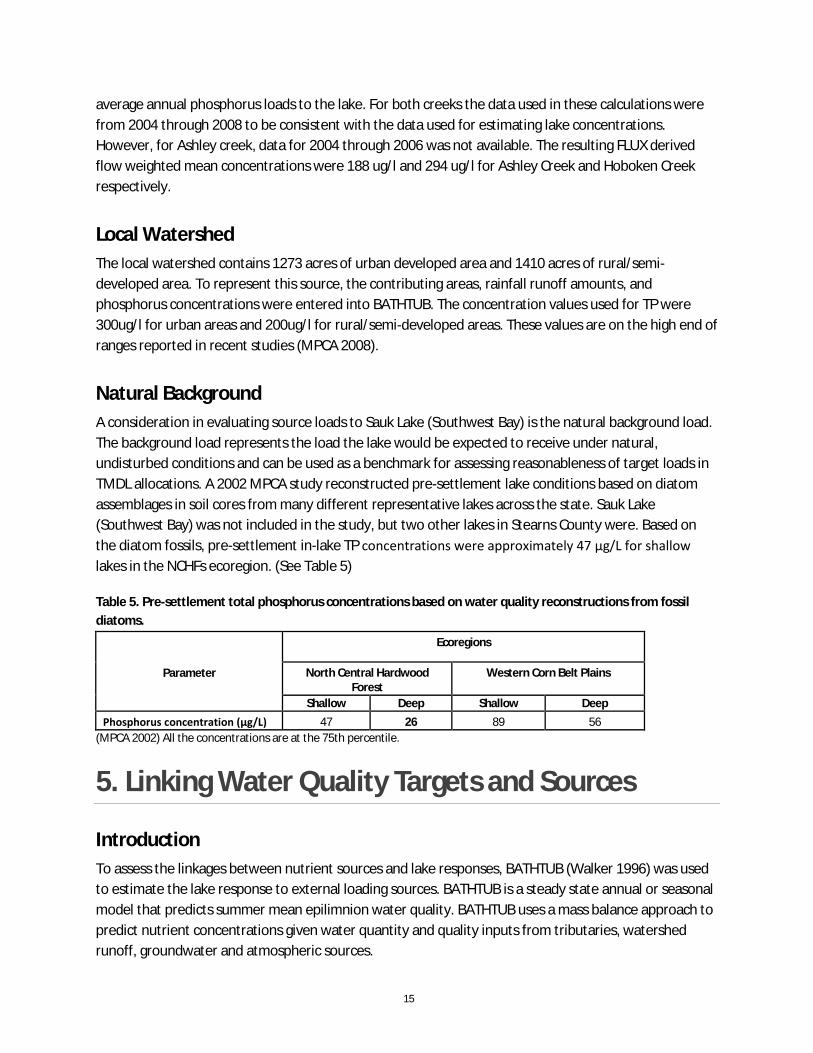
Natural Background A consideration in evaluating source loads to Sauk Lake (Southwest Bay) is the natural background load. The background load represents the load the lake would be expected to receive under natural, undisturbed conditions and can be used as a benchmark for assessing reasonableness of target loads in TMDL allocations. A 2002 MPCA study reconstructed pre-settlement lake conditions based on diatom assemblages in soil cores from many different representative lakes across the state. Sauk Lake (Southwest Bay) was not included in the study, but two other lakes in Stearns County were. Based on the diatom fossils, pre-settlement in-lake TP concentrations were approximately 47 μg/L for shallow lakes in the NCHFs ecoregion. (See Table 5)
Table 5. Pre-settlement total phosphorus concentrations based on water quality reconstructions from fossil diatoms.
Parameter
Ecoregions
North Central Hardwood Forest
Western Corn Belt Plains
Shallow Deep Shallow Deep Phosphorus concentration (μg/L) 47 26 89 56
(MPCA 2002) All the concentrations are at the 75th percentile.
5. Linking Water Quality Targets and Sources
Introduction To assess the linkages between nutrient sources and lake responses, BATHTUB (Walker 1996) was used to estimate the lake response to external loading sources. BATHTUB is a steady state annual or seasonal model that predicts summer mean epilimnion water quality. BATHTUB uses a mass balance approach to predict nutrient concentrations given water quantity and quality inputs from tributaries, watershed runoff, groundwater and atmospheric sources.
16
Model options, setup and calibration The data set for the lake averaged less than six samples per June through September period. This does not supply adequate information to model individual years for the purpose of comparing year by year results. It was determined that the best approach would be to average all the data for the years 2004 through 2008 (June through September) and input those values as lake parameter observations. The input from tributaries was obtained by using the model FLUX (Walker 1983) to estimate the annual flow weighted mean concentration (FWMC) using all the data from the same period of years. Contributions from local watershed runoff, precipitation, and estimated internal loading were also included.
Lake bathymetry parameters for a two segment (for the eastern and southern bays) model were determined using a map from the DNR LakeFinder database. For TP, the Canfield Bachman Reservoir model was used. Nitrogen was not simulated because phosphorus is the nutrient of concern. BATHTUB uses estimated concentrations to generate mass balance tables.
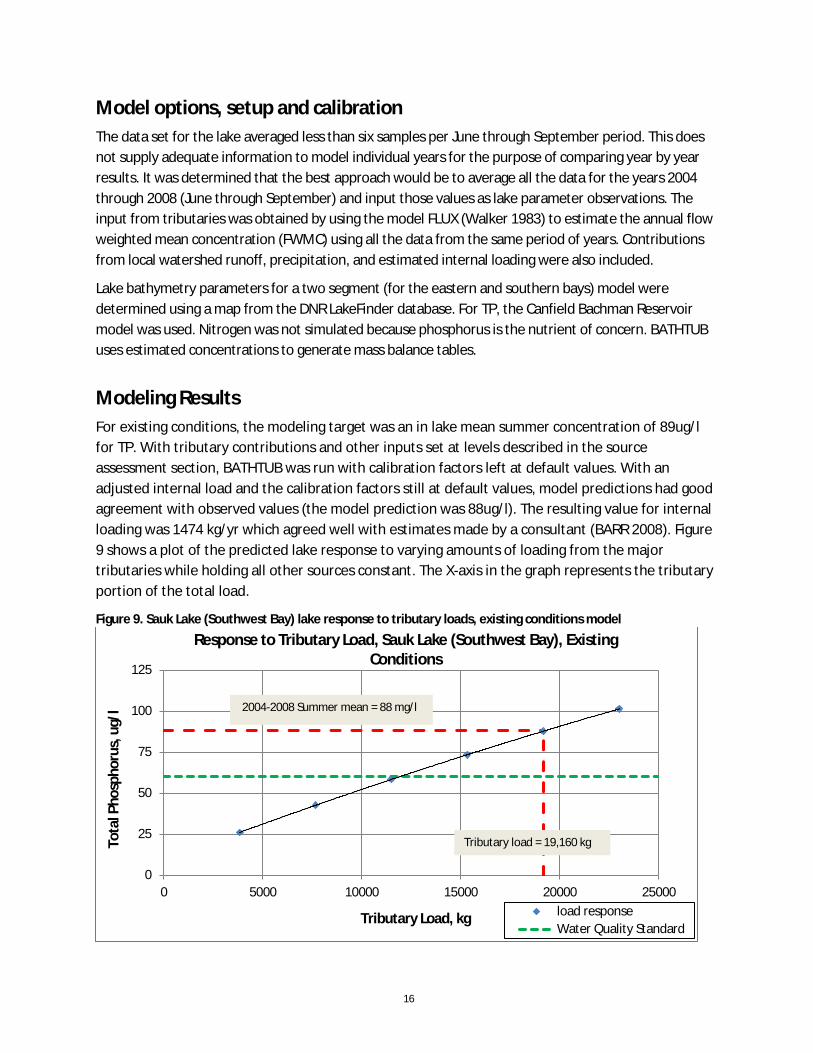
Modeling Results For existing conditions, the modeling target was an in lake mean summer concentration of 89ug/l for TP. With tributary contributions and other inputs set at levels described in the source assessment section, BATHTUB was run with calibration factors left at default values. With an adjusted internal load and the calibration factors still at default values, model predictions had good agreement with observed values (the model prediction was 88ug/l). The resulting value for internal loading was 1474 kg/yr which agreed well with estimates made by a consultant (BARR 2008). Figure 9 shows a plot of the predicted lake response to varying amounts of loading from the major tributaries while holding all other sources constant. The X-axis in the graph represents the tributary portion of the total load.
Figure 9. Sauk Lake (Southwest Bay) lake response to tributary loads, existing conditions model
0
25
50
75
100
125
0 5000 10000 15000 20000 25000
Tota
l Pho
spho
rus,
ug/
l
Tributary Load, kg
Response to Tributary Load, Sauk Lake (Southwest Bay), Existing Conditions
load responseWater Quality Standard
2004-2008 Summer mean = 88 mg/l
Tributary load = 19,160 kg
17
After the BATHTUB model was set up and calibrated for existing conditions, the next step was to select scenarios that would enable developing a TMDL for the lake. Initially, a target of 57ug/l of TP for in lake mean summer concentration was the goal. This was to enable inclusion of an explicit 5% MOS.
The first step in considering load reduction scenarios was to set external sources at required limits where appropriate. The Sauk (North Bay) TMDL study (MPCA 2013) recommendation was to attain an in-lake summer concentration of 38 ug/l of TP for Sauk (North Bay). Thus, to represent the load from Sauk Lake (North Bay), the average TP concentration in the discharge from Sauk (North Bay) to Sauk (Southwest Bay) was set at 38ug/l.
Recently, the MPCA has adopted a standard of 100 ug/l average TP concentrations for rivers in the NCHF ecoregion. Thus for Ashley Creek and Hoboken Creek the allowable average TP concentration was set at 100 ug/l.
TP contributions from local watershed runoff and internal loading were left at the same levels as for the existing conditions model.
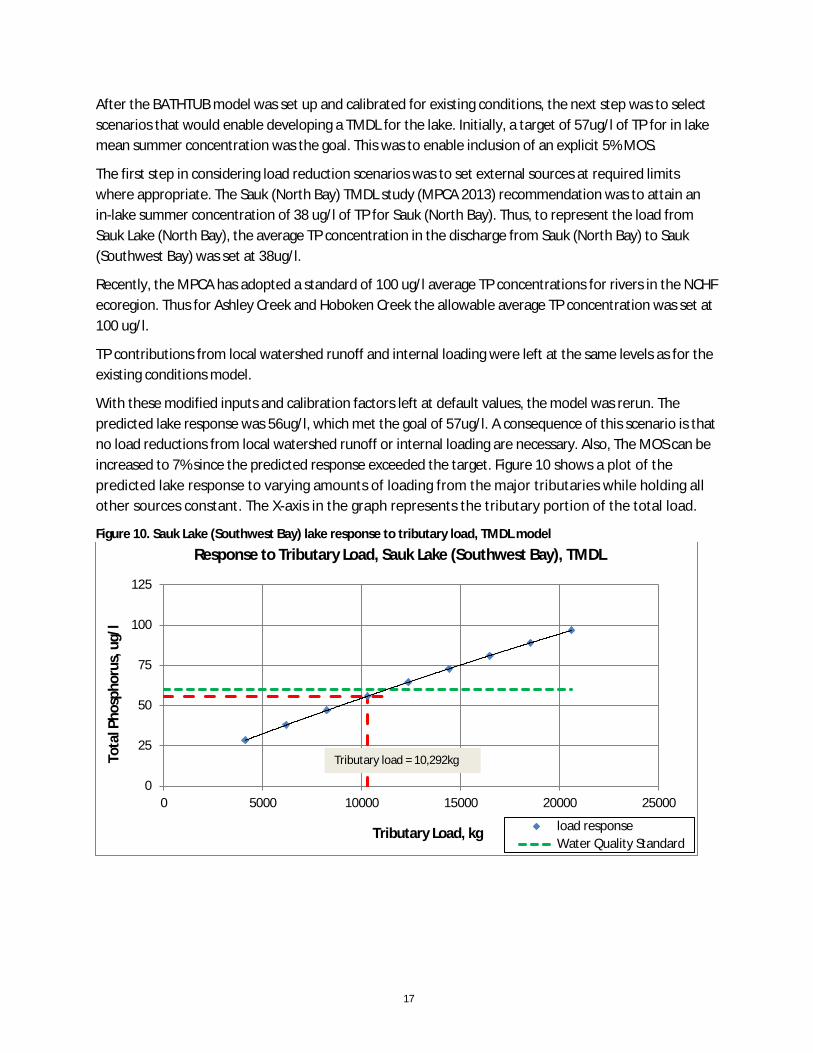
With these modified inputs and calibration factors left at default values, the model was rerun. The predicted lake response was 56ug/l, which met the goal of 57ug/l. A consequence of this scenario is that no load reductions from local watershed runoff or internal loading are necessary. Also, The MOS can be increased to 7% since the predicted response exceeded the target. Figure 10 shows a plot of the predicted lake response to varying amounts of loading from the major tributaries while holding all other sources constant. The X-axis in the graph represents the tributary portion of the total load.
Figure 10. Sauk Lake (Southwest Bay) lake response to tributary load, TMDL model
0
25
50
75
100
125
0 5000 10000 15000 20000 25000
Tota
l Pho
spho
rus,
ug/
l
Tributary Load, kg
Response to Tributary Load, Sauk Lake (Southwest Bay), TMDL
load responseWater Quality Standard
Tributary load = 10,292kg
18
6. TMDL Development
Introduction The TMDLs are expressed as mass (in this case, phosphorus, in kg/day) per unit time. Phosphorus is the constituent of interest for this TMDL since it is the limiting nutrient that enables excessive growth of aquatic algae. The TMDL equation is:
TMDL = WLA + LA + MOS, where
The WLA is the wasteload allocation for point sources, LA is the load allocation for non-point sources, and MOS is the margin of safety. The units required by the U.S. Environmental Protection Agency (EPA) are mass/day. In this report, units of mass/year will also be presented.
Total loading capacity The loading capacity is defined as the maximum pollutant load that a water body can receive, and still maintain compliance with water quality standards. This was determined by running the model with reduced external and internal loads until predictions met the standard. For Sauk Lake (Southwest Bay), with the major external sources set at recommended levels and no reduction in internal loading, the lake water quality goal of 60ug/l was met, which included a 7% MOS. After a model was constructed that predicted attainment of the water quality goal, the lake’s total loading capacity was derived by summing all of the internal and external loads.
Wasteload allocations The WLA includes permitted discharges from WWTPs, industrial sources and stormwater sources (MS4s). In the Sauk Lake (Southwest Bay) Watershed, there are no permitted discharges of these types. To comply with suggested protocol, a loading of 0.1% of the total loading capacity was included for both construction stormwater and industrial sources (a total of 0.2%).
Load allocations As discussed in the preceding section the LA for the contribution from upstream Sauk River was set at the amount determined in the Sauk Lake (North Bay) TMDL Report done in 2013 (MPCA 2013). The resulting allocation for the outlet of Sauk Lake (North Bay) is 3,952 kg/yr, a reduction of 1,976 kg/yr, or 33% from existing conditions. (Note: This reduction is not in addition to the reduction recommended by the Sauk Lake (North Bay) TMDL.)
The allocations for Ashley Creek and Hoboken Creek were determined by limiting the mean summer concentrations of phosphorus to 100ug/l, which represents the future standard proposed by the MPCA for rivers in the NCHF ecoregion. The resulting allocation for Ashley Creek is 5,200 kg/yr, a reduction of 4,680 kg/yr, or 47% from the existing condition of 9,880 kg/yr. The resulting allocation for Hoboken Creek is 1,140 kg/yr, a reduction of 2,212 kg/yr, or 66% from the existing condition of 3,352 kg/yr.
19
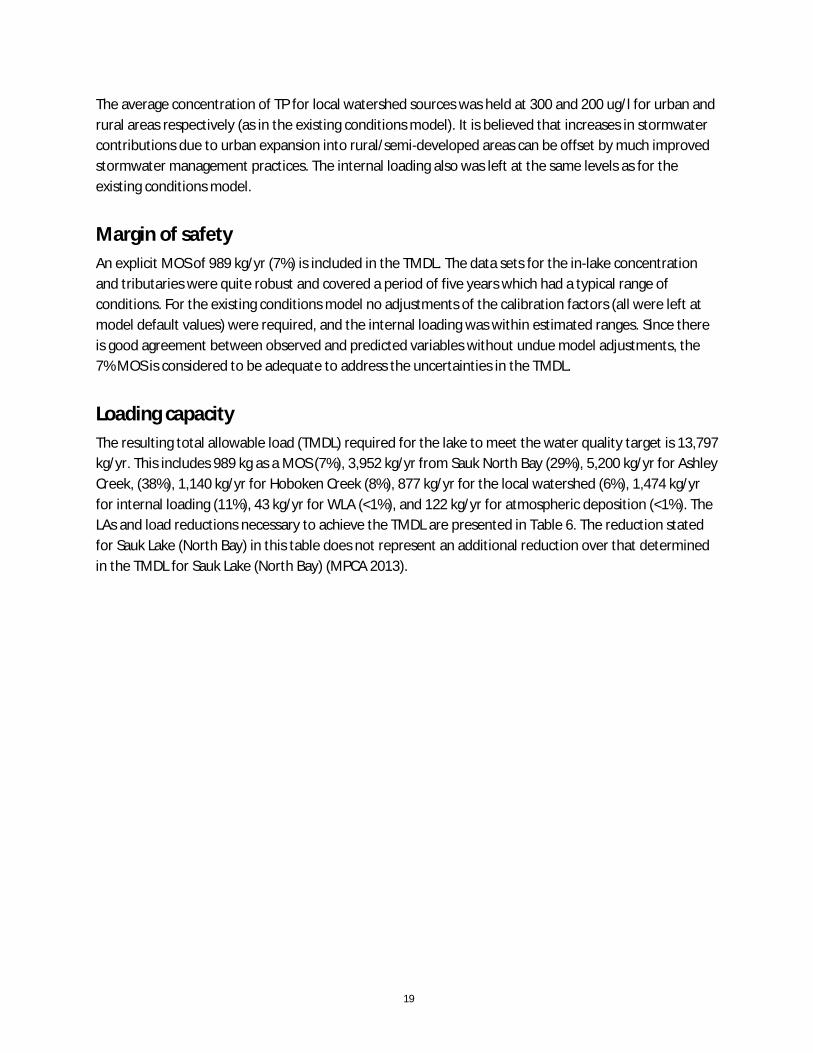
The average concentration of TP for local watershed sources was held at 300 and 200 ug/l for urban and rural areas respectively (as in the existing conditions model). It is believed that increases in stormwater contributions due to urban expansion into rural/semi-developed areas can be offset by much improved stormwater management practices. The internal loading also was left at the same levels as for the existing conditions model.
Margin of safety An explicit MOS of 989 kg/yr (7%) is included in the TMDL. The data sets for the in-lake concentration and tributaries were quite robust and covered a period of five years which had a typical range of conditions. For the existing conditions model no adjustments of the calibration factors (all were left at model default values) were required, and the internal loading was within estimated ranges. Since there is good agreement between observed and predicted variables without undue model adjustments, the 7% MOS is considered to be adequate to address the uncertainties in the TMDL.
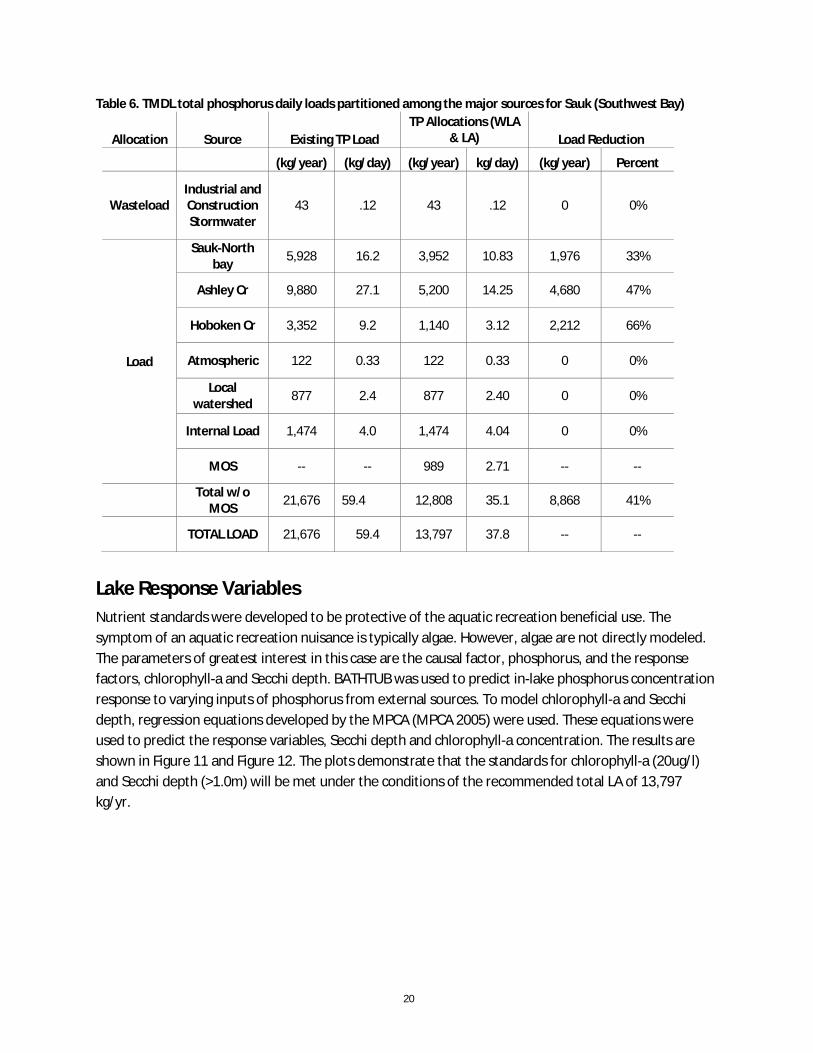
Loading capacity The resulting total allowable load (TMDL) required for the lake to meet the water quality target is 13,797 kg/yr. This includes 989 kg as a MOS (7%), 3,952 kg/yr from Sauk North Bay (29%), 5,200 kg/yr for Ashley Creek, (38%), 1,140 kg/yr for Hoboken Creek (8%), 877 kg/yr for the local watershed (6%), 1,474 kg/yr for internal loading (11%), 43 kg/yr for WLA (<1%), and 122 kg/yr for atmospheric deposition (<1%). The LAs and load reductions necessary to achieve the TMDL are presented in Table 6. The reduction stated for Sauk Lake (North Bay) in this table does not represent an additional reduction over that determined in the TMDL for Sauk Lake (North Bay) (MPCA 2013).
20
Table 6. TMDL total phosphorus daily loads partitioned among the major sources for Sauk (Southwest Bay)
Allocation Source Existing TP Load TP Allocations (WLA
& LA) Load Reduction
(kg/year) (kg/day) (kg/year) kg/day) (kg/year) Percent
Wasteload Industrial and Construction Stormwater
43 .12 43 .12 0 0%
Load
Sauk-North bay 5,928 16.2 3,952 10.83 1,976 33%
Ashley Cr 9,880 27.1 5,200 14.25 4,680 47%
Hoboken Cr 3,352 9.2 1,140 3.12 2,212 66%
Atmospheric 122 0.33 122 0.33 0 0%
Local watershed 877 2.4 877 2.40 0 0%
Internal Load 1,474 4.0 1,474 4.04 0 0%
MOS -- -- 989 2.71 -- --
Total w/o MOS 21,676 59.4 12,808 35.1 8,868 41%
TOTAL LOAD 21,676 59.4 13,797 37.8 -- --
Lake Response Variables Nutrient standards were developed to be protective of the aquatic recreation beneficial use. The symptom of an aquatic recreation nuisance is typically algae. However, algae are not directly modeled. The parameters of greatest interest in this case are the causal factor, phosphorus, and the response factors, chlorophyll-a and Secchi depth. BATHTUB was used to predict in-lake phosphorus concentration response to varying inputs of phosphorus from external sources. To model chlorophyll-a and Secchi depth, regression equations developed by the MPCA (MPCA 2005) were used. These equations were used to predict the response variables, Secchi depth and chlorophyll-a concentration. The results are shown in Figure 11 and Figure 12. The plots demonstrate that the standards for chlorophyll-a (20ug/l) and Secchi depth (>1.0m) will be met under the conditions of the recommended total LA of 13,797 kg/yr.

21
Figure 11. Sauk Lake (Southwest Bay) chlorophyll-a response.
Figure 12. Sauk Lake (Southwest Bay) Secchi depth response
Seasonal and Annual Variation The hydrological and nutrient budgets used in this TMDL were averages computed from five years of data which included wet and dry years. The resulting allocations and implemented best management practices (BMPs) will be protective for a broad range of climactic and land management conditions.
Seasonal variation is accounted for by developing the allocation for the summer season, which is when the nutrient levels peak and the likelihood of nuisance algae blooms is highest. By setting the TMDL to meet water quality goals during the critical summer period the allocations will be protective of the water quality during the other seasons.
0
5
10
15
20
25
30
0 10 20 30 40 50 60 70 80 90
Chlo
roph
yll-a
, ug/
l
Phosphorus Concentration, ug/l
Lake Response Model for Chlorophyll-a, Sauk Lake (Southwest Bay)
16.9ug/l < standard of 20ug/l
0
1
2
3
4
50 10 20 30 40 50 60 70 80 90
Secc
hi D
epth
, m
Phosphorus Concentration, ug/l
Lake Response Model for Secchi Depth, Sauk Lake (Southwest Bay)1.1 m > standard of 1.0 m
22
Reserve Capacity Reserve capacity is a portion of the load included in the TMDL to account for future growth or changes in land management in the watershed.
Currently there are no permitted industrial, or wastewater effluent sources in the Sauk Lake (Southwest Bay) Watershed. However, to comply with established TMDL protocols, 0.1% of the total watershed load was assigned to both industrial stormwater and construction stormwater. This allocation establishes a reserve capacity for stormwater.
The Sauk Lake (Southwest Bay) Watershed is primarily agricultural, which is unlikely to undergo much change during the next few decades. Some shifts between hay/pasture and row crops will occur, but this will not affect the loading capacity of the lake since the analysis was based on long term records, which likely included land management changes of the same type and magnitude.
The internal loading in the TMDL model was left at the same level as that for the existing conditions model. Thus, any decrease, over time, of internal loading would represent additional capacity.
7. Implementation Activities
Introduction This section provides general implementation strategies targeted toward reduction of nutrient loads in the Sauk Lake (Southwest Bay) Watershed. Implementation measures are needed to limit nutrient and sediment transport from upland areas, stabilize key riparian areas, and make in-channel improvements to control scour and sediment conveyance. In-lake implementation activities will be needed to reduce internal loading. The implementation plan should follow recommendations made in the Watershed Restoration and Protection Strategy (WRAPS) Report published by the MPCA in 2015 (MPCA 2015).
BMP Guidance Based on Agro-ecoregion Minnesota has 39 agro-ecoregions. Each agro-ecoregion is associated with a specific combination of soil types, landscape and climatic features, and land use. Agro-ecoregions are units having relatively homogeneous climate, soil and landscapes, and land use/land cover. Agro-ecoregions can be associated with a specific set of soil and water resource concerns, and with a specific set of management practices to minimize the impact of land use activities on soil and water resource quality.
The Minnesota Department of Agriculture (MDA), in 2012, released a useful BMP guide for agricultural practices: MDA Agricultural BMP Handbook.
A matrix has been developed by Dr. David Mulla of the University of Minnesota to provide general planning-level guidance on the application of BMPs within each agro-ecoregion in the state. The BMPs were developed through a focus group process that included experts from the University of Minnesota, MPCA, MDA, and the Minnesota Board of Water and Soil Resources. Four broad
23
categories of management practices discussed include nutrient management, vegetative practices, tillage practices, and structural practices. Selection of appropriate management practices for the pollutant(s) of concern depends on site-specific conditions, stakeholder attitudes and knowledge, and on economic factors. This information is intended to be used as a starting point in the development of a custom set of BMPs to reduce nutrient and sediment transport through improved management of uplands and riparian land within the Sauk Lake (Southwest Bay) TMDL project area.
The focus group identified a list of riparian and upland management practices that appear especially appropriate within the Central Till agro-ecoregion, which contains the Sauk Lake (Southwest Bay) project watershed. The BMPs recommended for reducing nutrient and sediment transport under the Vegetative, Primary Tillage, Nutrient Management, and Structural Practices categories include the following:
Vegetative Management Practices
· Contour farming
· Strip cropping
· Grassed waterways
· Grass filter strip for feedlot runoff
· Forest management practices
· Alternative crop in rotation
· Field windbreak
· Pasture Management (IRG)
· Conservation Reserve Program (CRP) or Conservation Reserve Enhancement Program (CREP)
Primary Tillage Practices
· Chisel Plow
· One pass tillage
· Ridge till
· Sustain surface roughness
Nutrient Management Practices
· Amount of application
· Timing of application
· Method of application
Structural Practices
· Wetland restoration
· Livestock exclusion
24
· Liquid manure waste facilities
A brief summary of each type of practice as it applies to the Sauk Lake TMDL watershed follows.
Vegetative Management Practices Vegetative practices include those focusing on the establishment and protection of crop and non-crop vegetation to minimize sediment mobilization from agricultural lands, and decrease nutrient and sediment transport to receiving waters. When designed and managed properly grassed waterways and grass filter strips increase entrainment of sediment. Cover crops can be very effective in improving soil texture and biological health, reducing erosion, retaining moisture and improving aeration. Other practices, such as alternative crop rotations, forest management, and field windbreaks, are designed to minimize exposure of bare soils to wind and water, which can transport soil off-site. Pasture management can involve rotational grazing techniques where pastures are divided into paddocks, and the livestock moved from one paddock to another before forage is over-grazed. Maintaining the vegetation allows for greater water infiltration, reducing runoff and associated nutrient and sediment transport.
There are a number of programs available to compensate land owners for moving environmentally sensitive cropland out of production for varying periods of time. These include the CRP, Re-Invest in Minnesota (RIM) Reserve Program, and the Conservation Reserve Enhancement Program - Minnesota II (CREP-II).
Primary Tillage Practices Reduced tillage practices can significantly reduce runoff from fields. Conservation tillage techniques emphasize the practice of leaving at least some vegetation cover or crop residue on fields to reduce the exposure of the soil to wind and water. Conservation tillage techniques emphasize leaving at least 30% crop residue or vegetative cover on active fields to reduce soil erosion by up to two-thirds (Randall et. al. 2002).
Nutrient management Practices Among all BMPs, nutrient management BMPs are one of the most effective ways to improve water quality because of the extent of nutrient related water quality issues. In Minnesota, cold weather makes nutrient management challenging due to a nongrowing season with a low evapotranspiration rate, frozen soil with little infiltration, and melting snow in spring. The combination of cold weather and unpredictable spring precipitation makes nutrient management even more complex. Following best management practices can help farmers overcome these challenges. A series of very useful fact sheets developed by the University of Minnesota Extension covers nutrient management and should be reviewed for more details on how to implement nutrient management on Minnesota farms. http://www.extension.umn.edu/agriculture/nutrient-management/
25
Structural Practices Structural practices emphasize elements that generally require a higher level of site-specific planning and engineering design. Most structural practices focus on watershed improvements to decrease nutrient loading to the receiving water. For example, restoration of wetlands can create a natural method of slowing overland runoff and storing runoff water, which can both reduce channel instability and flooding downstream. Livestock exclusion involves fencing or creating other structural barriers to limit or eliminate access to stream by livestock, and may involve directing livestock to an area that is better designed to provide limited access with minimal impact.
Stream and Channel Restoration Other practices which may be considered for the project area involve making improvements to improve channel stability and decrease in-stream sources of sediment. In-stream structures need to be carefully designed to direct flow where appropriate under a wide range of discharge conditions, and make sure that solution of one-channel stability problem doesn’t create another elsewhere. Also important is, where possible, making sure that the main stream channel can overflow into its floodplain at high flows to allow the stream to temporarily store water outside the streambank, reducing flow velocity and excessive scouring of the channel. Intact natural vegetation in the floodplain also acts to slow flow velocities, and encourages deposition and permanent capture of sediment and nutrients.
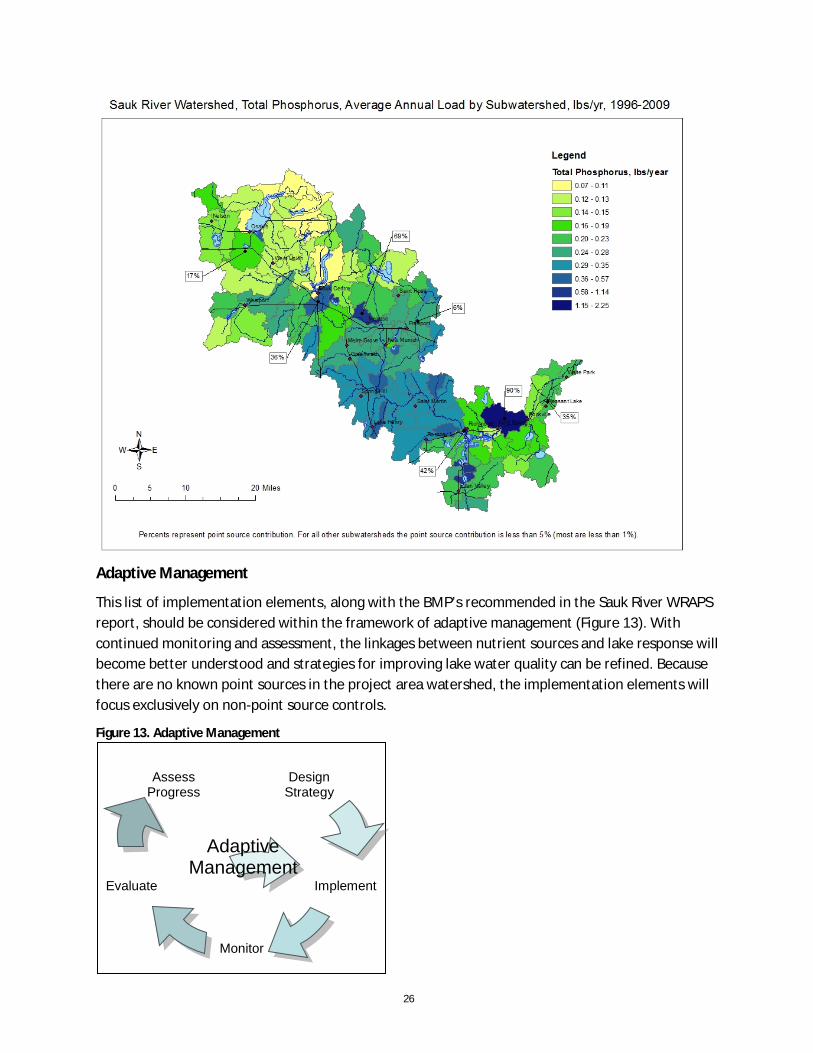
Prioritization Several prioritization methods can be used to assist with selecting specific areas in which to apply BMPs. These include the Zonation method developed by the DNR, and the HSPF model. Scenarios can be run with HSPF to predict watershed response to changes in management strategies. An HSPF model was developed for the Sauk River Watershed in 2013 (RESPEC 2013). Below is an example of a map produced with HSPF output. At this time a Zonation model has not been prepared for the Sauk River Watershed, but could be considered as a way to help narrow down locations where BMPs would be best suited.
26
Adaptive Management
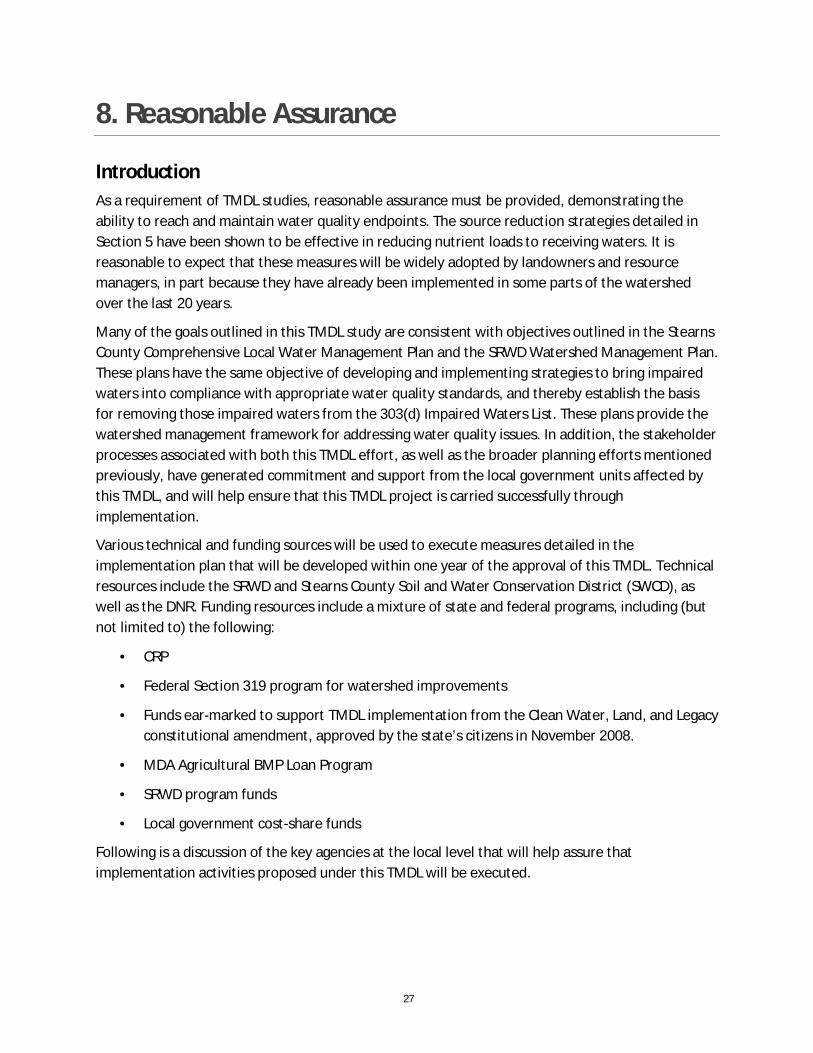
This list of implementation elements, along with the BMP’s recommended in the Sauk River WRAPS report, should be considered within the framework of adaptive management (Figure 13). With continued monitoring and assessment, the linkages between nutrient sources and lake response will become better understood and strategies for improving lake water quality can be refined. Because there are no known point sources in the project area watershed, the implementation elements will focus exclusively on non-point source controls.
Figure 13. Adaptive Management
Design Strategy
Implement
Monitor
Evaluate
Assess Progress
Adaptive Management
27
8. Reasonable Assurance
Introduction As a requirement of TMDL studies, reasonable assurance must be provided, demonstrating the ability to reach and maintain water quality endpoints. The source reduction strategies detailed in Section 5 have been shown to be effective in reducing nutrient loads to receiving waters. It is reasonable to expect that these measures will be widely adopted by landowners and resource managers, in part because they have already been implemented in some parts of the watershed over the last 20 years.
Many of the goals outlined in this TMDL study are consistent with objectives outlined in the Stearns County Comprehensive Local Water Management Plan and the SRWD Watershed Management Plan. These plans have the same objective of developing and implementing strategies to bring impaired waters into compliance with appropriate water quality standards, and thereby establish the basis for removing those impaired waters from the 303(d) Impaired Waters List. These plans provide the watershed management framework for addressing water quality issues. In addition, the stakeholder processes associated with both this TMDL effort, as well as the broader planning efforts mentioned previously, have generated commitment and support from the local government units affected by this TMDL, and will help ensure that this TMDL project is carried successfully through implementation.
Various technical and funding sources will be used to execute measures detailed in the implementation plan that will be developed within one year of the approval of this TMDL. Technical resources include the SRWD and Stearns County Soil and Water Conservation District (SWCD), as well as the DNR. Funding resources include a mixture of state and federal programs, including (but not limited to) the following:
· CRP
· Federal Section 319 program for watershed improvements
· Funds ear-marked to support TMDL implementation from the Clean Water, Land, and Legacy constitutional amendment, approved by the state’s citizens in November 2008.
· MDA Agricultural BMP Loan Program
· SRWD program funds
· Local government cost-share funds
Following is a discussion of the key agencies at the local level that will help assure that implementation activities proposed under this TMDL will be executed.
28
Sauk River Watershed District The SRWD has been active in water resources management and protection since it was formed in 1986. The SRWD current watershed management plan identifies the following major roles for the District:
1. Collection of monitoring data, with an emphasis on collection of a comprehensive set of surface water quality data to support diagnostic studies.
2. Development and implementation of a regulatory program that requires a permit from the SRWD for:
a. The development or redevelopment of properties which create greater than one acre of impervious.
b. Land disturbance within 500 feet of water bodies or wetlands.
c. Work in the Right of Way of any legal drainage system
d. Construction, installation, or alteration of certain water control structures
e. Diversion of water into a different sub-watershed or county drainage system
3. Providing technical assistance to landowners, farmers, businesses, lake associations, cities, townships, counties, state agencies, and school districts. Much of this technical assistance pertains to planning and installing BMPs for water quality protection and improvement.
4. Implementation of capital improvements.
5. Public education.
In March of 2010, the SRWD concluded the process of updating its rules, including addition of new requirements for stormwater runoff management, erosion control, drainage and water use. In 2013 the SRWD updated its watershed management plan which will apply for the period 2014 to 2023. This will provide the opportunity to more closely link SRWD policies, programs and projects with implementation of TMDLs affecting its jurisdiction, including the Sauk Lake (Southwest Bay) TMDL.
Stearns County Comprehensive Local Water Management Plan Stearns County has adopted a county water plan that articulates goals and objectives for water and land-related resource management initiatives. The adopted plan is for the time period 2008 through 2017. Completion of TMDL assessments of impaired waters within the county was identified as one of the top three priorities in the plan. In addition, the implementation section of the plan focuses on a number of areas important in restoring impaired waters to a non-impaired status, including:
1. Support and cooperation with watershed districts and the MPCA on on-going TMDL projects.
2. Educate feedlot owners on proper feedlot management, including manure storage and application, for the purpose of meeting regulatory requirements.
29
3. Provide information, technical and/or financial assistance to Stearns County landowners implementing agricultural BMPs on working lands to reduce soil erosion, protect streambanks, and improve water resources.
4. Actively promote and market federal/state/local conservation programs to targeted landowners and help prepare them for eligibility in program such as CRP and Environmental Quality Incentives Program (EQIP).
5. Promote and market conservation programs that provide cost-share and assistance to livestock producers for the adoption of comprehensive nutrient management plans.
6. Ensure the proper use and abandonment of manure pits.
7. Continue to inspect feedlots and work with owner/operators to bring their facilities into compliance with those feedlots that are within identified TMDL watersheds having priority.
8. Promote and establish buffers on public and private ditches
9. Establish and maintain vegetative buffers in accordance with existing Stearns County Land Use and Zoning Ordinance #209 and Minn. R. 61.20.3300, subp. 7.
Stearns County Soil and Water Conservation District The purpose of the Stearns County SWCD is to plan and execute policies, programs, and projects which conserve the soil and water resources within its jurisdictions. It is particularly concerned with erosion of soil due to wind and water. The SWCD is heavily involved in the implementation of practices that effectively reduce or prevent erosion, sedimentation, siltation, and agricultural-related pollution in order to preserve water and soil as resources. The District frequently acts as local sponsor for many types of projects, including grassed waterways, on-farm terracing, erosion control structures, and flow control structures. The SRWD has established close working relationships with the SWCD on a variety of projects. One example is the conservation buffer strip cash incentives program that provides cash incentives to create permanent grass buffer strips along stream corridors. The SRWD currently participates in the program by providing matching grants, and will work to target such practices in the GUS watersheds so that the practices are implemented as cost effectively as possible to achieve the load reduction required for that TMDL (Getchell Creek, Unnamed Creek and Stony Creek turbidity TMDL).
Monitoring
Future monitoring of water quality in Sauk Lake (Southwest Bay) and the major tributary, Sauk River, is necessary to enable assessment of whether progress is being made towards achievement of TMDL goals. A second, but no less important, purpose for additional monitoring is to improve upon the current understanding of the lake dynamics. A better understanding of the linkages between load sources and lake response will reduce uncertainties associated with model predictions, and allow refinement of LAs to various sources. Some specific areas where the monitoring could be improved are: more samples per season in the lake (epilimnion); more temperature-dissolved oxygen profiles in the lake; additional samples in the hypolimnion for TP and including iron and sulfate and lake bioassays.
An optimal time to begin effectiveness monitoring depends on the progress of implementation. After a substantial portion of the implementation work has been completed, effectiveness monitoring should
30
begin and be maintained for a minimum of three to four years. Following is a recommended strategy for the monitoring.
1. At two sampling locations in Sauk Lake (Southwest Bay), site id: 77-0150-01-203 (northern portion of lake); and 77-0150-01-206 (southern portion of lake)
· 10-12 times per summer (June through September) season:
TP (epilimnion)
Chlorophyll-a (epilimnion)
Secchi depth
Temperature and dissolved oxygen profile, pH
· 5-6 times per summer season
TP (hypolimnion)
OrthoP (hypolimnion)
Total Iron (hypolimnion)
Total Sulfate (hypolimnion)
2. Near the outlets of Ashley creek and Hoboken Creek · Continuous flow (gaging site with electronic logger)
· 18-20 times per year:
TP
Temperature, pH, dissolved oxygen, conductivity (with portable sonde), t-tube
· 9-10 times per year
Total Kjeldahl nitrogen
Nitrate/nitrite nitrogen
3. Blue-green toxicity testing if excessive algae blooms occur
31
9. Public Participation As part of the strategy to achieve implementation of the necessary allocations, the SRWD held a public meeting in December, 2008. The purpose of this meeting was to inform the general public and stakeholders about the TMDL process, and preliminary results of the Sauk Lake TMDL study. Additional stakeholder meetings, following the public noticing of the TMDL, will be held to update residents and to seek additional input on implantation efforts and planning. In addition to the public meetings, the SRWD intends to publish these results and project updates in their annual newsletter, as they have done on past TMDL studies in addition to their website (www.srwdmn.org). The SRWD’s Board of Managers and SWCD staff also made efforts to discuss the TMDL process and findings with their constituents and local landowners.
The MPCA held a 30-day public notice review and comment period from July 18 through August 17, 2016. The MPCA received six comments regarding the TMDL, all of which were submitted by the MDA. All comments have been addressed in this final TMDL.
10. References Barr Engineering Company, 2004. Detailed assessment of Phosphorus Sources to Minnesota
Watersheds.
Barr Engineering Company, 2007. Sauk Lake Internal Phosphorus Loading Study.
Dixit, S.S., Smol, J.P., Kingston, J.C. and Charles, D.F. 1992. Diatoms: powerful indicators of environmental change. Envir. Sci. Technol. 26:23-33
Djerrari, Amal 2009. Modeling Phosphorus Loading for the Sauk Lake TMDL
Edlund, M.B. and Ramstack, J. 2006. Diatom-Inferred TP in MCWD Lakes. Final Report to Minnehaha Creek Watershed District, Work Order #116-04, 33 pp.
Randall, G. 2002. Tillage Best Management Practices for Water Quality Protection in Southeastern Minnesota. University of Minnesota Extension Service.
McCollor and Heiskary, 1993. Selected Water Quality Characteristics of Minimally Impacted Streams From Minnesota's Seven Ecoregions. Minnesota Pollution Control Agency, St. Paul, MN
Minnesota Department of Agriculture, 2012, MDA Agricultural BMP Handbook
Minnesota Pollution Control Agency, 1999, Effects of Septic Systems on Ground Water Quality - Baxter, Minnesota, Prepared by Ground Water Monitoring and Assessment Program (GWMAP)
Minnesota Pollution Control Agency (MPCA), 2002. Water Quality Reconstruction from Fossil Diatoms: Applications for Trend Assessment, Model Verification, and Development of Nutrient Criteria for Lakes in Minnesota, USA. Minnesota Pollution Control Agency, St. Paul, Minnesota.
Minnesota Pollution Control Agency, 2005, Minnesota Lake Water Quality Assessment Report: Developing Nutrient Criteria, Third Edition
Minnesota Storm Water Manual, Minnesota Pollution Control Agency, 2005
32
Minnesota Pollution Control Agency, 2013, Sauk Lake (North Bay) Excess Nutrient TMDL
Minnesota Pollution Control Agency, 2015, Sauk River Watershed Restoration and Protection Plan (WRAP)
Mulla, D.J., A.S. Birr, G. Randall, J. Moncrief, M. Schmitt, Asekely, and E. Kerre 2001. Impacts of Animal Agriculture on Water Quality. Technical Work Paper prepared for the Environmental Quality Board of Minnesota.
Mulla, D.J. & P.H. Gowda, University of Minnesota and G.Wilson & H. Runke, BARR Engineering, 2003, Estimating Phosphorus Losses from Agricultural Lands for MPCA’s Detailed Assessment of Phosphorus Sources to Minnesota Watersheds
Nurnberg, G. 1997. Coping with Water Quality Problems Due to Hypolimnetic Anoxia in Central Ontario Lakes. Water Quality Research Journal of Canada. 32 (2) pp 391-405.
Sanocki, C.A., and B.C. Fisher, 2003. Physical Characteristics of Stream Subbasins in the Sauk River basin, Central Minnesota, Open File Report 00-233, Prepared in Cooperation with Minnesota Department of Transportation, Published by the U.S. Department of Interior, U.S. Geological Survey.
Sauk Centre Public Utilities Commission Wellhead Protection Plan. Bonestroo, Rosene Anderlik & Associates, 2004
Sauk River Watershed District et al. 2009. Sauk Lake Watershed Basin Restoration Continuation CWP Project
Sharpley, A.N., et al. 2006. Best Management Practices to Minimize Agricultural Phosphorus Impacts on Water Quality. United States Department of Agriculture, Agricultural Research Service, Publication ARS-163.
Walker,William W. 1996. Simplified Procedures for Eutrophication Assessment and Prediction: User Manual. USACE Report w-96-2.
Walker,William W. 1983. FLUX - A Computer Program for Estimating Mass Discharges, prepared for Environmental Laboratory, USAE Waterways Experiment Station, Vicksburg, Mississippi, EWQOS Work Unit 1-E, Working Paper No. 12, December 1983.
Walker, William W. 2003. Consideration of Variability and Uncertainty in Phosphorus Total Maximum Daily Loads for Lakes. J. Water Resour. Plng. and Mgmt., Volume 129, Issue 4, pp. 337-344 (July/August 2003).