Embed Size (px)
Citation preview

Report 1 – Social and Financial Exclusion Map
fromexclusion to inclusion throughmicrofinance
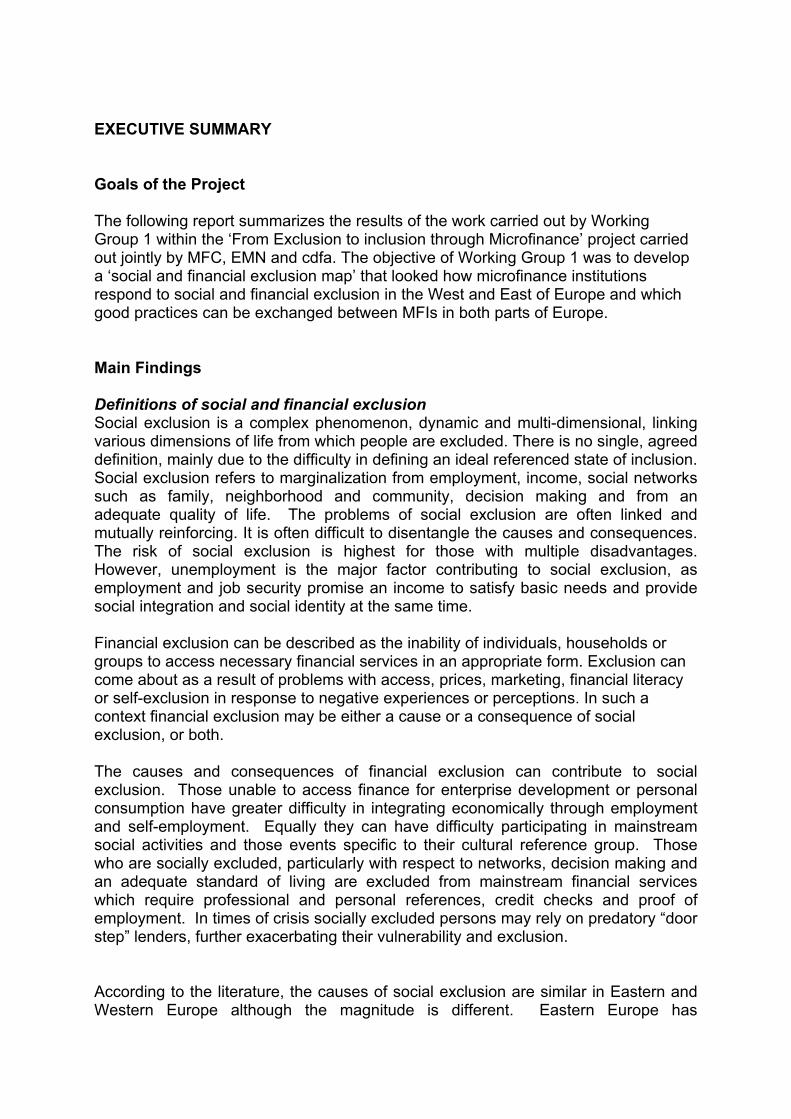
EXECUTIVE SUMMARY Goals of the Project The following report summarizes the results of the work carried out by Working Group 1 within the ‘From Exclusion to inclusion through Microfinance’ project carried out jointly by MFC, EMN and cdfa. The objective of Working Group 1 was to develop a ‘social and financial exclusion map’ that looked how microfinance institutions respond to social and financial exclusion in the West and East of Europe and which good practices can be exchanged between MFIs in both parts of Europe. Main Findings Definitions of social and financial exclusion Social exclusion is a complex phenomenon, dynamic and multi-dimensional, linking various dimensions of life from which people are excluded. There is no single, agreed definition, mainly due to the difficulty in defining an ideal referenced state of inclusion. Social exclusion refers to marginalization from employment, income, social networks such as family, neighborhood and community, decision making and from an adequate quality of life. The problems of social exclusion are often linked and mutually reinforcing. It is often difficult to disentangle the causes and consequences. The risk of social exclusion is highest for those with multiple disadvantages. However, unemployment is the major factor contributing to social exclusion, as employment and job security promise an income to satisfy basic needs and provide social integration and social identity at the same time. Financial exclusion can be described as the inability of individuals, households or groups to access necessary financial services in an appropriate form. Exclusion can come about as a result of problems with access, prices, marketing, financial literacy or self-exclusion in response to negative experiences or perceptions. In such a context financial exclusion may be either a cause or a consequence of social exclusion, or both. The causes and consequences of financial exclusion can contribute to social exclusion. Those unable to access finance for enterprise development or personal consumption have greater difficulty in integrating economically through employment and self-employment. Equally they can have difficulty participating in mainstream social activities and those events specific to their cultural reference group. Those who are socially excluded, particularly with respect to networks, decision making and an adequate standard of living are excluded from mainstream financial services which require professional and personal references, credit checks and proof of employment. In times of crisis socially excluded persons may rely on predatory “door step” lenders, further exacerbating their vulnerability and exclusion. According to the literature, the causes of social exclusion are similar in Eastern and Western Europe although the magnitude is different. Eastern Europe has

experienced dramatic economic change in the past 17 years where in the former communist countries structural reasons for social exclusion prevail. These reasons are first of all unemployment caused by the collapse of state owned industry and farms followed by significant social welfare cuts. In Western Europe social exclusion is also linked to unemployment. Here, however, unemployment is in part the result of the shift from an industrial based economy to a service oriented and technology dominated economy. And although the welfare state is under pressure, when compared to Eastern Europe, it continues to provide significant benefits in the form of income support, national health and retirement payments. The fight against social exclusion has been a major concern of EU policy since the early 1990s. Facilitating participation in employment and access to resources, rights, goods and services for all have become key European goals. In order to increase transnational policy cooperation, all Member States have been asked to prepare national action plans on social inclusion. The Role of Microfinance in Social and Financial Inclusion Microfinance refers to the provision of financial services - micro-loans, savings, insurance or transfer services - to low income households. It is widely seen as improving livelihoods, reducing vulnerability and fostering social as well as economic empowerment. Microcredit refers to provision of micro-loans for microenterprise development. As such, microcredit is one of several financial services referred to when the term microfinance is used. Microcredit can be a tool for social as well as financial inclusion, as it helps to prevent and redress all the areas of exclusion – poverty, low income, lack of employment - which are evidenced as a major component and reason for social exclusion. Moreover, programs that provide training, advice, mentoring and networking opportunities enhance skills and social empowerment of underprivileged groups, further contributing to inclusion. And microfinance through its broader range of services such as savings and insurance can further assist poor people to plan for future lump sum needs and to reduce their exposure to income changes or sudden expenses and to participate in social life. Provision of Financial Services Including Microcredit to the Poor: Two Schools of Thought The question of how best to provide financial services to the poor has fuelled intensive debates worldwide. The debate can be summarised into two different schools of thought: the institutionists and the welfarists. Although both view poverty-alleviation as their prime objective, each camp defines poverty differently, and, consequently, each has a different view of what is the best means of helping the poor gain access to financial services. The institutionists believe that microfinance will make a significant and permanent dent in poverty only if microfinance is significantly scaled up through its integration into formal financial systems which can guarantee permanent and financially self-sufficient services for large numbers of poor people. Welfarists do not believe that full financial self-sufficiency is a prerequisite for them to be able to reach poor people. They fear that the need to be financially self-sufficient (profitable) in order to attract private capital, will divert the industry from its paramount

goal of poverty alleviation. Microcredit programs implemented in the East generally fall into the institutionists school of thought and those implemented in the West generally fall into the welfarist approach. This difference is the result of historical, structural and legal factors. This difference creates excellent opportunities for cross regional sharing of best practices but also potential conceptual as well as practical difficulties in their application. The recommendations made by the working group take account of this challenge. Brief History and Overview of the Microcredit Sector in West and East The microcredit sectors in Western and Eastern Europe have evolved in very different contexts and as seen above, fall into different schools of thought regarding how best to provide financial services to the poor. The sector is younger in Western Europe than in Eastern Europe. Eastern Europe has larger actors, a greater loan volume and a bigger value of loans outstanding than in the West. In addition, in the East there are many institutions that are financially self-sustainable and able to attract concessional and in some cases commercial financing. Although the data is not directly comparable, in Eastern and Western Europe alike, NGOs tend to reach poorer clients with smaller businesses whereas banking institutions and government bodies tend to make loans to better off clients with larger businesses. In Western Europe the microcredit sector is relatively young and very diverse. The majority of microlenders active today began lending between 2000-2005. There is diversity in the types of organisations involved in microlending; from banks to NGOs, government bodies and foundations. Lenders operate for a variety of reasons. The majority work to ensure social and economic inclusion of persons at risk of poverty, while others focus on job creation and some aim to stimulate growth and development of small and medium sized enterprises and address market failure. NGOs appear to be reaching ‘poorer’ clients or at least clients with smaller businesses in the West whereas government programs tend to reach larger businesses. There is variety amongst banking institutions with those in Sweden reaching smaller businesses and perhaps poorer clients than many NGOs and than banking institutions in Germany for example. Western European microlenders receive funds for their operational costs from public (government) sources, the private sector (banks and foundations), charities (not for profit organisations that fund other not-for-profits). In addition, some generate earned income through interest rate charges and other loan fees. Loan capital is generally funded by public sources (government) followed by private sources (banks). In Eastern Europe, microfinance began in the nineties after the economic transition from centrally-planned to market economies. Microfinance started addressing the needs of a newly emerging social class – micro and small entrepreneurs as well as disadvantaged groups – victims of transformation, in particular the rural population in certain geographic areas who lost their livelihoods due to the collapse of the state farming system. The types of institutions engaged in microfinance services today include credit unions, state programs, non-government organizations, non-bank financial institutions and microfinance banks. Differences in the target clientele can be seen in the average loan size of microfinance institutions. Some of them provide very small loans and therefore reach low-end clients, while others also serve higher segment of better off entrepreneurs. This in particular concerns microfinance banks
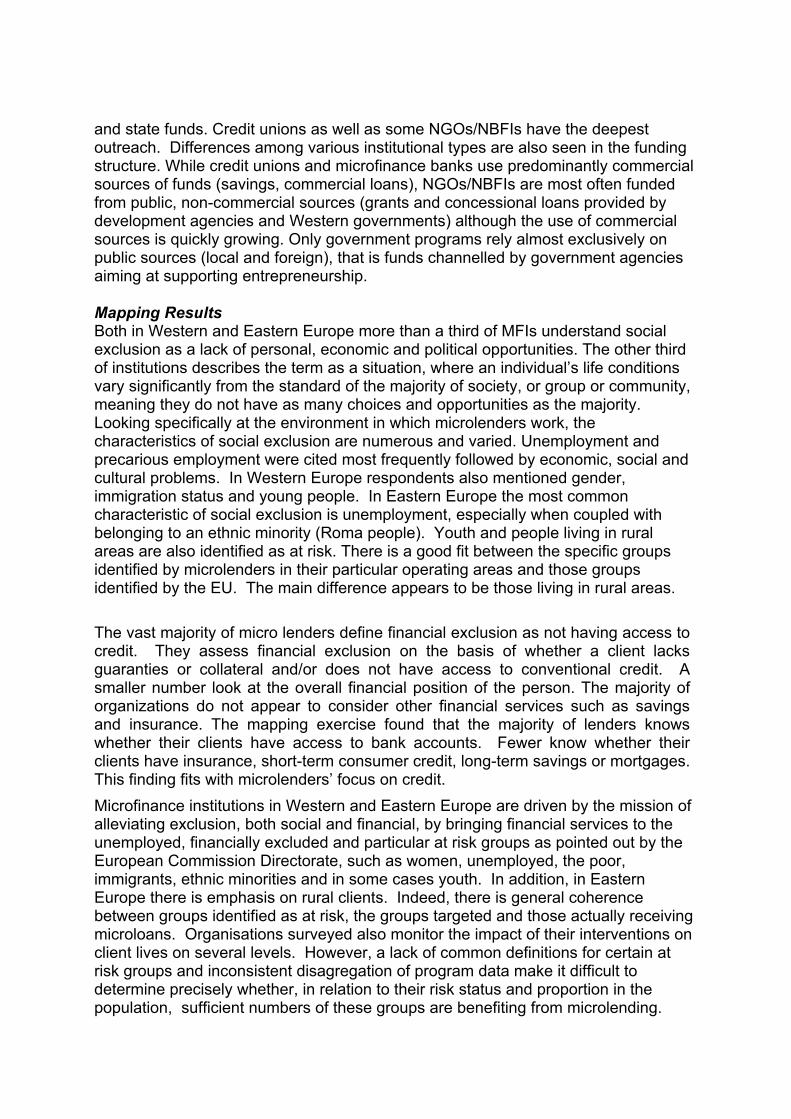
and state funds. Credit unions as well as some NGOs/NBFIs have the deepest outreach. Differences among various institutional types are also seen in the funding structure. While credit unions and microfinance banks use predominantly commercial sources of funds (savings, commercial loans), NGOs/NBFIs are most often funded from public, non-commercial sources (grants and concessional loans provided by development agencies and Western governments) although the use of commercial sources is quickly growing. Only government programs rely almost exclusively on public sources (local and foreign), that is funds channelled by government agencies aiming at supporting entrepreneurship. Mapping Results Both in Western and Eastern Europe more than a third of MFIs understand social exclusion as a lack of personal, economic and political opportunities. The other third of institutions describes the term as a situation, where an individual’s life conditions vary significantly from the standard of the majority of society, or group or community, meaning they do not have as many choices and opportunities as the majority. Looking specifically at the environment in which microlenders work, the characteristics of social exclusion are numerous and varied. Unemployment and precarious employment were cited most frequently followed by economic, social and cultural problems. In Western Europe respondents also mentioned gender, immigration status and young people. In Eastern Europe the most common characteristic of social exclusion is unemployment, especially when coupled with belonging to an ethnic minority (Roma people). Youth and people living in rural areas are also identified as at risk. There is a good fit between the specific groups identified by microlenders in their particular operating areas and those groups identified by the EU. The main difference appears to be those living in rural areas. The vast majority of micro lenders define financial exclusion as not having access to credit. They assess financial exclusion on the basis of whether a client lacks guaranties or collateral and/or does not have access to conventional credit. A smaller number look at the overall financial position of the person. The majority of organizations do not appear to consider other financial services such as savings and insurance. The mapping exercise found that the majority of lenders knows whether their clients have access to bank accounts. Fewer know whether their clients have insurance, short-term consumer credit, long-term savings or mortgages. This finding fits with microlenders’ focus on credit. Microfinance institutions in Western and Eastern Europe are driven by the mission of alleviating exclusion, both social and financial, by bringing financial services to the unemployed, financially excluded and particular at risk groups as pointed out by the European Commission Directorate, such as women, unemployed, the poor, immigrants, ethnic minorities and in some cases youth. In addition, in Eastern Europe there is emphasis on rural clients. Indeed, there is general coherence between groups identified as at risk, the groups targeted and those actually receiving microloans. Organisations surveyed also monitor the impact of their interventions on client lives on several levels. However, a lack of common definitions for certain at risk groups and inconsistent disagregation of program data make it difficult to determine precisely whether, in relation to their risk status and proportion in the population, sufficient numbers of these groups are benefiting from microlending.

Microlenders fulfil their mission by providing financial services but in both sub-regions they concentrate on providing access to credit for business purposes, rather than a range of financial products. Few MFIs offer personal or housing loans which are also important for better fulfilment of basic needs and social inclusion. Only banks and credit unions provide access to other financial services such as savings, transfers or insurance. Additionally, microlenders do not actively help their clients to move towards mainstream financial services once they gain experience, their business grows and they move toward becoming become eligible for the banking sector. Only two cases in the East are known for providing such assistance. However, indirectly, microlenders contribute to increased bank account usage as the majority of microlending transactions are processed via banks. Recommendations Recommentations at EU level - recognize that microfinance can be an effective tool for combating social and financial exclusion. Unemployment is a principal cause of social and financial exclusion in the EU. Microfinance institutions in the EU help the unemployed and financially excluded create their own jobs by providing financial and non-financial services that promote business creation and growth. -recognize that certain groups at risk of social and financial exclusion are under-represented in microfinance programs. Women, youth and rural areas appear to be underserved by microfinance programs in the EU. Definitional difficulties make it hard to ascertain representation of immigrants and ethnic minorities. Strategies for promoting access and participation by under-represented groups should be promoted and encouraged. - recognize the importance of developing common and consistent definitions in the EU for certain at-risk groups for data collection and monitoring purposes. As information is the first step toward understanding and meeting the needs of particular segments of the population, it is important to develop common definitions for these groups and to consider how this data can be collected legally while also protecting individual rights. - recognize the uniqueness, difficulty and therefore costs of serving microfinance clients in the EU. Unlike in developing countries where microcredit can serve large portions of the population, in the EU microfinance clients are the minority in the population and can be relatively difficult to reach. - promote management towards better social performance by ensuring MFI’s everyday operations are in line with their mission statements and that target groups are reached effectively with appropriate services that have an impact on clients’ lives. - recognize the need for including non-credit services in microfinance for fighting exclusion

Greater attention is needed to create regulatory environment that would allow microfinance institutions to extend their financial services to non-credit offerings that will fight all aspects of financial and social exclusion. - create assessment systems/performance standards for assessing operating efficiency of MFIs Maximizing operating efficiency whether as a means toward achieving sustainability or as a means toward ensuring value for money for donors should be a priority. This calls for further work towards creating an assessment system of MFI efficiency which would allow investors and funders to support the best performing MFIs, assist MFIs to improve efficiency and provide incentives towards efficiency improvements. - support cost-effective solutions, provide support based on MFI performance results With the use of performance assessment systems best performing MFIs should gain more attention and support to help them grow and provide services to greater numbers of clients. - consider ways to promote improved cooperation between non-governmental organizations, state institutions and European Union programs in order that clients receive a package of services instead of applying for separate services often overlapping each other and not fully meeting their current needs. Recommendations for MFIs - place more attention on social performance Microfinance institutions should recognize that they serve a unique market and should be more innovative in developing marketing approaches, products, services and cost-effective delivery mechanisms. - consider ways to promote improved cooperation between non-governmental organizations, state institutions and European Union programs and determine how to promote a system whereby clients receive a package of services instead of applying for separate services often overlapping each other and not fully meeting their current needs. - recognize that certain groups at risk of social and financial exclusion are under-represented in microfinance programs. Although microfinance institutions focus their activities on serving these groups, many are not being reached in relation to their representation in the overall population. MFIs should pay particular attention on these groups and develop approaches that promote equality of access and participation in microfinance. - develop common definitions for particular at risk groups and disaggregate data to better monitor outreach and impact. In the absence of EU wide definitions, MFIs should develop, at a minimum, country specific definitions or agree definitions applicable to the entire sector for ethnic minorities, immigrants and youth. Further, MFIs should consistently disaggregate data collected for monitoring and evaluation purposes. - develop long-term plans and work toward sustainability

MFIs should be aware of the fact that only long-term presence on the market will allow them to have significant impact on the targeted population. As such, more attention should be put towards adopting practices that will allow MFIs to increase their outreach, improve their efficiency and work toward sustainability. - adapt to anticipated changes in demand for microfinance In the East MFIs should realize that over time, with economic development and formal financial sector growth, they will need to shift towards serving more disadvantaged populations. Recommendations for networks - engage in promoting microfinance as a tool for social inclusion, so that it becomes a part of the EU agenda. Microfinance Networks should work with governments and the EU on creating a better environment for microfinance development as well as assist in structuring the most effective supporting activities. - support MFIs in their development On the MFI level, networks should support MFIs in their work towards better social and financial performance through knowledge exchange, identification and promotion of best practices.

8
Table of Contents Introduction to the Project........................................................................................... 9
Project Objectives ................................................................................................... 9 Working Group 1 Objectives ................................................................................... 9
Introduction to the Report ........................................................................................... 9 Social and Financial Exclusion: Definitions and European Context......................... 11 The Role of Microfinance in Social and Financial Inclusion ...................................... 18 Provision of Financial Services Including Microcredit to the Poor: Two Schools of Thought .................................................................................................................... 22 Brief History and Overview of the Microcredit Sector in West and East ................... 24 Social and Financial Exclusion Mapping Results...................................................... 30
Definitions of Social and Financial Exclusion ........................................................ 30 Characteristics of Social Exclusion and Financial Inclusion .................................. 32 Financial Exclusion in the Programme Area ......................................................... 33 Mission Statements............................................................................................... 34 Client Targeting..................................................................................................... 36 Addressing Social Exclusion ................................................................................. 42
Analysis and Challenges .......................................................................................... 50 Recommendations.................................................................................................... 56 Annex 1 - Working Group members ......................................................................... 60 Annex 2 - Methodology............................................................................................. 60 Annex 3 – Respondents ........................................................................................... 68 Annex 4 – Steering Group Details ............................................................................ 70 Annex 5 – Facts And Figures ................................................................................... 71 Annex 6 – Indicators of Social Inclusion ................................................................... 82 Annex 7 – Bibliography............................................................................................. 84
9
Introduction to the Project
Project Objectives The project aims to combine the various experiences of the project partners and their members in fighting social and financial exclusion in the East and West. The identification of key constraints and opportunities will serve as the basis for policy formulation and recommendations that will enable building more inclusive welfare and financial systems. The project’s specific objectives are to:
• increase learning on what approaches and tools exist among microfinance practitioners in the EU and the newly accessing countries, that allow them to effectively respond to the financial and non-financial needs of socially and financially excluded people
• identify key constraints and opportunities in reaching out to socially and financially excluded people
• develop a model for an East-West platform for information and knowledge exchange
The project’s work methodology was based on four joined working groups enabling sharing among participants (MFC, EMN, cdfa). The working groups were composed of members representing the three networks. The outputs of the working groups consist of reports and practical guides published and disseminated among practitioners and policy makers in EU and accessing countries.
Working Group 1 Objectives Working Group 1 focused on development of the project ‘social and financial exclusion map’. It looked into how financial exclusion ties with social exclusion, how MFIs respond to social exclusion in the East and in the West, what strategies are effective in the East and in the West, which good practices the East can adopt from the West and which good practices the West can adopt from the East.
Introduction to the Report Microfinance refers to the provision of financial services - micro-loans, savings, insurance or transfer services - to low income households. It is widely seen as improving livelihoods, reducing vulnerability and fostering social as well as economic empowerment1. Microcredit is one of several financial services referred to when the term microfinance is used. Microcredit is defined as a small loan, reimbursable over
1 Microfinance, Grants, and Non-financial Responses to Poverty Reduction: Where Does Microcredit Fit?, CGAP Focus Note 20 (2006)

10
a short period, used to support the creation or growth microenterprises. Microcredit is part of the microenterprise development agenda. Microfinance is recognized worldwide as an effective tool to fight social and financial exclusion and poverty. Most experience has come to Europe from the countries of the South. However experience in the South is not always relevant to the European context. Regional networks such as MFC and EMN and the cdfa, a national network operating in the UK, have been involved in creating good practice tailored to the countries where they operate. To date, little cross-breeding among the members of these three networks has occurred, despite the fact that some MFC members are currently located in the EU and many of them are in the accessing countries. It is very important to exchange and combine learning that has been accumulated in the East and West of Europe in order to strengthen the capacity of microfinance providers to deliver services to excluded people in an environment that poses significant legal and regulatory challenges when compared to the South. It is equally important to develop recommendations on how to change this environment.

11
Social and Financial Exclusion: Definitions and European Context Social Exclusion Social exclusion is a complex phenomenon, dynamic and multi-dimensional, linking various dimensions of life from which people are excluded. There is no single, agreed definition, mainly due to the difficulty in defining an ideal referenced state of inclusion. Social exclusion refers to marginalization from employment, income, social networks such as family, neighborhood and community, decision making and from an adequate quality of life.2 The problems of social exclusion are often linked and mutually reinforcing. It is often difficult to disentangle the causes and consequences. The risk of social exclusion is highest for those with multiple disadvantages. However, unemployment is the major factor contributing to social exclusion, as employment and job security promise an income to satisfy basic needs and provide social integration and social identity at the same time.3 Although unemployment is the major factor, if we disaggregate socially excluded groups by gender, age, geographic location, ethnicity and immigration status, other factors may emerge as being key. Social exclusion is strongly related with poverty, however these two concepts must be defined separately. To be poor does not necessarily mean being socially excluded, but it increases the chances of such an outcome4. A separate group of so called ‘working poor’5 deserves a mention in the social exclusion contex. The working poor are people, who although employed, do not earn sufficient income and are therefore more liable to fall into social exclusion. A study conducted in 2004 found that the perception of social exclusion is strongly connected with the experience of unemployment and severe financial difficulties, regardless of country. Exclusion from the labour market seems to promote the perception of marginalisation to a greater extent. Especially for EU 15 citizens, access to the labour market, which usually also means access to social protection systems in order to safeguard a certain standard of living, is fundamental for the provision of integration and life chances. Generally, it can be implied that the higher
2 Web definition 3 “Tackling Social Exclusion: Taking Stock and Looking to the Future: Emerging Findings,” Social Exclusion Unit, UK. 4 “Poverty, Social Exclusion and Microfinance in Britain,” Ben Rogaly, Thomas Fisher, Ed Mayo. OXFAM GB (1999) 5 Working poor is a term used to describe individuals and families who maintain regular employment but remain in relative poverty due to low levels of pay and dependent expenses. Officially the working poor are defined as individuals who spent at least 27 weeks in the labor force (working or looking for work), but whose incomes fell below the official poverty level. Source: Wikipedia

12
the welfare level of a country, the more people in the severely materially disadvantaged group suffer from the perception that they are outsiders6. Financial Exclusion Financial exclusion can be described as the inability of individuals, households or groups to access necessary financial services in an appropriate form. Exclusion can come about as a result of problems with access, prices, marketing, financial literacy or self-exclusion in response to negative experiences or perceptions. In such a context financial exclusion may be either a cause or a consequence of social exclusion, or both.7 In the European context, financial exclusion can be seen as exclusion from “mainstream” financial services market which has a stronger regulatory framework, established and reputation-conscious players and generally cheaper products and services. 8 In this context, the following financial services are considered ‘essential’ for participation in economic and social life:9
• Cash transmission banking • Insurance • Short-term consumer credit • Long-term savings
In the context of this study, financial exclusion can be an obstacle to launching and developing one’s business. Moreover underfunding is a principal cause of business failure. As a consequence, financial exclusion increases the chances of social exclusion by reducing the opportunity for self-employment through business creation. Links between Social and Financial Exclusion The causes and consequences of financial exclusion can contribute to social exclusion. Those unable to access finance for enterprise development or personal consumption have greater difficulty in integrating economically through employment and self-employment. Equally they can have difficulty participating in mainstream social activities and those events specific to their cultural reference group. Those who are socially excluded, particularly with respect to networks, decision making and an adequate standard of living are excluded from mainstream financial services which require professional and personal references, credit checks and proof of employment. In times of crisis socially excluded persons may rely on predatory “door step” lenders, further exacerbating their vulnerability and exclusion.
6 “Perceptions of Social Integration and Exclusion in an Enlarged Europe”. European Foundation for the Improvement of Living and Working Conditions (2004) 7 Centre for Research into Socially Inclusive Services, 2003. 8 “Financial Exclusion and Microfinance: An Overview of Issues,” N. Howell, Australia 9 Peter Cartwright “Banks, Consumers and Regulation,”quoted in “Financial Exclusion and Microfinance: An Overview of Issues,” N. Howell, Australia.

13
The European Context Although the term ‘social exclusion’ was rooted in the academic discussions of the 1960s and 1970s, it was not placed in a European Union context until the late 1980s, when it became a broader social policy issue. The term was originally used in the French political debate of the 1960s to describe a broad notion of detachment from mainstream values and social order10. In the early 1990s this understanding of social exclusion was taken on board in the European discussion on poverty. Until then the European debate had been mainly influenced by the Anglo-Saxon research tradition, which focused on issues of relative deprivation and concentrated on access to resources. Thereafter, an understanding of disadvantages which tackled lack of resources as well as inadequate social participation was developed. The fight against social exclusion has been a major concern of EU policy since the early 1990s. Facilitating participation in employment and access to resources, rights, goods and services for all have become key European goals. In order to increase transnational policy cooperation, all Member States have been asked to prepare national action plans on social inclusion11. According to the literature, the causes of social exclusion are similar in Eastern and Western Europe although the magnitude is different. Eastern Europe has experienced dramatic economic change in the past 17 years where in the former communist countries structural reasons for social exclusion prevail. These reasons are first of all unemployment caused by the collapse of state owned industry and farms followed by significant social welfare cuts. Unemployment rates in Eastern Europe range from 17.7% in Poland to 6.5% in Slovenia12. In Western Europe social exclusion is also linked to unemployment, which remains around 10% in many EU 15 countries (structural unemployment related to normal job turnover is expected to be in the 5% range). In Western Europe, however, unemployment is in part the result of the shift from an industrial based economy to a service oriented and technology dominated economy. And although the welfare state is under pressure, when compared to Eastern Europe, it continues to provide significant benefits in the form of income support, national health and retirement payments.
10 Perceptions of Social Integration and Exclusion in an Enlarged Europe. European Foundation for the Improvement of Living and Working Conditions (2004) 11 Joint Report on Social Inclusion 2004, European Commission, Directorate-General for Employment and Social Affairs, Unit E.2 12 Eurostat data www.epp.eurostat.ec.europa.eu

14
Table 5: Usual reasons for social exclusion in the East and in the West of EU12 East West unemployment low income poor housing poor skills / education discrimination crime ill health lack of social networks
exclusion from decision making
non-participation in associations and political parties In order to explain country level differences in the overall level of perceived social exclusion throughout the enlarged Europe, three aggregate indicators have been used to operationalise economic and welfare performance in different countries. GDP per capita, the total unemployment rate and the prevalence of serious solvency problems used as a poverty indicator. They explained far less than has been expected, but revealed some general patterns which will help a better understanding of how social exclusion experiences are distributed. Generally, the results show that13:
→ the lower the GDP per capita, the higher the level of perceived social exclusion
→ the higher the unemployment rate, the higher the level of perceived social exclusion
→ polarisation between the employed and the unemployed is far more pronounced in countries with a low total unemployment rate
→ the higher the prevalence of acute poverty, the higher the level of perceived social exclusion
→ polarisation between poor and non-poor is far more pronounced in countries with a low dispersion of acute poverty.
As social inclusion is one of the objectives of the European Union, in Belgium in 2001 at Laeken, a set of indicators for monitoring social exclusion was agreed within the framework of the Social Protection Committee and its Indicators Sub-Group14. The 13 “Perceptions of Social Integration and Exclusion in an Enlarged Europe”. European Foundation for the Improvement of Living and Working Conditions (2004) 14 Social Indicators In European Union. B. Nolan, Economic and Social Research Institute, Dublin, Ireland (2003)
15
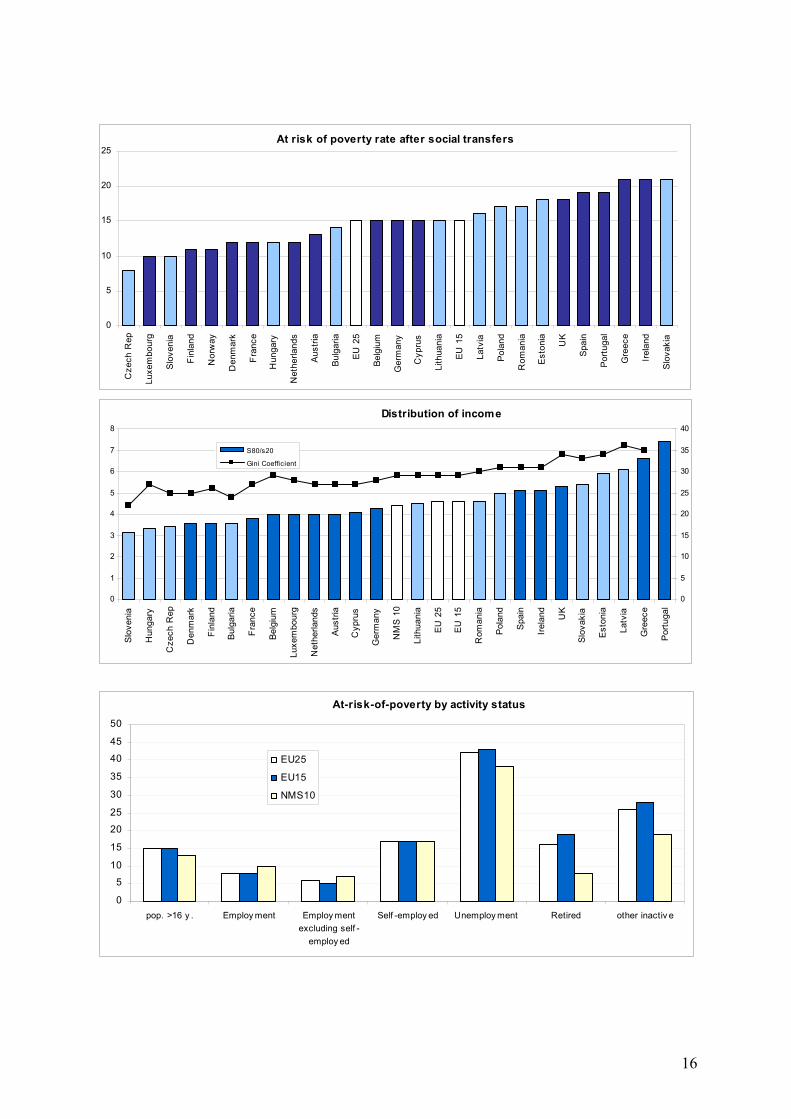
indicators cover four dimensions of social exclusion: income poverty, employment, education and health. The original set of 18 indicators was developed with a large variety of conceptual, methodological and data-related issues, and ended up as a set of Primary Indicators and a set of Secondary Indicators15. The Primary Indicators set includes low income rate after transfers, distribution of income, persistence of low income, long term unemployment rate, persons living in jobless households, early school leavers not in education or training, life expectancy at birth. The Secondary Indicators set includes dispersion around the low income threshold, Gini coefficient and very long term unemployment rate.
15 The list of indicators together with their definitions is available in Annex 6
16
At risk of poverty rate after social transfers
0
5
10
15
20
25
Cze
ch R
ep
Luxe
mbo
urg
Slo
veni
a
Finl
and
Nor
way
Den
mar
k
Fra
nce
Hun
gary
Net
herla
nds
Aus
tria
Bulg
aria
EU 2
5
Belg
ium
Ger
man
y
Cyp
rus
Lith
uani
a
EU 1
5
Latv
ia
Pola
nd
Rom
ania
Est
onia
UK
Spai
n
Por
tuga
l
Gre
ece
Irela
nd
Slo
vaki
a
0
1
2
3
4
5
6
7
8
Slo
veni
a
Hun
gary
Cze
ch R
ep
Den
mar
k
Finl
and
Bul
garia
Fra
nce
Belg
ium
Luxe
mbo
urg
Net
herla
nds
Aus
tria
Cyp
rus
Ger
man
y
NM
S 10
Lith
uani
a
EU
25
EU
15
Rom
ania
Pol
and
Spa
in
Irela
nd UK
Slo
vaki
a
Est
onia
Latv
ia
Gre
ece
Por
tuga
l
0
5
10
15
20
25
30
35
40
S80/s20
Gini Coefficient
Distribution of income
0
5
10
15
20
25
30
35
40
45
50
pop. >16 y . Employ ment Employ mentexcluding self -
employ ed
Self -employ ed Unemploy ment Retired other inactiv e
EU25
EU15
NMS10
At-risk-of-poverty by activity status

17
Long-term unemployment rate
0
2
4
6
8
10
12
14
Nor
way UK
Den
mar
k
Cyp
rus
Luxe
mbo
urg
Swed
en
Aust
ria
Irel
and
Net
herla
nds
Spa
in
Fin
land
Slo
veni
a
Hun
gary
EU
15
Mal
ta
Port
ugal
Ital
y
Fran
ce
Latv
ia
Cze
ch R
ep
Est
onia
Lith
uani
a
Bel
gium
Rom
ania
Ger
man
y
Gre
ece
Bul
garia
Pol
and
Slo
vaki
a
People aged 17-59 living in jobless households
0
2
4
6
8
10
12
14
16
18
Cyp
rus
Por
tuga
l
Lith
uani
a
Spa
in
Luxe
mbo
urg
Slo
veni
a
Cze
ch R
ep
Den
mar
k
Net
herla
nds
Latv
ia
Mal
ta
Irela
nd
Est
onia
Gre
ece
Aus
tria
Ital
y
EU 1
5
EU 2
5
Slov
akia
Rom
ania
Finl
and
Fran
ce UK
Ger
man
y
Hun
gary
Bul
garia
Belg
ium
Pol
and
Early school leavers
0
5
10
15
20
25
30
35
40
45
Slo
veni
a
Nor
way
Pol
and
Slo
vaki
a
Cze
ch R
ep
Den
mar
k
Aus
tria
Lith
uani
a
Fin
land
Sw
eden
Latv
ia
Irel
and
Hun
gary
Fra
nce
Bel
gium
Gre
ece
Luxe
mbo
urg
Net
herla
nds
Ger
man
y
Est
onia
UK
EU
25
EU
15
Cyp
rus
Bul
garia
Rom
ania
Ital
y
Spa
in
Por
tuga
l
Mal
ta
18
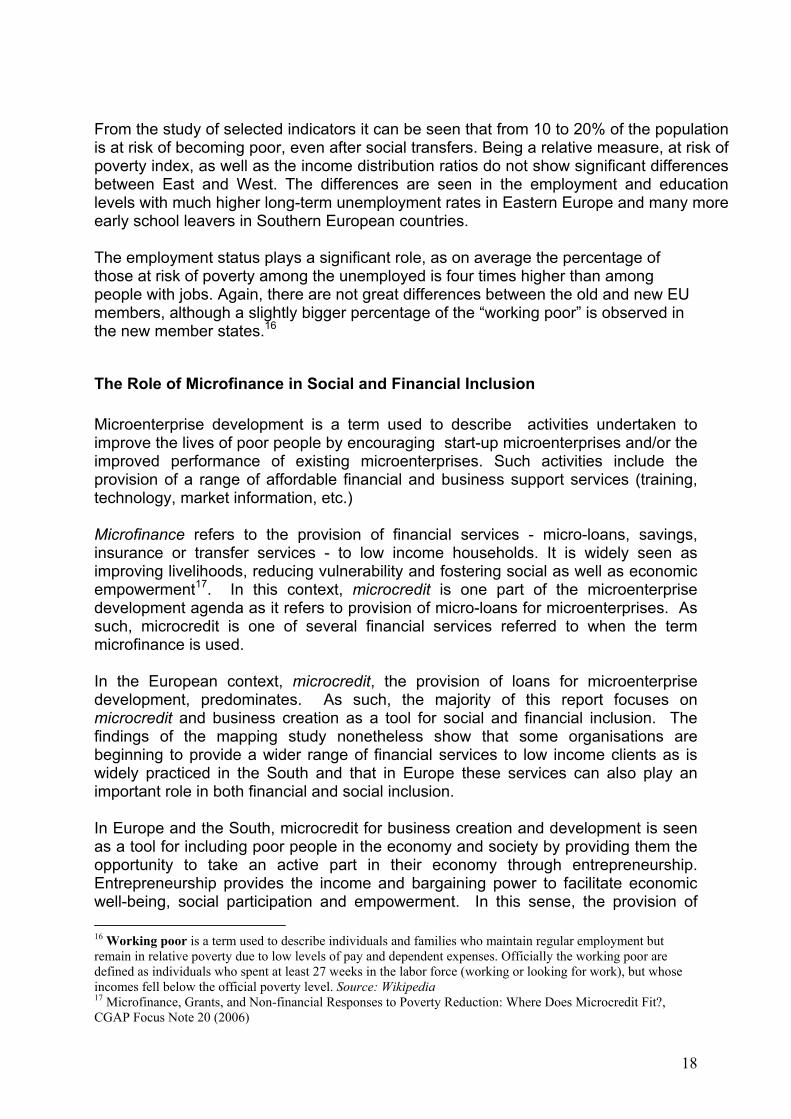
From the study of selected indicators it can be seen that from 10 to 20% of the population is at risk of becoming poor, even after social transfers. Being a relative measure, at risk of poverty index, as well as the income distribution ratios do not show significant differences between East and West. The differences are seen in the employment and education levels with much higher long-term unemployment rates in Eastern Europe and many more early school leavers in Southern European countries. The employment status plays a significant role, as on average the percentage of those at risk of poverty among the unemployed is four times higher than among people with jobs. Again, there are not great differences between the old and new EU members, although a slightly bigger percentage of the “working poor” is observed in the new member states.16
The Role of Microfinance in Social and Financial Inclusion Microenterprise development is a term used to describe activities undertaken to improve the lives of poor people by encouraging start-up microenterprises and/or the improved performance of existing microenterprises. Such activities include the provision of a range of affordable financial and business support services (training, technology, market information, etc.) Microfinance refers to the provision of financial services - micro-loans, savings, insurance or transfer services - to low income households. It is widely seen as improving livelihoods, reducing vulnerability and fostering social as well as economic empowerment17. In this context, microcredit is one part of the microenterprise development agenda as it refers to provision of micro-loans for microenterprises. As such, microcredit is one of several financial services referred to when the term microfinance is used. In the European context, microcredit, the provision of loans for microenterprise development, predominates. As such, the majority of this report focuses on microcredit and business creation as a tool for social and financial inclusion. The findings of the mapping study nonetheless show that some organisations are beginning to provide a wider range of financial services to low income clients as is widely practiced in the South and that in Europe these services can also play an important role in both financial and social inclusion. In Europe and the South, microcredit for business creation and development is seen as a tool for including poor people in the economy and society by providing them the opportunity to take an active part in their economy through entrepreneurship. Entrepreneurship provides the income and bargaining power to facilitate economic well-being, social participation and empowerment. In this sense, the provision of 16 Working poor is a term used to describe individuals and families who maintain regular employment but remain in relative poverty due to low levels of pay and dependent expenses. Officially the working poor are defined as individuals who spent at least 27 weeks in the labor force (working or looking for work), but whose incomes fell below the official poverty level. Source: Wikipedia 17 Microfinance, Grants, and Non-financial Responses to Poverty Reduction: Where Does Microcredit Fit?, CGAP Focus Note 20 (2006)

19
microcredit concerns a broader range of impact than mere financial improvement. It concerns improvements in quality of life, health, leadership and participation. Microcredit, therefore, can be a tool for social as well as financial inclusion, as it helps to prevent and redress all the areas of exclusion – poverty, low income, lack of employment - which are evidenced as a major component and reason for social exclusion. Moreover, programs that provide training, advice, mentoring and networking opportunities enhance skills and social empowerment of underprivileged groups, further contributing to inclusion. And microfinance through its broader range of services such as savings and insurance can further assist poor people to plan for future lump sum needs and to reduce their exposure to income changes or sudden expenses and to participate in social life. Studies worldwide of the impact of microfinance on clients’ lives generally support the proposition that microfinance reduces vulnerability by helping clients protect against future risk and cope with shocks and economic stress events after they occur. Three main pathways through which microfinance services reduce vulnerability include smoothing income, building assets and empowering women. 18 Below is a summary the findings of several impact studies. It is important to note that relative to developing regions of the world, fewer impact evaluations have been carried out in Western and Eastern Europe. Evaluating impact and social performance are strategic issues that require particular attention in the European Union. Measuring social return on investment is also increasingly important as it enables MFIs and their state funders to determine the net value of microenterprise lending support compared to payment of unemployment benefits. Impacts of Microfinance on Smoothing Income Evidence from impact studies suggests that one way microcredit reduces vulnerability is by increasing the sources of household income and labor supply. This, in turn, enables households to smooth income and consumption. An impact study in Thailand shows that credit contributes to an increased variety of secondary occupations and the diversification of goods and services sold within enterprises. A pilot study in Honduras found that more clients than non-clients had started a new economic activity in the past year. A number of impact studies find positive impacts on household labor supply, especially for women. A study of BURO-Tangail clients in Bangladesh finds that credit has a positive impact on increasing women’s contribution to family income, the basis for other important aspects of empowerment. 19 The study in Poland revealed that MFI clients were more likely than non-clients to report increasing revenues in their businesses in the last 12 months. The businesses which received two or more loans more often declared the increased in sales and net
18 “Microfinance, Risk Management, and Poverty”, Synthesis study by Jennefer Sebstad and Monique Cohen, March 2000 19 ibidem

20
revenues.20 A study in the UK found that clients increased their net annual income by 23%.21 Impacts of Microfinance on Building Assets Physical Assets. Findings from a number of studies suggest that microcredit programs play an important role in increasing productive assets for client households. A review of ten microcredit impact studies that looked at changes in enterprise assets found a positive change in the value of fixed assets among borrower enterprises in seven places: Jamaica, Honduras, Dominican Republic, South Africa, Kenya, Bangladesh, and Indonesia. In Bosnia and Herzegovina and Poland, microenterprises that used microcredit grew more dynamically as measured by a business index (composed of investments made and change in sales or net revenue). The index was also higher for repeat clients which confirms the assumption that repeat clients tend to use more of the benefits of a loan to reinvest in their business that newer clients.22 Human Assets. Several microfinance impact studies consider the impact of credit on children’s education, either by examining changes in expenditures on school fees, children’s school enrolment, school attendance, or educational attainment. Studies from Indonesia and Bangladesh show that credit contributes to increased expenditure on education. Data from Grameen Bank shows that credit to women has a statistically significant effect on the schooling of girls. Social Assets. Few impact studies to date have considered the impact of microfinance programs in building social assets, although these assets were found to play an important role in dealing with shocks and economic stress events in the field studies. A study in Bangladesh found changes in the position of women within class-based relations of dependency, exclusion, and marginalization. The study finds that poor borrowers, in particular, benefit more from increased social interactions and greater standing in the community. They are better able to offer hospitality, to call on help from neighbors, and to provide help when called upon. New social relationships developed through programs are important, and they are distinct from integration into the pre-existing community hierarchies. Impacts of Microfinance on Empowering Women Some convincing evidence from Bangladesh suggests that microcredit has a positive impact on some aspects of women’s empowerment. The analysis of BRAC data for that study considered sixteen indicators of women’s empowerment, ranging from knowledge and awareness of various social issues to ownership and control of assets and mobility. The analysis found two main channels through which microcredit reduces the vulnerability of women. The first is by increasing women’s control and decision-making power over their own assets (the ability to sell these assets without asking consent). The second channel for reducing vulnerability is by increasing knowledge, specifically knowledge about the legal way to divorce, knowledge that
20 Synthesis Report On The AIMS/MFC Impact Assessment Project (1999-2000) , Microfinance Centre for CEE and NIS (MFC), 2001 21 WEETU, Social Return on Investment, 2006. 22 ibidem

21
dowry is illegal, and knowledge of the local chairman’s name. It is not clear if this knowledge is actually put into practice, but greater legal and political awareness is an important first step in raising women’s consciousness of their rights within the household and community at large. Evidence from other countries on the impacts of microcredit on women’s empowerment generally supports the positive findings from Bangladesh. A study in Sri Lanka found that loans contributed to women’s independent income, which gave them more bargaining power in their relations with male family members. Results from Thailand show an increase in women’s confidence and cooperation with neighbors, as well as an increase in their husband’s likelihood of listening to them. A recent social impact evaluation in the UK demonstrated increases in self-confidence amongst women clients in general and in particular with respect to family decision making and negotiations with banks. Confidence in managing business finances also grew23. Impact on Jobs Creation Microcredit appears to have a positive impact on enterprise employment. In Peru, the impact analysis provides some indication that enterprises receiving microcredit were able to maintain higher levels of employment, employ more non-household members, and pay more in wages than non-client microenterprises. Against the background of a decline in overall employment in primary enterprises between 1997 and 1999, there was a significant increase in the employment of non-household members among those enterprises receiving ACP/Mibanco credit.24 A study from Poland revealed that microfinance client firms had considerable impact on local jobs market. MFI clients tended to hire more workers, especially full-time workers. They also decreased the number of unpaid family members working for the enterprises.25 The study below focuses on the map of microcredit as a tool for financial and social inclusion and examines its outreach to poor and at risk clients. It also explores sector players’ attitude towards the issue of exclusion and tries to track the initiatives undertaken towards improving the livelihood of microcredit clients. Last, but not least, it compares the practices in the East and West of the European Union and highlights where lessons can be learnt for both sides.
23 WEETU Social Impact Evaluation, 2006. 24 The Impacts Of Microcredit: A Case Study From Peru, Cohen, M., AIMS, September 2001 25 Synthesis Report On The AIMS/MFC Impact Assessment Project (1999-2000) , Microfinance Centre for CEE and NIS (MFC), 2001

22
Provision of Financial Services Including Microcredit to the Poor: Two Schools of Thought The question of how best to provide financial services to the poor has fuelled intensive debates worldwide. The debate can be summarised into two different schools of thought: the institutionists and the welfarists26. Although both view poverty-alleviation as their prime objective, each camp defines poverty differently, and, consequently, each has a different view of what is the best means of helping the poor gain access to financial services27. We will see further on that microcredit programs implemented in the East generally fall into one school of thought and those implemented in the West generally fall into the other. This difference creates excellent opportunities for cross regional sharing of best practices but also potential conceptual as well as practical difficulties in their application. The recommendations made by the working group at the end of this report take account of this challenge. The institutionists believe that microfinance will make a significant and permanent dent in poverty only if microfinance is significantly scaled up through its integration into formal financial systems which can guarantee permanent access to financial services for significant numbers of poor people. MFIs should first aim for financial sustainability; i.e. they should become independent of subsidies in the medium run. Institutionists further argue that “it is scale, not exclusive focus that determines whether significant outreach to the poorest will occur”.28 In effect, they believe that MFIs can achieve both financial sustainability and outreach to significant numbers of poor people (scale and depth) simultaneously. Substantial scale requires colossal financial resources that donors are incapable of providing.29 Only private capital is sufficiently abundant to allow MFIs to reach a significant number of poor people. Moreover, even if capital provided by donors were sufficient, it is not a guaranteed source in the long run. Widespread access to private financial capital requires MFIs to be well managed, efficient and, above all, profitable or financially self-sufficient. The above means that MFIs need to make profits from their loans. In other words, MFIs have to be able to reach large numbers of the poor (by increasing the scale of their operations), to enhance their efficiency (by decreasing operational costs, i.e., both administrative and personnel costs), but also to charge sustainable interest rates on their loans, i.e., interest rates that cover both operational and financial costs over the short term. According to the institutionists, striving for financial self-sufficiency will not prevent MFIs from reaching the very poor. Profitability does not
26 Microfinance Institutions: Profitability at the Service of Outreach? A Study of the Microfinance Industry in the ECA Region. R. Olszyna-Marzys, College of Europe (2006) 27 Where to Microfinance? G.M Woller, C.Dunford, W.Woodworth. International Journal of Economic Development. (1999) 28 Maximizing the Outreach of Microenterprise Finance: An Analysis of Successful Microfinance Programs. USAID Program and Operations Assessment Report No.10. Christen R.P., Rhyne E., Kogel R.C., McKean C. (1995) 29 Where to Microfinance? G.M Woller, C.Dunford, W.Woodworth. International Journal of Economic Development. (1999)
23
depend on the clientele reached, but on the degree to which the MFI is well designed and managed30. The welfarist approach is explicit in its commitment to reaching the very poor first, while it acknowledges the need to tackle world poverty on a large scale and to strive for increased financial self-sufficiency. Yet welfarists do not believe that full financial self-sufficiency, i.e., being profitable and independent of subsidies, is a prerequisite for them to be able to fulfil their social mission 17. Welfarists fear that the commercialisation of microfinance, more precisely, the need to be financially self-sufficient (profitable) in order to attract private capital, will divert the industry from its paramount goal of poverty alleviation. Welfarists do not accept the institutionists’ view that raising interest rates does not substantially diminish the demand for loans by poor people. Although they accept that there are poor households that are able to pay high interest rates, welfarists also believe that there are many borrowers, who are poorer and harder to reach and who are unable to pay such high interest rates. In other words, the poorest are not the ones that are necessarily able to pay the highest rates of interest, as the declining marginal return on capital would imply. Rather, the ability to pay high interest rates depends on the amount of capital and other inputs being used, therefore, on the occupation of the borrower and the use made of the loan31. Thus, the win-win situation advocated by institutionists is, in practice, much more complicated to achieve than they claim. Finally, welfarists do not agree that donors should concentrate only on programs which have attained or seek to attain financial self-sufficiency, regardless of the impact of the actual programs. If social benefits outweigh social costs, there is no reason why donors’ finance should dry up in the long run14. Mapping survey results indicate that programmes in Eastern Europe generally fall into the institutionist camp. Given the inefficiency of the financial sector to provide adequate financial services after the fall of communist regimes and the large number of displaced urban and rural workers, development of viable and sustainable financial institutions that could achieve scale and outreach to poor and at risk groups was a clear priority for development institutions which saw their intervention as a short-term assistance in setting up market-driven institutions. Considerable effort has been made to achieve this goal with significant success in the region. It is unclear how much Western European MFIs have been engaged in the above debate but the mapping exercise shows that they tend to fall into the welfarist camp. First, microcredit is conceived by the majority as a tool for bringing the socially excluded into the mainstream economy through entrepreneurship. There is relatively less emphasis on creating financially viable institutions that reach large number of
30 The Microcredit Summit’s Challenge: Working Towards Institutional Financial Self-Sufficiency while Maintaining a Commitment to Serving the Poorest Families. D.S. Gibbons, J.W. Meehan. Microcredit Summit. (2000) 31 The Microfinance Schism. Morduch J. World Development, Vol. 28, No.4

24
poor clients. This view is in part due to an existing financial sector that meets the needs of the majority. In addition, most organisations providing microcredit also provide a range of other social and employment services, receiving funding from the state as part of its social welfare provision. These organisations do not all necessarily conceive of themselves therefore as financial institutions. Second, legal restrictions on interest rates and borrowing for onward lending make pursing the institutionist approach to achieving scale and sustainability difficult for Western European MFIs. There is also debate over whether clients should bear the full costs of lending through interest rates and other fees and a view that public-private funding partnerships should contribute to costs given the social benefits of microcredit.
Brief History and Overview of the Microcredit Sector in West and East The Microcredit sectors in Western and Eastern Europe have evolved in very different contexts. As seen in the previous section, they also fall into different schools of thought regarding how best to provide financial services to the poor. The sector is younger in Western Europe than in Eastern Europe. Eastern Europe has larger actors, a greater loan volume and a bigger value of loans outstanding than in the West. In addition, in the East there are many institutions that are financially self-sustainable and able to attract concessional and in some cases commercial financing. Although the data is not directly comparable, in Eastern and Western Europe alike, NGOs tend to reach poorer clients with smaller businesses whereas banking institutions and government bodies tend to make loans to better off clients with larger businesses. Western Europe In Western Europe, the microcredit sector is relatively young and very diverse. Based upon European experience in the 19th century and that of developing counties in the 20th, a handful of Western European organizations pioneered microcredit in the late 1980s. However, the majority of microlenders active today began lending between 2000-2005. Over this period, the annual growth rate in the number of microloans disbursed has increased as has the number of actors. It is estimated that there are well over 100 actors involved in the lending process in the EU 15 and European Economic Area (EEA) countries. In 2005, microlenders participating in the mapping exercise disbursed 16,000 loans worth 158 million euros. Between 2004 and 2005 the number of loans disbursed grew by 18% and there has been a 5% growth in the total value lent.

25
Total Number and Value of Loans Disbursed in Western Europe
0
500
1000
1500
2000
2500
3000
3500
4000
4500
5000
5500
6000
6500
Belgium Finland France Germany Ireland Italy Norway Spain Sweden Switzerland UnitedKingdom
credit unionNGObankgovt
0
10 000 000
20 000 000
30 000 000
40 000 000
50 000 000
60 000 000
Belg iumFinland
France
GermanyIreland Italy
NorwaySpa in
Sweden
Sw itzerland
United K ingdomEu
ros
credit unionNGObankgovt
There is diversity in the types of organisations involved in microlending; from banks to NGOs, government bodies and foundations. Lenders operate for a variety of reasons. The majority work to ensure social and economic inclusion of persons at risk of poverty, while others focus on job creation and some aim to stimulate growth and development of small and medium sized enterprises and address market failure. Microloans sizes vary from €2,000 to €23,000. About 30% of organisations focus primarily on microlending. For another 50%, microlending represents 25% or less of their activity portfolio. Actors in this second category provide a spectrum of other social, employment or banking services. Over half of organisations involved in microlending in Western Europe provide pre- and post-lending business development services thus providing wider, microenterprise development services, not just microfinance, as it is often seen in Eastern Europe. Worldwide, many MFIs use the value of loans compared to income per capita as a proxy indicator to measure the poverty status of loan clients. It assumes that the smaller the loan size in relation to income, the poorer the client and the smaller his or her business.32 We see below that generally NGOs appear to be reaching ‘poorer’ clients or at least clients with smaller businesses in the West whereas government programs tend to reach larger businesses. There is variety amongst banking institutions with those in Sweden reaching smaller businesses and perhaps poorer clients than many NGOs and than banking institutions in Germany for example.
32 The ‘depth of outreach’ ratio used on its own has been shown to have weaknesses with respect to assessing the poverty status of clients because it may be that better off clients are taking out several loans from different MFIs to meet their business needs or that small loans are accepted because there is no other alternative (see Money with a Mission: Microfinance and Poverty Reduction, James Copestake, Martin Greeley, Susan Johnson, Naila Kabeer, Anton Simanowitz, Volume 1, ITDG Publishing, 2005). Even so, the ratio gives an idea of loan size in relation to income per capita and also provides an indication of the size of businesses supported. It further provides a means for comparing the size of loans within and across the two subregions studied for this report.

26
Average Loan Size/GNI per capita in US dollars Western Europe
0 20 40 60 80 100 120 140
Belgium
Finland
France
Germany
Italy
Norway
Spain
Sweden
Switzerland
United Kingdom
Percent
credit unionNGObankgovt
Monitoring portfolio performance, impact and achieving sustainability are significant challenges for the sector in Western Europe. As will be seen later in the report, MFIs do not generally provide full information on loan portfolio performance because of confidentiality concerns, difficulty and cost involved in separating microlending portfolio data from the rest of the institution’s loan portfolio, weak management information systems and insufficient attention to the importance of portfolio quality. Most lenders accurately track outputs such as clients served, loan repayment and jobs created. However, there is less information available on programme impact, particularly with respect to social impact. In addition, there are practical and conceptual barriers to achievement of sustainability.
Sources of Funds to Cover Operating Costs in Western Europe Funding Sources: Operational Costs
0
10
20
30
40
50
60
70
80
1-25% 26-50% 51-75% 76-100%
Percent of Funds
Perc
ent o
f Res
pond
ents
public sectorprivate sectorcharity sectorearned income
Western European microlenders receive funds for their operational costs from public (government) sources, the private sector (banks and foundations), charities (not for profit organisations that fund other not-for-profits). In addition, some generate earned income through interest rate charges and other loan fees. Loan capital is generally funded by public sources (government) followed by private sources (banks).

27
The above table shows that a significant number of Western European microlenders rely on public funds to cover the majority of their operational costs. Lenders falling into this category are primarily NGOs, foundations and government bodies. Those relying on earned income for significant proportion of their operational costs are banks. Those relying on earned income for 1-25% of their operational costs include NGOs, particularly in the UK where there are no interest rate caps and interest rates charged range from 5% to 27% depending upon the organisation. At present, not a single microlender has achieved sustainability in Western Europe. Although it is a long-term objective for many lenders, structural, cost and legal environments create barriers to sustainability. In addition, as discussed in the previous section, many carry out a number of other employment related activities and do not necessarily perceive themselves as financial institutions. There is also debate over the full cost of microlending and who and how these costs should be covered. Eastern Europe In Eastern Europe, microfinance began in the nineties after the economic transition from centrally-planned to market economies. Microfinance institutions were created to provide services to those layers of population that were out of the focus of formal financial institutions – state banks engaged in the process of restructuring and privatisation. Microfinance started addressing the needs of a newly emerging social class – micro and small entrepreneurs as well as disadvantaged groups – victims of transformation, in particular the rural population in certain geographic areas who lost their livelihoods due to the collapse of the state farming system. However, the major type of microfinance clientele constitute salaried workers – clients of credit unions - who use personal loans for various business and consumption needs. Credit unions, brought from Germany in the beginning of the 20th century, have the longest tradition. Under communist rule they survived in the form of employee ‘kasas’ providing short-term consumer loans to state workers. As they were state-subsidized in the past, credit unions are today struggling in some cases to set up sustainable operations. However, there are examples of countries such as Latvia, Lithuania and Poland where thanks to the efficiency of their operations, credit unions can provide a wide range of competitive services to those of banks. The other types of institutions engaged in microfinance services include state programs, non-government organizations, non-bank financial institutions and microfinance banks. For the purposes of this study and to be able to make comparisons from East to West we have grouped these into NGOs, government, credit unions and banks.
28
-
500
1,000
1,500
2,000
Bulgaria Hungary Latvia Lithuania Poland Romania Slovakia
MilionEuro bank
NGOcredit uniongovernment
Total Gross Loan Portfolio of Eastern European MFIs
-
200,000
400,000
600,000
800,000
1,000,000
Bulgaria Hungary Latvia Lithuania Poland Romania Slovakia
bankNGOcredit uniongovernment
Total Number of Active Borrowers of Eastern European MFIs
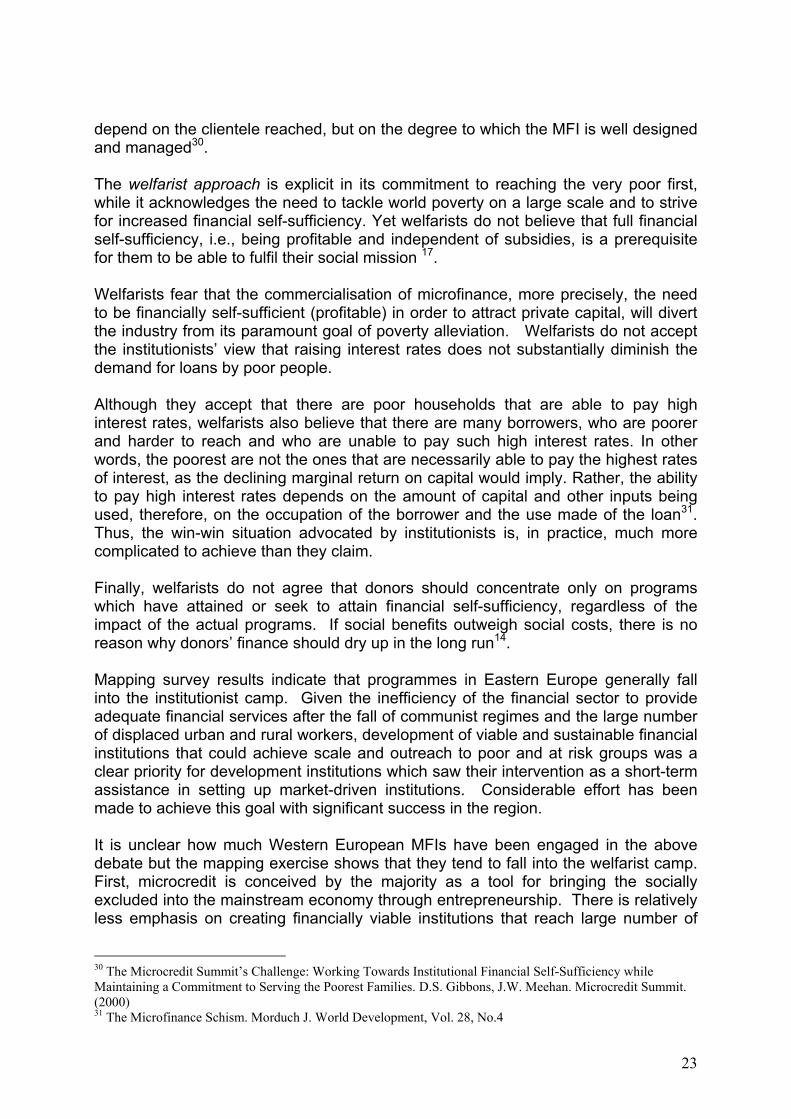
In total, market size measured by gross loan portfolio equals €3,600,000 utilized by 1,300,000 active borrowers. The growth rate was slower compared to Western Europe and reached 2% for loan portfolio and 10% for active borrowers. The biggest outreach is achieved by credit unions which serve 90 percent of the market, in particular in Hungary and Poland. They are followed by NGOs/NBFIs and microfinance banks both reaching similar numbers of clients. The most significant activity of NGOs/NBFIs is observed in Poland and Romania while microfinance banks operate only in Bulgaria and Romania. Differences in the target clientele can be seen in the average loan size of microfinance institutions. Some of them provide very small loans and therefore reach low-end clients, while others also serve higher segment of better off entrepreneurs. This in particular concerns microfinance banks and state funds. Credit unions as well as some of the NGOs/NBFIs have the deepest outreach33. In the last few years a trend towards going ‘downmarket’ can be observed, the gradual decrease of the average loan balance per borrower. For all institutional types more than half of institutions deepened their outreach by 20%. This is connected with the increasing interest of commercial banks in serving entrepreneurs and creating competition which forces the MFIs to start serving the micro segment. Moreover, the success of microfinance has demonstrated that there is demand for financial services in this segment which can be served profitably therefore more and
33 Depth of outreach is calculated as avg. loan balance per borrower divided by GNP per capita. This measure normalizes the loan size for different levels of country income making cross-country comparisons possible. Lower values of the ratio mean smaller loans which are associated with deeper outreach to the poor. Higher values mean that the outreach is more shallow as the institution serves clients with larger businesses. Deepening the outreach happens through the decrease of the depth of outreach ratio, therefore the downscaling effect is observed among MFIs whose depth of outreach change was negative during the year.
29
more commercial banks have started to offer new products to segments of the population previously out of the banks’ interest.
0% 50% 100% 150% 200%
Bulgaria
Hungary
Latvia
Lithuania
Poland
Romania
Slovakia
bankNGOcredit uniongovernment
Average loan balance/GNP per capita of Eastern European MFIs
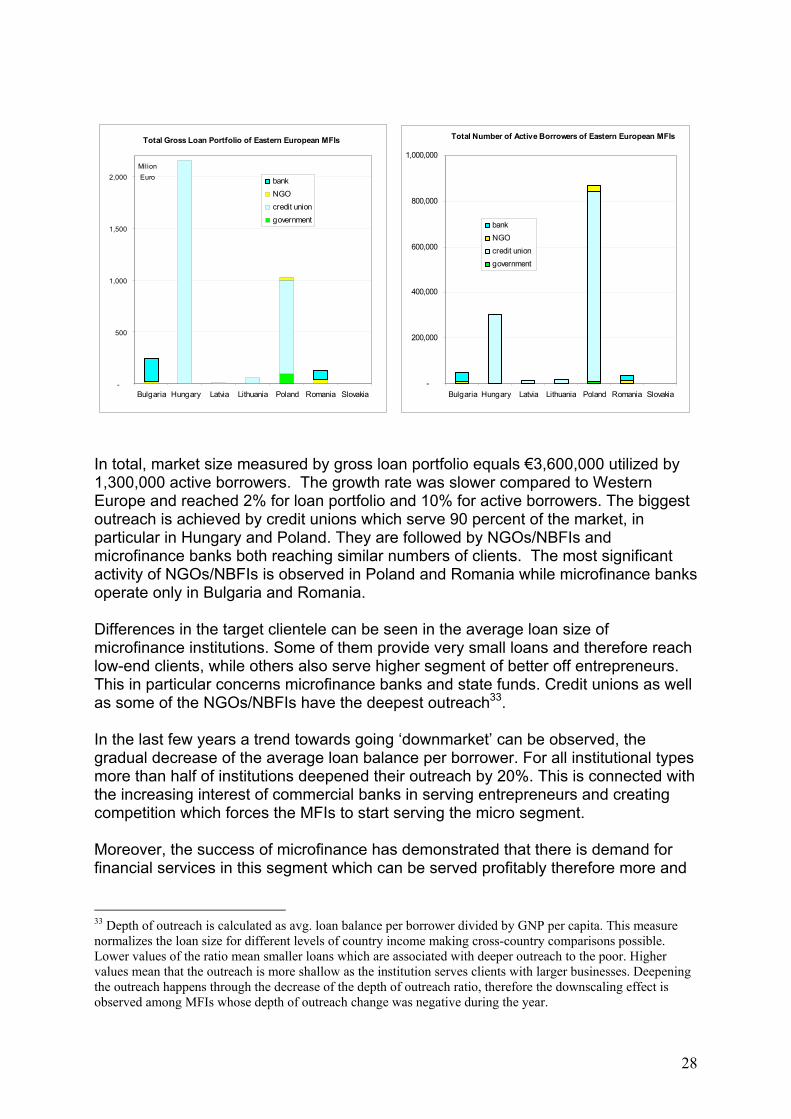
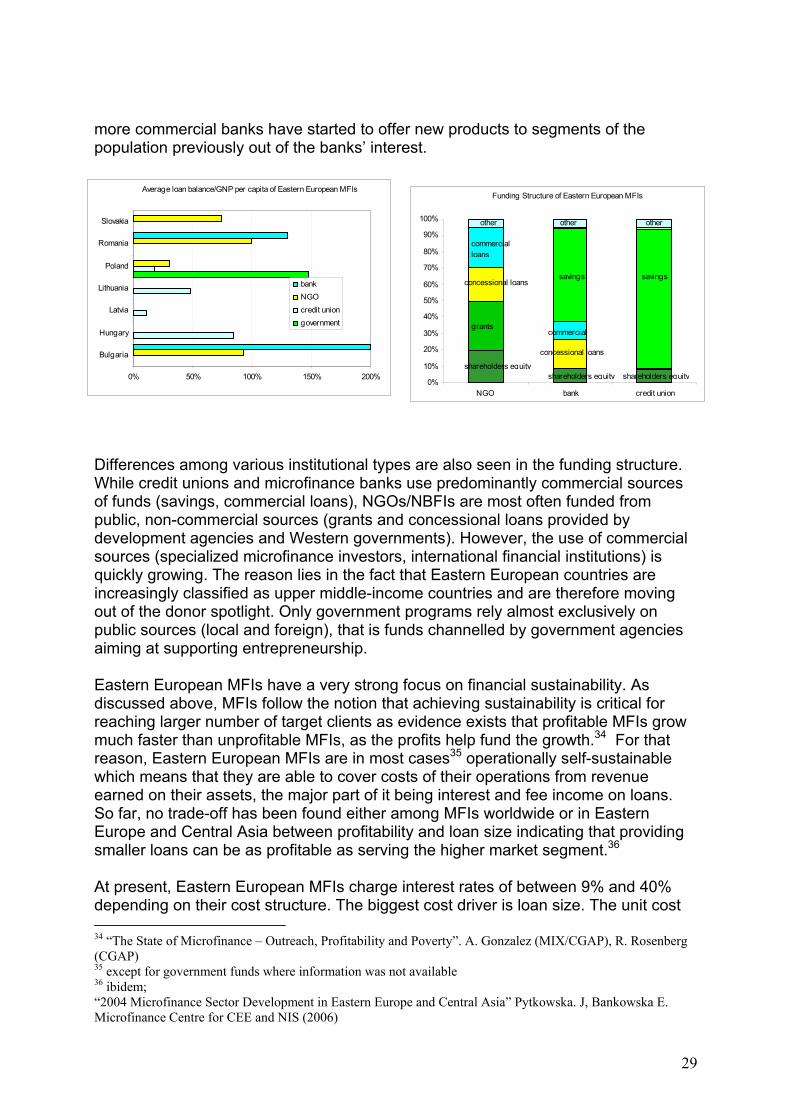
Differences among various institutional types are also seen in the funding structure. While credit unions and microfinance banks use predominantly commercial sources of funds (savings, commercial loans), NGOs/NBFIs are most often funded from public, non-commercial sources (grants and concessional loans provided by development agencies and Western governments). However, the use of commercial sources (specialized microfinance investors, international financial institutions) is quickly growing. The reason lies in the fact that Eastern European countries are increasingly classified as upper middle-income countries and are therefore moving out of the donor spotlight. Only government programs rely almost exclusively on public sources (local and foreign), that is funds channelled by government agencies aiming at supporting entrepreneurship. Eastern European MFIs have a very strong focus on financial sustainability. As discussed above, MFIs follow the notion that achieving sustainability is critical for reaching larger number of target clients as evidence exists that profitable MFIs grow much faster than unprofitable MFIs, as the profits help fund the growth.34 For that reason, Eastern European MFIs are in most cases35 operationally self-sustainable which means that they are able to cover costs of their operations from revenue earned on their assets, the major part of it being interest and fee income on loans. So far, no trade-off has been found either among MFIs worldwide or in Eastern Europe and Central Asia between profitability and loan size indicating that providing smaller loans can be as profitable as serving the higher market segment.36 At present, Eastern European MFIs charge interest rates of between 9% and 40% depending on their cost structure. The biggest cost driver is loan size. The unit cost 34 “The State of Microfinance – Outreach, Profitability and Poverty”. A. Gonzalez (MIX/CGAP), R. Rosenberg (CGAP) 35 except for government funds where information was not available 36 ibidem; “2004 Microfinance Sector Development in Eastern Europe and Central Asia” Pytkowska. J, Bankowska E. Microfinance Centre for CEE and NIS (2006)
0%
10%
20%
30%
40%
50%
60%
70%
80%
90%
100%
NGO bank credit union
shareholders equity
grants
concessional loanssavings
other
commercial loans
Funding Structure of Eastern European MFIs
savings
shareholders equity shareholders equity
commercial
otherother
concessional loans

30
of managing larger loans is lower which translates into lower interest rates on loans provided to larger entrepreneurs. Serving lower-end clients, on the other hand, is more difficult and time consuming which drives the costs up. It also involves higher risk of default as small loans are often uncollateralized and in case of default more difficult to recover. However, these costs can be largely reduced by increasing staff productivity which allows for the reduction of administrative costs. Additionally, the scale of operations is important. Larger MFIs can benefit from economies of scale and more efficiently manage their resources. Unlike Western European counterparts, Eastern European MFIs in most cases provide only microfinance leaving the other microenterprise development services to other non-financial institutions, like business-support centres or foundations for enterprise support.
Social and Financial Exclusion Mapping Results The focus of the mapping exercise was to understand how microlenders define social and financial exclusion and poverty, how they address social and financial exclusion as reflected in their mission statements and client targeting and their ideas about how social and financial exclusion can be addressed. The background information collected from microlenders on their operations is integrated into this section to deepen the analysis and cross check information provided in the social and financial exclusion portion of the mapping.
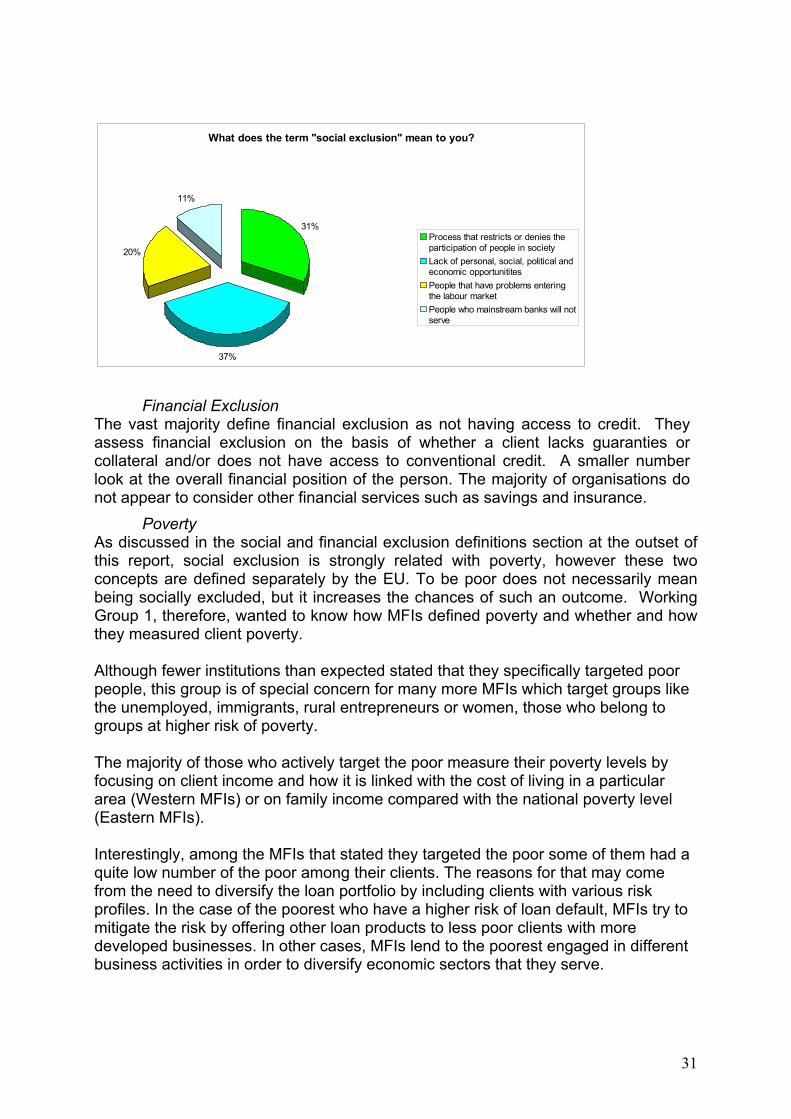
Definitions of Social and Financial Exclusion Social Exclusion Both in Western and Eastern Europe more than a third of MFIs understand social exclusion as a lack of personal, economic and political opportunities. The other third of institutions describes the term as a situation, where an individual’s life conditions vary significantly from the standard of the majority of society, or group or community, meaning they do not have as many choices and opportunities as the majority. This group also included aspects of social life like family, support networks and friends, as well as basic communication with other people and involvement in community activities. Some MFIs stated that poverty or lack of access to job opportunities and access to the labour market lead to exclusion. A smaller proportion of MFIs linked social exclusion with financial exclusion where the socially excluded also lack access to financial services of formal institutions. There is a commonality of understanding between the two regions studied and within the regions as well. Moreover, the MFI definitions are quite close to the definitions set out by the Working Group and provided at the beginning of this report. As such, there seems to be a widespread consensus on the elements, causes and consequences of social exclusion.
31
What does the term "social exclusion" mean to you?
31%
37%
20%
11%
Process that restricts or denies theparticipation of people in societyLack of personal, social, political andeconomic opportunititesPeople that have problems enteringthe labour marketPeople who mainstream banks will notserve
Financial Exclusion The vast majority define financial exclusion as not having access to credit. They assess financial exclusion on the basis of whether a client lacks guaranties or collateral and/or does not have access to conventional credit. A smaller number look at the overall financial position of the person. The majority of organisations do not appear to consider other financial services such as savings and insurance.
Poverty As discussed in the social and financial exclusion definitions section at the outset of this report, social exclusion is strongly related with poverty, however these two concepts are defined separately by the EU. To be poor does not necessarily mean being socially excluded, but it increases the chances of such an outcome. Working Group 1, therefore, wanted to know how MFIs defined poverty and whether and how they measured client poverty. Although fewer institutions than expected stated that they specifically targeted poor people, this group is of special concern for many more MFIs which target groups like the unemployed, immigrants, rural entrepreneurs or women, those who belong to groups at higher risk of poverty. The majority of those who actively target the poor measure their poverty levels by focusing on client income and how it is linked with the cost of living in a particular area (Western MFIs) or on family income compared with the national poverty level (Eastern MFIs). Interestingly, among the MFIs that stated they targeted the poor some of them had a quite low number of the poor among their clients. The reasons for that may come from the need to diversify the loan portfolio by including clients with various risk profiles. In the case of the poorest who have a higher risk of loan default, MFIs try to mitigate the risk by offering other loan products to less poor clients with more developed businesses. In other cases, MFIs lend to the poorest engaged in different business activities in order to diversify economic sectors that they serve.

32
Characteristics of Social Exclusion and Financial Inclusion Social Exclusion in the Programme Area Looking specifically at the environment in which microlenders work, the characteristics of social exclusion are numerous and varied. Unemployment and precarious employment were cited most frequently followed by economic, social and cultural problems. In Western Europe respondents also mentioned gender, immigration status and young people. Social exclusion was further characterized by the presence of at risk groups such as ex-prisoners, ex-drug addicts, long term unemployed, disabled people and elderly people. Educational status is also mentioned as affecting the level of exclusion in some program areas. In Eastern Europe the most common characteristic of social exclusion is unemployment, especially when coupled with belonging to an ethnic minority (Roma people). Youth and people living in rural areas are also identified as at risk. As discussed in the previous section, the European Commission Directorate for Employment and Social Affairs identifies the following groups as at greatest risk of poverty and social exclusion: women, single parent households (mostly headed by women) and the elderly. As above, unemployment is a key factor in poverty risk and social exclusion. Three groups particularly vulnerable to long-term unemployment are older male and female workers; men and women under the age of 25; immigrants and ethnic minorities.37 There is a good fit between the specific groups identified by microlenders in their particular operating areas and those groups identified by the EU. The main difference appears to be with respect to those living in rural areas.
What are the characteristics of social exclusion in your area?
0%
5%
10%
15%
20%
25%
30%
Unemploy
ment
At risk
grou
ps
Gender
Educatio
n
Immigrat
ion Stat
usEco
n., so
c., cu
lt . proble
ms
Youth
37 “Joint Report on Social Inclusion 2004,” European Commission Directorate for Employment and Social Affairs, 2004; “Microcredit for Small Businesses and Business Creation: Bridging a Market Gap,” European Union, DG Enterprise, 2004.
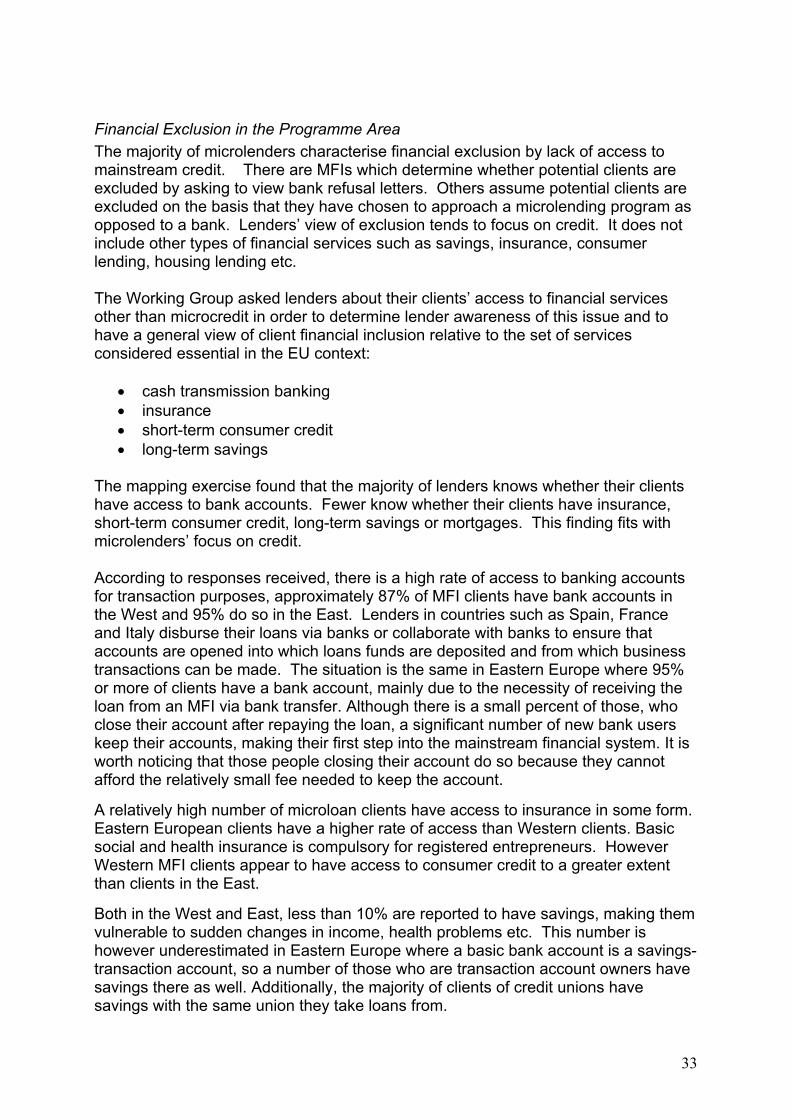
33
Financial Exclusion in the Programme Area The majority of microlenders characterise financial exclusion by lack of access to mainstream credit. There are MFIs which determine whether potential clients are excluded by asking to view bank refusal letters. Others assume potential clients are excluded on the basis that they have chosen to approach a microlending program as opposed to a bank. Lenders’ view of exclusion tends to focus on credit. It does not include other types of financial services such as savings, insurance, consumer lending, housing lending etc. The Working Group asked lenders about their clients’ access to financial services other than microcredit in order to determine lender awareness of this issue and to have a general view of client financial inclusion relative to the set of services considered essential in the EU context:
• cash transmission banking • insurance • short-term consumer credit • long-term savings
The mapping exercise found that the majority of lenders knows whether their clients have access to bank accounts. Fewer know whether their clients have insurance, short-term consumer credit, long-term savings or mortgages. This finding fits with microlenders’ focus on credit. According to responses received, there is a high rate of access to banking accounts for transaction purposes, approximately 87% of MFI clients have bank accounts in the West and 95% do so in the East. Lenders in countries such as Spain, France and Italy disburse their loans via banks or collaborate with banks to ensure that accounts are opened into which loans funds are deposited and from which business transactions can be made. The situation is the same in Eastern Europe where 95% or more of clients have a bank account, mainly due to the necessity of receiving the loan from an MFI via bank transfer. Although there is a small percent of those, who close their account after repaying the loan, a significant number of new bank users keep their accounts, making their first step into the mainstream financial system. It is worth noticing that those people closing their account do so because they cannot afford the relatively small fee needed to keep the account.
A relatively high number of microloan clients have access to insurance in some form. Eastern European clients have a higher rate of access than Western clients. Basic social and health insurance is compulsory for registered entrepreneurs. However Western MFI clients appear to have access to consumer credit to a greater extent than clients in the East.
Both in the West and East, less than 10% are reported to have savings, making them vulnerable to sudden changes in income, health problems etc. This number is however underestimated in Eastern Europe where a basic bank account is a savings-transaction account, so a number of those who are transaction account owners have savings there as well. Additionally, the majority of clients of credit unions have savings with the same union they take loans from.
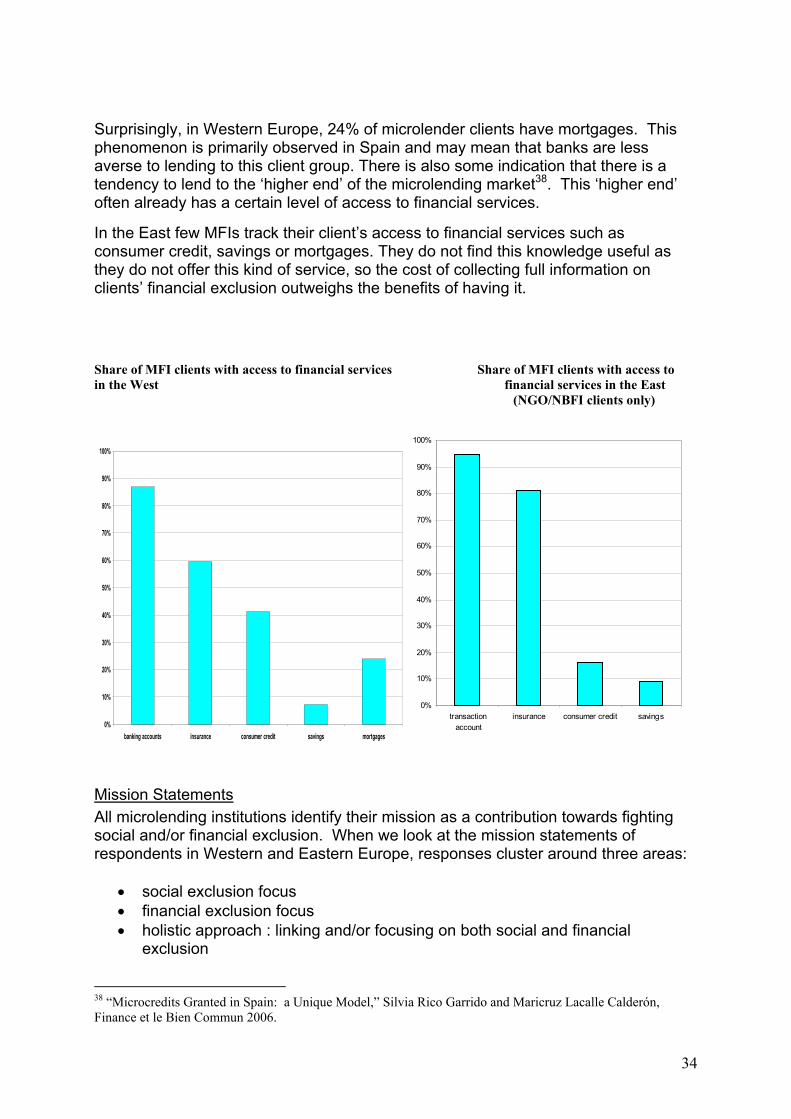
34
Surprisingly, in Western Europe, 24% of microlender clients have mortgages. This phenomenon is primarily observed in Spain and may mean that banks are less averse to lending to this client group. There is also some indication that there is a tendency to lend to the ‘higher end’ of the microlending market38. This ‘higher end’ often already has a certain level of access to financial services.
In the East few MFIs track their client’s access to financial services such as consumer credit, savings or mortgages. They do not find this knowledge useful as they do not offer this kind of service, so the cost of collecting full information on clients’ financial exclusion outweighs the benefits of having it.
Share of MFI clients with access to financial services Share of MFI clients with access to in the West financial services in the East (NGO/NBFI clients only)
0%
10%
20%
30%
40%
50%
60%
70%
80%
90%
100%
banking accounts insurance consumer credit savings mortgages
0%
10%
20%
30%
40%
50%
60%
70%
80%
90%
100%
transactionaccount
insurance consumer credit savings
Mission Statements All microlending institutions identify their mission as a contribution towards fighting social and/or financial exclusion. When we look at the mission statements of respondents in Western and Eastern Europe, responses cluster around three areas:
• social exclusion focus • financial exclusion focus • holistic approach : linking and/or focusing on both social and financial
exclusion
38 “Microcredits Granted in Spain: a Unique Model,” Silvia Rico Garrido and Maricruz Lacalle Calderón, Finance et le Bien Commun 2006.

35
The biggest share of institutions has a holistic approach linking the work towards financial inclusion with the broader issue of social inclusion of their clients.
26%
27%
47%social exclusionf inancial inclusionboth social and f inancial exclusion
Mission Statement
Below is a sample of microlender mission statements: “To ensure the socio-economic inclusion of people and collectives of risk of exclusion” - Spain “Addressing financial exclusion is our priority, followed by retaining and creating jobs, and improving the local economy in our region,” UK “Facilitate access to credit for start-up businesses and for business development and to help unemployed create their own businesses” - Belgium Socially responsible business creation/development funding, for people excluded from credit access or lacking collateral - France “To support economic, social, cultural, educational and pro-environmental initiatives of rural and small town inhabitants, thus contributing to all-sided, sustainable development of rural Poland.” Poland “Our mission is to support the entrepreneurs in Bulgaria, by providing alternative sources of financing for start-ups, small and medium business, which do not have access to bank system sources of capital.” Bulgaria Microlender mission statements demonstrate a shared view that microlending contributes to social inclusion via employment and that their role is to address both social and financial exclusion. All microlending institutions identify their mission as a contribution towards fighting social and/or financial exclusion. A mission statement’s role is to guide the institution through their every day performance. The next sections go beyond the mission statement and look whether

36
client targeting and services offered fit with their mission and experience of social and financial exclusion in the program area. In addition, impact measuring is discussed.
Client Targeting This next section compares at risk groups identified by microlenders with the groups they officially target and those actually accessing microloans. The purpose is to see where there is consistency between groups identified as at risk and client targeting and to see whether, in practice lenders, are successful in reaching the groups identified. When asked about the types of clients they target, Western and Eastern European microlenders identified a range of client groups: unemployed people, poor people, self-employed, women, ethnic minorities, immigrants, youth, disabled people, rural and urban populations and the financially excluded. In Western Europe the focus in order of frequency is on the financially excluded followed by women, unemployed, immigrants and the self-employed. In Eastern Europe, where only NGOs/NBFIs shared this information, the focus is on self-employed, rural populations, the unemployed and women. One-third of the institutions target ethnic minorities especially in countries with a significant Roma population like Romania, Bulgaria and Slovakia.
Share of Western MFIs saying they target different client groups
0
10
20
30
40
50
60
70
unemployed people
poor peo
ple
self-e
mployed
women
ethnic
minority g
roups
immigran
ts
youth (1
8-25 y
ear o
lds)
disabled
people
rural
population
urban
population
financia
lly exc
luded
Perc
ent

37
Share of Eastern MFIs saying they target different client groups
0%
10%
20%
30%
40%
50%
60%
70%
unemployed poor people self-employed
women ethnic immigrants youth disabled rural urban fin-excl.
The main characteristic differentiating Eastern from Western Europe is that none of the Eastern institutions target immigrants, as this phenomenon remains on the margin of social and economic life. And Western European organizations do not appear to be targeting rural areas. Are MFIs targeting those they have identified as at risk of social exclusion? There is a good match between the characteristics and groups identified by MFIs as being at risk of social exclusion and those client types MFIs say they target. For example, the unemployed were cited as most at risk of exclusion and in Eastern Europe unemployed people are the second most frequently cited target group and in the West, the third most frequently cited target group. Similarly there is coherence with respect to women and rural areas. Youth, however, in both regions do not appear to be receiving particular attention. Since the most common microfinance product is a business loan young people are perceived by some lenders as very risky clients because they have little or no business experience. How successful are MFIs in actually reaching those they identify at risk of exclusion? The mapping exercise collected data on disbursement of loans to different client groups in the West and the share of different client groups in the outstanding loan portfolio in the East. Disaggregated loan data is not available for the full list of at risk groups identified by microlenders. The risk categories where data is available are women (gender), immigrants, youth, disabled people and rural clients. In Western Europe overall, 41% of loan clients are women. In Italy, Norway and Spain the majority of loan clients are women. Four institutions serve women exclusively in Western Europe. In Eastern European countries female borrowers represent under 50% of clients with women the vast majority of clients in Slovakia. In Eastern Europe there are 3 institutions that almost exclusively serve women.
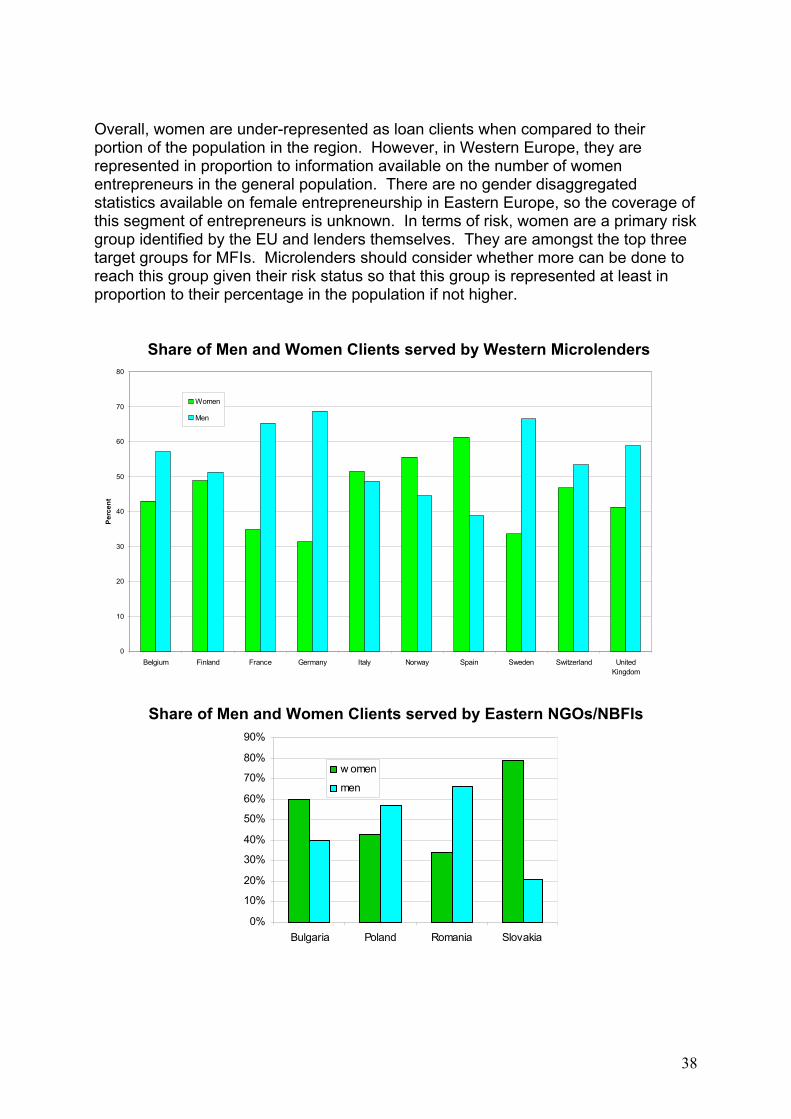
38
Overall, women are under-represented as loan clients when compared to their portion of the population in the region. However, in Western Europe, they are represented in proportion to information available on the number of women entrepreneurs in the general population. There are no gender disaggregated statistics available on female entrepreneurship in Eastern Europe, so the coverage of this segment of entrepreneurs is unknown. In terms of risk, women are a primary risk group identified by the EU and lenders themselves. They are amongst the top three target groups for MFIs. Microlenders should consider whether more can be done to reach this group given their risk status so that this group is represented at least in proportion to their percentage in the population if not higher. Share of Men and Women Clients served by Western Microlenders
0
10
20
30
40
50
60
70
80
Belgium Finland France Germany Italy Norway Spain Sweden Switzerland UnitedKingdom
Perc
ent
Women
Men
Share of Men and Women Clients served by Eastern NGOs/NBFIs
0%
10%
20%
30%
40%
50%
60%
70%
80%
90%
Bulgaria Poland Romania Slovakia
w omen
men
39
For other groups at risk of poverty and social exclusion, 7% of microloan clients in the West are ethnic minorities, 12% are immigrants, 11% are youth and less than 1% of clients are disabled people. It is important to treat the data on these groups with caution as only one third of institutions participating in the mapping exercise provided loan data on these clients. In the East the other client groups which are tracked by the majority of MFIs are rural borrowers and ethnic minorities. In Eastern Europe, rural clients are most often served by NGOs and NBFIs. One third of NGOs and NBFIs are located in rural areas and villagers constitute almost all of their clients. However, these MFIs have smaller outreach than their urban counterparts. Additionally, microfinance banks which serve much larger borrower numbers have mostly urban clients which further adds to the under-representation of the rural population among microfinance borrowers. All in all, the share of rural borrowers ranges between 15 and 40% in Eastern European countries and is below the share of rural inhabitants in each country39. With respect to ethnic minorities, in Eastern Europe three MFIs target ethnic minorities. Ethnic minorities appear to constitute only a fraction of microfinance clients although in some countries, like Bulgaria, Romania and Slovakia they represent between 1.7% and 4.7% of the population. In Western Europe, it is difficult to judge whether ethnic minorities are being reached in proportion to their representation in the population. In many countries it is not legal to ask people their ethnic background. The case of immigrants in Western Europe is similar. Although the study adopted a single definition of immigrant, (someone born outside of the EU/EEA), in practice, each country defines who is an immigrant in a different manner. In addition, data received from the UK mixed immigrants and ethnic minorities together whilst in Norway the same clients were doubled classifies as ethnic minorities and immigrants. However, previous work by EMN suggests that in some countries, immigrants are well represented amongst loan clients.40
39 Share of rural population in East European countries: Bulgaria – 30%; Hungary – 34%; Lithuania – 33%; Poland – 38%; Romania – 45%; Slovakia – 42% 40 EMN Working Paper Number 3, “Immigrant Participation in Microloan Programmes in Western Europe,”Miriam Guzy and Tamara Underwood, 2006.

40
Share of Different Types of Clients served by Western MFIs
Percent of Total Loans Disbursed in Each Country 2005
0
10
20
30
40
50
60
70
80
90
100
Belgium Finland France Germany Italy Norway Spain Sweden Switzerland UnitedKingdom
Perc
ent
Ethnic MinoritiesImmigrantsYouthDisabled People

41
Share of Different Types of Clients served by Eastern MFIs
0%
10%
20%
30%
40%
50%
60%
70%
80%
90%
100%
Bulgaria Poland Romania Slovakia
rural
urban
As with immigrants and ethnic minorities there are also definitional challenges with respect to youth. The principal lender focusing on youth in Western Europe defines youth as 14 to 30 year olds whilst Eurostat data considers youth as those 15 to 24 years of age. Bearing these definitional differences in mind, it appears that lenders in Western Europe are reaching youth at a slightly lower rate than their representation in the population. According to Eurostat, as of 1997, 13.5% of the EU 25 population and 13% of the EU 15 population was between 15 and 24 years of age.41 The mapping exercise shows that youth represent approximately 11% of borrowers in Western Europe overall but in countries such as the UK and Belgium they represent well over their proportion of the population.42 The above findings suggest that MFIs in both regions need to develop monitoring systems that track access to microloans by these at-risk groups. Given legal and definitional constraints, methods need to be found for both defining and assessing to what extent these groups are represented amongst program clients. In order to address exclusion of these groups, lenders should consider ways to increase at-risk groups’ participation in microlending programs in proportion to their numbers in the population and higher.
41 Eurostat 42 Youth entrepreneurship represents less than 1% of total entrepreneurship across the EU 15, although more than 50% of young people express an interest in starting a business. Young people are 3 times as likely to be unemployed as older people in the EU. See: “Youth Entrepreneurship: Latent Entrepreneurship, Market Failure and Enterprise Support,” F. Greene, 2005, National Council for Graduate Entrepreneurship, Policy Paper 2, UK.

42
Addressing Social Exclusion How Can Social Exclusion be Addressed? In Western Europe, respondents thought that the public sector should play a more important role in tackling social exclusion by promoting new policies to help people enter the labor market and by building stronger collaborative links with the private sector. They also believed that it is important to pay more attention to all exclusion and discrimination factors and to identify specific tailor-made responses for each type of exclusion.
How do you think social exclusion can be addressed?
23%
36%
27%
23%
18%
9%
0%
5%
10%
15%
20%
25%
30%
35%
40%
Paying attentionto all exclusion
anddiscrimination
factors
Policies to helppeople enter in
the labour market
Morecollaboration
betw een publicand private
sectors
Help excludedpeople w ithtailor-madeservices
With financialinclusion
Increasedaw areness of
challenges facedby entrepreneurs
Paying attention to all exclusion and discrimination factors
Policies to help people enter in the labour market
More collaboration betw een public and private sectors
Help excluded people w ith tailor-made services
With f inancial inclusion
Increased aw areness of challenges faced byentrepreneurs
In the East, the most important action identified was to create a set of tools that would support people in the process of social inclusion. The solutions should be more client-driven, fitting better individual needs. Several respondents praised the programs currently implemented as sufficient. However, to make them more efficient in terms of social inclusion, they recommended that all the activities undertaken be integrated, so that clients receive a package of services instead of applying for separate services often overlapping each other and not fully meeting their current needs. One of the most important issues here is the cooperation between non-governmental organizations and state institutions, including both local and European Union levels. Not surprisingly support in setting up businesses was one of the specific tools identified to tackle exclusion. Another solution suggested supporting beneficiaries with grants and scholarships. Microlender Efforts to Address Social Exclusion

43
Western European respondents believe they are fighting poverty and are addressing social exclusion by helping people enter the labor market by starting businesses. A portion sees the provision of microcredit as a tool in this effort, particularly for the unemployed. Networking and collaboration with like-minded organizations are also considered important ways in which lenders combat social exclusion.
Is your organisation addressing social exclusion or any aspects of it and how ?
57%
39%
26%
0%
10%
20%
30%
40%
50%
60%
Helping people enterthe labour marketthrough business
start up
Providing Microcredit without guaranties
especially forunemployed people
Collaboration innational andinternational
networks that followthe same objectives
Helping people enter the labour market throughbusiness start up
Providing Microcredit without guarantiesespecially for unemployed people
Collaboration in national and internationalnetworks that follow the same objectives
The majority of MFIs in Eastern Europe took up microfinance services as a main solution to tackle social exclusion through financial inclusion of entrepreneurs. Business development and as a consequence financial stability and living conditions improvement are considered as one of the most effective solutions. Many lenders provide pre- and post-lending business development support which assist entrepreneurs to access lending and improve the likelihood of business survival and growth. In Western Europe over half of organizations participating in the mapping exercise provide pre and post loan support. Most of this support is provided free of charge. Similarly in the East, half of the institutions provides businesss development services and 60% offer training in enterprise management. For example, institutions in Poland, Slovakia, Belgium, France, Italy and the UK, combine various elements such as education, grants and training for unemployed funded from different sources. In these examples, organizations combine various programs’ outcomes to achieve their overall mission. A separate group of institutions are credit unions which have the most holistic approach as they work on a community level with people that share a common bond. Apart from providing financial services they also contribute to social inclusion. By being membership-governed institutions they increase members’ participation in society and improve their self-esteem by promoting members’ ownership of the institution.

44
Addressing Financial Exclusion Although in Western Europe most MFIs consciously target financially-excluded people it is not so in Eastern Europe where only a third of institutions specified the focus on this group of clients. In practice, however, the majority of MFIs in the East serve those who cannot access credit facilities in mainstream banks either because they do not meet the eligibility criteria or because the banks do not operate in their vicinity. Despite the low level use of various financial services by microloan clients demonstrated in previous sections, few MFIs provide financial services other than business loans for enterprise development, with only 18% of respondents in Western Europe doing so. In Eastern Europe less than 10% of NGOs/NBFIs provide financial services other than business loans. In the East, services such as savings, insurance, consumer credit are offered only by deposit-taking institutions such as credit unions and microfinance banks. Most microlenders in Western Europe are unable to provide these services for legal and regulatory reasons. Share of MFIs providing selected loan products and other financial services in the West and East

45
0
20
40
60
80
100
120
business loans consumer/personalloans
savings products insurance money transfer services pensions home mortgages
Perc
ent
govtbankNGOcredit union
0%
20%
40%
60%
80%
100%
business loans agricultural loans personal loans housing loans savings insurance money transfers
government institutionsCusNGO/NBFIsMFBs
An exception in Western Europe is a handful of UK institutions that provide consumer loans, ‘back to work’ loans, education and training loans, debt consolidation loans and home improvement loans. The role of employment readiness loans such as back to work and education/training loans in promoting economic inclusion via employment deserves further attention as do debt consolidation loans that improve the credit worthiness of customers and therefore their prospects of accessing mainstream financial services in the future. Similarly, the contribution of personal and home loans to social inclusion deserves attention. In addition to information on financial products offered by lenders, the mapping exercise also asked respondents to describe the actions they undertook to help clients gain access to mainstream financial services. Although MFIs are aware of the degree to which clients have access to financial services, it appears that MFIs do little to help clients move to the mainstream financial sector. In Western Europe, 13% of respondents provided relevant responses to this question and 33% did so in
46
Eastern Europe. Actions undertaken include helping clients to open bank accounts, helping to negotiate business bank accounts with the banking sector and helping clients to repair their credit history. It may be that MFIs assume that providing microcredit in itself improves the likelihood that the client will eventually access mainstream banking and other mainstream financial services. On the other hand, for some there may be an incentive to keep the clients with the MFI rather than make them move to banks. In addition, in Western Europe, microcredit is still very young. MFIs are very focused on building up their portfolios and testing methodologies. They may not have looked ahead strategically to how they can contribute to mainstream financial inclusion or where legally possible, consider providing certain services themselves. In Eastern Europe, there is however a programme in Bulgaria that does take a strategic position on moving clients toward mainstream services, the JOBS programme which after two lending rounds moves clients to banks for further lending. Measuring Impact In order to see how microfinance responds to the issue of social and financial exclusion, it is useful to look not only at mission statements and target groups served but also at whether the impact of operations is measured and how. To do so, the mapping exercise asked lenders about the types of indicators monitored and the methods used for doing so. In particular, the Working Group was interested to know to what extent lenders monitor qualitative indicators of social inclusion such as participation in community associations and access to health, education and business support services. MFIs monitor impact in the areas that are linked to their mission. In the East and West the biggest number of MFIs that track various impact indicators are those MFIs with a broader mission towards social and financial inclusion as opposed to those that work towards only financial inclusion. Each of the indicators listed was measured by at least half of the institutions with a more holistic approach. In the case of financial inclusion driven MFIs the indicators such as jobs created/sustained and access to mainstream financial services were far more often measured than any other indicators. The mapping exercise also found that Western MFIs carry out impact surveys less frequently than Eastern European MFIs regardless of the type of the indicator. This may be related to the age of the sector in the West and lack of funds when compared to the East. In the East, almost each type of indicator is measured by almost half or more of the MFIs. This is not the case in the West. In both parts of Europe the number of jobs created/sustained is the indicator most commonly monitored by MFIs. This indicator allows for monitoring the MFI
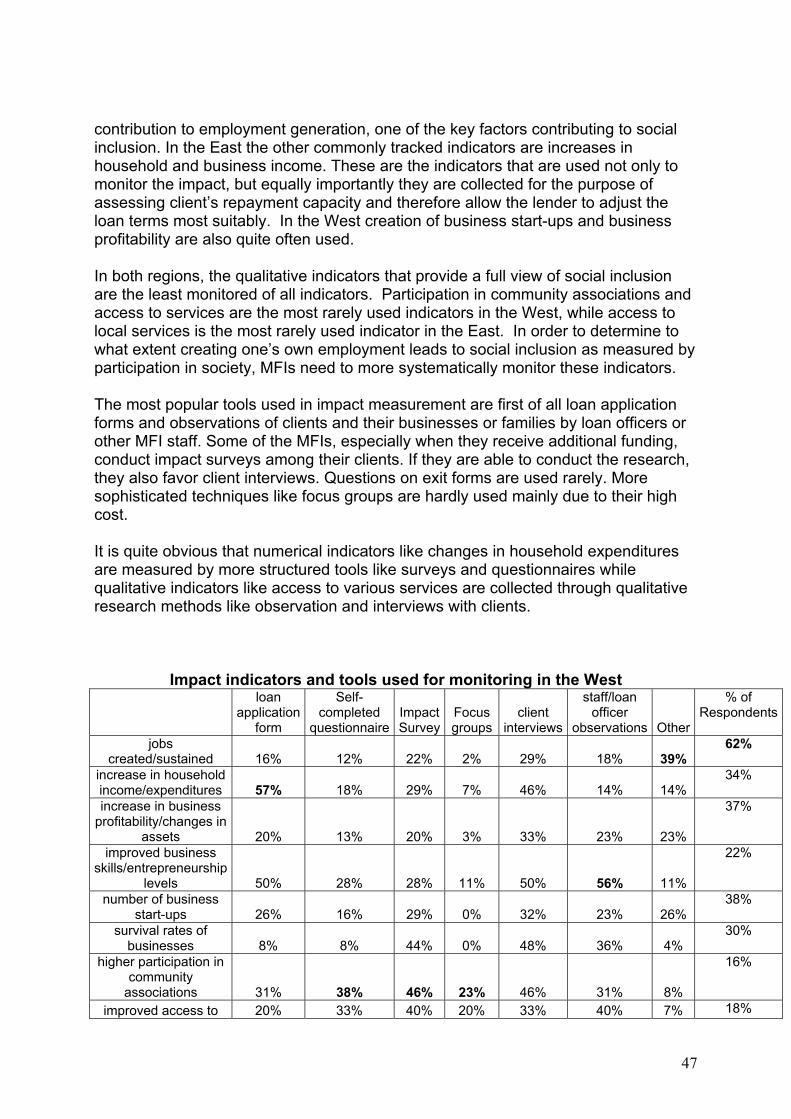
47
contribution to employment generation, one of the key factors contributing to social inclusion. In the East the other commonly tracked indicators are increases in household and business income. These are the indicators that are used not only to monitor the impact, but equally importantly they are collected for the purpose of assessing client’s repayment capacity and therefore allow the lender to adjust the loan terms most suitably. In the West creation of business start-ups and business profitability are also quite often used. In both regions, the qualitative indicators that provide a full view of social inclusion are the least monitored of all indicators. Participation in community associations and access to services are the most rarely used indicators in the West, while access to local services is the most rarely used indicator in the East. In order to determine to what extent creating one’s own employment leads to social inclusion as measured by participation in society, MFIs need to more systematically monitor these indicators. The most popular tools used in impact measurement are first of all loan application forms and observations of clients and their businesses or families by loan officers or other MFI staff. Some of the MFIs, especially when they receive additional funding, conduct impact surveys among their clients. If they are able to conduct the research, they also favor client interviews. Questions on exit forms are used rarely. More sophisticated techniques like focus groups are hardly used mainly due to their high cost. It is quite obvious that numerical indicators like changes in household expenditures are measured by more structured tools like surveys and questionnaires while qualitative indicators like access to various services are collected through qualitative research methods like observation and interviews with clients.
Impact indicators and tools used for monitoring in the West
loan application
form
Self-completed
questionnaireImpact Survey
Focus groups
client interviews
staff/loan officer
observations Other
% of Respondents
jobs created/sustained 16% 12% 22% 2% 29% 18% 39%
62%
increase in household income/expenditures 57% 18% 29% 7% 46% 14% 14%
34%
increase in business profitability/changes in
assets 20% 13% 20% 3% 33% 23% 23%
37%
improved business skills/entrepreneurship
levels 50% 28% 28% 11% 50% 56% 11%
22%
number of business start-ups 26% 16% 29% 0% 32% 23% 26%
38%
survival rates of businesses 8% 8% 44% 0% 48% 36% 4%
30%
higher participation in community
associations 31% 38% 46% 23% 46% 31% 8%
16%
improved access to 20% 33% 40% 20% 33% 40% 7% 18%

48
local services (health educ bus supp)
improved access to mainstream banking
services 36% 16% 32% 4% 60% 36% 4%
30%
business/product diversification 19% 25% 19% 0% 50% 56% 0%
20%
change in client self-confidence 14% 19% 43% 10% 52% 38% 5%
26%
Impact indicators and tools used for monitoring in the East
questions on
application form
Self-complet
ed question
naire (exit form)
impact survey
focus groups
client interview
s
staff/loan officer observat
ions
% of respond
ents
jobs created/sustain
ed
60% 13% 40% 7% 27% 40% 80%
increase in household
income/expenditures
47% 20% 40% 7% 33% 47% 67%
increase in business
profitability or business assets
53% 20% 33% 7% 27% 47% 67%
improved business
skills/entrepreneurship levels
27% 20% 13% 7% 27% 40% 47%
higher participation in associations
7% 7% 13% 7% 13% 33% 47%
improved access to local services (health educ bus supp)
7% 7% 20% 7% 27% 33% 40%
improved access to
mainstream banking services
33% 13% 27% 7% 27% 53% 67%
% of respondents
73% 33% 40% 7% 40% 60%

49
One of the greatest desires of microfinance institutions is to be able to measure their undertakings’ impact on their clients. MFIs are able and prepared to collect the information. Furthermore, they already collect a lot of information useful for impact measurement. However, in practice MFIs face many obstacles including:
− lack of funds for additional effort and tools to measure the impact
− lack of knowledge and skills (especially when an MFI does it on its own)
− various microfinance programs connected with various sources of funding – different requirements, target group and value of funds interrupts the clear strategy of impact measurement
− too many circumstances influencing the economic status of the clients (i.e. general country economic situation, natural disasters, changing regulatory environment etc.)
Lenders in both regions need to be supported to develop tools and methods to overcome these challenges.

50
Analysis and Challenges Microfinance institutions in Western and Eastern Europe are driven by the mission of alleviating exclusion, both social and financial, by bringing financial services to the unemployed, financially excluded and particular at risk groups as pointed out by the European Commission Directorate, such as women, unemployed, the poor, immigrants, ethnic minorities and in some cases youth. In addition, in Eastern Europe there is emphasis on rural clients. Indeed, all microlenders surveyed focus on serving one or several of these groups of clients and monitor the impact of their interventions on client lives on several levels. However, differences exist between the West and East over the degree to which attention is given to particular groups. In Eastern Europe, a significant number of microlenders target rural communities, which does not seem to be the case in Western Europe. In Eastern Europe agriculture remains unreformed and underinvested, therefore almost half of Eastern MFIs focus on providing services in rural areas for farming as well as off-farm activites. In Western Europe, on the other hand, most microlenders consciously target financially excluded while in the East only one third stated them as a target group. This does not mean that Eastern European MFIs do not serve the excluded. In most cases only the financially-excluded use microfinance services as these are more expensive than what banks offer, so only those who cannot access banks’ services are microfinance clients. The MFIs therefore do not place focus on specific activities ensuring the right client selection. In the West, where interest rates are capped and therefore loan costs and risks are subsidised, microlenders more carefully check clients’ eligibility to make sure that their services are used by the target group. Microlenders fulfil their mission by providing financial services but in both sub-regions they concentrate on providing access to credit for business purposes, rather than a range of financial products. Few MFIs offer personal or housing loans which are also important for better fulfilment of basic needs and social inclusion. Only banks and credit unions provide access to other financial services such as savings, transfers or insurance. Additionally, microlenders do not actively help their clients to move towards mainstream financial services once they gain experience, their business grows and they move toward becoming become eligible for the banking sector. Only two cases in the East is known for providing such assistance. However, indirectly, microlenders contribute to increased bank account usage as the majority of microlending transactions are processed via banks. Despite the success of microlending in reaching disadvantaged groups, several challenges remain which negatively affect the impact of microfinance and its role in social and financial inclusion.

51
1. Outreach and scale of operations With the exception of credit unions in Eastern Europe, the microfinance sector is very young, in particular in Western countries, and its scale of operations is much smaller than that observed in the South. However, it is difficult to compare between the different regions of the world as the share of potential clientele of microfinance services in European countries (Western in particular) is much smaller given high living standards in Europe and developed mainstream financial services. As no demand studies have been conducted so far, it is difficult to assess the penetration rate and therefore the relative scale compared to other regions but a rough estimation reveals that a large gap between supply and demand exists. The mapping study did not capture all microlending taking place in the West. However, from the data it appears that less than 1 percent of the population of productive age received microcredit while the financial exclusion rates are estimated at 10% of the population. In some countries of the East, up to 4% of the population aged 16-65 are microfinance clients but reliable data on financial exclusion are not available. Despite the young age, the industry is not growing as fast as one would expect from an emerging industry where usually high growth rates are observed in the initial phase of development. Also, compared to other microfinance industries worldwide, growth rates are below the average43 . In the West, the industry is growing slower than in the East but the growth rates have increased year on year in terms of numbers of loans as well as increasing interest on the part of governments and the private sector. 44 The banking sector, in particular, could play a crucial role in increasing scale by making loans funds available to NGOs via loans for onward lending as in France or special partnerships similar to the relationship between savings banks and NGOs in Spain. In the East, growth rates continue to slow down, which on the one hand is a sign of reaching a mature stage of growth. On the other hand, slower growth is a sign of the increasing barriers to expanding operations. Apart from legal obstacles discussed below in section 2, Eastern MFIs have to cope with increasing competition from commercial banks which have become more interested in serving the micro and small enterprise sector (shrinking target market of financially excluded). In addition, access to funding is becoming difficult due to the donor shift of interest from Eastern European countries to Central Asian republics (shrinking funding opportunities). Entrance of commercial banks into the financial services market for micro and small entrepreneurs provides both a challenge and an opportunity for MFIs in the East. The challenge lies in the need to move towards serving the lower-income segment of entrepreneurs who are more difficult to reach, more costly to serve and, above all, need different financial products. We can already observe the move towards the lower-end market as 90% of MFIs deepened their outreach by lowering the average loan size in some cases by as much as one-third. Lowering entry barriers for
43 see “Brief History and Overview of the Microcredit Sector in West and East” at the beginning of the report pages 13-16 44 “Overview of the Microfinance Sector in Western Europe: 2002-2003,” nef-EMN.

52
entrepreneurs by commercial banks is a great opportunity for microfinance clients to become financially-included and for MFIs to more effectively facilitate the transition to mainstream banking services. 2. Legal Environment Microlenders stumble over legal and regulatory barriers that prevent them from reaching target clients with effective services and hinder growth of the sector. Similarly microenterpreneurs face challenges that affect the launch and growth of their businesses. In Western Europe the principal barriers affecting lenders are interest rate caps, interdiction of borrowing for on-ward lending and restrictions on providing other financial services. None of the countries in the West and East allows for deposit collection by non-licensed institutions and in some cases, like Bulgaria and Romania, even credit unions are prohibited from this kind of activity among their members. For microentrepreneurs, in some countries the welfare system creates benefits traps making the transition from unemployment to employment through microenterprise difficult. Business registration processes and taxation regimes can discourage potential entrepreneurs and affect business growth, particularly in the first years after launch.45 . 3. Monitoring Outreach to At Risk Groups Most microlenders disaggregate their data by gender. Data on other at risk groups is not consistently available across the sector and seems to be tracked on an ad-hoc basis. Additionally, the numbers of specific at risk groups reached, such as ethnic minorities, immigrants and youth,is difficult to determine as is their relative representation in comparison to their representation in the population at large. In the case of ethnic minorities, immigrants and youth, there are definitional differences across countries. In some countries legal restrictions regarding the collection of information such as ethnic minority status make monitoring their access impossible. 4. MFI performance and sustainability Sustainability is crucial for ensuring long-term survival in the market through independence from donor subsidies. However, none of the Western European organizations can sustainably recover their costs at present. There is debate over the meaning of sustainability and whether clients should bear the full costs of
45 “Policy Measures for Promotion of the Use of Microcredit in Europe for Social Inclusion,” Evers&Jung, Facet, nef, EMN, MFC, 2005.

53
microlending. With high staff and overhead costs, some have estimated that in the UK, for example, interest rates of 60% would need to be charged to cover risk and loan processing costs on personal loans offered by microlenders. Interest rates in the UK change with loan size and personal loans currently offered are much smaller that the average microenterprise loan and therefore the 60% rate is higher than that likely needed for a larger microenterprise loan. 46 Nevertheless, this figure does give a sense of the vast difference between risk and cost recovery interest rates and those actually charged in practice. Indeed, in most Western European countries there are interest rate caps in the range of 5 to 8%. The average interest rate charged in Western Europe is 10%. Although charging such interest rates is not a possibility at present, this calculation gives a sense of the cost of microlending in the Western European environment. These costs need to be borne somehow and at the present the public sector is playing an important role in this effort. Even so, there are two risks here for MFIs in Western Europe. First, continued long-term public commitment to the sector and covering its costs is required. Will this commitment be sustained and for how long? Second, while operating costs are covered in major part from public sources, there may be insufficient incentive towards monitoring portfolio performance and improving efficiency and the quality of services as there is no market mechanism that verifies the final results. As an example, if one looks at portfolio performance data and loans per loan officer, we see big differences between the West and the East. First of all, in Western Europe, less than half of respondents provided data on repayment rates, percent portfolio at risk, value of write offs and rescheduled loans. For some organizations this is for confidentiality reasons. Others do not seem to be tracking this information. Secondly, average portfolio at risk rates are high for certain countries and organizations providing this data. However, repayment rates averaging 90% (See Annex I), suggest that even with elevated portfolio at risk rates, many MFIs manage delinquencies and collections effectively.
46 Personal communication, Sarah McGeehan, cdfa, 2006.

54
Average portfolio at risk over 30 days among MFIs in Western Europe
0% 5% 10% 15% 20% 25%
Belgium
Finland
France
Germany
Ireland
Italy
Norway
Spain
Sweden
Switzerland
United Kingdom
credit unionNGObankgovt
In Eastern Europe, the majority of MFIs are self-sustainable and their future is less dependent on government programs of support. A market-driven approach allows MFIs to attract funding from commercial sources and become in the long run an important part of financial markets. Sustainability is achieved by charging sustainable interest rates which reflect the MFI cost structure. The demand for microfinance services verifies the interest rate levels motivating the MFIs towards increased productivity and cost control. Evidence exists that profitable MFIs grow much faster than unprofitable MFIs, as the profits help fund the growth.47 By comparison to Western Europe, with only a few exceptions, Eastern European MFIs retain quite good portfolio quality. This is a result of strict repayment policies and little tolerance for delays. Timely repayments are part of ‘best practice’ recommendations followed by the majority of MFIs in Eastern Europe. All MFIs use loan tracking information systems which allow them to monitor the repayments on a timely basis. 47 “The State of Microfinance – Outreach, Profitability and Poverty”. A. Gonzalez (MIX/CGAP), R. Rosenberg (CGAP)

55
Average portfolio at risk over 30 days among MFIs in Eastern Europe
0.0% 5.0% 10.0% 15.0% 20.0% 25.0% 30.0%
Bulgaria
Latv ia
Lithuania
Poland
Romania
Slov akia
banks
NGOs
credit unions

56
Recommendations Recommendations on EU level - recognize that microfinance can be an effective tool for combating social and financial exclusion Microfinance institutions in the EU focus on providing services to vulnerable groups in population. MFIs operate in almost every country with the mission of reducing financial and/or social exclusion. Some of them specifically work with those who cannot access financial services from mainstream institutions while the other adopt a wider agenda for supporting those who lack other qualities necessary for full participation in society. All of them, by providing access to capital for business creation and growth, address the principal cause of social exclusion: unemployment. Indeed, in recognition of the role of microfinance in poverty reduction Mohammed Yunus received a 2006 Nobel Peace Prize. Mr Yunus, founded Grameen Bank in Bangladesh which is one of the pioneers of micro-credit lending schemes for the poor, especially women. Within 30 years the Bank reached 6.6 million borrowers. -recognize that certain groups at risk of social and financial exclusion are under-represented in microfinance programs. Women, youth and rural areas appear to be underserved by microfinance programs in the EU. Definitional difficulties make it difficult to ascertain representation of immigrants and ethnic minorities. Strategies for promoting access and participation by under-represented groups should be promoted and encouraged at all levels. - recognize the importance of developing common and consistent definitions in the EU for certain at-risk groups for data collection and monitoring purposes. MFIs target the unemployed, self-employed and other disadvantaged groups, including women, ethnic minorities, immigrants, rural populations and youth. However, inconsistent definitions and legal restrictions make collection and monitoring of data on certain groups difficult if not impossible. As information is the first step toward understanding and meeting the needs of particular segments of the population, it is important to develop common definitions for these groups and to consider how this data can be collected legally while also protecting individual rights. In addition to adopting common Europe-wide definitions where possible, MFIs should be supported to develop, at a minimum, their own country specific definitions or agree definitions applicable to the entire sector for ethnic minorities, immigrants and youth. Further they should be supported and encouraged to collect and disaggregate their loan data and monitoring and evaluation information along these lines. - recognize the uniqueness, difficulty and therefore costs of serving microfinance clients in the EU. Unlike in developing countries where microcredit can serve large portions of the population, in the EU microfinance clients are the minority in the population and can be relatively difficult to reach. Here, 15% of the population is at risk of poverty and 10% is financially excluded48. Moreover, microloan clients are often geographically dispersed
48 “Joint Report on Social Inclusion 2004”, European Commission Directorate for Employment and Social Affairs, 2004. Carbo Valverde S. and Lopez del Paso, R., 2005, «Exclusión financiera: un panorama», Perspectivas del sistema financiero, n.º 84,

57
and have been affected by years of unemployment or under-employment. It can be difficult for them to integrate into an economy increasingly dominated by technology and services. These characteristics contribute to their exclusion from the mainstream market of services and raise the issue of the cost of service provision to these groups and the sources for cost recovery. In particular, it is important to recognize the nature of the costs involved, look for ways to minimise them by increasing scale, charging interest rates that cover costs and if these measures are not possible, making a long-term commitment to financing MFI operating costs. - promote management towards better social performance by ensuring MFI’s everyday operations are in line with the mission statement and target groups are reached effectively with appropriate services and that have an impact on clients’ lives. In particular there is a need to strengthen MFI capacity to reach particular groups for whom tailor-made marketing, services and products are often required. The data available from the mapping exercise sample suggest that the participation of particular at risk groups such women, ethnic minorities, immigrants and youth is low compared to the other regions of the world where microcredit operates. This is in part because microcredit in Europe is very young, particularly in Western Europe, and programs are still developing and improving their methodologies. Research carried out by MFC, EMN and their members shows that segmenting the market and understanding the particular needs and capacities of these segments results in better services to these groups. Practical experiences of working with immigrants in the West can be shared with the East and work with ethnic minorities in the East can be shared with the West. Experience in market research and developing programs for women in the East can be shared with programs in the West. - recognize the need for including non-credit services in microfinance for fighting exclusion So far services are dominated by microcredit as a tool for supporting entrepreneurship that responds to the reduction of unemployment – one of the causes of social exclusion. Microfinance demonstrated positive impact on jobs creation through microlending. However, little is done towards the financial inclusion in respect to other financial services, including savings, insurance and money transfers. Only credit unions in some countries of Eastern Europe offer services that address a whole spectrum of financial needs. Greater attention is needed to create regulatory environment that would allow microfinance institutions to extent their financial services to non-credit offerings that will fight all aspects of financial exclusion and social exclusion. - create assessment system/performance standards for assessing operating efficiency of MFIs The discussion of microfinance schools of thought, sustainability, and portfolio performance demonstrated that there are different visions between East and West as well as structural and legal constraints. Nevertheless, for both regions, maximizing operating
Fundación de las Cajas de Ahorros, Madrid, quoted in “Exercising the Right to Credit: Financial Inclusion and the “Microcredits Granted in Spain: a Unique Model, ” Silvia Rico Garrido and Maricruz Lacalle Calderon, Finance et le Bien Commun 2006.
58
efficiency whether as a means toward achieving sustainability or as a means toward ensuring value for money for donors should be a priority. This calls for further work towards creating an assessment system of MFI efficiency which would allow investors and funders to support the best performing MFIs, assist MFIs to improve efficiency and provide incentives towards efficiency improvements. Already, work is currently underway to create guidelines for performance monitoring based on experience of the most successful MFIs in Eastern Europe and other regions of the world. - support cost-effective solutions, provide support based on MFI performance results With the use of performance assessment systems best performing MFIs should gain more attention and support to help them grow and provide services to greater numbers of clients. In particular, cost-effective solutions should gain greater attention and promotion, with the objective to replicate them among other microfinance providers. In order to more fully address social exclusion there is a need for better targeting tools that will ensure the outreach to socially disadvantaged groups. The global experience shows that social impact can be achieved when an institution has a social performance management system in place. - consider ways to promote improved cooperation between non-governmental organizations, state institutions and European Union programs in order that clients receive a package of services instead of applying for separate services often overlapping each other and not fully meeting their current needs. Recommendations for MFIs - place more attention on social performance Microfinance institutions should recognize that they serve a unique market and should be more innovative in developing marketing approaches, products, services and cost-effective delivery mechanisms. In doing so, they should ensure they work to understand the specific needs of particular at risk groups which may be more difficult to reach. In addition, monitoring systems should measure social inclusion indicators related to improved participation in society. Experience in social performance management piloted in the East can be shared with the West. Work on social return on investment and social impact evaluation in the West can be shared with the East. - consider ways to promote improved cooperation between non-governmental organizations, state institutions and European Union programs and determine how to promote a system whereby clients receive a package of services instead of applying for separate services often overlapping each other and not fully meeting their current needs. - recognize that certain groups at risk of social and financial exclusion are under-represented in microfinance programs. Although microfinance institutions focus their activities on serving these groups, many are not being reached in relation to their representation in the overall population. MFIs should pay particular attention on these groups and develop approaches that promote equality of access and participation in microfinance. - develop common definitions for particular at risk groups and disaggregate data to better monitor outreach and impact. In the absence of EU wide definitions, MFIs should
59
develop, at a minimum, country specific definitions or agree definitions applicable to the entire sector for ethnic minorities, immigrants and youth. They should collect data and monitor impact disaggregated along these lines. . - develop long-term plans and work toward sustainability MFIs should be aware of the fact that only long-term presence on the market will allow them to have significant impact on the targeted population. As such, more attention should be put towards adopting practices that will allow MFIs to increase their outreach. This would include developing long-term funding strategies. At the same time they should put greater attention towards sustainability which is fundamental for long-term existence. So far, the example of Eastern European MFIs shows that microfinance services can be provided sustainably, on condition that the full costs can be recovered from clients fees and that the institution runs its operations efficiently and monitors portfolio performance closely. In this area a lot of Eastern European experience could be used in the West. Work toward developing performance benchmarks and standards should receive added attention. - adapt to anticipated changes in demand for microfinance In the East MFIs should realize that over time, with economic development and formal financial sector growth, they will need to shift towards serving more disadvantaged populations. Currently, the major focus of Eastern European MFIs is on self-employed or small businesses who in time will gain better access to formal financial services, the way they do in Western Europe. This will involve changes in products offered and delivery methods that will affect their current mode of operations. In this respect they can learn from their Western counterparts which are already operating in mature markets. Recommendations for networks - engage in promoting microfinance as a tool for social inclusion, so that it becomes a part of the EU agenda. The networks should work with governments and the EU level on creating a better environment for microfinance development as well as assist in structuring the most effective supporting activities. Particular attention should be paid to interest rate caps, borrowing for onward lending, restrictions of provision of a full range of financial services including consumer lending, employment readiness lending, debt consolidation, savings and insurance. - support MFIs in their development On the MFIs level, networks should support MFIs in their work towards better social and financial performance through knowledge exchange, identification and promotion of best practices. In particular the different strands of the sustainability discussion in the West and the broadly accepted approach to sustainability in the East should be brought together for debate and identification of how lenders in the West can adopt sustainability measures successfully used in the East. Similarly work on social return on investment may be of use to MFIs in the East. Networks can also support the development performance benchmarks/standards to include operational and financial performance.
60
Annex 1 - Working Group members Justyna Pytkowska – Group Leader, Microfinance Centre for CEE and NIS, Poland Tamara Underwood, European Microfinance Network, France Agata Szostek, Microfinance Centre for CEE and NIS , Poland Ewa Bankowska, Microfinance Centre for CEE and NIS, Poland Kostadin Munev, UNDP-JOBS Project, Bulgaria Riccardo Aguglia, Fair Finance, UK
Annex 2 - Methodology First, Working Group 1 reviewed the existing literature on social and financial exclusion and EU Eurostat data and indicators on social exclusion. The group debated these definitions and indicators in the context of the work carried out by the members of the respective networks. Second, the group agreed a set of working definitions and indicators for the purposes of the mapping study and used this to develop a questionnaire sent to microfinance institutions operating in EU, European Economic Area (EEA) and accession countries. The mapping exercise focused on microfinance institutions’ 2005 activities. It was divided into two sub-studies, one conducted in Western European Countries (15 EU Members + countries of EEA)49, the second one in the East of European Union (6 EU New Member States and Pre-Accession Countries)50. The division was motivated by the practical knowledge of the microfinance sector on the part of the two regional network organisations MFC and EMN. The division also built on existing data collection processes implemented by the regional networks. The mapping exercise concentrated on 2 areas: social and financial exclusion and background information about MFI operations. For social and financial inclusion, topics covered were:
• microlender mission statements • microlender understanding of social and financial exclusion and poverty • targeting issues in the context of tackling social exclusion • microlender awareness and rates of client access to financial services • actions undertaken to address social and financial exclusion • impact monitoring
49 Western European Countries to which questionnaires were sent: Belgium, France, Germany, Ireland, Italy, Norway, Portugal, Spain, Sweden, Switzerland, United Kingdom 50 Eastern European countries to which questionnaires were sent: Bulgaria, Hungary, Latvia, Lithuania, Poland, Romania, Slovakia. Czech Rep, Estonia and Slovenia were not included in the study as no microfinance activites were found there.
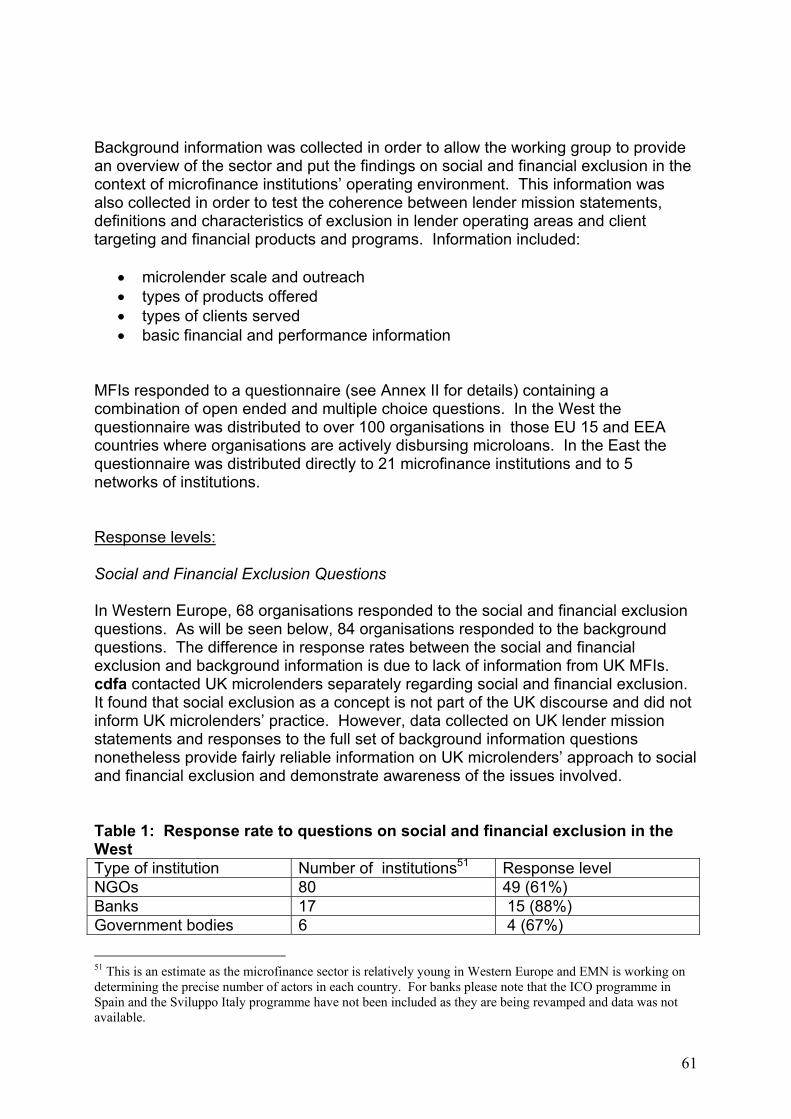
61
Background information was collected in order to allow the working group to provide an overview of the sector and put the findings on social and financial exclusion in the context of microfinance institutions’ operating environment. This information was also collected in order to test the coherence between lender mission statements, definitions and characteristics of exclusion in lender operating areas and client targeting and financial products and programs. Information included:
• microlender scale and outreach • types of products offered • types of clients served • basic financial and performance information
MFIs responded to a questionnaire (see Annex II for details) containing a combination of open ended and multiple choice questions. In the West the questionnaire was distributed to over 100 organisations in those EU 15 and EEA countries where organisations are actively disbursing microloans. In the East the questionnaire was distributed directly to 21 microfinance institutions and to 5 networks of institutions. Response levels: Social and Financial Exclusion Questions In Western Europe, 68 organisations responded to the social and financial exclusion questions. As will be seen below, 84 organisations responded to the background questions. The difference in response rates between the social and financial exclusion and background information is due to lack of information from UK MFIs. cdfa contacted UK microlenders separately regarding social and financial exclusion. It found that social exclusion as a concept is not part of the UK discourse and did not inform UK microlenders’ practice. However, data collected on UK lender mission statements and responses to the full set of background information questions nonetheless provide fairly reliable information on UK microlenders’ approach to social and financial exclusion and demonstrate awareness of the issues involved. Table 1: Response rate to questions on social and financial exclusion in the West Type of institution Number of institutions51 Response level NGOs 80 49 (61%) Banks 17 15 (88%) Government bodies 6 4 (67%)
51 This is an estimate as the microfinance sector is relatively young in Western Europe and EMN is working on determining the precise number of actors in each country. For banks please note that the ICO programme in Spain and the Sviluppo Italy programme have not been included as they are being revamped and data was not available.

62
In Eastern Europe the response levels depended on the type of the institution. While banks, credit unions and government loan funds were more reluctant to disclose their information, the majority of NGOs and Non-bank financial institutions (NBFIs) provided answers. Table 2: Response rate to questions on social and financial exclusion in the East Type of institution Number of institutions Response level Credit Unions 332 57 (17%) NGO/NBFIs 22 13 (59%) Microfinance banks 2 0 (0%) Government funds 103 0 (0%) Background MFI information For Western Europe, background information was collected through the same questionnaire. Eighty-four microlenders responded to the background information questions. Table 3: Response rate to questions on background information in the West Type of institution Number of institutions52 Response level NGOs 80 65 (81%) Banks 17 15 (88%) Government bodies 6 4 (67%) For the Eastern European actors, background information was collected through the same questionnaire and from publicly available sources, such as web sites and annual reports. Table 4: Response rate to questions on background information in the East Type of institution Number of the institutions Response level Credit Unions 332 332 (100%) NGO/NBFIs 22 19 (86%) Microfinance banks 2 2 (100%) Government funds 103 68 (66%)
52 This is an estimate as the microfinance sector is relatively young in Western Europe and EMN is working on determining the precise number of actors in each countries. For banks please note that the ICO programme in Spain and the Sviluppo Italy programme have not been included as they are being revamped and data was not available.
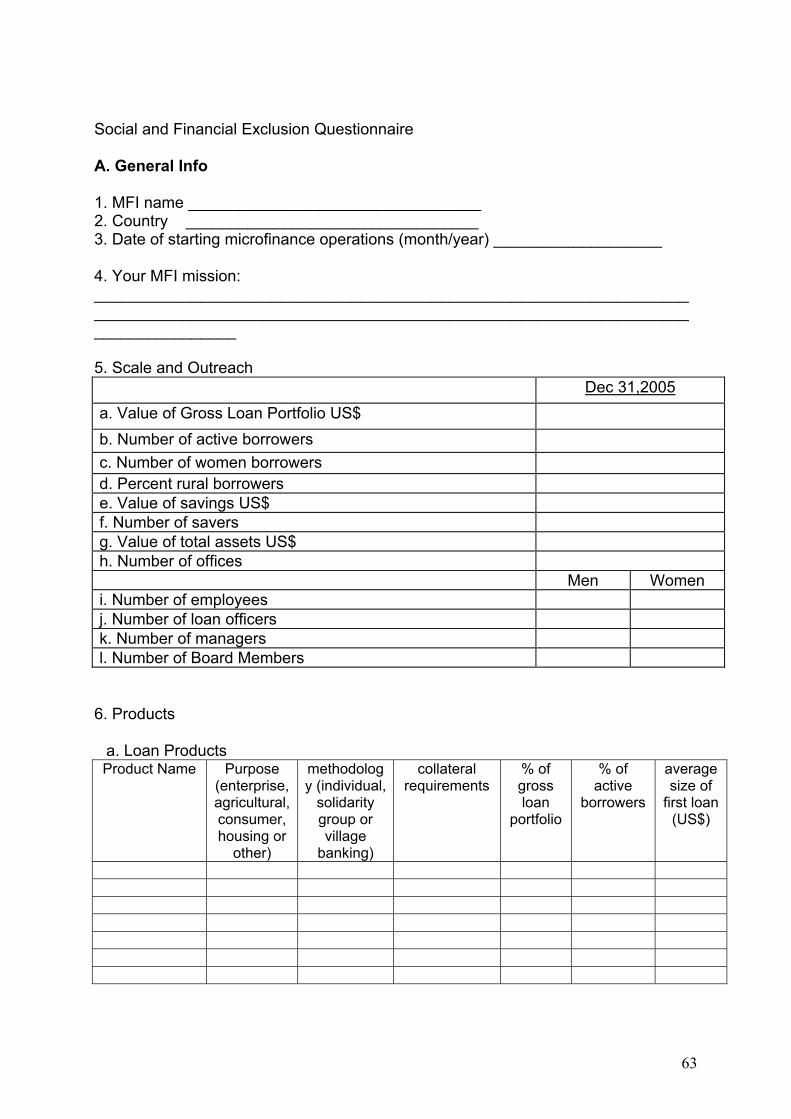
63
Social and Financial Exclusion Questionnaire A. General Info 1. MFI name _________________________________ 2. Country _________________________________ 3. Date of starting microfinance operations (month/year) ___________________ 4. Your MFI mission: ______________________________________________________________________________________________________________________________________________________ 5. Scale and Outreach
Dec 31,2005 a. Value of Gross Loan Portfolio US$ b. Number of active borrowers c. Number of women borrowers d. Percent rural borrowers e. Value of savings US$ f. Number of savers g. Value of total assets US$ h. Number of offices
Men Women i. Number of employees j. Number of loan officers k. Number of managers l. Number of Board Members
6. Products
a. Loan Products Product Name Purpose
(enterprise, agricultural, consumer, housing or
other)
methodology (individual,
solidarity group or village
banking)
collateral requirements
% of gross loan
portfolio
% of active
borrowers
average size of
first loan (US$)
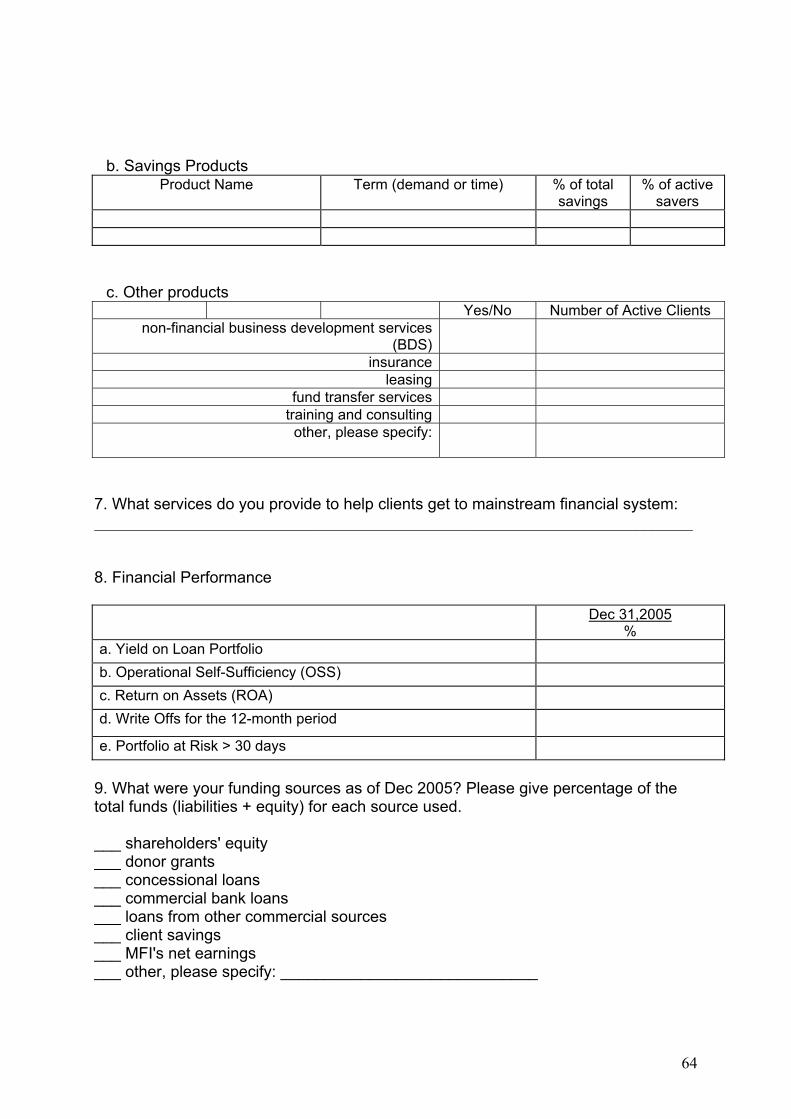
64
b. Savings Products
Product Name Term (demand or time) % of total savings
% of active savers
c. Other products Yes/No Number of Active Clients
non-financial business development services (BDS)
insurance leasing
fund transfer services training and consulting
other, please specify:
7. What services do you provide to help clients get to mainstream financial system: ___________________________________________________________________________ 8. Financial Performance Dec 31,2005
% a. Yield on Loan Portfolio b. Operational Self-Sufficiency (OSS) c. Return on Assets (ROA) d. Write Offs for the 12-month period
e. Portfolio at Risk > 30 days
9. What were your funding sources as of Dec 2005? Please give percentage of the total funds (liabilities + equity) for each source used. ___ shareholders' equity ___ donor grants ___ concessional loans ___ commercial bank loans ___ loans from other commercial sources ___ client savings ___ MFI's net earnings ___ other, please specify: _____________________________

65
B. Targeting
1. Do you have any of the following client-specific forms of targeting? What percentage of your clients do these groups constitute?
Yes/No Approximately, what
percentage of clients do they constitute?
no client-specific targeting the poor unemployed self-employed financially-excluded people women youth disabled ethnic minorities immigrants rural population urban population other, please specify:
2. If you target the poor how do you assess the poverty level of your potential clients? _____________________________________________________________________________ 3. If you target financially-excluded, how do you assess whether the potential client is financially excluded? _____________________________________________________________________________ 4. Approximately what percentage of your clients have:
___bank account for cash transmission and payments ___ insurance ___ short-term consumer credit ___ long-term savings ___ don’t know
5. If you target ethnic minorities, who are they? _____________________________________________________________________________ C. Social exclusion 1. How do you understand the term ‘social exclusion’? _____________________________________________________________________________

66
2. Does it exist in your area of operations? _____________________________________________________________________________ 3. What are its characteristics in your area? _____________________________________________________________________________ 4. How do you think it can be addressed? _____________________________________________________________________________ 5. Is your MFI addressing this problem or any aspects of it? How? _____________________________________________________________________________ D. Impact 1. Do you measure impact of your activities on clients? ___ Yes ___ No 2. If so, what do you measure and how?
questions on
application form
questions on exit form
impact
survey
focus groups
participatory rural
assessment/
wealth ranking
client interview
s
staff/loan
officer observations
other
jobs created/sustained
household income/expenditures
business profitability or changes in business assets
entrepreneurship level/business skills
participation in associations
access to local services (health services, employment office, business support services, etc.)
access to mainstream banking services
other, please specify:

67
3. What impact did you observe in the areas that you ticked? (for instance – if you measure number of jobs created please state this number for 2005). __________________________________________________________________________________________________________________________________________________________ 4. Do you have any reports available about the impact of your operations?
___ Yes ___ No

68
Annex 3 – Respondents The following institutions provided their information to the study: Bolded are those institutions that provided full answers to all questions in the survey. Country Name of Institution
Eastern Europe Bulgaria Nachala Cooperative Mikrofond EAD Russe Popular Kasa UNDP-JOBS USTOI Hungary Latvia Latvian Credit Unions Lithuania Lithuanian Credit Unions Poland Fundusz Mikro Inicjatywa Mikro PSFP Rural Development Foundation Fundation for Development of Polish Agriculture Polish Savings and Credit Unions Romania CAPA Finance Center for Economic Development Express Finance FAER Integra Romania LAM OMRO ROMCOM Slovakia Integra Foundation VOKA Foundation
Western Europe Belgium Fonds de Partcipation Finland Finnvera Plc France Airdie Association pour le Droit à l'Initiative Economique Germany Arbeitsfurderung Kassel Stadt GmbH EnterBusiness GmbH / iq consult gmbh Investitionsbank Schleswig-Holstein (IB) L- Bank
Mikrofinanzzentrum NRW - Brechmann Management GmbH
MONEX Microfinanzierung Baden- Wurttemberg e.V run - Rheinhessisches Unternehmensgr�ndungsNetzwerk
Senator fur Arbeit, Frauen, Gesundheit, Jugend und Soziales Frderprogramm 'Starthilfefonds'
Wirtschaftsforderungsgesellschaft Paderborn mbH Ireland First Step Microfinance

69
Italy Banca Popolare Etica Compagnia di San Paolo Dieci Talenti Fondazione Antiusura Santa Maria Del Soccorso - Onlus - Fondazione Risorsa Donna MAG2 Fiance Mag Soc. Mutua per L'Autogestione Magvenezia Soc. Cooperativa
Micro.Bo - Associazione per lo Sviluppo della Microfinanza
Norway Nettverkskreditt BA ( Network Credit Norway - NCN) Spain Accio Solidaria Contra l'Atur Agencia Desarrollo local Ayuntamiento de Alcoy (alicante) Asociacion Tierra Nueva/Fundacion Valdocco Assoccio Solidara Contra l'Atur
Ayuntamiento de Sabadell-Promicio Economica de Sabadell S.L.
Ayuntamiento de Santa Lucia BBK Solidorioa Fundazioa Caixa Galicia Caja de Ahorros de Zaragoza, Aragon y Rioja- IBERCAJA Caja Duero (dpto. Banca Universal) Camara de comercio de Girona - Chamber of Commerce Camara de Comercio de Peru en Espana Colonya-caixa de Pollenca Consorci de Promocio Economica de Lleida Cruz Roja Espanola Empresa Municipal per al a la Formacio Ocupacional Equipo Microcreditos Caja de Ahorros de la Rioja Fundacion CajaGranada Desarrollo Solidario
Fundacion International de la Mujer Emprendedora - FIDEM
Fundacion Genus Fundacio Privada Trinijove Fundacio Un Sol Mon de de Caixa Catalunya Interarts Kuxta - Caja de Ahorros de Gipuzkoa San Sebastian
MITA ONG Centro de Desarrollo de Iniciativas Empresariales
Obra Social de la Caixa - Programa de Microcreditos
Organizacion de mujeres empresarias y gerenicia activa (OMEGA)
SECOT, Seniors Esponoles para la Cooperacion Tecnica Transformando S coop Madrid
Union de Asociaciones de Trabajadoras Autonomas y Emprendedoras
Women's World Banking - Banco Mundial de la Mujer Sweden ALMI F”retagspartner AB Ekobanken Medlemsbank Switzerland Fondation ASECE - Georges Aegler United Kingdom Aston Reinvestment Trust (ART)

70
Black Country Reivestment Society Blackpool Moneyline Business in Prisons Capitalise Business Support Ltd Derbyloans Developing Strathclyde East Lancaster Moneyline East London Small Business Centre Fair Finance First Enterprise Business Agency Fredericks Foundation GLE One London Gloucestershire Development Loan Fund Ltd Norfolk and Waveny Enterprise SVS Senet Ltd Southcoast Moneyline Street Northeast Suffolk Regeneration Trust The Enterprise Fund Ltd The Five Lamps Organisation The Prince's Scottish Youth Business Trust WEETU
Annex 4 – Steering Group Details Grzegorz Galusek, Microfinance Centre for CEE and NIS (MFC) Bernie Morgan, cdfa Philippe Guichandut, European Microfinance Network, (EMN)

71
Annex 5 – Facts And Figures MFI types Number of MFIs by type in Western Europe Number of MFIs by type in Eastern Europe
0
5
10
15
20
25
30
Belgium Finland France Germany Ireland Italy Norway Spain Sweden Switzerland UnitedKingdom
govtbankNGOcredit union
-
20
40
60
80
100
120
140
160
180
Bulgaria Hungary Latvia Lithuania Poland Romania Slovakia
govtcredit unionNGObank
Scale and Outreach Number and Value of Loans Disbursed in Western Europe in 2005
0
500
1000
1500
2000
2500
3000
3500
4000
4500
5000
5500
6000
6500
Belgium Finland France Germany Ireland Italy Norway Spain Sweden Switzerland UnitedKingdom
credit unionNGObankgovt
0
10 000 000
20 000 000
30 000 000
40 000 000
50 000 000
60 000 000
Belg iumF in land
France
GermanyIre land Ita ly
NorwaySpain
Sweden
Sw itze rland
United K ingdom
Euro
s
credit unionNGObankgovt
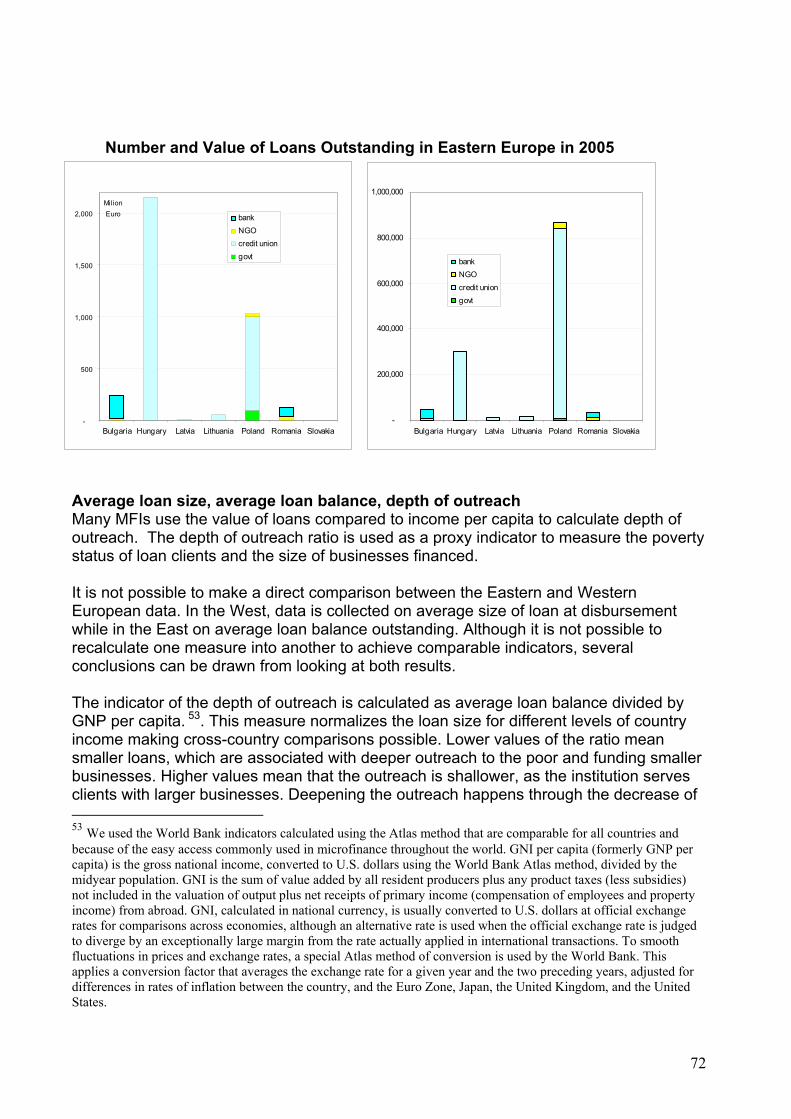
72
Number and Value of Loans Outstanding in Eastern Europe in 2005
-
500
1,000
1,500
2,000
Bulgaria Hungary Latvia Lithuania Poland Romania Slovakia
MilionEuro bank
NGOcredit uniongovt
Total Gross Loan Portfolio of Eastern European MFIs
-
200,000
400,000
600,000
800,000
1,000,000
Bulgaria Hungary Latvia Lithuania Poland Romania Slovakia
bankNGOcredit uniongovt
Total Number of Active Borrowers of Eastern European MFIs
Average loan size, average loan balance, depth of outreach Many MFIs use the value of loans compared to income per capita to calculate depth of outreach. The depth of outreach ratio is used as a proxy indicator to measure the poverty status of loan clients and the size of businesses financed. It is not possible to make a direct comparison between the Eastern and Western European data. In the West, data is collected on average size of loan at disbursement while in the East on average loan balance outstanding. Although it is not possible to recalculate one measure into another to achieve comparable indicators, several conclusions can be drawn from looking at both results. The indicator of the depth of outreach is calculated as average loan balance divided by GNP per capita. 53. This measure normalizes the loan size for different levels of country income making cross-country comparisons possible. Lower values of the ratio mean smaller loans, which are associated with deeper outreach to the poor and funding smaller businesses. Higher values mean that the outreach is shallower, as the institution serves clients with larger businesses. Deepening the outreach happens through the decrease of 53 We used the World Bank indicators calculated using the Atlas method that are comparable for all countries and because of the easy access commonly used in microfinance throughout the world. GNI per capita (formerly GNP per capita) is the gross national income, converted to U.S. dollars using the World Bank Atlas method, divided by the midyear population. GNI is the sum of value added by all resident producers plus any product taxes (less subsidies) not included in the valuation of output plus net receipts of primary income (compensation of employees and property income) from abroad. GNI, calculated in national currency, is usually converted to U.S. dollars at official exchange rates for comparisons across economies, although an alternative rate is used when the official exchange rate is judged to diverge by an exceptionally large margin from the rate actually applied in international transactions. To smooth fluctuations in prices and exchange rates, a special Atlas method of conversion is used by the World Bank. This applies a conversion factor that averages the exchange rate for a given year and the two preceding years, adjusted for differences in rates of inflation between the country, and the Euro Zone, Japan, the United Kingdom, and the United States.

73
the depth of outreach ratio, therefore the downscaling effect is observed among MFIs whose depth of outreach change was negative during the year. Average Depth of Outreach by MFI Type in the West and in the East in 2005
0 20 40 60 80 100 120 140
Belgium
Finland
France
Germany
Italy
Norway
Spain
Sweden
Switzerland
United Kingdom
Percent
credit unionNGObankgovt
0% 50% 100% 150% 200%
Bulgaria
Hungary
Latvia
Lithuania
Poland
Romania
Slovakia
bankNGOcredit uniongovt
Types of Loan Products The European sector, both Western and Eastern, has not yet transitioned from microcredit to microfinance as it has in developing countries. This is evidenced by the types of products provided. Share of MFIs providing selected loan products and other financial services in the West
0
20
40
60
80
100
120
business loans consumer/personalloans
savings products insurance money transfer services pensions home mortgages
Perc
ent
govtbankNGOcredit union
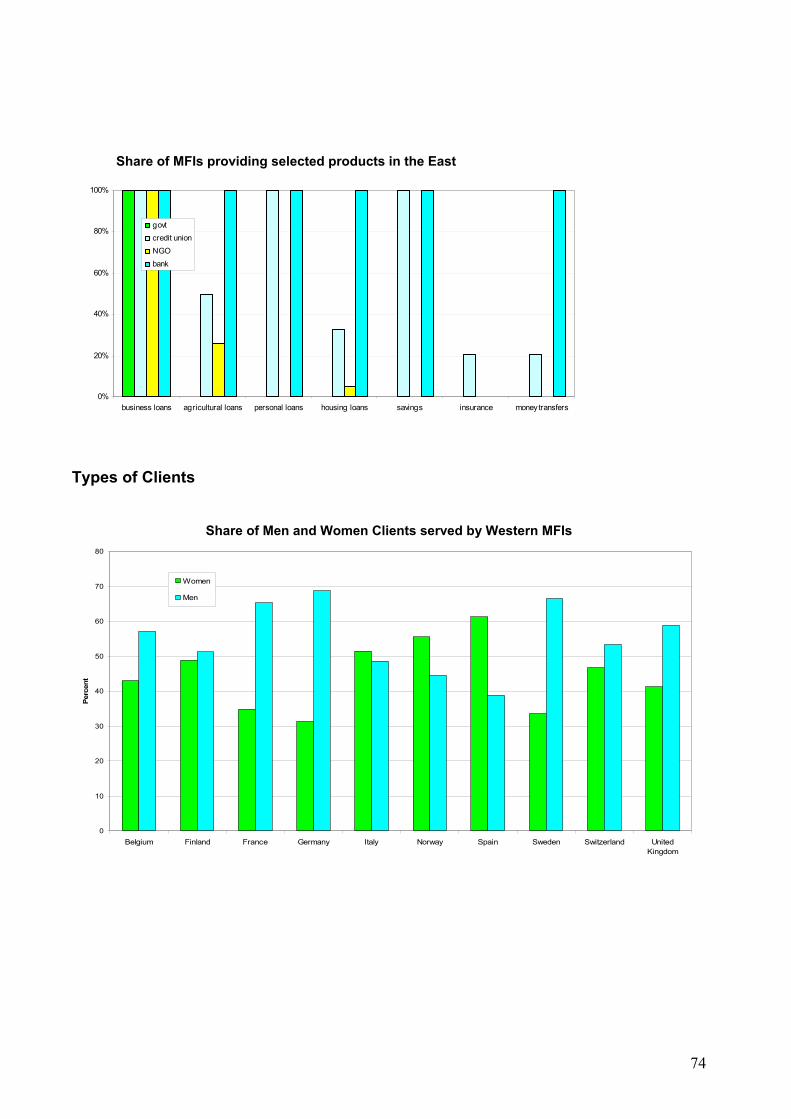
74
Share of MFIs providing selected products in the East
0%
20%
40%
60%
80%
100%
business loans agricultural loans personal loans housing loans savings insurance money transfers
govtcredit unionNGObank
Types of Clients
Share of Men and Women Clients served by Western MFIs
0
10
20
30
40
50
60
70
80
Belgium Finland France Germany Italy Norway Spain Sweden Switzerland UnitedKingdom
Perc
ent
Women
Men

75
Share of Men and Women Clients Served by Eastern NGOs/NBFIs
0%
10%
20%
30%
40%
50%
60%
70%
80%
Bulgaria Poland Romania Slovakia
w omen
men
Share of Different Types of Clients served by Western MFIs
Percent of Total Loans Disbursed in Each Country 2005
0
10
20
30
40
50
60
70
80
90
100
Belgium Finland France Germany Italy Norway Spain Sweden Switzerland UnitedKingdom
Perc
ent
Ethnic MinoritiesImmigrantsYouthDisabled People
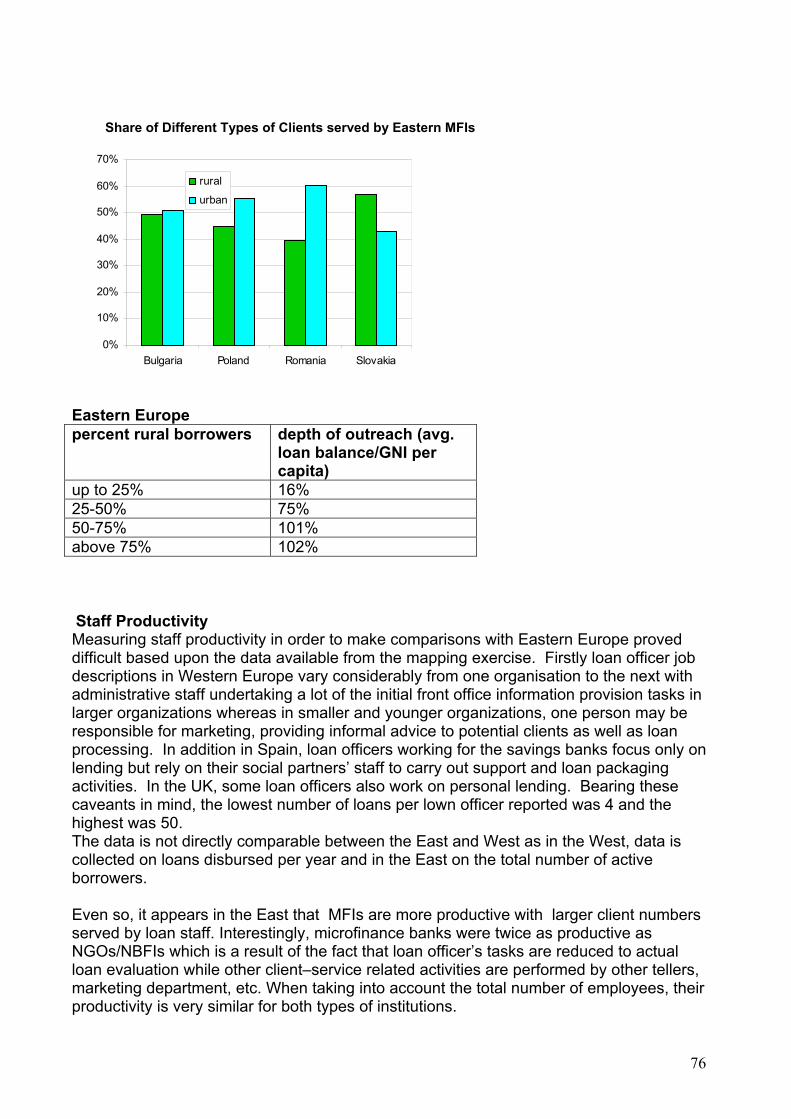
76
Share of Different Types of Clients served by Eastern MFIs
0%
10%
20%
30%
40%
50%
60%
70%
Bulgaria Poland Romania Slovakia
rural
urban
Eastern Europe percent rural borrowers depth of outreach (avg.
loan balance/GNI per capita)
up to 25% 16% 25-50% 75% 50-75% 101% above 75% 102% Staff Productivity Measuring staff productivity in order to make comparisons with Eastern Europe proved difficult based upon the data available from the mapping exercise. Firstly loan officer job descriptions in Western Europe vary considerably from one organisation to the next with administrative staff undertaking a lot of the initial front office information provision tasks in larger organizations whereas in smaller and younger organizations, one person may be responsible for marketing, providing informal advice to potential clients as well as loan processing. In addition in Spain, loan officers working for the savings banks focus only on lending but rely on their social partners’ staff to carry out support and loan packaging activities. In the UK, some loan officers also work on personal lending. Bearing these caveants in mind, the lowest number of loans per lown officer reported was 4 and the highest was 50. The data is not directly comparable between the East and West as in the West, data is collected on loans disbursed per year and in the East on the total number of active borrowers. Even so, it appears in the East that MFIs are more productive with larger client numbers served by loan staff. Interestingly, microfinance banks were twice as productive as NGOs/NBFIs which is a result of the fact that loan officer’s tasks are reduced to actual loan evaluation while other client–service related activities are performed by other tellers, marketing department, etc. When taking into account the total number of employees, their productivity is very similar for both types of institutions.
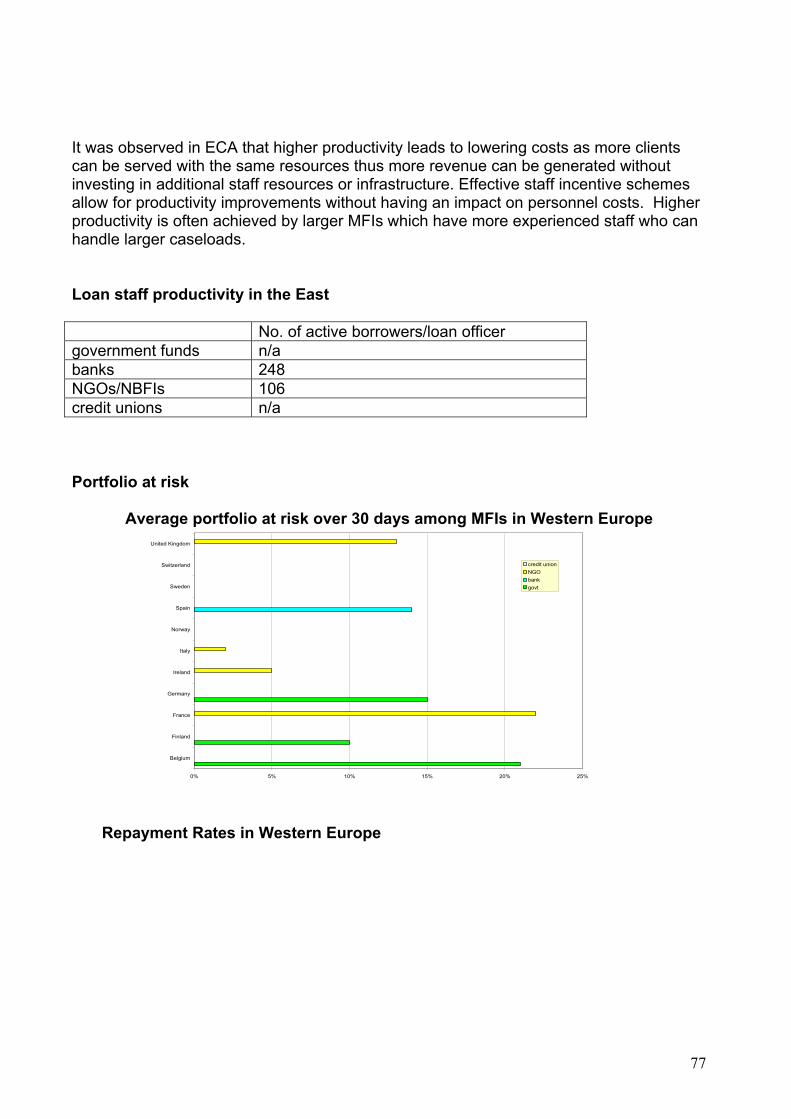
77
It was observed in ECA that higher productivity leads to lowering costs as more clients can be served with the same resources thus more revenue can be generated without investing in additional staff resources or infrastructure. Effective staff incentive schemes allow for productivity improvements without having an impact on personnel costs. Higher productivity is often achieved by larger MFIs which have more experienced staff who can handle larger caseloads. Loan staff productivity in the East No. of active borrowers/loan officer government funds n/a banks 248 NGOs/NBFIs 106 credit unions n/a Portfolio at risk
Average portfolio at risk over 30 days among MFIs in Western Europe
0% 5% 10% 15% 20% 25%
Belgium
Finland
France
Germany
Ireland
Italy
Norway
Spain
Sweden
Switzerland
United Kingdom
credit unionNGObankgovt
Repayment Rates in Western Europe

78
0%
10%
20%
30%
40%
50%
60%
70%
80%
90%
100%
Belgium Finland France Germany Ireland Italy Norway Spain Sweden Switzerland UnitedKingdom
govtbankNGOcredit union
Average portfolio at risk over 30 days among MFIs in Eastern Europe
0.0% 5.0% 10.0% 15.0% 20.0% 25.0% 30.0%
Bulgaria
Latv ia
Lithuania
Poland
Romania
Slov akia
MFBs
NGO/NBFIs
Cus
Funding Not a single MFI surveyed in Western Europe is self-sustaining at present although sustainability is a long term goal for many MFIs. They rely on public and private funds to cover operational costs and provide loan capital. The majority of microlenders receive between 75 to 100% of their operational funds from public sources and loan capital from a combination of public and private sources such as banks.

79
Sources of funds to cover operating costs in Western Europe
Funding Sources: Operational Costs
0
10
20
30
40
50
60
70
80
1-25% 26-50% 51-75% 76-100%
Percent of Funds
Perc
ent o
f Res
pond
ents
public sectorprivate sectorcharity sectorearned income
Funding sources for loan capital in Western Europe
Funding Sources: Loan Capital
0
10
20
30
40
50
60
70
80
1-25% 26-50% 51-75% 76-100%
Percent of Funding
Perc
ent o
f Res
pond
ents
public sectorprivate sectorcharity sectorearned income
In Eastern Europe, by contrast, MFIs follow the notion that achieving sustainability is critical for reaching larger number of target clients and ensuring long-term existence through better access to funding sources. Evidence exists that profitable MFIs grow much faster than unprofitable MFIs do as the profits help fund the growth.54 For that reason, Eastern European MFIs are in most cases55 operationally self-sustainable as they are
54 “The State of Microfinance – Outreach, Profitability and Poverty”. A. Gonzalez (MIX/CGAP), R. Rosenberg (CGAP) 55 except for government funds where information was not available

80
able to cover costs of their operations from revenue earned on their assets, the major part of it being interest and fee income on loans. Eastern Europe also use a variety of sources of funds but the level of engagement of different types of them depends on the type of the institution Credit unions and microfinance banks which are deposit-taking institutions chiefly rely on client deposits as their assets are in 70-90% funded from deposits and membership shares. The exception here are those credit unions which do not collect savings (some credit unions in Bulgaria) and therefore have funding structure similar to that of NGOs/NBFIs. Microfinance banks additionally use commercial and concessional loans from public and private sources. Credit unions very rarely use public sources of funds (some foreign aid grants were used for capacity building in the past), they rather use commercial funds from financial institutions but to a very limited extent.. Funding sources for loan capital in Eastern Europe: credit unions and microfinance banks
Non deposit-taking funding structures, NGOs/NBFIs. are more versatile in their funding structures. Almost all of them use grants for funding their loan portfolio. These grants were provided as start-up capital which at a later stage were complemented by concessional loans from public sources and socially-responsible private lenders as well as commercial loans from private sources, in some cases – local commercial banks. Already more than half of the MFIs have loans with commercial lenders. Few MFIs use shareholder or owner equity as they either have status of non-governmental institutions or have only recently transformed into commercial entities. In the latter case, although they are registered as for-profit institutions, they remain not-for-profit, that is reinvest all earnings back into the company. This does not attract equity investors who seek returns on their investments.
0%
10%
20%
30%
40%
50%
60%
70%
80%
90%
100%
1-25% 25-50% 51-75% 75-100%
shareholdersgrantsconcessional loanscommercial loansearningssav ingsPe
rcen
t of
Rep
osnd
ents
Percent of Funding
Funding Sources of Credit Unions
0%
10%
20%
30%
40%
50%
60%
70%
80%
90%
100%
1-25% 25-50% 51-75% 75-100%
shareholdersgrantsconcessional loanscommercial loansearningssav ings
Per
cent
of R
epos
nden
ts
Percent of Funding
Funding Sources of Microfinance Banks

81
Often NGOs/NBFIs receive funding from their parent networks which perform fundraising role on behalf of their partner MFIs. This happens in case of Opportunity International and World Vision networks. In some cases MFIs borrow funds from other MFIs that operate in the same network. Funding sources for loan capital in Eastern Europe: NGOs/NBFIs
0%
10%
20%
30%
40%
50%
60%
70%
80%
90%
100%
1-25% 25-50% 51-75% 75-100%
shareholders grantsconcessional loanscommercial loansearningssav ings
Per
cent
of R
epos
nden
ts
Percent of Funding
Funding Sources of NGOs/NBFIs
Only government funds rely almost exclusively on public sources (local and foreign), that is funds channelled by government agencies aiming at supporting entrepreneurship. Some of them

82
Annex 6 – Indicators of Social Inclusion The Set of Indicators of Social Inclusion developed by Social Protection Committee
Table 1: Primary indicators
Indicator Definition 1 Low income rate
after transfers Percentage of individuals living in households where the total equivalised household income is below 60 per cent national equivalised median income with breakdowns by age and gender, most frequent activity status, household type, tenure status
2 Distribution of income
S80/S20: Ratio between the national equivalised income of the top 20 per cent of the income distribution to the bottom 20 per cent
3 Persistence of low income
Persons living in households where the total equivalised household income was below 60 per cent median national equivalised income in year n and (at least) two years of years n-1, n-2, n-3 (incl. gender breakdown)
4 Relative median low income gap
Difference between the median income of persons below the low income threshold and the low income threshold, expressed as a percentage of the low income threshold (incl. gender breakdown)
5 Regional cohesion Coefficient of variation of employment rates at NUTS 2 level
6 Long term unemployment rate
Total long-term unemployed population (≥12 months; ILO definition) as proportion of total active population (incl. Gender breakdown)
7 Persons living in jobless households
Persons aged 0-65 (0-60) living in households where none is working out of the persons living in eligible households
8 Early school leavers not in education or training
Share of total population of 18-24-year olds having achieved ISCED level 2 or less and not attending education or training (incl. gender breakdown)
9 Life expectancy at birth
Number of years a person may be expected to live, starting at age 0, for Males and Females
10 Self defined health status by income level.
Ratio of the proportions in the bottom and top quintile groups (by equivalised income) of the population aged 16 and over who classify themselves as in a bad or very bad state of health (incl. gender breakdown)
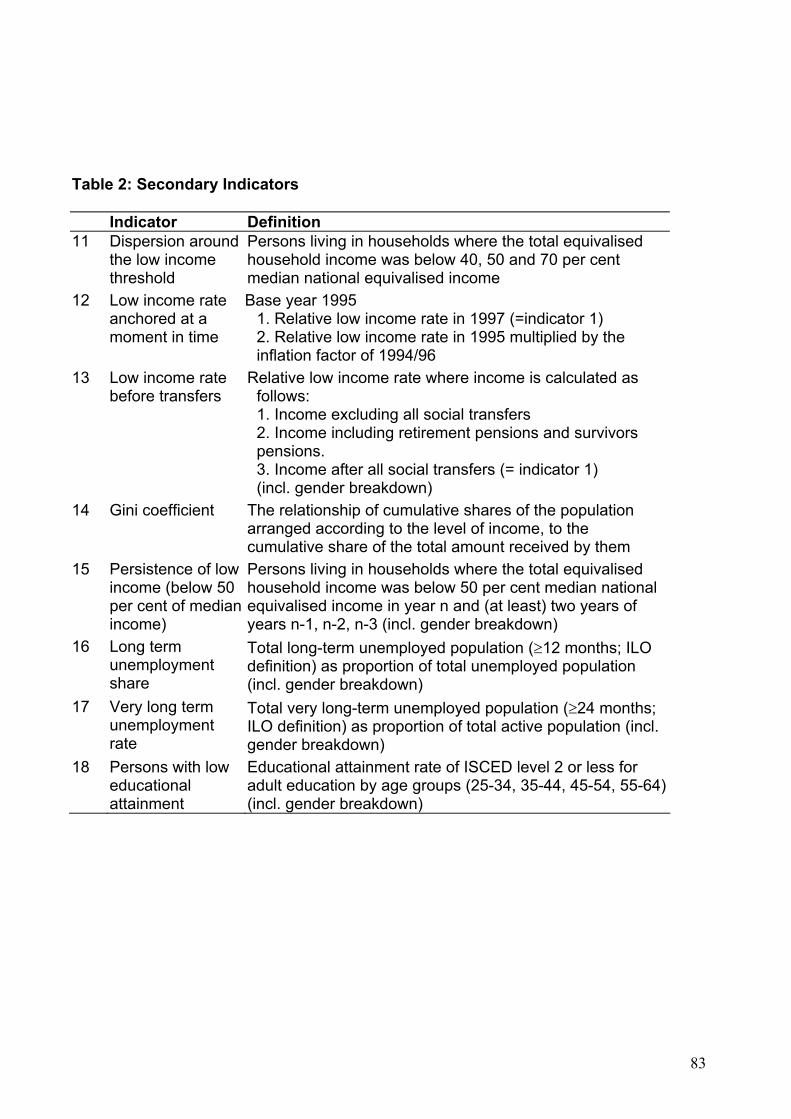
83
Table 2: Secondary Indicators
Indicator Definition 11 Dispersion around
the low income threshold
Persons living in households where the total equivalised household income was below 40, 50 and 70 per cent median national equivalised income
12 Low income rate anchored at a moment in time
Base year 1995 1. Relative low income rate in 1997 (=indicator 1) 2. Relative low income rate in 1995 multiplied by the inflation factor of 1994/96
13 Low income rate before transfers
Relative low income rate where income is calculated as follows: 1. Income excluding all social transfers 2. Income including retirement pensions and survivors pensions. 3. Income after all social transfers (= indicator 1) (incl. gender breakdown)
14 Gini coefficient The relationship of cumulative shares of the population arranged according to the level of income, to the cumulative share of the total amount received by them
15 Persistence of low income (below 50 per cent of median income)
Persons living in households where the total equivalised household income was below 50 per cent median national equivalised income in year n and (at least) two years of years n-1, n-2, n-3 (incl. gender breakdown)
16 Long term unemployment share
Total long-term unemployed population (≥12 months; ILO definition) as proportion of total unemployed population (incl. gender breakdown)
17 Very long term unemployment rate
Total very long-term unemployed population (≥24 months; ILO definition) as proportion of total active population (incl. gender breakdown)
18 Persons with low educational attainment
Educational attainment rate of ISCED level 2 or less for adult education by age groups (25-34, 35-44, 45-54, 55-64) (incl. gender breakdown)

84
Annex 7 – Bibliography “Tackling Social Exclusion: Taking Stock and Looking to the Future: Emerging Findings,” Social Exclusion Unit, UK. “Poverty, Social Exclusion and Microfinance in Britain,” Ben Rogaly, Thomas Fisher, Ed Mayo. OXFAM GB (1999) “Perceptions of Social Integration and Exclusion in an Enlarged Europe”. European Foundation for the Improvement of Living and Working Conditions (2004) Centre for Research into Socially Inclusive Services, 2003. “Financial Exclusion and Microfinance: An Overview of Issues,” N. Howell, Australia Peter Cartwright “Banks, Consumers and Regulation,”quoted in “Financial Exclusion and Microfinance: An Overview of Issues,” N. Howell, Australia. “Joint Report on Social Inclusion 2004”, European Commission, Directorate-General for Employment and Social Affairs, Unit E.2 “Social Indicators In European Union”. B. Nolan, Economic and Social Research Institute, Dublin, Ireland (2003) “Microfinance, Grants, and Non-financial Responses to Poverty Reduction: Where Does Microcredit Fit?”, CGAP Focus Note 20 (2006) “Microfinance Institutions: Profitability at the Service of Outreach? A Study of the Microfinance Industry in the ECA Region.” R. Olszyna-Marzys, College of Europe (2006) “Where to Microfinance?” G.M Woller, C.Dunford, W.Woodworth. International Journal of Economic Development. (1999) “Maximizing the Outreach of Microenterprise Finance: An Analysis of Successful Microfinance Programs.” USAID Program and Operations Assessment Report No.10. Christen R.P., Rhyne E., Kogel R.C., McKean C. (1995) “The Microcredit Summit’s Challenge: Working Towards Institutional Financial Self-Sufficiency while Maintaining a Commitment to Serving the Poorest Families.” D.S. Gibbons, J.W. Meehan. Microcredit Summit. (2000) “The Microfinance Schism.” Morduch J. World Development, Vol. 28, No.4 “Money with a Mission: Microfinance and Poverty Reduction”. James Copestake, Martin Greeley, Susan Johnson, Naila Kabeer, Anton Simanowitz, Volume 1, ITDG Publishing, 2005). “The State of Microfinance – Outreach, Profitability and Poverty”. A. Gonzalez (MIX/CGAP), R. Rosenberg (CGAP)

85
“2004 Microfinance Sector Development in Eastern Europe and Central Asia” Pytkowska. J, Bankowska E. Microfinance Centre for CEE and NIS (2006) “Microcredit for Small Businesses and Business Creation: Bridging a Market Gap,” European Union, DG Enterprise, 2004. “Microcredits Granted in Spain: a Unique Model ,” Silvia Rico Garrido and Maricruz Lacalle Calderón, Finance et le Bien Commun, 2006. “Immigrant Participation in Microloan Programmes in Western Europe,”Miriam Guzy and Tamara Underwood, EMN Working Paper Number 3, 2006. “Youth Entrepreneurship: Latent Entrepreneurship, Market Failure and Enterprise Support,” F. Greene, 2005, National Council for Graduate Entrepreneurship, Policy Paper 2, UK. “Overview of the Microfinance Sector in Western Europe: 2002-2003,” nef-EMN. “Policy Measures for Promotion of the Use of Microcredit in Europe for Social Inclusion,” Evers&Jung, Facet, nef, EMN, MFC, 2005.
Carbo Valverde S. and Lopez del Paso, R., 2005, «Exclusión financiera: un panorama», Perspectivas del sistema financiero, n.º 84, Fundación de las Cajas de Ahorros, Madrid, quoted in “Microcredits Granted in Spain: a Unique Model,” Silvia Rico Garrido and Maricruz Lacalle Calderon, in Finance et le Bien Commun, , 2006.

This project has received funding from the European Commission within the frameworkof the Community Action Programme to Combat Social Exclusion 2002-2006.
Sole responsibility lies with the author and the Commission is not responsible for anyuse that may be made of the information contained herein.
Microfinance Centre (MFC)for Central and Eastern Europe and the New Independent StatesKoszykowa 60/62 m.52 00-673 Warsaw, Poland
Telephone +48 22 622 34 65 Fax: +48 22 622 34 85www.mfc.org.pl
European Microfinance Network4 Bd Poissonnière - 75 009 Paris
Telephone +33 1 56 03 59 70Fax +33 1 56 03 59 77www.european-microfinance.org
Community Development Finance AssociationRoom 101Hatton Square Business Centre16/16a Baldwins GardensLondon EC1N 7RJ
Telephone +44 20 7430 0222Fax +44 20 7430 2112www.cdfa.org.uk
April
200
7 ©
cdf
a, M
FC,
EMN