Embed Size (px)
Citation preview
The Merced River Alliance Project
FINAL REPORT, Volume II
Biological Monitoring and Assessment
Prepared by Stillwater Sciences
2855 Telegraph Avenue, Suite 400 Berkeley, California 94705
Prepared for East Merced Resource Conservation District
Merced, California and
State Water Resources Control Board Sacramento, California
September 2008 Revised
The Merced River Alliance Project Final Report: Volume II LIST OF PREPARERS: Maia Singer, Ph.D. Krista Orr, M.S. Russ Liebig William McDowell Marie Reil David Zajanc Julian Wood (PRBO Conservation Science) Nadav Nur (PRBO Conservation Science) Tom King (BioAssessment Services)
Financial support for this project has been provided by a grant from the
CALFED Watershed Program and administered by the California State Water Resources Control Board. For more information or copies of this final report,
please contact:
Stillwater Sciences 2855 Telegraph Avenue, Suite 400
Berkeley, CA 94705 510‐848‐8098
www.stillwatersci.com Suggested citation Stillwater Sciences. 2008. The Merced River Alliance Project Final Report. Volume II: Biological monitoring and assessment report. Prepared by Stillwater Sciences, Berkeley, California.
The Merced River Alliance Project Final Report Volume II: Biological Monitoring and Assessment
Stillwater Sciences
i
Table of Contents 1 DISTRIBUTION LIST.............................................................................................................. 1‐1
2 PROJECT ORGANIZATION.................................................................................................. 2‐1
3 PROBLEM STATEMENT AND BACKGROUND.............................................................. 3‐1 3.1 PROBLEM STATEMENT.................................................................................................... 3‐1 3.2 STUDY RATIONALE......................................................................................................... 3‐1 3.3 PHYSICAL AND BIOLOGICAL SETTING ........................................................................... 3‐2
3.3.1 Geomorphology and Hydrology........................................................................ 3‐4 3.3.2 Habitat and Biota ............................................................................................. 3‐7
4 BIOLOGICAL MONITORING & ASSESSMENT GOALS & OBJECTIVES................ 4‐1
5 BIOLOGICAL MONITORING & ASSESSMENT DESCRIPTION................................ 5‐1 5.1 PROJECT SCHEDULE........................................................................................................ 5‐1 5.2 MONITORING METHODOLOGY ...................................................................................... 5‐1
5.2.1 Coarse‐scale Aquatic Habitat Mapping............................................................ 5‐4 5.2.2 Hydrology....................................................................................................... 5‐10 5.2.3 Fish Study ...................................................................................................... 5‐11 5.2.4 BMI Study...................................................................................................... 5‐28 5.2.5 Avian Study ................................................................................................... 5‐45
6 EXISTING DATA...................................................................................................................... 6‐1
7 NEW DATA................................................................................................................................ 7‐1 7.1 COARSE‐SCALE AQUATIC HABITAT MAPPING.............................................................. 7‐1
7.1.1 Lower River ...................................................................................................... 7‐2 7.1.2 Upper River ...................................................................................................... 7‐5
7.2 HYDROLOGY................................................................................................................... 7‐8 7.2.1 Hydrological Overview of the Merced River .................................................... 7‐8 7.2.2 Hydrology Summary for the Merced Alliance Survey Periods ...................... 7‐11
7.3 FISH STUDY................................................................................................................... 7‐13 7.3.1 Fish Species Composition, Abundance, and Distribution .............................. 7‐14 7.3.2 Fish Community Assemblages ....................................................................... 7‐25 7.3.3 Habitat Use by Fish Species ........................................................................... 7‐28 7.3.4 Fish Hypotheses.............................................................................................. 7‐37
7.4 BMI STUDY................................................................................................................... 7‐48 7.4.1 Aquatic Bioassessment ................................................................................... 7‐48 7.4.2 Exotics Survey................................................................................................ 7‐62
7.5 AVIAN STUDY............................................................................................................... 7‐65
The Merced River Alliance Project Final Report Volume II: Biological Monitoring and Assessment
Stillwater Sciences
ii
7.5.1 Breeding Season.............................................................................................. 7‐65 7.5.2 Fall Migration ................................................................................................ 7‐69 7.5.3 Winter Season ................................................................................................ 7‐69 7.5.4 Avian Hypotheses........................................................................................... 7‐69
8 DATA EVALUATION ............................................................................................................. 8‐1 8.1 COARSE‐SCALE AQUATIC HABITAT MAPPING.............................................................. 8‐1 8.2 FISH STUDY..................................................................................................................... 8‐2
8.2.1 Comparisons to Historical Fish Data ............................................................... 8‐2 8.2.2 Evaluation of New Fish Data ........................................................................... 8‐4 8.2.3 Fish Conclusions ............................................................................................ 8‐12
8.3 BMI STUDY................................................................................................................... 8‐13 8.3.1 Comparisons to Historical BMI Data............................................................. 8‐13 8.3.2 Evaluation of New BMI Data......................................................................... 8‐16 8.3.3 BMI Conclusions............................................................................................ 8‐21
8.4 AVIAN STUDY............................................................................................................... 8‐22 8.4.1 Comparisons to Historical Avian Data .......................................................... 8‐22 8.4.2 Evaluation of New Avian Data ...................................................................... 8‐24 8.4.3 Avian Conclusions ......................................................................................... 8‐28
9 REFERENCES ............................................................................................................................ 9‐1 LIST OF TABLES Table 3‐1. Dams regulated by the California Division of the Safety of Dams in the Merced River
watershed. ............................................................................................................................ 3‐6 Table 5‐1. The Merced Alliance biological monitoring and assessment schedule.......................... 5‐2 Table 5‐2. Coarse‐scale habitat types used for remote aquatic habitat assessment. ....................... 5‐5 Table 5‐3. Merced River reach designations. ....................................................................................... 5‐6 Table 5‐4. Parameters measured during coarse‐scale aquatic habitat mapping. ............................ 5‐8 Table 5‐5. Merced River stream gaging stations used for hydrologic analysis............................. 5‐10 Table 5‐6. Summary of fish sampling design and monitoring site selection................................. 5‐14 Table 5‐7. Sources used for fish sampling methods.......................................................................... 5‐17 Table 5‐8. Site characterization and physical habitat data collected during fish monitoring. .... 5‐21 Table 5‐9. Habitat types used for site‐specific fish habitat characterization. ................................ 5‐22 Table 5‐10. Microhabitat parameters for species‐specific fish surveys. ......................................... 5‐23 Table 5‐11. Fish community assemblage descriptions and associated fish species. ..................... 5‐26 Table 5‐12. Contiguous river stretches used for analyzing longitudinal gradients in fish linear
density within community assemblages........................................................................ 5‐27 Table 5‐13. Summary of BMI sampling design and monitoring site selection.............................. 5‐32 Table 5‐14. Site characterization and physical habitat data collected during BMI monitoring. . 5‐36 Table 5‐15. Metrics used to describe BMI assemblages. ................................................................... 5‐40 Table 5‐16. Summary of avian sampling design and monitoring site selection............................ 5‐49 Table 5‐17. Parameters measured during avian monitoring. .......................................................... 5‐50 Table 5‐18. Fourteen focal species selected for avian habitat analyses........................................... 5‐55 Table 5‐19. Local riparian patch characteristics and habitat features from relevé data and
landscape variables from GIS sources used in avian habitat analyses. ..................... 5‐56

The Merced River Alliance Project Final Report Volume II: Biological Monitoring and Assessment
Stillwater Sciences
iii
Table 5‐20. Landscape‐level vegetation classes considered to be “riparian” for Merced Alliance avian habitat analyses....................................................................................................... 5‐58
Table 7‐1. Bed and bank substrate by reach for the lower and upper Merced River. .................... 7‐2 Table 7‐2. Selected hydrological characteristics at gaging stations on the Merced River............ 7‐10 Table 7‐3. Mean annual flows (cfs) at gaging stations on the Merced River for select water years
(2005, 2006, 2007) and for the period of record (1969–2007)........................................ 7‐11 Table 7‐4. Mean monthly flows (cfs) during spring at gaging stations on the Merced River for
2005–2008............................................................................................................................ 7‐12 Table 7‐5. Dates of fish surveys. .......................................................................................................... 7‐13 Table 7‐6. Merced River reach designations. ..................................................................................... 7‐14 Table 7‐7. Native, introduced, anadromous, and resident fish species richness and abundance
during all surveys, 2006–2008.* ....................................................................................... 7‐15 Table 7‐8. Fish community assemblages and species presence by season and reach during spring,
summer, and fall 2006–2008............................................................................................. 7‐26 Table 7‐9. Data quality measures for water quality data collected in conjunction with fish
surveys................................................................................................................................ 7‐29 Table 7‐10. Water quality by reach for parameters measured in conjunction with fish surveys. *7‐30 Table 7‐11. Relative use of coarse‐scale aquatic habitat types by native fish species on the Merced
River 2006–2008. ................................................................................................................ 7‐37 Table 7‐12. Habitat suitability criteria for fry and juvenile Chinook salmon. ............................... 7‐38 Table 7‐13. Linear density estimates for trout and Sacramento suckers in the upper Merced River
for 2007 by species, life stage, and reach, based on a modified two‐phase stratified sampling approach using snorkeling. ............................................................................ 7‐47
Table 7‐14. Summary of timing of BMI surveys. ............................................................................... 7‐48 Table 7‐15. Aquatic bioassessment samples collected during 2006 and 2007. .............................. 7‐48 Table 7‐16. Metric summaries for BMI assemblages sampled during the Merced Alliance surveys.7‐50 Table 7‐17. Comparisons of MHC and TRC samples as a function of BMI richness, diversity and
composition metrics.......................................................................................................... 7‐51 Table 7‐18. Data quality measures for water quality data collected in conjunction with BMI
surveys................................................................................................................................ 7‐59 Table 7‐19. Water quality summary by reach for data collected in conjunction with BMI surveys.7‐59 Table 7‐20. Physical habitat quality scores for Merced Alliance BMI sampling sites. ................. 7‐62 Table 7‐21. Summary of surveys dates for avian surveys................................................................ 7‐65 Table 7‐22. Local riparian patch features associated with avian species diversity and focal species
abundance by river segment............................................................................................ 7‐68 Table 7‐23. Landscape variables associated with avian species diversity and focal species
abundance by river segment............................................................................................ 7‐71 Table 7‐24. Effect of shrub cover on avian focal species abundance and overall species diversity
in the lower Merced River................................................................................................ 7‐74 Table 8‐1. Previously existing aquatic macroinvertebrate study sites located on or near the
Merced River...................................................................................................................... 8‐14
The Merced River Alliance Project Final Report Volume II: Biological Monitoring and Assessment
Stillwater Sciences
iv
LIST OF FIGURES Figure 3‐1. Merced River watershed, project location, and land use. Figure 3‐2. Restoration projects on the upper and lower Merced River. Figure 3‐3. Aerial photographs of the lower Merced River (Gravel Mining 1 Reach) depicting
the transition from a multiple‐channel anastomosing reach with a broad floodplain, to a single‐thread system with a confined channel and narrow floodplain (Source: Agricultural Stabilization and Conservation Service).
Figure 3‐4. Annual hydrograph components for the Merced River. Figure 5‐1. Biological assessment monitoring sites on the Merced River (includes all
resources), 2006–2008. Figure 5‐2. Aquatic habitat mapping scales applied to the Merced Alliance biological
monitoring and assessment. Figure 5‐3. Fish monitoring sites along the Merced River, 2006–2008. Figure 5‐4. BMI monitoring site locations, names, and ecological subregions along the
Merced River, 2006–2007. Figure 5‐5. Diagrams detailing BMI sampling methods. Figure 5‐6. Photograph of Chinese mitten crab trap. Figure 5‐7. Avian monitoring sites along the Merced River, 2006–2007. Figure 5‐8. Detail of a variable circular plot (VCP) point count used for avian breeding
surveys. Figure 5‐9. Detail of the area search method used for avian surveys. Figure 7‐1. Relative frequency of habitat unit types by reach under low‐flow conditions for
the a) lower and b) upper Merced River. Figure 7‐2. Wetted channel widths by reach for lower and upper Merced River. Figure 7‐3. Mapped large woody debris density (LWD/mile) in the lower and upper Merced
River under low‐flow conditions, fall 2005. Figure 7‐4. Seasonal flow patterns in the upper Merced River (represented by the POH
gage), and the lower Merced River (represented by the MMF and MST gages). Figure 7‐5. Mean annual flow and 20‐year running average mean annual flow at the a)
Pohono gage (POH; USGS gage #11266500), and b) below the Merced Falls dam (MMF; USGS gage #11270900).
Figure 7‐6. Fish species composition across all years and all seasons in the a) lower and b) upper Merced River.
Figure 7‐7. Estimated linear density for all fish species observed, 2006‐2008. Figure 7‐8. a) Species richness and diversity and b) percent composition, by reach in the
lower Merced River, summer 2006. Figure 7‐9. a) Species richness and diversity and b) percent composition, by reach in the
lower Merced River, fall 2006. Figure 7‐10. a) Species richness and diversity and b) percent composition, by reach in the
lower Merced River, spring 2007. Figure 7‐11. a) Species richness and diversity and b) percent composition, by reach in the
lower Merced River, summer 2007. Figure 7‐12. a) Species richness and diversity and b) percent composition, by reach in the
lower Merced River, fall 2007. Figure 7‐13. a) Species richness and diversity and b) percent composition, by reach in the
lower Merced River, spring 2008.
The Merced River Alliance Project Final Report Volume II: Biological Monitoring and Assessment
Stillwater Sciences
v
Figure 7‐14. Length‐frequency charts for lower Merced River summer 2006 through spring 2008 surveys combined for a) O. mykiss, b) Chinook salmon, c) lamprey species, d) channel catfish, e) brown bullhead, f) white catfish, g) common carp, h) Sacramento pikeminnow, i) hardhead, j) sculpin species, k) Sacramento sucker, l) largemouth bass, m) smallmouth bass, n) spotted bass, and o) bluegill sunfish.
Figure 7‐15. a) Species richness and diversity and b) percent composition, by reach in the upper Merced River, fall 2006.
Figure 7‐16. a) Species richness and diversity and b) percent composition, by reach in the upper Merced River, fall 2007.
Figure 7‐17. Length‐frequency charts for upper Merced River fall 2006 and 2007 surveys combined for a) O. mykiss (rainbow trout), b) brown trout, c) common carp, d) hardhead, e) Sacramento pikeminnow, f) Sacramento sucker, g) largemouth bass, h) smallmouth bass, and i) redeye bass.
Figure 7‐18. Clustering tree produced by hierarchical a) divisive and b) agglomerative methods (asymmetric binary variable type).
Figure 7‐19. Fish linear density from seasonal snorkel and electrofishing surveys for a) summer 2006, b) fall 2006, c) spring 2007, d) summer 2007, e) fall 2007, and f) spring 2008.
Figure 7‐20. PCA for physical habitat in the a) lower and b) upper Merced River; and water quality variables in the c) lower and d) upper Merced River.
Figure 7‐21. Results of PCA for species in the a) lower Merced River, and b) upper Merced River.
Figure 7‐22. Reach‐scale use of aquatic habitat types across fish species and sampling seasons (2006–2008) in the a) lower, and b) upper Merced River.
Figure 7‐23. Comparison of bass and juvenile Chinook salmon densities in a) spring 2007, and b) spring 2008.
Figure 7‐24. Water temperatures in the upper Merced River in water years 2006 and 2007. Figure 7‐25. Estimated densities (points), with 95% confidence intervals for a) O. mykiss
(rainbow trout), b) brown trout, and c) Sacramento sucker. Figure 7‐26. NMS ordination of relative sample similarity as a function of BMI taxonomic
composition grouped by lower and upper river. Figure 7‐27. Three dimensional NMS ordination of relative sample similarity as a function of
BMI taxonomic composition showing samples grouped by ecological subregion. Figure 7‐28. NMS ordination of relative sample similarity as a function of BMI taxonomic
composition showing samples grouped by ecological subregion. Figure 7‐29. Percentage of fine particles (< 2mm) represented at each sample site with respect
to elevation and ecological subregion. Figure 7‐30. EPT taxa richness plotted against percentage of fine particles represented in
substrate at sample sites. Figure 7‐31. EPT taxa richness plotted against embeddedness at sample sites. Figure 7‐32. Multimetric Index (MMI) values for a) MHC and b) TRC samples. Figure 7‐33. Mean multimetric Index values and 95% confidence intervals by ecological
subregions. Figure 7‐34. Fixed woody material (FWM) plotted against a) composite metric scores, and b)
as an NMS ordination showing increasing levels of fixed woody material matter represented by increasing circle diameter.
Figure 7‐35. a) Taxonomic and b) EPT richness for three elevation categories within the Merced River watershed.
The Merced River Alliance Project Final Report Volume II: Biological Monitoring and Assessment
Stillwater Sciences
vi
Figure 7‐36. Collector‐filterer a) relative abundance and b) elevation by river mile. Figure 7‐37. Relative abundance downstream and upstream of the foothill reservoirs vor a)
collector‐filterers, b) non‐insect taxa, and c) Malacostraca. Figure 7‐38. a) EPT Richness and b) EPT Index mean values (±95% confidence intervals) for
spring 2005 and combined sampling events in years 2006 and 2007 within the Dredger Tailings Reach of the Merced River.
Figure 7‐39. Mean breeding season bird species diversity (Shannon‐Wiener) by monitoring site, 2006‐07.
Figure 7‐40. Average bird species diversity by site for the a) lower, and b) the upper Merced River, 2006‐2007.
Figure 7‐41. Total number of raptor detections by river segment (upper and lower) during all breeding season (May and June) point count surveys, 2006‐07.
Figure 7‐42. Comparisons of relative explanatory power for landscape variables and local riparian patch (“Local RP”) variables for models predicting overall species diversity and focal species abundance in the lower and upper Merced River.
Figure 7‐43. Cumulative avian species diversity by site from fall migration (Aug‐Oct) area search surveys, 2006–2007.
Figure 7‐44. Cumulative species diversity by site from winter (Nov–Mar) area search surveys conducted along the lower Merced River, 2006–2008.
Figure 7‐45. Mean riparian zone width in meters by monitoring site. Figure 7‐46. The explanatory power (beta = standardized regression coefficient) of riparian
cover at two different scales (50 m and 100 m) and riparian zone width (log transformed) in predicting abundance for six focal bird species in the lower Merced River.
Figure 7‐47. Avian species diversity vs. log riparian width (in meters) in the lower Merced River, 2006‐07.
Figure 7‐48. Avian species diversity vs. riparian vegetation cover in the lower Merced River, 2006‐2007.
Figure 7‐49. Species diversity vs. riparian vegetation cover in the upper Merced River, 2006–2007.
Figure 8‐1. Conceptual model of Merced River resident fish distribution for a) natural, and b) current conditions.
Figure 8‐2. Integration of two BMI data sets using normalized composite metric scores to show relative orientation of the samples across sites in the Merced River watershed.
Figure 8‐3. Relative abundance of Fixed Woody Material (FWM) with respect to elevation at BMI sample points on the Merced River.
The Merced River Alliance Project Final Report Volume II: Biological Monitoring and Assessment
Stillwater Sciences
vii
LIST OF APPENDICES Appendix A. Restoration Projects on the Merced River Appendix B. Historical Fish Data Appendix C. Historical Avian Data Appendix D. Existing Flow Station Data Appendix E. Example Data Sheets Appendix F. Sampling Permits Appendix G. New Aquatic Habitat Mapping Data Appendix H. New Fish Data Appendix I. New Benthic Macroinvertebrate Data Appendix J. New Avian Data

The Merced River Alliance Project Final Report Volume II: Biological Monitoring and Assessment
Stillwater Sciences
viii
LIST OF ACRONYMS AND ABBREVIATIONS ac – acres af – acre‐feet AMFSTP – Adaptive Management Forum Scientific and Technical Panel BLM – Bureau of Land Management BMAP – Biological Monitoring and Assessment Plan BMI – aquatic benthic macroinvertebrate CAMP – Comprehensive Assessment and Monitoring Plan CAS – cascade CBDA – California Bay‐Delta Authority CDFG – California Department of Fish and Game CDWR – California Department of Water Resources CF – collector‐filterer cfs – cubic feet per second CG – collector‐gatherer CMARP – Comprehensive Monitoring, Assessment, and Research Program CMIN – Calaveras Materials Inc. CNDDB – California Natural Diversity Database CON – Confluence Reach CPUE – catch per unit effort CRS – CDWR gage at Cressy (lower Merced River) CSPB – California State Bioassessment Procedure CTV – California tolerance value DO – dissolved oxygen DQO – data quality objective DTR – Dredger Tailings Reach EMRCD – East Merced Resource Conservation District ENC – Encroached Reach EPA – Environmental Protection Agency EPT – Ephemeroptera, Plecoptera, Tricoptera FFG – functional feeding group FOM – fine organic matter fps – feet per second ft – feet FWM – fixed woody material GB – Glaciated Batholith Reach GIS – geographic information system GJHA – George J. Hatfield State Park GLD – glide GM1 – Gravel Mining 1 Reach GM2 – Gravel Mining 2 Reach GPP – generator‐powered pulsator GPS – global positioning system ha – hectare HEPA – Henderson Park HGR – high‐gradient riffle HIB – USGS gage 11264500 at Happy Isles Bridge (upper Merced River)
The Merced River Alliance Project Final Report Volume II: Biological Monitoring and Assessment
Stillwater Sciences
ix
ID – irrigation district in ‐ inches km – kilometer LB – Lower Batholith Reach LGR‐ low‐gradient riffle LSP – lateral scour pool LWD – large woody debris m – meters MBB – Merced ID gage at Briceburg (upper Merced River) MCP – mid‐channel pool MCRCD – Mariposa County Resource Conservation District MEFA – Merced Falls Avenue Merced ID – Merced Irrigation District MF – Merced Falls Reach mi ‐ miles mm ‐ millimeters MMF – USGS gage 11270900 below Merced Falls (lower Merced River) MRR – Merced River Ranch MRS – Merced River stakeholders MSN – CDWR gage near Snelling (lower Merced River) MSRA – McConnell State Recreation Area MST – USGS gage 11272500 near Stevinson (lower Merced River) MVZ – Museum of Vertebrate Zoology NAWQA – USGS National Water‐Quality Assessment Program NOAA – National Oceanic and Atmospheric Administration NPS – National Parks Service NRS – Natural Resource Scientists, Inc. PAEP – Project Assessment and Evaluation Plan PFMC – Pacific Fisheries Management Council PLP – plunge pool POH – USGS gage 11266500) at Pohono Bridge (upper Merced River) POW – pocket water PRBO – Point Reyes Bird Observatory QA/QC – quality assurance, quality control QAPP – Quality Assurance Project Plan RM – river mile RST – rotary screw trap SAFIT – Southwest Association of Invertebrate Taxonomists s ‐ seconds SJR – San Joaquin River SWAMP – Surface Water Ambient Monitoring Program SWRCB – State Water Resources Control Board TID – Turlock Irrigation District UF1 – Upper Foothills 1 Reach UF2 – Upper Foothills 2 Reach UF3 – Upper Foothills 3 Reach UMRWC – Upper Merced River Watershed Council USBR – United States Bureau of Reclamation

The Merced River Alliance Project Final Report Volume II: Biological Monitoring and Assessment
Stillwater Sciences
x
USFWS – United States Fish and Wildlife Service USGS – United States Geological Survey VAMP – Vernalis Adaptive Management Plan VCP – variable circular plot WQ – water quality WY – water year YNP – Yosemite National Park YOY – Young‐of‐year YV – Yosemite Valley Reach
The Merced River Alliance Project Final Report Volume II: Biological Monitoring and Assessment
Stillwater Sciences
1‐1
1 DISTRIBUTION LIST The following individuals received copies of the draft version of the Final Biological Monitoring and Assessment Report. State Water Regional Control Board Pamela Buford, SWRCB Grant Manager Diane Beaulaurier, San Joaquin River TMDL and NPS Unit CALFED Dan Wermeil, Watershed Program East Merced Resource Conservation District Karen Barstow, President Catherine Weber, Project Director Nancy McConnell, Alliance Project Manager UC Merced Martha Conklin, Professor and Water Quality QA/QC Officer

The Merced River Alliance Project Final Report Volume II: Biological Monitoring and Assessment
Stillwater Sciences
2‐1
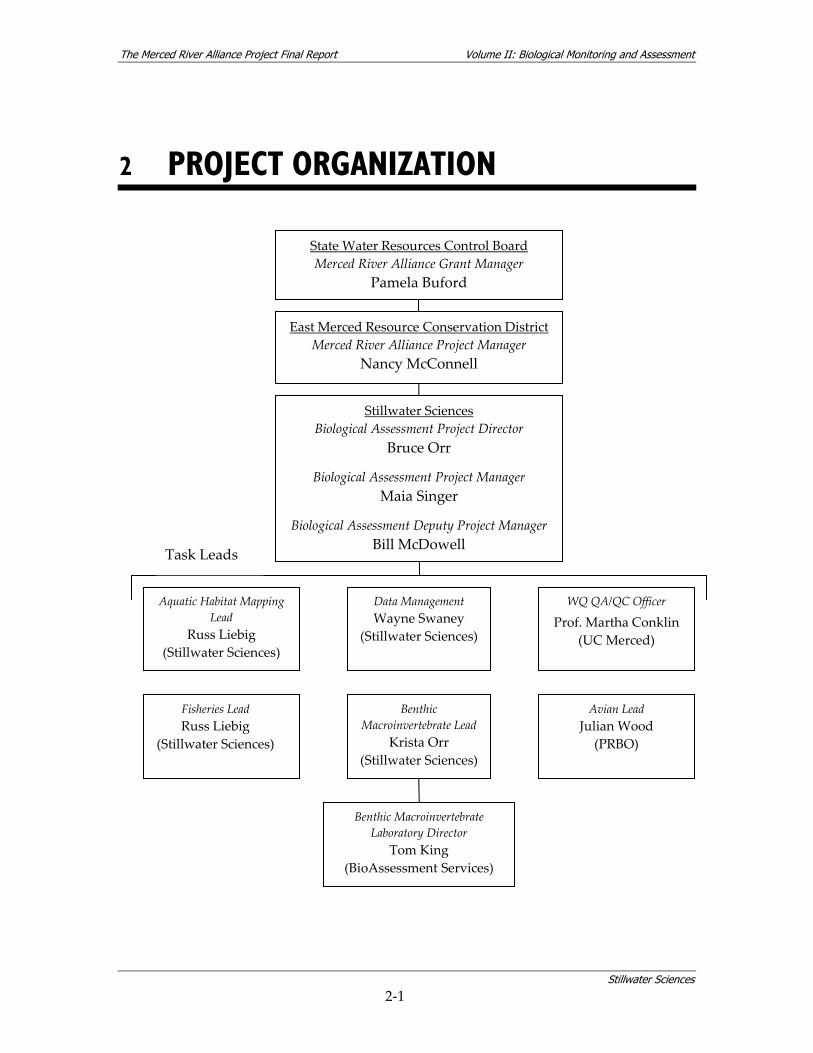
2 PROJECT ORGANIZATION
East Merced Resource Conservation District Merced River Alliance Project Manager
Nancy McConnell
Fisheries Lead Russ Liebig
(Stillwater Sciences)
Avian Lead Julian Wood
(PRBO)
Benthic Macroinvertebrate Lead
Krista Orr (Stillwater Sciences)
Stillwater Sciences Biological Assessment Project Director
Bruce Orr
Biological Assessment Project Manager Maia Singer
Biological Assessment Deputy Project Manager Bill McDowell
State Water Resources Control Board Merced River Alliance Grant Manager
Pamela Buford
Benthic Macroinvertebrate Laboratory Director
Tom King (BioAssessment Services)
Aquatic Habitat Mapping Lead
Russ Liebig (Stillwater Sciences)
Data Management Wayne Swaney
(Stillwater Sciences)
Task Leads
WQ QA/QC Officer
Prof. Martha Conklin (UC Merced)

The Merced River Alliance Project Final Report Volume II: Biological Monitoring and Assessment
Stillwater Sciences
3‐1
3 PROBLEM STATEMENT AND BACKGROUND
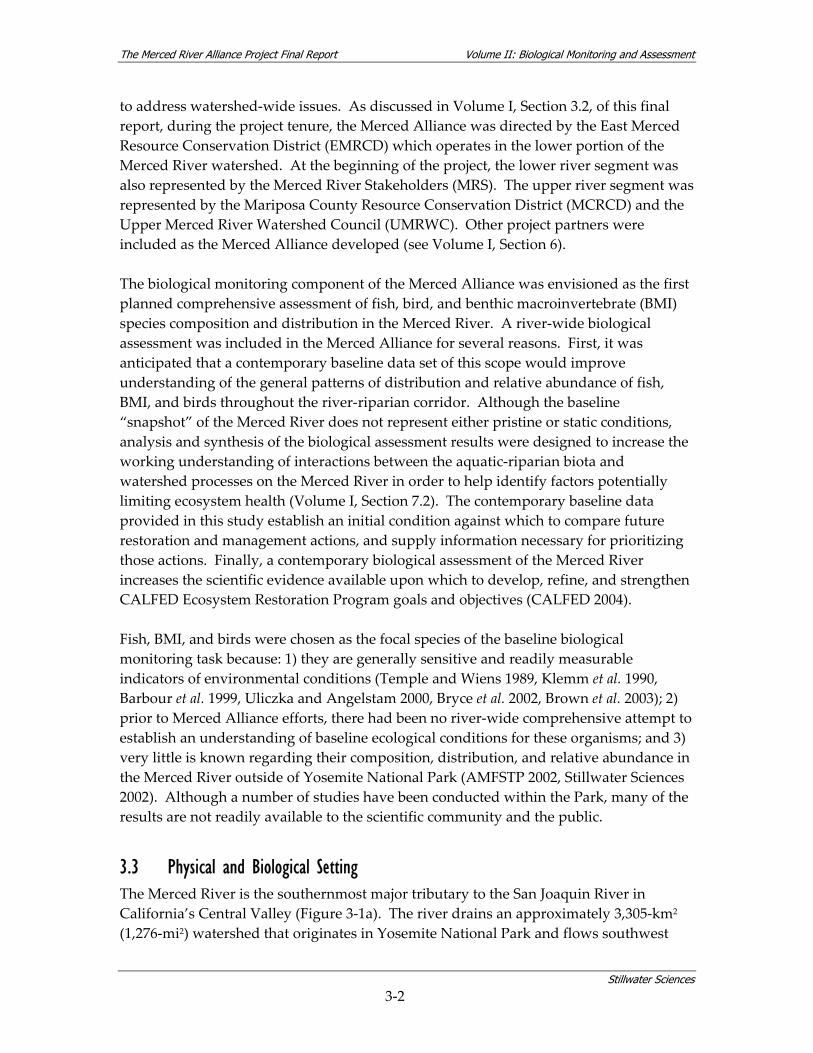
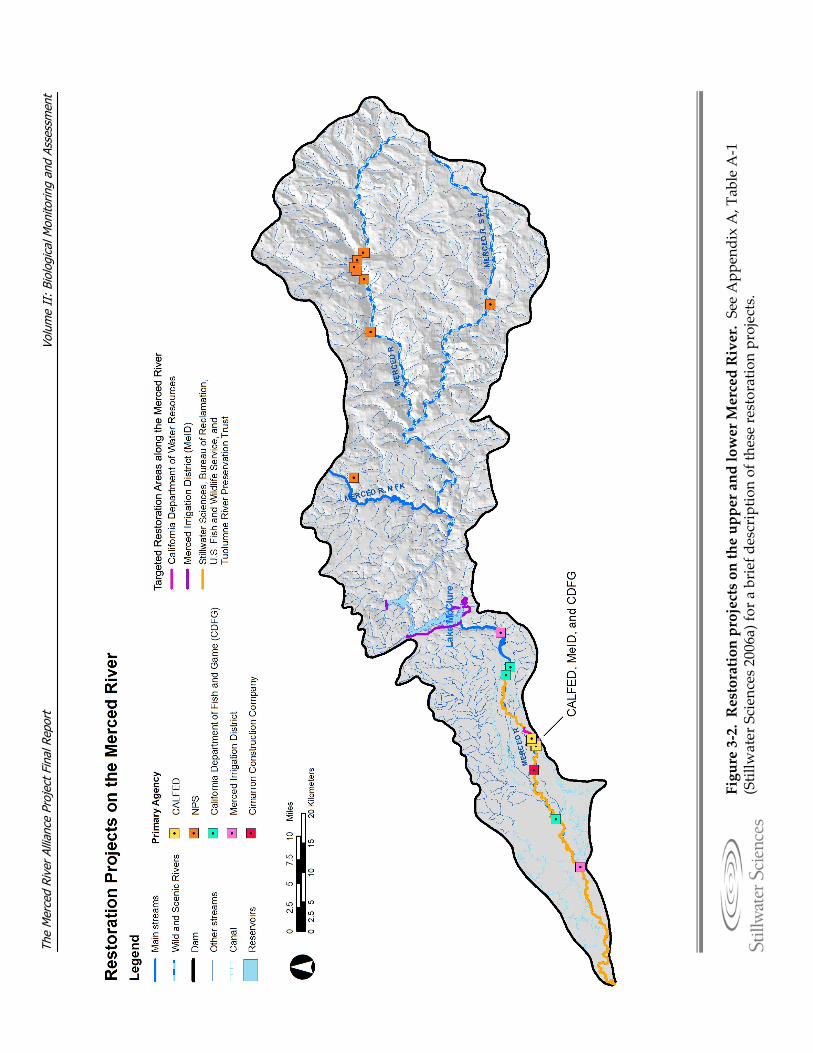
3.1 Problem Statement The Merced River, a major tributary to the San Joaquin River, is located in the southern portion of California’s Central Valley (Figure 3‐1a). The upper and lower segments of the Merced River and the greater watershed have been affected by a range of human interventions including dams and flow regulation, flow diversion, gold and aggregate (sand and gravel) mining, levee construction, land use conversion in the floodplain, clearing of riparian vegetation, introduction of exotic plant and animal species, and point and non‐point source pollution from abandoned mines. Beyond these, effluent from wastewater treatment plants, bank protection, and recreational use are also potential factors affecting the range of biological and physical processes occurring in the Merced River watershed. Although a number of restoration projects have been undertaken during the past two decades (Figure 3‐2; see also Table A‐1, Appendix A), there is currently a lack of contemporary watershed‐scale data to evaluate the effects of various reach or sub‐reach scale projects in either the upper or lower segments of the Merced River. This final report encompasses methods and results from a two‐year, six‐season (Summer 2006 to Spring 2008) biological monitoring and assessment effort for the Merced River. Methods and a summary of existing data, previously described in the Biological Monitoring and Assessment Plan (BMAP [Stillwater Sciences 2006a]), are updated and presented in this final report, as well as a further analysis of the preliminary data given in the Interim Biological Monitoring and Assessment Report (Stillwater Sciences 2007). The majority of intended analyses described in the BMAP (Stillwater Sciences 2006a), along with additional analysis approaches developed during the project tenure, are also included in this final report.
3.2 Study Rationale The biological monitoring component of the Merced River Alliance Project (Merced Alliance) represents the first planned comprehensive assessment of fish, bird, and BMI (benthic macroinvertebrate) species composition and distribution in the Merced River. The larger Merced Alliance concatenates two independent management efforts in the same watershed, creating an umbrella under which the watershed conservation districts and stakeholder groups for the upper and lower Merced River can work collaboratively
The Merced River Alliance Project Final Report Volume II: Biological Monitoring and Assessment
Stillwater Sciences
3‐2
to address watershed‐wide issues. As discussed in Volume I, Section 3.2, of this final report, during the project tenure, the Merced Alliance was directed by the East Merced Resource Conservation District (EMRCD) which operates in the lower portion of the Merced River watershed. At the beginning of the project, the lower river segment was also represented by the Merced River Stakeholders (MRS). The upper river segment was represented by the Mariposa County Resource Conservation District (MCRCD) and the Upper Merced River Watershed Council (UMRWC). Other project partners were included as the Merced Alliance developed (see Volume I, Section 6). The biological monitoring component of the Merced Alliance was envisioned as the first planned comprehensive assessment of fish, bird, and benthic macroinvertebrate (BMI) species composition and distribution in the Merced River. A river‐wide biological assessment was included in the Merced Alliance for several reasons. First, it was anticipated that a contemporary baseline data set of this scope would improve understanding of the general patterns of distribution and relative abundance of fish, BMI, and birds throughout the river‐riparian corridor. Although the baseline “snapshot” of the Merced River does not represent either pristine or static conditions, analysis and synthesis of the biological assessment results were designed to increase the working understanding of interactions between the aquatic‐riparian biota and watershed processes on the Merced River in order to help identify factors potentially limiting ecosystem health (Volume I, Section 7.2). The contemporary baseline data provided in this study establish an initial condition against which to compare future restoration and management actions, and supply information necessary for prioritizing those actions. Finally, a contemporary biological assessment of the Merced River increases the scientific evidence available upon which to develop, refine, and strengthen CALFED Ecosystem Restoration Program goals and objectives (CALFED 2004). Fish, BMI, and birds were chosen as the focal species of the baseline biological monitoring task because: 1) they are generally sensitive and readily measurable indicators of environmental conditions (Temple and Wiens 1989, Klemm et al. 1990, Barbour et al. 1999, Uliczka and Angelstam 2000, Bryce et al. 2002, Brown et al. 2003); 2) prior to Merced Alliance efforts, there had been no river‐wide comprehensive attempt to establish an understanding of baseline ecological conditions for these organisms; and 3) very little is known regarding their composition, distribution, and relative abundance in the Merced River outside of Yosemite National Park (AMFSTP 2002, Stillwater Sciences 2002). Although a number of studies have been conducted within the Park, many of the results are not readily available to the scientific community and the public.
3.3 Physical and Biological Setting The Merced River is the southernmost major tributary to the San Joaquin River in California’s Central Valley (Figure 3‐1a). The river drains an approximately 3,305‐km2 (1,276‐mi2) watershed that originates in Yosemite National Park and flows southwest
The Merced River Alliance Project Final Report Volume II: Biological Monitoring and Assessment
Stillwater Sciences
3‐3
through the Sierra Nevada range before joining the San Joaquin River 140 km (87 mi) south of the City of Sacramento. Elevations in the watershed range from 3,960 m (13,000 ft) at the crest to 15 m (49 ft) at the confluence with the San Joaquin River. The Merced River watershed is bisected into upper and lower segments by New Exchequer Dam (River Mile [RM] * 62.5), which controls runoff from 81 percent of the basin and creates Lake McClure. The upper Merced River contains the mainstem, the North Fork (RM 83.3), and the South Fork Merced River (RM 99.7). The mainstem and South Fork originate within the boundaries of Yosemite National Park, beginning in the southern peaks of the park and draining an area of approximately 1,323‐km2 (511‐mi2) (NPS 2000). From the headwaters to Lake McClure, the mainstem and South Fork rivers are designated by Congress as Wild and Scenic River (Figure 3‐1b) (NPS 2005). The North Fork originates in the Stanislaus National Forest and joins the mainstem within lands administered by the Bureau of Land Management (BLM). The potential for Wild and Scenic river designation for the North Fork Merced River is currently being studied by BLM (P. Cranston, pers. comm. 2005). Overall, the National Park Service, U.S. Forest Service, and Bureau of Land Management administer 242,811 hectares (600,000 acres), or 86%, of the watershed in the upper segment of the Merced River , while approximately 40,469 hectares (100,000 acres), or 14%, are privately owned and dedicated to ranching and other agriculture, much of it on the North Fork of the river. The only major tributary to the lower Merced River is Dry Creek, which drains a 285‐km2 (110‐mi2) watershed and joins the Merced River at RM 32.7. The lower portion of the Merced River watershed is almost entirely privately owned and land use is predominantly agricultural (grazing, dairy, poultry, and orchard). Aggregate mining of dredger tailings occurs within the Dredger Tailings Reach (DTR), an 11‐km (7‐mi) stretch of river between Crocker‐Huffman Dam (RM 52) and a point just downstream of the Snelling Road Bridge (RM 45.2) (Stillwater Sciences 2002). Within the DTR, CDFG owns the Merced River Ranch (MRR [RM 50 to 51]). The MRR was purchased by CDFG in 1998 as a source of sand, gravel, and cobble for future restoration projects and as a floodplain restoration site. Merced Irrigation District (Merced ID) owns the Cuneo Fishing Access property at the north boundary of the MRR and the Main Canal which runs through the southern portion of the Ranch. Merced ID also owns land under which the CDFG operates a Chinook salmon (Oncorhynchus tshawytscha) hatchery, and leases property to the Calaveras Trout Farm at the north‐east boundary of the MRR. Small parcels of publicly owned land occur throughout the lower Merced River, including Henderson County Park, Hagaman County Park, McConnell State Park, and George J. Hatfield State Park (Figure 3‐1b).
* River Mile (RM), rather than River Kilometer (RK), designations are reported following USGS convention. All RM’s
are derived from the USGS 1:100,000 Digital Line Graph (DLG).
The Merced River Alliance Project Final Report Volume II: Biological Monitoring and Assessment
Stillwater Sciences
3‐4
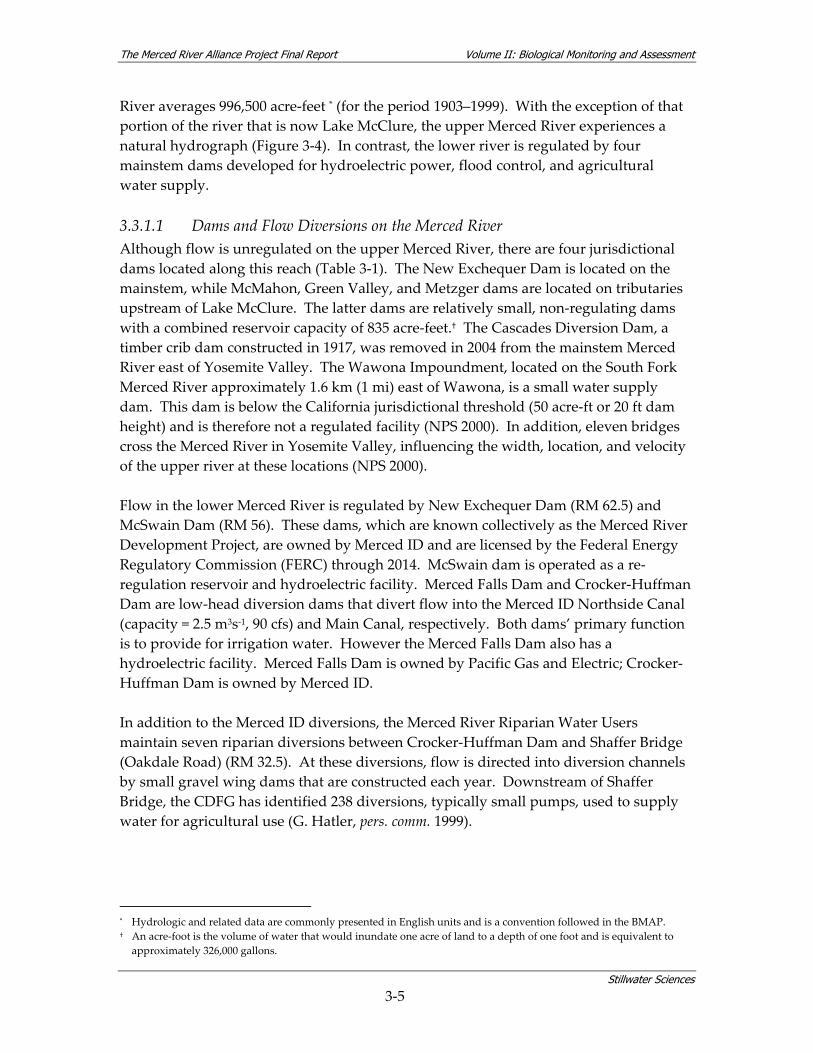
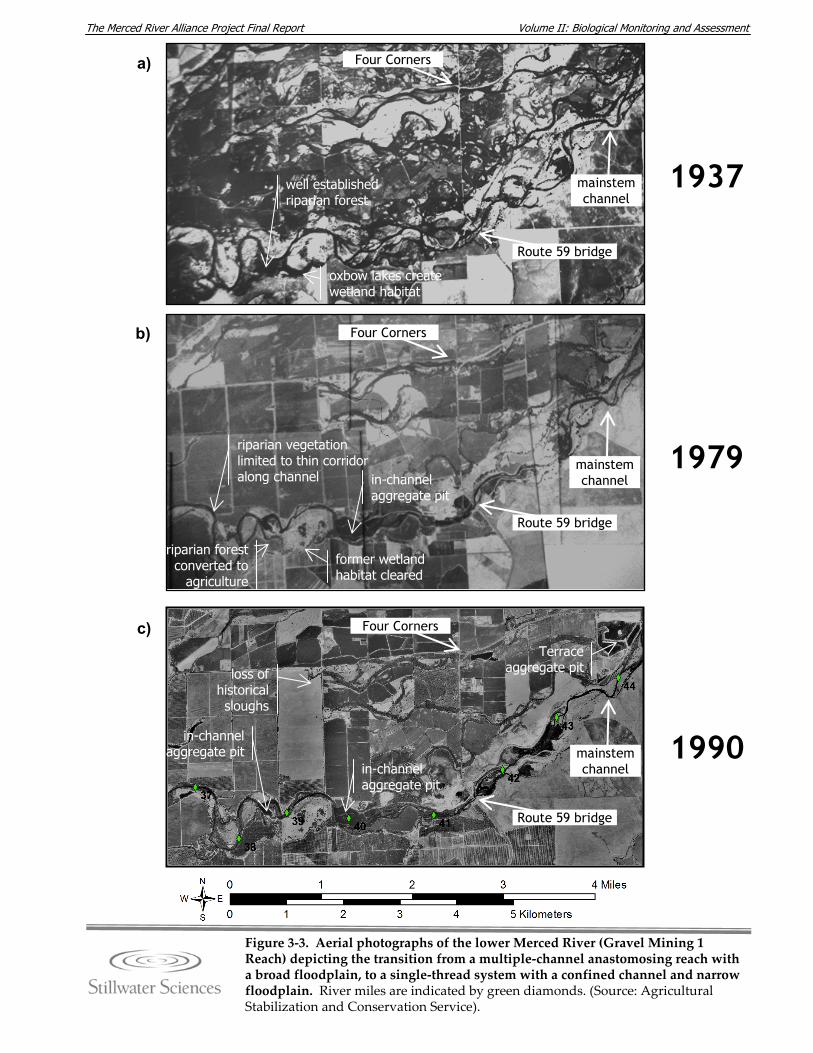
3.3.1 Geomorphology and Hydrology The Merced River originates in the high elevations of the western Sierra Nevada. It flows westward through about 595 km2 (230 mi2) of granitic terrain in Yosemite National Park, where it is confined in bedrock valleys by steep bedrock gorges. Prior to the mid‐19th century, wet meadows were prevalent in Yosemite Valley, particularly in the western portion of the Valley proximal to a large moraine at the foot of El Capitan. In 1879, a 1.2‐ to 2.7‐m (4‐ to 9‐ft) portion of the moraine was blasted out of the Merced River channel in order to lower the water table behind the moraine. The intent was to reduce the amount of wet meadows, thereby reducing mosquito populations in the Valley. Since the blasting, the Merced River upstream of El Capitan has become more channelized, with fewer wet meadows in the riparian zone, and an increased erosion rate of the river base level in adjacent areas between El Capitan Meadow and Yosemite Lodge (NPS 2000). After leaving Yosemite National Park, the Merced River flows through roughly 155 km2 (60 mi2) of metamorphic terrain in the western Sierran foothills between El Portal and the Merced Falls Dam (Stillwater Sciences 2001). Construction and operation of the Merced Falls Dam (1901), along with that of the original Exchequer Dam (1926), the New Exchequer Dam (1967) and McSwain Dam (1966), has caused major geomorphic and hydrologic perturbations to the mainstem Merced River downstream of confluence with the North Fork Merced River (RM 83.3). Details about these and other, smaller dams on the Merced River are discussed in Section 3.3.1.1, and the effects of flow regulation and diversion on hydrology and sediment supply to the lower portion of the Merced River watershed are discussed in Section 3.3.1.2 . The river leaves the upland landscape near Merced Falls Dam (RM 55) and enters the broad, unconfined eastern California Central Valley. The river valley broadens near Crocker‐Huffman Dam (RM 52) and the river enters into what was historically a highly dynamic, multiple channel (anastomosing) river system (Figure 3‐3a). Review of maps and aerial photographs from 1937 to 1990 indicates that these channels, which included the current mainstem channel as well as Ingalsbe, Dana and Hopeton sloughs, once occupied the entire width of the valley floor (up to 7.2 km [4.5 mi] wide) in the Snelling vicinity. The combined effects of valley‐scale gold dredging, flow regulation, elimination of coarse sediment supply, reduction of fine sediment supply, and land‐use development have converted the lower Merced River in this reach from a complex, multiple‐channel system (Figure 3‐3a) to a single‐thread system with a narrow floodplain adjacent to the confined channel (Figure 3‐3b,c). Downstream of the Dry Creek confluence (RM 32.7), the valley width narrows again. Similar to other rivers originating from the west side of the Sierra Nevada, flow in the Merced River is typified by late spring and early summer snowmelt, fall and winter rainstorm peaks, and low summer baseflows. Annual water yield from the Merced
The Merced River Alliance Project Final Report Volume II: Biological Monitoring and Assessment
Stillwater Sciences
3‐5
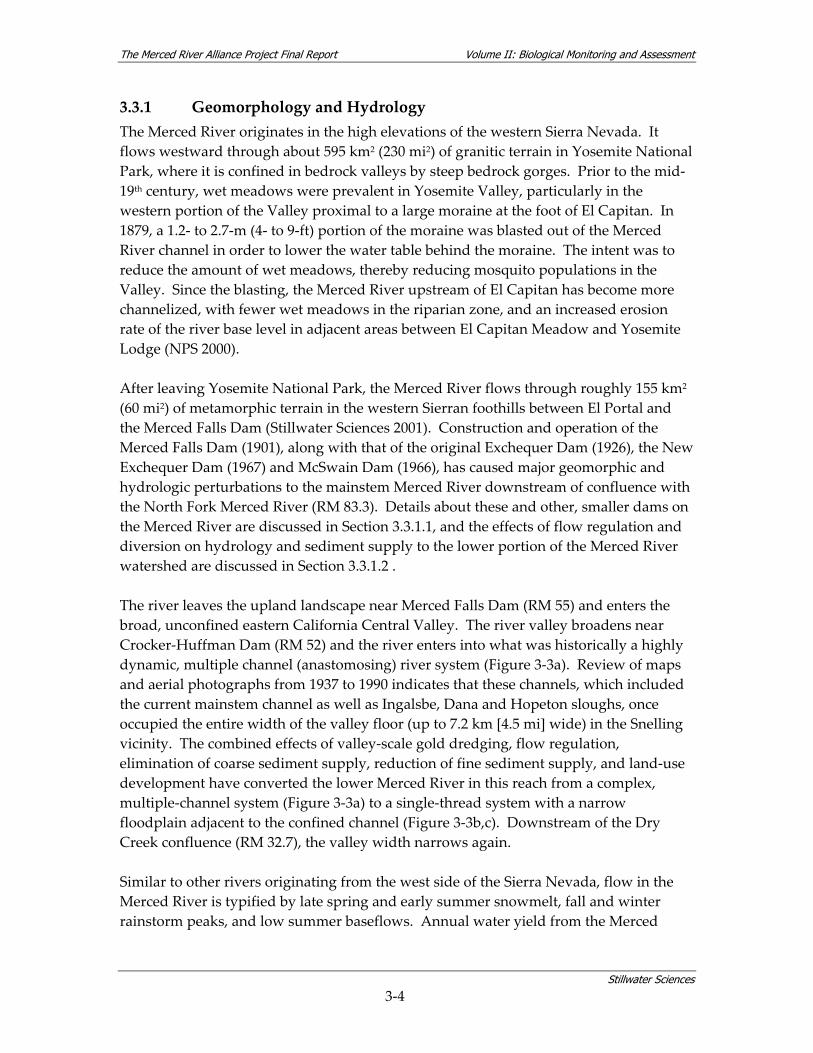
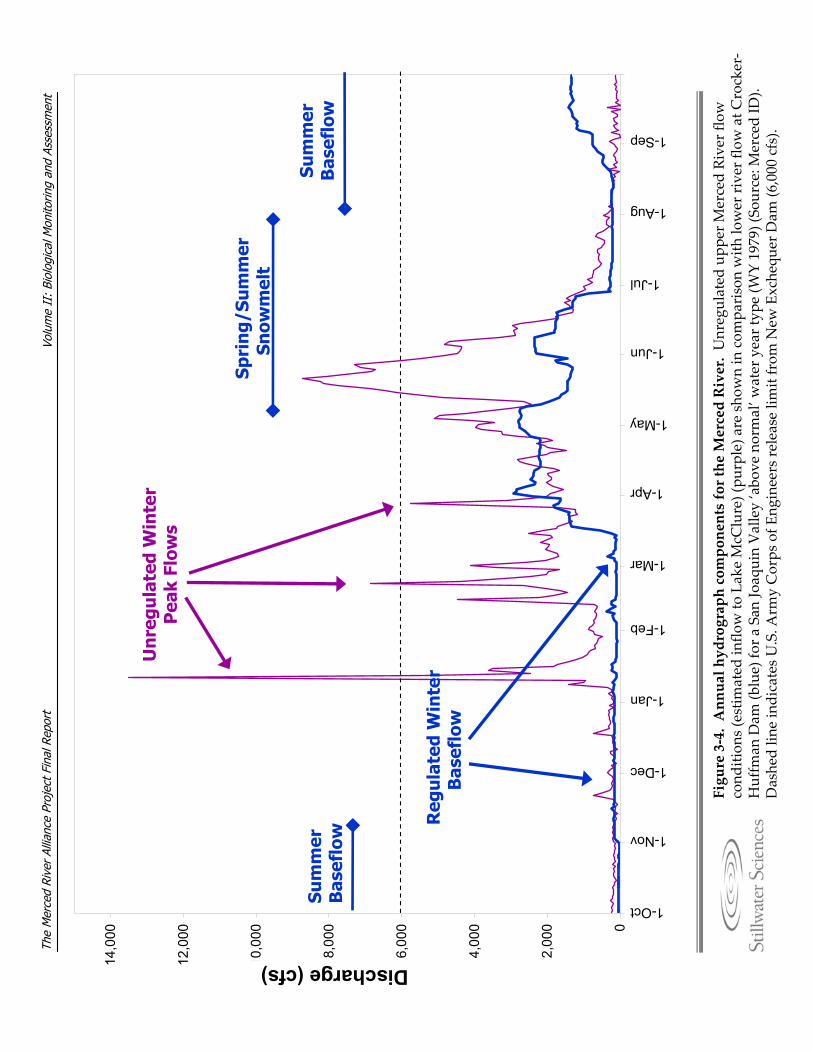
River averages 996,500 acre‐feet * (for the period 1903–1999). With the exception of that portion of the river that is now Lake McClure, the upper Merced River experiences a natural hydrograph (Figure 3‐4). In contrast, the lower river is regulated by four mainstem dams developed for hydroelectric power, flood control, and agricultural water supply. 3.3.1.1 Dams and Flow Diversions on the Merced River Although flow is unregulated on the upper Merced River, there are four jurisdictional dams located along this reach (Table 3‐1). The New Exchequer Dam is located on the mainstem, while McMahon, Green Valley, and Metzger dams are located on tributaries upstream of Lake McClure. The latter dams are relatively small, non‐regulating dams with a combined reservoir capacity of 835 acre‐feet.† The Cascades Diversion Dam, a timber crib dam constructed in 1917, was removed in 2004 from the mainstem Merced River east of Yosemite Valley. The Wawona Impoundment, located on the South Fork Merced River approximately 1.6 km (1 mi) east of Wawona, is a small water supply dam. This dam is below the California jurisdictional threshold (50 acre‐ft or 20 ft dam height) and is therefore not a regulated facility (NPS 2000). In addition, eleven bridges cross the Merced River in Yosemite Valley, influencing the width, location, and velocity of the upper river at these locations (NPS 2000). Flow in the lower Merced River is regulated by New Exchequer Dam (RM 62.5) and McSwain Dam (RM 56). These dams, which are known collectively as the Merced River Development Project, are owned by Merced ID and are licensed by the Federal Energy Regulatory Commission (FERC) through 2014. McSwain dam is operated as a re‐regulation reservoir and hydroelectric facility. Merced Falls Dam and Crocker‐Huffman Dam are low‐head diversion dams that divert flow into the Merced ID Northside Canal (capacity = 2.5 m3s‐1, 90 cfs) and Main Canal, respectively. Both dams’ primary function is to provide for irrigation water. However the Merced Falls Dam also has a hydroelectric facility. Merced Falls Dam is owned by Pacific Gas and Electric; Crocker‐Huffman Dam is owned by Merced ID. In addition to the Merced ID diversions, the Merced River Riparian Water Users maintain seven riparian diversions between Crocker‐Huffman Dam and Shaffer Bridge (Oakdale Road) (RM 32.5). At these diversions, flow is directed into diversion channels by small gravel wing dams that are constructed each year. Downstream of Shaffer Bridge, the CDFG has identified 238 diversions, typically small pumps, used to supply water for agricultural use (G. Hatler, pers. comm. 1999).
* Hydrologic and related data are commonly presented in English units and is a convention followed in the BMAP. † An acre‐foot is the volume of water that would inundate one acre of land to a depth of one foot and is equivalent to
approximately 326,000 gallons.
The Merced River Alliance Project Final Report Volume II: Biological Monitoring and Assessment
Stillwater Sciences
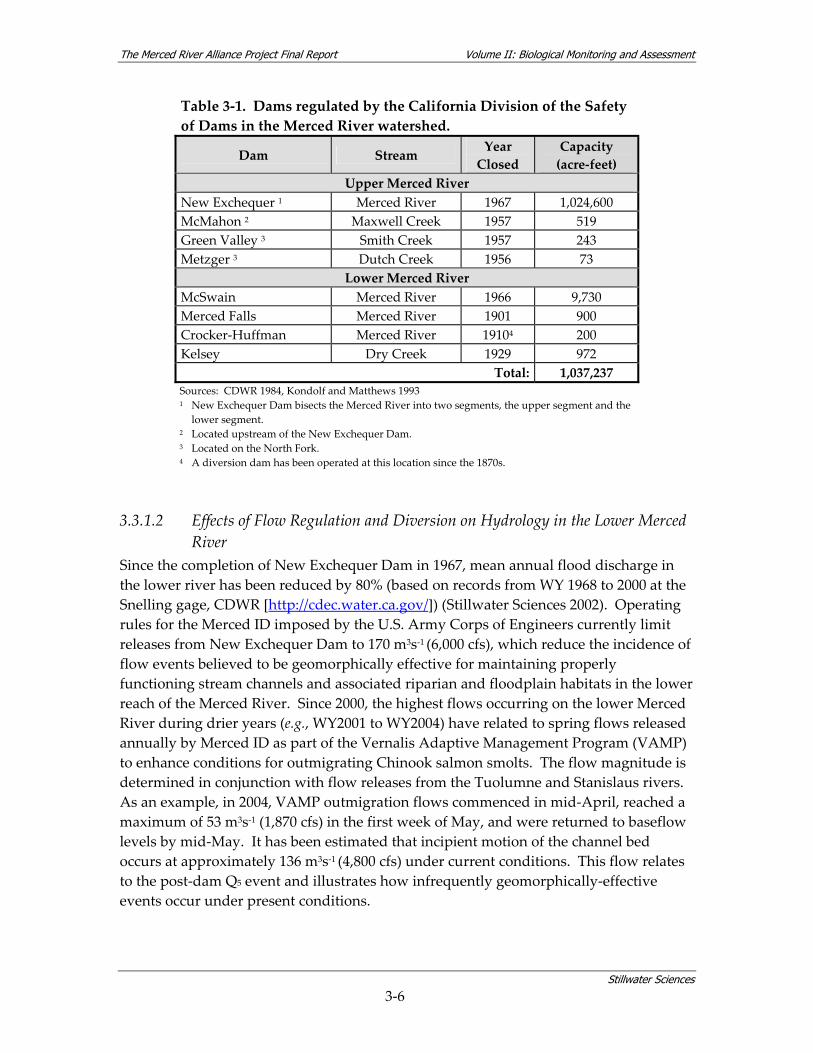
3‐6
Table 3‐1. Dams regulated by the California Division of the Safety of Dams in the Merced River watershed.
Dam Stream Year Closed
Capacity (acre‐feet)
Upper Merced River New Exchequer 1 Merced River 1967 1,024,600 McMahon 2 Maxwell Creek 1957 519 Green Valley 3 Smith Creek 1957 243 Metzger 3 Dutch Creek 1956 73
Lower Merced River McSwain Merced River 1966 9,730 Merced Falls Merced River 1901 900 Crocker‐Huffman Merced River 19104 200 Kelsey Dry Creek 1929 972
Total: 1,037,237 Sources: CDWR 1984, Kondolf and Matthews 1993 1 New Exchequer Dam bisects the Merced River into two segments, the upper segment and the
lower segment. 2 Located upstream of the New Exchequer Dam. 3 Located on the North Fork. 4 A diversion dam has been operated at this location since the 1870s.
3.3.1.2 Effects of Flow Regulation and Diversion on Hydrology in the Lower Merced
River Since the completion of New Exchequer Dam in 1967, mean annual flood discharge in the lower river has been reduced by 80% (based on records from WY 1968 to 2000 at the Snelling gage, CDWR [http://cdec.water.ca.gov/]) (Stillwater Sciences 2002). Operating rules for the Merced ID imposed by the U.S. Army Corps of Engineers currently limit releases from New Exchequer Dam to 170 m3s‐1 (6,000 cfs), which reduce the incidence of flow events believed to be geomorphically effective for maintaining properly functioning stream channels and associated riparian and floodplain habitats in the lower reach of the Merced River. Since 2000, the highest flows occurring on the lower Merced River during drier years (e.g., WY2001 to WY2004) have related to spring flows released annually by Merced ID as part of the Vernalis Adaptive Management Program (VAMP) to enhance conditions for outmigrating Chinook salmon smolts. The flow magnitude is determined in conjunction with flow releases from the Tuolumne and Stanislaus rivers. As an example, in 2004, VAMP outmigration flows commenced in mid‐April, reached a maximum of 53 m3s‐1 (1,870 cfs) in the first week of May, and were returned to baseflow levels by mid‐May. It has been estimated that incipient motion of the channel bed occurs at approximately 136 m3s‐1 (4,800 cfs) under current conditions. This flow relates to the post‐dam Q5 event and illustrates how infrequently geomorphically‐effective events occur under present conditions.
The Merced River Alliance Project Final Report Volume II: Biological Monitoring and Assessment
Stillwater Sciences
3‐7
3.3.2 Habitat and Biota A compilation and synthesis of existing fish, bird, and BMI data for the upper and lower Merced River was undertaken as a component of the Merced River biological assessment monitoring, and is discussed in more detail in Volume I, Section 5.3.2. The following section represents a basic overview of general habitat and biota conditions. Habitat along the Merced River corridor varies with topography and elevation as the river flows through mountains, foothills, and the valley floor to its confluence with the San Joaquin River. Three ecoregions are represented: the Central California Valley, the Southern and Central California chaparral and woodlands, and the Sierra Nevada (Omernik and Bailey 1997, Miles and Goudey 1997). The upper portion of the Merced River, located in the Sierra Nevada and upper foothills, contains large blocks of high‐quality mature forest, relatively diverse and abundant wildlife communities, and high water quality. While habitat fragmentation affects wildlife species in the upper portion of the Merced River watershed (NPS 2000), the majority of land in Yosemite National Park is designated Wilderness under the California Wilderness Act of 1984 (Public Law 98‐425), not including the developed Valley areas where the majority of park infrastructure and facilities are located (NPS 2005). Five major vegetation zones are supported in Yosemite National Park: chaparral/oak woodland, lower montane, upper montane, subalpine, and alpine (NPS 2000). El Portal, just outside the Park, is in the chaparral/oak woodland zone. Distributions of vegetation cover types in Yosemite National Park and El Portal have been mapped by the National Park Service (Aerial Information Systems 1997). Other areas outside of Yosemite Valley are in the lower montane, upper montane, and subalpine zones (NPS 2000). Non‐native plant species occur to some extent throughout the upper portion of the Merced River watershed. A number of state‐listed rare vegetation types are sustained in the El Portal area (NPS 2000). Fire suppression and changing land‐use practices have altered natural fire regimes of the Sierra Nevada dramatically, affecting ecological structures and functions in associated plant communities (UC Davis 1996). The lower Merced River segment is located in the valley floor and lower foothills. Along this segment of the river, land use activities including gold dredging, gravel mining, and agricultural development have significantly reduced the extent of riparian vegetation. While there are no pre‐colonial estimates of riparian forest extent specific to the Merced River, the remaining riparian landscape in the lower portion of the watershed (approximately 1,619 ha [4,000 ac]), represents roughly 20% of the pre‐dam floodplain area (Stillwater Sciences 2001). A wide range of vegetation conditions currently occurs in the Merced River corridor, from a thin band of trees one tree canopy wide in developed reaches to large patches of relatively intact floodplain forest near the confluence with the San Joaquin River. In general however, widespread encroachment of riparian vegetation into the former active river channel in recent decades has generally prevented establishment of pioneer riparian species and has arrested natural vegetation successional patterns (Stillwater Sciences 2001). Non‐native invasive grasses
The Merced River Alliance Project Final Report Volume II: Biological Monitoring and Assessment
Stillwater Sciences
3‐8
and forbs dominate the herbaceous communities on the lower Merced River, and some non‐native tree and shrub species have become established and threaten to invade more of the corridor. Although biota in the upper portion of the watershed have experienced relatively less land use disturbance than that of the lower portion, habitat quality and species composition have been altered in the upper river. For example, most fish in Yosemite National Park are introduced species (NPS 2000). Although fish stocking in Yosemite no longer occurs, past stocking activities, along with other anthropogenic influences (e.g., fallen tree removal from streams, elimination of riparian vegetation by human trampling and bank stabilization, alteration of meadow hydrology by roads, ditches and utility structures), have altered fish populations in Yosemite Valley. While rainbow trout (O. mykiss) is the only salmonid species native to the upper portion of the watershed, including Yosemite National Park, it is now outnumbered by non‐native brown trout (Salmo trutta) in many stretches of the upper Merced River (NPS 2000).* Additionally, introductions of non‐native stocks of rainbow trout have altered the genetics of Yosemite Valley’s native strain (NPS 2000) (see Section 5.3.1 of the BMAP [Stillwater Sciences 2006a] for further detail of fish species distribution and stocking in Yosemite National Park). Noticeable population declines have been detected in a variety of bird species in the Sierra Nevada, including two species that have been observed in the Merced River watershed: Great Gray Owls (Strix nebulosa) and Willow Flycatchers (Empidonax traillii). Possible causes for these declines include grazing, logging, fire suppression, development, recreational use, pesticides, habitat destruction on wintering grounds, large‐scale climate changes, and nest parasitism by Brown‐headed Cowbirds (Molothrus ater) (NPS 2000). In the lower river, biotic responses to the severe degradation of in‐channel and floodplain habitats have not been well documented. For example, although the riparian zone area has significantly decreased since pre‐colonial times, and the natural successional patterns of the vegetation are now impaired, the impact on avian species has not been formally studied. Additionally, it is known that dam construction eliminated access to upstream holding pools and spawning areas and resulted in the extirpation of Central Valley spring‐run Chinook salmon from the basin by the late 1940s (Skinner 1962). Because Central Valley fall‐run Chinook salmon do not require cold pools in which to over‐summer as adults, they were not as vulnerable to habitat loss and alteration as the spring run. Fall‐run Chinook salmon are an important management species in the Merced River, and numerous state and federal resource programs include increasing the abundance of Chinook salmon in their goals. Although anadromous salmonids historically migrated into the upper reaches of the Merced River, spawning is now concentrated in the * Results by Brown and Short (1999) indicate relatively more rainbow trout than brown trout at several Yosemite
National Park sites monitored in 1993–1995.
The Merced River Alliance Project Final Report Volume II: Biological Monitoring and Assessment
Stillwater Sciences
3‐9
Dredger Tailings Reach (RM 44.7 to RM 51.3) directly downstream of the Crocker‐Huffman Dam, which is a barrier to upstream fish movement. The Merced River Hatchery is located just below Crocker‐Huffman Dam and is the only salmon hatchery in the San Joaquin River basin. The hatchery utilizes San Joaquin Chinook salmon broodstock (CDFG 1998a, as cited by Vogel 2003), producing an estimated 9% of the Merced River fall‐run Chinook in 2000 (where natural production is estimated at 91% by CDFG 1994 as cited in USFWS 2002). Merced ID currently increases flows during the critical fall‐run Chinook salmon outmigration period (VAMP flows) to increase juvenile Chinook salmon survival during outmigration in the lower Merced River and, in conjunction with VAMP flow releases on other tributaries, downstream in the San Joaquin River and Delta. Steelhead (the anadromous life history form of Oncorhynchus mykiss; rainbow trout are the resident life history form) are also an important management species, although their historical occurrence and distribution in the Merced River is not well documented. The Central Valley steelhead ESU is listed as threatened under the federal Endangered Species Act (USFWS 1998).

Volu
me
II:
Biol
ogic
al M
onito
ring
and
Asse
ssm
ent
The
Mer
ced
Rive
r Al
lianc
e Pr
ojec
t Fin
al R
epor
t
Figure 3‐1. M
erced River watershed, project location, and land use. a) Location of th
e Merced River a
s a
tributary to th
e San Joaquin River, which flow
s no
rth an
d into th
e San Fran
cisco Ba
y‐Delta. b) T
he M
erced
River is show
n with Lake McC
lure bisectin
g the up
per a
nd lo
wer segments at N
ew Exchequ
er Dam
. La
nd
use alon
g the up
per river is primarily fede
ral, while in th
e lower river it is prim
arily private and agricultural.
a)
b)
Volu
me
II:
Biol
ogic
al M
onito
ring
and
Asse
ssm
ent
The
Mer
ced
Rive
r Al
lianc
e Pr
ojec
t Fin
al R
epor
t
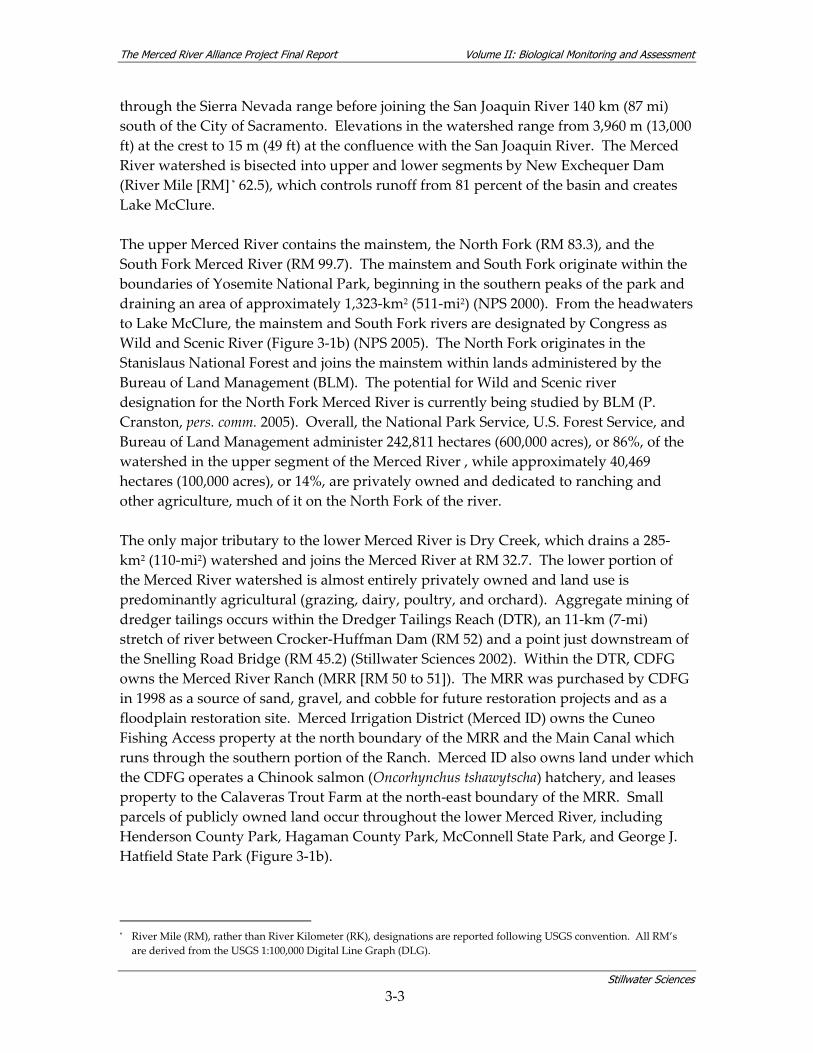
Figure 3‐2. Restoration projects on the upper and lower Merced River.See App
endix A, T
able A‐1
(Stillw
ater Sciences 2006a) fo
r a brief descriptio
n of th
ese restoration projects.
Volu
me
II:
Biol
ogic
al M
onito
ring
and
Asse
ssm
ent
The
Mer
ced
Rive
r Al
lianc
e Pr
ojec
t Fin
al R
epor
t
Figure 3‐4.Annual hydrograph components for the Merced River. Unregulated upp
er M
erced River flow
cond
ition
s (estim
ated in
flow to Lake McC
lure) (pu
rple) a
re sho
wnin com
parison with lo
wer river flow at C
rocker‐
Huffm
an Dam (b
lue) fo
r a San Jo
aquin Valley ‘abo
ve normal’w
ater year typ
e (W
Y 1979) (So
urce: M
erced ID
).
Dashed lin
e indicates U.S. A
rmy Corps of E
ngineers re
lease lim
itfrom N
ew Exchequ
er Dam (6
,000 cfs).
0
2,00
0
4,00
0
6,00
0
8,00
0
10,0
00
12,0
00
14,0
00
1-Oct
1-Nov
1-Dec
1-Jan
1-Feb
1-Mar
1-Apr
1-May
1-Jun
1-Jul
1-Aug
1-Sep
dt
discharge (cfs)
Sum
mer
Bas
eflo
w
Un
regu
late
d W
inte
rP
eak
Flow
s
Spri
ng/
Sum
mer
Snow
mel
t
Sum
mer
Bas
eflo
w
Reg
ula
ted
Win
ter
Bas
eflo
w
Discharge (cfs)
Volume II: Biological Monitoring and Assessment The Merced River Alliance Project Final Report
Figure 3‐3. Aerial photographs of the lower Merced River (Gravel Mining 1 Reach) depicting the transition from a multiple‐channel anastomosing reach with a broad floodplain, to a single‐thread system with a confined channel and narrow floodplain. River miles are indicated by green diamonds. (Source: Agricultural Stabilization and Conservation Service).
1937
1979
1990
Four Corners
Route 59 bridge
mainstem channel
Route 59 bridge
Route 59 bridge
Terrace aggregate pit
in-channel aggregate pit
Four Corners
Four Corners
riparian vegetationlimited to thin corridor along channel
riparian forest converted to
agriculture
former wetland habitat cleared
oxbow lakes create wetland habitat
well establishedriparian forest
mainstem channel
mainstem channel
in-channel aggregate pit
in-channel aggregate pit
loss of historical sloughs
a)
b)
c)

The Merced River Alliance Project Final Report Volume II: Biological Monitoring and Assessment
Stillwater Sciences
4‐1
4 BIOLOGICAL MONITORING & ASSESSMENT GOALS & OBJECTIVES
The primary goal of the biological monitoring and assessment is to provide contemporary baseline data regarding native and non‐native fish, riparian bird, and BMI species on the upper and lower reaches of the Merced River.* This goal supports several AFRP/CALFED Adaptive Management Forum recommendations for including adaptive management techniques in current and future restoration projects on the Merced River (AMFSTP 2002). While the complete adaptive management process itself is not addressed by the Merced Alliance, monitoring necessary to support the application of an adaptive management approach is addressed. For example, the study is designed to expand existing information beyond the current focus on adult Chinook salmon abundance, distribution and smolt output for the lower Merced River, by including other life history stages of salmon and by collecting ecological data on other species of interest (AFRP/CALFED Monitoring Recommendation 4.3.1). Additionally, because the scope of the project is river‐wide, this study provides baseline information at multiple scales for areas outside those currently under restoration. The baseline biological monitoring and assessment will offer a useful set of comparative data on habitat use in restored and unrestored environments (AFRP/CALFED Monitoring Recommendation 4.3.1). The multi‐year, river‐wide scope also supports the application of an ecosystem‐scale perspective to management and recovery of listed species on the Merced River (AFRP/CALFED Ecosystem Perspective Recommendation 4.1). In an effort to guide current and projected restoration activities on the Merced River, the biological monitoring and assessment was designed with a secondary goal of testing hypotheses for each monitoring component (e.g., fish, BMI, riparian birds) when feasible. Although these hypotheses have been tested as part of the monitoring program, the baseline surveys, combined with other ongoing monitoring of environmental conditions, are expected to provide information from which additional, more specific hypotheses can be developed in future studies.
* Riparian vegetation monitoring, while not a separate component of the monitoring plan, is addressed as part of avian
habitat characterization (Section 5.2.5.3).

The Merced River Alliance Project Final Report Volume II: Biological Monitoring and Assessment
Stillwater Sciences
4‐2
The following list summarizes the Merced Alliance biological monitoring objectives (repeated from Volume I of this final report):
1. Compile and synthesize existing biological data for the Merced River corridor.
2. Compile and map aquatic habitat data for the Merced River corridor in GIS.
3. Undertake two years of biological monitoring for fish, BMI, and riparian bird communities in the Merced River watershed.
a. Expand and enhance past and existing monitoring efforts. b. Standardize monitoring protocols to ensure compatibility with
regional data sets (including SWAMP Quality Assurance Project Plan [QAPP] elements) and allow for comparisons with other Central Valley river corridors.
c. Apply river‐long monitoring and assessment protocols that support CALFED Science Board recommendations (AMFSTP 2002).
d. Address specific biological assessment hypotheses developed to guide current and future river restoration efforts.
4. Organize baseline biological and relevant physical habitat data and make available to local watershed‐related entities and agencies.
a. Present at community meetings. b. Transfer data to the Merced Alliance web‐site
(http://www.mercedalliance.org). c. Submit annual reports to the SWRCB.
Detailed methods for each of the monitoring components are described in Section 5.2, including subject‐specific monitoring objectives, methods and hypotheses. Following the SWRCB recommended report structure, a review of existing biological data sources for the Merced River was originally detailed in Section 6 for both the BMAP (Stillwater Sciences 2006a) and the Interim Report (Stillwater Sciences 2007). For the Merced Alliance final report, review of existing data sources is presented in Volume I, however a Section 6 placeholder remains in Volume II to maintain consistency with the SWRCB report structure. Monitoring results are presented in Section 7, while Section 8 includes data evaluation for each monitoring component and comparison of new data to existing data. Field data, including water quality data collected as part of the fish and BMI studies (i.e., dissolved oxygen, temperature, conductivity, pH, and turbidity) were measured in accordance with SWAMP protocols and the SWAMP QAPP, as detailed in the BMAP (Stillwater Sciences 2006a). As the Merced Alliance project scope did not include a comprehensive water quality survey, water quality data collected during the fish and BMI studies are not combined for the final report—i.e., fish water quality data are reported with fish survey results, and BMI water quality data are reported with the BMI survey results.
The Merced River Alliance Project Final Report Volume II: Biological Monitoring and Assessment
Stillwater Sciences
5‐1
5 BIOLOGICAL MONITORING & ASSESSMENT DESCRIPTION
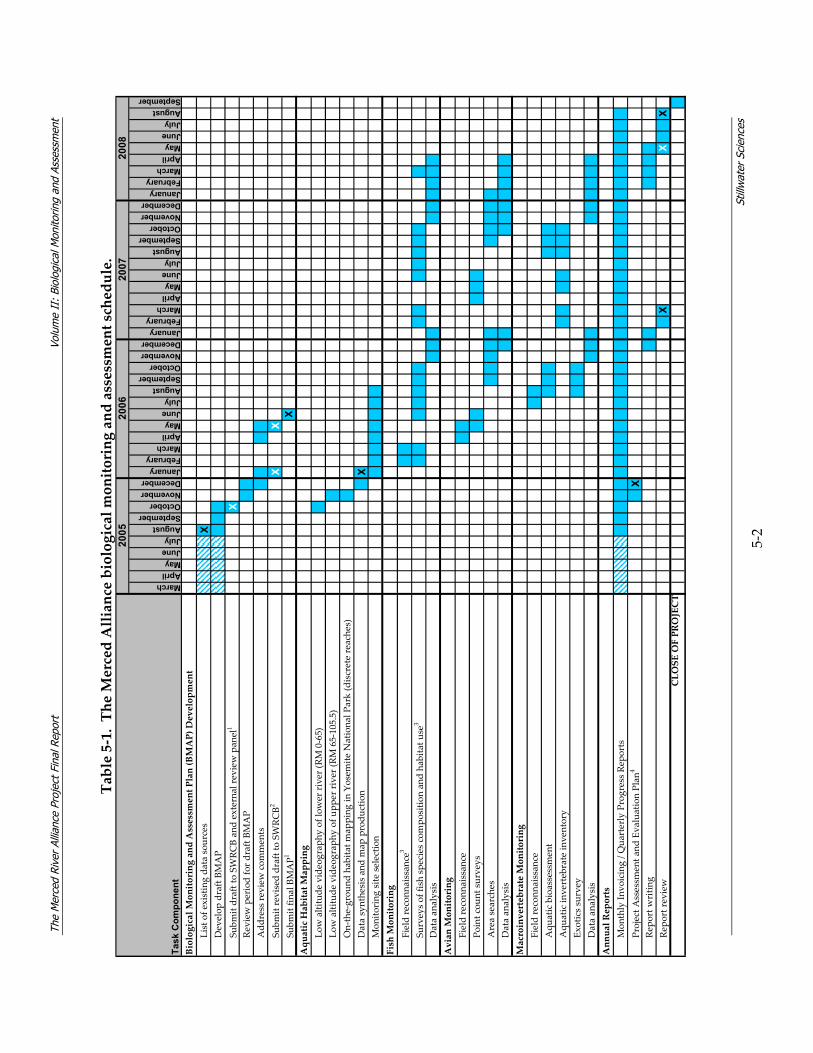
5.1 Project Schedule Table 5‐1 presents the project schedule.
5.2 Monitoring Methodology As discussed in Section 4, the Merced Alliance biological monitoring and assessment was designed to provide a river‐long contemporary snapshot for three major communities of organisms: fish, BMI, and riparian birds. As a reflection of the river‐long monitoring and assessment approach, and in an effort to significantly expand and enhance past and existing monitoring efforts on the Merced River, a total of 95 monitoring sites were located throughout the lower and upper river segments (Figure 5‐1). Fish monitoring sites in the lower river were sampled across three seasons (spring, summer, fall), while fish sites in the upper river were sampled during the fall only. BMI sites in both the upper and lower river were sampled primarily in the fall, with the exception of a subset of BMI sites which were also sampled during the spring, and Chinese mitten crab sites in the lower river sampled during summer and fall 2006. Finally, bird monitoring sites along the lower river corridor were sampled across three seasons (spring, fall, winter), while bird sites along the upper river corridor were sampled during two seasons (spring, fall). Timing of the individual sampling efforts was based on species biology and life history and is described in more detail for each community in sections 5.2.3.3, 5.2.4.3, and 5.2.5.3.
The
Mer
ced
Rive
r Al
lianc
e Pr
ojec
t Fin
al R
epor
t Vo
lum
e II
: Bi
olog
ical
Mon
itorin
g an
d As
sess
men
t
Still
wat
er S
cien
ces
5‐2
Table 5‐1. The Merced Alliance biological monitoring and assessment schedule.
MarchAprilMayJuneJulyAugustSeptemberOctoberNovemberDecemberJanuaryFebruaryMarchAprilMayJuneJulyAugustSeptemberOctoberNovemberDecemberJanuaryFebruaryMarchAprilMayJuneJulyAugustSeptemberOctoberNovemberDecemberJanuaryFebruaryMarchAprilMayJuneJulyAugustSeptember
Biological Monitoring and Assessment Plan (BMAP) Development
List of e
xisting da
ta sou
rces
XDevelop draft BM
AP
Subm
it draft to SW
RCB an
d external re
view pan
el1
XRe
view period for d
raft BM
AP
Add
ress re
view com
ments
Subm
it revised draft to SW
RCB2
XX
Subm
it fin
al BMAP1
XAquatic Habitat M
apping
Low altitude videograp
hy of low
er river (RM
0‐65)
Low altitude videograp
hy of u
pper river (RM
65‐105.5)
On‐the‐grou
nd habita
t map
ping in Yosem
ite N
ationa
l Park (discrete reaches)
Data synthesis an
d map produ
ction
XMon
itoring site selectio
nFish Monitoring
Field reconn
aissan
ce3
Surveys of fish spe
cies com
positio
n an
d ha
bitat u
se3
Data an
alysis
Avian Monitoring
Field reconn
aissan
cePo
int cou
nt surveys
Area searches
Data an
alysis
Macroinvertebrate Monitoring
Field reconn
aissan
ceAqu
atic bioassessment
Aqu
atic in
vertebrate in
ventory
Exotics survey
Data an
alysis
Annual Reports
Mon
thly In
voicing / Q
uarterly Progress Re
ports
Project A
ssessm
ent a
nd Evaluation Plan
4X
Repo
rt w
ritin
gRe
port re
view
XX
XCLOSE OF PROJECT
2008
Task
Com
pone
nt
2006
2007
2005
The
Mer
ced
Rive
r Al
lianc
e Pr
ojec
t Fin
al R
epor
t Vo
lum
e II
: Bi
olog
ical
Mon
itorin
g an
d As
sess
men
t
Still
wat
er S
cien
ces
5‐3
Key: Interm
ittent w
ork du
e to SWRCB gran
t delays
X Draft de
liverable due
X Fina
l deliverable due
1 Th
e original grant agreement sched
uled th
e draft a
nd fina
l BMAP for S
eptember 2
005 an
d Nov
ember 2
005 respectiv
ely; how
ever, the project sched
ule refle
cts a
djusted
due da
tes.
2 Re
vised draft B
MAP was sub
mitted in tw
o pa
rts. First sub
mittal in
clud
ed all review
er com
ments excep
t BMI study plan. Secon
d subm
ittal in
clud
ed BMI study plan.
3 Origina
lly sched
uled fish field reconn
aissan
ce and sam
pling du
ring spring 2006 w
as postpon
ed due to extremely high flow
s.
4 Th
e original grant agreement sched
uled th
e PA
EP fo
r Aug
ust 2
005; how
ever, the project sched
ule refle
cts the ad
justed due date.
The Merced River Alliance Project Final Report Volume II: Biological Monitoring and Assessment
Stillwater Sciences
5‐4
5.2.1 Coarse‐scale Aquatic Habitat Mapping This task was designed to provide information regarding stream habitat along the mainstem Merced River (approximately 123 river miles) in order to support the final selection of representative fish and benthic macroinvertebrate (BMI) monitoring sites for the Merced Alliance biological studies. Aquatic habitat mapping was intended to provide a continuous view of the Merced riverscape through systematic sampling of coarse‐scale aquatic habitats at low‐flow conditions. The coarse‐scale habitats were determined remotely by use of aerial videography and air photos. The habitat “types” were defined using a simplified version of standard habitat classifications (i.e., riffles, runs, pools, backwaters) commonly described in the literature (e.g., McCain et al. 1990). Figure 5‐2 indicates the relative scale of habitat classifications applied to the Merced River basin, following the basin, segment, and reach scale conventions of Fausch et al. (2002). Mapping was used to document the longitudinal distribution and relative proportions of habitat types throughout the river, and to identify physical features such as channel confinement, dominant bed substrate size, and barriers to fish migration. However, the spatial scale of this effort was not intended to provide sufficient resolution for comparative assessment of the effects of future restoration activities on aquatic habitat. Rather, the data were planned for use at the segment scale to reveal larger patterns in habitat distribution to aid in understanding of factors that contribute to fish population characteristics (Fausch et al. 2002, Ward 1998). Finer‐scale habitat delineation, including sub‐classifications of habitat type and measurement of microhabitat parameters, was carried out as part of the continuing individual fish and BMI surveys (Sections 5.2.2 and 5.2.4). During the biological surveys, habitat delineation was carried out at each monitoring site using on‐the‐ground observations. Since the assessments were seasonal, these site‐specific habitat delineations took place at multiple flows. Microhabitat parameters (focal velocity, focal depth, distance to cover, etc.) were measured only when physical characteristics at the scale of the individual fish or group of fish were considered to be important criteria determining habitat use (e.g., for juvenile salmonids). 5.2.1.1 Objectives The objectives of the aquatic habitat mapping task were to: 1) describe the distribution, frequency, and/or length of coarse‐scale habitat types (e.g., pool, riffle, run) of the Merced River; 2) characterize various coarse‐scale habitat parameters (e.g., unit dimensions, dominant substrate type, etc.); 3) supplement existing reach‐scale temperature information; and 4) record coarse‐scale stream habitat features such as potential migration barriers to fish, large woody debris (LWD), and locations of tributaries or other important features. These stated objectives supported the selection
The Merced River Alliance Project Final Report Volume II: Biological Monitoring and Assessment
Stillwater Sciences
5‐5
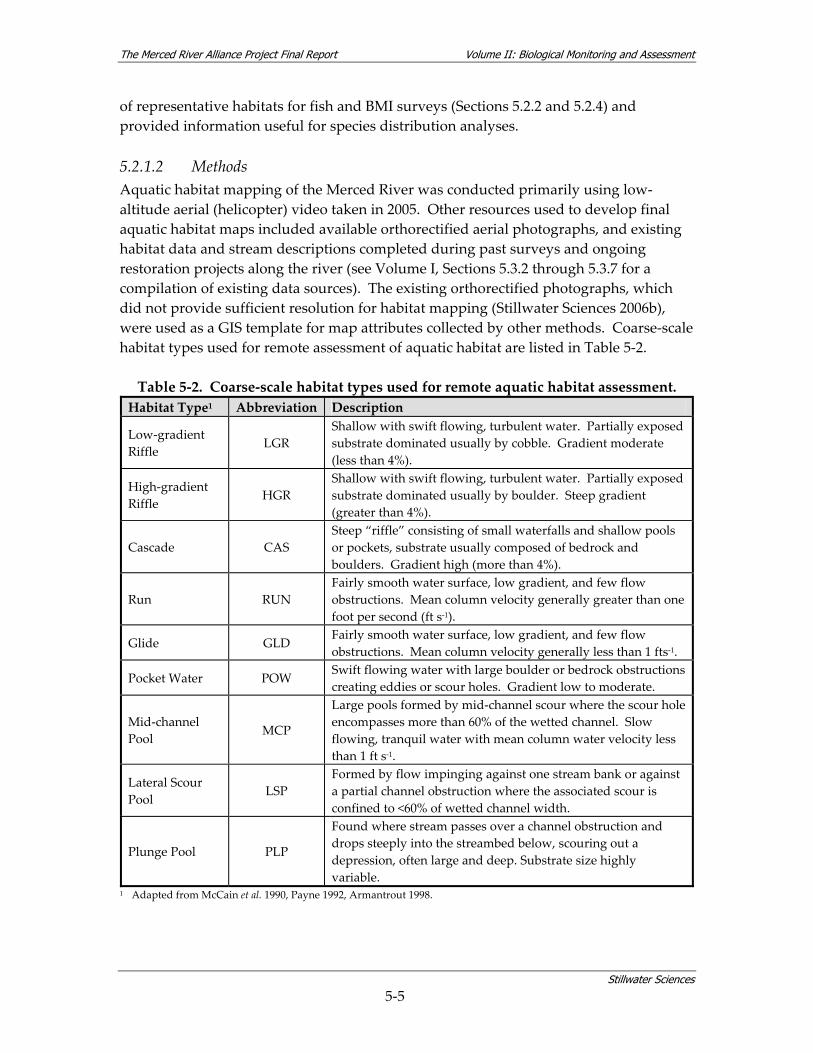
of representative habitats for fish and BMI surveys (Sections 5.2.2 and 5.2.4) and provided information useful for species distribution analyses. 5.2.1.2 Methods Aquatic habitat mapping of the Merced River was conducted primarily using low‐altitude aerial (helicopter) video taken in 2005. Other resources used to develop final aquatic habitat maps included available orthorectified aerial photographs, and existing habitat data and stream descriptions completed during past surveys and ongoing restoration projects along the river (see Volume I, Sections 5.3.2 through 5.3.7 for a compilation of existing data sources). The existing orthorectified photographs, which did not provide sufficient resolution for habitat mapping (Stillwater Sciences 2006b), were used as a GIS template for map attributes collected by other methods. Coarse‐scale habitat types used for remote assessment of aquatic habitat are listed in Table 5‐2. Table 5‐2. Coarse‐scale habitat types used for remote aquatic habitat assessment. Habitat Type1 Abbreviation Description
Low‐gradient Riffle LGR
Shallow with swift flowing, turbulent water. Partially exposed substrate dominated usually by cobble. Gradient moderate (less than 4%).
High‐gradient Riffle
HGR Shallow with swift flowing, turbulent water. Partially exposed substrate dominated usually by boulder. Steep gradient (greater than 4%).
Cascade CAS Steep “riffle” consisting of small waterfalls and shallow pools or pockets, substrate usually composed of bedrock and boulders. Gradient high (more than 4%).
Run RUN Fairly smooth water surface, low gradient, and few flow obstructions. Mean column velocity generally greater than one foot per second (ft s‐1).
Glide GLD Fairly smooth water surface, low gradient, and few flow obstructions. Mean column velocity generally less than 1 fts‐1.
Pocket Water POW Swift flowing water with large boulder or bedrock obstructions creating eddies or scour holes. Gradient low to moderate.
Mid‐channel Pool MCP
Large pools formed by mid‐channel scour where the scour hole encompasses more than 60% of the wetted channel. Slow flowing, tranquil water with mean column water velocity less than 1 ft s‐1.
Lateral Scour Pool
LSP Formed by flow impinging against one stream bank or against a partial channel obstruction where the associated scour is confined to <60% of wetted channel width.
Plunge Pool PLP
Found where stream passes over a channel obstruction and drops steeply into the streambed below, scouring out a depression, often large and deep. Substrate size highly variable.
1 Adapted from McCain et al. 1990, Payne 1992, Armantrout 1998.
The Merced River Alliance Project Final Report Volume II: Biological Monitoring and Assessment
Stillwater Sciences
5‐6
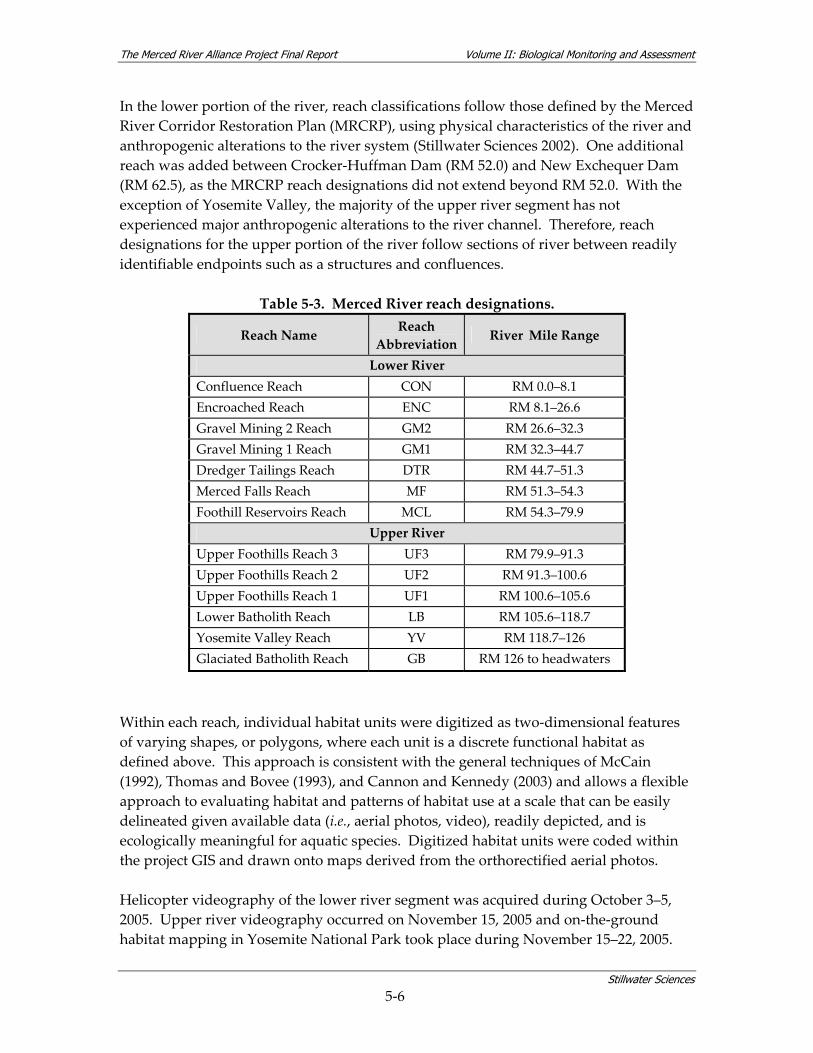
In the lower portion of the river, reach classifications follow those defined by the Merced River Corridor Restoration Plan (MRCRP), using physical characteristics of the river and anthropogenic alterations to the river system (Stillwater Sciences 2002). One additional reach was added between Crocker‐Huffman Dam (RM 52.0) and New Exchequer Dam (RM 62.5), as the MRCRP reach designations did not extend beyond RM 52.0. With the exception of Yosemite Valley, the majority of the upper river segment has not experienced major anthropogenic alterations to the river channel. Therefore, reach designations for the upper portion of the river follow sections of river between readily identifiable endpoints such as a structures and confluences.
Table 5‐3. Merced River reach designations.
Reach Name Reach Abbreviation
River Mile Range
Lower River Confluence Reach CON RM 0.0–8.1 Encroached Reach ENC RM 8.1–26.6 Gravel Mining 2 Reach GM2 RM 26.6–32.3 Gravel Mining 1 Reach GM1 RM 32.3–44.7 Dredger Tailings Reach DTR RM 44.7–51.3 Merced Falls Reach MF RM 51.3–54.3 Foothill Reservoirs Reach MCL RM 54.3–79.9
Upper River Upper Foothills Reach 3 UF3 RM 79.9–91.3 Upper Foothills Reach 2 UF2 RM 91.3–100.6 Upper Foothills Reach 1 UF1 RM 100.6–105.6 Lower Batholith Reach LB RM 105.6–118.7 Yosemite Valley Reach YV RM 118.7–126 Glaciated Batholith Reach GB RM 126 to headwaters
Within each reach, individual habitat units were digitized as two‐dimensional features of varying shapes, or polygons, where each unit is a discrete functional habitat as defined above. This approach is consistent with the general techniques of McCain (1992), Thomas and Bovee (1993), and Cannon and Kennedy (2003) and allows a flexible approach to evaluating habitat and patterns of habitat use at a scale that can be easily delineated given available data (i.e., aerial photos, video), readily depicted, and is ecologically meaningful for aquatic species. Digitized habitat units were coded within the project GIS and drawn onto maps derived from the orthorectified aerial photos. Helicopter videography of the lower river segment was acquired during October 3–5, 2005. Upper river videography occurred on November 15, 2005 and on‐the‐ground habitat mapping in Yosemite National Park took place during November 15–22, 2005.
The Merced River Alliance Project Final Report Volume II: Biological Monitoring and Assessment
Stillwater Sciences
5‐7
Remote and on‐the‐ground aquatic habitat mapping was conducted under minimum flow conditions, in order to: 1) facilitate evaluation of low‐flow fish migration barriers, 2) maximize access and safety during fieldwork, and 3) evaluate habitat composition during the seasonal period of greatest habitat heterogeneity. In coordination with Merced ID, flows in the lower Merced River were reduced to approximate normal summer baseflow conditions (2.8–5.6 m3s‐1 [100–200 cfs]) during October 3–5, 2005 (T. Selb, pers. comm. 2005). The flow reduction was carried out to support Merced Phase IV geomorphic investigations (Stillwater Sciences 2006b) and Merced Alliance aquatic habitat mapping efforts. Without the flow reduction, flows in the lower Merced River were projected to exceed 14 m3s‐1 (500 cfs) through October 2005 (T. Selb, pers. comm. 2005). As the upper reach is unregulated, low‐altitude videography was conducted in mid‐November 2005, when flows had decreased as much as possible. The continuous study area included the Merced River from the San Joaquin River Confluence (RM 0) to New Exchequer Dam (RM 62.5) (lower Merced River), and the Merced River upstream of New Exchequer Dam to El Portal (RM 105.5) near the entrance to Yosemite National Park (upper Merced River). Three additional discrete reaches of the upper Merced River within Yosemite were also included in the study area, where safety and permit constraints allowed for on‐the‐ground mapping activities (see Section 5.2.1.2). As shown in Table 5‐4, multiple parameters and features were recorded during the remote aquatic habitat mapping of the upper and lower Merced River. The flow conditions at which habitat mapping occurred were determined from stream gage data on the date the video was taken.
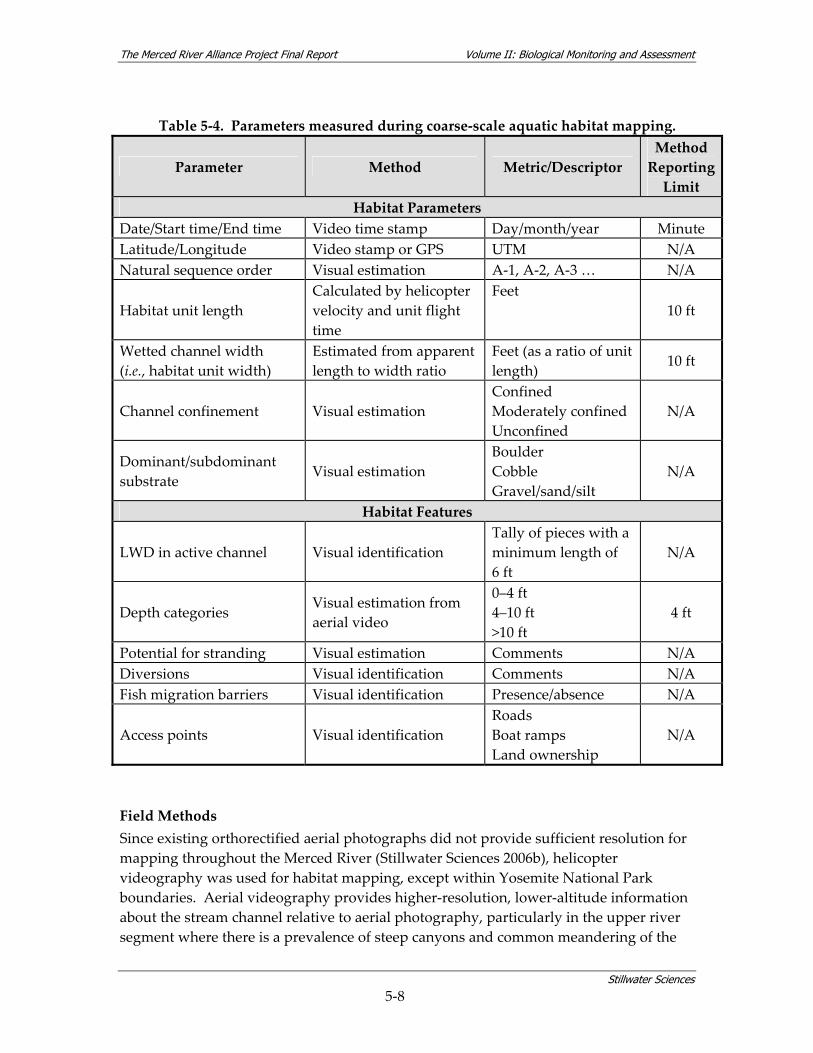
The Merced River Alliance Project Final Report Volume II: Biological Monitoring and Assessment
Stillwater Sciences
5‐8
Table 5‐4. Parameters measured during coarse‐scale aquatic habitat mapping.
Parameter Method Metric/Descriptor Method Reporting Limit
Habitat Parameters Date/Start time/End time Video time stamp Day/month/year Minute Latitude/Longitude Video stamp or GPS UTM N/A Natural sequence order Visual estimation A‐1, A‐2, A‐3 … N/A
Habitat unit length Calculated by helicopter velocity and unit flight time
Feet 10 ft
Wetted channel width (i.e., habitat unit width)
Estimated from apparent length to width ratio
Feet (as a ratio of unit length)
10 ft
Channel confinement Visual estimation Confined Moderately confined Unconfined
N/A
Dominant/subdominant substrate
Visual estimation Boulder Cobble Gravel/sand/silt
N/A
Habitat Features
LWD in active channel Visual identification Tally of pieces with a minimum length of 6 ft
N/A
Depth categories Visual estimation from aerial video
0–4 ft 4–10 ft >10 ft
4 ft
Potential for stranding Visual estimation Comments N/A Diversions Visual identification Comments N/A Fish migration barriers Visual identification Presence/absence N/A
Access points Visual identification Roads Boat ramps Land ownership
N/A
Field Methods Since existing orthorectified aerial photographs did not provide sufficient resolution for mapping throughout the Merced River (Stillwater Sciences 2006b), helicopter videography was used for habitat mapping, except within Yosemite National Park boundaries. Aerial videography provides higher‐resolution, lower‐altitude information about the stream channel relative to aerial photography, particularly in the upper river segment where there is a prevalence of steep canyons and common meandering of the

The Merced River Alliance Project Final Report Volume II: Biological Monitoring and Assessment
Stillwater Sciences
5‐9
channel. Aerial video was flown at fall low‐flow conditions throughout the upper and lower river. The helicopter crew consisted of a pilot, an experienced videographer, and a narrator. The narrator was generally familiar with the Merced River corridor and included landmark descriptions (e.g., roads, bridges, in‐channel features), during the video. The video also included a time‐stamp and GPS coordinates to allow habitat locations to be accurately referenced during mapping activities.
Aerial videography was not possible in Yosemite National Park because park regulations require that helicopter or airplane flights be at least 2,000 ft* (~600 m) above the ground at all times (S. Thompson, pers. comm. 2005) Typical videography flight elevations occur at 150–300 ft above the ground. Therefore, on‐the‐ground mapping was used for habitat delineation in discrete reaches of the Merced River within Park boundaries. Mapped reaches were located upstream, within, and downstream of Yosemite Valley. The most upstream reach was located in Little Yosemite Valley, above 6000 ft (1,800 m) or the elevation at which fish were naturally precluded from the river following glaciation (J. Meyer, pers. comm. 2005). Approximately one mile was mapped in Little Yosemite Valley, with the final mapped stream length dependent on mapping time plus travel time to and from the study reach. Within the Yosemite Valley, approximately six river miles were mapped in order to re‐occupy locations that were mapped in 1991 by USFS (Kisanuki and Shaw 1992). Approximately 1.6 km (1.0 mi) was mapped between Yosemite Valley and the Park boundary in El Portal, with the final location based on accessibility within the canyon alongside Highway 140. On‐the‐ground mapping was conducted by a team of two biologists. Starting points, ending points, and landmarks were referenced using a handheld GPS receiver, which enabled the habitat mapping data to be georeferenced and added to the project GIS. Notable features not necessarily identified using aerial photography or videography, such as spawning activity (e.g., redds), were noted and their locations recorded on a topographic map or using GPS and transferred to the digital base maps. Field verification of mapped habitat units occurred during individual fish surveys. Analytical Methods Preliminary data analysis occurred within two months following remote and field investigations, so that the results could be made available to other Project tasks. Existing aquatic habitat in the Merced River was delineated using ArcView GIS software and digitized onto topographic quads (1:24,000). Frequency distributions of habitat types were summarized by reach. Analysis at the basin and segment scale is intended to reveal larger patterns in habitat distribution that suggest mechanisms of fish population regulation (Fausch et al. 2002, Ward 1998).
* The regulation is given in feet by Yosemite National Park.
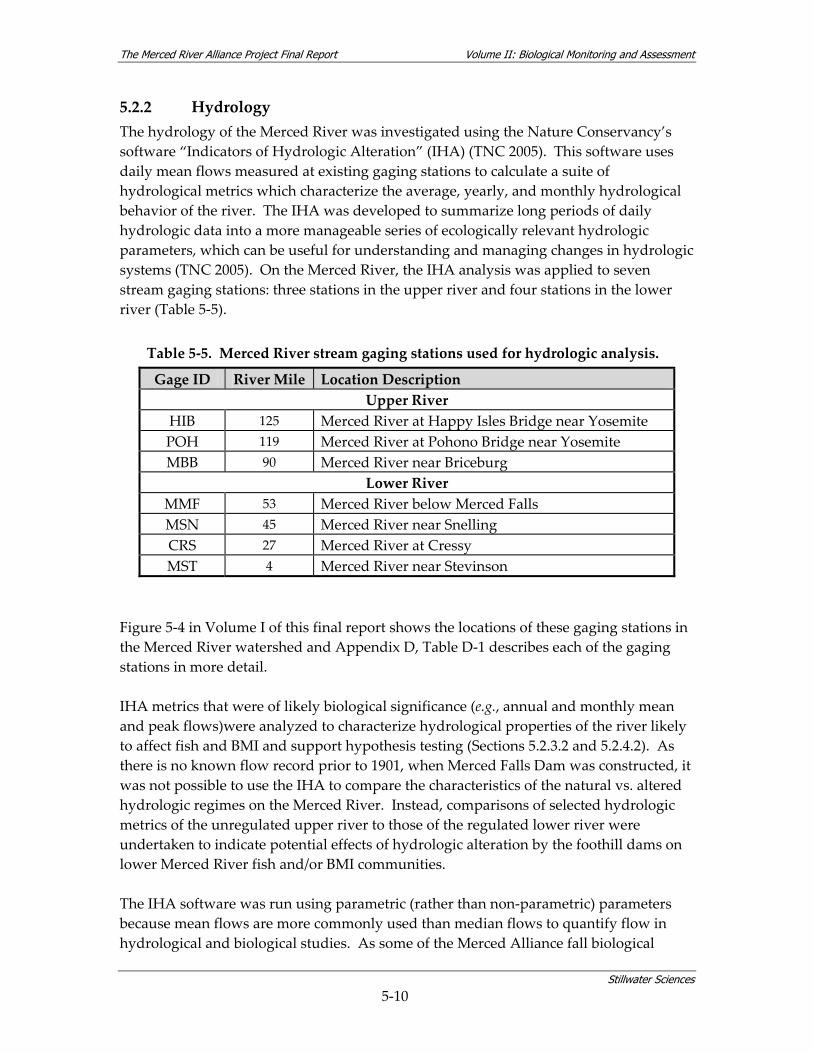
The Merced River Alliance Project Final Report Volume II: Biological Monitoring and Assessment
Stillwater Sciences
5‐10
5.2.2 Hydrology The hydrology of the Merced River was investigated using the Nature Conservancy’s software “Indicators of Hydrologic Alteration” (IHA) (TNC 2005). This software uses daily mean flows measured at existing gaging stations to calculate a suite of hydrological metrics which characterize the average, yearly, and monthly hydrological behavior of the river. The IHA was developed to summarize long periods of daily hydrologic data into a more manageable series of ecologically relevant hydrologic parameters, which can be useful for understanding and managing changes in hydrologic systems (TNC 2005). On the Merced River, the IHA analysis was applied to seven stream gaging stations: three stations in the upper river and four stations in the lower river (Table 5‐5).
Table 5‐5. Merced River stream gaging stations used for hydrologic analysis.
Gage ID River Mile Location Description Upper River
HIB 125 Merced River at Happy Isles Bridge near Yosemite POH 119 Merced River at Pohono Bridge near Yosemite MBB 90 Merced River near Briceburg
Lower River MMF 53 Merced River below Merced Falls MSN 45 Merced River near Snelling CRS 27 Merced River at Cressy MST 4 Merced River near Stevinson
Figure 5‐4 in Volume I of this final report shows the locations of these gaging stations in the Merced River watershed and Appendix D, Table D‐1 describes each of the gaging stations in more detail. IHA metrics that were of likely biological significance (e.g., annual and monthly mean and peak flows)were analyzed to characterize hydrological properties of the river likely to affect fish and BMI and support hypothesis testing (Sections 5.2.3.2 and 5.2.4.2). As there is no known flow record prior to 1901, when Merced Falls Dam was constructed, it was not possible to use the IHA to compare the characteristics of the natural vs. altered hydrologic regimes on the Merced River. Instead, comparisons of selected hydrologic metrics of the unregulated upper river to those of the regulated lower river were undertaken to indicate potential effects of hydrologic alteration by the foothill dams on lower Merced River fish and/or BMI communities. The IHA software was run using parametric (rather than non‐parametric) parameters because mean flows are more commonly used than median flows to quantify flow in hydrological and biological studies. As some of the Merced Alliance fall biological
The Merced River Alliance Project Final Report Volume II: Biological Monitoring and Assessment
Stillwater Sciences
5‐11
surveys were conducted during the month of October, the water year for the purposes of the IHA modeling was defined as November 1st through October 31st. In this way, fall biological survey data from a given calendar year were also included within the same IHA water year.
5.2.3 Fish Study The baseline fish population monitoring surveys were designed to complement information available from current and ongoing studies (Section 5.3.3 of Volume I) and to ensure compatibility with ongoing data collection efforts to the maximum extent possible. Observations of species composition relative to habitat, made during the Merced Alliance fish surveys, in combination with available pre‐existing data, were intended to provide information to support future restoration activities by associating fish habitat type use and timing within the Merced River. 5.2.3.1 Objectives The objectives of the river‐wide baseline fish monitoring task were to: 1) document baseline fish community species composition (native and introduced) in the Merced River; 2) identify spatial patterns in fish species composition and distribution at multiple habitat scales (e.g., segment, reach, habitat unit, microhabitat) and during seasonal shifts (e.g., late winter/early spring, late spring/early summer, late summer/early fall); 3) document fish use of specific habitat types in order to better link habitat characteristics to species‐specific life history requirements; and, 4) address specific fish hypotheses, as detailed in the next section. 5.2.3.2 Hypotheses The fish hypotheses focus on juvenile Central Valley fall‐run Chinook salmon and resident fish species in the lower Merced River, and trout species in the upper Merced River. They were developed as declarative statements of important assumptions about these species that subsequently were evaluated during the study and either verified or modified. Hypotheses developed for resident fish in the lower river incorporate several ideas detailed in CALFED’s Comprehensive Monitoring, Assessment, and Research Program (CMARP) regarding the distribution and relative abundance of resident fish and introduced species in the Merced River (Brown et al. 2003). As such, they are based on the conceptual model described in CMARP and discussed in Section 6.1.1.1 of the BMAP (Stillwater Sciences 2006a, Figure 9). The upper river hypotheses incorporate recommendations made by Kisanuki and Shaw (1992) following their habitat mapping studies in Yosemite National Park. As discussed in Section 4, addressing the following hypotheses was a secondary goal of the Merced Alliance biological assessment monitoring, with collection of contemporary baseline data for fish, avian, and macroinvertebrate species as the primary goal.
The Merced River Alliance Project Final Report Volume II: Biological Monitoring and Assessment
Stillwater Sciences
5‐12
Fall‐run Chinook salmon (Oncorhynchus tshawytscha) hypotheses:
1. In the lower river, Chinook fry (< 50 mm [< 2 in] FL) are found primarily in channel margin and backwater habitat, with relative density determined by microhabitat variables (e.g., water velocity, water depth, cover).
2. The relative density of Chinook fry is different between reaches where spawning habitat restoration has occurred (Appendix A, Table A‐1) and reaches where no restoration has occurred.
3. In areas with suitable physical habitat (e.g., water velocity, water depth, cover), temperature, and water quality (e.g., dissolved oxygen) for juvenile Chinook fry (> 50 mm [> 2 in] FL), the relative density of fry will be lower in sites with piscivorous fish (e.g., bass) compared to sites where predators are absent. In other words, density of Chinook fry will be inversely related to predator density in co‐occupied or adjacent habitats.
4. Variable seasonal flow magnitude and duration will determine the longitudinal distribution pattern of Chinook fry in the lower river. At low spring flows (< 28 m3s‐1 [< 1,000 cfs]), Chinook fry will be clustered in the upper reaches of the lower river, with very few fry rearing near the SJR confluence. At higher spring flows (> 28 m3s‐1 [> 1,000 cfs]), fry will be distributed throughout the lower river, with little or no clustering in upstream areas (i.e., near spawning locations).
Steelhead (Oncorhynchus mykiss) hypothesis:
5. In the lower river, the distribution of steelhead will be determined largely by water temperature, with deleterious effects on each life stage due to both short‐term near‐lethal temperatures and chronic elevated sub‐lethal temperatures that impose significant bioenergetic stress on the fish.
Lower river fish community hypotheses (except salmonids):
6. The effect of 2005 high flows on the Merced River will be to extend the downstream limit of the native Foothill Community (Sacramento pikeminnow, tule perch, Sacramento sucker, hardhead, riffle sculpin, as defined in Brown et al. [2003]), and to limit the upstream extent of the Large Tributary Community (largemouth bass, bluegill, redear sunfish, white catfish, channel catfish, as defined in Brown et al. [2003]), as compared with earlier surveys by Brown in 1993–1995, which were conducted following an extended 6‐year drought (Brown 2000).
7. Prickly sculpin and smallmouth bass distribution in the lower Merced River during 2006–2007 will be similar to that of earlier surveys by Brown in 1993–1995 (Brown 2000), as flow differences between these years are not expected to affect the longitudinal distribution of these species.
The Merced River Alliance Project Final Report Volume II: Biological Monitoring and Assessment
Stillwater Sciences
5‐13
Upper river fish community hypotheses:
8. In the upper Merced River, thermal stratification in large, deep pools provides temperature refugia for trout species. Therefore the longitudinal distribution of trout species will be correlated with pool distribution in reaches where water temperature might otherwise be too warm.
9. Rainbow trout abundance will be greatest in upper Merced River mainstem reaches that have been restored for spawning habitat (Appendix A, Table A‐1) and will exceed pre‐restoration observations made by Kisanuki and Shaw (1992).
5.2.3.3 Methods The fish sampling design is summarized in Table 5‐6 and described in more detail in the remainder of this section. In general, the study elements focus on fish community composition and distribution in the upper and lower segments of the Merced River (Figure 5‐3), as well as habitat associations at multiple spatial scales. While the lower Merced River fish surveys were designed to be conducted three times per year during 2006 and 2007, flow‐related safety concerns and equipment limitations posed by extremely high flows (> 140 m3 s‐1 [5,000 cfs]) and turbidity during spring 2006 resulted in only summer and fall season surveys in the first year of the study. An additional spring sampling event was undertaken during March 2008 as a substitute for the originally planned spring 2006 event. Overall, fish survey timing was based on species biology and life history timing in order to collect data at ecologically meaningful time intervals. In the lower river segment, summertime surveys (July–August) in the lower river were timed to follow salmonid outmigration and also focused on introduced and native resident fish (e.g., bass, sunfish, catfish), while fall surveys (October) corresponded to the late‐summer rearing period for most resident species and overlapped with the fall‐run Chinook spawning period. Although concurrent with ongoing CDFG surveys, Merced Alliance fish surveys did not duplicate CDFG redd surveys or carcass counts (Volume I, Section 5.3.3), nor did they interfere with spawning activities. Merced Alliance spring surveys in the lower river were conducted during late spring (March) to coincide with emergence of fall‐run Chinook salmon fry and the primary period of juvenile rearing and outmigration. They were also intended to coincide with the spring spawning period of many of the native resident fish (e.g., lamprey, Sacramento splittail, Sacramento sucker). Sampling in the upper river segment was designed to occur once annually during the late summer or fall, when flows are lowest and all ages of rainbow trout, including young‐of‐the‐year, and brown trout were expected to be observed.
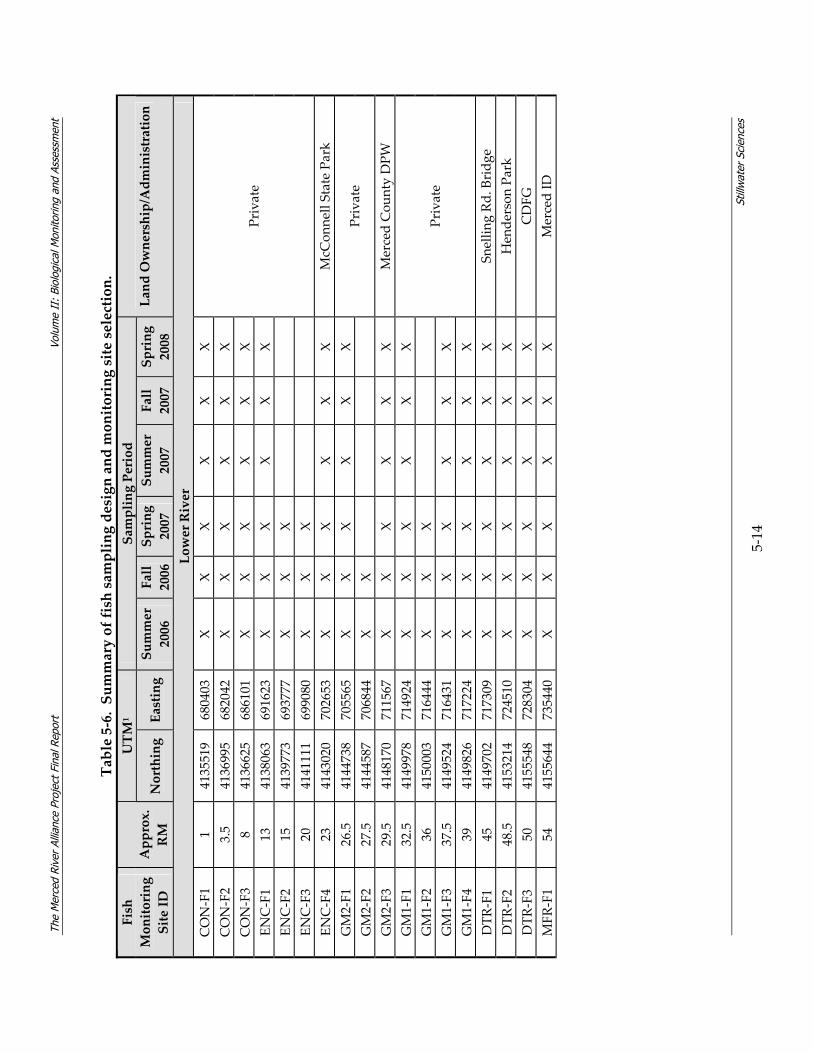
The
Mer
ced
Rive
r Al
lianc
e Pr
ojec
t Fin
al R
epor
t Vo
lum
e II
: Bi
olog
ical
Mon
itorin
g an
d As
sess
men
t
Still
wat
er S
cien
ces
5‐14
Table 5‐6. Summary of fish sampling design and monitoring site selection.
UTM
1Sampling Period
Fish
Monitoring
Site ID
Approx.
RM
Northing
Easting
Summer
2006
Fall
2006 Spring
2007
Summer
2007
Fall
2007 Spring
2008
Land Ownership/Administration
Lower River
CON‐F1
1 4135519
680403
X X
X X
X X
CON‐F2
3.5
4136995
682042
X X
X X
X X
CON‐F3
8 4136625
686101
X X
X X
X X
ENC‐F1
13
4138063
691623
X X
X X
X X
ENC‐F2
15
4139773
693777
X X
X
ENC‐F3
20
4141111
699080
X X
X
Private
ENC‐F4
23
4143020
702653
X X
X X
X X
McC
onnell State Pa
rk
GM2‐F1
26.5
4144738
705565
X X
X X
X X
GM2‐F2
27.5
4144587
706844
X X
Private
GM2‐F3
29.5
4148170
711567
X X
X X
X X
Merced Cou
nty DPW
GM1‐F1
32.5
4149978
714924
X X
X X
X X
GM1‐F2
36
4150003
716444
X X
X
GM1‐F3
37.5
4149524
716431
X X
X X
X X
GM1‐F4
39
4149826
717224
X X
X X
X X
Private
DTR‐F1
45
4149702
717309
X X
X X
X X
Snellin
g Rd
. Bridg
e DTR‐F2
48.5
4153214
724510
X X
X X
X X
Hende
rson Park
DTR‐F3
50
4155548
728304
X X
X X
X X
CDFG
MFR‐F1
54
4155644
735440
X X
X X
X X
Merced ID
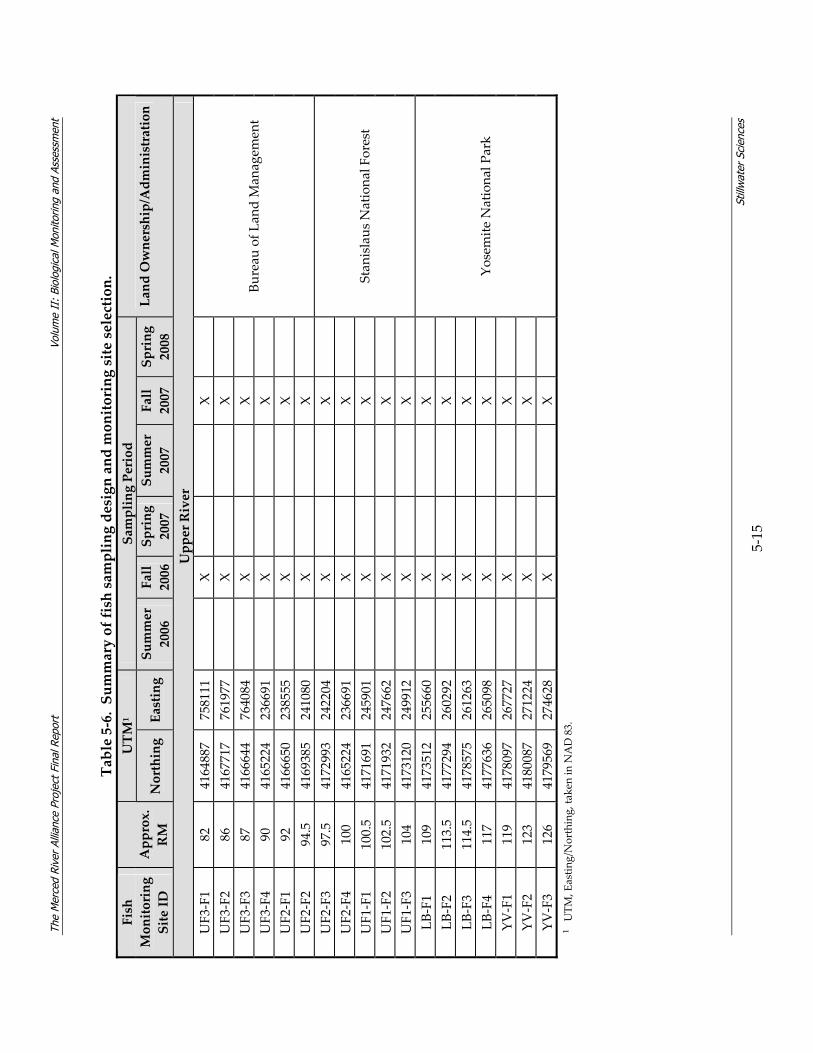
The
Mer
ced
Rive
r Al
lianc
e Pr
ojec
t Fin
al R
epor
t Vo
lum
e II
: Bi
olog
ical
Mon
itorin
g an
d As
sess
men
t
Still
wat
er S
cien
ces
5‐15
Table 5‐6. Summary of fish sampling design and monitoring site selection.
UTM
1Sampling Period
Fish
Monitoring
Site ID
Approx.
RM
Northing
Easting
Summer
2006
Fall
2006 Spring
2007
Summer
2007
Fall
2007 Spring
2008
Land Ownership/Administration
Upper River
UF3‐F1
82
4164887
758111
X
X
UF3‐F2
86
4167717
761977
X
X
UF3‐F3
87
4166644
764084
X
X
UF3‐F4
90
4165224
236691
X
X
UF2‐F1
92
4166650
238555
X
X
UF2‐F2
94.5
4169385
241080
X
X
Bureau of L
and Man
agem
ent
UF2‐F3
97.5
4172993
242204
X
X
UF2‐F4
100
4165224
236691
X
X
UF1‐F1
100.5
4171691
245901
X
X
UF1‐F2
102.5
4171932
247662
X
X
UF1‐F3
104
4173120
249912
X
X
Stan
islaus N
ationa
l Forest
LB‐F1
109
4173512
255660
X
X
LB‐F2
113.5
4177294
260292
X
X
LB‐F3
114.5
4178575
261263
X
X
LB‐F4
117
4177636
265098
X
X
YV‐F1
119
4178097
267727
X
X
YV‐F2
123
4180087
271224
X
X
YV‐F3
126
4179569
274628
X
X
Yosemite N
ationa
l Park
1 UTM
, Eastin
g/Northing, ta
ken in N
AD 83.

The Merced River Alliance Project Final Report Volume II: Biological Monitoring and Assessment
Stillwater Sciences
5‐16
Fish monitoring sites were selected throughout the Merced River watershed to meet the following criteria:
1. To represent the range of coarse‐scale aquatic habitat types identified during the mapping efforts described in Section 5.2.1;
2. To include likely juvenile salmonid rearing habitat (e.g., stream margins under overhanging vegetation, backwaters) in the lower Merced River;
3. To be accessible; and
4. To take advantage of existing fish and water quality monitoring data, fluvial geomorphological characterization of stream channel, and riparian habitat monitoring, where possible.
The majority of land in the lower Merced River corridor is privately owned and property access permission is not often granted when special‐status species may be involved. For this reason, publicly owned sites were chosen for sampling in the lower Merced River corridor wherever possible. Privately owned sites were included wherever possible as well, with their ultimate availability for sampling dependent on landowner access agreements. Site selection reconnaissance occurred prior to initiation of field work to verify the presence of desired aquatic habitat types and conditions and to determine the most appropriate and efficient sampling approach. Reconnaissance included limited testing of field sampling methods and equipment to ensure compatibility with local conditions. All access routes were designated in accordance with the agreements to access private property. Photos and GPS locations were taken of each site, and site locations subsequently were identified on GIS maps corresponding to mapped aquatic habitat units. Accuracy, precision, recovery, and completeness requirements for field measurements were SWAMP compatible as discussed in Section 9.1 of the BMAP (Stillwater Sciences 2006a). Field Methods Fish surveys were conducted using direct observation (snorkel surveys), seining, backpack electrofishing, and boat electrofishing. The methods were consistent with the targeted species and life stage, location, seasonal conditions, and regulatory restrictions. Monitoring sites comprised one or more habitat units defined during the aquatic habitat mapping effort (Section 5.2.1). The number of habitat units chosen at a given monitoring site varied directly with the diversity of habitat at the site. In general, sites consisted of one to three habitat units considered representative of local channel conditions, with the number of units surveyed dependent on the amount of time available. The latter was largely determined by the overall length and complexity of the habitat units present. Sampled habitat units were generally contiguous, and sampling occurred from mid‐
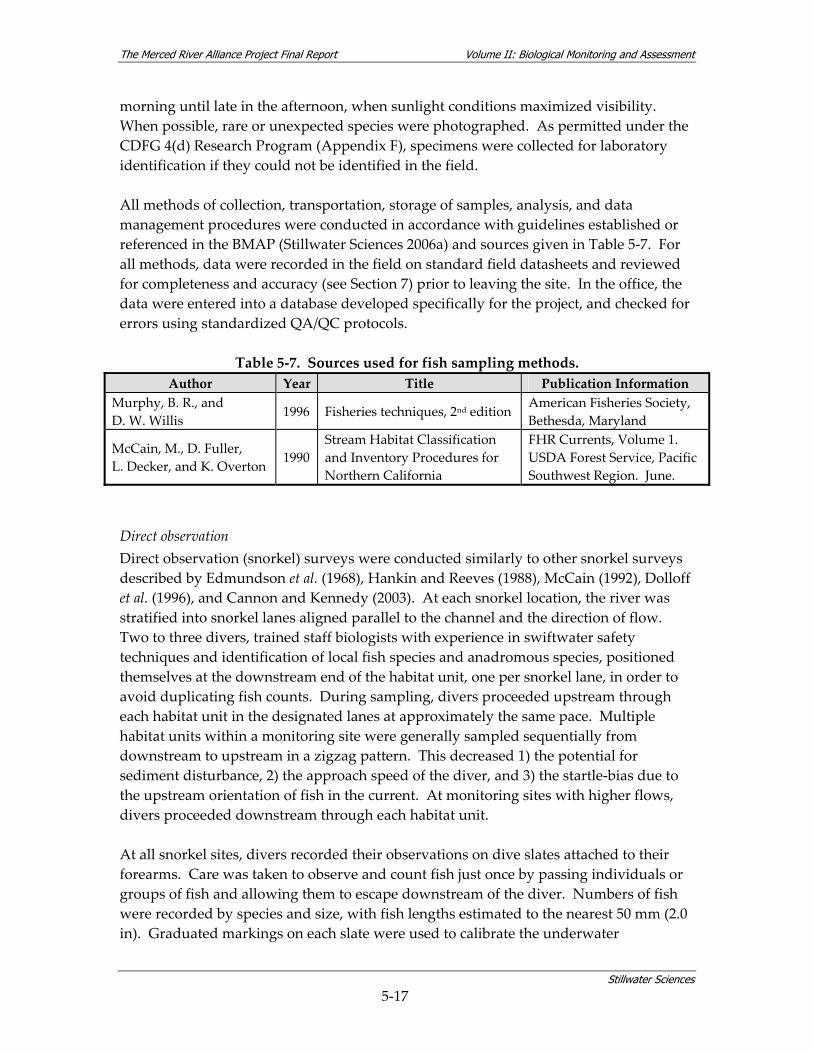
The Merced River Alliance Project Final Report Volume II: Biological Monitoring and Assessment
Stillwater Sciences
5‐17
morning until late in the afternoon, when sunlight conditions maximized visibility. When possible, rare or unexpected species were photographed. As permitted under the CDFG 4(d) Research Program (Appendix F), specimens were collected for laboratory identification if they could not be identified in the field. All methods of collection, transportation, storage of samples, analysis, and data management procedures were conducted in accordance with guidelines established or referenced in the BMAP (Stillwater Sciences 2006a) and sources given in Table 5‐7. For all methods, data were recorded in the field on standard field datasheets and reviewed for completeness and accuracy (see Section 7) prior to leaving the site. In the office, the data were entered into a database developed specifically for the project, and checked for errors using standardized QA/QC protocols.
Table 5‐7. Sources used for fish sampling methods. Author Year Title Publication Information
Murphy, B. R., and D. W. Willis
1996 Fisheries techniques, 2nd edition American Fisheries Society, Bethesda, Maryland
McCain, M., D. Fuller, L. Decker, and K. Overton
1990 Stream Habitat Classification and Inventory Procedures for Northern California
FHR Currents, Volume 1. USDA Forest Service, Pacific Southwest Region. June.
Direct observation Direct observation (snorkel) surveys were conducted similarly to other snorkel surveys described by Edmundson et al. (1968), Hankin and Reeves (1988), McCain (1992), Dolloff et al. (1996), and Cannon and Kennedy (2003). At each snorkel location, the river was stratified into snorkel lanes aligned parallel to the channel and the direction of flow. Two to three divers, trained staff biologists with experience in swiftwater safety techniques and identification of local fish species and anadromous species, positioned themselves at the downstream end of the habitat unit, one per snorkel lane, in order to avoid duplicating fish counts. During sampling, divers proceeded upstream through each habitat unit in the designated lanes at approximately the same pace. Multiple habitat units within a monitoring site were generally sampled sequentially from downstream to upstream in a zigzag pattern. This decreased 1) the potential for sediment disturbance, 2) the approach speed of the diver, and 3) the startle‐bias due to the upstream orientation of fish in the current. At monitoring sites with higher flows, divers proceeded downstream through each habitat unit. At all snorkel sites, divers recorded their observations on dive slates attached to their forearms. Care was taken to observe and count fish just once by passing individuals or groups of fish and allowing them to escape downstream of the diver. Numbers of fish were recorded by species and size, with fish lengths estimated to the nearest 50 mm (2.0 in). Graduated markings on each slate were used to calibrate the underwater
The Merced River Alliance Project Final Report Volume II: Biological Monitoring and Assessment
Stillwater Sciences
5‐18
observations. Start and end times were noted and all data recorded on the dive slates were transcribed to a datasheet upon completion of the snorkel survey. Divers also recorded visibility and weather conditions during each snorkel survey. Seining Seining surveys were used primarily to document smaller fish. Seining was conducted by crews of two to three staff biologists using a beach seine net to sample fish in shallow channel margins and on inundated floodplains possessing adequate space for seine haul‐out (e.g., bar). During the 2007and 2008 spring sampling, seining was used to reduce the need for backpack electrofishing during the period of Chinook salmon juvenile rearing. Seining was also planned for sampling floodplain habitat should springtime inundation persist long enough to permit reproduction by fish that spawn in the floodplain (e.g., Sacramento splittail). However, during spring 2007 and 2008, no floodplain inundation was observed at fish monitoring sites on the Merced River. During fall 2006, floodplain inundation was noted at one location in the Gravel Mining 1 Reach and one location in the Gravel Mining 2 Reach. The beach seine creates a “wall” extending from the surface to the bottom of the water column. Mesh panels hang from a float line, which sits at the water surface, to a lead line, which sits at the bottom of the seine, and prevent fish from escaping from the net. The beach seine, at 1.8 m (6 ft) high, 9.1 m (30 ft) wide, and possessing a 0.32‐cm (0.125‐in) mesh, was hauled through a location by a two person team and then drawn to shore to trap and capture the fish. Fish were held in buckets for transport and processing. Start and end times and the sampling duration of each seine pass were recorded. The width of the deployed seine opening was recorded, and haul distance was estimated in order to calculate an approximate sample area for use in calculating catch per unit effort (CPUE). All fish were identified to species, counted, and measured for length and weight before being returned to the river at approximately the same location where they were captured. Boat electrofishing Boat electrofishing was used primarily to document presence of adult fish, and was necessary in deeper areas and in habitat units where higher water velocities and turbidity made wading or snorkeling unsafe and ineffective. While these conditions were common throughout the lower river during 2006 and 2007, they were not encountered in the upper river. Thus, boat electrofishing was confined to the lower Merced River. Boat electrofishing was conducted using one of two different types of boats. Sampling with the first type of boat, a 6.4 m (21 ft) aluminum Smith‐Root electrofishing boat, was conducted by a crew of three to four staff biologists including one operator, two crew members netting and removing the captured fish from the nets, and one crew member stationed on the shore. Sampled fish were placed in a live well on‐board the boat, or in
The Merced River Alliance Project Final Report Volume II: Biological Monitoring and Assessment
Stillwater Sciences
5‐19
supplementary on‐shore live wells if capture numbers exceeded the capacity of the boat live‐well. Boat electrofishing was also conducted using a 4.3 m (14 ft) Zodiac inflatable raft (Mark II Classic) outfitted with a 5 horsepower (HP) outboard motor and a Smith‐Root 1.5 KVA electrofishing apparatus as detailed by Stangl (2001). Sampling with the Zodiac raft was conducted by a crew of two staff biologists, including one operator and one crew member netting and removing the captured fish from the nets and placing them in a live well on‐board the raft. Start and end times and the sampling duration of the pass for each habitat unit were recorded from the meter on the electrofisher. All fish captured, whether held on‐board or on‐shore, were processed immediately following each electrofishing pass. Data collected during boat electrofishing were recorded in the field on standard field datasheets (Appendix E). Each captured fish was identified to species, measured to the nearest millimeter (fork length and total length), and weighed to the nearest tenth of a gram. After processing was completed, fish from all passes were returned to the river at approximately the same location where they were captured. Backpack electrofishing Backpack electrofishing was conducted opportunistically along the wade‐able stream margins at snorkel sites to: 1) help verify species identifications made during snorkeling; 2) potentially obtain species length and weight relationships for estimating fish biomass from snorkel data; and 3) to capture species that, because of either their behavior or size, were difficult to observe while snorkeling. Backpack electrofishing was also conducted along wade‐able stream margins at boat electrofishing sites, in areas that were too shallow to accommodate the boat electrofisher. Backpack electrofishing throughout the upper and lower Merced River was conducted with the use of one to two Smith‐Root backpack electrofishers (Model LR‐24 or Model 12 with 11‐in anode rings and standard “rat‐tail” cathodes) and a crew of two to three staff biologists per backpack electrofisher, including one shocker and one to two netters. At sites where backpack electrofishing was employed, all areas within the selected habitat unit were sampled from the center of the channel towards the stream margins. When two backpack electrofishers were used, sampling consisted of simultaneous and roughly parallel passes upstream through the habitat unit. In excessively turbulent portions of the waterway, such as high‐gradient riffles, netters positioned their nets directly downstream of the anode ring to maximize capture of fish that could not be easily observed or that were caught in the turbulent flow. Start and end times and the sampling duration (in seconds) were recorded from each backpack electrofisher. In the upper Merced River, three sites were selected for trout density and biomass measurements. At these sites, a multiple‐pass depletion method (Platts et al. 1983) was used, with block nets (4.76 mm [0.1875 inch] mesh size) placed at each site to prevent the movement of fish into or out of the sampling locations. The bottom edges of the block
The Merced River Alliance Project Final Report Volume II: Biological Monitoring and Assessment
Stillwater Sciences
5‐20
nets were sealed with cobble and small boulders and the top edges of the nets propped above the water surface with dowels to prevent fish from escaping during sampling. Multiple passes of equal effort were made to capture as large a percentage of the population as possible. After completion of each pass, biologists identified each fish to species level and recorded fork length (mm) and weight (g) of each individual fish. Fish weight, to the nearest tenth of a gram, was measured using an electronic balance. Scale samples were collected from selected trout species and stored in labeled envelopes for potential use in age verification by the California Department of Fish and Game (CDFG). All captured fish were allowed to recover in buckets or live wells before being returned to the river at approximately the same location where they were captured. Site characterization While remote coarse‐scale aquatic habitat mapping was conducted under low‐flow conditions to aid in monitoring site selection (Section 5.2.1), site‐scale habitat characterization was conducted at ambient flows during each seasonal fish survey, which included additional aquatic habitat typing, measurement of habitat dimensions, assessment of cover and bed substrate type and quantity, , and measurement of local water quality. Specific parameters measured during site‐scale habitat characterization are summarized in Table 5‐8. Habitat types used for the site‐specific habitat assessment were similar to those identified during the coarse‐scale aquatic habitat mapping effort, with the addition of backwater, floodplain, and margin habitat (Table 5‐9). The additional information collected during the site‐scale habitat characterization allowed for finer‐scale habitat assessment than was possible in the remote monitoring effort, thus providing more information on fish choice of habitat and potentially helping to describe the influence of physical habitat parameters on fish behavior and bioenergetics.
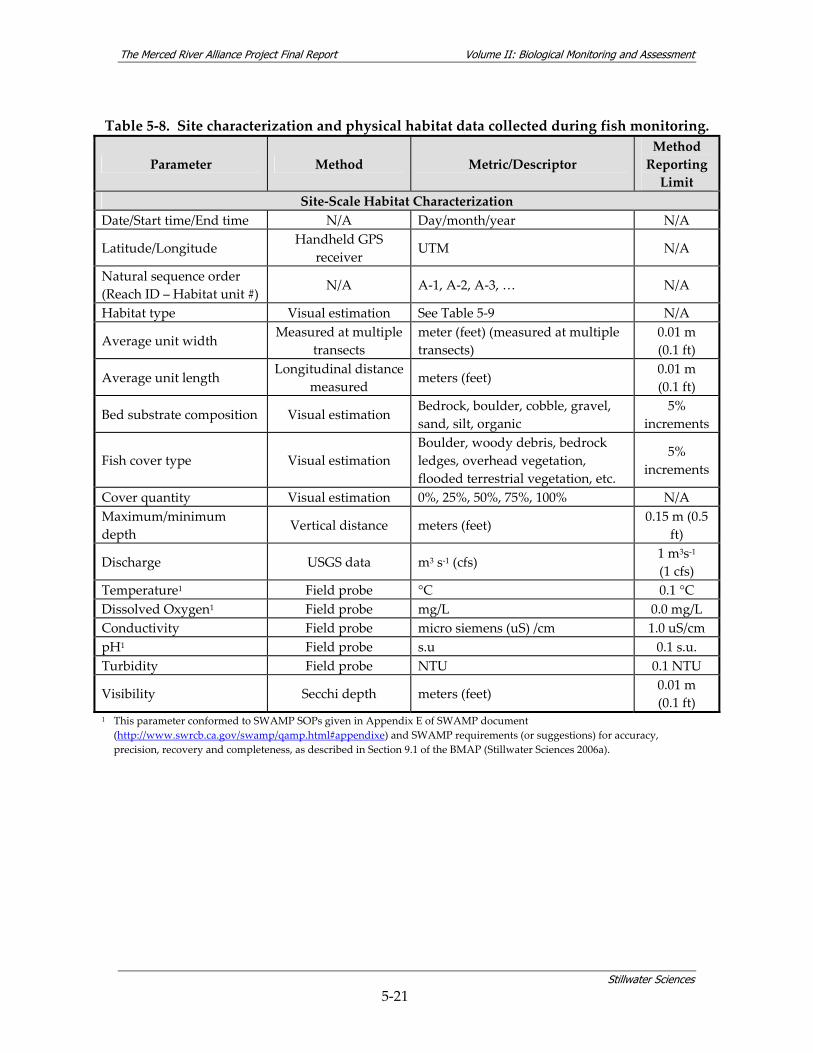
The Merced River Alliance Project Final Report Volume II: Biological Monitoring and Assessment
Stillwater Sciences
5‐21
Table 5‐8. Site characterization and physical habitat data collected during fish monitoring.
Parameter Method Metric/Descriptor Method Reporting Limit
Site‐Scale Habitat Characterization Date/Start time/End time N/A Day/month/year N/A
Latitude/Longitude Handheld GPS receiver
UTM N/A
Natural sequence order (Reach ID – Habitat unit #)
N/A A‐1, A‐2, A‐3, … N/A
Habitat type Visual estimation See Table 5‐9 N/A
Average unit width Measured at multiple transects
meter (feet) (measured at multiple transects)
0.01 m (0.1 ft)
Average unit length Longitudinal distance measured
meters (feet) 0.01 m (0.1 ft)
Bed substrate composition Visual estimation Bedrock, boulder, cobble, gravel, sand, silt, organic
5% increments
Fish cover type Visual estimation Boulder, woody debris, bedrock ledges, overhead vegetation, flooded terrestrial vegetation, etc.
5% increments
Cover quantity Visual estimation 0%, 25%, 50%, 75%, 100% N/A Maximum/minimum depth
Vertical distance meters (feet) 0.15 m (0.5 ft)
Discharge USGS data m3 s‐1 (cfs) 1 m3s‐1 (1 cfs)
Temperature1 Field probe °C 0.1 °C Dissolved Oxygen1 Field probe mg/L 0.0 mg/L Conductivity Field probe micro siemens (uS) /cm 1.0 uS/cm pH1 Field probe s.u 0.1 s.u. Turbidity Field probe NTU 0.1 NTU
Visibility Secchi depth meters (feet) 0.01 m (0.1 ft)
1 This parameter conformed to SWAMP SOPs given in Appendix E of SWAMP document (http://www.swrcb.ca.gov/swamp/qamp.html#appendixe) and SWAMP requirements (or suggestions) for accuracy, precision, recovery and completeness, as described in Section 9.1 of the BMAP (Stillwater Sciences 2006a).
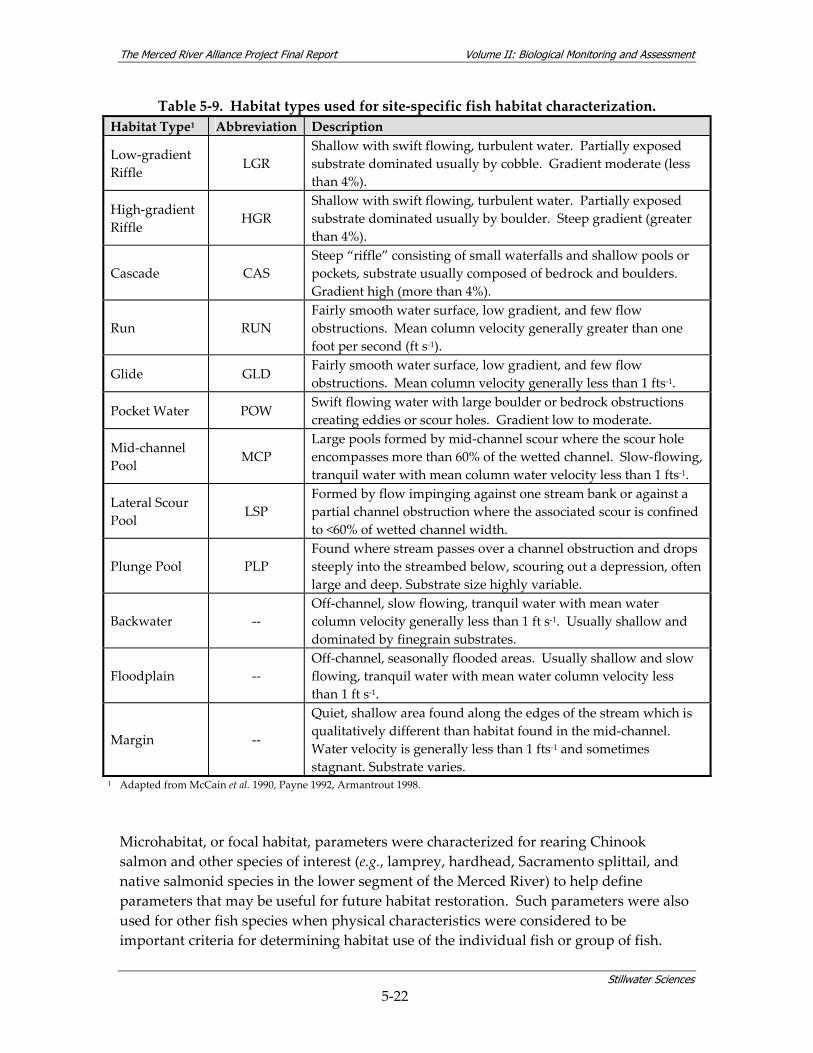
The Merced River Alliance Project Final Report Volume II: Biological Monitoring and Assessment
Stillwater Sciences
5‐22
Table 5‐9. Habitat types used for site‐specific fish habitat characterization. Habitat Type1 Abbreviation Description
Low‐gradient Riffle
LGR Shallow with swift flowing, turbulent water. Partially exposed substrate dominated usually by cobble. Gradient moderate (less than 4%).
High‐gradient Riffle
HGR Shallow with swift flowing, turbulent water. Partially exposed substrate dominated usually by boulder. Steep gradient (greater than 4%).
Cascade CAS Steep “riffle” consisting of small waterfalls and shallow pools or pockets, substrate usually composed of bedrock and boulders. Gradient high (more than 4%).
Run RUN Fairly smooth water surface, low gradient, and few flow obstructions. Mean column velocity generally greater than one foot per second (ft s‐1).
Glide GLD Fairly smooth water surface, low gradient, and few flow obstructions. Mean column velocity generally less than 1 fts‐1.
Pocket Water POW Swift flowing water with large boulder or bedrock obstructions creating eddies or scour holes. Gradient low to moderate.
Mid‐channel Pool
MCP Large pools formed by mid‐channel scour where the scour hole encompasses more than 60% of the wetted channel. Slow‐flowing, tranquil water with mean column water velocity less than 1 fts‐1.
Lateral Scour Pool
LSP Formed by flow impinging against one stream bank or against a partial channel obstruction where the associated scour is confined to <60% of wetted channel width.
Plunge Pool PLP Found where stream passes over a channel obstruction and drops steeply into the streambed below, scouring out a depression, often large and deep. Substrate size highly variable.
Backwater ‐‐ Off‐channel, slow flowing, tranquil water with mean water column velocity generally less than 1 ft s‐1. Usually shallow and dominated by finegrain substrates.
Floodplain ‐‐ Off‐channel, seasonally flooded areas. Usually shallow and slow flowing, tranquil water with mean water column velocity less than 1 ft s‐1.
Margin ‐‐
Quiet, shallow area found along the edges of the stream which is qualitatively different than habitat found in the mid‐channel. Water velocity is generally less than 1 fts‐1 and sometimes stagnant. Substrate varies.
1 Adapted from McCain et al. 1990, Payne 1992, Armantrout 1998.
Microhabitat, or focal habitat, parameters were characterized for rearing Chinook salmon and other species of interest (e.g., lamprey, hardhead, Sacramento splittail, and native salmonid species in the lower segment of the Merced River) to help define parameters that may be useful for future habitat restoration. Such parameters were also used for other fish species when physical characteristics were considered to be important criteria for determining habitat use of the individual fish or group of fish.
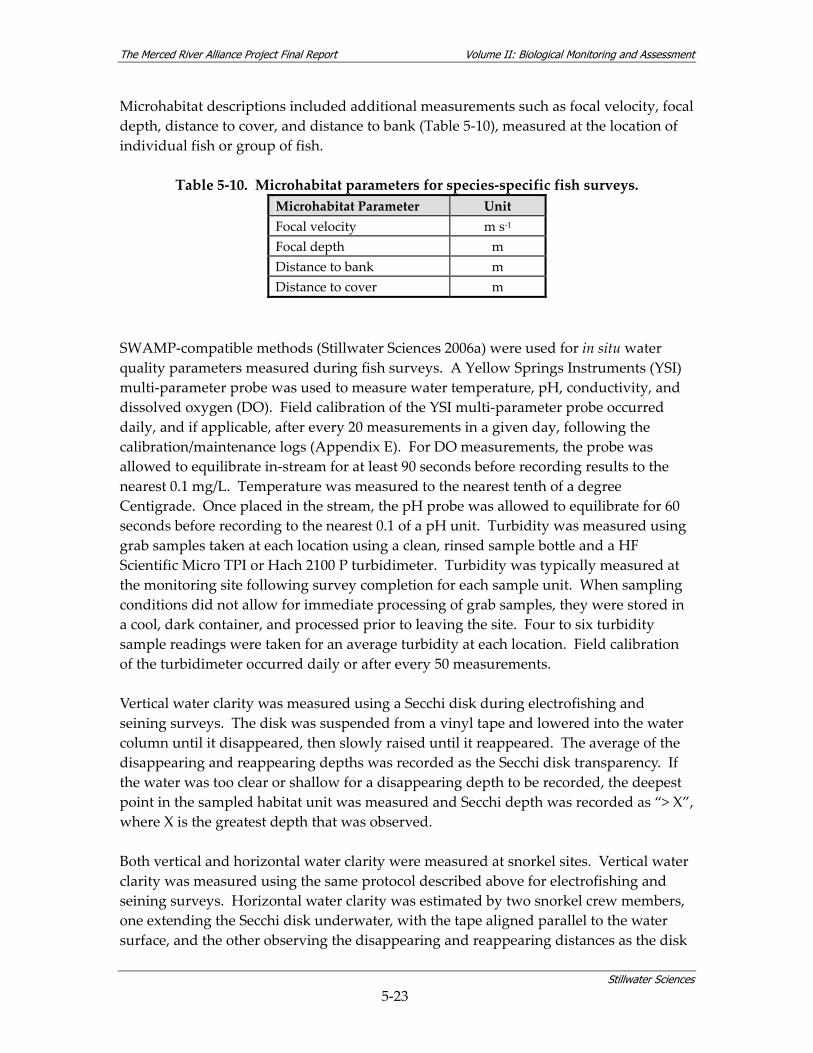
The Merced River Alliance Project Final Report Volume II: Biological Monitoring and Assessment
Stillwater Sciences
5‐23
Microhabitat descriptions included additional measurements such as focal velocity, focal depth, distance to cover, and distance to bank (Table 5‐10), measured at the location of individual fish or group of fish.
Table 5‐10. Microhabitat parameters for species‐specific fish surveys. Microhabitat Parameter Unit Focal velocity m s‐1 Focal depth m Distance to bank m Distance to cover m
SWAMP‐compatible methods (Stillwater Sciences 2006a) were used for in situ water quality parameters measured during fish surveys. A Yellow Springs Instruments (YSI) multi‐parameter probe was used to measure water temperature, pH, conductivity, and dissolved oxygen (DO). Field calibration of the YSI multi‐parameter probe occurred daily, and if applicable, after every 20 measurements in a given day, following the calibration/maintenance logs (Appendix E). For DO measurements, the probe was allowed to equilibrate in‐stream for at least 90 seconds before recording results to the nearest 0.1 mg/L. Temperature was measured to the nearest tenth of a degree Centigrade. Once placed in the stream, the pH probe was allowed to equilibrate for 60 seconds before recording to the nearest 0.1 of a pH unit. Turbidity was measured using grab samples taken at each location using a clean, rinsed sample bottle and a HF Scientific Micro TPI or Hach 2100 P turbidimeter. Turbidity was typically measured at the monitoring site following survey completion for each sample unit. When sampling conditions did not allow for immediate processing of grab samples, they were stored in a cool, dark container, and processed prior to leaving the site. Four to six turbidity sample readings were taken for an average turbidity at each location. Field calibration of the turbidimeter occurred daily or after every 50 measurements. Vertical water clarity was measured using a Secchi disk during electrofishing and seining surveys. The disk was suspended from a vinyl tape and lowered into the water column until it disappeared, then slowly raised until it reappeared. The average of the disappearing and reappearing depths was recorded as the Secchi disk transparency. If the water was too clear or shallow for a disappearing depth to be recorded, the deepest point in the sampled habitat unit was measured and Secchi depth was recorded as “> X”, where X is the greatest depth that was observed. Both vertical and horizontal water clarity were measured at snorkel sites. Vertical water clarity was measured using the same protocol described above for electrofishing and seining surveys. Horizontal water clarity was estimated by two snorkel crew members, one extending the Secchi disk underwater, with the tape aligned parallel to the water surface, and the other observing the disappearing and reappearing distances as the disk
The Merced River Alliance Project Final Report Volume II: Biological Monitoring and Assessment
Stillwater Sciences
5‐24
was moved through the water. The horizontal measures were taken both into and away from the sun. Analytical Methods Fish survey data were analyzed to characterize species composition and distribution, and to develop metrics including population‐level indices (e.g., estimated linear density) and community‐level indices (e.g., species richness, species diversity) to support descriptions of spatial and seasonal patterns in the Merced River fish community. The fish community was investigated at a variety of spatial scales, including basin, segment, reach, habitat unit, and microhabitat scales (Figure 5‐2). At the basin scale, the presence of fish community assemblages and their longitudinal and seasonal distribution were analyzed throughout the mainstem Merced River (i.e., across both upper and lower river segments), while analyses of native versus introduced species, anadromous versus resident species, generally dominant species, and fish length‐frequency were conducted at the segment scale (i.e., upper vs. lower river). Community‐level indices such as species richness and species diversity, as well as population‐level indices such as estimated fish linear abundance and percent of total individuals observed by species were analyzed at the reach scale, including an analysis of seasonal patterns. Habitat associations were explored at the segment and reach scale for all species, with selected species analyzed at the microhabitat scale. Estimated linear density Estimated linear fish density is defined as the total number of fish of each species recovered in all locations (i.e., habitat units) associated with a given monitoring site, divided by the total length of the habitat units sampled during the associated survey. Note that the “total length” here serves as a measure of sampling effort, rather than a monitoring site dimension, because it sums the various lengths of habitat units associated with an observed fish species and not the total length of the monitoring site. It is considered an estimate since the sampling methods described above were not designed to target absolute density for observed fish species. Estimated linear density is expressed as the number of fish per 100 meters. Estimated linear density data were used in multiple analyses, including an investigation of potential reach‐scale trends in overall fish density, community assemblage distribution, and a species‐specific analysis in the upper river segment. Species richness and diversity Species richness is defined as the number of species detected within a given reach, while species diversity measures ecological diversity based on the number of species detected, weighted by the number of individuals of each species, also within a given reach. A high score indicates high ecological (species) diversity. Species diversity is measured using a transformation of the usual Shannon‐Weiner index, which is symbolized by Hʹ (also called Shannon‐Weaver index or Shannon index; Krebs 1989). This transformed index, which was introduced by MacArthur (1965) is N1 where N1 = 2Hʹ. The advantage
The Merced River Alliance Project Final Report Volume II: Biological Monitoring and Assessment
Stillwater Sciences
5‐25
of N1 over Hʹ is that N1 is measured in terms of species, whereas Hʹ is measured in terms of bits of information (Nur et al. 1999). Thus, N1 is more easily interpreted, and species diversity (measured as N1) and richness can be compared. The formula for computing species diversity is as follows:
N1 = e 'H and ∑=
=S
1ii )1)()(ln( 'H
i-pp
Where: S = total species richness pi = the proportion of the total number of individuals for the ith species.
Fish community assemblages Multivariate cluster analysis was used as an exploratory technique to determine whether fish survey results indicated the existence of discrete fish community assemblages in the Merced River. In ecological studies, cluster analyses are often used to organize entities into classes or groups such that within‐group similarity is maximized and among‐group similarity is minimized, according to some objective criteria (McGargigal et al. 2000). For the Merced Alliance data set, fall 2006 fish species presence‐absence data were analyzed at the basin scale, across all fish monitoring sites, using both hierarchical agglomerative and divisive cluster analysis methods. Agglomerative methods begin with each observation as a single cluster and progressively combine similar clusters until there is only one remaining cluster. Divisive methods start with a single cluster containing all observations and divide until each observation exists as its own cluster (Kaufman and Rousseeuw 1990). Both agglomerative and divisve clustering methods rely on calculation of a dissimilarity matrix based on observed data. For the Merced Alliance exploratory analysis, fish species observations were treated as values from an asymmetric binary variable, which allowed one of the possible values (e.g., presence/absence) to be of greater importance. Because species absence during a survey does not necessarily mean that the species does not exist in Merced River, only that it was not detected, species presence was considered to be a result of greater importance than species absence. Results of the cluster analyses were compared with broad water temperature assemblages and an expanded version of the San Joaquin River Drainage (SJRD) community assemblage model originally defined in Brown et al. (2003) (Table 5‐11). Additionally, longitudinal gradients in fish community assemblages were assessed by comparison of observed species distributions with expected distributions based on the fish assemblage descriptions given in Table 5‐11. The comparison was based on species‐specific estimated linear densities calculated as described above for each SJRD community assemblage for each sampling season. The estimated linear densities were analyzed along a river mile continuum to identify potential seasonal shifts in the extent
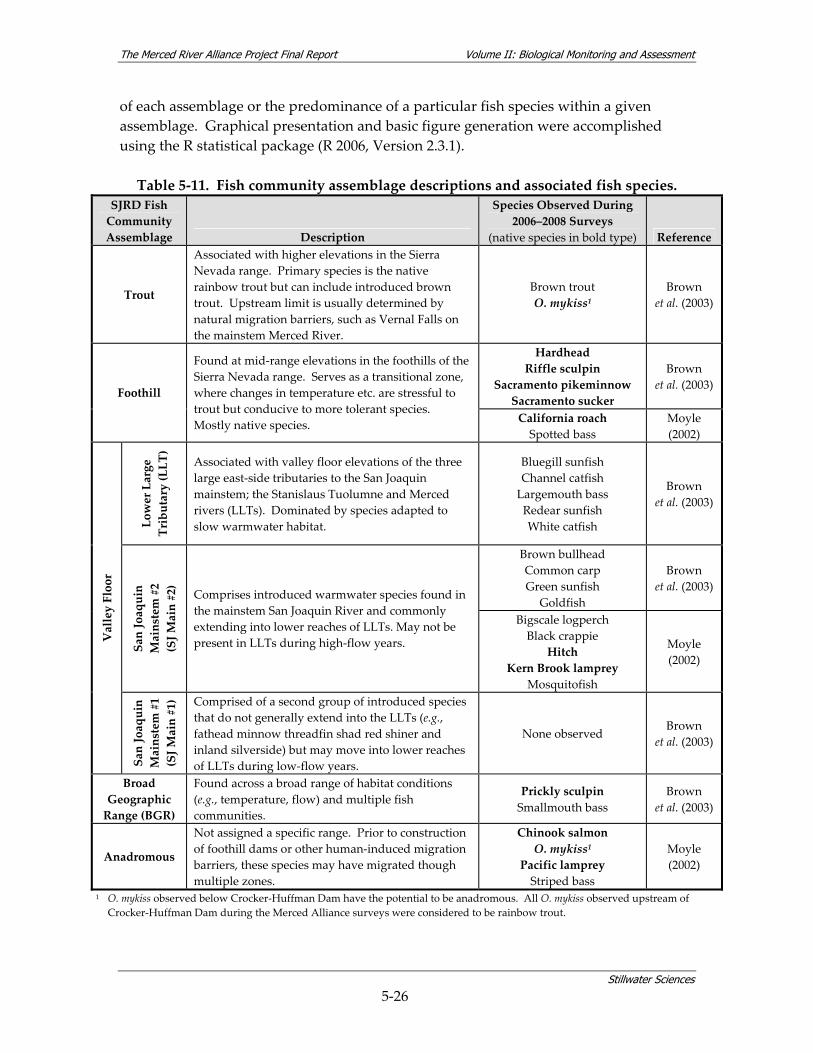
The Merced River Alliance Project Final Report Volume II: Biological Monitoring and Assessment
Stillwater Sciences
5‐26
of each assemblage or the predominance of a particular fish species within a given assemblage. Graphical presentation and basic figure generation were accomplished using the R statistical package (R 2006, Version 2.3.1). Table 5‐11. Fish community assemblage descriptions and associated fish species.
SJRD Fish Community Assemblage Description
Species Observed During 2006–2008 Surveys
(native species in bold type) Reference
Trout
Associated with higher elevations in the Sierra Nevada range. Primary species is the native rainbow trout but can include introduced brown trout. Upstream limit is usually determined by natural migration barriers, such as Vernal Falls on the mainstem Merced River.
Brown trout O. mykiss1
Brown et al. (2003)
Hardhead Riffle sculpin
Sacramento pikeminnow Sacramento sucker
Brown et al. (2003) Foothill
Found at mid‐range elevations in the foothills of the Sierra Nevada range. Serves as a transitional zone, where changes in temperature etc. are stressful to trout but conducive to more tolerant species. Mostly native species. California roach
Spotted bass Moyle (2002)
Lower Large
Tributary (LLT)
Associated with valley floor elevations of the three large east‐side tributaries to the San Joaquin mainstem; the Stanislaus Tuolumne and Merced rivers (LLTs). Dominated by species adapted to slow warmwater habitat.
Bluegill sunfish Channel catfish Largemouth bass Redear sunfish White catfish
Brown et al. (2003)
Brown bullhead Common carp Green sunfish
Goldfish
Brown et al. (2003)
San Joaquin
Mainstem #2
(SJ M
ain #2)
Comprises introduced warmwater species found in the mainstem San Joaquin River and commonly extending into lower reaches of LLTs. May not be present in LLTs during high‐flow years.
Bigscale logperch Black crappie
Hitch Kern Brook lamprey
Mosquitofish
Moyle (2002)
Valley Floor
San Joaquin
Mainstem #1
(SJ M
ain #1) Comprised of a second group of introduced species
that do not generally extend into the LLTs (e.g., fathead minnow threadfin shad red shiner and inland silverside) but may move into lower reaches of LLTs during low‐flow years.
None observed Brown
et al. (2003)
Broad Geographic Range (BGR)
Found across a broad range of habitat conditions (e.g., temperature, flow) and multiple fish communities.
Prickly sculpin Smallmouth bass
Brown et al. (2003)
Anadromous
Not assigned a specific range. Prior to construction of foothill dams or other human‐induced migration barriers, these species may have migrated though multiple zones.
Chinook salmon O. mykiss1
Pacific lamprey Striped bass
Moyle (2002)
1 O. mykiss observed below Crocker‐Huffman Dam have the potential to be anadromous. All O. mykiss observed upstream of Crocker‐Huffman Dam during the Merced Alliance surveys were considered to be rainbow trout.
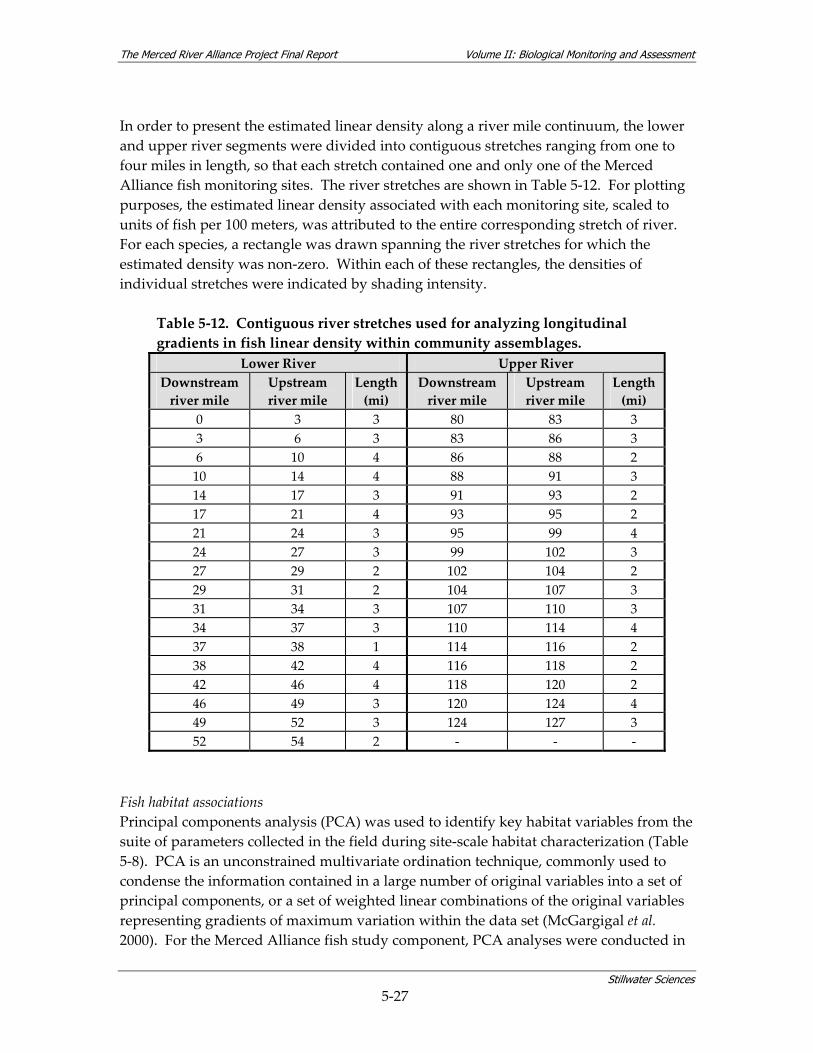
The Merced River Alliance Project Final Report Volume II: Biological Monitoring and Assessment
Stillwater Sciences
5‐27
In order to present the estimated linear density along a river mile continuum, the lower and upper river segments were divided into contiguous stretches ranging from one to four miles in length, so that each stretch contained one and only one of the Merced Alliance fish monitoring sites. The river stretches are shown in Table 5‐12. For plotting purposes, the estimated linear density associated with each monitoring site, scaled to units of fish per 100 meters, was attributed to the entire corresponding stretch of river. For each species, a rectangle was drawn spanning the river stretches for which the estimated density was non‐zero. Within each of these rectangles, the densities of individual stretches were indicated by shading intensity.
Table 5‐12. Contiguous river stretches used for analyzing longitudinal gradients in fish linear density within community assemblages.
Lower River Upper River Downstream river mile
Upstream river mile
Length(mi)
Downstream river mile
Upstream river mile
Length(mi)
0 3 3 80 83 3 3 6 3 83 86 3 6 10 4 86 88 2 10 14 4 88 91 3 14 17 3 91 93 2 17 21 4 93 95 2 21 24 3 95 99 4 24 27 3 99 102 3 27 29 2 102 104 2 29 31 2 104 107 3 31 34 3 107 110 3 34 37 3 110 114 4 37 38 1 114 116 2 38 42 4 116 118 2 42 46 4 118 120 2 46 49 3 120 124 4 49 52 3 124 127 3 52 54 2 ‐ ‐ ‐
Fish habitat associations Principal components analysis (PCA) was used to identify key habitat variables from the suite of parameters collected in the field during site‐scale habitat characterization (Table 5‐8). PCA is an unconstrained multivariate ordination technique, commonly used to condense the information contained in a large number of original variables into a set of principal components, or a set of weighted linear combinations of the original variables representing gradients of maximum variation within the data set (McGargigal et al. 2000). For the Merced Alliance fish study component, PCA analyses were conducted in
The Merced River Alliance Project Final Report Volume II: Biological Monitoring and Assessment
Stillwater Sciences
5‐28
the R statistical package (R 2006, Version 2.3.1), using the “rda” function within the library package “vegan” (Oksanen et al. 2006). The fish habitat PCA was conducted at the segment scale (i.e., separately for the upper river and lower river.) All seasonal sampling events were included in the analysis. Physical habitat variables and water quality variables were analyzed separately to reduce the potential for confounding effects of simultaneous longitudinal and seasonal variation in water quality parameters. PCA physical habitat variables included percent values for primary habitat types (i.e., riffle and pool/run/glide), cover types (i.e., boulder, large woody debris, aquatic vegetation, and none), substrate types (i.e., cobble and silt substrates), and average and maximum depth (ft), while the separate set of water quality variables included pH, specific conductivity (uS/cm), turbidity (NTU), dissolved oxygen (mg/L), and water temperature (°C). If multiple categories were available for a given environmental variable, only the most dominant category was included in the analysis. For example, percent cobble and percent silt were selected to represent bed substrate in the physical habitat PCA because these two were the most common substrates observed during the fish surveys. Results of the PCA were scaled by eigenvalues, as described by Oksanen et al. (2006), to account for differences in the unit scale among environmental variables. The gradients evident from the first two principal components were intended to identify the most influential set of variables that could be used in later analyses. PCA was also applied to fish presence/absence data in order to potentially isolate a few species that were representative of the larger set of all sampled species for inclusion in the habitat associations analysis. The presence/absence data were used for the PCA, rather than estimated linear density, as the latter was considered a less consistent measure for quantitative analysis due to the variety of capture methods (e.g., snorkel, seine, backpack eletrofishing, boat electrofishing) that were necessarily used at different monitoring sites. Species PCA results were compared with results from the cluster analysis (see above) as a corroborative check.
5.2.4 BMI Study Stream surveys of BMI are frequently conducted as indicators of water quality and overall aquatic ecosystem health (Barbour et al. 1999, Plafkin et al. 1989, Mebane 2001). The intent of the BMI study component was to provide further information regarding BMI assemblages and aquatic habitat quality within the Merced River. The BMI component of the Merced Alliance biological monitoring was designed to complement information available from recent and ongoing studies (Section 5.3.4 of Volume I) and to ensure compatibility with ongoing data collection efforts to the maximum extent possible.
The Merced River Alliance Project Final Report Volume II: Biological Monitoring and Assessment
Stillwater Sciences
5‐29
5.2.4.1 Objectives The objectives of the BMI study were to: 1) gather information regarding BMI composition, distribution, and relative abundance in the Merced River watershed as an indicator of water quality and ecosystem health; 2) conduct seasonal BMI bioassessments using both targeted riffle and multi‐habitat composite samples; 3) determine presence or absence of non‐native, invasive aquatic invertebrate species including the Asian clam (Corbicula fluminea), Chinese mitten crab (Eriocheir sinensis), and New Zealand mud snail (Potamopyrgus antipodarum); 4) relate data generated by objectives 1–3 to ecological subregions (Miles and Goudey 1997; Omernik and Bailey 1997) and physical habitat variables in order to better understand the relationship between BMI assemblages and their physical environment; and 5) address specific BMI hypotheses, as detailed in the next section. 5.2.4.2 Hypotheses Hypotheses developed for the Merced Alliance BMI surveys build upon the results of recent BMI studies conducted in the region (Bergendorf 2005, Brown and May 2000a, Brown and May 2000b, Carter and Fend 2001, Gangloff 1998, Markiewicz et al. 2003, Ward and Stanford 1995). As stated in Section 4, addressing the following hypotheses was a secondary goal of the Merced Alliance biological assessment monitoring, with collection of contemporary baseline data for fish, avian, and BMI taxa as the primary goal. BMI hypotheses are addressed in Sections 7.4.1 and 8.3 of this report.
1. BMI samples taken from sites with relatively large amounts of fixed woody material (FWM) (as quantified during the physical habitat assessment) will exhibit higher MMI values than those taken from sites without significant FWM (Kaufman et al. 1999).
2. BMI taxonomic richness will be greatest in riffles in the foothill region above New Exchequer Dam, as compared with taxonomic richness measured in riffles located in either the mountain or valley floor regions of the Merced River (Brown and May 2000a).
3. Serial discontinuity in the longitudinal pattern of functional feeding group (FFG) relative abundance will be apparent at New Exchequer Dam, with increased relative abundance of collector‐filterers just below the dam (Ward and Stanford 1995).
4. An increase in the relative abundance and richness of stonefly and other Ephemeroptera, Plecoptera, and Trichoptera (EPT) taxa will be apparent in the Dredger Tailings Reach during the wetter year surveys in 2006–2007 as compared with the data collected in March 2005 following multiple years of “dry” to “normal” flows (Stillwater Sciences 2006b).
5. EPT richness will be greater in reaches where habitat restoration involving substrate renewal (e.g., gravel augmentation) or channel reconfiguration has

The Merced River Alliance Project Final Report Volume II: Biological Monitoring and Assessment
Stillwater Sciences
5‐30
occurred, as compared with otherwise similar reaches in which no restoration has occurred (Merz and Chan 2005).
6. Chinese mitten crab distribution in the Merced River will be limited to the lower sand‐bedded reaches of the Merced River. Relative abundance will be greatest near the SJR confluence and will decrease upstream of the confluence (because the source of the invasion is upstream movement of crabs from the Sacramento‐San Joaquin River estuary) (Bergendorf 2005).
7. If found, the New Zealand mud snail, which has not been documented in the Merced River to date (Post, pers. comm., 2006), will not exhibit any consistent longitudinal pattern in distribution and abundance (because introduction by humans may occur at any point within the Merced River corridor). Relative abundance will be highest in areas where recreational fishing activities are most prominent (e.g., Yosemite Valley, just upstream of Lake McClure on the mainstem).
8. Asian clam distribution in the Merced River will extend beyond that measured in 2003 by Brown (pers. comm. 2006) to include locations in the upper river (i.e., the dams do not represent a barrier to upstream dispersal since birds or humans can serve as vectors of introduction to the upper portion of the watershed).
5.2.4.3 Methods The BMI sampling approach for the Merced Alliance BMAP (Stillwater Sciences 2006a) was designed to be SWAMP compatible and was, therefore, based on the BMI protocol adopted under the U.S. EPA’s Environmental Monitoring and Assessment Program Western Pilot Study (EMAP‐West) and the EPA wadeable stream assessment field operations manual (EPA 2004). Detailed information regarding the development and use of the EMAP‐West methodology, including a comparison of its components to other BMI sampling protocols, is provided in Section 5.2.3.3 of the BMAP (Stillwater Sciences 2006a). Merced Alliance BMI monitoring sites were selected to meet the following criteria:
1. To take advantage of existing aquatic BMI and water quality monitoring data, especially those data taken at sites where restoration actions have been undertaken;
2. To be accessible;
3. To be proximal to fish monitoring sites, where applicable; and
4. To represent a range of ecological subregions (as defined by Miles and Goudey, 1997).
A total of 18 sites in the lower river segment and 20 sites in the upper river segment were chosen and sampled for BMI bioassessment monitoring in fall 2006 and 2007 (Table 5‐13, Figure 5‐4). A subset of these sites (ten in the upper river segment and ten in the
The Merced River Alliance Project Final Report Volume II: Biological Monitoring and Assessment
Stillwater Sciences
5‐31
lower river segment) was also sampled during the spring/summer of 2007 (Table 5‐13). Monitoring sites were 500 m (1,640 ft) in length and placed at least 30 m (100 ft) upstream or downstream of any bridge or abutment that may influence the flow of the stream (Appendix I‐2). Collectively the BMI monitoring sites spanned six ecological subregions (Table 5‐13; Figure 5‐4).

The
Mer
ced
Rive
r Al
lianc
e Pr
ojec
t Fin
al R
epor
t
Volu
me
II:
Biol
ogic
al M
onito
ring
and
Asse
ssm
ent
Still
wat
er S
cien
ces
5‐32
Table 5‐13. Summary of BMI sampling design and monitoring site selection.
UTM
1 Sampling Period
Ecological
Subregion
BMI
Monitoring
Site ID
Approx.
RM
Northing
Easting
Fall
2006
Spring/
Summer
2007
Fall
2007
Land Ownership/Administration
Lower River
CON‐B1*
1.0
4135764
680761
X
X CON‐B2*
3.5
4136816
681474
X X
X EN
C‐B1*
8.5
4136742
685859
X
X EN
C‐B2*
12.5
4138044
690759
X X
X EN
C‐B3
14.5
4138515
691737
X
X EN
C‐B4
17.5
4140623
697969
X
X EN
C‐B5*
24
4143862
703042
X X
X GM2‐B1
27
4144894
705521
X
X
Man
teca M
erced
Allu
vium
GM2‐B2
29
4146511
709359
X X
X
Private
GM2‐B3
32
4147626
711006
X
X Merced Cou
nty
GM1‐B1
36.5
4149843
715280
X
X GM1‐B2
39
4149826
717224
X X
X GM1‐B3
44.5
4153267
725037
X X
X DTR‐B1
46.5
4154261
725728
X X
X
Private
DTR‐B2
48.5
4155858
727414
X
X Hende
rson Park
DTR‐B3
50
4155287
729931
X X
X Merced ID
/CDFG
DTR‐B4
51.5
4155485
731521
X X
X CDFG H
atchery
HardP
an/Cam
anche
Terraces
MF‐B1
53.5
4155146
735274
X X
X Private
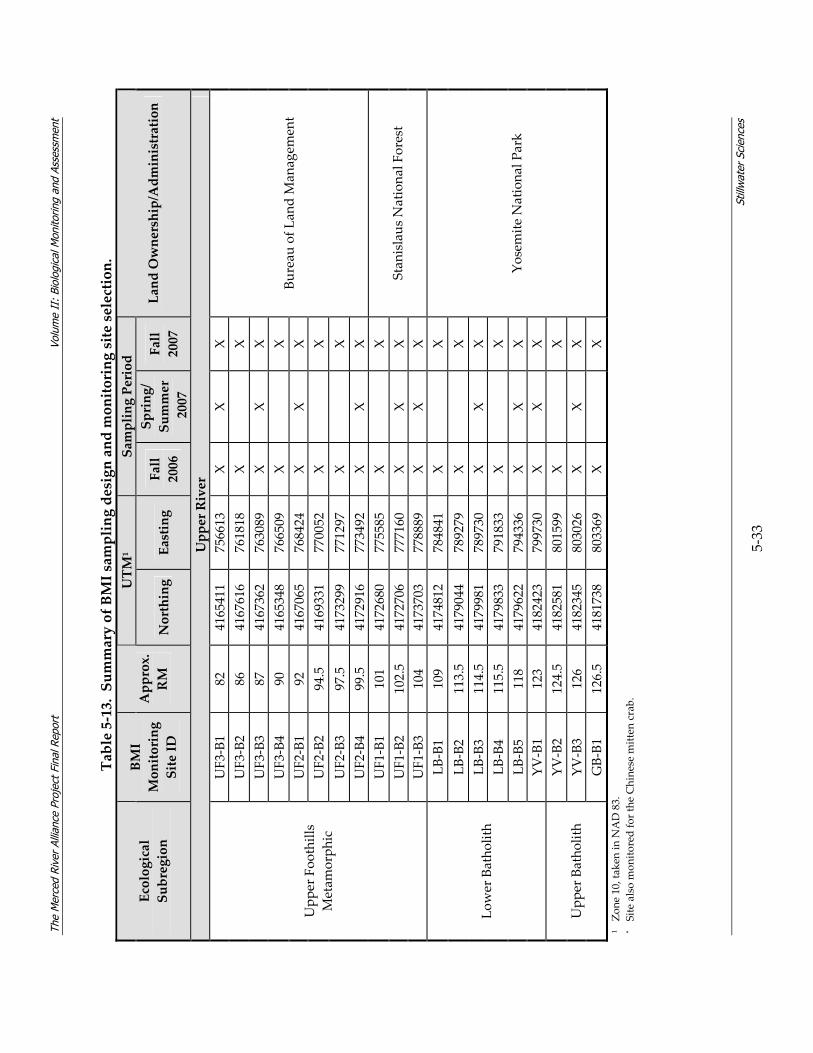
The
Mer
ced
Rive
r Al
lianc
e Pr
ojec
t Fin
al R
epor
t
Volu
me
II:
Biol
ogic
al M
onito
ring
and
Asse
ssm
ent
Still
wat
er S
cien
ces
5‐33
Table 5‐13. Summary of BMI sampling design and monitoring site selection.
UTM
1 Sampling Period
Ecological
Subregion
BMI
Monitoring
Site ID
Approx.
RM
Northing
Easting
Fall
2006
Spring/
Summer
2007
Fall
2007
Land Ownership/Administration
Upper River
UF3‐B1
82
4165411
756613
X X
X UF3‐B2
86
4167616
761818
X
X UF3‐B3
87
4167362
763089
X X
X UF3‐B4
90
4165348
766509
X
X UF2‐B1
92
4167065
768424
X X
X UF2‐B2
94.5
4169331
770052
X
X UF2‐B3
97.5
4173299
771297
X
X UF2‐B4
99.5
4172916
773492
X X
X
Bureau of L
and Man
agem
ent
UF1‐B1
101
4172680
775585
X
X UF1‐B2
102.5
4172706
777160
X X
X
Upp
er Foo
thills
Metam
orph
ic
UF1‐B3
104
4173703
778889
X X
X Stan
islaus N
ationa
l Forest
LB‐B1
109
4174812
784841
X
X LB‐B2
113.5
4179044
789279
X
X LB‐B3
114.5
4179981
789730
X X
X LB‐B4
115.5
4179833
791833
X
X LB‐B5
118
4179622
794336
X X
X
Lower Batho
lith
YV‐B1
123
4182423
799730
X X
X YV‐B2
124.5
4182581
801599
X
X YV‐B3
126
4182345
803026
X X
X Upp
er Batho
lith
GB‐B1
126.5
4181738
803369
X
X
Yosemite N
ationa
l Park
1 Zo
ne 10, ta
ken in N
AD 83.
* Site also mon
itored for the Chinese m
itten crab.
The Merced River Alliance Project Final Report Volume II: Biological Monitoring and Assessment
Stillwater Sciences
5‐34
Bioassessment Field Methods Detailed quality assurance and quality control (QA/QC) measures for the Merced Alliance biological monitoring are discussed in the BMAP (Stillwater Sciences 2006a). For BMI monitoring, Stillwater Sciences’ biologists recorded all field survey information on datasheets, which were entered into a database immediately following each monitoring visit. Specific monitoring methods are described below. Multi‐habitat composite (MHC) sample The downstream end of each monitoring site was designated as transect “A” (Figure 5‐5). Ten additional transects (labeled “B” through “K” moving upstream) were determined at intervals equal to 1/10 of the total monitoring site length (50 m). Each transect was sampled at one of three points (facing downstream, Left [L] = 25% of stream width, Center [C] = 50%, or Right [R] = 75%), which was selected systematically following a random start at Transect A. A stopwatch was used to randomly select the first sampling location (at Transect A) by noting the last digit on the watch – if the digit was 1 through 3, Transect A was sampled at the left point, 4 through 6, at the center point, and 7 through 9, at the right point. The remaining transects B through K were sampled following the sequence “L, C, R, L, C, R, etc.” If a sampling point was located in water that was too deep, inaccessible, or otherwise unsafe, an alternate sampling point along the transect was selected. In such cases, an effort was made to equally represent the left bank, right bank, and mid‐channel habitat in the sample. A sample was collected from each of the 11 transects (Transects A–K) at the assigned sampling spots (L, C, R) using a D‐frame kicknet with 500 μm mesh. Riffle, run, and glide habitats (see Table 5‐9 for aquatic habitat type definitions) were sampled in a similar manner. With the net opening facing upstream, the net was securely placed on the stream bottom to eliminate gaps under the frame. A quadrat of 0.09 m2 (1 ft2), equal to the area of the net, was disturbed for thirty seconds just upstream of the net opening. Large rocks that were less than 50% into the sampling area were pushed aside. Remaining substrate was either scrubbed by hand or kicked by foot, depending on depth and velocity conditions, to dislodge organisms and wash them into the net. Where possible, mussels, snails, and sections of vegetation that fell entirely within the quadrat were removed by hand and included in the sample. After scrubbing or kicking, the substrate particles were removed from the sample area. Finer substrate within the quadrat was disturbed in an upstream to downstream pattern. After the sample was taken, the net was pulled up out of the water, then immersed in the stream several times to remove fine sediments and to concentrate organisms at the tail end of the net. Due to the greater sampling depth necessary, pool habitat was sampled using a modified method. A quadrat equal to the area of the net (0.09 m2 [1 ft2]) was disturbed either by foot or with the base of the net (depending on water depth). The net was then
The Merced River Alliance Project Final Report Volume II: Biological Monitoring and Assessment
Stillwater Sciences
5‐35
continuously swept through this area just above the channel bottom in a downstream to upstream motion for thirty seconds. The net was kept moving at all times so that organisms trapped in the net were not able to escape. If the sample area contained large amounts of vegetation, the net was swept through this vegetation. Large rocks that were less than 50% into the sampling area were pushed aside. Remaining substrate was either scrubbed by hand or kicked by foot, depending on depth, to dislodge organisms and wash them into the net. Where possible, mussels, snails, and sections of vegetation that fell entirely within the quadrat were removed by hand and included in the sample. After 30 seconds of sweeping, the net was removed from the water with a quick upstream motion to wash the organisms to the bottom of the net. The net was then immersed in the stream several times to remove fine sediments and to concentrate organisms at the end of the net. No water or material was allowed to enter the mouth of the net during this final step. Targeted riffle composite (TRC) sample Upon arrival at the monitoring site, the number of riffle habitat units contained in the sample reach was visually estimated. A riffle unit was considered to be riffle habitat with an area greater than 0.09 m2 (1 ft2). If there was less than 0.74 m2 (8 ft2) of riffle (eight riffle habitat units) habitat present within the monitoring site, a targeted riffle sample was not collected. If there was at least 0.74 m2 (8 ft2) of riffle habitat present within the monitoring site, a total of eight samples were taken to form the targeted riffle composite. In cases where there were fewer than eight distinct riffles, more than one kick sample per riffle was collected (Figure 5‐5). If there were more than eight riffles, one or more riffle units were skipped at random. In either case, an effort was made to spread sampling points throughout the reach as much as possible. The core area (excluding channel margins and upstream/downstream boundaries) of each riffle was defined and visually divided into nine equal quadrats in a 3x3 grid. One quadrat was randomly selected for a kick sample. If more than one sample was collected from a particular riffle, a second quadrat was randomly chosen and sampled. The remaining sampling protocols for targeted riffle composite samples followed those discussed above for riffle/run/glide habitats. Sample processing Each composite sample was transferred into a labeled, plastic sample jar, containing 95% ethanol, by carefully inverting the net. Residual organisms clinging to the net were removed by hand, using forceps if necessary, and placed in the jar. Any large objects in the net (such as rocks, sticks, and leaves) were carefully inspected for organisms before being discarded. Detritus was removed to the greatest extent possible, without losing any organisms. The net was thoroughly rinsed before proceeding to the next upstream sampling location. Aquatic bioassessment samples were labeled with the project name, site identification, sample type, date and time sampled, preservatives used, constituent analyses required,
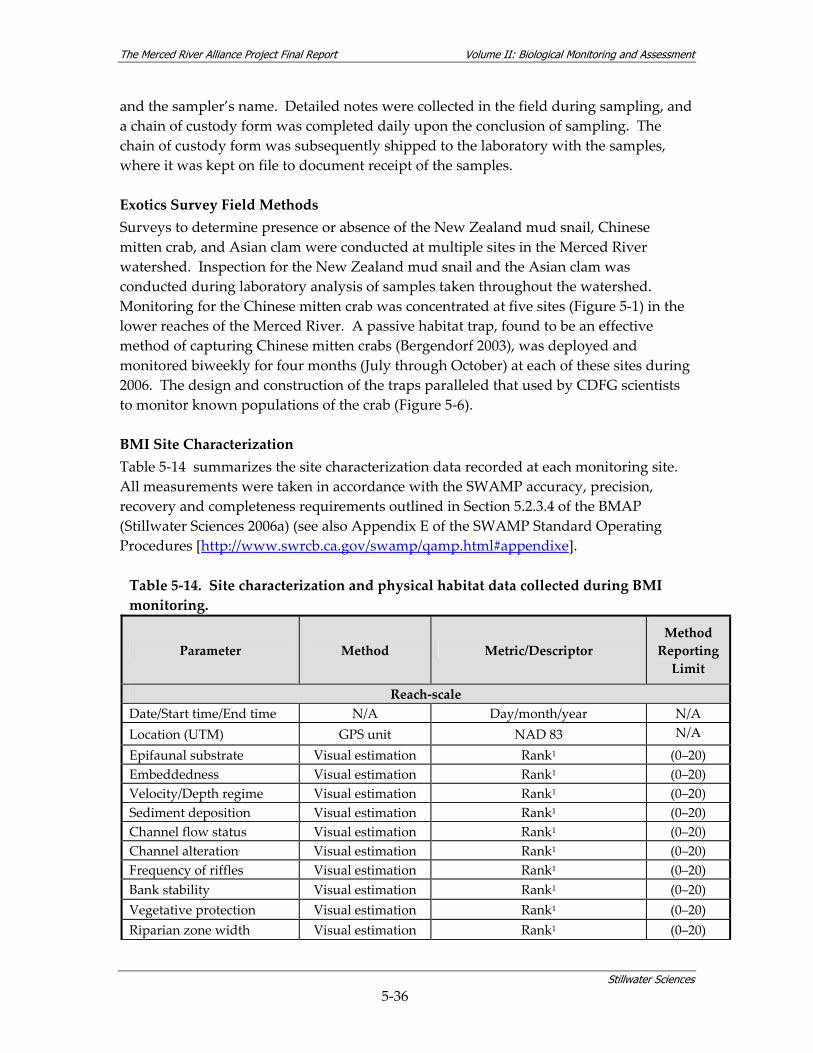
The Merced River Alliance Project Final Report Volume II: Biological Monitoring and Assessment
Stillwater Sciences
5‐36
and the sampler’s name. Detailed notes were collected in the field during sampling, and a chain of custody form was completed daily upon the conclusion of sampling. The chain of custody form was subsequently shipped to the laboratory with the samples, where it was kept on file to document receipt of the samples. Exotics Survey Field Methods Surveys to determine presence or absence of the New Zealand mud snail, Chinese mitten crab, and Asian clam were conducted at multiple sites in the Merced River watershed. Inspection for the New Zealand mud snail and the Asian clam was conducted during laboratory analysis of samples taken throughout the watershed. Monitoring for the Chinese mitten crab was concentrated at five sites (Figure 5‐1) in the lower reaches of the Merced River. A passive habitat trap, found to be an effective method of capturing Chinese mitten crabs (Bergendorf 2003), was deployed and monitored biweekly for four months (July through October) at each of these sites during 2006. The design and construction of the traps paralleled that used by CDFG scientists to monitor known populations of the crab (Figure 5‐6). BMI Site Characterization Table 5‐14 summarizes the site characterization data recorded at each monitoring site. All measurements were taken in accordance with the SWAMP accuracy, precision, recovery and completeness requirements outlined in Section 5.2.3.4 of the BMAP (Stillwater Sciences 2006a) (see also Appendix E of the SWAMP Standard Operating Procedures [http://www.swrcb.ca.gov/swamp/qamp.html#appendixe]. Table 5‐14. Site characterization and physical habitat data collected during BMI monitoring.
Parameter Method Metric/Descriptor Method Reporting Limit
Reach‐scale Date/Start time/End time N/A Day/month/year N/A Location (UTM) GPS unit NAD 83 N/A
Epifaunal substrate Visual estimation Rank1 (0–20) Embeddedness Visual estimation Rank1 (0–20) Velocity/Depth regime Visual estimation Rank1 (0–20) Sediment deposition Visual estimation Rank1 (0–20) Channel flow status Visual estimation Rank1 (0–20) Channel alteration Visual estimation Rank1 (0–20) Frequency of riffles Visual estimation Rank1 (0–20) Bank stability Visual estimation Rank1 (0–20) Vegetative protection Visual estimation Rank1 (0–20) Riparian zone width Visual estimation Rank1 (0–20)
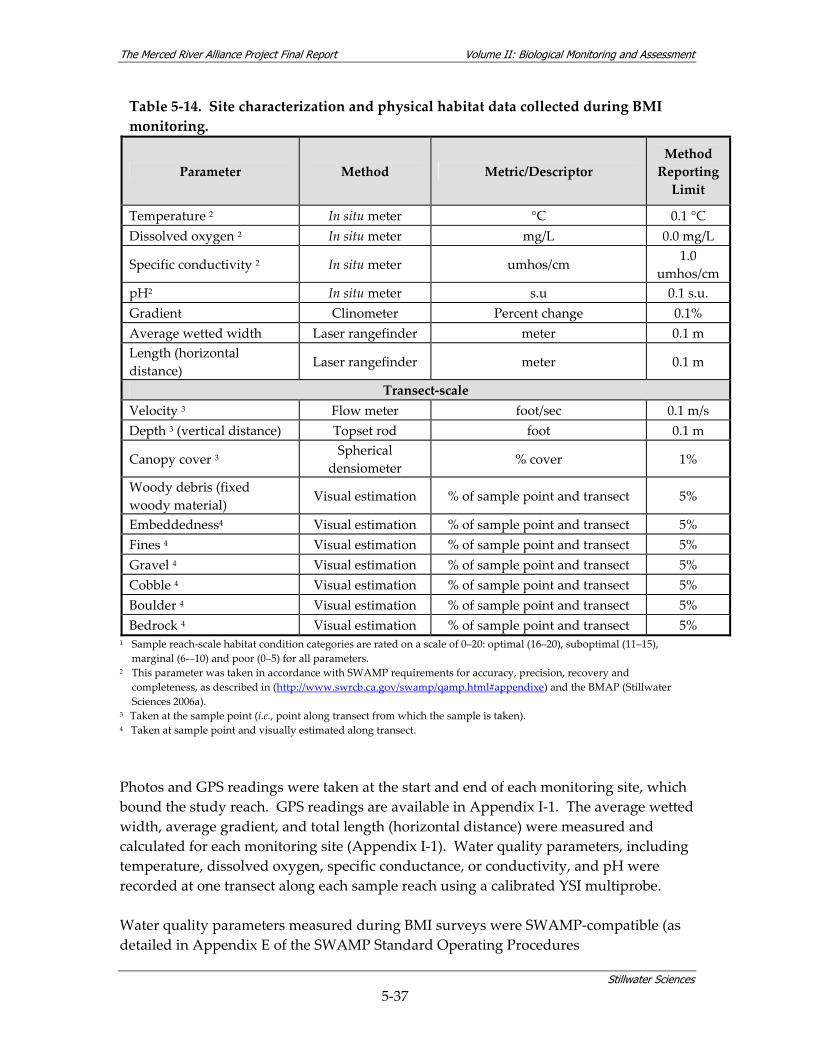
The Merced River Alliance Project Final Report Volume II: Biological Monitoring and Assessment
Stillwater Sciences
5‐37
Table 5‐14. Site characterization and physical habitat data collected during BMI monitoring.
Parameter Method Metric/Descriptor Method Reporting Limit
Temperature 2 In situ meter °C 0.1 °C Dissolved oxygen 2 In situ meter mg/L 0.0 mg/L
Specific conductivity 2 In situ meter umhos/cm 1.0 umhos/cm
pH2 In situ meter s.u 0.1 s.u. Gradient Clinometer Percent change 0.1% Average wetted width Laser rangefinder meter 0.1 m Length (horizontal distance)
Laser rangefinder meter 0.1 m
Transect‐scale Velocity 3 Flow meter foot/sec 0.1 m/s Depth 3 (vertical distance) Topset rod foot 0.1 m
Canopy cover 3 Spherical densiometer % cover 1%
Woody debris (fixed woody material)
Visual estimation % of sample point and transect 5%
Embeddedness4 Visual estimation % of sample point and transect 5% Fines 4 Visual estimation % of sample point and transect 5% Gravel 4 Visual estimation % of sample point and transect 5% Cobble 4 Visual estimation % of sample point and transect 5% Boulder 4 Visual estimation % of sample point and transect 5% Bedrock 4 Visual estimation % of sample point and transect 5%
1 Sample reach‐scale habitat condition categories are rated on a scale of 0–20: optimal (16–20), suboptimal (11–15), marginal (6‐–10) and poor (0–5) for all parameters.
2 This parameter was taken in accordance with SWAMP requirements for accuracy, precision, recovery and completeness, as described in (http://www.swrcb.ca.gov/swamp/qamp.html#appendixe) and the BMAP (Stillwater Sciences 2006a).
3 Taken at the sample point (i.e., point along transect from which the sample is taken). 4 Taken at sample point and visually estimated along transect.
Photos and GPS readings were taken at the start and end of each monitoring site, which bound the study reach. GPS readings are available in Appendix I‐1. The average wetted width, average gradient, and total length (horizontal distance) were measured and calculated for each monitoring site (Appendix I‐1). Water quality parameters, including temperature, dissolved oxygen, specific conductance, or conductivity, and pH were recorded at one transect along each sample reach using a calibrated YSI multiprobe. Water quality parameters measured during BMI surveys were SWAMP‐compatible (as detailed in Appendix E of the SWAMP Standard Operating Procedures
The Merced River Alliance Project Final Report Volume II: Biological Monitoring and Assessment
Stillwater Sciences
5‐38
[http://www.swrcb.ca.gov/swamp/qamp.html#appendixe]) and are available for inclusion in the SWAMP database. In situ water quality data were measured in conjunction with all BMI surveys. Parameters measured included temperature, dissolved oxygen, specific conductivity, and pH (Table 5‐14). The instrument used to collect water quality data (except for pH) was the Yellow Springs Instrument (YSI) 85. Both an Oakton pHTestr 2 probe and EMD ColorpHast low conductivity pH strips were used to measure pH. All instruments were maintained and calibrated according to manufacturer specifications. Dissolved oxygen calibrations were verified using results from standard Winkler titrations conducted before and after field work in an office setting. An example of the YSI 85 calibration data sheet is presented in Appendix E‐7. The multiprobe was placed in the stream slowly and carefully in order to prevent trapped air from affecting the readings. Once submerged, the probe was moved around to dislodge bubbles and given at least 90 seconds to equilibrate before measurements were recorded. Relative percent composition of substrate size, fixed organic matter and macrophytes was visually estimated along each transect at the monitoring site and at the point of benthic sample collection. In addition, at the sample point along each transect, percent canopy cover was estimated using a spherical densiometer, velocity was measured with a flow meter, depth was recorded using a topset rod, and inorganic substrate was classified as fine (< 2 mm), gravel (> 2–16 mm), cobble (> 64–250 mm), boulder (> 250–4000 mm), or bedrock (> 4000 mm). A gravelometer was used to periodically verify substrate size classes during assessments. Finally, physical habitat quality was assessed for each monitoring site using the US EPA’s Rapid Bioassessment Protocols (Barbour et al. 1999). The parameters assessed are summarized in Table 5‐14. Ten habitat variables, such as available cover, embeddedness, channel flow status, and riparian and bank conditions were ranked on a scale of 0 to 20, for a total possible score of 200. For reference, habitat scores of 0 to 50 are considered “poor;” habitat scores of 51 to 100 are considered “marginal;” habitat scores of 101 to 150 are considered “suboptimal;” and scores of 151 to 200 are considered “optimal”(Barbour et al. 1999). These habitat characterizations (e.g., poor, marginal) are based on the written criteria documented in Appendix E‐5. Optimal habitats generally contain a high diversity of habitats, low levels of embeddedness and sediment deposition, stable banks, and a well‐developed riparian zone. Poor habitats are generally channelized and exhibit low habitat diversity, high sediment loads which fill channel bed interstitial spaces, high erosion rates, and narrow or non‐existent riparian corridors. Laboratory Methods At the laboratory, each composite sample was rinsed in a standard No. 35 sieve (0.5 mm [0.0196 in]) and transferred to a tray with twenty, 4‐in2 (25‐cm2) grids. Samples were inspected for the New Zealand Mud Snail and Asian clam and then subsampled using a
The Merced River Alliance Project Final Report Volume II: Biological Monitoring and Assessment
Stillwater Sciences
5‐39
stereomicroscope with magnifications of 10x to 20x. Subsamples were transferred from randomly selected grids to Petri dishes where the BMI were removed indiscriminately and placed in vials containing 70% ethanol and 2% glycerol. In cases where BMI abundance exceeded 100 organisms per grid, half grids were delineated to assure that a minimum of three discreet areas within the tray of benthic material was subsampled. At least 500 BMIs were subsampled from a minimum of three areas of the subsampling tray, but typically five discrete areas were subsampled. If there were more BMIs remaining in the last grid after 500 (± 5%) were archived, then the remaining BMIs were tallied and archived in a separate vial. This was done to assure a reasonably accurate estimate of BMI abundance based on the portion of benthos in the tray that was subsampled. These “extra” BMIs were not included in the taxonomic lists and metric calculations. Estimates of sample abundance were made by extrapolating the total number of organisms subsampled from a delineated area (grids) of the subsampling tray to the total area (total grids) occupied by benthos within the subsampling tray. The debris from the processed grids was placed in a remnant jar and preserved in 70% ethanol for later quality control testing. Subsampled BMIs were identified using standard aquatic BMI identification keys (e.g., Kathman and Brinkhurst 1998, Merritt and Cummins 1996, Stewart and Stark 1993, Thorp and Covich 2001, Wiggins 1996). All organisms retained on a 0.5 mm screen were removed from the subsample and archived in labeled vials with a mixture of 70% ethanol and 2% glycerol. Identification of BMIs was accomplished with the aid of Zeiss Stemi‐2000C stereomicroscopes with Dolan Jenner fiber optic light sources. Identifications were made using anywhere from 6.5x to 100x, or more when necessary. In some cases BMI parts were slide mounted and examined under a compound microscope using 100x or 200x magnification. A standard level one taxonomic effort was used as specified in the Southwest Association of Freshwater Invertebrate Taxonomists (SAFIT) September 2006 first draft (http://www.waterboards.ca.gov/swamp/docs/safit/ste_list.pdf). California tolerance value (CTV) and functional feeding group (FFG) designations were obtained from the California Aquatic Macroinvertebrate Laboratory Network (CAMLnet) short list of taxonomic effort, January 2003 revision. Exceptions to the standard taxonomic effort were made for immature organisms and pupae; in these cases, organisms were identified to the lowest taxonomic resolution possible. The subsampling procedure was supplemented to accommodate an estimate of BMI biovolume. Biovolume measurements were made by calculating the volume of liquid displaced by the subsampled BMIs from each sample prior to sorting by taxon. Initially, ethanol‐preserved BMIs were transferred to water prior to volumetric displacement. However, due to excessive organism degradation, subsampled BMIs were instead transferred to a 35% ethanol solution prior to volumetric displacement measurements. Surface liquid was removed from the BMIs using blotting paper after the BMIs were transferred to a 5.0 ml graduated cylinder. The blotting paper was rolled into a cylinder of suitable diameter to facilitate insertion into the graduated cylinder to the level of the
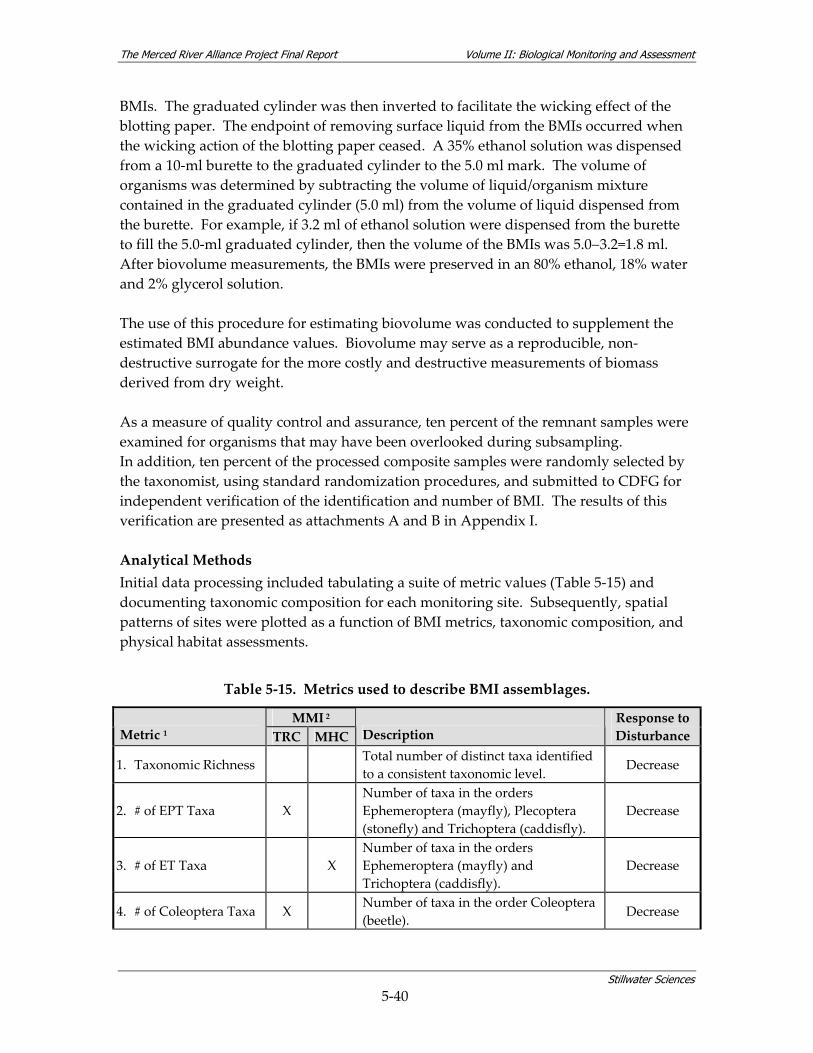
The Merced River Alliance Project Final Report Volume II: Biological Monitoring and Assessment
Stillwater Sciences
5‐40
BMIs. The graduated cylinder was then inverted to facilitate the wicking effect of the blotting paper. The endpoint of removing surface liquid from the BMIs occurred when the wicking action of the blotting paper ceased. A 35% ethanol solution was dispensed from a 10‐ml burette to the graduated cylinder to the 5.0 ml mark. The volume of organisms was determined by subtracting the volume of liquid/organism mixture contained in the graduated cylinder (5.0 ml) from the volume of liquid dispensed from the burette. For example, if 3.2 ml of ethanol solution were dispensed from the burette to fill the 5.0‐ml graduated cylinder, then the volume of the BMIs was 5.0−3.2=1.8 ml. After biovolume measurements, the BMIs were preserved in an 80% ethanol, 18% water and 2% glycerol solution. The use of this procedure for estimating biovolume was conducted to supplement the estimated BMI abundance values. Biovolume may serve as a reproducible, non‐destructive surrogate for the more costly and destructive measurements of biomass derived from dry weight. As a measure of quality control and assurance, ten percent of the remnant samples were examined for organisms that may have been overlooked during subsampling. In addition, ten percent of the processed composite samples were randomly selected by the taxonomist, using standard randomization procedures, and submitted to CDFG for independent verification of the identification and number of BMI. The results of this verification are presented as attachments A and B in Appendix I. Analytical Methods Initial data processing included tabulating a suite of metric values (Table 5‐15) and documenting taxonomic composition for each monitoring site. Subsequently, spatial patterns of sites were plotted as a function of BMI metrics, taxonomic composition, and physical habitat assessments.
Table 5‐15. Metrics used to describe BMI assemblages.
MMI 2 Metric 1 TRC MHC Description
Response to Disturbance
1. Taxonomic Richness Total number of distinct taxa identified to a consistent taxonomic level.
Decrease
2. # of EPT Taxa X Number of taxa in the orders Ephemeroptera (mayfly), Plecoptera (stonefly) and Trichoptera (caddisfly).
Decrease
3. # of ET Taxa X Number of taxa in the orders Ephemeroptera (mayfly) and Trichoptera (caddisfly).
Decrease
4. # of Coleoptera Taxa X Number of taxa in the order Coleoptera (beetle).
Decrease
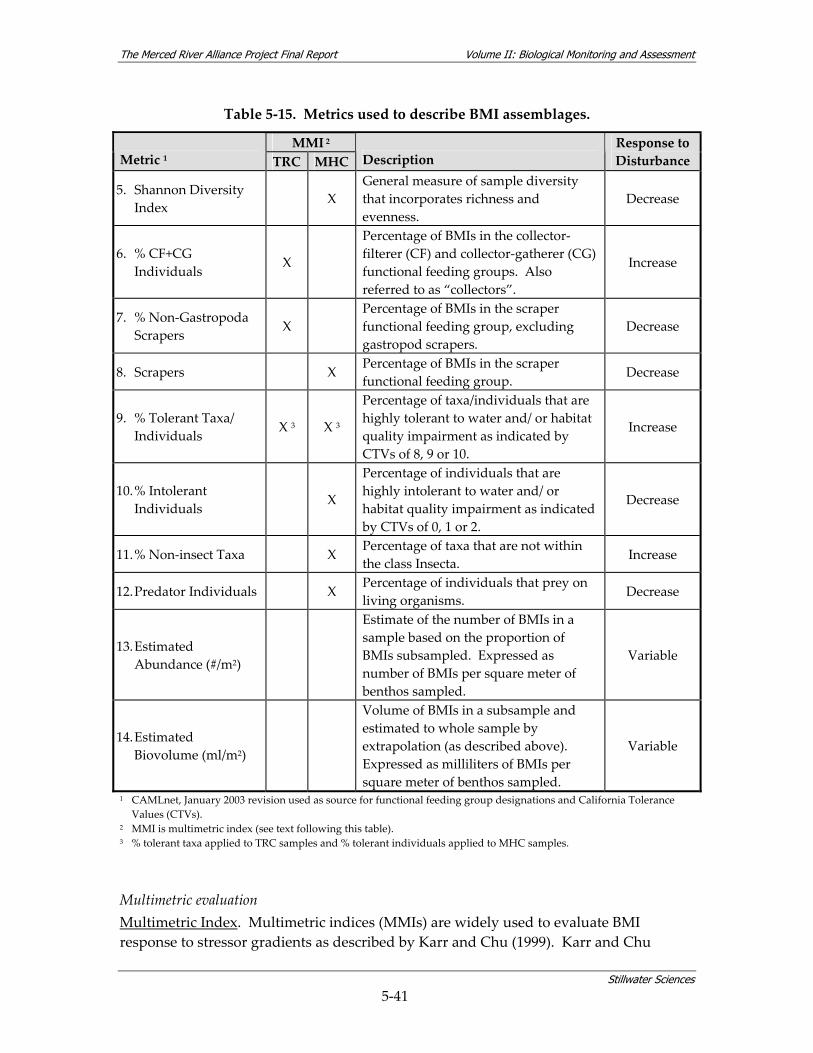
The Merced River Alliance Project Final Report Volume II: Biological Monitoring and Assessment
Stillwater Sciences
5‐41
Table 5‐15. Metrics used to describe BMI assemblages.
MMI 2 Metric 1 TRC MHC Description
Response to Disturbance
5. Shannon Diversity Index
X General measure of sample diversity that incorporates richness and evenness.
Decrease
6. % CF+CG Individuals X
Percentage of BMIs in the collector‐filterer (CF) and collector‐gatherer (CG) functional feeding groups. Also referred to as “collectors”.
Increase
7. % Non‐Gastropoda Scrapers
X Percentage of BMIs in the scraper functional feeding group, excluding gastropod scrapers.
Decrease
8. Scrapers X Percentage of BMIs in the scraper functional feeding group.
Decrease
9. % Tolerant Taxa/ Individuals X 3 X 3
Percentage of taxa/individuals that are highly tolerant to water and/ or habitat quality impairment as indicated by CTVs of 8, 9 or 10.
Increase
10. % Intolerant Individuals X
Percentage of individuals that are highly intolerant to water and/ or habitat quality impairment as indicated by CTVs of 0, 1 or 2.
Decrease
11. % Non‐insect Taxa X Percentage of taxa that are not within the class Insecta.
Increase
12. Predator Individuals X Percentage of individuals that prey on living organisms.
Decrease
13. Estimated Abundance (#/m2)
Estimate of the number of BMIs in a sample based on the proportion of BMIs subsampled. Expressed as number of BMIs per square meter of benthos sampled.
Variable
14. Estimated Biovolume (ml/m2)
Volume of BMIs in a subsample and estimated to whole sample by extrapolation (as described above). Expressed as milliliters of BMIs per square meter of benthos sampled.
Variable
1 CAMLnet, January 2003 revision used as source for functional feeding group designations and California Tolerance Values (CTVs).
2 MMI is multimetric index (see text following this table). 3 % tolerant taxa applied to TRC samples and % tolerant individuals applied to MHC samples.
Multimetric evaluation Multimetric Index. Multimetric indices (MMIs) are widely used to evaluate BMI response to stressor gradients as described by Karr and Chu (1999). Karr and Chu
The Merced River Alliance Project Final Report Volume II: Biological Monitoring and Assessment
Stillwater Sciences
5‐42
identified multiple human activities that contribute to disturbance of aquatic ecosystems, including land use, effluent discharge, water withdrawal, discharge from reservoirs, sport and commercial fisheries, and introduction of exotic species. These human activities subsequently influence flow regime, physical habitat structure, water quality, energy source and biological interactions. The MMI was developed to measure the effects of these stressors on BMI assemblages, using a scale that ranges from 0 (lowest quality relative to reference) to 100 (highest quality relative to reference). For the Merced Alliance study, two MMIs were used to evaluate BMI response to habitat quality throughout the Merced River (Table 5‐14). The first MMI was developed for riffle‐based samples by Rehn et al. (2007a) to evaluate the potential BMI reponse to hydropower projects in Sierra Nevada streams. The riffle‐based MMI was developed using five metrics screened from a larger set of 77 metrics, with the five selected metrics representing distinct attributes of BMI assemblages having high signal‐to‐noise ratios and relatively little redundancy: 1) # of EPT Taxa; 2) # of Coleoptera Taxa; 3) % CF+CG Individuals; 4) % Non‐Gastropoda Scrapers; and 5) % Tolerant Taxa/ Individuals (Table 5‐14) (Rehn et al. 2007a). The second MMI was developed for MHC samples using seven metrics (Table 5‐14) originally screened from 82 metrics having a spatial scale and range of stream orders relevant to the MHC sample type (Rehn 2008): 1) # of ET Taxa; 2) Shannon Diversity Index; 3) Scrapers; 4) % Tolerant Taxa/ Individuals; 5) % Intolerant Individuals; 6) % Non‐insect Taxa; and 7) Predator Individuals. Development of MMI for MHC samples was somewhat limited due to a smaller number of stream sections possessing wadable conditions (Rehn 2008). Nevertheless, the MMI for MHC samples is the most current multimetric analytical tool available for assessing MHC site quality in the Sierra Nevada region of California. Despite the wide use of multimetric approaches for evaluating water and habitat quality, there are limitations to its application for the Merced Alliance study. First, the MMI is dependent on identifying BMIs to a consistent taxonomic level. Consequently, its application to historical data sets can be problematic if there are inconsistencies in taxonomic level between historical and contemporary data sets. In addition, the spatial scale of MMI application is bounded by the elevation range of reference sites used in its development. For watershed scale assessments in California, MMI values assigned to samples from valley and low‐elevation transitional regions should be used for assessing change in BMI assemblages rather than site quality, because there is currently a lack of available reference information for lowland waterbodies in California. Composite Metric Scores. Composite metric scores were also generated for the Merced Alliance BMI data in order to compare historical USGS data (1994 to 1996) to the Merced Alliance BMI data (2006 to 2007). As discussed above, use of the MMI was not possible for the historical data set due to recent changes in the standard level of taxonomic identification. The composite metric score approach is similar to an MMI but lacks the step of assigning a score to an empirically derived range of metric values. Instead, the
The Merced River Alliance Project Final Report Volume II: Biological Monitoring and Assessment
Stillwater Sciences
5‐43
composite metric score approach compares a group of samples on a relative basis by subtracting the value of each sample metric from the grand mean of all sample metrics used in the analysis and then normalizing the values. The formula for computing the composite metric score is as follows:
Composite Metric Score = ∑ ±(xi ‐ xi)/semi Where:
xi = sample value for the i‐th metric within a group of sites xi = grand mean of the samples within a group of sites for the i‐th metric semi = standard error of the mean for the i‐th metric ± = a plus sign denotes a metric that decreases with response to disturbance (e.g.,
EPT taxa) while a minus sign denotes a metric that increases with response to disturbance (e.g., percent tolerant taxa).
The eight metrics used for generating composite metric scores included taxonomic richness, EPT taxa, Coleoptera taxa, Shannon Diversity, percent collectors, percent non‐gastropod scrapers, percent non‐insect taxa, and percent tolerant taxa. The resulting composite metric scores were plotted to show relative differences in sample units as a function of BMI assemblage quality defined by the composite metrics. Multivariate analyses Ordination. Non‐metric multidimensional scaling (NMS) ordination was used to evaluate relative similarity of sample units based on taxonomic composition (McCune and Mefford 2006). In addition, NMS was used to explore relationships between environmental variables and BMI composition. Categorical environmental variables included sample type (MHC and TRC), sampling event (fall 2006, spring/summer 2007 and fall 2007), season (spring/summer and fall), ecological subregion (Figure 5‐4), and river segment (lower and upper). Quantitative variables included elevation, gradient, embeddedness, macrophytes, fixed organic matter, fines, gravel, cobble, boulder, bedrock, habitat score, weighted mean habitat type, specific conductance and canopy. Substrate composition could not be assessed using pebble counts across transects because of unwadable conditions at many sites. As a result, substrate composition was estimated (relative percent; Table 5‐14) with frequent gravelometer calibration at the point of benthic sample collection. Gradient and elevation were log transformed prior to analysis. PC‐ORD version 5 software was used to perform NMS in “autopilot mode”, utilizing the medium thoroughness setting and the Sorensen (Bray‐Curtis) distance measure. Plots of stress versus iteration (scree plots) were evaluated to assure that improvement in fit was achieved with added dimensions and exceeded a cumulative coefficient of determination of 0.6. Correlation Analysis. Pearson product moment correlations were used to explore relationships between habitat variables and biological response variables (metrics).
The Merced River Alliance Project Final Report Volume II: Biological Monitoring and Assessment
Stillwater Sciences
5‐44
Spot and transect scale habitat variables were converted to site mean values and the various habitat types documented at each site were assigned a number (pool = 1, glide = 2, run = 3, riffle = 4 and cascade = 5) so that a weighted mean habitat type could be assigned to each site where a MHC sample was collected. The analysis included generating correlations between habitat variables and biological metrics and selecting those variables with significant (p < 0.001) and moderately strong correlation (|r| > 0.4 ) and reviewing scatterplots for linear or “wedge‐shaped” relationships (Ode et al. 2005). A “wedge‐shaped” relationship would indicate no response across a gradient until a threshold is reached, after which the response variable increases or decreases with magnitude of the habitat variable. Wilcoxon Paired‐sample Test. A Wilcoxon paired‐sample test was applied to evaluate differences between the two sample types collected, MHC and TRC, using a pairwise test design. Metrics associated with richness, diversity, composition, abundance and biovolume were compared using Wilcoxon tests at sites where both MHC and TRC samples were collected for each of the sampling events. The non‐parametric Wilcoxon paired‐sample test was used to evaluate significant differences instead of the parametric paired‐sample t‐test because many of the metrics did not meet assumptions of normality. The Wilcoxon paired‐sample test has 95% of the statistical power as the paired‐sample t‐test (Zar 1984). Mann‐Whitney U‐test. A Mann‐Whitney U‐test was applied to evaluate relative abundance of BMI that fell within the collector‐filterer (CF) functional feeding group (FFG) with respect to New Exchequer Dam (BMI Hypothesis 3). Sites were grouped as follows for testing differences: 1) Merced Falls Reach and Dredger Tailings Reach sites downstream of the foothill reservoirs (n = 25), and 2) Upper Foothills Reach 3 sites immediately upstream of the foothill reservoirs (n = 26). The non‐parametric Mann‐Whitney U‐test test was used to evaluate significant differences instead of the parametric independent t‐test because the metrics did not meet assumptions of normality. The Mann‐Whitney U‐test has 95% of the statistical power as the paired‐sample t‐test (Zar 1984). Kruskal‐Wallis (H‐test). To evaluate taxonomic richness in riffles with respect to elevation (BMI Hypothesis 2), a U‐test was conducted using ecoregion as the predictor variable and both mean total richness and EPT richness as response variables. Data within the foothill region did not meet assumptions of homoscedastic variance, hence the use of this non‐parametric test. All richness metrics were based on the SAFIT level 1 standard taxonomic effort. Samples from riffle habitats were grouped into three elevation/ecoregion categories: 1) Valley ,including all riffle samples downstream of the foothill reservoirs (n=24); 2) Foothill, including all samples within the Upper Foothills reaches plus the LB‐1 site located at 2000 feet elevation (n=32); and 3) all other samples above 610 m (2000 ft) elevation, including the other Lower Batholith sites, Yosemite Valley sites, and the Glaciated Batholith (n=21).
The Merced River Alliance Project Final Report Volume II: Biological Monitoring and Assessment
Stillwater Sciences
5‐45
Historical Comparison. Finally, historical BMI data were evaluated for comparison to BMI data collected for this survey effort. Due to some differences in taxonomic resolution, historical and concurrent taxa lists were standardized to the maximum extent feasible prior to their comparison. Also, sample comparisons using historical data were limited to those with similar sampling methods, net mesh size, and proximity to locations established for this survey effort.
5.2.5 Avian Study Birds are often considered to be ideal study organisms for monitoring and evaluating ecosystem restoration and management (Carignan and Villard 2002), because they respond to changes in the environment over multiple spatial scales (Temple and Weins 1989). The Merced Alliance avian surveys were designed to complement information available from current and ongoing studies (Volume I, Section 5.3.5) and to ensure compatibility with ongoing data collection efforts to the maximum extent possible. This approach was intended to provide further information regarding landbird species currently established in the riparian corridor of the Merced River. It is anticipated that species composition relative to habitat types and use patterns will positively influence the nature of future restoration activities and inform riparian revegetation options throughout the Merced River riparian corridor. While all species observed during avian monitoring activities were recorded, the standard methods presented here underrepresent some species such as nocturnal birds or raptors. Although included among the species of concern found in the Merced River watershed (Appendix C, Table C‐1), nocturnal birds and raptors can not be adequately surveyed for abundance or density without special surveys or nest searches, which were beyond the scope of this study plan. Descriptive statistics are reported for these species if they were observed; however, discussion of trends or analysis of inter‐site differences for these species was not possible. 5.2.5.1 Objectives The objectives of the baseline avian monitoring were to: 1) document avian community species composition (native and non‐native) and relative abundance in the Merced River riparian corridor during the breeding season (as the primary focus) and during the fall migration and winter season (as the secondary focus); 2) evaluate the influence of riparian vegetation patch size, composition, and structure on the species composition and distribution of bird species nesting in the corridor; 3) provide baseline data to be integrated with ongoing surveys conducted on the San Joaquin, Tuolumne, and Sacramento rivers; and 4) address specific avian hypotheses, as detailed in the next section. The relationships between bird species abundance and vegetation characteristics were also investigated.
The Merced River Alliance Project Final Report Volume II: Biological Monitoring and Assessment
Stillwater Sciences
5‐46
5.2.5.2 Hypotheses Avian hypotheses developed for the avian surveys focus on the relationship between habitat variables at different spatial scales and avian species diversity and relative abundance. The avian hypotheses incorporate observations and findings detailed in the Riparian Bird Conservation Plan (RHJV 2004), Siegel and DeSante (2003), Heath and Ballard (2003), Spautz et al. (2006), and Nur et al. (2008). As detailed in Section 4 addressing the following hypotheses was a secondary goal of the Merced Alliance biological assessment monitoring, with collection of contemporary baseline data for fish, avian, and BMI species as the goal.
1. Adjacent landscape characteristics (e.g., agriculture, industrial mining, urban development,) along the upper and lower segments of the Merced River are relatively less important to songbird species occurrence than species‐specific vegetation composition (e.g., tree species richness, understory layer) of the local riparian patch.
2. In each river segment (lower and upper) diversity of obligate riparian species will be positively related to riparian zone width and the percentage of riparian vegetation cover in the landscape (versus upland or other vegetation types) within a site.
3. In the lower Merced River corridor, overall bird species diversity and relative abundance for a suite of focal species will be greater in habitats possessing a well‐developed shrub layer (e.g., blackberry, mugwort and other vegetation between 0.5 and 5 m from the ground) than in those having a simple overstory canopy structure (e.g., cottonwood, valley oak) without an understory layer.
4. In the upper segment of the Merced River, bird species diversity and relative abundance will be greater in riparian habitats located within a matrix of Montane Chaparral habitats that have recently experienced fire (within 1–2 years).
5.2.5.3 Methods The avian sampling design is summarized in Table 5‐16 and described in more detail in the remainder of this section. Standardized methodologies for monitoring landbirds (Ralph et al. 1993, Nur et al. 1999) were used to assess avian community species composition and distribution in the Merced River corridor. Use of standardized methods allows for baseline data to be integrated with recent or ongoing surveys conducted by PRBO on nearby rivers such as the Cosumnes (Nur et al. 2006), the San Joaquin (Cormier et al. 2006, Howell and Dettling 2007), the Mokelumne (Pfeffer et al. 2006), and the Tuolumne (Wood and Nur 2006) (Avian Objective 3). Point counts were used to estimate avian community species abundance and composition during the breeding season, while area searches (a modified point count method) were used during migration and over‐wintering periods. Site reconnaissance during 2006 indicated that mist netting was not the most cost‐effective tool for assessing avian demographics in the
The Merced River Alliance Project Final Report Volume II: Biological Monitoring and Assessment
Stillwater Sciences
5‐47
Merced River watershed. While site dimensions and canopy structure at several monitoring sites were adequate to accommodate proper deployment and alignment of the recommended 8–12 mist nets (Ralph et al. 1993), observed avian density likely would not have supported the necessary capture rate of approximately two birds per net per day. Instead, observations of nests and nesting behavior (e.g., food and/or material carry, territorial display, dependent fledglings) were recorded during spring point count surveys to obtain baseline information on breeding status. Avian habitat relationships were assessed at both the local riparian patch scale and the landscape scale. Local‐scale data were collected using relevé vegetation assessment plots, which consisted of a 50‐m radius circular plot centered on an established point count station. Landscape‐scale data were gathered using geo‐referenced vegetation and environmental data layers obtained from existing sources and manipulated in a GIS environment for further analysis. While the avian point count surveys were designed to be conducted throughout the Merced River watershed a minimum of three times during each breeding season for 2006 and 2007 (Stillwater Sciences 2006a), heavy rains, high river flows, flooding of survey areas, and other scheduling conflicts caused the 2006 breeding season surveys to commence several weeks later than originally anticipated. For this reason, each spring 2006 site was visited twice, with the exception of three sites along the upper river segment (YV‐A3, UGB‐A1, UGB‐A2) that were visited only once and two sites (UF2‐A1 and LB‐A1) that were not visited until 2007 due to weather, scheduling, and/or access conflicts (Table 5‐16, Figure 5‐7). However, these sites were visited during fall area searches and were sampled during the 2007 breeding season. All point count sites were surveyed three times in 2007. Area searches were designed to be conducted in both the lower and upper segments of the Merced River corridor during the fall (August–October) and in the lower segment during the winter (November–March; Stillwater Sciences 2006a). Since mist netting was ultimately not included as part of avian monitoring, due to a low probability of the required capture rate, the frequency of visits to the fall and winter area search locations was increased to two to four visits for each monitoring site (Table 5‐16). Avian monitoring sites were chosen throughout the watershed using the following criteria:
1. To encompass a variety of habitat conditions and adjacent land uses; 2. To be accessible; and 3. To take advantage of existing avian survey data where available.
The majority of land in the lower Merced River corridor is privately owned (Stillwater Sciences 2002), and property access permission is difficult to obtain when special‐status species may be involved. For this reason, publicly‐owned sites were chosen for

The Merced River Alliance Project Final Report Volume II: Biological Monitoring and Assessment
Stillwater Sciences
5‐48
sampling in the lower Merced River corridor wherever possible. Privately owned sites were included as well, with their availability for sampling dependent on landowner access agreements. The upper portion of the watershed is predominantly managed by U.S. Forest Service and National Park Service (agencies which have formal application procedures for scientific collector permits) (Figure 3‐1) and thus monitoring sites were consistently available for surveys.
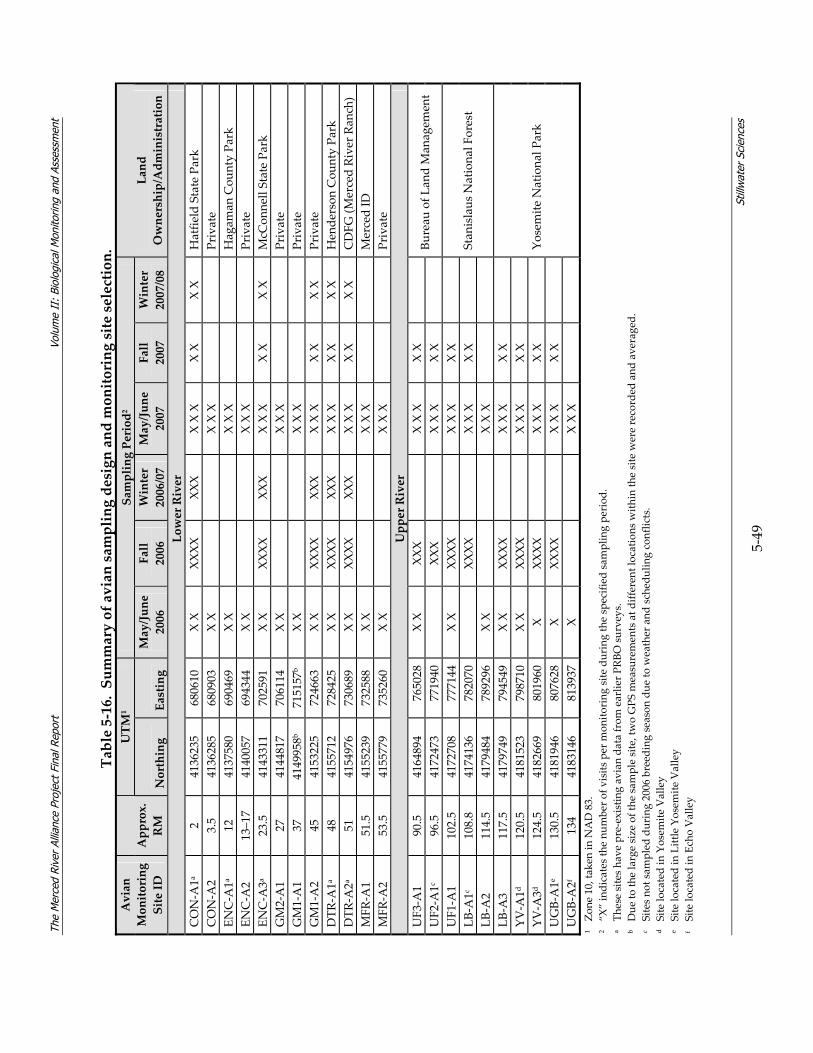
The
Mer
ced
Rive
r Al
lianc
e Pr
ojec
t Fin
al R
epor
t Vo
lum
e II
: Bi
olog
ical
Mon
itorin
g an
d As
sess
men
t
Still
wat
er S
cien
ces
5‐49
Table 5‐16. Summary of avian sampling design and monitoring site selection.
UTM
1Sampling Period
2 Avian
Monitoring
Site ID
Approx.
RM
Northing
Easting
May/June
2006
Fall
2006
Winter
2006/07
May/June
2007
Fall
2007
Winter
2007/08
Land
Ownership/Administration
Lower River
CON‐A
1a
2 4136235
680610
X X
XXXX
XXX
X X X
X X
X X
Hatfie
ld State Park
CON‐A
2 3.5
4136285
680903
X X
X X X
Private
ENC‐A
1a
12
4137580
690469
X X
X X X
Hagam
an Cou
nty Pa
rk
ENC‐A
2 13–17
4140057
694344
X X
X X X
Private
ENC‐A
3a
23.5
4143311
702591
X X
XXXX
XXX
X X X
X X
X X
McC
onnell State Pa
rk
GM2‐A1
27
4144817
706114
X X
X X X
Private
GM1‐A1
37
4149958b
715157
b X X
X X X
Private
GM1‐A2
45
4153225
724663
X X
XXXX
XXX
X X X
X X
X X
Private
DTR‐A
1a
48
4155712
728425
X X
XXXX
XXX
X X X
X X
X X
Hende
rson Cou
nty Pa
rk
DTR‐A
2a
51
4154976
730689
X X
XXXX
XXX
X X X
X X
X X
CDFG (M
erced River R
anch)
MFR‐A
1 51.5
4155239
732588
X X
X X X
Merced ID
MFR‐A
2 53.5
4155779
735260
X X
X X X
Private
Upper River
UF3‐A
1 90.5
4164894
765028
X X
XXX
X X X
X X
UF2‐A
1c
96.5
4172473
771940
XX
X
X X X
X X
Bu
reau of L
and Man
agem
ent
UF1‐A
1 102.5
4172708
777144
X X
XXXX
X X X
X X
LB‐A
1c
108.8
4174136
782070
XX
XX
X X X
X X
LB‐A
2 114.5
4179484
789296
X X
X X X
Stan
islaus N
ationa
l Forest
LB‐A
3 117.5
4179749
794549
X X
XXXX
X X X
X X
YV‐A
1d
120.5
4181523
798710
X X
XXXX
X X X
X X
YV‐A
3d
124.5
4182669
801960
X
XXXX
X X X
X X
UGB‐A1e
130.5
4181946
807628
X
XXXX
X X X
X X
UGB‐A2f
134
4183146
813937
X
X X X
Yosemite N
ationa
l Park
1 Zo
ne 10, ta
ken in N
AD 83.
2 “X
” indicates the nu
mber o
f visits per m
onito
ring site during the specified sam
pling pe
riod
.
a T
hese sites ha
ve pre‐existing avian da
ta from earlier P
RBO surveys.
b Due to th
e large size of the sa
mple site, two GPS m
easurements at d
ifferent locations w
ithin th
e site w
ere recorded and averaged.
c Sites no
t sam
pled during 2006 breed
ing season due to w
eather and sched
uling conflicts.
d Site lo
cated in Yosem
ite Valley
e Site lo
cated in Little Yosem
ite Valley
f Site lo
cated in Echo Valley
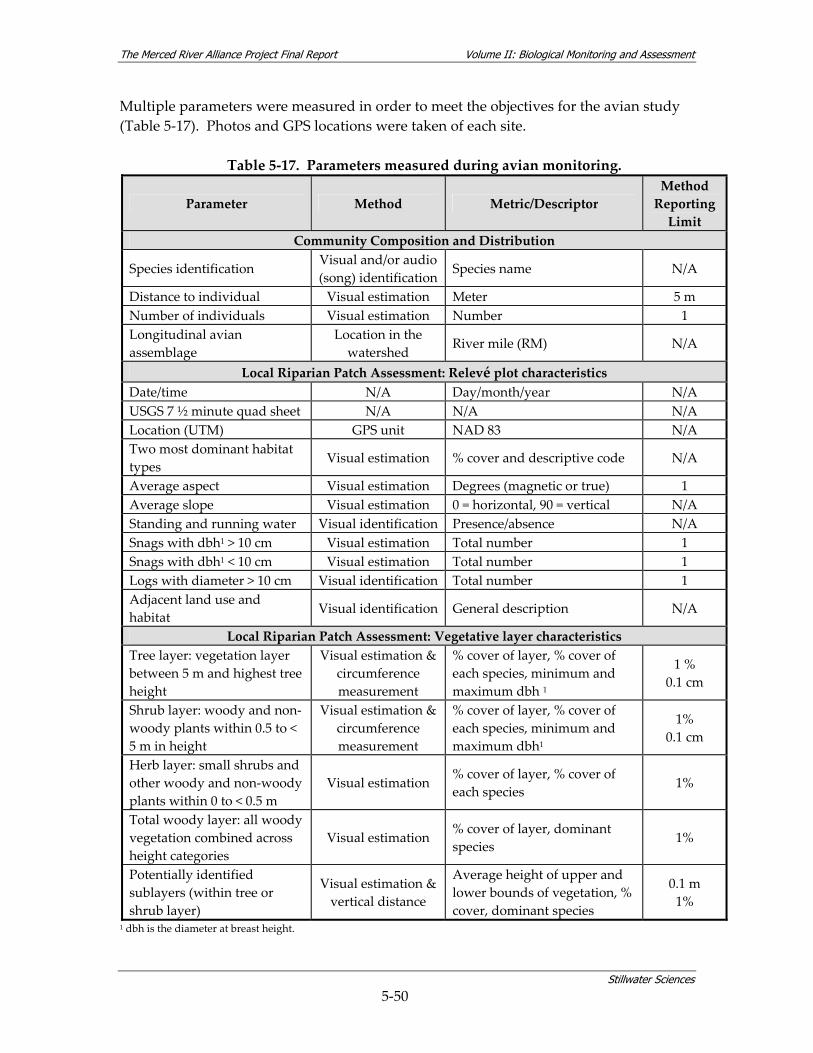
The Merced River Alliance Project Final Report Volume II: Biological Monitoring and Assessment
Stillwater Sciences
5‐50
Multiple parameters were measured in order to meet the objectives for the avian study (Table 5‐17). Photos and GPS locations were taken of each site.
Table 5‐17. Parameters measured during avian monitoring.
Parameter Method Metric/Descriptor Method Reporting Limit
Community Composition and Distribution
Species identification Visual and/or audio (song) identification
Species name N/A
Distance to individual Visual estimation Meter 5 m Number of individuals Visual estimation Number 1 Longitudinal avian assemblage
Location in the watershed
River mile (RM) N/A
Local Riparian Patch Assessment: Relevé plot characteristics Date/time N/A Day/month/year N/A USGS 7 ½ minute quad sheet N/A N/A N/A Location (UTM) GPS unit NAD 83 N/A Two most dominant habitat types
Visual estimation % cover and descriptive code N/A
Average aspect Visual estimation Degrees (magnetic or true) 1 Average slope Visual estimation 0 = horizontal, 90 = vertical N/A Standing and running water Visual identification Presence/absence N/A Snags with dbh1 > 10 cm Visual estimation Total number 1 Snags with dbh1 < 10 cm Visual estimation Total number 1 Logs with diameter > 10 cm Visual identification Total number 1 Adjacent land use and habitat Visual identification General description N/A
Local Riparian Patch Assessment: Vegetative layer characteristics Tree layer: vegetation layer between 5 m and highest tree height
Visual estimation & circumference measurement
% cover of layer, % cover of each species, minimum and maximum dbh 1
1 % 0.1 cm
Shrub layer: woody and non‐woody plants within 0.5 to < 5 m in height
Visual estimation & circumference measurement
% cover of layer, % cover of each species, minimum and maximum dbh1
1% 0.1 cm
Herb layer: small shrubs and other woody and non‐woody plants within 0 to < 0.5 m
Visual estimation % cover of layer, % cover of each species
1%
Total woody layer: all woody vegetation combined across height categories
Visual estimation % cover of layer, dominant species
1%
Potentially identified sublayers (within tree or shrub layer)
Visual estimation & vertical distance
Average height of upper and lower bounds of vegetation, % cover, dominant species
0.1 m 1%
1 dbh is the diameter at breast height.
The Merced River Alliance Project Final Report Volume II: Biological Monitoring and Assessment
Stillwater Sciences
5‐51
Field Methods Detailed quality assurance and quality control (QA/QC) measures for the Merced Alliance biological monitoring are discussed in the BMAP (Stillwater Sciences 2006a). For avian monitoring, PRBO biologists recorded all field survey information on datasheets, which were entered into a database immediately following each monitoring visit. PRBO biologists followed data entry and QA/QC procedures outlined in the Palomarin Handbook (PRBO 2004, also available in Appendix C‐2). Specific monitoring methods are described below. Point counts The point count is a survey method used to generate information on the yearly changes of bird populations at fixed points, differences in species composition between habitat types, and abundance patterns of species. It is an efficient and data‐rich method for bird surveys (Nur et al. 1999) and as such has been adopted for use by US Fish and Wildlife Service as the standardized approach for monitoring landbirds (Ralph et al. 1993). Point counts involve an observer standing in one spot and recording all birds seen or heard at either a fixed distance or an unlimited distance. Counting may be repeated many times at a given point. In 2006 and 2007, a minimum of three and a maximum of 14 point count stations were established at each avian monitoring site (Appendix J, Table J‐1). Each sampling station was separated by at least 200 m (656 ft) to avoid point count overlap and census bias (Ralph et al. 1993; Figure 5‐8). Each point was surveyed by trained biologists with experience in the identification of Western U.S. bird species by sight, song, and call. Point locations were surveyed on one, two or three mornings, at least ten days apart (see Appendix J, Table J‐1 for survey dates for each monitoring site). A total of 190 point count stations were established at 22 monitoring sites (Figure 5‐7). At each sampling station, the Variable Circular Plot (VCP) method (Figure 5‐8) was used to delineate a 360° plot, with the observer at the center or “point.” Within the VCP, the distance to each detection (variable) was recorded as follows: within 10 m (33 ft) of the observer, from 10 to 20 m (33 to 66 ft), from 20 to 30 m (66 to 98 ft), from 30 to 40 m (98 to 131 ft), from 40 to 50 m (131 to 164 ft), from 50 to 75 m (165 to 248 ft), and from 75 to 100 m (248 to 330 ft). Detections beyond 100 m (330 ft) were also noted. The distance recorded was the distance from the point count station to the first location an individual bird was observed, measured to the point at which a plumb line would hit the ground if hung from the location at which the bird was observed. This distance was measured as though a tape were laid across the ground, including any intervening topographic features. Birds that were flying over but not using the habitat at the site were recorded as “fly‐overs.” Birds observed foraging aerially over the plot were counted (e.g., foraging raptors and swallows).
The Merced River Alliance Project Final Report Volume II: Biological Monitoring and Assessment
Stillwater Sciences
5‐52
Point counts lasted five minutes per station. Surveys were conducted during peak singing hours from local sunrise until no later than four hours past sunrise. Behavioral cues that alerted the observer to the individual bird were recorded, as well as indications of breeding status. Every effort was made to avoid double‐counting individuals. Juvenile birds were recorded as such and were excluded from analyses. No attracting devices or recordings were used. Point count surveys were not conducted during poor weather conditions, such as high winds or rain, when probability of detection was reduced. Area searches The area search method consists of a series of three 20‐minute counts in which the observer moves through a defined area. With this method, quiet birds can be identified, especially as birds vocalize less during the non‐breeding season. As shown in Figure 5‐9 the sampling sites were delineated to provide three separate search areas (or plots), each approximately 0.03 km2 (7.4 acres) in forest or dense woodland, and 0.1 km2 (27.7 acres) or greater in more open habitats (Ralph et al. 1993). Area searches were conducted during fall migration from August through October at 13 sites (Appendix J, Table J‐1). Area searches were carried out no later than four hours after dawn. Periodically, the search areas were sampled in the reverse direction to avoid bias due to temporal changes in bird activity levels. Numbers of birds of each species seen or heard were recorded during the 20‐minute search period. When observed, birds outside the search area, or flying over but not using the habitat within the search area, were recorded separately. Local riparian patch assessment using relevé plots Relevé plots provide information on vegetation, habitat associations, and major vegetation structural characteristics (Table 5‐17) that have a relationship with bird feeding and nesting requirements (Ralph et al. 1993). As shown in the Appendix E‐6 example datasheet, habitat features and other vegetation characteristics were recorded during relevé Merced Alliance plot sampling. The relevé plots consisted of a 50‐m (164‐feet) radius circle centered on a point count station. Relevé plot sampling was conducted following morning point counts and occurred once during the May through June survey period in 2006 or 2007. Riparian width measurement Riparian zone width was measured at each point count station using hand‐held range finders. Points with riparian widths greater than 100 m, or where on‐the‐ground measurement was not feasible due to lack of visibility, were measured using GIS and aerial imagery. Width was measured using a length of imaginary line running perpendicular to the river, from one edge of the riparian area, through the center of the point count station, to the opposite edge of the riparian area. The edge of the riparian area was defined as the point when non‐riparian communities were encountered, or

The Merced River Alliance Project Final Report Volume II: Biological Monitoring and Assessment
Stillwater Sciences
5‐53
where riparian plant species no longer constituted at least 25 % of the vegetation cover. If riparian vegetation was present on the opposite bank of the river, it was also included in the overall riparian width measurement, and the width of the river not covered by overhanging vegetation was subtracted. Analytical Methods Point count and area search data were analyzed to generate species lists, characterize species distribution (including comparisons of bird presence/absence among sites), develop community‐level metrics such as species richness and diversity, and population‐level metrics such as species relative abundance. Additionally, point count data were analyzed to determine associations with vegetation, habitat and landscape characteristics. Species richness and diversity Species richness is defined as the number of species detected within 50 m (164 ft) for point count data or within the area search plot for area search data, per defined time period. Species diversity measures the number of species detected within the 50 m (164 ft) radius for point count data or within the area search plot for area search data, weighted by the proportion of individuals of each species. A high value indicates high ecological (species) diversity. Species diversity is measured using a transformation of the usual Shannon‐Weiner index, which is symbolized by Hʹ (also called Shannon‐Weaver index or Shannon index; Krebs 1989). This transformed index, which was introduced by MacArthur (1965), is N1 where N1 = eHʹ. The advantage of N1 over Hʹ is that N1 is measured in terms of species, whereas Hʹ is measured in terms of bits of information (Nur et al. 1999). Thus, N1 is more easily interpreted, and species diversity (measured as N1) and richness can be directly compared.
N1 = e 'H and ∑=
=S
1ii )1)()(ln( 'H
i-pp
Where: S = total species richness pi = the proportion of the total number of individuals for the ith species.
Statistical analyses of species diversity were carried out using STATA 10.0 (StataCorp. 2008). Shannon index of diversity was calculated using data from all visits for each point in each year. The analysis used mean Shannon index of diversity per point, calculated over the two years of data collected. No data transformation was necessary (normality confirmed with qnorm procedure in STATA; Nur et al. 1999). Shannon index of diversity for area search data was calculated by site using data from all subplots and all visits across all years.
The Merced River Alliance Project Final Report Volume II: Biological Monitoring and Assessment
Stillwater Sciences
5‐54
Abundance and selection of avian focal species In addition to focusing on the community‐level metrics (e.g., species richness and diversity) included in the avian study objectives (Section 5.2.5.1), the analysis approach for the Merced Alliance avian study component included population‐level parameters, such as breeding season abundance and distribution, for individual focal species. While data were collected for all bird species observed, a group of 14 focal bird species (Table 5‐18) was selected to represent the bird community as a whole and to infer relationships about overall avian abundance. From these 14 focal species we selected a subset of species best suited for each type of analysis. Criteria for selecting focal bird species for each analysis included: 1) providing sufficient sample size for statistical analysis, 2) having particular management concern (e.g., California Partners in Flight focal species, nuisance species), 3) collectively spanning a range of life history traits, and 4) detected in upper and lower segments of the Merced River (for analyses including all monitoring sites). An abundance index was calculated for each focal species as the mean number of detections within the 50 m (164 ft) radius of the point count plot, following methodology in Nur et al. (1999), Spautz et al. (2006), and Nur et al. (2008). While the BMAP (Stillwater Sciences 2006a) included the potential for building detection models using distance sampling methods (Buckland et al. 2001), there were insufficient detections during the four to five rounds of point counts conducted between 2006 and 2007 to satisfy the requirements of a detection probability analysis (Nur et al. 1997, Buckland et al. 2001). In the absence of data to support this type of analysis, the Merced Alliance avian point count information for the 14 focal species was limited to detections within 50 m (164 ft) following recommendations in Ralph et al. (1993) and allowing for comparison with other bird studies (Avian Objective 3). Detections beyond 50 m were used when summarizing raptor results and for generating overall species lists. Statistical analysis of abundance was undertaken following Nur et al. (2008), using the natural log of the mean detections per hectare per survey plus a constant “c”, where “c” was added to prevent taking the log of zero and equals the smallest positive value observed for the variable (Nur et al. 1999). A log transformation was used to normalize residuals.
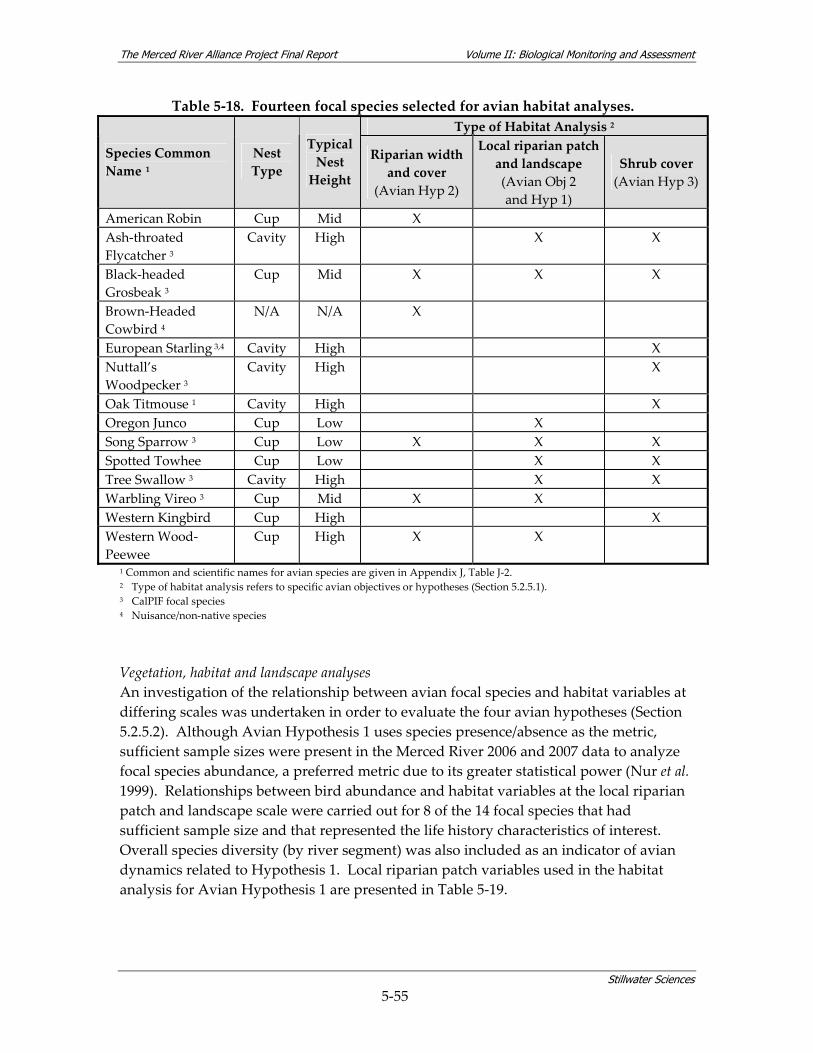
The Merced River Alliance Project Final Report Volume II: Biological Monitoring and Assessment
Stillwater Sciences
5‐55
Table 5‐18. Fourteen focal species selected for avian habitat analyses. Type of Habitat Analysis 2
Species Common Name 1
Nest Type
Typical Nest Height
Riparian width and cover
(Avian Hyp 2)
Local riparian patch and landscape (Avian Obj 2 and Hyp 1)
Shrub cover (Avian Hyp 3)
American Robin Cup Mid X Ash‐throated Flycatcher 3
Cavity High X X
Black‐headed Grosbeak 3
Cup Mid X X X
Brown‐Headed Cowbird 4
N/A N/A X
European Starling 3,4 Cavity High X Nuttall’s Woodpecker 3
Cavity High X
Oak Titmouse 1 Cavity High X Oregon Junco Cup Low X Song Sparrow 3 Cup Low X X X Spotted Towhee Cup Low X X Tree Swallow 3 Cavity High X X Warbling Vireo 3 Cup Mid X X Western Kingbird Cup High X Western Wood‐Peewee
Cup High X X
1 Common and scientific names for avian species are given in Appendix J, Table J‐2. 2 Type of habitat analysis refers to specific avian objectives or hypotheses (Section 5.2.5.1). 3 CalPIF focal species 4 Nuisance/non‐native species
Vegetation, habitat and landscape analyses An investigation of the relationship between avian focal species and habitat variables at differing scales was undertaken in order to evaluate the four avian hypotheses (Section 5.2.5.2). Although Avian Hypothesis 1 uses species presence/absence as the metric, sufficient sample sizes were present in the Merced River 2006 and 2007 data to analyze focal species abundance, a preferred metric due to its greater statistical power (Nur et al. 1999). Relationships between bird abundance and habitat variables at the local riparian patch and landscape scale were carried out for 8 of the 14 focal species that had sufficient sample size and that represented the life history characteristics of interest. Overall species diversity (by river segment) was also included as an indicator of avian dynamics related to Hypothesis 1. Local riparian patch variables used in the habitat analysis for Avian Hypothesis 1 are presented in Table 5‐19.
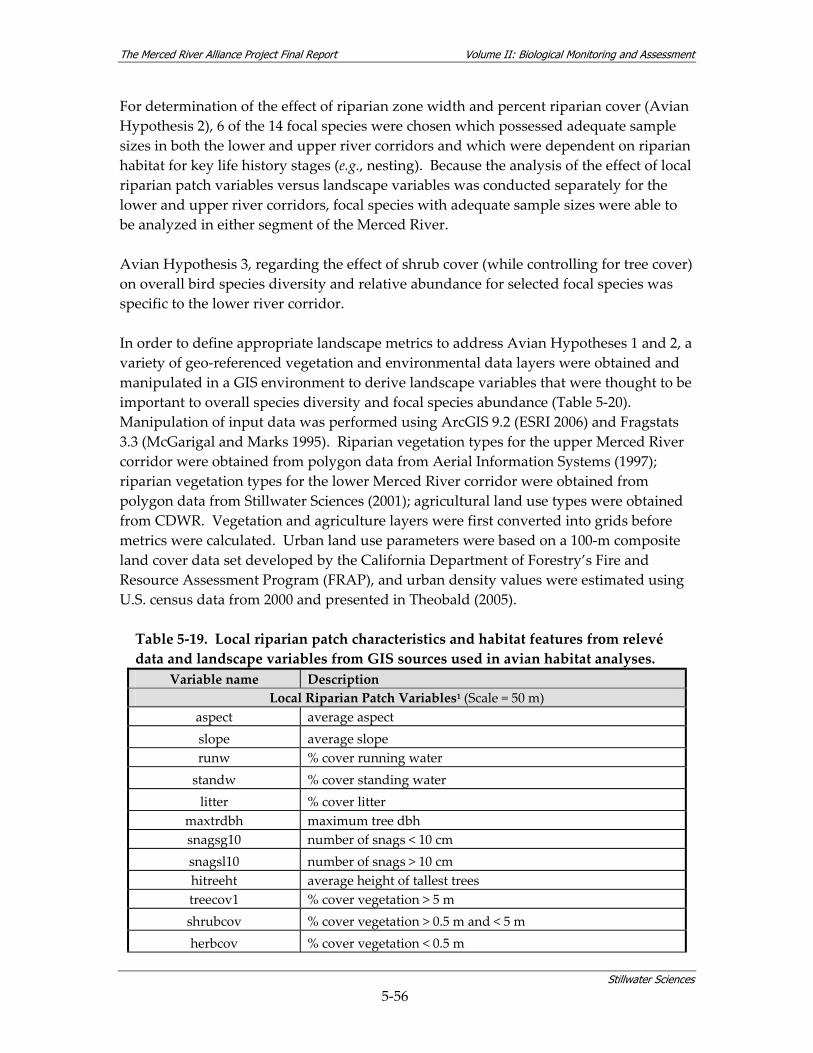
The Merced River Alliance Project Final Report Volume II: Biological Monitoring and Assessment
Stillwater Sciences
5‐56
For determination of the effect of riparian zone width and percent riparian cover (Avian Hypothesis 2), 6 of the 14 focal species were chosen which possessed adequate sample sizes in both the lower and upper river corridors and which were dependent on riparian habitat for key life history stages (e.g., nesting). Because the analysis of the effect of local riparian patch variables versus landscape variables was conducted separately for the lower and upper river corridors, focal species with adequate sample sizes were able to be analyzed in either segment of the Merced River. Avian Hypothesis 3, regarding the effect of shrub cover (while controlling for tree cover) on overall bird species diversity and relative abundance for selected focal species was specific to the lower river corridor. In order to define appropriate landscape metrics to address Avian Hypotheses 1 and 2, a variety of geo‐referenced vegetation and environmental data layers were obtained and manipulated in a GIS environment to derive landscape variables that were thought to be important to overall species diversity and focal species abundance (Table 5‐20). Manipulation of input data was performed using ArcGIS 9.2 (ESRI 2006) and Fragstats 3.3 (McGarigal and Marks 1995). Riparian vegetation types for the upper Merced River corridor were obtained from polygon data from Aerial Information Systems (1997); riparian vegetation types for the lower Merced River corridor were obtained from polygon data from Stillwater Sciences (2001); agricultural land use types were obtained from CDWR. Vegetation and agriculture layers were first converted into grids before metrics were calculated. Urban land use parameters were based on a 100‐m composite land cover data set developed by the California Department of Forestry’s Fire and Resource Assessment Program (FRAP), and urban density values were estimated using U.S. census data from 2000 and presented in Theobald (2005). Table 5‐19. Local riparian patch characteristics and habitat features from relevé data and landscape variables from GIS sources used in avian habitat analyses.
Variable name Description Local Riparian Patch Variables1 (Scale = 50 m)
aspect average aspect slope average slope runw % cover running water standw % cover standing water litter % cover litter
maxtrdbh maximum tree dbh snagsg10 number of snags < 10 cm snagsl10 number of snags > 10 cm hitreeht average height of tallest trees treecov1 % cover vegetation > 5 m shrubcov % cover vegetation > 0.5 m and < 5 m herbcov % cover vegetation < 0.5 m
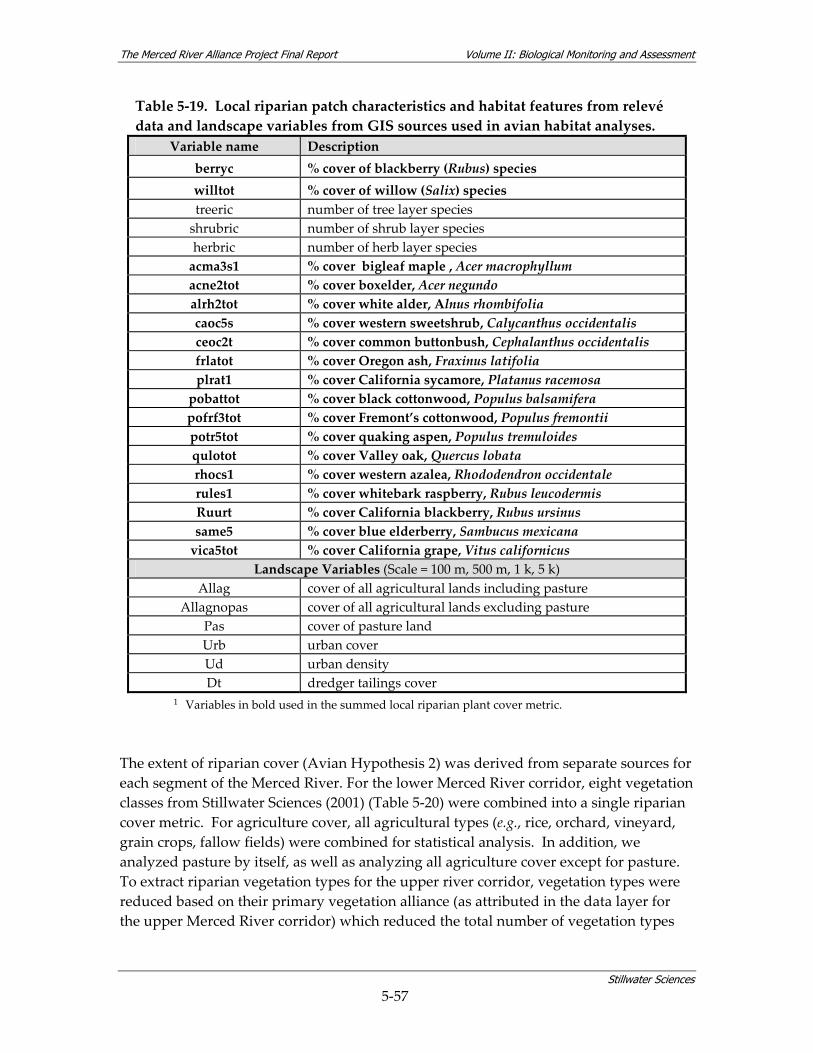
The Merced River Alliance Project Final Report Volume II: Biological Monitoring and Assessment
Stillwater Sciences
5‐57
Table 5‐19. Local riparian patch characteristics and habitat features from relevé data and landscape variables from GIS sources used in avian habitat analyses.
Variable name Description berryc % cover of blackberry (Rubus) species willtot % cover of willow (Salix) species treeric number of tree layer species shrubric number of shrub layer species herbric number of herb layer species acma3s1 % cover bigleaf maple , Acer macrophyllum acne2tot % cover boxelder, Acer negundo alrh2tot % cover white alder, Alnus rhombifolia caoc5s % cover western sweetshrub, Calycanthus occidentalis ceoc2t % cover common buttonbush, Cephalanthus occidentalis frlatot % cover Oregon ash, Fraxinus latifolia plrat1 % cover California sycamore, Platanus racemosa pobattot % cover black cottonwood, Populus balsamifera pofrf3tot % cover Fremont’s cottonwood, Populus fremontii potr5tot % cover quaking aspen, Populus tremuloides qulotot % cover Valley oak, Quercus lobata rhocs1 % cover western azalea, Rhododendron occidentale rules1 % cover whitebark raspberry, Rubus leucodermis Ruurt % cover California blackberry, Rubus ursinus same5 % cover blue elderberry, Sambucus mexicana vica5tot % cover California grape, Vitus californicus
Landscape Variables (Scale = 100 m, 500 m, 1 k, 5 k) Allag cover of all agricultural lands including pasture
Allagnopas cover of all agricultural lands excluding pasture Pas cover of pasture land Urb urban cover Ud urban density Dt dredger tailings cover
1 Variables in bold used in the summed local riparian plant cover metric. The extent of riparian cover (Avian Hypothesis 2) was derived from separate sources for each segment of the Merced River. For the lower Merced River corridor, eight vegetation classes from Stillwater Sciences (2001) (Table 5‐20) were combined into a single riparian cover metric. For agriculture cover, all agricultural types (e.g., rice, orchard, vineyard, grain crops, fallow fields) were combined for statistical analysis. In addition, we analyzed pasture by itself, as well as analyzing all agriculture cover except for pasture. To extract riparian vegetation types for the upper river corridor, vegetation types were reduced based on their primary vegetation alliance (as attributed in the data layer for the upper Merced River corridor) which reduced the total number of vegetation types
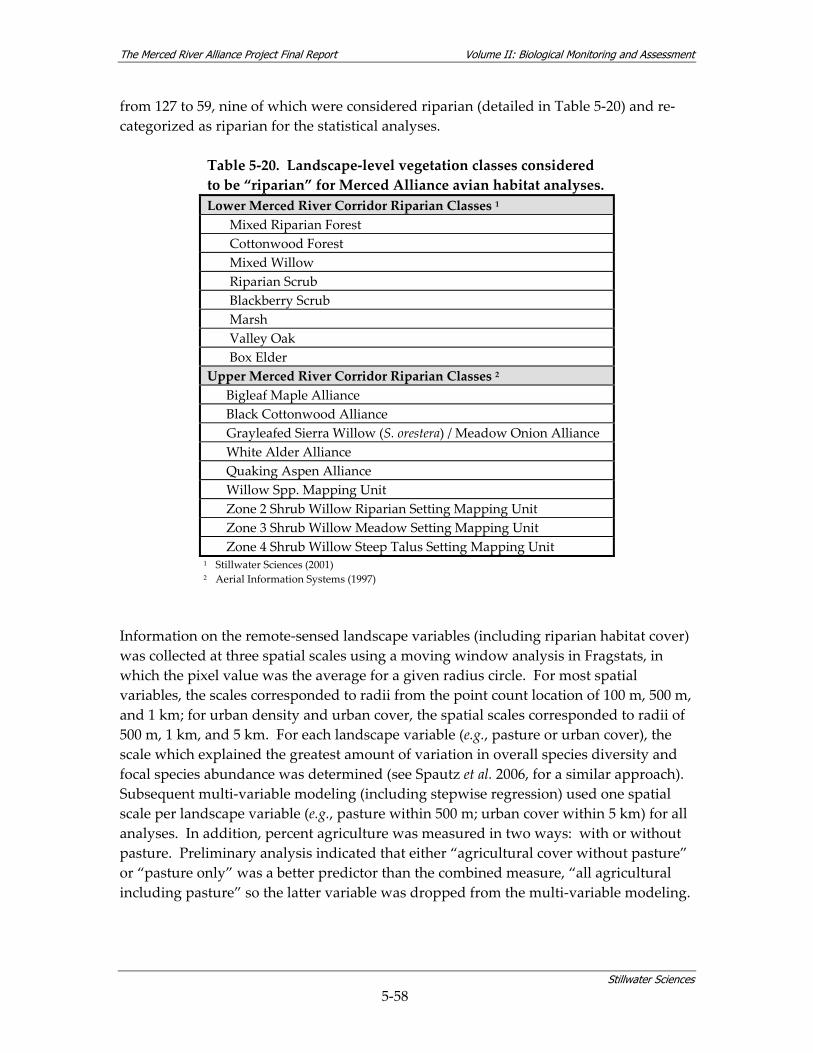
The Merced River Alliance Project Final Report Volume II: Biological Monitoring and Assessment
Stillwater Sciences
5‐58
from 127 to 59, nine of which were considered riparian (detailed in Table 5‐20) and re‐categorized as riparian for the statistical analyses.
Table 5‐20. Landscape‐level vegetation classes considered to be “riparian” for Merced Alliance avian habitat analyses. Lower Merced River Corridor Riparian Classes 1 Mixed Riparian Forest Cottonwood Forest Mixed Willow Riparian Scrub Blackberry Scrub Marsh Valley Oak Box Elder
Upper Merced River Corridor Riparian Classes 2 Bigleaf Maple Alliance Black Cottonwood Alliance Grayleafed Sierra Willow (S. orestera) / Meadow Onion Alliance White Alder Alliance Quaking Aspen Alliance Willow Spp. Mapping Unit Zone 2 Shrub Willow Riparian Setting Mapping Unit Zone 3 Shrub Willow Meadow Setting Mapping Unit Zone 4 Shrub Willow Steep Talus Setting Mapping Unit
1 Stillwater Sciences (2001) 2 Aerial Information Systems (1997)
Information on the remote‐sensed landscape variables (including riparian habitat cover) was collected at three spatial scales using a moving window analysis in Fragstats, in which the pixel value was the average for a given radius circle. For most spatial variables, the scales corresponded to radii from the point count location of 100 m, 500 m, and 1 km; for urban density and urban cover, the spatial scales corresponded to radii of 500 m, 1 km, and 5 km. For each landscape variable (e.g., pasture or urban cover), the scale which explained the greatest amount of variation in overall species diversity and focal species abundance was determined (see Spautz et al. 2006, for a similar approach). Subsequent multi‐variable modeling (including stepwise regression) used one spatial scale per landscape variable (e.g., pasture within 500 m; urban cover within 5 km) for all analyses. In addition, percent agriculture was measured in two ways: with or without pasture. Preliminary analysis indicated that either “agricultural cover without pasture” or “pasture only” was a better predictor than the combined measure, “all agricultural including pasture” so the latter variable was dropped from the multi‐variable modeling.

The Merced River Alliance Project Final Report Volume II: Biological Monitoring and Assessment
Stillwater Sciences
5‐59
To identify the best landscape model describing avian diversity and abundance, backward elimination stepwise regression (Neter et al. 1990) was carried out, analyzing each river segment (upper or lower) separately. Each model was initiated with five landscape variables (using one spatial scale per variable, see above), and used p< 0.05 as the criterion for retention of a variable. For identification of the best “local habitat and vegetation” model, backward elimination stepwise regression was applied beginning with 33 variables: 15 general local riparian patch variables (collected with the relevé method) and 18 plant species‐specific cover variables (Table 5‐19). The 15 general local riparian patch variables were chosen on the basis of previous analyses of songbird‐habitat relationships (Wood et al. 2006, Nur et al. 2008), and covered measures of the herb, shrub, and tree habitat layers without reference to the specific plant species. The 18 species‐specific cover variables represented important riparian‐associated plant species, reflecting both herbaceous and shrubby understory, as well as trees (Table 5‐19). The same criterion used to determine the best local riparian patch statistical model was also used to identify the best landscape model.
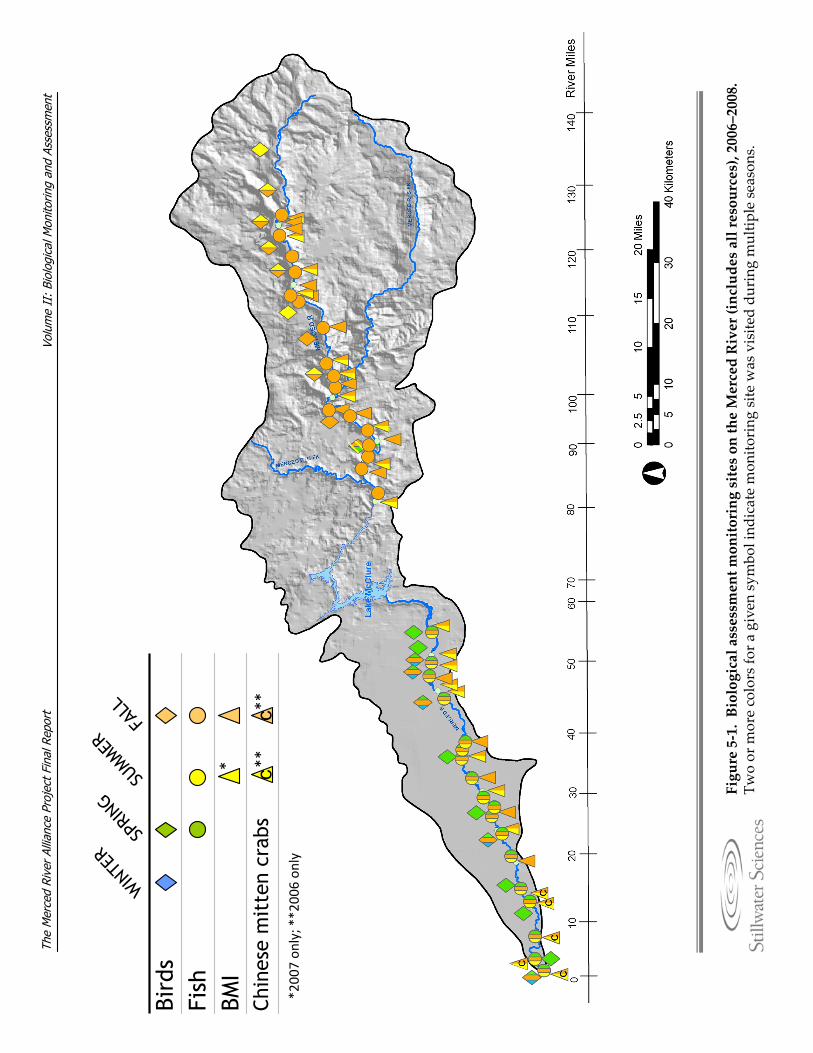
Volu
me
II:
Biol
ogic
al M
onito
ring
and
Asse
ssm
ent
The
Mer
ced
Rive
r Al
lianc
e Pr
ojec
t Fin
al R
epor
t
Figure 5‐1. Biological assessment monitoring sites on the Merced River (includes all resources), 2006–2008.
Two or m
ore colors fo
r a given sym
bol ind
icate mon
itoring site w
as visite
d du
ring m
ultip
le seasons.
*200
7 on
ly; **2
006 on
ly
FALL
WIN
TER
SUMMER
SPRI
NG
cc
Bird
sFi
shBM
ICh
ines
e m
itte
n cr
abs
* ****
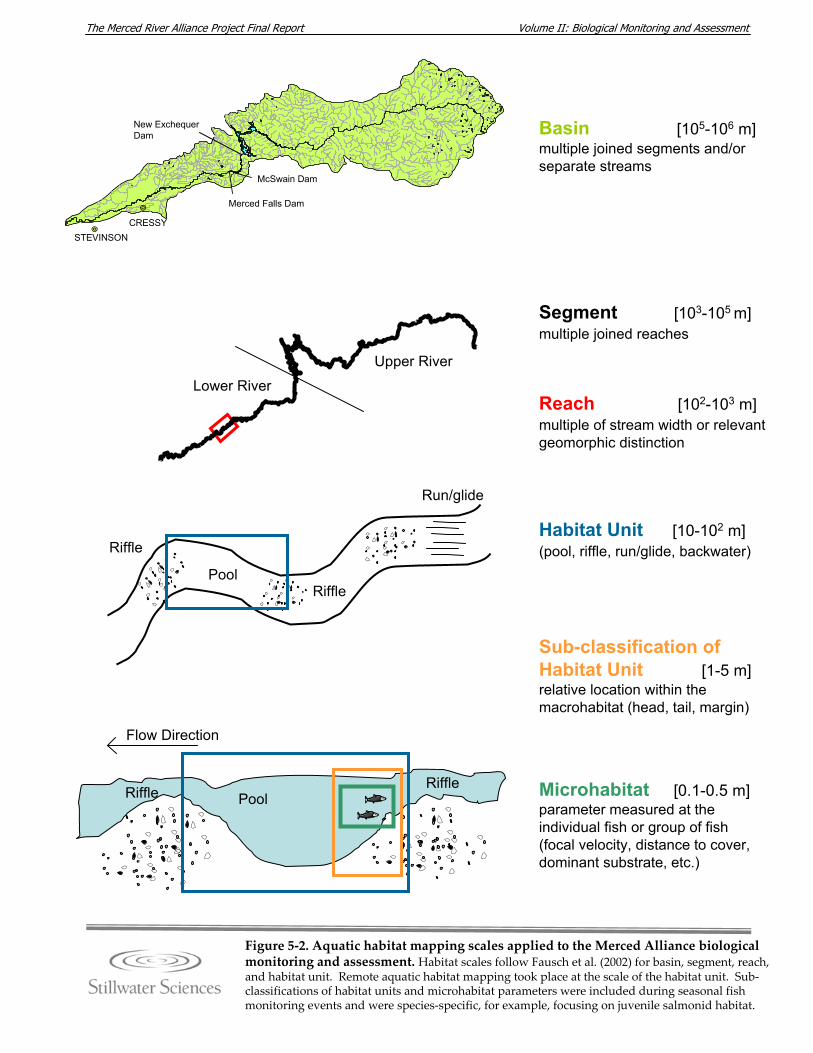
Volume II: Biological Monitoring and Assessment The Merced River Alliance Project Final Report
STEVINSONCRESSY
Basin [105-106 m]multiple joined segments and/or separate streams
Segment [103-105 m]multiple joined reaches
Reach [102-103 m]multiple of stream width or relevant geomorphic distinction
Habitat Unit [10-102 m](pool, riffle, run/glide, backwater)
Sub-classification of Habitat Unit [1-5 m]relative location within the macrohabitat (head, tail, margin)
Microhabitat [0.1-0.5 m]parameter measured at the individual fish or group of fish (focal velocity, distance to cover, dominant substrate, etc.)
Run/glide
Flow Direction
PoolRiffle
Upper River
Lower River
Merced Falls Dam
McSwain Dam
New Exchequer Dam
PoolRiffle
Riffle
Figure 5‐2. Aquatic habitat mapping scales applied to the Merced Alliance biological monitoring and assessment. Habitat scales follow Fausch et al. (2002) for basin, segment, reach, and habitat unit. Remote aquatic habitat mapping took place at the scale of the habitat unit. Sub‐classifications of habitat units and microhabitat parameters were included during seasonal fish monitoring events and were species‐specific, for example, focusing on juvenile salmonid habitat.
Riffle
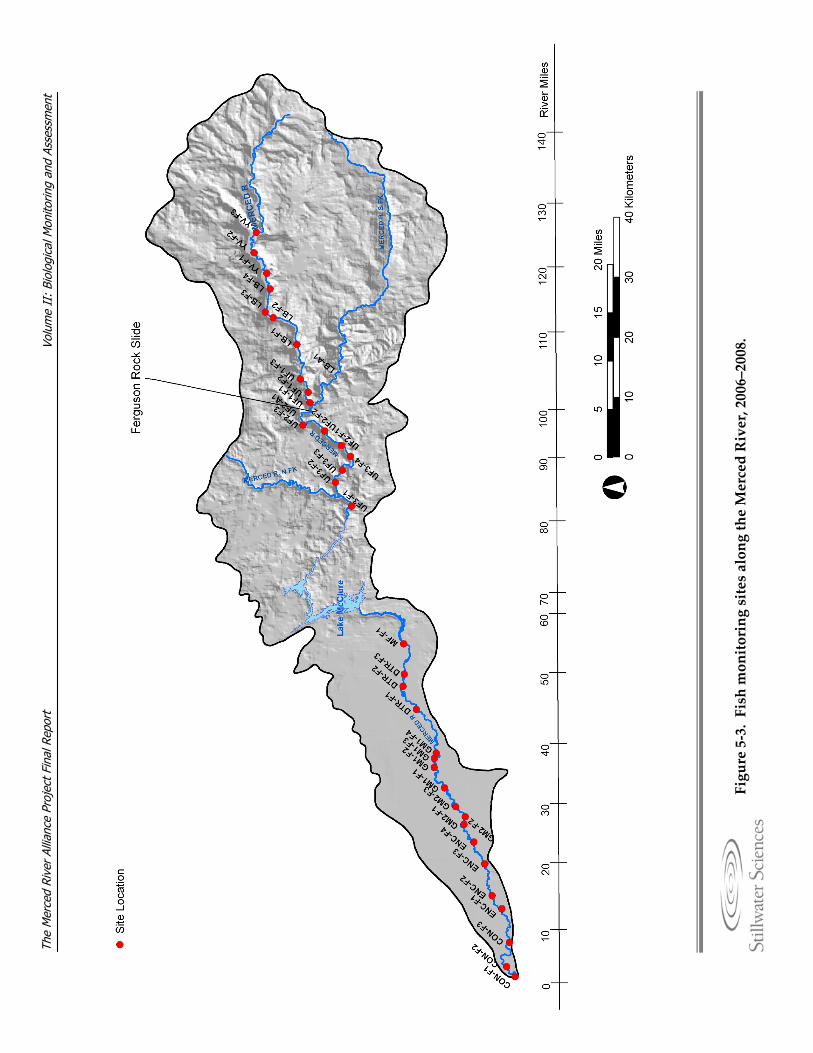
Volu
me
II:
Biol
ogic
al M
onito
ring
and
Asse
ssm
ent
The
Mer
ced
Rive
r Al
lianc
e Pr
ojec
t Fin
al R
epor
t
Figure 5‐3. Fish monitoring sites along the Merced River, 2006–2008.
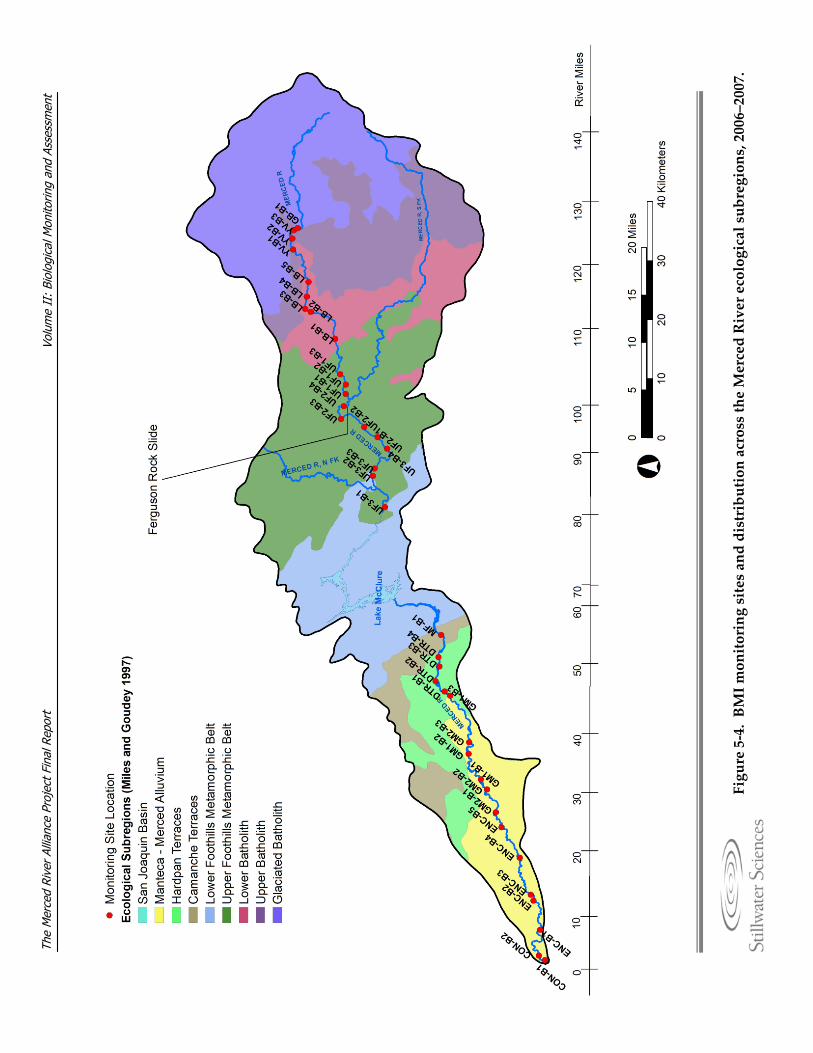
Volu
me
II:
Biol
ogic
al M
onito
ring
and
Asse
ssm
ent
The
Mer
ced
Rive
r Al
lianc
e Pr
ojec
t Fin
al R
epor
t
Figure 5‐4. BM
I monitoring sites and distribution across the Merced River ecological subregions, 2006–2007.
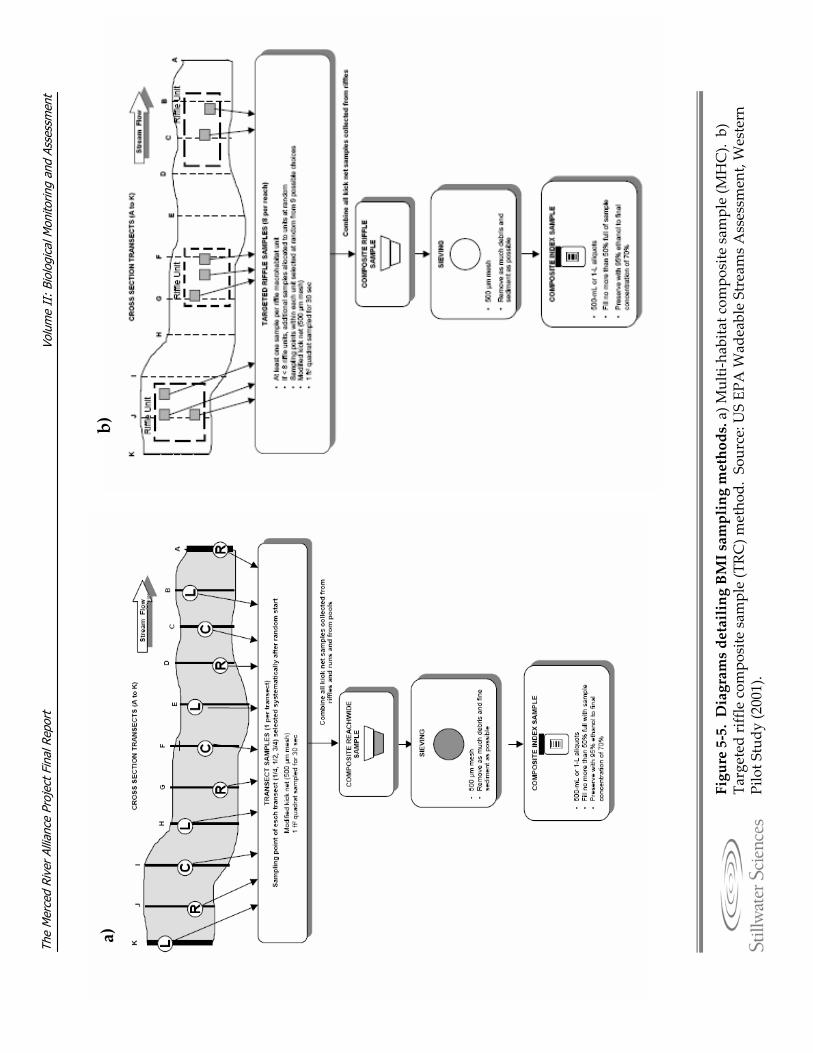
Volu
me
II:
Biol
ogic
al M
onito
ring
and
Asse
ssm
ent
The
Mer
ced
Rive
r Al
lianc
e Pr
ojec
t Fin
al R
epor
t
a)b)
Figure 5‐5. Diagrams detailing BMI sampling methods. a) M
ulti‐ha
bitat com
posite sa
mple (M
HC). b)
Targeted riffle com
posite sam
ple (TRC
) metho
d.So
urce: U
S EP
A W
adeable Stream
s Assessm
ent, Western
Pilot S
tudy (2
001).

Volu
me
II:
Biol
ogic
al M
onito
ring
and
Asse
ssm
ent
The
Mer
ced
Rive
r Al
lianc
e Pr
ojec
t Fin
al R
epor
t
Figure 5‐6. Photograph of Chinese mitten crab trap.
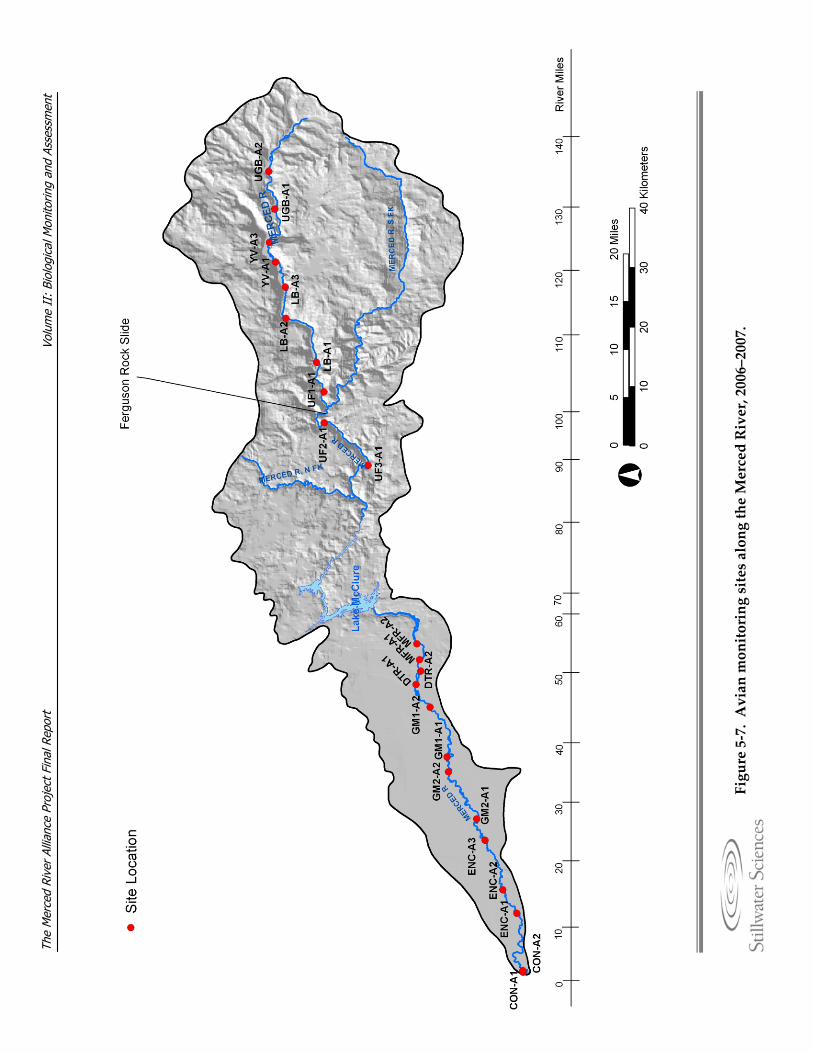
Volu
me
II:
Biol
ogic
al M
onito
ring
and
Asse
ssm
ent
The
Mer
ced
Rive
r Al
lianc
e Pr
ojec
t Fin
al R
epor
t
Figure 5‐7. Avian monitoring sites along the Merced River, 2006–2007.
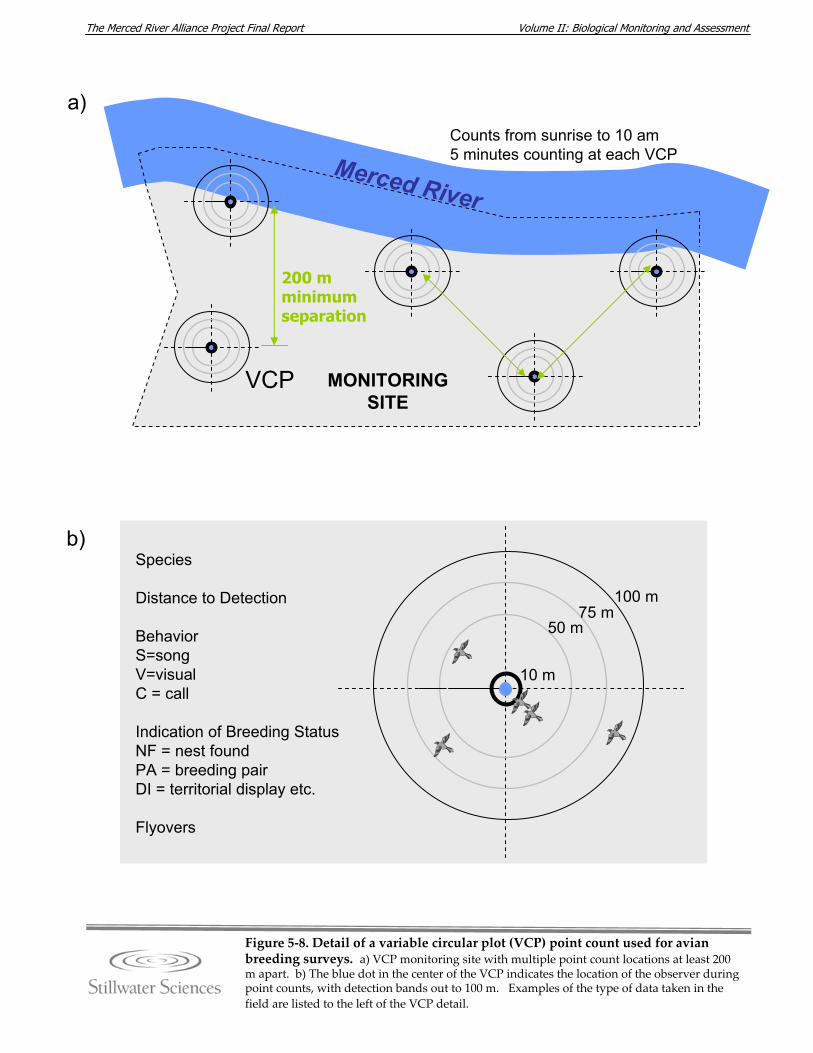
Volume II: Biological Monitoring and Assessment The Merced River Alliance Project Final Report
Figure 5‐8. Detail of a variable circular plot (VCP) point count used for avian breeding surveys. a) VCP monitoring site with multiple point count locations at least 200 m apart. b) The blue dot in the center of the VCP indicates the location of the observer during point counts, with detection bands out to 100 m. Examples of the type of data taken in the field are listed to the left of the VCP detail.
a)
b)
200 m minimumseparation
Merced River
VCP MONITORING SITE
Counts from sunrise to 10 am5 minutes counting at each VCP
Species
Distance to Detection
Behavior S=songV=visualC = call
Indication of Breeding StatusNF = nest foundPA = breeding pairDI = territorial display etc.
Flyovers
10 m
50 m75 m
100 m
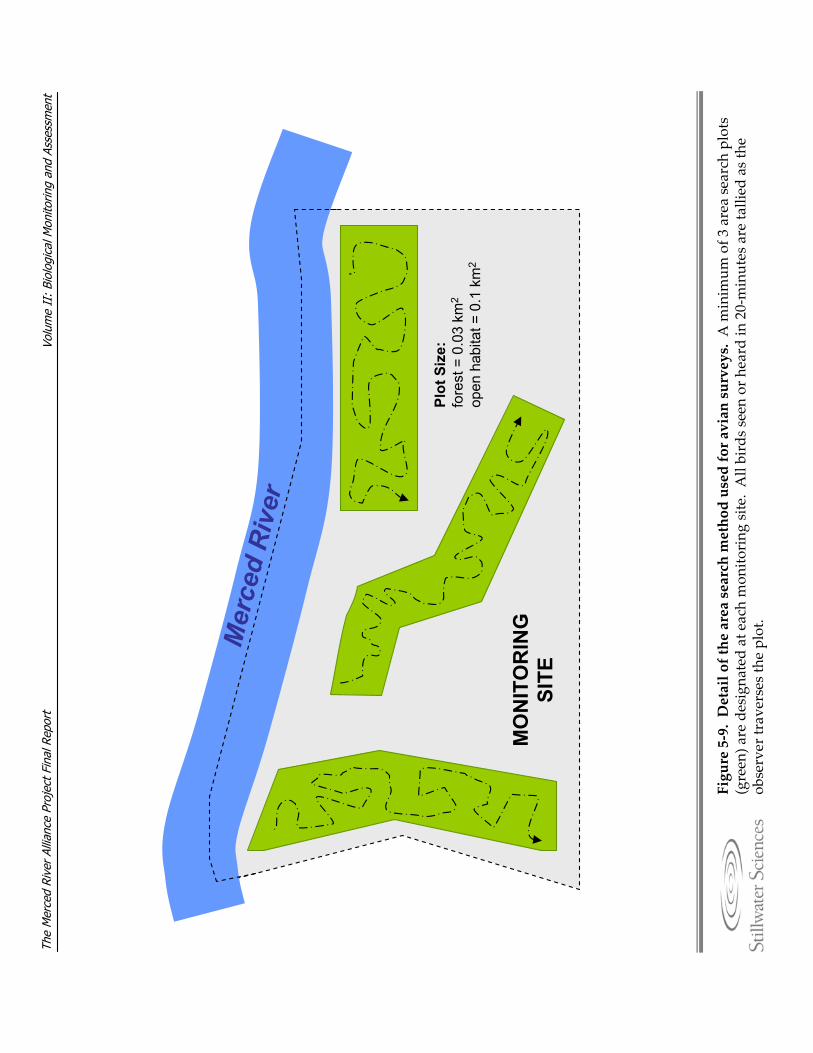
Volu
me
II:
Biol
ogic
al M
onito
ring
and
Asse
ssm
ent
The
Mer
ced
Rive
r Al
lianc
e Pr
ojec
t Fin
al R
epor
t
Figure 5‐9. Detail of the area search method used for avian surveys. A m
inim
um of 3 area search plots
(green) a
re designa
ted at each mon
itoring site
. All birds seen or h
eard in 20‐minutes are ta
llied as the
observer traverses the plot.
Mer
ced
Riv
er
MO
NIT
OR
ING
SITE
Plot
Siz
e:fo
rest
= 0
.03
km2
open
hab
itat =
0.1
km
2
The Merced River Alliance Project Final Report Volume II: Biological Monitoring and Assessment
Stillwater Sciences
6‐1
6 EXISTING DATA As discussed in Section 4, a review of existing biological data sources for the Merced River was originally detailed in Section 6 for both the BMAP (Stillwater Sciences 2006a) and the Interim Report (Stillwater Sciences 2007) based on the recommended SWRCB report structure. For this final report, tables containing data sources reviewed for the Merced Alliance and maps of previous studies’ sampling locations can be found in Section 5.3 of Volume I. This Section 6 placeholder remains in Volume II to maintain consistency with the SWRCB recommended report structure. Synthesis and analysis of existing data has been integrated into Section 7 (New Data), and Section 8 (Data Evaluation).

The Merced River Alliance Project Final Report Volume II: Biological Monitoring and Assessment
Stillwater Sciences
7‐1
7 NEW DATA
7.1 Coarse-scale Aquatic Habitat Mapping As described in Section 5.2.1, aquatic habitat mapping of the mainstem Merced River was conducted using low altitude helicopter videography in all six reaches of the lower river segment (RM 0 to 54.3) and three of six reaches of the upper river segment (RM 79.9 to 105.6). As helicopter flights are not generally permitted in Yosemite National Park, on‐the‐ground mapping methods were used to characterize discrete portions of the remaining three reaches in the upper river segment, including the Lower Batholith (RM 105.6 to 118.7), Yosemite Valley (RM 118.7 to 126), and Glaciated Batholith (RM 126 to headwaters) reaches. The Merced River aquatic habitat maps are available as a series of 34 tiles and accompanying summary spreadsheets at the Merced River Digital Library (www.mercedriverwatershed.org/projects/stillwater). Results of the aquatic habitat mapping and assessment are presented in the following paragraphs, summarized by reach. Analysis of aquatic habitat data at the basin‐ and segment‐scale was carried out to reveal larger patterns in habitat distribution that could suggest mechanisms of fish population regulation (Fausch et al. 2002, Ward 1998). As the Lake McClure Reach (RM 54.3 to 79.9) includes predominantly lacustrine habitat of the foothill reservoirs Lake McSwain and Lake McClure, it is not considered further in the data presentation. There were minor differences between original river mile calculations, developed using a 1:100K stream network model, and the estimated lengths of river reaches derived during coarse‐scale aquatic habitat mapping. Small discrepancies were observed between the sum of the individual units in a given reach and the distance between designated reach breaks; for reaches in the lower river segment, summed habitat unit measurements were within 3.5% of total designated reach length, while for the upper river segment, summed habitat unit measurements were within 2.5% of total designated reach length. Therefore, as a conservative estimate of measurement error, 5% can be assumed for a given habitat unit length throughout the upper and lower river segments. However, because estimated habitat unit widths were calculated from the lengths based on estimated width:length (Table 5‐4), habitat widths will have a larger assumed measurement error. Pool depth was visually estimated and units were then classified as “deep” (> 1.2 m [> 4 ft]) or “shallow” (< 1.2 m [< 4 ft]). As with any flow‐dependent measurement, current aquatic habitat conditions in the Merced River may vary significantly from that shown in the fall 2005 aquatic habitat maps.
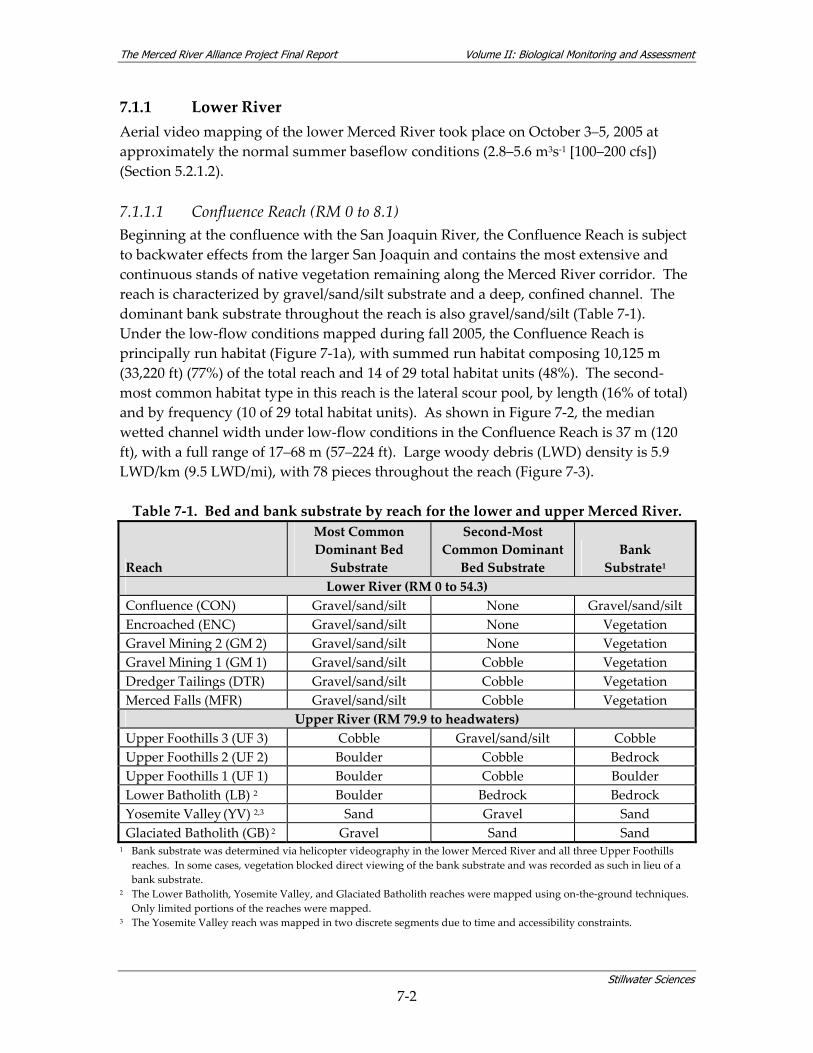
The Merced River Alliance Project Final Report Volume II: Biological Monitoring and Assessment
Stillwater Sciences
7‐2
7.1.1 Lower River Aerial video mapping of the lower Merced River took place on October 3–5, 2005 at approximately the normal summer baseflow conditions (2.8–5.6 m3s‐1 [100–200 cfs]) (Section 5.2.1.2). 7.1.1.1 Confluence Reach (RM 0 to 8.1) Beginning at the confluence with the San Joaquin River, the Confluence Reach is subject to backwater effects from the larger San Joaquin and contains the most extensive and continuous stands of native vegetation remaining along the Merced River corridor. The reach is characterized by gravel/sand/silt substrate and a deep, confined channel. The dominant bank substrate throughout the reach is also gravel/sand/silt (Table 7‐1). Under the low‐flow conditions mapped during fall 2005, the Confluence Reach is principally run habitat (Figure 7‐1a), with summed run habitat composing 10,125 m (33,220 ft) (77%) of the total reach and 14 of 29 total habitat units (48%). The second‐most common habitat type in this reach is the lateral scour pool, by length (16% of total) and by frequency (10 of 29 total habitat units). As shown in Figure 7‐2, the median wetted channel width under low‐flow conditions in the Confluence Reach is 37 m (120 ft), with a full range of 17–68 m (57–224 ft). Large woody debris (LWD) density is 5.9 LWD/km (9.5 LWD/mi), with 78 pieces throughout the reach (Figure 7‐3). Table 7‐1. Bed and bank substrate by reach for the lower and upper Merced River.
Reach
Most Common Dominant Bed Substrate
Second‐Most Common Dominant Bed Substrate
Bank Substrate1
Lower River (RM 0 to 54.3) Confluence (CON) Gravel/sand/silt None Gravel/sand/silt Encroached (ENC) Gravel/sand/silt None Vegetation Gravel Mining 2 (GM 2) Gravel/sand/silt None Vegetation Gravel Mining 1 (GM 1) Gravel/sand/silt Cobble Vegetation Dredger Tailings (DTR) Gravel/sand/silt Cobble Vegetation Merced Falls (MFR) Gravel/sand/silt Cobble Vegetation
Upper River (RM 79.9 to headwaters) Upper Foothills 3 (UF 3) Cobble Gravel/sand/silt Cobble Upper Foothills 2 (UF 2) Boulder Cobble Bedrock Upper Foothills 1 (UF 1) Boulder Cobble Boulder Lower Batholith (LB) 2 Boulder Bedrock Bedrock Yosemite Valley (YV) 2,3 Sand Gravel Sand Glaciated Batholith (GB) 2 Gravel Sand Sand
1 Bank substrate was determined via helicopter videography in the lower Merced River and all three Upper Foothills reaches. In some cases, vegetation blocked direct viewing of the bank substrate and was recorded as such in lieu of a bank substrate.
2 The Lower Batholith, Yosemite Valley, and Glaciated Batholith reaches were mapped using on‐the‐ground techniques. Only limited portions of the reaches were mapped.
3 The Yosemite Valley reach was mapped in two discrete segments due to time and accessibility constraints.
The Merced River Alliance Project Final Report Volume II: Biological Monitoring and Assessment
Stillwater Sciences
7‐3
7.1.1.2 Encroached Reach (RM 8.1 to 26.6) The Encroached Reach is the longest of the twelve reaches in the Merced River and is highly affected by agricultural levees along its full extent. The reach contains a roughly equal frequency of run (20 of 41 total units) and lateral scour pool habitats (18 of 41 total units); however, runs are the predominant habitat type by length at 26,620 m (87,320 ft) or 87% of the total reach distance. The Encroached Reach is moderately confined with an entirely gravel/sand/silt bed substrate. Due to extensive vegetation cover, it was not possible to determine the dominant bank substrate in most of the units. While bank vegetation is common (Table 7‐1), almost all of the native riparian vegetation in the Encroached Reach is located within the agricultural levees, and for much of the reach vegetation width is one tree wide. Median wetted channel width is 32 m (105 ft), with a range of 18–81 m (59–267 ft) (Figure 7‐2). As shown in Figure 7‐3, LWD density is relatively high at 7.9 LWD/km (12.8 LWD/mi) with 242 pieces observed throughout the reach. 7.1.1.3 Gravel Mining 2 Reach (RM 26.6 to 32.3) The Gravel Mining 2 Reach extends from just downstream of the Santa Fe Boulevard Bridge, to the Shaffer Road Bridge. This reach includes the confluence with Dry Creek (RM 32.7) and several in‐channel and floodplain aggregate mining pits. Dry Creek drains a 285‐km2 (110‐mi2) watershed to the north of the river and is the only major tributary to the river downstream of Crocker‐Huffman Dam (Stillwater Sciences 2001). The creek enters the mainstem Merced River at an in‐channel mining pit (Unit 45, Merced River Aquatic Habitat Maps [http://www.mercedriverwatershed.org/ projects/Stillwater]). The channel in the Gravel Mining 2 Reach is confined and deep, with runs occurring as the most frequent habitat type, consisting of 20 of 46 total units and 38% (3,440 m [11,290 ft]) of total reach length (Figure 7‐1a). Mid‐channel pools are the second‐most common unit type by frequency (13 of 46 total units) but are the most common by length, representing 43% (3,950 m [12,950 ft]) of total reach length. Of the 13 mid‐channel pool units observed in the Gravel Mining 2 Reach, four are large, flooded gravel pits. These pits also represent the widest aquatic habitat units within the reach, with a median width of 98 m (323 ft), compared to the reach‐wide median width of 31 m (100 ft) (Figure 7‐2). The deep mid‐channel gravel pits were commonly observed to have large floating algal mats at the water surface. Four off‐channel gravel pits are also present along the reach at RM 29.5, 30, 31.5, and 32.2. The dominant bed substrate in the Gravel Mining 2 Reach is gravel/sand/silt for every unit mapped (Table 7‐1). Extensive vegetation cover prevented the identification of the most common bank substrate. The riparian corridor width in the Gravel Mining 2 Reach is wider than that of the Encroached Reach, at approximately 15 m (50 ft) on each bank
The Merced River Alliance Project Final Report Volume II: Biological Monitoring and Assessment
Stillwater Sciences
7‐4
in most places (Stillwater Sciences 2001). LWD density is 4.7 LWD/km (7.6 LWD/mi), with 43 pieces throughout the reach at the time of sampling (Figure 7‐3). 7.1.1.4 Gravel Mining 1 Reach (RM 32.3 to 44.7) The Gravel Mining 1 Reach extends from Shaffer Road Bridge to approximately 1.9 km (1.2 miles) downstream of the Snelling Road Bridge. As in the Gravel Mining 2 Reach, the river channel and floodplain have been extensively mined for aggregate (sand and gravel) both on the floodplain and in the river channel. In the Gravel Mining 1 Reach, the channel is confined and deep and the most common dominant bed substrate is gravel/sand/silt sand for all habitat types except low‐gradient riffles (Table 7‐1). Cobble is present in 17 of 37 low‐gradient riffle units, and thus represents the second‐most common dominant bed substrate for the reach. Aquatic habitat the Gravel Mining 1 Reach is represented fairly evenly by four habitat types: runs, mid‐channel pools, lateral scour pools, and low‐gradient riffles. As shown in Figure 7‐1a, runs are the most common habitat type by frequency and by length, although they only represent 42 of the 125 mapped units and 39% of the total reach length. The number of low‐gradient riffles (37) is higher than that of mid‐channel pools (26) and lateral scour pools (20); however, mid‐channel pools are more common by length at 27% of total reach length. As in Gravel Mining 2 Reach, flooded off‐channel gravel pits are present throughout this reach. There are also two large gravel pits within the main channel, one 240 m (800 ft) wide and 580 m (1,900 ft) long at approximately RM 41.1, and another 200 m (650 ft) wide and 150 m (500 ft long) at approximately RM 39.3. The median wetted channel width is 26 m (85 ft) (Figure 7‐2). Thick algal mats were present at the time of sampling in the smaller of the two gravel pits, as in most of the off‐channel gravel pits. LWD density is 6.8 LWD/km (11.0 LWD/mi), with a total of 136 pieces observed in the reach at the time of sampling (Figure 7‐3). 7.1.1.5 Dredger Tailings Reach (RM 44.7 to 51.3) The Dredger Tailings Reach extends from approximately 1.9 km (1.2 miles) downstream of the Snelling Road Bridge to Crocker‐Huffman Dam. The channel in this reach is confined by piles of dredger tailings, which have replaced the natural floodplain soils and floodplain forest and have increased floodplain elevation along the river. Low‐gradient riffles and runs are the two most common habitat types in this reach; 21 of 58 total units are low‐gradient riffles and 18 are runs (Figure 7‐1a). While not high in number, several long and deep mid‐channel pools are present in the reach. Consequently, this habitat type is the second‐most common habitat type by length at 34% of the total reach length. Gravel/sand/silt is the most common dominant bed substrate (40 units) while cobble is the second‐most common dominant bed substrate (13 units) (Table 7‐1). There are three small diversion dams in the reach; the largest dam at RM 51.2 creates a deep mid‐channel pool and causes the river to widen to 240 m (800 ft) just upstream of the diversion point, or roughly eight times the median reach width of
The Merced River Alliance Project Final Report Volume II: Biological Monitoring and Assessment
Stillwater Sciences
7‐5
30 m(100 ft) for the reach (Figure 7‐2). LWD density is 4.5 LWD/km (7.2 LWD/mi) or 49 pieces for the reach (Figure 7‐3). 7.1.1.6 Merced Falls Reach (RM 51.3 to 54.3) The Merced Falls Reach is formed by Crocker‐Huffman Dam at the downstream end and Merced Falls Dam at the upstream end of the reach. The reach is relatively short, having only eight habitat units extending over 4,860 m (15,930 ft), and the channel is entirely confined and deep (>1.2 m [4 ft]). However, this portion of the river functions as a distinct reach characterized by flow releases from upstream dams and withdrawals from the Merced Irrigation District’s diversion structure at Crocker‐Huffman Dam. The range of channel flow (< 2.8 m3s‐1 [100 cfs] to > 280 m3s‐1 [10,000 cfs]) is relatively greater and flows change more frequently as compared with other reaches of the lower Merced River, resulting in the potential for highly variable aquatic habitat conditions. The number of mid‐channel pools (3) and low‐gradient riffles (3) are equal; however, the deep (>10 ft) mid‐channel pools represent 77% of total reach length (Figure 7‐1a). Gravel/sand/silt is the most common dominant bed substrate (3 of 8 units), while cobble is the second‐most common dominant substrate (2 of 8 units) (Table 7‐1). Bed substrate was not visible in the three units immediately below the Merced Falls Dam due to poor visibility. The median wetted channel width is 51 m (166 ft). Vegetation was present on the bank throughout the reach and prevented any identification of dominant bank substrate.
7.1.2 Upper River As discussed in Section 5.2.1.2, helicopter videography of the Upper Foothills reaches (3, 2, and 1) was conducted on November 15, 2005 at flows of 3.62 m3s‐1 (128 cfs). Additionally, ground mapping of limited sections of the Lower Batholith, Yosemite Valley, and Glaciated Batholith reaches in Yosemite National Park took place from November 15–22, 2005 at flows of 0.71–1.27 m3s‐1 (25–45 cfs) (Section 5.2.1.2). On‐the‐ground methods provided additional detail about habitat features in the mapped units; for example, gravel, silt, and sand substrates were separated into distinct categories during on‐the‐ground mapping. It was not possible to ground map entire reaches within Yosemite National Park boundaries due to accessibility and time constraints. 7.1.2.1 Upper Foothills 3 Reach (RM 79.9 to 91.3) The Upper Foothills 3 Reach extends from Lake McClure, upstream of the reservoir’s influence, to the Briceburg Bridge. The channel is confined throughout, with an even mix of habitat units greater than 1.2 m (4 ft) deep and units <1.2 m (4 ft); and a median wetted channel width of 25 m (82 ft) with range of 9–62 m (31–203 ft) (Figure 7‐2). Low‐gradient riffles (54 of 153 total units) are the most frequent habitat type, followed by runs (50 of 153) and mid‐channel pools (37 of 153) (Figure 7‐1b). By length, mid‐channel pools were the most heavily represented habitat type at 42% of the total reach length. Cobble is the predominant substrate, found throughout the numerous low‐gradient
The Merced River Alliance Project Final Report Volume II: Biological Monitoring and Assessment
Stillwater Sciences
7‐6
riffles in the reach, while gravel/sand/silt is the subdominant bed substrate. Deposits of fine sediment were noted in the downstream portions of the reach, presumably due to backwater effects from typical fluctuations in reservoir levels. This is the downstream‐most reach in which bedrock is noted as the dominant substrate for an individual habitat unit. Bed substrate was not visible in several mapped units due to glare in the video image. The most common dominant bank material for the reach is bedrock and cobble (Table 7‐1). No LWD was observed in the Upper Foothills 3 Reach (Figure 7‐3). 7.1.2.2 Upper Foothills 2 Reach (RM 91.3 to 100.6) The Upper Foothills 2 Reach begins at Briceburg Bridge and ends at the confluence of the mainstem and the South Fork Merced River. The channel is confined and deep throughout the reach. The most common habitat types in the reach are runs (49 of 145 total units) and low‐gradient riffles (46 of 145), while by length runs (40%) and mid‐channel pools (33%) are the most common (Figure 7‐1b). Boulder and cobble substrates predominate throughout the reach (Table 7‐1), with boulder present in most low and high‐gradient riffles and cobble present in most runs and mid‐channel pools. Bedrock substrate is also present in many mid‐channel pools. The median wetted channel width is 20 m (66 ft). One piece of LWD was observed in the reach (0.066 LWD/km [0.11 LWD/mi]) (Figure 7‐3). 7.1.2.3 Upper Foothills 1 Reach (RM 100.6 to 105.6) The Upper Foothills 1 Reach begins at the confluence of the mainstem and the South Fork Merced River and ends at Incline Road Bridge near the entrance to Yosemite National Park. Low‐gradient riffles (27 of 77 total units) and mid‐channel pools (24 of 77 total units) are the most common aquatic habitat types in the reach (Figure 7‐1b). Low‐gradient riffles and mid‐channel pools are also the most common unit by length, representing 42% and 35% of the total reach length, respectively. Boulder is the most common dominant bank and bed substrate in the reach (Table 7‐1). The median wetted channel width is 20 m (66 ft). No large woody debris was observed in the reach (Figure 7‐3). 7.1.2.4 Lower Batholith Reach (RM 105.6 to 118.7) The Lower Batholith Reach begins at Incline Road Bridge near the entrance to Yosemite National Park and ends just downstream of Pohono Bridge. On‐the‐ground mapping was conducted in the Lower Batholith Reach from RM 112.7 to RM 114.6. Mid‐channel pools are the most common habitat type in the mapped section by frequency and by length, representing 24 of 74 total units and 51% of total length (Figure 7‐1b). Boulder is the dominant substrate in 30 of the 75 units, followed by bedrock, which is the dominant substrate in 22 units. Boulder is also the most common subdominant substrate (22 units). Bedrock is the most common dominant bank substrate. The median wetted channel width in the area mapped is 14 m (47 ft) and the width varies from 6–30 m (19–100 ft) (Figure 7‐2). The Lower Batholith Reach has the highest diversity of habitat types
The Merced River Alliance Project Final Report Volume II: Biological Monitoring and Assessment
Stillwater Sciences
7‐7
of any mapped reach in the Merced River. It has the only mapped occurrences of pocket water and plunge pools. While fish cover could not be identified during the helicopter viedography, it was assessed during on‐the‐ground aquatic habitat mapping. Fish cover was present in 62% of the units and redds were observed in several units. Large woody debris was more common in this reach than in the Upper Foothills reaches (Figure 7‐3), at 4.8 LWD/km (7.8 LWD/mi). 7.1.2.5 Yosemite Valley Reach (RM 118.7 to 126.0) The Yosemite Valley Reach, beginning downstream of Pohono Bridge and extending to the Happy Isles Bridge (RM 126), was mapped in two discrete segments in an effort to map as much of the reach as possible using on‐the‐ground techniques within project time constraints. Segment A begins at the downstream end of the reach (RM 118.7) and ends at approximately RM 123.2. Segment B begins at RM 124.6 and ends at the Happy Isles Bridge. In mapped sections, runs and lateral scour pools are the most common habitat types, with 34 and 33 units respectively. Mid‐channel pools, lateral scour pools, and runs are the most common by length, representing 41%, 27%, and 26% of the total mapped distance, respectively (Figure 7‐1b). Throughout the reach, sand is the most common dominant substrate, found primarily in mid‐channel and lateral scour pools, while gravel is the sub‐dominant substrate (Table 7‐1). The median wetted channel width in the mapped sections is 19 m (62 ft), with a range of 8–43 m (25–140 ft) (Figure 7‐2) In general, gravel substrate is common in runs while boulder and cobble are most common in high and low‐gradient riffles. Three hundred forty‐five pieces of large woody debris were observed in the mapped sections, much of which was aggregated in jams, for an average of 7.9 LWD/km (12.8 LWD/mi), which was the highest level recorded in the upper Merced River (Figure 7‐3). 7.1.2.6 Glaciated Batholith Reach (RM 126 to headwaters) The Glaciated Batholith reach begins at the easternmost edge of Yosemite Valley (RM 126) and continues to the headwaters of the Merced River. Due to the difficult access conditions and time constraints, only 1,290 m (0.8 mi), including six habitat units, were mapped in this reach, beginning in the Little Yosemite Valley at RM 130 and ending at the downstream end of the Bunnel Cascade (RM 131). In Little Yosemite Valley, the reach is surrounded by a wooded meadow with many trees showing signs of fire damage. There was a large amount of LWD in the river, typically present in debris jams which blocked the entire channel and prevented the channel from being mapped safely. Of the habitat units mapped, three of the six units and 93% of the sub‐reach length were mid‐channel pools (Figure 7‐1b). Gravel is the most common dominant substrate in the mapped sub‐reach, while sand is the second‐most common dominant substrate (Table 7‐1). The most common bank substrate is sand. The median width is 16 m (53 ft), with a range of 8–23 m (25–75 ft) (Figure 7‐2). No large woody debris was observed in the mapped portion of the reach. Upstream of the mapped portion of the reach, the valley narrows and the glacial bowl begins to steepen into a small gorge. Larger substrate is more common and the stream gradient increases, and most of the habitat is largely riffle
The Merced River Alliance Project Final Report Volume II: Biological Monitoring and Assessment
Stillwater Sciences
7‐8
or cascade. A waterfall separates Lost Valley from Little Yosemite Valley, and the section of stream between the two valleys containing the falls is ensconced in bedrock walls. The stream channel is narrow (< 10 m [< 33 ft]) for most of this section and is largely high‐ or low‐gradient riffle separated by several smaller cascades.
7.2 Hydrology 7.2.1 Hydrological Overview of the Merced River Table 7‐2 presents a variety of hydrological metrics measured at each of the seven gaging locations for data collected following the completion of the largest dam on the Merced River, New Exchequer Dam, in 1968. As discussed in Section 5.2.2, hydrology in the Merced River above New Exchequer Dam and Lake McClure is unregulated. In the upper reach, as shown by the mean annual flows presented in Table 7‐2, the river experiences gradually increasing flow from Yosemite Valley downstream to Lake McClure (mean annual flow at RM 125 [HIB gaging station] is 10.8 m3s‐1 [380 cfs], while mean annual flow at RM 90 [MBB gaging station] is 29.1 m3s‐1 [1,028 cfs]), with two major tributaries, the South Fork and North Fork Merced River, both entering the river downstream of Pohono Bridge (RM 119 [POH gaging station]). New Exchequer Dam, McSwain Dam, and Merced Falls Dam regulate flows on the Merced River (Section 7.2), reducing peak flows and increasing summer baseflows downstream of the dams. Lake McClure has a usable capacity of about one million acre‐feet (USGS 1999), an amount very close to the mean total annual measured at RM 53 (MMF gaging station). Thus, the reservoir appears to have limited ability to store large volumes of water from wetter–than‐average years over multiple years. Downstream of New Exchequer and McSwain dams, a series of diversions for irrigation substantially reduce river flow, with the North Side Canal and the Crocker‐Huffman Diversion being the two largest. As shown in Table 7‐2, mean annual flow is 39.2 m3s‐1 (1,383 cfs) at RM 53 (MMF), upstream of the Crocker‐Huffman Diversion, and 16.9 m3s‐1 (596 cfs) at RM 45 (MSN gaging station), just downstream of the diversion. The Dry Creek tributary enters the lower Merced River upstream of the town of Cressy, somewhat augmenting flows in the lower river segment. Mean annual flow at RM 27 (CRS gaging station), just downstream of the Dry Creek confluence, is 19.8 m3s‐1 (699 cfs), or 2.9 m3s‐1 (103 cfs) more than mean annual flow at RM 45 (MSN), upstream of the confluence. Further inspection of Table 7‐2 reveals that the lower river segment generally experiences less variable flows (lower coefficients of variation) and has higher low flows in proportion to average flows (higher baseflow indices). While some of these effects are likely partially due to the larger catchment area of the lower river segment, attenuation of storm events and increased summer baseflow due to the foothill dams play a significant role in altering the hydrological behavior of the river between its upper and lower reaches. Despite the regulation of flow in the lower river segment, there is still substantial seasonal variation in flow, with the bulk of the flow released from Lake
The Merced River Alliance Project Final Report Volume II: Biological Monitoring and Assessment
Stillwater Sciences
7‐9
McClure (measured at RM 53 [MMF]) occurring from May through November, and the highest flows occurring in July and August (Figure 7‐4). This seasonal pattern represents a shift of spring peak flows in the upper river (as represented by POH gaging station in Figure 7‐4) to later in the summer. March low flows are low relative to the mean March flows at gaging stations downstream of the Crocker‐Huffman Diversion (MSN, CRS, and MST gaging stations) (Table 7‐2). This indicates that the Crocker‐Huffman Diversion may significantly reduce early spring low flows but has a proportionally smaller effect on early spring floods. During the last eight years, implementation of the Vernalis Adaptive Management Plan (VAMP) has necessitated substantial release of water from Lake McClure in April and May to improve conditions for salmonid outmigrants. This timing of these outmigration flows is set to coincide with spring peak flows that would occur under the unregulated flow regime and that still occur in the upper river segment.
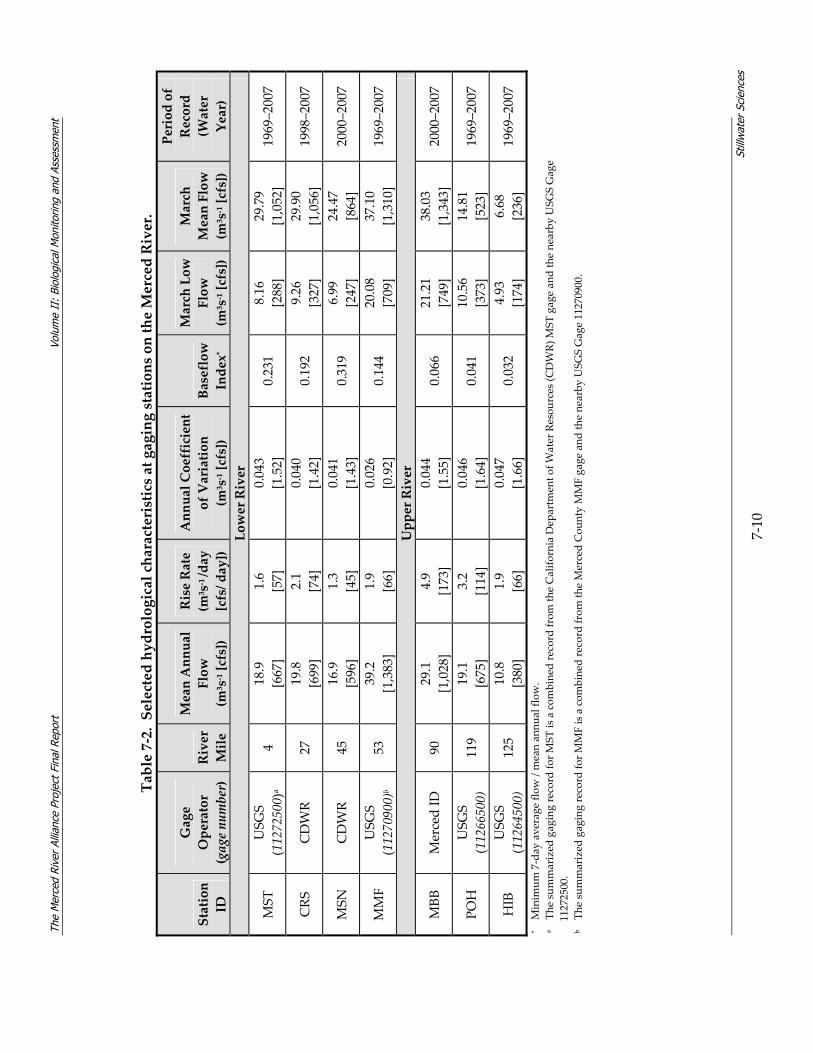
The
Mer
ced
Rive
r Al
lianc
e Pr
ojec
t Fin
al R
epor
t Vo
lum
e II
: Bi
olog
ical
Mon
itorin
g an
d As
sess
men
t
Still
wat
er S
cien
ces
7‐10
Table 7‐2. Selected hydrological characteristics at gaging stations on the Merced River.
Station
ID
Gage
Operator
(gage number) River
Mile
Mean Annual
Flow
(m3 s‐1 [cfs])
Rise Rate
(m3 s‐1 /day
[cfs/ day])
Annual Coefficient
of Variation
(m3 s‐1 [cfs])
Baseflow
Index*
March Low
Flow
(m3 s‐1 [cfs])
March
Mean Flow
(m3 s‐1 [cfs])
Period of
Record
(Water
Year)
Lower River
MST
USG
S
(11272500)
a 4
18.9
[667]
1.6
[57]
0.043
[1.52]
0.231
8.16
[288]
29.79
[1,052]
1969–2007
CRS
CDWR
27
19.8
[699]
2.1
[74]
0.040
[1.42]
0.192
9.26
[327]
29.90
[1,056]
1998–2007
MSN
CDWR
45
16.9
[596]
1.3
[45]
0.041
[1.43]
0.319
6.99
[247]
24.47
[864]
2000–2007
MMF
USG
S (11270900)b
53
39.2
[1,383]
1.9
[66]
0.026
[0.92]
0.144
20.08
[709]
37.10
[1,310]
1969–2007
Upper River
MBB
Merced ID
90
29.1
[1,028]
4.9
[173]
0.044
[1.55]
0.066
21.21
[749]
38.03
[1,343]
2000–2007
POH
USG
S (11266500)
119
19.1
[675]
3.2
[114]
0.046
[1.64]
0.041
10.56
[373]
14.81
[523]
1969–2007
HIB
USG
S (11264500)
125
10.8
[380]
1.9
[66]
0.047
[1.66]
0.032
4.93
[174]
6.68
[236]
1969–2007
* M
inim
um 7‐day average flow / mean an
nual flow
. a
The sum
marized gaging record fo
r MST is a com
bined record from th
e Califo
rnia Dep
artm
ent o
f Water Resou
rces (C
DWR) M
ST gage an
d the nearby USG
S Gage
11272500.
b The sum
marized gaging record fo
r MMF is a com
bined record from th
e Merced Cou
nty MMF gage and th
e nearby USG
S Gage 11270900.
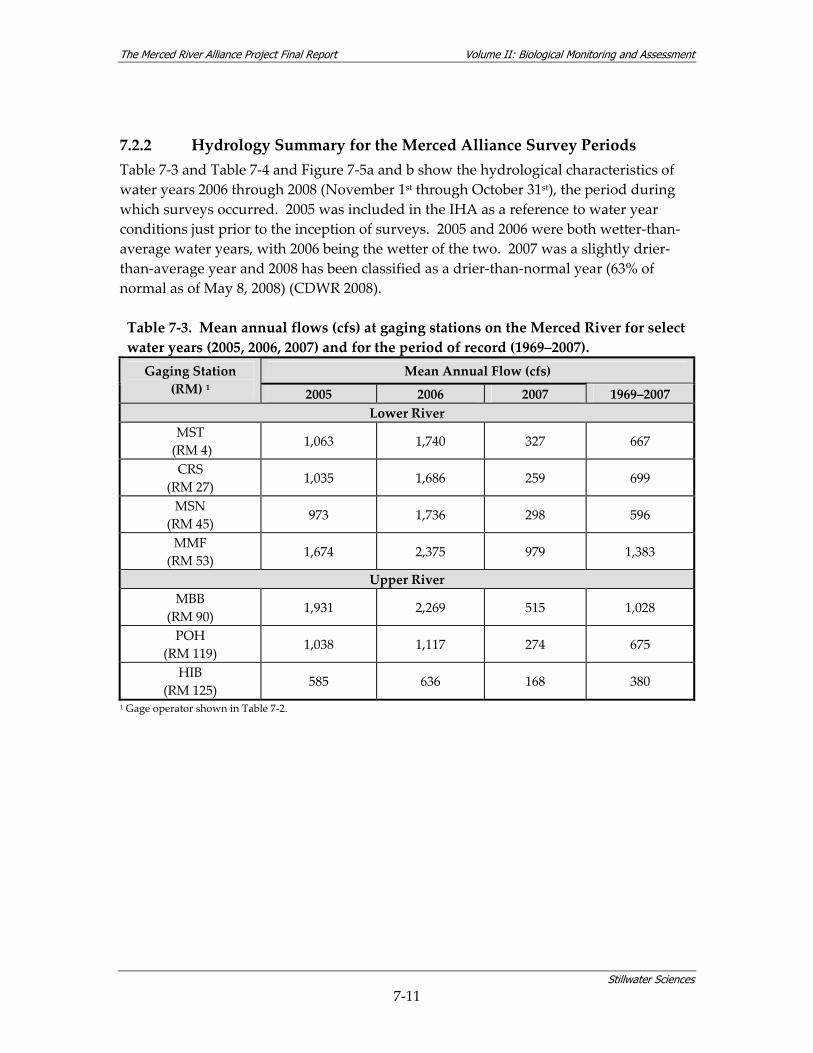
The Merced River Alliance Project Final Report Volume II: Biological Monitoring and Assessment
Stillwater Sciences
7‐11
7.2.2 Hydrology Summary for the Merced Alliance Survey Periods Table 7‐3 and Table 7‐4 and Figure 7‐5a and b show the hydrological characteristics of water years 2006 through 2008 (November 1st through October 31st), the period during which surveys occurred. 2005 was included in the IHA as a reference to water year conditions just prior to the inception of surveys. 2005 and 2006 were both wetter‐than‐average water years, with 2006 being the wetter of the two. 2007 was a slightly drier‐than‐average year and 2008 has been classified as a drier‐than‐normal year (63% of normal as of May 8, 2008) (CDWR 2008). Table 7‐3. Mean annual flows (cfs) at gaging stations on the Merced River for select water years (2005, 2006, 2007) and for the period of record (1969–2007).
Mean Annual Flow (cfs) Gaging Station (RM) 1 2005 2006 2007 1969–2007
Lower River MST (RM 4) 1,063 1,740 327 667
CRS (RM 27)
1,035 1,686 259 699
MSN (RM 45)
973 1,736 298 596
MMF (RM 53)
1,674 2,375 979 1,383
Upper River MBB
(RM 90) 1,931 2,269 515 1,028
POH (RM 119)
1,038 1,117 274 675
HIB (RM 125)
585 636 168 380
1 Gage operator shown in Table 7‐2.
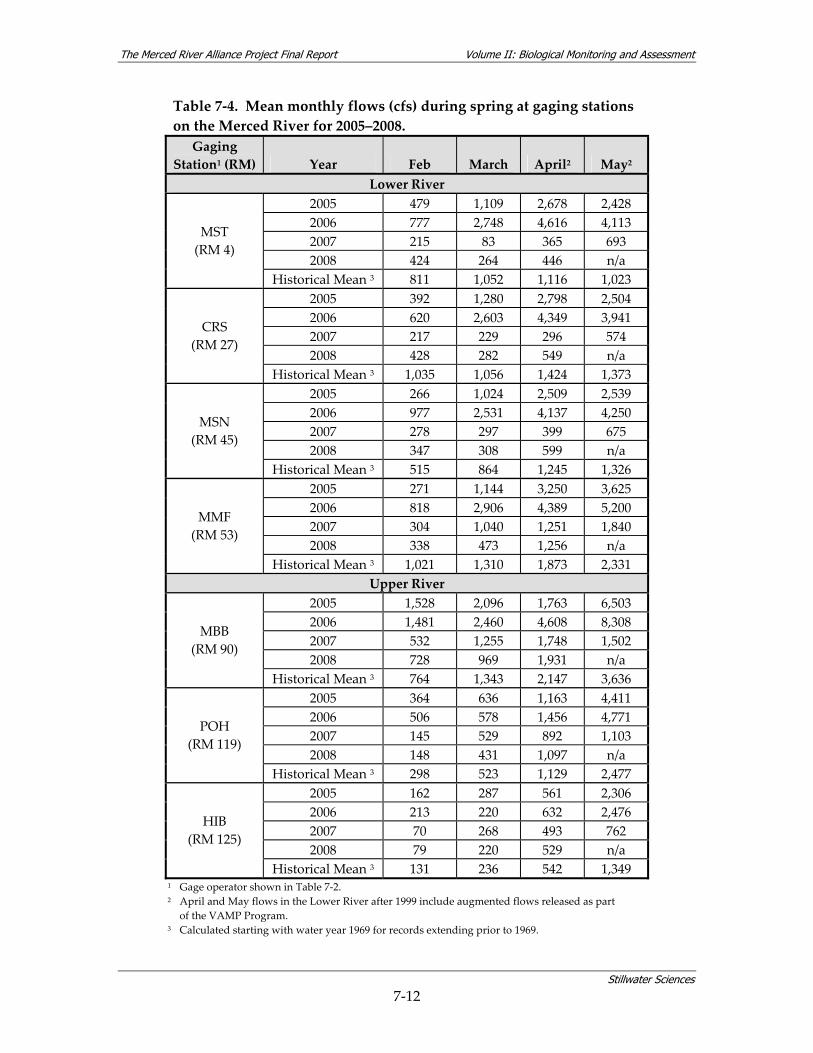
The Merced River Alliance Project Final Report Volume II: Biological Monitoring and Assessment
Stillwater Sciences
7‐12
Table 7‐4. Mean monthly flows (cfs) during spring at gaging stations on the Merced River for 2005–2008. Gaging
Station1 (RM) Year Feb March April2 May2 Lower River
2005 479 1,109 2,678 2,428 2006 777 2,748 4,616 4,113 2007 215 83 365 693 2008 424 264 446 n/a
MST (RM 4)
Historical Mean 3 811 1,052 1,116 1,023 2005 392 1,280 2,798 2,504 2006 620 2,603 4,349 3,941 2007 217 229 296 574 2008 428 282 549 n/a
CRS (RM 27)
Historical Mean 3 1,035 1,056 1,424 1,373 2005 266 1,024 2,509 2,539 2006 977 2,531 4,137 4,250 2007 278 297 399 675 2008 347 308 599 n/a
MSN (RM 45)
Historical Mean 3 515 864 1,245 1,326 2005 271 1,144 3,250 3,625 2006 818 2,906 4,389 5,200 2007 304 1,040 1,251 1,840 2008 338 473 1,256 n/a
MMF (RM 53)
Historical Mean 3 1,021 1,310 1,873 2,331 Upper River
2005 1,528 2,096 1,763 6,503 2006 1,481 2,460 4,608 8,308 2007 532 1,255 1,748 1,502 2008 728 969 1,931 n/a
MBB (RM 90)
Historical Mean 3 764 1,343 2,147 3,636 2005 364 636 1,163 4,411 2006 506 578 1,456 4,771 2007 145 529 892 1,103 2008 148 431 1,097 n/a
POH (RM 119)
Historical Mean 3 298 523 1,129 2,477 2005 162 287 561 2,306 2006 213 220 632 2,476 2007 70 268 493 762 2008 79 220 529 n/a
HIB (RM 125)
Historical Mean 3 131 236 542 1,349 1 Gage operator shown in Table 7‐2. 2 April and May flows in the Lower River after 1999 include augmented flows released as part
of the VAMP Program. 3 Calculated starting with water year 1969 for records extending prior to 1969.
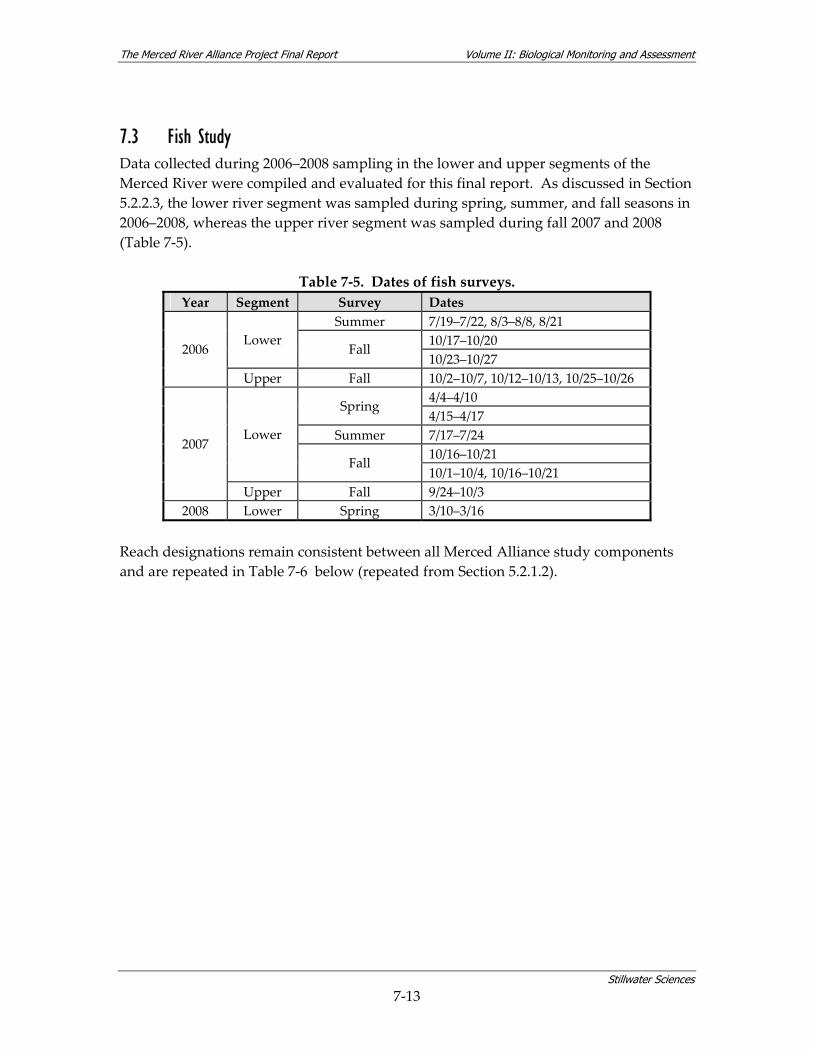
The Merced River Alliance Project Final Report Volume II: Biological Monitoring and Assessment
Stillwater Sciences
7‐13
7.3 Fish Study Data collected during 2006–2008 sampling in the lower and upper segments of the Merced River were compiled and evaluated for this final report. As discussed in Section 5.2.2.3, the lower river segment was sampled during spring, summer, and fall seasons in 2006–2008, whereas the upper river segment was sampled during fall 2007 and 2008 (Table 7‐5).
Table 7‐5. Dates of fish surveys. Year Segment Survey Dates
Summer 7/19–7/22, 8/3–8/8, 8/21 10/17–10/20 Lower
Fall 10/23–10/27
2006
Upper Fall 10/2–10/7, 10/12–10/13, 10/25–10/26 4/4–4/10 Spring 4/15–4/17
Summer 7/17–7/24 10/16–10/21
Lower
Fall 10/1–10/4, 10/16–10/21
2007
Upper Fall 9/24–10/3 2008 Lower Spring 3/10–3/16
Reach designations remain consistent between all Merced Alliance study components and are repeated in Table 7‐6 below (repeated from Section 5.2.1.2).
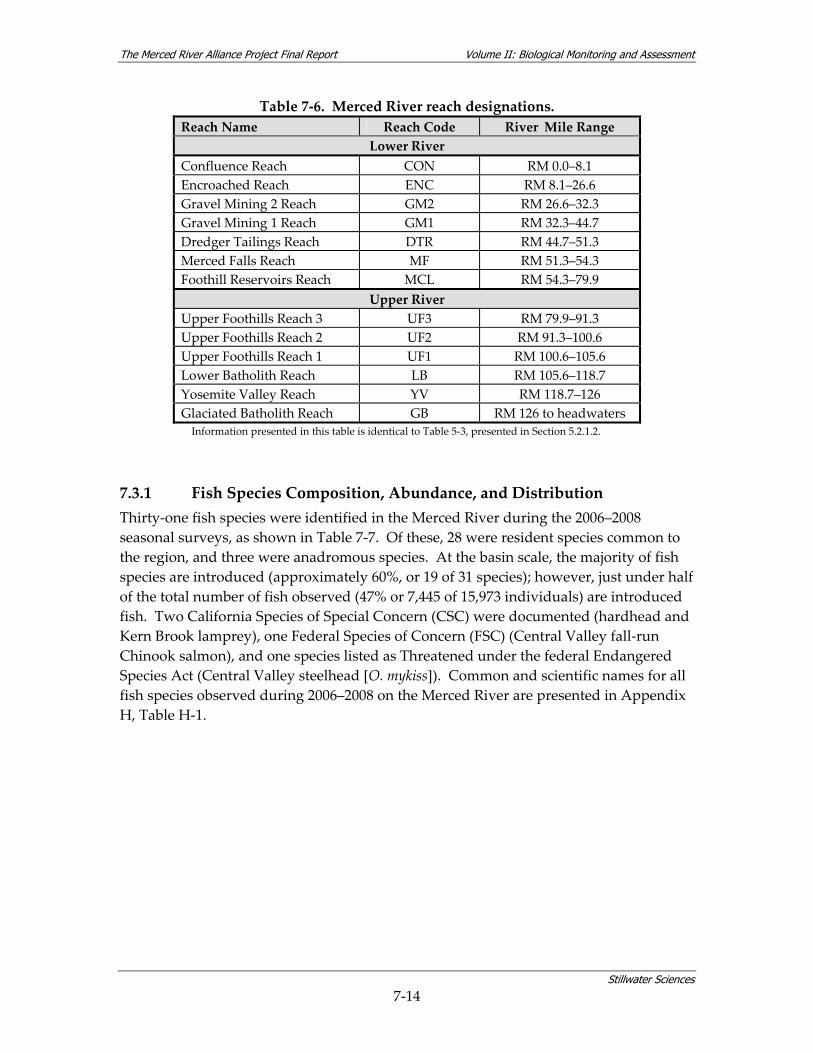
The Merced River Alliance Project Final Report Volume II: Biological Monitoring and Assessment
Stillwater Sciences
7‐14
Table 7‐6. Merced River reach designations. Reach Name Reach Code River Mile Range
Lower River Confluence Reach CON RM 0.0–8.1 Encroached Reach ENC RM 8.1–26.6 Gravel Mining 2 Reach GM2 RM 26.6–32.3 Gravel Mining 1 Reach GM1 RM 32.3–44.7 Dredger Tailings Reach DTR RM 44.7–51.3 Merced Falls Reach MF RM 51.3–54.3 Foothill Reservoirs Reach MCL RM 54.3–79.9
Upper River Upper Foothills Reach 3 UF3 RM 79.9–91.3 Upper Foothills Reach 2 UF2 RM 91.3–100.6 Upper Foothills Reach 1 UF1 RM 100.6–105.6 Lower Batholith Reach LB RM 105.6–118.7 Yosemite Valley Reach YV RM 118.7–126 Glaciated Batholith Reach GB RM 126 to headwaters Information presented in this table is identical to Table 5‐3, presented in Section 5.2.1.2.
7.3.1 Fish Species Composition, Abundance, and Distribution Thirty‐one fish species were identified in the Merced River during the 2006–2008 seasonal surveys, as shown in Table 7‐7. Of these, 28 were resident species common to the region, and three were anadromous species. At the basin scale, the majority of fish species are introduced (approximately 60%, or 19 of 31 species); however, just under half of the total number of fish observed (47% or 7,445 of 15,973 individuals) are introduced fish. Two California Species of Special Concern (CSC) were documented (hardhead and Kern Brook lamprey), one Federal Species of Concern (FSC) (Central Valley fall‐run Chinook salmon), and one species listed as Threatened under the federal Endangered Species Act (Central Valley steelhead [O. mykiss]). Common and scientific names for all fish species observed during 2006–2008 on the Merced River are presented in Appendix H, Table H‐1.
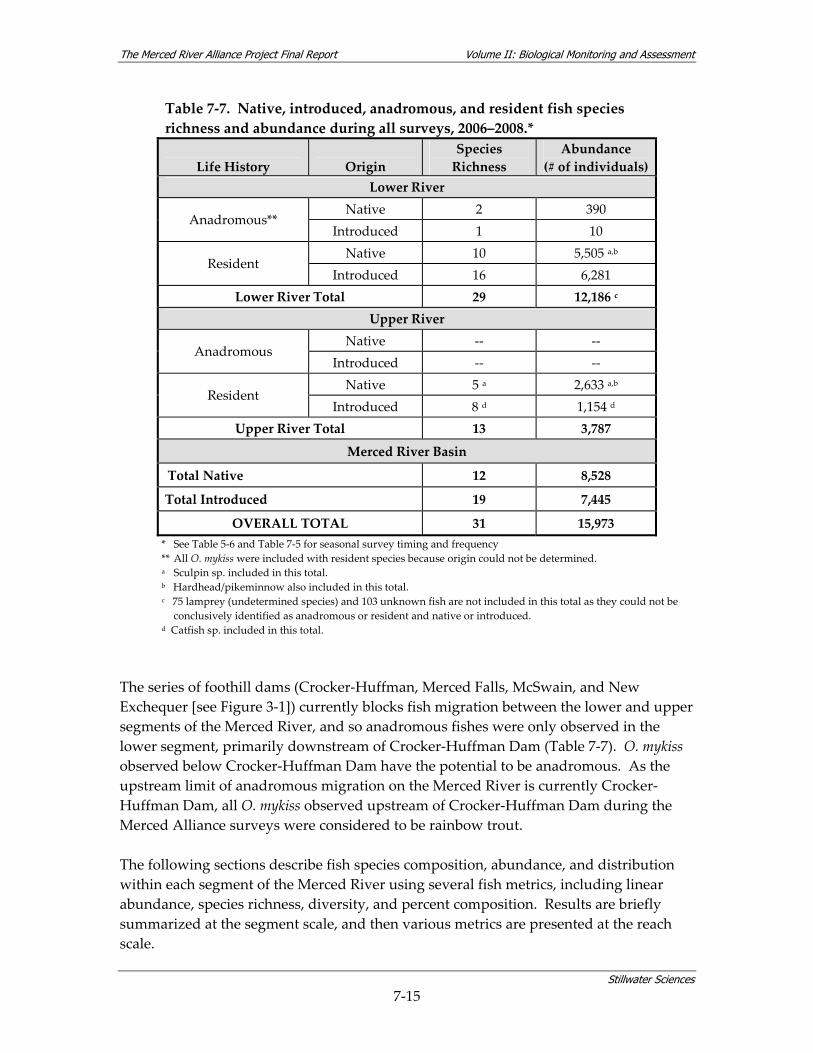
The Merced River Alliance Project Final Report Volume II: Biological Monitoring and Assessment
Stillwater Sciences
7‐15
Table 7‐7. Native, introduced, anadromous, and resident fish species richness and abundance during all surveys, 2006–2008.*
Life History Origin Species Richness
Abundance (# of individuals)
Lower River Native 2 390
Anadromous** Introduced 1 10 Native 10 5,505 a,b
Resident Introduced 16 6,281
Lower River Total 29 12,186 c Upper River
Native ‐‐ ‐‐ Anadromous
Introduced ‐‐ ‐‐ Native 5 a 2,633 a,b
Resident Introduced 8 d 1,154 d
Upper River Total 13 3,787
Merced River Basin
Total Native 12 8,528
Total Introduced 19 7,445
OVERALL TOTAL 31 15,973 * See Table 5‐6 and Table 7‐5 for seasonal survey timing and frequency ** All O. mykiss were included with resident species because origin could not be determined. a Sculpin sp. included in this total. b Hardhead/pikeminnow also included in this total. c 75 lamprey (undetermined species) and 103 unknown fish are not included in this total as they could not be
conclusively identified as anadromous or resident and native or introduced. d Catfish sp. included in this total.
The series of foothill dams (Crocker‐Huffman, Merced Falls, McSwain, and New Exchequer [see Figure 3‐1]) currently blocks fish migration between the lower and upper segments of the Merced River, and so anadromous fishes were only observed in the lower segment, primarily downstream of Crocker‐Huffman Dam (Table 7‐7). O. mykiss observed below Crocker‐Huffman Dam have the potential to be anadromous. As the upstream limit of anadromous migration on the Merced River is currently Crocker‐Huffman Dam, all O. mykiss observed upstream of Crocker‐Huffman Dam during the Merced Alliance surveys were considered to be rainbow trout. The following sections describe fish species composition, abundance, and distribution within each segment of the Merced River using several fish metrics, including linear abundance, species richness, diversity, and percent composition. Results are briefly summarized at the segment scale, and then various metrics are presented at the reach scale.
The Merced River Alliance Project Final Report Volume II: Biological Monitoring and Assessment
Stillwater Sciences
7‐16
7.3.1.1 Lower River In the lower river segment, 12,364 individual fish from 29 species were observed during the 2006–2008 seasonal surveys. Of these, 12,186 (98.5%) were identifiable to species and hence could be categorized as anadromous or resident and native or introduced (Table 7‐7). Three anadromous species were present at relatively low abundance, including two native species, Central Valley fall‐run Chinook salmon and Pacific lamprey, and the introduced striped bass (Figure 7‐6). Chinook salmon and striped bass were observed exclusively downstream of Crocker‐Huffman Dam, while Pacific lamprey were present both downstream of the dam and in the Merced Falls Reach, just upstream of the dam but still in the lower river segment. It is assumed that the partially removed fish ladder at Crocker‐Huffman provided limited passage for lamprey observed above the dam. The O. mykiss observed upstream of Crocker‐Huffman Dam were considered resident since Crocker‐Huffman Dam is a migration barrier to most fish species. Overall, resident fish made up the large majority of species and individuals observed in the lower Merced River (Table 7‐7). Less than half of the resident species observed (40% or 11 of 27) were native to the Merced River, and slightly less than half of the total number of resident fish (47% or 5,505 of 11,786) observed were native (Table 7‐7). Estimated Linear Density The total number of fish observed at each site during the 2006–2008 surveys was normalized to produce an estimate of linear density, expressed as the number of fish per 100 meters. The estimated linear density values are summarized by reach in Figure 7‐7. As evidenced by the wide range of values and multiple statistical outliers shown in the box plot for each reach, estimated linear fish density in the lower river segment exhibited high variability, ranging across two to three orders of magnitude. Overall in the lower river during the 2006–2008 surveys, variability between reaches outweighed intra‐reach variability (p = 0.03, Kruskal‐Wallis non‐parametric ranking test alternative to ANOVA), with the highest median estimated density values observed in the Gravel Mining Reach 1 (GM1) and the Dredger Tailings Reach (DTR). Species Richness, Diversity, and Percent Composition Despite the high variability in estimated linear abundance by reach, a closer look at reach‐specific species richness and diversity metrics along with percent composition (by family) in Figure 7‐8 through Figure 7‐13 indicates some degree of reach specificity in the lower Merced River. On the whole, species richness and diversity metrics varied from reach to reach within seasons, across seasons, and across flow years, suggesting that the reaches behaved as relatively distinct entities (see Figure 7‐8a through Figure 7‐13a). The dominant species also changed by reach (see Figure 7‐8b through Figure 7‐13b for percent composition by family and Appendix Table H‐3 for species raw data). For example, in the spring 2008 survey, the downstream to upstream dominant species shifted from mosquitofish in the Confluence Reach, to bass and sunfish in the
The Merced River Alliance Project Final Report Volume II: Biological Monitoring and Assessment
Stillwater Sciences
7‐17
Encroached and Gravel Mining 2 reaches, to more even distributions between Sacramento sucker, bass, sunfish and mosquitofish in the Gravel Mining 1 Reach, to hardhead and pikeminnow in the Dredger Tailings Reach (Figure 7‐13b). The most consistently distinctive reach in terms of the measured fish metrics was the Merced Falls Reach, which is physically separated from the rest of the lower river by Crocker‐Huffman Dam and therefore was expected to be unique. With the exception of fall 2006, when overall metrics were low in the Gravel Mining 1 Reach as well (Figure 7‐9a), the Merced Falls Reach exhibited lower species richness (2 to 5 vs. 8 to 18 for 2006–2008) and diversity (1.9 to 4.0 vs. 1.88 to 8.9 for 2006–2008) than all other reaches in the lower river. The species observed in the Merced Falls Reach were the native Sacramento sucker, O. mykiss, riffle sculpin, prickly sculpin, Pacific lamprey and Kern Brook lamprey, and introduced mosquitofish (only observed in fall 2007) (Table 7‐8). Close correspondence between species richness and diversity in the Merced Falls Reach indicates a relatively even distribution of individuals across a small number of mostly native species, a composition that was not observed elsewhere in the lower river segment. In other reaches of the lower river segment, one species, often the introduced mosquitofish, largemouth bass, or spotted bass, was dominant by reach and multiple other fish species (including native and introduced species) comprised less than 2% of the total species composition. This pattern is also reflected in the divergence in richness and diversity indices for the majority of the lower river reaches (Figure 7‐8b through Figure 7‐13b). Despite consistently occurring differences in species richness, species diversity, and percent composition between reaches, gradual reach‐scale patterns are apparent in the data. In four of six seasons (summer 2006, spring 2007, summer 2007, fall 2007), species richness and/or diversity changed in a similarly progressive manner throughout the lower river, increasing upstream from the Confluence Reach through the Encroached Reach, peaking in either the Encroached, Gravel Mining 2 or Gravel Mining 1 reaches, and then decreasing upstream into the Dredger Tailings and Merced Falls reaches (Figure 7‐8a through Figure 7‐13a). For these cases, the reach exhibiting the greatest richness value appeared to be acting as a transition zone between warm‐water species (i.e., bass, sunfish, carp, and mosquitofish) and transitional/colder water species (i.e., Sacramento sucker, hardhead, and pikeminnow). From spring to summer, the transition zone appeared to move upstream; for example, the Gravel Mining 1 Reach was dominated by transitional/colder water species during spring 2007 surveys and warm‐water species during summer 2007 surveys. Patterns in species distribution differed between spring 2007 and the spring 2008 surveys, largely due to the distribution of Sacramento sucker, Sacramento pikeminnow, and hardhead (Figure 7‐10b and Figure 7‐13a). While there was some apparent reach specificity on the lower river (see previous discussion), changes in percent composition of several commonly occurring species
The Merced River Alliance Project Final Report Volume II: Biological Monitoring and Assessment
Stillwater Sciences
7‐18
occurred gradually between reaches rather than abruptly from one reach to the next. For example, bass and sunfish were generally among the dominant species in the Confluence, Encroached, and Gravel Mining reaches of the lower river, while the native Sacramento sucker, Sacramento pikeminnow, and hardhead were more common in the Dredger Tailings Reach but were found occasionally in the downstream reaches as well. For all surveys, mosquitofish were widely distributed across all six lower river reaches. Overall, the number of species observed during the fall surveys was lower than the number of species observed during spring and summer for all flow years (2006, 2007, and 2008). However, fall observations were different between the two survey years; during the 2006 (high‐flow year) fall surveys, the lowest number of individual fish were observed (559), while during fall 2007 (low‐flow year), the greatest number of individual fish were observed (13,823). The difference was most likely due to depth refuge, which may have affected sampling/observation effectiveness for both boat electrofishing and snorkel surveys. During the spring and summer surveys, observations ranged from 1,557 individuals (spring 2008) to 2,963 individuals (summer 2007). Length‐frequency Distributions by Species Twenty‐nine fish species from ten different families were observed during the lower Merced River fish surveys. Histograms of length‐frequencies at 25‐mm intervals were generated for each species and analyzed to determine length‐frequency modes. Following Murphy and Willis (1996), modes were used to estimate component age classes for each species, when possible. For species with low overall observations or low observations within particular length groups, age classes were determined using available literature references of common length ranges for a given age class. O. mykiss observed in the lower Merced River ranged in size from the 0 to 25 mm size class to the 401 to 425 mm size class, and likely ranged up to 4+ years (Figure 7‐14a). In warm low‐gradient streams, they may reach 90 to 100 mm fork length in the first year, 150 to 210 mm in the second year, 210 to 300 mm in the third year, and 300 mm or more in the fourth year (Moyle 2002). The 110 O. mykiss observed were relatively evenly distributed across all age classes, with O. mykiss estimated to fall within the 3+ age class the most frequent size observed during Merced Alliance fish surveys. Chinook salmon observed in the lower Merced River were all 100 mm or less and almost certainly were YOY fish (Figure 7‐14b). Both Kern Brook and Pacific lamprey were observed in the lower Merced River (Figure 7‐14c). Two Kern Brook lamprey observed fell within the 0 to 25 mm and 51 to 75 mm size class; however, most were larger individuals and ranged up to 150 mm. While both adult and ammocoete Kern Brook lamprey were observed, specific age classes could not be determined for Kern Brook lamprey based on length‐frequency distribution or available literature. Pacific lamprey ranged from 51 to 175 mm in length. No Pacific lamprey adults were observed. The length of the Pacific lamprey ammocoete life stage

The Merced River Alliance Project Final Report Volume II: Biological Monitoring and Assessment
Stillwater Sciences
7‐19
is uncertain but probably lasts five to seven years (Moyle 2002). Age classes could not be determined for Pacific lamprey ammocoetes based on length‐frequency distribution or available literature. Channel catfish, brown bullhead, and white catfish were all captured in the lower Merced River. Length‐frequency distributions indicated that most of these were YOY and adult fish, with few individuals in intermediate (i.e., juvenile) age classes (Figure 7‐14d‐f). Although there is considerable variation in growth from population to population, channel catfish will typically reach 70 to 100 mm total length in the first year, 120 to 200 mm in the second year, 200 to 350 mm in the third year, 300 to 400 mm in the fourth year, and 350 to 450 mm in the fifth year (Carlander 1969, as cited in Moyle 2002). Channel catfish were estimated to range from YOY up to approximately 5+ with the majority of fish falling within the 3+ age class (Figure 7‐14d). No channel catfish were observed between 101 and 225 mm. Brown bullhead reach 70 to 100 mm total length in their first year, 100 to 140 mm in their second year, 140 to 200 mm in their third year, 190 to 280 mm in their fourth year (Emig 1966 and Bianchi et al. 1978; both cited in Moyle 2002). Brown bullhead were estimated to range from YOY up to approximately age 3+ (Figure 7‐14e). White catfish were estimated to fall within the YOY, 1+, and 2+ age classes (Figure 7‐14f). However, because growth rates for all bullhead and catfish species vary widely in California, the aforementioned age classes may not be entirely accurate for Merced River populations. Common carp observed in the lower Merced River were primarily larger fish (>350 mm; likely age ≥ 2+), with fish greater than 500 mm (likely age 4+) the most commonly observed during the surveys. The smallest carp observed were between 126 and 150 mm (Figure 7‐14g). Literature suggests YOY carp average 100 to 150 mm; age 1+ carp may double in length and add 100 to 120 mm in each following year, although growth tends to slow down after the fourth or fifth year (Moyle 2002). Goldfish were observed in low numbers and had nearly equal representatives of each age class from YOY to possible age 6+ adults, therefore there is no length‐frequency histogram presented for goldfish. Goldfish observed during the Merced Alliance surveys ranged in length from approximately 26 to 400 mm. Goldfish growth rates are highly variable; in California young typically reach 50 to 90 mm in their first year and normal growth in subsequent years is 15 to 25 mm/year, the amount decreasing with age (Moyle 2002). Hitch observations in the lower Merced River during the 2006–2008 surveys were limited to YOY fish less than 100 mm in length, and no length‐frequency histogram is presented for this species. Sacramento pikeminnow and hardhead observed in the lower Merced River ranged between 0 to 25 mm and 500+ mm (Figure 7‐14h), and between 0 to 25 mm and 376 to 400 mm (Figure 7‐14i), respectively. Sacramento pikeminnow typically reach 50 to 85 mm standard length at the end of their first year, 100 to 150 mm at the end of their second year, 170 to 250 at the end of their third year, 240 to 270 mm at the end of their

The Merced River Alliance Project Final Report Volume II: Biological Monitoring and Assessment
Stillwater Sciences
7‐20
fourth year, and 260 to 350 mm at the end of their fifth year (Mulligan 1975, Moyle et al. 1983, Brown and Moyle 1996, Grant 1992, Brown 1990, Tucker et al. 1998; all cited in Moyle 2002). Pikeminnow observed in the lower Merced River surveys likely ranged from YOY to age 6+. Hardhead typically reach 60 to 80 mm standard length by the end of their first year, 100 to 120 mm in their second, and 160 to 170 in their third (Reeves 1964, Moyle et al. 1983, PG&E 1985, Grant 1992, all cited in Moyle 2002). Hardhead observed in the lower Merced River surveys likely ranged from YOY to approximately age 2+. Other minnow species observed in the lower Merced River include California roach, golden shiner, and Sacramento splittail; however, observations of these three species were too low to determine age classes based on length‐frequency distributions. No length‐frequency histograms were produced for these species. California roach observed were less than 50 mm in length and were thus estimated to fall within the YOY age class based on available literature (Moyle 2002). Observed golden shiner ranged from 26 to 125 mm. Growth rates in golden shiner are highly variable, but in most cases the fish observed in the lower Merced River corresponded to the YOY and 1+ age classes (Moyle 2002). Observed Sacramento splittail lengths ranged from 201 to 375 mm and were thus likely adult fish corresponding to the 2+ through 5+ age classes (Moyle 2002). Sculpin species observed in the lower Merced River included riffle sculpin and prickly sculpin (Figure 7‐14j). Length‐frequency distributions could not be used to estimate age classes for riffle sculpin or prickly sculpin due to the slow growth rate of sculpin (Moyle 2002) and the corresponding requirement for more precise length measurements than were possible during the Merced Alliance community surveys. Riffle sculpin were observed in the lower Merced River measuring from 51 to 100 mm, which based on data collected in California spans YOY (25 to 45 mm standard length), 1+ (60 to 80 mm) and 2+ (75 to100 mm) age classes (Moyle 2002). Prickly sculpin observed in the lower river ranged from 26 to 150 mm (Figure 7‐14j). Based on data collected for prickly sculpin in the San Joaquin River this spans YOY, 1+ (51 to 71 mm), 2+ (61 to 85 mm), 3+ (64 to 90 mm), and 4+ (75 to 90 mm) age classes (Moyle 2002). Sacramento suckers observed in the lower Merced River included YOY fish to approximately 5+ (Figure 7‐14k). Annual increments in length range from 12 to 87 mm, averaging around 40 mm, although the rate slows down in older fish (Moyle 2002). The length‐frequency histogram for Sacramento sucker displayed an uneven distribution, with most observations occurring for YOY. Bass species observed in the lower Merced River included largemouth bass, spotted bass, and smallmouth bass. Largemouth bass can reach 50 to 200 mm in their first year, 70 to 320 mm in their second year, 150 to 370 mm in their third year, and 200 to 410 mm in their fourth year (Moyle 2002). Smallmouth bass measure 60 to 180 mm at the end of their first year, 140 to 270 mm at the end of their second year, 190 to 270 mm at the end

The Merced River Alliance Project Final Report Volume II: Biological Monitoring and Assessment
Stillwater Sciences
7‐21
of their third year, 250 to 410 mm at the end of their fourth year (Moyle 2002). Growth rates of spotted bass vary with habitat, but one study in Arkansas suggests they reach 50 to 170 mm in their first year, 150 to 325 mm in their second year, 205 to 405 mm in their third year, 245 to 435 mm in their fourth year, and 315 to 505 mm in their fifth year (Vogele 1975, as cited in Moyle 2002). The bass population observed in the lower Merced River included young‐of‐the‐year (YOY) and fish up to 4+ years (Figure 7‐14l–n). Both the largemouth bass and spotted bass appeared to have an age‐class distribution of predominantly YOY fish and fewer representatives of each subsequent older age class (Figure 7‐14 l,n). Smallmouth bass were observed in lower numbers than largemouth bass or spotted bass and predominantly consisted of 1+ to 3+ fish with low observations of both YOY and 4+ age class fish (Figure 7‐14m). Sunfish species observed in the lower Merced River included bluegill, redear, green sunfish and pumpkinseed. Bluegill sunfish made up the majority of observations and fish ranged from YOY to 4+ years (Figure 7‐14o). Green sunfish, redear and pumpkinseed observations were too low for length‐frequency distribution analysis and no histograms were produced. Two pumpkinseed sunfish were observed in the 126 to 150 mm size class. These fish likely fall within the 3+ age class, based on available literature (Moyle 2002). Black crappie observed in the lower Merced River were too uncommon to determine age class based on length‐frequency distributions, and no histogram was produced. Black crappie ranged in length from 76 to 200 mm. Based on available literature, the black crappie observed were likely YOY and 1+ fish (Moyle 2002). Bigscale logperch ranged from 51 mm to 125 mm, and according to available literature, these fish are likely YOY and 1+ fish (Moyle 2002). Observations of this species were too few and no histogram was produced. Striped bass were observed in the lower Merced River, but due to low numbers the length‐frequency distribution data could not be used to determine age classes. Large numbers of mosquitofish measuring less than or equal to 75 mm were observed on the lower Merced River. Mosquitofish rarely live more than 15 months (Moyle 2002), and thus the mosquitofish observed during the Merced Alliance surveys were YOY and 1+ age class. 7.3.1.2 Upper River In the upper river segment, 4,003 individual fish belonging to 13 species were observed during the 2006–2007 seasonal surveys (Figure 7‐6). Of these, 3,787 (95%) were identifiable to species, and hence were able to be categorized as native or introduced (Table 7‐7). Fish community composition in the upper river segment included only resident species, because the foothill dams currently restrict anadromous fish to the
The Merced River Alliance Project Final Report Volume II: Biological Monitoring and Assessment
Stillwater Sciences
7‐22
lower Merced River. Similar to the lower river segment, a greater number of introduced species were observed (62% or 8 of 13) as compared with native species (38% or 5 of 13). However, unlike in the lower river segment, the abundance of native fish in the upper river segment (2,633 of 3,787) was more than twice as great as that of introduced fish species (1,154 of 3,787) (Table 7‐7). As in the lower river segment, Sacramento sucker was highly abundant; however, other native species, including O. mykiss (rainbow trout), hardhead, and Sacramento pikeminnow, also composed a large fraction of the total fish observed in the upper river segment (Figure 7‐15 and Figure 7‐16). The introduced smallmouth bass were also seen at relatively high numbers, (783 of 3,787 individuals]) in the upper river (Figure 7‐6). Spotted and largemouth bass, which were a relatively greater percentage of bass in the lower river, were less than 5% of total sample size during the upper river surveys (Figure 7‐6). Brown trout, an introduced species commonly stocked in the upper Merced River (NPS 2000), and redeye bass both represented less than 5% of total sample size, and were the only fish species observed exclusively in the upper Merced River (Figure 7‐6). Estimated Linear Density Linear density estimates (number of fish per 100 m) for the upper segment are presented by reach in Figure 7‐7. As shown by the wide range of values and statistical outliers in the box plot for each reach, estimated linear fish density values in the upper river exhibited high variability, as described previously for the lower river segment. This was particularly evident in the Yosemite Valley Reach, where estimated linear abundance ranged across four orders of magnitude. Overall in the upper river during fall 2006–2007 surveys, intra‐reach variability was slightly less than variability between the reaches (p=0.03 Kruskal‐Wallis nonparametric ranking test alternative to ANOVA). However, rather than attributing this to independent reach‐scale behavior, visual inspection of Figure 7‐7 suggests that there were similarities between median linear density and observation variability in the Upper Foothills 3 and 2 Reaches and the Upper Foothills 1 and Lower Batholith Reaches. The Yosemite Valley Reach exhibited the most consistently variable linear density as well as having the lowest median linear density estimate during the fall 2006–2007 surveys. Species Richness, Diversity, and Percent Composition During fall 2006 and 2007, calculated indices in the upper river segment exhibited a general pattern where species richness was highest (> 8) in the Upper Foothills 3 Reach, immediately upstream of Lake McClure, and decreased with distance upstream (Figure 7‐15a and Figure 7‐16a). Consistently low richness values (3–4) were observed in the Yosemite Valley Reach. In 2006, reach‐scale species diversity corresponded roughly to species richness, indicating a roughly equal distribution of individuals across the species present in each reach. In contrast, species diversity during 2007 changed only slightly across reaches, while species richness decreased from the Upper Foothill reaches through Yosemite Valley as Sacramento sucker and O. mykiss (rainbow trout) became
The Merced River Alliance Project Final Report Volume II: Biological Monitoring and Assessment
Stillwater Sciences
7‐23
generally more abundant and the number of introduced bass and carp became less abundant. Comparison between 2006 and 2007 indicates that under lower flow conditions (e.g., 2007), warm‐water species such as bass and carp were dominant species in the Upper Foothills 3 and 2 reaches, and were co‐dominant in the Upper Foothills 1 Reach, while under higher flow conditions (e.g., 2006), these species were co‐dominant further downstream in the Upper Foothills 3 Reach (Figure 7‐15b and Figure 7‐16b). Hardhead and pikeminnow were generally more abundant in the upstream reaches (e.g., Lower Batholith, Yosemite Valley) during the 2006 surveys, but were also found in the downstream reaches (e.g., Upper Foothills 3, Upper Foothills 2, and Upper Foothills 1) in both survey years. Hardhead were most abundant in the Upper Foothills 1 Reach in both years, and had notably high (228 of the 1384 total individuals observed) relative abundance in 2006. Brown trout were observed in the Upper Foothills 1 Reach during the 2006 surveys, and the Lower Batholith and Yosemite Valley reaches during both the 2006 and 2007 surveys. During the 2006 surveys they were the numerically dominant species in the Yosemite Valley Reach (57% of total composition) and made up 25% of the individuals observed in the 2007 surveys. Spotted bass, redeye bass, and sculpin were observed at lower relative abundances. Largemouth bass, common carp, and brown bullhead were only observed in the Upper Foothills 3 Reach during both survey years. Length‐frequency Distributions by Species As detailed earlier in this section, 13 fish species from six different families were observed during the upper Merced River fish surveys. Histograms of length‐frequencies at 25‐mm intervals were generated for species observed in sufficient numbers and analyzed to determine length‐frequency modes. Following Murphy and Willis 1996, modes were used to estimate component age classes for each species. For species with low overall observations or low observations within particular length groups, age classes were determined using available literature references of common length ranges for a given age class. Trout species observed in the upper Merced River included both O. mykiss (rainbow trout) and brown trout. In small, high‐gradient streams, rainbow trout in California typically reach 75 mm at the end of their first year, 140 mm at the end of their second year, 190 mm at the end of their third year, and 235 mm at the end of their fourth year (Snider and Linden 1981, as cited in Moyle 2002). In warm low‐gradient streams, they may reach 90 to100 mm fork length in the first year, 150 to 210 mm in the second year, 210 to 300 mm in the third year, and 300 mm or more in the fourth year (Moyle 2002). O. mykiss (rainbow trout) were the most commonly observed of the two species and ranged from YOY up to approximately age 5+ with the majority of fish falling within the 2+ and 3+ age classes (Figure 7‐17a). Brown trout growth in California is variable with fish able to reach 30 to 80 mm in their first year, 70to 220 mm (usually 130 to 160 mm) in their second year, 130 to 360 mm (usually 190 to 280 mm) in their third year, and 230 to 450
The Merced River Alliance Project Final Report Volume II: Biological Monitoring and Assessment
Stillwater Sciences
7‐24
mm (usually 350 to 410 mm) in their fourth year (Carlander 1969, as cited in Moyle 2002). Length‐frequency distribution for brown trout exhibited a relatively even distribution of age classes, ranging from YOY to age 5+ (Figure 7‐17b). Bullhead and catfish species were observed in the upper Merced River but, due to low numbers, length‐frequency distribution data could not be used to determine age classes and no length‐frequency histograms were produced. These fish measured from 251 to 350 mm. Common carp observed in the upper Merced River were primarily larger fish (>325 mm), with most exceeding 500 mm. The smallest common carp observed during the fish surveys were between 276 and 300 mm, indicating that adult fish made up a majority of the observations (Figure 7‐17c). The size of Sacramento pikeminnow and hardhead observed in the upper Merced River indicate an uneven age class distribution (Figure 7‐17d,e). Hardhead abundance was greatest in the YOY age class, with lower numbers of fish in the 2+ to 5+ age classes (Figure 7‐17d). Sacramento pikeminnow and hardhead estimated to fall within the 1+ age class were not observed in the upper Merced River Sacramento suckers observed in the upper Merced River ranged in age from YOY fish to approximately age 5+. The length‐frequency histogram for Sacramento suckers shows an uneven distribution, with YOY and adult fish 4+ and older occurring most frequently. Relatively few Sacramento suckers were observed in the size range corresponding to the 1+ and 2+ age classes (Figure 7‐17f). Bass species observed in the upper Merced River included largemouth bass, redeye bass, smallmouth bass, and spotted bass. Smallmouth bass were the most commonly observed of the bass species in the upper Merced River. The size of smallmouth bass corresponded to age classes ranging from YOY to 4+, the greatest abundance in the YOY to 2+ age classes (Figure 7‐17h). Largemouth bass and redeye bass were most common in the 1+ to 3+ age classes (Figure 7‐17g and Figure 7‐17i, respectively). Abundance of spotted bass was the lowest of the bass species, and sizes corresponded to a range from YOY to age 3+. Due to low numbers, no histogram was produced for spotted bass. Sculpin species were observed in the upper Merced River but, due to low numbers, length‐frequency distribution data could not be used to determine age classes and no length‐frequency histograms were produced. Sculpin observed in the upper Merced River measured from 26 to 150 mm.
The Merced River Alliance Project Final Report Volume II: Biological Monitoring and Assessment
Stillwater Sciences
7‐25
7.3.2 Fish Community Assemblages At the basin scale, results of both the exploratory hierarchical agglomerative and divisive cluster analysis techniques for determining possible fish community assemblages in the Merced River identified two general groups (Figure 7‐18):
• Group 1 ‐ bluegill, carp, largemouth bass, and spotted bass; • Group 2 ‐ hardhead, smallmouth bass, O. mykiss, and Sacramento sucker
Overall, there was a general conformity to the broader water temperature assemblages (see Table 7‐8 for definitions). For example, Group 1 shown above possesses four warm‐water species and one transitional species (spotted bass) while Group 2 possesses three transitional species and one cold‐water species (O. mykiss), suggesting a segment‐scale grouping with predominantly warm‐water species and some transitional species in the lower river segment, and predominantly transitional and some cold‐water species in the upper river segment. Beyond these two groups, two native species pairs were consistently grouped together: hitch/roach and prickly sculpin/riffle sculpin; however the fish species in these two pairs were relatively rare in the data set. Fish species composition in the Merced River is shown in more detail in Table 7‐8, where species’ presence is indicated by reach and sampling season. Warm‐water species, most of which are included in Moyle’s (2002) deep‐bodied fishes community, include bass, sunfish, and catfish. Warm‐water species were observed throughout the lower segment of the Merced River with some species also observed in the lower reaches of the upper river segment (e.g., bass, brown bullhead, and carp) (Table 7‐8). Cold‐water species, generally corresponding with Moyle’s (2002) rainbow trout assemblage, include brown trout and rainbow trout. Cold‐water species were observed in the upper segment of the Merced River, with O. mykiss (rainbow trout) also observed in the upper reaches of the lower river segment. Transitional‐zone fish species, most belonging to Moyle’s (2002) pikeminnow–hardhead–sucker assemblage, are more adapted to the variable water temperature between the warm‐water and cold‐water zones and include minnows (Sacramento pikeminnow, hardhead, roach), sculpin (prickly and riffle), and Sacramento suckers. Transitional‐zone species were observed throughout the Merced River during all sampling seasons (Table 7‐8). As indicated by results of the cluster analyses, the initial attempt to allow the data to prescribe groupings of fish species did not appear to support the SJRD community assemblages defined by Brown et al. (2003) and was only broadly supportive of the fish assemblages defined in Moyle (2002). Despite this, estimated linear density values for fish species observed in the Merced River during the 2006–2008 surveys were organized using an expanded version of the SJRD community assemblage model (Brown et al. 2003) (see Table 5‐11 for assemblage definitions), plotted by river mile and season, and visually inspected to identify potential seasonal or other trends not captured by the cluster analysis (Figure 7‐19).
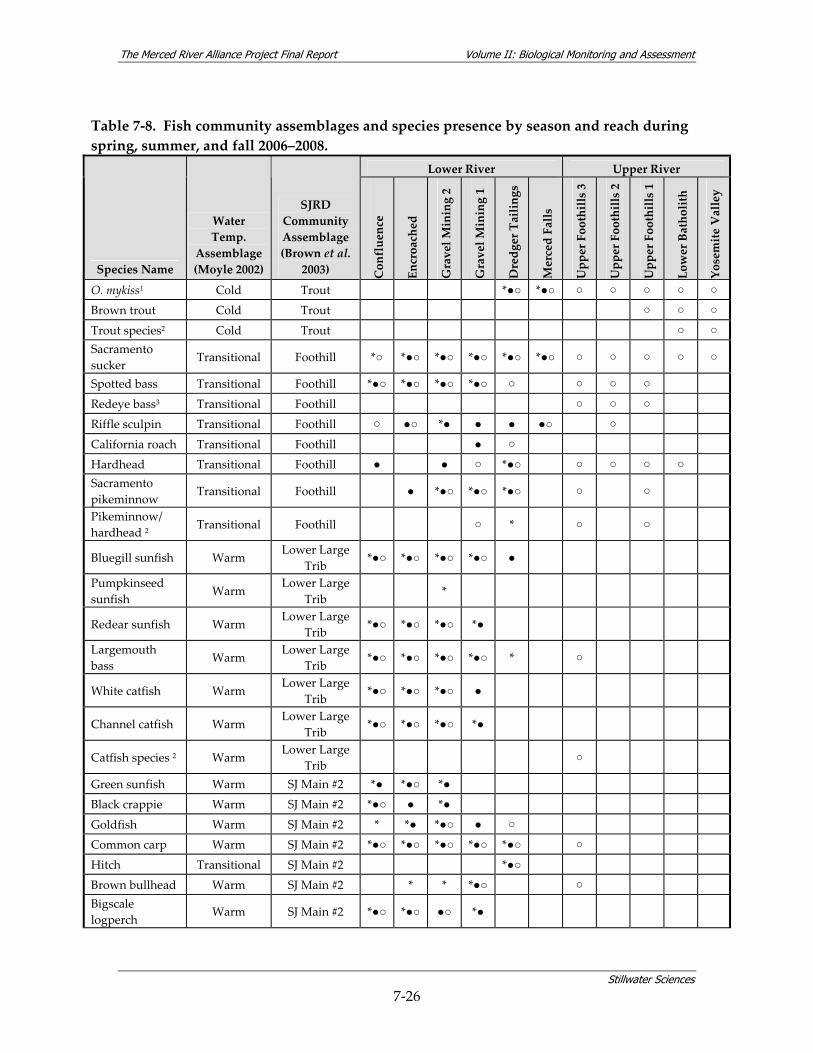
The Merced River Alliance Project Final Report Volume II: Biological Monitoring and Assessment
Stillwater Sciences
7‐26
Table 7‐8. Fish community assemblages and species presence by season and reach during spring, summer, and fall 2006–2008.
Lower River Upper River
Species Name
Water Temp.
Assemblage (Moyle 2002)
SJRD Community Assemblage(Brown et al.
2003) Confluence
Encroached
Gravel M
ining 2
Gravel M
ining 1
Dredger Tailings
Merced Falls
Upper Foothills 3
Upper Foothills 2
Upper Foothills 1
Lower Batholith
Yosemite Valley
O. mykiss1 Cold Trout *●○ *●○ ○ ○ ○ ○ ○
Brown trout Cold Trout ○ ○ ○
Trout species2 Cold Trout ○ ○ Sacramento sucker
Transitional Foothill *○ *●○ *●○ *●○ *●○ *●○ ○ ○ ○ ○ ○
Spotted bass Transitional Foothill *●○ *●○ *●○ *●○ ○ ○ ○ ○
Redeye bass3 Transitional Foothill ○ ○ ○
Riffle sculpin Transitional Foothill ○ ●○ *● ● ● ●○ ○
California roach Transitional Foothill ● ○
Hardhead Transitional Foothill ● ● ○ *●○ ○ ○ ○ ○ Sacramento pikeminnow
Transitional Foothill ● *●○ *●○ *●○ ○ ○
Pikeminnow/ hardhead 2
Transitional Foothill ○ * ○ ○
Bluegill sunfish Warm Lower Large
Trib *●○ *●○ *●○ *●○ ●
Pumpkinseed sunfish
Warm Lower Large
Trib *
Redear sunfish Warm Lower Large
Trib *●○ *●○ *●○ *●
Largemouth bass
Warm Lower Large
Trib *●○ *●○ *●○ *●○ * ○
White catfish Warm Lower Large
Trib *●○ *●○ *●○ ●
Channel catfish Warm Lower Large
Trib *●○ *●○ *●○ *●
Catfish species 2 Warm Lower Large
Trib ○
Green sunfish Warm SJ Main #2 *● *●○ *●
Black crappie Warm SJ Main #2 *●○ ● *●
Goldfish Warm SJ Main #2 * *● *●○ ● ○
Common carp Warm SJ Main #2 *●○ *●○ *●○ *●○ *●○ ○
Hitch Transitional SJ Main #2 *●○
Brown bullhead Warm SJ Main #2 * * *●○ ○ Bigscale logperch
Warm SJ Main #2 *●○ *●○ ●○ *●
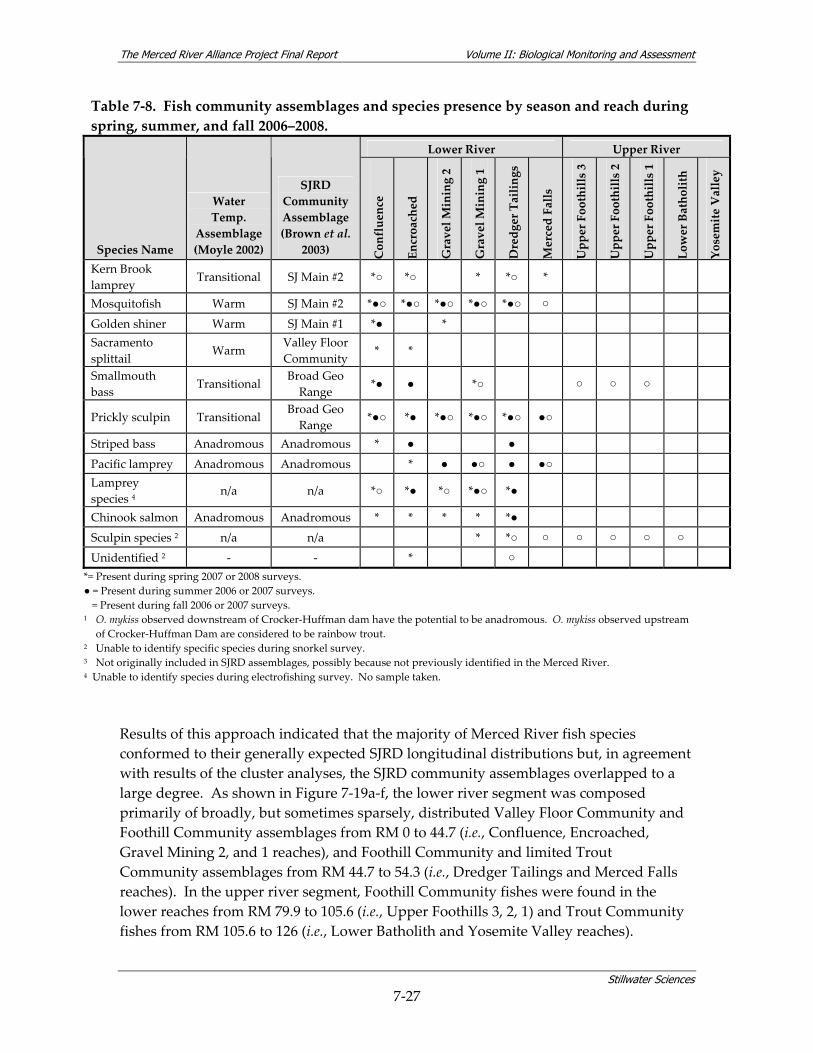
The Merced River Alliance Project Final Report Volume II: Biological Monitoring and Assessment
Stillwater Sciences
7‐27
Table 7‐8. Fish community assemblages and species presence by season and reach during spring, summer, and fall 2006–2008.
Lower River Upper River
Species Name
Water Temp.
Assemblage (Moyle 2002)
SJRD Community Assemblage(Brown et al.
2003) Confluence
Encroached
Gravel M
ining 2
Gravel M
ining 1
Dredger Tailings
Merced Falls
Upper Foothills 3
Upper Foothills 2
Upper Foothills 1
Lower Batholith
Yosemite Valley
Kern Brook lamprey
Transitional SJ Main #2 *○ *○ * *○ *
Mosquitofish Warm SJ Main #2 *●○ *●○ *●○ *●○ *●○ ○
Golden shiner Warm SJ Main #1 *● * Sacramento splittail
Warm Valley Floor Community
* *
Smallmouth bass
Transitional Broad Geo Range
*● ● *○ ○ ○ ○
Prickly sculpin Transitional Broad Geo Range
*●○ *● *●○ *●○ *●○ ●○
Striped bass Anadromous Anadromous * ● ●
Pacific lamprey Anadromous Anadromous * ● ●○ ● ●○ Lamprey species 4
n/a n/a *○ *● *○ *●○ *●
Chinook salmon Anadromous Anadromous * * * * *●
Sculpin species 2 n/a n/a * *○ ○ ○ ○ ○ ○
Unidentified 2 ‐ ‐ * ○ *= Present during spring 2007 or 2008 surveys. ● = Present during summer 2006 or 2007 surveys. � = Present during fall 2006 or 2007 surveys. 1 O. mykiss observed downstream of Crocker‐Huffman dam have the potential to be anadromous. O. mykiss observed upstream
of Crocker‐Huffman Dam are considered to be rainbow trout. 2 Unable to identify specific species during snorkel survey. 3 Not originally included in SJRD assemblages, possibly because not previously identified in the Merced River. 4 Unable to identify species during electrofishing survey. No sample taken.
Results of this approach indicated that the majority of Merced River fish species conformed to their generally expected SJRD longitudinal distributions but, in agreement with results of the cluster analyses, the SJRD community assemblages overlapped to a large degree. As shown in Figure 7‐19a‐f, the lower river segment was composed primarily of broadly, but sometimes sparsely, distributed Valley Floor Community and Foothill Community assemblages from RM 0 to 44.7 (i.e., Confluence, Encroached, Gravel Mining 2, and 1 reaches), and Foothill Community and limited Trout Community assemblages from RM 44.7 to 54.3 (i.e., Dredger Tailings and Merced Falls reaches). In the upper river segment, Foothill Community fishes were found in the lower reaches from RM 79.9 to 105.6 (i.e., Upper Foothills 3, 2, 1) and Trout Community fishes from RM 105.6 to 126 (i.e., Lower Batholith and Yosemite Valley reaches).
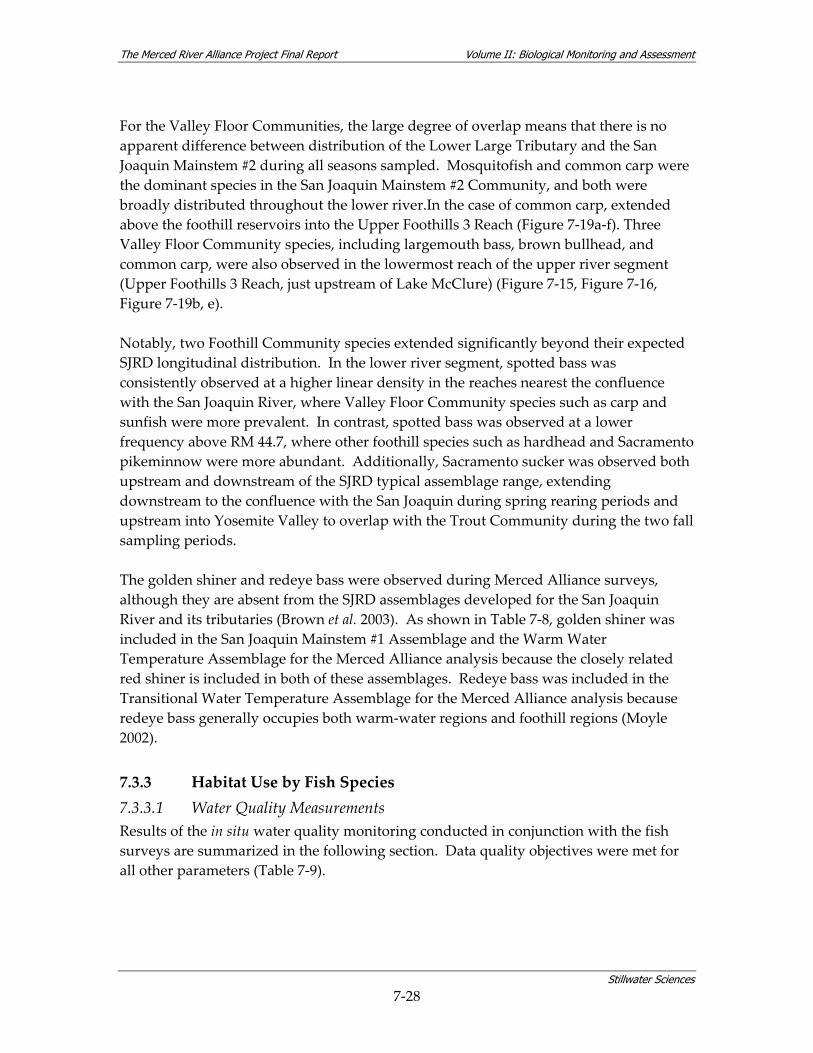
The Merced River Alliance Project Final Report Volume II: Biological Monitoring and Assessment
Stillwater Sciences
7‐28
For the Valley Floor Communities, the large degree of overlap means that there is no apparent difference between distribution of the Lower Large Tributary and the San Joaquin Mainstem #2 during all seasons sampled. Mosquitofish and common carp were the dominant species in the San Joaquin Mainstem #2 Community, and both were broadly distributed throughout the lower river.In the case of common carp, extended above the foothill reservoirs into the Upper Foothills 3 Reach (Figure 7‐19a‐f). Three Valley Floor Community species, including largemouth bass, brown bullhead, and common carp, were also observed in the lowermost reach of the upper river segment (Upper Foothills 3 Reach, just upstream of Lake McClure) (Figure 7‐15, Figure 7‐16, Figure 7‐19b, e). Notably, two Foothill Community species extended significantly beyond their expected SJRD longitudinal distribution. In the lower river segment, spotted bass was consistently observed at a higher linear density in the reaches nearest the confluence with the San Joaquin River, where Valley Floor Community species such as carp and sunfish were more prevalent. In contrast, spotted bass was observed at a lower frequency above RM 44.7, where other foothill species such as hardhead and Sacramento pikeminnow were more abundant. Additionally, Sacramento sucker was observed both upstream and downstream of the SJRD typical assemblage range, extending downstream to the confluence with the San Joaquin during spring rearing periods and upstream into Yosemite Valley to overlap with the Trout Community during the two fall sampling periods. The golden shiner and redeye bass were observed during Merced Alliance surveys, although they are absent from the SJRD assemblages developed for the San Joaquin River and its tributaries (Brown et al. 2003). As shown in Table 7‐8, golden shiner was included in the San Joaquin Mainstem #1 Assemblage and the Warm Water Temperature Assemblage for the Merced Alliance analysis because the closely related red shiner is included in both of these assemblages. Redeye bass was included in the Transitional Water Temperature Assemblage for the Merced Alliance analysis because redeye bass generally occupies both warm‐water regions and foothill regions (Moyle 2002).
7.3.3 Habitat Use by Fish Species 7.3.3.1 Water Quality Measurements Results of the in situ water quality monitoring conducted in conjunction with the fish surveys are summarized in the following section. Data quality objectives were met for all other parameters (Table 7‐9).
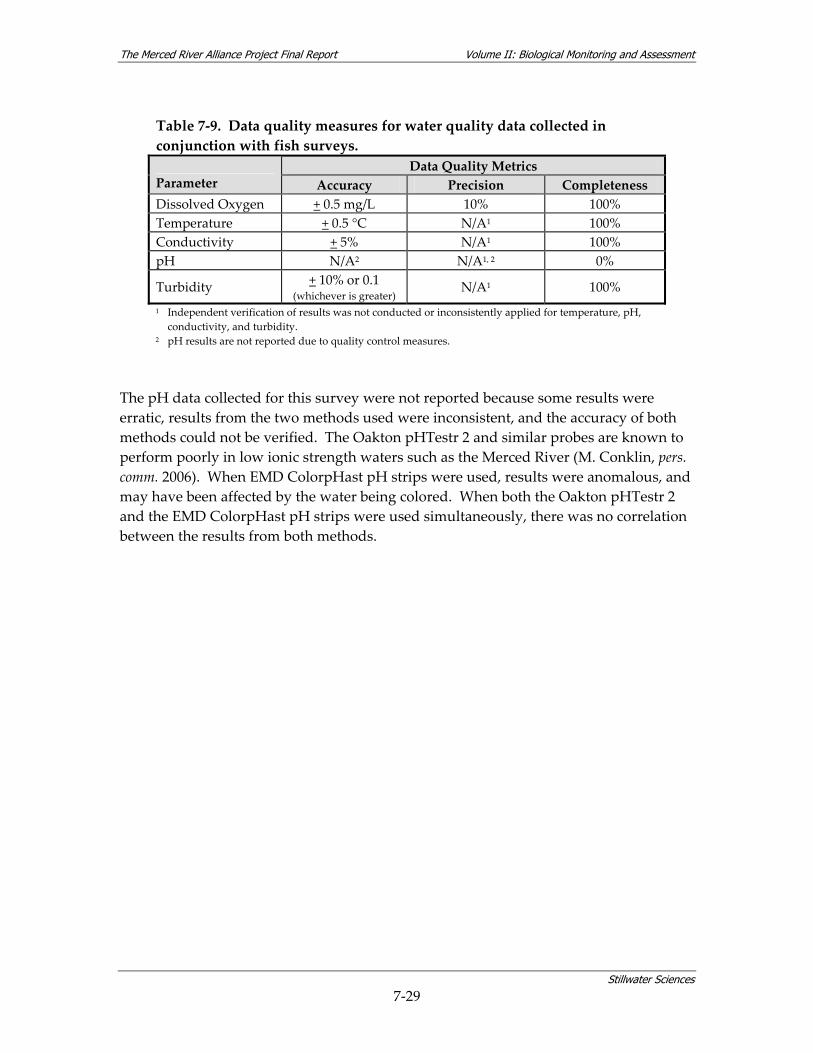
The Merced River Alliance Project Final Report Volume II: Biological Monitoring and Assessment
Stillwater Sciences
7‐29
Table 7‐9. Data quality measures for water quality data collected in conjunction with fish surveys.
Data Quality Metrics Parameter Accuracy Precision Completeness Dissolved Oxygen + 0.5 mg/L 10% 100% Temperature + 0.5 °C N/A1 100% Conductivity + 5% N/A1 100% pH N/A2 N/A1, 2 0%
Turbidity + 10% or 0.1 (whichever is greater) N/A1 100%
1 Independent verification of results was not conducted or inconsistently applied for temperature, pH, conductivity, and turbidity.
2 pH results are not reported due to quality control measures.
The pH data collected for this survey were not reported because some results were erratic, results from the two methods used were inconsistent, and the accuracy of both methods could not be verified. The Oakton pHTestr 2 and similar probes are known to perform poorly in low ionic strength waters such as the Merced River (M. Conklin, pers. comm. 2006). When EMD ColorpHast pH strips were used, results were anomalous, and may have been affected by the water being colored. When both the Oakton pHTestr 2 and the EMD ColorpHast pH strips were used simultaneously, there was no correlation between the results from both methods.
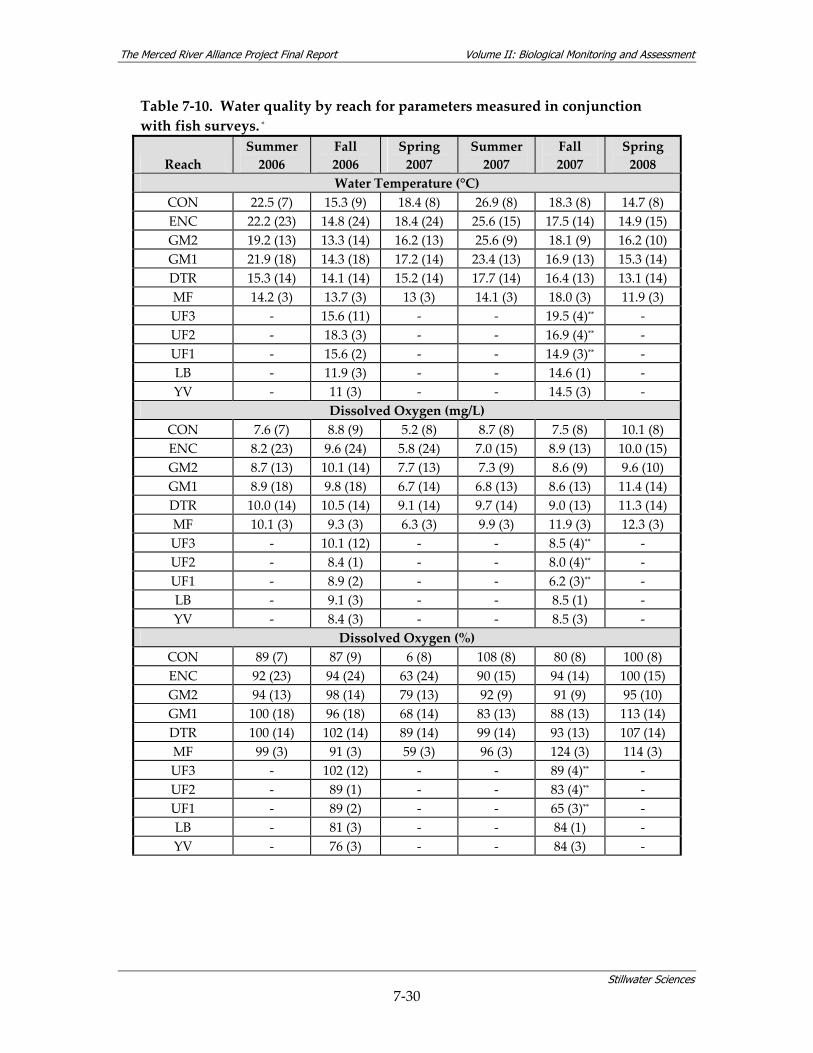
The Merced River Alliance Project Final Report Volume II: Biological Monitoring and Assessment
Stillwater Sciences
7‐30
Table 7‐10. Water quality by reach for parameters measured in conjunction with fish surveys. *
Reach Summer 2006
Fall 2006
Spring 2007
Summer 2007
Fall 2007
Spring 2008
Water Temperature (°C) CON 22.5 (7) 15.3 (9) 18.4 (8) 26.9 (8) 18.3 (8) 14.7 (8) ENC 22.2 (23) 14.8 (24) 18.4 (24) 25.6 (15) 17.5 (14) 14.9 (15) GM2 19.2 (13) 13.3 (14) 16.2 (13) 25.6 (9) 18.1 (9) 16.2 (10) GM1 21.9 (18) 14.3 (18) 17.2 (14) 23.4 (13) 16.9 (13) 15.3 (14) DTR 15.3 (14) 14.1 (14) 15.2 (14) 17.7 (14) 16.4 (13) 13.1 (14) MF 14.2 (3) 13.7 (3) 13 (3) 14.1 (3) 18.0 (3) 11.9 (3) UF3 ‐ 15.6 (11) ‐ ‐ 19.5 (4)** ‐ UF2 ‐ 18.3 (3) ‐ ‐ 16.9 (4)** ‐ UF1 ‐ 15.6 (2) ‐ ‐ 14.9 (3)** ‐ LB ‐ 11.9 (3) ‐ ‐ 14.6 (1) ‐ YV ‐ 11 (3) ‐ ‐ 14.5 (3) ‐
Dissolved Oxygen (mg/L) CON 7.6 (7) 8.8 (9) 5.2 (8) 8.7 (8) 7.5 (8) 10.1 (8) ENC 8.2 (23) 9.6 (24) 5.8 (24) 7.0 (15) 8.9 (13) 10.0 (15) GM2 8.7 (13) 10.1 (14) 7.7 (13) 7.3 (9) 8.6 (9) 9.6 (10) GM1 8.9 (18) 9.8 (18) 6.7 (14) 6.8 (13) 8.6 (13) 11.4 (14) DTR 10.0 (14) 10.5 (14) 9.1 (14) 9.7 (14) 9.0 (13) 11.3 (14) MF 10.1 (3) 9.3 (3) 6.3 (3) 9.9 (3) 11.9 (3) 12.3 (3) UF3 ‐ 10.1 (12) ‐ ‐ 8.5 (4)** ‐ UF2 ‐ 8.4 (1) ‐ ‐ 8.0 (4)** ‐ UF1 ‐ 8.9 (2) ‐ ‐ 6.2 (3)** ‐ LB ‐ 9.1 (3) ‐ ‐ 8.5 (1) ‐ YV ‐ 8.4 (3) ‐ ‐ 8.5 (3) ‐
Dissolved Oxygen (%) CON 89 (7) 87 (9) 6 (8) 108 (8) 80 (8) 100 (8) ENC 92 (23) 94 (24) 63 (24) 90 (15) 94 (14) 100 (15) GM2 94 (13) 98 (14) 79 (13) 92 (9) 91 (9) 95 (10) GM1 100 (18) 96 (18) 68 (14) 83 (13) 88 (13) 113 (14) DTR 100 (14) 102 (14) 89 (14) 99 (14) 93 (13) 107 (14) MF 99 (3) 91 (3) 59 (3) 96 (3) 124 (3) 114 (3) UF3 ‐ 102 (12) ‐ ‐ 89 (4)** ‐ UF2 ‐ 89 (1) ‐ ‐ 83 (4)** ‐ UF1 ‐ 89 (2) ‐ ‐ 65 (3)** ‐ LB ‐ 81 (3) ‐ ‐ 84 (1) ‐ YV ‐ 76 (3) ‐ ‐ 84 (3) ‐
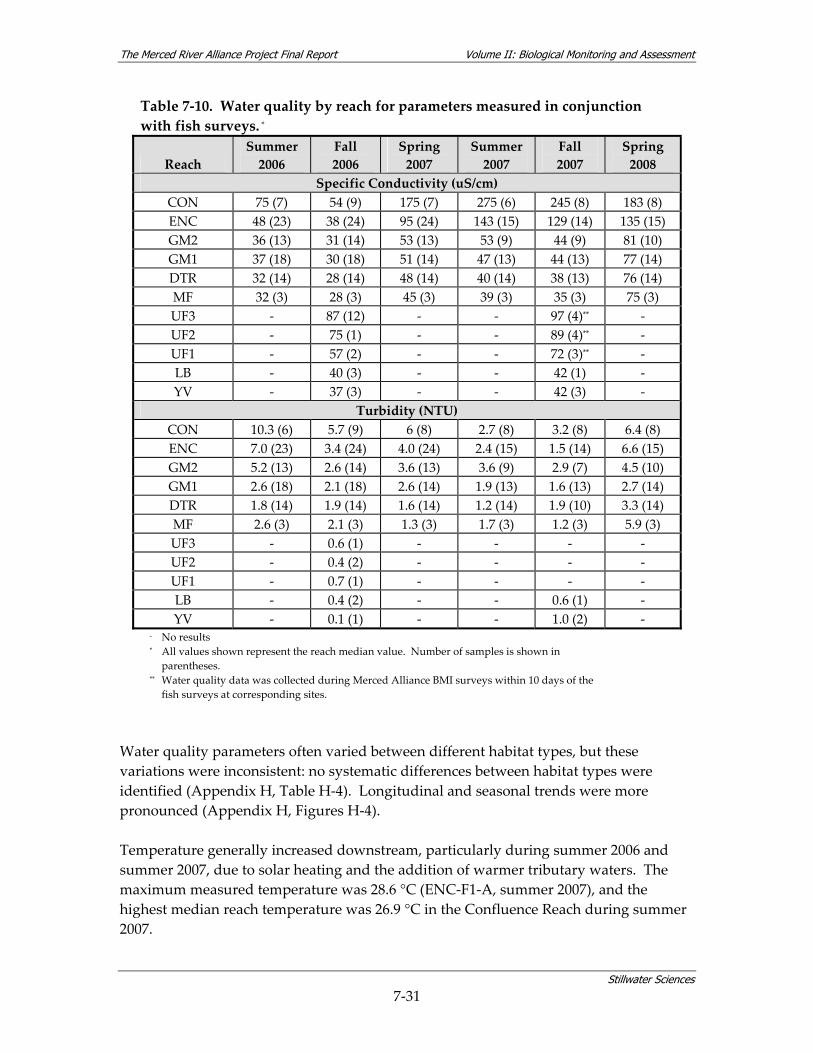
The Merced River Alliance Project Final Report Volume II: Biological Monitoring and Assessment
Stillwater Sciences
7‐31
Table 7‐10. Water quality by reach for parameters measured in conjunction with fish surveys. *
Reach Summer 2006
Fall 2006
Spring 2007
Summer 2007
Fall 2007
Spring 2008
Specific Conductivity (uS/cm) CON 75 (7) 54 (9) 175 (7) 275 (6) 245 (8) 183 (8) ENC 48 (23) 38 (24) 95 (24) 143 (15) 129 (14) 135 (15) GM2 36 (13) 31 (14) 53 (13) 53 (9) 44 (9) 81 (10) GM1 37 (18) 30 (18) 51 (14) 47 (13) 44 (13) 77 (14) DTR 32 (14) 28 (14) 48 (14) 40 (14) 38 (13) 76 (14) MF 32 (3) 28 (3) 45 (3) 39 (3) 35 (3) 75 (3) UF3 ‐ 87 (12) ‐ ‐ 97 (4)** ‐ UF2 ‐ 75 (1) ‐ ‐ 89 (4)** ‐ UF1 ‐ 57 (2) ‐ ‐ 72 (3)** ‐ LB ‐ 40 (3) ‐ ‐ 42 (1) ‐ YV ‐ 37 (3) ‐ ‐ 42 (3) ‐
Turbidity (NTU) CON 10.3 (6) 5.7 (9) 6 (8) 2.7 (8) 3.2 (8) 6.4 (8) ENC 7.0 (23) 3.4 (24) 4.0 (24) 2.4 (15) 1.5 (14) 6.6 (15) GM2 5.2 (13) 2.6 (14) 3.6 (13) 3.6 (9) 2.9 (7) 4.5 (10) GM1 2.6 (18) 2.1 (18) 2.6 (14) 1.9 (13) 1.6 (13) 2.7 (14) DTR 1.8 (14) 1.9 (14) 1.6 (14) 1.2 (14) 1.9 (10) 3.3 (14) MF 2.6 (3) 2.1 (3) 1.3 (3) 1.7 (3) 1.2 (3) 5.9 (3) UF3 ‐ 0.6 (1) ‐ ‐ ‐ ‐ UF2 ‐ 0.4 (2) ‐ ‐ ‐ ‐ UF1 ‐ 0.7 (1) ‐ ‐ ‐ ‐ LB ‐ 0.4 (2) ‐ ‐ 0.6 (1) ‐ YV ‐ 0.1 (1) ‐ ‐ 1.0 (2) ‐
‐ No results * All values shown represent the reach median value. Number of samples is shown in
parentheses. ** Water quality data was collected during Merced Alliance BMI surveys within 10 days of the
fish surveys at corresponding sites.
Water quality parameters often varied between different habitat types, but these variations were inconsistent: no systematic differences between habitat types were identified (Appendix H, Table H‐4). Longitudinal and seasonal trends were more pronounced (Appendix H, Figures H‐4). Temperature generally increased downstream, particularly during summer 2006 and summer 2007, due to solar heating and the addition of warmer tributary waters. The maximum measured temperature was 28.6 °C (ENC‐F1‐A, summer 2007), and the highest median reach temperature was 26.9 °C in the Confluence Reach during summer 2007.
The Merced River Alliance Project Final Report Volume II: Biological Monitoring and Assessment
Stillwater Sciences
7‐32
Dissolved oxygen levels were variable between monitoring sites and within habitat units. The maximum dissolved oxygen concentration measured was 13.3 mg/L (MF‐F1‐C, spring 2008) and the minimum concentration measured was 0.9 mg/L (GM1‐F4‐B, fall 2007). Dissolved oxygen levels were consistently lowest during spring 2007, particularly at the most downstream reaches (i.e., Encroached and Confluence reaches), where reach median dissolved oxygen concentrations were 5.8 mg/L and 5.2 mg/L, respectively. Dissolved oxygen saturations were generally below 75% in spring 2007, indicating that temperature was not responsible for the low dissolved oxygen levels. Similarly, dissolved oxygen levels were generally lower during summer 2007 than during summer 2006. In contrast, dissolved oxygen levels were unusually high during spring 2008, with reach median dissolved oxygen concentrations ranging from 9.6 (Gravel Mining 2 Reach) to 12.3 mg/L (Merced Falls Reach). The pH levels measured with the Oakton pHTestr 2 (all seasons except spring 2007) generally ranged between pH 7 and 8. During spring 2007, the EMD ColorpHast pH strips were used, and all measured values were between pH 5 and 6. Longitudinal trends in pH levels were minor. During spring 2008, both methods were used and yielded inconsistent results ranging from about pH 6 to 10. In the lower river segment, conductivity values increased downstream of the Gravel Mining 2 Reach, with the highest reach median conductivity in the lower river consistently occurring in the Confluence Reach, and the second highest consistently occurring in the Encroached Reach. The observed downstream increase in conductivity was larger in 2007 and 2008 than in 2006. During summer and fall 2007, reach median conductivities in the Confluence Reach (275 uS/cm and 245 uS/cm, respectively) were about 5 times reach median conductivities in the Gravel Mining 2 Reach (53 uS/cm and 44 uS/cm, respectively). In the upper river segment, sufficient data to assess longitudinal conductivity trends were collected only during fall 2006. Reach median conductivities increased progressively downstream, ranging from 37 uS/cm in the Yosemite Valley Reach to 87 uS/cm in the Upper Foothills 3 Reach. Turbidity gradually increased from upstream to downstream monitoring sites across all seasons sampled. Reach median turbidity levels in the Encroached and Confluence reaches were greater than 5 NTU. In all other reaches, median turbidity levels were less than 5 NTU, except during spring 2008 in the Merced Falls Reach when reach median turbidity was 5.9 NTU and during summer 2006 in the Gravel Mining 2 reach when reach median turbidity was 6.7 NTU. The maximum measured turbidity across the entire study was 14.6 NTU, measured in the Confluence Reach at site CON‐F3‐D, during fall 2007. The increasing conductivity and turbidity levels observed downstream of the Gravel Mining 2 Reach indicate the addition of particulate matter and minerals in this reach of
The Merced River Alliance Project Final Report Volume II: Biological Monitoring and Assessment
Stillwater Sciences
7‐33
the river. The cities of Livingston and Delhi, located along the north and south banks of the Merced River within the Gravel Mining 2 Reach, discharge municipal wastewater, poultry farm runoff, general agricultural runoff, and a variety of other anthropogenic sources, that may be responsible for these changes in water quality. The overall low dissolved oxygen levels (< 6 mg/L) observed in the lower river segment during spring 2007 may have been caused by respiratory depletion of oxygen from bacterial respiration. Such high levels of respiration could have been a result of a large algal bloom in the river, or in proximal agricultural drainage canals, prior to the Merced Alliance spring survey. However no reports of such an occurrence were confirmed. Alternatively, an unanticipated point discharge in the lower river segment may have caused the low dissolved oxygen during spring 2007. Conversely, the high dissolved oxygen levels detected during spring 2008 were too high to be attributable to temperature or increased flows. The Merced Alliance fish survey in situ water quality results are in general agreement with 2004–2006 monitoring results reported by the East San Joaquin Water Quality Coalition (ESJWQC). ESJWQC (2007) results indicate periodic low dissolved oxygen and pH in the mainstem Merced River near Cressy (RM 27). ESJWQC (2007) results also indicate occasional exceedances in the mainstem Merced River to Regional Water Quality Control Board Basin Plan Water Quality Objectives or other local water quality objectives for several parameters not measured during the Merced Alliance surveys, including metals (i.e., lead), bacteria (i.e., Escherichia coli), pesticides (i.e., chlorpyrifos), and toxicity to aquatic invertebrate and algal bioindicators (i.e., Ceriodaphnia dubia and Selensatrum capricornutum) (ESJWQC 2007). Several additional exceedances were recorded within agricultural drainage canals that discharge to the lower Merced River (ESJWQC 2007). Additionally, the lower Merced River from McSwain Reservoir (approximately RM 56) to the confluence with the San Joaquin River (RM 0) is listed as water quality impaired under Section 303(d) of the Clean Water Act for mercury, and organophosphate and organochlorine pesticides (chlorpyrifos, diazinon, and group A). Combined, the ESJWQC and Merced Alliance results indicate a need for water quality improvement in the lower Merced River. 7.3.3.2 Aquatic Habitat and Fish Species Gradients As discussed in Section 5.2.3.3, fish habitat use was explored using principal components analysis (PCA) intended to isolate key habitat variables from the large number of parameters collected in the field, and then test species associations with these variables. The segment‐scale environmental PCA indicated strong gradients for physical habitat variables in the Merced River, with percent of a given habitat type (e.g., percent riffle, percent run/pool/glide) and water depth dominating the first principal component (PC1) in both river segments (Figure 7‐20a,b). In general, PC1 appeared to be a habitat‐depth gradient, describing a continuum from edge habitat with shallow depth to run/pool/glide habitat with deeper water. The second principal component (PC2) presented as a cover‐substrate gradient, with a continuum from no cover and

The Merced River Alliance Project Final Report Volume II: Biological Monitoring and Assessment
Stillwater Sciences
7‐34
coarse substrate to a high degree of cover and finer substrate. While these general habitat gradients were the same for the upper and lower river segments, some segment‐specific habitat differences were apparent from the PCA. In the upper river segment, the PC1 habitat‐depth gradient included low‐gradient riffle habitat, while low‐gradient riffle habitat was not of major consequence to the PCA in the lower Merced River. In the upper river segment, the cover‐substrate gradient (PC2) included a continuum from high boulder cover to no cover, in contrast to the continuum from high aquatic vegetation cover to no cover in the lower river segment. For both river segments, the first two principal components explained just under 50% of the variation, at 48% for the lower river and 46% for the upper river, indicating that a large amount of habitat variability remained inherent to the data set, even though there were apparent segment‐scale physical habitat gradients in the Merced River. Examination of environmental variable correlation matrices supported this result, in that habitat type (e.g., percent riffle, percent run/pool/glide) was not strongly correlated with other physical parameters such as cover type and depth. For example, during fall 2006, even the strongest correlations were not high, being percent riffle and percent boulder cover (r = 0.50), and percent run/pool/glide and depth (r = 0.54 for maximum depth and r = 0.50 for average depth). Across all seasons, water quality parameters exhibited strong gradients, with relatively high DO and pH levels in the lower river segment associated with lower temperature, conductivity, and turbidity measurements (Figure 7‐20c). In the upper river, the opposite trend was indicated, with higher DO levels observed in conjunction with high values of temperature, conductivity, turbidity and low pH (Figure 7‐20d). Fish species gradients are shown in Figure 7‐21 at the segment scale. For both segments, species PC1 appeared to be a gradient from native, transitional‐assemblage species (Foothill Community) to introduced, warm‐water assemblage species (Valley Floor Community). PC2 resembles a similar gradient to PC1. 7.3.3.3 Fish Habitat Associations Logistic regression of species presence/absence versus the first two principal components identified in the environmental PCA (Section 7.3.3.2) indicated expected trends, albeit with only a subset of the physical habitat and water quality variables. For example, during fall 2007, Sacramento sucker, Sacramento pikeminnow, and hardhead presence decreased with increasing temperature and pH, whereas spotted bass presence increased with increasing temperature and pH. Spotted bass tended to have stronger positive relationships with % LWD and maximum depth, whereas the three native species had stronger positive relationships with % low‐gradient riffle, % cobble substrate, and % boulder cover. Despite the strong water‐quality and physical‐habitat gradients identified in Section 7.3.3.2, all other cover variables, habitat types, and water
The Merced River Alliance Project Final Report Volume II: Biological Monitoring and Assessment
Stillwater Sciences
7‐35
quality parameters (e.g., turbidity and conductivity) did not show evident segment‐scale trends with species presence/absence. At the reach‐scale, overall fish use of the different aquatic habitat types is shown across all sampling seasons in Figure 7‐22. For this analysis, average estimated fish density by habitat type was projected across the reach based on known frequency of habitat occurrence. This was used to determine the ratio of fish per habitat type to total fish in the reach, or a normalized linear fish density. The normalized linear fish density was compared with the fractional extent of each habitat type by reach (Figure 7‐1b), or linear habitat frequency, to indicate whether a given habitat type was supporting a relatively high number of fish. An analysis of habitat type use by native fish species was conducted at the reach scale. As shown in Figure 7‐22a, the majority of points fall along the 1:1 line, indicating that across six sampling seasons (2006–2008), the various aquatic habitat types on the lower Merced River supported a number of fish roughly proportional to the reach‐scale linear extent of the habitat type itself. The primary exception to this was margin habitat, which consistently supported much higher densities of fish than any other habitat. This result was not surprising, as juvenile fish are generally associated with margin habitat (Moyle 2002), with large groups (> 50 to 75 fish) and several smaller groups (25 to 50 fish) of juvenile Sacramento suckers, Sacramento pikeminnow, fall‐run Chinook salmon, and mosquitofish sampled throughout seasonal surveys in margin habitat. Additionally, there were four habitat types that appeared to support a relatively high number of fish as compared with their reach‐specific linear extents, including mid‐channel pool habitat in the Dredger Tailings Reach, backwater habitat in the Confluence Reach, and low‐gradient riffle and run habitat in the Merced Falls Reach. The high estimated fish density associated with mid‐channel pool habitat (MCP) in the Dredger Tailings Reach was primarily due to large groups (> 150) of Sacramento sucker in two different locations during spring 2007 and fall 2007. While there was only one backwater habitat location sampled in the Confluence Reach, it supported high numbers of fish (between 70 and 275) during summer 2007, fall 2007, and spring 2008 surveys, suggesting this habitat type may be relatively important to the reach as a whole. In the Merced Falls Reach, while low‐gradient riffle (LGR) and run habitat appear to support higher numbers of fish as compared with their linear extent, an approximately 2‐mile‐long mid‐channel pool at the downstream end of that reach was not sampled, nor were two other 0.25‐mile‐long mid‐channel pools within the reach. Therefore the Merced Falls reach‐wide fish habitat associations may be skewed towards over‐representation of low‐gradient riffle and run habitat. Overall, in the lower river segment, while some seasonal differences between fish use of different habitat types were apparent, the differences were not consistent across flow years and were within the
The Merced River Alliance Project Final Report Volume II: Biological Monitoring and Assessment
Stillwater Sciences
7‐36
observed range of variability in the estimated linear densities at the reach scale (Figure 7‐7, Section 7.3.1.1). In the upper river, mid‐channel pools appeared to consistently support the highest estimated linear density of fish as compared with of the extent of the habitat itself (Figure 7‐22b). The exception to this was the Yosemite Valley Reach, in which lateral scour pools (LSP) supported a higher linear density of fish, although reach‐scale extent of this habitat was roughly equal to that of runs and was approximately half that of mid‐channel pools (Figure 7‐1b). Glide (GLD) habitat appeared to be an important habitat only in Upper Foothills 1 Reach, where it was found at a relatively higher frequency as compared with other reaches but still at a low frequency compared with other habitat types in the same reach (Figure 7‐1b). Due to the low frequency of this habitat type in general, glide sample size was low (n = 6, 2006–2007) and thus the high numbers of fish observed in the Upper Foothills Reach are not necessarily representative of other glide habitat in the upper river segment. Finally, low‐gradient riffle habitat in Upper Foothills 3 and Upper Foothills 1 reaches appeared to support a relatively low density of fish, based on the linear extent of riffle habitat in the reach, potentially because mid‐channel pool habitat in these same reaches appeared to be more important for fish use during the fall 2007 and fall 2008 surveys. Variability in reach‐scale linear density estimates for the upper river segment was lower as compared with the lower river segment, likely due to the lower incidence of large groups of fish in the upper segment (Section 7.3.1.1). As shown in Table 7‐11, non‐native fish species outnumbered native species in most habitat types in the lower river segment, with the exception of low‐gradient riffles and floodplains where native species composed 60% and 50% of the total number of species, respectively. Introduced species were observed in all aquatic habitat types and were most dominant (70% of total species) in mid‐channel pools and plunge pools. Although not shown in Table 7‐23, reach‐scale results were similar, with the exception of the Dredger Tailings Reach, where large groups of native Sacramento suckers were found in the mid‐channel pools and introduced species were rare (see above results). In the upper river segment, relative use by native species was more specific to habitat type, with native species making up only 40% of all species found in mid‐channel pools and runs but 100% of all species found in plunge pool, pocket water, and margin habitat (although only a small number of species were found in the latter three types) (Table 7‐11).
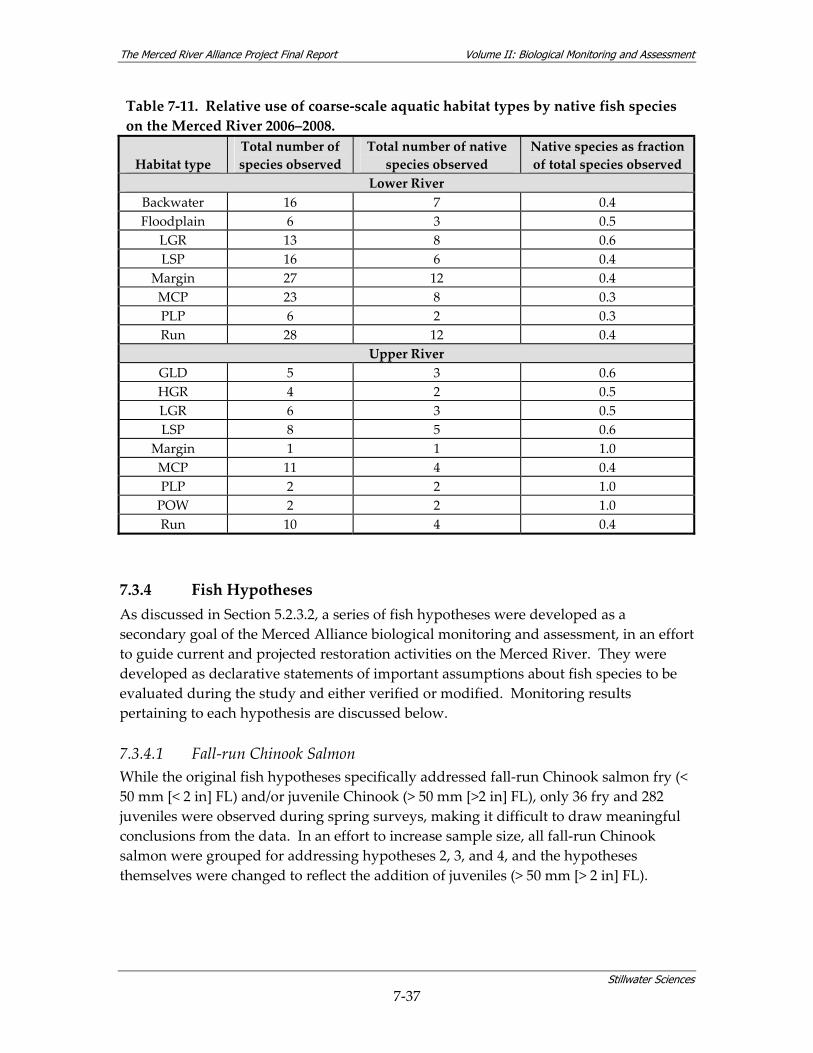
The Merced River Alliance Project Final Report Volume II: Biological Monitoring and Assessment
Stillwater Sciences
7‐37
Table 7‐11. Relative use of coarse‐scale aquatic habitat types by native fish species on the Merced River 2006–2008.
Habitat type Total number of species observed
Total number of native species observed
Native species as fraction of total species observed
Lower River Backwater 16 7 0.4 Floodplain 6 3 0.5
LGR 13 8 0.6 LSP 16 6 0.4
Margin 27 12 0.4 MCP 23 8 0.3 PLP 6 2 0.3 Run 28 12 0.4
Upper River GLD 5 3 0.6 HGR 4 2 0.5 LGR 6 3 0.5 LSP 8 5 0.6
Margin 1 1 1.0 MCP 11 4 0.4 PLP 2 2 1.0 POW 2 2 1.0 Run 10 4 0.4
7.3.4 Fish Hypotheses As discussed in Section 5.2.3.2, a series of fish hypotheses were developed as a secondary goal of the Merced Alliance biological monitoring and assessment, in an effort to guide current and projected restoration activities on the Merced River. They were developed as declarative statements of important assumptions about fish species to be evaluated during the study and either verified or modified. Monitoring results pertaining to each hypothesis are discussed below. 7.3.4.1 Fall‐run Chinook Salmon While the original fish hypotheses specifically addressed fall‐run Chinook salmon fry (< 50 mm [< 2 in] FL) and/or juvenile Chinook (> 50 mm [>2 in] FL), only 36 fry and 282 juveniles were observed during spring surveys, making it difficult to draw meaningful conclusions from the data. In an effort to increase sample size, all fall‐run Chinook salmon were grouped for addressing hypotheses 2, 3, and 4, and the hypotheses themselves were changed to reflect the addition of juveniles (> 50 mm [> 2 in] FL).
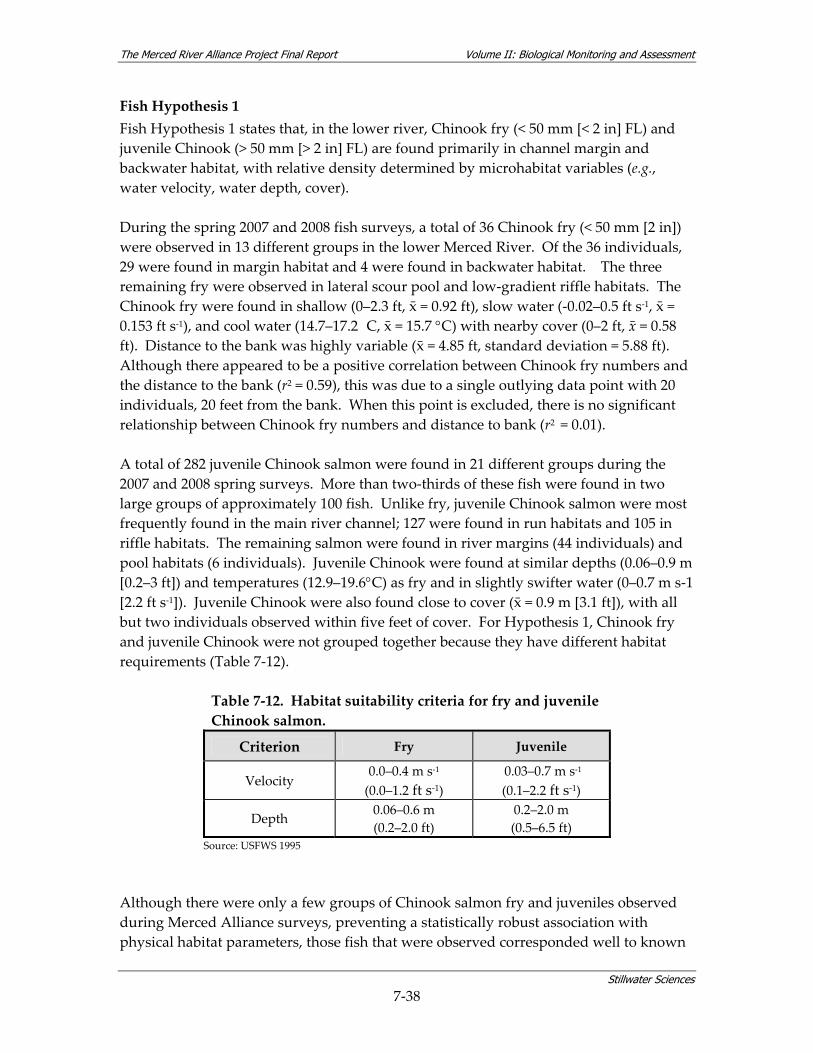
The Merced River Alliance Project Final Report Volume II: Biological Monitoring and Assessment
Stillwater Sciences
7‐38
Fish Hypothesis 1 Fish Hypothesis 1 states that, in the lower river, Chinook fry (< 50 mm [< 2 in] FL) and juvenile Chinook (> 50 mm [> 2 in] FL) are found primarily in channel margin and backwater habitat, with relative density determined by microhabitat variables (e.g., water velocity, water depth, cover). During the spring 2007 and 2008 fish surveys, a total of 36 Chinook fry (< 50 mm [2 in]) were observed in 13 different groups in the lower Merced River. Of the 36 individuals, 29 were found in margin habitat and 4 were found in backwater habitat. The three remaining fry were observed in lateral scour pool and low‐gradient riffle habitats. The Chinook fry were found in shallow (0–2.3 ft, x̄ = 0.92 ft), slow water (‐0.02–0.5 ft s‐1, x̄ = 0.153 ft s‐1), and cool water (14.7–17.2 �C, x̄ = 15.7 °C) with nearby cover (0–2 ft, x̄ = 0.58 ft). Distance to the bank was highly variable (x̄ = 4.85 ft, standard deviation = 5.88 ft). Although there appeared to be a positive correlation between Chinook fry numbers and the distance to the bank (r2 = 0.59), this was due to a single outlying data point with 20 individuals, 20 feet from the bank. When this point is excluded, there is no significant relationship between Chinook fry numbers and distance to bank (r2 = 0.01). A total of 282 juvenile Chinook salmon were found in 21 different groups during the 2007 and 2008 spring surveys. More than two‐thirds of these fish were found in two large groups of approximately 100 fish. Unlike fry, juvenile Chinook salmon were most frequently found in the main river channel; 127 were found in run habitats and 105 in riffle habitats. The remaining salmon were found in river margins (44 individuals) and pool habitats (6 individuals). Juvenile Chinook were found at similar depths (0.06–0.9 m [0.2–3 ft]) and temperatures (12.9–19.6°C) as fry and in slightly swifter water (0–0.7 m s‐1 [2.2 ft s‐1]). Juvenile Chinook were also found close to cover (x̄ = 0.9 m [3.1 ft]), with all but two individuals observed within five feet of cover. For Hypothesis 1, Chinook fry and juvenile Chinook were not grouped together because they have different habitat requirements (Table 7‐12).
Table 7‐12. Habitat suitability criteria for fry and juvenile Chinook salmon.
Criterion Fry Juvenile
Velocity 0.0–0.4 m s‐1 (0.0–1.2 ft s‐1)
0.03–0.7 m s‐1 (0.1–2.2 ft s‐1)
Depth 0.06–0.6 m (0.2–2.0 ft)
0.2–2.0 m (0.5–6.5 ft)
Source: USFWS 1995
Although there were only a few groups of Chinook salmon fry and juveniles observed during Merced Alliance surveys, preventing a statistically robust association with physical habitat parameters, those fish that were observed corresponded well to known
The Merced River Alliance Project Final Report Volume II: Biological Monitoring and Assessment
Stillwater Sciences
7‐39
habitat suitability criteria. These results also corresponded to results of 2005 juvenile Chinook surveys conducted in the Dredger Tailings Reach (Stillwater Sciences 2006b). Fish Hypothesis 2 Fish Hypothesis 2 predicts that the relative density of Chinook fry and juveniles is different between reaches where spawning habitat restoration (Appendix A, Table A‐1) has occurred and reaches where no restoration has occurred. Merced Alliance fish monitoring sites with the closest proximity to lower river habitat restoration or gravel augmentation locations included GM2‐F3 (RM 29.5), DTR‐F1 (RM 45) and DTR‐F3 (RM 50). The Western Stone restoration project (Appendix A, Table A‐1) is currently in the preliminary design stage *, so this project was not included in the analysis for Fish Hypothesis 2. Two locations in the Gravel Mining 1 Reach have been restored within the past decade: floodplain and channel reconstruction has occurred in the Robinson Reach (RM 41.5 to 44.5), and gravel pit isolation and recontouring and revegetation of the floodplain has occurred just downstream in the Ratzlaff Reach (RM 40). However, these portions of the river were not accessible during the Merced Alliance surveys. Despite ongoing gravel augmentation or wing dam construction at multiple sites within the DTR, densities of Chinook fry and juveniles in the DTR did not differ significantly from the other lower river reaches during the 2007 surveys (p = 0.30), the 2008 surveys (p = 0.10), or the two years combined (p = 0.46). However, low overall sample size for Chinook salmon during the Merced Alliance study means that Fish Hypothesis 2 could not be comprehensively addressed. Fish Hypothesis 3 Fish Hypothesis 3 states that in areas with suitable physical habitat (e.g., water velocity, water depth, cover), temperature, and water quality (e.g., dissolved oxygen), the relative density of fry (< 50 mm [< 2 in] FL) and juvenile Chinook (> 50 mm [> 2 in] FL) will be lower where predators (e.g., bass) are present compared to areas where predators are absent. Densities of fry and juvenile Chinook will be inversely related to predatory density in co‐occupied or adjacent habitats. Figure 7‐23 shows estimated linear density of Chinook and bass in the lower river segment by river mile during spring 2007 and spring 2008. During both study years, only one relatively large group of Chinook was found along with several scattered individuals, a result which makes correlation with the more evenly distributed bass difficult. Although not shown by the river mile distributions (Figure 7‐23), Chinook salmon fry and juveniles were observed primarily in margin habitat and bass were
* Status based on project website (http://www.sjd.water.ca.gov/rivermanagement/Current/projects/weststone/index.cfm).
Accessed on August, 27, 2008.
The Merced River Alliance Project Final Report Volume II: Biological Monitoring and Assessment
Stillwater Sciences
7‐40
found primarily in main channel habitat during the 2007 and 2008 spring surveys. Thus co‐occupation of habitats by bass and salmon was not observed. Where they did overlap by river mile, Chinook salmon and bass were found in adjacent habitats. Notably, estimated linear densities of bass were 1.5–2 times greater during spring 2008 as compared with spring 2007, and bass were observed 11 miles farther upstream (i.e., river mile 50) in 2008. Chinook densities and distribution followed a trend opposite to bass, with lower linear densities during 2008. As shown in Table 7‐4, spring flows at the Snelling (MSN) and Cressy (CRS) gages in the lower Merced River during 2008 were 20–50% higher than those recorded during 2007. In summary, while there was overlap of Chinook and bass distributions at several river mile locations, potential trends were obscured by the high variability in estimated linear density and the overall low sample size of Chinook. Thus overall, Fish Hypothesis 3 could not be fully addressed. Fish Hypothesis 4 Fish Hypothesis 4 states that variable seasonal flow magnitude and duration will determine the longitudinal distribution pattern of Chinook fry and juveniles in the lower river. At low spring flows (< 28.1 m3s‐1 [< 1,000 cfs]), Chinook fry and juveniles will be clustered in the upper reaches of the lower river, with very few individuals rearing near the SJR confluence. At higher spring flows (> 28.1 m3s‐1 [> 1,000 cfs]), fry and juveniles will be distributed throughout the lower river, with little or no clustering in upstream areas (i.e., near spawning locations). Spring 2007 flows corresponded to the range of “low flows” (< 1,000 cfs) specified in Hypothesis 4, with flows at the Cressy (CRS) gage ranging 176–247 cfs during fish surveys and mean monthly flows for February, March, and April 2007 < 300 cfs (Table 7‐4). Spring 2008 flows were only somewhat higher, with flows at the Cressy (CRS) gage ranging from 287–369 cfs in the days surrounding the surveys and mean monthly flows for February, March, and April 2008 < 600 cfs. Spring 2008 flows did not exceed 1,000 cfs at any point prior to or during the fish surveys. There were very low numbers of Chinook salmon observed during both spring 2007 and 2008, and no reach‐scale clustering of fish was noted. During the 2007 spring surveys, most of the juvenile Chinook salmon (251 out of 282) were found at GM1‐F3 (RM 37.3), and during the 2008 spring surveys, the majority of the fish (20 of 36) were found slightly farther upstream at DTR‐F1 (RM 45.5) and closer to the majority of spawning habitat in the lower Merced River. No large groups were found outside of these monitoring sites, and the remaining Chinook salmon individuals were spread throughout the lower Merced River. During the 2007 surveys, Chinook salmon were found as far downstream as ENC‐F4 (RM 23) and as far upstream as DTR‐F3 (RM 50), while in 2008 the distribution of salmon was shifted slightly downstream with fish observed as far downstream as CON‐F3 (RM 3.5) and as far upstream as DTR‐F4 (RM 48.4). Although the overall distribution of juvenile Chinook during spring 2007 and 2008 was similar to the expected low‐flow scenario stated in the hypothesis (i.e., rearing Chinook found nearest to the SJR confluence during

The Merced River Alliance Project Final Report Volume II: Biological Monitoring and Assessment
Stillwater Sciences
7‐41
relatively higher flow years), the overall small sample size and lack of comparison flows greater than 1,000 cfs rendered results for Fish Hypothesis 4 inconclusive. 7.3.4.2 Steelhead Fish Hypothesis 5 Fish Hypothesis 5 predicts that in the lower river, the distribution of steelhead (O. mykiss) will be determined largely by water temperature, with deleterious effects on each life stage due to both short‐term near‐lethal temperatures and chronic elevated sub‐lethal temperatures that impose significant bioenergetic stress on the fish. Hypothesis 5 could not be evaluated because no steelhead were found during any of the lower river surveys. Some O. mykiss individuals were found in the Dredger Tailings Reach; however, they showed no signs of smolting and may have been resident fish that had washed over Crocker‐Huffman Dam from the Merced Falls Reach, where they have been stocked in the past (M. Ardohain, pers. comm. 2005). 7.3.4.3 Lower River Fish Community (except salmonids) Fish Hypothesis 6 Fish Hypothesis 6 states that the effect of 2005–2006 high flows on the Merced River will be to extend the downstream limit of the native Foothill Community (as defined in Brown et al. [2003]: Sacramento pikeminnow, tule perch, Sacramento sucker, hardhead, riffle sculpin), and to limit the upstream limit of the Large Tributary Community (as defined in Brown et al. [2003]: largemouth bass, bluegill, redear sunfish, white catfish, channel catfish), as compared with earlier surveys by Brown in 1993–1995 (Brown 2000), which were conducted following a 6‐year drought. As discussed in Section 7.3.2, there was considerable overlap in SJRD community assemblages during the 2006–2008 seasonal surveys. While the downstream limit of hardhead and Sacramento pikeminnow in the native Foothill Community was generally near river mile 30 (Figure 7‐8b to Figure 7‐13b), other members of the community, including the native Sacramento sucker, were observed throughout the lower river segment during all survey years (where 2006 was a high‐flow year, but 2007 and 2008 were relatively low‐flow years). Spotted bass were more often found near the San Joaquin River confluence than the upstream reaches of the lower river segment, but it is an introduced species and did not actually conform to the expected distribution of the Foothill Community. Riffle sculpin were not consistently observed and tule perch were not observed at all during the surveys, so no conclusions can be drawn regarding these species. Thus, the Sacramento sucker was the only native Foothill Community species that appeared to have an extended downstream limit compared to earlier surveys by Brown (1993–1995) (Brown 2000).
The Merced River Alliance Project Final Report Volume II: Biological Monitoring and Assessment
Stillwater Sciences
7‐42
There was no apparent difference in the distribution of Lower Large Tributary fish species related to flow conditions, as this community consistently extended as far upstream as river mile 40 and overlapped to a large degree with the Foothill Community species. During spring 2008, largemouth bass were observed as far upstream as Crocker‐Huffman Dam, the upstream limit to fish migration on the lower Merced River. Thus, although surveys were not conducted following an extended drought, as were the Brown 1993–1995 surveys, Lower Large Tributary species were still widely distributed in the lower Merced River. In summary, there did not appear to be an effect of 2005–2006 high flows on the downstream limit of the native Foothill Community or the upstream limit of the Large Tributary Community (both as defined in Brown et al. [2003]), as stated in Fish Hypothesis 6. Fish Hypothesis 7 Fish Hypothesis 7 states that prickly sculpin and smallmouth bass distribution in the lower Merced River during 2006–2007 will be similar to that of earlier surveys by Brown et al. in 1993–1995 (Brown 2000), as flow differences between these years are not expected to affect the longitudinal distribution of these species. Unlike the Brown et al. surveys in 1993–1995, smallmouth bass did not appear to have a broad geographic distribution on the Merced River during the 2006–2008 surveys. Individual smallmouth bass were found as far downstream as the Confluence Reach (RM 0 to 8.1) and as far upstream as the Gravel Mining 1 Reach (RM 32.3 to 44.7). However, because only 53 individuals were observed in the lower Merced River across the six seasonal surveys, definitive statements cannot be made regarding the true geographical distribution of smallmouth bass in the Merced River. In contrast, prickly sculpin were found throughout the lower Merced River during the relatively higher flow 2006 surveys (Figure 7‐8b and Figure 7‐9b) as well as the lower flow spring and summer 2007 surveys (Figure 7‐10b and Figure 7‐11b). During the fall 2007 and spring 2008 surveys, prickly sculpin were found only upstream of river mile 26 (i.e., the Gravel Mining reaches and the Dredger Tailings Reach). However, only a small number of sculpin were found during each survey, so the distribution may not be representative of actual conditions. Overall, it appears that the distribution of prickly sculpin was not affected by the flow years, as predicted by the earlier Brown (2000) surveys and Fish Hypothesis 7. 7.3.4.4 Upper River Fish Community Fish Hypothesis 8 Fish Hypothesis 8 predicts that in the upper Merced River, thermal stratification in large, deep pools provides temperature refugia for trout species, and so the longitudinal
The Merced River Alliance Project Final Report Volume II: Biological Monitoring and Assessment
Stillwater Sciences
7‐43
distribution of these species in reaches where water temperature might otherwise be too warm will be correlated with pool distribution. In order to address Fish Hypothesis 8, estimated linear densities for trout were analyzed throughout the upper river segment and associated with either pool (PLP, LSP, MCP, see Table 5‐9) or non‐pool habitats for both 2006 (high‐flow conditions) and 2007 (low‐flow conditions). Additionally, paired pool surface and bottom temperature measurements were analyzed to determine the potential for thermal stratification in deep pools as a means for providing thermal refugia. Finally, water temperatures of pool habitats were compared with non‐pool habitats for both 2006 and 2007. During the 2006 surveys, linear densities of trout were not significantly higher in pools than in other habitat types throughout the upper river segment (p = 0.14) or in the Upper Foothills 2 and 3 reaches (p = 0.27), which are the farthest downstream and therefore most likely to experience overall warmer water temperature. In the 2007 surveys, when flows were lower, pool habitats had a significantly higher linear density (fish/100m) than non‐pool habitats (p = 0.004). This effect could not be tested in the two most downstream reaches of the upper river segment, as no trout were found in any habitat in either the Upper Foothills 3 or the Upper Foothills 2 reaches in 2007. The paired pool temperature data consisted of one water surface and one pool bottom measurement at each of the 13 sites, for a total of 19 paired sets combining 2006 and 2007 data. Based on the results of a paired, one‐tailed t‐test, pool bottoms were only slightly colder than the corresponding surface water locations (p=0.05) at an average difference of 0.085 °C (0.15 °F). Available data from a CDFG thermograph located at Briceburg (CDFG unpublished data A) indicates a relatively large mid‐summer (e.g., July–August) water temperature difference of 4 to 9 °C (7 to 16 °F) between 2006 and 2007 (see Figure 7‐24). However, by late summer/early fall (e.g., September–October) when the Merced Alliance fish surveys were conducted, there was no apparent remaining difference between water temperatures observed during 2006 and 2007 (see Figure 7‐24). With the exception of two locations, UF2‐F3 in 2006 (19.1 °C [66.4 °F]) and UF1‐F3 in 2007 (19.4 °C [66.9 °F]), water temperatures measured during the Merced Alliance surveys did not approach the level (19–20 °C [66–68 °F]) at which chronic exposure is considered stressful for O. mykiss (rainbow trout) (FERC 1993) and growth declines rapidly (Myrick and Cech 2001), or the short‐term incipient lethal level (25 °C [77 °F]) (Myrick and Cech 2001), so trout survival may not have required a thermal refugia by this point in the season (e.g., fall). Furthermore, there was no significant temperature difference (p = 0.12) between pool habitats (n = 9) and non‐pool habitats (n = 4) during 2007 in any of the reaches in the upper river, nor was there a significant difference (p = 0.20) in 2006.

The Merced River Alliance Project Final Report Volume II: Biological Monitoring and Assessment
Stillwater Sciences
7‐44
In summary, while there were higher linear densities of trout in pool habitats during the 2007 low‐flow conditions than in 2006 under higher‐flow conditions, this observation could not be explained by cooler temperatures of the pools themselves (as compared with non‐pool habitats) or thermal stratification within the pools. The lack of trout in the most downstream reaches (UF‐3 and UF‐2) during 2007 may have been due to unsuitably warm water temperatures which drove this species farther upstream or into Lake McClure downstream to seek thermal refugia. Alternatively, trout may have been seeking cover refuge from predators in the pools, rather than seeking thermal refugia. Finally, it is possible that water temperature differences in the upper Merced River are supported at a finer spatial scale than was measured using comparisons of surface and pool bottom temperatures. The influence of groundwater upwelling from fissures in the river bed on overall water temperature may be dissipated within only tenths of meters of the fissures themselves, thus providing microhabitat that would be better characterized on a finer scale than was possible during the Merced Alliance baseline surveys.
Fish Hypothesis 9 Fish Hypothesis 9 states that rainbow trout, brown trout, and/or Sacramento sucker abundance will be greatest in upper Merced River mainstem reaches that have been restored for spawning habitat (Appendix A, Table A‐1) and will exceed pre‐restoration observations made by Kisanuki and Shaw (1992). Fish Hypothesis 9 could not be evaluated because information regarding completed spawning habitat restoration projects on the upper Merced River was not available. While several restoration projects in the Yosemite Valley Reach have been completed since the Kisanuki and Shaw (1992) surveys, they were not generally focused on fish habitat improvements (Appendix A, Table A‐1). Instead, comparisons between Merced Alliance and earlier Kisanuki and Shaw (1992) density estimates for O. mykiss (i.e., rainbow trout), brown trout, and/or Sacramento sucker were carried out to investigate potential differences between recent and historical data in the Yosemite Valley Reach. Linear densities of rainbow trout, brown trout, and Sacramento sucker were estimated for the upper Merced River using a two‐phase survey design modified from Mohr and Hankin (in press). Fall 2007 linear density estimates were used to evaluate whether rainbow trout abundance was greatest in the Yosemite Valley Reach, which has undergone a variety of restoration activities since the early 1990s, and whether observed abundance levels exceeded historical observations made by Kisanuki and Shaw (1992). As comparative data from Kisanuki and Shaw (1992) are available, Sacramento sucker and brown trout observations were also included in the analysis. Linear density estimates were calculated by reach, including the Lower Batholith Reach (RM 105.6 to 118.7), the Yosemite Valley Reach (RM 118.7 to 126), and a combined Upper Foothill 1, 2, and 3 reach (RM 79.9 to 105.6). The three Upper Foothill reaches were combined for the

The Merced River Alliance Project Final Report Volume II: Biological Monitoring and Assessment
Stillwater Sciences
7‐45
linear density analysis due to geomorphic similarities among the reaches and to increase sample size. The two‐phase stratified sampling design involved snorkeling upper Merced River habitat units multiple times in order to quantify the variance associated with density estimates. For the analysis, most sampled habitat units were grouped into discrete sampling strata (i.e., all pools, all riffles, all runs); however, strata were necessarily combined when low numbers of fish observed did not allow for stratum‐specific estimates. In a typical Phase 1 sampling approach, habitat units would be selected using stratified random sampling where the habitat types represent strata (Mohr and Hankin, in press). However, in the upper Merced River, 2007 Phase I units simply re‐occupied all 2006 sampled habitat units, and so the analysis was conducted using the following two assumptions: 1) the Merced Alliance fish monitoring sites (and habitat units contained therein) were representative of the frequency and extent of aquatic habitat occurring in a given reach, and 2) data from these habitat units could be reasonably extrapolated to estimate reach‐specific linear fish densities. Thus, for the upper Merced River, Phase I single‐pass snorkel estimates were conducted at all fish monitoring sites, and by extension within all habitat units sampled during 2006. For Phase II, a subset of the Phase I habitat units were sampled using multiple‐pass snorkel counts. The bounded counts estimator (Regier and Robson 1967) was used to determine linear density for each snorkeled unit. Following the typical two‐phase sampling approach, results from the Phase II estimates were used to calibrate snorkel counts from Phase 1 (Mohr and Hankin, in press). Densities were calculated based on unit abundance estimates and average habitat unit lengths. In order to allow for comparisons, the 2007 fish life history stage definitions were adjusted to be consistent with Kisanuki and Shaw (1992). Sacramento sucker YOY were defined as < 50 mm, juveniles between 50 and 200 mm, and adults >200 mm. In the case of trout, Kisanuki and Shaw (1992) defined YOY as ≤ 130 mm and adults >130 mm; however, due to the delineation of size classes in 25‐mm increments for the Merced Alliance surveys, YOY trout were classified as < 126 mm and adults as ≥ 126 mm for the 2007 analysis. Results of this analysis indicated high variability of estimated linear density across the three species, all life stages, and each of the reaches, ranging from 0 fish/mi in the case of YOY brown trout (Lower Batholith Reach) to greater than 2,000 fish/mi for YOY Sacramento sucker (Lower Batholith Reach) (Figure 7‐25). The majority of density estimates fell within the range of approximately 20 to 400 fish/mi. Peak linear density of rainbow trout and Sacramento suckers of each life stage tended to occur in the Lower Batholith Reach (Figure 7‐25a,c), but in most cases the differences between the reaches were not significant (p > 0.05). There were significantly more rainbow trout adults observed in the Lower Batholith Reach than in the Yosemite Valley (296 fish/mi as
The Merced River Alliance Project Final Report Volume II: Biological Monitoring and Assessment
Stillwater Sciences
7‐46
compared with 60 fish/mi, p < 0.05) or the Upper Foothill (30 fish/mi, p < 0.05), and significantly more Sacramento sucker adults in the Lower Batholith Reach and Upper Foothill (391 fish/mi and 389 fish/mi) than in Yosemite Valley (19 fish/mi) (p < 0.05) (Table 7‐13). Densities of adult and YOY brown trout were highest in the Yosemite Valley Reach (Figure 7‐25b and Table 7‐13). However, adult brown trout densities in the Yosemite Valley Reach were not significantly greater (p > 0.05) than in the Lower Batholith Reach, the only other reach where this life stage was observed. Brown trout tended to be relatively scarce throughout the survey. No brown trout of any life stage were observed in the Upper Foothill 1, 2, 3 reaches (Table 7‐13). A comparison of results from the Merced Alliance fall 2007 surveys with those of Kisanuki and Shaw (1992) suggests that, in general, fall 2007 trout densities in the Yosemite Valley Reach were lower than those of summer 1991. There were substantially more YOY rainbow and brown trout observed in Yosemite Valley in 1991 as compared to 2007 (298 and 634 trout/mi compared to 36 and 10 trout/mi, respectively) (Figure 7‐25a,b). Adult rainbow and brown trout, however, were observed at similar densities in 1991 and 2007 (p > 0.05) (Figure 7‐25a,b). Densities of juvenile and adult Sacramento suckers in Yosemite Valley also appeared to be higher in 1991 (Kisanuki and Shaw 1992) than in 2007 (Figure 7‐25c), however statistical significance of the juvenile and adult comparisons could not be determined due to the lack of uncertainty estimates for the Kisanuki and Shaw (1992) data.
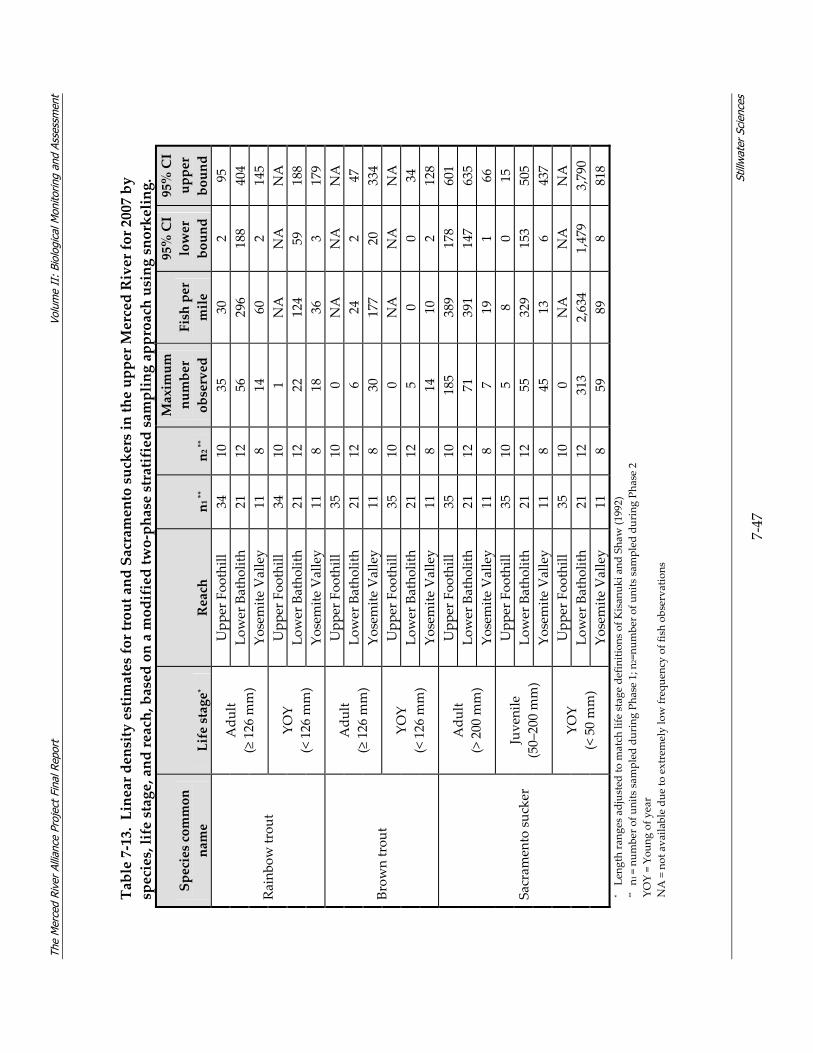
The
Mer
ced
Rive
r Al
lianc
e Pr
ojec
t Fin
al R
epor
t
Volu
me
II:
Biol
ogic
al M
onito
ring
and
Asse
ssm
ent
St
illw
ater
Sci
ence
s
7‐47
Table 7‐13. Linear density estimates for trout and Sacramento suckers in the upper M
erced River for 2007 by
species, life stage, and reach, based on a modified two‐phase stratified sampling approach using snorkeling.
Species common
name
Life stage
* Reach
n1 **
n2 **
Maximum
number
observed
Fish per
mile
95% CI
lower
bound
95% CI
upper
bound
Upp
er Foo
thill
34
10
35
30
2 95
Lower Batho
lith
21
12
56
296
188
404
Adu
lt (≥ 126 m
m)
Yosemite Valley
11
8 14
60
2 145
Upp
er Foo
thill
34
10
1 NA
NA
NA
Lower Batho
lith
21
12
22
124
59
188
Rainbo
w trou
t YO
Y (< 126 m
m)
Yosemite Valley
11
8 18
36
3 179
Upp
er Foo
thill
35
10
0 NA
NA
NA
Lower Batho
lith
21
12
6 24
2 47
Adu
lt (≥ 126 m
m)
Yosemite Valley
11
8 30
177
20
334
Upp
er Foo
thill
35
10
0 NA
NA
NA
Lower Batho
lith
21
12
5 0
0 34
Brow
n trou
t YO
Y (< 126 m
m)
Yosemite Valley
11
8 14
10
2 128
Upp
er Foo
thill
35
10
185
389
178
601
Lower Batho
lith
21
12
71
391
147
635
Adu
lt (> 200 m
m)
Yosemite Valley
11
8 7
19
1 66
Upp
er Foo
thill
35
10
5 8
0 15
Lower Batho
lith
21
12
55
329
153
505
Juvenile
(50–200 mm)
Yosemite Valley
11
8 45
13
6 437
Upp
er Foo
thill
35
10
0 NA
NA
NA
Lower Batho
lith
21
12
313
2,634
1,479
3,790
Sacram
ento sucker
YOY
(< 50 mm)
Yosemite Valley
11
8 59
89
8 818
* Le
ngth ra
nges adjusted to m
atch life stage de
finition
s of Kisan
uki and Sha
w (1
992)
** n
1 = nu
mber o
f units sam
pled during Ph
ase 1; n
2=nu
mber o
f units sam
pled during Ph
ase 2
YOY = Yo
ung of year
NA = not availa
ble du
e to extremely low freque
ncy of fish observatio
ns
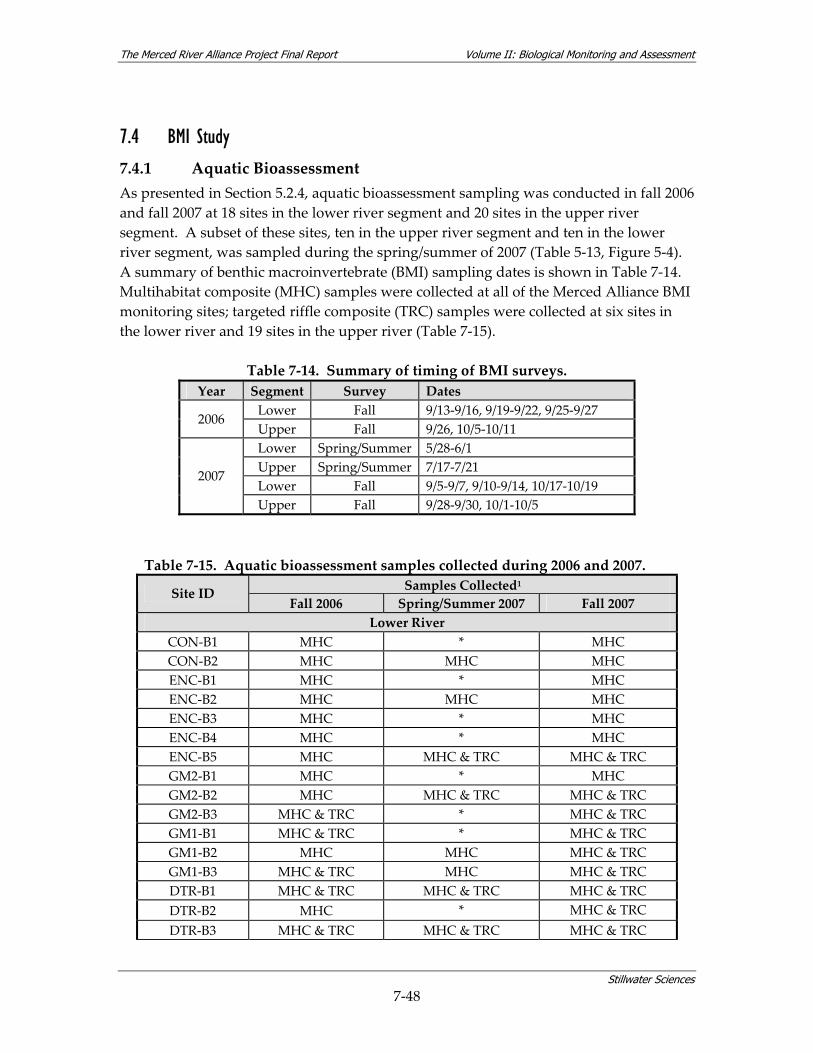
The Merced River Alliance Project Final Report Volume II: Biological Monitoring and Assessment
Stillwater Sciences
7‐48
7.4 BMI Study 7.4.1 Aquatic Bioassessment As presented in Section 5.2.4, aquatic bioassessment sampling was conducted in fall 2006 and fall 2007 at 18 sites in the lower river segment and 20 sites in the upper river segment. A subset of these sites, ten in the upper river segment and ten in the lower river segment, was sampled during the spring/summer of 2007 (Table 5‐13, Figure 5‐4). A summary of benthic macroinvertebrate (BMI) sampling dates is shown in Table 7‐14. Multihabitat composite (MHC) samples were collected at all of the Merced Alliance BMI monitoring sites; targeted riffle composite (TRC) samples were collected at six sites in the lower river and 19 sites in the upper river (Table 7‐15).
Table 7‐14. Summary of timing of BMI surveys. Year Segment Survey Dates
Lower Fall 9/13‐9/16, 9/19‐9/22, 9/25‐9/27 2006 Upper Fall 9/26, 10/5‐10/11 Lower Spring/Summer 5/28‐6/1 Upper Spring/Summer 7/17‐7/21 Lower Fall 9/5‐9/7, 9/10‐9/14, 10/17‐10/19
2007
Upper Fall 9/28‐9/30, 10/1‐10/5
Table 7‐15. Aquatic bioassessment samples collected during 2006 and 2007. Samples Collected1Site ID
Fall 2006 Spring/Summer 2007 Fall 2007 Lower River
CON‐B1 MHC * MHC CON‐B2 MHC MHC MHC ENC‐B1 MHC * MHC ENC‐B2 MHC MHC MHC ENC‐B3 MHC * MHC ENC‐B4 MHC * MHC ENC‐B5 MHC MHC & TRC MHC & TRC GM2‐B1 MHC * MHC GM2‐B2 MHC MHC & TRC MHC & TRC GM2‐B3 MHC & TRC * MHC & TRC GM1‐B1 MHC & TRC * MHC & TRC GM1‐B2 MHC MHC MHC & TRC GM1‐B3 MHC & TRC MHC MHC & TRC DTR‐B1 MHC & TRC MHC & TRC MHC & TRC DTR‐B2 MHC * MHC & TRC DTR‐B3 MHC & TRC MHC & TRC MHC & TRC

The Merced River Alliance Project Final Report Volume II: Biological Monitoring and Assessment
Stillwater Sciences
7‐49
Table 7‐15. Aquatic bioassessment samples collected during 2006 and 2007. Samples Collected1Site ID
Fall 2006 Spring/Summer 2007 Fall 2007 DTR‐B4 MHC & TRC MHC & TRC MHC & TRC MF‐B1 MHC MHC MHC
Upper River UF3‐B1 MHC & TRC MHC & TRC MHC & TRC UF3‐B2 MHC & TRC * MHC & TRC UF3‐B3 MHC & TRC MHC & TRC MHC & TRC UF3‐B4 MHC & TRC * MHC & TRC UF2‐B1 MHC MHC & TRC MHC & TRC UF2‐B2 MHC & TRC * MHC & TRC UF2‐B3 MHC & TRC * MHC & TRC UF2‐B4 MHC & TRC MHC & TRC MHC & TRC UF1‐B1 MHC & TRC * MHC & TRC UF1‐B2 MHC & TRC MHC & TRC MHC & TRC UF1‐B3 MHC & TRC MHC & TRC MHC & TRC LB‐B1 MHC & TRC * MHC & TRC LB‐B2 MHC & TRC * MHC & TRC LB‐B3 MHC & TRC MHC & TRC MHC & TRC LB‐B4 MHC & TRC * MHC & TRC LB‐B5 MHC & TRC MHC & TRC MHC & TRC YV‐B1 MHC & TRC MHC & TRC MHC & TRC YV‐B2 MHC & TRC * MHC & TRC YV‐B3 MHC & TRC MHC & TRC MHC & TRC GB‐B1 MHC & TRC * MHC & TRC
1 MHC = Multihabitat Composite; TRC = Targeted Riffle Composite. * Not sampled
7.4.1.1 BMI A complete taxonomic list of sampled BMIs is presented in Appendix I‐7. Metric values for individual monitoring sites are presented in Appendix I‐8 and were based on the Southwest Association of Invertebrate Taxonomists (SAFIT) level 1 standard taxonomic effort. From the 179 composite samples collected, approximately 85,000 BMIs were subsampled comprising 177 distinct taxa, including 76 EPT taxa and 20 Coleoptera taxa (Table 7‐16). Several other metrics, including Shannon Diversity, % Collector‐Gatherer plus Collector‐Filterer Individuals (collectors), % Non‐Gastropoda Scrapers, % Tolerant Taxa and metrics associated with abundance and biovolume, are also summarized in Table 7‐16 as cumulative totals by sample type and as median values (and range) across all monitoring sites. The summary metrics indicate that BMI assemblages collected from MHC samples had higher cumulative total richness and diversity when compared to TRC samples. The percentage of collectors (cumulative total) was similar between the two sample groups
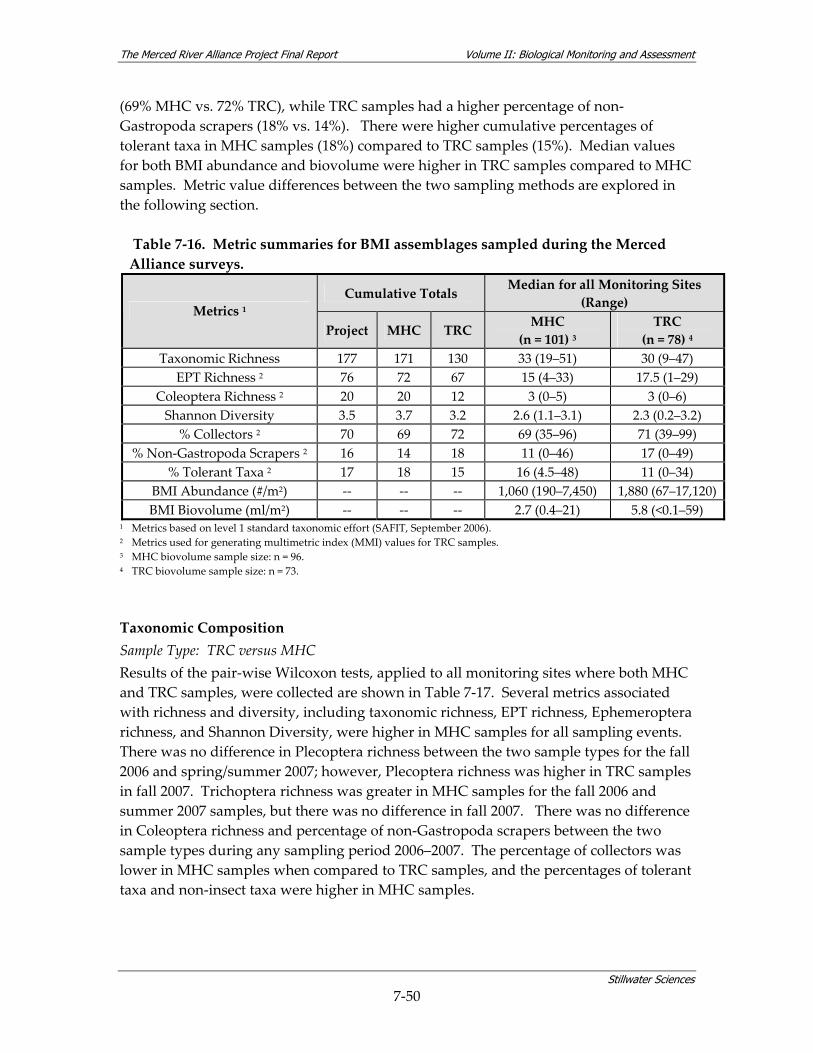
The Merced River Alliance Project Final Report Volume II: Biological Monitoring and Assessment
Stillwater Sciences
7‐50
(69% MHC vs. 72% TRC), while TRC samples had a higher percentage of non‐Gastropoda scrapers (18% vs. 14%). There were higher cumulative percentages of tolerant taxa in MHC samples (18%) compared to TRC samples (15%). Median values for both BMI abundance and biovolume were higher in TRC samples compared to MHC samples. Metric value differences between the two sampling methods are explored in the following section. Table 7‐16. Metric summaries for BMI assemblages sampled during the Merced Alliance surveys.
Cumulative Totals Median for all Monitoring Sites (Range) Metrics 1
Project MHC TRC MHC (n = 101) 3
TRC (n = 78) 4
Taxonomic Richness 177 171 130 33 (19–51) 30 (9–47) EPT Richness 2 76 72 67 15 (4–33) 17.5 (1–29)
Coleoptera Richness 2 20 20 12 3 (0–5) 3 (0–6) Shannon Diversity 3.5 3.7 3.2 2.6 (1.1–3.1) 2.3 (0.2–3.2)
% Collectors 2 70 69 72 69 (35–96) 71 (39–99) % Non‐Gastropoda Scrapers 2 16 14 18 11 (0–46) 17 (0–49)
% Tolerant Taxa 2 17 18 15 16 (4.5–48) 11 (0–34) BMI Abundance (#/m2) ‐‐ ‐‐ ‐‐ 1,060 (190–7,450) 1,880 (67–17,120)BMI Biovolume (ml/m2) ‐‐ ‐‐ ‐‐ 2.7 (0.4–21) 5.8 (<0.1–59)
1 Metrics based on level 1 standard taxonomic effort (SAFIT, September 2006). 2 Metrics used for generating multimetric index (MMI) values for TRC samples. 3 MHC biovolume sample size: n = 96. 4 TRC biovolume sample size: n = 73.
Taxonomic Composition Sample Type: TRC versus MHC Results of the pair‐wise Wilcoxon tests, applied to all monitoring sites where both MHC and TRC samples, were collected are shown in Table 7‐17. Several metrics associated with richness and diversity, including taxonomic richness, EPT richness, Ephemeroptera richness, and Shannon Diversity, were higher in MHC samples for all sampling events. There was no difference in Plecoptera richness between the two sample types for the fall 2006 and spring/summer 2007; however, Plecoptera richness was higher in TRC samples in fall 2007. Trichoptera richness was greater in MHC samples for the fall 2006 and summer 2007 samples, but there was no difference in fall 2007. There was no difference in Coleoptera richness and percentage of non‐Gastropoda scrapers between the two sample types during any sampling period 2006–2007. The percentage of collectors was lower in MHC samples when compared to TRC samples, and the percentages of tolerant taxa and non‐insect taxa were higher in MHC samples.
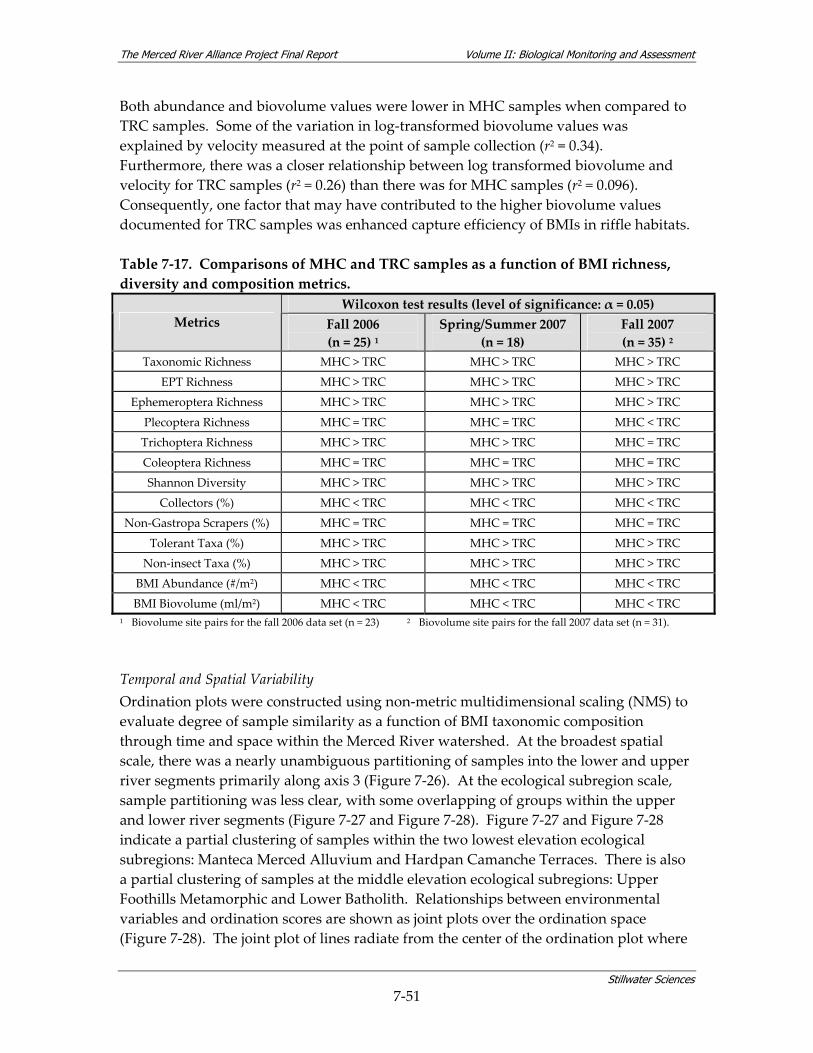
The Merced River Alliance Project Final Report Volume II: Biological Monitoring and Assessment
Stillwater Sciences
7‐51
Both abundance and biovolume values were lower in MHC samples when compared to TRC samples. Some of the variation in log‐transformed biovolume values was explained by velocity measured at the point of sample collection (r2 = 0.34). Furthermore, there was a closer relationship between log transformed biovolume and velocity for TRC samples (r2 = 0.26) than there was for MHC samples (r2 = 0.096). Consequently, one factor that may have contributed to the higher biovolume values documented for TRC samples was enhanced capture efficiency of BMIs in riffle habitats. Table 7‐17. Comparisons of MHC and TRC samples as a function of BMI richness, diversity and composition metrics.
Wilcoxon test results (level of significance: α = 0.05) Metrics Fall 2006
(n = 25) 1 Spring/Summer 2007
(n = 18) Fall 2007 (n = 35) 2
Taxonomic Richness MHC > TRC MHC > TRC MHC > TRC
EPT Richness MHC > TRC MHC > TRC MHC > TRC
Ephemeroptera Richness MHC > TRC MHC > TRC MHC > TRC
Plecoptera Richness MHC = TRC MHC = TRC MHC < TRC
Trichoptera Richness MHC > TRC MHC > TRC MHC = TRC
Coleoptera Richness MHC = TRC MHC = TRC MHC = TRC
Shannon Diversity MHC > TRC MHC > TRC MHC > TRC
Collectors (%) MHC < TRC MHC < TRC MHC < TRC
Non‐Gastropa Scrapers (%) MHC = TRC MHC = TRC MHC = TRC
Tolerant Taxa (%) MHC > TRC MHC > TRC MHC > TRC
Non‐insect Taxa (%) MHC > TRC MHC > TRC MHC > TRC
BMI Abundance (#/m2) MHC < TRC MHC < TRC MHC < TRC
BMI Biovolume (ml/m2) MHC < TRC MHC < TRC MHC < TRC 1 Biovolume site pairs for the fall 2006 data set (n = 23) 2 Biovolume site pairs for the fall 2007 data set (n = 31).
Temporal and Spatial Variability Ordination plots were constructed using non‐metric multidimensional scaling (NMS) to evaluate degree of sample similarity as a function of BMI taxonomic composition through time and space within the Merced River watershed. At the broadest spatial scale, there was a nearly unambiguous partitioning of samples into the lower and upper river segments primarily along axis 3 (Figure 7‐26). At the ecological subregion scale, sample partitioning was less clear, with some overlapping of groups within the upper and lower river segments (Figure 7‐27 and Figure 7‐28). Figure 7‐27 and Figure 7‐28 indicate a partial clustering of samples within the two lowest elevation ecological subregions: Manteca Merced Alluvium and Hardpan Camanche Terraces. There is also a partial clustering of samples at the middle elevation ecological subregions: Upper Foothills Metamorphic and Lower Batholith. Relationships between environmental variables and ordination scores are shown as joint plots over the ordination space (Figure 7‐28). The joint plot of lines radiate from the center of the ordination plot where
The Merced River Alliance Project Final Report Volume II: Biological Monitoring and Assessment
Stillwater Sciences
7‐52
the angle and length of the lines indicate the direction and strength of the relationship. The strength of the relationship between environmental variables and ordination scores exceeded coefficients of determination of 0.25. Figure 7‐28 indicates a strong ordering of sample units along the elevation gradient depicted by axis 3. Other variables including percent gradient and percentage of cobbles increased with increasing elevation while percentages of fines and macrophytes increased with decreasing elevation, all of which contributed to the variation in taxonomic composition of BMIs. Figure 7‐28 shows axis 2 of the ordination, which reveals weighted mean habitat type as a variable influencing ordination scores. This suggests that as the habitat changed from pool/glide to run/riffle there were concomitant changes in the taxonomic composition of BMIs. The scree plot indicates that the majority of variation in ordination scores was explained by axes 2 and 3 (cumulative r2 = 0.58). However, three dimensions (axes) produced a cumulative r2 of 0.79. The ordination plots did not indicate a clear grouping of samples based on seasonal or annual taxonomic composition of BMIs. There were, however, several taxa that seasonally predominated in relative abundance (Appendix I‐7). These taxa included the stonefly, Suwallia, and the ephemerellid mayflies, Attenella and Drunella flavilinea, which predominated at several monitoring sites in the upper river segment in spring/summer but not in the fall. The stoneflies (Sweltsa and Cultus/Osobenus) were nearly absent from spring/summer samples but common in fall samples in the upper river segment. The caddisfly Micrasema was abundant in fall but absent from spring/summer samples. To further explore sampling‐event differences, single‐factor ANOVA was used to evaluate significant differences between sampling events using the robust EPT taxa metric as the biological response variable. The ordination plot (Figure 7‐28) indicates a strong elevation effect on BMI composition within three elevation categories: 1) Valley (all downstream of the foothill reservoirs; n = 24), 2) Foothill (sites within the Upper Foothills reaches plus the LB‐1 site located at 610 m [2000 ft] elevation; n = 32), and 3) Mountain (all other sites above 610 m [2,000 ft] elevation including the other Lower Batholith sites, Yosemite Valley sites, and the Glaciated Batholith site; n = 21). Therefore, samples from these three groups were tested independently to evaluate sampling‐event differences. The EPT taxa data within each group were normally distributed and variance was homoscedastic. Mean EPT taxa values for the three sampling events were not significantly different within the valley (F(2, 67) = 1.4, p = 0.26) and mountain (F(2, 43) = 0.42, p = 0.65) groups, but there were significant differences within the foothill group (F(2, 58) = 14.3, p < 0.05). Tukey’s multiple comparison indicated no difference between mean EPT taxa values for fall 2006 and spring/summer 2007, but they indicated that mean EPT taxa values were lower in fall 2007.
The Merced River Alliance Project Final Report Volume II: Biological Monitoring and Assessment
Stillwater Sciences
7‐53
Biological Metric Response to Physical Habitat Variables The weighted mean habitat variable calculated from sites where a multihabitat approach was used showed moderate correlation with some constituents that vary along elevation gradients, as described by Vannote et al. (1980) and summarized by Allan (1995). Similar relationships were described in California by Brown and May (2000a) and Markiewicz et al. (2003). Based on Pearson correlation results, weighted mean habitat values were moderately correlated (|r| > 0.4, p < 0.0001) with percentages of embeddedness (‐), macrophytes (‐), fines (‐), cobble (+), boulder (+) and log‐transformed gradient (+) and elevation (+). This implies that as site habitat changed from pool/glide to riffle/cascade, embeddedness, macrophytes and fines decreased, while cobble, boulder and gradient increased with increasing elevation. Figure 7‐29 illustrates the percentage of fine particles at sample sites with respect to elevation and ecological subregion. All sites at which fines represented greater than 60 percent of the substrate occur at elevations less than 200 feet in the Merced Manteca Alluvium subregion (Figure 7‐29). One would then expect that with these changes in habitat there would be corresponding changes in BMI metric values. Increases in weighted mean habitat values corresponded with increases in total taxa (r = 0.44), EPT taxa (r = 0.51); Ephemeroptera taxa (r = 0.46), Trichoptera taxa (r = 0.49) non‐gastropod scrapers (r = 0.47), composite metric scores (r = 0.52), and decreases in oligochaetes (r = ‐0.46), tolerant taxa (r = ‐0.55), and collector‐gatherers (r = ‐0.49). All of these correlations were highly significant (p < 0.0001, n = 101). Several other metrics evaluated had significant (p < 0.05) but weak correlation (|r| < 0.4) with physical habitat variables. Canopy was weakly correlated with percent FWM (r = 0.32, p < 0.0001) but correlation with the other physical habitat variables was negligible. There was negligible correlation between canopy and biological metrics, except percent intolerant organisms (r = 0.40, p < 0.0001). Examination of scatterplots revealed additional information about some of these relationships that were not fully explained by correlation coefficients. Percent fines (particles < 2 mm) indicated no apparent corresponding change in biological metrics through the range of about 0 to 50 percent. As fines increased from 50 to 95 percent, however, there was a corresponding decrease in EPT taxa suggesting a threshold effect (Figure 7‐30). The same pattern was evident for embeddedness; the threshold, however, was about 70 percent embeddedness before there was a corresponding change in biological metric values (Figure 7‐31). Multimetric Evaluation Multimetric index Multimetric indices (MMIs) are plotted in Figure 7‐32a for all MHC samples and Figure 7‐32b for all TRC samples. Two overall patterns are apparent from these figures regarding the distribution of MMI values across monitoring site locations. First, there
The Merced River Alliance Project Final Report Volume II: Biological Monitoring and Assessment
Stillwater Sciences
7‐54
was a distinct grouping of MMI values for samples in the lower and upper river segments for all sampling events. As previously shown in Figure 7‐26, ordination produced a similar pattern using relative taxonomic composition. Second, MMI values for TRC and MHC samples followed similar trends (highly correlated, r = 0.89) and differences were not significant at sites where both types of samples were collected (Wilcoxon, p > 0.05, n = 78 site pairs). Other less consistent patterns in the distribution of MMI values across sites and sampling events were also apparent. MMI values at one or more of the Gravel Mining Reach sites were relatively high in comparison to others in the lower river segment for both sample types but particularly high for TRC samples. These relatively high MMI values were due mostly to the high relative abundance of the intolerant (CTV = 1) scraping caddisfly, Protoptila, at Gravel Mining Reach sites, particularly sites GM2‐B2, GM2‐B3 and GM1‐B1. Its increased abundance was the primary elevating influence on the percent non‐gastropoda scraper metric (TRC samples) and percent scraper metric (MHC samples), which are components of the MMIs (Table 5‐15). Another notable trend was the high variation of MMI values for one or more of the monitoring sites within the Upper Foothills Reach 3 (UF3). In fall 2006, MMI values for site UF3‐B1 fell more within the range of monitoring sites in the lower river segment. The UF3‐B1 TRC sample had unusually low BMI abundance (67/m2), which resulted in a sample with low richness and diversity. In spring/summer and fall of 2007, the UF3‐B1 sample and its duplicate fell within an intermediate range of MMI values when compared to MMI values in the lower and upper river segments. However, in fall 2007, other sites within the Upper Foothills Reach, primarily UF3, indicated high variation, especially when compared to MMI values in fall 2006 and spring/summer 2007. Black fly (Simulium) populations in fall 2007 TRC samples were especially high at the Upper Foothills sites UF3‐B1 through UF3‐B4, where they composed 70% to 95% of the organisms sampled. Site LB‐B1 also contained abundant black flies (52% and 60%), which contributed to its low MMI value in fall 2007 for both sample types. Average MMI values within the two lowest‐elevation ecological subregions ranged from 19 to 21, and average MMI values within the three uppermost‐elevation ecological subregions ranged from 56 to 68 (Figure Figure 7‐33). High black fly populations, particularly in fall 2007, contributed to low MMI values at the UF3 monitoring sites and contributed to the slightly lower MMI mean for the Upper Foothills ecological subregion when compared to the other two highest elevation ecological subregions. BMI Hypotheses As discussed in Section 5.2.4.2, a series of BMI hypotheses were developed as a secondary goal of the Merced Alliance biological monitoring and assessment, in an effort to guide current and projected restoration activities on the Merced River. These hypotheses were developed as exploratory statements regarding afctors affecting BMI
The Merced River Alliance Project Final Report Volume II: Biological Monitoring and Assessment
Stillwater Sciences
7‐55
distribution and composition that were subsequently evaluated during the study and either supported or refuted. BMI Hypotheses 1–5 are addressed below. Hypotheses 6–8 are addressed later in the document (Section 7.4.2.) because they are related to results of the exotic BMI surveys. Additional discussion of the BMI hypotheses is included in Section 8.3.2. BMI Hypothesis 1 – Woody Debris and Composite Metric Scores BMI Hypothesis 1 states that BMI samples taken from sites with relatively large amounts of fixed woody material (FWM) (as quantified during the physical habitat assessment) will exhibit higher MMI values than those taken from sites without significant FWM (Kaufman et al. 1999). Percent FWM was estimated along each transect and at each sample point where benthic samples were collected. The percentages of FWM that were assessed at the points where benthic samples were collected were used for the analysis because many of the sites were not wadeable and visibility in the channel was low, which resulted in many non‐reportable values for transect assessments. A scatterplot of FWM and MMI values revealed a sparse distribution of FWM at all Merced River monitoring sites, with many zero values aligned along the entire range of MMI values (Figure 7‐34a). FWM was included in the ordination analysis but was excluded from the joint plot (Figure 7‐28) because of weak correlation (r = ‐0.29, axis 3; r = ‐0.12, axis 2). Figure 7‐34b shows the ordination plot with circles (samples) increasing in diameter with increasing percentages of FWM. The plot indicates that FWM was more prevalent within the two lowest elevation ecological subregions , at sites with a more depositional (pool/glide) habitat type. BMI Hypothesis 2 – Taxonomic Richness Above New Exchequer Dam BMI Hypothesis 2 asserts that taxonomic richness will be greatest in riffles located in the foothill region above New Exchequer Dam, as compared with taxonomic richness measured in riffles located in either the mountain or valley floor regions of the Merced River (Brown and May 2000a). Samples from riffle habitats were grouped into three elevation categories: 1) Valley (all downstream of the foothill reservoirs, n = 24), 2) Foothill (sites within the Upper Foothills reaches plus the LB‐1 site located at 610 m [2,000 ft] elevation, n = 32), and 3) Mountain (all other sites above 610 m [2,000 ft] elevation including the other Lower Batholith sites, Yosemite Valley sites, and the Glaciated Batholith site, n = 21). In addition to overall taxonomic richness, EPT richness was tested because it is generally highly correlated with taxonomic richness and has a higher signal‐to‐noise ratio (Rehn et al. 2007a).
The Merced River Alliance Project Final Report Volume II: Biological Monitoring and Assessment
Stillwater Sciences
7‐56
Figure 7‐35 presents boxplots of total taxa and EPT richness across the three treatment groups. There were significant differences among the treatment groups for both taxonomic richness and EPT richness values (H‐test, p < 0.05). Total and EPT richness were higher at foothill sites when compared to the valley sites, and EPT richness was higher at mountain sites when compared to the foothill sites. Total taxa richness was not significantly different between the foothill and mountain site groups (U‐test, p > 0.05). Therefore, the results support the hypothesis that richness at foothill sites is higher when compared to richness at valley sites. However, the results do not support the hypothesis that richness at foothill sites is higher when compared to richness at mountain sites. BMI Hypothesis 3 – Functional Feeding Groups Below New Exchequer Dam BMI Hypothesis 3 states that serial discontinuity in the longitudinal pattern of functional feeding group (FFG) relative abundance will be apparent at New Exchequer Dam, with increased relative abundance of collector‐filterers (CF) just below the dam (Ward and Stanford 1995). Despite a clear partitioning of monitoring sites upstream and downstream of the foothill reservoirs by both ordination and MMI scores, serial discontinuity in relative abundance of CF was not apparent in the Merced River as stated in BMI Hypothesis 3. While CF were well represented downstream of New Exchequer Dam and the other three foothill reservoirs (monitoring sites grouped between 70–100m [240 and 320 ft] elevation), CF were also well represented at multiple monitoring sites upstream of the foothill reservoirs (Figure 7‐36). This pattern suggests no meaningful differences in CF for the two site groups, or higher CF upstream of the reservoirs (Figure 7‐36). CF relative abundance proved to be higher upstream of the foothill reservoirs at Upper Foothills 3 sites when compared to CF relative abundance downstream of the foothill reservoirs (U‐test, p < 0.05; Figure 7‐37a). Further examination of the taxa list for this project, reveals serial discontinuity in relative abundance of non‐insect taxa, including amphipods downstream and upstream of the foothill reservoirs, supporting work done by Hilsenhoff (1971), Ward (1974) Brown and May (2000a) and Petts (1984). The 2006–2007 seasonal sampling events of the Merced Alliance BMI study component yielded a higher relative abundance of non‐insect taxa downstream of the reservoirs at the Dredger Tailings Reach and Merced Falls Reach sites (n = 25) when compared to the relative abundance of non‐insect taxa upstream of the reservoirs at the Upper Foothills 3 sites (n = 26); this difference was significant (U‐test, p < 0.05; Figure 7‐37b). Furthermore, restricting the non‐insects to Malacostraca isolates the amphipods and isopods, which were much more abundant downstream of the reservoirs when compared to their relative abundance upstream of the reservoirs (U‐test, p < 0.05; Figure 7‐37c). Additional discussion on serial discontinuity and BMI hypothesis 3 is included in Section 8.3.2.8.
The Merced River Alliance Project Final Report Volume II: Biological Monitoring and Assessment
Stillwater Sciences
7‐57
BMI Hypothesis 4 – EPT richness in the DTR BMI Hypothesis 4 predicts an increase in the relative abundance and richness of stonefly and other EPT taxa in the Dredger Tailings Reach in sampling years 2006 and 2007 as compared with the data collected in March 2005 following multiple years of “dry” to “normal” flows (Stillwater Sciences 2006b). Analysis of this hypothesis was restricted to samples from riffle habitats because the March 2005 Dredger Tailings Reach samples were collected from riffle habitat. The pool of possible sample units for this analysis included: 1) spring 2005 (n = 8), 2) fall 2006 (n = 3), 3) spring/summer 2007 (n = 3), and 4) fall 2007 (n = 4). Due to an insufficient sample size for individual 2006 and 2007 events, mean values were calculated from two groups: spring 2005 (n = 8) and all 2006 and 2007 sampling events (n = 10). Mean EPT richness values for the two groups were 11 (2005) and 9 (2006 and 2007), a difference which was significant (t‐test, p < 0.05; Figure 7‐38a). While this result indicates that multiple years of “dry” to “normal” flows did not contribute to a decrease in EPT taxa, it is somewhat confounded because mean EPT index was higher in the 2006 and 2007 sample group when compared to spring 2005 (t‐test, p < 0.05; Figure 7‐38b). EPT richness reflects the number of EPT taxa represented in a sample, regardless of the number of individual organisms within each taxon. EPT index is the cumulative sum of all EPT organisms expressed as a percentage of all the organisms in the sample. In 2005 there were more EPT taxa but fewer individuals comprising the EPT orders when compared to samples collected in 2006 and 2007. Thus, although BMI Hypothesis 4 is not supported, the results are of questionable ecological significance. BMI Hypothesis 5 – EPT Richness and Habitat Restoration BMI Hypothesis 5 states EPT richness will be greater in reaches where habitat restoration involving substrate renewal (e.g., gravel augmentation) or channel reconfiguration has occurred, as compared with otherwise similar reaches in which no restoration has occurred (Merz and Chan 2005). To examine this hypothesis, areas on the Merced River where restoration has occurred (Appendix A) were linked, as closely as feasible, to the Merced Alliance BMI monitoring sites. The sites with the closest proximity to habitat restoration included GM2‐B2, DTR‐B3 and B4, LB‐B5, and YV‐B1 and B2. At lower river restoration sites, EPT richness values were examined in comparison to control sites upstream and downstream of the restoration activity. For the lower river segment, the following sites were used for control (n = 44): all sites within the Encroachment Reach, all sites in the Gravel Mining Reach except site GM2‐B2 (restoration site), and all sites in the Dredger Tailings Reach except sites DTR‐B3 and DTR‐B4 (restoration sites). Sample size for the lower river restoration sites was 17. Mean EPT richness at the control sites was 10.3 and mean EPT richness at the restoration sites was 10.9 and not significantly different (t‐test; p > 0.05). In addition, mean MMI values for the restoration and control site groups were not significantly different (t‐test, p > 0.05). Abundance and biovolume mean values,
The Merced River Alliance Project Final Report Volume II: Biological Monitoring and Assessment
Stillwater Sciences
7‐58
however, proved to be higher at restoration sites when compared to control sites (t‐test; p < 0.05). The remaining restoration sites are located in the mountain region as defined in Hypothesis 2, where it was established that the mountain sites had significantly higher EPT richness values than foothill sites. Hence the analysis was restricted to the pool of samples within the mountain region, and these were split into restoration and control groups. The control group included sites (n = 26) consisting of Lower Batholith sites except LB‐B1 (foothill) and LB‐B5 (restoration), and Yosemite Valley sites except YV‐B1 and YV‐B2 (restoration sites). The restoration sites consisted of 16 samples from the sites identified above. Mean EPT richness values between the control and restoration site groups were not significantly different (t‐test, p > 0.05). In addition, mean MMI values between the two site groups were not significantly different (t‐test, p > 0.05). The restoration site group had a higher mean abundance when compared to the control site group (t‐test, p < 0.05) but biovolume mean values were not significantly different (t‐test; p > 0.05). These results indicate that habitat restoration appears to have had no effect on the number of EPT taxa or MMI values. Additional discussion on BMI hypothesis 5 and the effects of restoration is presented in Section 8.3.2.7. 7.4.1.2 Physical Habitat Assessment Site Characterization As described in Section 5.2.4.3, physical habitat data were collected along with both MHC and TRC samples. Parameters recorded along the transect and at the sample point for all monitoring sites and sampling events are presented and summarized in Appendices I‐3 and I‐4. The values measured at the transect scale were varied, and intra‐site variation was pronounced for the MHC samples. As expected, this variability is greater than that of TRC samples, with the disparity inherent because of differences in sample design. For example, MHC collections were made at 11 transects every 50 m along the reach; and more often than not, transects were distributed across several distinct habitat units. In contrast, TRC samples were collected from 8 quadrats, which often occurred within the same riffle unit and were in a relatively homogeneous physical habitat. Water Quality Measurements In situ water quality constituents were measured in conjunction with all BMI surveys. Parameters measured included temperature, dissolved oxygen, specific conductivity, pH, and turbidity. In three instances, post‐calibration of the dissolved oxygen sensor indicated a greater than 10% difference between Winkler titration results and instrument results. Dissolved oxygen data collected using these calibrations were not reported. pH data collected for this survey were not reported because some results were erratic, results from the two methods used were inconsistent, and the accuracy of both methods could not be verified. The Oakton pHTestr 2 and similar probes are known to perform poorly in low ionic strength waters such as the Merced River (M. Conklin, pers. comm.

The Merced River Alliance Project Final Report Volume II: Biological Monitoring and Assessment
Stillwater Sciences
7‐59
2006). When EMD ColorpHast pH strips were used, results were anomalous and may have been affected by the water being colored. When both the Oakton pHTestr 2 and the EMD ColorpHast pH strips were used simultaneously, there was no correlation between the results from both methods. Data quality objectives were met for all other parameters (Table 7‐18). Table 7‐18. Data quality measures for water quality data collected in conjunction with BMI surveys.
Data Quality Measures Parameter
Accuracy Precision Completeness
Dissolved Oxygen + 0.5 mg/L 10% 85%
Temperature + 0.5 °C N/A 1 100%
Conductivity + 5% N/A 1 100%
pH N/A 2 N/A 1, 2 0%
Turbidity + 10% or 0.1 (whichever is greater)
N/A 1 100% 1 Independent verification of results was not conducted or inconsistently applied for temperature, pH, conductivity, and
turbidity. 2 pH results are not reported due to quality control measures.
In situ water quality results are summarized in Table 7‐19 and presented in full in Appendix I‐5. Table 7‐19. Water quality summary by reach for data collected in conjunction with BMI surveys.
Reach Fall 2006 Spring/ Summer 2007 Fall 2007 Water Temperature (°C)
CON 19.6 (2) 25.9 (1) 24.8 (2) ENC 18.4 (5) 23.6 (2) 25.7 (5) GM2 15.4 (3) 22.9 (1) 22.4 (3) GM1 16.4 (3) 21.1 (2) 20.6 (3) DTR 14.5 (4) 14.7 (3) 17.6 (4) MF 15.4 (1) not sampled 15.1 (1) UF3 17.6 (4) 24.0 (2) 19.5 (4) UF2 15.2 (4) 25.7 (2) 16.9 (4) UF1 14.8 (3) 25.2 (2) 14.9 (3) LB 11.6 (5) 21.2 (2) 13.8 (5) YV 10.5 (3) 15.8 (2) 12.9 (3) GB 8.0 (1) not sampled 10.0 (1)
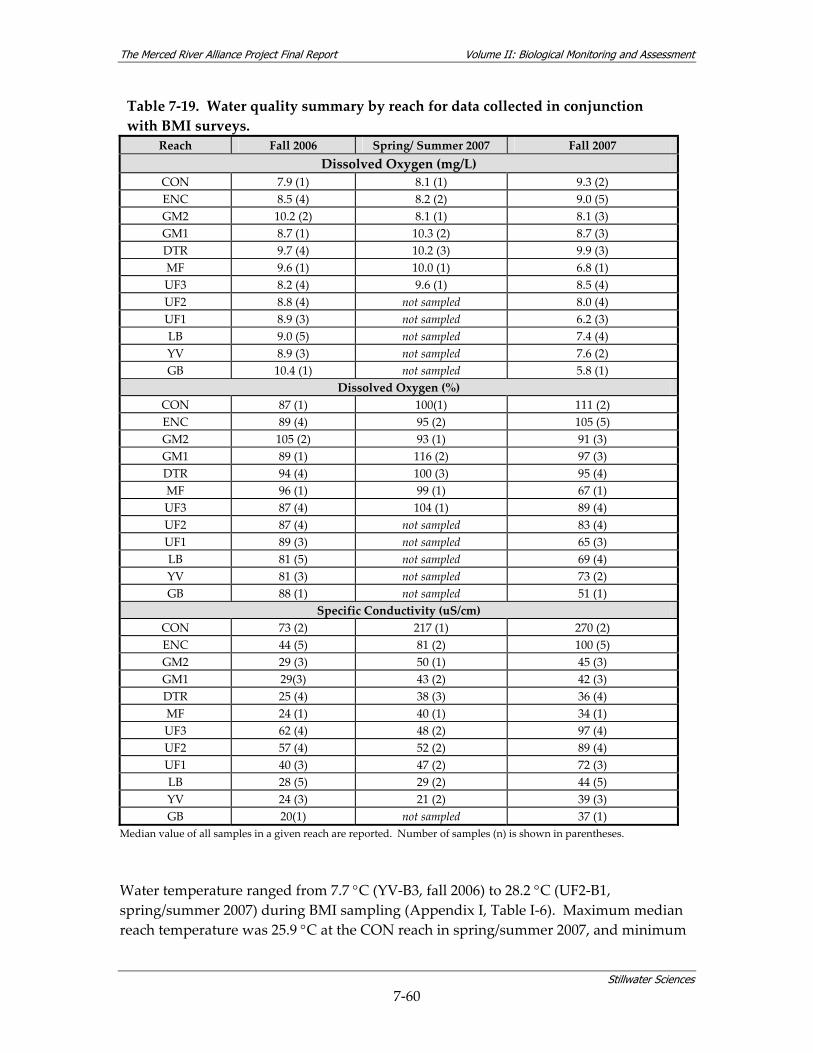
The Merced River Alliance Project Final Report Volume II: Biological Monitoring and Assessment
Stillwater Sciences
7‐60
Table 7‐19. Water quality summary by reach for data collected in conjunction with BMI surveys.
Reach Fall 2006 Spring/ Summer 2007 Fall 2007 Dissolved Oxygen (mg/L)
CON 7.9 (1) 8.1 (1) 9.3 (2) ENC 8.5 (4) 8.2 (2) 9.0 (5) GM2 10.2 (2) 8.1 (1) 8.1 (3) GM1 8.7 (1) 10.3 (2) 8.7 (3) DTR 9.7 (4) 10.2 (3) 9.9 (3) MF 9.6 (1) 10.0 (1) 6.8 (1) UF3 8.2 (4) 9.6 (1) 8.5 (4) UF2 8.8 (4) not sampled 8.0 (4) UF1 8.9 (3) not sampled 6.2 (3) LB 9.0 (5) not sampled 7.4 (4) YV 8.9 (3) not sampled 7.6 (2) GB 10.4 (1) not sampled 5.8 (1)
Dissolved Oxygen (%) CON 87 (1) 100(1) 111 (2) ENC 89 (4) 95 (2) 105 (5) GM2 105 (2) 93 (1) 91 (3) GM1 89 (1) 116 (2) 97 (3) DTR 94 (4) 100 (3) 95 (4) MF 96 (1) 99 (1) 67 (1) UF3 87 (4) 104 (1) 89 (4) UF2 87 (4) not sampled 83 (4) UF1 89 (3) not sampled 65 (3) LB 81 (5) not sampled 69 (4) YV 81 (3) not sampled 73 (2) GB 88 (1) not sampled 51 (1)
Specific Conductivity (uS/cm) CON 73 (2) 217 (1) 270 (2) ENC 44 (5) 81 (2) 100 (5) GM2 29 (3) 50 (1) 45 (3) GM1 29(3) 43 (2) 42 (3) DTR 25 (4) 38 (3) 36 (4) MF 24 (1) 40 (1) 34 (1) UF3 62 (4) 48 (2) 97 (4) UF2 57 (4) 52 (2) 89 (4) UF1 40 (3) 47 (2) 72 (3) LB 28 (5) 29 (2) 44 (5) YV 24 (3) 21 (2) 39 (3) GB 20(1) not sampled 37 (1)
Median value of all samples in a given reach are reported. Number of samples (n) is shown in parentheses.
Water temperature ranged from 7.7 °C (YV‐B3, fall 2006) to 28.2 °C (UF2‐B1, spring/summer 2007) during BMI sampling (Appendix I, Table I‐6). Maximum median reach temperature was 25.9 °C at the CON reach in spring/summer 2007, and minimum

The Merced River Alliance Project Final Report Volume II: Biological Monitoring and Assessment
Stillwater Sciences
7‐61
median reach temperature was 10.5 °C at the YV reach in fall 2006. Water temperature generally increased downstream when data were collected concurrently. Downstream temperature increases are common in snow‐fed rivers and reflect solar heating and the addition of water from warmer tributaries, plus equilibration with warmer ambient air temperatures typically found at lower elevations. Water temperatures were highest during the summer sampling event. Dissolved oxygen levels ranged from 5.4 mg/L (UF2‐B2, fall 2007) to 11.5 mg/L (GM2‐B1, fall 2006) during BMI sampling. Maximum median reach dissolved oxygen was 10.3 mg/L at the GM1 reach in spring/summer 2007, and minimum median reach dissolved oxygen was 6.2 mg/L at the UF1 reach in fall 2007. The low levels of dissolved oxygen measured during the spring 2007 lower river during fish surveys (Table 7‐10) were not measured during the BMI surveys, likely because the BMI surveys were conducted about a month later, after conditions changed. In the upper river, dissolved oxygen levels during BMI surveys were generally lower in fall 2007 than in fall 2006. Trends in specific conductivity data were generally similar to those in data collected for the fish surveys. Specific conductivity was highest in the most downstream sites, reaching a maximum of 275.6 μS/cm (CON‐B1, fall 2007), with a maxium median reach specific conductivity of 270 uS/cm (CON, fall 2007). Specific conductivity increased downstream in both the upper and lower river, but specific conductivity decreased from the lowest upper river reach (UF3) to the uppermost lower river site (MF), probably due to release of less saline water from spring runoff stored in Lake McClure during the summer and fall. As discussed for in situ water quality data collected in conjunction with the fish surveys (Section Error! Reference source not found.), BMI in situ water quality results are in general agreement with 2004–2006 monitoring results reported by the East San Joaquin Water Quality Coalition (ESJWQC 2007). Combined, the ESJWQC and Merced Alliance results indicate a need for water quality improvement in the lower Merced River. Physical Habitat Assessment Score As part of the SWAMP protocol, a physical habitat assessment was conducted at each monitoring site, in which ten habitat parameters were ranked on a scale of 0 to 20 and totaled for the site (total possible score of 200). As shown in Table 7‐20, habitat scores ranged from 76 to 190 (median = 154), where scores of 0 to 50 are considered “poor;” scores of 51 to 100 are considered “marginal;” scores of 101 to 150 are considered “suboptimal”; and scores of 151 to 200 are considered “optimal” (Barbour et al. 1999). Throughout the study period, Merced River BMI monitoring sites consistently ranked in the optimal or suboptimal categories, with a few marginal scores at sites closest to the San Joaquin confluence. Individual scores partitioned by parameter are presented for each site in Appendix I‐6.
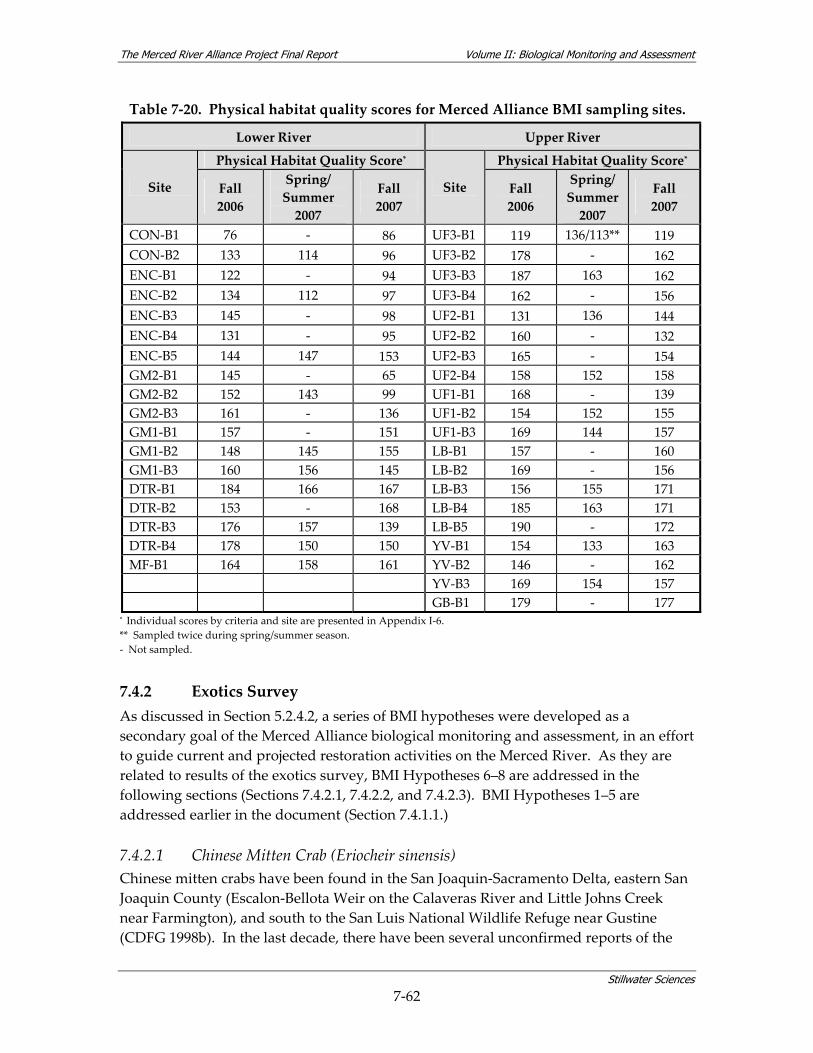
The Merced River Alliance Project Final Report Volume II: Biological Monitoring and Assessment
Stillwater Sciences
7‐62
Table 7‐20. Physical habitat quality scores for Merced Alliance BMI sampling sites.
Lower River Upper River
Physical Habitat Quality Score* Physical Habitat Quality Score*
Site Fall 2006
Spring/ Summer 2007
Fall 2007
Site Fall 2006
Spring/ Summer 2007
Fall 2007
CON‐B1 76 ‐ 86 UF3‐B1 119 136/113** 119 CON‐B2 133 114 96 UF3‐B2 178 ‐ 162 ENC‐B1 122 ‐ 94 UF3‐B3 187 163 162 ENC‐B2 134 112 97 UF3‐B4 162 ‐ 156 ENC‐B3 145 ‐ 98 UF2‐B1 131 136 144 ENC‐B4 131 ‐ 95 UF2‐B2 160 ‐ 132 ENC‐B5 144 147 153 UF2‐B3 165 ‐ 154 GM2‐B1 145 ‐ 65 UF2‐B4 158 152 158 GM2‐B2 152 143 99 UF1‐B1 168 ‐ 139 GM2‐B3 161 ‐ 136 UF1‐B2 154 152 155 GM1‐B1 157 ‐ 151 UF1‐B3 169 144 157 GM1‐B2 148 145 155 LB‐B1 157 ‐ 160 GM1‐B3 160 156 145 LB‐B2 169 ‐ 156 DTR‐B1 184 166 167 LB‐B3 156 155 171 DTR‐B2 153 ‐ 168 LB‐B4 185 163 171 DTR‐B3 176 157 139 LB‐B5 190 ‐ 172 DTR‐B4 178 150 150 YV‐B1 154 133 163 MF‐B1 164 158 161 YV‐B2 146 ‐ 162 YV‐B3 169 154 157 GB‐B1 179 ‐ 177
* Individual scores by criteria and site are presented in Appendix I‐6. ** Sampled twice during spring/summer season. ‐ Not sampled.
7.4.2 Exotics Survey As discussed in Section 5.2.4.2, a series of BMI hypotheses were developed as a secondary goal of the Merced Alliance biological monitoring and assessment, in an effort to guide current and projected restoration activities on the Merced River. As they are related to results of the exotics survey, BMI Hypotheses 6–8 are addressed in the following sections (Sections 7.4.2.1, 7.4.2.2, and 7.4.2.3). BMI Hypotheses 1–5 are addressed earlier in the document (Section 7.4.1.1.) 7.4.2.1 Chinese Mitten Crab (Eriocheir sinensis) Chinese mitten crabs have been found in the San Joaquin‐Sacramento Delta, eastern San Joaquin County (Escalon‐Bellota Weir on the Calaveras River and Little Johns Creek near Farmington), and south to the San Luis National Wildlife Refuge near Gustine (CDFG 1998b). In the last decade, there have been several unconfirmed reports of the

The Merced River Alliance Project Final Report Volume II: Biological Monitoring and Assessment
Stillwater Sciences
7‐63
Chinese mitten crab from the lower Stanislaus and Merced rivers, but no official collections have been documented from this area; in addition, no crabs were reported from these areas during 2006 or 2007 (Heib, pers. comm. 2007). As discussed in Section 5.2.4.3, during the first year of the study, passive habitat traps (Figure 5‐6) targeting the Chinese mitten crab were deployed at five sites (Table 5‐12, Figure 5‐1) in the lower river segment and monitored biweekly during the summer and fall (when developing crabs are most likely to be visible). However, surveys did not indicate the presence of the Chinese mitten crab. In addition, during aquatic bioassessment sampling in 2006 and 2007, no Chinese mitten crab carapaces were observed along the river banks. BMI Hypothesis 6 – Chinese Mitten Crab Distribution BMI Hypothesis 6 states that, because the potential source of invasion would be the Sacramento‐San Joaquin River estuary, Chinese mitten crab distribution in the Merced River will be limited to the lower sand‐bedded reaches of the Merced River, and that relative abundance will be greatest near the SJR confluence and will decrease upstream of the confluence (Bergendorf 2005). As the survey did not indicate the presence of the Chinese mitten crab, it was not possible to test this hypothesis. Since the crabs were initially collected in the San Francisco Bay in 1992, rapid population‐wide fluctuations in their abundance have been documented (Bergendorf 2005, Rudnick et al. 2005, Hanson and Sytsma 2005). Their abundance increased dramatically in 1998–1999, and during this timeframe they were found as far south as the San Luis National Wildlife Refuge in the San Joaquin River. Yet extensive surveys conducted in the San Joaquin River Basin (May and Brown 2001) in the year 2000 did not reveal the presence of the Chinese mitten crab. Since this time, populations of the Chinese mitten crab have continued to decline in the Sacramento‐San Joaquin River estuary (Heib, pers. comm. 2007). This, along with the results of the passive habitat trapping survey, suggests that the Chinese mitten crab has not yet invaded the Merced River. 7.4.2.2 New Zealand Mud Snail (Potamopyrgus antipodarum [family Hydrobiidae]) The New Zealand mud snail is a an invasive species with a high reproductive potential that can be found in many habitat types including silt, sand, gravel, cobbles, and vegetation. Populations of the New Zealand mud snail have been documented on several rivers in Northern California, including the Napa and Calaveras Rivers; however, the New Zealand mud snail has not been documented on the Merced River to date (CDFG 2008). Aquatic bioassessment collections taken in 2006 and 2007 from upper and lower river segments were inspected for New Zealand mud snails during laboratory processing. No mud or spring snails of the family Hydrobiidae were found in the benthic samples.
The Merced River Alliance Project Final Report Volume II: Biological Monitoring and Assessment
Stillwater Sciences
7‐64
BMI Hypothesis 7 – New Zealand Mud Snail Distribution BMI Hypothesis 7 predicts that, if found, the New Zealand mud snail will not exhibit any consistent longitudinal pattern in distribution and abundance (because introduction by humans may occur at any point within the Merced River corridor) and relative abundance will be highest in areas where recreational fishing activities are most prominent. The New Zealand mud snail was not found during the 2006 and 2007 surveys, thus it was not possible to test this hypothesis. 7.4.2.3 Asian clam (Corbicula fluminea [family Corbiculidae]) The Asian clam is native to southern and eastern Asia. The clam was initially documented in California in 1938 and is now present in rivers and streams throughout the state. The species is most abundant in well‐oxygenated, clear waters but is found both in lotic and lentic habitats. Clay and fine to coarse grained sand are preferred substrates, although these clams may be found in lower numbers on most any substrate (USGS 2001). Previous studies have documented the presence of the Asian clam in tributary rivers to the San Joaquin River, including the Merced. The clam is thought to affect ecosystem processes by limiting suspended algal biomass within tributaries, thereby reducing export of suspended algae into mainstem rivers (Brown and May, 2004). In both years, the Asian clam was present in samples collected from 13 of the monitoring sites located in the lower river segment from the confluence (CON‐F1) upstream to site GM1‐B3, at an elevation of 69 m (255 ft). Additionally, fingernail clams (Family Sphaeriidae) were found at several sites between 46 m (150 ft) and 98 m (320 ft) elevation in the lower river segment. Another unionoid mollusk, the western pearshell mussel (Margaritifera falcata), was found in the lower river during the Merced Alliance surveys. Clams were scarce in benthic samples from the upper river segment where only 21 sphaeriid clams (Pisidium) were documented. BMI Hypothesis 8 – Asian Clam Distribution BMI Hypothesis 8 states that Asian clam distribution in the Merced River will extend beyond that measured in 2003 by Brown et al. (Brown et al. 2007) to include locations in the upper river (i.e., the dams do not represent a barrier to upstream dispersal since birds or humans can serve as vectors of introduction to the upper portion of the watershed). Although a quantified estimate of Asian clam abundance on the Merced is beyond the scope of this study, the data from the BMI collections and field observations indicate that dams may represent a barrier to upstream dispersal of this organism, contradicting BMI Hypothesis 8.
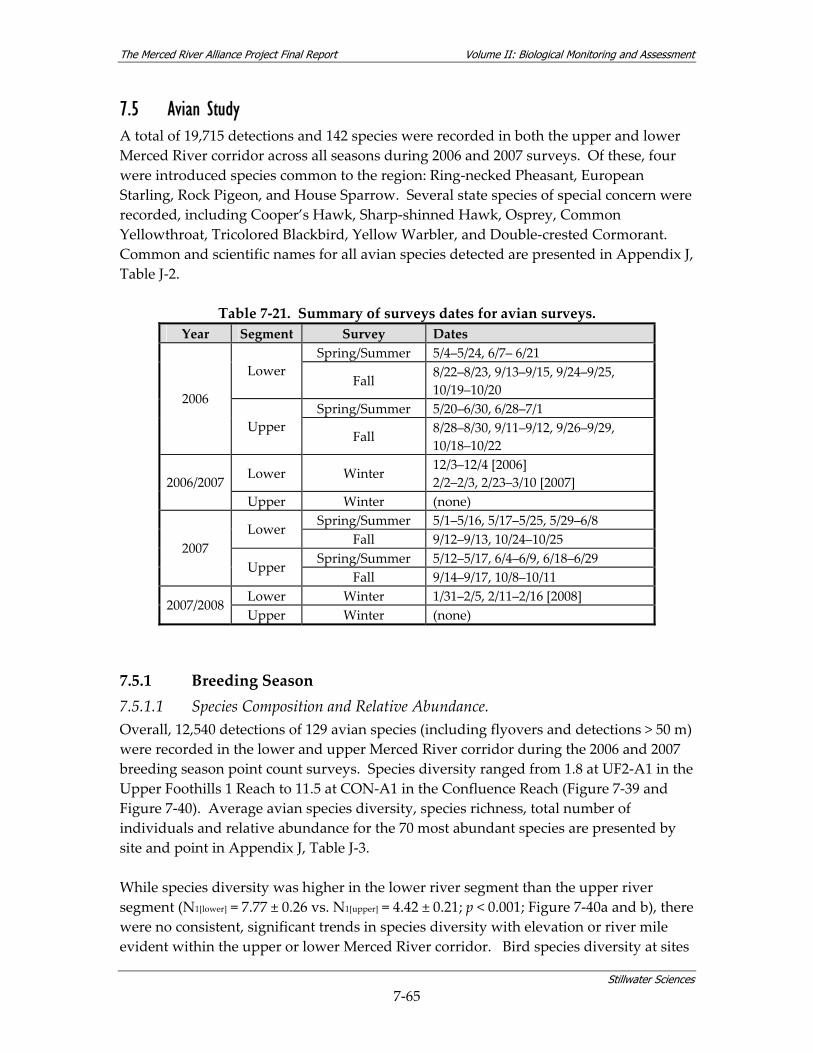
The Merced River Alliance Project Final Report Volume II: Biological Monitoring and Assessment
Stillwater Sciences
7‐65
7.5 Avian Study A total of 19,715 detections and 142 species were recorded in both the upper and lower Merced River corridor across all seasons during 2006 and 2007 surveys. Of these, four were introduced species common to the region: Ring‐necked Pheasant, European Starling, Rock Pigeon, and House Sparrow. Several state species of special concern were recorded, including Cooper’s Hawk, Sharp‐shinned Hawk, Osprey, Common Yellowthroat, Tricolored Blackbird, Yellow Warbler, and Double‐crested Cormorant. Common and scientific names for all avian species detected are presented in Appendix J, Table J‐2.
Table 7‐21. Summary of surveys dates for avian surveys. Year Segment Survey Dates
Spring/Summer 5/4–5/24, 6/7– 6/21 Lower
Fall 8/22–8/23, 9/13–9/15, 9/24–9/25, 10/19–10/20
Spring/Summer 5/20–6/30, 6/28–7/1 2006
Upper Fall 8/28–8/30, 9/11–9/12, 9/26–9/29,
10/18–10/22
Lower Winter 12/3–12/4 [2006] 2/2–2/3, 2/23–3/10 [2007] 2006/2007
Upper Winter (none) Spring/Summer 5/1–5/16, 5/17–5/25, 5/29–6/8 Lower
Fall 9/12–9/13, 10/24–10/25 Spring/Summer 5/12–5/17, 6/4–6/9, 6/18–6/29
2007 Upper
Fall 9/14–9/17, 10/8–10/11 Lower Winter 1/31–2/5, 2/11–2/16 [2008] 2007/2008 Upper Winter (none)
7.5.1 Breeding Season 7.5.1.1 Species Composition and Relative Abundance. Overall, 12,540 detections of 129 avian species (including flyovers and detections > 50 m) were recorded in the lower and upper Merced River corridor during the 2006 and 2007 breeding season point count surveys. Species diversity ranged from 1.8 at UF2‐A1 in the Upper Foothills 1 Reach to 11.5 at CON‐A1 in the Confluence Reach (Figure 7‐39 and Figure 7‐40). Average avian species diversity, species richness, total number of individuals and relative abundance for the 70 most abundant species are presented by site and point in Appendix J, Table J‐3. While species diversity was higher in the lower river segment than the upper river segment (N1[lower] = 7.77 ± 0.26 vs. N1[upper] = 4.42 ± 0.21; p < 0.001; Figure 7‐40a and b), there were no consistent, significant trends in species diversity with elevation or river mile evident within the upper or lower Merced River corridor. Bird species diversity at sites
The Merced River Alliance Project Final Report Volume II: Biological Monitoring and Assessment
Stillwater Sciences
7‐66
located along the lower Merced River ranged from 5.6 to 11.5 (Figure 7‐39 and Figure 7‐40a), while sites along the upper Merced River displayed species diversity ≤ 7 throughout the surveys (Figure 7‐39 and Figure 7‐40b). Sites in the Confluence and Encroached reaches of the lower river (RM 0 to 8.1 and 8.1 to 26.6, respectively) exhibited particularly high species diversity (> 9). The majority of bird detections during the 2006 and 2007 breeding season point counts were songbirds. The most common species detected was Tree Swallow, followed by European Starling, an introduced species common throughout California, and Bushtit, a native resident species. The native songbirds American Robin, House Wren, and Cedar Waxwing were also frequently observed during the 2006 and 2007 breeding season. Avian community composition differed between the upper and lower segments of the Merced River (Appendix J, Table J‐4). There were 99 total species detected along the lower river corridor, 43 of which were unique to the lower river corridor including Blue Grosbeak, Yellow‐billed Magpie, and Swainson’s Hawk. Other species such as Cooper’s Hawk, California Quail, and Mourning Dove were detected within the lower river corridor and in one or more of the Upper Foothills reaches sites. There were fifty‐six species (Appendix J, Table J‐4) detected in both the upper and lower river corridor. Some of these species’ distributions spanned the range of monitoring sites (e.g., American Robin, Song Sparrow, Black‐headed Grosbeak and Northern Flicker were detected from the lowest elevation, westernmost sites to the highest elevation, easternmost sites; Appendix J, Table J‐5). In the upper river corridor, 87 total species were detected, with 31 species unique to the upper river corridor monitoring sites including Stellar’s Jay, Golden‐crowned Kinglet, Brown Creeper, American Dipper, and Mountain Chickadee (Appendix J, Table J‐4). Some species (e.g., Northern Goshawk, Red‐breasted Sapsucker, Black‐backed Woodpecker, Hermit Thrush, Cassin’s Finch, and Purple Finch) were only detected at the highest elevation sites in the Upper Glaciated Batholith Reach of the upper river corridor. Others extended downstream to the Merced Falls Reach (e.g., Common Merganser and Common Raven). In some cases, the distribution of a species ended abruptly where another closely related species’ distribution began. Western Scrub‐Jay was detected throughout the lower river corridor and into the Lower Batholith Reach of the upper river corridor, the latter marking the lowest elevation extent of the Stellar’s Jay’s distribution (Appendix J, Table J‐5). American Crow, a lower river corridor species, and Common Raven, an upper river corridor species, showed a similar pattern, with the Merced Falls Reach serving as the apparent dividing line between the two species’ distributions. Tree Swallows in the lower river corridor gave way to Violet Green Swallows in the upper river corridor with little overlap. The transition between Oak Titmouse and Bushtit at lower river sites and Mountain Chickadee at upper river sites occurred with very little overlap in the Lower Batholith Reach. Some species such as Western Tanager and Warbling Vireo that breed in the upper river segment were detected during the breeding season surveys in both

The Merced River Alliance Project Final Report Volume II: Biological Monitoring and Assessment
Stillwater Sciences
7‐67
segments of the river. However, in the lower river corridor, these two species were likely late spring migrants (i.e., not breeding) still moving through the California Central Valley. Ten raptor species were detected (Figure 7‐41), including White‐tailed Kite (proposed for listing under the Federal Endangered Species Act [ESA]) and Swainson’s Hawk (listed as threatened under the California ESA). Breeding behavior was evident for Cooper’s Hawk, Red‐shouldered Hawk, Red‐tailed Hawk, and Swainson’s Hawk (Appendix J, Table J‐6). Nests were found for Cooper’s Hawk at GM1‐A2 (RM 45), and for Red‐tailed Hawk at ENC‐A3 (RM 23). Nest material carries were observed for Red‐shouldered Hawk at DTR‐A2 (RM 51) and for Swainson’s Hawk at GM1‐A1 (RM 37). The vast majority of raptor detections during the breeding season occurred in the lower river corridor (Figure 7‐41). 7.5.1.2 Effect of Riparian Vegetation Patch Size, Composition, and Structure on
Focal Species Abundance and Overall Species Diversity Overall species diversity and abundance of eight focal species in relation to local riparian patch and habitat variables were analyzed in each segment (i.e., upper vs. lower) of the Merced River(Figure 7‐42a‐h). Models were not fit for Oregon Junco and Warbling Vireo in the lower river corridor due to insufficient sample size. Best‐fitting models differed considerably when comparing river segments, even for the same species (Table 7‐22). For example, neither of the two variables identified for Ash‐throated Flycatcher in the lower river corridor (snags greater than 10 cm dbh and berry cover) were included in the best statistical model for this species in the upper river corridor, where running water, standing water, and buttonbush were important (Table 7‐22). Of the eight species analyzed, the r2 values of the resulting models exceeded 25% in at least one of the two river segments. The explanatory power of the models, as indicated by r2, varied across species from 0.07 for upper river corridor Spotted Towhee (Figure 7‐42f) to 0.61 for Oregon Junco (Figure 7‐42d) in the upper river corridor. Although the explanatory power of the Spotted Towhee models was low in the upper river corridor, it was high in the lower river corridor (r2 = 0.56) (Figure 7‐42f). For Song Sparrows, predictive models based on local vegetation features had high r2 values in both river segments (i.e., 0.42 and 0.54) (Figure 7‐42e).
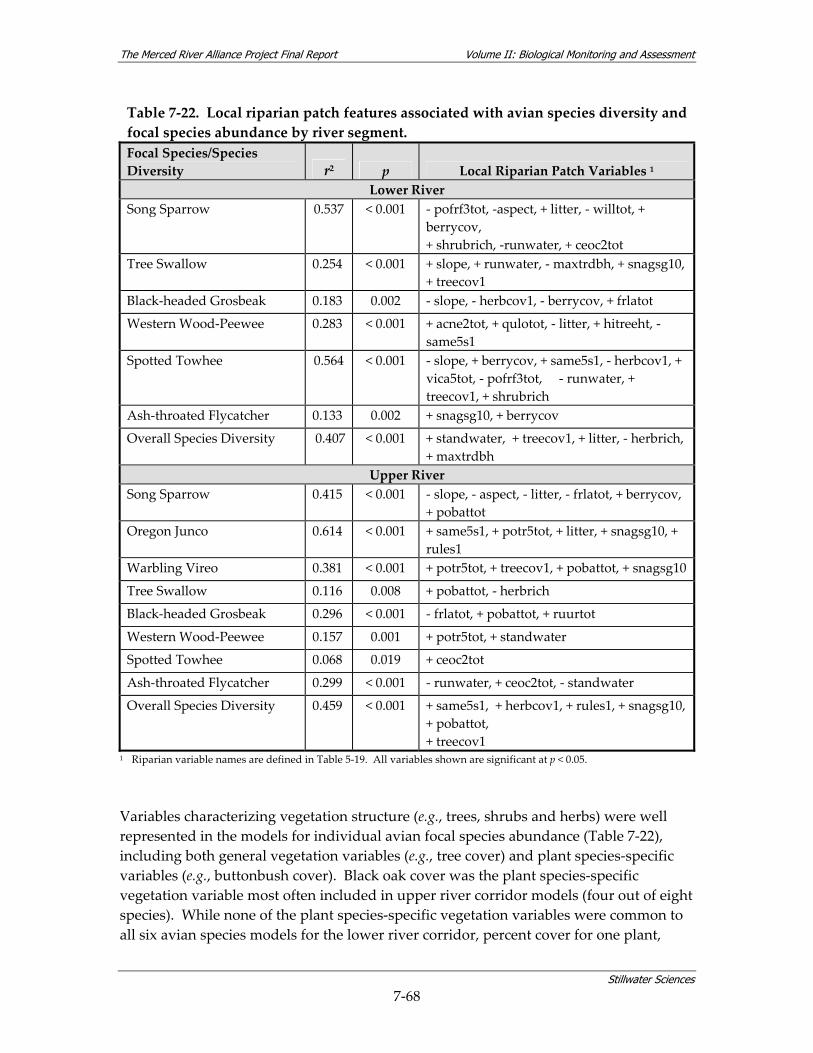
The Merced River Alliance Project Final Report Volume II: Biological Monitoring and Assessment
Stillwater Sciences
7‐68
Table 7‐22. Local riparian patch features associated with avian species diversity and focal species abundance by river segment. Focal Species/Species Diversity r2 p Local Riparian Patch Variables 1
Lower River Song Sparrow 0.537 < 0.001 ‐ pofrf3tot, ‐aspect, + litter, ‐ willtot, +
berrycov, + shrubrich, ‐runwater, + ceoc2tot
Tree Swallow 0.254 < 0.001 + slope, + runwater, ‐ maxtrdbh, + snagsg10, + treecov1
Black‐headed Grosbeak 0.183 0.002 ‐ slope, ‐ herbcov1, ‐ berrycov, + frlatot
Western Wood‐Peewee 0.283 < 0.001 + acne2tot, + qulotot, ‐ litter, + hitreeht, ‐ same5s1
Spotted Towhee 0.564 < 0.001 ‐ slope, + berrycov, + same5s1, ‐ herbcov1, + vica5tot, ‐ pofrf3tot, ‐ runwater, + treecov1, + shrubrich
Ash‐throated Flycatcher 0.133 0.002 + snagsg10, + berrycov
Overall Species Diversity 0.407 < 0.001 + standwater, + treecov1, + litter, ‐ herbrich, + maxtrdbh
Upper River Song Sparrow 0.415 < 0.001 ‐ slope, ‐ aspect, ‐ litter, ‐ frlatot, + berrycov,
+ pobattot Oregon Junco 0.614 < 0.001 + same5s1, + potr5tot, + litter, + snagsg10, +
rules1 Warbling Vireo 0.381 < 0.001 + potr5tot, + treecov1, + pobattot, + snagsg10
Tree Swallow 0.116 0.008 + pobattot, ‐ herbrich
Black‐headed Grosbeak 0.296 < 0.001 ‐ frlatot, + pobattot, + ruurtot
Western Wood‐Peewee 0.157 0.001 + potr5tot, + standwater
Spotted Towhee 0.068 0.019 + ceoc2tot
Ash‐throated Flycatcher 0.299 < 0.001 ‐ runwater, + ceoc2tot, ‐ standwater
Overall Species Diversity 0.459 < 0.001 + same5s1, + herbcov1, + rules1, + snagsg10, + pobattot, + treecov1
1 Riparian variable names are defined in Table 5‐19. All variables shown are significant at p < 0.05.
Variables characterizing vegetation structure (e.g., trees, shrubs and herbs) were well represented in the models for individual avian focal species abundance (Table 7‐22), including both general vegetation variables (e.g., tree cover) and plant species‐specific variables (e.g., buttonbush cover). Black oak cover was the plant species‐specific vegetation variable most often included in upper river corridor models (four out of eight species). While none of the plant species‐specific vegetation variables were common to all six avian species models for the lower river corridor, percent cover for one plant,
The Merced River Alliance Project Final Report Volume II: Biological Monitoring and Assessment
Stillwater Sciences
7‐69
Fremont cottonwood, was included in two of six models (negative for Song Sparrow and Spotted Towhee). Overall, avian species diversity was well predicted by local riparian patch variables, both in the lower river corridor (r2 = 0.41) and in the upper river corridor (r2 = 0.46) (Table 7‐22 and Figure 7‐42a). Except for tree cover (positive effect in both river segments), different variables were important in the avian diversity models for the upper and lower river segments.
7.5.2 Fall Migration During the 2006 and 2007 fall migration, a total of 3,831 birds and 117 species were observed along the upper and lower Merced River (Appendix J, Table J‐7). Although monitoring sites in the lower river corridor had, on average, higher bird species diversity (16.3) than sites in the upper river corridor (12.0; Figure 7‐43) the difference between the two segments was not as great as that observed during the breeding season. High numbers of Cedar Waxwings were observed, especially at site DTR‐A2 in the lower river corridor, and were mostly due to detections of large flocks. The most abundant species detected in the lower river corridor during the fall migration periods of 2006 and 2007 were the non‐native European Starling, the native Cedar Waxwing, and the native White‐crowned Sparrow. Bushtit, Stellar’s Jay, and American Robin were the most common species detected in the upper river corridor during the fall 2006–2007 surveys.
7.5.3 Winter Season During the winter seasons of 2006, 2007, and early 2008, a total of 3,344 birds and 81 species were observed along the lower Merced River (no winter surveys were conducted in the upper river corridor; Appendix J, Table J‐8). As shown in Figure 7‐44, species diversity was similar across all monitoring sites with an overall bird species diversity for the lower river corridor of 15.5. The total number of detections for each species at each monitoring site is presented in Appendix J, Table J‐8. Summed across all sites, Yellow‐rumped Warbler, European Starling (non‐native species), and Golden‐crowned Sparrow were the most abundant species during the winter surveys, with over 300 total detections each.
7.5.4 Avian Hypotheses As discussed in Section 5.2.5.2, a series of avian hypotheses were developed as a secondary goal of the Merced Alliance biological monitoring and assessment, in an effort to guide current and projected restoration activities on the Merced River. The hypotheses are addressed below.
The Merced River Alliance Project Final Report Volume II: Biological Monitoring and Assessment
Stillwater Sciences
7‐70
7.5.4.1 Avian Hypothesis 1 Avian Hypothesis 1 predicts that adjacent landscape characteristics (e.g., agriculture, industrial mining, urban development) along the upper and lower segments of the Merced River are relatively less important to songbird species occurrence than are species‐specific vegetation composition (e.g., tree species richness, understory layer) of the local riparian patch. As the effect of local riparian patch variables on avian metrics was addressed largely through the exploration of Avian Objective 2, the majority of this section focuses on the results of the landscape‐scale analysis, followed by a comparison of the two scales. The preferred spatial scale (based on preliminary analysis) for all landscape variables was 1 km, except for urban cover (5 km) and dredger tailings cover (500 m). Predictive models for avian focal species abundance based only on landscape variables explained less than 20% of the variation, with two exceptions (Table 7‐23). The model for Spotted Towhee in the lower river corridor had a high r2 (0.41) showing relationships with urban cover within 5 km (negative) and pasture cover within 1 km (positive). The model for Black‐headed Grosbeak exhibited an r2 = 0.26, indicating a positive relationship with urban density and a negative relationship with the extent of dredger tailings. In the lower river corridor, the landscape variable pasture cover was commonly included (three of six species; positive in all cases), whereas in the upper river corridor, urban density within 1 km was commonly included (five out of eight species’ models; negative in all cases). For two species in the upper river corridor there were no significant landscape variables predicting focal species abundance (Spotted Towhee and Tree Swallow). Landscape variables also predicted overall species diversity in both the lower and upper Merced River (Table 7‐23), although the explanatory power was limited. In the lower river corridor, the only significant landscape predictor was dredger tailings cover (negative effect). In the upper river corridor, the model included all agriculture cover except pasture (negative) and two measures of urban land use. There was a strong negative effect of urban density within 1 km, consistent with results obtained for individual focal species. After controlling for the effect of urban density, there was a positive effect of urban cover within 5 km, indicating that for a given level of housing units per unit area, the more spread out urban areas were associated with greater species diversity. In short, results for the upper river corridor indicated that areas possessing nearby suburban sprawl showed greater species diversity as compared with areas possessing a nearby concentration of urban units.
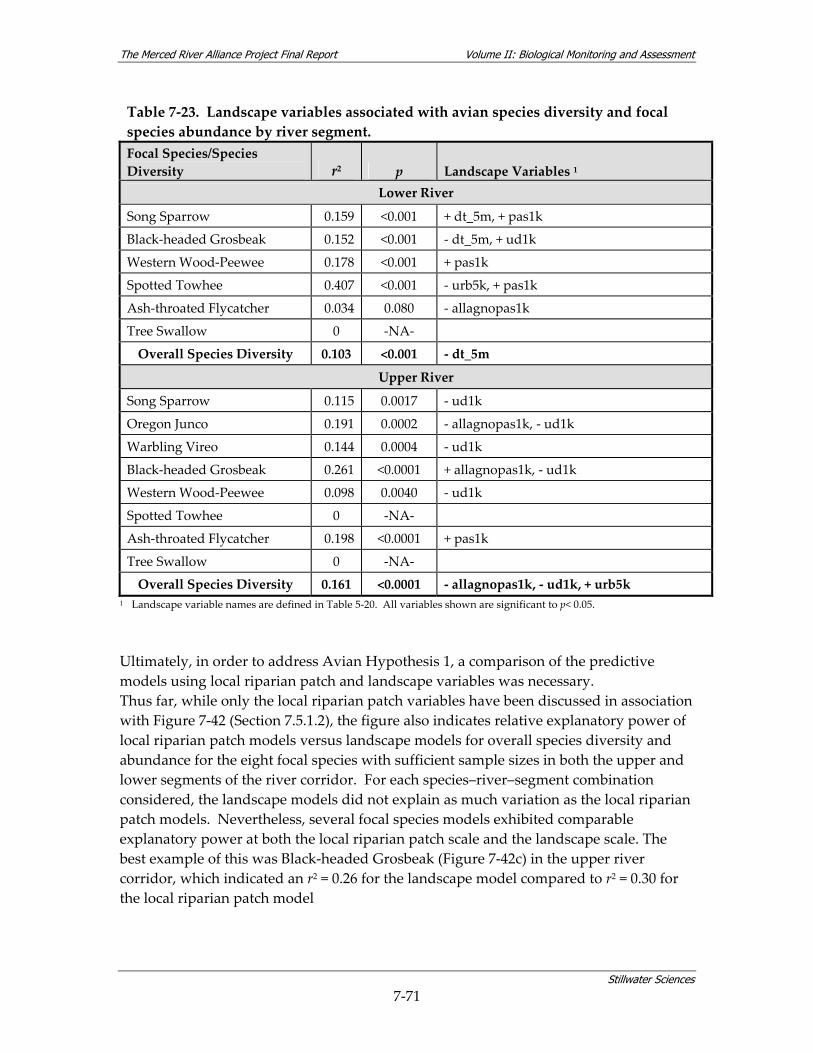
The Merced River Alliance Project Final Report Volume II: Biological Monitoring and Assessment
Stillwater Sciences
7‐71
Table 7‐23. Landscape variables associated with avian species diversity and focal species abundance by river segment. Focal Species/Species Diversity r2 p Landscape Variables 1
Lower River
Song Sparrow 0.159 <0.001 + dt_5m, + pas1k
Black‐headed Grosbeak 0.152 <0.001 ‐ dt_5m, + ud1k
Western Wood‐Peewee 0.178 <0.001 + pas1k
Spotted Towhee 0.407 <0.001 ‐ urb5k, + pas1k
Ash‐throated Flycatcher 0.034 0.080 ‐ allagnopas1k
Tree Swallow 0 ‐NA‐
Overall Species Diversity 0.103 <0.001 ‐ dt_5m
Upper River
Song Sparrow 0.115 0.0017 ‐ ud1k
Oregon Junco 0.191 0.0002 ‐ allagnopas1k, ‐ ud1k
Warbling Vireo 0.144 0.0004 ‐ ud1k
Black‐headed Grosbeak 0.261 <0.0001 + allagnopas1k, ‐ ud1k
Western Wood‐Peewee 0.098 0.0040 ‐ ud1k
Spotted Towhee 0 ‐NA‐
Ash‐throated Flycatcher 0.198 <0.0001 + pas1k
Tree Swallow 0 ‐NA‐
Overall Species Diversity 0.161 <0.0001 ‐ allagnopas1k, ‐ ud1k, + urb5k 1 Landscape variable names are defined in Table 5‐20. All variables shown are significant to p< 0.05.
Ultimately, in order to address Avian Hypothesis 1, a comparison of the predictive models using local riparian patch and landscape variables was necessary. Thus far, while only the local riparian patch variables have been discussed in association with Figure 7‐42 (Section 7.5.1.2), the figure also indicates relative explanatory power of local riparian patch models versus landscape models for overall species diversity and abundance for the eight focal species with sufficient sample sizes in both the upper and lower segments of the river corridor. For each species–river–segment combination considered, the landscape models did not explain as much variation as the local riparian patch models. Nevertheless, several focal species models exhibited comparable explanatory power at both the local riparian patch scale and the landscape scale. The best example of this was Black‐headed Grosbeak (Figure 7‐42c) in the upper river corridor, which indicated an r2 = 0.26 for the landscape model compared to r2 = 0.30 for the local riparian patch model
The Merced River Alliance Project Final Report Volume II: Biological Monitoring and Assessment
Stillwater Sciences
7‐72
7.5.4.2 Avian Hypothesis 2 Avian Hypothesis 2 states that in both the upper and lower river, diversity of obligate riparian species will be positively related to riparian zone width and the percentage of riparian vegetation cover in the landscape (versus upland or other vegetation types) within a site. The influence of metrics describing the amount and width of riparian habitat on avian species diversity and focal species abundance was explored by calculating riparian zone width at each point count station and riparian cover at the 50 m (relevé) scale, based on individual riparian‐associated plant species. The average riparian width for each monitoring site is shown in Figure 7‐45. Riparian cover was also calculated based on riparian habitat sub‐types from the GIS data layers, determined either at the 100‐m (lower river corridor) or 500‐m scale (upper river corridor). Preliminary analysis indicated that these scales demonstrated the highest predictive relationships between the measure of riparian cover and diversity and/or focal species abundance. For this analysis we used six focal species (based on the eight species from the previous analysis; however, Oregon Junco and Warbling Vireo were not found in the lower corridor and hence were not included in this analysis). In the lower river corridor, four focal species showed a significant positive relationship between abundance and riparian zone width: Song Sparrow, Western Wood‐pewee, Black‐headed Grosbeak, and Brown‐headed Cowbird (Figure 7‐46). These same four species also showed a significant relationship between abundance and riparian cover for at least one of the two scales (50‐m or 100‐m radius). For two of the species, the effect of riparian width was stronger than the effect of riparian cover within 100 m; and for two of the species, the reverse was observed. For Warbling Vireo, there was no significant relationship between riparian metrics and abundance in the lower river corridor due to limited sample sizes. For American Robin, results were inconsistent: a weak positive relationship with riparian cover within 100 m was observed but a significant negative relationship with riparian zone width. In the upper river corridor, we examined the same six focal species. For Western Wood‐pewee and Warbling Vireo, there were no significant relationships observed between abundance and any of the three riparian metrics (Figure 7‐46). For three species, there was a significant relationship between abundance and either riparian zone width (Song Sparrow) or riparian cover within 500 m (Brown‐headed Cowbird, American Robin) (Figure 7‐46a,d,f). For Black‐headed Grosbeak there was a suggestive positive but not statistically significant relationship between species abundance and riparian cover within 500 m (Figure 7‐46c). In the lower river corridor, mean species diversity increased strongly with increasing riparian zone width (Figure 7‐47) and with riparian vegetation cover (Figure 7‐48). The effect of riparian zone width is well demonstrated in Figure 7‐47: comparing point
The Merced River Alliance Project Final Report Volume II: Biological Monitoring and Assessment
Stillwater Sciences
7‐73
counts with zero width to the widest category of riparian zone (above 150 m) demonstrates a two‐fold increase in species diversity. In the highest riparian cover categories (above 50%), species diversity was, on average, about 80% greater than in the lowest riparian cover categories (below 10%). When both variables were included in a regression model, the effect of each was significant, although the effect of riparian zone width was greater (beta = + 0.361, p= 0.003) than riparian cover (beta = + 0.242, p= 0.043). The effect of log riparian width was considerably stronger than that of untransformed riparian width. This indicates a non‐linear response: with every 1 m incremental increase in riparian zone width, there is less relative gain in avian species diversity. In the upper river corridor, only the relationship between riparian vegetation cover within 500 m and avian species diversity was significant (p < 0.001). There was no significant relationship between riparian zone width and species diversity. As shown in Figure 7‐49, mean species diversity was about 65% greater for the riparian locations possessing the greatest riparian vegetation cover, as compared with locations having the least amount of cover. In summary, study results indicate that Avian Hypothesis 2 was partially supported. In the lower river corridor, mean avian species diversity was positively related to riparian zone width and riparian vegetation cover, as stated in Avian Hypothesis 2. Four of 14 focal species also showed a significant positive relationship between abundance and riparian zone width in the lower Merced River corridor: Song Sparrow, Western Wood‐pewee, Black‐headed Grosbeak, and Brown‐headed Cowbird. However, in the upper river corridor, while mean avian species diversity and riparian vegetation cover within 500 m were positively correlated, there was no significant relationship between riparian zone width and species diversity as originally hypothesized. 7.5.4.3 Avian Hypothesis 3 Avian Hypothesis 3 states that, in the lower segment of the Merced River corridor, overall bird species diversity and relative abundance for a suite of focal species will be greater in habitats possessing a well‐developed shrub layer (e.g., blackberry, mugwort and other vegetation between 0.5 and 5 m [1.6 and 16 ft] from the ground) than in those having a simple overstory canopy structure (e.g., cottonwood, valley oak) without an understory layer. For the lower Merced River, the relationship between shrub cover, a key component of understory vegetation, and overall species diversity and abundance of ten focal species was analyzed while controlling for tree cover. Results indicated that for six of the ten lower river bird species examined, the direction of the shrub cover effect was positive (Table 7‐24). However, in only two of those six cases was the effect significantly positive (Song Sparrow and Spotted Towhee); for two cases, the effect was marginally significant (p > 0.05, p < 0.10; Ash‐throated Flycatcher and Oak Titmouse); and in the remaining two

The Merced River Alliance Project Final Report Volume II: Biological Monitoring and Assessment
Stillwater Sciences
7‐74
cases the effect was not significant, (p > 0.1). For the other four focal species included in the analysis, the direction of the shrub cover effect was negative but not significant, with the exception of European Starling (p < 0.05). There was only a weak effect of shrub cover on overall species diversity. The results suggest that, in contrast to species‐specific shrub vegetation, which was often significant with respect to bird species abundance, a general metric of understory vegetation was not important to riparian‐associated bird species.
Table 7‐24. Effect of shrub cover on avian focal species abundance and overall species diversity in the lower Merced River.
Focal Species Shrub cover 1 Beta 1
Shrub p value 1
Tree Cover 2
Tree p value 2
Ash‐throated Flycatcher + + 0.208 0.055 + 0.003 Black‐headed Grosbeak ‐ ‐ 0.005 NS + 0.001 Brown‐headed Cowbird + + 0.025 NS ‐ NS European Starling ‐ ‐ 0.230 0.025 + < 0.001 Nuttall’s Woodpecker ‐ ‐ 0.173 0.068 + < 0.001 Oak Titmouse + + 0.171 0.093 ‐ 0.057 Song Sparrow + + 0.349 0.001 + NS Spotted Towhee + + 0.306 0.001 ‐ NS Tree Swallow + + 0.162 NS + NS Western Kingbird ‐ ‐ 0.166 NS + NS Species Diversity ‐ ‐ 0.057 NS ‐ NS
1 Results shown are after controlling for the effect of tree cover and include the standardized regression coefficient (beta) for shrub cover.
2 Results shown are after controlling for shrub cover.
7.5.4.4 Avian Hypothesis 4 Avian Hypothesis 4 predicts that, in the upper segment of the Merced River, bird species diversity and relative abundance will be greater in riparian habitats located within a matrix of Montane Chaparral habitats that have recently experienced fire (within 1–2 years). This hypothesis could not be addressed during the Merced Alliance study period. There were insufficient data from our point count surveys to address this question analytically or even qualitatively. The two sites located near recent fires were UF2‐A1, located over 1 mi from the 2001 Briceburg Fire, and LB‐A1, located within a mile of the 2003 Woodlot Fire. Species diversity at both sites fell within the expected range (Appendix J, J‐3) given the amount and quality of riparian habitat at each site.
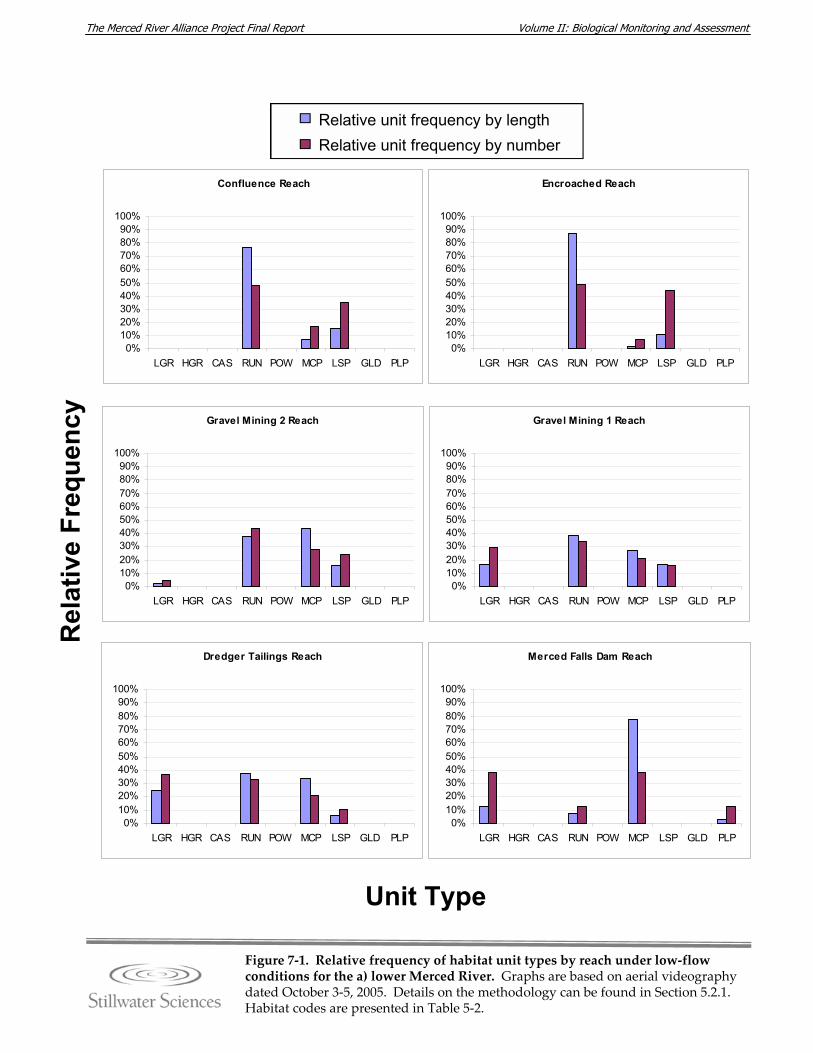
Volume II: Biological Monitoring and Assessment The Merced River Alliance Project Final Report
Figure 7‐1. Relative frequency of habitat unit types by reach under low‐flow conditions for the a) lower Merced River. Graphs are based on aerial videography dated October 3‐5, 2005. Details on the methodology can be found in Section 5.2.1. Habitat codes are presented in Table 5‐2.
Confluence Reach
0%10%20%30%40%50%60%70%80%90%
100%
LGR HGR CAS RUN POW MCP LSP GLD PLP
Encroached Reach
0%10%20%30%40%50%60%70%80%90%
100%
LGR HGR CAS RUN POW MCP LSP GLD PLP
Gravel Mining 2 Reach
0%10%20%30%40%50%60%70%80%90%
100%
LGR HGR CAS RUN POW MCP LSP GLD PLP
Gravel Mining 1 Reach
0%10%20%30%40%50%60%70%80%90%
100%
LGR HGR CAS RUN POW MCP LSP GLD PLP
Dredger Tailings Reach
0%10%20%30%40%50%60%70%80%90%
100%
LGR HGR CAS RUN POW MCP LSP GLD PLP
Merced Falls Dam Reach
0%10%20%30%40%50%60%70%80%90%
100%
LGR HGR CAS RUN POW MCP LSP GLD PLP
Relative unit frequency by lengthRelative unit frequency by number
Rel
ativ
e Fr
eque
ncy
Unit Type
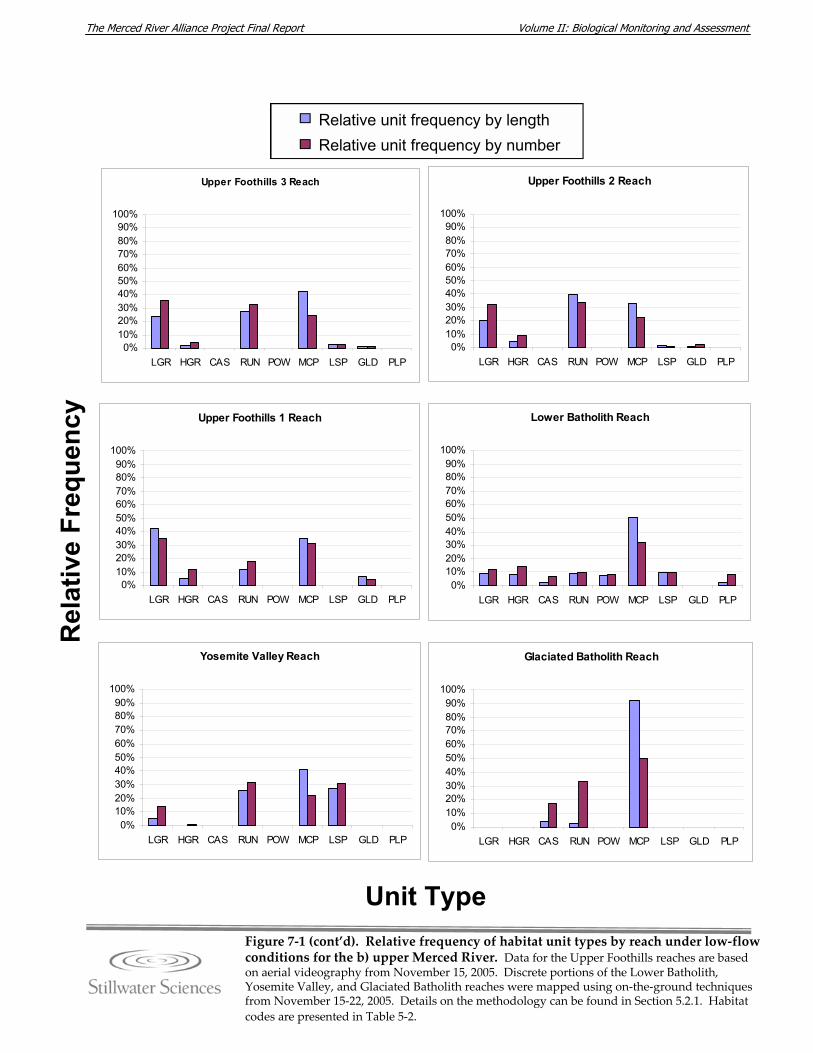
Volume II: Biological Monitoring and Assessment The Merced River Alliance Project Final Report
Figure 7‐1 (cont’d). Relative frequency of habitat unit types by reach under low‐flow conditions for the b) upper Merced River. Data for the Upper Foothills reaches are based on aerial videography from November 15, 2005. Discrete portions of the Lower Batholith, Yosemite Valley, and Glaciated Batholith reaches were mapped using on‐the‐ground techniques from November 15‐22, 2005. Details on the methodology can be found in Section 5.2.1. Habitat codes are presented in Table 5‐2.
Rel
ativ
e Fr
eque
ncy
Unit Type
Upper Foothills 3 Reach
0%10%20%30%40%50%60%70%80%90%
100%
LGR HGR CAS RUN POW MCP LSP GLD PLP
Upper Foothills 2 Reach
0%10%20%30%40%50%60%70%80%90%
100%
LGR HGR CAS RUN POW MCP LSP GLD PLP
Upper Foothills 1 Reach
0%10%20%30%40%50%60%70%80%90%
100%
LGR HGR CAS RUN POW MCP LSP GLD PLP
Lower Batholith Reach
0%10%20%30%40%50%60%70%80%90%
100%
LGR HGR CAS RUN POW MCP LSP GLD PLP
Yosemite Valley Reach
0%10%20%30%40%50%60%70%80%90%
100%
LGR HGR CAS RUN POW MCP LSP GLD PLP
Glaciated Batholith Reach
0%10%20%30%40%50%60%70%80%90%
100%
LGR HGR CAS RUN POW MCP LSP GLD PLP
Relative unit frequency by lengthRelative unit frequency by number
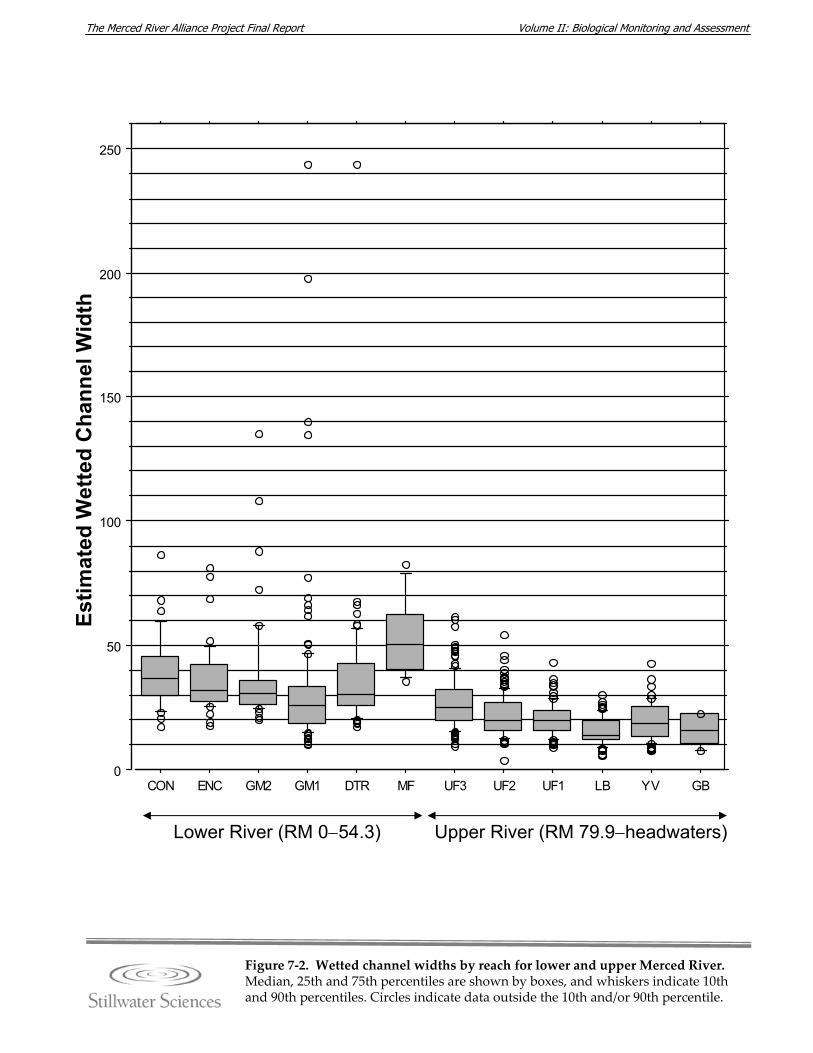
Volume II: Biological Monitoring and Assessment The Merced River Alliance Project Final Report
Figure 7‐2. Wetted channel widths by reach for lower and upper Merced River. Median, 25th and 75th percentiles are shown by boxes, and whiskers indicate 10th and 90th percentiles. Circles indicate data outside the 10th and/or 90th percentile.
Lower River (RM 0−54.3) Upper River (RM 79.9−headwaters)
Estim
ated
Wet
ted
Cha
nnel
Wid
th
0
50
100
150
200
250
CON ENC GM2 GM1 DTR MF UF3 UF2 UF1 LB YV GB
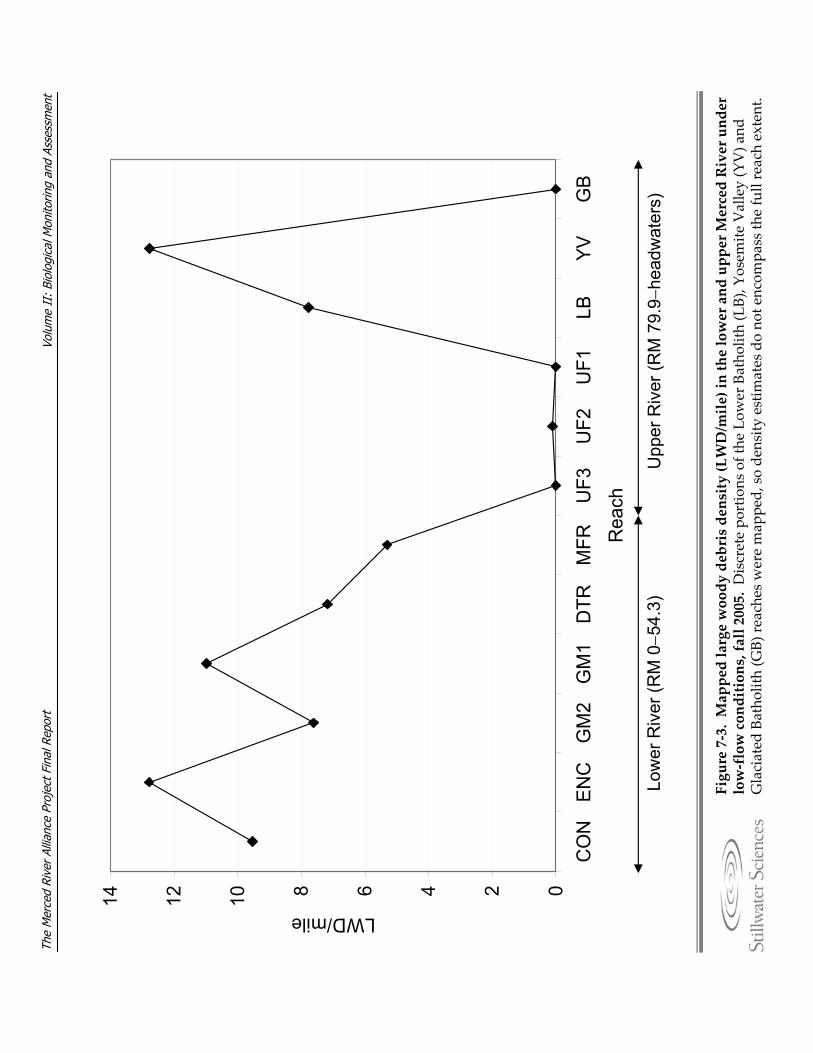
Volu
me
II:
Biol
ogic
al M
onito
ring
and
Asse
ssm
ent
The
Mer
ced
Rive
r Al
lianc
e Pr
ojec
t Fin
al R
epor
t
02468101214
CO
NEN
CG
M2
GM
1D
TRM
FRU
F3U
F2U
F1LB
YVG
BR
each
LWD/mile
Figure 7‐3.Mapped large woody debris density (LWD/mile) in the lower and upper Merced River under
low‐flow conditions, fall 2005. D
iscrete po
rtions of the Low
er Batho
lith (LB), Y
osem
ite Valley (YV) a
nd
Glaciated Batho
lith (G
B) re
aches were map
ped, so de
nsity estim
ates do no
t encom
pass th
e full reach extent.
Low
er R
iver
(RM
0−5
4.3)
Upp
er R
iver
(RM
79.
9−he
adw
ater
s)
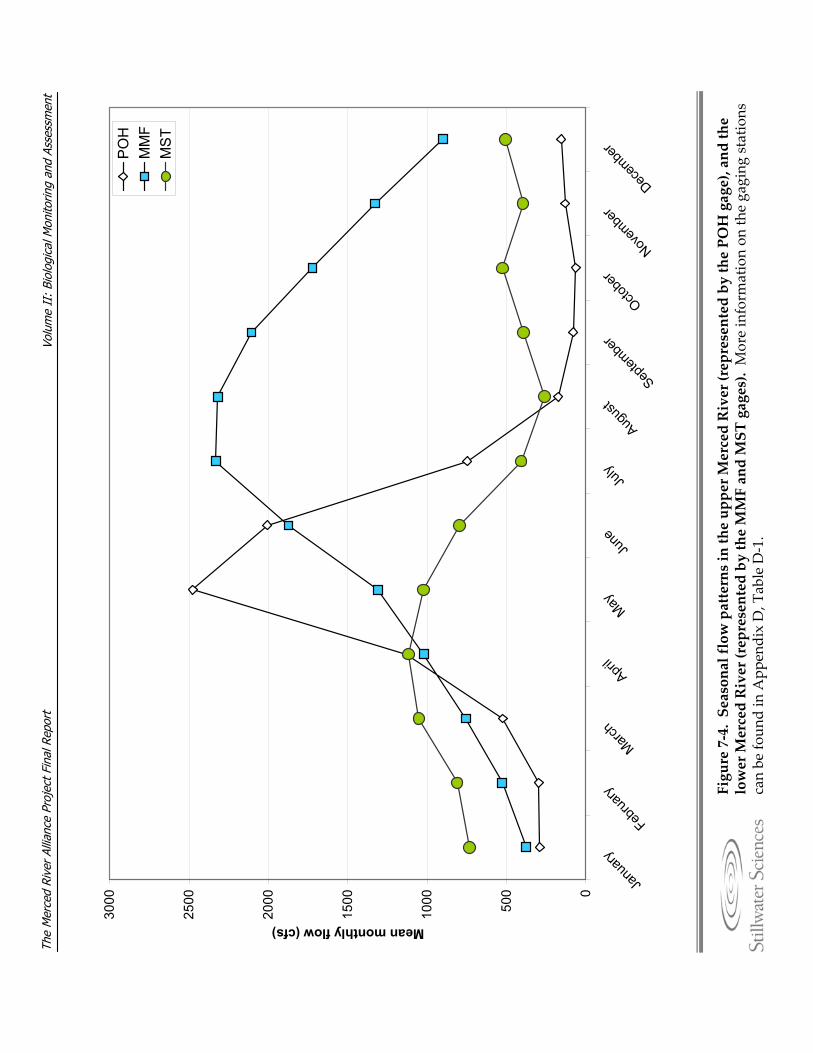
Volu
me
II:
Biol
ogic
al M
onito
ring
and
Asse
ssm
ent
The
Mer
ced
Rive
r Al
lianc
e Pr
ojec
t Fin
al R
epor
t
Figure 7‐4. Seasonal flow patterns in the upper M
erced River (represented by the POH gage), and the
lower Merced River (represented by the MMF and MST gages). M
ore inform
ation on th
e gaging
stations
can be fo
und in App
endix D, T
able D‐1.
0
500
1000
1500
2000
2500
3000
Janu
ary
Februa
ry
March
April
May
June
July
Augus
tSep
tembe
r
Octobe
r
Novem
ber
Decem
ber
Mean monthly flow (cfs)P
OH
MM
FM
ST
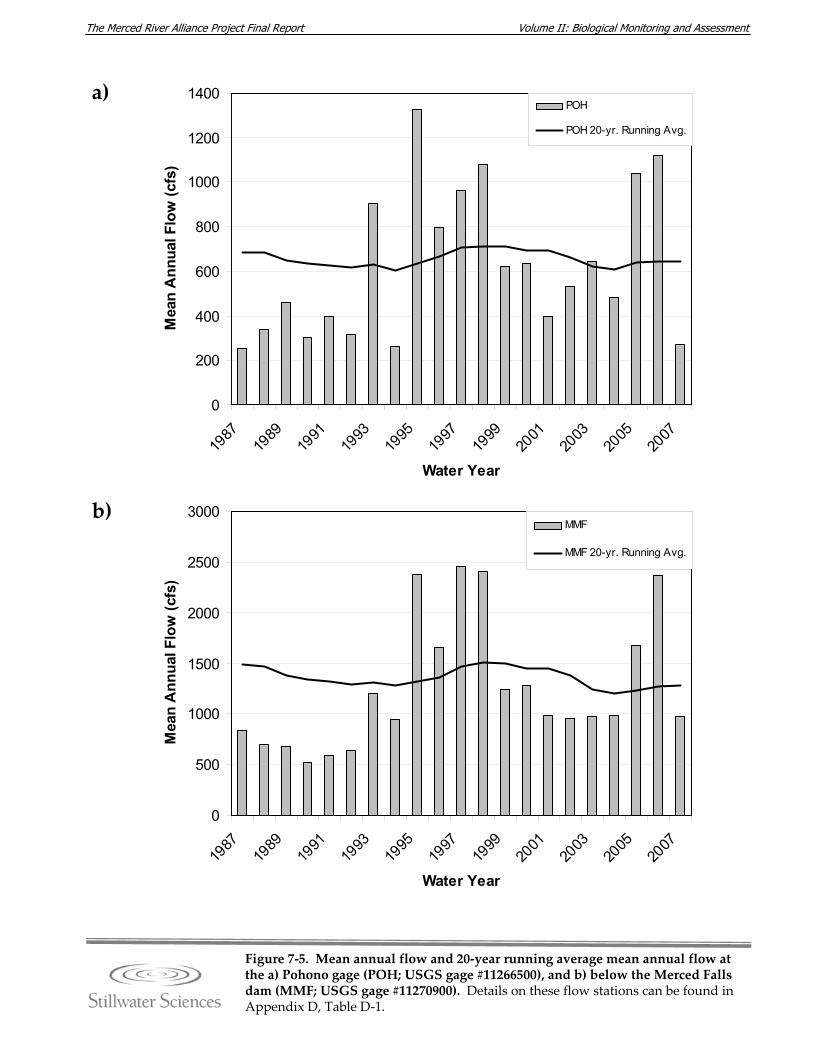
Volume II: Biological Monitoring and Assessment The Merced River Alliance Project Final Report
Figure 7‐5. Mean annual flow and 20‐year running average mean annual flow at the a) Pohono gage (POH; USGS gage #11266500), and b) below the Merced Falls dam (MMF; USGS gage #11270900). Details on these flow stations can be found in Appendix D, Table D‐1.
a)
b)
0
500
1000
1500
2000
2500
3000
1987
1989
1991
1993
1995
1997
1999
2001
2003
2005
2007
Water Year
Mea
n A
nnua
l Flo
w (c
fs)
MMF
MMF 20-yr. Running Avg.
0
200
400
600
800
1000
1200
1400
1987
1989
1991
1993
1995
1997
1999
2001
2003
2005
2007
Water Year
Mea
n A
nnua
l Flo
w (c
fs)
POH
POH 20-yr. Running Avg.
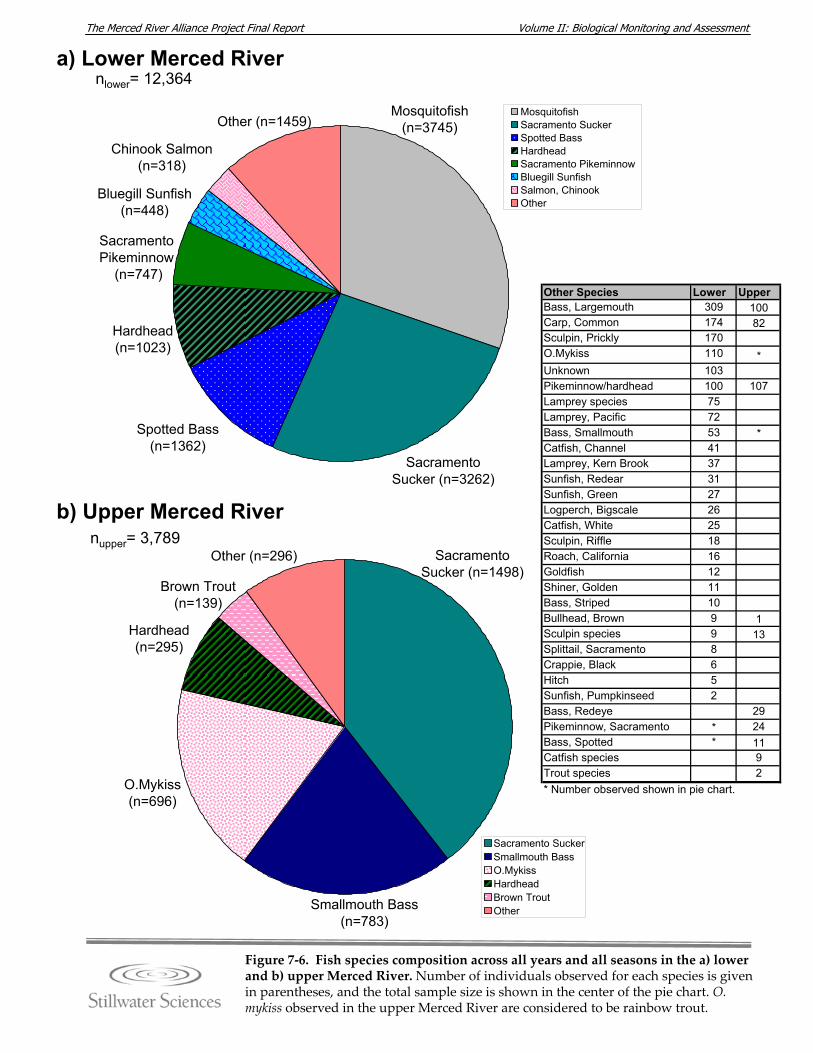
Volume II: Biological Monitoring and Assessment The Merced River Alliance Project Final Report
Sacramento Sucker (n=1498)
O.Mykiss (n=696)
Hardhead (n=295)
Brown Trout (n=139)
Other (n=296)
Smallmouth Bass (n=783)
Sacramento SuckerSmallmouth BassO.MykissHardheadBrown TroutOther
Mosquitofish (n=3745)
Sacramento Sucker (n=3262)
Spotted Bass (n=1362)
Hardhead (n=1023)
Bluegill Sunfish (n=448)
Chinook Salmon (n=318)
Other (n=1459)
Sacramento Pikeminnow
(n=747)
MosquitofishSacramento SuckerSpotted BassHardheadSacramento PikeminnowBluegill SunfishSalmon, ChinookOther
Figure 7‐6. Fish species composition across all years and all seasons in the a) lower and b) upper Merced River. Number of individuals observed for each species is given in parentheses, and the total sample size is shown in the center of the pie chart. O. mykiss observed in the upper Merced River are considered to be rainbow trout.
nupper= 3,789
nlower= 12,364a) Lower Merced River
b) Upper Merced River
Other Species Lower UpperBass, Largemouth 309 100Carp, Common 174 82Sculpin, Prickly 170O.Mykiss 110 *Unknown 103Pikeminnow/hardhead 100 107Lamprey species 75Lamprey, Pacific 72Bass, Smallmouth 53 *Catfish, Channel 41Lamprey, Kern Brook 37Sunfish, Redear 31Sunfish, Green 27Logperch, Bigscale 26Catfish, White 25Sculpin, Riffle 18Roach, California 16Goldfish 12Shiner, Golden 11Bass, Striped 10Bullhead, Brown 9 1Sculpin species 9 13Splittail, Sacramento 8Crappie, Black 6Hitch 5Sunfish, Pumpkinseed 2Bass, Redeye 29Pikeminnow, Sacramento * 24Bass, Spotted * 11Catfish species 9Trout species 2* Number observed shown in pie chart.
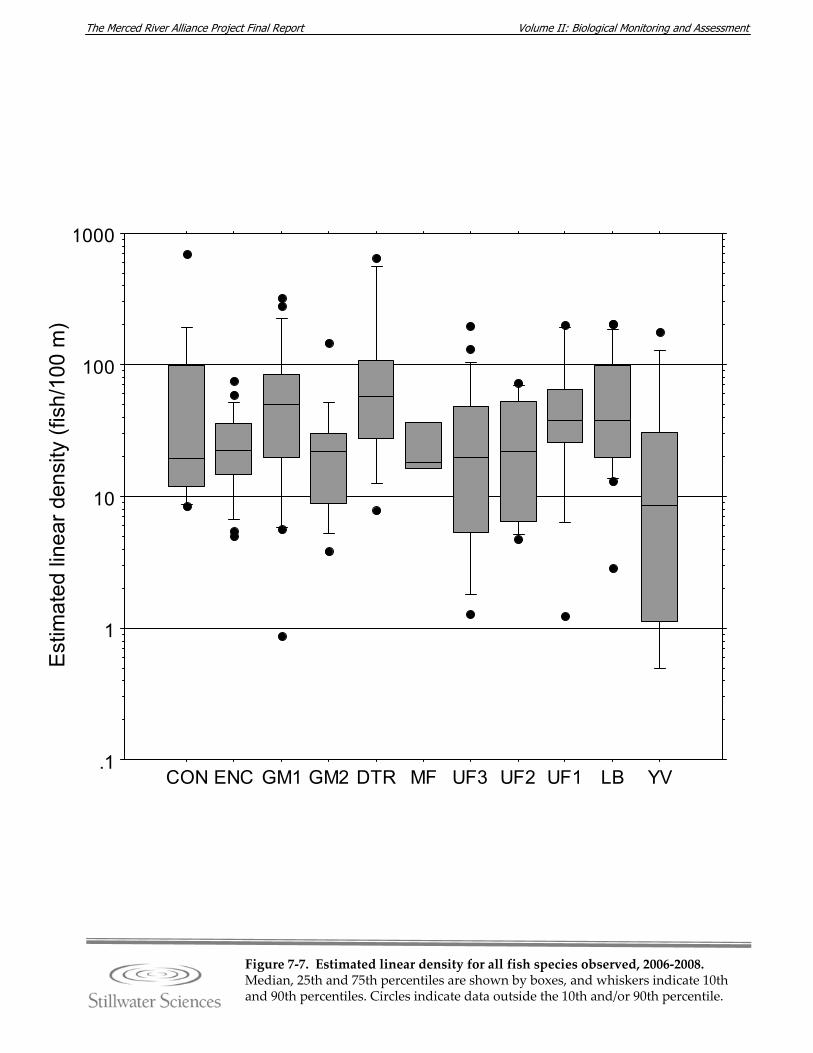
Volume II: Biological Monitoring and Assessment The Merced River Alliance Project Final Report
Figure 7‐7. Estimated linear density for all fish species observed, 2006‐2008. Median, 25th and 75th percentiles are shown by boxes, and whiskers indicate 10th and 90th percentiles. Circles indicate data outside the 10th and/or 90th percentile.
.1
1
10
100
1000
CON ENC GM1 GM2 DTR MF UF3 UF2 UF1 LB YV
Est
imat
ed li
near
den
sity
(fis
h/10
0 m
)
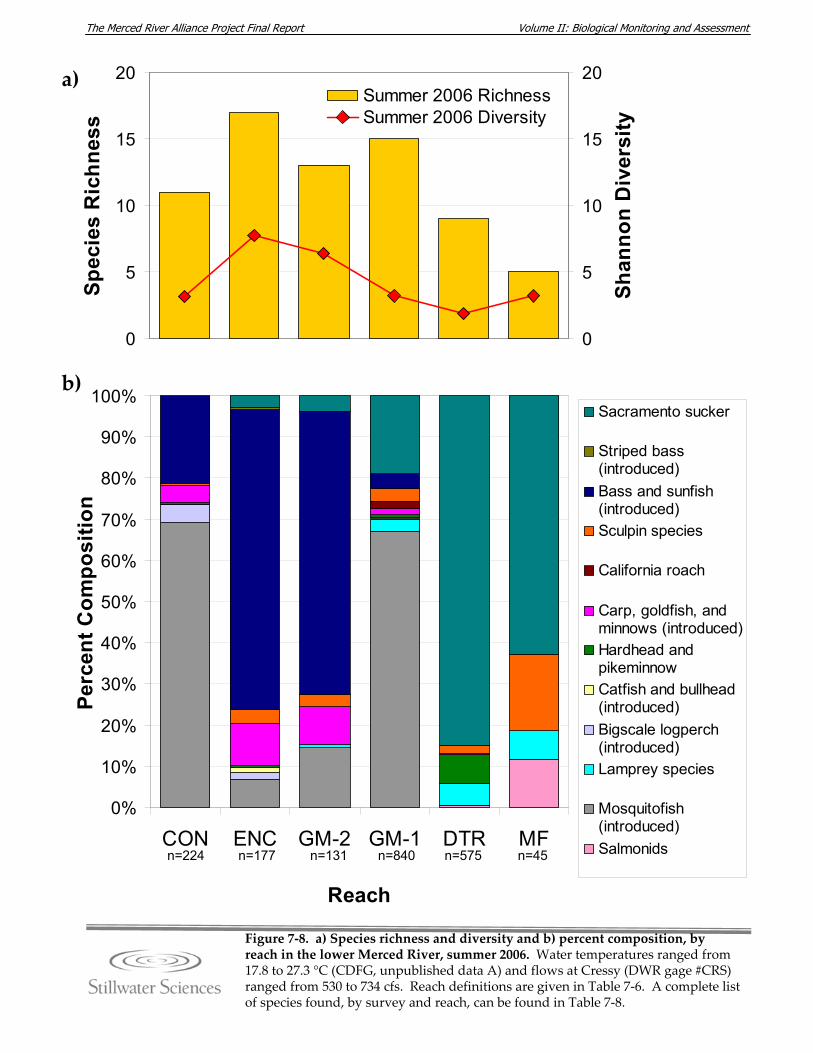
Volume II: Biological Monitoring and Assessment The Merced River Alliance Project Final Report
0
5
10
15
20Sp
ecie
s R
ichn
ess
0
5
10
15
20
Shan
non
Div
ersi
ty Summer 2006 Richness
Summer 2006 Diversity
0%
10%
20%
30%
40%
50%
60%
70%
80%
90%
100%
CON ENC GM-2 GM-1 DTR MF
Reach
Perc
ent C
ompo
sitio
n
Sacramento sucker
Striped bass(introduced)Bass and sunfish(introduced)Sculpin species
California roach
Carp, goldfish, andminnows (introduced)Hardhead andpikeminnowCatfish and bullhead(introduced)Bigscale logperch(introduced)Lamprey species
Mosquitofish(introduced)Salmonidsn=224 n=177 n=131 n=840 n=45n=575
a)
b)
Figure 7‐8. a) Species richness and diversity and b) percent composition, by reach in the lower Merced River, summer 2006. Water temperatures ranged from 17.8 to 27.3 °C (CDFG, unpublished data A) and flows at Cressy (DWR gage #CRS) ranged from 530 to 734 cfs. Reach definitions are given in Table 7‐6. A complete list of species found, by survey and reach, can be found in Table 7‐8.
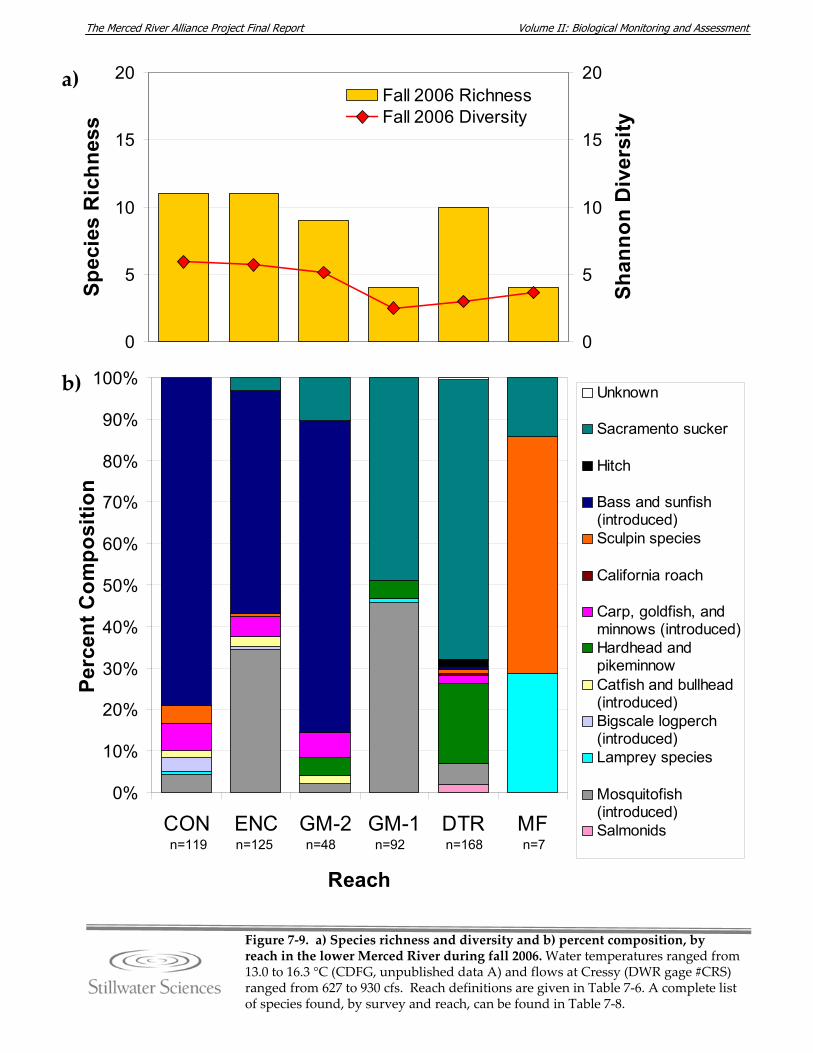
Volume II: Biological Monitoring and Assessment The Merced River Alliance Project Final Report
0
5
10
15
20Sp
ecie
s R
ichn
ess
0
5
10
15
20
Shan
non
Div
ersi
ty
Fall 2006 RichnessFall 2006 Diversity
0%
10%
20%
30%
40%
50%
60%
70%
80%
90%
100%
CON ENC GM-2 GM-1 DTR MF
Reach
Perc
ent C
ompo
sitio
n
Unknown
Sacramento sucker
Hitch
Bass and sunfish(introduced)Sculpin species
California roach
Carp, goldfish, andminnows (introduced)Hardhead andpikeminnowCatfish and bullhead(introduced)Bigscale logperch(introduced)Lamprey species
Mosquitofish(introduced)Salmonids
n=119 n=125 n=48 n=92 n=7n=168
a)
b)
Figure 7‐9. a) Species richness and diversity and b) percent composition, by reach in the lower Merced River during fall 2006. Water temperatures ranged from 13.0 to 16.3 °C (CDFG, unpublished data A) and flows at Cressy (DWR gage #CRS) ranged from 627 to 930 cfs. Reach definitions are given in Table 7‐6. A complete list of species found, by survey and reach, can be found in Table 7‐8.
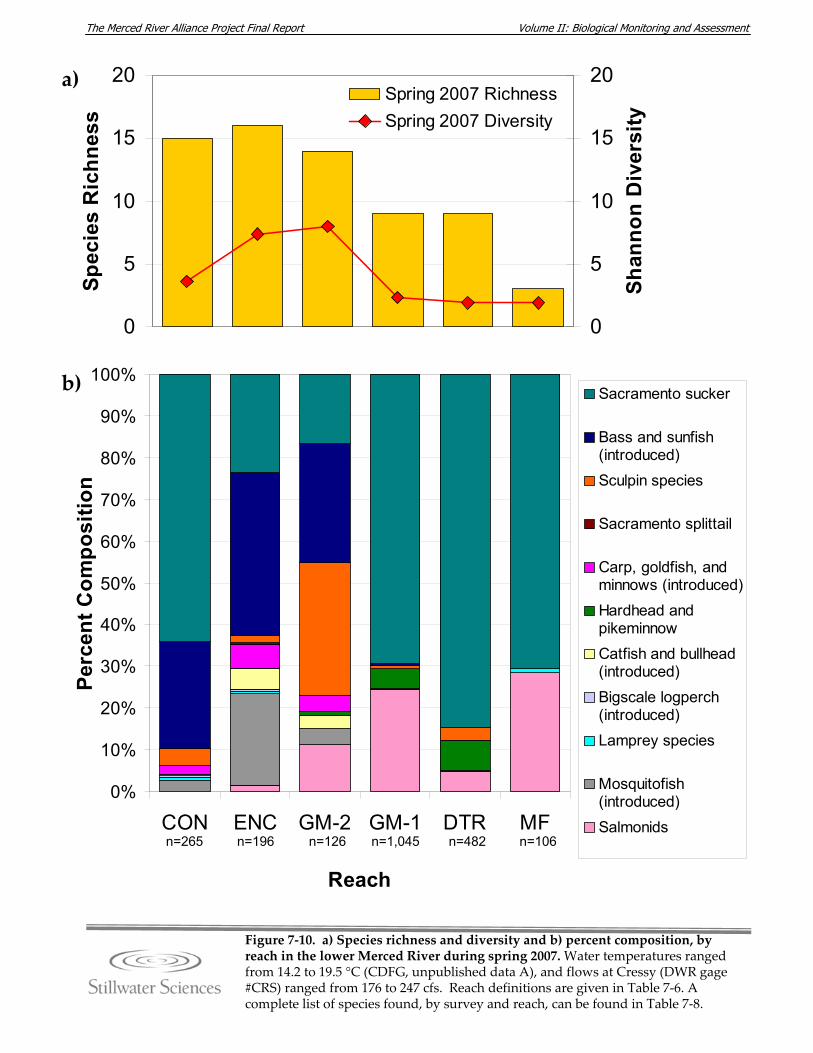
Volume II: Biological Monitoring and Assessment The Merced River Alliance Project Final Report
0
5
10
15
20Sp
ecie
s R
ichn
ess
0
5
10
15
20
Shan
non
Div
ersi
ty
Spring 2007 RichnessSpring 2007 Diversity
0%
10%
20%
30%
40%
50%
60%
70%
80%
90%
100%
CON ENC GM-2 GM-1 DTR MF
Reach
Perc
ent C
ompo
sitio
n
Sacramento sucker
Bass and sunfish(introduced)Sculpin species
Sacramento splittail
Carp, goldfish, andminnows (introduced)Hardhead andpikeminnowCatfish and bullhead(introduced)Bigscale logperch(introduced)Lamprey species
Mosquitofish(introduced)Salmonids
n=265 n=196 n=126 n=1,045 n=106n=482
a)
b)
Figure 7‐10. a) Species richness and diversity and b) percent composition, by reach in the lower Merced River during spring 2007. Water temperatures ranged from 14.2 to 19.5 °C (CDFG, unpublished data A), and flows at Cressy (DWR gage #CRS) ranged from 176 to 247 cfs. Reach definitions are given in Table 7‐6. A complete list of species found, by survey and reach, can be found in Table 7‐8.
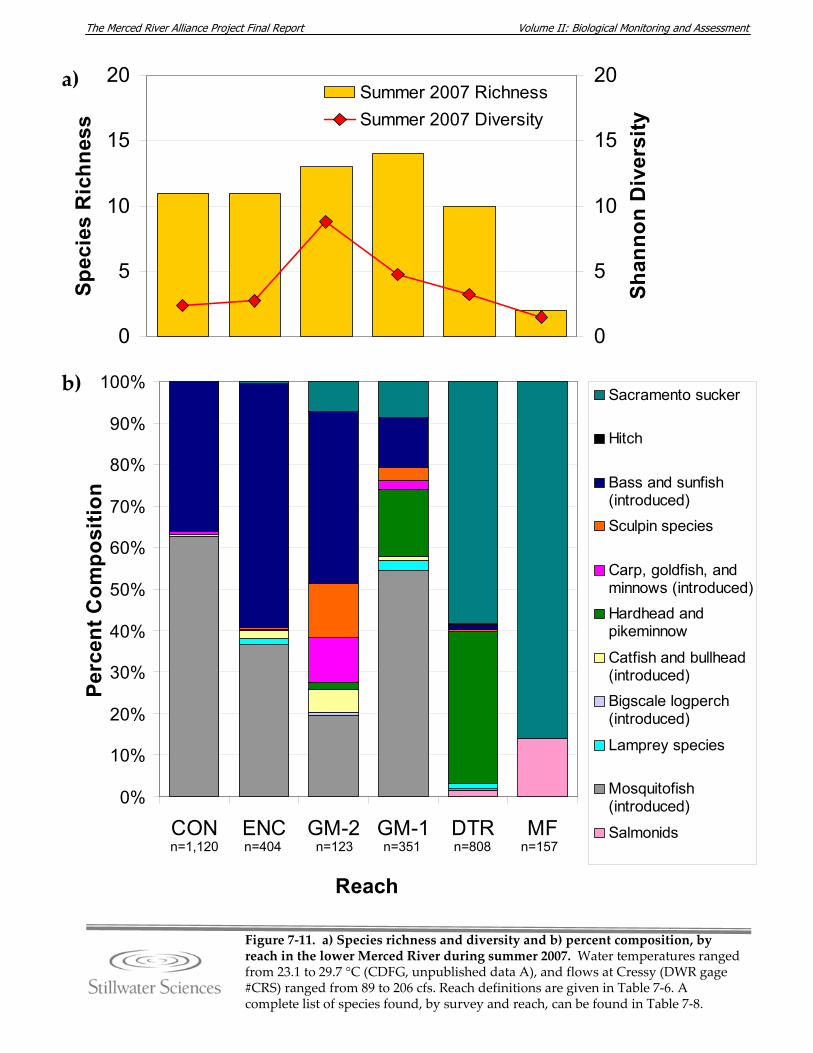
Volume II: Biological Monitoring and Assessment The Merced River Alliance Project Final Report
0
5
10
15
20Sp
ecie
s R
ichn
ess
0
5
10
15
20
Shan
non
Div
ersi
ty
Summer 2007 RichnessSummer 2007 Diversity
0%
10%
20%
30%
40%
50%
60%
70%
80%
90%
100%
CON ENC GM-2 GM-1 DTR MF
Reach
Perc
ent C
ompo
sitio
n
Sacramento sucker
Hitch
Bass and sunfish(introduced)Sculpin species
Carp, goldfish, andminnows (introduced)Hardhead andpikeminnow
Catfish and bullhead(introduced)Bigscale logperch(introduced)
Lamprey species
Mosquitofish(introduced)
Salmonidsn=1,120 n=404 n=123 n=351 n=157n=808
a)
b)
Figure 7‐11. a) Species richness and diversity and b) percent composition, by reach in the lower Merced River during summer 2007. Water temperatures ranged from 23.1 to 29.7 °C (CDFG, unpublished data A), and flows at Cressy (DWR gage #CRS) ranged from 89 to 206 cfs. Reach definitions are given in Table 7‐6. A complete list of species found, by survey and reach, can be found in Table 7‐8.
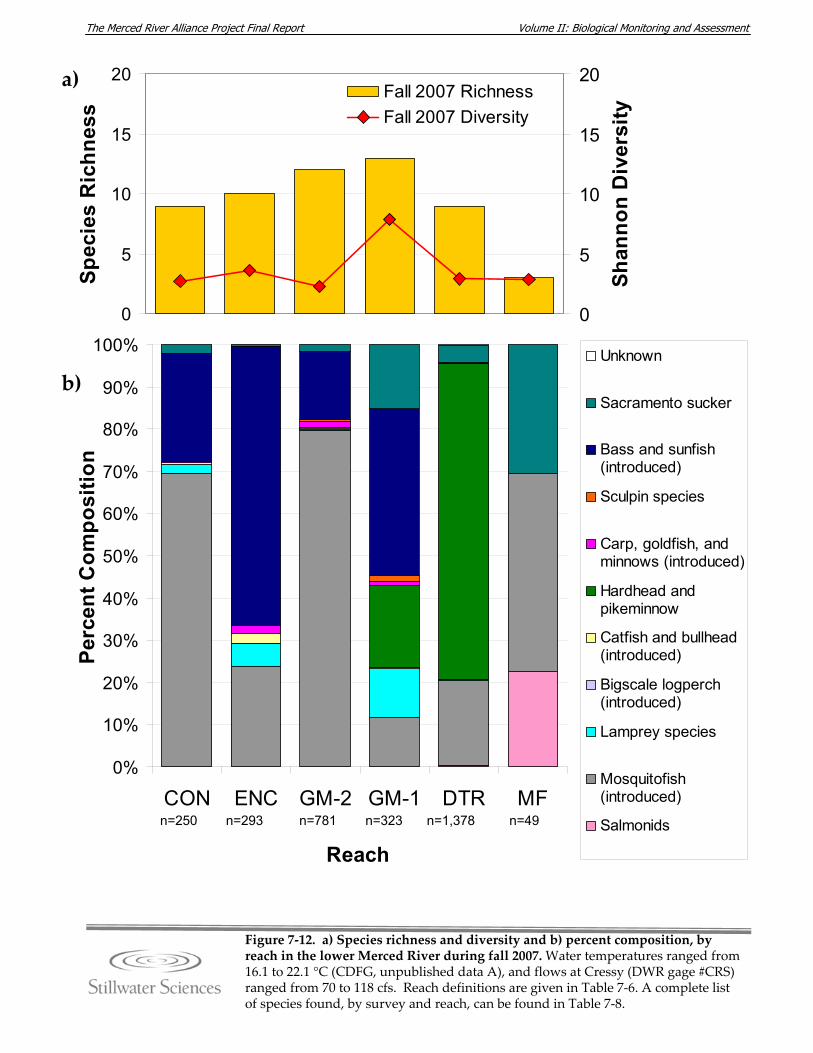
Volume II: Biological Monitoring and Assessment The Merced River Alliance Project Final Report
0
5
10
15
20Sp
ecie
s R
ichn
ess
0
5
10
15
20
Shan
non
Div
ersi
ty
Fall 2007 RichnessFall 2007 Diversity
0%
10%
20%
30%
40%
50%
60%
70%
80%
90%
100%
CON ENC GM-2 GM-1 DTR MF
Reach
Perc
ent C
ompo
sitio
n
Unknown
Sacramento sucker
Bass and sunfish(introduced)
Sculpin species
Carp, goldfish, andminnows (introduced)
Hardhead andpikeminnow
Catfish and bullhead(introduced)
Bigscale logperch(introduced)
Lamprey species
Mosquitofish(introduced)
Salmonidsn=250 n=293 n=781 n=323 n=49n=1,378
a)
b)
Figure 7‐12. a) Species richness and diversity and b) percent composition, by reach in the lower Merced River during fall 2007. Water temperatures ranged from 16.1 to 22.1 °C (CDFG, unpublished data A), and flows at Cressy (DWR gage #CRS) ranged from 70 to 118 cfs. Reach definitions are given in Table 7‐6. A complete list of species found, by survey and reach, can be found in Table 7‐8.
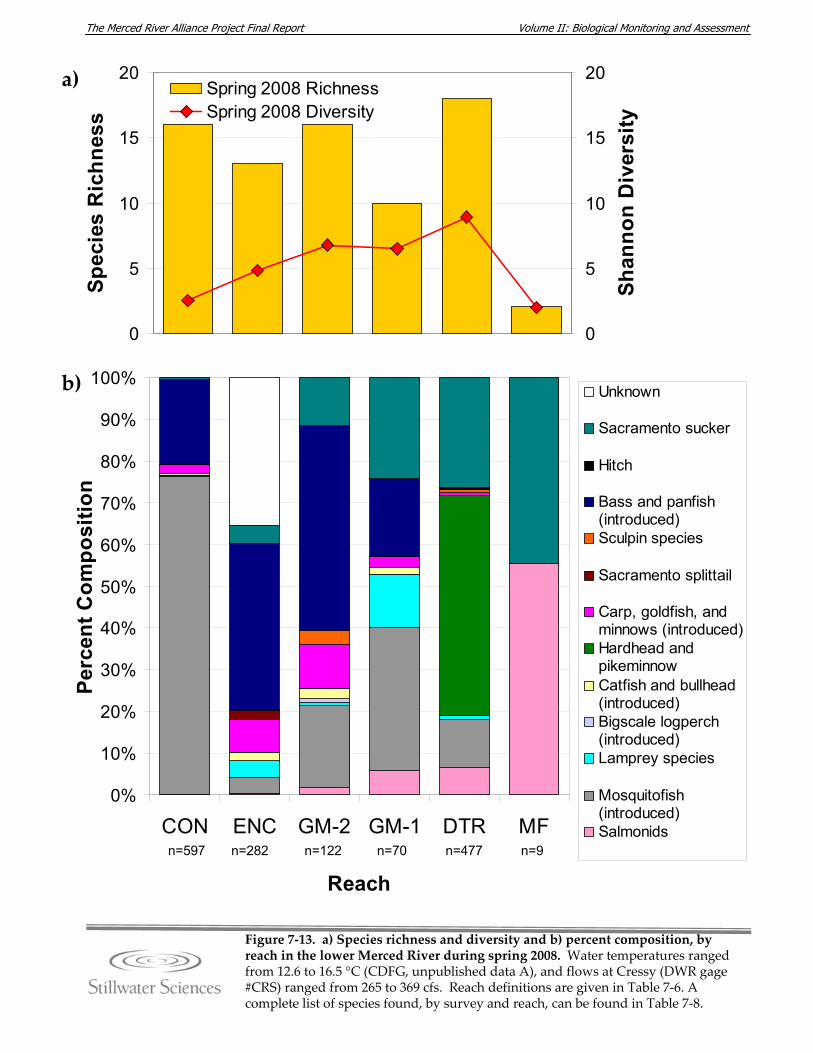
Volume II: Biological Monitoring and Assessment The Merced River Alliance Project Final Report
0
5
10
15
20Sp
ecie
s R
ichn
ess
0
5
10
15
20
Shan
non
Div
ersi
ty
Spring 2008 RichnessSpring 2008 Diversity
0%
10%
20%
30%
40%
50%
60%
70%
80%
90%
100%
CON ENC GM-2 GM-1 DTR MF
Reach
Perc
ent C
ompo
sitio
n
Unknown
Sacramento sucker
Hitch
Bass and panfish(introduced)Sculpin species
Sacramento splittail
Carp, goldfish, andminnows (introduced)Hardhead andpikeminnowCatfish and bullhead(introduced)Bigscale logperch(introduced)Lamprey species
Mosquitofish(introduced)Salmonids
n=597 n=282 n=122 n=70 n=9n=477
a)
b)
Figure 7‐13. a) Species richness and diversity and b) percent composition, by reach in the lower Merced River during spring 2008. Water temperatures ranged from 12.6 to 16.5 °C (CDFG, unpublished data A), and flows at Cressy (DWR gage #CRS) ranged from 265 to 369 cfs. Reach definitions are given in Table 7‐6. A complete list of species found, by survey and reach, can be found in Table 7‐8.
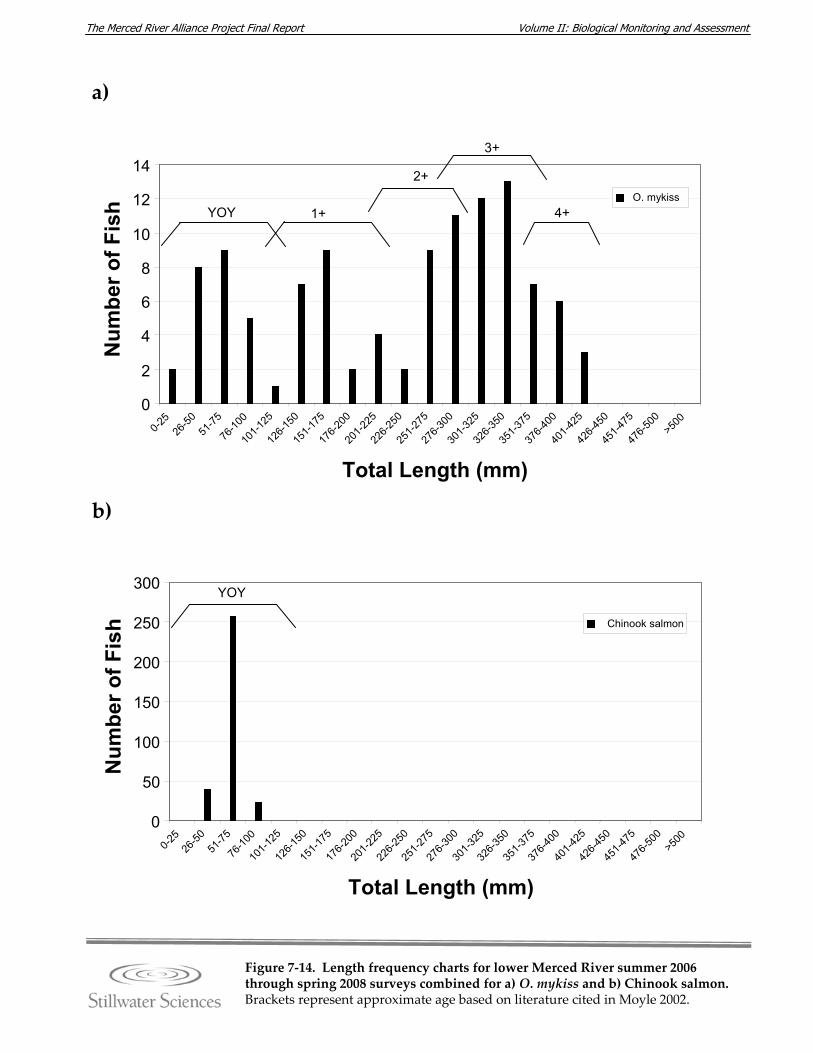
Volume II: Biological Monitoring and Assessment The Merced River Alliance Project Final Report
Figure 7‐14. Length frequency charts for lower Merced River summer 2006 through spring 2008 surveys combined for a) O. mykiss and b) Chinook salmon. Brackets represent approximate age based on literature cited in Moyle 2002.
a)
b)
0
2
4
6
8
10
12
14
0-25
26-50
51-75
76-10
0
101-1
25
126-1
50
151-1
75
176-2
00
201-2
25
226-2
50
251-2
75
276-3
00
301-3
25
326-3
50
351-3
75
376-4
00
401-4
25
426-4
50
451-4
75
476-5
00>5
00
Total Length (mm)
Num
ber o
f Fis
h O. mykissYOY 1+
2+
3+
4+
0
50
100
150
200
250
300
0-25
26-50
51-75
76-10
0
101-1
25
126-1
50
151-1
75
176-2
00
201-2
25
226-2
50
251-2
75
276-3
00
301-3
25
326-3
50
351-3
75
376-4
00
401-4
25
426-4
50
451-4
75
476-5
00>5
00
Total Length (mm)
Num
ber o
f Fis
h Chinook salmon
YOY
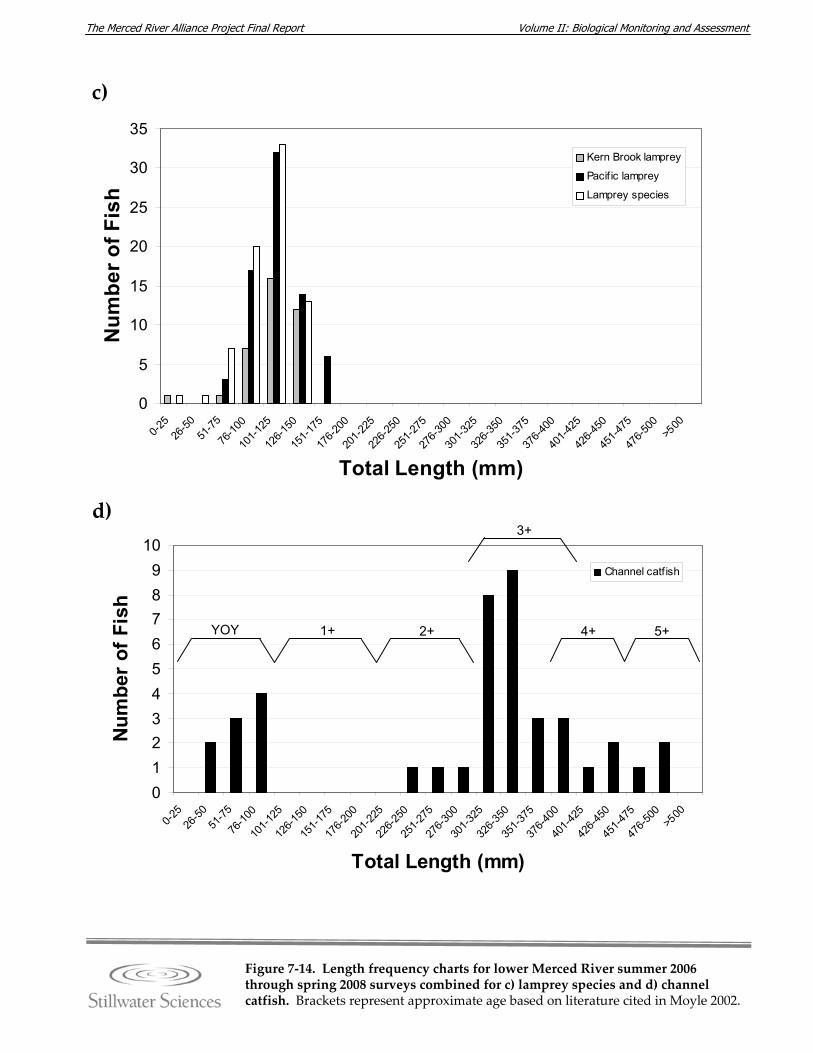
Volume II: Biological Monitoring and Assessment The Merced River Alliance Project Final Report
Figure 7‐14. Length frequency charts for lower Merced River summer 2006 through spring 2008 surveys combined for c) lamprey species and d) channel catfish. Brackets represent approximate age based on literature cited in Moyle 2002.
c)
d)
0
5
10
15
20
25
30
35
0-25
26-50
51-75
76-10
0
101-1
25
126-1
50
151-1
75
176-2
00
201-2
25
226-2
50
251-2
75
276-3
00
301-3
25
326-3
50
351-3
75
376-4
00
401-4
25
426-4
50
451-4
75
476-5
00>5
00
Total Length (mm)
Num
ber o
f Fis
h
Kern Brook lamprey
Pacif ic lamprey
Lamprey species
0123456789
10
0-25
26-50
51-75
76-10
0
101-1
25
126-1
50
151-1
75
176-2
00
201-2
25
226-2
50
251-2
75
276-3
00
301-3
25
326-3
50
351-3
75
376-4
00
401-4
25
426-4
50
451-4
75
476-5
00>5
00
Total Length (mm)
Num
ber
of F
ish
Channel catf ish
YOY 2+
3+
4+ 5+1+
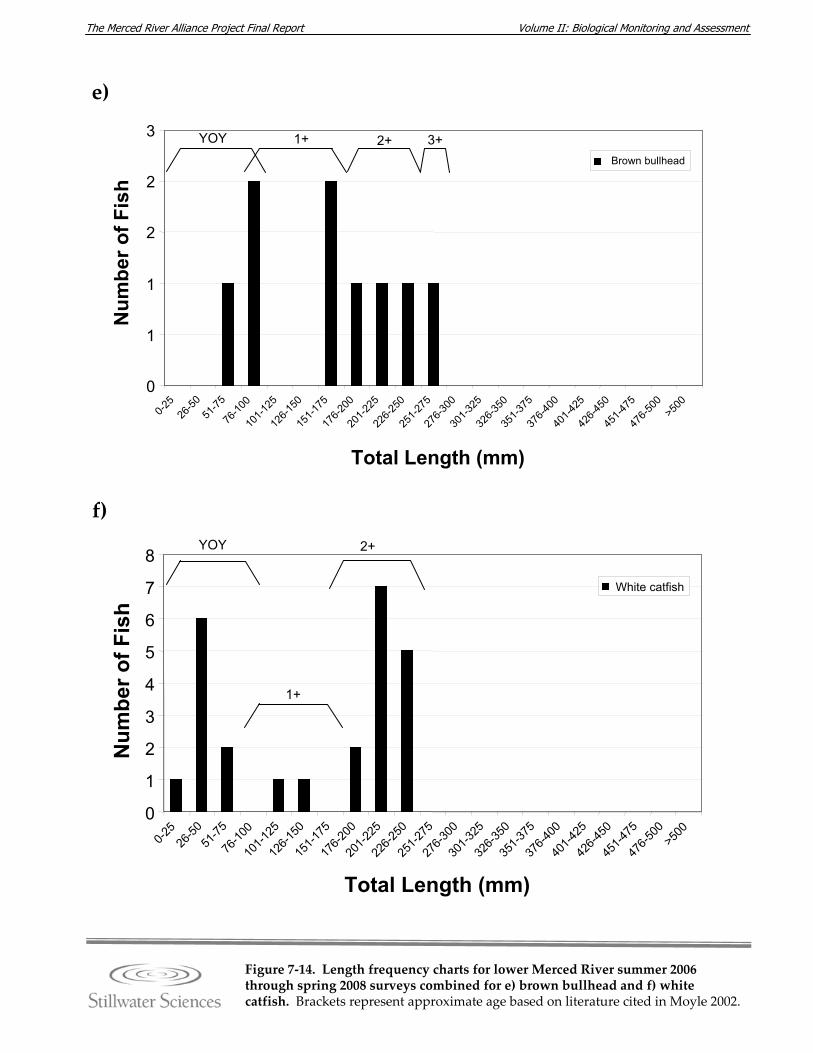
Volume II: Biological Monitoring and Assessment The Merced River Alliance Project Final Report
Figure 7‐14. Length frequency charts for lower Merced River summer 2006 through spring 2008 surveys combined for e) brown bullhead and f) white catfish. Brackets represent approximate age based on literature cited in Moyle 2002.
0
1
1
2
2
3
0-25
26-50
51-75
76-10
0
101-1
25
126-1
50
151-1
75
176-2
00
201-2
25
226-2
50
251-2
75
276-3
00
301-3
25
326-3
50
351-3
75
376-4
00
401-4
25
426-4
50
451-4
75
476-5
00>5
00
Total Length (mm)
Num
ber o
f Fis
h
Brown bullhead
YOY 2+1+ 3+
0
1
2
3
4
5
6
7
8
0-25
26-50
51-75
76-10
0
101-1
25
126-1
50
151-1
75
176-2
00
201-2
25
226-2
50
251-2
75
276-3
00
301-3
25
326-3
50
351-3
75
376-4
00
401-4
25
426-4
50
451-4
75
476-5
00>5
00
Total Length (mm)
Num
ber o
f Fis
h
White catfish
YOY
1+
2+
e)
f)
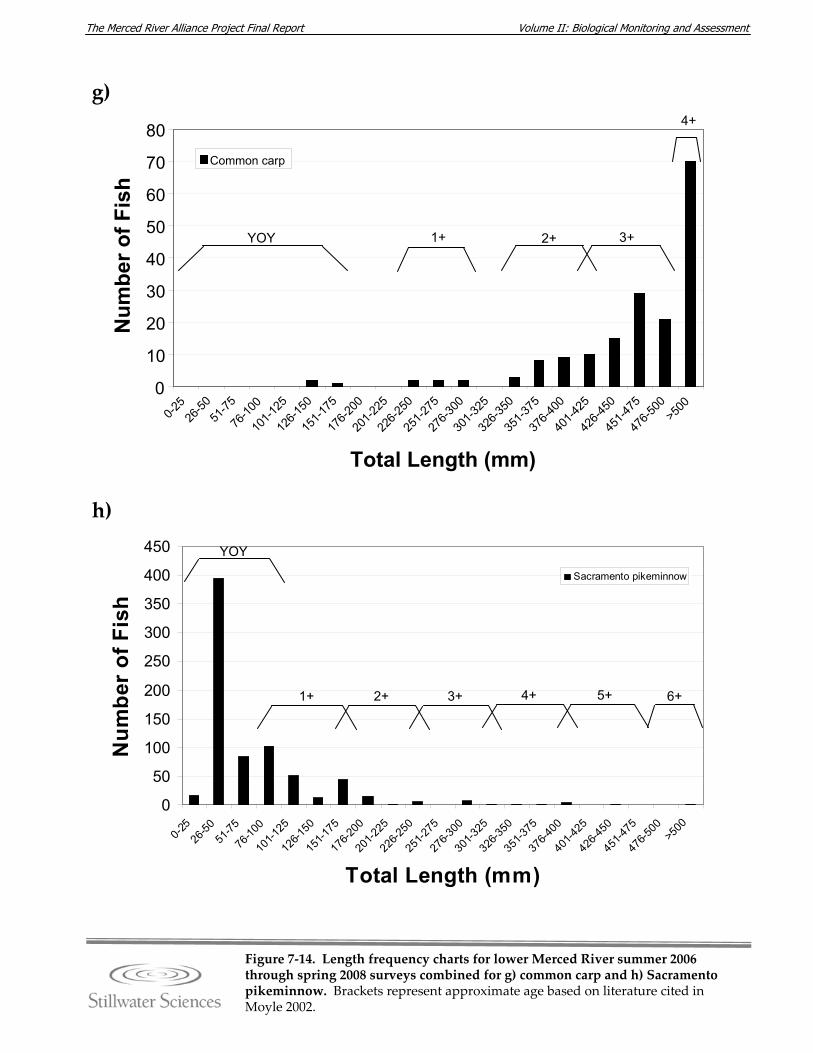
Volume II: Biological Monitoring and Assessment The Merced River Alliance Project Final Report
0
10
20
30
40
50
60
70
80
0-25
26-50
51-75
76-10
0
101-1
25
126-1
50
151-1
75
176-2
00
201-2
25
226-2
50
251-2
75
276-3
00
301-3
25
326-3
50
351-3
75
376-4
00
401-4
25
426-4
50
451-4
75
476-5
00>5
00
Total Length (mm)
Num
ber o
f Fis
h
YOY 1+ 2+ 3+
4+
Figure 7‐14. Length frequency charts for lower Merced River summer 2006 through spring 2008 surveys combined for g) common carp and h) Sacramento pikeminnow. Brackets represent approximate age based on literature cited in Moyle 2002.
Common carp
g)
h)
0
50
100
150
200
250
300
350
400
450
0-25
26-50
51-75
76-10
0
101-1
25
126-1
50
151-1
75
176-2
00
201-2
25
226-2
50
251-2
75
276-3
00
301-3
25
326-3
50
351-3
75
376-4
00
401-4
25
426-4
50
451-4
75
476-5
00>5
00
Total Length (mm)
Num
ber
of F
ish
Sacramento pikeminnow
YOY
1+ 2+ 3+ 4+ 5+ 6+
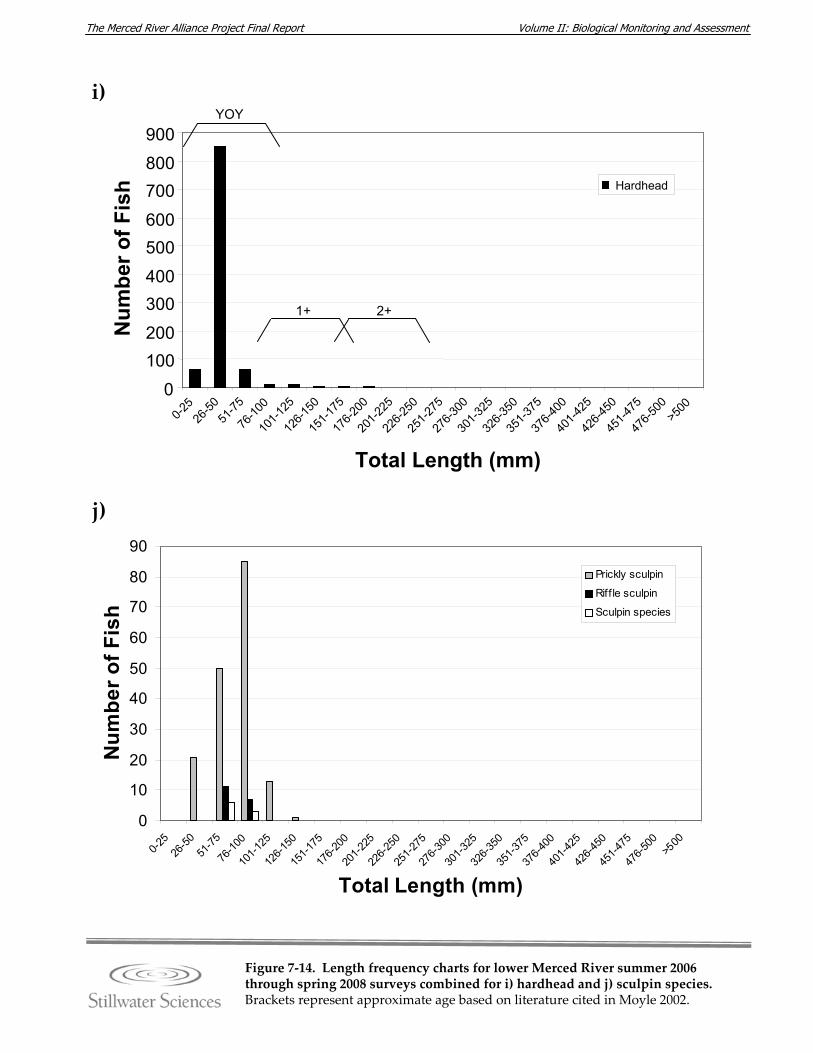
Volume II: Biological Monitoring and Assessment The Merced River Alliance Project Final Report
Figure 7‐14. Length frequency charts for lower Merced River summer 2006 through spring 2008 surveys combined for i) hardhead and j) sculpin species. Brackets represent approximate age based on literature cited in Moyle 2002.
0100200
300400500600
700800900
0-25
26-50
51-75
76-10
0
101-1
25
126-1
50
151-1
75
176-2
00
201-2
25
226-2
50
251-2
75
276-3
00
301-3
25
326-3
50
351-3
75
376-4
00
401-4
25
426-4
50
451-4
75
476-5
00>5
00
Total Length (mm)
Num
ber o
f Fis
hYOY
1+ 2+
Hardhead
i)
j)
0
10
20
30
40
50
60
70
80
90
0-25
26-50
51-75
76-10
0
101-1
25
126-1
50
151-1
75
176-2
00
201-2
25
226-2
50
251-2
75
276-3
00
301-3
25
326-3
50
351-3
75
376-4
00
401-4
25
426-4
50
451-4
75
476-5
00>5
00
Total Length (mm)
Num
ber o
f Fis
h
Prickly sculpin
Riff le sculpin
Sculpin species
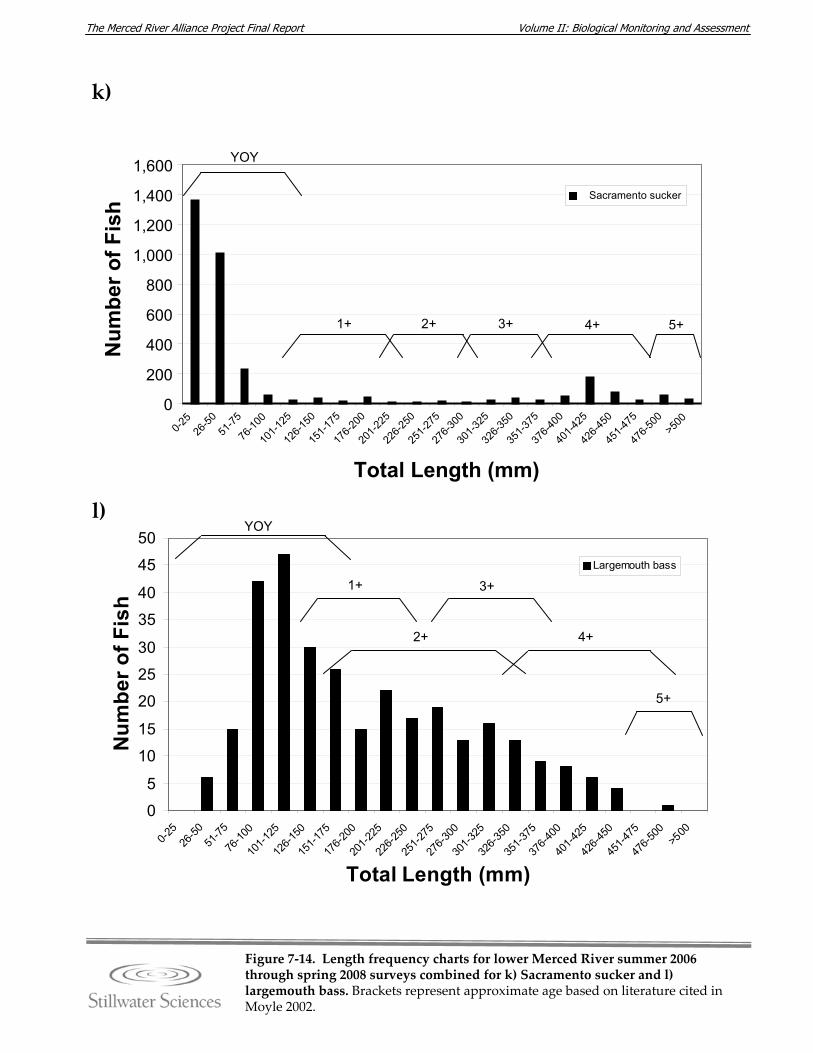
Volume II: Biological Monitoring and Assessment The Merced River Alliance Project Final Report
n=50 n=85
Figure 7‐14. Length frequency charts for lower Merced River summer 2006 through spring 2008 surveys combined for k) Sacramento sucker and l) largemouth bass. Brackets represent approximate age based on literature cited in Moyle 2002.
k)
0
200
400
600
800
1,000
1,200
1,400
1,600
0-25
26-50
51-75
76-10
0
101-1
25
126-1
50
151-1
75
176-2
00
201-2
25
226-2
50
251-2
75
276-3
00
301-3
25
326-3
50
351-3
75
376-4
00
401-4
25
426-4
50
451-4
75
476-5
00>5
00
Total Length (mm)
Num
ber o
f Fis
h
Sacramento sucker
YOY
1+ 2+ 3+ 4+ 5+
0
5
10
15
20
25
30
35
40
45
50
0-25
26-50
51-75
76-10
0
101-1
25
126-1
50
151-1
75
176-2
00
201-2
25
226-2
50
251-2
75
276-3
00
301-3
25
326-3
50
351-3
75
376-4
00
401-4
25
426-4
50
451-4
75
476-5
00>5
00
Total Length (mm)
Num
ber o
f Fis
h
Largemouth bass
l)YOY
1+
2+
3+
4+
5+
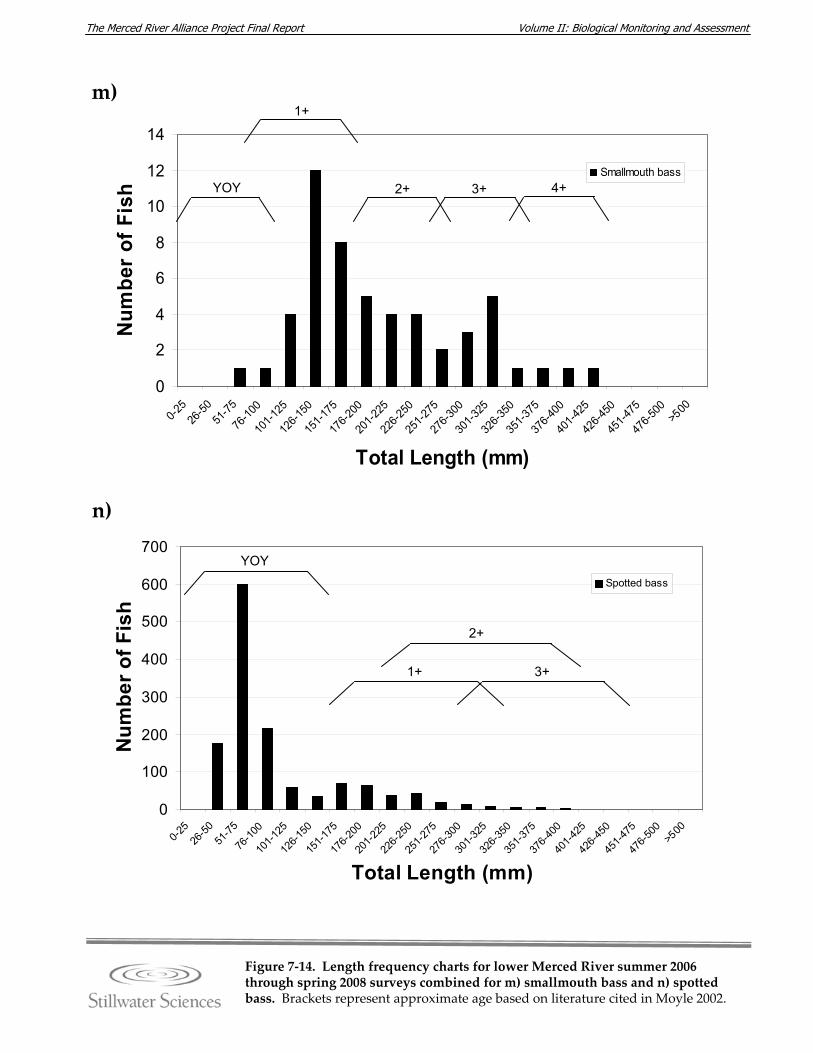
Volume II: Biological Monitoring and Assessment The Merced River Alliance Project Final Report
Figure 7‐14. Length frequency charts for lower Merced River summer 2006 through spring 2008 surveys combined for m) smallmouth bass and n) spotted bass. Brackets represent approximate age based on literature cited in Moyle 2002.
0
2
4
6
8
10
12
14
0-25
26-50
51-75
76-10
0
101-1
25
126-1
50
151-1
75
176-2
00
201-2
25
226-2
50
251-2
75
276-3
00
301-3
25
326-3
50
351-3
75
376-4
00
401-4
25
426-4
50
451-4
75
476-5
00>5
00
Total Length (mm)
Num
ber
of F
ish
Smallmouth bassYOY
1+
2+ 3+ 4+
m)
n)
0
100
200
300
400
500
600
700
0-25
26-50
51-75
76-10
0
101-1
25
126-1
50
151-1
75
176-2
00
201-2
25
226-2
50
251-2
75
276-3
00
301-3
25
326-3
50
351-3
75
376-4
00
401-4
25
426-4
50
451-4
75
476-5
00>5
00
Total Length (mm)
Num
ber o
f Fis
h
Spotted bass
YOY
1+
2+
3+

Volume II: Biological Monitoring and Assessment The Merced River Alliance Project Final Report
Figure 7‐14. Length frequency charts for lower Merced River summer 2006 through spring 2008 surveys combined for o) bluegill sunfish. Brackets represent approximate age based on literature cited in Moyle 2002.
0
20
40
60
80
100
120
140
160
0-25
26-50
51-75
76-10
0
101-1
25
126-1
50
151-1
75
176-2
00
201-2
25
226-2
50
251-2
75
276-3
00
301-3
25
326-3
50
351-3
75
376-4
00
401-4
25
426-4
50
451-4
75
476-5
00>5
00
Total Length (mm)
Num
ber o
f Fis
hBluegill sunfish
YOY
1+ 2+ 3+ 4+
o)
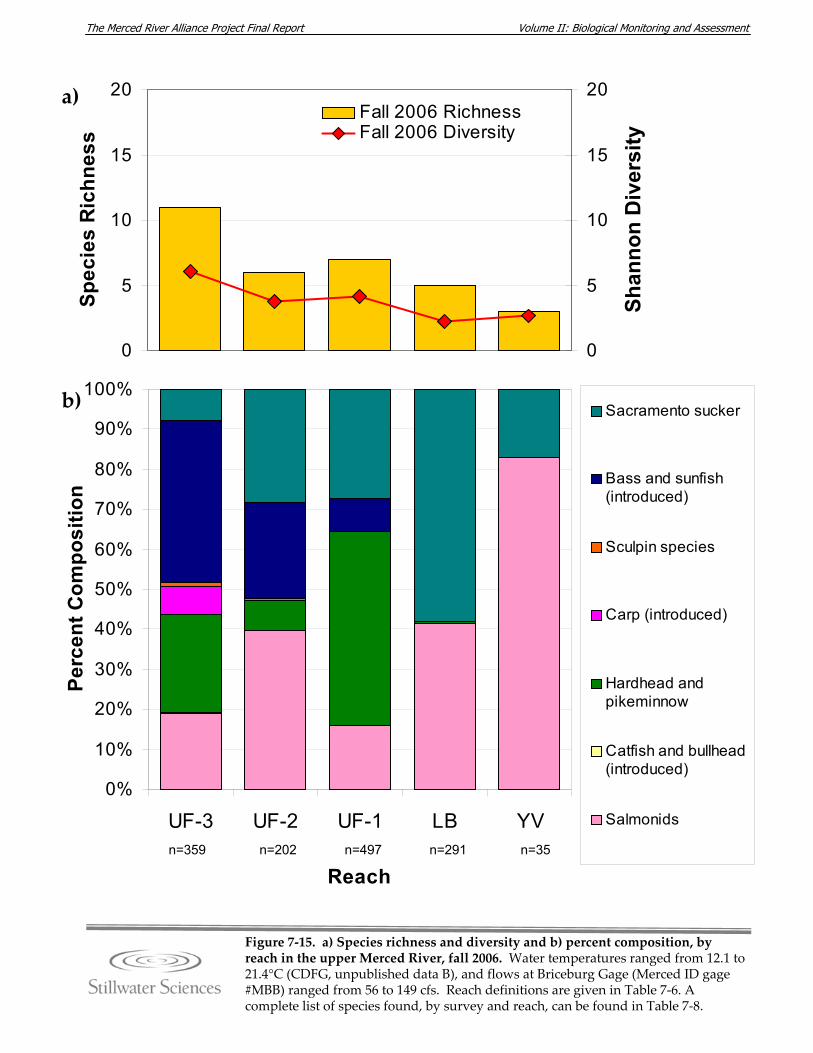
Volume II: Biological Monitoring and Assessment The Merced River Alliance Project Final Report
0
5
10
15
20Sp
ecie
s R
ichn
ess
0
5
10
15
20
Shan
non
Div
ersi
ty (N
1)Fall 2006 Richness
Fall 2006 Diversity
0%
10%
20%
30%
40%
50%
60%
70%
80%
90%
100%
UF-3 UF-2 UF-1 LB YV
Reach
Perc
ent C
ompo
sitio
n
Sacramento sucker
Bass and sunfish(introduced)
Sculpin species
Carp (introduced)
Hardhead andpikeminnow
Catfish and bullhead(introduced)
Salmonids
Shan
non
Div
ersi
ty
n=359 n=202 n=497 n=291 n=35
a)
b)
Figure 7‐15. a) Species richness and diversity and b) percent composition, by reach in the upper Merced River, fall 2006. Water temperatures ranged from 12.1 to 21.4°C (CDFG, unpublished data B), and flows at Briceburg Gage (Merced ID gage #MBB) ranged from 56 to 149 cfs. Reach definitions are given in Table 7‐6. A complete list of species found, by survey and reach, can be found in Table 7‐8.
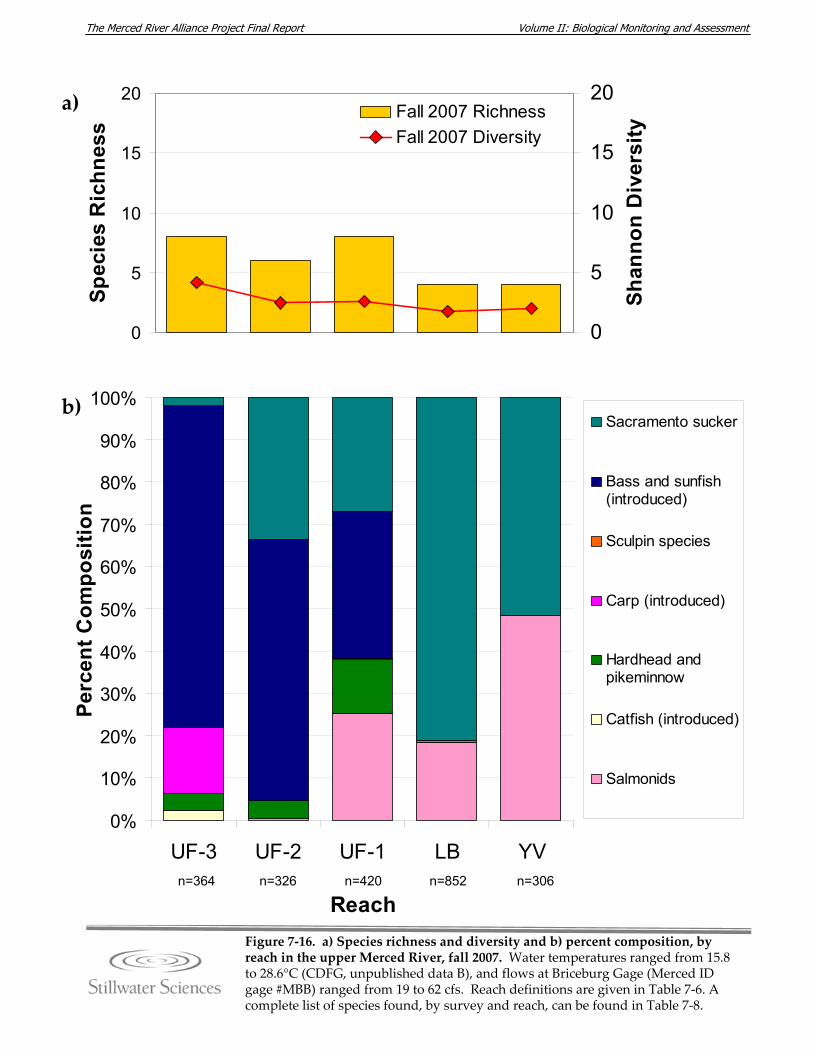
Volume II: Biological Monitoring and Assessment The Merced River Alliance Project Final Report
0
5
10
15
20Sp
ecie
s R
ichn
ess
0
5
10
15
20
Shan
non
Div
ersi
ty
Fall 2007 RichnessFall 2007 Diversity
0%
10%
20%
30%
40%
50%
60%
70%
80%
90%
100%
UF-3 UF-2 UF-1 LB YV
Reach
Perc
ent C
ompo
sitio
n
Sacramento sucker
Bass and sunfish(introduced)
Sculpin species
Carp (introduced)
Hardhead andpikeminnow
Catfish (introduced)
Salmonids
n=364 n=326 n=420 n=852 n=306
a)
b)
Figure 7‐16. a) Species richness and diversity and b) percent composition, by reach in the upper Merced River, fall 2007. Water temperatures ranged from 15.8 to 28.6°C (CDFG, unpublished data B), and flows at Briceburg Gage (Merced ID gage #MBB) ranged from 19 to 62 cfs. Reach definitions are given in Table 7‐6. A complete list of species found, by survey and reach, can be found in Table 7‐8.
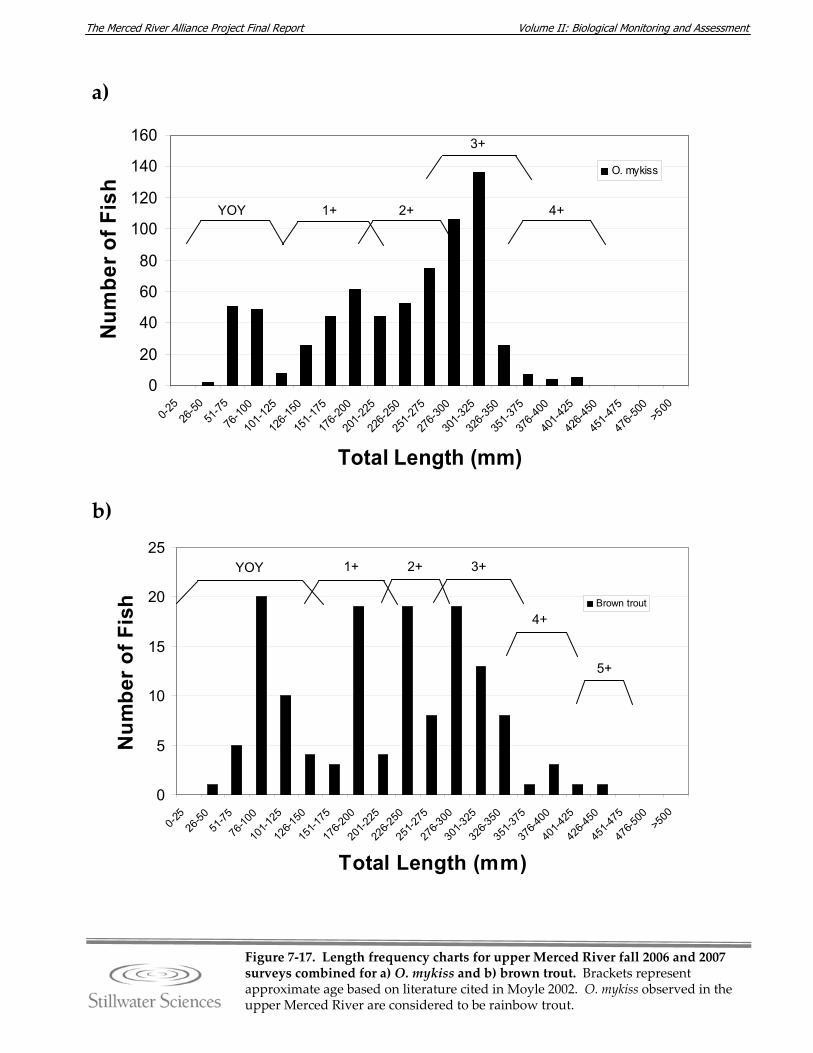
Volume II: Biological Monitoring and Assessment The Merced River Alliance Project Final Report
0
20
40
60
80
100
120
140
160
0-25
26-50
51-75
76-10
0
101-1
25
126-1
50
151-1
75
176-2
00
201-2
25
226-2
50
251-2
75
276-3
00
301-3
25
326-3
50
351-3
75
376-4
00
401-4
25
426-4
50
451-4
75
476-5
00>5
00
Total Length (mm)
Num
ber o
f Fis
h
O. mykiss
0
5
10
15
20
25
0-25
26-50
51-75
76-10
0
101-1
25
126-1
50
151-1
75
176-2
00
201-2
25
226-2
50
251-2
75
276-3
00
301-3
25
326-3
50
351-3
75
376-4
00
401-4
25
426-4
50
451-4
75
476-5
00>5
00
Total Length (mm)
Num
ber
of F
ish Brown trout
Figure 7‐17. Length frequency charts for upper Merced River fall 2006 and 2007 surveys combined for a) O. mykiss and b) brown trout. Brackets represent approximate age based on literature cited in Moyle 2002. O. mykiss observed in the upper Merced River are considered to be rainbow trout.
a)
b)
YOY 1+ 2+
3+
4+
YOY 1+ 2+ 3+
4+
5+
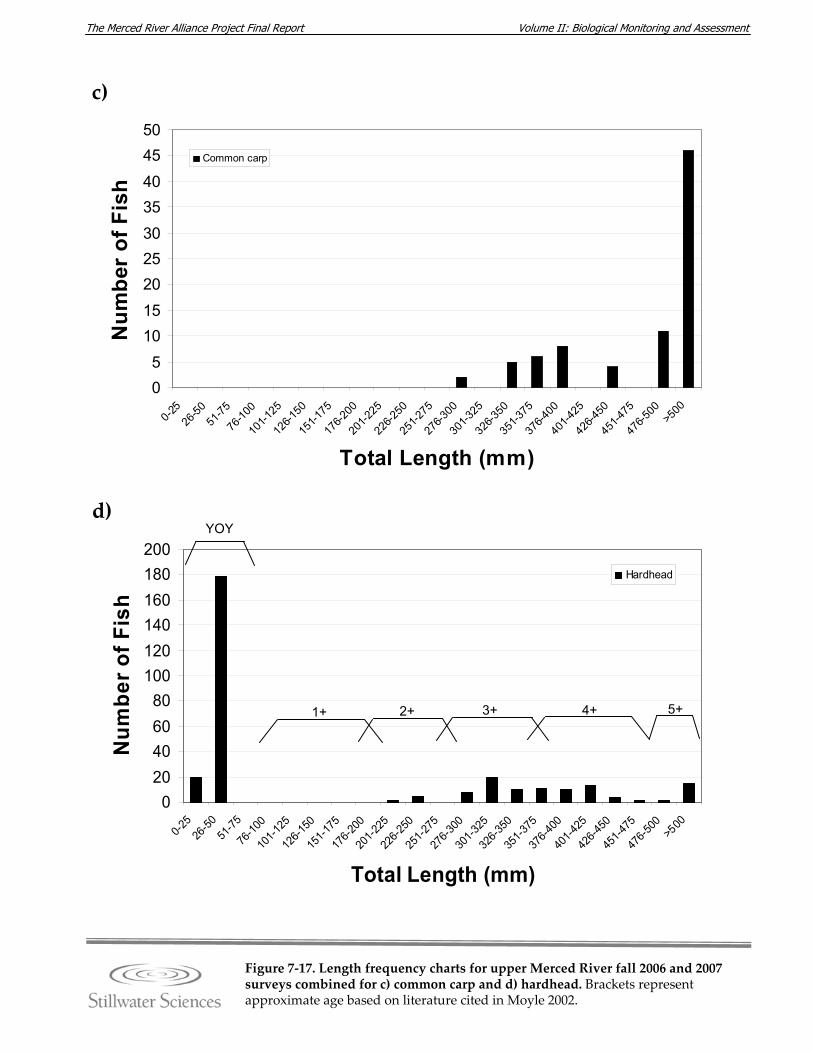
Volume II: Biological Monitoring and Assessment The Merced River Alliance Project Final Report
020406080
100120140160180200
0-25
26-50
51-75
76-10
0
101-1
25
126-1
50
151-1
75
176-2
00
201-2
25
226-2
50
251-2
75
276-3
00
301-3
25
326-3
50
351-3
75
376-4
00
401-4
25
426-4
50
451-4
75
476-5
00>5
00
Total Length (mm)
Num
ber o
f Fis
h
Hardhead
05
101520253035404550
0-25
26-50
51-75
76-10
0
101-1
25
126-1
50
151-1
75
176-2
00
201-2
25
226-2
50
251-2
75
276-3
00
301-3
25
326-3
50
351-3
75
376-4
00
401-4
25
426-4
50
451-4
75
476-5
00>5
00
Total Length (mm)
Num
ber
of F
ish
Common carp
Figure 7‐17. Length frequency charts for upper Merced River fall 2006 and 2007 surveys combined for c) common carp and d) hardhead. Brackets represent approximate age based on literature cited in Moyle 2002.
c)
d)YOY
1+ 2+ 3+ 4+ 5+
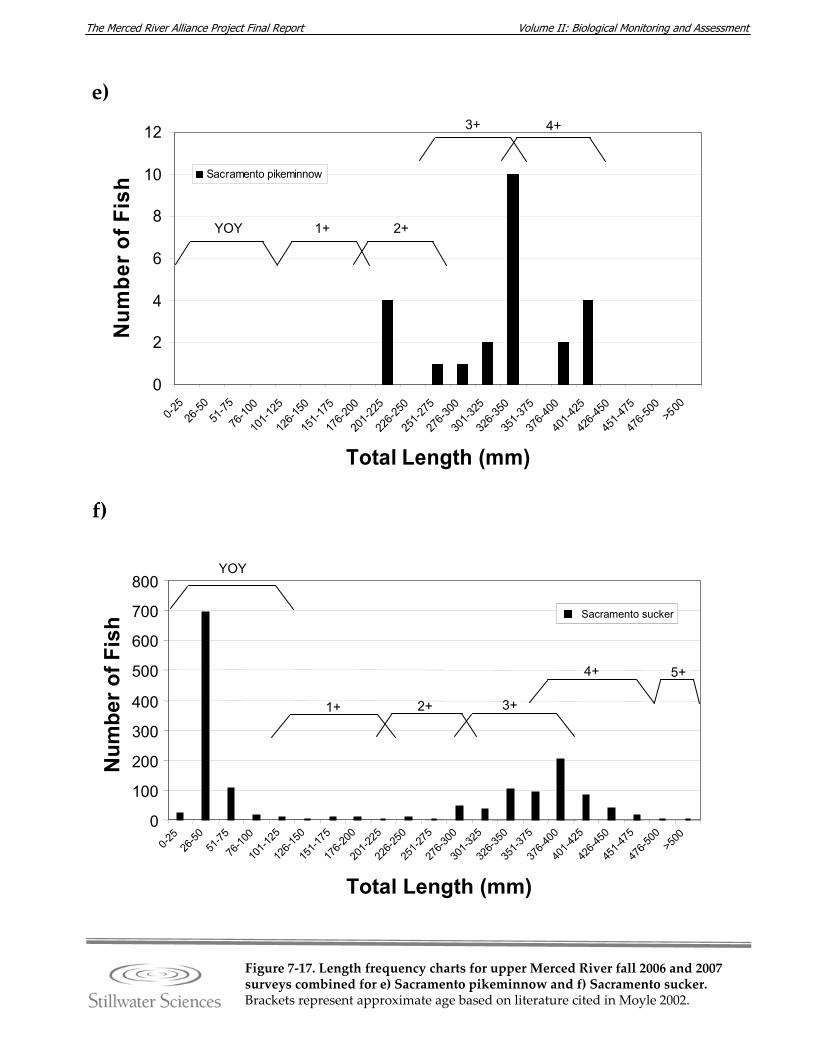
Volume II: Biological Monitoring and Assessment The Merced River Alliance Project Final Report
0
2
4
6
8
10
12
0-25
26-50
51-75
76-10
0
101-1
25
126-1
50
151-1
75
176-2
00
201-2
25
226-2
50
251-2
75
276-3
00
301-3
25
326-3
50
351-3
75
376-4
00
401-4
25
426-4
50
451-4
75
476-5
00>5
00
Total Length (mm)
Num
ber o
f Fis
h Sacramento pikeminnow
0
100
200
300
400
500
600
700
800
0-25
26-50
51-75
76-10
0
101-1
25
126-1
50
151-1
75
176-2
00
201-2
25
226-2
50
251-2
75
276-3
00
301-3
25
326-3
50
351-3
75
376-4
00
401-4
25
426-4
50
451-4
75
476-5
00>5
00
Total Length (mm)
Num
ber o
f Fis
h Sacramento sucker
0
100
200
300
400
500
600
700
800
0-25
26-50
51-75
76-10
0
101-1
25
126-1
50
151-1
75
176-2
00
201-2
25
226-2
50
251-2
75
276-3
00
301-3
25
326-3
50
351-3
75
376-4
00
401-4
25
426-4
50
451-4
75
476-5
00>5
00
Total Length (mm)
Num
ber o
f Fis
h Sacramento sucker
Figure 7‐17. Length frequency charts for upper Merced River fall 2006 and 2007 surveys combined for e) Sacramento pikeminnow and f) Sacramento sucker. Brackets represent approximate age based on literature cited in Moyle 2002.
YOY 1+ 2+
3+ 4+
e)
f)
1+ 2+ 3+
4+ 5+
YOY
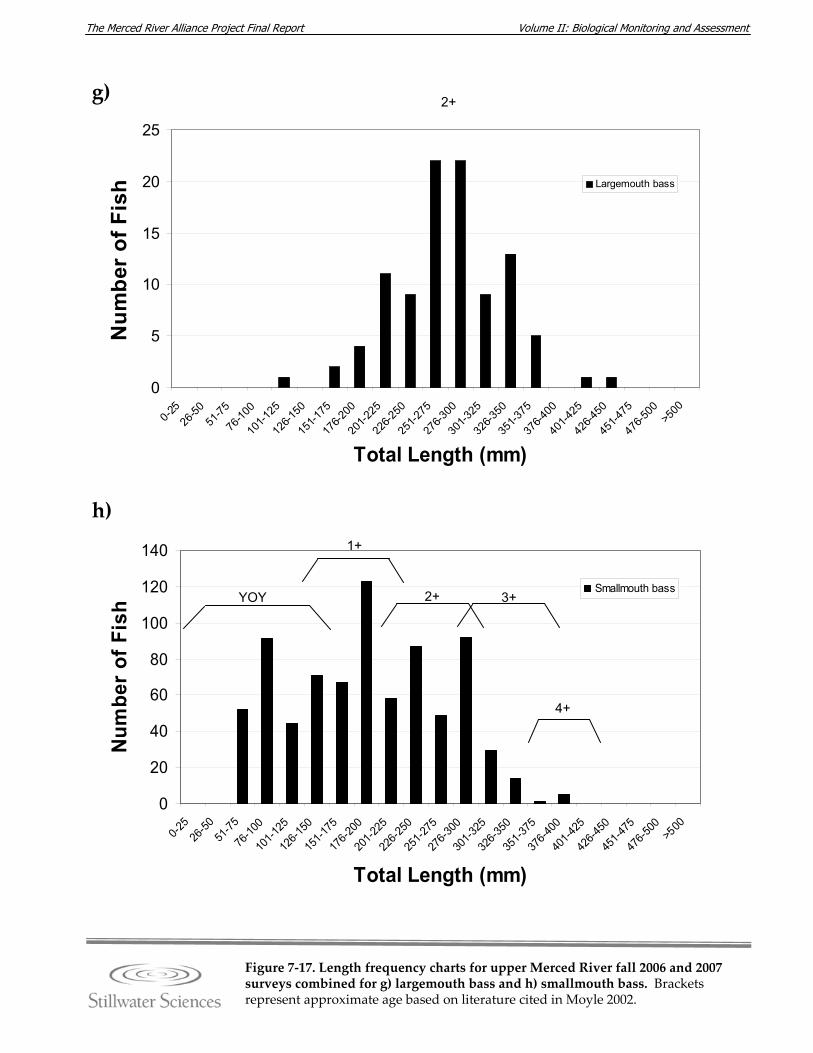
Volume II: Biological Monitoring and Assessment The Merced River Alliance Project Final Report
0
20
40
60
80
100
120
140
0-25
26-50
51-75
76-10
0
101-1
25
126-1
50
151-1
75
176-2
00
201-2
25
226-2
50
251-2
75
276-3
00
301-3
25
326-3
50
351-3
75
376-4
00
401-4
25
426-4
50
451-4
75
476-5
00>5
00
Total Length (mm)
Num
ber
of F
ish
Smallmouth bass
Figure 7‐17. Length frequency charts for upper Merced River fall 2006 and 2007 surveys combined for g) largemouth bass and h) smallmouth bass. Brackets represent approximate age based on literature cited in Moyle 2002.
g)
h)
1+
2+
3+
4+
YOY
YOY
1+
2+ 3+
4+
0
5
10
15
20
25
0-25
26-50
51-75
76-10
0
101-1
25
126-1
50
151-1
75
176-2
00
201-2
25
226-2
50
251-2
75
276-3
00
301-3
25
326-3
50
351-3
75
376-4
00
401-4
25
426-4
50
451-4
75
476-5
00>5
00
Total Length (mm)
Num
ber
of F
ish Largemouth bass
Total Length (mm)
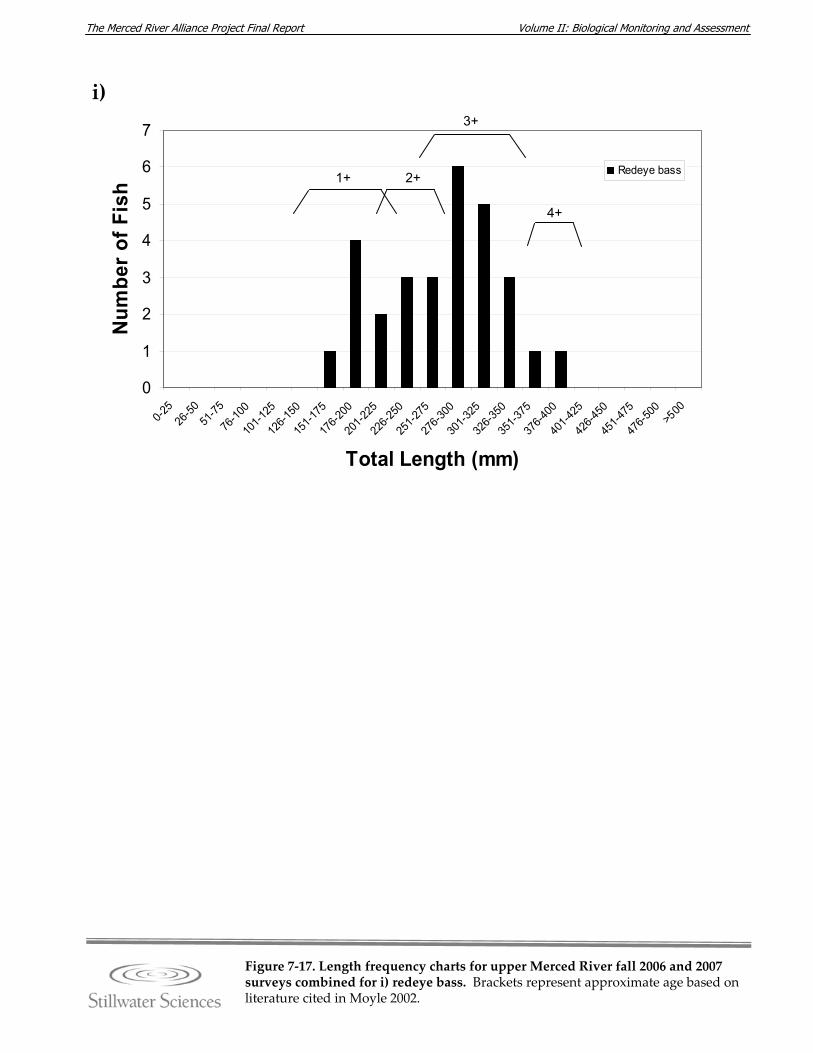
Volume II: Biological Monitoring and Assessment The Merced River Alliance Project Final Report
0
1
2
3
4
5
6
7
0-25
26-50
51-75
76-10
0
101-1
25
126-1
50
151-1
75
176-2
00
201-2
25
226-2
50
251-2
75
276-3
00
301-3
25
326-3
50
351-3
75
376-4
00
401-4
25
426-4
50
451-4
75
476-5
00>5
00
Total Length (mm)
Num
ber
of F
ish
Redeye bass
Figure 7‐17. Length frequency charts for upper Merced River fall 2006 and 2007 surveys combined for i) redeye bass. Brackets represent approximate age based on literature cited in Moyle 2002.
i)
1+ 2+
3+
4+
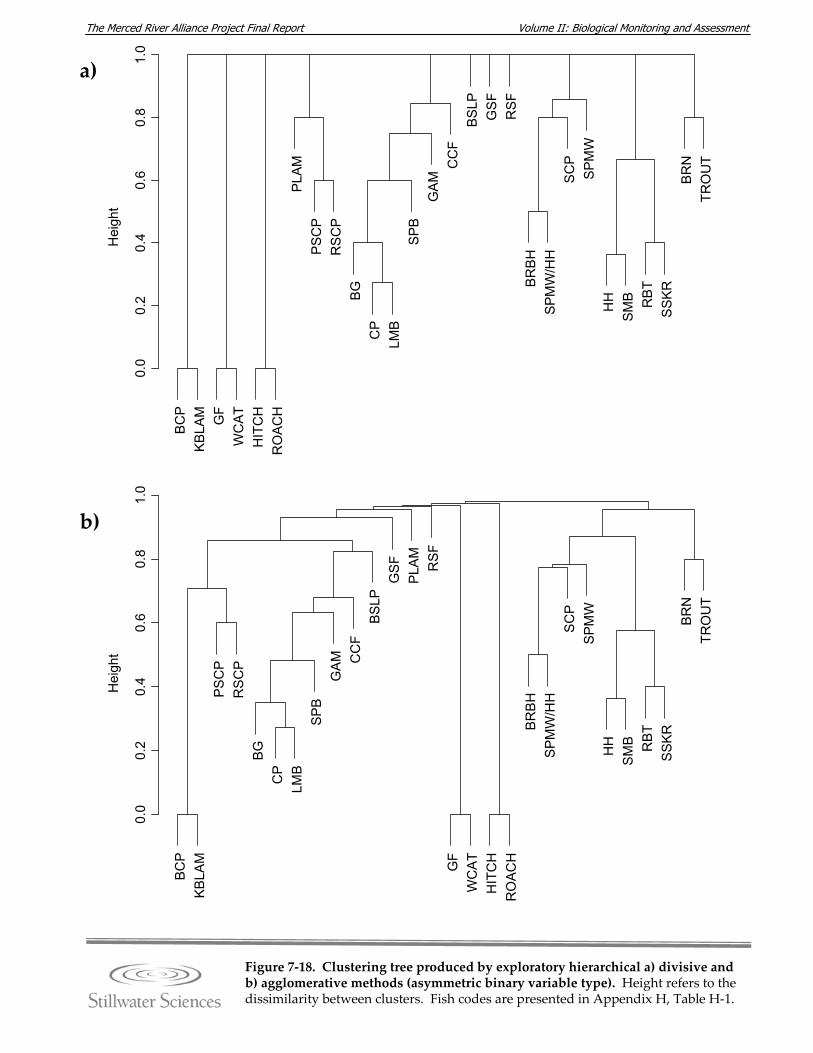
Volume II: Biological Monitoring and Assessment The Merced River Alliance Project Final Report
Figure 7‐18. Clustering tree produced by exploratory hierarchical a) divisive and b) agglomerative methods (asymmetric binary variable type). Height refers to the dissimilarity between clusters. Fish codes are presented in Appendix H, Table H‐1.
BC
P
BG
BRB
H
BRN
BSLP
CC
F
CP
GA
M
GF
GS
F
HH
HIT
CH
KBLA
M
LMB
PLAM
PSC
P
RBT
RO
ACH
RSC
P
RS
F
SCP
SMB
SPB
SPM
W
SPM
W/H
H
SSK
R
TRO
UT
WC
AT
0.0
0.2
0.4
0.6
0.8
1.0
Hei
ght
BCP
BG
BRB
H
BRN
BSLP
CC
F
CP
GA
M
GF
GS
F
HH
HIT
CH
KBLA
M
LMB
PLA
M
PSC
P
RBT
RO
ACH
RS
CP
RSF
SC
P
SMB
SPB
SPM
W
SPM
W/H
H
SSKR
TRO
UT
WC
AT
0.0
0.2
0.4
0.6
0.8
1.0
Hei
ght
a)
b)
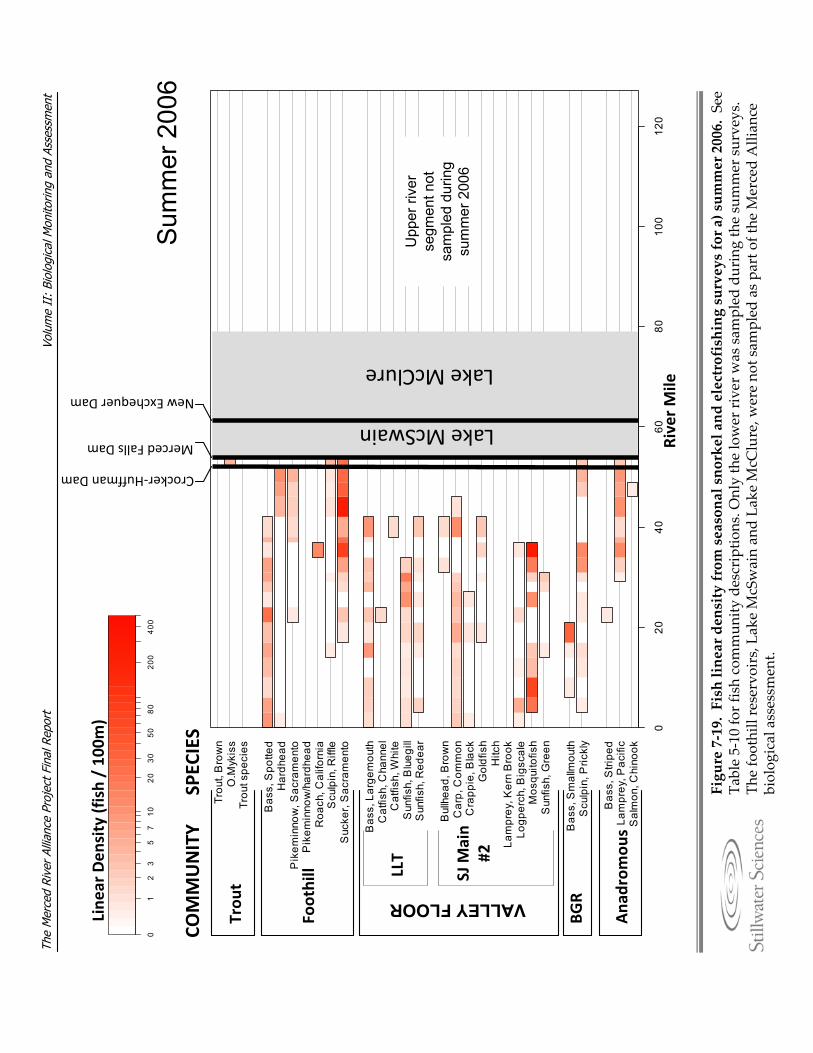
Volu
me
II:
Biol
ogic
al M
onito
ring
and
Asse
ssm
ent
The
Mer
ced
Rive
r Al
lianc
e Pr
ojec
t Fin
al R
epor
t
Figure 7‐19. Fish linear density from seasonal snorkel and electrofishingsurveys for a) summer 2006. See
Table 5‐10 fo
r fish commun
ity descriptio
ns. O
nly the lower river w
as sam
pled during the summer surveys.
The foothill reservoirs, L
ake McSwainan
d La
ke M
cClure, w
ere no
t sam
pled as pa
rt of the M
erced Allian
ce
biolog
ical assessm
ent.
020
4060
8010
012
0
Sal
mon
, Chi
nook
Lam
prey
, Pac
ific
Bas
s, S
tripe
d
Scu
lpin
, Pric
kly
Bas
s, S
mal
lmou
th
Sun
fish,
Gre
enM
osqu
itofis
hLo
gper
ch, B
igsc
ale
Lam
prey
, Ker
n B
rook
Hitc
hG
oldf
ish
Cra
ppie
, Bla
ckC
arp,
Com
mon
Bul
lhea
d, B
row
n
Sun
fish,
Red
ear
Sun
fish,
Blu
egill
Cat
fish,
Whi
teC
atfis
h, C
hann
elB
ass,
Lar
gem
outh
Suc
ker,
Sac
ram
ento
Scu
lpin
, Riff
leR
oach
, Cal
iforn
iaP
ikem
inno
w/h
ardh
ead
Pik
emin
now
, Sac
ram
ento
Har
dhea
dB
ass,
Spo
tted
Trou
t spe
cies
O.M
ykis
sTr
out,
Bro
wn
Sum
mer
200
6
Upp
er ri
ver
segm
ent n
ot
sam
pled
dur
ing
sum
mer
200
6
01
23
57
1020
3050
8020
040
0
Line
ar Den
sity (fish / 10
0m)
Lake McSwain
River Mile
SPEC
IES
Crocker‐Huffman Dam
Merced Falls Dam
New Exchequer Dam
Lake McClure
VALLEY FLOOR
COMMUNITY
Trou
t
Foothill LLT
SJ M
ain
#2
BGR
Ana
drom
ous
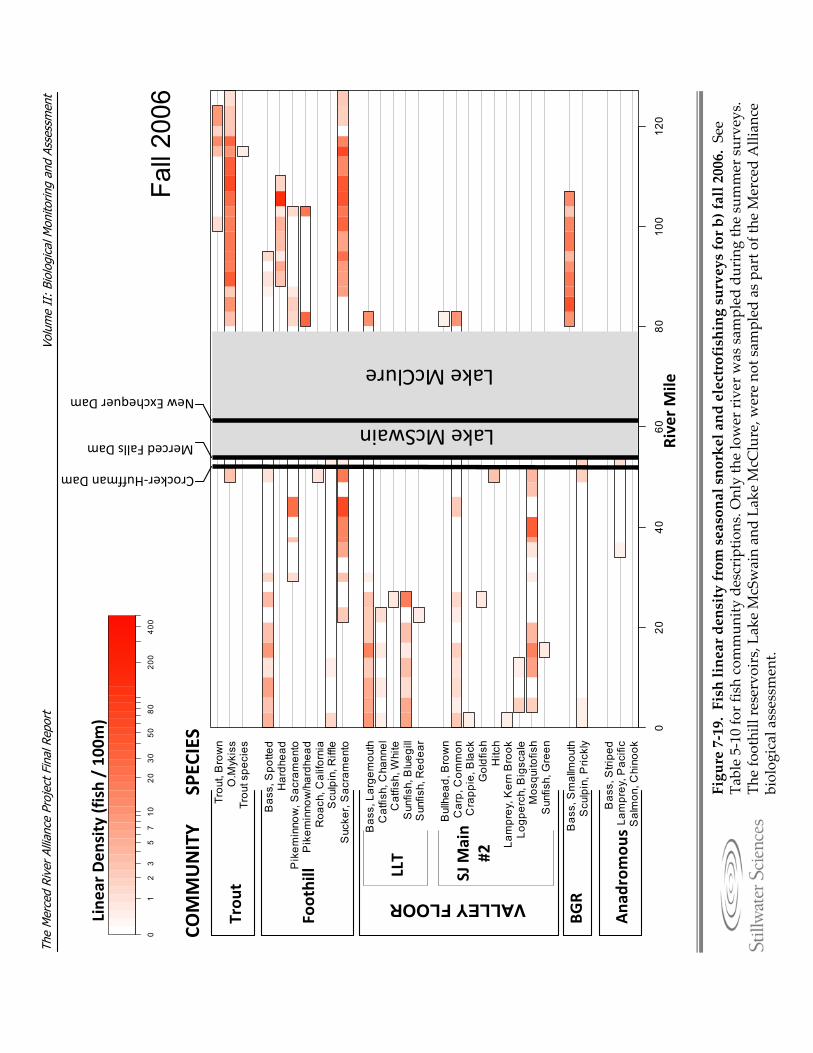
Volu
me
II:
Biol
ogic
al M
onito
ring
and
Asse
ssm
ent
The
Mer
ced
Rive
r Al
lianc
e Pr
ojec
t Fin
al R
epor
t
Figure 7‐19. Fish linear density from seasonal snorkel and electrofishingsurveys for b) fall 2006. See
Table 5‐10 fo
r fish commun
ity descriptio
ns. O
nly the lower river w
as sam
pled during the summer surveys.
The foothill reservoirs, L
ake McSwainan
d La
ke M
cClure, w
ere no
t sam
pled as pa
rt of the M
erced Allian
ce
biolog
ical assessm
ent.
Fall
2006
020
4060
8010
012
0
Sal
mon
, Chi
nook
Lam
prey
, Pac
ific
Bas
s, S
tripe
d
Scu
lpin
, Pric
kly
Bas
s, S
mal
lmou
th
Sun
fish,
Gre
enM
osqu
itofis
hLo
gper
ch, B
igsc
ale
Lam
prey
, Ker
n B
rook
Hitc
hG
oldf
ish
Cra
ppie
, Bla
ckC
arp,
Com
mon
Bul
lhea
d, B
row
n
Sun
fish,
Red
ear
Sun
fish,
Blu
egill
Cat
fish,
Whi
teC
atfis
h, C
hann
elB
ass,
Lar
gem
outh
Suc
ker,
Sac
ram
ento
Scu
lpin
, Riff
leR
oach
, Cal
iforn
iaP
ikem
inno
w/h
ardh
ead
Pik
emin
now
, Sac
ram
ento
Har
dhea
dB
ass,
Spo
tted
Trou
t spe
cies
O.M
ykis
sTr
out,
Bro
wn
01
23
57
1020
3050
8020
040
0
Line
ar Den
sity (fish / 10
0m)
Lake McSwain
River Mile
SPEC
IES
Crocker‐Huffman Dam
Merced Falls Dam
New Exchequer Dam
Lake McClure
VALLEY FLOOR
COMMUNITY
Trou
t
Foothill LLT
SJ M
ain
#2
BGR
Ana
drom
ous
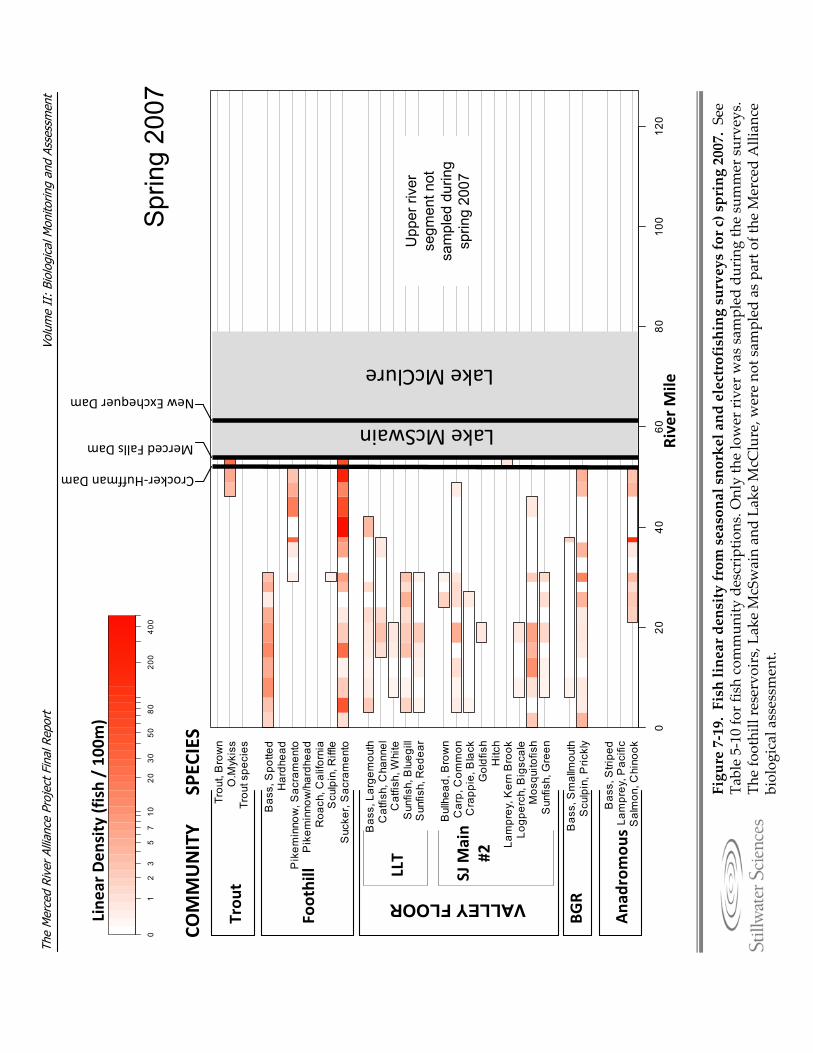
Volu
me
II:
Biol
ogic
al M
onito
ring
and
Asse
ssm
ent
The
Mer
ced
Rive
r Al
lianc
e Pr
ojec
t Fin
al R
epor
t
Figure 7‐19. Fish linear density from seasonal snorkel and electrofishingsurveys for c) spring 2007. See
Table 5‐10 fo
r fish commun
ity descriptio
ns. O
nly the lower river w
as sam
pled during the summer surveys.
The foothill reservoirs, L
ake McSwainan
d La
ke M
cClure, w
ere no
t sam
pled as pa
rt of the M
erced Allian
ce
biolog
ical assessm
ent.
Spr
ing
2007
020
4060
8010
012
0
Sal
mon
, Chi
nook
Lam
prey
, Pac
ific
Bas
s, S
tripe
d
Scu
lpin
, Pric
kly
Bas
s, S
mal
lmou
th
Sun
fish,
Gre
enM
osqu
itofis
hLo
gper
ch, B
igsc
ale
Lam
prey
, Ker
n B
rook
Hitc
hG
oldf
ish
Cra
ppie
, Bla
ckC
arp,
Com
mon
Bul
lhea
d, B
row
n
Sun
fish,
Red
ear
Sun
fish,
Blu
egill
Cat
fish,
Whi
teC
atfis
h, C
hann
elB
ass,
Lar
gem
outh
Suc
ker,
Sac
ram
ento
Scu
lpin
, Riff
leR
oach
, Cal
iforn
iaP
ikem
inno
w/h
ardh
ead
Pik
emin
now
, Sac
ram
ento
Har
dhea
dB
ass,
Spo
tted
Trou
t spe
cies
O.M
ykis
sTr
out,
Bro
wn
Upp
er ri
ver
segm
ent n
ot
sam
pled
dur
ing
sprin
g 20
07
01
23
57
1020
3050
8020
040
0
Line
ar Den
sity (fish / 10
0m)
Lake McSwain
River Mile
SPEC
IES
Crocker‐Huffman Dam
Merced Falls Dam
New Exchequer Dam
Lake McClure
VALLEY FLOOR
COMMUNITY
Trou
t
Foothill LLT
SJ M
ain
#2
BGR
Ana
drom
ous
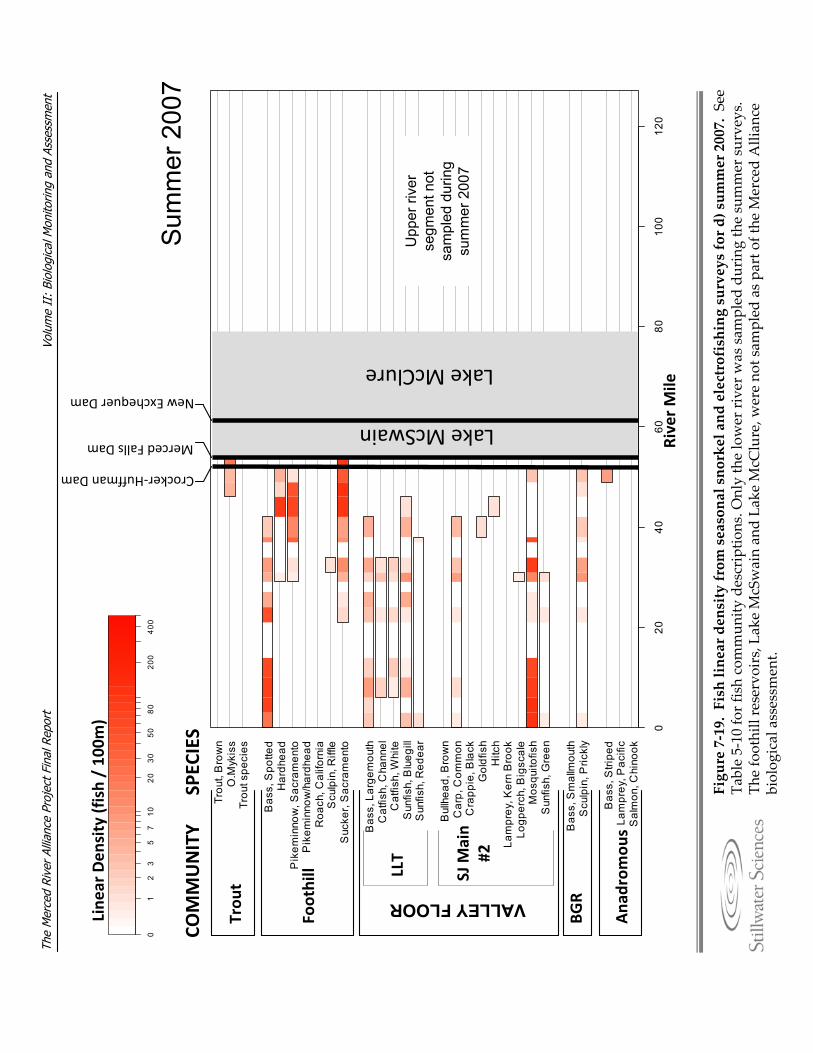
Volu
me
II:
Biol
ogic
al M
onito
ring
and
Asse
ssm
ent
The
Mer
ced
Rive
r Al
lianc
e Pr
ojec
t Fin
al R
epor
t
Figure 7‐19. Fish linear density from seasonal snorkel and electrofishingsurveys for d) summer 2007. See
Table 5‐10 fo
r fish commun
ity descriptio
ns. O
nly the lower river w
as sam
pled during the summer surveys.
The foothill reservoirs, L
ake McSwainan
d La
ke M
cClure, w
ere no
t sam
pled as pa
rt of the M
erced Allian
ce
biolog
ical assessm
ent.
Sum
mer
200
7
020
4060
8010
012
0
Sal
mon
, Chi
nook
Lam
prey
, Pac
ific
Bas
s, S
tripe
d
Scu
lpin
, Pric
kly
Bas
s, S
mal
lmou
th
Sun
fish,
Gre
enM
osqu
itofis
hLo
gper
ch, B
igsc
ale
Lam
prey
, Ker
n B
rook
Hitc
hG
oldf
ish
Cra
ppie
, Bla
ckC
arp,
Com
mon
Bul
lhea
d, B
row
n
Sun
fish,
Red
ear
Sun
fish,
Blu
egill
Cat
fish,
Whi
teC
atfis
h, C
hann
elB
ass,
Lar
gem
outh
Suc
ker,
Sac
ram
ento
Scu
lpin
, Riff
leR
oach
, Cal
iforn
iaP
ikem
inno
w/h
ardh
ead
Pik
emin
now
, Sac
ram
ento
Har
dhea
dB
ass,
Spo
tted
Trou
t spe
cies
O.M
ykis
sTr
out,
Bro
wn
Upp
er ri
ver
segm
ent n
ot
sam
pled
dur
ing
sum
mer
200
7
01
23
57
1020
3050
8020
040
0
Line
ar Den
sity (fish / 10
0m)
Lake McSwain
River Mile
SPEC
IES
Crocker‐Huffman Dam
Merced Falls Dam
New Exchequer Dam
Lake McClure
VALLEY FLOOR
COMMUNITY
Trou
t
Foothill LLT
SJ M
ain
#2
BGR
Ana
drom
ous
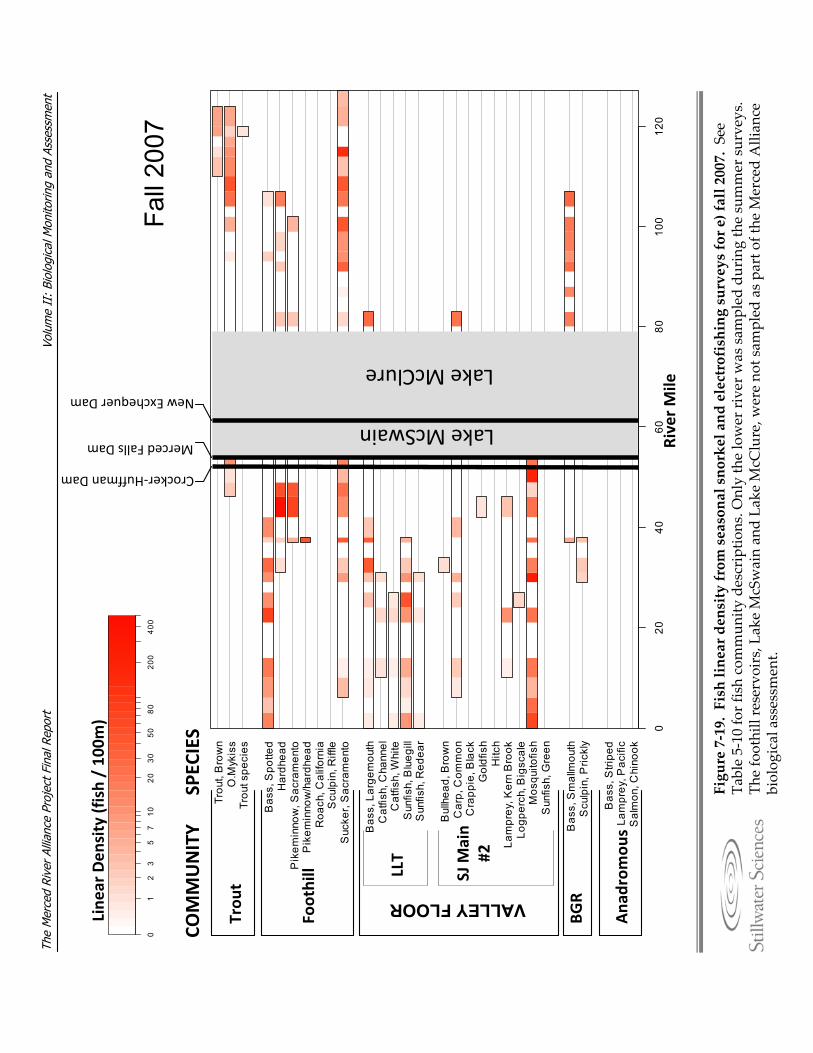
Volu
me
II:
Biol
ogic
al M
onito
ring
and
Asse
ssm
ent
The
Mer
ced
Rive
r Al
lianc
e Pr
ojec
t Fin
al R
epor
t
Figure 7‐19. Fish linear density from seasonal snorkel and electrofishingsurveys for e) fall 2007. See
Table 5‐10 fo
r fish commun
ity descriptio
ns. O
nly the lower river w
as sam
pled during the summer surveys.
The foothill reservoirs, L
ake McSwainan
d La
ke M
cClure, w
ere no
t sam
pled as pa
rt of the M
erced Allian
ce
biolog
ical assessm
ent.
020
4060
8010
012
0
Sal
mon
, Chi
nook
Lam
prey
, Pac
ific
Bas
s, S
tripe
d
Scu
lpin
, Pric
kly
Bas
s, S
mal
lmou
th
Sun
fish,
Gre
enM
osqu
itofis
hLo
gper
ch, B
igsc
ale
Lam
prey
, Ker
n B
rook
Hitc
hG
oldf
ish
Cra
ppie
, Bla
ckC
arp,
Com
mon
Bul
lhea
d, B
row
n
Sun
fish,
Red
ear
Sun
fish,
Blu
egill
Cat
fish,
Whi
teC
atfis
h, C
hann
elB
ass,
Lar
gem
outh
Suc
ker,
Sac
ram
ento
Scu
lpin
, Riff
leR
oach
, Cal
iforn
iaP
ikem
inno
w/h
ardh
ead
Pik
emin
now
, Sac
ram
ento
Har
dhea
dB
ass,
Spo
tted
Trou
t spe
cies
O.M
ykis
sTr
out,
Bro
wn
01
23
57
1020
3050
8020
040
0
Line
ar Den
sity (fish / 10
0m)
Lake McSwain
River Mile
SPEC
IES
Crocker‐Huffman Dam
Merced Falls Dam
New Exchequer Dam
Lake McClure
VALLEY FLOOR
COMMUNITY
Trou
t
Foothill LLT
SJ M
ain
#2
BGR
Ana
drom
ous
Fall
2007
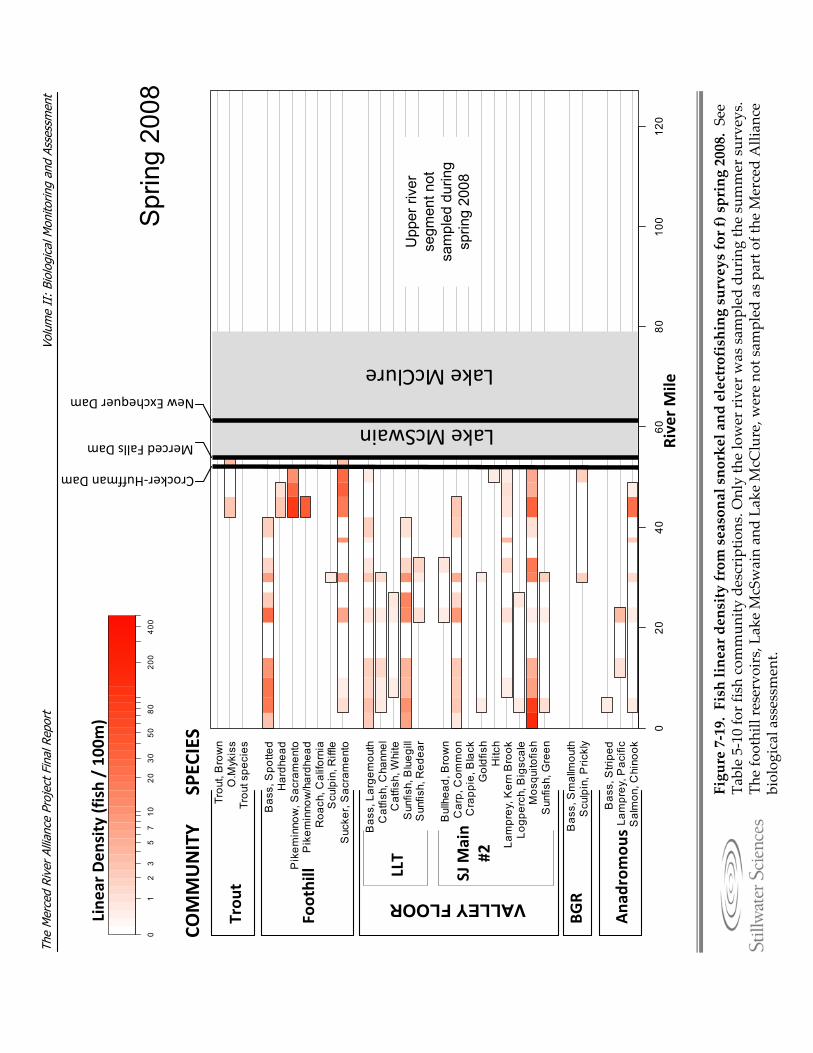
Volu
me
II:
Biol
ogic
al M
onito
ring
and
Asse
ssm
ent
The
Mer
ced
Rive
r Al
lianc
e Pr
ojec
t Fin
al R
epor
t
Figure 7‐19. Fish linear density from seasonal snorkel and electrofishingsurveys for f) spring 2008. See
Table 5‐10 fo
r fish commun
ity descriptio
ns. O
nly the lower river w
as sam
pled during the summer surveys.
The foothill reservoirs, L
ake McSwainan
d La
ke M
cClure, w
ere no
t sam
pled as pa
rt of the M
erced Allian
ce
biolog
ical assessm
ent.
Spr
ing
2008
020
4060
8010
012
0
Sal
mon
, Chi
nook
Lam
prey
, Pac
ific
Bas
s, S
tripe
d
Scu
lpin
, Pric
kly
Bas
s, S
mal
lmou
th
Sun
fish,
Gre
enM
osqu
itofis
hLo
gper
ch, B
igsc
ale
Lam
prey
, Ker
n B
rook
Hitc
hG
oldf
ish
Cra
ppie
, Bla
ckC
arp,
Com
mon
Bul
lhea
d, B
row
n
Sun
fish,
Red
ear
Sun
fish,
Blu
egill
Cat
fish,
Whi
teC
atfis
h, C
hann
elB
ass,
Lar
gem
outh
Suc
ker,
Sac
ram
ento
Scu
lpin
, Riff
leR
oach
, Cal
iforn
iaP
ikem
inno
w/h
ardh
ead
Pik
emin
now
, Sac
ram
ento
Har
dhea
dB
ass,
Spo
tted
Trou
t spe
cies
O.M
ykis
sTr
out,
Bro
wn
01
23
57
1020
3050
8020
040
0
Line
ar Den
sity (fish / 10
0m)
Lake McSwain
River Mile
SPEC
IES
Crocker‐Huffman Dam
Merced Falls Dam
New Exchequer Dam
Lake McClure
VALLEY FLOOR
COMMUNITY
Trou
t
Foothill LLT
SJ M
ain
#2
BGR
Ana
drom
ous
Upp
er ri
ver
segm
ent n
ot
sam
pled
dur
ing
sprin
g 20
08
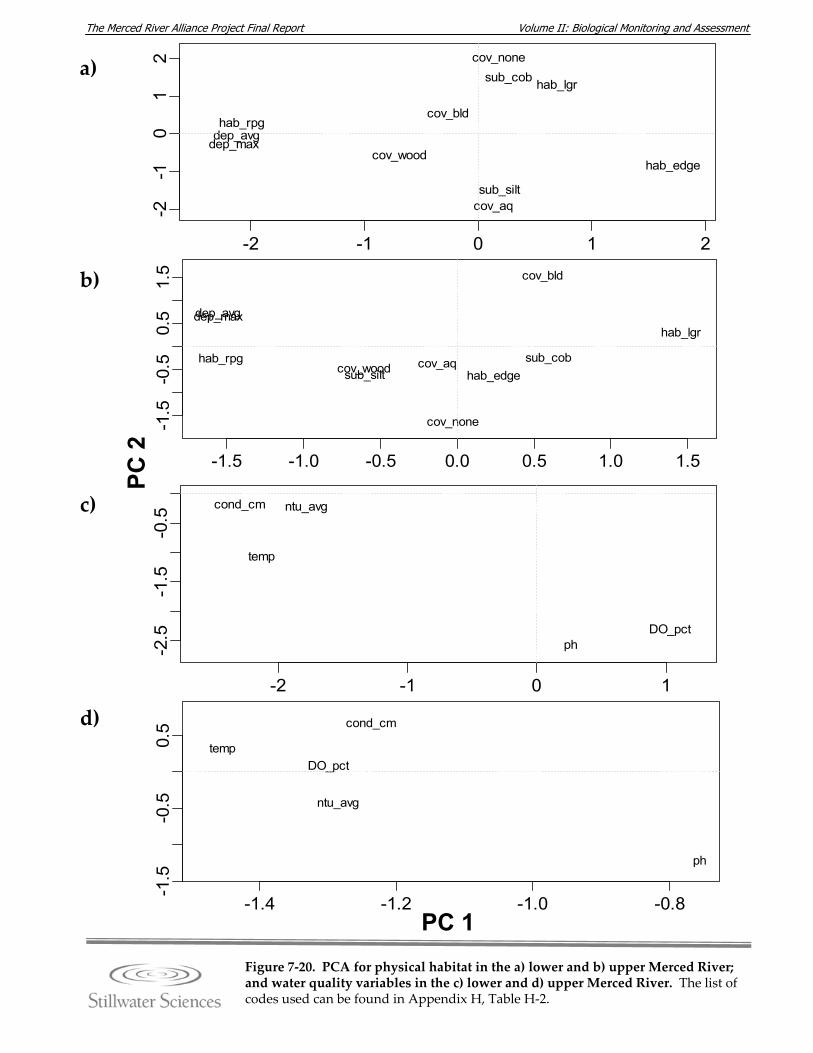
Volume II: Biological Monitoring and Assessment The Merced River Alliance Project Final Report
PC 2
-2 -1 0 1 2
-2-1
01
2
hab_lgr
hab_edge
hab_rpg
sub_cob
sub_silt
cov_bld
cov_wood
cov_aq
cov_none
dep_avgdep_max
-1.5 -1.0 -0.5 0.0 0.5 1.0 1.5
-1.5
-0.5
0.5
1.5
hab_lgr
hab_edgehab_rpg sub_cob
sub_silt
cov_bld
cov_wood cov_aq
cov_none
dep_avgdep_max
-2 -1 0 1
-2.5
-1.5
-0.5
DO_pct
cond_cm
temp
ph
ntu_avg
-1.4 -1.2 -1.0 -0.8
-1.5
-0.5
0.5
DO_pct
cond_cm
temp
ph
ntu_avg
PC 1
a)
b)
c)
d)
Figure 7‐20. PCA for physical habitat in the a) lower and b) upper Merced River; and water quality variables in the c) lower and d) upper Merced River. The list of codes used can be found in Appendix H, Table H‐2.
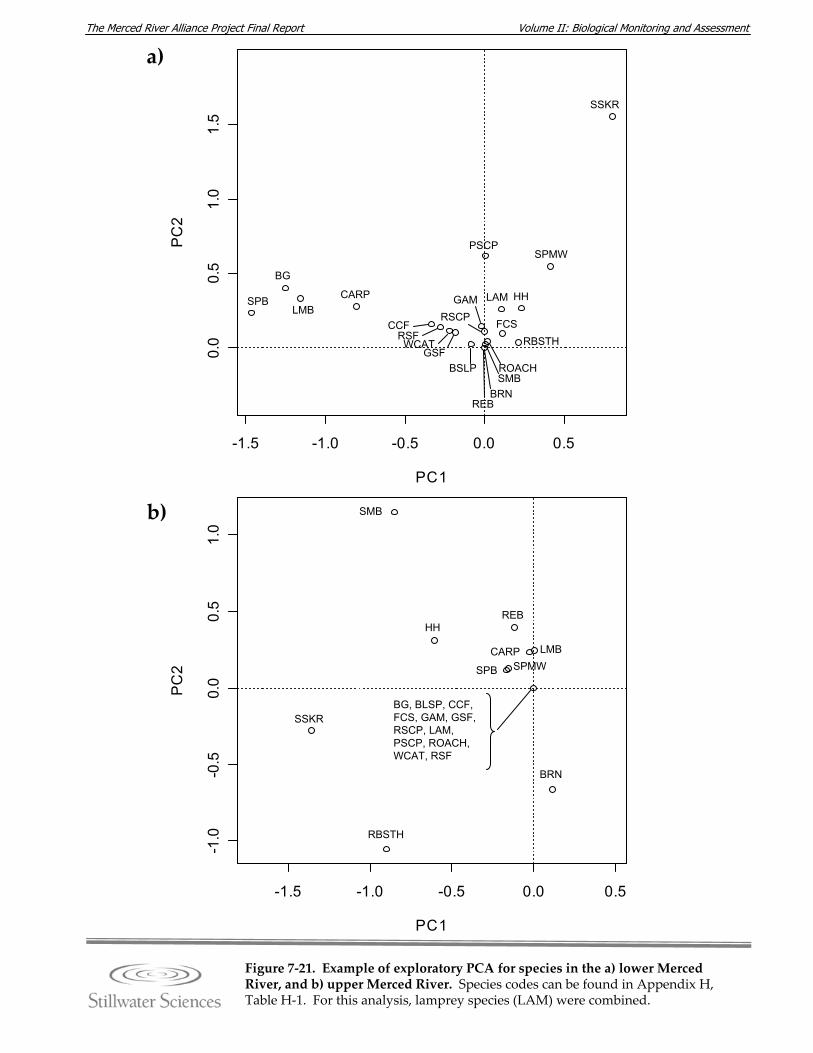
Volume II: Biological Monitoring and Assessment The Merced River Alliance Project Final Report
-1.5 -1.0 -0.5 0.0 0.5
0.0
0.5
1.0
1.5
PC1
PC
2
SPB
BG
LMBCARP
CCFRSFWCAT
GSFBSLP
GAMRSCP
BRNREB
PSCP
SMBROACH
LAM
FCS
HH
RBSTH
SPMW
SSKR
-1.5 -1.0 -0.5 0.0 0.5
-1.0
-0.5
0.0
0.5
1.0
PC1
PC
2
SSKR
RBSTH
SMB
HH
SPB SPMW
REB
CARP LMB
BG, BLSP, CCF,FCS, GAM, GSF,RSCP, LAM,PSCP, ROACH,WCAT, RSF
BRN
a)
b)
Figure 7‐21. Example of exploratory PCA for species in the a) lower Merced River, and b) upper Merced River. Species codes can be found in Appendix H, Table H‐1. For this analysis, lamprey species (LAM) were combined.
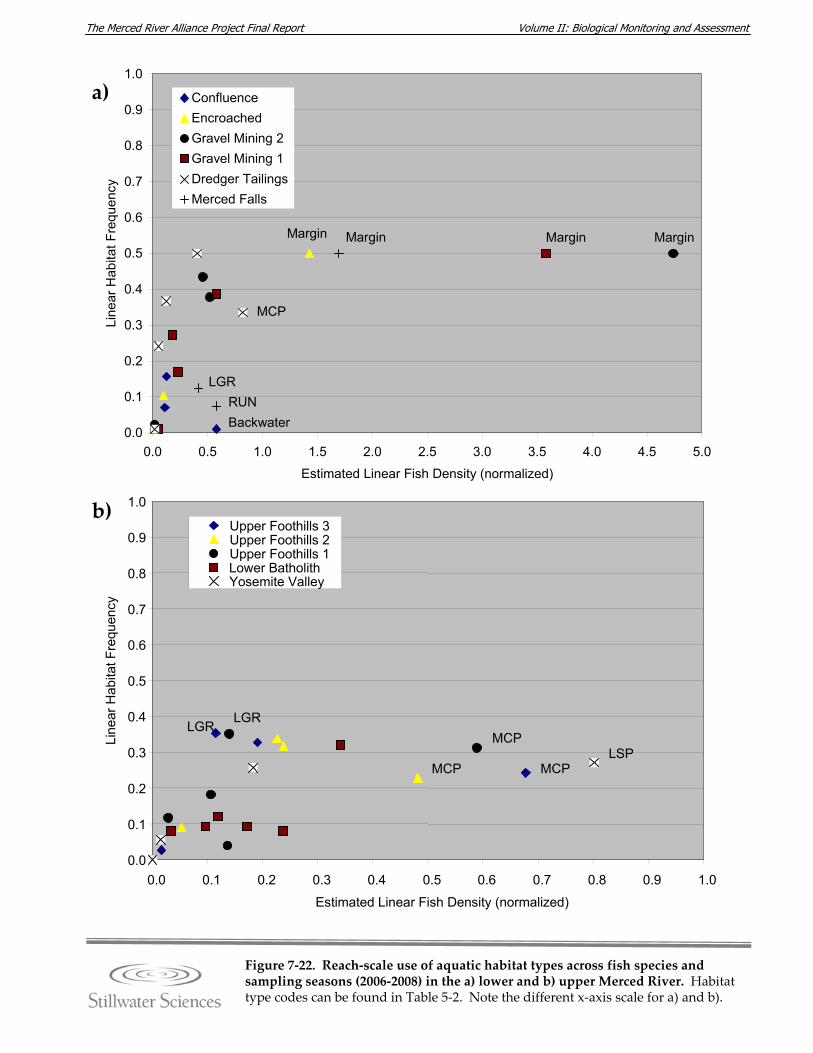
Volume II: Biological Monitoring and Assessment The Merced River Alliance Project Final Report
0.0
0.1
0.2
0.3
0.4
0.5
0.6
0.7
0.8
0.9
1.0
0.0 0.5 1.0 1.5 2.0 2.5 3.0 3.5 4.0 4.5 5.0
Estimated Linear Fish Density (normalized)
Line
ar H
abita
t Fre
quen
cyConfluenceEncroachedGravel Mining 2Gravel Mining 1Dredger TailingsMerced Falls
MCP
Backwater
LGRRUN
Margin MarginMargin Margin
a)
b)
Figure 7‐22. Reach‐scale use of aquatic habitat types across fish species and sampling seasons (2006‐2008) in the a) lower and b) upper Merced River. Habitat type codes can be found in Table 5‐2. Note the different x‐axis scale for a) and b).
0.0
0.1
0.2
0.3
0.4
0.5
0.6
0.7
0.8
0.9
1.0
0.0 0.1 0.2 0.3 0.4 0.5 0.6 0.7 0.8 0.9 1.0
Estimated Linear Fish Density (normalized)
Line
ar H
abita
t Fre
quen
cy
Upper Foothills 3Upper Foothills 2Upper Foothills 1Lower BatholithYosemite Valley
MCP
MCP
MCPLSP
LGRLGR
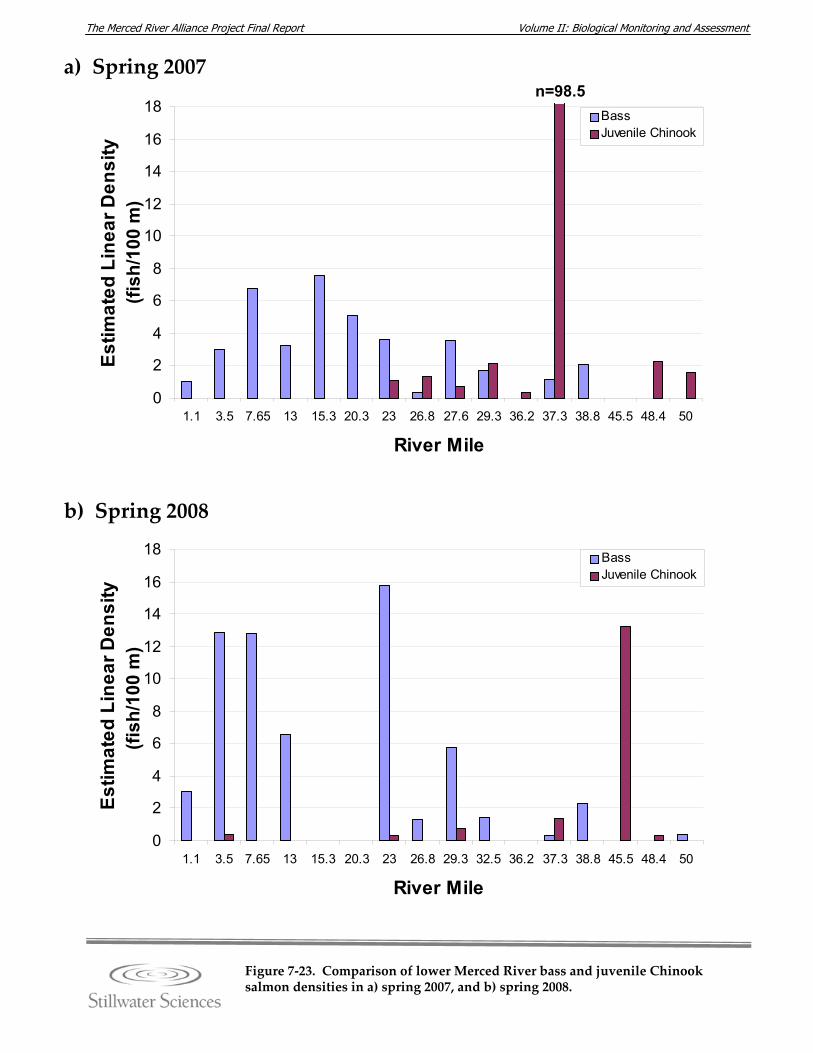
Volume II: Biological Monitoring and Assessment The Merced River Alliance Project Final Report
Figure 7‐23. Comparison of lower Merced River bass and juvenile Chinook salmon densities in a) spring 2007, and b) spring 2008.
a) Spring 2007
b) Spring 2008
0
2
4
6
8
10
12
14
16
18
1.1 3.5 7.65 13 15.3 20.3 23 26.8 29.3 32.5 36.2 37.3 38.8 45.5 48.4 50
River Mile
Estim
ated
Lin
ear D
ensi
ty
(fish
/100
m)
BassJuvenile Chinook
(fish
/100
m)
0
2
4
6
8
10
12
14
16
18
1.1 3.5 7.65 13 15.3 20.3 23 26.8 27.6 29.3 36.2 37.3 38.8 45.5 48.4 50
River Mile
Estim
ated
Lin
ear D
ensi
ty
(fish
/100
m)
BassJuvenile Chinook
n=98.5
(fish
/100
m)
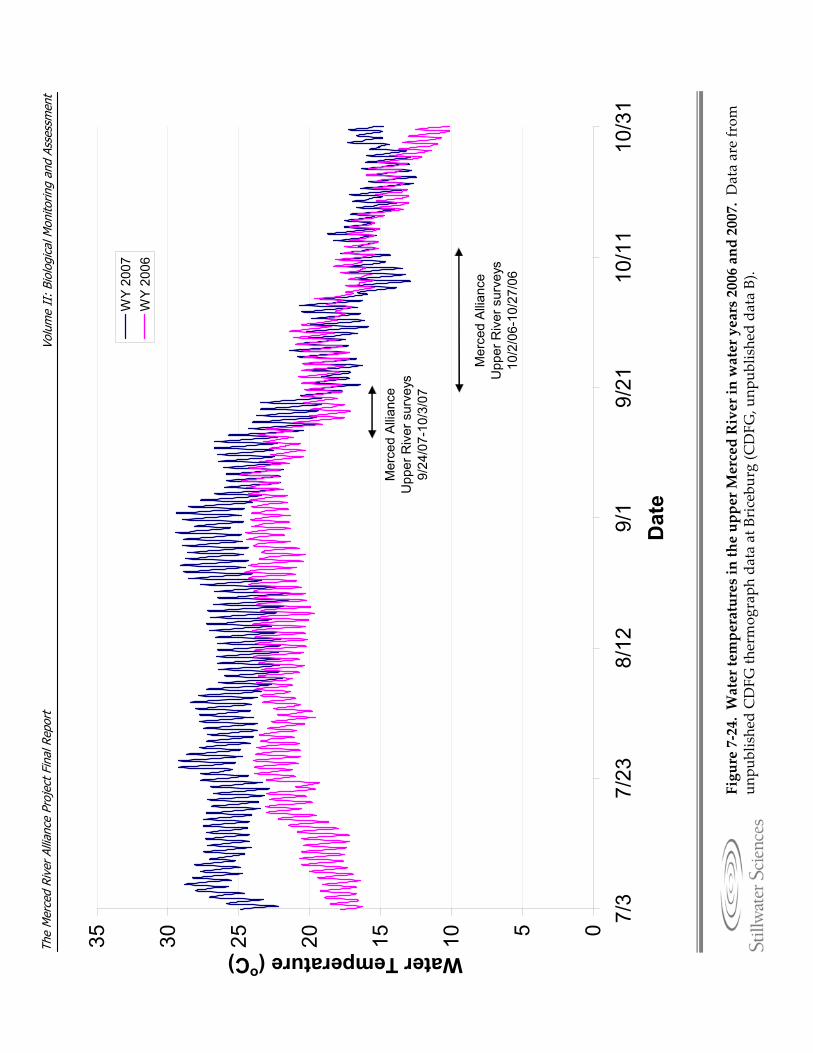
Volu
me
II:
Biol
ogic
al M
onito
ring
and
Asse
ssm
ent
The
Mer
ced
Rive
r Al
lianc
e Pr
ojec
t Fin
al R
epor
t
Figure 7‐24. Water temperatures in the upper M
erced River in water years2006 and 2007.
Data are from
unpu
blished CDFG th
ermog
raph data at Bricebu
rg(CDFG
, unp
ublished da
ta B).
05101520253035
7/3
7/23
8/12
9/1
9/21
10/1
110
/31
Dat
e
Water Temperature (oC)
WY
2007
WY
2006
Mer
ced
Allia
nce
Upp
er R
iver
sur
veys
9/24
/07-
10/3
/07
Mer
ced
Allia
nce
Upp
er R
iver
sur
veys
10/2
/06-
10/2
7/06
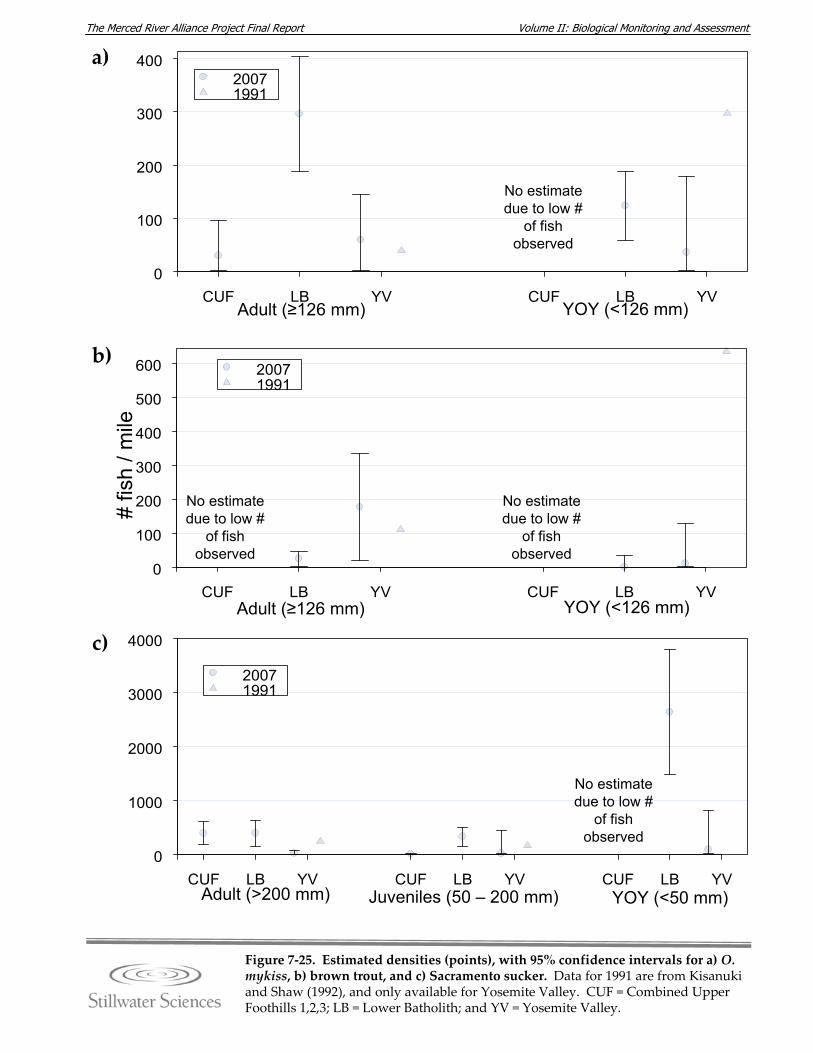
Volume II: Biological Monitoring and Assessment The Merced River Alliance Project Final Report
20071991
CUF LB YV CUF LB YV0
100
200
300
400
500
600
20071991
CUF LB YV CUF LB YV0
100
200
300
400
Adult (≥126 mm) YOY (<126 mm)
No estimate due to low #
of fish observed
Adult (≥126 mm) YOY (<126 mm)
No estimate due to low #
of fish observed
No estimate due to low #
of fish observed
# fis
h / m
ile
a)
b)
c)
Figure 7‐25. Estimated densities (points), with 95% confidence intervals for a) O. mykiss, b) brown trout, and c) Sacramento sucker. Data for 1991 are from Kisanukiand Shaw (1992), and only available for Yosemite Valley. CUF = Combined Upper Foothills 1,2,3; LB = Lower Batholith; and YV = Yosemite Valley.
20071991
CUF LB YV CUF LB YV CUF LB YV0
1000
2000
3000
4000
Adult (>200 mm) Juveniles (50 – 200 mm) YOY (<50 mm)
No estimate due to low #
of fish observed
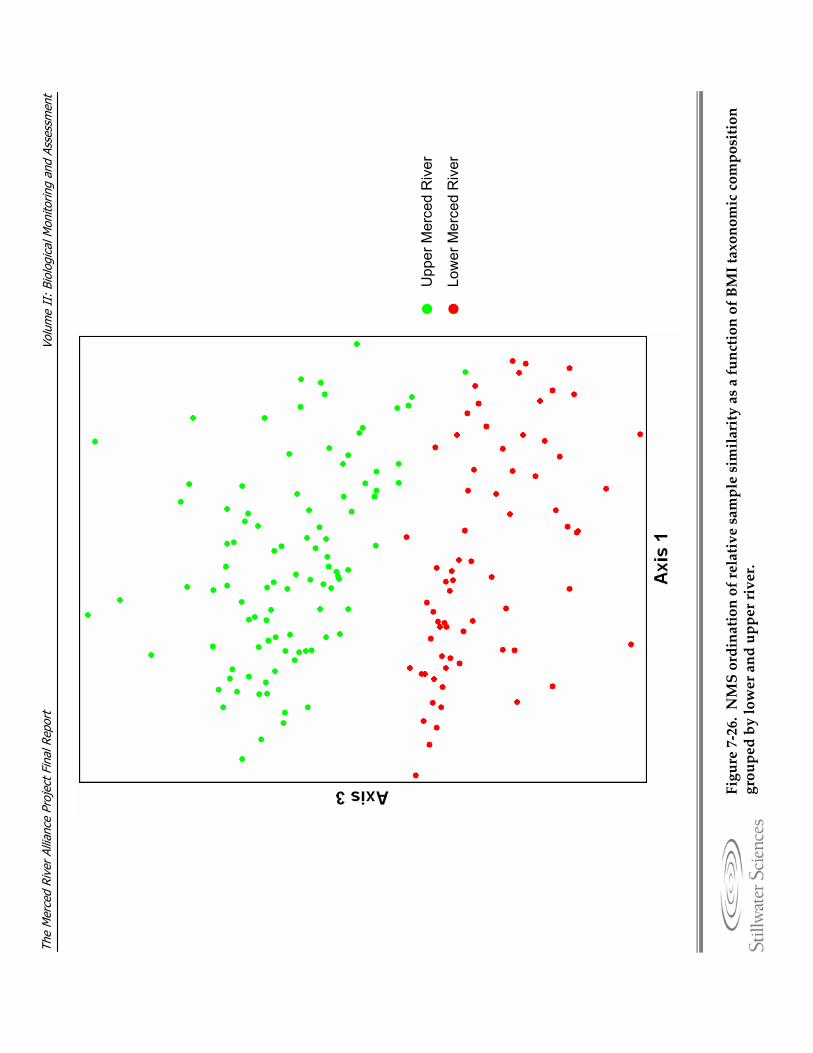
Volu
me
II:
Biol
ogic
al M
onito
ring
and
Asse
ssm
ent
The
Mer
ced
Rive
r Al
lianc
e Pr
ojec
t Fin
al R
epor
t
Figure 7‐26. NMS ordination of relative sample similarity as a function of BMI taxonomic composition
grouped by lower and upper river.
Upp
er M
erce
d R
iver
Low
er M
erce
d R
iver
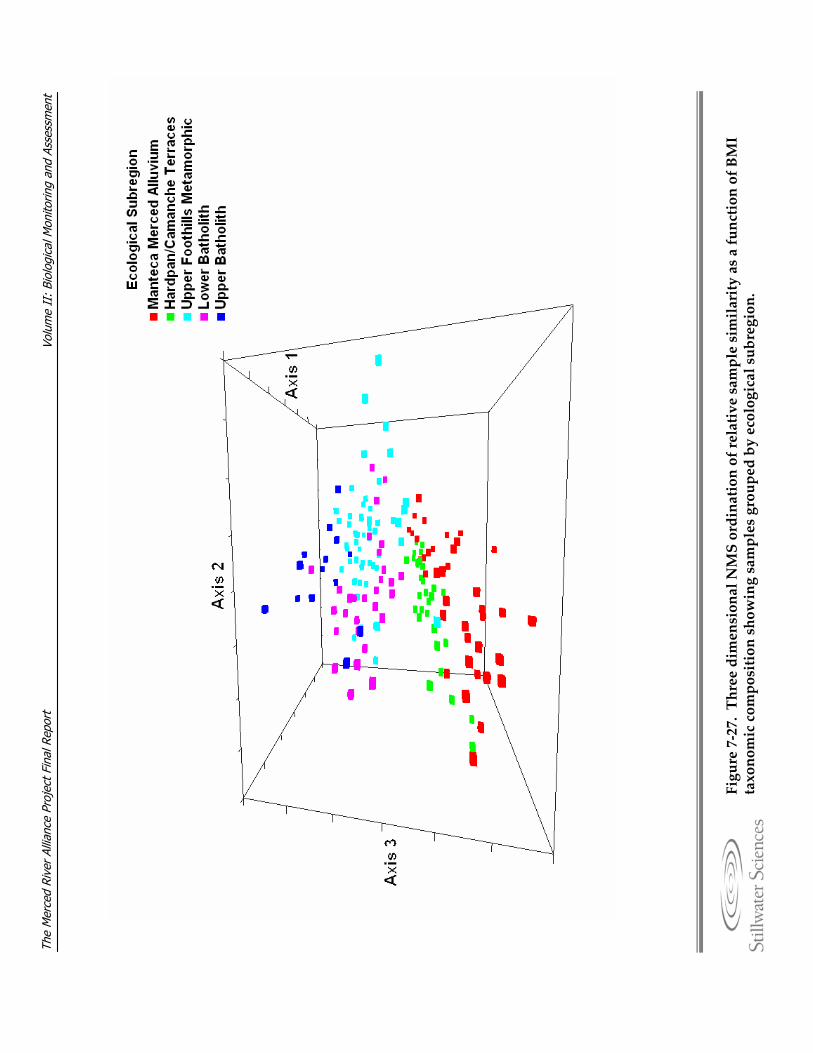
Volu
me
II:
Biol
ogic
al M
onito
ring
and
Asse
ssm
ent
The
Mer
ced
Rive
r Al
lianc
e Pr
ojec
t Fin
al R
epor
t
Figure 7‐27. Three dimensional NMS ordination of relative sample similarity as a function of BMI
taxonomic composition showing samples grouped by ecological subregion.
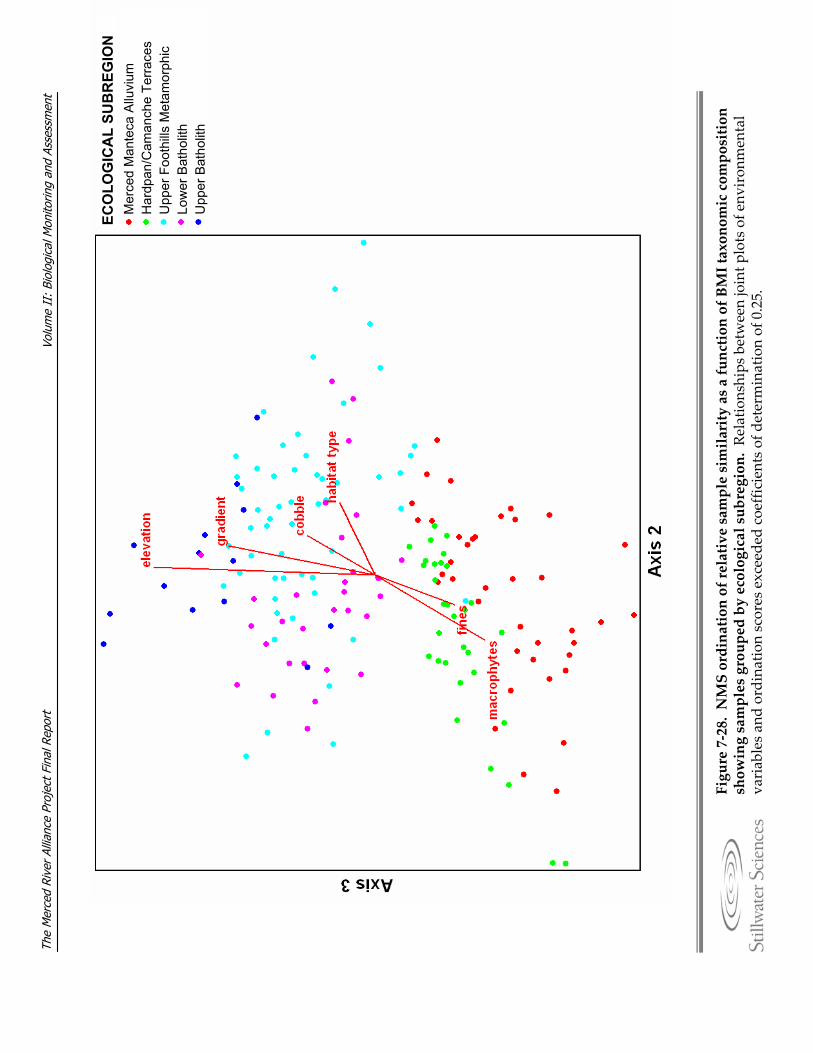
Volu
me
II:
Biol
ogic
al M
onito
ring
and
Asse
ssm
ent
The
Mer
ced
Rive
r Al
lianc
e Pr
ojec
t Fin
al R
epor
t
Figure 7‐28. NMS ordination of relative sample similarity as a function of BMI taxonomic composition
showing samples grouped by ecological subregion. Re
latio
nships between joint p
lots of env
iron
mental
variables an
d ordina
tion scores exceede
d coeffic
ients of determination of 0.25.
ECO
LOG
ICA
L SU
BR
EGIO
NM
erce
d M
ante
ca A
lluvi
umH
ardp
an/C
aman
che
Terra
ces
Upp
er F
ooth
ills
Met
amor
phic
Low
er B
atho
lith
Upp
er B
atho
lith
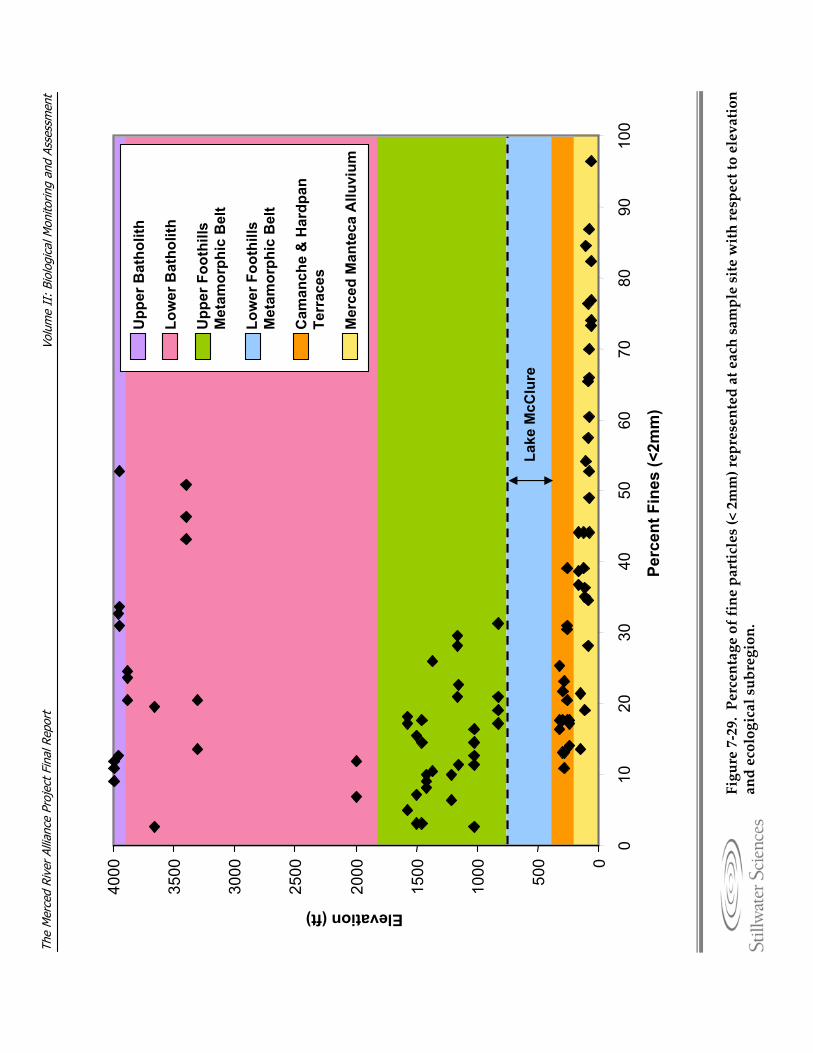
Volu
me
II:
Biol
ogic
al M
onito
ring
and
Asse
ssm
ent
The
Mer
ced
Rive
r Al
lianc
e Pr
ojec
t Fin
al R
epor
t
Figure 7‐29. Percentage of fine particles (< 2mm) represented at each sample site with respect to elevation
and ecological subregion.
Mer
ced
Man
teca
Allu
vium
Cam
anch
e&
Har
dpan
Te
rrac
es
Low
er F
ooth
ills
Met
amor
phic
Bel
t
Upp
er F
ooth
ills
Met
amor
phic
Bel
t
Low
er B
atho
lith
Upp
er B
atho
lith
Perc
ent F
ines
(<2m
m)
Lake
McC
lure
0
500
1000
1500
2000
2500
3000
3500
4000
010
2030
4050
6070
8090
100
Elevation (ft)
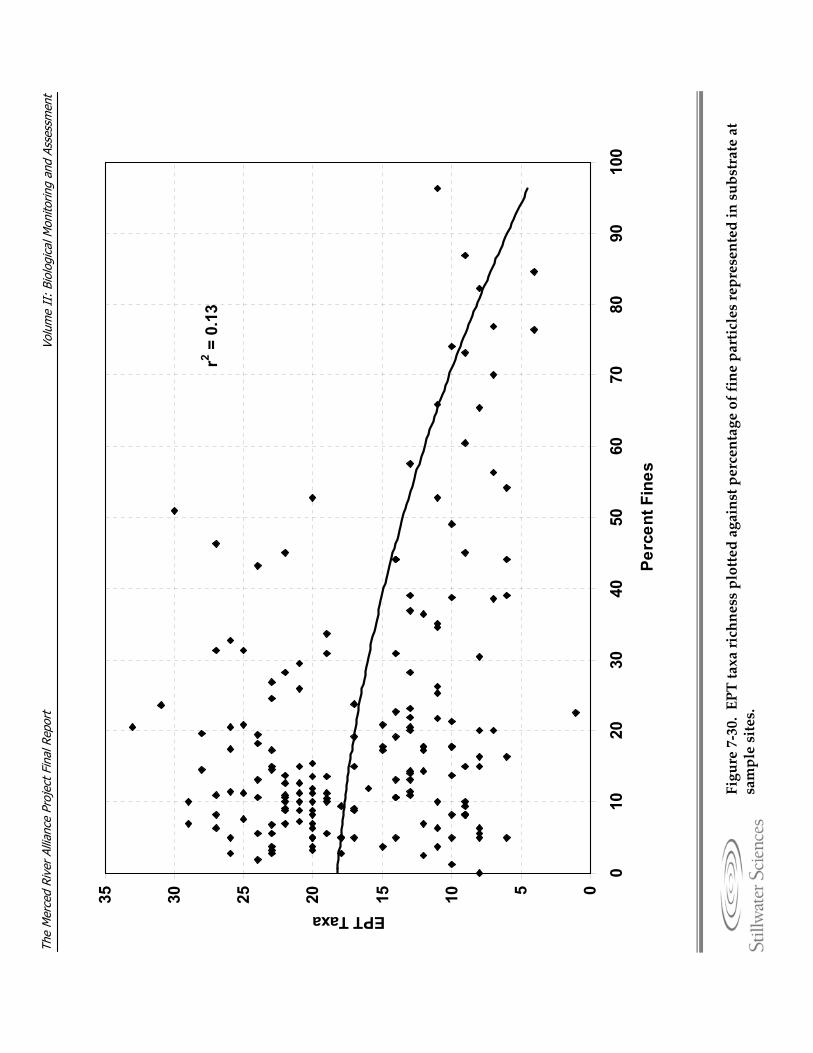
Volu
me
II:
Biol
ogic
al M
onito
ring
and
Asse
ssm
ent
The
Mer
ced
Rive
r Al
lianc
e Pr
ojec
t Fin
al R
epor
t
r2 = 0
.13
05101520253035
010
2030
4050
6070
8090
100
Perc
ent F
ines
EPT Taxa
Figure 7‐30. EPT taxa richness plotted against percentage of fine particles represented in substrate at
sample sites.
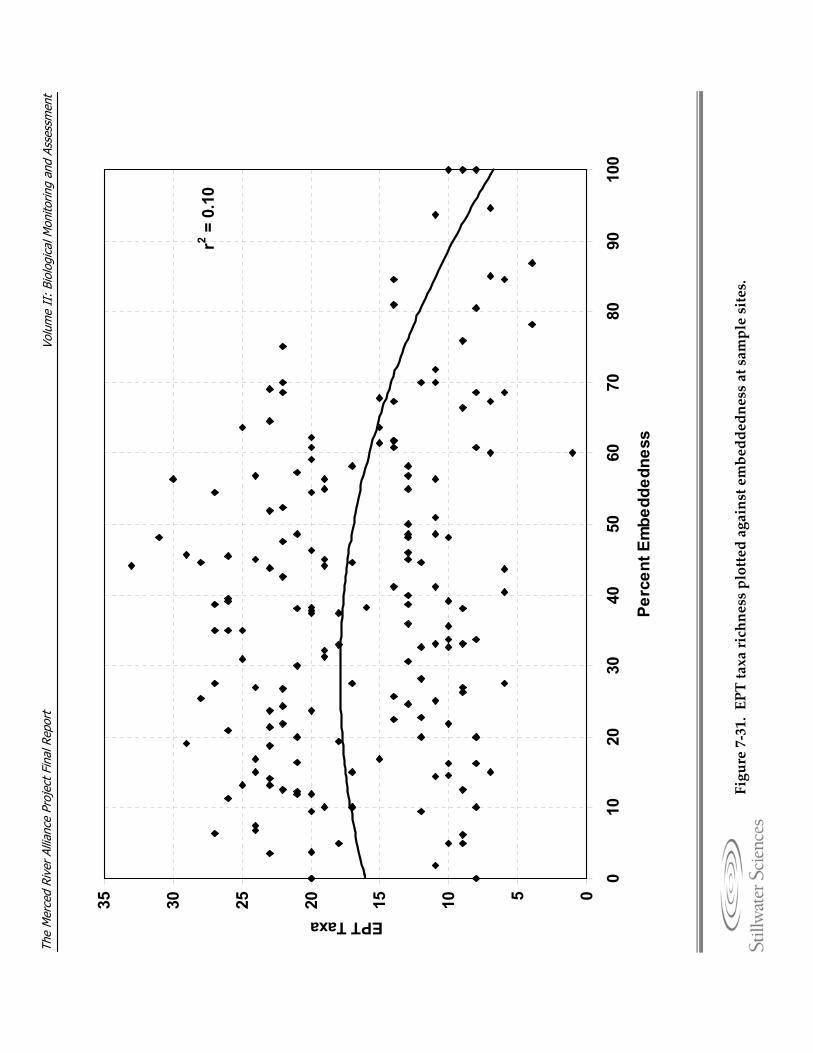
Volu
me
II:
Biol
ogic
al M
onito
ring
and
Asse
ssm
ent
The
Mer
ced
Rive
r Al
lianc
e Pr
ojec
t Fin
al R
epor
t
r2 = 0
.10
05101520253035
010
2030
4050
6070
8090
100
Perc
ent E
mbe
dded
ness
EPT Taxa
Figure 7‐31. EPT taxa richness plotted against embeddednessat sample sites.
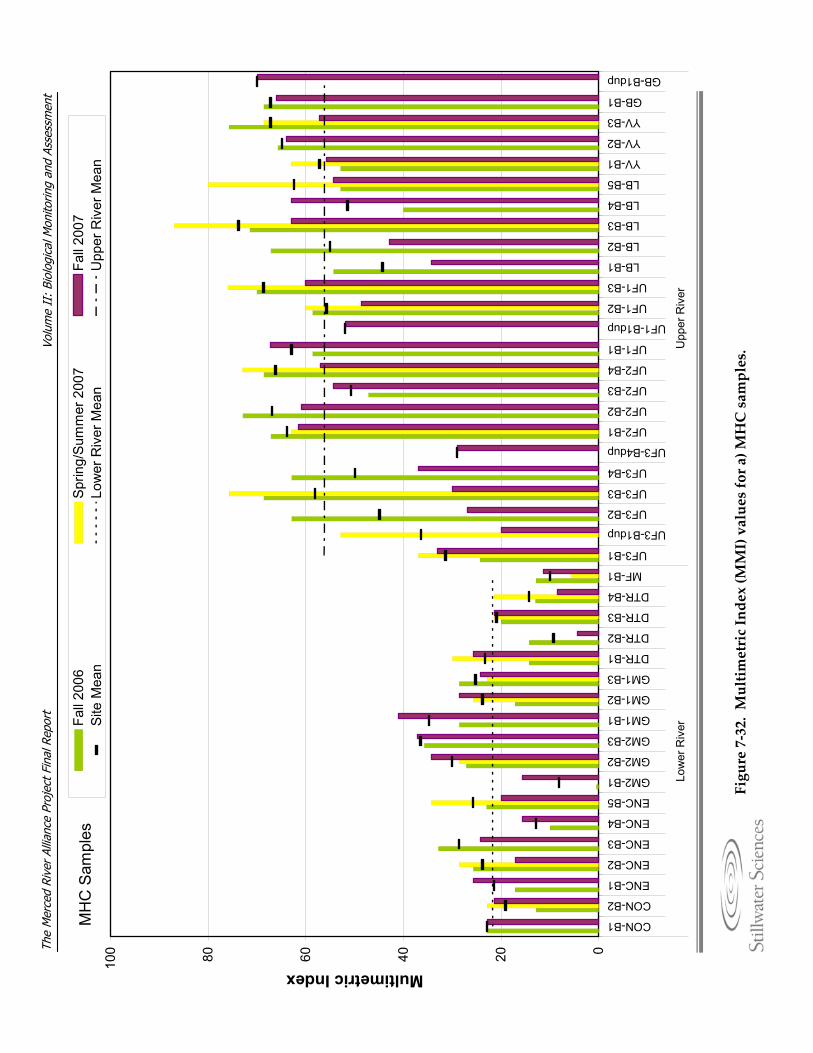
Volu
me
II:
Biol
ogic
al M
onito
ring
and
Asse
ssm
ent
The
Mer
ced
Rive
r Al
lianc
e Pr
ojec
t Fin
al R
epor
t
Figure 7‐32. Multim
etricIndex (MMI) values for a) M
HC samples.
020406080100
CON-B1
CON-B2
ENC-B1
ENC-B2
ENC-B3
ENC-B4
ENC-B5
GM2-B1
GM2-B2
GM2-B3
GM1-B1
GM1-B2
GM1-B3
DTR-B1
DTR-B2
DTR-B3
DTR-B4
MF-B1
UF3-B1
UF3-B1dup
UF3-B2
UF3-B3
UF3-B4
UF3-B4dup
UF2-B1
UF2-B2
UF2-B3
UF2-B4
UF1-B1
UF1-B1dup
UF1-B2
UF1-B3
LB-B1
LB-B2
LB-B3
LB-B4
LB-B5
YV-B1
YV-B2
YV-B3
GB-B1
GB-B1dup
Low
er R
iver
Upp
er R
iver
Multimetric IndexFa
ll 20
06S
prin
g/S
umm
er 2
007
Fall
2007
Site
Mea
nLo
wer
Riv
er M
ean
Upp
er R
iver
Mea
nM
HC
Sam
ples

Volu
me
II:
Biol
ogic
al M
onito
ring
and
Asse
ssm
ent
The
Mer
ced
Rive
r Al
lianc
e Pr
ojec
t Fin
al R
epor
t
Figure 7‐32. Multim
etricIndex (MMI) values for b) TRC samples.
020406080100
ENC-B5
GM2-B2
GM2-B3
GM1-B1
GM1-B2
GM1-B3
DTR-B1
DTR-B2
DTR-B3
DTR-B4
MF-B1
UF3-B1
UF3-B1dup
UF3-B2
UF3-B3
UF3-B4
UF3-B4dup
UF2-B1
UF2-B2
UF2-B3
UF2-B4
UF1-B1
UF1-B1dup
UF1-B2
UF1-B3
LB-B1
LB-B2
LB-B3
LB-B4
LB-B5
YV-B1
YV-B2
YV-B3
GB-B1
GB-B1dup
Low
er R
iver
Upp
er R
iver
Multimetric IndexFa
ll 20
06Sp
ring/
Sum
mer
200
7Fa
ll 20
07Si
te M
ean
Low
er R
iver
Mea
nU
pper
Riv
er M
ean
TRC
Sam
ples
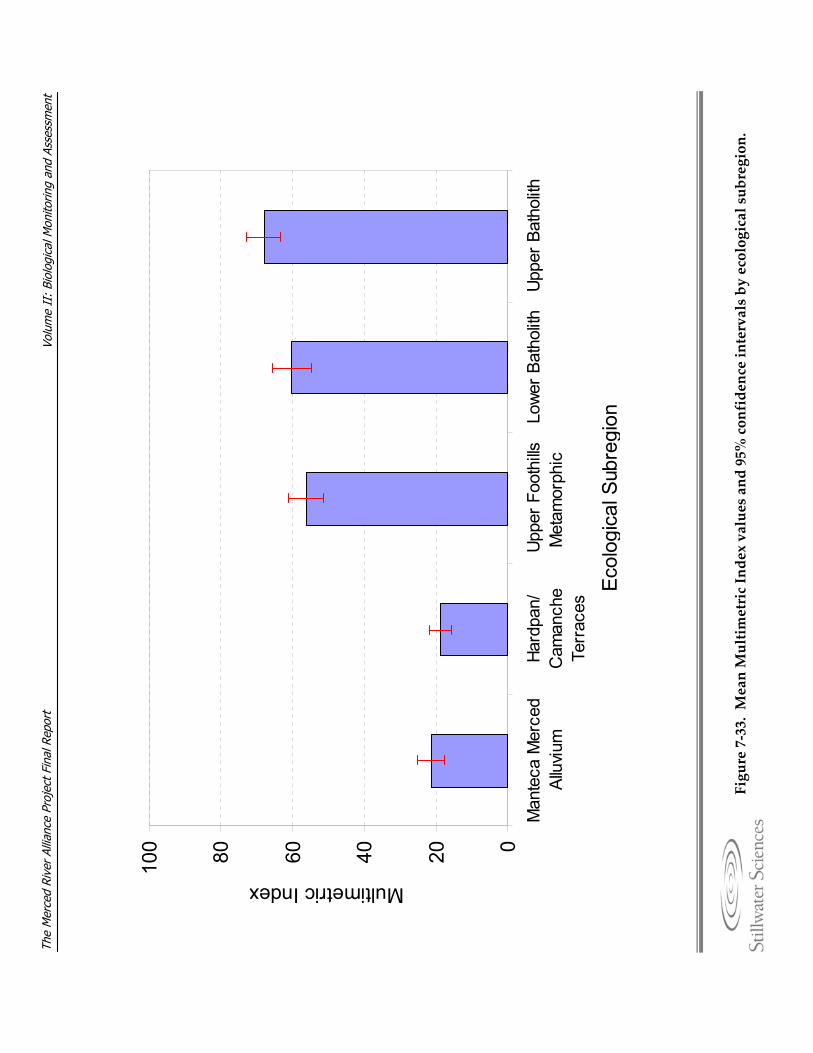
Volu
me
II:
Biol
ogic
al M
onito
ring
and
Asse
ssm
ent
The
Mer
ced
Rive
r Al
lianc
e Pr
ojec
t Fin
al R
epor
t
Figure 7‐33. Mean Multim
etricIndex values and 95% confidence intervals by ecological subregion.
020406080100
Man
teca
Mer
ced
Allu
vium
Hard
pan/
Cam
anch
eTe
rrac
es
Uppe
r Foo
thills
Met
amor
phic
Lo
wer B
atho
lithUp
per B
atho
lith
Ecol
ogic
al S
ubre
gion
Multimetric Index
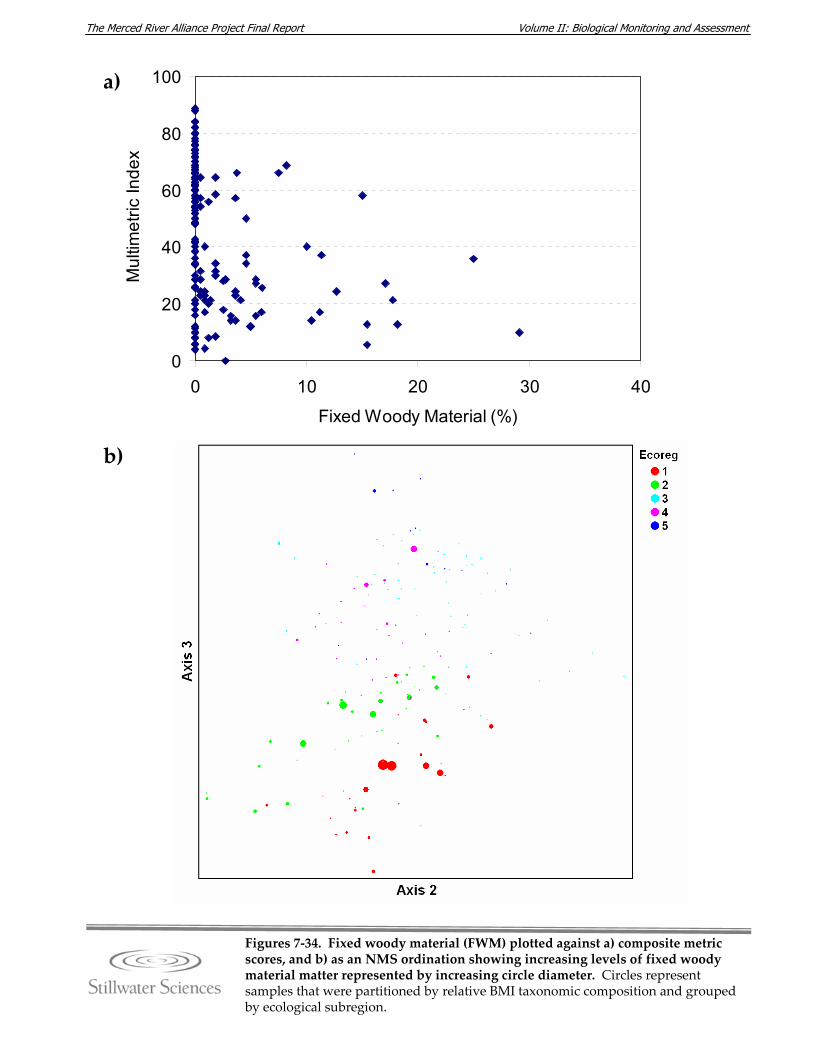
Volume II: Biological Monitoring and Assessment The Merced River Alliance Project Final Report
0
20
40
60
80
100
0 10 20 30 40
Fixed Woody Material (%)
Mul
timet
ric In
dex
Figures 7‐34. Fixed woody material (FWM) plotted against a) composite metric scores, and b) as an NMS ordination showing increasing levels of fixed woody material matter represented by increasing circle diameter. Circles represent samples that were partitioned by relative BMI taxonomic composition and grouped by ecological subregion.
a)
b)
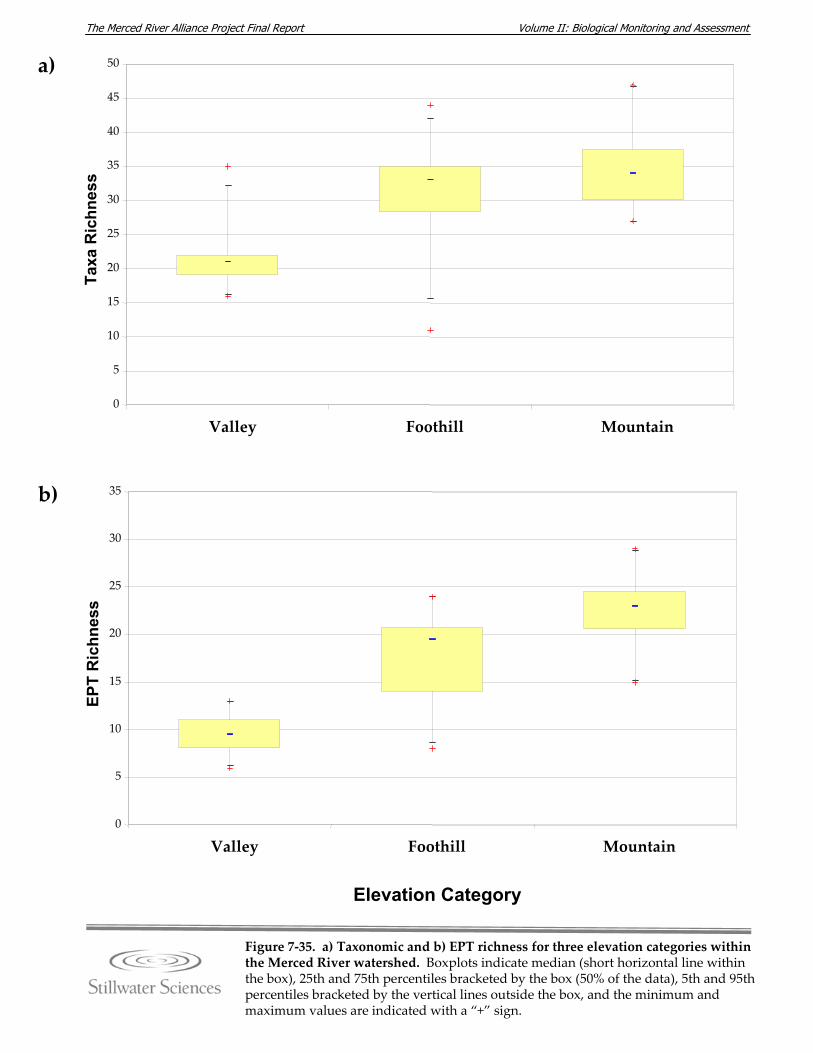
Volume II: Biological Monitoring and Assessment The Merced River Alliance Project Final Report
Figure 7‐35. a) Taxonomic and b) EPT richness for three elevation categories within the Merced River watershed. Boxplots indicate median (short horizontal line within the box), 25th and 75th percentiles bracketed by the box (50% of the data), 5th and 95th percentiles bracketed by the vertical lines outside the box, and the minimum and maximum values are indicated with a “+” sign.
0
5
10
15
20
25
30
35
40
45
50
Valley Foothill Mountain
Taxa
Ric
hnes
s
0
5
10
15
20
25
30
35
Valley Foothill Mountain
Elevation Category
EPT
Ric
hnes
sa)
b)
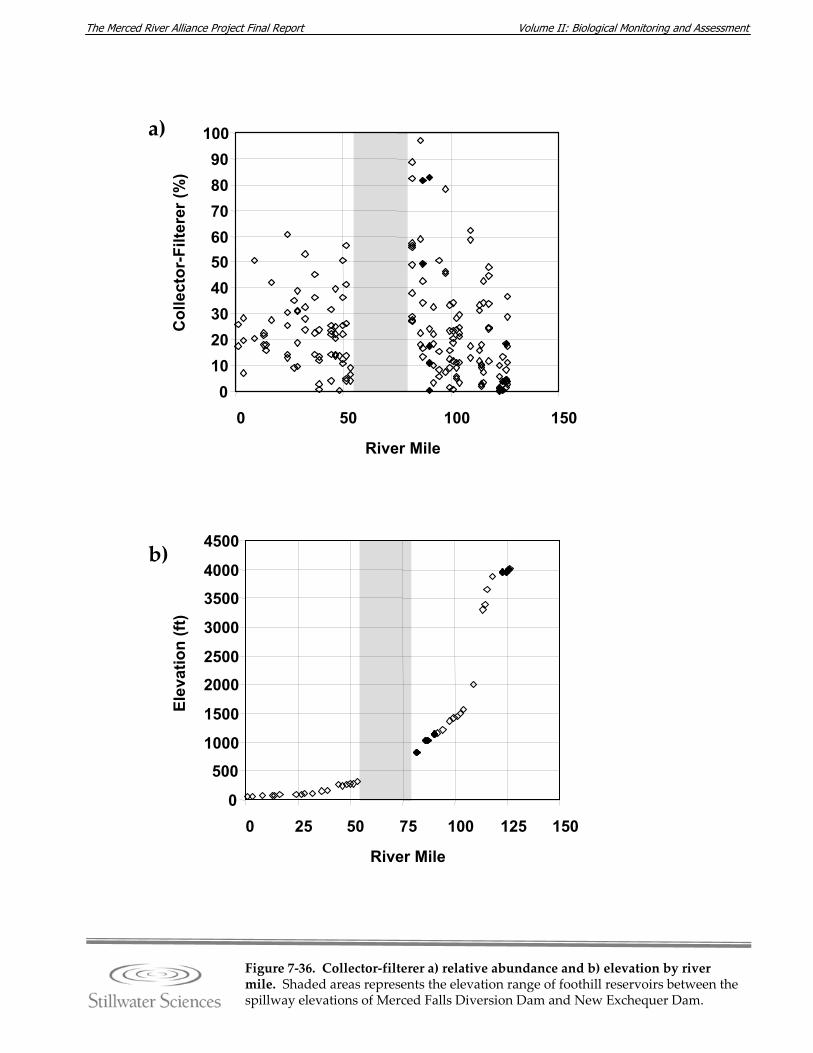
Volume II: Biological Monitoring and Assessment The Merced River Alliance Project Final Report
Figure 7‐36. Collector‐filterer a) relative abundance and b) elevation by river mile. Shaded areas represents the elevation range of foothill reservoirs between the spillway elevations of Merced Falls Diversion Dam and New Exchequer Dam.
a)
b)
0102030405060708090
100
0 50 100 150
River Mile
Col
lect
or-F
ilter
er (%
)
0
500
1000
1500
2000
2500
3000
3500
4000
4500
0 25 50 75 100 125 150
River Mile
Elev
atio
n (ft
)
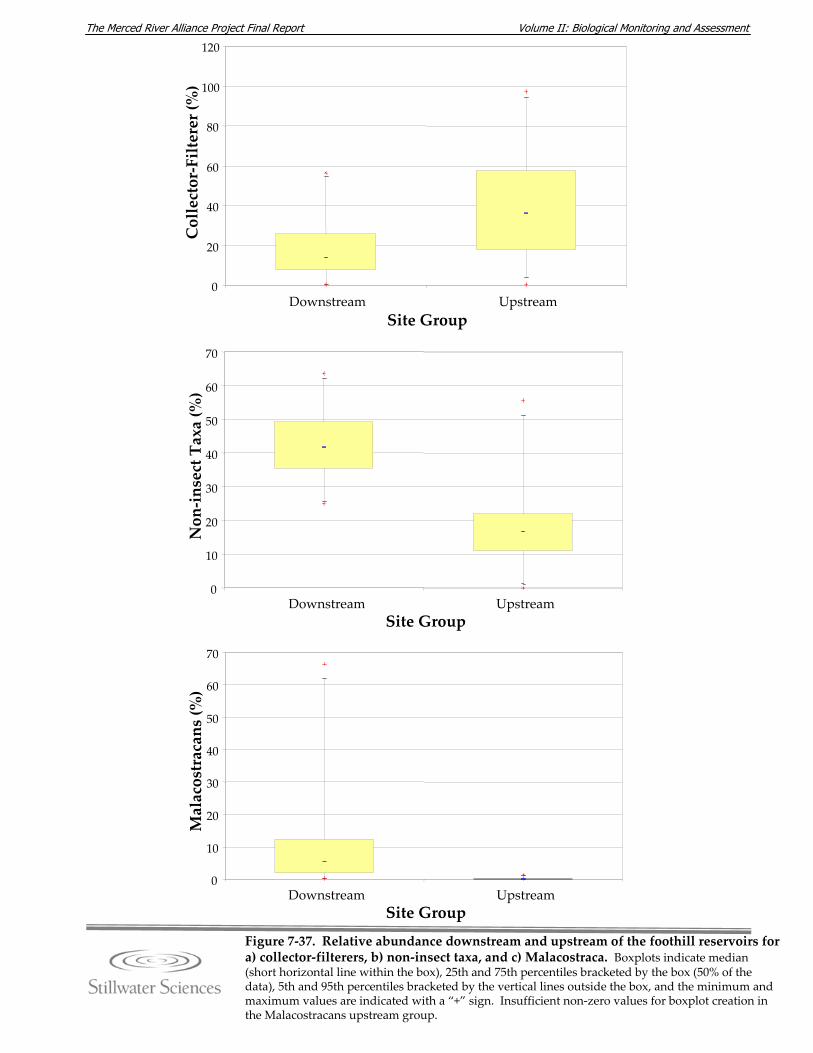
Volume II: Biological Monitoring and Assessment The Merced River Alliance Project Final Report
Figure 7‐37. Relative abundance downstream and upstream of the foothill reservoirs for a) collector‐filterers, b) non‐insect taxa, and c) Malacostraca. Boxplots indicate median (short horizontal line within the box), 25th and 75th percentiles bracketed by the box (50% of the data), 5th and 95th percentiles bracketed by the vertical lines outside the box, and the minimum and maximum values are indicated with a “+” sign. Insufficient non‐zero values for boxplot creation in the Malacostracans upstream group.
0
20
40
60
80
100
120
Downstream UpstreamSite Group
Collector‐Filterer (%)
0
10
20
30
40
50
60
70
Downstream UpstreamSite Group
Non‐insect Taxa (%)
0
10
20
30
40
50
60
70
Downstream UpstreamSite Group
Malacostracans(%)
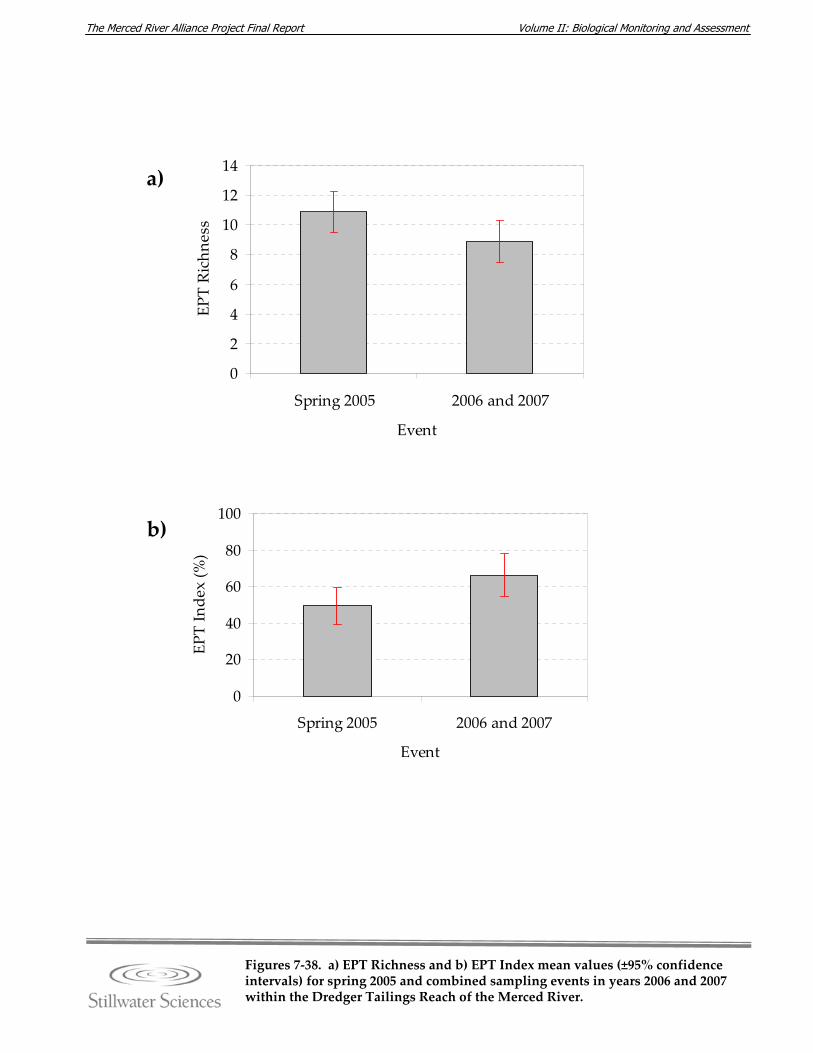
Volume II: Biological Monitoring and Assessment The Merced River Alliance Project Final Report
Figures 7‐38. a) EPT Richness and b) EPT Index mean values (±95% confidence intervals) for spring 2005 and combined sampling events in years 2006 and 2007 within the Dredger Tailings Reach of the Merced River.
0
2
4
6
8
10
12
14
Spring 2005 2006 and 2007
Event
EPT Richne
ss
0
20
40
60
80
100
Spring 2005 2006 and 2007
Event
EPT Inde
x (%
)a)
b)
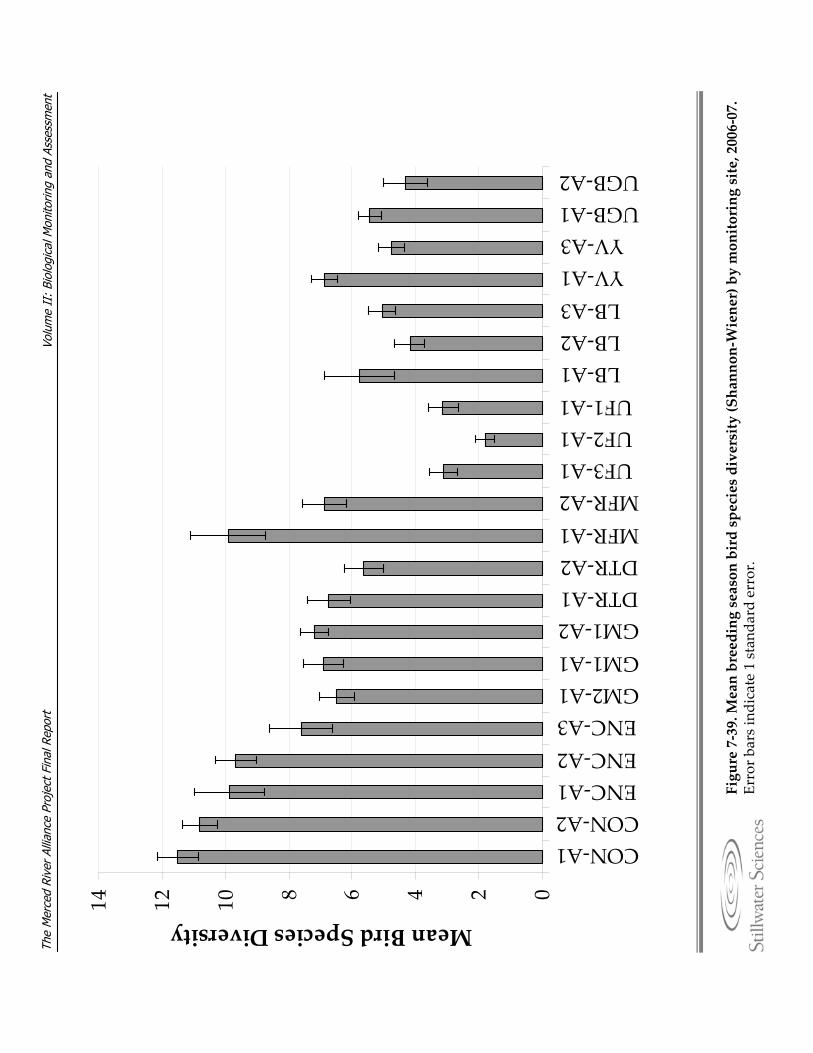
Volu
me
II:
Biol
ogic
al M
onito
ring
and
Asse
ssm
ent
The
Mer
ced
Rive
r Al
lianc
e Pr
ojec
t Fin
al R
epor
t
02468101214
CON‐A1CON‐A2ENC‐A1ENC‐A2ENC‐A3GM2‐A1GM1‐A1GM1‐A2DTR‐A1DTR‐A2MFR‐A1MFR‐A2UF3‐A1UF2‐A1UF1‐A1LB‐A1LB‐A2LB‐A3YV‐A1YV‐A3
UGB‐A1UGB‐A2
Mean Bird Species Diversity
Figure 7‐39. Mean breeding season bird species diversity (Shannon‐Wiener) by monitoring site, 2006‐07.
Error b
ars indicate 1 stand
ard error.
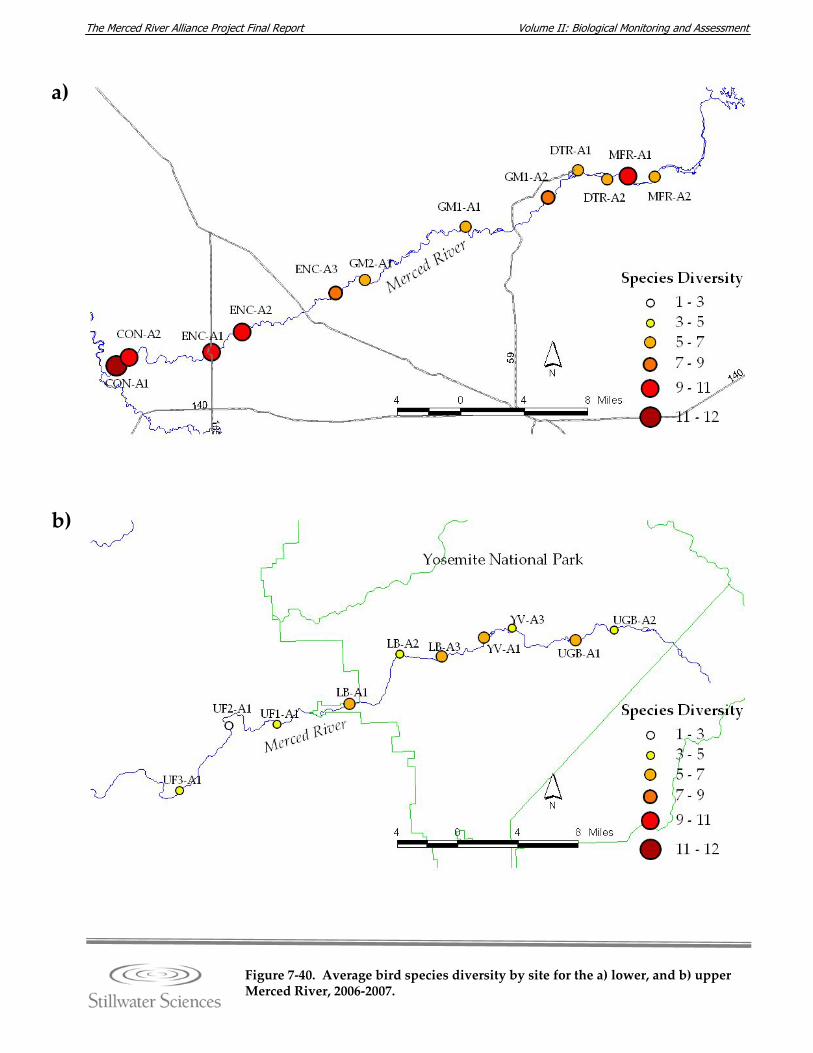
Volume II: Biological Monitoring and Assessment The Merced River Alliance Project Final Report
Figure 7‐40. Average bird species diversity by site for the a) lower, and b) upper Merced River, 2006‐2007.
a)
b)
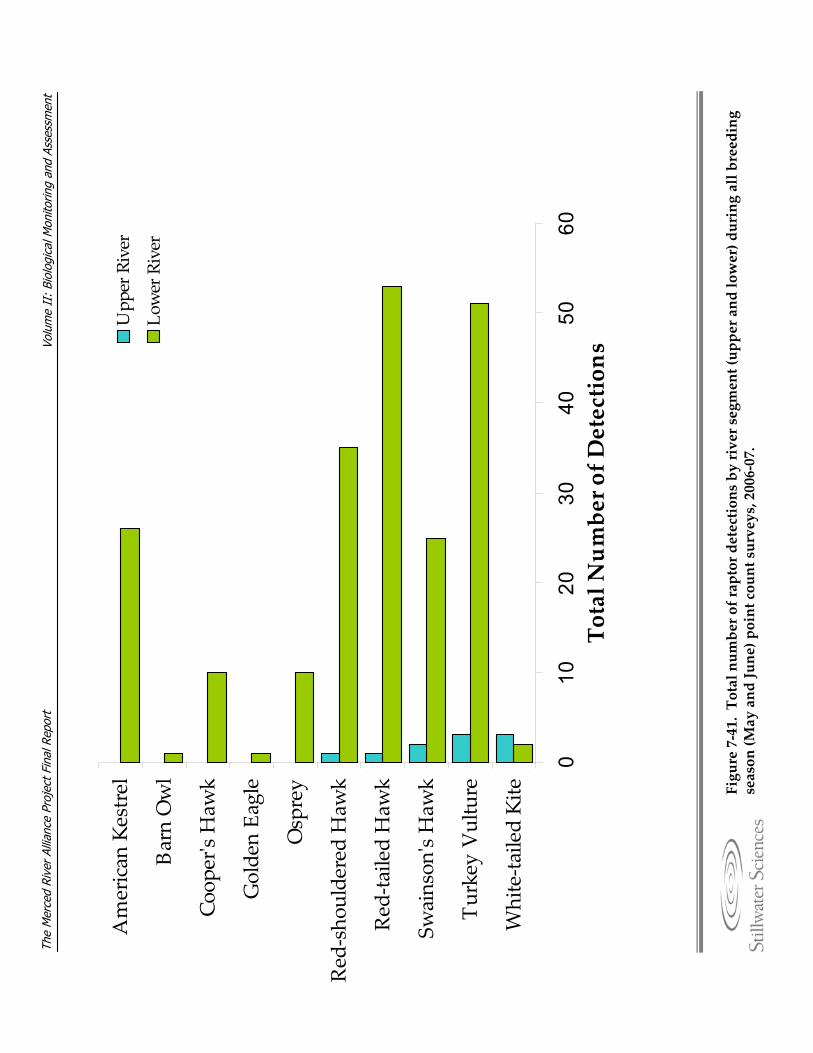
Volu
me
II:
Biol
ogic
al M
onito
ring
and
Asse
ssm
ent
The
Mer
ced
Rive
r Al
lianc
e Pr
ojec
t Fin
al R
epor
t
Figure 7‐41. Total num
ber of raptor detections by river segment (upper and lower) during all breeding
season (M
ay and June) point count surveys, 2006‐07.
Riv
er
010
2030
4050
60
White‐ta
iled Kite
Turkey Vulture
Swainsonʹs Haw
k
Red‐ta
iled Haw
k
Red‐sho
uldered Haw
k
Osprey
Golden Ea
gle
Coop
erʹs Haw
k
Barn Owl
American Kestrel
Total Num
ber of Detections
Upp
er River
Lower River
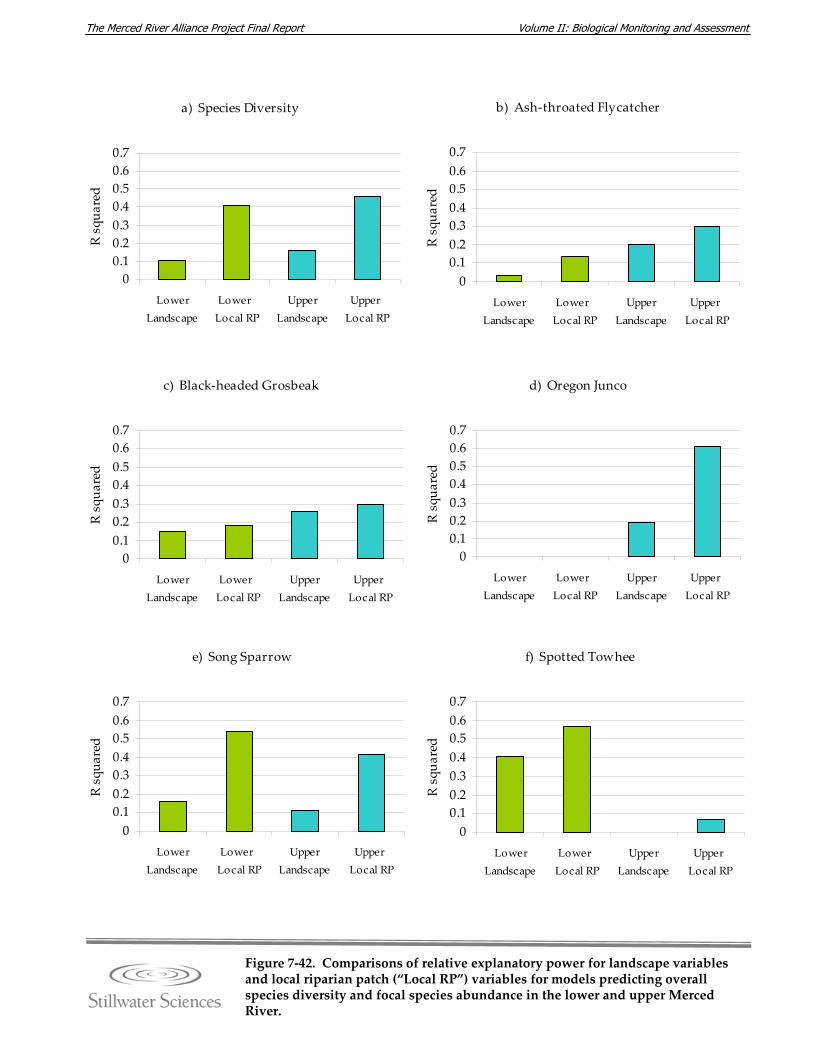
Volume II: Biological Monitoring and Assessment The Merced River Alliance Project Final Report
b) Ash‐throated Flycatcher
00.10.20.30.40.50.60.7
LowerLandscape
Lower Local RP
UpperLandscape
Upper Local RP
R squ
ared
Figure 7‐42. Comparisons of relative explanatory power for landscape variables and local riparian patch (“Local RP”) variables for models predicting overall species diversity and focal species abundance in the lower and upper Merced River.
a) Species Diversity
00.10.20.30.40.50.60.7
LowerLandscape
Lower Local RP
UpperLandscape
Upper Local RP
R squ
ared
c) Black‐headed Grosbeak
00.10.20.30.40.50.60.7
LowerLandscape
Lower Local RP
UpperLandscape
Upper Local RP
R squ
ared
d) Oregon Junco
00.10.20.30.40.50.60.7
LowerLandscape
Lower Local RP
UpperLandscape
Upper Local RP
R squ
ared
e) Song Sparrow
00.10.20.30.40.50.60.7
LowerLandscape
Lower Local RP
UpperLandscape
Upper Local RP
R squ
ared
f) Spotted Towhee
00.10.20.30.40.50.60.7
LowerLandscape
Lower Local RP
UpperLandscape
Upper Local RP
R squ
ared
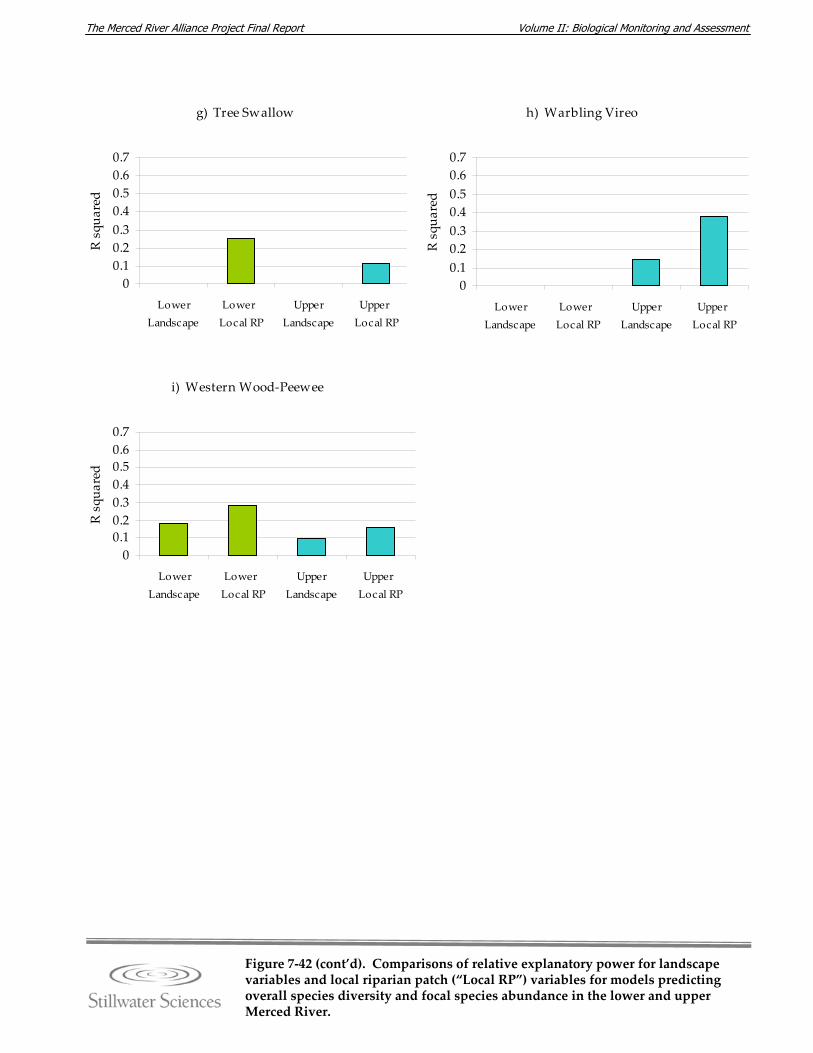
Volume II: Biological Monitoring and Assessment The Merced River Alliance Project Final Report
Figure 7‐42 (cont’d). Comparisons of relative explanatory power for landscape variables and local riparian patch (“Local RP”) variables for models predicting overall species diversity and focal species abundance in the lower and upper Merced River.
g) Tree Swallow
00.10.20.30.40.50.60.7
LowerLandscape
Lower Local RP
UpperLandscape
Upper Local RP
R squ
ared
h) Warbling Vireo
00.10.20.30.40.50.60.7
LowerLandscape
Lower Local RP
UpperLandscape
Upper Local RP
R squ
ared
i) Western Wood‐Peewee
00.10.20.30.40.50.60.7
LowerLandscape
Lower Local RP
UpperLandscape
Upper Local RP
R squ
ared
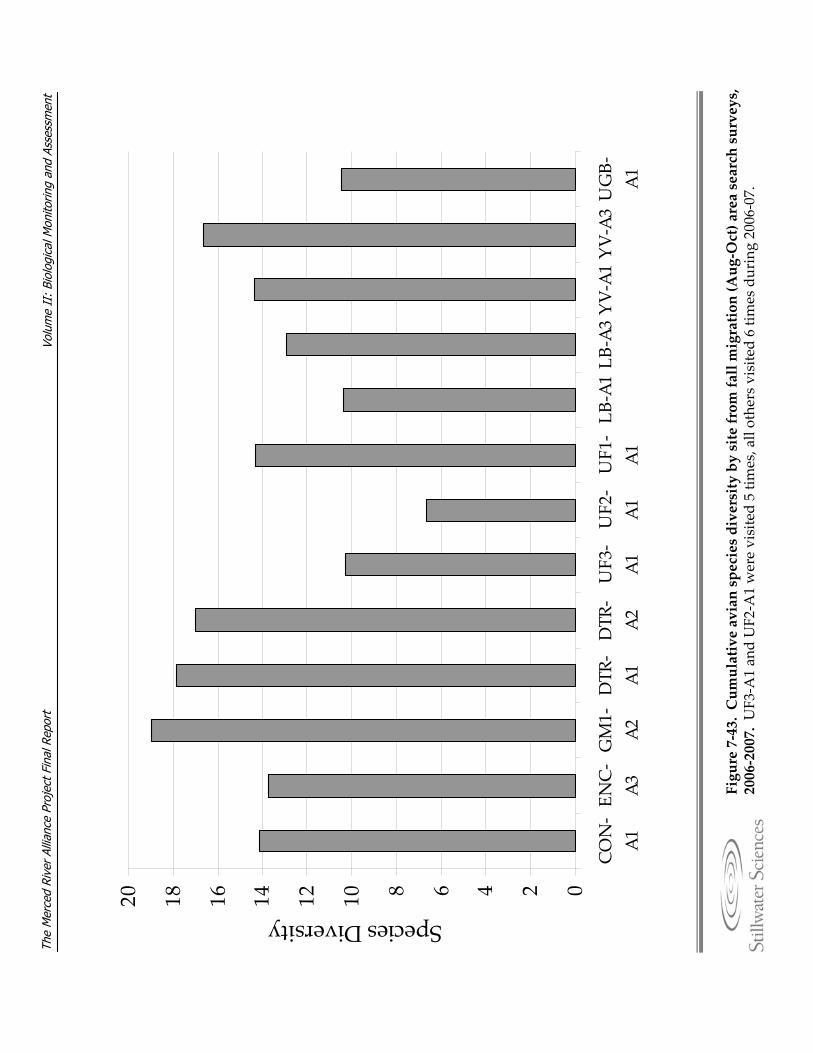
Volu
me
II:
Biol
ogic
al M
onito
ring
and
Asse
ssm
ent
The
Mer
ced
Rive
r Al
lianc
e Pr
ojec
t Fin
al R
epor
t
Figure 7‐43. Cumulative avian species diversity by site from fall migration (Aug‐Oct) area search surveys,
2006‐2007. U
F3‐A
1 an
d UF2‐A
1 were visited 5 tim
es, all others visite
d 6 tim
es during 2006‐07.
02468101214161820
CON‐
A1
ENC‐
A3
GM1‐
A2
DTR‐
A1
DTR‐
A2
UF3‐
A1
UF2‐
A1
UF1‐
A1
LB‐A1LB‐A3YV‐A1YV‐A3UGB‐
A1
Species Diversity
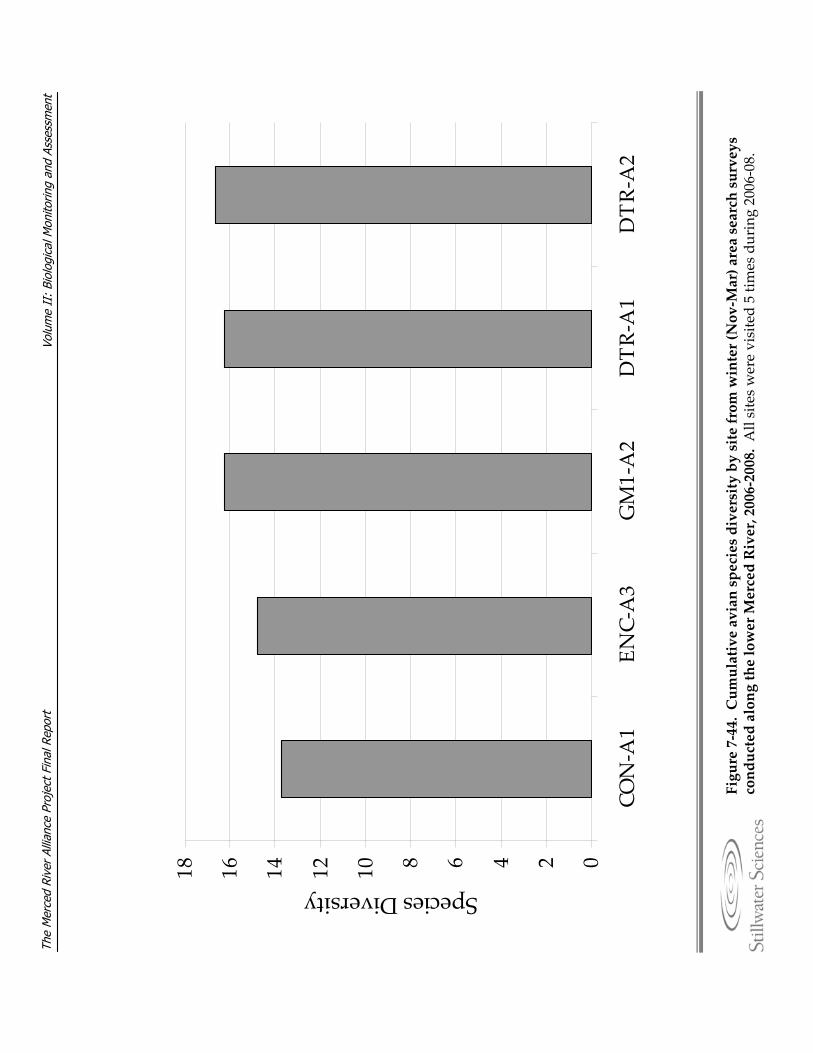
Volu
me
II:
Biol
ogic
al M
onito
ring
and
Asse
ssm
ent
The
Mer
ced
Rive
r Al
lianc
e Pr
ojec
t Fin
al R
epor
t
Figure 7‐44. Cumulative avian species diversity by site from winter (Nov‐Mar) area search surveys
conducted along the lower Merced River, 2006‐2008. All sites were visited 5 tim
es during 2006‐08.
024681012141618
CON‐A
1EN
C‐A3
GM1‐A2
DTR‐A
1DTR‐A
2
Species Diversity
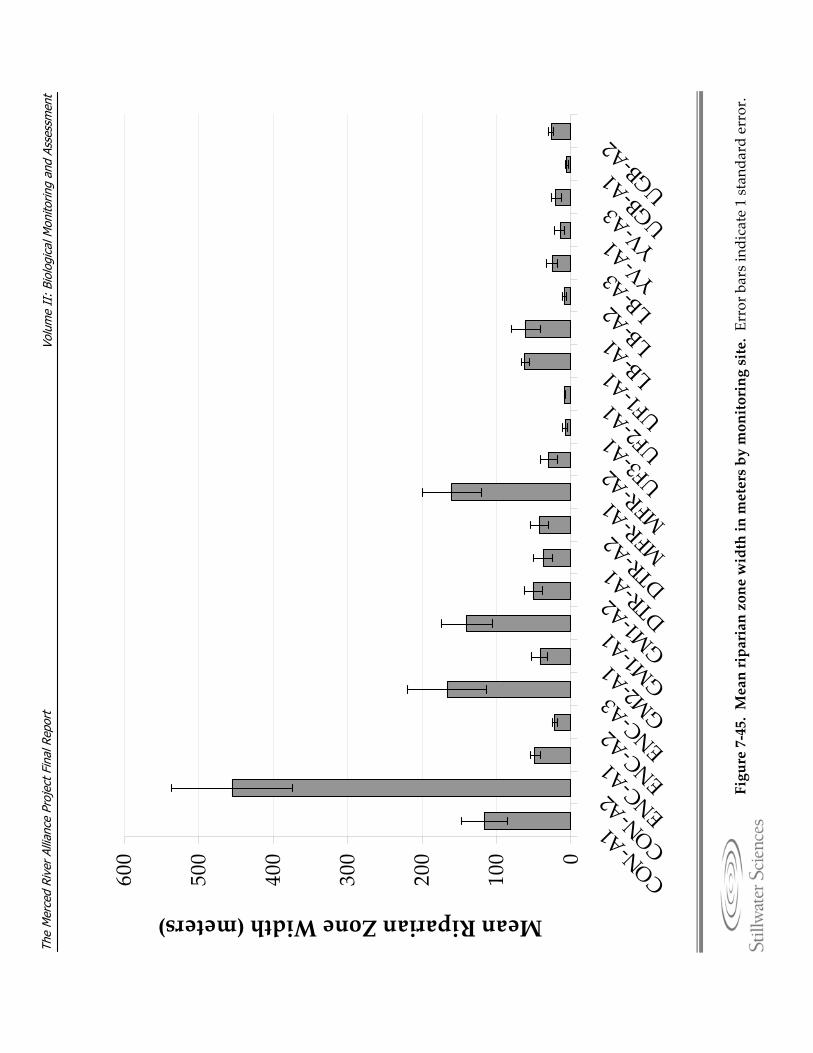
Volu
me
II:
Biol
ogic
al M
onito
ring
and
Asse
ssm
ent
The
Mer
ced
Rive
r Al
lianc
e Pr
ojec
t Fin
al R
epor
t
0
100
200
300
400
500
600
CON‐
A1 CON‐
A2 ENC‐
A1 ENC‐
A2 ENC‐
A3 GM2‐A
1GM
1‐A1
GM1‐A
2DT
R‐A1 DTR‐
A2 MFR‐
A1 MFR‐
A2 UF3‐A
1 UF2‐A
1 UF1‐A
1 LB‐A
1 LB‐A
2 LB‐A
3 YV‐A
1 YV‐A
3UG
B‐A1 UGB‐A
2Mean Riparian Zone Width (meters)
Figure 7‐45. Mean riparian zone width in meters by monitoring site. Error b
ars indicate 1 stand
ard error.
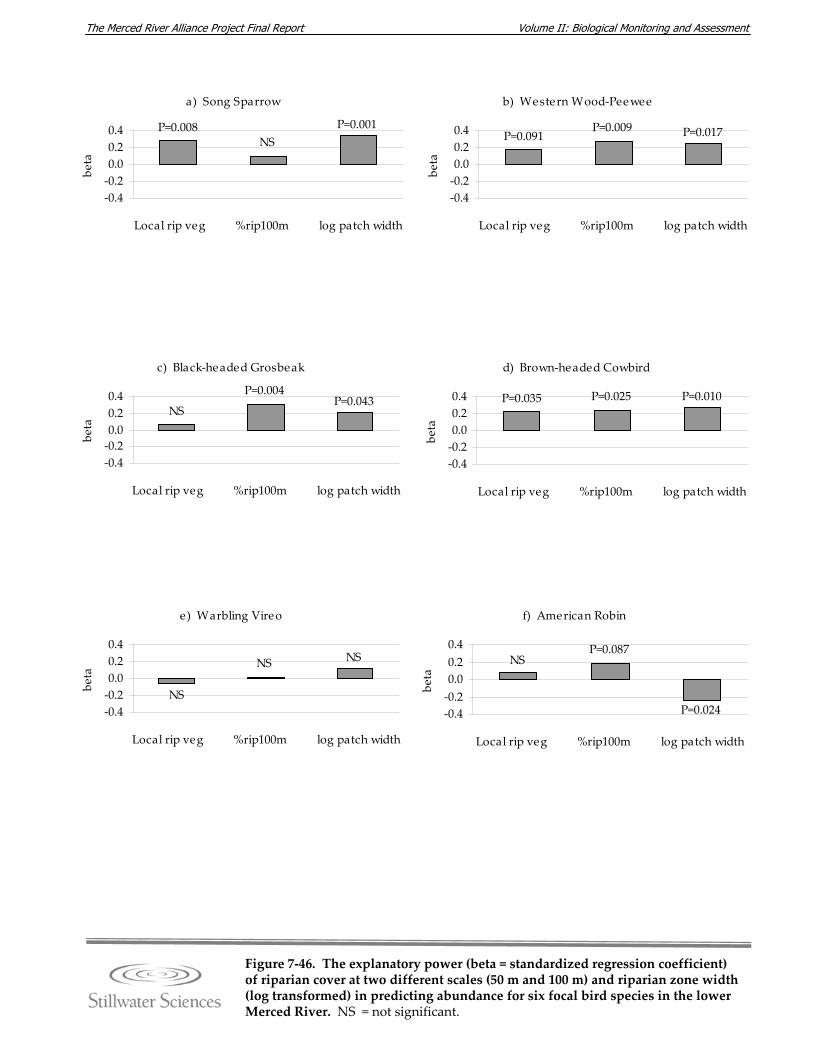
Volume II: Biological Monitoring and Assessment The Merced River Alliance Project Final Report
b) Western Wood‐Peewee
P=0.009P=0.091 P=0.017
‐0.4‐0.20.00.20.4
Local rip veg %rip100m log patch width
beta
d) Brown‐headed Cowbird
P=0.025P=0.035 P=0.010
‐0.4‐0.20.00.20.4
Local rip veg %rip100m log patch width
beta
f) American Robin
P=0.024
NSP=0.087
‐0.4‐0.20.00.20.4
Local rip veg %rip100m log patch width
beta
Figure 7‐46. The explanatory power (beta = standardized regression coefficient) of riparian cover at two different scales (50 m and 100 m) and riparian zone width (log transformed) in predicting abundance for six focal bird species in the lower Merced River. NS = not significant.
a) Song Sparrow
NSP=0.008 P=0.001
‐0.4‐0.20.00.20.4
Local rip veg %rip100m log patch width
beta
c) Black‐headed Grosbeak
P=0.004
NSP=0.043
‐0.4‐0.20.00.20.4
Local rip veg %rip100m log patch width
beta
e ) Warbling Vireo
NS
NS
NS
‐0.4‐0.20.00.20.4
Local rip veg %rip100m log patch width
beta
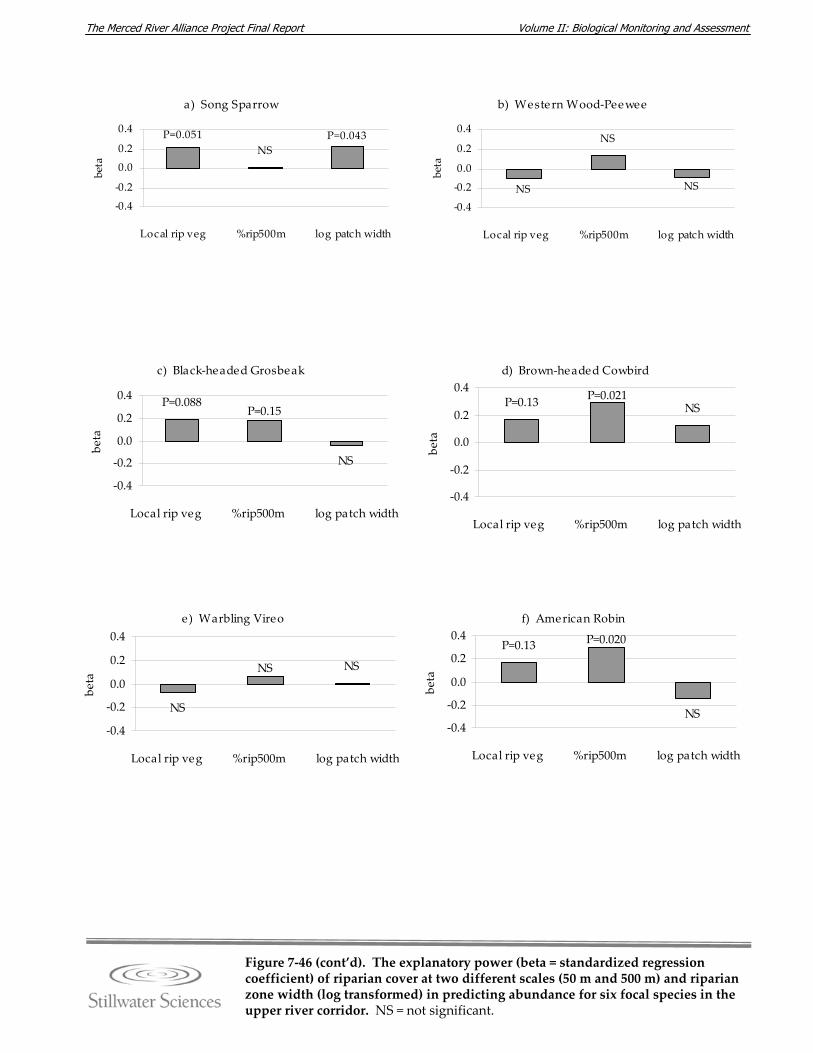
Volume II: Biological Monitoring and Assessment The Merced River Alliance Project Final Report
Figure 7‐46 (cont’d). The explanatory power (beta = standardized regression coefficient) of riparian cover at two different scales (50 m and 500 m) and riparian zone width (log transformed) in predicting abundance for six focal species in the upper river corridor. NS = not significant.
a) Song Sparrow
NSP=0.051 P=0.043
‐0.4
‐0.2
0.0
0.2
0.4
Local rip veg %rip500m log patch width
beta
e ) Warbling Vireo
NS
NSNS
‐0.4
‐0.2
0.0
0.2
0.4
Local rip veg %rip500m log patch width
beta
b) Western Wood‐Peewee
NS
NS NS
‐0.4
‐0.2
0.0
0.2
0.4
Local rip veg %rip500m log patch width
beta
d) Brown‐headed Cowbird
P=0.13 NSP=0.021
‐0.4
‐0.2
0.0
0.2
0.4
Local rip veg %rip500m log patch width
beta
f) American Robin
P=0.13
NS
P=0.020
‐0.4
‐0.2
0.0
0.2
0.4
Local rip veg %rip500m log patch width
beta
c) Black‐headed Grosbeak
P=0.088
NS
P=0.15
‐0.4
‐0.2
0.0
0.2
0.4
Local rip veg %rip500m log patch width
beta
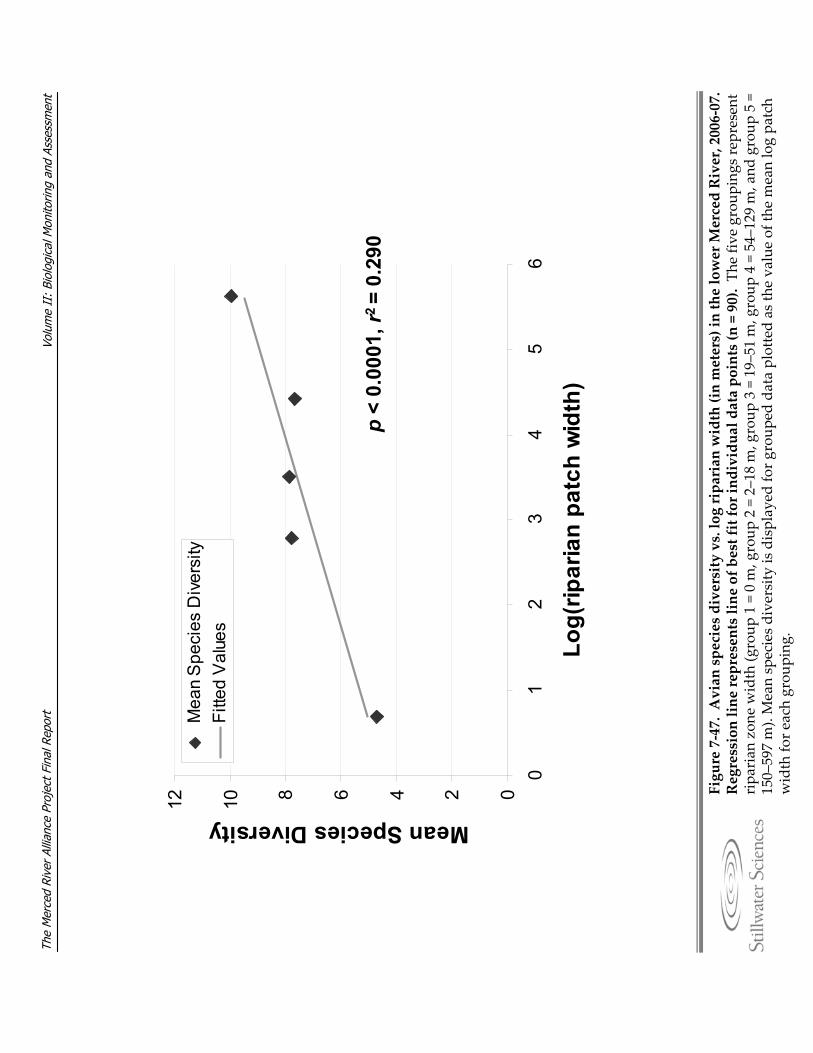
Volu
me
II:
Biol
ogic
al M
onito
ring
and
Asse
ssm
ent
The
Mer
ced
Rive
r Al
lianc
e Pr
ojec
t Fin
al R
epor
t
Figure 7‐47. Avian species diversity vs. log riparian width (in meters) in the lower Merced River, 2006‐07.
Regression line represents line of best fit for individual data points (n = 90). Th
e fiv
e grou
ping
s represent
ripa
rian zon
e width (g
roup 1 = 0 m
, group 2 = 2–18 m, group 3 = 19–51 m
, group 4 = 54–129 m, and group 5 =
150–597 m). Mean species diversity is displayed fo
r group
ed data plotted as th
e value of th
e mean log pa
tch
width fo
r each grou
ping
.
024681012
01
23
45
6
Log(
ripar
ian
patc
h w
idth
)
Mean Species DiversityM
ean
Spe
cies
Div
ersi
tyFi
tted
Val
ues
p<
0.00
01, r
2 =
0.29
0
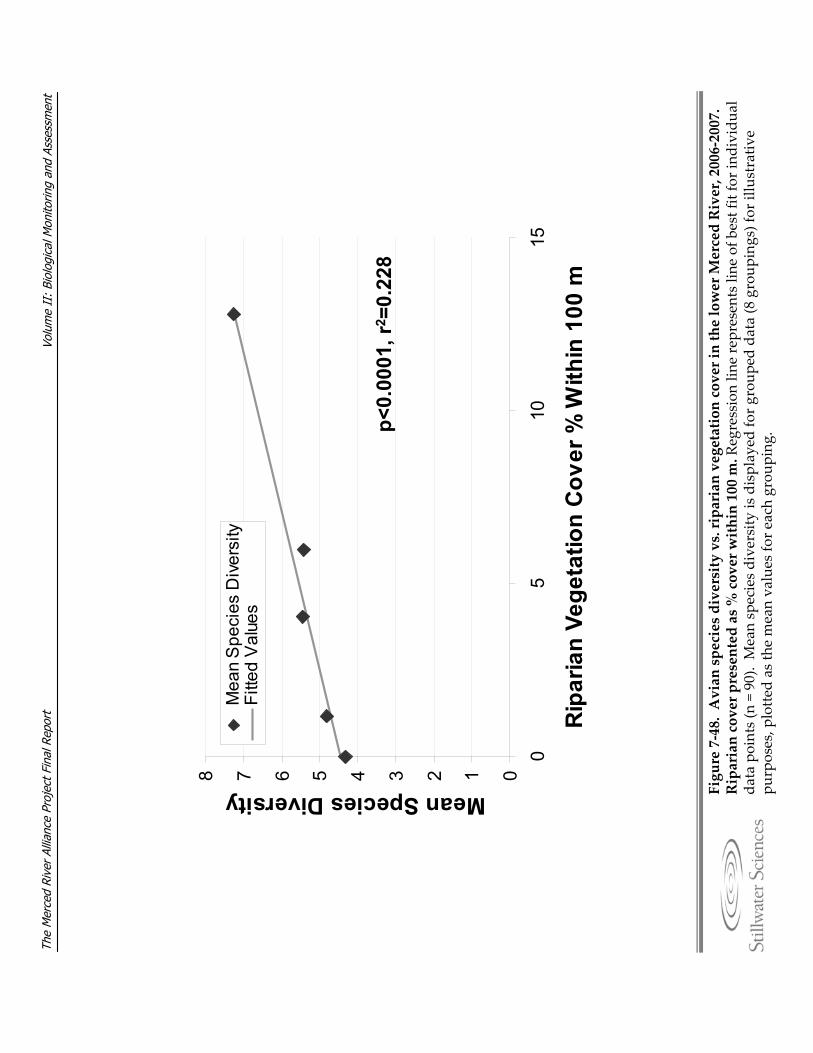
Volu
me
II:
Biol
ogic
al M
onito
ring
and
Asse
ssm
ent
The
Mer
ced
Rive
r Al
lianc
e Pr
ojec
t Fin
al R
epor
t
Figure 7‐48. Avian species diversity vs. riparian vegetation cover in the lower Merced River, 2006‐2007.
Riparian cover presented as % cover within 100 m. R
egression lin
e represents line of b
est fit for ind
ividua
l da
ta points (n = 90). Mean species diversity is displayed fo
r group
ed data (8 group
ings) for illustrativ
e pu
rposes, p
lotte
d as th
e mean values fo
r each grou
ping
.
012345678
05
1015
Rip
aria
n Ve
geta
tion
Cov
er %
With
in 1
00 m
Mean Species DiversityM
ean
Spe
cies
Div
ersi
tyFi
tted
Val
ues
p<0.
0001
, r2 =
0.22
8
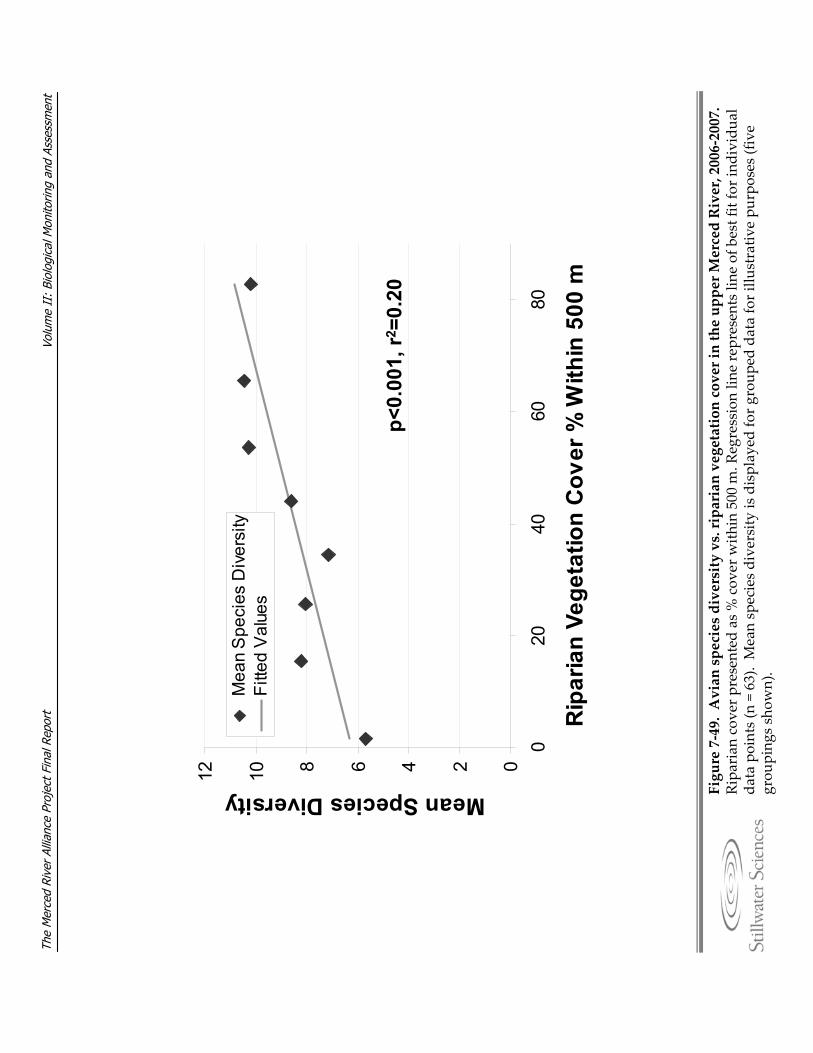
Volu
me
II:
Biol
ogic
al M
onito
ring
and
Asse
ssm
ent
The
Mer
ced
Rive
r Al
lianc
e Pr
ojec
t Fin
al R
epor
t
Figure 7‐49. Avian species diversity vs. riparian vegetation cover in the upper M
erced River, 2006‐2007.
Ripa
rian cov
er presented as % cov
er w
ithin 500 m
. Regression lin
e represents line of b
est fit for ind
ividua
l da
ta points (n = 63). Mean species diversity is displayed fo
r group
ed data for illu
strativ
e pu
rposes (five
grou
ping
s show
n).
024681012
020
4060
80
Rip
aria
n Ve
geta
tion
Cov
er %
With
in 5
00 m
Mean Species DiversityM
ean
Spe
cies
Div
ersi
tyFi
tted
Val
ues
p<0.
001,
r2=0
.20

The Merced River Alliance Project Final Report Volume II: Biological Monitoring and Assessment
Stillwater Sciences
8‐1
8 DATA EVALUATION The following section expands on the results provided as new data for the Merced Alliance by offering discussion and further interpretation of the information reported in Section 7. Results are compared with historical data, where available, and evaluated in the context of both the current study and other related research, based upon available scientific literature relevant to the study elements. In some cases, recommendations for further study are outlined as well.
8.1 Coarse-scale Aquatic Habitat Mapping Results of the coarse‐scale aquatic habitat mapping effort were used along with several other factors to support monitoring site selection for the fish and benthic macroinvertebrate (BMI) surveys. As described in sections 5.2.3.3 and 5.2.4.3, monitoring sites were selected to represent the range of coarse‐scale aquatic habitat types identified during mapping efforts, to be accessible, to take advantage of existing data (where possible), and to maintain coincident fish and BMI sites (where possible). As described in Section 5.2.4.3, BMI sites were composed of 500‐m reaches that encompassed a variety of coarse‐ and finer scale aquatic habitat types to produce a multi‐habitat composite sample. Wherever possible, reach‐wide targeted riffle samples were also collected at a BMI monitoring site. While fish monitoring sites also included multiple sample locations and often several habitat types within a site, habitat associations were considered as part of the fish study objectives (Section 5.2.3.1) and therefore data were reported for individual habitat units. The remainder of the habitat mapping evaluation focused on individual aquatic habitat units sampled during the fish surveys, although as shown in Figure 5‐1, fish and BMI sites were often coincident and so the overall evaluation of fish monitoring site selection is generally applicable to the BMI sites. With the exception of cascades (see Table 5‐2 for definition), all types of coarse‐scale habitat mapped in the Merced River during fall 2005 were represented within the fish monitoring sites and were sampled during summer and fall 2006 and 2007 (Appendix G, Table G‐1). While cascade habitat was present as multiple short units in the mapped portions of the Lower Batholith and Glaciated Batholith reaches (Figure 7‐1b), the characteristic high gradient (> 4%) provides limited fish habitat and made it unsafe to sample cascades using available standard methods. As shown in Figure 7‐1, runs were the predominant habitat type (by length) in most reaches, followed by low‐gradient riffles and mid‐channel pools. Accordingly, these three habitat types were sampled with the highest relative frequency within the selected fish monitoring sites (Appendix G,
The Merced River Alliance Project Final Report Volume II: Biological Monitoring and Assessment
Stillwater Sciences
8‐2
Table G‐1). In general, however, the main mapped habitat types were under‐sampled when considered on the basis of relative frequency of occurrence by length within each reach. This was due to the inclusion of backwater and margin habitat types, two additional categories of aquatic habitat that were classified in the Merced River during 2006 and 2007 summer and fall surveys but not included in the 2005 mapping effort. While the scale of the remote helicopter videography method did not allow for inclusion of backwater habitat features, they were identified as commonly utilized fish habitat during the 2006 and 2007 lower river surveys and, accordingly, these features were sampled in the Confluence, Encroached, Gravel Mining 2, Gravel Mining 1, and Dredger Tailings reaches (Figure 7‐1a). Margin habitat, defined as the area along the stream bank exhibiting relatively slower velocity, lesser water depth and unique cover attributes as compared with main channel habitat, was originally included in fish survey datasheets as a further descriptor, or sub‐classification, of the larger coarse‐scale unit. However, during 2006 and 2007 fish surveys in the lower Merced River, fish were frequently observed along the river margins and several margin samples constituted 100% of a given coarse‐scale habitat unit (i.e., run or low‐gradient riffle). Based on these observations, margin habitat was included as a primary habitat type during the 2006–2007 sampling and for analysis purposes. The conspicuous lack of LWD in the Upper Foothills reaches (Figure 7‐3) may be due to generally higher flows in these reaches, as compared with recorded flows in the Lower Batholith and Yosemite Valley reaches located farther upstream (Section 7.2.1). Additionally, in January 1997, above‐normal precipitation and severe flooding in the upper Merced River caused transport of massive amounts of woody material (31,000 m3 [40,450 yd3] [T. Selb, pers. comm. 2008]) downstream to Lake McClure (White 1997a, 1997b, 1997c). The wood was extracted from the reservoir by raft, an effort that took two years to complete (T. Selb, pers. comm. 2008). Peak discharge during the January 1997 flood event reached 700 m3 s‐1 (24,600 cfs) at the Pohono Bridge gauging station; flows during this event are the highest on record for the Merced River. The relatively narrow riparian zone in the Upper Foothills 1, 2, and 3 Reaches, as measured during the Merced Alliance avian study (Figure 7‐45), coupled with the general absence of forest vegetation in adjacent uplands, suggests that recruitment potential for LWD in these reaches may be low. Even eight years later, this may explain the almost complete lack of LWD observed in the Upper Foothills reaches during the Merced Alliance surveys.
8.2 Fish Study 8.2.1 Comparisons to Historical Fish Data A summary of previous and ongoing fish studies that were reviewed prior to the Merced Alliance study is presented in Volume 1, Section 5.3.1 of this final report. The Merced Alliance fish hypotheses were largely structured to compare newly collected baseline survey data to that of recent or earlier fish surveys, and specific comparisons to
The Merced River Alliance Project Final Report Volume II: Biological Monitoring and Assessment
Stillwater Sciences
8‐3
historical fish data pertaining to our study hypotheses have already been made in Section 7.3.4. Aditional discussion of these comparisons is included in Section 8.2.2. While a total of 41 species have been observed in the Merced River during previous studies, only 31 were observed during the Merced Alliance study. As shown in Appendix B, Table B‐1, only one native species, Sacramento blackfish, was historically noted in the Merced River but not observed during seasonal surveys. While it is possible that this species does inhabit the lower reaches of the Merced River near the confluence with the San Joaquin River (Moyle 2002), actual numbers may be low enough that they were not captured at all during the Merced Alliance multi‐season sampling efforts. It is also possible that the sampling methods employed in the Merced Alliance study (i.e., snorkeling, seining, backpack electrofishing, and boat electrofishing) did not adequately allow for capture or identification of this species. Several introduced species, including inland silverside, white crappie, shad (American and threadfin), red shiner, bullhead (black and yellow) were also historically observed in the lower Merced River but were not seen during the 2006–2008 surveys. Brook trout were historically observed in the upper Merced River but were not seen during the 2006–2008 surveys. Two species observed during the Merced Alliance study were not present in historical data: the native riffle sculpin and the non‐native pumpkinseed sunfish. In the historical data, unidentified sculpin species were reported in the Merced, and as the riffle sculpin possesses a very similar morphology to the prickly sculpin, it is possible that riffle sculpin were present during historical surveys but were either misidentified or grouped with the more common prickly sculpin. Pumpkinseed sunfish may represent a new introduction to the Merced River, or they may have been present at very low densities, and thus not found, during previous studies. Only two pumpkinseed sunfish were observed during seasonal surveys, and these were only observed during the spring 2008 surveys. Consistent with the historical data record (Stillwater Sciences 2006b), introduced fish compose the majority of species observed in the Merced Allicance study (Table 7‐7). Redeye bass, which were observed during 2001 in the Merced River and are therefore more recent inclusions in the historical data set, were also observed in the Upper Foothills 1, 2, and 3 reaches during fall of 2007. According to Moyle (2002), redeye bass were introduced to California during the 1960s and have been successful invaders of Sierra foothill streams due to their small adult size, aggressive behavior and generalized feeding requirements. It is possible that redeye bass were present in the Merced River prior to 2001 but were misidentified as smallmouth bass. For further discussion of redeye bass in the Merced Alliance surveys, see Section 8.2.2.6.
The Merced River Alliance Project Final Report Volume II: Biological Monitoring and Assessment
Stillwater Sciences
8‐4
8.2.2 Evaluation of New Fish Data 8.2.2.1 Community Composition Baseline fish community species composition of the Merced River was investigated at a variety of spatial scales, including basin‐, segment‐, and reach‐scales (Figure 5‐2). As summarized in Table 7‐7, the majority of fish species found in the Merced River during 2006‐2008 were introduced, resident species. This was observed at both the basin and segment scale. The majority of individual fish observed in the Merced River were native residents in the upper river segment and introduced residents in the lower river segment, although the latter varied by season, with native fish such as YOY and juvenile Sacramento suckers and Sacramento pikeminnows outnumbering introduced fish in the spring of 2007 and 2008. While native fall‐run Chinook salmon were also observed during the spring season, overall numbers were low and therefore this species did not appear to contribute significantly to the higher number of native fish in the lower river segment during spring of 2007 and 2008. As described in Section 7.3.2, the basin‐scale results of both the agglomerative and the divisive cluster analysis techniques indicate a general conformity to the broader water temperature‐based fish assemblages (Moyle 2002) but do not clearly match the predictions of the more distinct SJRD assemblages (Brown et al. 2003). This is largely because multiple species were found at variable densities throughout the river (Figure 7‐19), rather than conforming to distinct groupings in a smaller portion of the river. Despite the statistical non‐conformity, the species were still organized using the SJRD assemblages for the fish analysis presented in this report, because it was useful for visually identifying potential trends and for conceptualizing the Merced River fish communities in the larger context of the San Joaquin River Basin. Indeed, it may not be possible to see clearly defined assemblages at the scale of Merced River watershed (e.g., basin). The SJRD assemblages were originally defined at an even larger basin scale, that of the entire San Joaquin River drainage, where the broader geographic range (including the Stanislaus, Tuolumne, and Merced rivers, along with the Mud Slough, Salt Slough, Orestimba Creek, and Spanish Grant Drain) may allow for overlap between the assemblages in transitional habitats but still provide enough spatial separation to denote different assemblages. Despite the habitat variability inherent to the 123 miles of the Merced River included in the 2006–2008 Merced Alliance surveys, there was a large degree of overlap in fish communities (particularly in the lower river segment), which suggests only a broad conformity to the Brown et al. (2003) SJRD model. In keeping with the predictions of previous studies, the distribution of the native Sacramento sucker (and by association the entire Foothill Community) during 2006–2008 generally corresponds to “natural conditions” (Moyle 2002, Brown et al. 2003). The latter is characterized by extension of the Foothill Community species throughout the river (upstream and downstream) and significant overlap with Valley Floor species in the lower river segment (Figure 8‐1). This pattern was largely driven by Sacramento sucker, as Sacramento pikeminnow and hardhead were consistently observed at lower relative
The Merced River Alliance Project Final Report Volume II: Biological Monitoring and Assessment
Stillwater Sciences
8‐5
densities and in a less broad distribution than the Sacramento sucker (Figure 7‐18). The introduced spotted bass, also a Foothill Community species, was observed to have a distribution in the lower river segment that is atypical of other Foothill Community or transitional species and more typical of the Valley Floor communities (Figure 7‐19, Figure 8‐1). Spotted bass prefer habitat with summer temperatures of 24–31 °C (Moyle 2002), which is closer to temperatures preferred by the transitional and Valley Floor fish communities. At the segment scale, fish community patterns were much the same as those observed at the basin scale, likely because the series of mainstem Merced River dams bisect the river within the foothill region itself, where major species transitions would be expected to take place. As predicted by Brown et al. (2003), the presence of the foothill reservoirs appears to have extended the Valley Floor Community into the upper segment of the Merced River. During both 2007 and 2008, species richness was highest in the upper river reach just upstream of Lake McClure (i.e., the Upper Foothills 3 Reach [Figure 7‐15 and Figure 7‐16) and included some Lower Large Tributary and San Joaquin Mainstem #2 Community species such as the non‐native largemouth bass and common carp, which are currently (or were historically) stocked in Lake McClure for sport fishing. While the presence of Lake McClure appears to support Valley Floor Community species in the lower reaches of the upper Merced River segment, this particular effect of the reservoir on fish community structure appears to be limited to approximately 5 miles (or roughly 10%) of the 46 miles of upper river segment surveyed between Lake McClure and the upstream end of Yosemite Valley. Smallmouth bass (Broad Geographic Range fish Community) and spotted bass (Foothill Community) were also found in the upper river segment, which may be related to current or historical stocking practices in Lake McClure. However, the range of these bass species extended upstream throughout the Upper Foothill 1, 2, and 3 reaches and into the Lower Batholith Reach. Introduced redeye bass were observed in the upper river segment during fall 2007 in the Upper Foothill 1, 2, and 3 reaches (Table 7‐8). Although not shown in Figure 7‐19 because they were not originally included in the SJRD community assemblage model (Brown et al. 2003), redeye bass are considered a transitional species and have demonstrated a capacity to live in both California foothill streams and reservoirs (Moyle 2003). Redeye bass are aggressive invaders that reach a relatively small adult size. They are opportunistic predators, feeding throughout the water column, and they have completely displaced native minnows and suckers in many reaches of the Cosumnes River (Moyle 2003). The redeye bass has been commonly misidentified as smallmouth bass in other Central Valley river systems, including the Cosumnes and Stanislaus Rivers (Moyle 2003). Since smallmouth bass were also observed in the Upper Foothill 1, 2, and 3 reaches of the Merced River (Figure 7‐19b,e), further surveys are warranted to confirm the presence of redeye bass in the Foothill Community of the Merced River and to determine whether there is any relationship between the presence of this aggressive introduced species and native minnow densities or the BMI community (in response to
The Merced River Alliance Project Final Report Volume II: Biological Monitoring and Assessment
Stillwater Sciences
8‐6
high rates of predation by redeye bass). Sacramento suckers, hardhead, and Sacramento pikeminnow were observed in the Upper Foothill 1, 2, and 3 reaches along with redeye bass, at variable densities as compared with other reaches in the upper river segment (Figure 7‐19b, e). Merced Alliance survey results indicate that the downstream extent of the Trout Community may currently extend beyond that of natural conditions (Figure 8‐1), as O. mykiss was observed between Crocker‐Huffman Dam and Merced Falls Dam, in the Merced Falls Reach, as well as in the upstream end of the Dredger Tailings Reach (RM 44.7 to 51.3). The Merced Alliance sampling methods did not allow for absolute distinction between the anadromous form of O. mykiss (steelhead) and the freshwater form (rainbow trout), but the O. mykiss observed in the lower segment of the Merced River were not likely to be steelhead. The majority of O. mykiss observed in the lower river segment were found above Crocker‐Huffman Dam, the upstream limit for fish migration on the lower river segment, suggesting they were resident rainbow trout or stocked hatchery fish. The few O. mykiss that were found in the Dredger Tailings Reach may have also been resident fish of upstream or hatchery origin. Although there is no documented historical evidence of steelhead in the Merced River, steelhead presence in the lower Merced River is possible, based on documented occurrence of Chinook salmon and a lack of natural migration barriers (McEwan 2001). Zimmerman et al. (2008) determined, using strontium:calcium ratio analysis of otoliths, that one of 23 O. mykiss captured in the lower Merced River was a resident fish of maternal steelhead (anadromous) origin. This finding strongly suggests that anadromous O. mykiss have entered the lower Merced River and spawned successfully in the recent past, albeit in very low numbers. At the reach scale, community level indices, such as species richness and diversity (Figure 7‐9 through Figure 7‐13, Figure 7‐15, Figure 7‐16) reflect the presence of community assemblages in each of the reaches and the richness of those community assemblage groups. For example, the Trout Community, which was observed in both the upper and lower river segments, has a relatively low species richness. Correspondingly, reaches where the numerically dominant fish assemblage was the Trout Community also had lower species richness. In contrast, reaches containing the Valley Floor Community assemblages (with high community species richness) also possessed higher overall species richness and diversity. 8.2.2.2 Spatial Patterns and Seasonal Shifts Clear seasonal shifts in community‐level metrics were observed at the reach scale in the lower river segment, with the lowest fish species richness and diversity occurring in the fall, with a predominance of the introduced bass and the mosquitofish. Higher species richness and diversity were observed during the spring, with a predominance of native species including Sacramento sucker, trout, and sculpin (Figure 7‐10 and Figure 7‐13). Seasonal shifts in the transition zone in the lower Merced River were also apparent. For
The Merced River Alliance Project Final Report Volume II: Biological Monitoring and Assessment
Stillwater Sciences
8‐7
example, from spring to summer 2007 the transition zone appeared to move upstream; the Gravel Mining 1 Reach was dominated by transitional/colder water species during spring surveys and warm‐water species during summer surveys (Figures 7‐10 and Figure 7‐11). Seasonal shifts in community assemblages were less apparent at the basin and segment scale because, as discussed in Section 8.2.2.1, Merced River fish communities overlapped to a large degree during all seasons sampled (Figure 7‐19a‐f). The number of individual fish observed in each survey varied from season to season and year to year. Overall, more fish were observed during the fall seasons than summer and spring seasons combined. However, this was highly variable between the two survey years; during the 2006 (high‐flow year) fall surveys, the lowest number of individual fish were observed (559), while during fall 2007 (low‐flow year), the greatest number of individual fish were observed (13,823). The difference was most likely due to more effective depth refuge and reduced water clarity in 2006, which reduced the effectiveness of both boat electrofishing and snorkel surveys. During the spring and summer surveys, observations ranged from 1,557 individuals (spring 2008) to 2,963 individuals (summer 2007). As the upper river was only sampled during the late summer/fall season, seasonal trends cannot be examined.
8.2.2.3 Habitat Associations At the basin and segment scale, fish habitat associations (see Section 7.3.3.2) indicate expected trends based on known species’ preferences for a subset of the measured physical habitat and water quality variables. Temperature, percent LWD, maximum depth, and percent substrate displayed evident trends for Sacramento sucker, Sacramento pikeminnow, hardhead, and spotted bass, those species with sufficient observations to apply the regression technique. However, despite the water quality and physical habitat gradients identified using PCA in Section 7.3.3.2, all other cover variables, habitat types, and water quality parameters (e.g., turbidity and conductivity) did not show evident trends with species presence/absence. This may be because the first two environmental principal components explained just under 50% of the variation in the aquatic habitat data, at 48% for the lower river and 46% for the upper river (Section 7.3.3.2), indicating that, although there were apparent segment‐scale physical habitat gradients in the Merced River, a large amount of habitat variability remained inherent to the data set. Examination of environmental variable correlation matrices support this interpretation, with the strongest correlations observed between percent riffle and percent boulder cover (r = 0.50), and between percent run/pool/glide and depth (r = 0.54 for maximum depth and r = 0.50 for average depth). At the reach‐scale, the analysis of normalized linear fish density by linear habitat frequency (Figure 7‐1b) indicates that the majority of habitat types supported similar densities of fish. In the lower river, the primary exception to this was margin habitat, which consistently supported higher densities of fish than any other habitat. Twenty‐seven species of fish (Table 7‐11) were observed using the shallow depths and slow
The Merced River Alliance Project Final Report Volume II: Biological Monitoring and Assessment
Stillwater Sciences
8‐8
velocities (< 1 m s‐1, Table 5‐9 ) found in margin habitat in the lower river. Only 12 of the 27 species observed in margin habitat (40%) were native, including mainly juvenile fall‐run Chinook salmon (Figure 7‐14b), YOY hardhead (Figure 7‐14i), and YOY Sacramento sucker (Figure 7‐14k). Introduced species outnumbered native species in all lower river segment habitat types except low‐gradient riffles and floodplains (Table 7‐11). While this may indicate that targeting segment‐scale restoration activities to favor riffles and floodplains over other habitat types may preferentially benefit native fish species, introduced species appear to be utilizing all habitat types fairly regularly. At the reach‐scale, mid‐channel pool habitat in the Dredger Tailings Reach and backwater habitat in the Confluence Reach also supported relatively high densities of native fish. As six of seven total fish species found in mid‐channel pools in the Dredger Tailings Reach were native species (spotted bass was the lone exception), this habitat type appears to be important to native fish at the reach scale. Since mid‐channel pool habitat in the Merced Falls Reach was not sampled during seasonal surveys, additional consideration of fish use of mid‐channel pool habitat in this reach is likely necessary. However it appears that low‐gradient riffle and run habitat in the Merced Falls Reach is currently supporting relatively high densities of fish. In the upper river segment, mid‐channel pools appeared to consistently support the highest estimated linear density of fish as compared with of the extent of the habitat itself (Figure 7‐22b). However, almost all other habitat types in the upper river segment supported greater numbers of native species than did mid‐channel pools, where only 40% of observed species were native. In the Yosemite Valley Reach, lateral scour pools supported the highest linear density of fish, which included high numbers of the introduced brown trout along with many native Sacramento sucker and rainbow trout. Although not specifically quantified in the lateral scour pool surveys, field observations indicated that several large accumulations of LWD were associated with this habitat type in the Yosemite Valley Reach, providing excellent cover for fish. 8.2.2.4 Fall‐run Chinook Salmon The overall low sample size of fall‐run Chinook salmon observed during 2006–2008 rendered the Merced Alliance salmon‐specific hypotheses difficult to address. The majority of juvenile Chinook were observed in only one or two large groups each year, with the few remaining individuals spread throughout the lower river segment. The lack of reach‐scale clustering observed may have been a result of study design, as surveys included habitat types not conducive to Chinook rearing conditions, rather than focusing exclusively on Dredger Tailings Reach backwater and margin habitats where Chinook densities are expected to be the highest. In fact, the number of fall‐run Chinook salmon observed during the Merced Alliance surveys was much lower than 2004 surveys conducted for the Merced Phase IV Baseline Monitoring Study (Stillwater Sciences 2006b), which focused on ideal rearing habitats. However, it is also likely that declining fall‐run Chinook salmon populations documented by other studies (USFWS
The Merced River Alliance Project Final Report Volume II: Biological Monitoring and Assessment
Stillwater Sciences
8‐9
2007), make it very difficult, if not impossible, to demonstrate reach‐scale trends due to the very low abundance of salmon in the river as a whole. Despite the low overall sample size, there are a few general statements that can be made regarding observed fall‐run Chinook distribution and habitat use in the Merced River. The salmon that were observed occupied habitat that corresponded well to known habitat suitability criteria (Table 7‐12) and to recent results (2005) of juvenile Chinook surveys conducted in the Dredger Tailings Reach (Stillwater Sciences 2006b). Interestingly, the Dredger Tailings Reach, which includes the highest incidence of gravel augmentation and wing dam construction locations as compared with other lower river reaches, did not have significantly higher densities of fry or juvenile Chinook salmon in either 2007, 2008, or the two years combined (p = 0.46). Since salmon spawning habitat was targeted for enhancement in this reach rather than rearing rearing habitat, it is possible that rearing juveniles would not have remained proximal to “restored” gravels and would have moved farther downstream. However, it is more likely that reach‐scale trends, such as those addressed in Fish Hypothesis 2, simply could not be discerned with the low sample size of Chinook salmon during the 2006–2008 surveys. Co‐occupation of habitats by bass and juvenile Chinook was also not observed, which is not surprising given the different species’ habitat requirements and the efficiency at which bass prey on salmon. However, a significant degree of overlap was noted between overall bass and juvenile Chinook distributions in the river (Figure 7‐23), and the two species were found in adjacent habitats. While estimated linear densities of bass and the spatial extent of their distribution in the lower river segment increased from spring 2007 to spring 2008, Chinook densities and distribution followed the opposite trend. Continued monitoring of fall‐run juvenile Chinook salmon populations on the lower Merced River is recommended, not only to provide general outmigration information but also to help prioritize and monitor the effectiveness of future restoration projects. It is recommended that restoration project monitoring be conducted at a reach scale, focusing on the area of suitable in‐channel rearing habitat and the area of floodplain habitat from February through May, the area of habitat suitable for predatory bass, the projected density of rearing salmonids, and the relationship between the area of suitable habitat for bass and rearing salmonids and the projected density of these species. Monitoring projects should consider the application of a Before‐After‐Control‐Impact (BACI) study design to allow for testing of success criteria using a control site in place of a reference site. This is because widespread flow regulation, mining activities, and agricultural development in the San Joaquin Basin hinder the possibility of identifying a site, or a group of sites, to adequately represent the reference (e.g., natural or undisturbed) conditions for the Dredger Tailings Reach or other lower Merced River reaches (Stillwater Sciences 2006c).
The Merced River Alliance Project Final Report Volume II: Biological Monitoring and Assessment
Stillwater Sciences
8‐10
8.2.2.5 Lower River Resident Fish Community In addition to the more general trends in the lower Merced River fish community structure discussed in Section 8.2.2.1, Fish Hypotheses 6 and 7 explored whether differences between high‐flow (2006) and low‐flow years (2007–2008) would affect the longitudinal distribution of fish communities, including the native Foothill Community, Lower Large Tributary Community, and Broad Geographical Range species, especially with reference to earlier surveys conducted by Brown (1993–1995) following a six‐year drought. As discussed in Section 7.3.4.3 and shown in Figure 7‐19, Sacramento sucker was the only native Foothill Community species that appeared to have increased its downstream extent compared to earlier basin‐wide surveys by Brown et al. (2003). However, there were no discernable differences in this species’ distribution between recent high‐flow (2006) and low‐flow (2007) years. There was also no apparent influence of flow conditions on the distribution of Lower Large Tributary fish species related to flow conditions, either in this study or as compared with the previous Brown (1993–1995) surveys, and the fish in this community were widely distributed in the lower Merced River. As mentioned in Section 8.2.2.1, no fish species from the San Joaquin Mainstem #1 Community (Table 5‐11) were observed during this study under any of the flow conditions encountered during sampling. Distribution of the Broad Geographic Range Community, including the native prickly sculpin and introduced smallmouth bass, was variable throughout the Merced Alliance study and did not appear to be affected by flow conditions. Prickly sculpin were not observed in the upper river segment during any sampling season (Figure 7‐19), and their distribution in the lower Merced River was patchy and did not appear to be linked to flow conditions. Relatively low linear densities of smallmouth bass were observed in the lower river segment, with higher densities in the upper river segment and no apparent effect of flow conditions (Figure 7‐19). Overall, comparisons between the Merced Alliance study and results from earlier Brown (2000) surveys do not clearly suggest differences related to flow conditions; however, more focused studies are required to confirm this. 8.2.2.6 Upper River Fish Community Beyond the more general trends in the upper Merced River fish community structure discussed in Section 8.2.2.1, Fish Hypotheses 8 and 9 explored the effect of pool temperatures on trout distribution in the upper river segment and compared estimated densities of rainbow trout, brown trout, and/or Sacramento sucker to historical observations made by Kisanuki and Shaw (1992), prior to a series of river restoration efforts in Yosemite National Park. Based on the fall 2007 and 2008 surveys, preferential use of pool habitats by trout in the upper Merced River did not appear to be due to the effect of water temperature. Pool temperatures were not significantly different between pool and non‐pool habitats (p = 0.2 in 2006, p = 0.12 in 2007) regardless of high‐flow (2006) or low‐flow (2007) conditions,
The Merced River Alliance Project Final Report Volume II: Biological Monitoring and Assessment
Stillwater Sciences
8‐11
and significant thermal stratification within the pools was not observed. There was a lack of trout sampled in the most downstream reaches (Upper Foothills 2 and 3 reaches) during low‐flow conditions in 2007, indicating that they may have moved farther upstream or downstream into the reservoir due to overall warm temperatures and out of all habitats in those lower reaches. One explanation for trout use of pool habitat in the upper Merced River, as thermal refuge does not appear to be a compelling reason based on the Merced Alliance survey results, is that trout use the deepest pools as cover refuge from predators. As discussed in Section 7.3.4.4 pools sampled in fall 2006 were likely still deep enough to provide cover from avian or mammalian predators such as hawks or raccoons, although they averaged approximately 1 m (3.3 ft) shallower in 2007. Examination of the potential effects of habitat improvements between 1991 and 2007 on resident fish species in the upper Merced River indicated that for Sacramento sucker, rainbow trout, and brown trout, fall 2007 densities in the Yosemite Valley Reach were either the same or significantly lower than those of summer 1991 (p < 0.05) (Figure 7‐25). Despite the supposition of differences between “restored” conditions (i.e., 2007) and “pre‐restoration” conditions (i.e., 1991), the results are inconclusive largely because the 1991 sampling methodology (i.e., 1 pass snorkel survey) did not allow for calculation of variance for the fish density estimates. Therefore, for comparisons between 1991 and 2007, it was only possible to conclude if a potential difference was not significant; it was not possible to conclude if a difference was significant. These comparisons also assume that data based on a single snorkel pass are comparable to a bounded‐counts estimate based on multiple snorkel passes. Due to the way the bounded‐counts estimate is calculated (i.e., adding the highest count to the difference between the highest count and the second highest count), it is likely that the bounded‐counts estimate will be greater and closer to the true population value than a single pass estimate. Nevertheless, the 2007 density estimates, which extend into the Lower Batholith Reach and the combined Upper Foothills 1, 2, and 3 reaches, indicated that O. mykiss (rainbow trout) are not particularly abundant in the Yosemite Valley Reach. In 2007, peak linear density of rainbow trout and Sacramento sucker of each life stage tended to occur in the Lower Batholith Reach (Figure 7‐25a,c), which is within the boundaries of Yosemite National Park, but is located downstream of the Yosemite Valley areas presumed to have been restored (Appendix A, Table A‐1). In contrast, linear densities of brown trout were relatively greater in the Yosemite Valley Reach, and no brown trout were found below the Lower Batholith Reach, potentially due to warmer water temperatures outside of brown trout tolerance range (Moyle 2002), or other factors such as predation pressure or physical habitat preferences. Generally, however, 2007 differences in estimated densities between the reaches were not significant (p > 0.05). Overall then, study results suggest that the effects of previous in‐stream habitat restoration in Yosemite National Park cannot be discerned based on data from the two studies, or that brown trout have benefited from restoration more than rainbow trout.
The Merced River Alliance Project Final Report Volume II: Biological Monitoring and Assessment
Stillwater Sciences
8‐12
The observed fish distribution may, in fact, have more to do with temperature and habitat type preferences than the effects of restoration. More targeted monitoring is recommended for future restoration projects in the upper Merced River, with monitoring focused at the reach scale. As recommended for lower river salmonid‐focused enhancement projects, consideration of a Before‐After‐Control‐Impact (BACI) study may be useful for the upper river to adequately test success criteria.
8.2.3 Fish Conclusions At both the basin and segment scales, as well as across seasons, the majority of fish species observed in the Merced River during 2006–2008 were introduced, resident species. However, the number of introduced fish observed versus the number of native fish observed varied at the segment‐ and reach‐scales. Despite the habitat variability inherent to the mainstem Merced River from RM 0 to RM 123, there was a large degree of overlap in fish communities (particularly in the lower river segment) and only broad conformity to more distinct groupings described using the SJRD model (Brown et al. 2003). Overall, comparisons between the Merced Alliance high‐flow (2006) and low‐flow (2007–2008) conditions, and results from earlier Brown (2000) surveys conducted following six years of drought, did not clearly suggest differences in fish community distributions as related to flow conditions. Based on the 2006–2008 fish survey results, resident native fishes including Sacramento sucker, Sacramento pikeminnow, and hardhead appear to be well‐represented in the overall Merced River fish community. While only a few were observed, the native California roach was also present in the mid‐ to upper‐reaches of the lower river segment. The presence of Central Valley fall‐run Chinook salmon, Pacific lamprey, and striped bass in the lower river indicates that anadromous species continue to be able to migrate as far upstream as Crocker‐Huffman Dam in the lower river, with Pacific lamprey apparently ascending Crocker‐Huffman Dam and into the upstream Merced Falls Reach. The number of Central Valley fall‐run Chinook salmon observations was very low (< 350 individuals total) during both spring 2007 and 2008, apparently mirroring recent region‐wide declines of this species (USFWS 2007). Despite this, the distribution of fish that were observed corresponded well to known habitat suitability criteria and to recent results of juvenile Chinook salmon surveys conducted in the Dredger Tailings Reach. In addition to the multiple introduced Valley Floor Community fish species found in the lower river, the particularly invasive redeye bass was observed in the upper river segment. If, as may have been the case in the Cosumnes River (Moyle 2003), the redeye bass is capable of displacing native minnows and suckers, these key members of the Foothill Community in the upper river segment may be susceptible to significant decline. Further study is warranted to confirm the presence of the redeye bass in the upper river segment and to determine whether it is likely to impact native fish populations.
The Merced River Alliance Project Final Report Volume II: Biological Monitoring and Assessment
Stillwater Sciences
8‐13
At the basin‐ and segment‐scale, fish habitat associations conformed to expected trends based on known species’ preferences for a subset of measured physical habitat and water quality variables, including habitat type and water temperature. At the reach scale, the majority of habitat types appear to be supporting a number of fish proportional to the reach‐scale linear extent of the habitat type itself in both river segments. Exceptions to this included primarily margin habitat in the lower river segment and mid‐channel pool habitat in the upper river segment, which support fish at disproportionately higher abundances than their linear extent would suggest. Also in the upper river segment, trout use of pool habitat does not appear to be related to its potential for offering thermal refugia, regardless of high‐flow or low‐flow conditions, and may be more important for providing cover refuge from predators.
8.3 BMI Study 8.3.1 Comparisons to Historical BMI Data A summary of previous and ongoing benthic macroinvertebrate (BMI) studies that were reviewed prior to the Merced Alliance study is presented in Volume 1, Section 5.3.2 of this final report. Extensive re‐analysis of the existing BMI data was necessary to allow direct comparison with Merced Alliance BMI data. Table 8 1 summarizes previously conducted studies and their associated sampling methodologies, as originally presented in the BMAP (Stillwater Sciences 2006a).
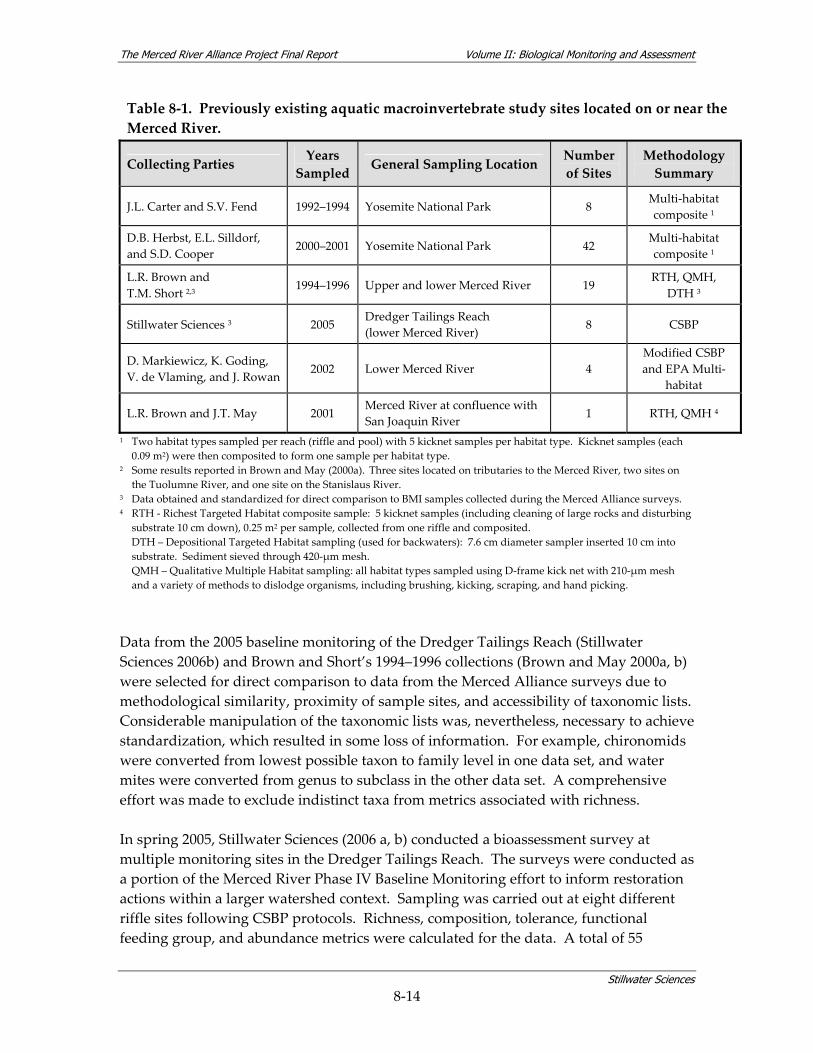
The Merced River Alliance Project Final Report Volume II: Biological Monitoring and Assessment
Stillwater Sciences
8‐14
Table 8‐1. Previously existing aquatic macroinvertebrate study sites located on or near the Merced River.
Collecting Parties Years Sampled
General Sampling Location Number of Sites
Methodology Summary
J.L. Carter and S.V. Fend 1992–1994 Yosemite National Park 8 Multi‐habitat composite 1
D.B. Herbst, E.L. Silldorf, and S.D. Cooper 2000–2001 Yosemite National Park 42
Multi‐habitat composite 1
L.R. Brown and T.M. Short 2,3
1994–1996 Upper and lower Merced River 19 RTH, QMH,
DTH 3
Stillwater Sciences 3 2005 Dredger Tailings Reach (lower Merced River) 8 CSBP
D. Markiewicz, K. Goding, V. de Vlaming, and J. Rowan
2002 Lower Merced River 4 Modified CSBP and EPA Multi‐
habitat
L.R. Brown and J.T. May 2001 Merced River at confluence with San Joaquin River 1 RTH, QMH 4
1 Two habitat types sampled per reach (riffle and pool) with 5 kicknet samples per habitat type. Kicknet samples (each 0.09 m2) were then composited to form one sample per habitat type.
2 Some results reported in Brown and May (2000a). Three sites located on tributaries to the Merced River, two sites on the Tuolumne River, and one site on the Stanislaus River.
3 Data obtained and standardized for direct comparison to BMI samples collected during the Merced Alliance surveys. 4 RTH ‐ Richest Targeted Habitat composite sample: 5 kicknet samples (including cleaning of large rocks and disturbing
substrate 10 cm down), 0.25 m2 per sample, collected from one riffle and composited. DTH – Depositional Targeted Habitat sampling (used for backwaters): 7.6 cm diameter sampler inserted 10 cm into
substrate. Sediment sieved through 420‐μm mesh. QMH – Qualitative Multiple Habitat sampling: all habitat types sampled using D‐frame kick net with 210‐μm mesh
and a variety of methods to dislodge organisms, including brushing, kicking, scraping, and hand picking.
Data from the 2005 baseline monitoring of the Dredger Tailings Reach (Stillwater Sciences 2006b) and Brown and Short’s 1994–1996 collections (Brown and May 2000a, b) were selected for direct comparison to data from the Merced Alliance surveys due to methodological similarity, proximity of sample sites, and accessibility of taxonomic lists. Considerable manipulation of the taxonomic lists was, nevertheless, necessary to achieve standardization, which resulted in some loss of information. For example, chironomids were converted from lowest possible taxon to family level in one data set, and water mites were converted from genus to subclass in the other data set. A comprehensive effort was made to exclude indistinct taxa from metrics associated with richness. In spring 2005, Stillwater Sciences (2006 a, b) conducted a bioassessment survey at multiple monitoring sites in the Dredger Tailings Reach. The surveys were conducted as a portion of the Merced River Phase IV Baseline Monitoring effort to inform restoration actions within a larger watershed context. Sampling was carried out at eight different riffle sites following CSBP protocols. Richness, composition, tolerance, functional feeding group, and abundance metrics were calculated for the data. A total of 55

The Merced River Alliance Project Final Report Volume II: Biological Monitoring and Assessment
Stillwater Sciences
8‐15
distinct BMI taxa were found, including 22 EPT taxa. Orthoclad midges and the mayfly Tricorythodes were numerically dominant at all sites. Tolerance Values for all sites fell within a moderate range (4.8–5.5), indicating moderately tolerant BMI assemblages. There was no observed relationship between richness, composition, or tolerance metrics and site location, indicating that habitat quality is consistent within the DTR. The study also included three gravel augmentation or wing dam sites among the eight sampling locations, but results indicated no relationship between measured metrics and the frequency of site disturbance. However, there did appear to be a small effect of the upstream foothill dams on functional feeding groups in the DTR, with the relative abundance of collector‐filterers decreasing with distance downstream from the dams. A comparison of these samples to those collected from the DTR during the Merced Alliance surveys is discussed in Sections 7.4.1 and 8.3.1. The Merced River was also included in a larger study of macroinvertebrate assemblages in the Sacramento and San Joaquin River Valley drainages (Brown and May 2000a,b). During 1994–1996, BMI data were collected from both the upper and lower segments of the Merced River, as well as from other locations throughout the western Sierra Nevada and California Central Valley. The authors reported that macroinvertebrate assemblages on snags, in addition to those found in riffles, may be useful in family‐level bioassessments of environmental conditions in valley floor habitats. For the riffle samples, elevation was the most important factor determining BMI assemblage structure, while for the snag samples, other factors including land use, specific conductance, and mean dominant substrate were key. Spreadsheets of BMI taxa lists generated by these studies were obtained from the USGS website (http://infotrek.er.usgs.gov/traverse/f?p=NAWQA:HOME:496486380111580). Site descriptions and coordinates were used to match, as close as feasible, monitoring site locations established during the Merced Alliance surveys. The historical data set was generated from 1994 to 1996 from samples collected with a 425 μm mesh net in the fall season using a richest targeted habitat (i.e., riffles) sampling strategy (Brown and May 2000). Therefore, only the Merced Alliance TRC samples were used for comparison. Due to the extensive manipulation of the taxa lists required to attain standardization, a less rigorous comparison was employed with the goal of identifying only large‐magnitude differences. Composite metric scores were calculated as described in Section 5.2.3. Figure 8‐2 shows composite metric scores for both USGS and Merced Alliance data at contiguous sites. The BMI data yielded from the Brown and May (2000a, b) studies and the Merced Alliance data were remarkably similar considering the differences in sampling net mesh size, net type, laboratory processing procedures and taxonomic resolution. However,
The Merced River Alliance Project Final Report Volume II: Biological Monitoring and Assessment
Stillwater Sciences
8‐16
the quality of data and efficiency of integrating data sets would be greatly enhanced with regional standardization of procedures including taxonomic effort. The comparison indicates that the Brown and May (2000a, b) and Merced Alliance BMI composite metric scores are similarly distributed among the sites, with significant partitioning between the site groups upstream and downstream of the foothill reservoirs (Figure 8‐2). Additionally, as shown in Figure 8‐2, two Merced Alliance monitoring sites in the foothill region contained high relative abundances of black flies, which contributed to decreased metric values associated with richness and altering composition. These black fly populations appear highly localized, as indicated by site UF3‐B4 in fall 2007 where the sample and its duplicate sample had a large disparity in the relative abundance of black flies: 75 percent relative abundance in one sample and 5 percent relative abundance in the second sample, identified as the duplicate. In addition, the Brown and May (2000a, b) sample collected between the UF2 and UF1 sites in 1994 had a moderate abundance of black flies (approximately 20 percent), which may have influenced its score.
8.3.2 Evaluation of New BMI Data 8.3.2.1 Multi‐habitat versus Targeted Riffle Sampling BMI sampling for aquatic bioassessment purposes has traditionally targeted riffles as the richest habitat (Harrington 1999). More recent protocol in California (i.e., SWAMP) outlines two types of samples to be collected: one taken from only riffles and one taken from regular intervals within the site boundary, which usually results in the sampling of multiple habitat types. Results from the Merced Alliance study showed that despite higher richness and diversity values in MHC vs. TRC samples, the overall biological signals from both sample types were similar. As stated in Section 7.4.1.1 under multimetric evaluation, MMI values for TRC and MHC samples followed similar trends and were highly correlated (r = 0.89). This means that as the MMI values of one sample type increased, there was a concomitant increase in the MMI values of the other sample type. Furthermore, at sites where both sample types were collected there was no significant difference in MMI values between MHC and TRC samples (Wilcoxon, p = 0.8, n = 78 site pairs). Despite this, TRC samples consistently exhibited both higher abundance and biovolume than MHC samples. Some of the disparity in biovolume can be attributed to differences in velocity at the point of collection; in habitats with higher velocity, the current facilitates transfer of organisms into the net. Therefore, while overall richness and diversity are increased by sampling multiple habitat types, capture efficiency (especially of larger organisms), is reduced. These results have several implications for study design: 1) in the Merced Alliance study, MHC samples were more likely than TRC samples to contain fewer than the standard 500‐organism subsample, which hinders
The Merced River Alliance Project Final Report Volume II: Biological Monitoring and Assessment
Stillwater Sciences
8‐17
overall comparability among all the samples; 2) due to lower abundance, MHC samples take longer to process in the laboratory (i.e., the length of time required to subsample 500 BMI increases with decreasing density of organisms); and 3) the consistency of biological signal between the two sample types suggests that, given adequate riffle habitat, collecting only TRC samples in larger rivers may be more efficient and less costly than collecting both. The high similarity in biological signal between MHC and TRC sample types is supported by Rehn et al. (2007b), in which the authors documented similar results for an even larger data set collected from a broader spatial scale. 8.3.2.2 Community Composition and Distribution There was a clear partitioning of taxonomic composition between upper river sites (upstream of the foothill reservoirs) and lower river sites (downstream of the foothill reservoirs). This grouping with respect to the river segments and the presence of reservoirs was also apparent in the MMI values. MMI values for monitoring sites in the upper Merced River consistently exceeded those in the lower Merced River. In addition, all sample units in the lower Merced River received a MMI value less than 42, whereas the majority (84%) of MMI values for sample units in the upper Merced River exceeded 40. While the MMI is useful for identifying patterns in relative BMI assemblage quality at monitoring sites throughout a given project area, there are limitations to its use for the Merced Alliance study. The primary limitation is that the component metrics and scoring criteria were developed for reference and test sites upstream of the California Central Valley floor (Rehn et al. 2007a, Rehn 2008). As a result, MMI values for sites within the lower segment of the Merced River downstream of the foothill reservoirs should be considered only in the context of how BMI assemblages change along the elevation gradient of the project area, and not in the context of absolute site quality. It is likely that a different suite of metrics would be more appropriate for characterizing sites of river and stream systems on or near the valley floor. For example, Odonata (damselflies and dragonflies) could replace Plecoptera (stonefly) in the EPT metric for characterizing sites in the warmer low foothill and valley regions (Markiewicz et al. 2003). However, without suitable reference conditions in the valley and low foothills, even metric selection and screening would be difficult. 8.3.2.3 Seasonal Patterns A seasonal effect on BMI assemblages as indicated by the robust EPT taxa metric was weak or negligible. There were no differences in EPT taxa values between seasonal sampling events for the valley and mountain site groups. While there was a difference in the foothill site group, it was between the two fall data sets. The significantly lower mean EPT taxa values in fall 2007 were likely due to the localized high populations of black flies in the Upper Foothills 3 reach, which affected metrics associated with richness and composition. Whether or not the increase in localized black fly populations was a
The Merced River Alliance Project Final Report Volume II: Biological Monitoring and Assessment
Stillwater Sciences
8‐18
result of lower river flow in the fall 2007 (see Section 7.2.2), natural annual variation, or other factors is unknown. 8.3.2.4 Physical Habitat Effects The qualitative total physical habitat quality score assigned to each site during each sampling event was included in the NMS ordination, but it was not included in the joint plot of environmental variables because its coefficient of determination was less than the 0.25 threshold (i.e., explained less than 25% of the variation of any of the axes). It was, however, moderately correlated with the elevation axis (axis 3, r = 0.41). Habitat quality scores were clustered into two groups with several relatively low scores (<120) grouped at the lowest elevation sites (100 ft and less) and the remainder of scores ranging mostly from 120 to 190 throughout the elevation range of the watershed. While Pearson correlations of total habitat quality scores and biological metrics indicated significant correlation for many metrics, the strength of the correlations was weak (|r|< 0.4) except for percent tolerant taxa (r = ‐0.44, p < 0.0001). Overall, the habitat scores indicated that over 90 percent of the habitat assessments yielded scores in the optimal to suboptimal range. As discussed in Section 7.4.1.2, changes in habitat variables were moderately correlated with shifts in biological metrics and BMI taxonomic composition, primarily along the elevation gradient of the watershed. However, it is likely that the reservoir and other anthropogenic factors were also contributing to these differences, both in terms of taxonomic composition and biological metrics. Yet, conclusively isolating these factors and their effects would be difficult, especially without suitable biological reference conditions established for the valley and low foothill regions of California’s major river systems. 8.3.2.5 Exotics Survey The Merced Alliance BMI exotics survey found no New Zealand mud snails (Potamopyrgus antipodarum) during field sample collections or sample processing of approximately 85,000 benthic organisms. Chinese mitten crabs (Eriocheir sinensis) were not encountered in traps targeting them, nor were they encountered during field sample collections of BMI. Distribution of the Asian clam (Corbicula) was restricted to sites downstream of the foothill reservoirs. No Corbicula individuals were encountered during field sample collections upstream of the foothill reservoirs or during processing of samples collected upstream of the foothill reservoirs 8.3.2.6 BMI and Large Woody Debris The lack of relationship between BMI and woody debris (as measured by FWM) was unexpected and contrary to several previous studies (Kaufman et al. 1999) and summarized by Allan (1995). This result, however, may be attributable to the overall sparse distribution of woody material recorded at sites throughout the river. Of the total
The Merced River Alliance Project Final Report Volume II: Biological Monitoring and Assessment
Stillwater Sciences
8‐19
177 FWM measurements, 73% of the assessments yielded FWM values of less than 1% and 88% of the assessments yielded FWM values of less than 5%. This sparse and uneven distribution of FWM with many zero values (66% of measurements) precludes the establishment of a definitive relationship between BMI and FWM for this project. The sparse and uneven distribution of FWM documented at sampling transects during BMI surveys conducted in 2006 and 2007 was supported by results of the habitat mapping conducted in fall 2005, which indicated a lack of LWD in the Upper Foothills reaches (Figure 7‐3 and Figure 8‐3). As discussed in Section 8.1, the absence of LWD may be due to scouring from generally higher flows in the Upper Foothills reaches as compared with the upstream Lower Batholith and Yosemite Valley reaches, as well as the January 1997 flood event which caused transport of massive amounts of woody material (31,000 m3 [40,450 yd3] [T. Selb, pers. comm. 2008]) downstream to Lake McClure (White 1997a, 1997b, 1997c). The relatively narrow riparian zone in the Upper Foothills 1, 2, and 3 Reaches, as measured during the Merced Alliance avian study (Figure 7‐45), combined with general lack of forests on adjacent upland slopes in these reaches, suggests that recruitment potential for LWD (or FWM) in the Upper Foothill reaches may be low. Even eight years later, this may explain the almost complete lack of LWD observed in the Upper Foothills reaches during the Merced Alliance surveys. In addition, the application of the multi‐habitat assessment procedure to this river system was limited at many sites due to high discharge, which reduced the number of transects at which substrate character could be assessed along transects. Therefore, analysis of the relationship between relative abundance of FWM and composite metrics scores was limited to substrate data taken at the sample point only. 8.3.2.7 Habitat Restoration Effects EPT richness was not significantly different between sampled reaches where habitat restoration or channel reconfiguration was conducted and reaches in which it was not, contradicting BMI Hypothesis 5. Nevertheless, concluding that restoration has not enhanced habitat at these sites is likely premature. In accordance with the primary objectives of the Merced Alliance study, the BMI data set is an extensive longitudinal profile of invertebrate assemblages in the river. Data at this scale may not be suitable for detecting biological signals that are local in extent. To more adequately address the efficacy of future restoration efforts on the Merced River, sampling should be repeated temporally at locations proximal to the habitat augmentation. In addition, expanding the analysis to include other metrics may address the question more comprehensively. Several sites within the Gravel Mining Reach, including sites GM2‐B2 (restoration site), GM2‐B2 and GM1‐B1, were previously identified in Figure 7‐32b (Section 7.4.1.2) as being outliers within the monitoring site group downstream of the foothill reservoirs, because of relatively high MMI values in fall TRC sample sets related to the abundance of the scraping caddisfly, Protoptila. Further review of the taxa list indicates that other
The Merced River Alliance Project Final Report Volume II: Biological Monitoring and Assessment
Stillwater Sciences
8‐20
scrapers were commonly sampled from the Gravel Mining Reach, notably heptageniid mayflies, Ecdyonurus criddlei and Heptagenia. All of these taxa contribute to EPT richness and influence the magnitude of the non‐Gastropoda scraper metric, which at least partially explains the relatively high MMI values for the Gravel Mining Reach in the fall TRC sample set (Figure 7‐32b). However, if gravel/cobble augmentation was restricted to site GM2‐B2 only, then enhancement of BMI assemblage quality was not indicated by either EPT taxa or MMI values. 8.3.2.8 Serial Discontinuity and BMI Functional Feeding Groups Despite a clear partitioning of monitoring sites in the Merced River watershed with respect to the foothill reservoirs by both ordination and MMI values, serial discontinuity in relative abundance of collector‐filterers (CF) was not apparent as stated in BMI Hypothesis 3. As described under MMI evaluation in Section 7.4.1.1, black fly populations were high at most of the Upper Foothills Reach 3 sites, particularly in fall 2007. These black flies contributed to the relatively high CF relative abundance documented upstream of the reservoir. Hydropsychid caddisflies were a primary contributor to the CF metric at DTR sites downstream of the reservoir and black flies also contributed to the CF functional feeding group at DTR/MF sites, but not enough to overcome the combined abundances of individuals composing the CF functional feeding group at the Upper Foothills Reach 3 monitoring sites. Hydropsychid caddisflies and black flies have been shown to be abundant at sites downstream of reservoirs previously by Ward and Stanford (1995) and Spence and Hynes (1971). In addition, numerous other effects of reservoirs on BMI assemblages have been described (Armitage 1982, Petts 1984, Baxter 1977, Brunke et al. 2001, Brusven 1982, Camargo and Voelz 1998, Cushman 1985, Lehmkuhl 1972, Stanford and Ward 2001). Petts (1984) compiled studies indicating that reservoir effects on downstream fauna depend on operational characteristics and management of the dam/reservoir system, depth of release point, locale, capacity and other factors. Most aquatic non‐insect taxa, including amphipods and isopods (Malacostraca), have an entirely aquatic life stage potentially making them more likely to be affected by serial discontinuity. Because most non‐insect BMI taxa do not have a terrestrial (i.e. aerial) stage, it is generally more difficult for them to ascend to riverine habitats upstream of dam/reservoir systems than aquatic insects with an adult aerial stage. In addition to malacostracans, other non‐insect taxa including flatworms, oligochaetes, and molluscs were more abundant downstream of the foothill reservoirs. This taxonomic disparity was likely a major factor in the clustering of samples as depicted by the ordination plot of the upper and lower river (Figure 7‐26). Brown and May (2000) also listed amphipods among some of the non‐insect taxa that contributed to a strong biological
The Merced River Alliance Project Final Report Volume II: Biological Monitoring and Assessment
Stillwater Sciences
8‐21
response to elevation gradients, with increasing populations occurring in valleys and low foothill regions.
8.3.3 BMI Conclusions The Merced Alliance bioassessment produced standardized aquatic invertebrate data throughout the valley, foothill and mountain regions of the mainstem river, which can provide a baseline for future assessments for either targeted riffle or multihabitat sampling strategies. As discussed in Section 8.3.1, previous bioassessment studies have shown that BMI community structure throughout the Merced River is shaped by flow variation and discharge, water quality, elevation, land use, and food web dynamics. The results of the Merced Alliance BMI component are largely concordant with these findings. Although taxonomic standardization would allow more detailed comparison, integration of historical BMI data with that generated during the Merced Alliance surveys demonstrated consistent results. The Merced Alliance BMI study documented 1) an effect of elevation and other related environmental variables on habitat and BMI taxonomic composition and biological metrics, 2) a general consistency of biological signals for three discreet elevation regions for the three sampling events, 3) higher abundance and biovolume in TRC samples than in MHC samples, a factor likely attributed to enhanced capture efficiency of larger organisms in riffle habitats, 4) elevated taxonomic richness and diversity in MHC samples compared to TRC samples, and 5) high correlation of the overall biological signals, despite differences in individual metrics, produced from MHC and TRC samples. In addressing the secondary hypotheses, low levels of FWM were noted, particularly at monitoring sites in the Upper Foothills 1, 2, and 3 reaches of the Merced River. This precluded a conclusive assessment of the relationship between BMI composition and woody debris for the overall study. The lack of FWM in the Upper Foothills 1, 2, and 3 reaches was unexpected, however it may have been due to the January 1997 flood event which caused massive amounts of woody material to be scoured from the channel and transported downstream to Lake McClure (White 1997a, 1997b, 1997c). In addition, the effect of site restoration on BMI assemblage quality was not apparent using a single biological metric or an MMI as response variables for mountain and valley sites. However, elevated MMI values at several Gravel Mining Reach sites in riffle habitat in the fall season were uncharacteristic for the site groups in the lower Merced River, indicating that the extent of gravel/cobble augmentation during restoration activities should be verified prior to concluding that there was actually no effect on the BMI assemblage. Finally, even though significant disparity was not found between the collector‐filterer functional feeding group upstream and downstream of the foothill reservoirs, Merced Alliance BMI results suggest serial discontinuity of non‐insect taxa as a result of the dam/reservoir system.
The Merced River Alliance Project Final Report Volume II: Biological Monitoring and Assessment
Stillwater Sciences
8‐22
Overall, BMI assemblages responded in an expected manner to habitat factors associated with changes in elevation; nevertheless, other unidentified elements are likely contributing to the differences in BMI assemblage quality observed above and below foothill reservoirs. Factors influenced by the dam/reservoir system, including flow, temperature, abundance of particulate organic matter, and fluvial geomorphology, likely affect BMI assemblages. Isolating the effects of these individual factors, however, is difficult without suitable biological references established in valley and lower foothill regions of California. Furthermore, without suitable knowledge of biological reference conditions, interpretation of signals from the lower river segment may be misleading and could lead to costly and possibly counterproductive remediation efforts. Markiewicz et al. (2003) initiated the development a regional biotic index for California Central Valley waterways in 2002, yet were only able to assess relative metric response due to a lack of reference sites. The development of an effective absolute biotic index for the California Central Valley would require an assessment of metrics along a clear stressor gradient established between reference and test sites, analogous to that used by Rehn et al. (2007) and Rehn (2008) for foothill and mountain regions in California. Such an endeavor will be challenging as the flow regimes and aquatic habitats for most of the California Central Valley waterways are significantly altered or regulated.
8.4 Avian Study 8.4.1 Comparisons to Historical Avian Data A summary of avian data sources reviewed prior to the Merced Alliance surveys is presented in Volume 1, Section 5.3.2 of this final report. As discussed in the BMAP (Stillwater Sciences 2006a), avian data have been collected from the lower Merced River and Yosemite National Park within the past one to seven years, while data from BLM lands have been collected incidental to other wildlife observations that occurred during the late 1970s. In addition, information from the University of California, Berkeley Museum of Vertebrate Zoology (MVZ) and the California Natural Diversity Database (CNDDB) date from 1915. However, as these historical avian studies were conducted using a variety of sampling methodologies, inter‐project comparisons are difficult to make. In general terms, the overall number of species detected during the Merced Alliance surveys was lower than reported in pre‐1940s and recent MVZ compilations. Rough comparisons of species diversity between previous studies and the Merced Alliance surveys at common monitoring sites along the lower river corridor (e.g., CON‐A1, GM2‐A1, DTR‐A1, DTR‐A2) indicate some similarities, with diversity values for both studies typically ranging from 4 to 6 for the Gravel Mining and Dredger Tailings sites, but roughly twice as much diversity observed during Merced Alliance surveys for the common Confluence Reach site (CON‐A1) (Table 25 in Stillwater Sciences [2006b] and Figure 7‐40 of this final report). Additional analysis would be required to confirm that these rough comparisons are reasonable, however, given the potentially different sampling methods and survey timing. Further discussion of the comparison between
The Merced River Alliance Project Final Report Volume II: Biological Monitoring and Assessment
Stillwater Sciences
8‐23
the Merced Alliance survey data and the Grinnell and Storer (1924) surveys is presented below. Historical surveys, conducted by Grinnell and Storer (1924) between 1911 and 1920 in Yosemite National Park (YNP) and the eastern edge of the San Joaquin Valley, provide the first detailed accounts of the area’s breeding bird communities and have served as baselines for subsequent studies. Avian studies have been conducted since the 1920’s, mostly within Yosemite National Park and within the last few decades. The methods used during Grinnell’s time differ substantially from contemporary methods, making direct comparisons of relative bird abundance difficult to undertake. Nonetheless, the differences between Grinnell’s survey results and more contemporary survey results are striking for many species. Species formerly described as “common” or “fairly common” by Grinnell and Storer (1924) are now absent as breeders from large portions of their former range. Conversely, some species notably absent from the historical survey sites are now present in large numbers. A comprehensive re‐survey of the Grinnell and Storer study is provided by Moritz (2007) and includes an analysis of the substantial changes in the bird community of Yosemite National Park. The Merced Alliance surveys, though not designed to replicate historical surveys, were conducted in some of the areas surveyed by Grinnell and Storer (1924). Specifically, historical transects such as Snelling (Merced Alliance site DTR‐A1), El Portal (LB‐A1) and Yosemite Valley (YV‐A1 and YV‐A3) were likely near or overlapped with the specified 2006–2007 Merced Alliance survey sites. Bird species recorded on the Snelling transect during Grinnell’s time that were not detected during the Merced Alliance surveys include Bell’s Vireo, Willow Flycatcher and Swainson’s Thrush. These species have experienced dramatic range reductions in the Central Valley and Northern Sierras where they formerly bred (Sedgwick and Knopf 1988, RHJV 2004, Gardali et al. 2006, Siegel et al. 2008). Riparian habitat loss and degradation, parasitism by the Brown‐headed Cowbird, and other factors likely contributed to these declines. The Brown‐headed Cowbird is an obligate brood parasite that lays its eggs in the nests of songbirds leaving the burden of rearing its young to the host, usually at the expense of the host’s young. For other species commonly detected during Grinnell’s time (e.g., Yellow Warbler, Warbling Vireo and Yellow‐breasted Chat), more data are needed to determine their current status as breeders at DTR‐A1. On the Valley floor (sites in the Confluence and Encroached reaches) Yellow Warbler, Warbling Vireo and Yellow‐breasted Chat are largely absent as breeders where they once bred (Grinnell and Miller 1944). Historical data summarized from Grinnell and Storer’s (1924) El Portal transect were from early spring (27 April 1916) and likely included many non‐breeding migrants. Merced Alliance surveys at El Portal (LB‐A1) were conducted in May and June 2006 and failed to detect Warbling Vireo, Lazuli Bunting and Chipping Sparrow, which were
The Merced River Alliance Project Final Report Volume II: Biological Monitoring and Assessment
Stillwater Sciences
8‐24
detected during the Grinnell surveys. More data are needed to determine the status of Warbling Vireo, Lazuli Bunting and Chipping Sparrow at LB‐A1. Willow Flycatcher and Swainson’s Thrush are two notable species detected in numbers during historical breeding season surveys in Yosemite Valley and absent from the 2006–2007 Merced Alliance point count surveys. By the 1940s, both species were already scarce in Yosemite Valley (Gaines 1977). A recent study by Siegel et al. (2008) concluded that the Willow Flycatcher, a species frequently parasitized by the Brown‐headed Cowbird (Sedgwick and Knopf 1988), no longer breeds in YNP. Both species also rely on low, dense riparian vegetation for nesting, which has been reduced and/or degraded in many areas along the Merced River in Yosemite Valley. Some of these degraded areas are currently being restored and may once again offer potential nesting habitat for Willow Flycatcher and Swainson’s Thrush. Other species such as Chipping Sparrow were historically present in Yosemite Valley in large numbers but were scarce during the Merced Alliance surveys as well as the Grinnell re‐surveys described by Moritz (2007). This apparent decrease in Chipping Sparrow abundance was also noted by Gaines (1977). Chipping Sparrows are associated with open areas and dry meadows that in many areas of Yosemite Valley have been encroached upon by conifers. Many other breeding species in Yosemite Valley (Dusky Flycatcher, Lazuli Bunting, and Ruby‐crowned Kinglet) appear to have decreased or vanished since the historical surveys were conducted. Conversely, a number of species detected during the 2006–2007 breeding seasons were not represented in the historical surveys of Yosemite Valley, including Brown‐headed Cowbird, Bullock’s Oriole, Common Raven, Song Sparrow, and Chestnut‐backed Chickadee. The increase in Brown‐headed Cowbirds in YNP was poorly documented but likely occurred sometime after the 1940s (Gaines 1977). Likewise, the increase in Common Ravens in YNP probably occurred after the 1950s possibly due to the increase in roads and the road‐killed animals on which they feed (Gaines 1977). Unlike the Brown‐headed Cowbird, the Common Raven’s impact on the songbird community is probably negligible.
8.4.2 Evaluation of New Avian Data 8.4.2.1 Community Composition and Distribution The majority of bird detections during the 2006 and 2007 breeding season point counts were songbirds. The lower Merced River exhibited higher species diversity in the breeding season (Figure 7‐40a) relative to the upper Merced River (Figure 7‐40b). Sites in the Confluence and Encroached reaches of the lower river corridor possessed the highest species diversity during the breeding season. Similarly, during fall migration there was greater diversity in the lower portion of the watershed relative to the upper portion. Avian community composition varied across seasons and between the upper and lower segments of the Merced River, with greater numbers of species observed
The Merced River Alliance Project Final Report Volume II: Biological Monitoring and Assessment
Stillwater Sciences
8‐25
during the breeding season and higher numbers of unique species found in the lower Merced River corridor as compared with the upper Merced River. While there was a notable difference between avian community composition in the upper and lower river corridor during 2006–2007, some of the species listed as unique to either the upper or the lower river corridor may have been present in both segments but were not detected during the 2‐year study. For example, Hutton’s Vireo may also be present in the lower river corridor but in very low abundance. Many of the species unique to the lower river corridor were birds associated with open water habitat or wetlands (e.g., Black‐Crowned Night Heron, Common Moorhen, Double‐crested Cormorant, Forster’s Tern, Great Blue Heron, Great Egret, Green Heron, Pied‐billed Grebe, and Wood Duck). Wetland habitat, while included in the landscape‐level vegetation analysis for the lower river corridor, was limited in extent, particularly outside of the Dredger Tailings Reach, and it was thus combined with seven other vegetation classes into a single riparian cover metric (Table 5‐20). Despite the lack of resolution for lower river corridor wetland habitat at the landscape level, wetland‐associated bird species observed during the Merced Alliance surveys contributed to the overall higher species diversity found in the lower river corridor. This finding corresponds to results from recent (2004–2005) avian surveys in the lower river corridor, where avian use of three common habitat types was investigated as a portion of the CALFED Merced River Phase IV Baseline Monitoring effort to inform restoration actions within a larger watershed context (Stillwater Sciences 2006b). Using multiple relevé plots at two monitoring sites common to both projects, Henderson Park (DTR‐A1) and Merced River Ranch (DTR‐A2), the CALFED study showed that of the three habitat types sampled, mixed riparian habitat and wetland swale habitat provided similar avian habitat in terms of number of individuals, species richness, and species diversity. Further analysis of the data indicated that although wetland swales and mixed riparian habitat exhibited similar metric values, the two types of habitat supported different avian communities: for the combined site data a greater number of unique bird species (17) were observed in wetland swale habitat, as compared with mixed riparian habitat (2). Based on the results of both the watershed‐scale Merced Alliance surveys and the reach‐specific CALFED study, wetlands such as those found in the Dredger Tailings Reach appear to contribute greatly to the overall species diversity of the lower river corridor and should be considered as important habitat during restoration planning. 8.4.2.2 Avian Abundance Avian abundance was determined for a subset of the species we encountered, which we referred to as focal species. In some cases, focal species abundance varied in relation to river segment, riparian width, local patch characteristics, and/or landscape metrics (as detailed in the following sections). Examining the abundance of individual species is crucial in restoration and wildlife management studies. For many projects, the goal of restoration is to create habitat to benefit wildlife, yet many projects do not adequately
The Merced River Alliance Project Final Report Volume II: Biological Monitoring and Assessment
Stillwater Sciences
8‐26
measure wildlife response to restoration (e.g., how abundance varies among sites). When projects do measure wildlife response, they often rely on community‐level metrics; however, different species may not respond similarly to environmental influences so it is preferable to also have information on individual species. Alternately, some studies only focus on a few (or worse) a single listed species to describe baseline conditions and evaluate and guide conservation actions. Listed species tend to be rare, making it difficult or impossible to collect sufficient data upon which to base future management recommendations, and it is difficult to draw management inferences from data collected on only one species. A focal species analysis provides more information. The actual set of focal species used varied depending on the objective or hypothesis, as the presence and abundance of species varied between the river segments. An original intention of the study was to model avian detection rates to account for differences in detectability between the upper and lower river segments which would presumably be due to differences in habitat (Valley Foothill Riparian, Montane Riparian, coniferous, etc.) However, most of the analyses were conducted for each river segment separately, thereby accounting for any differences in detectability. Another reason for modeling detection rates is to estimate density and ultimately to estimate population parameters, which were beyond the scope of this project. 8.4.2.3 Vegetation and Landscape Effects Results of the Merced Alliance avian study component indicate that local riparian patch variables were often good predictors of species‐specific abundance or overall bird species diversity, but that the specific predictors differed among riparian‐associated songbirds. This result is similar to findings from elsewhere in the Central Valley (Nur et al. 2008). However, different predictor variables were identified in analyses of the upper Merced River vs. the lower Merced River within the same species. This finding suggests that bird response depends on the ecological context, and particular responses may be confined to only one eco‐region. Thus, models developed for one region should not be quickly generalized to other regions for that species (Nur et al. 2008). In every case where it was possible to make a comparison, the local riparian patch variables provided models with higher explanatory power than models that only incorporated adjacent landscape information. However, these results should be qualified by noting that the landscape models included only a set of six potential predictors, compared to the more detailed local riparian patch models possessing 33 potential predictors. Urban density was the landscape variable most often included in the models, especially in the upper river corridor, and it displayed a negative effect on species diversity and focal species abundance. Rottenborn (1999) also found negative effects of urban development on species richness and density of riparian species. Paradoxically, although avian species diversity declined with increasing urban density within 1 km, diversity increased with increasing urban cover. While this latter
The Merced River Alliance Project Final Report Volume II: Biological Monitoring and Assessment
Stillwater Sciences
8‐27
relationship might suggest a correlation with urban sprawl, the urbanization in the upper Merced River corridor is very limited compared to the lower river corridor and is not comparable to the patterns of urbanization that characterize the lower river corridor. Crooks et al. (2004) and others (Blair 1996) found that bird species richness was positively affected by moderate levels of urban development, and they suggest that the presence of bird feeders and non‐native vegetation associated with urbanization allows native and non‐native birds associated with humans (e.g., American Robins, House Sparrows) to co‐occur with the suite of species usually associated with a given vegetation or habitat type (e.g., riparian or coniferous forest), thereby increasing local species richness. It should be noted that the limited urban development in the upper portion of the Merced River watershed tends to occur in areas possessing a wide floodplain (e.g., Yosemite Valley) and these same areas also support more extensive riparian areas than the more confined stretches of the river corridor (e.g., the Upper Foothills reaches). 8.4.2.4 Riparian Zone Width and Cover The extent of riparian cover and riparian zone width were both highly important variables at the landscape‐scale. Not only did these two measures of riparian habitat correlate highly with some (but not all) focal species investigated, but also the two metrics also provided good predictors of overall species diversity. The striking difference in species diversity, comparing the lower portion of the Merced River watershed to the upper potion (7.8 ± 0.3 [SE]) vs. 4.4 ± 0.2 [SE]; Figure 7‐40a‐b), can be at least partly understood within the context of riparian cover in the landscape and riparian zone width. Average riparian zone width in the lower river corridor was 92.2 ± 13.1 [SE] m, as compared with 23.1 ± 2.8 [SE] m in the upper river corridor (Figure 7‐45). Nevertheless, differences in overall species diversity were still significantly different (p < 0.0001) between the upper and lower river, even after controlling for riparian patch width or riparian cover. Although study results indicated that riparian habitat characteristics as well as local vegetation measures provided good predictive models for focal species abundance and overall species diversity, the same was not true for overall shrub cover. In fact, the effect of shrub cover, after controlling for tree cover, was weak and non‐significant with respect to species diversity and seven out of the 10 focal bird species analyzed. In contrast, specific shrub species provided good predictor variables of focal species abundance and overall species diversity. These results suggest that, for many birds, shrub cover in general is not as important as what type of shrub is available. Alternatively, birds may be cueing in on some other vegetation structure (MacArthur 1965) and not simply percent cover of shrubs. For example, overall bird species diversity was positively associated with structural characteristics typical of mature riparian forests (% cover of vegetation > 5 m in height, maximum tree dbh and density of large snags; Table 7‐22). Many species had significant associations (both positive and
The Merced River Alliance Project Final Report Volume II: Biological Monitoring and Assessment
Stillwater Sciences
8‐28
negative) with vegetation structure at varying heights from the ground including the shrub layer. Local riparian patch models for Ash‐throated Flycatcher and the analyses of shrub cover both demonstrate the importance of shrubs (berry cover specifically and shrub cover in general) to this species. One might assume that Ash‐throated Flycatcher would not be associated with shrub characteristics given its natural history (a cavity nester that largely feeds aerially on flying insects). However, results from two different analyses point to the importance of shrubs for this species. This association with shrubs is corroborated by others as summarized by Cardiff and Dittmann (2002).
8.4.3 Avian Conclusions Results of the Merced Alliance avian study component underscore the importance of the upper and lower segments of the Merced River to a large variety of bird species, especially songbirds, throughout the year, and particularly during the breeding season. Moreover, the lower river segment may be particularly important for raptors. Birds in both segments of the Merced River appear to be responsive to a suite of variables, including local riparian patch and landscape factors, which all influence avian abundance, diversity and community composition to some degree. Management recommendations should be tailored to the region of the river as the set of factors important in one region were not always important in the other region. Species diversity was strongly related to measures of riparian cover or riparian patch width in both regions. Future restoration efforts should thus take into consideration riparian zone width and specific plant species (as opposed to a generic grouping of shrub plants) that are associated with riparian birds along the Merced River.
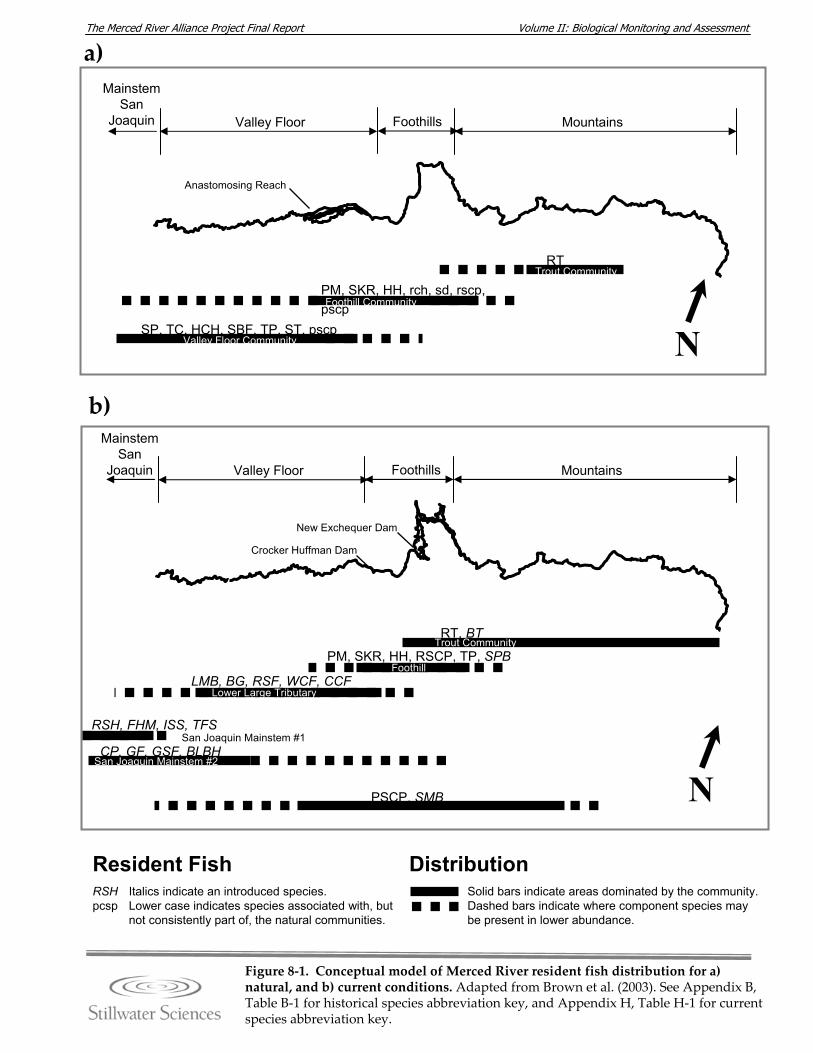
Volume II: Biological Monitoring and Assessment The Merced River Alliance Project Final Report
a)
b)
Crocker Huffman Dam
New Exchequer Dam
CP, GF, GSF, BLBHSan Joaquin Mainstem #2
PSCP, SMB
RT, BTTrout Community
PM, SKR, HH, RSCP, TP, SPBFoothill
LMB, BG, RSF, WCF, CCFLower Large Tributary
RSH, FHM, ISS, TFSSan Joaquin Mainstem #1
Foothills MountainsValley Floor
N
Mainstem San
Joaquin
SP, TC, HCH, SBF, TP, ST, pscpValley Floor Community
PM, SKR, HH, rch, sd, rscp,pscpFoothill Community
Anastomosing Reach
Foothills MountainsValley Floor
Mainstem San
Joaquin
RTTrout Community
N
Figure 8‐1. Conceptual model of Merced River resident fish distribution for a) natural, and b) current conditions. Adapted from Brown et al. (2003). See Appendix B, Table B‐1 for historical species abbreviation key, and Appendix H, Table H‐1 for current species abbreviation key.
Solid bars indicate areas dominated by the community. Dashed bars indicate where component species may be present in lower abundance.
RSH Italics indicate an introduced species. pcsp Lower case indicates species associated with, but
not consistently part of, the natural communities.
DistributionResident Fish
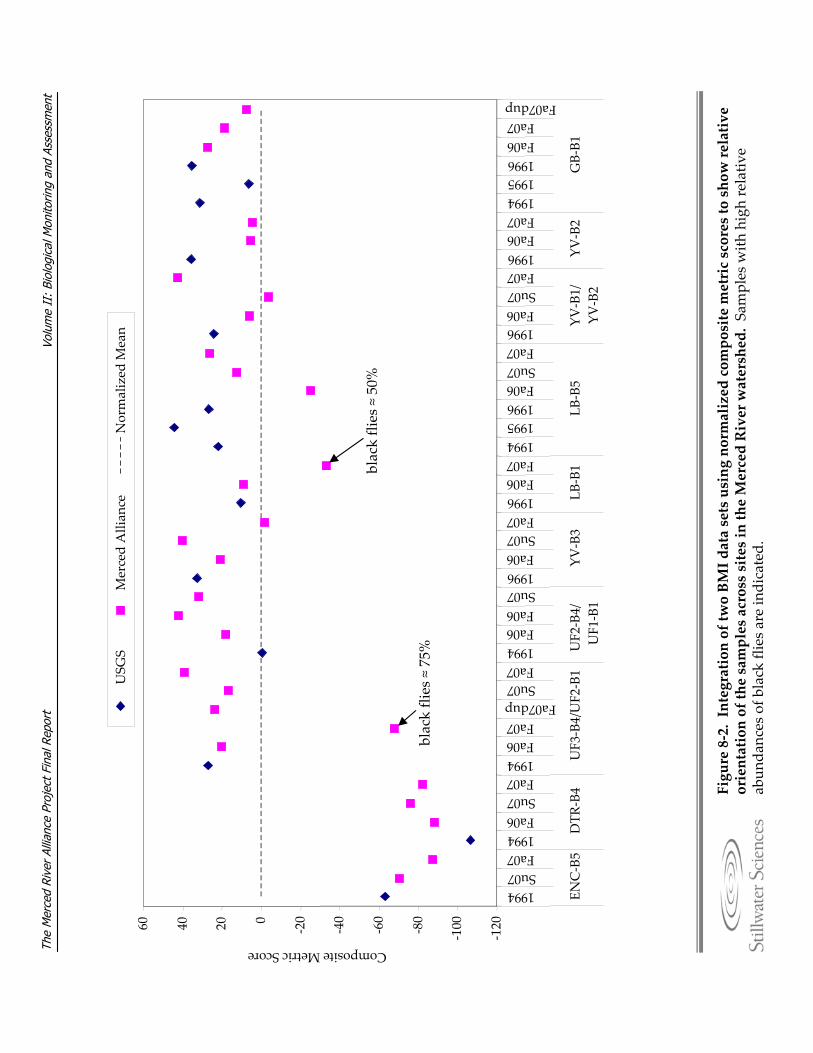
Volu
me
II:
Biol
ogic
al M
onito
ring
and
Asse
ssm
ent
The
Mer
ced
Rive
r Al
lianc
e Pr
ojec
t Fin
al R
epor
t
Figure 8‐2. Integration of two BM
I data sets using normalized composite metric scores to show relative
orientation of the samples across sites in the Merced River watershed. Samples w
ith high relativ
e abun
dances of b
lack flies are indicated.
‐120
‐100‐80
‐60
‐40
‐200204060
1994Su07Fa071994Fa06Su07Fa071994Fa06Fa07
Fa07dupSu07Fa071994Fa06Fa06Su071996Fa06Su07Fa071996Fa06Fa07199419951996Fa06Su07Fa071996Fa06Su07Fa071996Fa06Fa07199419951996Fa06Fa07
Fa07dup
ENC‐B5
DTR‐B4
UF3‐B4/UF2‐B1
UF2‐B4/
UF1‐B1
YV‐B3
LB‐B1
LB‐B5
YV‐B1/
YV‐B2
YV‐B2
GB‐B1
Composite Metric Score
USG
SNormalized M
ean
black flies ≈75%
black flies ≈50%
Merced Allian
ce
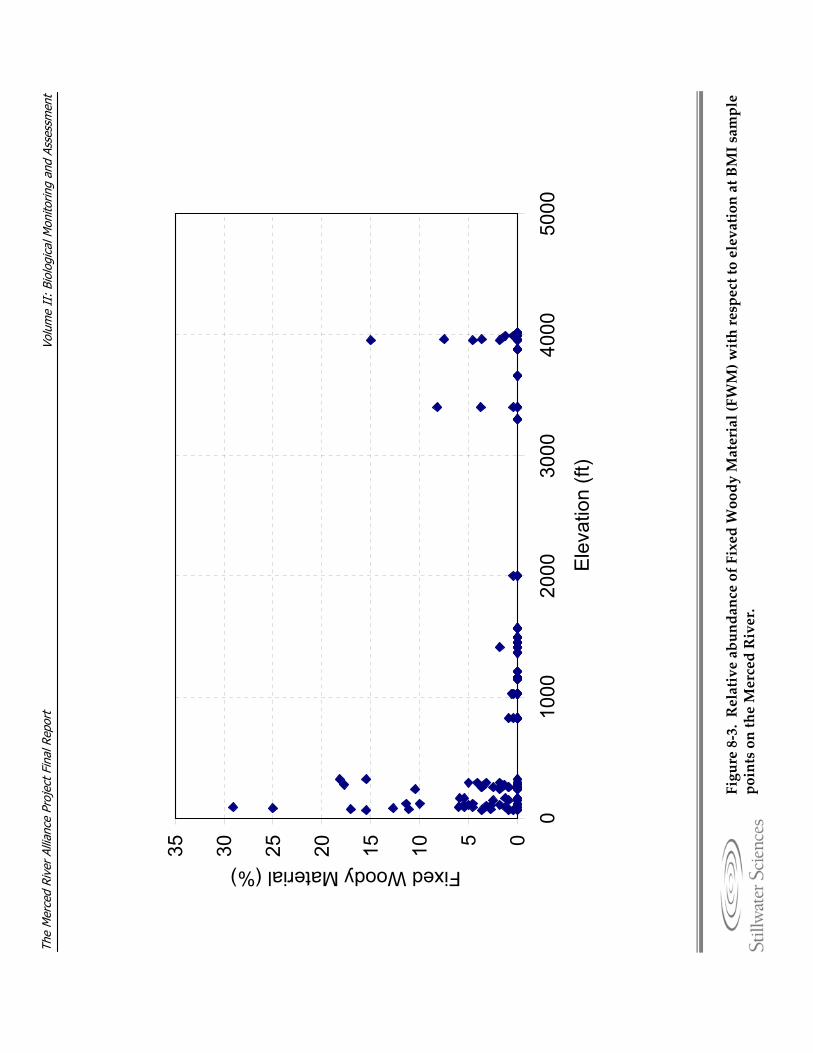
Volu
me
II:
Biol
ogic
al M
onito
ring
and
Asse
ssm
ent
The
Mer
ced
Rive
r Al
lianc
e Pr
ojec
t Fin
al R
epor
t
Figure 8‐3. Relative abundance of Fixed Woody Material (FW
M) with respect to elevation at BMI sample
points on the Merced River.
05101520253035
010
0020
0030
0040
0050
00
Ele
vatio
n (ft
)
Fixed Woody Material (%)

The Merced River Alliance Project Final Report Volume II: Biological Monitoring and Assessment
Stillwater Sciences
9‐1
9 REFERENCES Aerial Information Systems. 1997. Yose_1997veg_final_poly. Map, Arc shapefile.
Yosemite National Park Service, California.
Allan, J. D. 1995. Stream ecology‐ structure and function of running waters. First edition. Chapman & Hall.
AMFSTP (Adaptive Management Forum Scientific and Technical Panel). 2002. Merced River adaptive management forum report. Information Center for the Environment, University of California, Davis, California.
Ardohain, M. 2005. Personal communication. Administrative Assistant, Merced Irrigation District Parks Department by M. Singer, Stillwater Sciences, Berkeley, California.
Armantrout, N. B., compiler. 1998. Glossary of aquatic habitat inventory terminology. American Fisheries Society, Bethesda, Maryland.
Armitage, P. D. 1982. Environmental changes induced by stream regulation and their effect on lotic macroinvertebrate communities. Pages 139–165 in A. Lillehammer and S. J. Saltveit, editors. Second International Symposium on Regulated Streams (Regulated Rivers). Universitetsforlaget, Oslo, Norway.
Askins, R. A. 1995. Hostile landscapes and the decline of migratory songbirds. Science 257: 1956‐1957.
Barbour, M. T., J. Gerritsen, B. D. Snyder, and J. B. Stribling. 1999. Rapid bioassessment protocols for use in streams and wadeable rivers: periphyton, benthic macroinvertebrates, and fish. Second edition. EPA 841‐B‐99‐002. U. S. Environmental Protection Agency, Office of Water, Washington, D.C.
Baxter, R. M. 1977. Environmental effects of dams and impoundments. Annual review of Ecology and Systematics 8: 255–283.
Bergendorf, D. 2005. Assessment of mitten crab (Eriocheir spp.). Monitoring methods and habitat preference in the San Francisco Estuary. Prepared by U. S. Fish and Wildlife Service.
Blair, R. B. 1996. Land use and avian species diversity along an urban gradient. Ecological Applications 62: 506–519.
The Merced River Alliance Project Final Report Volume II: Biological Monitoring and Assessment
Stillwater Sciences
9‐2
Botti, S. 1977. Status of fish populations in 102 planted lakes. Unpublished file report. U.S. Department of the Interior, National Park Service, Yosemite National Park, California.
Boutin, S. and D. Hebert. 2002. Landscape ecology and forest management: developing an effective partnership. Ecological Applications 12: 390–397.
Brown, L. B. 1990. Age, growth, feeding and behavior of Sacramento squawfish (Ptychocheilus grandis) in Bear Creek, Colusa County, California. Southwestern Naturalist 35: 249––260.
Brown, L. B., and P. B. Moyle. 1996. Invading species in the Eel River, California: success, failures, and relationships with resident species. Environmental Biology of Fishes 49: 271–291.
Brown, L. R. 1996. Aquatic biology of the San Joaquin‐Tulare basins, California: analysis of available data through 1992. U. S. Geological Survey Water‐Supply Paper 2471. USGS National Water‐Quality Assessment Program San Joaquin ‐ Tulare basins NAWQA.
Brown, L. R. 1998. Concentrations of chlorinated organic compounds in biota and bed sediment in streams of the lower San Joaquin River drainage, California. U. S. Geological Survey Open‐File Report 98–171.
Brown, L. R. 2000. Fish communities and their associations with environmental variables, lower San Joaquin River drainage, California. Environmental Biology of Fishes 57: 251–269.
Brown, L. R. 2006. Personal communication. Biologist, U.S. Geologic Survey by K. E. Orr, Stillwater Sciences, Davis, California. April 2006.
Brown, L. R. and J. T. May. 2000a. Benthic macroinvertebrate assemblages and their relations with environmental variables in the Sacramento and San Joaquin River drainages, California, 1993–1997. U.S. Geological Survey Water‐Resources Investigations Report 00‐4125. National Water‐Quality Assessment Program.
Brown, L. R. and J. T. May. 2000b. Macroinvertebrate assemblages on woody debris and their relations with environmental variables in the lower Sacramento and San Joaquin drainages, California. Environmental Monitoring and Assessment 64: 311–329. http://ca.water.usgs.gov/sanj/pub/usgs/wrir00‐4125/wrir00‐4125.html
Brown, L. R. and J. T. May. 2004. Periphyton and macroinvertebrate communities at five sites in the San Joaquin River basin, California, during June and September, 2001. U. S. Geological Survey Scientific Investigations Report 2004‐5098.
The Merced River Alliance Project Final Report Volume II: Biological Monitoring and Assessment
Stillwater Sciences
9‐3
Brown, L. R. and T. Short. 1999. Biological, habitat, and water quality conditions in the upper Merced River drainage, Yosemite National Park, California, 1993–1996. USGS Water‐Resources Investigations Report 99‐4088. Sacramento, California.
Brown, L. R., C. R. Kratzer, and N. M. Dubrovsky. 1999. Integrating chemical, water quality, habitat, and fish assemblage data from the San Joaquin River drainage, California. Chapter 3 in K. M. Scow, G. E. Fog, D. E. Hinton and M. L. Johnson, editors. Integrated Assessment of Ecosystem Health. Lewis Publishers, Boca Raton, Florida.
Brown, L. R., J. K. Thompson, K. H. Higgins, and L. V. Lucas. 2007. Population density, biomass, and age‐class structure of the invasive clam Corbicula fluminea in rivers of the lower San Joaquin River watershed, California. Western North American Naturalist 67: 572–586.
Brown, L. R., T. Ford, M. Saiki, J. May, and J. Merz. 2003. Monitoring, research, and assessment components for river resident fish species. Prepared for CALFED.
Brunke, M., A. Hoffmann, and M. Pusch. 2001. Use of mesohabitat‐specific relationships between flow velocity and river discharge to assess invertebrate minimum flow requirements. Regulated Rivers: Research and Management 17: 667–676.
Brusven, M. A. 1982. The distribution and abundance of bethic insects subjected to reservoir release flows in the Clearwater River, Idaho, USA. Pages 167–180 in A. Lillehammer and S. J. Saltveit, editors. International Symposium on Regulated Streams (Regulated Rivers). Universitetsforlaget, Oslo, Norway.
Bryce, S. A., R. M. Hughes, and P. R. Kaufmann. 2002. Development of a bird integrity index: using bird assemblages as indicators of riparian condition. Environmental Management 30: 294–310.
Buckland, S. T., D. R. Anderson, K. P. Burnham, J. L. Laake, D. L. Borchers, and L. Thomas. 2001. Introduction to distance sampling: estimating abundance of biological populations. Oxford University Press, Oxford.
CALFED. 2004. Ecosystem restoration multi‐year program plan (Years 5‐8). Report including CALFED Ecosystem Restoration Strategic Goals and Objectives. http://calwater.ca.gov/ProgramPlans_2004/Ecosystem_Restoration_Program_Plan_7‐04.pdf
Camargo, J. A. and N. J. Voelz. 1998. Biotic and abiotic changes along the recovery gradient of two impounded rivers with different impoundment use. Environmental Monitoring and Assessment 50: 143–158.
The Merced River Alliance Project Final Report Volume II: Biological Monitoring and Assessment
Stillwater Sciences
9‐4
Camargo, J. A. and N. J. Voelz. 1998. Biotic and abiotic changes along the recovery gradient of two impounded rivers with different impoundment use. Environmental Monitoring and Assessment 50: 143–158.
CAMLnet. 2003. List of Californian macroinvertebrate taxa and standard taxonomic effort. Prepared by California Aquatic Bioassessment Laboratory, California Department of Fish and Game, Rancho Cordova, California. Revision date 27 January.
Cannon, T. C., and T. Kennedy. 2003. Snorkel survey of the lower American River 2003. Prepared by Fishery Foundation of California, San Francisco for U. S. Fish and Wildlife Service, Central Valley Project Improvement Program, Sacramento, California.
Cardiff, S. W. and D. L. Dittmann. 2002. Ash‐throated flycather (Myiarchus cinerascens). No. 644 in A. Poole and F. Gill, editors. The birds of North America. The Academy of Natural Sciences, Philadelphia, Pennsylvania and The American Ornithologistsʹ Union, Washington, D. C.
Carigan, V., and M. A. Villard. 2002. Selecting indicator species to monitor ecological integrity: a review. Environmental Monitoring and Assessment 78: 45–61.
Carter, J. L., and S. V. Fend. 2001. Inter‐annual changes in the benthic community structure of riffles and pools in reaches of contrasting gradient. Hydrobiologia 459: 187–200.
CDFG (California Department of Fish and Game). 1994. Inland Fisheries Technical Report: Central Valley Anadromous sport fish annual run‐size, harvest, and population estimates, 1967 through 1991. Compiled by T.J. Mills and F. Fisher. Sacramento, California.
CDFG. 1998a. Genetic concerns related to use of out‐of‐basin fall‐run Chinook salmon for studies in the lower San Joaquin River. Presented to the State Water Resources Control Board Public Hearing; Phase 2, regarding “The responsibilities of the parties who are jointly proposing the San Joaquin River Agreement.” CDFG Exhibit 20. CDFG Region 4.
CDFG. 1998b. Bay and delta region, Chinese mitten crab life history: life history and background information on Chinese mitten crab. http://www.delta.dfg.ca.gov/mittencrab/life_hist.asp
CDFG. 2008. New Zealand mudsnail information website. Invasive Species Program, Habitat Conservation Branch, CDFG, Sacramento, California. http://www.dfg.ca.gov/invasives/mudsnail/index.html [Accessed on 16 April 2008].
The Merced River Alliance Project Final Report Volume II: Biological Monitoring and Assessment
Stillwater Sciences
9‐5
CDFG. Unpublished data A. Merced River temperature data from a CDFG thermograph located at Briceburg, CA. September 2008.
CDFG. Unpublished data B. Merced River temperature data from multiple CDFG thermographs located in the lower Merced River, CA. February 2008.
CDWR (California Department of Water Resources). 1984. Dams within the jurisdiction of the state of California. Bulletin Number 17‐84. California Department of Water Resources, Sacramento, California.
CDWR. 2008. Water conditions in California. California Cooperative Snow Surveys. State of California. Bulletin 120‐4‐08. http://cdec.water.ca.gov/snow/bulletin120/b120may08.pdf
Conklin, M. 2006. Personal communication. Professor, University of California, Merced, California by M. Singer, Stillwater Sciences, Berkeley, California.
Cormier, R. L., J. K. Wood, C. A. Howell, T. Gardali, M. Herzog, and G. R. Geupel. 2006. Bird inventory and monitoring along the San Joaquin River: 2003–2005 comprehensive report. PRBO unpublished final report. Point Reyes Bird Observatory, Stinson Beach, California to U.S. Dept. of the Interior Bureau of Reclamation, Sacramento, California.
Cranston, P. 2005. Personal communication. Wildlife Biologist, Bureau of Land Management, California, by M. Singer, Stillwater Sciences, Berkeley, California. Wild and scenic status of the mainstem and north fork Merced River. 5 July.
Crooks, K. R., A. V. Suarez, D. T. Bolger. 2004. Avian assemblages along a gradient of urbanization in a highly fragmented landscape. Biological Conservation 115: 451–462.
Cushman, R. M. 1985. Review of ecological effects of rapidly varying flows downstream from hydroelectric facilities. North American Journal of Fisheries Management 5: 330–339.
DeVries, D. R. and R. V. Frie. 1996. Determination of age and growth. Pages 483–512 in B. R. Murphy and D. W. Willis, editors. Fisheries techniques. Second edition. American Fisheries Society, Bethesda, Maryland.
Dobkin, D. S. 1994. Conservation and management of Neotropical migrant landbirds in the Northern Rockies and Great Plains. University of Idaho Press, Moscow.
Dolloff, A., J. Kershner, and R. Thurow. 1996. Underwater observation. Pages 533–554 in B. Murphy and D. Willis, editors. Fisheries techniques. American Fisheries Society, Bethesda, Maryland.
The Merced River Alliance Project Final Report Volume II: Biological Monitoring and Assessment
Stillwater Sciences
9‐6
Donovan, T. M., P. W. Jones, E. M. Annand, and F. R. Thompson III. 1997. Variation in local scale edge effects: mechanisms and landscape context. Ecology 78: 2064–2075.
Dubrovsky, N. M., C. R. Kratzer, L. R. Brown, J. M. Gronberg, and K. R. Burow. 1998. Water quality in the San Joaquin‐Tulare basins, California, 1992–95. USGS NAWQA (National Water Quality Assessment) Program data. http://water.usgs.gov/pubs/circ/circ1159/
Dunford, W. and K. E. Freemark. 2004. Matrix matters: effects of surrounding land uses on forest birds near Ottawa, Canada. Landscape Ecology 20: 497–511.
Edmundson, E., F. E. Everest, and D. W. Chapman. 1968. Permanence of station in juvenile Chinook salmon and steelhead trout. Journal of the Fisheries Research Board of Canada 25: 1453–1464.
Elliot, M. J. and M. H. Loughlin. 1992. Historical overview of fishery management in Yosemite National Park 1877–1992. Natural Resources draft report. Yosemite National Park, California.
EPA (U.S. Environmental Protection Agency). 2004. Wadeable stream assessment: field operations manual. EPA841‐B‐04‐004. U.S. Environmental Protection Agency, Office of Water and Office of Research and Development, Washington, D. C.
ESJWQC (East San Joaquin Water Quality Coalition). 2007. Summary annual report 2007.
ESRI (Environmental Systems Research Institute). 2006. ArcGIS 9.2. Redlands, California.
Fausch, K. D., C. E. Torgersen, C. V. Baxter, and H. W. Li. 2002. Landscapes to riverscapes: bridging the gap between research and conservation of stream fishes. BioScience 52: 483–498.
FERC (Federal Energy Regulatory Commission). 1993. Proposed modifications to the Lower Mokelumne River Project, California. FERC Project No. 2916‐004 (Licensee: East Bay Municipal Utility District). FERC, Division of Project Compliance and Administration, Washington, D. C., Final Environmental Impact Statement.
Gaines, D. 1977. Birds of the Yosemite Sierra: a distributional study. California Syllabus. Oakland, California .
Gangloff, M. 1998. The New Zealand mud snail in western North America. Aquatic Nuisance Species Digest 2: 1.

The Merced River Alliance Project Final Report Volume II: Biological Monitoring and Assessment
Stillwater Sciences
9‐7
Grant, G. C. 1992. Selected life history aspects of Sacramento squawfish and hardhead in Pine Creek, Tehama County, California. M.S. thesis. California State University, Chico, California.
Grinnell, J. and T. I. Storer. 1924. Animal life in the Yosemite: an account of the mammals, birds, reptiles and amphibians in a cross‐section of the Sierra Nevada. University of California Press, Berkeley, California.
Grinnell, J., and A. H. Miller. 1944. The distribution of the birds of California. Pacific Coast Avifauna No. 27. Cooper Ornithological Club, Berkeley. Reprinted by Artemisia Press, Lee Vining, California.
Hankin, D. G. and G. H. Reeves. 1988. Estimating total fish abundance and total habitat area in small streams based on visual estimation methods. Canadian Journal of Fisheries and Aquatic Sciences 45: 834–844.
Hanson, E. and M. Sytsma. 2005. Mitten crab (Eriocheir spp.) recruitment: factors that influence larval supply and return to settlement sites. Prepared by E. Hanson and M. Sytsma, Center for Lakes and Reservoirs, Portland State University, Portland, Oregon.
Harrington, J. M. 1999. California stream bioassessment procedures. California Department of Fish and Game, Water Pollution Control Laboratory. Rancho Cordova, California.
Hatler, G. 1999. Personal communication. Fisheries biologist, California Department of Fish and Game, Fresno, California.
Hawking, C. P., J. L. Kershner, P. Bisson, M. S. Bryant, L. M. Decker, S. V. Gregory, D. A. McCullough, C. K. Overton, G. H. Reeves, R. J. Steedman, and M. K. Young. 1993. A hierarchical approach to classifying stream habitat features. Fisheries 18: 3–12.
Heath, S. K. and G. Ballard. 2003. Patterns of songbird diversity and occurrence in riparian habitats of the eastern Sierra Nevada. In P. M. Farber, editor. California riparian systems: processes and floodplain management, ecology, and restoration. Riparian habitat and floodplains conference proceedings. Riparian Habitat Joint Venture, Sacramento, California.
Heib, K. 2007. Personal communication. Invasive Species Biologist, California Department of Fish and Game by K. E. Orr, Stillwater Sciences, Davis, California. March 5.
Herbst, D. B., E. L. Silldorff, and S. D. Cooper. 2003. The influence of introduced trout on native aquatic invertebrate communities in a paired watershed study of High
The Merced River Alliance Project Final Report Volume II: Biological Monitoring and Assessment
Stillwater Sciences
9‐8
Sierran streams. Final report. Prepared for The Nature Conservancy, Ecosystem Research Program (#HO‐CSD‐050600‐CA) and the University of California Water Resources Center (#W‐930).
Hilsenhoff, W. 1971. Changes in the downstream insect and amphipod fauna caused by an impoundment with a hypolimnion drain. Annals of the Entomological Society of America 64: 743–746.
Howell, C. A. and M. Dettling. 2007. Evaluating least bellʹs vireos and their habitat at the San Joaquin River National Wildlife Refuge, 2007. PRBO unpublished report. Prepared by Point Reyes Bird Observatory, California to U.S. Fish and Wildlife Service, Los Banos, California.
Howell, C. A., S. C. Latta, T. M. Donovan, P. A. Porneluzi, G. R. Parks, and J. Faaborg. 2000. Landscape effects mediate breeding bird abundance in Midwestern forests. Landscape Ecology 15: 547–562.
Howell, C. A., W. Dijak, and F. R. Thompson, III. 2007. Landscape context and selection for forest edge by breeding brown‐headed cowbirds. Landscape Ecology 22: 273–284.
Jennings, M. R. and M. K. Saiki. 1990. Establishment of red shiner, Notropis lutrensis, in the San Joaquin Valley, California. California Fish and Game 76: 46–57.
Karr, J. R. and E. W. Chu. 1999. Restoring life in running waters. Island Press, Covelo, California.
Kathman, R. D. and R. O. Brinkhurst. 1998. Guide to the freshwater Oligochaetes of North America. Aquatic Resources Center, College Grove, Tennessee.
Kaufman, L. and P. J. Rousseeuw. 1990. Finding groups in data: An introduction to cluster analysis. Wiley, New York.
Kaufmann, P. R., P. Levine, E. G. Robison, C. Seeliger, and D. V. Peck. 1999. Quantifying physical habitat in wadeable streams. EPA 620/R‐99/003. U.S. Environmental Protection Agency, Washington D. C.
Kisanuki, T. T., and T. A. Shaw. 1992. Merced River habitat typing, underwater fish observations, and habitat restoration. Report AFF1‐FRO‐92‐03. U.S. Fish and Wildlife Service, Coastal California Fishery Resource Office, Arcata, California. http://www.fws.gov/cno/arcata/fisheries/reports/yose/yose_merced592.pdf
Klemm, D. J., P. A. Lewis, F. Fulk, and J. M. Lazorchak. 1990. Macroinvertebrate field and laboratory methods for evaluating the biological integrity of surface waters. PA/600/4‐90/030. U.S. Environmental Protection Agency.
The Merced River Alliance Project Final Report Volume II: Biological Monitoring and Assessment
Stillwater Sciences
9‐9
Knapp, R. A. 1996. Non‐native trout in natural lakes of the Sierra Nevada: an analysis of their distributions and impacts on native aquatic biota in Sierra Nevada Ecosystem Project final report to Congress. Vol. III, Assessment, commissioned reports, and background information. University of California Davis, Centers for Water and Wildland Resources.
Knopf, F. L., R. R. Johnson, T. Rich, F. B. Samson, and R. C. Szaro. 1988. Conservation of riparian ecosystems in the United States. Wilson Bulletin 100: 272–284.
Kondolf, G. M. and W. V. G. Matthews. 1993. Management of coarse sediment on regulated rivers. Water Resources Center, University of California, Davis, California.
Krebs, C. J. 1989. Ecological methodology. Harper and Row Publishers, New York, New York.
Lehmkuhl, D. M. 1972. Changes in thermal regime as a cause of reduction of benthic fauna downstream of a reservoir. Journal of Fisheries Research Board of Canada 29: 1329–1332.
MacArthur, R. H. 1965. Patterns of species diversity. Biological Reviews 40: 510–533.
Markiewicz, D., K. Goding, V. de Vlaming, and J. Rowan. 2003. Benthic macroinvertebrate bioassessment of San Joaquin River tributaries: spring and fall 2002. California State Water Resources Control Board. http://www.swrcb.ca.gov/rwqcb5/available_documents/waterqualitystudies/SJR02_Bioassess_final_083005.pdf
May, J. T. and L. R. Brown. 2001. Chinese mitten crab surveys of San Joaquin River basin and Suisun Marsh, California, 2000. U.S. Geological Survey Open File Report 01‐396. Prepared in cooperation with the Interagency Ecological Program.
Mazerolle, M. J. and M. A. Villard. 1999. Patch characteristics and landscape context as predictors of species presence and abundance: a review. Ecoscience 6: 117–124.
McCain, M. E. 1992. Comparison of habitat use and availability for juvenile fall chinook salmon in a tributary of the Smith River, California. FHR Currents, No. 7. USDA Forest Service, Region 5.
McCain, M., D. Fuller, L. Decker, and K. Overton. 1990. Stream habitat classification and inventory procedures for northern California. FHR Currents, Volume 1. USDA Forest Service, Pacific Southwest Region.
The Merced River Alliance Project Final Report Volume II: Biological Monitoring and Assessment
Stillwater Sciences
9‐10
McCune, B. and M. J. Mefford. 2006. PC‐ORD. Multivariate analysis of ecological data. Version 5. MjM Software, Gleneden Beach, Oregon, USA.
McEwan, D. R. 2001. Central Valley steelhead. Pages 1‐44 in R. L. Brown, editor. Contributions to the biology of Central Valley salmonids. CDFG Fish Bulletin: 179.
McGarigal, K. and B. J. Marks. 1995. FRAGSTATS: spatial pattern analysis program for quantifying landscape structure. USDA Forest Service General technical report, PNW‐351. http://www.umass.edu/landeco/research/fragstats/fragstats.html
McGarigal, K., S. Cushman, and S. Stafford. 2000. Multivariate statistics for wildlife and ecology research. Springer Publishing, New York, New York.
Mebane, C. 2001. Testing bioassessment metrics: macroinvertebrate, sculpin, and salmonid responses to stream habitat, sediment, and metals. Environmental Monitoring and Assessment 67: 293–322.
Merritt, R. W. and K. W. Cummins. 1996. An introduction to the aquatic insects of North America. Second edition. Dendall/Hunt Publishing Co., Dubuque, Iowa.
Merz, J. E. and L. K. Chan. 2005. Effects of gravel augmentation on macroinvertebrate assemblages in a regulated California river. River Research and Applications 21: 61–74.
Meyer, J. 2005. Personal communication. Wildlife Biologist, National Park Service by M. Singer, Stillwater Sciences, Berkeley, California.
Miles, S. R. and C. R. Goudey. 1997. Ecological subregions of California: section and subsection descriptions. U.S. Department of Agriculture, Forest Service Report R5‐EM‐TP‐005. Pacific Southwest Region, San Francisco, California.
Mohr, M. S., and D. G. Hankin. In press. Two‐phase survey designs for estimation of fish abundance in small streams. NOAA Technical Memorandum NMFS‐SWFSC.
Moritz, C. 2007. Are‐survey of the historic Grinnell‐Storer vertebrate transect in Yosemite National Park, California. Unpublished report. Prepared for Sequoia and Kings Canyon National Parks, Three Rivers, California.
Moyle, P. B. 1976. Inland fishes of California. First edition. University of California Press, Berkeley, California.
Moyle, P. B. 2002. Inland fishes of California. Revised edition. University of California Press, Berkeley, California.
The Merced River Alliance Project Final Report Volume II: Biological Monitoring and Assessment
Stillwater Sciences
9‐11
Moyle, P. B. and R. D. Nichols. 1973. Ecology of some native and introduced fishes of the Sierra Nevada foothills in Central California. Copeia 1973: 978–990.
Moyle, P.B., B. Vondracek, and G. D. Grossman. 1983. Response of fish populations in the North Fork of the Feather River, California to treatment with fish toxicants. Norhter American Journal of Fisheries Management 3: 48–60.
Mulligan, M. J. 1975. The ecology of fish populations in Mill Flat Creek: tributary to the Kings River. M.S. thesis. California State University, Fresno, California.
Murphy, B. R., and D. W. Willis, editors. 1996. Fisheries techniques. Second edition. American Fisheries Society, Bethesda, Maryland.
Myrick, C. A., and J. J. Cech, Jr. 2001. Temperature effects on Chinook salmon and steelhead: a review focusing on Californiaʹs Central Valley populations. Technical Publication 01‐1. Published electronically by the Bay‐Delta Modeling Forum. http://www.sfei.org/modelingforum/
Neter, J., W. Wasserman, and M. H. Kutner. 1990. Applied linear statistical models: regression, analysis of variance, and experimental designs. Third edition. Irwin Press, Homewood, Illinois, USA.
NOAA (National Oceanic and Atmospheric Administration). 2005. Designation of critical habitat for seven Evolutionarily Significant Units of Pacific salmon and steelhead in California. Federal Register 70: 52488–52627.
NPS (National Park Service). 2000. Yosemite Valley plan, supplemental environmental impact statement, Volume 1A. United States Department of the Interior, National Park Service, Yosemite National Park. November 2000.
NPS. 2005. Merced wild and scenic river revised comprehensive management plan and supplemental environmental impact statement (revised Merced River plan/SEIS). United States Department of the Interior, National Park Service, Yosemite National Park.
NPS. In progress. 1997 Vegetation map of Yosemite National Park. United States Department of the Interior, National Park Service, Yosemite National Park.
Nur, N, J. K. Wood, K. Lindquist, C. A. Howell, and G. R. Geupel. 2006. Trends in avian abundance and diversity in restored and mature habitat on the Cosumnes River, 1995–2005. PRBO Unpublished report, Contract ERP‐ 01‐NO1. Prepared by Point Reyes Bird Observatory, Petaluma, California for California Bay‐Delta Authority Ecosystem Restoration Program.
The Merced River Alliance Project Final Report Volume II: Biological Monitoring and Assessment
Stillwater Sciences
9‐12
Nur, N., G. Ballard, and G. R. Geupel. 2008. Regional analysis of riparian bird species response to vegetation and local habitat features. Wilson Journal of Ornithology 120, in press.
Nur, N., S. L. Jones, and G. R. Geupel. 1999. A statistical handbook to data analysis of standardized avian monitoring programs. BTP‐R6001‐1999. U.S. Department of the Interior, Fish and Wildlife Service, Washington, D.C.
Nur, N., S. Zack, J. Evens, and T. Gardali. 1997. Tidal marsh birds of the San Francisco Bay Region: status, distribution, and conservation of five category 2 taxa. Final draft report. Prepared for National Biological Survey (now U.S. Geological Survey). Available from PRBO Conservation Science, Petaluma, California
Ode, P. R., A. C. Rehn and J. T. May. 2005. A quantitative tool for assessing the integrity of southern coastal California streams. Environmental Management 35: 493–504.
Oksanen, J., R. Kindt, P. Legendre, and R. B. OʹHara. 2006. Vegan: community ecology. Package Version 1.8‐3. http://cran.r‐project.org.
Omernik, J. M. and R. G. Bailey. 1997. Distinguishing between watersheds and ecoregions. Journal of American Water Resources Association 33: 935–949.
Payne, T. R. 1992. Stratified random selection process for the placement of physical habitat simulation (PHABSIM) transects. Paper presented at AFS Western Division Meeting, Fort Collins, Colorado. 13‐16 July.
Petts, G. E. 1984. Macroinvertebrate response to upstream impoundment. Pages 175–208 in Impounded rivers: perspectives for ecological management. John Wiley and Sons, New York, New York.
Pfeffer, A., J. K. Wood, G. R. Geupel. 2006. Songbird breeding and migration along the lower Mokelumne River, 2004–2006. Unpublished report. Prepared by Point Reyes Bird Observatory, California for San Joaquin County Resource Conservation District, Stockton, California.
PG&E (Pacific Gas and Electric). 1985. Bald eagle and fish study: Pit 3, 4, and 5 project. Prepared by Biosystems Analysis, Inc. and University of California, Davis.
Plafkin, J. L., M. T. Barbour, K. D. Porter, S. K. Gross, and R. M. Hughes. 1989. Rapid bioassessment protocols for use in streams and rivers. EPA/444/4‐89/001. Office of Water Regulations and Standards, U.S. Environmental Protection Agency, Washington D.C.

The Merced River Alliance Project Final Report Volume II: Biological Monitoring and Assessment
Stillwater Sciences
9‐13
Platts, W. S., W. F. Megahan and G. W. Minshall. 1983. Methods for evaluating stream, riparian and biotic conditions. General technical report, INT‐138. USDA Forest Service Intermountain Range and Experiment Station.
Post, D. 2006. Personal communication. Invasive Species Biologist, California Department of Fish and Game by T. King, Bioassessment Services, Fulsom, California. March 30.
PRBO (Point Reyes Bird Observatory). 2004. The palomarin handbook: PRBOʹs terrestrial program procedures manual. Seventh edition. PRBO Conservation Science, Stinson Beach, California.
R Development Core Team. 2006. R: a language and environment for statistical computing. R Foundation for Statistical Computing, Vienna, Austria. http://www.R‐project.org
Ralph, C. J., G. R. Geupel, P. Pyle, T. E. Martin, and D. F. DeSante. 1993. Handbook of field methods for monitoring landbirds. General technical report, PtW‐GTR‐144. USDA Forest Service, Pacific Southwest Research Station, Berkeley, California.
Reeves, J. E. 1964. Age and growth of hardhead minnow, Mylopharodon conocephalus (Baird and Girard), in the American River basin of California, with notes on its ecology. M.S. thesis. University of California, Berkeley, California.
Regier, H. A. and D. S. Robson. 1966. Estimating population numbers and mortality rates. Pages 31–66 in S. D. Gerking, editor, The biological basis of freshwater fish production. Blackwell Scientific, Oxford, England.
Rehn, A. C., N. von Ellenrieder, and P. R. Ode. 2007a. Assessment of ecological impacts of hydropower projects on benthic macroinvertebrate assemblages: a review of existing data collected for FERC relicensing studies. CEC‐500‐2007‐040. California Energy Commission, PIER Energy‐Related Environmental Research Program.
Rehn, A. C., P. R. Ode, and C. P. Hawkins. 2007b. Comparisons of targeted‐riffle and reach‐wide benthic macroinvertebrate samples: implications for data sharing in stream condition assessments. Journal of North American Benthological Society 26: 332–348.
RHJV (Riparian Habitat Joint Venture). 2004. The riparian bird conservation plan: a strategy for reversing the decline of riparian associated birds in California. Version 2.0. California Partners in Flight, Point Reyes Bird Observatory, Stinson Beach, California. http://www.prbo.org/CPIF/Riparian/Riparian.html
The Merced River Alliance Project Final Report Volume II: Biological Monitoring and Assessment
Stillwater Sciences
9‐14
Robinson, S. K., F. R. Thompson, III, T. M. Donovan, D. R. Whitehead, and J. Faaborg. 1995. Regional forest fragmentation and the nesting success of migratory birds. Science 267: 1987–1990.
Rosenstock, S. S., D. R. Anderson, K. M. Griesen, T. Leukering, and M. F. Carter. 2002. Landbird counting techniques: current practices and an alternative. The Auk 199: 46–53.
Rottenborn, S. C. 1999. Predicting the impacts of urbanization on riparian bird communities. Biological Conservation 88: 289–299.
Rudnick, D., T. Veldhuizen, R. Tullis, C. Culver, K. Heib, and B. Tsukimura. 2005. A life history model for the San Francisco Estuary population of the Chinese mitten crab, Eriocheir sinensis (Decapoda: Grapsiodea). Biological Invasions 7: 333–350.
Saab, V. A., C. E. Bock, T. D. Rich, and D. S. Dobkin. 1995. Livestock grazing effects on migratory landbirds in western North America. Pages 311–353 in T. E. Martin and D. M. Finch, editors. Ecology and management of neotropical migratory birds: a synthesis and review of critical issues. Oxford University Press, New York, New York.
Saiki, M. K. 1984. Environmental conditions and fish faunas in low elevation rivers on the irrigated San Joaquin Valley floor, California. California Fish and Game 70: 145–157.
Sedwick, J. A. and F. L. Knopf. 1988. A high incidence of brown‐headed cowbird parasitism of willow flycatchers. The Condor 90: 253–256.
Selb, T. 2005. Personal communication. Deputy General Manager, Merced Irrigation District by P. Downs, Stillwater Sciences, Berkeley, California.
Selb, T. 2008. Personal communication. Deputy General Manager, Merced Irrigation District by M. Singer and K. Orr, Stillwater Sciences, Berkeley, California.
Siegel, R. B. and D. F. DeSante. 2003. Bird communities in thinned versus unthinned Sierran mixed conifer stands. Wilson Bulletin 115: 155–165.
Siegel, R. B., R. L. Wilkerson, and D. F. DeSante. 2008. Extirpation of the willow flycatcher from Yosemite National Park. Western Birds 39: 8–21.
Skinner, J. E. 1962. A historical review of the fish and wildlife resources of the San Francisco Bay area. Report No. 1. California Department of Fish and Game, Water Projects Branch.
The Merced River Alliance Project Final Report Volume II: Biological Monitoring and Assessment
Stillwater Sciences
9‐15
Spautz, H., N. Nur, D. Stralberg, and Y. Chan. 2006. Multiple‐scale habitat relationships of tidal‐marsh breeding birds in the San Francisco Bay estuary. Studies in Avian Biology 32: 247–269.
Spence, J. A. and H. B. N. Hynes. 1971. Differences in benthos upstream and downstream of an impoundment. Journal of Fisheries Research Board of Canada 28: 35–43.
Stanford, J. A. and J. V. Ward. 2001. Revisiting the serial discontinuity concept. Regulated Rivers: Research and Management 17: 303–310.
Stangl, M. J. 2001. An electrofishing raft for sampling intermediate‐size waters with restricted boat access. North American Journal of Fisheries Management 21:679–682.
StataCorp. 2008. Stata statistical software, release 10.0. Stata Corporation, College Station, Texas.
Stewart, K. W. and B. P. Stark. 1993. Nymphs of North American stonefly genera (Plecoptera). University of North Texas Press, Denton, Texas.
Stillwater Sciences. 2001. Merced River corridor restoration plan baseline studies. Volume II: geomorphic and riparian vegetation investigations. Prepared by Stillwater Sciences, Berkeley, California for CALFED, Sacramento, California.
Stillwater Sciences. 2002. Merced River corridor restoration plan. Prepared by Stillwater Sciences, Berkeley, California, for CALFED, Sacramento, California.
Stillwater Sciences. 2006a. The Merced River Alliance biological monitoring and assessment plan. Prepared by Stillwater Sciences, Berkeley, California.
Stillwater Sciences. 2006b. Baseline monitoring of the Merced River Dredger Tailings Reach. Stillwater Sciences, Berkeley, California.
Stillwater Sciences. 2006c. Merced River ranch channel‐floodplain restoration: post‐implementation monitoring plan. Stillwater Sciences, Berkeley, California.
Stillwater Sciences. 2007. The Merced River Alliance Project: interim biological monitoring and assessment report. Stillwater Sciences, Berkeley, California.
Sturgess, J. and R. Hobbs. Unpublished data. Bigscale logperch populations in the Sacramento River Delta. University of California, Davis, California.
Temple, S. A. and J. A. Wiens. 1989. Bird populations and environmental changes: can birds be bioindicators? American Birds 43: 260–270.
The Merced River Alliance Project Final Report Volume II: Biological Monitoring and Assessment
Stillwater Sciences
9‐16
The Nature Conservancy. 2001. Indicators of hydrologic alteration. Smith Scientific Software.
Theobald, D. 2005. Landscape patterns of exurban growth in the USA from 1980 to 2020. Ecology and Society 10: 31. http://www.ecologyandsociety.org/vol10/iss1/art32/
Thomas, J. A., and K. D. Bovee. 1993. Application and testing of a procedure to evaluate transferability of habitat suitability criteria. Regulated Rivers: Research and Management 8: 285–294.
Thompson, S. 2005. Personal communication. Wildlife Biologist, National Park Service by M. Singer, Stillwater Sciences, Berkeley, California.
Thompson, W. L. 2002. Towards reliable bird surveys: accounting for individuals present but not detected. The Auk 119: 18–25.
Thorp, J. H. and A. P. Covich, editors. 2001. Ecology and classification of North American invertebrates. Second edition. Academic Press, San Diego, California.
Tucker, M. E., C. M. Williams, and R. R. Johnson. 1998. Abundance, food habits, and life history aspects of Sacramento squawfish and striped bass at the Red Bluff Diversion Complex, California, 1994–1996. USFWS Red Bluff Research Pumping Plant Report 4. Red Bluff, California.
UC Davis (University of California at Davis). 1996. Sierra Nevada Ecosystem Project, Vol. I–Vol. III. Final report to Congress. http://ceres.ca.gov/snep/pubs/index.html
Uliczka, H., and P. Angelstam. 2000. Assessing conservation values of forest stands based on specialized lichens and birds. Biological Conservation 95: 343–351.
USFWS (U.S. Fish and Wildlife Service). 1995. The relationship between instream flow and physical habitat availability for Chinook salmon in the lower Tuolumne River, California. Prepared by USFWS Ecological Services, Sacramento Field Office, Sacramento, California for Turlock Irrigation District and Modesto Irrigation District.
USFWS. 1997. Comprehensive assessment and monitoring program (CAMP). Implementation plan, March 1997. Prepared by Central Valley Fish and Wildlife Restoration Program Office, Sacramento, California with technical assistance from Montgomery Watson, Jones & Stokes Associates, Inc., and CH2M HILL, Sacramento, California.
The Merced River Alliance Project Final Report Volume II: Biological Monitoring and Assessment
Stillwater Sciences
9‐17
USFWS. 1998. Endangered and threatened wildlife and plants; Listing of several evolutionarily significant units of west coast steelhead. Federal Register 63: 32996–32998.
USFWS. 2002. Comprehensive assessment and monitoring program (CAMP). Annual report, 2000. Prepared by CH2M‐Hill, Sacramento, California. http://www.fws.gov/pacific/sacramento/fwr/2000_CAMP_Report.pdf
USFWS. 2007. A compilation and analysis of anadromous fish monitoring data from the Central Valley of California, 1992–2006. Prepared by the U.S. Fish and Wildlife Service and Bureau of Reclamation, Comprehensive Assessment and Monitoring Program. Sacramento, California. .
USGS (U.S. Geological Survey). 1999. 1999 California hydrologic data report. http://ca.water.usgs.gov/archive/waterdata/99/11269500.html [Accessed 20 May 2008].
USGS. 2001. Nonindigenous species bulletin, #2001‐001. Gainsville, Florida. http://www.fcsc.usgs.gov.
Vannote, R. L., G. W. Minshall, K. W. Cummins, J. R. Sedell, and C. E. Cushing. 1980. The river continuum concept. Canadian Journal of Fisheries and Aquatic Sciences 37: 130–137.
Vogel, D. A. 2003. Merced River water temperature feasibility investigation reconnaissance report. Report to U.S. Fish and Wildlife Service, Anadromous Fish Restoration Program.
Wallis, E. I. 1952. Comprehensive review of trout fishery problems of Yosemite National Park: a report of the Yosemite trout investigations, 1951–1953. U.S. Department of the Interior, National Park Service, Yosemite National Park.
Ward J. V. 1974. A temperature stressed stream ecosystem below a hypolimnial release mountain reservoir. Archiv. Hydrobiol. 74: 247–275.
Ward, J. V. 1998. Riverine landscapes: biodiversity patterns, disturbance regimes, and aquatic conservation. Biological Conservation 83: 269–278.
Ward, J. V., and J. A. Stanford. 1995. The serial discontinuity concept: extending the model to floodplain rivers. Regulated Rivers: Research and Management 10: 159–168.
White, B. 1997a. McClure awaits cleanup flood debris to stay until snowmelt hits. The Modesto Bee, California. 2 April, p.A1.
The Merced River Alliance Project Final Report Volume II: Biological Monitoring and Assessment
Stillwater Sciences
9‐18
White, B. 1997b. Escalon firm to clean McClure. The Modesto Bee, California. 27 May, p.B2.
White, B. 1997c. Flood cleanup continues at McClure. The Modesto Bee, California. 25 June, p.B2.
Wiggins, G. B. 1996. Larva of North American caddisfly genera (Trichoptera). Second edition. University of Toronto, Toronto.
Wood, J. 2005. Personal communication. Avian biologist, Point Reyes Bird Observatory by M. Singer, Stillwater Sciences, Berkeley, California.
Wood, J. K. and N. Nur. 2006. Bird response to restoration. Grayson River Ranch final report 2000–2006. Unpublished report. Prepared by PRBO for Friends of the Tuolumne, Stockton, California.
Wood, J. K., C. A. Howell, and G. R. Geupel. 2006. Songbird monitoring on the San Joaquin River National Wildlife Refuge: patterns of abundance, reproductive success and short‐term responses to restoration. Unpublished final report (2000‐2005). Prepared for U. S. Fish and Wildlife Service, San Luis National Wildlife Refuge Complex. Los Banos, California.
Zar, J. H. 1984. Biostatistical analysis. Second edition. Prentice Hall, New Jersey.
Zimmerman, C. E., G. W. Edwards, and K. Perry. 2008. Maternal origin and migratory history of Oncorhynchus mykiss captured in rivers of the Central Valley, California. Final report, Contract P0385300. Prepared for California Department of Fish and Game.


![Biological Monitoring two.ppt [Read-Only]](https://img.pdfslide.us/doc/110x75/61bd3e8561276e740b10cf81/biological-monitoring-twoppt-read-only.jpg)