Embed Size (px)
Citation preview
Impact of Education and Training on Income Support recipients
Lixin Cai, Daniel Kuehnle, and Yi-Ping Tseng Melbourne Institute of Applied Economic and Social Research
Acknowledgements This research was commissioned by the Australian Government Department of Education, Employment and Workplace Relations (DEEWR) under the Social Policy Research Services Agreement (2005–09) with the Melbourne Institute of Applied Economic and Social Research. The views expressed in this report are those of the authors alone and do not represent those of DEEWR.
June 2010
Final Report
2
Table of Contents
Executive Summary ............................................................................................... 3 1. Introduction ............................................................................................................ 6 2. Literature review .................................................................................................... 7 3. Data ...................................................................................................................... 10 4. Patterns of training participation and barriers to participation ............................ 13 5. Factors influencing training/study participation .................................................. 20 6. Impacts of training/study on income support receipt, employment and earnings 28 7. Conclusion ........................................................................................................... 35 8. References ............................................................................................................ 38 9. Appendices ........................................................................................................... 42
Executive Summary
In this report, we use data from the Longitudinal Pathways Survey (LPS) and the Research
and Evaluation Dataset (RED) to:
• Examine income support recipients’ patterns of participation in training and study;
• Analyse the factors that affect income support recipients’ participation in education
and training;
• Estimate the effects of training participation on income support status and labour
market outcomes.
This study is unique in the sense that it combines administrative data (RED) with survey data
on income support recipients (LPS) and allows us to track income support recipients’
experiences in terms of employment and training patterns over time, both when they are on
and off income support. The LPS consists of three cohorts of income support recipients to
represent the pre-reform, transitional, and post-reform periods of the Welfare-to-Work
reforms. For reasons discussed in the report, this study uses only two LPS cohorts, these being
the pre-reform and post-reforms samples, and supplements these with the RED to arrive at a
rich dataset suitable for descriptive and regression-based analysis.
The LPS differentiates between short training and formal study, allowing us to analyse the
patterns of participation for these separately. The modeling sample consists of around 45,450
observations (14,711 individuals) of which approximately 25 per cent undertook some form
of short training or formal training during the six months prior to an interview. Of those
individuals undertaking some form of training, about 56 per cent were involved only in
formal study, about 35 per cent only in short training, and around 9 per cent in both. Once we
analyse the participation patterns by income support payment types, the student type
payments exhibit the largest rates as to be expected, and recipients of a Newstart Allowance
(NSA) show the second highest participation rate. Those on a disability support pension and
on any payment type other than student, NSA or parenting payments show the highest rates of
non-participation.
Among those who participated in some form of short training, the largest group consisted of
individuals involved in obtaining a licence (39 per cent) or on-the-job training (37 per cent).
About 10 per cent of short trainings related to computing or new technologies, where as less
4
than 1 per cent was concerned with educational basics such as general numeracy or reading
skills. Among those involved in formal study, over 50 per cent undertook TAFE or technical
studies, about 19 per cent studies towards a degree, and around 12 per cent for an
undergraduate certificate. For those not undertaking any form of training, ‘ill health’ and ‘too
busy/unsuitable hours’ were the most frequently cited reasons for non-participation (22 per
cent each), followed by a lack of interest and parenting responsibilities.
The results from our study indicate that the probability of engaging in some form of training
is higher for women than men. Consistent with the prediction of human capital theory,
younger people were more likely to participate in training or study. Individuals who already
possessed a level of education higher than Year 10 were more likely to participate in training
or study compared to people with Year 10 or less education. There is some evidence that
individuals on NSA and PPS (parenting payment partnered) are significantly more likely to
do some form of training when compared to people not on benefits. The most important
factors that reduce the probability of engaging in study or training include an individual’s
poor health and the presence of children under the age of 3. However, the effect of child
caring responsibility on training participation only applies to mothers and given that the
barrier disappears as the child gets older (above age 3), we believe that it should not be of
great policy concern.
In terms of the effects of training on income support, short training was found to have a
significant effect in reducing income support receipt. Although our results showed the effects
of formal study to be small and statistically insignificant, this is likely to be caused by the fact
that most participants had not finished their studies at the time of the interview. In terms of
labour market outcomes, both short and formal training were found to have a positive effect
on the incidence of work (i.e. working at the time of the interview or having worked in the six
months prior to the interview). For example, individuals who completed a short course were
11 percentage points more likely to have a full-time job than those who did not participate in
any training twelve months after training commencement. For other labour market outcomes,
such as working hours, hourly wages and weekly earnings, the impacts were generally
insignificant for both forms of training.
The results need to be interpreted with care, especially the conclusion that formal study has no
impact on labour market outcomes other than employment. This finding is likely to be caused

5
by the short length of our current data set. Further research is needed in this area and will
require longer panel data that follows individuals until after they have finished their formal
studies in order to evaluate the full effects of formal study.
6
1. Introduction The two main objectives of the project are (1) to examine income support recipients’ patterns
of participation in education and training and (2) to estimate the effects of such participation
on their labour market outcomes (e.g. employment and income support receipt patterns and
earnings). It will also investigate whether and to what extent the effects vary across different
types of education and training.
Specifically, the project seeks to answer the following questions:
• What are the patterns of skill acquisition among income support recipients, i.e. what
types of education and training do they undertake?
• What factors affect income support recipients’ participation in education and training,
as well as the types of education and training they choose to undertake?
• What are the impacts of education and training on employment outcomes, earnings,
exit from income support and re-entry into income support payments? Whether and to
what extent do the effects differ across different types of education and training? Do
the effects differ for recipients of different payment types?1
One of the main reasons for individuals to be on income support and/or unemployed is that
they lack the skills relevant to employment, due either to low education or to skills having
been outdated. The Federal Government recognises the importance of skill upgrading in the
process of successful welfare-to-work transitions. However, currently there is little empirical
evidence on the effectiveness of various training programs (or courses) in terms of their
effects on labour market outcomes, especially in the Australian context. Most existing
Australian studies on the impact of education and training focus on the average effects for the
general population instead of the effects on income support recipients, or those who have just
exited from income support (Ryan 2002; Long and Shah 2008; Booth and Katic 2008). Since
it is well recognised in the literature that the impacts of education and training are
heterogeneous across individuals (Blundell et al 2003), we argue that it is not appropriate to
generalise the estimates from the general population to this target group. By comparing the
effects of different types of education and training for income support recipients, this project
will provide information for policy development on education and/or training linked to
employment services.
1 The question whether the effects of training differ for recipients of different payment types is in the original project description but cannot examined due to small sample size.
7
This project extends an earlier study undertaken by the Melbourne Institute (Cai et al. 2008)
which examined the role of human capital in determining the patterns of employment and
income support receipt. This study did not, however, investigate the impact of training
undertaken by income support recipients.
The current study combines descriptive analysis with multivariate modelling to seek answers
to the questions listed above. It is structured as follows: section two reviews both the
Australian and international literature on the impact of various training programs. Section
three describes the data and sample selection rules employed in this study. Section four
presents descriptive statistics on the patterns of education and training participation by
individuals’ income support receipt status. Section five presents the results of multivariate
analysis on individuals’ participation in short training and formal study. In particular, the
participation decision of the two types of training/education is jointly modelled using a
bivariate probit model. In section six, the impacts of short training and formal study are
estimated separately using matching methods. A brief conclusion is provided in section seven.
2. Literature review Australian Studies
Using data that combine administrative data from the DEWR and DEST with those data
collected from a specially designed survey, Rahmani, Crosier and Pollack (2002) evaluate the
effects of the Literacy and Numeracy Training (LANT) Program on unemployed job seekers’
employment status, earnings and income support status. They find no evidence that
participating in the program improves job seekers’ employment outcomes in terms of full-
time employment and earnings. In fact, they report that those who participated in the program
longer or completed the program had a lower probability of full-time employment than those
eligible job seekers who did not participate in the program or who withdrew at a very early
stage from the program. In terms of income support receipt status, it is found that program
participants had a similar probability of leaving income support than non-participants, and
that those who stayed longer on the program were less likely to leave income support.
Stromback and Dockery (2000) examine the effect of labour market programs on the
transition between unemployment and employment states. It is found that participation in any
of the programs examined in the study increases the hazard rate of exiting unemployment and
reduces the hazard rate of exiting employment. When they further classify the programs into
four groups (training; employment placement; job search assistance; and wage subsidy), they
8
find that a wage subsidy has the largest effect on both the transition rate, which is followed by
employment placement; the effect of training occupies the third position. When the
destinations of transition out of unemployment are further divided into employment and out
of the labour force, their results show that participation in any of the programs has a positive
effect on the hazard rate to both destinations.
Using aggregate data for the period 1989 to 1995, Leeves (2000) studies the effects of the
number of labour market program commencements on the rate of outflows from
unemployment. It is found that labour market program commencements have no effect on the
outflow rate for the short-term unemployed (defined as unemployment of less than one year)
for both males and females, but a significant effect exists for the long-term unemployed (i.e.
unemployment of more than one year), and that the effect is larger for women than for men.
Unlike Stromback and Dockery (2000), the effect of a particular program or a subgroup of
programs is not separately examined in the study.
DEWR (2006) evaluates the effects of components of the Active Participation Model (APM),
including Job Search Training, Customised Assistance, Work for the Dole and Mutual
Obligation, on job seekers’ employment outcomes one year after program commencement.
The study uses a simple matching method to define a control group and estimates an
employment model for the control group. The employment model is then applied to the
treatment group to predict their employment outcomes. The difference between the observed
and predicted outcomes of the treatment group is interpreted as “net impacts” of program
participation. The results indicate that each of the four program component has a positive net
impact on the employment probability. The effects range from eight to eleven percentage
points among the components. It is also found that participation in the programs helps to
maintain employment obtained after the participation.
Richardson (2002) examines the effects of mutual obligations activity requirements on the
hazard rate of leaving unemployment benefits by young unemployed people. The set of
activities, which include education and training, are evaluated as a whole, and it is found that
the additional activity requirements have a moderate positive effect on the hazard rate of
leaving unemployment benefits . However, this effect is largely a “threat effect”, in the sense
that it is the requirement of additional activity rather than undertaking the activity itself that
has an effect on the hazard rate.
The studies reviewed above all examine the effect of labour market programs, including
training, on the probability of subsequently leaving unemployment, which may or may not
9
lead to employment. There are also studies that examine the effect of training and/or
education on labour market outcomes of the working age population, such as Booth and Katic
(2008) and Cai et al. (2008).
Booth and Katic (2008) use waves 3 to 6 of the Household, Income and Labour Dynamics in
Australia (HILDA) survey to examine the effects of on-the-job-training on wages of full-time
male workers in the private sector. They find that general training undertaken with the
previous employer has a significant effect on men’s hourly wages, although the cost of the
training was borne by the employer, while similar training undertaken with the current
employer has no effects on workers’ current wages.
International literature
There is a large body of international literature evaluating various aspects of active labour
market programs in different countries. Heckman, LaLonde and Smith (1999) provide a
comprehensive review of the U.S. studies. Martin and Grubb (2001) and the Organisation for
Economic Cooperation and Development (OECD) review the studies from all OECD
countries (OECD 2005). In addition, Kluve (2006) performs a meta-analysis to summarise the
effectiveness of different type of European active labour market programs. Appendix C
provides a list that includes papers which are included in Kluve’s analyses with additions of
Australian studies and more recent international publications 2
Since most training programs are targeted at unemployed job seekers, the exit rate from
unemployment to employment is one of the frequently used outcome measures in the studies.
In general it is found that training programs - although they may not refer to the same thing in
different studies - have a positive effect on the exit rate (Hujer et al. 2006; Arellano 2005;
Crepon, Dejemeppe and Gurgand 2005; Cockx 2003; Zhang 2003; Richardson and van de
Berg 2002). However, a few studies reach a different conclusion (e.g.Lechner and Wunsch
2006; Hujer et al. 2004; Gerfin and Lechner 2002). Some studies examine the probability of
employment at certain points in time after training commencement and find mixed evidence
(e.g. Rinne, Schneider and Uhlendorff 2007; Hardoy 2005; Andren and Andren 2002).
. To preserve space, here we
only summarise the main results.
There are a number of studies that compare employment effects of different training types.
Short and medium term training programs are often found to outperform long term training
2 The list is based on the training related studies list in Kluve (2006) with additions of Australian studies and more recent international publications.
10
programs in terms of producing positive employment outcomes (e.g. Huber et al. 2009;
Biewen et al. 2007; Fitzenberger and Speckesser 2007; Fitzenberger and Völter 2007;
Fitzenberger et al. 2006a; Lechner et al. 2005a,b). When comparing practically oriented
training programs with other form of training, Lechner et al. (2005a), Fitzenberger et al.
(2006a), and Fitzenberger and Völter (2007) do not find that practical training programs as
implemented in the 1990s in Germany produce better employment outcomes than other forms
of training. In contrast, Biewen et al. (2007) do conclude that practical training programs are
more effective than classroom-based training programs.
A few studies examine the effect of training programs on earnings of the former unemployed
and produce ambiguous findings. Raaum, Torp and Zhang (2002) use Norwegian data and
find that participation in training programs has a positive effect on earnings for those with
recent labour market experience, but no effect for labour market entrants. Using Swedish data,
Andren and Gustafsson (2002) find that participation in a training course increases earnings
for the 1984-85 and 1987-88 unemployment cohorts, but find no effects on the 1990-91
cohort. When comparing the earnings effect of the Adult Education Initiative with the Labour
Market Training programs on Swedish jobseekers, Stenberg (2007) finds that overall the latter
program has a stronger positive effect than the former, although the difference is negligible
for those aged 43-55.
3. Data The main dataset for this project is the Longitudinal Pathways Survey (LPS). This is
supplemented by the Research Evaluation Dataset (RED). The LPS tracks the experiences of
income support (IS) recipients over time, including recipients who left income support. As a
result, employment and income support receipt patterns can be derived from the data. This is
the major advantage of the LPS data. In addition, the LPS contains information on education
and training, the key variables for this project. The RED is used to obtain information on the
income support history of individuals.
The LPS is designed to evaluate the effects of the “Welfare to Work” (WtW) reform policies
introduced in early 2006. WtW is a package of initiatives aimed at increasing workforce
participation of four groups of income support recipients: Parenting Payments (PP), Disability
Support Pension (DSP), matured aged job seekers (MAJS), and very long-term unemployed
11
(VLTU).3
For this study, only cohorts 1 and 3 were used. It was advised by the project sponsor that
cohort 2 was unsuitable for the analysis. Since the cohort membership status is defined using
income support status, some individuals may fit in the definition of multiple cohorts. For
some reason, duplicates were created for individuals who fit in multiple cohorts. Since most
of our analysis pools data from both cohort 1 and cohort 3, those duplicates were dropped.
The numbers of observations that fit in the definition of each cohort by survey wave are
presented in
The LPS consists of three cohorts of income support recipients to collect
information for the pre-reform, post-reforms and transitional period of the reform. The
population of the cohort 1 sample refers to all income support (IS) recipients of working age
between 1 September 2005 and 28 February 2006, the period before WtW reform was
implemented. The cohort 2 sample represents income support recipients who were granted an
IS payment or who exited the IS system during the WtW reform transitional period (i.e. 1
March 2006 to 31 August 2006). The cohort 3 sample was drawn from the population of new
entrants and exiters of IS payments in the period 1 September 2006 to 28 February 2007,
which was after the reforms were implemented. Since the LPS was undertaken as part of an
evaluation of the WtW initiative, the WtW target groups plus Income Support entry and exit
status are used to stratify the samples. The cohort 1 sample was followed for five waves
starting from May/June 2006 and ending in May/June 2008, with each wave interview being
approximately six months apart. The interviews for cohort 2 and 3 started 18 months after
cohort 1 and were followed for 4 and 3 waves, respectively. However, in this study we focus
on the effects of training and education on various outcome measures for income support
recipients, and do not attempt to evaluate the effect of WtW reforms.
Table 1.
3 For new PP recipients (i.e. receiving PP on and after 1 July 2006) the eligibility age of the youngest child was reduced from sixteen to six years for partnered parents, and to eight years for single parents. Partnered parents with a youngest child of six years or older and single parents with a youngest child eight years or older would typically be paid Newstart Allowances and subject to part-time participation requirements. Before WtW policy changes were introduced, one of the key criteria for DSP was that the person with a disability was unable to work for 30 hours or more per week. Under WtW (i.e. receiving DSP on and after 1 July 2006), this condition was reduced to 15 hours per week for new applicants. People who were able to work 15 hours or more would mostly be granted NSA (instead of DSP) and subject to part-time participation and mutual obligation requirements. Under WtW, mature job seekers (aged between 50 and 64 and in receipt of NSA) had to register with an employment service provider and were subject to the same job search requirements as younger job seekers. And those aged 50 to 54 were no longer able to meet their activity test requirements by doing voluntary work only. For very long-term unemployed, after a second period of intensive support customised assistance, the reforms required them to have a review with their job network member to determine their future service needs.
12
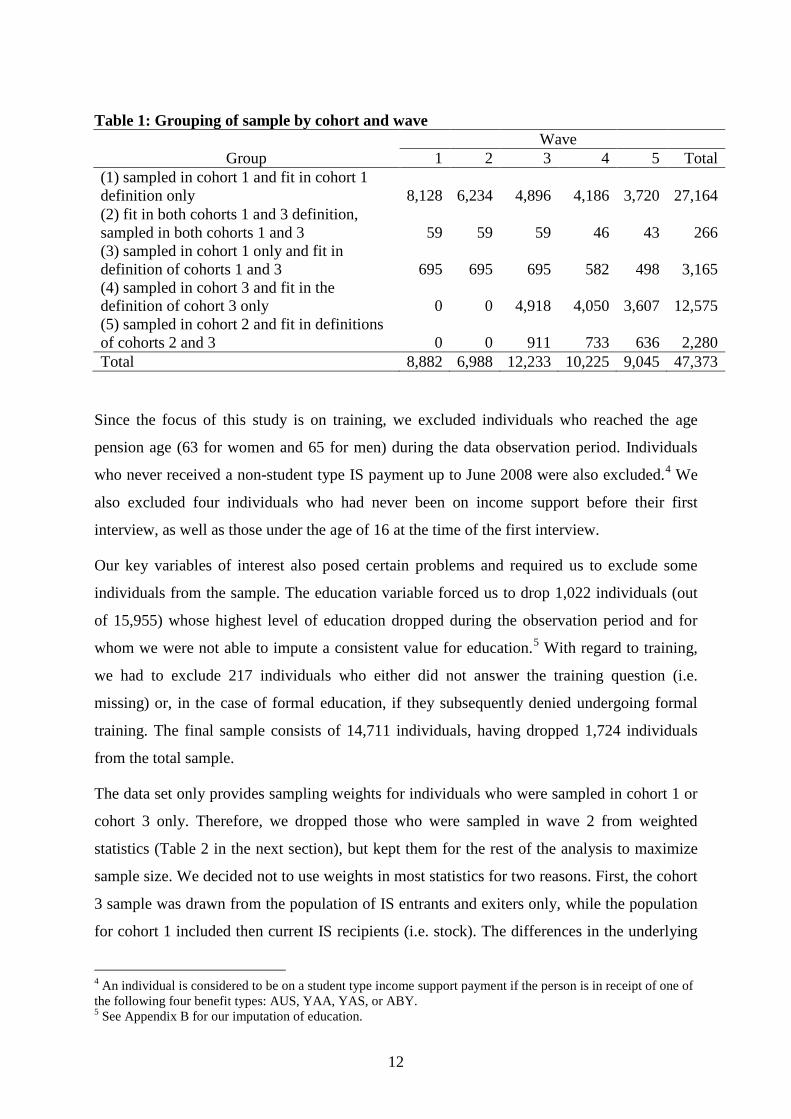
Table 1: Grouping of sample by cohort and wave Wave
Group 1 2 3 4 5 Total (1) sampled in cohort 1 and fit in cohort 1 definition only 8,128 6,234 4,896 4,186 3,720 27,164 (2) fit in both cohorts 1 and 3 definition, sampled in both cohorts 1 and 3 59 59 59 46 43 266 (3) sampled in cohort 1 only and fit in definition of cohorts 1 and 3 695 695 695 582 498 3,165 (4) sampled in cohort 3 and fit in the definition of cohort 3 only 0 0 4,918 4,050 3,607 12,575 (5) sampled in cohort 2 and fit in definitions of cohorts 2 and 3 0 0 911 733 636 2,280 Total 8,882 6,988 12,233 10,225 9,045 47,373
Since the focus of this study is on training, we excluded individuals who reached the age
pension age (63 for women and 65 for men) during the data observation period. Individuals
who never received a non-student type IS payment up to June 2008 were also excluded.4
Our key variables of interest also posed certain problems and required us to exclude some
individuals from the sample. The education variable forced us to drop 1,022 individuals (out
of 15,955) whose highest level of education dropped during the observation period and for
whom we were not able to impute a consistent value for education.
We
also excluded four individuals who had never been on income support before their first
interview, as well as those under the age of 16 at the time of the first interview.
5
The data set only provides sampling weights for individuals who were sampled in cohort 1 or
cohort 3 only. Therefore, we dropped those who were sampled in wave 2 from weighted
statistics (Table 2 in the next section), but kept them for the rest of the analysis to maximize
sample size. We decided not to use weights in most statistics for two reasons. First, the cohort
3 sample was drawn from the population of IS entrants and exiters only, while the population
for cohort 1 included then current IS recipients (i.e. stock). The differences in the underlying
With regard to training,
we had to exclude 217 individuals who either did not answer the training question (i.e.
missing) or, in the case of formal education, if they subsequently denied undergoing formal
training. The final sample consists of 14,711 individuals, having dropped 1,724 individuals
from the total sample.
4 An individual is considered to be on a student type income support payment if the person is in receipt of one of the following four benefit types: AUS, YAA, YAS, or ABY. 5 See Appendix B for our imputation of education.
13
populations of the two cohorts make interpretation of weighted estimates difficult when the
estimates are derived from combining the two cohorts. Secondly, the variables used to derive
the weights will be included as explanatory variables in the multivariate analysis. As such,
using weights will not benefit the estimates of the multivariate analysis, but will reduce the
sample size significantly. Since the sample size is not very large, we would like to keep as
many observations in the analysis as possible. The summary statistics of weighted and
unweighted sample are provided in Appendix Table A2.
Two forms of training participation can be identified in the LPS: short training, referring to
training that does not lead to a recognised certificate or qualification; and formal study or
training, referring to study or training that leads to a formally recognised certificate or
qualification. Formal study or training will be referred to as formal study from now on. In
relation to short training, respondents were only asked whether they had completed a short
training in the past six months (or since the last interview) and what type of short training it
was, given they had completed one. It is impossible to identify incomplete short trainings
from the data. Single and multiple short trainings within one period also cannot be
distinguished.
In terms of formal study, similarly, very short incomplete study spells which commenced and
ended at the same interview reference period were not recorded. However, for both short
training and formal study, the exact timing of training occurred was unknown - we only know
that it occurred in the previous six months. As a result, whether an individuals was on IS at
the time of participating in training or study is only known for individuals who were on IS or
who were off IS in the entire six month reference period. For those who were on IS only for
part of the reference period, their IS status when they were doing training is unknown. Even
though the training information is not perfect, it still provides useful information as long as
the statistics are interpreted with care.
4. Patterns of training participation and barriers to participation 4.1. Patterns of training participation
Table 2 presents the participation rates in training, differentiated by the different training
forms. For individuals in cohort 1, about a quarter of them undertook one of the two forms of
training, although the rate varies across different waves. Individuals in Cohort 3 had a higher
rate of training participation (varying from 31 per cent to 29 per cent across waves) than those
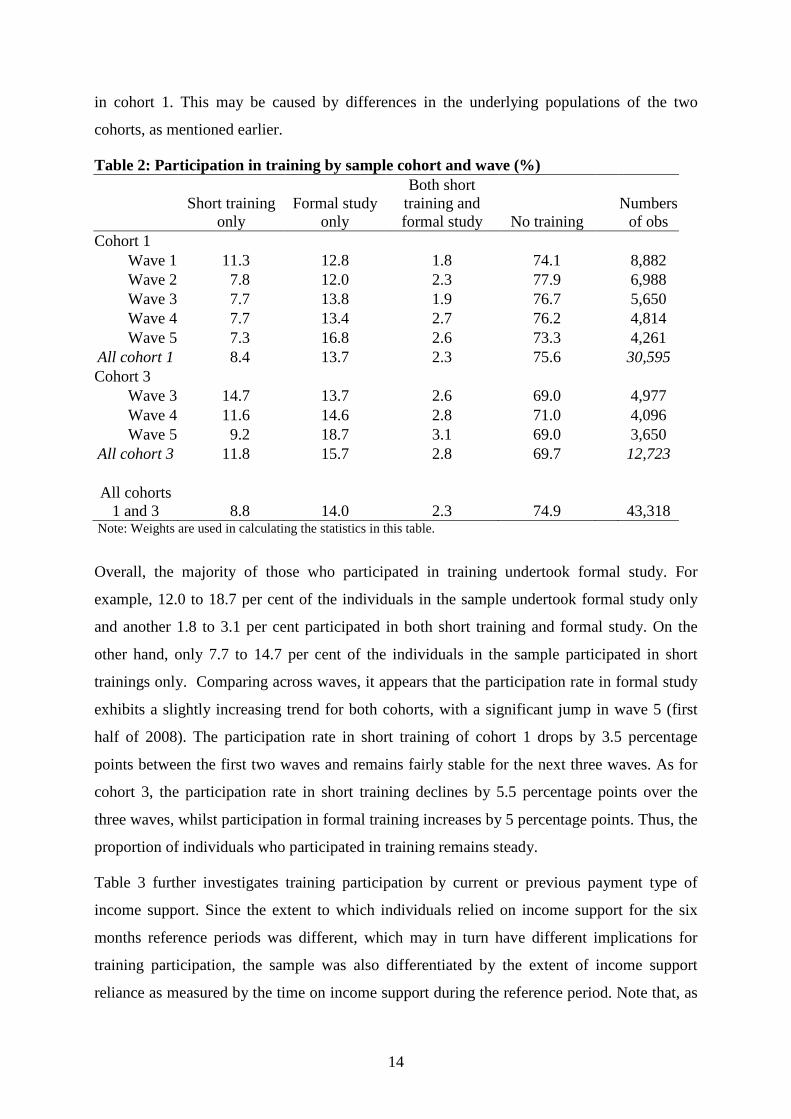
14
in cohort 1. This may be caused by differences in the underlying populations of the two
cohorts, as mentioned earlier.
Table 2: Participation in training by sample cohort and wave (%)
Short training
only Formal study
only
Both short training and formal study No training
Numbers of obs
Cohort 1 Wave 1 11.3 12.8 1.8 74.1 8,882 Wave 2 7.8 12.0 2.3 77.9 6,988 Wave 3 7.7 13.8 1.9 76.7 5,650 Wave 4 7.7 13.4 2.7 76.2 4,814 Wave 5 7.3 16.8 2.6 73.3 4,261
All cohort 1 8.4 13.7 2.3 75.6 30,595 Cohort 3
Wave 3 14.7 13.7 2.6 69.0 4,977 Wave 4 11.6 14.6 2.8 71.0 4,096 Wave 5 9.2 18.7 3.1 69.0 3,650
All cohort 3 11.8 15.7 2.8 69.7 12,723
All cohorts 1 and 3 8.8 14.0 2.3 74.9 43,318
Note: Weights are used in calculating the statistics in this table.
Overall, the majority of those who participated in training undertook formal study. For
example, 12.0 to 18.7 per cent of the individuals in the sample undertook formal study only
and another 1.8 to 3.1 per cent participated in both short training and formal study. On the
other hand, only 7.7 to 14.7 per cent of the individuals in the sample participated in short
trainings only. Comparing across waves, it appears that the participation rate in formal study
exhibits a slightly increasing trend for both cohorts, with a significant jump in wave 5 (first
half of 2008). The participation rate in short training of cohort 1 drops by 3.5 percentage
points between the first two waves and remains fairly stable for the next three waves. As for
cohort 3, the participation rate in short training declines by 5.5 percentage points over the
three waves, whilst participation in formal training increases by 5 percentage points. Thus, the
proportion of individuals who participated in training remains steady.
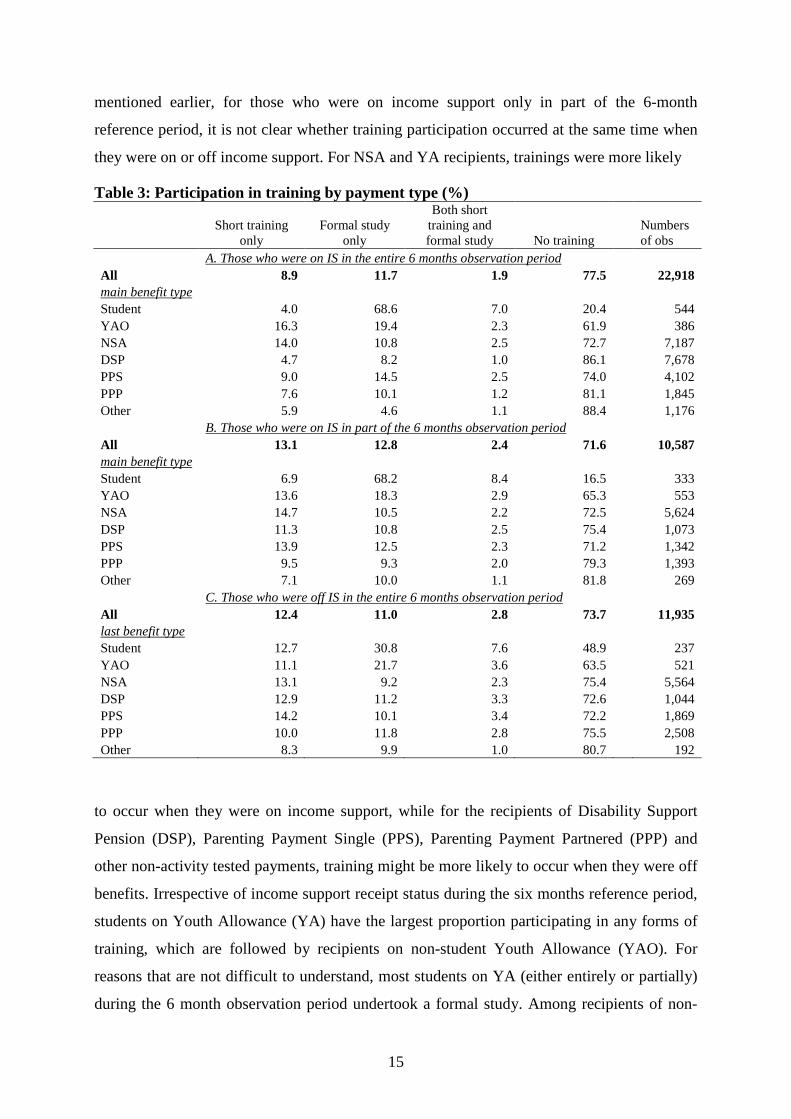
Table 3 further investigates training participation by current or previous payment type of
income support. Since the extent to which individuals relied on income support for the six
months reference periods was different, which may in turn have different implications for
training participation, the sample was also differentiated by the extent of income support
reliance as measured by the time on income support during the reference period. Note that, as
15
mentioned earlier, for those who were on income support only in part of the 6-month
reference period, it is not clear whether training participation occurred at the same time when
they were on or off income support. For NSA and YA recipients, trainings were more likely
Table 3: Participation in training by payment type (%)
Short training
only Formal study
only
Both short training and formal study No training
Numbers of obs
A. Those who were on IS in the entire 6 months observation period All 8.9 11.7 1.9 77.5 22,918
main benefit type Student 4.0 68.6 7.0 20.4 544 YAO 16.3 19.4 2.3 61.9 386 NSA 14.0 10.8 2.5 72.7 7,187 DSP 4.7 8.2 1.0 86.1 7,678 PPS 9.0 14.5 2.5 74.0 4,102 PPP 7.6 10.1 1.2 81.1 1,845 Other 5.9 4.6 1.1 88.4 1,176 B. Those who were on IS in part of the 6 months observation period All 13.1 12.8 2.4 71.6 10,587
main benefit type Student 6.9 68.2 8.4 16.5 333 YAO 13.6 18.3 2.9 65.3 553 NSA 14.7 10.5 2.2 72.5 5,624 DSP 11.3 10.8 2.5 75.4 1,073 PPS 13.9 12.5 2.3 71.2 1,342 PPP 9.5 9.3 2.0 79.3 1,393 Other 7.1 10.0 1.1 81.8 269 C. Those who were off IS in the entire 6 months observation period All 12.4 11.0 2.8 73.7 11,935
last benefit type Student 12.7 30.8 7.6 48.9 237 YAO 11.1 21.7 3.6 63.5 521 NSA 13.1 9.2 2.3 75.4 5,564 DSP 12.9 11.2 3.3 72.6 1,044 PPS 14.2 10.1 3.4 72.2 1,869 PPP 10.0 11.8 2.8 75.5 2,508 Other 8.3 9.9 1.0 80.7 192
to occur when they were on income support, while for the recipients of Disability Support
Pension (DSP), Parenting Payment Single (PPS), Parenting Payment Partnered (PPP) and
other non-activity tested payments, training might be more likely to occur when they were off
benefits. Irrespective of income support receipt status during the six months reference period,
students on Youth Allowance (YA) have the largest proportion participating in any forms of
training, which are followed by recipients on non-student Youth Allowance (YAO). For
reasons that are not difficult to understand, most students on YA (either entirely or partially)
during the 6 month observation period undertook a formal study. Among recipients of non-
16
student Youth Allowance, about 20 per cent undertook formal studies and a slightly smaller
proportion participated in short training. For income support other than youth allowance,
education and training participation rate varies by payment type when they are on income
support. However, once these individuals are off income support, there are no significant
differences in the participation rate among them.
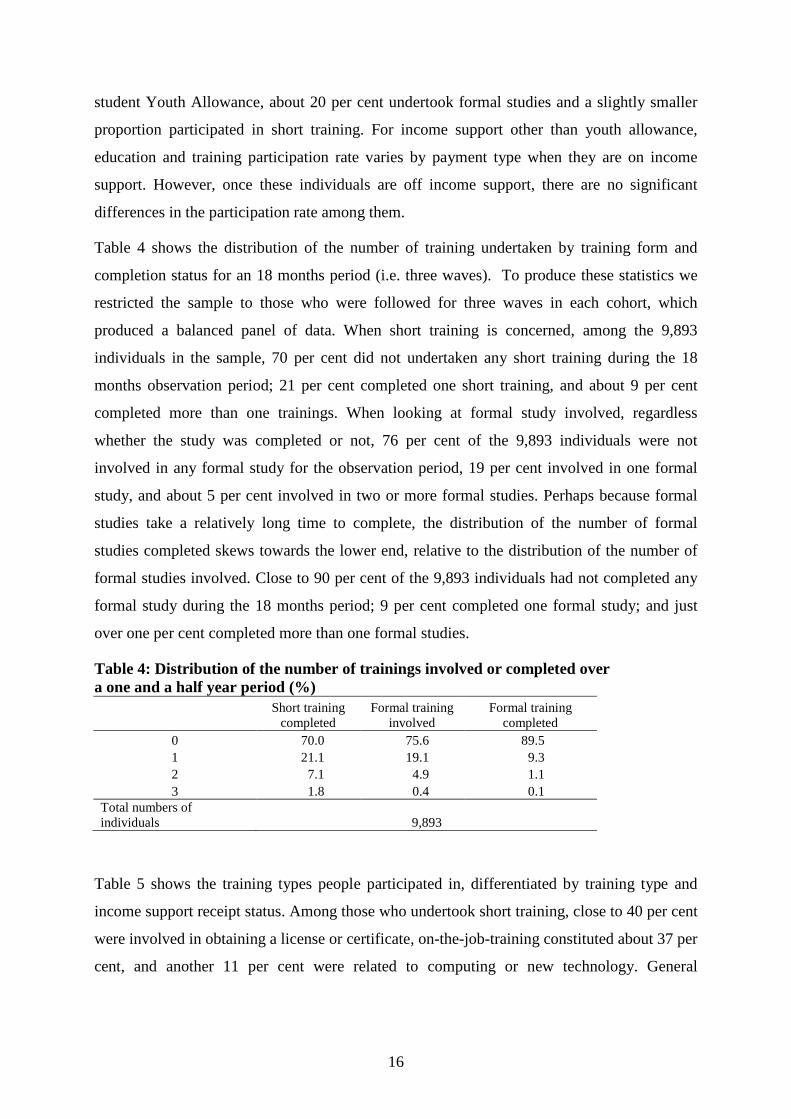
Table 4 shows the distribution of the number of training undertaken by training form and
completion status for an 18 months period (i.e. three waves). To produce these statistics we
restricted the sample to those who were followed for three waves in each cohort, which
produced a balanced panel of data. When short training is concerned, among the 9,893
individuals in the sample, 70 per cent did not undertaken any short training during the 18
months observation period; 21 per cent completed one short training, and about 9 per cent
completed more than one trainings. When looking at formal study involved, regardless
whether the study was completed or not, 76 per cent of the 9,893 individuals were not
involved in any formal study for the observation period, 19 per cent involved in one formal
study, and about 5 per cent involved in two or more formal studies. Perhaps because formal
studies take a relatively long time to complete, the distribution of the number of formal
studies completed skews towards the lower end, relative to the distribution of the number of
formal studies involved. Close to 90 per cent of the 9,893 individuals had not completed any
formal study during the 18 months period; 9 per cent completed one formal study; and just
over one per cent completed more than one formal studies.
Table 4: Distribution of the number of trainings involved or completed over a one and a half year period (%)
Short training
completed Formal training
involved Formal training
completed 0 70.0 75.6 89.5 1 21.1 19.1 9.3 2 7.1 4.9 1.1 3 1.8 0.4 0.1
Total numbers of individuals 9,893
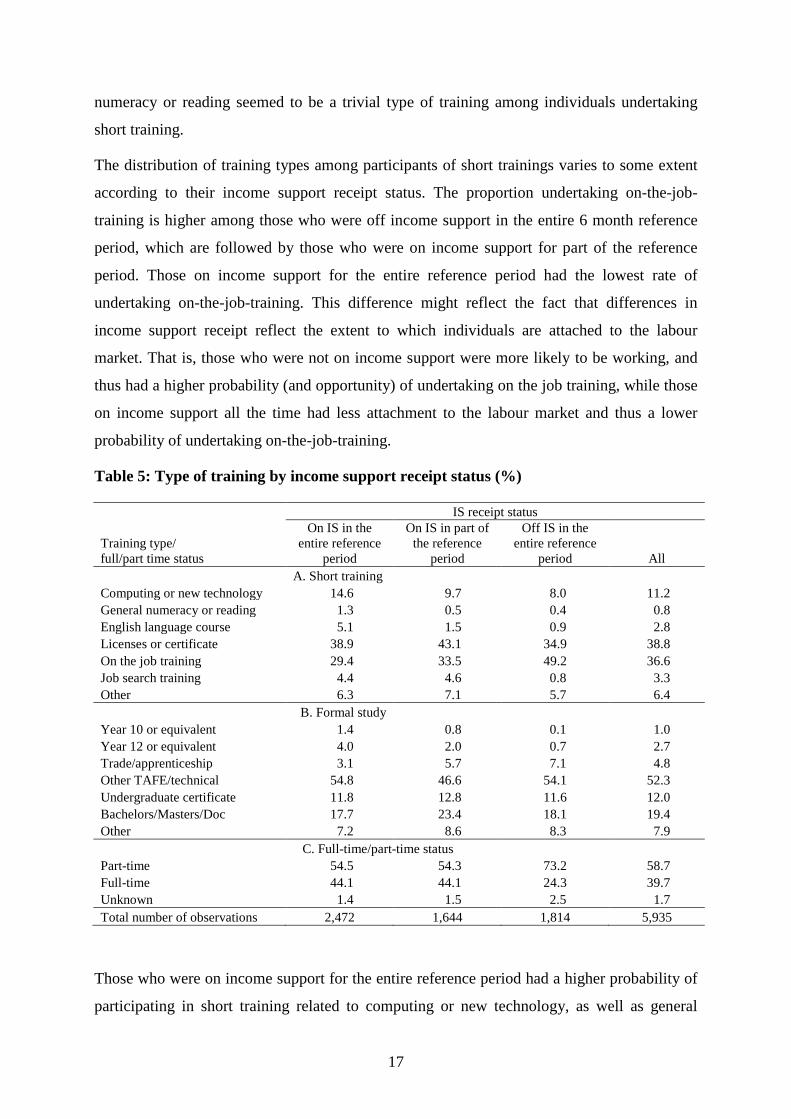
Table 5 shows the training types people participated in, differentiated by training type and
income support receipt status. Among those who undertook short training, close to 40 per cent
were involved in obtaining a license or certificate, on-the-job-training constituted about 37 per
cent, and another 11 per cent were related to computing or new technology. General
17
numeracy or reading seemed to be a trivial type of training among individuals undertaking
short training.
The distribution of training types among participants of short trainings varies to some extent
according to their income support receipt status. The proportion undertaking on-the-job-
training is higher among those who were off income support in the entire 6 month reference
period, which are followed by those who were on income support for part of the reference
period. Those on income support for the entire reference period had the lowest rate of
undertaking on-the-job-training. This difference might reflect the fact that differences in
income support receipt reflect the extent to which individuals are attached to the labour
market. That is, those who were not on income support were more likely to be working, and
thus had a higher probability (and opportunity) of undertaking on the job training, while those
on income support all the time had less attachment to the labour market and thus a lower
probability of undertaking on-the-job-training.
Table 5: Type of training by income support receipt status (%)
IS receipt status
Training type/ full/part time status
On IS in the entire reference
period
On IS in part of the reference
period
Off IS in the entire reference
period All A. Short training Computing or new technology 14.6 9.7 8.0 11.2 General numeracy or reading 1.3 0.5 0.4 0.8 English language course 5.1 1.5 0.9 2.8 Licenses or certificate 38.9 43.1 34.9 38.8 On the job training 29.4 33.5 49.2 36.6 Job search training 4.4 4.6 0.8 3.3 Other 6.3 7.1 5.7 6.4 B. Formal study Year 10 or equivalent 1.4 0.8 0.1 1.0 Year 12 or equivalent 4.0 2.0 0.7 2.7 Trade/apprenticeship 3.1 5.7 7.1 4.8 Other TAFE/technical 54.8 46.6 54.1 52.3 Undergraduate certificate 11.8 12.8 11.6 12.0 Bachelors/Masters/Doc 17.7 23.4 18.1 19.4 Other 7.2 8.6 8.3 7.9 C. Full-time/part-time status Part-time 54.5 54.3 73.2 58.7 Full-time 44.1 44.1 24.3 39.7 Unknown 1.4 1.5 2.5 1.7 Total number of observations 2,472 1,644 1,814 5,935
Those who were on income support for the entire reference period had a higher probability of
participating in short training related to computing or new technology, as well as general
18
numeracy or reading, than the other two groups of short training participants, perhaps
reflecting the fact that the former group lacks these relevant job skills to a larger extent than
the latter two groups.
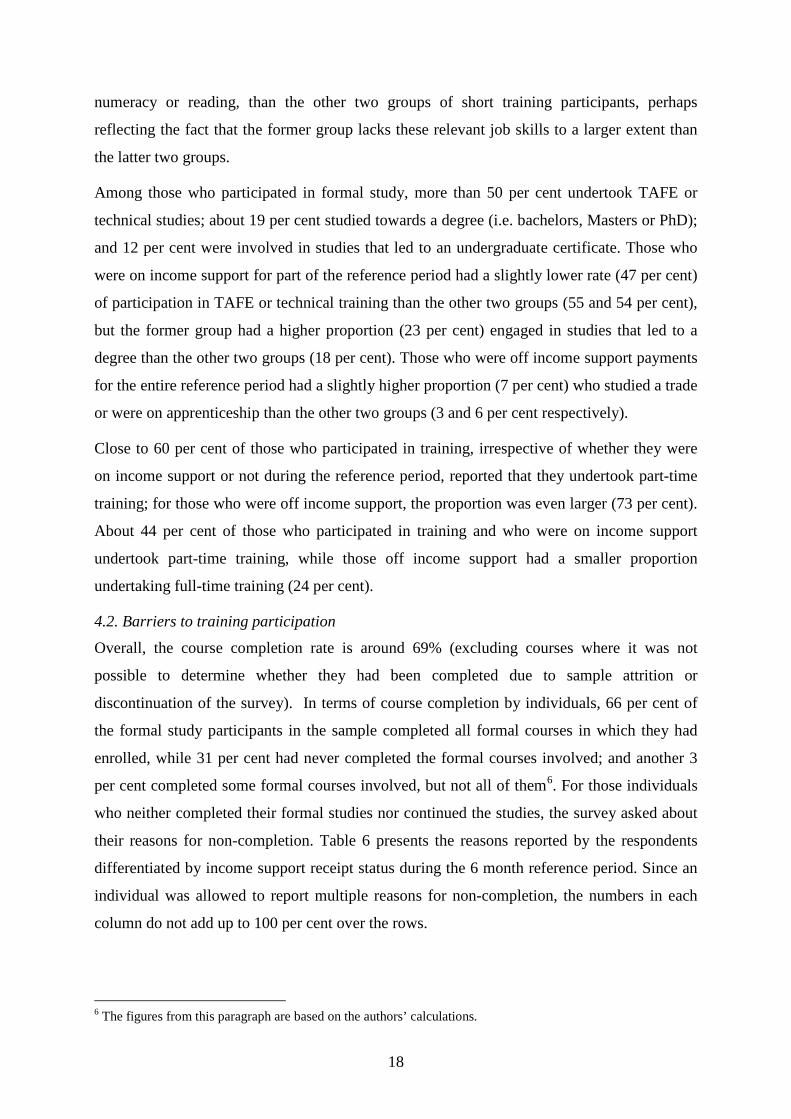
Among those who participated in formal study, more than 50 per cent undertook TAFE or
technical studies; about 19 per cent studied towards a degree (i.e. bachelors, Masters or PhD);
and 12 per cent were involved in studies that led to an undergraduate certificate. Those who
were on income support for part of the reference period had a slightly lower rate (47 per cent)
of participation in TAFE or technical training than the other two groups (55 and 54 per cent),
but the former group had a higher proportion (23 per cent) engaged in studies that led to a
degree than the other two groups (18 per cent). Those who were off income support payments
for the entire reference period had a slightly higher proportion (7 per cent) who studied a trade
or were on apprenticeship than the other two groups (3 and 6 per cent respectively).
Close to 60 per cent of those who participated in training, irrespective of whether they were
on income support or not during the reference period, reported that they undertook part-time
training; for those who were off income support, the proportion was even larger (73 per cent).
About 44 per cent of those who participated in training and who were on income support
undertook part-time training, while those off income support had a smaller proportion
undertaking full-time training (24 per cent).
4.2. Barriers to training participation
Overall, the course completion rate is around 69% (excluding courses where it was not
possible to determine whether they had been completed due to sample attrition or
discontinuation of the survey). In terms of course completion by individuals, 66 per cent of
the formal study participants in the sample completed all formal courses in which they had
enrolled, while 31 per cent had never completed the formal courses involved; and another 3
per cent completed some formal courses involved, but not all of them6
6 The figures from this paragraph are based on the authors’ calculations.
. For those individuals
who neither completed their formal studies nor continued the studies, the survey asked about
their reasons for non-completion. Table 6 presents the reasons reported by the respondents
differentiated by income support receipt status during the 6 month reference period. Since an
individual was allowed to report multiple reasons for non-completion, the numbers in each
column do not add up to 100 per cent over the rows.
19
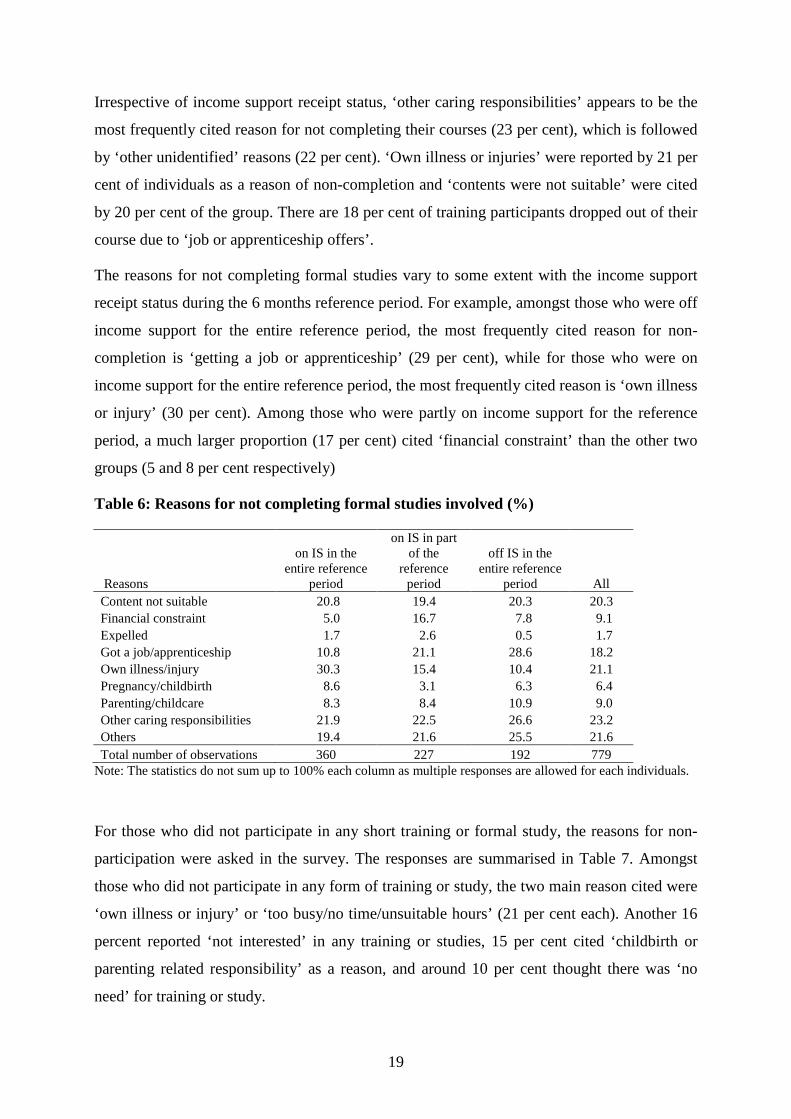
Irrespective of income support receipt status, ‘other caring responsibilities’ appears to be the
most frequently cited reason for not completing their courses (23 per cent), which is followed
by ‘other unidentified’ reasons (22 per cent). ‘Own illness or injuries’ were reported by 21 per
cent of individuals as a reason of non-completion and ‘contents were not suitable’ were cited
by 20 per cent of the group. There are 18 per cent of training participants dropped out of their
course due to ‘job or apprenticeship offers’.
The reasons for not completing formal studies vary to some extent with the income support
receipt status during the 6 months reference period. For example, amongst those who were off
income support for the entire reference period, the most frequently cited reason for non-
completion is ‘getting a job or apprenticeship’ (29 per cent), while for those who were on
income support for the entire reference period, the most frequently cited reason is ‘own illness
or injury’ (30 per cent). Among those who were partly on income support for the reference
period, a much larger proportion (17 per cent) cited ‘financial constraint’ than the other two
groups (5 and 8 per cent respectively)
Table 6: Reasons for not completing formal studies involved (%)
Reasons
on IS in the entire reference
period
on IS in part of the
reference period
off IS in the entire reference
period All Content not suitable 20.8 19.4 20.3 20.3 Financial constraint 5.0 16.7 7.8 9.1 Expelled 1.7 2.6 0.5 1.7 Got a job/apprenticeship 10.8 21.1 28.6 18.2 Own illness/injury 30.3 15.4 10.4 21.1 Pregnancy/childbirth 8.6 3.1 6.3 6.4 Parenting/childcare 8.3 8.4 10.9 9.0 Other caring responsibilities 21.9 22.5 26.6 23.2 Others 19.4 21.6 25.5 21.6 Total number of observations 360 227 192 779
Note: The statistics do not sum up to 100% each column as multiple responses are allowed for each individuals.
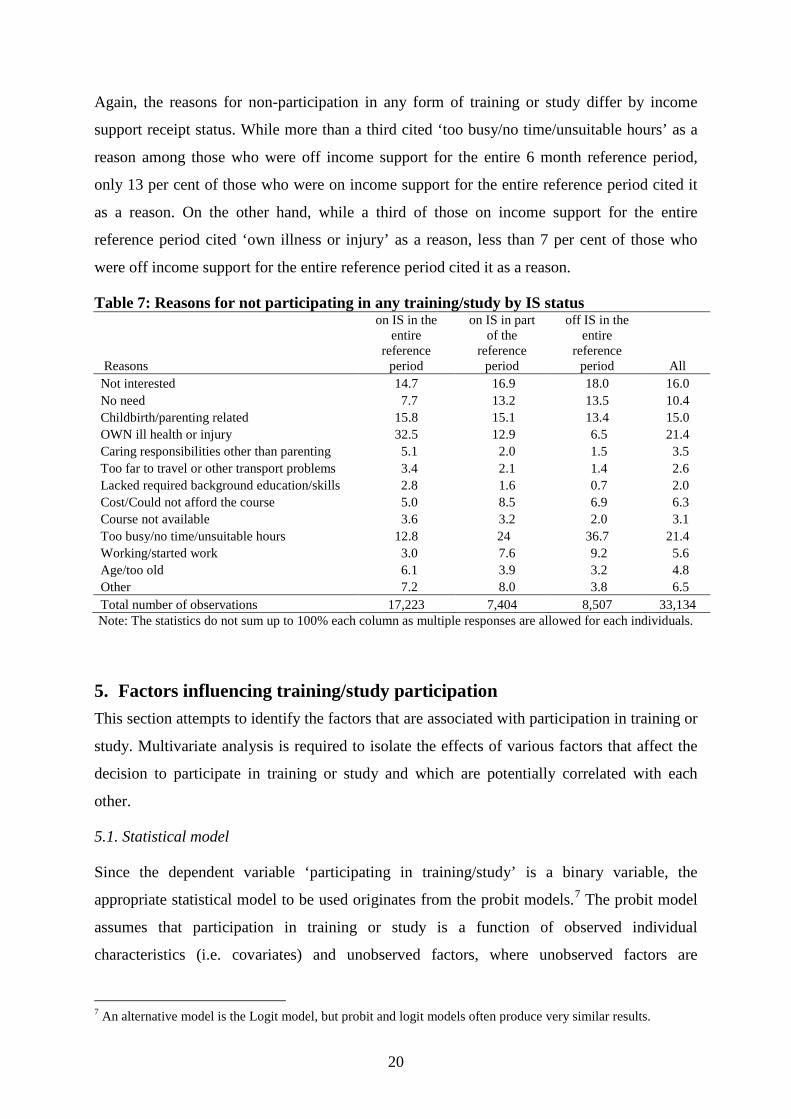
For those who did not participate in any short training or formal study, the reasons for non-
participation were asked in the survey. The responses are summarised in Table 7. Amongst
those who did not participate in any form of training or study, the two main reason cited were
‘own illness or injury’ or ‘too busy/no time/unsuitable hours’ (21 per cent each). Another 16
percent reported ‘not interested’ in any training or studies, 15 per cent cited ‘childbirth or
parenting related responsibility’ as a reason, and around 10 per cent thought there was ‘no
need’ for training or study.
20
Again, the reasons for non-participation in any form of training or study differ by income
support receipt status. While more than a third cited ‘too busy/no time/unsuitable hours’ as a
reason among those who were off income support for the entire 6 month reference period,
only 13 per cent of those who were on income support for the entire reference period cited it
as a reason. On the other hand, while a third of those on income support for the entire
reference period cited ‘own illness or injury’ as a reason, less than 7 per cent of those who
were off income support for the entire reference period cited it as a reason.
Table 7: Reasons for not participating in any training/study by IS status
Reasons
on IS in the entire
reference period
on IS in part of the
reference period
off IS in the entire
reference period All
Not interested 14.7 16.9 18.0 16.0 No need 7.7 13.2 13.5 10.4 Childbirth/parenting related 15.8 15.1 13.4 15.0 OWN ill health or injury 32.5 12.9 6.5 21.4 Caring responsibilities other than parenting 5.1 2.0 1.5 3.5 Too far to travel or other transport problems 3.4 2.1 1.4 2.6 Lacked required background education/skills 2.8 1.6 0.7 2.0 Cost/Could not afford the course 5.0 8.5 6.9 6.3 Course not available 3.6 3.2 2.0 3.1 Too busy/no time/unsuitable hours 12.8 24 36.7 21.4 Working/started work 3.0 7.6 9.2 5.6 Age/too old 6.1 3.9 3.2 4.8 Other 7.2 8.0 3.8 6.5 Total number of observations 17,223 7,404 8,507 33,134
Note: The statistics do not sum up to 100% each column as multiple responses are allowed for each individuals.
5. Factors influencing training/study participation This section attempts to identify the factors that are associated with participation in training or
study. Multivariate analysis is required to isolate the effects of various factors that affect the
decision to participate in training or study and which are potentially correlated with each
other.
5.1. Statistical model
Since the dependent variable ‘participating in training/study’ is a binary variable, the
appropriate statistical model to be used originates from the probit models.7
7 An alternative model is the Logit model, but probit and logit models often produce very similar results.
The probit model
assumes that participation in training or study is a function of observed individual
characteristics (i.e. covariates) and unobserved factors, where unobserved factors are
21
summarised into a random variable that follows a standard normal distribution. Summary
statistics on the observed covariates of training/study participation are listed in Appendix
Table A3. Using the information available from both LPS and RED, we try to include in the
model as many of the observed covariates as possible.
Since individuals can participate in either formal study or short training, or both, and the
factors that affect the decisions could be correlated, we model participation in formal study
and participation in short training jointly. The joint model improves the efficiency of the
estimates and this is indeed supported by the empirical results.8
A disadvantage of the probit model, compared to a linear model, is that the coefficient
estimate on an observed variable does not measure the marginal effect of the variable,
although the sign of the estimate does indicate the impact direction of the variable. For
example, a positive sign of a variable means that an increase in the variable raises the
probability of participating in training or study. For ease of interpretation, we report the
marginal effect estimates in the main text (see table 8) which are calculated using the
coefficient estimates and the underlying data. The joint model allows us to calculate the
marginal effects on the probability of participating for three distinct outcomes: formal study
only, short-training only, and both formal study and short training. Since the sum of the
probabilities of participating in any form of training or study and the probability of not
participating must equal one, the marginal effect on the probability of not participating can be
inferred as zero minus the sum of the effects on the probabilities of participating in any
training or study.
It is important to note that the explanatory variables used in the model are taken from the
information one wave (6 months) prior to the current interview. Since the dependent variable
(training participation) concerns the interviewees’ experience in training and education for the
past 6 months, their current characteristics may have been influenced by their participation in
training or formal study. This endogenity problem of reverse causality may arise if variables
from the current interview are applied to explain training participation. To overcome this
problem, individuals’ decision concerning training participation are best explained by their
observable characteristics at the time of participation. Given the current data constraints, the
lagged values of the explanatory variables are the best choice to solve this problem.
8 As shown in the appendix Table 15, the estimate on the correlation of the unobserved determinants between participation in formal study and in short training is statistically significant, which implies an efficiency gain in jointly modelling the two participation equations.
22
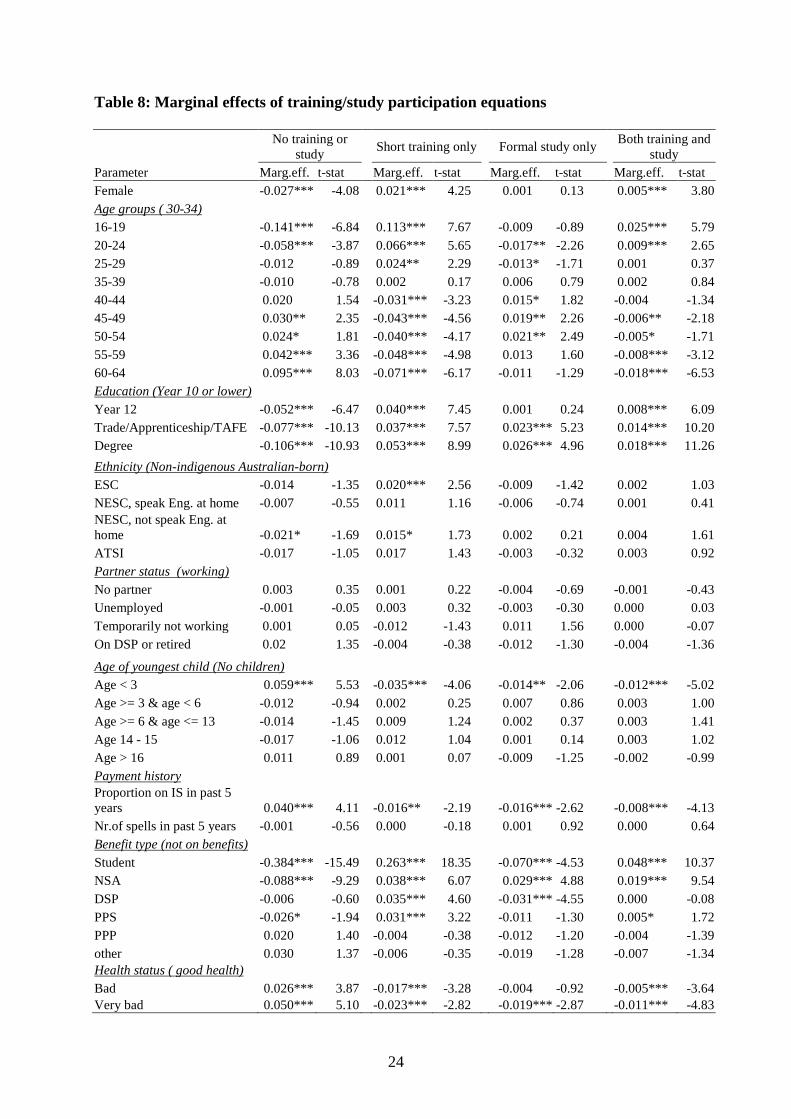
5.2. Estimation results
We use the estimate on the first variable female in table 8 to illustrate how to interpret the
marginal effect estimates.9 Female is a dummy variable, equal to one if a person is female
and zero otherwise. The estimates indicate that other things being equal, the probability of
participating in short training only is 2.1 percentage points higher for females than for males;
the probability of participating in both formal study and short training is half a percentage
point higher; while the probability of not participating in training or study is 2.7 percentage
points lower.10
Age is grouped into ten categories and the reference age group is 30-34 years old. That is, all
estimates on the age variables are benchmarked to the 30-34 age group. The estimates indicate
that compared to those aged 30-34 years, younger people are more likely to participate in
short training only and the younger the age, the stronger is the association. For example, while
the probability of participating in short training only is 2.4 percentage points higher for those
aged 25-29 relative to those aged 30-34, the difference in the probability is 11.3 percentage
points between those aged 16-19 and those aged 30-34. On the other hand, older people are
less likely to participate in short training only when compared with those aged 30-34, and the
likelihood decreases even further when age further increases. The probability of participating
in short training only is 3.1 percentage points lower for those aged 40-44 relative to those
aged 30-34, but for those aged 60-64 the probability is 7.1 percentage points lower. The
impact pattern for participating in both short training and formal study is similar to that on
participating in short training only but with much smaller magnitude, while the impact on
participating in formal study only shows an opposite pattern of smaller magnitude.
The probability of participating in formal study is also higher for females than
for males, but the estimate is very small in magnitude and statistically insignificant.
Consequently, we see that the probability of not participating in any training or study is on
average higher for older people and lower for younger people, a finding that is consistent with
the prediction of human capital theory. The theory implies that older people tend to invest less
in human capital than younger people since the former have a shorter expected life span ahead
and thus lower expected returns to their investment. While this may be an optimal decision
from an individual‘s point of view, the social returns to human capital investments for older
9 Note that due to rounding errors the sum of the marginal effects across the column may not always be zero. 10 Here all estimates when looked at alone should be interpreted as conditional on ‘other things being equal’, but to preserve space this phrase may not be repeated all the time.
23
people might still justify policies that encourage older people to invest more in their human
capital, for instance by subsidising the cost of participating in a training or study.
In terms of education attainment, the reference group refers to those who have not progressed
beyond Year 10. It is interesting to note that participating in short training, formal study, or
both, is positively associated with the level of education that an individual already has
obtained. That is, the higher the education level an individual has already achieved, the more
likely it is that this person will participate in further education of the types mentioned. One
explanation might be that for those with a higher level of education, the marginal cost of
participating in further training or study is lower than for those with a lower level of
education, particularly in terms of time required to obtain new skills. Another explanation
might be that those with a higher level of education have some unobserved personal attribute,
such as genetic ability or intrinsic motivation, that leads them to pursue further studies.
For the ethnicity variables, people who were born in Australia but not of an indigenous
background constitute the reference group. These variables are generally insignificant except
for the estimate on immigrants from an English speaking country, which is found to increase
the probability of participating in short training only by 2 percentage points, compared to the
non-indigenous Australian born. There is also weak evidence that immigrants from a non-
English speaking country who do not speak English at home have a higher probability of
participating in short training only and a lower probability of not participating in any training
or study.
24
Table 8: Marginal effects of training/study participation equations
No training or
study Short training only Formal study only Both training and study
Parameter Marg.eff. t-stat Marg.eff. t-stat Marg.eff. t-stat Marg.eff. t-stat Female -0.027*** -4.08 0.021*** 4.25 0.001 0.13 0.005*** 3.80
Age groups ( 30-34) 16-19 -0.141*** -6.84 0.113*** 7.67 -0.009 -0.89 0.025*** 5.79 20-24 -0.058*** -3.87 0.066*** 5.65 -0.017** -2.26 0.009*** 2.65 25-29 -0.012 -0.89 0.024** 2.29 -0.013* -1.71 0.001 0.37 35-39 -0.010 -0.78 0.002 0.17 0.006 0.79 0.002 0.84 40-44 0.020 1.54 -0.031*** -3.23 0.015* 1.82 -0.004 -1.34 45-49 0.030** 2.35 -0.043*** -4.56 0.019** 2.26 -0.006** -2.18 50-54 0.024* 1.81 -0.040*** -4.17 0.021** 2.49 -0.005* -1.71 55-59 0.042*** 3.36 -0.048*** -4.98 0.013 1.60 -0.008*** -3.12 60-64 0.095*** 8.03 -0.071*** -6.17 -0.011 -1.29 -0.018*** -6.53
Education (Year 10 or lower) Year 12 -0.052*** -6.47 0.040*** 7.45 0.001 0.24 0.008*** 6.09 Trade/Apprenticeship/TAFE -0.077*** -10.13 0.037*** 7.57 0.023*** 5.23 0.014*** 10.20 Degree -0.106*** -10.93 0.053*** 8.99 0.026*** 4.96 0.018*** 11.26
Ethnicity (Non-indigenous Australian-born) ESC -0.014 -1.35 0.020*** 2.56 -0.009 -1.42 0.002 1.03 NESC, speak Eng. at home -0.007 -0.55 0.011 1.16 -0.006 -0.74 0.001 0.41 NESC, not speak Eng. at home -0.021* -1.69 0.015* 1.73 0.002 0.21 0.004 1.61 ATSI -0.017 -1.05 0.017 1.43 -0.003 -0.32 0.003 0.92
Partner status (working) No partner 0.003 0.35 0.001 0.22 -0.004 -0.69 -0.001 -0.43 Unemployed -0.001 -0.05 0.003 0.32 -0.003 -0.30 0.000 0.03 Temporarily not working 0.001 0.05 -0.012 -1.43 0.011 1.56 0.000 -0.07 On DSP or retired 0.02 1.35 -0.004 -0.38 -0.012 -1.30 -0.004 -1.36
Age of youngest child (No children) Age < 3 0.059*** 5.53 -0.035*** -4.06 -0.014** -2.06 -0.012*** -5.02 Age >= 3 & age < 6 -0.012 -0.94 0.002 0.25 0.007 0.86 0.003 1.00 Age >= 6 & age <= 13 -0.014 -1.45 0.009 1.24 0.002 0.37 0.003 1.41 Age 14 - 15 -0.017 -1.06 0.012 1.04 0.001 0.14 0.003 1.02 Age > 16 0.011 0.89 0.001 0.07 -0.009 -1.25 -0.002 -0.99
Payment history Proportion on IS in past 5 years 0.040*** 4.11 -0.016** -2.19 -0.016*** -2.62 -0.008*** -4.13 Nr.of spells in past 5 years -0.001 -0.56 0.000 -0.18 0.001 0.92 0.000 0.64
Benefit type (not on benefits) Student -0.384*** -15.49 0.263*** 18.35 -0.070*** -4.53 0.048*** 10.37 NSA -0.088*** -9.29 0.038*** 6.07 0.029*** 4.88 0.019*** 9.54 DSP -0.006 -0.60 0.035*** 4.60 -0.031*** -4.55 0.000 -0.08 PPS -0.026* -1.94 0.031*** 3.22 -0.011 -1.30 0.005* 1.72 PPP 0.020 1.40 -0.004 -0.38 -0.012 -1.20 -0.004 -1.39 other 0.030 1.37 -0.006 -0.35 -0.019 -1.28 -0.007 -1.34
Health status ( good health) Bad 0.026*** 3.87 -0.017*** -3.28 -0.004 -0.92 -0.005*** -3.64 Very bad 0.050*** 5.10 -0.023*** -2.82 -0.019*** -2.87 -0.011*** -4.83
25
No training Only short training Only formal training Both
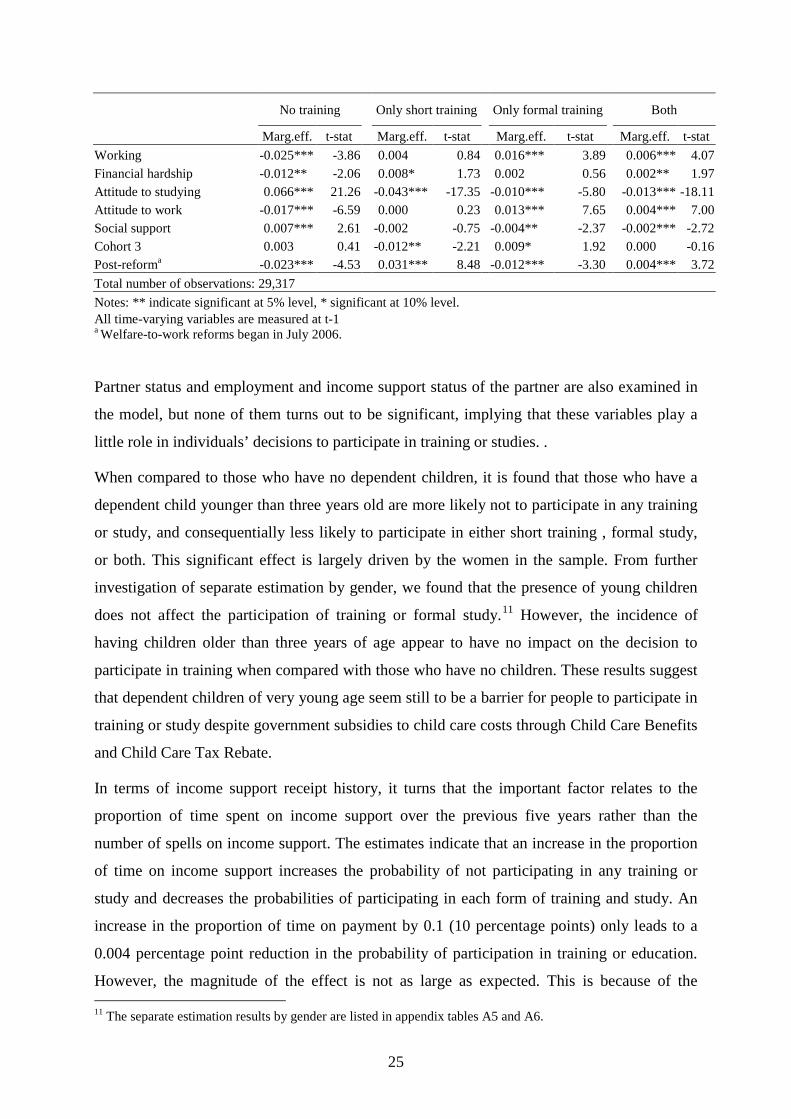
Marg.eff. t-stat Marg.eff. t-stat Marg.eff. t-stat Marg.eff. t-stat Working -0.025*** -3.86 0.004 0.84 0.016*** 3.89 0.006*** 4.07 Financial hardship -0.012** -2.06 0.008* 1.73 0.002 0.56 0.002** 1.97 Attitude to studying 0.066*** 21.26 -0.043*** -17.35 -0.010*** -5.80 -0.013*** -18.11 Attitude to work -0.017*** -6.59 0.000 0.23 0.013*** 7.65 0.004*** 7.00 Social support 0.007*** 2.61 -0.002 -0.75 -0.004** -2.37 -0.002*** -2.72 Cohort 3 0.003 0.41 -0.012** -2.21 0.009* 1.92 0.000 -0.16 Post-reforma -0.023*** -4.53 0.031*** 8.48 -0.012*** -3.30 0.004*** 3.72 Total number of observations: 29,317 Notes: ** indicate significant at 5% level, * significant at 10% level. All time-varying variables are measured at t-1 a Welfare-to-work reforms began in July 2006.
Partner status and employment and income support status of the partner are also examined in
the model, but none of them turns out to be significant, implying that these variables play a
little role in individuals’ decisions to participate in training or studies. .
When compared to those who have no dependent children, it is found that those who have a
dependent child younger than three years old are more likely not to participate in any training
or study, and consequentially less likely to participate in either short training , formal study,
or both. This significant effect is largely driven by the women in the sample. From further
investigation of separate estimation by gender, we found that the presence of young children
does not affect the participation of training or formal study.11
In terms of income support receipt history, it turns that the important factor relates to the
proportion of time spent on income support over the previous five years rather than the
number of spells on income support. The estimates indicate that an increase in the proportion
of time on income support increases the probability of not participating in any training or
study and decreases the probabilities of participating in each form of training and study. An
increase in the proportion of time on payment by 0.1 (10 percentage points) only leads to a
0.004 percentage point reduction in the probability of participation in training or education.
However, the magnitude of the effect is not as large as expected. This is because of the
However, the incidence of
having children older than three years of age appear to have no impact on the decision to
participate in training when compared with those who have no children. These results suggest
that dependent children of very young age seem still to be a barrier for people to participate in
training or study despite government subsidies to child care costs through Child Care Benefits
and Child Care Tax Rebate.
11 The separate estimation results by gender are listed in appendix tables A5 and A6.
26
estimates here are marginal effects keeping other characteristics the same and the duration of
past income support receipt are correlated with other characteristics. For example, large
proportion of long term unemployed individuals has relatively low education level.
The estimates on the benefit type variables show that certain types of benefit payments matter
in individuals’ decision to participate in training/study. Compared to people who are not on
income support at the previous interview, persons receiving a student type payment (such as
AusStudy and Youth Allowance (student)) are more likely to participate in short training only
or both short training and formal study, but less likely to participate only in formal study.
Overall people on student payments are less likely not to participate in any training or study.
This may reflect that some of those who received student payments (participating in study by
default) at the previous interview have already completed their training, and consequently no
immediate needs to participate in further training.
Persons on Newstart Allowance (NSA) are more likely to participate in short training or
formal study, or both, and are less likely not to participate in any training when compared
with those not on income support. This is expected given that NSA recipients are subject to
activity test requirements, which include training or study as an eligible activity. However, it
is a surprise to note that recipients of Disability Support Pension (DSP) are more likely to
participate in short training while less likely to participate in formal study, when compared to
those who are not on income support. Recipients on Parenting Payment Single (PPS) are also
more likely to participate in short training although they are not subject to activity tests,
perhaps because they want to prepare themselves for entering into labour market by means of
training before their children grow old enough , rendering them ineligible for the payment. On
the other hand, people on Parenting Payment Partnered (PPP) and other payments do not
appear to show differences when compared to those not on income support.
While a person’s health itself is often considered a form of human capital, it may affect the
decisions on investing in other forms of human capital (e.g. education and training) as well.
This indeed appears to be the case here. Compared to people in good health, people with bad
health are less likely to participate in short training and in both short training and formal
study. The estimated marginal effect on the probability of formal study is negative as well,
although not significant. As expected, the effect of very bad health on training/study
participation is even larger than the effect of bad health, and very bad health reduces the
probability of participating in all forms of training or study. These results are consistent with
27
the findings from the descriptive analysis in section four, where ‘own illness or injury’ was
cited by a large proportion as a reason for non-participation.
Working status at the previous interview is also found to be associated with training/study
participation. In particular, compared to those who are not working, those who are working
have a higher probability of participating in formal study (1.6 percentage points higher) and
also a higher probability of participating in both formal study and short training (0.6
percentage point higher).
Surprisingly, financial hardship does not appear to be a barrier to training/study participation.
Indeed, it is found that those who thought their households were facing financial hardship
have a lower probability of not participating in any training/study, compared to those who did
not think so.
The variable concerning attitude towards studying is defined in a way that a higher value
reflects a more negative attitude towards study. And the results show, not surprisingly, that
people with a more negative attitude towards study are less likely to participate in any forms
of training or study.
The definition of attitude to work is opposite to that of attitude to study: a higher value of
attitude to work means the person possesses a more positive towards work. The estimate on
this variable is as expected as those who are more positive towards work are also more likely
to participate in training/study, particularly formal study.
A higher value of the social support variable means that the person feels she has more social
support. The estimates indicate that those who have higher social support tend to have a lower
probability of participating in training/study than those with lower social support, perhaps
because a higher degree of social support offsets individuals’ motivation for self-reliance.
To see whether the WtW policy reforms have had an impact on individuals’ decision to
participate in training/study, we included an indicator variable that assumes the values of one
for the post-WtW period, and zero otherwise. The estimates on this variable show that the
probability of participating in short training is higher (3.1 percentage points) in the post-
reform period than in the pre-reform period, but the probability of participating in formal
study is lower, implying that the reform may encourage people into short training in expense
of formal study. However, in the post-reform period those in cohort 3 have a lower probability
of participating in short training than those in cohort 1. The explanation for this result is not
clear and requires further investigation.
28
6. Impacts of training/study on income support receipt, employment and earnings
6.1. Methodology
The ultimate goal of training or studies is to improve the skills and human capital of
participants and consequently their labour market outcomes. Therefore, in this section we
examine whether and to what extent participation in training or studies impacts on
individuals’ income support receipt status, employment and earnings. For this purpose we
cannot simply compare the outcomes of interest between those who participated in training or
studies with those who did not for the reason that, as shown in the previous section, the
decision to participate in training or studies is influenced by individual characteristics that
also affect their labour market outcomes. The effects of training or studies would be
confounded by those factors in a simple comparison.
In principle one could compare the outcome variables between two individuals who have the
same characteristics but with different training/study participation status to infer the effect of
training/study. However, the dimension of individual characteristics is so large (e.g. there are
over 40 variables in the training/study participation model) that it is virtually impossible to
find two persons who have the same characteristics but different training/study participation
status. One approach that facilitates comparing like with like and overcomes the ‘curse of
dimensionality’ problem is the propensity score matching method, a method widely used in
the literature of labour market program evaluation.
The essence of the propensity score matching method is that for each person in the treatment
group (i.e. training/study participants in our case), we find someone among the non-
participants who has the closest probability (or propensity score) to participate in the
treatment (i.e. matched non-participants). The matched non-participants therefore form a
proper comparison group. In other words, the idea of propensity score matching is to create a
comparison group with a distribution of characteristics that is similar to those of the treatment
group. Their average outcomes can then be used as proxies for the average outcomes of the
treatment group had they not participated in the training/education. The differences in the
outcomes between the treatment group and the (matched) comparison group can therefore be
interpreted as the effect of treatment for those who participated in training, that is, the effect
of treatment on the treated (ATET). It is important to note that the treatment effect will in
general vary across individuals, so that the average treatment effect on the treated will not be
29
the same as the average treatment effect of all income support recipient (ATE). See Blundell
et al. (2008) for a further discussion about the differences between ATET and ATE.
Before getting on to the practical issue of propensity score matching, it is important to define
both the treatment group and the control group (potential comparison group before matching).
Following our previous classification of training/studies, we examine the effects of two
treatments: short training and formal study. As discussed earlier, some individuals
participated in multiple trainings and formal studies. To ensure that the estimated effects are
not caused by a mix of different types of training, we define two treatment groups as follows:
• Formal study treatment group: individuals who only commenced one formal study in
our observation period, and they did not participate in any short trainings.
• Short training treatment group: individuals who completed a short training during our
observation window, and who did not participate in any form of formal study.
For both these treatment groups, individuals who have never participated in training or study
within our observation window are used as the potential control group. The matching is
carried out separately for each wave. However, since we want to base the propensity scores on
individuals’ characteristics before training/study commencement, all the independent
variables in the probit model for matching are one-wave lagged. Consequently, observations
in wave 1 are not used to examine the effects of training/study on labour market outcomes,
and only observations in wave 2 and onwards are used. The characteristics of treatment and
control groups before matching are presented in appendix tables A7 and A8. It is clear that the
characteristics differ between participants and non-participants. Formal training participants
are in general younger and with more females compared with non-participant and also
compared with population (weighted figure) in cohort 1 and cohort 3 in Appendix table A2. In
addition, among the two treatment groups, the distributions of characteristics of the
training/education participants are also different across waves.
The matching procedure we adopt in this study is kernel matching with variable calliper,
which involves executing the following steps:
(a) Estimating the probability of participating in training/education using a probit model and
obtaining the latent index of training/education participation.
(b) Applying kernel matching algorithm based on the latent index to obtain weights for
control observations. For details of the matching algorithms, see Borland and Tseng
(2007).
30
(c) Computing the differences in outcomes between treatment and the weighted control
observations (comparison group).
We also apply the bootstrap method with 999 replications to obtain the standard errors of the
impact estimates.
One advantage of the matching method is that impacts can be easily presented for various
outcome measures. The impacts of training/education on proportion of time on payments as
well as labour market outcomes, such as employment, working hours and earnings are
estimated. We also examine the evolution of these impacts over time by examining various
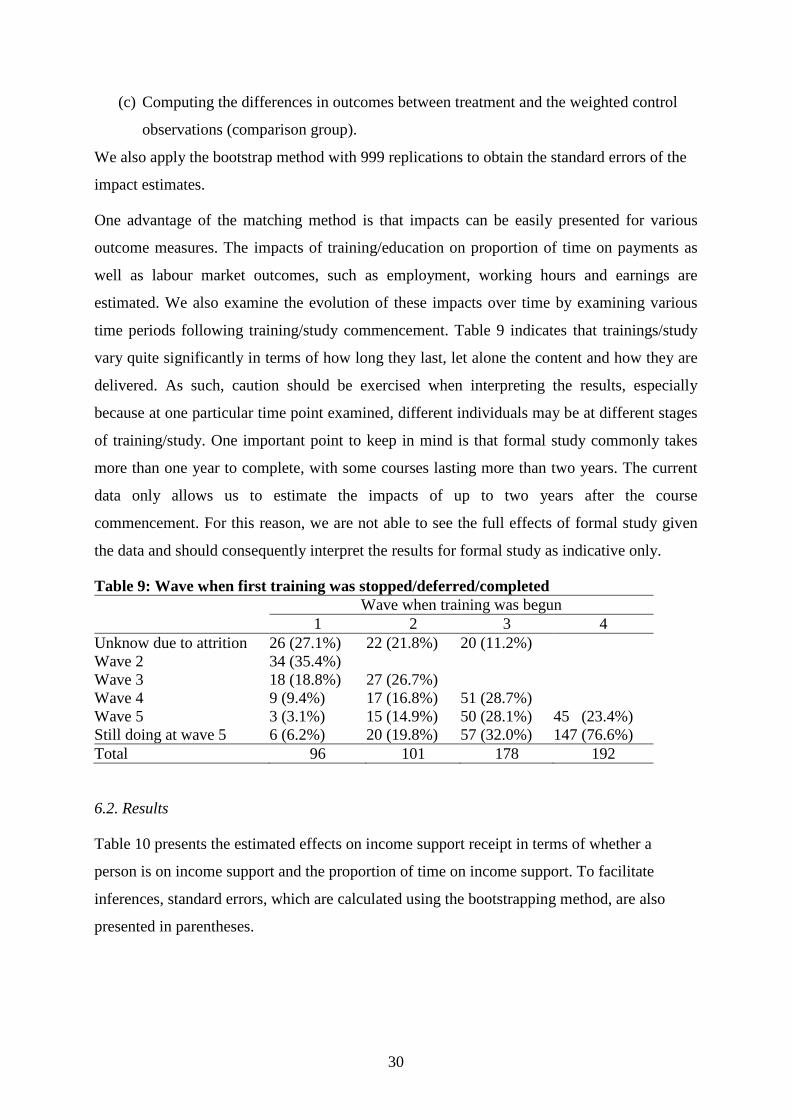
time periods following training/study commencement. Table 9 indicates that trainings/study
vary quite significantly in terms of how long they last, let alone the content and how they are
delivered. As such, caution should be exercised when interpreting the results, especially
because at one particular time point examined, different individuals may be at different stages
of training/study. One important point to keep in mind is that formal study commonly takes
more than one year to complete, with some courses lasting more than two years. The current
data only allows us to estimate the impacts of up to two years after the course
commencement. For this reason, we are not able to see the full effects of formal study given
the data and should consequently interpret the results for formal study as indicative only.
Table 9: Wave when first training was stopped/deferred/completed Wave when training was begun 1 2 3 4 Unknow due to attrition 26 (27.1%) 22 (21.8%) 20 (11.2%) Wave 2 34 (35.4%) Wave 3 18 (18.8%) 27 (26.7%) Wave 4 9 (9.4%) 17 (16.8%) 51 (28.7%) Wave 5 3 (3.1%) 15 (14.9%) 50 (28.1%) 45 (23.4%) Still doing at wave 5 6 (6.2%) 20 (19.8%) 57 (32.0%) 147 (76.6%) Total 96 101 178 192
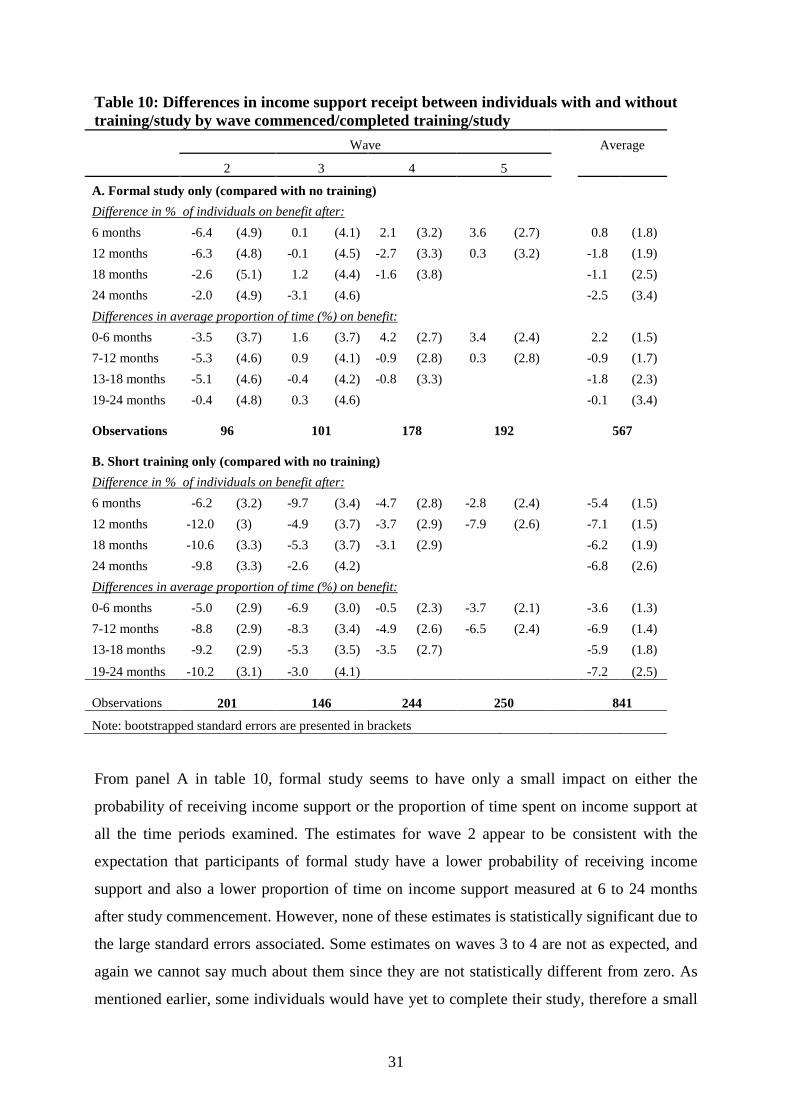
6.2. Results
Table 10 presents the estimated effects on income support receipt in terms of whether a
person is on income support and the proportion of time on income support. To facilitate
inferences, standard errors, which are calculated using the bootstrapping method, are also
presented in parentheses.
31
Table 10: Differences in income support receipt between individuals with and without training/study by wave commenced/completed training/study Wave Average
2 3 4 5
A. Formal study only (compared with no training) Difference in % of individuals on benefit after:
6 months -6.4 (4.9) 0.1 (4.1) 2.1 (3.2) 3.6 (2.7) 0.8 (1.8) 12 months -6.3 (4.8) -0.1 (4.5) -2.7 (3.3) 0.3 (3.2) -1.8 (1.9) 18 months -2.6 (5.1) 1.2 (4.4) -1.6 (3.8) -1.1 (2.5) 24 months -2.0 (4.9) -3.1 (4.6) -2.5 (3.4)
Differences in average proportion of time (%) on benefit: 0-6 months -3.5 (3.7) 1.6 (3.7) 4.2 (2.7) 3.4 (2.4) 2.2 (1.5) 7-12 months -5.3 (4.6) 0.9 (4.1) -0.9 (2.8) 0.3 (2.8) -0.9 (1.7) 13-18 months -5.1 (4.6) -0.4 (4.2) -0.8 (3.3) -1.8 (2.3) 19-24 months -0.4 (4.8) 0.3 (4.6) -0.1 (3.4)
Observations
96 101 178 192 567 B. Short training only (compared with no training)
Difference in % of individuals on benefit after: 6 months -6.2 (3.2) -9.7 (3.4) -4.7 (2.8) -2.8 (2.4) -5.4 (1.5) 12 months -12.0 (3) -4.9 (3.7) -3.7 (2.9) -7.9 (2.6) -7.1 (1.5) 18 months -10.6 (3.3) -5.3 (3.7) -3.1 (2.9) -6.2 (1.9) 24 months -9.8 (3.3) -2.6 (4.2) -6.8 (2.6)
Differences in average proportion of time (%) on benefit: 0-6 months -5.0 (2.9) -6.9 (3.0) -0.5 (2.3) -3.7 (2.1) -3.6 (1.3) 7-12 months -8.8 (2.9) -8.3 (3.4) -4.9 (2.6) -6.5 (2.4) -6.9 (1.4) 13-18 months -9.2 (2.9) -5.3 (3.5) -3.5 (2.7) -5.9 (1.8)
19-24 months -10.2 (3.1) -3.0 (4.1) -7.2 (2.5)
Observations
201 146 244 250 841
Note: bootstrapped standard errors are presented in brackets
From panel A in table 10, formal study seems to have only a small impact on either the
probability of receiving income support or the proportion of time spent on income support at
all the time periods examined. The estimates for wave 2 appear to be consistent with the
expectation that participants of formal study have a lower probability of receiving income
support and also a lower proportion of time on income support measured at 6 to 24 months
after study commencement. However, none of these estimates is statistically significant due to
the large standard errors associated. Some estimates on waves 3 to 4 are not as expected, and
again we cannot say much about them since they are not statistically different from zero. As
mentioned earlier, some individuals would have yet to complete their study, therefore a small
32
increase (and statistically insignificant) in time on payments should not post any worry to the
policy makers.
On the other hand, short training (panel B in table 10) appears to be effective in reducing
income support receipt. Compared with those who did not participate in any training, those
who participated in short training appear to have a lower probability of receiving income
support and shorter time on income support at various periods of training commencement. For
example, after six months of short training commencement, the proportion on income support
of the participants in wave 2 is six percentage points lower than those non-participants; after
24 months the gap is about ten percentage points. Regarding the proportion of time on income
support, short training participants are five percentage points lower than non-participants
within 6 months of training commencement in wave 2, and about ten percentage points lower
during the period 19-24 months after training commencement. The estimates vary across
waves, perhaps reflecting heterogeneity of the effects between individuals and over time.
Overall the effects of short training do not appear show any clear patterns over time (i.e.
either increase or decrease). In particular, the effect does not appear to be larger for the post-
WtW periods.
Tables 11 and 12 present the effects on employment outcomes, as measured by work
incidence (whether working or not at the time of survey and whether the respondent ever
worked during the six months prior to the survey), hours worked (a measure of work
intensity), hourly wages and weekly earnings. We also examine the skill levels of the main
job. Table 11 shows the effects after 6 months of training/study commencement, while table
12 is for the effects after 12 months.
From table 11, formal study appears to increase work incidence after six months of training
commencement. For example, after six months of training commencement people who
participated in formal study in wave 2 have a probability of working that is 12 percentage
points higher than those who did not participate in any training. The effect on work incidence
in the six months prior to interview (i.e., ever worked in past 6 months) is similar. These
estimates are significant for wave 4 as well, although with smaller magnitude, but
insignificant for wave 3. However, formal study does not appear to have an effect on the
incidence of full-time employment – the estimates are small and insignificant.
The estimates on the effects of working hours, hourly wages and earnings are mixed in terms
of the direction of the effects. Most estimates are positive and in line with expectations, but in
some cases they are negative. However, except for the effect on hours worked in all jobs,

33
which is positive and significant in wave 2 (and on average), the effects on other measures of
working hours and the effects on hourly wages and weekly earnings are all insignificant,
suggesting that formal study may not have an effect on these measures of labour market
outcomes, at least not for this group of people examined.
In terms of skill levels of main jobs, overall formal study does not appear to increase the
proportion of participants with medium or high skill jobs. Only in wave 2 is the estimate
found to be statistically significant, which leads the average effect to be weakly significant (at
10 per cent significance level). However, due to the fact that some individuals in the treatment
group may still be studying and therefore take a casual job, it is not surprising that the effects
are not significant and that some are of a negative sign.
The effects of short training exhibit a similar pattern to the effect of formal study. That is,
there is evidence that short training has significant effects on work incidence and hours
worked in all jobs, but it has no effects on other outcome variables, and the effects vary across
waves.
Table 12 presents the effects on labour market outcomes twelve months after training
commencement. Note that for these effects, only waves 2 and 3 can be used due to the fact
that the data constraint do not permit observing training participants from wave 4 twelve
months after training commencement.
Overall, the effect patterns twelve months after training commencement are similar to those
six months after commencement. That is, only the effects on work incidence are found
significant for both short training and formal study and the effects on other labour market
outcomes are mostly insignificant. Hours worked in all jobs are an exception, for which it is
found that short training has a significant effect, particularly in wave 3. Another difference is
that when the effects are significant, the magnitude of the effects appears to be larger after
twelve months than after 6 months, perhaps reflecting that the effect of training needs time to
realise.
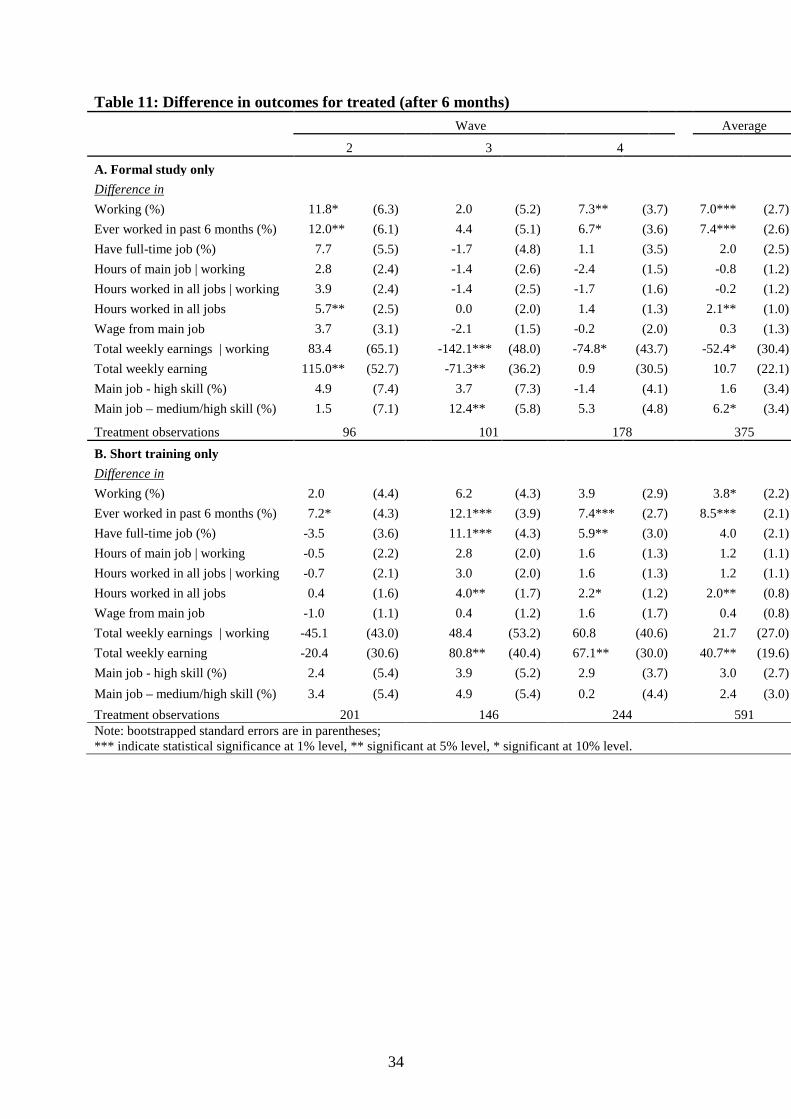
34
Table 11: Difference in outcomes for treated (after 6 months) Wave Average
2 3 4 A. Formal study only
Difference in Working (%) 11.8* (6.3) 2.0 (5.2) 7.3** (3.7) 7.0*** (2.7) Ever worked in past 6 months (%) 12.0** (6.1) 4.4 (5.1) 6.7* (3.6) 7.4*** (2.6) Have full-time job (%) 7.7 (5.5) -1.7 (4.8) 1.1 (3.5) 2.0 (2.5) Hours of main job | working 2.8 (2.4) -1.4 (2.6) -2.4 (1.5) -0.8 (1.2) Hours worked in all jobs | working 3.9 (2.4) -1.4 (2.5) -1.7 (1.6) -0.2 (1.2) Hours worked in all jobs 5.7** (2.5) 0.0 (2.0) 1.4 (1.3) 2.1** (1.0) Wage from main job 3.7 (3.1) -2.1 (1.5) -0.2 (2.0) 0.3 (1.3) Total weekly earnings | working 83.4 (65.1) -142.1*** (48.0) -74.8* (43.7) -52.4* (30.4) Total weekly earning 115.0** (52.7) -71.3** (36.2) 0.9 (30.5) 10.7 (22.1) Main job - high skill (%) 4.9 (7.4) 3.7 (7.3) -1.4 (4.1) 1.6 (3.4) Main job – medium/high skill (%) 1.5 (7.1) 12.4** (5.8) 5.3 (4.8) 6.2* (3.4)
Treatment observations 96 101 178 375 B. Short training only
Difference in Working (%) 2.0 (4.4) 6.2 (4.3) 3.9 (2.9) 3.8* (2.2) Ever worked in past 6 months (%) 7.2* (4.3) 12.1*** (3.9) 7.4*** (2.7) 8.5*** (2.1) Have full-time job (%) -3.5 (3.6) 11.1*** (4.3) 5.9** (3.0) 4.0 (2.1) Hours of main job | working -0.5 (2.2) 2.8 (2.0) 1.6 (1.3) 1.2 (1.1) Hours worked in all jobs | working -0.7 (2.1) 3.0 (2.0) 1.6 (1.3) 1.2 (1.1) Hours worked in all jobs 0.4 (1.6) 4.0** (1.7) 2.2* (1.2) 2.0** (0.8) Wage from main job -1.0 (1.1) 0.4 (1.2) 1.6 (1.7) 0.4 (0.8) Total weekly earnings | working -45.1 (43.0) 48.4 (53.2) 60.8 (40.6) 21.7 (27.0) Total weekly earning -20.4 (30.6) 80.8** (40.4) 67.1** (30.0) 40.7** (19.6) Main job - high skill (%) 2.4 (5.4) 3.9 (5.2) 2.9 (3.7) 3.0 (2.7) Main job – medium/high skill (%) 3.4 (5.4) 4.9 (5.4) 0.2 (4.4) 2.4 (3.0) Treatment observations 201 146 244 591 Note: bootstrapped standard errors are in parentheses; *** indicate statistical significance at 1% level, ** significant at 5% level, * significant at 10% level.
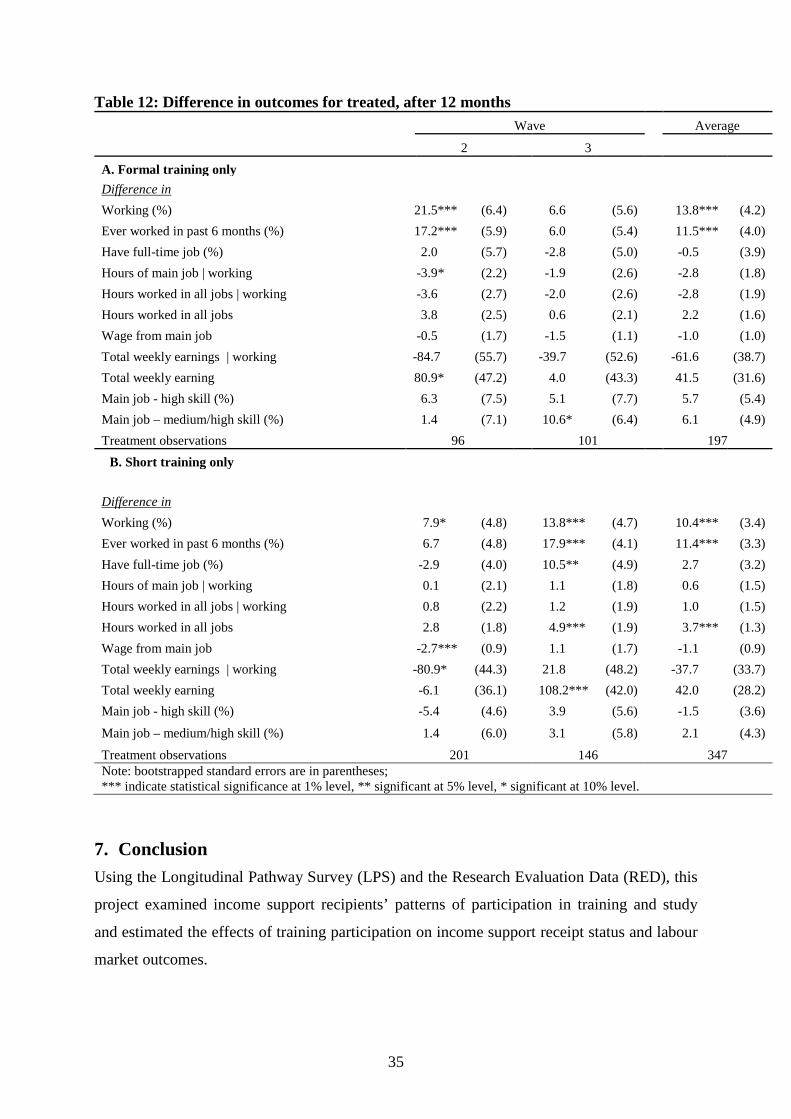
35
Table 12: Difference in outcomes for treated, after 12 months Wave Average
2 3 A. Formal training only
Difference in Working (%) 21.5*** (6.4) 6.6 (5.6) 13.8*** (4.2) Ever worked in past 6 months (%) 17.2*** (5.9) 6.0 (5.4) 11.5*** (4.0) Have full-time job (%) 2.0 (5.7) -2.8 (5.0) -0.5 (3.9) Hours of main job | working -3.9* (2.2) -1.9 (2.6) -2.8 (1.8) Hours worked in all jobs | working -3.6 (2.7) -2.0 (2.6) -2.8 (1.9) Hours worked in all jobs 3.8 (2.5) 0.6 (2.1) 2.2 (1.6) Wage from main job -0.5 (1.7) -1.5 (1.1) -1.0 (1.0) Total weekly earnings | working -84.7 (55.7) -39.7 (52.6) -61.6 (38.7) Total weekly earning 80.9* (47.2) 4.0 (43.3) 41.5 (31.6) Main job - high skill (%) 6.3 (7.5) 5.1 (7.7) 5.7 (5.4) Main job – medium/high skill (%) 1.4 (7.1) 10.6* (6.4) 6.1 (4.9) Treatment observations 96 101 197
B. Short training only
Difference in Working (%) 7.9* (4.8) 13.8*** (4.7) 10.4*** (3.4) Ever worked in past 6 months (%) 6.7 (4.8) 17.9*** (4.1) 11.4*** (3.3) Have full-time job (%) -2.9 (4.0) 10.5** (4.9) 2.7 (3.2) Hours of main job | working 0.1 (2.1) 1.1 (1.8) 0.6 (1.5) Hours worked in all jobs | working 0.8 (2.2) 1.2 (1.9) 1.0 (1.5) Hours worked in all jobs 2.8 (1.8) 4.9*** (1.9) 3.7*** (1.3) Wage from main job -2.7*** (0.9) 1.1 (1.7) -1.1 (0.9) Total weekly earnings | working -80.9* (44.3) 21.8 (48.2) -37.7 (33.7) Total weekly earning -6.1 (36.1) 108.2*** (42.0) 42.0 (28.2) Main job - high skill (%) -5.4 (4.6) 3.9 (5.6) -1.5 (3.6)
Main job – medium/high skill (%) 1.4 (6.0) 3.1 (5.8) 2.1 (4.3)
Treatment observations 201 146 347 Note: bootstrapped standard errors are in parentheses; *** indicate statistical significance at 1% level, ** significant at 5% level, * significant at 10% level.
7. Conclusion Using the Longitudinal Pathway Survey (LPS) and the Research Evaluation Data (RED), this
project examined income support recipients’ patterns of participation in training and study
and estimated the effects of training participation on income support receipt status and labour
market outcomes.
36
On the patterns of training participation, about 25 to 30 per cent of the persons in the sample
participated in either short training or formal study over the six months prior to the interview.
Overall the majority of those who participated in training undertook formal study, a form of
training that leads to a formal qualification. It also appears that participation in formal study
increased over time for the two cohorts surveyed. Income support recipients on a student type
payment had the largest proportion participating in training, as to be expected, which was
followed by recipients on NSA. Among those who participated in short training, obtaining a
licence or certificate consisted of the largest group (40 per cent), followed by on-the-job-
training (37 per cent), where as general numeracy or reading seemed to be a trivial type of
short training.
Among those who participated in formal study, over a half undertook TAFE or technical
studies, about 19 per cent studied towards a degree and 12 per cent towards an undergraduate
certificate. For those who did not compete their training or studies enrolled, caring
responsibilities and own illness or injury were the most frequently cited reasons for non-
completion. On the other hand, own illness or injury was the most frequently cited reason for
not participating in training or study at all.
The model estimation results on training/study participation showed that compared to males,
females were more likely to participate in training, particularly short training. Younger people
were more likely to participate in training or study, consistent with the prediction of human
capital theory. While this may be an optimal decision from an individual‘s point of view, the
social returns to human capital investments for older people might still justify policies that
encourage older people to invest more in their human capital, for instance by subsidising the
cost of participating in a training or study. Individuals who already possessed a level of
education higher than Year 10 were more likely to participate in training or study compared to
people with Year 10 or below. From a policy perspective, these results seem to indicate that
the incentives for participation in further education should be targeted towards those groups
with lower levels of education (Year 10 or below).
The presence of children under the age of 3 substantially reduced the probability of
participation in any training or study, suggesting that dependent children of a very young age
are still a barrier for participation in training, despite government subsidies for child care costs
such as Child Care Benefits and the Child Care Tax Rebate. However, the finding only
applies to mothers and given that the barrier disappears as the child gets older, we believe that
it should not be of policy concern.
37
Conditional on other characteristics, more time spent on income support over the previous
five years appears to reduce the probability of participation in training or study. Compared
with those who were not on income support, recipients of NSA were more likely to participate
in training or study, probably due to their activity requirements. As to be expected, people
with poor health were found to be less likely to participate in any training or study than
people with good health. In addition, attitudes towards study and work play a very important
role in individuals’ training/study participation. Change individuals perception of training
may be important in promoting training participation.
When the effects of short training and formal study on income support receipt were examined,
it was found that only short training had a significant effect on income support receipt, while
the effects of formal study were largely insignificant. Individuals who participated in short
training were found to be less likely to receive income support and spent less time on income
support. However, the results from the matching method on income support receipt and
labour market outcomes should be interpreted and treated with caution as the sample size of
the treatment groups is relatively small.
When the effects on labour market outcomes were examined, it was found that the effects on
work incidence (i.e. whether working or not at the time of interview and whether respondent
ever worked during the previous six months of the interview) were significant as expected for
both short training and formal study, but the effects on other labour market outcomes, such as
working hours, hourly wages and weekly earnings, were generally insignificant. However, it
is not appropriate to conclude from the insignificant effects on wages that training does not
affect individuals’ wages, for the reason that a significant proportion of individuals move
from not employed to being employed. Thus, the composition of the group earning a wage
has changed. In addition, it is not surprising that the impacts of formal study are insignificant
because some participants had not yet finished their study. The results do not permit the
conclusion that formal study has no impact on labour market outcomes. Further research in
this area is needed and requires panel data that follows individuals for longer periods of time
to evaluate the full effects of formal study.
38
8. References Aakvik, A. (2003). 'Estimating the employment effects of education for disabled workers in Norway.' in Empirical Economics 28(3): 515-533. Albrecht, J., G. J. van den Berg, et al. (2005) 'The Knowledge Lift: The Swedish Adult Education Program That Aimed to Eliminate Low Worker Skill Levels', in IZA Discussion Paper No 1503 Andrén, D. and T. Andrén (2002) 'Assessing the Employment Effects of Labor Market Training Programs in Sweden', in Working Papers in Economics No 70 Andrén, T. and B. Gustafsson (2002) 'Income Effects from Labor Market Training Programs in Sweden During the 80’s and 90’s', in IZA Discussion Paper No 603 Arellano, F. A. (2005) 'Do training programmes get the unemployed back to work? A look at the Spanish experience', in Working Paper No 05-25 Arulampalam, W., A. Booth, et al. (2006) 'Are there Asymmetries in the Effects of Training on the Conditional Male Wage Distribution?', in Discussion Paper No 523
Borland, J. and Y. Tseng (2007) “Does a minimum job search requirement for the unemployed reduce their time on welfare payments? Evidence from the Job Seeker Diary in Australia”, Industrial and labor relations review, Vol. 60, No. 3, pp. 357-378. Blundell, R. & L. Dearden & B. Sianesi, 2003. "Evaluating the impact of education on earnings in the UK: Models, methods and results from the NCDS," IFS Working Papers W03/20, Institute for Fiscal Studies. Blundell, R. & Costa Dias, M. (2008) "Alternative Approaches to Evaluation in Empirical Microeconomics," IZA Discussion Papers 3800, Institute for the Study of Labor (IZA). Cai L. (2008), “Human Capital and the Patterns of Employment and Welfare Receipt” SPRC Project 8-07 Final Report. Cockx, B. (2003) 'Vocational Training of Unemployed Workers in Belgium', in IZA Discussion Paper No 682 Crepon, B., M. Dejemeppe, et al. (2005) 'Counseling the unemployed : does it lower unemployment duration and recurrence ?', in Discussion Papers No 2005-34 DEWR (2006) “Customised Assistance, Job Search Training, Work for the Dole and Mutual Obligation - A Net Impact Study”. Filges, T. and B. Larsen (2005). 'Stick, Carrot and Skill Acquisition.' in Scandinavian Journal of Economics 107(3): 495-519. Geerdsen, L. P. (2006). 'Is there a Threat Effect of Labour Market Programmes? A Study of ALMP in the Danish UI System.' in Economic Journal 116(513): 738-750.
39
Geerdsen, L. P. (2006). 'Is There a Threat Effect of Labour Market Programmes? A Study of ALMP in the Danish UI System.' in Economic Journal 116(513): 738-750. Gerfin, M. and M. Lechner (2002) “Microeconometric Evaluation of the Active Labor Market Policy in Switzerland.” Economic Journal, 112(482), 854-893. Graversen, B. K. and J. C. v. Ours (2008). 'How to help unemployed find jobs quickly: Experimental evidence from a mandatory activation program.' in Journal of Public Economics 92(10-11): 2020-2035. Hamalainen, K., R. Uusitalo, et al. (2008). 'Varying Biases in Matching Estimates: Evidence from Two Randomised Job Search Training Experiments.' in Labour Economics 15(4): 604-618. Hardoy, I. (2005). 'Impact of Multiple Labour Market Programmes on Multiple Outcomes: The Case of Norwegian Youth Programmes.' in LABOUR 19(3): 425-467. Hebbar, L. (2006). 'Vocational Training for the Unemployed: Its Impact on Uncommonly Served Groups.' in International Journal of Manpower 27(4): 377-395. Heckman, J. R.J. LaLonde, and J.A. Smith (1999). “The Economics and Econometrics of Active Labor Market Programs.” In: O. Ashenfelter and D. Card (eds.), Handbook of Labor Economics, Vol. 3 A, Amsterdam: Elsevier Science, 1865-2097. Huber, M., M. Lechner, et al. (2009) 'Do German Welfare-to-Work Programmes Reduce Welfare and Increase Work?', in IZA Discussion Papers No 4090 Hujer, R., S. L. Thomsen, et al. (2006). 'The Effects of Vocational Training Programmes on the Duration of Unemployment in Eastern Germany.' in Allgemeines Statistisches Archiv/Journal of the German Statistical Society 90(2): 299-321. Hujer, R., S.L. Thomsen, C. Zeiss (2004). “The Effects of Vocational Training Programmes on the Duration of Unemployment in Germany”. IZA Discussion Paper No. 1117. Jekaterina, D. and H. Mihails (2007). 'A Stock-Flow Matching Approach to Evaluation of Public Training Programme in a High Unemployment Environment.' in LABOUR 21(3): 503-540. Jochen, K. (2006) 'The Effectiveness of European Active Labor Market Policy', in IZA Discussion Papers No 2018 Lalive, R., J. C. van Ours, et al. (2005). 'The Effect of Benefit Sanctions on the Duration of Unemployment.' in Journal of the European Economic Association 3(6): 1386-1417. Lalive, R., J. C. van Ours, et al. (2008). 'The Impact of Active Labour Market Programmes on the Duration of Unemployment in Switzerland.' in Economic Journal 118(525): 235-257. Lechner, M. and B. Melly (2007) 'Earnings Effects of Training Programs', in CEPR Discussion Paper No no. 6400
40
Lechner, M., R. Miquel, et al. (2005) 'The Curse and Blessing of Training the Unemployed in a Changing Economy: the Case of East Germany after Unification', in CEPR Discussion Papers No 5171 Lechner, M. and C. Wunsch (2006) 'Are Training Programs More Effective When Unemployment Is High?', in CEPR Discussion Paper No 5920 Leeves, G. (2000) “Duration-Specific Unemployment Outflow Rates and Labour Market Programs”, Vol 33, p221-34. Long M & Shah C, 2008. Private returns to vocational education and training qualifications. NCVER, Adelaide. www.ncver.edu.au/publications/2011.html Martin, J. P. and D. Grubb (2001) 'What works and for whom: a review of OECD countries' experiences with active labour market policies', in Working Papers No 2001-14 OECD (2005). “Labour Market Programmes and Activation Strategies: Evaluating the Impacts”, OECD Employment Outlook, Ch. 4. Raaum, O., H. Torp, et al. (2003) 'Do individual programme effects exceed the costs? Norwegian evidence on long run effects of labour market training', in Memorandum No 15-2002 Rahmani, Z., T. Crosier, et al. (2002) 'Evaluating the impact of the Literacy and Numeracy Training Programme for job seekers', in Research, Analysis and Evaluation Group No Richardson, K. and G. J. v. d. Berg (2002) 'The effect of vocational employment training on the individual transition rate from unemployment to work', in Working Papers No 2002-08 Richardson, L. L. (2002). 'Impact of the Mutual Obligation Initiative on the Exit Behaviour of Unemployment Benefit Recipients: The Threat of Additional Activities.' in The Economic Record 78(243): 406-21. Rinne, U., M. Schneider, et al. (2001) 'Too Bad to Benefit? Effect Heterogeneity of Public Training Programs', in IZA Discussion Paper No 3240. Rosholm, M. and M. Svarer (2004) 'Estimating the Threat Effect of Active Labour Market Programmes', in IZA Discussion Papers No 1300. Ryan, C. (2002), Individual Returns to Vocational Education and Training Qualifications: Their Implications for Lifelong Learning, NCVER, Adelaide. http://www.ncver.edu.au/students/publications/766.html Sianesi, B. (2004). 'An Evaluation of the Swedish System of Active Labor Market Programs in the 1990s.' in Review of Economics and Statistics 86(1): 133-155. Stenberg, A. (2003) 'The Adult Education Initiative in Sweden. Second Year Effects on Wage Earnings and the Influence on Branch Mobility', in Swedish Working Papers in Economics No 608.
41
Stenberg, A. (2005). 'Comprehensive Education for the Unemployed--Evaluating the Effects on Unemployment of the Adult Education Initiative in Sweden.' in LABOUR 19(1): 123-146. Stenberg, A. (2007). 'Comprehensive Education or Vocational Training for the Unemployed?', in International Journal of Manpower 28(1): 42-61. Stenberg, A. and O. Westerlund (2008). 'Does Comprehensive Education Work for the Long-Term Unemployed?', in Labour Economics 15(1): 54-67. Stromback and Dockery (2000) “Labour market programs, unemployment and employment hazards: an application using the 1994-1997 Survey of Employment and Unemployment Patterns”, Australian Bureau of Statistics Occasional Paper ABS Cat. No. 6293.0.00.002. van den Berg, G. J. and B. van der Klaauw (2006). 'Counseling and Monitoring of Unemployed Workers: Theory and Evidence from a Controlled Social Experiment.' in International Economic Review 47(3): 895-936. Zhang, T. (2003) 'Identifying treatment effects of active labour market programmes for Norwegian adults', in Memorandum No 26/2003 Zweimueller, J. and R. Winter-Ebmer (1996). 'Manpower Training Programmes and Employment Stability.' in Economica 63(249): 113-130.

42
9. Appendices Appendix A: Table A1: Definition of all independent variables used in the estimation Variable Variable definition Notes Sex Dummy = 1 if female Age Dummy variables for age in 5-year bands
(base category: 30-34)
Education Dummy variables for following categories:
Year 10 or lower (base category) Includes those with year 10, primary school and no formal schooling.
Year 12
Trade/Apprenticeship/TAFE Includes all trade and apprenticeship qualifications, as well as all other TAFE/technical certificates or diploma.
Degree Includes Bachelor, Masters and Doctorate degrees.
Ethnicity Dummy variables for following categories:
Non-indigenous Australian-born (base category)
Born in English speaking country (ESC)
Not born in English speaking country (NESC), speak English at home
Not born in English speaking country (NESC), do not speak English at home
Aboriginal or Torres Strait Islander (ATSI)
Partner status Dummy variables for following categories:
Working (base category)
Unemployed
Temporarily not working
On DSP or retired
Status unknown
Age of youngest Dummy variables for following categories:

43
child No children (base category)
Don't know
Age < 3
Age >= 3 & age < 6
Age >= 6 & age <= 13
Age 14 - 15
Age > 16
Payment history Proportion of time on income support in past 5 years (the variable ranges from 0 to 1)
This denominator of this variable has been adjusted for younger recipients as the proportion is calculated as the number of days in receipt of benefits divided by the number of days the respondent was eligible for income support in the past 5 years (thus may be less than 5 years for respondents aged between 16 and 20).
Number of income support spells in past 5 years
Covers the period where respondent was eligible for income support in the past 5 years (i.e. may be less than 5 years for respondents aged between 16 and 20).
Benefit type Dummy variables for following categories:
Not on benefits (base category)
Student
Includes Austudy, Youth Allowance Apprentice, Youth Allowance Student, and Abstudy.
NSA
DSP
PPS
PPP
Other
All other types of income support.
Health status Dummy variables for following categories:
Very good health (base category) Combines respondents with ‘excellent', 'very good', or ‘good' health conditions.
Bad
Very bad
Working Dummy = 1 if working at the time of the
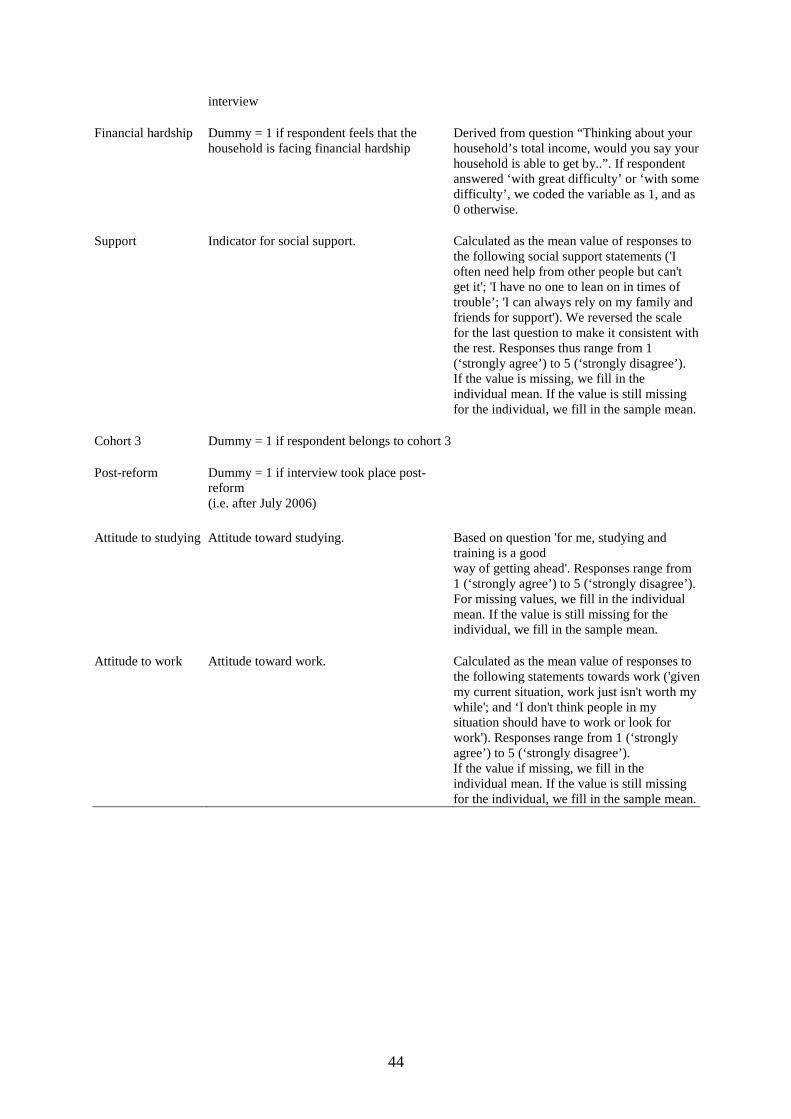
44
interview
Financial hardship Dummy = 1 if respondent feels that the household is facing financial hardship
Derived from question “Thinking about your household’s total income, would you say your household is able to get by..”. If respondent answered ‘with great difficulty’ or ‘with some difficulty’, we coded the variable as 1, and as 0 otherwise.
Support Indicator for social support. Calculated as the mean value of responses to the following social support statements ('I often need help from other people but can't get it'; 'I have no one to lean on in times of trouble’; 'I can always rely on my family and friends for support'). We reversed the scale for the last question to make it consistent with the rest. Responses thus range from 1 (‘strongly agree’) to 5 (‘strongly disagree’). If the value is missing, we fill in the individual mean. If the value is still missing for the individual, we fill in the sample mean.
Cohort 3 Dummy = 1 if respondent belongs to cohort 3
Post-reform Dummy = 1 if interview took place post-reform
(i.e. after July 2006)
Attitude to studying Attitude toward studying. Based on question 'for me, studying and
training is a good way of getting ahead'. Responses range from 1 (‘strongly agree’) to 5 (‘strongly disagree’). For missing values, we fill in the individual mean. If the value is still missing for the individual, we fill in the sample mean.
Attitude to work Attitude toward work. Calculated as the mean value of responses to the following statements towards work ('given my current situation, work just isn't worth my while'; and ‘I don't think people in my situation should have to work or look for work'). Responses range from 1 (‘strongly agree’) to 5 (‘strongly disagree’). If the value if missing, we fill in the individual mean. If the value is still missing for the individual, we fill in the sample mean.
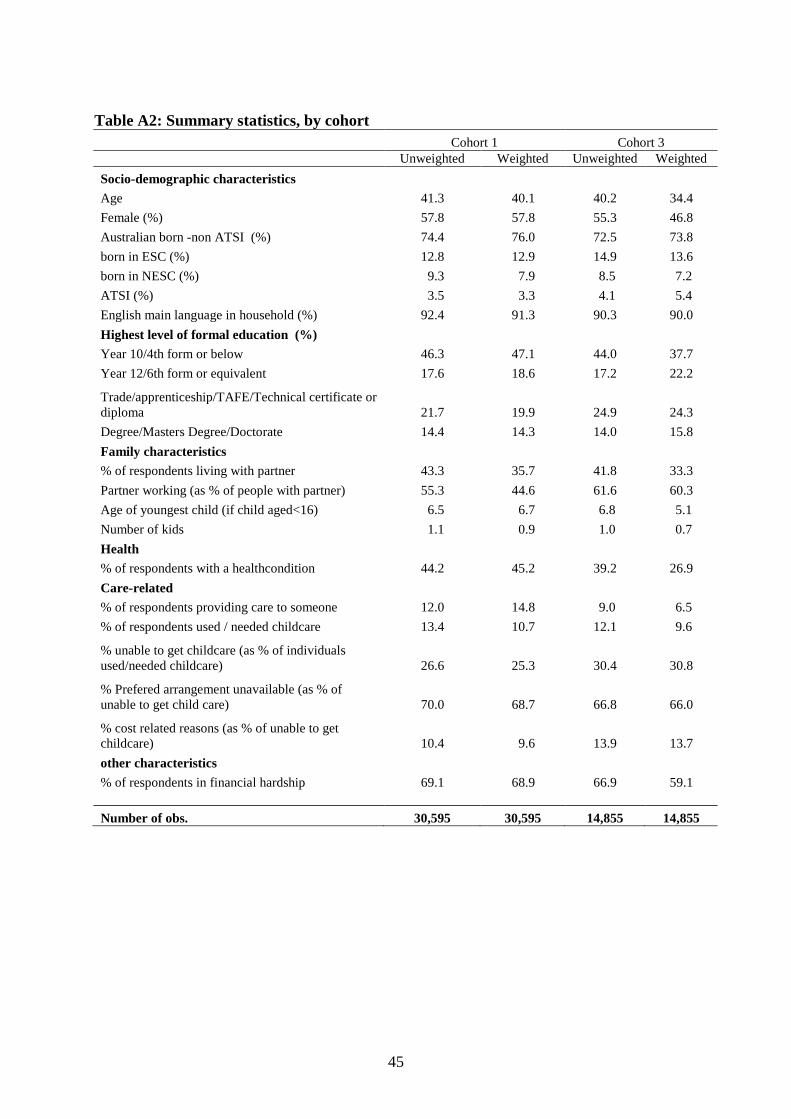
45
Table A2: Summary statistics, by cohort Cohort 1 Cohort 3 Unweighted Weighted Unweighted Weighted Socio-demographic characteristics Age 41.3 40.1 40.2 34.4 Female (%) 57.8 57.8 55.3 46.8 Australian born -non ATSI (%) 74.4 76.0 72.5 73.8 born in ESC (%) 12.8 12.9 14.9 13.6 born in NESC (%) 9.3 7.9 8.5 7.2 ATSI (%) 3.5 3.3 4.1 5.4 English main language in household (%) 92.4 91.3 90.3 90.0 Highest level of formal education (%) Year 10/4th form or below 46.3 47.1 44.0 37.7 Year 12/6th form or equivalent 17.6 18.6 17.2 22.2
Trade/apprenticeship/TAFE/Technical certificate or diploma 21.7 19.9 24.9 24.3 Degree/Masters Degree/Doctorate 14.4 14.3 14.0 15.8 Family characteristics % of respondents living with partner 43.3 35.7 41.8 33.3 Partner working (as % of people with partner) 55.3 44.6 61.6 60.3 Age of youngest child (if child aged<16) 6.5 6.7 6.8 5.1 Number of kids 1.1 0.9 1.0 0.7 Health % of respondents with a healthcondition 44.2 45.2 39.2 26.9 Care-related % of respondents providing care to someone 12.0 14.8 9.0 6.5 % of respondents used / needed childcare 13.4 10.7 12.1 9.6
% unable to get childcare (as % of individuals used/needed childcare) 26.6 25.3 30.4 30.8
% Prefered arrangement unavailable (as % of unable to get child care) 70.0 68.7 66.8 66.0
% cost related reasons (as % of unable to get childcare) 10.4 9.6 13.9 13.7 other characteristics % of respondents in financial hardship 69.1 68.9 66.9 59.1 Number of obs. 30,595 30,595 14,855 14,855
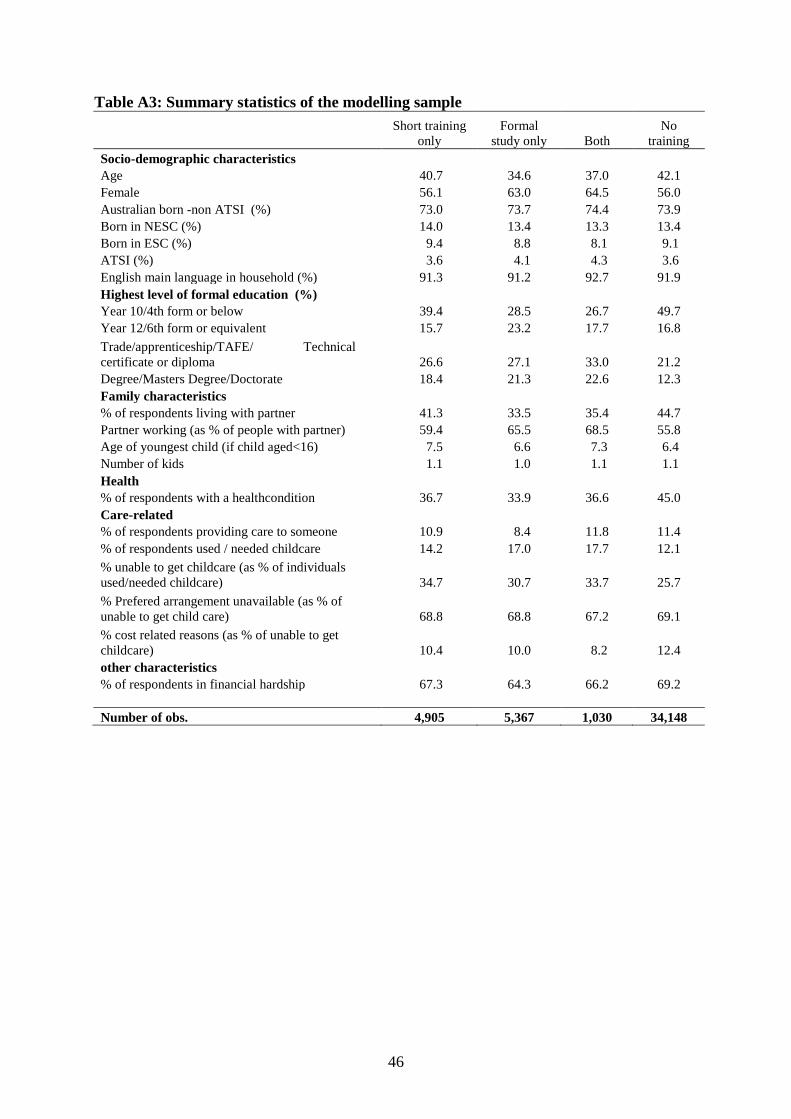
46
Table A3: Summary statistics of the modelling sample
Short training
only Formal
study only Both No
training Socio-demographic characteristics Age 40.7 34.6 37.0 42.1 Female 56.1 63.0 64.5 56.0 Australian born -non ATSI (%) 73.0 73.7 74.4 73.9 Born in NESC (%) 14.0 13.4 13.3 13.4 Born in ESC (%) 9.4 8.8 8.1 9.1 ATSI (%) 3.6 4.1 4.3 3.6 English main language in household (%) 91.3 91.2 92.7 91.9 Highest level of formal education (%) Year 10/4th form or below 39.4 28.5 26.7 49.7 Year 12/6th form or equivalent 15.7 23.2 17.7 16.8 Trade/apprenticeship/TAFE/ Technical certificate or diploma 26.6 27.1 33.0 21.2 Degree/Masters Degree/Doctorate 18.4 21.3 22.6 12.3 Family characteristics % of respondents living with partner 41.3 33.5 35.4 44.7 Partner working (as % of people with partner) 59.4 65.5 68.5 55.8 Age of youngest child (if child aged<16) 7.5 6.6 7.3 6.4 Number of kids 1.1 1.0 1.1 1.1 Health % of respondents with a healthcondition 36.7 33.9 36.6 45.0 Care-related % of respondents providing care to someone 10.9 8.4 11.8 11.4 % of respondents used / needed childcare 14.2 17.0 17.7 12.1 % unable to get childcare (as % of individuals used/needed childcare) 34.7 30.7 33.7 25.7 % Prefered arrangement unavailable (as % of unable to get child care) 68.8 68.8 67.2 69.1 % cost related reasons (as % of unable to get childcare) 10.4 10.0 8.2 12.4 other characteristics % of respondents in financial hardship 67.3 64.3 66.2 69.2 Number of obs. 4,905 5,367 1,030 34,148
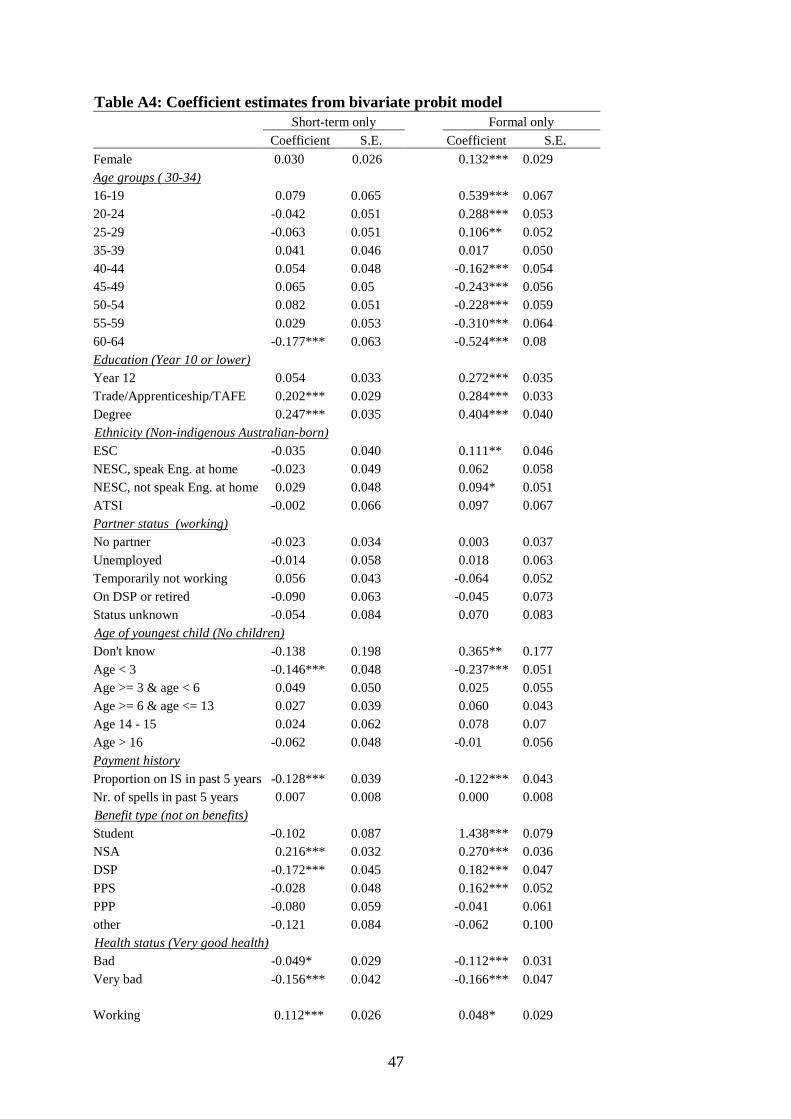
47
Table A4: Coefficient estimates from bivariate probit model Short-term only Formal only Coefficient S.E. Coefficient S.E. Female 0.030 0.026 0.132*** 0.029
Age groups ( 30-34) 16-19 0.079 0.065 0.539*** 0.067 20-24 -0.042 0.051 0.288*** 0.053 25-29 -0.063 0.051 0.106** 0.052 35-39 0.041 0.046 0.017 0.050 40-44 0.054 0.048 -0.162*** 0.054 45-49 0.065 0.05 -0.243*** 0.056 50-54 0.082 0.051 -0.228*** 0.059 55-59 0.029 0.053 -0.310*** 0.064 60-64 -0.177*** 0.063 -0.524*** 0.08
Education (Year 10 or lower) Year 12 0.054 0.033 0.272*** 0.035 Trade/Apprenticeship/TAFE 0.202*** 0.029 0.284*** 0.033 Degree 0.247*** 0.035 0.404*** 0.040
Ethnicity (Non-indigenous Australian-born) ESC -0.035 0.040 0.111** 0.046 NESC, speak Eng. at home -0.023 0.049 0.062 0.058 NESC, not speak Eng. at home 0.029 0.048 0.094* 0.051 ATSI -0.002 0.066 0.097 0.067
Partner status (working) No partner -0.023 0.034 0.003 0.037 Unemployed -0.014 0.058 0.018 0.063 Temporarily not working 0.056 0.043 -0.064 0.052 On DSP or retired -0.090 0.063 -0.045 0.073 Status unknown -0.054 0.084 0.070 0.083
Age of youngest child (No children) Don't know -0.138 0.198 0.365** 0.177 Age < 3 -0.146*** 0.048 -0.237*** 0.051 Age >= 3 & age < 6 0.049 0.050 0.025 0.055 Age >= 6 & age <= 13 0.027 0.039 0.060 0.043 Age 14 - 15 0.024 0.062 0.078 0.07 Age > 16 -0.062 0.048 -0.01 0.056
Payment history Proportion on IS in past 5 years -0.128*** 0.039 -0.122*** 0.043 Nr. of spells in past 5 years 0.007 0.008 0.000 0.008
Benefit type (not on benefits) Student -0.102 0.087 1.438*** 0.079 NSA 0.216*** 0.032 0.270*** 0.036 DSP -0.172*** 0.045 0.182*** 0.047 PPS -0.028 0.048 0.162*** 0.052 PPP -0.080 0.059 -0.041 0.061 other -0.121 0.084 -0.062 0.100
Health status (Very good health) Bad -0.049* 0.029 -0.112*** 0.031 Very bad -0.156*** 0.042 -0.166*** 0.047 Working 0.112*** 0.026 0.048* 0.029
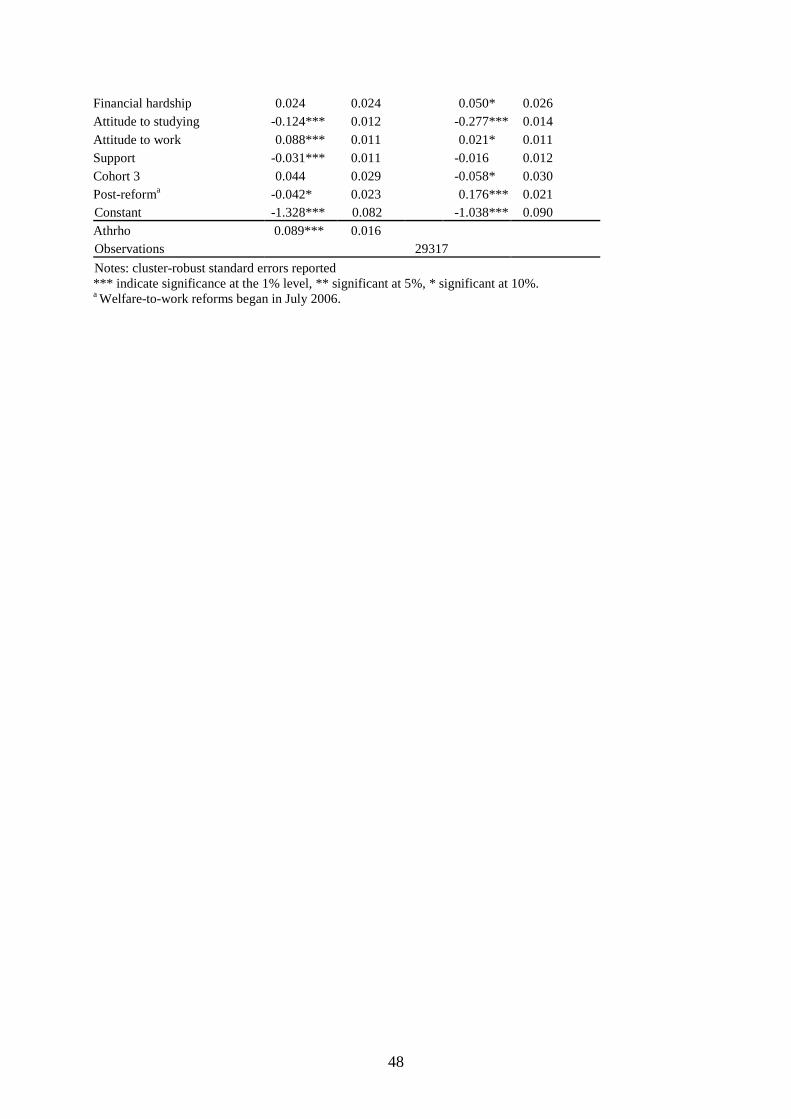
48
Financial hardship 0.024 0.024 0.050* 0.026 Attitude to studying -0.124*** 0.012 -0.277*** 0.014 Attitude to work 0.088*** 0.011 0.021* 0.011 Support -0.031*** 0.011 -0.016 0.012 Cohort 3 0.044 0.029 -0.058* 0.030 Post-reforma -0.042* 0.023 0.176*** 0.021 Constant -1.328*** 0.082 -1.038*** 0.090 Athrho 0.089*** 0.016 Observations 29317 Notes: cluster-robust standard errors reported *** indicate significance at the 1% level, ** significant at 5%, * significant at 10%. a Welfare-to-work reforms began in July 2006.
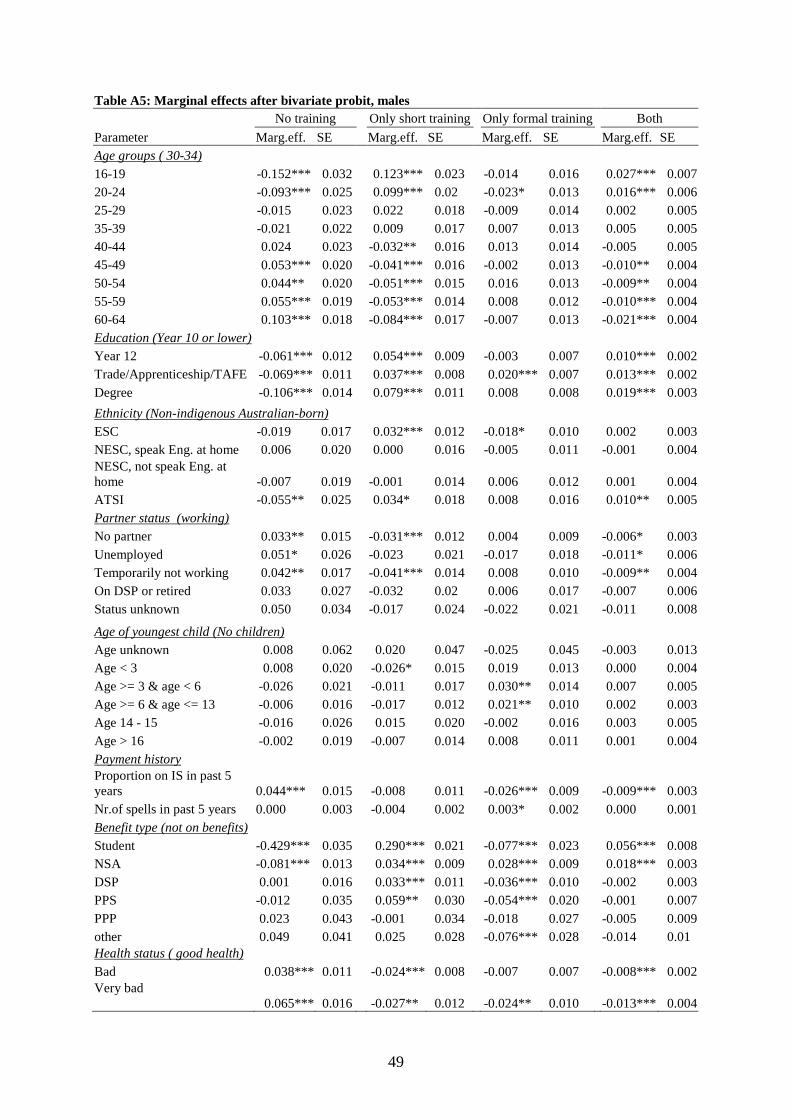
49
Table A5: Marginal effects after bivariate probit, males No training Only short training Only formal training Both Parameter Marg.eff. SE Marg.eff. SE Marg.eff. SE Marg.eff. SE
Age groups ( 30-34) 16-19 -0.152*** 0.032 0.123*** 0.023 -0.014 0.016 0.027*** 0.007 20-24 -0.093*** 0.025 0.099*** 0.02 -0.023* 0.013 0.016*** 0.006 25-29 -0.015 0.023 0.022 0.018 -0.009 0.014 0.002 0.005 35-39 -0.021 0.022 0.009 0.017 0.007 0.013 0.005 0.005 40-44 0.024 0.023 -0.032** 0.016 0.013 0.014 -0.005 0.005 45-49 0.053*** 0.020 -0.041*** 0.016 -0.002 0.013 -0.010** 0.004 50-54 0.044** 0.020 -0.051*** 0.015 0.016 0.013 -0.009** 0.004 55-59 0.055*** 0.019 -0.053*** 0.014 0.008 0.012 -0.010*** 0.004 60-64 0.103*** 0.018 -0.084*** 0.017 -0.007 0.013 -0.021*** 0.004
Education (Year 10 or lower) Year 12 -0.061*** 0.012 0.054*** 0.009 -0.003 0.007 0.010*** 0.002 Trade/Apprenticeship/TAFE -0.069*** 0.011 0.037*** 0.008 0.020*** 0.007 0.013*** 0.002 Degree -0.106*** 0.014 0.079*** 0.011 0.008 0.008 0.019*** 0.003
Ethnicity (Non-indigenous Australian-born) ESC -0.019 0.017 0.032*** 0.012 -0.018* 0.010 0.002 0.003 NESC, speak Eng. at home 0.006 0.020 0.000 0.016 -0.005 0.011 -0.001 0.004 NESC, not speak Eng. at home -0.007 0.019 -0.001 0.014 0.006 0.012 0.001 0.004 ATSI -0.055** 0.025 0.034* 0.018 0.008 0.016 0.010** 0.005
Partner status (working) No partner 0.033** 0.015 -0.031*** 0.012 0.004 0.009 -0.006* 0.003 Unemployed 0.051* 0.026 -0.023 0.021 -0.017 0.018 -0.011* 0.006 Temporarily not working 0.042** 0.017 -0.041*** 0.014 0.008 0.010 -0.009** 0.004 On DSP or retired 0.033 0.027 -0.032 0.02 0.006 0.017 -0.007 0.006 Status unknown 0.050 0.034 -0.017 0.024 -0.022 0.021 -0.011 0.008
Age of youngest child (No children) Age unknown 0.008 0.062 0.020 0.047 -0.025 0.045 -0.003 0.013 Age < 3 0.008 0.020 -0.026* 0.015 0.019 0.013 0.000 0.004 Age >= 3 & age < 6 -0.026 0.021 -0.011 0.017 0.030** 0.014 0.007 0.005 Age >= 6 & age <= 13 -0.006 0.016 -0.017 0.012 0.021** 0.010 0.002 0.003 Age 14 - 15 -0.016 0.026 0.015 0.020 -0.002 0.016 0.003 0.005 Age > 16 -0.002 0.019 -0.007 0.014 0.008 0.011 0.001 0.004
Payment history Proportion on IS in past 5 years 0.044*** 0.015 -0.008 0.011 -0.026*** 0.009 -0.009*** 0.003 Nr.of spells in past 5 years 0.000 0.003 -0.004 0.002 0.003* 0.002 0.000 0.001
Benefit type (not on benefits) Student -0.429*** 0.035 0.290*** 0.021 -0.077*** 0.023 0.056*** 0.008 NSA -0.081*** 0.013 0.034*** 0.009 0.028*** 0.009 0.018*** 0.003 DSP 0.001 0.016 0.033*** 0.011 -0.036*** 0.010 -0.002 0.003 PPS -0.012 0.035 0.059** 0.030 -0.054*** 0.020 -0.001 0.007 PPP 0.023 0.043 -0.001 0.034 -0.018 0.027 -0.005 0.009 other 0.049 0.041 0.025 0.028 -0.076*** 0.028 -0.014 0.01
Health status ( good health) Bad 0.038*** 0.011 -0.024*** 0.008 -0.007 0.007 -0.008*** 0.002 Very bad 0.065*** 0.016 -0.027** 0.012 -0.024** 0.010 -0.013*** 0.004
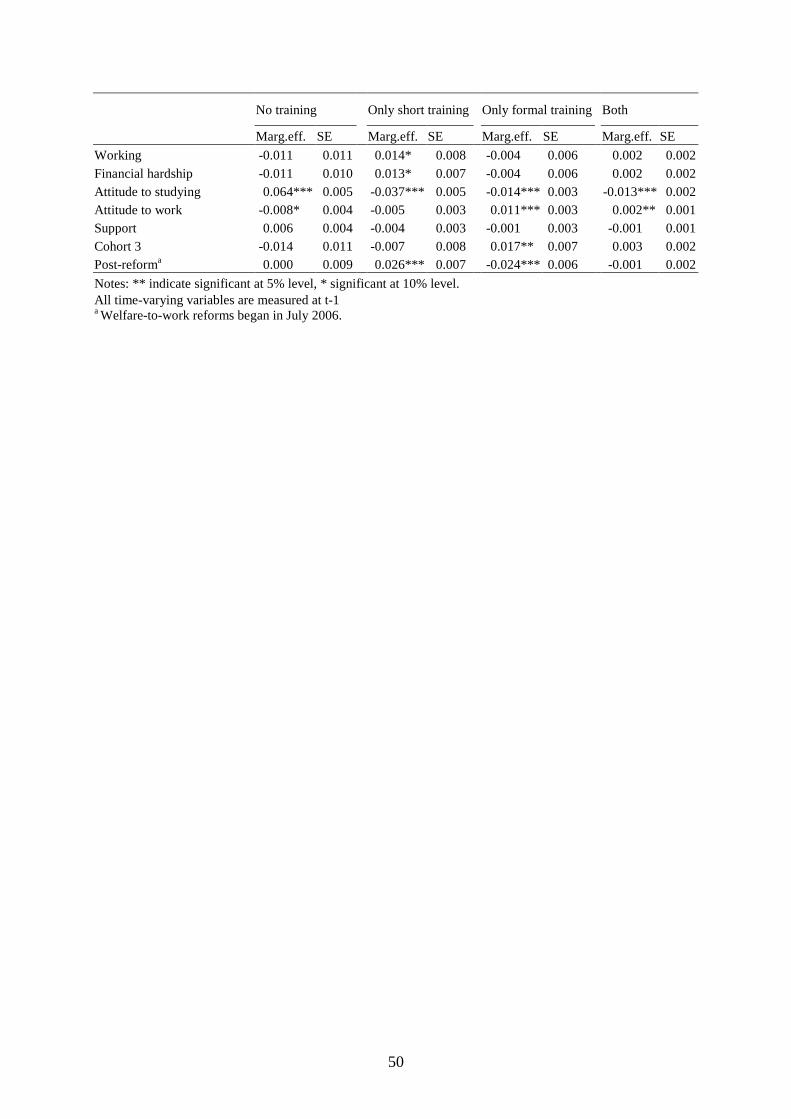
50
No training Only short training Only formal training Both
Marg.eff. SE Marg.eff. SE Marg.eff. SE Marg.eff. SE Working -0.011 0.011 0.014* 0.008 -0.004 0.006 0.002 0.002 Financial hardship -0.011 0.010 0.013* 0.007 -0.004 0.006 0.002 0.002 Attitude to studying 0.064*** 0.005 -0.037*** 0.005 -0.014*** 0.003 -0.013*** 0.002 Attitude to work -0.008* 0.004 -0.005 0.003 0.011*** 0.003 0.002** 0.001 Support 0.006 0.004 -0.004 0.003 -0.001 0.003 -0.001 0.001 Cohort 3 -0.014 0.011 -0.007 0.008 0.017** 0.007 0.003 0.002 Post-reforma 0.000 0.009 0.026*** 0.007 -0.024*** 0.006 -0.001 0.002 Notes: ** indicate significant at 5% level, * significant at 10% level. All time-varying variables are measured at t-1 a Welfare-to-work reforms began in July 2006.
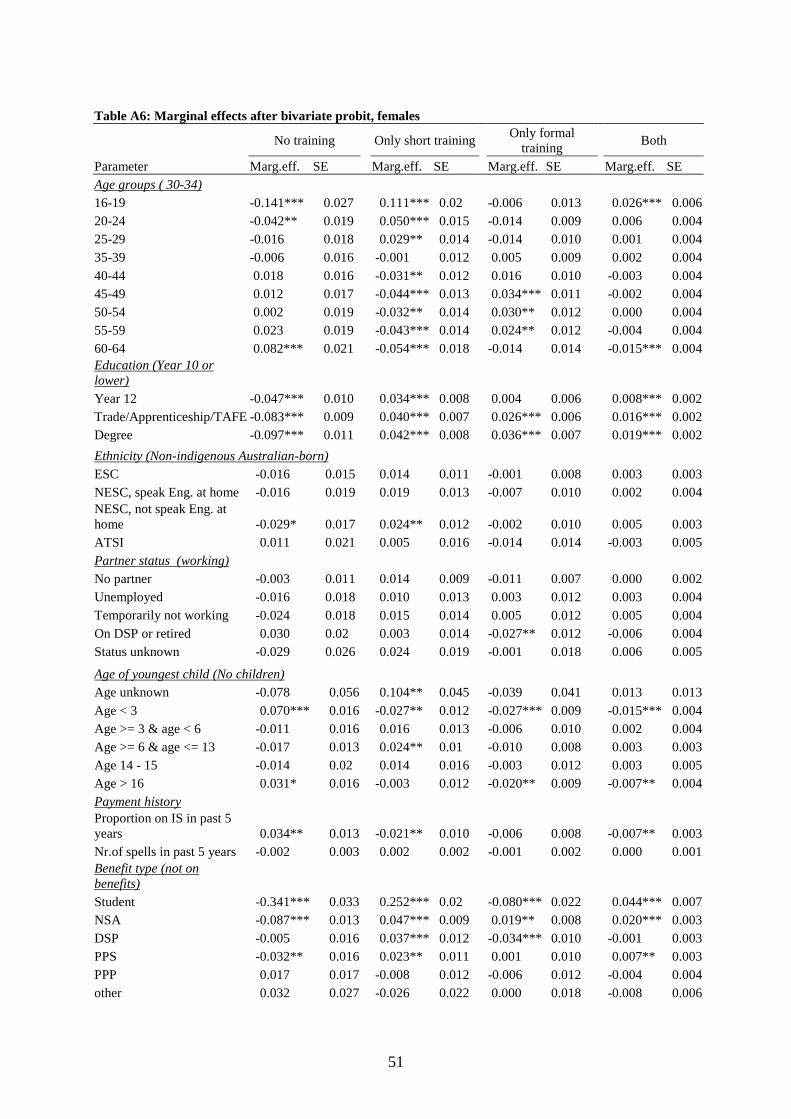
51
Table A6: Marginal effects after bivariate probit, females
No training Only short training Only formal training Both
Parameter Marg.eff. SE Marg.eff. SE Marg.eff. SE Marg.eff. SE Age groups ( 30-34)
16-19 -0.141*** 0.027 0.111*** 0.02 -0.006 0.013 0.026*** 0.006 20-24 -0.042** 0.019 0.050*** 0.015 -0.014 0.009 0.006 0.004 25-29 -0.016 0.018 0.029** 0.014 -0.014 0.010 0.001 0.004 35-39 -0.006 0.016 -0.001 0.012 0.005 0.009 0.002 0.004 40-44 0.018 0.016 -0.031** 0.012 0.016 0.010 -0.003 0.004 45-49 0.012 0.017 -0.044*** 0.013 0.034*** 0.011 -0.002 0.004 50-54 0.002 0.019 -0.032** 0.014 0.030** 0.012 0.000 0.004 55-59 0.023 0.019 -0.043*** 0.014 0.024** 0.012 -0.004 0.004 60-64 0.082*** 0.021 -0.054*** 0.018 -0.014 0.014 -0.015*** 0.004
Education (Year 10 or lower) Year 12 -0.047*** 0.010 0.034*** 0.008 0.004 0.006 0.008*** 0.002 Trade/Apprenticeship/TAFE -0.083*** 0.009 0.040*** 0.007 0.026*** 0.006 0.016*** 0.002 Degree -0.097*** 0.011 0.042*** 0.008 0.036*** 0.007 0.019*** 0.002
Ethnicity (Non-indigenous Australian-born) ESC -0.016 0.015 0.014 0.011 -0.001 0.008 0.003 0.003 NESC, speak Eng. at home -0.016 0.019 0.019 0.013 -0.007 0.010 0.002 0.004 NESC, not speak Eng. at home -0.029* 0.017 0.024** 0.012 -0.002 0.010 0.005 0.003 ATSI 0.011 0.021 0.005 0.016 -0.014 0.014 -0.003 0.005
Partner status (working) No partner -0.003 0.011 0.014 0.009 -0.011 0.007 0.000 0.002 Unemployed -0.016 0.018 0.010 0.013 0.003 0.012 0.003 0.004 Temporarily not working -0.024 0.018 0.015 0.014 0.005 0.012 0.005 0.004 On DSP or retired 0.030 0.02 0.003 0.014 -0.027** 0.012 -0.006 0.004 Status unknown -0.029 0.026 0.024 0.019 -0.001 0.018 0.006 0.005
Age of youngest child (No children) Age unknown -0.078 0.056 0.104** 0.045 -0.039 0.041 0.013 0.013 Age < 3 0.070*** 0.016 -0.027** 0.012 -0.027*** 0.009 -0.015*** 0.004 Age >= 3 & age < 6 -0.011 0.016 0.016 0.013 -0.006 0.010 0.002 0.004 Age >= 6 & age <= 13 -0.017 0.013 0.024** 0.01 -0.010 0.008 0.003 0.003 Age 14 - 15 -0.014 0.02 0.014 0.016 -0.003 0.012 0.003 0.005 Age > 16 0.031* 0.016 -0.003 0.012 -0.020** 0.009 -0.007** 0.004
Payment history Proportion on IS in past 5 years 0.034** 0.013 -0.021** 0.010 -0.006 0.008 -0.007** 0.003 Nr.of spells in past 5 years -0.002 0.003 0.002 0.002 -0.001 0.002 0.000 0.001
Benefit type (not on benefits) Student -0.341*** 0.033 0.252*** 0.02 -0.080*** 0.022 0.044*** 0.007 NSA -0.087*** 0.013 0.047*** 0.009 0.019** 0.008 0.020*** 0.003 DSP -0.005 0.016 0.037*** 0.012 -0.034*** 0.010 -0.001 0.003 PPS -0.032** 0.016 0.023** 0.011 0.001 0.010 0.007** 0.003 PPP 0.017 0.017 -0.008 0.012 -0.006 0.012 -0.004 0.004 other 0.032 0.027 -0.026 0.022 0.000 0.018 -0.008 0.006
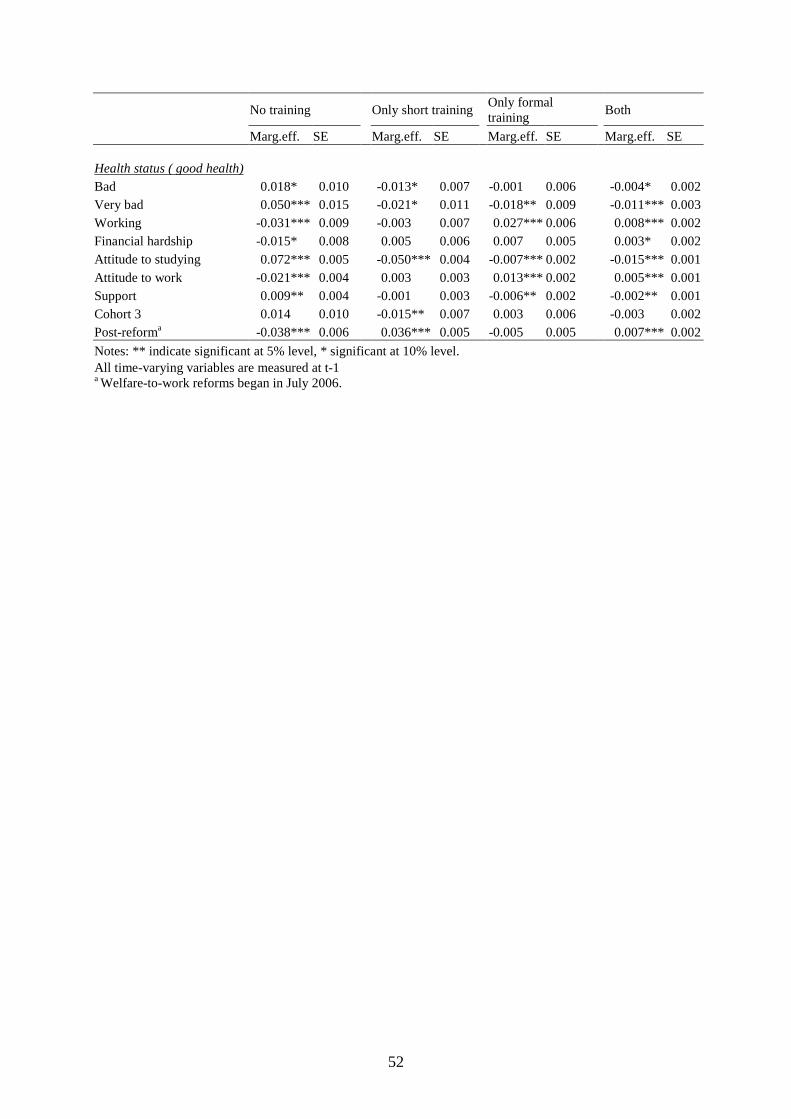
52
No training Only short training Only formal
training Both
Marg.eff. SE Marg.eff. SE Marg.eff. SE Marg.eff. SE
Health status ( good health) Bad 0.018* 0.010 -0.013* 0.007 -0.001 0.006 -0.004* 0.002 Very bad 0.050*** 0.015 -0.021* 0.011 -0.018** 0.009 -0.011*** 0.003 Working -0.031*** 0.009 -0.003 0.007 0.027*** 0.006 0.008*** 0.002 Financial hardship -0.015* 0.008 0.005 0.006 0.007 0.005 0.003* 0.002 Attitude to studying 0.072*** 0.005 -0.050*** 0.004 -0.007*** 0.002 -0.015*** 0.001 Attitude to work -0.021*** 0.004 0.003 0.003 0.013*** 0.002 0.005*** 0.001 Support 0.009** 0.004 -0.001 0.003 -0.006** 0.002 -0.002** 0.001 Cohort 3 0.014 0.010 -0.015** 0.007 0.003 0.006 -0.003 0.002 Post-reforma -0.038*** 0.006 0.036*** 0.005 -0.005 0.005 0.007*** 0.002 Notes: ** indicate significant at 5% level, * significant at 10% level. All time-varying variables are measured at t-1 a Welfare-to-work reforms began in July 2006.
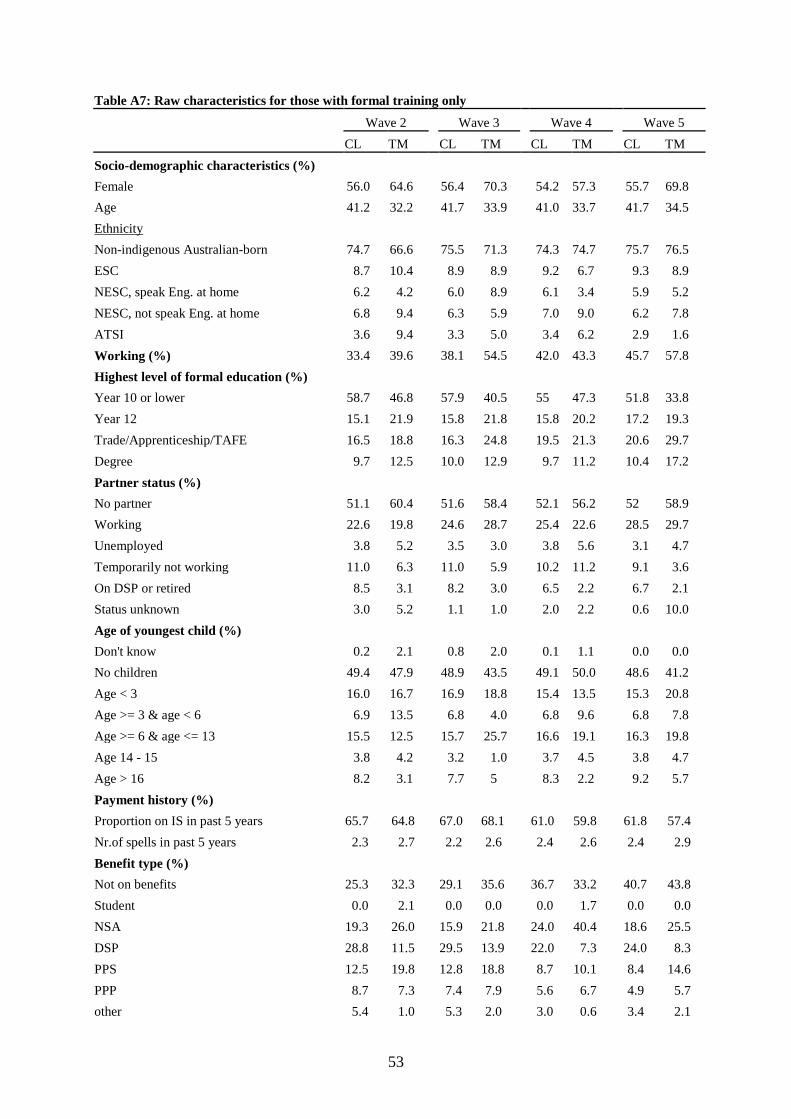
53
Table A7: Raw characteristics for those with formal training only
Wave 2 Wave 3 Wave 4 Wave 5 CL TM CL TM CL TM CL TM Socio-demographic characteristics (%) Female 56.0 64.6 56.4 70.3 54.2 57.3 55.7 69.8 Age 41.2 32.2 41.7 33.9 41.0 33.7 41.7 34.5
Ethnicity Non-indigenous Australian-born 74.7 66.6 75.5 71.3 74.3 74.7 75.7 76.5 ESC 8.7 10.4 8.9 8.9 9.2 6.7 9.3 8.9 NESC, speak Eng. at home 6.2 4.2 6.0 8.9 6.1 3.4 5.9 5.2 NESC, not speak Eng. at home 6.8 9.4 6.3 5.9 7.0 9.0 6.2 7.8 ATSI 3.6 9.4 3.3 5.0 3.4 6.2 2.9 1.6 Working (%) 33.4 39.6 38.1 54.5 42.0 43.3 45.7 57.8 Highest level of formal education (%) Year 10 or lower 58.7 46.8 57.9 40.5 55 47.3 51.8 33.8 Year 12 15.1 21.9 15.8 21.8 15.8 20.2 17.2 19.3 Trade/Apprenticeship/TAFE 16.5 18.8 16.3 24.8 19.5 21.3 20.6 29.7 Degree 9.7 12.5 10.0 12.9 9.7 11.2 10.4 17.2 Partner status (%) No partner 51.1 60.4 51.6 58.4 52.1 56.2 52 58.9 Working 22.6 19.8 24.6 28.7 25.4 22.6 28.5 29.7 Unemployed 3.8 5.2 3.5 3.0 3.8 5.6 3.1 4.7 Temporarily not working 11.0 6.3 11.0 5.9 10.2 11.2 9.1 3.6 On DSP or retired 8.5 3.1 8.2 3.0 6.5 2.2 6.7 2.1 Status unknown 3.0 5.2 1.1 1.0 2.0 2.2 0.6 10.0 Age of youngest child (%) Don't know 0.2 2.1 0.8 2.0 0.1 1.1 0.0 0.0 No children 49.4 47.9 48.9 43.5 49.1 50.0 48.6 41.2 Age < 3 16.0 16.7 16.9 18.8 15.4 13.5 15.3 20.8 Age >= 3 & age < 6 6.9 13.5 6.8 4.0 6.8 9.6 6.8 7.8 Age >= 6 & age <= 13 15.5 12.5 15.7 25.7 16.6 19.1 16.3 19.8 Age 14 - 15 3.8 4.2 3.2 1.0 3.7 4.5 3.8 4.7 Age > 16 8.2 3.1 7.7 5 8.3 2.2 9.2 5.7 Payment history (%) Proportion on IS in past 5 years 65.7 64.8 67.0 68.1 61.0 59.8 61.8 57.4 Nr.of spells in past 5 years 2.3 2.7 2.2 2.6 2.4 2.6 2.4 2.9 Benefit type (%) Not on benefits 25.3 32.3 29.1 35.6 36.7 33.2 40.7 43.8 Student 0.0 2.1 0.0 0.0 0.0 1.7 0.0 0.0 NSA 19.3 26.0 15.9 21.8 24.0 40.4 18.6 25.5 DSP 28.8 11.5 29.5 13.9 22.0 7.3 24.0 8.3 PPS 12.5 19.8 12.8 18.8 8.7 10.1 8.4 14.6 PPP 8.7 7.3 7.4 7.9 5.6 6.7 4.9 5.7 other 5.4 1.0 5.3 2.0 3.0 0.6 3.4 2.1
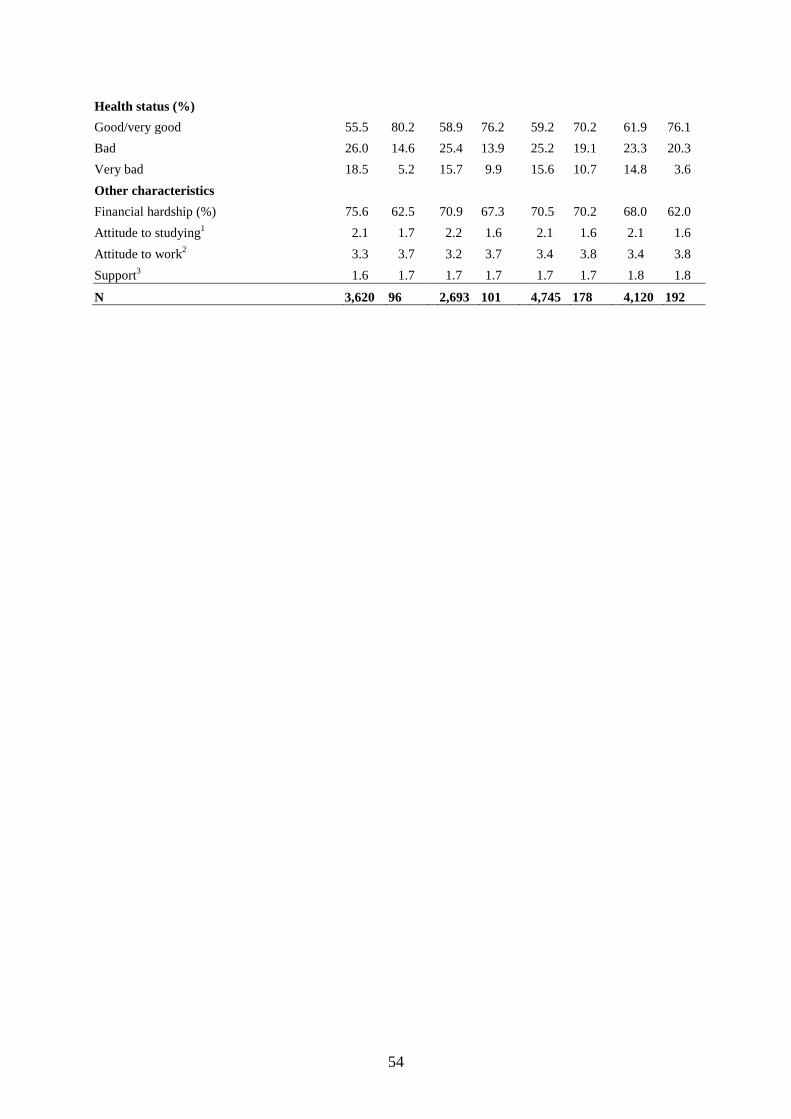
54
Health status (%) Good/very good 55.5 80.2 58.9 76.2 59.2 70.2 61.9 76.1 Bad 26.0 14.6 25.4 13.9 25.2 19.1 23.3 20.3 Very bad 18.5 5.2 15.7 9.9 15.6 10.7 14.8 3.6 Other characteristics Financial hardship (%) 75.6 62.5 70.9 67.3 70.5 70.2 68.0 62.0 Attitude to studying1 2.1 1.7 2.2 1.6 2.1 1.6 2.1 1.6 Attitude to work2 3.3 3.7 3.2 3.7 3.4 3.8 3.4 3.8 Support3 1.6 1.7 1.7 1.7 1.7 1.7 1.8 1.8
N 3,620 96 2,693 101 4,745 178 4,120 192
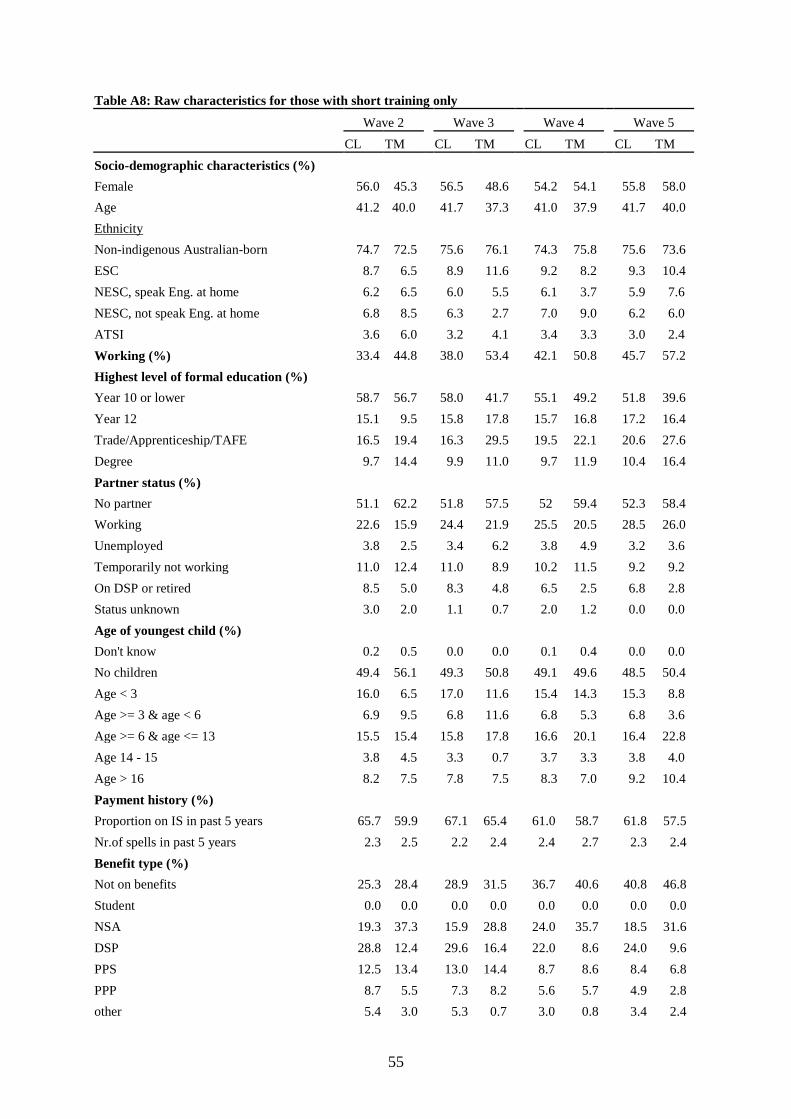
55
Table A8: Raw characteristics for those with short training only
Wave 2 Wave 3 Wave 4 Wave 5 CL TM CL TM CL TM CL TM Socio-demographic characteristics (%) Female 56.0 45.3 56.5 48.6 54.2 54.1 55.8 58.0 Age 41.2 40.0 41.7 37.3 41.0 37.9 41.7 40.0
Ethnicity Non-indigenous Australian-born 74.7 72.5 75.6 76.1 74.3 75.8 75.6 73.6 ESC 8.7 6.5 8.9 11.6 9.2 8.2 9.3 10.4 NESC, speak Eng. at home 6.2 6.5 6.0 5.5 6.1 3.7 5.9 7.6 NESC, not speak Eng. at home 6.8 8.5 6.3 2.7 7.0 9.0 6.2 6.0 ATSI 3.6 6.0 3.2 4.1 3.4 3.3 3.0 2.4 Working (%) 33.4 44.8 38.0 53.4 42.1 50.8 45.7 57.2 Highest level of formal education (%) Year 10 or lower 58.7 56.7 58.0 41.7 55.1 49.2 51.8 39.6 Year 12 15.1 9.5 15.8 17.8 15.7 16.8 17.2 16.4 Trade/Apprenticeship/TAFE 16.5 19.4 16.3 29.5 19.5 22.1 20.6 27.6 Degree 9.7 14.4 9.9 11.0 9.7 11.9 10.4 16.4 Partner status (%) No partner 51.1 62.2 51.8 57.5 52 59.4 52.3 58.4 Working 22.6 15.9 24.4 21.9 25.5 20.5 28.5 26.0 Unemployed 3.8 2.5 3.4 6.2 3.8 4.9 3.2 3.6 Temporarily not working 11.0 12.4 11.0 8.9 10.2 11.5 9.2 9.2 On DSP or retired 8.5 5.0 8.3 4.8 6.5 2.5 6.8 2.8 Status unknown 3.0 2.0 1.1 0.7 2.0 1.2 0.0 0.0 Age of youngest child (%) Don't know 0.2 0.5 0.0 0.0 0.1 0.4 0.0 0.0 No children 49.4 56.1 49.3 50.8 49.1 49.6 48.5 50.4 Age < 3 16.0 6.5 17.0 11.6 15.4 14.3 15.3 8.8 Age >= 3 & age < 6 6.9 9.5 6.8 11.6 6.8 5.3 6.8 3.6 Age >= 6 & age <= 13 15.5 15.4 15.8 17.8 16.6 20.1 16.4 22.8 Age 14 - 15 3.8 4.5 3.3 0.7 3.7 3.3 3.8 4.0 Age > 16 8.2 7.5 7.8 7.5 8.3 7.0 9.2 10.4 Payment history (%) Proportion on IS in past 5 years 65.7 59.9 67.1 65.4 61.0 58.7 61.8 57.5 Nr.of spells in past 5 years 2.3 2.5 2.2 2.4 2.4 2.7 2.3 2.4 Benefit type (%) Not on benefits 25.3 28.4 28.9 31.5 36.7 40.6 40.8 46.8 Student 0.0 0.0 0.0 0.0 0.0 0.0 0.0 0.0 NSA 19.3 37.3 15.9 28.8 24.0 35.7 18.5 31.6 DSP 28.8 12.4 29.6 16.4 22.0 8.6 24.0 9.6 PPS 12.5 13.4 13.0 14.4 8.7 8.6 8.4 6.8 PPP 8.7 5.5 7.3 8.2 5.6 5.7 4.9 2.8 other 5.4 3.0 5.3 0.7 3.0 0.8 3.4 2.4

56
Health status (%) Good/very good 55.5 63.1 59.1 69.2 59.2 72.6 61.9 70.8 Bad 26.0 29.4 25.2 23.3 25.2 18 23.3 19.2 Very bad 18.5 7.5 15.7 7.5 15.6 9.4 14.8 10.0 Other characteristics Financial hardship (%) 75.6 78.1 70.8 70.5 70.5 70.1 67.9 62.4 Attitude to studying1 2.1 1.9 2.2 1.8 2.1 1.8 2.1 1.9 Attitude to work2 3.3 3.7 3.2 3.9 3.4 3.9 3.4 3.8 Support3 1.6 1.6 1.7 1.6 1.7 1.7 1.8 1.8
N 3,619 201 2,671 146 4,744 244 4,095 250

57
Table A9: Raw outcomes for those with only formal training Wave 2 Wave 3 Wave 4 Wave 5 CL TM CL TM CL TM CL TM
Proportion of time on benefits (%) for next 6 months 69.3 54.7 67.8 62.0 59.3 58.6 57.9 53.6 12 months 67.1 49.0 66.1 58.1 58.0 51.4 59.1 51.9 18 months 65.7 47.7 64.5 53.9 59.3 53.3 24 months 64.3 51.1 64.6 54.3
Proportion of sample on benefits (%) after 6 months 68.0 49.0 66.4 58.4 58.7 55.1 57.4 53.1 12 months 66.0 46.9 65.3 55.4 57.7 49.4 60.1 52.6 18 months 65.2 50.0 63.9 54.5 60.5 54.5 24 months 63.8 49.0 65.8 52.7
Job characteristics - after 6 months Working (%) 37.7 59.7 39.6 56.0 45.5 59.5 Ever worked in past 6 months (%) 43.8 67.7 44.4 64.0 52.3 67.6 Have full-time job (%) 14.6 27.4 14.8 18.7 18.6 25.7 Hours of main job | working 27.8 31.5 27.5 26.4 28.8 28.1 Hours worked in all jobs | working 28.3 33.0 28.0 27.0 29.3 29.1 Hours worked in all jobs 10.5 19.5 10.9 15.1 13.1 17.3 Wage from main job 20.2 23.3 20.3 18.6 20.8 20.1 Total weekly earnings | working 537.8 629.7 553.8 433.2 595.6 543.5 Total weekly earning 180.5 358.3 196.4 216.6 246.8 302.0 Main job - high skill (%) 19.9 24.3 18.1 23.8 17.3 16.3 Main job – medium/high skill (%) 75.6 81.1 72.9 88.1 74.0 79.1
Job characteristics - after 12 months Working (%) 39.4 73.5 39.0 60.3 Ever worked in past 6 months (%) 44.3 75.5 44.8 66.7 Have full-time job (%) 14.7 22.4 13.9 17.5 Hours of main job | working 27.6 25.4 27.0 26.0 Hours worked in all jobs | working 28.0 26.1 27.5 26.3 Hours worked in all jobs 10.9 19.0 10.6 15.7 Wage from main job 20.3 20.2 20.7 19.0 Total weekly earnings | working 553.6 511.5 551.2 521.3 Total weekly earning 195.6 370.0 191.7 284.3 Main job - high skill (%) 18.7 25.7 18.1 26.3 Main job – medium/high skill (%) 73.8 80.0 75.8 86.8
Job characteristics - after 18 months Working (%) 38.6 62.2 Ever worked in past 6 months (%) 44.6 75.6 Have full-time job (%) 13.7 26.7 Hours of main job | working 27.0 29.6 Hours worked in all jobs | working 27.5 30.4 Hours worked in all jobs 10.5 18.9 Wage from main job 20.6 23.2 Total weekly earnings | working 548.7 641.8 Total weekly earning 188.9 399.3 Main job - high skill (%) 18.7 21.4 Main job – medium/high skill (%) 76.2 85.7 N 3,620 96 2,693 101 4,745 178 4,120 192

58
Table A10: Raw outcomes for those with only short training Wave 2 Wave 3 Wave 4 Wave 5 CL TM CL TM CL TM CL TM
Proportion of time on benefits (%) for next 6 months 69.3 56.4 67.9 54.2 59.3 50.6 57.8 45.7 12 months 67.2 49.5 66.1 49.7 58.0 44.7 59.0 44.7 18 months 65.7 46.8 64.6 51.2 59.3 48.2 24 months 64.3 44.1 64.7 53.1
Proportion of sample on benefits (%) after 6 months 68.0 53.2 66.5 49.3 58.7 45.5 57.3 46.0 12 months 66.0 44.8 65.4 52.1 57.7 45.9 60.1 44.4 18 months 65.3 44.8 64.0 50.7 60.5 50.4 24 months 63.8 43.8 65.9 55.2
Job characteristics - after 6 months Working (%) 37.6 52.3 39.4 62.5 45.5 60.7 Ever worked in past 6 months (%) 43.8 66.4 44.1 74.1 52.4 73.1 Have full-time job (%) 14.6 18.8 14.8 33.0 18.6 31.8 Hours of main job | working 27.8 29.0 27.6 31.2 28.8 31.8 Hours worked in all jobs | working 28.3 29.5 28.0 31.8 29.3 32.3 Hours worked in all jobs 10.5 15.3 10.9 19.9 13.1 19.5 Wage from main job 20.2 18.9 20.3 20.9 20.8 22.4 Total weekly earnings | working 538.1 527.6 554.8 633.3 595.6 681.8 Total weekly earning 180.5 242.8 195.7 382.4 246.9 395.3 Main job - high skill (%) 19.9 23.1 18.1 22.9 17.3 21.3 Main job – medium/high skill (%) 75.6 78.5 72.9 77.1 74.0 73.8
Job characteristics - after 12 months Working (%) 39.4 60.6 39.0 69.2 Ever worked in past 6 months (%) 44.2 66.1 44.7 81.3 Have full-time job (%) 14.7 21.1 13.9 31.9 Hours of main job | working 27.6 30.0 27.0 29.1 Hours worked in all jobs | working 28.0 31.2 27.5 29.8 Hours worked in all jobs 10.8 18.5 10.6 20.6 Wage from main job 20.3 18.0 20.6 21.7 Total weekly earnings | working 553.6 542.6 550.6 590.9 Total weekly earning 195.4 294.4 191.1 402.9 Main job - high skill (%) 18.8 13.8 18.0 22.6 Main job – medium/high skill (%) 73.8 73.8 75.9 77.4
Job characteristics - after 18 months Working (%) 38.5 57.0 Ever worked in past 6 months (%) 44.5 68.8 Have full-time job (%) 13.7 22.6 Hours of main job | working 27.0 33.3 Hours worked in all jobs | working 27.5 33.4 Hours worked in all jobs 10.5 18.6 Wage from main job 20.6 19.3 Total weekly earnings | working 548.8 587.2 Total weekly earning 188.7 278.1 Main job - high skill (%) 18.7 13.5 Main job – medium/high skill (%) 76.1 78.8 N 3,619 201 2,671 146 4,744 244 4,095 250
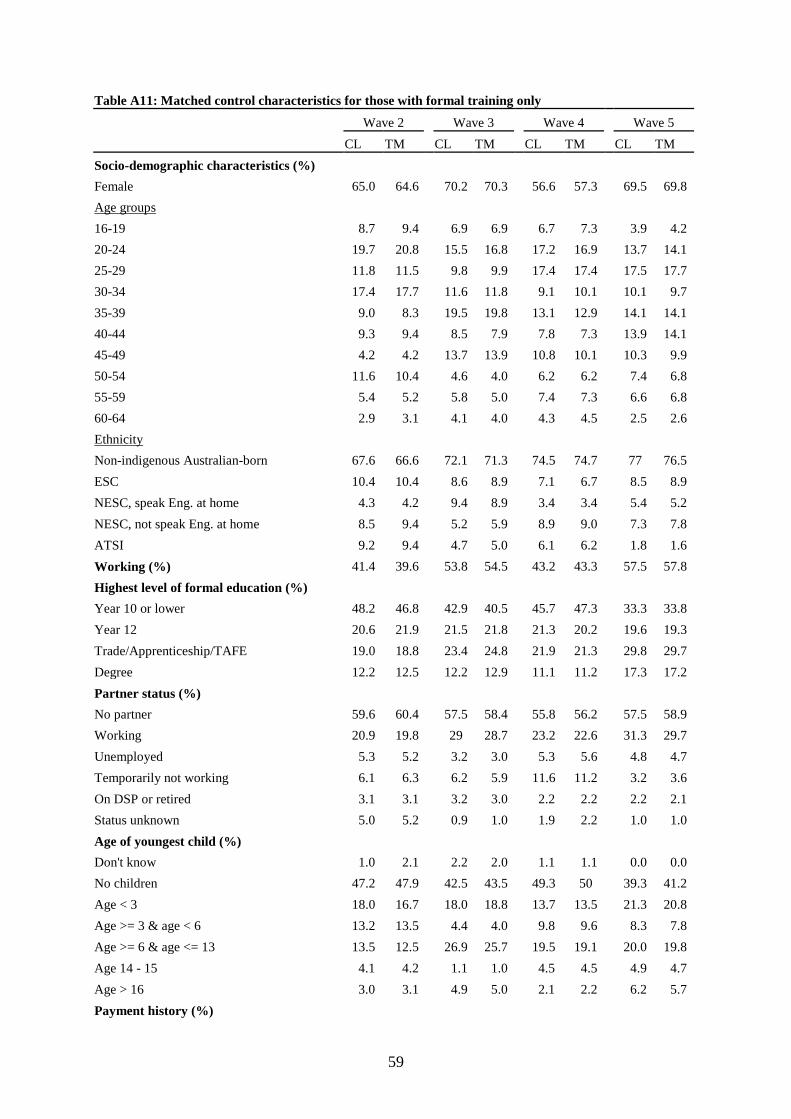
59
Table A11: Matched control characteristics for those with formal training only
Wave 2 Wave 3 Wave 4 Wave 5 CL TM CL TM CL TM CL TM Socio-demographic characteristics (%) Female 65.0 64.6 70.2 70.3 56.6 57.3 69.5 69.8
Age groups 16-19 8.7 9.4 6.9 6.9 6.7 7.3 3.9 4.2 20-24 19.7 20.8 15.5 16.8 17.2 16.9 13.7 14.1 25-29 11.8 11.5 9.8 9.9 17.4 17.4 17.5 17.7 30-34 17.4 17.7 11.6 11.8 9.1 10.1 10.1 9.7 35-39 9.0 8.3 19.5 19.8 13.1 12.9 14.1 14.1 40-44 9.3 9.4 8.5 7.9 7.8 7.3 13.9 14.1 45-49 4.2 4.2 13.7 13.9 10.8 10.1 10.3 9.9 50-54 11.6 10.4 4.6 4.0 6.2 6.2 7.4 6.8 55-59 5.4 5.2 5.8 5.0 7.4 7.3 6.6 6.8 60-64 2.9 3.1 4.1 4.0 4.3 4.5 2.5 2.6
Ethnicity Non-indigenous Australian-born 67.6 66.6 72.1 71.3 74.5 74.7 77 76.5 ESC 10.4 10.4 8.6 8.9 7.1 6.7 8.5 8.9 NESC, speak Eng. at home 4.3 4.2 9.4 8.9 3.4 3.4 5.4 5.2 NESC, not speak Eng. at home 8.5 9.4 5.2 5.9 8.9 9.0 7.3 7.8 ATSI 9.2 9.4 4.7 5.0 6.1 6.2 1.8 1.6 Working (%) 41.4 39.6 53.8 54.5 43.2 43.3 57.5 57.8 Highest level of formal education (%) Year 10 or lower 48.2 46.8 42.9 40.5 45.7 47.3 33.3 33.8 Year 12 20.6 21.9 21.5 21.8 21.3 20.2 19.6 19.3 Trade/Apprenticeship/TAFE 19.0 18.8 23.4 24.8 21.9 21.3 29.8 29.7 Degree 12.2 12.5 12.2 12.9 11.1 11.2 17.3 17.2 Partner status (%) No partner 59.6 60.4 57.5 58.4 55.8 56.2 57.5 58.9 Working 20.9 19.8 29 28.7 23.2 22.6 31.3 29.7 Unemployed 5.3 5.2 3.2 3.0 5.3 5.6 4.8 4.7 Temporarily not working 6.1 6.3 6.2 5.9 11.6 11.2 3.2 3.6 On DSP or retired 3.1 3.1 3.2 3.0 2.2 2.2 2.2 2.1 Status unknown 5.0 5.2 0.9 1.0 1.9 2.2 1.0 1.0 Age of youngest child (%) Don't know 1.0 2.1 2.2 2.0 1.1 1.1 0.0 0.0 No children 47.2 47.9 42.5 43.5 49.3 50 39.3 41.2 Age < 3 18.0 16.7 18.0 18.8 13.7 13.5 21.3 20.8 Age >= 3 & age < 6 13.2 13.5 4.4 4.0 9.8 9.6 8.3 7.8 Age >= 6 & age <= 13 13.5 12.5 26.9 25.7 19.5 19.1 20.0 19.8 Age 14 - 15 4.1 4.2 1.1 1.0 4.5 4.5 4.9 4.7 Age > 16 3.0 3.1 4.9 5.0 2.1 2.2 6.2 5.7 Payment history (%)
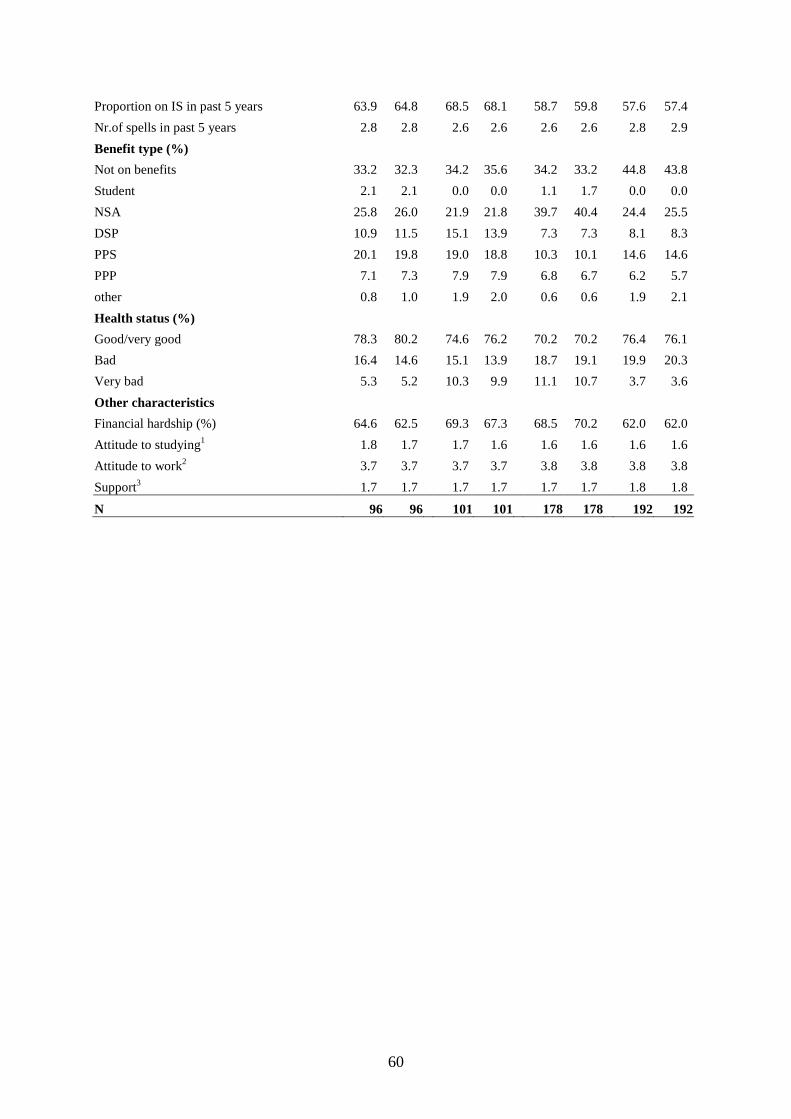
60
Proportion on IS in past 5 years 63.9 64.8 68.5 68.1 58.7 59.8 57.6 57.4 Nr.of spells in past 5 years 2.8 2.8 2.6 2.6 2.6 2.6 2.8 2.9 Benefit type (%) Not on benefits 33.2 32.3 34.2 35.6 34.2 33.2 44.8 43.8 Student 2.1 2.1 0.0 0.0 1.1 1.7 0.0 0.0 NSA 25.8 26.0 21.9 21.8 39.7 40.4 24.4 25.5 DSP 10.9 11.5 15.1 13.9 7.3 7.3 8.1 8.3 PPS 20.1 19.8 19.0 18.8 10.3 10.1 14.6 14.6 PPP 7.1 7.3 7.9 7.9 6.8 6.7 6.2 5.7 other 0.8 1.0 1.9 2.0 0.6 0.6 1.9 2.1 Health status (%) Good/very good 78.3 80.2 74.6 76.2 70.2 70.2 76.4 76.1 Bad 16.4 14.6 15.1 13.9 18.7 19.1 19.9 20.3 Very bad 5.3 5.2 10.3 9.9 11.1 10.7 3.7 3.6 Other characteristics Financial hardship (%) 64.6 62.5 69.3 67.3 68.5 70.2 62.0 62.0 Attitude to studying1 1.8 1.7 1.7 1.6 1.6 1.6 1.6 1.6 Attitude to work2 3.7 3.7 3.7 3.7 3.8 3.8 3.8 3.8 Support3 1.7 1.7 1.7 1.7 1.7 1.7 1.8 1.8
N 96 96 101 101 178 178 192 192
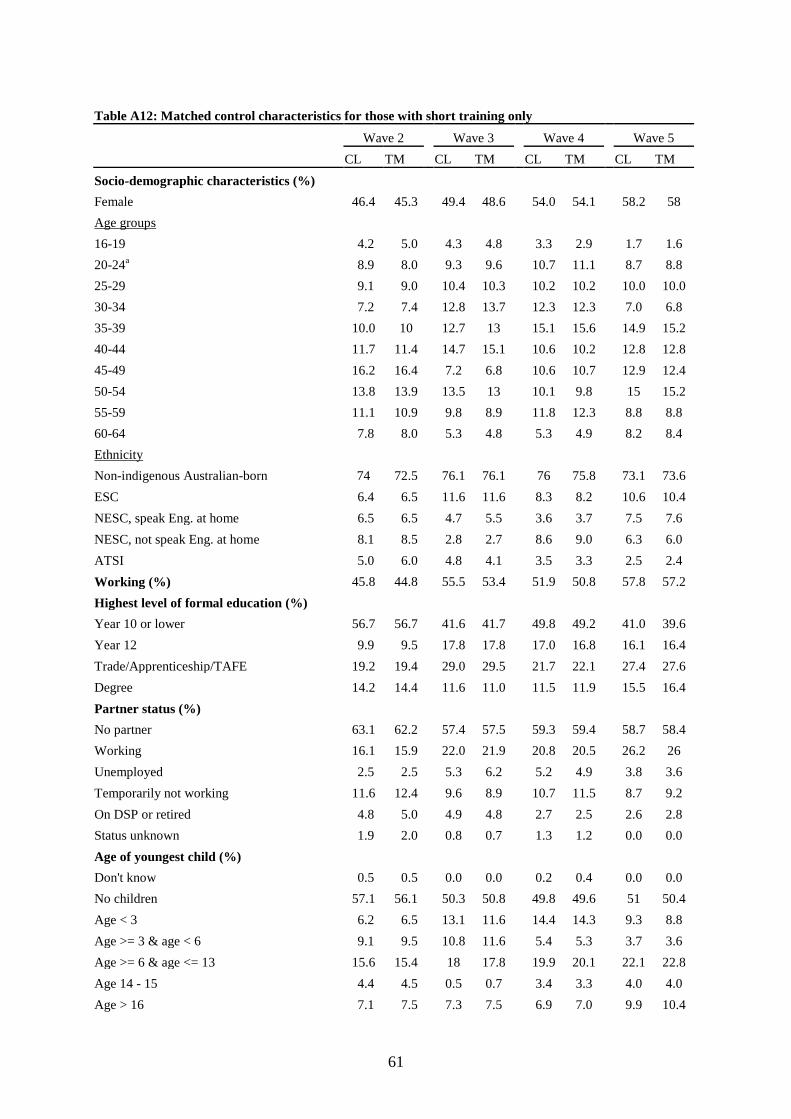
61
Table A12: Matched control characteristics for those with short training only
Wave 2 Wave 3 Wave 4 Wave 5 CL TM CL TM CL TM CL TM Socio-demographic characteristics (%) Female 46.4 45.3 49.4 48.6 54.0 54.1 58.2 58
Age groups 16-19 4.2 5.0 4.3 4.8 3.3 2.9 1.7 1.6 20-24a 8.9 8.0 9.3 9.6 10.7 11.1 8.7 8.8 25-29 9.1 9.0 10.4 10.3 10.2 10.2 10.0 10.0 30-34 7.2 7.4 12.8 13.7 12.3 12.3 7.0 6.8 35-39 10.0 10 12.7 13 15.1 15.6 14.9 15.2 40-44 11.7 11.4 14.7 15.1 10.6 10.2 12.8 12.8 45-49 16.2 16.4 7.2 6.8 10.6 10.7 12.9 12.4 50-54 13.8 13.9 13.5 13 10.1 9.8 15 15.2 55-59 11.1 10.9 9.8 8.9 11.8 12.3 8.8 8.8 60-64 7.8 8.0 5.3 4.8 5.3 4.9 8.2 8.4
Ethnicity Non-indigenous Australian-born 74 72.5 76.1 76.1 76 75.8 73.1 73.6 ESC 6.4 6.5 11.6 11.6 8.3 8.2 10.6 10.4 NESC, speak Eng. at home 6.5 6.5 4.7 5.5 3.6 3.7 7.5 7.6 NESC, not speak Eng. at home 8.1 8.5 2.8 2.7 8.6 9.0 6.3 6.0 ATSI 5.0 6.0 4.8 4.1 3.5 3.3 2.5 2.4 Working (%) 45.8 44.8 55.5 53.4 51.9 50.8 57.8 57.2 Highest level of formal education (%) Year 10 or lower 56.7 56.7 41.6 41.7 49.8 49.2 41.0 39.6 Year 12 9.9 9.5 17.8 17.8 17.0 16.8 16.1 16.4 Trade/Apprenticeship/TAFE 19.2 19.4 29.0 29.5 21.7 22.1 27.4 27.6 Degree 14.2 14.4 11.6 11.0 11.5 11.9 15.5 16.4 Partner status (%) No partner 63.1 62.2 57.4 57.5 59.3 59.4 58.7 58.4 Working 16.1 15.9 22.0 21.9 20.8 20.5 26.2 26 Unemployed 2.5 2.5 5.3 6.2 5.2 4.9 3.8 3.6 Temporarily not working 11.6 12.4 9.6 8.9 10.7 11.5 8.7 9.2 On DSP or retired 4.8 5.0 4.9 4.8 2.7 2.5 2.6 2.8 Status unknown 1.9 2.0 0.8 0.7 1.3 1.2 0.0 0.0 Age of youngest child (%) Don't know 0.5 0.5 0.0 0.0 0.2 0.4 0.0 0.0 No children 57.1 56.1 50.3 50.8 49.8 49.6 51 50.4 Age < 3 6.2 6.5 13.1 11.6 14.4 14.3 9.3 8.8 Age >= 3 & age < 6 9.1 9.5 10.8 11.6 5.4 5.3 3.7 3.6 Age >= 6 & age <= 13 15.6 15.4 18 17.8 19.9 20.1 22.1 22.8 Age 14 - 15 4.4 4.5 0.5 0.7 3.4 3.3 4.0 4.0 Age > 16 7.1 7.5 7.3 7.5 6.9 7.0 9.9 10.4
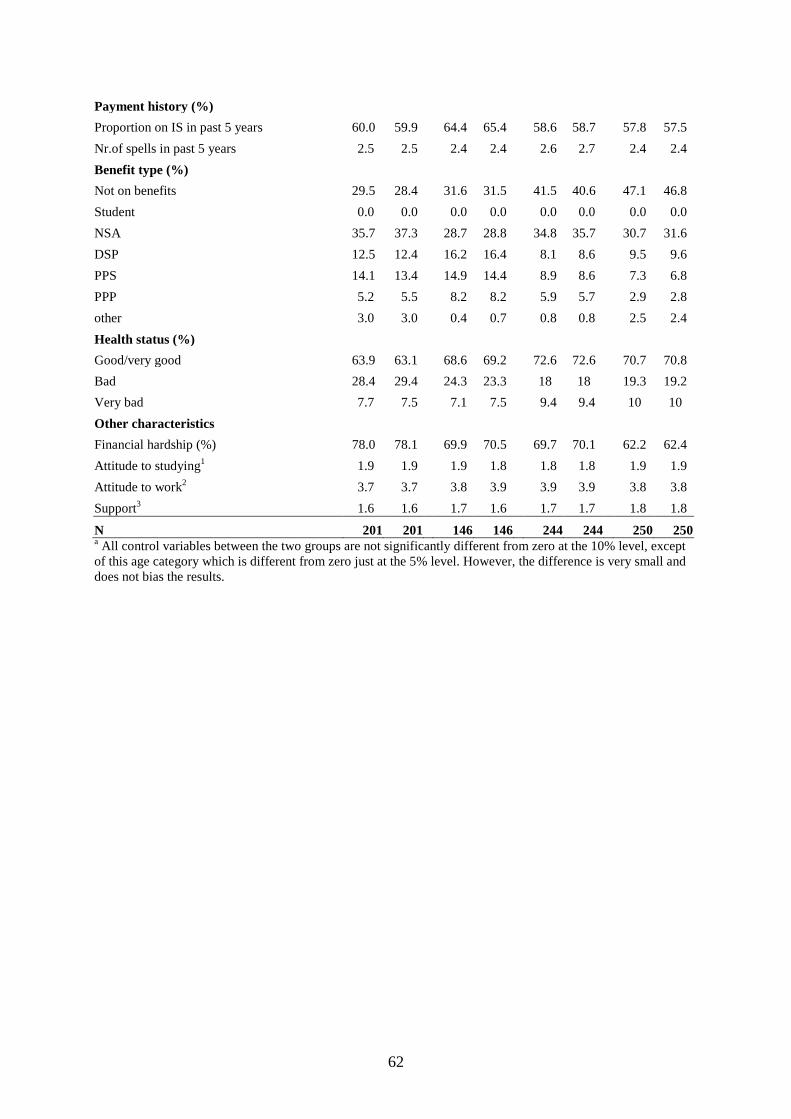
62
Payment history (%) Proportion on IS in past 5 years 60.0 59.9 64.4 65.4 58.6 58.7 57.8 57.5 Nr.of spells in past 5 years 2.5 2.5 2.4 2.4 2.6 2.7 2.4 2.4 Benefit type (%) Not on benefits 29.5 28.4 31.6 31.5 41.5 40.6 47.1 46.8 Student 0.0 0.0 0.0 0.0 0.0 0.0 0.0 0.0 NSA 35.7 37.3 28.7 28.8 34.8 35.7 30.7 31.6 DSP 12.5 12.4 16.2 16.4 8.1 8.6 9.5 9.6 PPS 14.1 13.4 14.9 14.4 8.9 8.6 7.3 6.8 PPP 5.2 5.5 8.2 8.2 5.9 5.7 2.9 2.8 other 3.0 3.0 0.4 0.7 0.8 0.8 2.5 2.4 Health status (%) Good/very good 63.9 63.1 68.6 69.2 72.6 72.6 70.7 70.8 Bad 28.4 29.4 24.3 23.3 18 18 19.3 19.2 Very bad 7.7 7.5 7.1 7.5 9.4 9.4 10 10 Other characteristics Financial hardship (%) 78.0 78.1 69.9 70.5 69.7 70.1 62.2 62.4 Attitude to studying1 1.9 1.9 1.9 1.8 1.8 1.8 1.9 1.9 Attitude to work2 3.7 3.7 3.8 3.9 3.9 3.9 3.8 3.8 Support3 1.6 1.6 1.7 1.6 1.7 1.7 1.8 1.8
N 201 201 146 146 244 244 250 250 a All control variables between the two groups are not significantly different from zero at the 10% level, except of this age category which is different from zero just at the 5% level. However, the difference is very small and does not bias the results.

63
Appendix B: Methodological note on imputing education
We noted that there are 4,373 individuals whose highest level of education changed between any two
waves (having dropped the pensioners, non-students, etc.). It is natural to expect people to retain or
raise their skill level, but quite suspicious if their skill level drops. It needs to be noted that we can
only compare changes between waves 1 and 3 (as the question was not asked in wave 2), waves 3 and
4, and waves 4 and 5.
We have been required to regroup educational attainment in order to identify changes in the level of
skills between the waves. The following three groups serve to identify movement in education groups:
1. Year 10 or below (includes primary school, whether finished or not);
2. Year 12; all trade, TAFE, and apprenticeship qualifications; and
3. All degrees (Bachelor’s, Master’s, Doctorate)
This distinction allows us to identify up to four separate points of educational attainment for each
individual (depending on cohort and attrition). Our focus lies on those where the highest level or
education drops. Whilst we don’t know the reasons for the vast discrepancy of the data (i.e. an
individual moving from PhD to primary then back to TAFE), it seemed sensible to utilise all the data
available for each individual and “smooth out” educational attainment to arrive at an imputed variable.
We therefore designed the following imputation rules: we ignore cases where individuals solely retain
or increase their skills, but focus on individuals who at some stage report a lower level of education
than before. Now, if we have four observations of education for an individual, there are two options
• if there are three of the same level, we smooth out the only inconsistent one with these three
• if we have less than three of the same level, we cannot determine the highest level of
education with much certainty, so we are forced to drop them.
If we have three observations of education for an individual, there are two options
• if there are two of the same level, we smooth out the only inconsistent one with the other two
• if there is no majority for one level of education, we are forced to drop them.
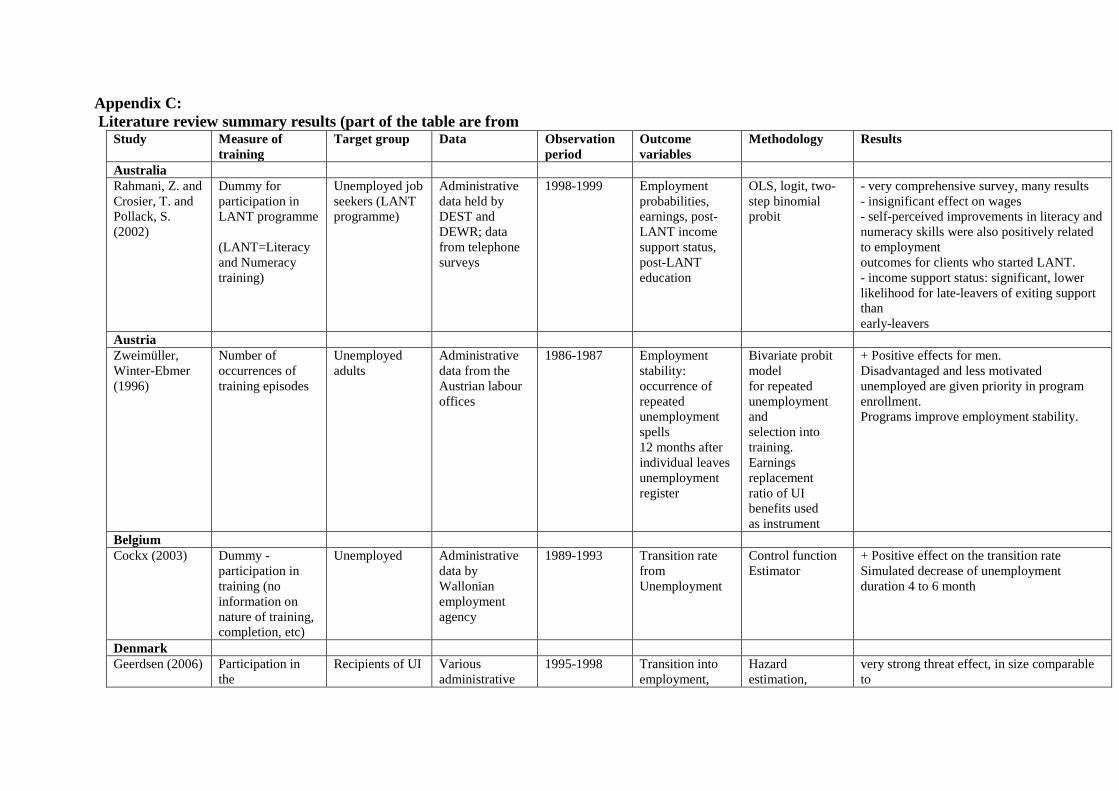
Appendix C: Literature review summary results (part of the table are from
Study Measure of training
Target group Data Observation period
Outcome variables
Methodology Results
Australia Rahmani, Z. and Crosier, T. and Pollack, S. (2002)
Dummy for participation in LANT programme (LANT=Literacy and Numeracy training)
Unemployed job seekers (LANT programme)
Administrative data held by DEST and DEWR; data from telephone surveys
1998-1999 Employment probabilities, earnings, post-LANT income support status, post-LANT education
OLS, logit, two-step binomial probit
- very comprehensive survey, many results - insignificant effect on wages - self-perceived improvements in literacy and numeracy skills were also positively related to employment outcomes for clients who started LANT. - income support status: significant, lower likelihood for late-leavers of exiting support than early-leavers
Austria Zweimüller, Winter-Ebmer (1996)
Number of occurrences of training episodes
Unemployed adults
Administrative data from the Austrian labour offices
1986-1987 Employment stability: occurrence of repeated unemployment spells 12 months after individual leaves unemployment register
Bivariate probit model for repeated unemployment and selection into training. Earnings replacement ratio of UI benefits used as instrument
+ Positive effects for men. Disadvantaged and less motivated unemployed are given priority in program enrollment. Programs improve employment stability.
Belgium Cockx (2003) Dummy -
participation in training (no information on nature of training, completion, etc)
Unemployed Administrative data by Wallonian employment agency
1989-1993 Transition rate from Unemployment
Control function Estimator
+ Positive effect on the transition rate Simulated decrease of unemployment duration 4 to 6 month
Denmark Geerdsen (2006) Participation in
the Recipients of UI Various
administrative 1995-1998 Transition into
employment, Hazard estimation,
very strong threat effect, in size comparable to
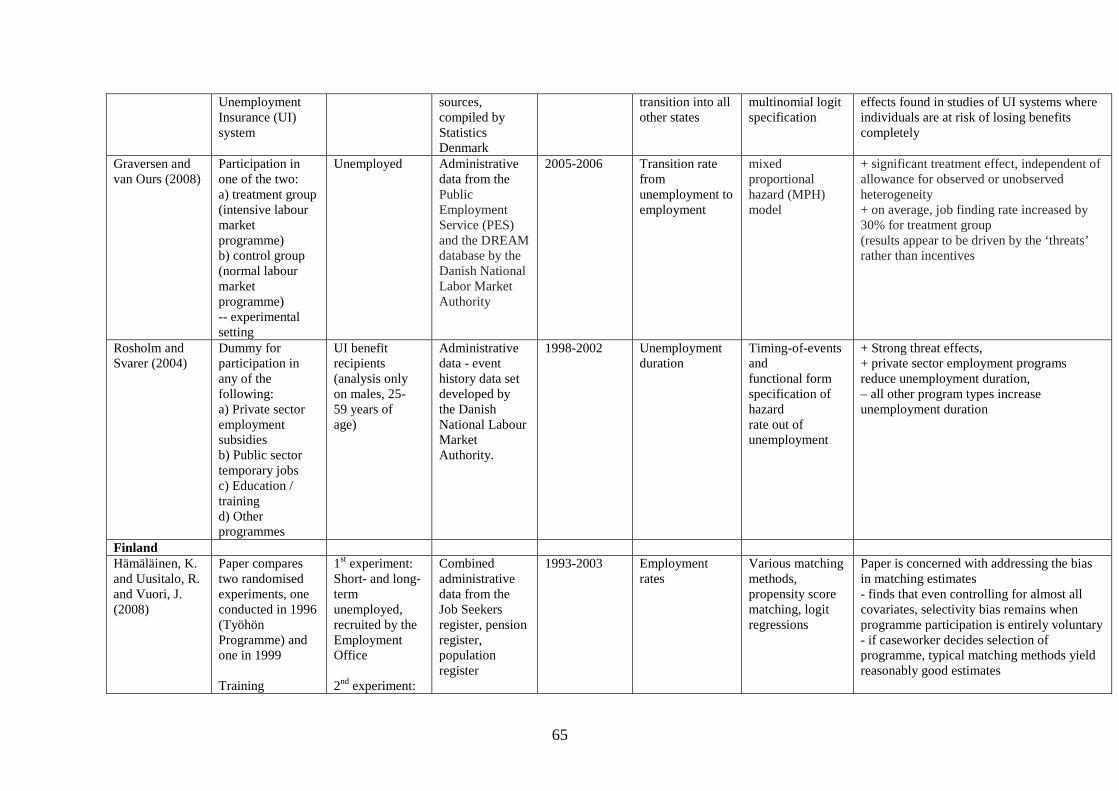
65
Unemployment Insurance (UI) system
sources, compiled by Statistics Denmark
transition into all other states
multinomial logit specification
effects found in studies of UI systems where individuals are at risk of losing benefits completely
Graversen and van Ours (2008)
Participation in one of the two: a) treatment group (intensive labour market programme) b) control group (normal labour market programme) -- experimental setting
Unemployed Administrative data from the Public Employment Service (PES) and the DREAM database by the Danish National Labor Market Authority
2005-2006 Transition rate from unemployment to employment
mixed proportional hazard (MPH) model
+ significant treatment effect, independent of allowance for observed or unobserved heterogeneity + on average, job finding rate increased by 30% for treatment group (results appear to be driven by the ‘threats’ rather than incentives
Rosholm and Svarer (2004)
Dummy for participation in any of the following: a) Private sector employment subsidies b) Public sector temporary jobs c) Education / training d) Other programmes
UI benefit recipients (analysis only on males, 25- 59 years of age)
Administrative data - event history data set developed by the Danish National Labour Market Authority.
1998-2002 Unemployment duration
Timing-of-events and functional form specification of hazard rate out of unemployment
+ Strong threat effects, + private sector employment programs reduce unemployment duration, – all other program types increase unemployment duration
Finland Hämäläinen, K. and Uusitalo, R. and Vuori, J. (2008)
Paper compares two randomised experiments, one conducted in 1996 (Työhön Programme) and one in 1999 Training
1st experiment: Short- and long-term unemployed, recruited by the Employment Office 2nd experiment:
Combined administrative data from the Job Seekers register, pension register, population register
1993-2003 Employment rates
Various matching methods, propensity score matching, logit regressions
Paper is concerned with addressing the bias in matching estimates - finds that even controlling for almost all covariates, selectivity bias remains when programme participation is entirely voluntary - if caseworker decides selection of programme, typical matching methods yield reasonably good estimates
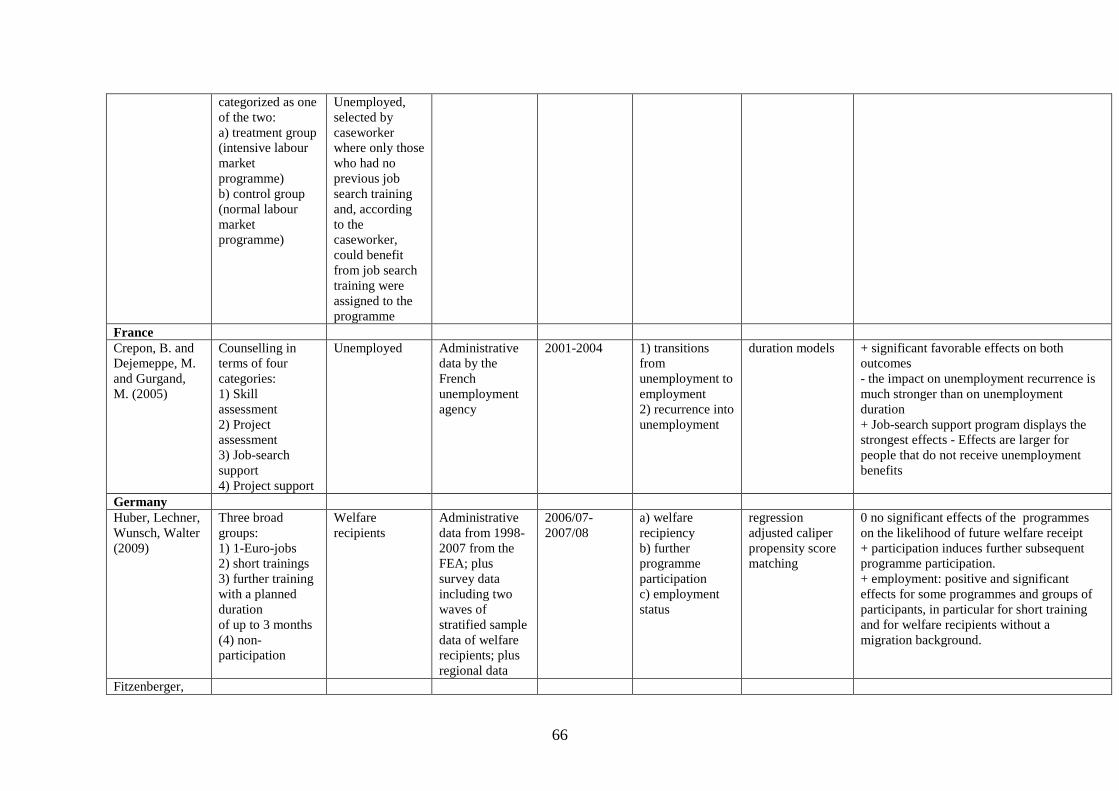
66
categorized as one of the two: a) treatment group (intensive labour market programme) b) control group (normal labour market programme)
Unemployed, selected by caseworker where only those who had no previous job search training and, according to the caseworker, could benefit from job search training were assigned to the programme
France Crepon, B. and Dejemeppe, M. and Gurgand, M. (2005)
Counselling in terms of four categories: 1) Skill assessment 2) Project assessment 3) Job-search support 4) Project support
Unemployed Administrative data by the French unemployment agency
2001-2004 1) transitions from unemployment to employment 2) recurrence into unemployment
duration models + significant favorable effects on both outcomes - the impact on unemployment recurrence is much stronger than on unemployment duration + Job-search support program displays the strongest effects - Effects are larger for people that do not receive unemployment benefits
Germany Huber, Lechner, Wunsch, Walter (2009)
Three broad groups: 1) 1-Euro-jobs 2) short trainings 3) further training with a planned duration of up to 3 months (4) non-participation
Welfare recipients
Administrative data from 1998-2007 from the FEA; plus survey data including two waves of stratified sample data of welfare recipients; plus regional data
2006/07- 2007/08
a) welfare recipiency b) further programme participation c) employment status
regression adjusted caliper propensity score matching
0 no significant effects of the programmes on the likelihood of future welfare receipt + participation induces further subsequent programme participation. + employment: positive and significant effects for some programmes and groups of participants, in particular for short training and for welfare recipients without a migration background.
Fitzenberger,
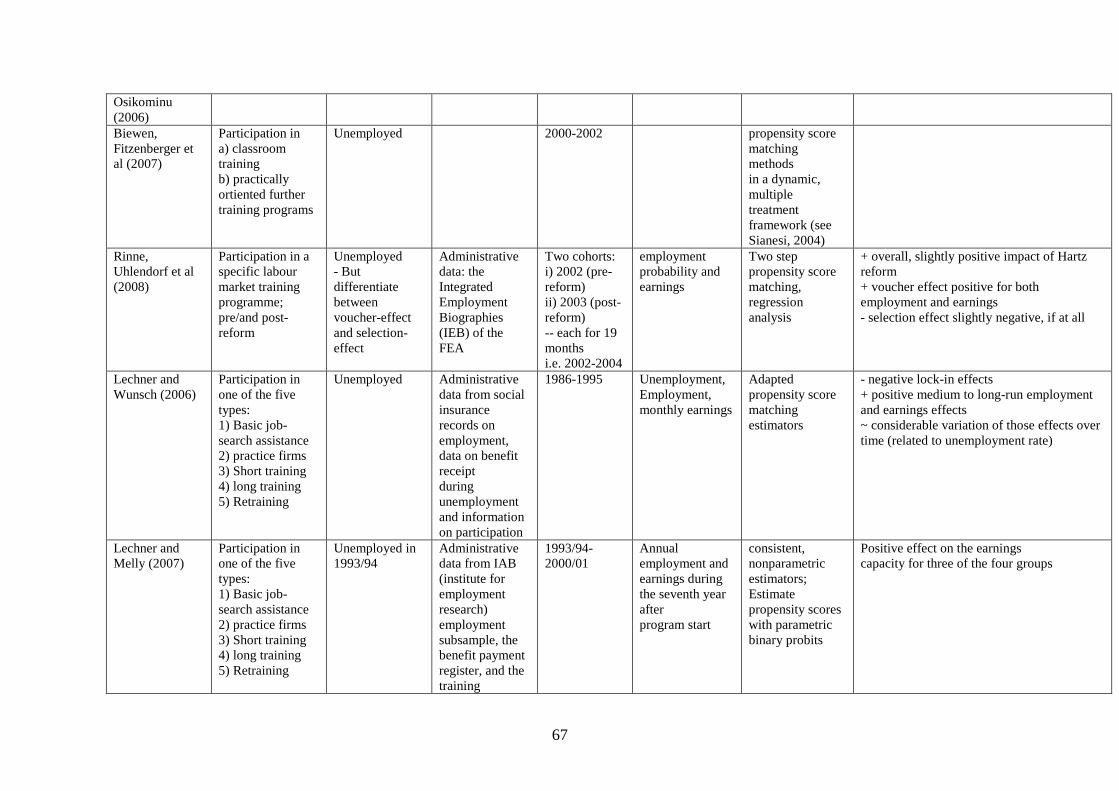
67
Osikominu (2006) Biewen, Fitzenberger et al (2007)
Participation in a) classroom training b) practically ortiented further training programs
Unemployed 2000-2002 propensity score matching methods in a dynamic, multiple treatment framework (see Sianesi, 2004)
Rinne, Uhlendorf et al (2008)
Participation in a specific labour market training programme; pre/and post-reform
Unemployed - But differentiate between voucher-effect and selection-effect
Administrative data: the Integrated Employment Biographies (IEB) of the FEA
Two cohorts: i) 2002 (pre-reform) ii) 2003 (post-reform) -- each for 19 months i.e. 2002-2004
employment probability and earnings
Two step propensity score matching, regression analysis
+ overall, slightly positive impact of Hartz reform + voucher effect positive for both employment and earnings - selection effect slightly negative, if at all
Lechner and Wunsch (2006)
Participation in one of the five types: 1) Basic job-search assistance 2) practice firms 3) Short training 4) long training 5) Retraining
Unemployed Administrative data from social insurance records on employment, data on benefit receipt during unemployment and information on participation
1986-1995 Unemployment, Employment, monthly earnings
Adapted propensity score matching estimators
- negative lock-in effects + positive medium to long-run employment and earnings effects ~ considerable variation of those effects over time (related to unemployment rate)
Lechner and Melly (2007)
Participation in one of the five types: 1) Basic job-search assistance 2) practice firms 3) Short training 4) long training 5) Retraining
Unemployed in 1993/94
Administrative data from IAB (institute for employment research) employment subsample, the benefit payment register, and the training
1993/94-2000/01
Annual employment and earnings during the seventh year after program start
consistent, nonparametric estimators; Estimate propensity scores with parametric binary probits
Positive effect on the earnings capacity for three of the four groups
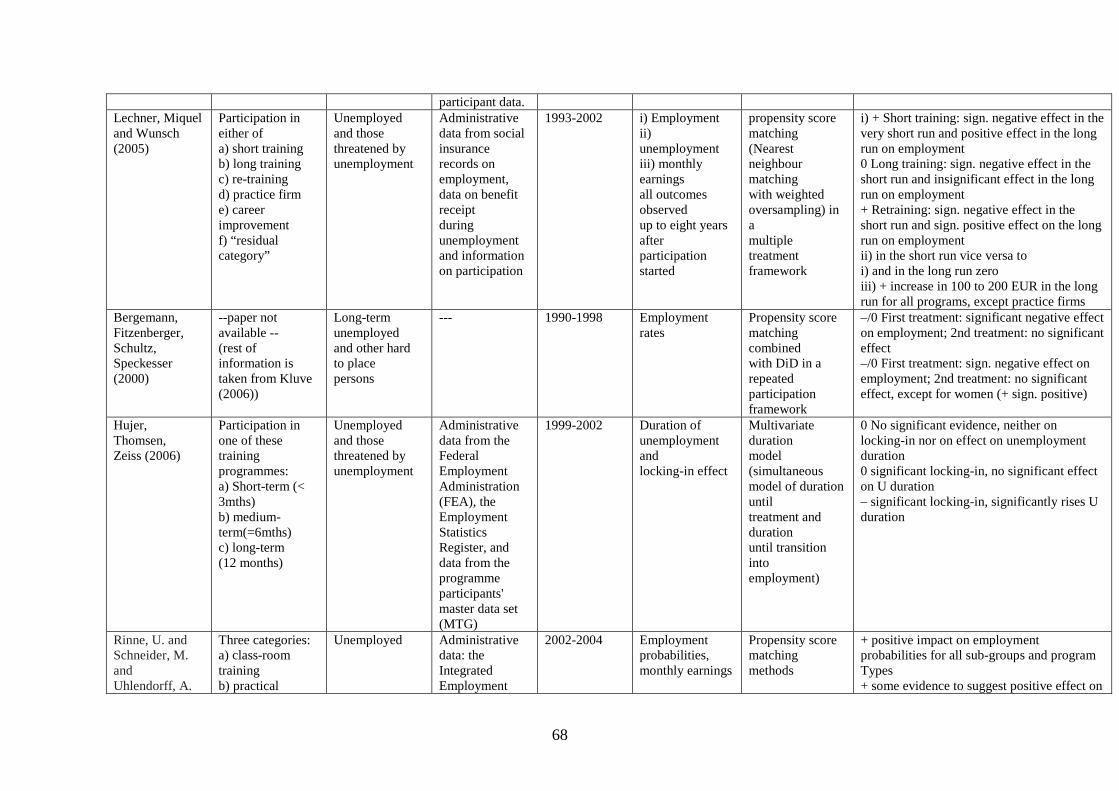
68
participant data. Lechner, Miquel and Wunsch (2005)
Participation in either of a) short training b) long training c) re-training d) practice firm e) career improvement f) “residual category”
Unemployed and those threatened by unemployment
Administrative data from social insurance records on employment, data on benefit receipt during unemployment and information on participation
1993-2002 i) Employment ii) unemployment iii) monthly earnings all outcomes observed up to eight years after participation started
propensity score matching (Nearest neighbour matching with weighted oversampling) in a multiple treatment framework
i) + Short training: sign. negative effect in the very short run and positive effect in the long run on employment 0 Long training: sign. negative effect in the short run and insignificant effect in the long run on employment + Retraining: sign. negative effect in the short run and sign. positive effect on the long run on employment ii) in the short run vice versa to i) and in the long run zero iii) + increase in 100 to 200 EUR in the long run for all programs, except practice firms
Bergemann, Fitzenberger, Schultz, Speckesser (2000)
--paper not available -- (rest of information is taken from Kluve (2006))
Long-term unemployed and other hard to place persons
--- 1990-1998 Employment rates
Propensity score matching combined with DiD in a repeated participation framework
–/0 First treatment: significant negative effect on employment; 2nd treatment: no significant effect –/0 First treatment: sign. negative effect on employment; 2nd treatment: no significant effect, except for women (+ sign. positive)
Hujer, Thomsen, Zeiss (2006)
Participation in one of these training programmes: a) Short-term (< 3mths) b) medium-term(=6mths) c) long-term (12 months)
Unemployed and those threatened by unemployment
Administrative data from the Federal Employment Administration (FEA), the Employment Statistics Register, and data from the programme participants' master data set (MTG)
1999-2002 Duration of unemployment and locking-in effect
Multivariate duration model (simultaneous model of duration until treatment and duration until transition into employment)
0 No significant evidence, neither on locking-in nor on effect on unemployment duration 0 significant locking-in, no significant effect on U duration – significant locking-in, significantly rises U duration
Rinne, U. and Schneider, M. and Uhlendorff, A.
Three categories: a) class-room training b) practical
Unemployed Administrative data: the Integrated Employment
2002-2004 Employment probabilities, monthly earnings
Propensity score matching methods
+ positive impact on employment probabilities for all sub-groups and program Types + some evidence to suggest positive effect on
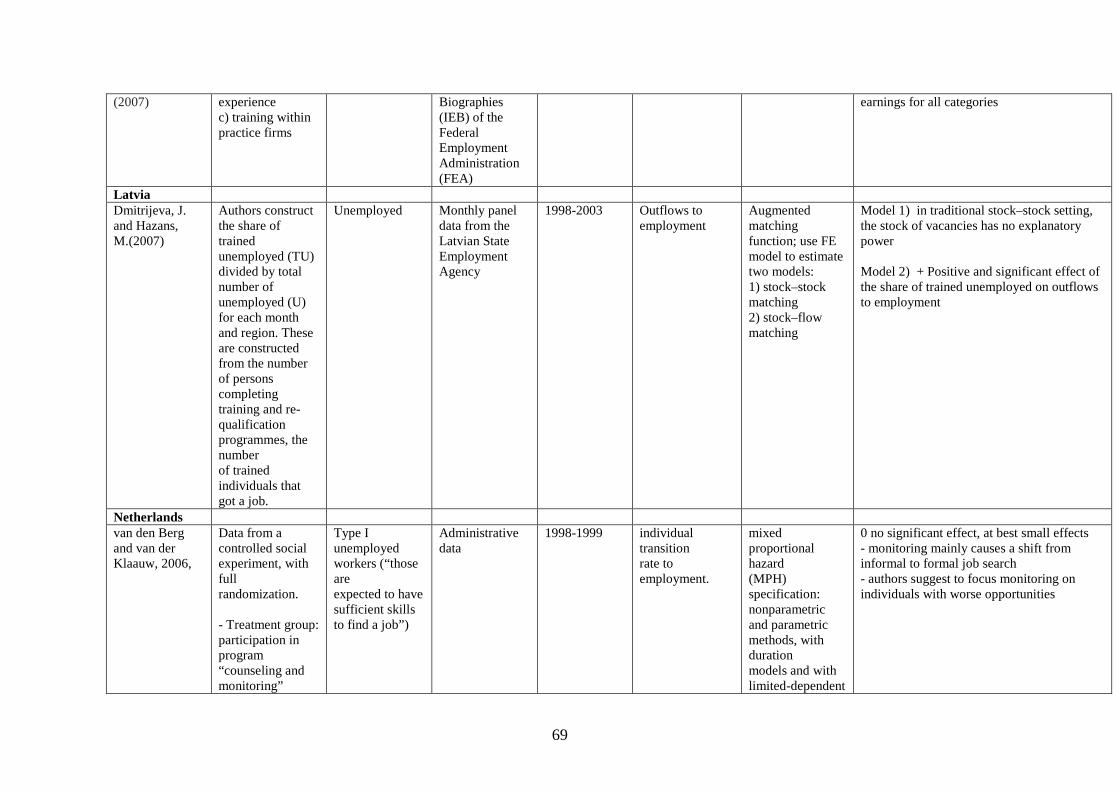
69
(2007) experience c) training within practice firms
Biographies (IEB) of the Federal Employment Administration (FEA)
earnings for all categories
Latvia Dmitrijeva, J. and Hazans, M.(2007)
Authors construct the share of trained unemployed (TU) divided by total number of unemployed (U) for each month and region. These are constructed from the number of persons completing training and re-qualification programmes, the number of trained individuals that got a job.
Unemployed Monthly panel data from the Latvian State Employment Agency
1998-2003 Outflows to employment
Augmented matching function; use FE model to estimate two models: 1) stock–stock matching 2) stock–flow matching
Model 1) in traditional stock–stock setting, the stock of vacancies has no explanatory power Model 2) + Positive and significant effect of the share of trained unemployed on outflows to employment
Netherlands van den Berg and van der Klaauw, 2006,
Data from a controlled social experiment, with full randomization. - Treatment group: participation in program “counseling and monitoring”
Type I unemployed workers (“those are expected to have sufficient skills to find a job”)
Administrative data
1998-1999 individual transition rate to employment.
mixed proportional hazard (MPH) specification: nonparametric and parametric methods, with duration models and with limited-dependent
0 no significant effect, at best small effects - monitoring mainly causes a shift from informal to formal job search - authors suggest to focus monitoring on individuals with worse opportunities
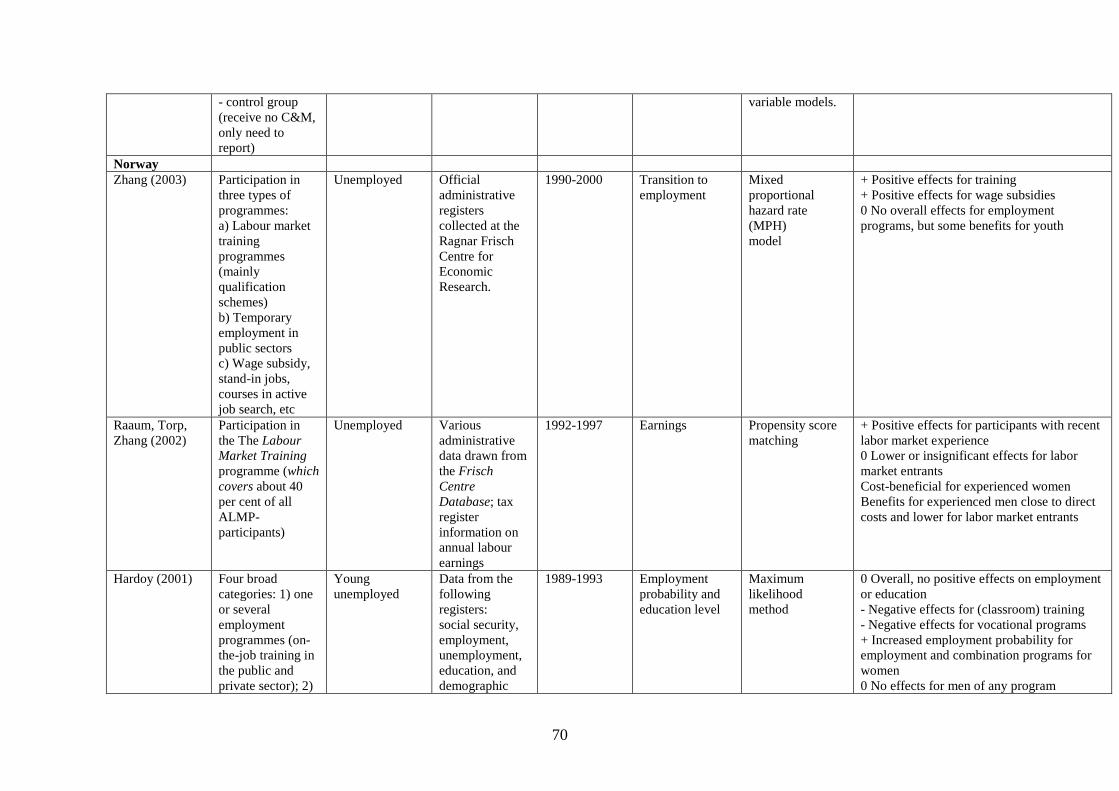
70
- control group (receive no C&M, only need to report)
variable models.
Norway Zhang (2003) Participation in
three types of programmes: a) Labour market training programmes (mainly qualification schemes) b) Temporary employment in public sectors c) Wage subsidy, stand-in jobs, courses in active job search, etc
Unemployed Official administrative registers collected at the Ragnar Frisch Centre for Economic Research.
1990-2000 Transition to employment
Mixed proportional hazard rate (MPH) model
+ Positive effects for training + Positive effects for wage subsidies 0 No overall effects for employment programs, but some benefits for youth
Raaum, Torp, Zhang (2002)
Participation in the The Labour Market Training programme (which covers about 40 per cent of all ALMP-participants)
Unemployed Various administrative data drawn from the Frisch Centre Database; tax register information on annual labour earnings
1992-1997 Earnings Propensity score matching
+ Positive effects for participants with recent labor market experience 0 Lower or insignificant effects for labor market entrants Cost-beneficial for experienced women Benefits for experienced men close to direct costs and lower for labor market entrants
Hardoy (2001) Four broad categories: 1) one or several employment programmes (on-the-job training in the public and private sector); 2)
Young unemployed
Data from the following registers: social security, employment, unemployment, education, and demographic
1989-1993 Employment probability and education level
Maximum likelihood method
0 Overall, no positive effects on employment or education - Negative effects for (classroom) training - Negative effects for vocational programs + Increased employment probability for employment and combination programs for women 0 No effects for men of any program
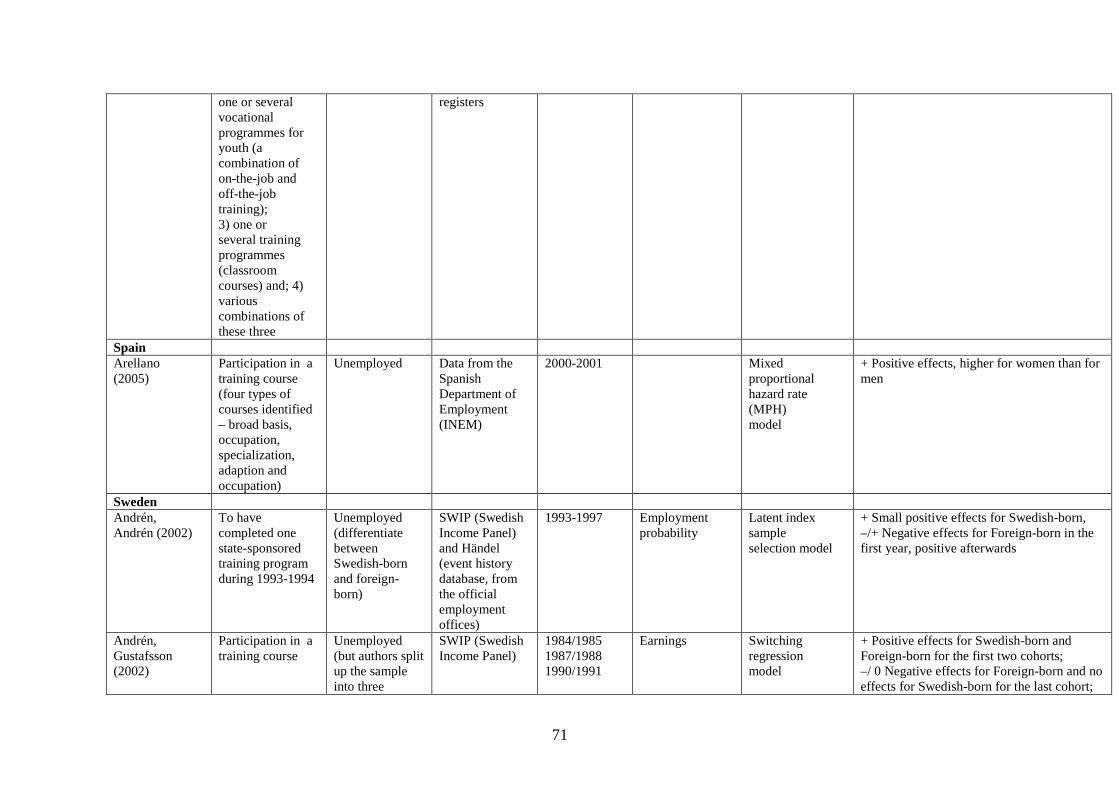
71
one or several vocational programmes for youth (a combination of on-the-job and off-the-job training); 3) one or several training programmes (classroom courses) and; 4) various combinations of these three
registers
Spain Arellano (2005)
Participation in a training course (four types of courses identified – broad basis, occupation, specialization, adaption and occupation)
Unemployed Data from the Spanish Department of Employment (INEM)
2000-2001 Mixed proportional hazard rate (MPH) model
+ Positive effects, higher for women than for men
Sweden Andrén, Andrén (2002)
To have completed one state-sponsored training program during 1993-1994
Unemployed (differentiate between Swedish-born and foreign-born)
SWIP (Swedish Income Panel) and Händel (event history database, from the official employment offices)
1993-1997 Employment probability
Latent index sample selection model
+ Small positive effects for Swedish-born, –/+ Negative effects for Foreign-born in the first year, positive afterwards
Andrén, Gustafsson (2002)
Participation in a training course
Unemployed (but authors split up the sample into three
SWIP (Swedish Income Panel)
1984/1985 1987/1988 1990/1991
Earnings Switching regression model
+ Positive effects for Swedish-born and Foreign-born for the first two cohorts; –/ 0 Negative effects for Foreign-born and no effects for Swedish-born for the last cohort;
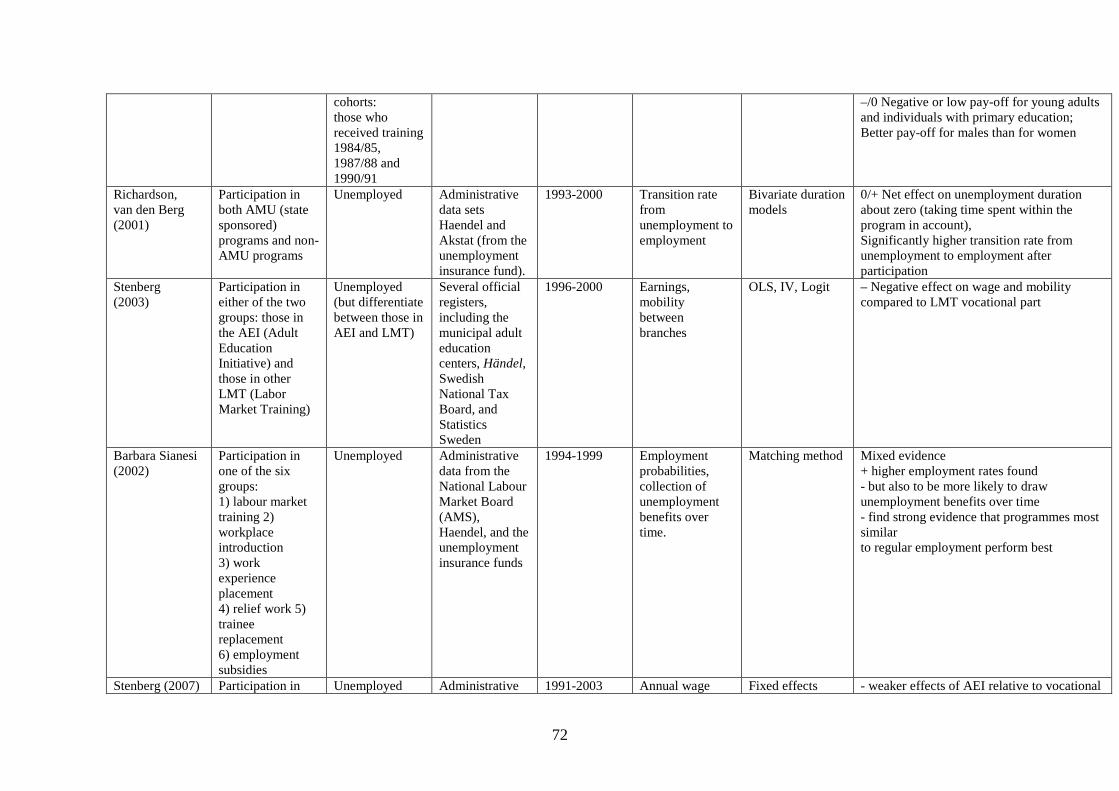
72
cohorts: those who received training 1984/85, 1987/88 and 1990/91
–/0 Negative or low pay-off for young adults and individuals with primary education; Better pay-off for males than for women
Richardson, van den Berg (2001)
Participation in both AMU (state sponsored) programs and non-AMU programs
Unemployed Administrative data sets Haendel and Akstat (from the unemployment insurance fund).
1993-2000 Transition rate from unemployment to employment
Bivariate duration models
0/+ Net effect on unemployment duration about zero (taking time spent within the program in account), Significantly higher transition rate from unemployment to employment after participation
Stenberg (2003)
Participation in either of the two groups: those in the AEI (Adult Education Initiative) and those in other LMT (Labor Market Training)
Unemployed (but differentiate between those in AEI and LMT)
Several official registers, including the municipal adult education centers, Händel, Swedish National Tax Board, and Statistics Sweden
1996-2000 Earnings, mobility between branches
OLS, IV, Logit – Negative effect on wage and mobility compared to LMT vocational part
Barbara Sianesi (2002)
Participation in one of the six groups: 1) labour market training 2) workplace introduction 3) work experience placement 4) relief work 5) trainee replacement 6) employment subsidies
Unemployed Administrative data from the National Labour Market Board (AMS), Haendel, and the unemployment insurance funds
1994-1999 Employment probabilities, collection of unemployment benefits over time.
Matching method Mixed evidence + higher employment rates found - but also to be more likely to draw unemployment benefits over time - find strong evidence that programmes most similar to regular employment perform best
Stenberg (2007) Participation in Unemployed Administrative 1991-2003 Annual wage Fixed effects - weaker effects of AEI relative to vocational
73
the Adult Education Initiative (AEI)
(comparison between those in AEI and LMT)
data from the total population register, the register of adult education, and Haendel
earnings regressions Training (LMT) on earnings - no differences between programmes for age group 43-55 - results warrant more careful targeting
Stenberg (2005) Participation in the Adult Education Initiative (AEI) (i.e. started program, but not necessarily completed it)
Unemployed (comparison between those in AEI and LMT)
Administrative data from the register of adult education, and Haendel, merged at Statistics Sweden (SCB).
1997-2002 Incidence of Unemployment, Unemployment duration
Bivariate probit model, Powell IV
0 Decreased incidence of unemployment, but increased unemployment duration compared to LMT
Richardson, K. and G. J. v. d. Berg
Participation in the AMU (employment training program)
Unemployed Administrative data sets HÄNDEL and AKSTAT (from the unemployment insurance fund)
1993-2000 transition rate from unemployment to employment
bivariate duration models
+ significantly positive effect on exit to work after exiting the program - magnitude is very large shortly after leaving the course but diminishes afterwards - taking account of the time spent in the program, the net effect of participation in the program on the mean unemployment duration is close to zero
Stenberg and Westerlund (2008)
Participation in either AEI or LMT (i.e. started program, but not necessarily completed it)
Long-term unemployed either in i) AEI ii) LMT iii) open unemployment
Administrative data sets by Statistics Sweden and AMS.
Data from 1996-2001
Annual wage earnings
OLS; also perform “backcasting” OLS regressions
i vs. iii) those with more than 1 semester of adult education experienced an increase in annual wage earnings compared with those who remained in open unemployment. 0 at the compulsory level no significant effects are found - LMT preparatory training had positive effects on wage earnings but these effects were smaller thanto those achieved by LMT vocational training
Albrecht, van den Berg, and Vroman,(2005)
Participation in “Knowledge Life” (KL) programme
Low skilled unemployed
Administrative data sets RAMS (for income and wealth), HAENDEL, AKSTAT,
1990-2000 i) employment ii) annual income iii) labour market equilibrium
probit; fixed effect methods allowing for treatment effect heterogeneity; equilibrium search model with
i)+ii) 0 KL has no significant effect on average income and employment of women i) + KL participation has significantly positive employment effect for young men ii) 0 no significant effect on average annual income iii) program generates an equilibrium
74
KOMVUX (for participation in any adult education program)
heterogeneous worker skills for iii)
response of the skill distribution of vacancies towards the higher skill
Sianesi (2004) matching methods
Switzerland Rafael Lalive, Jan C. van Ours and Josef Zweimueller (2005)
Don’t look at training but at effect of sanctions and warnings
Unemployment insurance recipients
unemployment insurance register
1997-1999 Re-employment rates
Bivariate duration model
+ Substantial and significant effct of both sanctions and warnings
Rafael Lalive, Jan C. van Ours and Josef Zweimueller (2008)
Investigate four types of programmes: a) basic training (PC, language, job) b) advanced training c) employment programmes d) subsidized jobs
Unemployed Unemployment data: administrative records of the State Secretariat for Economic Affairs (AVAM and ASAL databases); these are matched with data from social security records social security records (AHV data).
Dec. 1997 – May 1999
Length of unemployment
a) matching method b) proportional hazard model with time-varying treatment effects c) a bivariate MPH-model where regular jobs and ALMPs are competing destinations
a+b) subsidising jobs has highest positive effects on the transition rate c) allowing for selectivity even the treatment effect of subsidised jobs fades away d) matching approach and the timing-of-events approach generate different treatment effects once we allow unobserved heterogeneity to influence the inflow into ALMPs.
United States Leela Hebbar (2006)
Dummy for participation in ITG (Individual Training Grant) training programme
Unemployed eligible for UI - two sub-groups studied (high school dropouts and women enrolled in engineering or computer
Administrative data obtained from the New Jersey Department of Labor and Workforce Development; merged with
1995-1999 Re-employment rates, wages
difference-in-difference wage model combined with an employment regression model
- ITG participation has a positive impact on re-employment beginning in the seventh quarter after claiming UI - type of training matters - generally, training has no impact on wage recovery - the impact on re-employment for high school dropouts varies by race
75
programming) wage data from New Jersey’s unemployment insurance wage record system
Multiple countries assessments Martin and Grubb (2001) (OECD countries)
1985-2000 Paper i) surveys the literature on the evaluation of ALMP ii) uses country reviews and analytical studies on active and passive ALMP
Kluve, J. (2006) Dummies for 1) direct employment 2) private sector inventive scheme 3) services and sanctions 4) youth programs
Other evaluation studies
Range between 1984 and 2004
Program success, (binomial: positive and negative; multinomial: including neutral)
Binomial probit and multinomial probit regressions (meta-analysis)
- Once program type is taken into account, there is little systematic relationship between program effectiveness and a host of other contextual factors 0+ traditional training programs are found to have a modest positive impact on employment rates. + Relative to these programs, private sector incentive programs and Services and Sanctions show a significantly better performance - target group seems to matter,
Arulampalam, Booth and Bryan (2006) (Austria, Belgium, Britain, Denmark Finland, France, Ireland, Italy, Netherlands, Spain)
Construct a variable measuring the cumulative count of completed training events since the 1st wave of the sample
Employed private sector males aged 25-54
European Community Household Panel (ECHP): British data adapted using BNHS and BHPS
1994-1999 Hourly wages Authors use OLS and quantile-regression techniques to estimate the relationship between work-related training and wages
OLS shows considerable inter-country differences; QR analysis finds that the training effect is uniform across the conditional wage distribution within a country