Embed Size (px)
Citation preview
Final Report to:
El Paso Electric Company for
Eddy County Gas Turbine Fatal Flaw Study Prepared by:
Robert Laffen Einar Larsen Richard Piwko Elizabeth Pratico Conrad St. Pierre GE Power Systems Energy Consulting
November 6, 2001
GE Power Systems Energy Consulting D:\AAWork\Interconnecting Generating Companys\Stu
i dies Posted on the OASIS\Generator Interconnection Study - 80 MW at Eddy County 345.doc

GE Power Systems Energy Consulting ii D:\AAWork\Interconnecting Generating Companys\Studies Posted on the OASIS\Generator Interconnection Study - 80 MW at Eddy County 345.doc
Foreword
This document was prepared by General Electric International, Inc. through its Power Systems Energy Consulting (PSEC) group in Schenectady, NY. It is submitted to El Paso Electric Company. Technical and commercial questions and any correspondence concerning this document should be referred to:
Robert Laffen Power Systems Energy Consulting General Electric International, Inc.
Building 2, Room 636 Schenectady, New York 12345
Phone: (518) 385-1229 Fax: (518) 385-9529
E-mail: [email protected]

GE Power Systems Energy Consulting iii D:\AAWork\Interconnecting Generating Companys\Studies Posted on the OASIS\Generator Interconnection Study - 80 MW at Eddy County 345.doc
Legal Notice
This report was prepared by General Electric International, Inc.’s Power Systems Energy Consulting (PSEC) as an account of work sponsored by El Paso Electric Company (EPE). Neither EPE nor PSEC, nor any person acting on behalf of either:
1. Makes any warranty or representation, expressed or implied, with respect to the use of any information contained in this report, or that the use of any information, apparatus, method, or process disclosed in the report may not infringe privately owned rights.
2. Assumes any liabilities with respect to the use of or for damage resulting from the use of any information, apparatus, method, or process disclosed in this report.

Table of Contents
1. INTRODUCTION ............................................................................................................................1.1
2. TASK 1 - PERFORMANCE EVALUATIONS..............................................................................2.1
2.1 STEADY-STATE ANALYSIS..............................................................................................................2.1 2.1.1 System Conditions ................................................................................................................2.1 2.1.2 Performance Criteria ...........................................................................................................2.1 2.1.3 Thermal Analysis ..................................................................................................................2.2 2.1.4 Voltage Analysis ...................................................................................................................2.7
2.2 QV EVALUATION............................................................................................................................2.9 2.3 TRANSIENT STABILITY ANALYSIS.................................................................................................2.11 2.4 TRANSIENT SWITCHING SURGE EVALUATION...............................................................................2.17 2.5 REMEDIATIONS FOR CALIENTE-AMRAD OUTAGE .........................................................................2.18 2.6 TRANSFER-TRIP OF EDDY COUNTY PLANT ...................................................................................2.18
3. TASK 2 - EDDY COUNTY INTERACTIONS WITH THE AMRAD SVC ...............................3.1
3.1 HARMONIC ANALYSIS ....................................................................................................................3.1 3.2 TORSIONAL SCREENING..................................................................................................................3.6
3.2.1 Operation with 345kV line in service ...................................................................................3.6 3.2.2 Operation with generator radial on HVDC..........................................................................3.6
3.3 CONTROL INTERACTIONS................................................................................................................3.7 3.3.1 Existing Operating Strategy .................................................................................................3.7 3.3.2 Reactive coordination with new plant ..................................................................................3.7 3.3.3 Generator radial on HVDC..................................................................................................3.7
3.4 REACTIONS OF THE HVDC TERMINAL............................................................................................3.8 3.4.1 Trip of HVDC with generators in operation.........................................................................3.8 3.4.2 Trip of Eddy County – AMRAD 345kV Line with generators in operation ........................3.10
4. CONCLUSIONS ...............................................................................................................................4.1
APPENDIX A. STEADY STATE RESULTS……………...……...………………….……..ATTACHED
APPENDIX B. QV REACTIVE MARGIN CURVES…………………………………..…ATTACHED
APPENDIX C. TRANSIENT SWITCHING SURGE RESULTS…………………………ATTACHED
APPENDIX D. HARMONIC STUDY COMPUTER OUTPUT EXPLANATION .………………D.1
APPENDIX E. ADDITIONAL ANALYSIS BY EPE ………….. …………………………ATTACHED
APPENDIX F. COST ESTIMATES ……………………………..…………………………ATTACHED
GE Power Systems Energy Consulting iv D:\AAWork\Interconnecting Generating Companys\Studies Posted on the OASIS\Generator Interconnection Study - 80 MW at Eddy County 345.doc
1. Introduction
El Paso Electric Company (EPE) is evaluating the parallel installation of two (2) 40MW simple-cycle gas turbine generators connected to the 345 kV side of the Eddy County back-to-back HVDC Terminal. General Electric’s Power Systems Energy Consulting group (PSEC) performed feasibility studies for this application for EPE.
One power flow/stability base case, developed by EPE to represent the 2003 Heavy Summer (HS) system, has been used in this study. The fundamental study approach involved two separate activities.
• First, an abbreviated series of performance simulations has been conducted to determine the impact of the proposed power plant on thermal, voltage, QV, transient stability and switching transient performance of the transmission system.
• Secondly, several additional factors have been evaluated to identify any potential impacts due to the proximity of the point of interconnection to the Eddy County HVDC Terminal and the Amrad Static Var Compensator (SVC). This interaction analysis identified potential mitigation measures for the major impacts of the generators on the HVDC Terminal/SVC.
The objective of this effort was to identify potential major impacts associated with commissioning of the proposed plant and to provide the developers with a preliminary view of the efforts, potential required modifications, and potential costs that would be needed to achieve a successful integration of the plant. Based on these preliminary indications of potential project impacts and costs, the developer can then make an informed decision whether to go forward with a more detailed engineering analysis and design effort. Results of the performance simulations have been evaluated against technical constraints in the operation of the Eddy County HVDC Terminal and WSCC planning criteria.
GE Power Systems Energy Consulting 1.1 D:\AAWork\Interconnecting Generating Companys\Studies Posted on the OASIS\Generator Interconnection Study - 80 MW at Eddy County 345.doc

GE Power Systems Energy Consulting 2.1 D:\AAWork\Interconnecting Generating Companys\Studies Posted on the OASIS\Generator Interconnection Study - 80 MW at Eddy County 345.doc
2. Task 1 - Performance Evaluations
2.1 Steady-State Analysis
2.1.1 System Conditions
Power flow cases representing the 2003 Heavy Summer (HS) system condition were obtained from EPE for use in this analysis.
A total of four base cases were included in this analysis, representing the following system conditions:
• Benchmark Case: 2003 Heavy Summer condition, without the Eddy County GTs
• Scenario 1: 2003 Heavy Summer condition, with the Eddy County GTs delivering the maximum output to California, by decreasing the California generation.
• Scenario 2: 2003 Heavy Summer condition, with the Eddy County GTs delivering the maximum output to EPE, by decreasing the local EPE generation.
• Scenario 3: 2003 Heavy Summer condition, with the Eddy County HVDC Terminal out of service. The Eddy County GTs deliver the maximum output to EPE, by decreasing the local EPE generation.
In all cases, the modeling of the Amrad 115/345 kV transformer was modified to include the Amrad SVC on the third winding, at the 13kV voltage level. In the cases with the Eddy County HVDC terminal in service, a full HVDC representation was included, and the flow on the HVDC line was increased to 220MW, in order to simulate the most highly stressed condition.
2.1.2 Performance Criteria
Each of the power flow base cases has been examined under both normal and single contingency conditions. The contingency list consisted of all lines and transformers with base voltages of 100kV and above in EPE (area 75) and the neighboring areas, including Los Alamos (area 76), PEGT (77), PNM (78), and TNMP (79). In all, nearly 400 contingencies were simulated.
No multiple contingencies were included. For each contingency studied, all regulating equipment (transformer controls and switched shunts) was fixed at pre-contingency positions. All buses, lines, and transformers with base voltages of 69kV and above have been monitored in EPE (area 75). All buses, lines, and transformers with base voltages of 100kV and above have been monitored in Los Alamos (area 76), PEGT (77), PNM (78), and TNMP (79).
The thermal criteria used to evaluate each normal and post-contingency condition was as follows: Pre-contingency flows on lines and transformers must remain at or below the

normal rating of the element (rating 1), and post-contingency flows on network elements must remain at or below the emergency rating (rating 2). Flows above 100% of an element’s rating are considered violations. These performance criteria are summarized in Table 2-1 and Table 2-2.
Table 2-1. Branch Loading Performance Criteria.
Branch Loading
Normal Conditions
loading < normal rating
Contingency Conditions
loading < long term emergency (LTE) rating
Table 2-2. Bus Voltage Performance Criteria.
Bus Voltage
Normal Conditions
0.95pu < voltage < 1.05pu
Contingency Conditions
0.925pu < voltage < 1.05pu
Tabular results are presented below to show criteria violations, as defined above, present in each scenario.
2.1.3 Thermal Analysis
Violations of the branch loading criteria, as defined above, have been identified and summarized in tabular form for each scenario. All comparisons are made on a relative performance basis (e.g. the change in line loading from the benchmark system to that with the proposed plant, stated in terms of percent of line rating) as well as an absolute basis (i.e., the percentage of overload or outside of voltage criteria). Results will be presented to show which, if any, thermal or voltage violations are caused or exacerbated by the proposed generation.
Table 2-3 shows a cross-tabulation of the thermal violations that were observed in Scenario 1, which includes the new generation delivering it's maximum output to California. This table shows the from-bus, to-bus, and circuit identifier for each overloaded element, as well as the element type (line or transformer). Element ratings are shown in units of amperes for lines and MVA for transformers. The per unit loading on the line, based on the element rating, is shown for both Scenario 1, and the benchmark system. The next column indicates the pu loading change caused by the new generation in this scenario. The last column lists the element on outage, if any.
For each element listed in Table 2-3, only the maximum flow on each overloaded element is indicated. There may be additional contingencies that result in a less severe
GE Power Systems Energy Consulting 2.2 D:\AAWork\Interconnecting Generating Companys\Studies Posted on the OASIS\Generator Interconnection Study - 80 MW at Eddy County 345.doc

overload on any of the lines shown in the table; a complete list of the thermal violations observed is included in Appendix A, as Table A-1. For completeness, the two pre-contingency overloads are also included in this table.
As shown in Table 2-3, each of the thermal violations present in Scenario 1 is a pre-existing violation, which is also present in the benchmark case. In addition, many of the violations listed are less severe than in Scenario 1 than in the benchmark condition.
Scenario 2 and Scenario 3 were also examined under steady state base case and single contingency conditions. The thermal violations that were observed in Scenario 2 and Scenario 3 are included in Table 2-4 and Table 2-5, respectively.
Table 2-4 lists five new overloads present in Scenario 2, that were not present in the benchmark condition. Each of the Caliente 345/115kV transformers was overloaded to 103.1%, for the outage of the other. In the benchmark system, these transformers were not overloaded for any contingency condition. In addition, for the outage of the Arroyo 345/115kV transformer, a new overload was observed on the Airport-Picacho 115kV line.
Table 2-4 also indicates an overload of the Amrad 345/115kV transformer and the Amrad-Alamogordo 115kV line, for outage of the Caliente-Amrad 345kV line. Because this contingency did not solve in the benchmark condition, a direct comparison is not possible; however, it is clear from the system topology that the installation of the proposed generation will cause these overloads. For example, for the outage of the Caliente-Amrad 345kV line, the power delivered to Artesia by the HVDC terminal must flow through the Amrad 345/115kV transformer. In the benchmark system, the maximum of 220MW delivered by the HVDC terminal will not overload the Amrad 345/115kV transformer, which has an emergency rating of 261MVA. In Scenario 2, the outage of the Caliente-Amrad 345kV line will cause the Amrad 345/115kV transformer to carry the power produced by the new generation, in addition to the power delivered by the HVDC terminal. With the new generation in service, a total of 300MW must be carried through the Amrad transformer, which is clearly in violation of the transformer's emergency rating. Similarly, the Alamogordo Tap-Alamogordo 115kV line will be overloaded with the new generation in service.
In Scenario 3, the most severe thermal violation on the Mimbres-Airport 115kV line was observed for the outage of the Newman-Luna 345kV line. In the benchmark system, the Mimbres - Airport 115kV line was loaded to 98% for this outage; in Scenario 3 the line loading was 109.1%. It should be noted, however, that this line was more severely overloaded in both the benchmark condition and in Scenario 2, for the outage of the Arroyo 345/115kV transformer.
No pre-contingency thermal violations were caused or exacerbated by the new generation in any of the scenarios examined. A list of the unsolved contingencies is included as Table 2-6. No contingency that solved in the benchmark system was unsolved in any of the other scenarios.
GE Power Systems Energy Consulting 2.3 D:\AAWork\Interconnecting Generating Companys\Studies Posted on the OASIS\Generator Interconnection Study - 80 MW at Eddy County 345.doc
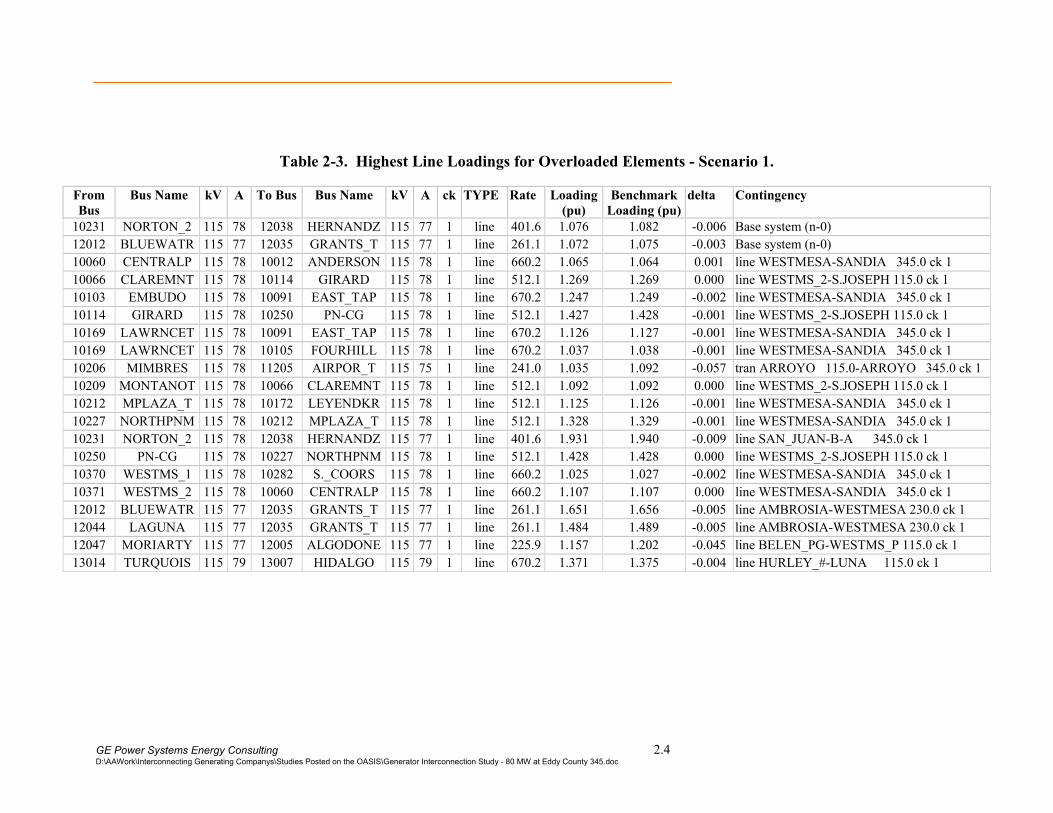
Table 2-3. Highest Line Loadings for Overloaded Elements - Scenario 1.
From Bus
Bus Name kV A To Bus Bus Name kV A ck TYPE Rate Loading (pu)
Benchmark Loading (pu)
delta Contingency
10231 NORTON_2 115 78 12038 HERNANDZ 115 77 1 line 401.6 1.076 1.082 -0.006 Base system (n-0)12012 BLUEWATR 115 77 12035 GRANTS_T 115 77 1 line 261.1 1.072 1.075 -0.003 Base system (n-0)10060 CENTRALP 115 78 10012 ANDERSON 115 78 1 line 660.2 1.065 1.064 0.001 line WESTMESA-SANDIA 345.0 ck 1 10066 CLAREMNT 115 78 10114 GIRARD 115 78 1 line 512.1 1.269 1.269 0.000 line WESTMS_2-S.JOSEPH 115.0 ck 1 10103 EMBUDO 115 78 10091 EAST_TAP 115 78 1 line 670.2 1.247 1.249 -0.002 line WESTMESA-SANDIA 345.0 ck 1 10114 GIRARD 115 78 10250 PN-CG 115 78 1 line 512.1 1.427 1.428 -0.001 line WESTMS_2-S.JOSEPH 115.0 ck 1 10169 LAWRNCET 115 78 10091 EAST_TAP 115 78 1 line 670.2 1.126 1.127 -0.001 line WESTMESA-SANDIA 345.0 ck 1 10169 LAWRNCET 115 78 10105 FOURHILL 115 78 1 line 670.2 1.037 1.038 -0.001 line WESTMESA-SANDIA 345.0 ck 1 10206 MIMBRES 115 78 11205 AIRPOR_T 115 75 1 line 241.0 1.035 1.092 -0.057 tran ARROYO 115.0-ARROYO 345.0 ck 1 10209 MONTANOT 115 78 10066 CLAREMNT 115 78 1 line 512.1 1.092 1.092 0.000 line WESTMS_2-S.JOSEPH 115.0 ck 1 10212 MPLAZA_T 115 78 10172 LEYENDKR 115 78 1 line 512.1 1.125 1.126 -0.001 line WESTMESA-SANDIA 345.0 ck 1 10227 NORTHPNM 115 78 10212 MPLAZA_T 115 78 1 line 512.1 1.328 1.329 -0.001 line WESTMESA-SANDIA 345.0 ck 1 10231 NORTON_2 115 78 12038 HERNANDZ 115 77 1 line 401.6 1.931 1.940 -0.009 line SAN_JUAN-B-A 345.0 ck 1 10250 PN-CG 115 78 10227 NORTHPNM 115 78 1 line 512.1 1.428 1.428 0.000 line WESTMS_2-S.JOSEPH 115.0 ck 1 10370 WESTMS_1 115 78 10282 S._COORS 115 78 1 line 660.2 1.025 1.027 -0.002 line WESTMESA-SANDIA 345.0 ck 1 10371 WESTMS_2 115 78 10060 CENTRALP 115 78 1 line 660.2 1.107 1.107 0.000 line WESTMESA-SANDIA 345.0 ck 1 12012 BLUEWATR 115 77 12035 GRANTS_T 115 77 1 line 261.1 1.651 1.656 -0.005 line AMBROSIA-WESTMESA 230.0 ck 1 12044 LAGUNA 115 77 12035 GRANTS_T 115 77 1 line 261.1 1.484 1.489 -0.005 line AMBROSIA-WESTMESA 230.0 ck 1 12047 MORIARTY 115 77 12005 ALGODONE 115 77 1 line 225.9 1.157 1.202 -0.045 line BELEN_PG-WESTMS_P 115.0 ck 1 13014 TURQUOIS 115 79 13007 HIDALGO 115 79 1 line 670.2 1.371 1.375 -0.004 line HURLEY_#-LUNA 115.0 ck 1
GE Power Systems Energy Consulting 2.4 D:\AAWork\Interconnecting Generating Companys\Studies Posted on the OASIS\Generator Interconnection Study - 80 MW at Eddy County 345.doc

Table 2-4. Highest Line Loadings for Overloaded Elements - Scenario 2.
From Bus
Bus Name kV A To Bus Bus Name kV A ck TYPE Rate Loading (pu)
Benchmark Loading (pu)
delta Contingency
10231 NORTON_2 115 78 12038 HERNANDZ 115 77 1 line 401.6 1.080 1.082 -0.002 Base system (n-0)12012 BLUEWATR 115 77 12035 GRANTS_T 115 77 1 line 261.1 1.075 1.075 0.000 Base system (n-0)10060 CENTRALP 115 78 10012 ANDERSON 115 78 1 line 660.2 1.063 1.064 -0.001 line WESTMESA-SANDIA 345.0 ck 1 10066 CLAREMNT 115 78 10114 GIRARD 115 78 1 line 512.1 1.268 1.269 -0.001 line WESTMS_2-S.JOSEPH 115.0 ck 1 10103 EMBUDO 115 78 10091 EAST_TAP 115 78 1 line 670.2 1.247 1.249 -0.002 line WESTMESA-SANDIA 345.0 ck 1 10114 GIRARD 115 78 10250 PN-CG 115 78 1 line 512.1 1.426 1.428 -0.002 line WESTMS_2-S.JOSEPH 115.0 ck 1 10169 LAWRNCET 115 78 10091 EAST_TAP 115 78 1 line 670.2 1.125 1.127 -0.002 line WESTMESA-SANDIA 345.0 ck 1 10169 LAWRNCET 115 78 10105 FOURHILL 115 78 1 line 670.2 1.037 1.038 -0.001 line WESTMESA-SANDIA 345.0 ck 1 10206 MIMBRES 115 78 11205 AIRPOR_T 115 75 1 line 241.0 1.122 1.092 0.030 tran ARROYO 115.0-ARROYO 345.0 ck 1 10209 MONTANOT 115 78 10066 CLAREMNT 115 78 1 line 512.1 1.092 1.092 0.000 line WESTMS_2-S.JOSEPH 115.0 ck 1 10212 MPLAZA_T 115 78 10172 LEYENDKR 115 78 1 line 512.1 1.124 1.126 -0.002 line WESTMESA-SANDIA 345.0 ck 1 10227 NORTHPNM 115 78 10212 MPLAZA_T 115 78 1 line 512.1 1.327 1.329 -0.002 line WESTMESA-SANDIA 345.0 ck 1 10231 NORTON_2 115 78 12038 HERNANDZ 115 77 1 line 401.6 1.939 1.940 -0.001 line SAN_JUAN-B-A 345.0 ck 1 10250 PN-CG 115 78 10227 NORTHPNM 115 78 1 line 512.1 1.427 1.428 -0.001 line WESTMS_2-S.JOSEPH 115.0 ck 1 10370 WESTMS_1 115 78 10282 S._COORS 115 78 1 line 660.2 1.026 1.027 -0.001 line WESTMESA-SANDIA 345.0 ck 1 10371 WESTMS_2 115 78 10060 CENTRALP 115 78 1 line 660.2 1.105 1.107 -0.002 line WESTMESA-SANDIA 345.0 ck 1 11010 AMRAD 345 75 11008 AMRAD 115 75 1 tran 261.0 1.124 N/A line CALIENTE-AMRAD 345.0 ck 1 11037 CALIENTE 115 75 11038 CALIENTE 345 75 1 tran 224.0 1.031 0.961 0.070 tran CALIENTE 115.0-CALIENTE 345.0 ck 2 11037 CALIENTE 115 75 11038 CALIENTE 345 75 2 tran 224.0 1.031 0.961 0.070 tran CALIENTE 115.0-CALIENTE 345.0 ck 1 11205 AIRPOR_T 115 75 12059 PICACHO 115 77 1 line 241.0 1.009 0.980 0.029 tran ARROYO 115.0-ARROYO 345.0 ck 1 12012 BLUEWATR 115 77 12035 GRANTS_T 115 77 1 line 261.1 1.656 1.656 0.000 line AMBROSIA-WESTMESA 230.0 ck 1 12044 LAGUNA 115 77 12035 GRANTS_T 115 77 1 line 261.1 1.490 1.489 0.001 line AMBROSIA-WESTMESA 230.0 ck 1 12047 MORIARTY 115 77 12005 ALGODONE 115 77 1 line 225.9 1.202 1.202 0.000 line BELEN_PG-WESTMS_P 115.0 ck 1 13001 ALAMOTAP 115 79 13000 ALAMOGCP 115 79 1 line 530.2 1.329 N/A line CALIENTE-AMRAD 345.0 ck 1 13014 TURQUOIS 115 79 13007 HIDALGO 115 79 1 line 670.2 1.358 1.375 -0.017 line HURLEY_#-LUNA 115.0 ck 1
GE Power Systems Energy Consulting 2.5 D:\AAWork\Interconnecting Generating Companys\Studies Posted on the OASIS\Generator Interconnection Study - 80 MW at Eddy County 345.doc

Table 2-5. Highest Line Loadings for Overloaded Elements - Scenario 3.
From Bus
Bus Name kV A To Bus Bus Name kV A ck TYPE Rate Loading (pu)
Benchmark Loading (pu)
delta Contingency
10231 NORTON_2 115 78 12038 HERNANDZ 115 77 1 line 401.6 1.086 1.082 0.004 Base system (n-0)12012 BLUEWATR 115 77 12035 GRANTS_T 115 77 1 line 261.1 1.077 1.075 0.002 Base system (n-0)10060 CENTRALP 115 78 10012 ANDERSON 115 78 1 line 660.2 1.065 1.064 0.001 line WESTMESA-SANDIA 345.0 ck 1 10066 CLAREMNT 115 78 10114 GIRARD 115 78 1 line 512.1 1.269 1.269 0.000 line WESTMS_2-S.JOSEPH 115.0 ck 1 10103 EMBUDO 115 78 10091 EAST_TAP 115 78 1 line 670.2 1.248 1.249 -0.001 line WESTMESA-SANDIA 345.0 ck 1 10114 GIRARD 115 78 10250 PN-CG 115 78 1 line 512.1 1.427 1.428 -0.001 line WESTMS_2-S.JOSEPH 115.0 ck 1 10169 LAWRNCET 115 78 10091 EAST_TAP 115 78 1 line 670.2 1.127 1.127 0.000 line WESTMESA-SANDIA 345.0 ck 1 10169 LAWRNCET 115 78 10105 FOURHILL 115 78 1 line 670.2 1.038 1.038 0.000 line WESTMESA-SANDIA 345.0 ck 1 10206 MIMBRES 115 78 11205 AIRPOR_T 115 75 1 line 241.0 1.091 0.980 0.111 line NEWMAN -LUNA 345.0 ck 1 10209 MONTANOT 115 78 10066 CLAREMNT 115 78 1 line 512.1 1.092 1.092 0.000 line WESTMS_2-S.JOSEPH 115.0 ck 1 10212 MPLAZA_T 115 78 10172 LEYENDKR 115 78 1 line 512.1 1.125 1.126 -0.001 line WESTMESA-SANDIA 345.0 ck 1 10227 NORTHPNM 115 78 10212 MPLAZA_T 115 78 1 line 512.1 1.328 1.329 -0.001 line WESTMESA-SANDIA 345.0 ck 1 10231 NORTON_2 115 78 12038 HERNANDZ 115 77 1 line 401.6 1.948 1.940 0.008 line SAN_JUAN-B-A 345.0 ck 1 10250 PN-CG 115 78 10227 NORTHPNM 115 78 1 line 512.1 1.428 1.428 0.000 line WESTMS_2-S.JOSEPH 115.0 ck 1 10370 WESTMS_1 115 78 10282 S._COORS 115 78 1 line 660.2 1.025 1.027 -0.002 line WESTMESA-SANDIA 345.0 ck 1 10371 WESTMS_2 115 78 10060 CENTRALP 115 78 1 line 660.2 1.108 1.107 0.001 line WESTMESA-SANDIA 345.0 ck 1 12012 BLUEWATR 115 77 12035 GRANTS_T 115 77 1 line 261.1 1.660 1.656 0.004 line AMBROSIA-WESTMESA 230.0 ck 1 12044 LAGUNA 115 77 12035 GRANTS_T 115 77 1 line 261.1 1.493 1.489 0.004 line AMBROSIA-WESTMESA 230.0 ck 1 12047 MORIARTY 115 77 12005 ALGODONE 115 77 1 line 225.9 1.221 1.202 0.019 line BELEN_PG-WESTMS_P 115.0 ck 1 13014 TURQUOIS 115 79 13007 HIDALGO 115 79 1 line 670.2 1.378 1.375 0.003 line HURLEY_#-LUNA 115.0 ck 1
GE Power Systems Energy Consulting 2.6 D:\AAWork\Interconnecting Generating Companys\Studies Posted on the OASIS\Generator Interconnection Study - 80 MW at Eddy County 345.doc

GE Power Systems Energy Consulting 2.7 D:\AAWork\Interconnecting Generating Companys\Studies Posted on the OASIS\Generator Interconnection Study - 80 MW at Eddy County 345.doc
Table 2-6. Unsolved Contingencies.
Case Contingency Benchmark line AMRAD -ALAMOTAP 115.0 ck 1
line CALIENTE-AMRAD 345.0 ck 1 line MORIARTY-ALGODONE 115.0 ck 1 line ALAMOTAP-ALAMOGCP 115.0 ck 1 line TURQUOIS-HIDALGO 115.0 ck 1 line WALSENBG-GLADSTON 230.0 ck 1 line NORTON_1-MEJIA_T 115.0 ck 1 tran AMRAD 115.0-AMRAD 345.0 ck 1 tran GLADSTON 230.0-GLADSTON 115.0 ck 1
Scenario 1 line AMRAD -ALAMOTAP 115.0 ck 1 line CALIENTE-AMRAD 345.0 ck 1 line MORIARTY-ALGODONE 115.0 ck 1 line ALAMOTAP-ALAMOGCP 115.0 ck 1 line TURQUOIS-HIDALGO 115.0 ck 1 line WALSENBG-GLADSTON 230.0 ck 1 tran AMRAD 115.0-AMRAD 345.0 ck 1 tran GLADSTON 230.0-GLADSTON 115.0 ck 1
Scenario 2 line AMRAD -ALAMOTAP 115.0 ck 1 line MORIARTY-ALGODONE 115.0 ck 1 line ALAMOTAP-ALAMOGCP 115.0 ck 1 line TURQUOIS-HIDALGO 115.0 ck 1 line WALSENBG-GLADSTON 230.0 ck 1 tran AMRAD 115.0-AMRAD 345.0 ck 1 tran GLADSTON 230.0-GLADSTON 115.0 ck 1
Scenario 3 line AMRAD -ALAMOTAP 115.0 ck 1 line MORIARTY-ALGODONE 115.0 ck 1 line ALAMOTAP-ALAMOGCP 115.0 ck 1 line TURQUOIS-HIDALGO 115.0 ck 1 line WALSENBG-GLADSTON 230.0 ck 1 tran AMRAD 115.0-AMRAD 345.0 ck 1 tran GLADSTON 230.0-GLADSTON 115.0 ck 1
2.1.4 Voltage Analysis
The steady-state analysis revealed numerous voltage violations in the benchmark system and in all three post-project scenarios. For each of the post-project scenarios, each bus that experienced a low voltage violation is listed in Table 2-7, along with the lowest voltage observed in this analysis. Table 2-7 shows the system condition (Scenario 1,2 or 3), the bus number, name, and base kV, and the lowest voltage seen by the bus. The voltage observed in the benchmark system is included, as is the per-unit difference in voltage between the post-project scenario and the benchmark system. The last column lists the element on outage.

Table 2-7. Lowest Bus Voltage Violations.
Case Bus Number
Bus Name kV V-pu V-pu Benchmark
delta Contingency
Scenario 1 11102 MILAGRO 69 0.914 0.920 -0.006 line MILAGRO -NEWMAN 115.0 ck 1 Scenario 1 11103 MILAGRO 115 0.914 0.920 -0.006 line MILAGRO -NEWMAN 115.0 ck 1 Scenario 1 12008 BERNARDO 115 0.913 0.923 -0.010 line BERNARDO-BELEN_PG 115.0 ck 1 Scenario 1 12073 SOCORROP 115 0.915 0.925 -0.010 line BERNARDO-BELEN_PG 115.0 ck 1 Scenario 1 13004 CHINO 115 0.843 0.841 0.002 line HURLEY_#-LUNA 115.0 ck 1 Scenario 1 13008 HURLEY_# 115 0.845 0.842 0.003 line HURLEY_#-LUNA 115.0 ck 1 Scenario 1 13010 PDTYRONE 115 0.863 0.861 0.002 line HURLEY_#-LUNA 115.0 ck 1 Scenario 2 11102 MILAGRO 69 0.920 0.920 0.000 line MILAGRO -NEWMAN 115.0 ck 1 Scenario 2 11103 MILAGRO 115 0.920 0.920 0.000 line MILAGRO -NEWMAN 115.0 ck 1 Scenario 2 13003 CENTRAL 115 0.857 0.846 0.011 line HURLEY_#-LUNA 115.0 ck 1 Scenario 2 13004 CHINO 115 0.852 0.841 0.011 line HURLEY_#-LUNA 115.0 ck 1 Scenario 2 13008 HURLEY_# 115 0.853 0.842 0.011 line HURLEY_#-LUNA 115.0 ck 1 Scenario 2 13010 PDTYRONE 115 0.871 0.861 0.010 line HURLEY_#-LUNA 115.0 ck 1 Scenario 2 13014 TURQUOIS 115 0.878 0.868 0.010 line HURLEY_#-LUNA 115.0 ck 1 Scenario 3 11102 MILAGRO 69 0.921 0.920 0.001 line MILAGRO -NEWMAN 115.0 ck 1 Scenario 3 11103 MILAGRO 115 0.921 0.920 0.001 line MILAGRO -NEWMAN 115.0 ck 1 Scenario 3 12008 BERNARDO 115 0.916 0.923 -0.007 line BERNARDO-BELEN_PG 115.0 ck 1 Scenario 3 12073 SOCORROP 115 0.918 0.925 -0.007 line BERNARDO-BELEN_PG 115.0 ck 1 Scenario 3 13004 CHINO 115 0.839 0.841 -0.002 line HURLEY_#-LUNA 115.0 ck 1 Scenario 3 13008 HURLEY_# 115 0.841 0.842 -0.001 line HURLEY_#-LUNA 115.0 ck 1 Scenario 3 13010 PDTYRONE 115 0.859 0.861 -0.002 line HURLEY_#-LUNA 115.0 ck 1 Scenario 3 13014 TURQUOIS 115 0.867 0.868 -0.001 line HURLEY_#-LUNA 115.0 ck 1
In Scenario 1 and Scenario 3, for the outage of the BERNARDO-BELEN_PG 115kV transmission line, the voltage at the SOCORROP 115kV bus was below the lower limit of 0.925. The lowest voltage seen at this bus is 0.925pu in the benchmark condition. For the remaining of the violations shown in table, the low voltage violation is present in the benchmark system, as well as the post-project system of interest.
Numerous high voltage violations were also observed in this analysis. A table showing the highest voltage violations revealed in this analysis is included as Table A-2 in Appendix A. Each of the high voltage violations observed was also present in the benchmark case, and not a result of the added generation. A table listing all of the voltage violations observed for all four scenarios is also included in Appendix A.
GE Power Systems Energy Consulting 2.8 D:\AAWork\Interconnecting Generating Companys\Studies Posted on the OASIS\Generator Interconnection Study - 80 MW at Eddy County 345.doc
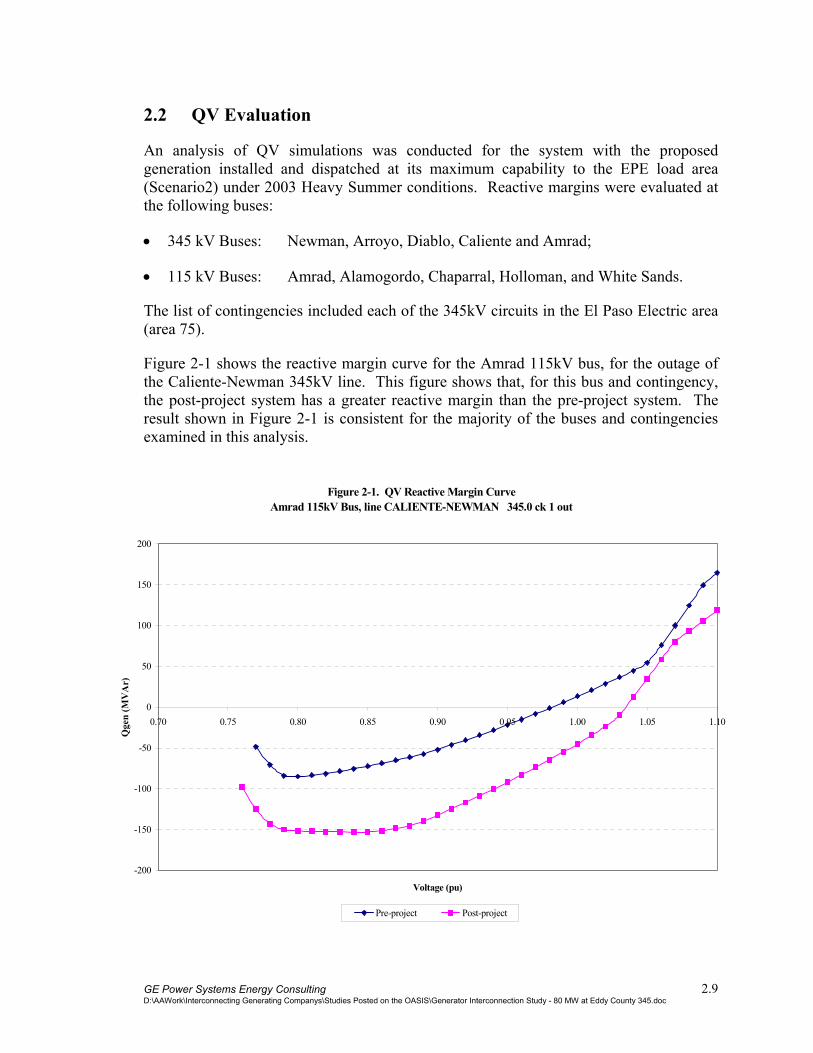
2.2 QV Evaluation
An analysis of QV simulations was conducted for the system with the proposed generation installed and dispatched at its maximum capability to the EPE load area (Scenario2) under 2003 Heavy Summer conditions. Reactive margins were evaluated at the following buses:
• 345 kV Buses: Newman, Arroyo, Diablo, Caliente and Amrad;
• 115 kV Buses: Amrad, Alamogordo, Chaparral, Holloman, and White Sands.
The list of contingencies included each of the 345kV circuits in the El Paso Electric area (area 75).
Figure 2-1 shows the reactive margin curve for the Amrad 115kV bus, for the outage of the Caliente-Newman 345kV line. This figure shows that, for this bus and contingency, the post-project system has a greater reactive margin than the pre-project system. The result shown in Figure 2-1 is consistent for the majority of the buses and contingencies examined in this analysis.
Figure 2-1. QV Reactive Margin CurveAmrad 115kV Bus, line CALIENTE-NEWMAN 345.0 ck 1 out
-200
-150
-100
-50
0
50
100
150
200
0.70 0.75 0.80 0.85 0.90 0.95 1.00 1.05 1.10
Voltage (pu)
Qge
n (M
VA
r)
Pre-project Post-project
GE Power Systems Energy Consulting 2.9 D:\AAWork\Interconnecting Generating Companys\Studies Posted on the OASIS\Generator Interconnection Study - 80 MW at Eddy County 345.doc

In Scenario 2, the new Eddy County units are in service in place of one of the Newman generators. For contingencies that separated the new generation from the bus being examined the reactive margin was greater in the pre-project system. This situation is illustrated in Figure 2-2.
Figure 2-2 shows the reactive margin curve for the Amrad 115kV bus, for the outage of the Amrad-Artesia 345kV line. In the pre-project system, the Newman bus was able to contribute to the support of the voltage at Amrad; however, in the post-project system, the outage Amrad-Artesia 345kV line prevents the new generation from providing VARs for support at Amrad.
Figure 2-2. QV Reactive Margin CurveAmrad 115kV Bus, line AMRAD -ARTESIA 345.0 ck 1 out
-250
-200
-150
-100
-50
0
50
100
150
200
0.70 0.75 0.80 0.85 0.90 0.95 1.00 1.05 1.10
Voltage (pu)
Qge
n (M
VA
r)
Pre-project Post-project
The QV reactive margin curves for each bus and contingency taken are included in Appendix B. For certain faults, the pre-project case did not solve, and only the post-project reactive margin curve is shown. It should also be noted that in the analysis of the Alamogordo 115kV bus, neither case solved for the outage of the Caliente-Amrad 345kV line.
GE Power Systems Energy Consulting 2.10 D:\AAWork\Interconnecting Generating Companys\Studies Posted on the OASIS\Generator Interconnection Study - 80 MW at Eddy County 345.doc
2.3 Transient Stability Analysis
The objective of the transient stability evaluation was to verify that the proposed plant meet performance criteria established for the EPE system via its most recent FERC Form 715 filing. The evaluation consisted of ten-second simulations of two (2) specific events:
• The first event was a bolted-three-phase fault on the Caliente-Amrad 345kV transmission line, at Amrad.
• The second event simulated the loss of the entire plant while the plant is being dispatched at its maximum capability to EPE.
Figure 2-3 shows the response of Eddy County unit #1 to the fault on the Caliente-Amrad 345kV line. The voltages at selected 345kV buses are shown in Figure 2-4, and the voltages at selected nearby 115kV buses are shown in Figure 2-5. The response revealed in these figures indicates that the system was stable for the fault scenario examined.
The second fault scenario included a fault at Eddy County, which resulted in the loss of the proposed plant. Bus voltages for selected 345kV and 115kV buses are shown in Figures 2-6 and 2-7, respectively. As in the examination of the fault on the Caliente-Amrad line, the system response to the loss of the Eddy County plant was stable.
The transient stability analysis indicates no negative impacts from the proposed Eddy County generation.
GE Power Systems Energy Consulting 2.11 D:\AAWork\Interconnecting Generating Companys\Studies Posted on the OASIS\Generator Interconnection Study - 80 MW at Eddy County 345.doc

0.0
0.5
1.0
1.5
0 5 10
Eddy County #1 vt
Time (seconds)
0
20
40
60Eddy County #1 ang
0.98
1.00
1.02Eddy County #1 spd
0
50
100
150
0 5 10
Eddy County #1 pg
Time (seconds)
-100
0
100Eddy County #1 qg
0
5
10
15Eddy County #1 efd
Eddy County Generation Study Three-Phase fault on Caliente-Amrad
Normally-Cleared in 6 cycles
21-SEP-2001 10:28:46 chans\03sc2-06.chan Page 1
Figure 2-3. Eddy County response to Caliente-Amrad fault simulation
GE Power Systems Energy Consulting 2.12 D:\AAWork\Interconnecting Generating Companys\Studies Posted on the OASIS\Generator Interconnection Study - 80 MW at Eddy County 345.doc

0.0
0.5
1.0
1.5
0 5 10
Artesia 345 Voltage
Time (seconds)
0.0
0.5
1.0
1.5Amrad 345 Voltage
0.0
0.5
1.0
1.5Caliente 345 Voltage
0.50
0.75
1.00
1.25
0 5 10
Newman 345 Voltage
Time (seconds)
0.4
0.6
0.8
1.0
1.2Arroyo 345 Voltage
0.6
0.8
1.0
1.2Diablo 345 Voltage
Eddy County Generation Study Three-Phase fault on Caliente-Amrad
Normally-Cleared in 6 cycles
21-SEP-2001 10:29:59 chans\03sc2-06.chan Page 1
Figure 2-4. Voltages at 345kV buses, in response to Caliente-Amrad fault
GE Power Systems Energy Consulting 2.13 D:\AAWork\Interconnecting Generating Companys\Studies Posted on the OASIS\Generator Interconnection Study - 80 MW at Eddy County 345.doc

0.0
0.5
1.0
1.5
0 5 10
Amrad 115 Voltage
Time (seconds)
0.0
0.5
1.0
1.5Alamogordo 115 Voltage
0.4
0.6
0.8
1.0
1.2Chaparral 115 Voltage
0.0
0.5
1.0
1.5
0 5 10
Hollowman 115 Voltage
Time (seconds)
0.0
0.5
1.0
1.5White Sands 115 Voltage
0.25
0.50
0.75
1.00
1.25Caliente 115 Voltage
Eddy County Generation Study Three-Phase fault on Caliente-Amrad
Normally-Cleared in 6 cycles
21-SEP-2001 10:31:44 chans\03sc2-06.chan Page 1
Figure 2-5. Voltages at 115kV buses, in response to Caliente-Amrad fault
GE Power Systems Energy Consulting 2.14 D:\AAWork\Interconnecting Generating Companys\Studies Posted on the OASIS\Generator Interconnection Study - 80 MW at Eddy County 345.doc

0
1
2
0 5 10
Artesia 345 Voltage
Time (seconds)
0.5
1.0
1.5Amrad 345 Voltage
0.6
0.8
1.0
1.2Caliente 345 Voltage
0.6
0.8
1.0
1.2
0 5 10
Newman 345 Voltage
Time (seconds)
0.8
1.0
1.2Arroyo 345 Voltage
0.8
0.9
1.0
1.1Diablo 345 Voltage
Eddy County Generation Study Trip New Eddy County Plant
Event at T=1.0
21-SEP-2001 10:30:09 chans\03sc2-07.chan Page 1
Figure 2-6. Voltages at 345kV buses, in response to loss of Eddy County plant
GE Power Systems Energy Consulting 2.15 D:\AAWork\Interconnecting Generating Companys\Studies Posted on the OASIS\Generator Interconnection Study - 80 MW at Eddy County 345.doc

0.50
0.75
1.00
1.25
0 5 10
Amrad 115 Voltage
Time (seconds)
0.6
0.8
1.0
1.2Alamogordo 115 Voltage
0.8
1.0
1.2Chaparral 115 Voltage
0.50
0.75
1.00
1.25
0 5 10
Hollowman 115 Voltage
Time (seconds)
0.50
0.75
1.00
1.25White Sands 115 Voltage
0.6
0.8
1.0
1.2Caliente 115 Voltage
Eddy County Generation Study Trip New Eddy County Plant
Event at T=1.0
21-SEP-2001 10:31:54 chans\03sc2-07.chan Page 1
Figure 2-7. Voltages at 115kV buses, in response to loss of Eddy County plant
GE Power Systems Energy Consulting 2.16 D:\AAWork\Interconnecting Generating Companys\Studies Posted on the OASIS\Generator Interconnection Study - 80 MW at Eddy County 345.doc

2.4 Transient Switching Surge Evaluation
A preliminary investigation was performed to evaluate any potential switching surge impacts of switching the 345 kV transmission lines around Amrad/Eddy County on the Eddy County HVDC Terminal/Amrad SVC with the new generating plant in operation. This area of the El Paso Electric transmission system was modeled using the Electromagnetic Transients Program (EMTP) based on the models used in recent studies performed for EPE. Table 2-8 summarizes the cases that were simulated along with brief conclusions from case comparisons.
Table 2-8. Switching Surge Case Summary.
Case Energize (from – to)
Caliente54
Mvar Reactor
Amrad80
Mvar Reactor
Artesia54
Mvar Reactor
Eddy County
Gen.
HVDC
Conclusions
1A Amrad to Caliente OFF ON ON OFF ON 1B Amrad to Caliente OFF ON ON ON ON
about the same
2A Amrad to Caliente OFF OFF ON OFF ON 2B Amrad to Caliente OFF OFF ON ON ON
slightly better with Eddy Cty. generation
3A Amrad to Caliente ON ON ON OFF ON 3B Amrad to Caliente ON ON ON ON ON
about the same
4A Amrad to Artesia ON OFF OFF OFF ON 5A Amrad to Artesia ON ON ON OFF ON 6B Artesia to Amrad ON OFF OFF ON OFF 7B Artesia to Amrad ON ON ON ON OFF
transients better when switching from Amrad
8A Amrad 80 Mvar Reactor
ON Switch ON OFF ON
8B Amrad 80 Mvar Reactor
ON Switch ON ON ON
distortion at Artesia is reduced with Eddy Cty. generation
Plots corresponding to the above cases can be found in Appendix C. The “A” cases have Eddy County generation off, and the “B” cases have Eddy County generation on. Where direct comparisons can be made, for example in Cases 1A and 1B, there are also plots comparing a selected transient voltage with and without the Eddy County generation (solid line is with generation, dotted line is without generation). The simulations were performed with variation of shunt reactors in service.
Direct comparisons of transients were made switching the line from Amrad to Caliente with and without the Eddy County generation. The transients were about the same or slightly better with the generation. Simulations were also performed on the Amrad–Artesia line. It was found that the transients were less severe when switching from the Amrad end than from the Artesia end with the Eddy County generation on and the HVDC off. The results also indicated that the voltage distortion was reduced with the Eddy County generation when energizing the 80 Mvar shunt reactor at Amrad.
In summary, the switching transients are about the same or slightly improved with the addition of the Eddy County generation. These results, which show some improvement at lower-order harmonics, are in agreement with the harmonic analysis results of Section 3.1.
GE Power Systems Energy Consulting 2.17 D:\AAWork\Interconnecting Generating Companys\Studies Posted on the OASIS\Generator Interconnection Study - 80 MW at Eddy County 345.doc

2.5 Remediations for Caliente-Amrad Outage
For the Caliente-Amrad 345kV outage, the proposed generation causes overloads on the Amrad transformer, and the Alamogordo Tap-Alamogordo 115kV transmission line. Possible mitigation options include:
1) Replacing the Amrad transformer, and upgrading the Alamogordo line
2) Adding a second transformer, and upgrading the Alamogordo line
For option 1), the new Amrad transformer would have to be large enough to accommodate a possible 220MW from the HVDC terminal, as well as the 80MW from the new plant. In addition, the transformer would have to accommodate the Amrad SVC, which is presently connected to the tertiary of the existing Amrad autotransformer.
Adding a second transformer 345/115kV transformer, in parallel with the existing Amrad transformer, would also alleviate the overloads resulting from the added generation. In both options 1) and 2), the Alamogordo Tap-Alamogordo 115kV transmission line must also be upgraded.
2.6 Transfer-trip of Eddy County Plant
The possibility of implementing a transfer-trip scheme was also examined, in accordance with the scope of this study. If such a scheme was implemented, the outage of the Caliente-Amrad circuit would result in the trip of the Eddy County generating facility. The advantage of such a scheme is clear: if the new plant was tripped, the loading on the Amrad transformer and the Alamogordo 115kV line would not be increased beyond present levels. Furthermore, the stability simulations shown in Section 2.3 show that the system is stable for a fault on the Caliente-Amrad line. Therefore, a transfer-trip scheme can be implemented to act within the thermal loading timeframe of the line and transformer, a timeframe of many seconds, rather than a several second response that would be necessary if the system response was unstable.
The disadvantages of a transfer-trip scheme are also apparent: a trip signal must be sent, either from the relays on the Caliente-Amrad line, or from meters on the Amrad transformer. The geographical distance between Amrad and the Eddy County plant will present a challenge to a transfer-trip scheme of this nature. In addition, the scheme will have to be able to accommodate the situation where EPE is exporting over the HVDC terminal, and the Eddy County generation is providing 80MW of that export. The potential for a false trip is also present.
GE Power Systems Energy Consulting 2.18 D:\AAWork\Interconnecting Generating Companys\Studies Posted on the OASIS\Generator Interconnection Study - 80 MW at Eddy County 345.doc

GE Power Systems Energy Consulting 3.1 D:\AAWork\Interconnecting Generating Companys\Studies Posted on the OASIS\Generator Interconnection Study - 80 MW at Eddy County 345.doc
3. Task 2 - Eddy County Interactions with the Amrad SVC
3.1 Harmonic Analysis
The location of the proposed Eddy County peaking units is near two sources of harmonic current, the Eddy DC terminal and the Amrad Substation SVC. While both of these stations have harmonic filters, some harmonics will still flow in the connecting circuits and into the proposed generators. Generators are more sensitive to harmonics than transformers and transmission lines and the harmonic currents can result in added heating of the generator rotors. An approximation to harmonic limits is made by calculating an equivalent negative sequence current and comparing it to the steady state negative sequence current, I2, capability of the machine. For the proposed machines, ANSI C50 specifies an I2 capability of 8% based on the machine’s full load current.
The system was modeled as shown in Figure 3-1. While the model is a small portion of the El Paso system, it represents the critical components. Representing a larger portion of the El Paso system would have more parallel paths for the harmonic current to flow and slightly less flow in the generators; therefore this model will err to a higher current flowing in the generators. If the generators can withstand the current in this model, they will withstand the current in a more detailed model. The transformer and line data was taken from the database that was used for the detailed power flow analysis.
Harmonic currents assigned for the SVC used the higher individual harmonic current from any SVC operating point. These harmonic source values were taken from Table 2, page 190, of “Reactive Power Control in Electric Systems” by T.J.E.Miller. The harmonic content of the dc terminal used the suggested currents for a 12-pulse converter from IEEE-519-1992, Table 13.1. For a worst case calculation, the harmonic currents from the two sources were taken to be in phase.
The transmission lines were modeled with hyperbolic long-line equations. The resistive component of the representation of the transformers and transmission lines included skin effects resulting from high frequency current flow.

12.5
Mva
r
11t
h
0.04
2 -j1
2 .60
7
0.00
21 +
j 0.1
042AR
T _G
213
.8 k
V
0.00
005
+ j .
0005
345
kV
0.00
4 +
j 0.1
2884
0.31
% o
n60
MVA
Prim
-0. 0
0033
-j0 .
0121
0.00
32 +
j .0
274 4
B =
0.49
41
S our
ce E
q uiv.
0.00
62 +
j 0.
0369
C ALI
ENTE
0.00
4 +
j 0.1
2884
AMR A
D
0.31
% o
n60
MVA
ART_
G1
13.8
kV
0.00
69 +
j .0
614
B =
1.11
04
0.0 1
6 +
j 0.8
0
ARTE
SIA
AMRA
D LD
120
kV
Sec
0.00
1 42
+j0.
0562
5
Impe
danc
es o
n 10
0 M
VA b
ase
0.00
52 +
j 0.2
610
0.01
04 +
j 0.5
198
Ter.
0.00
4 5 +
j0.1
796
0.13
34 +
j 6.6
676
AMR A
D SV
C
D UM
MY
13.0
kV
S VC
75 M
var
0.04
140
-j13 .
0254
12.5
Mva
r
5th
5
Mva
r 2
nd
5th
0.09
01
-j26 .
666
2nd
12.4
Mva
r
7th
0.04
25
-j12 .
7608
7th
11th
EDDY
WES
T DC T
ERM
INAL
200
MW
0.55
95 +
j 0. 0
001
HP-2
0.55
95 +
j 0. 0
001
HP-1
0.00
05 +
j 0.0
2331
0.00
05 +
j 0.0
233 1
30 M
var
12t
h
0.01
1 2
-j3.3
563
30 M
var
12t
h
0.01
1 2
-j3.3
563
Figure 3-1. Single-Line Diagram of Local System
GE Power Systems Energy Consulting 3.2 D:\AAWork\Interconnecting Generating Companys\Studies Posted on the OASIS\Generator Interconnection Study - 80 MW at Eddy County 345.doc

A digital model of the system was made and a number of operating contingencies examined. These cases are defined in Table 3-1. The system harmonic impedance and voltage distortion was compared with and without the proposed generation.
The Artesia bus impedance is shown in Figures 3-2 and 3-3. The addition of the generator lowers the bus impedance at the lower frequency because it is a short-circuit source. At the higher frequencies, the filters at Eddy County DC terminal and the Artesia SVC equipments are controlling the bus impedance and there is little change. The peaks and valley above the 15 harmonic order are due to the line capacitance and reactance interactions. These plots show that the generators do not change the natural system resonances to any noticeable degree.
Table 3-1 shows that the generators have little effect on the voltage distortion at the Artesia 345 kV bus as noted by comparing Cases 0a and 0b with Cases 1 to 4. Removing one hi-pass filter at the Eddy HVDC increases the voltage distortion by 0.6% points, (Cases 5-7). This is expected since less filtering is being done.
The voltage distortion at the generator terminals reduces with the generators in service. Lowering the short-circuit impedance would have this effect. The voltage distortion on the terminals of the generator is less than the maximum allowed by IEEE-519 on both the Total Harmonic Distortion (THD) and the individual harmonic distortion for all the conditions examined. IEEE-519 limits at voltages less than 69-kV are 5% on THD and 3% for individual.
The harmonic currents flowing in the generator cause additional machine heating. The expression used by GE to calculate the equivalent negative-sequence current is given below. For example when m = 2, I3m-1 would be the 5th harmonic current, I3m+1 would be the 7th harmonic current and I3m , the 6th harmonic current. If the system has balanced voltages, the I2 will be zero and only the harmonic currents will contribute to the negative sequence rotor heating
n
I2EQ = I + (Σ [3m/2)1/2 ({I3m-1 + I3m+1}2 + {I3m}2] )1/2 2 m=1
The continuous capability of the machine is 8% negative sequence currents. The table shows that the equivalent heating due to harmonics is less than 3% thereby allowing some I2 for unbalanced 60 Hz voltages.
A sample computer printout has been included in Appendix D, and shows the impedances and harmonic current injections used in this model.
GE Power Systems Energy Consulting 3.3 D:\AAWork\Interconnecting Generating Companys\Studies Posted on the OASIS\Generator Interconnection Study - 80 MW at Eddy County 345.doc

Table 3-1. Summary of Results
Generator 13.8 kV Bus Condition
Max Individual Voltage Case Gen Reactor DC filters
345 kV Artesia
Bus THDVoltage
THD Percent Harmonic
Gen. I2 Eq
0a 0 In 2 4.11 4.11 1.97 13 - 0b 0 Out 2 4.00 4.00 1.93 13 - 1 2 In 2 4.11 3.29 1.63 13 2.185 2 2 Out 2 4.09 3.27 1.59 13 2.180 3 1 In 2 4.11 3.29 1.60 13 2.195 4 1 Out 2 4.09 3.28 1.56 13 2.191 5 2 In 1 4.75 3.80 1.71 17 2.762 6 2 Out 1 4.74 3.80 1.71 17 2.764 7 1 Out 1 4.77 3.82 1.67 17 2.803
The analysis shows that, from a power quality perspective, the environment into which the proposed generators are to be connected is satisfactory.
1. The voltage distortion on the 13.8 kV generator terminals is less than the maximum allowed by IEEE-519.
2. The equivalent negative-sequence current is significantly below the 8% allowed by ANSI-C50.
3. The proposed generators have little effect on the 345-kV voltage distortion.
GE Power Systems Energy Consulting 3.4 D:\AAWork\Interconnecting Generating Companys\Studies Posted on the OASIS\Generator Interconnection Study - 80 MW at Eddy County 345.doc

LegendWith New Gen, with Reactor
-- -- -- --Without New Gen, with Reactor - - - - - - - With New Gen, without Reactor
Bus Impedance at Artesia 345-kV Bus
0.00
0.40
0.80
1.20
1.60
Peru
nit I
mpe
danc
e
0 5 10 15 20 25 30 35 40 45 50Harmonic Order
Figure 3-2. Frequency Scan of Artesia Bus Impedance
Without New Gen, without reactor
With New Gen, with reactor
Bus Impedance at Artesia 345-kV Bus
0.00
0.50
1.00
1.50
2.00
Per U
nit I
mpe
danc
e
1.00 1.50 2.00 2.50 3.00 3.50 4.00 4.50 5.00
Harmonic
Figure 3-3. Detail Frequency Scan of Artesia Bus Impedance to the 5th Harmonic
Without New Gen, with reactor
With New Gen, without reactor
GE Power Systems Energy Consulting 3.5 D:\AAWork\Interconnecting Generating Companys\Studies Posted on the OASIS\Generator Interconnection Study - 80 MW at Eddy County 345.doc

3.2 Torsional Screening
3.2.1 Operation with 345kV line in service
Torsional screening shows a unit interaction factor (UIF) of approximately 0.17 with one machine and 0.22 with both machines. These are for normal operation with the line to Amrad in service.
Guidelines for torsional interaction indicate that a UIF level above 0.1 may lead to detrimental torsional oscillations and therefore requires attention:
1. A detailed SSTI calculation with the actual controls represented should be performed. This will quantify the actual risk to the generator in the application, and may indicate a need to modify HVDC regulator settings to accommodate the generator.
2. Protective relays can be applied to the generator. These provide insurance in case the actual system encounters contingencies beyond those considered in the detailed study.
At this stage, it is recommended that the project assume that the detailed study will be done in the facility study stage, and that protective relays will be included when the generator is installed.
3.2.2 Operation with generator radial on HVDC
Torsional interaction will be much more severe for this case than for the case with the 345kV line. Protective relays on the generator will be mandatory if this operating mode is required. In addition, it is likely that a special control will be needed in the HVDC system to provide torsional damping.
GE Power Systems Energy Consulting 3.6 D:\AAWork\Interconnecting Generating Companys\Studies Posted on the OASIS\Generator Interconnection Study - 80 MW at Eddy County 345.doc

3.3 Control Interactions
3.3.1 Existing Operating Strategy
The existing strategy for operating the HVDC and SVC relies on manual switching and reference setting.
The dc power is ramped slowly, with reactive switching done manually at appropriate power levels. The SVC voltage reference is adjusted by the system operator to keep the net SVC output near zero MVAr.
3.3.2 Reactive coordination with new plant
When operating with both the HVDC and 345kV line to Amrad, the generator should be in voltage regulating mode. This will help to stabilize the system. It is expected that HVDC system operation will be improved by this addition, as it provides both increased short-circuit capacity plus steady-state voltage regulation.
The generator voltage reference will need to be adjusted in a manner similar to the SVC voltage reference, with the objective of maintaining steady-state reactive power within a predetermined range.
Further studies will be needed in the facilities design stage to establish the predetermined ranges of reactive power output.
Given the added complication of this additional operator duty, it is suggested that some form of operator assistance be provided via automatic voltage reference setting. This can be a local function at the generator, or at the operator location where both the SVC and generator voltage references can be automatically updated as system conditions vary.
3.3.3 Generator radial on HVDC
The short-circuit capacity at the converter will be approximately 450MVA with both generators. This is 5.6 pu with respect to the 80MW power transfer, which should be acceptable for HVDC control stability.
GE Power Systems Energy Consulting 3.7 D:\AAWork\Interconnecting Generating Companys\Studies Posted on the OASIS\Generator Interconnection Study - 80 MW at Eddy County 345.doc

3.4 Reactions of the HVDC Terminal
3.4.1 Trip of HVDC with generators in operation
A series of simulations were performed to evaluate the transient stability of the system, for a trip of the HVDC terminal. For each simulation, the HVDC line is carrying 220MW pre-disturbance, the filters are operating, and the reactor is out of service.
The first simulation was performed on the benchmark system, in order to establish the baseline performance. When the HVDC was tripped, the transient performance of the system was stable.
The second simulation was performed on the Scenario 2 case, as described above, with the new generation in service, and dispatched against local EPE generation. In this case, the transient performance of the system was unstable. When the HVDC was tripped, the new generation was unable to absorb the VARs that were being absorbed by the HVDC prior to the trip.
Next, the trip of the HVDC in Scenario 2 was examined, with the filters at the HVDC tripped one second after the trip of the HVDC terminal itself. When the filters were tripped, less VAR consumption was required by the system. In this case, the new generators were able perform the required VAR absorbtion, and the transient performance of the system was stable.
One additional case was examined with the generation in service. In this scenario, the HVDC was tripped, the filters at the HVDC were tripped one second later, and the reactor at the HVDC was put in service one second after that. The VAR consumption performed by the reactor results in a further improvement in system performance, which remained stable.
Figure 3-4 shows the results of the four simulations described above. With the new generation installed, a mitigation scheme will have to be implemented, in order to maintain stability in the event of a trip of the HVDC terminal.
GE Power Systems Energy Consulting 3.8 D:\AAWork\Interconnecting Generating Companys\Studies Posted on the OASIS\Generator Interconnection Study - 80 MW at Eddy County 345.doc

0.8
1.0
1.2
0 5 10
Artesia 345 Voltage
Time (seconds)
0.9
1.0
1.1
1.2Amrad 345 Voltage
-0.5
0.0
0.5Amrad Bsvc
0.0
0.5
1.0
1.5
0 5 10
New Gen vt
Time (seconds)
-50
0
50
100New Gen pg
-100
-50
0New Gen qg
Eddy County HVDC Trip Reactor Switched in (___), Filters Switched Out (._.)
Plant Generating 80MW (...), Pre-Project (---)
07-AUG-2001 15:07:24 chans\03sc2-03.chan Page 1
Figure 3-4. System Response to the Trip of the HVDC Terminal
GE Power Systems Energy Consulting 3.9 D:\AAWork\Interconnecting Generating Companys\Studies Posted on the OASIS\Generator Interconnection Study - 80 MW at Eddy County 345.doc

3.4.2 Trip of Eddy County – AMRAD 345kV Line with generators in operation
A trip of the 345kV line will require rapid transition to the isolated mode of operation if it is required to keep the generators and HVDC in operation. A new HVDC control function is needed for this.
The control function will take over adjustment of power command to the HVDC system. It must have rapid response capability, and be sensitive to frequency on the west terminal. The function will change HVDC power in a rapid, smooth manner to regulate generator speed.
There will be some constraints on operation with this function.
1. Operation below the minimum HVDC power level of 35 MW cannot be achieved. Near this minimum operating level there will be some uncertainty of secure operation. As the HVDC converter varies its power transfer to regulate frequency and match power output of the generators, HVDC current may become discontinuous. Once such a discontinuity is encountered, the generator should be tripped, because attempts to recover will introduce potentially repetitive transient torques that can cause torsional shaft vibrations to build up to dangerous levels.
2. Should the HVDC system initially be transferring power east to west, then a rapid power reversal will be required as part of the transition. The existing system was not designed to perform this function, so it is uncertain whether it can be done without major modifications to the HVDC control.
Detailed design of this function would be a task in the facility study. Part of this detailed design would be to determine feasibility of performing a rapid power reversal without major control changes.
GE Power Systems Energy Consulting 3.10 D:\AAWork\Interconnecting Generating Companys\Studies Posted on the OASIS\Generator Interconnection Study - 80 MW at Eddy County 345.doc

GE Power Systems Energy Consulting 4.1 D:\AAWork\Interconnecting Generating Companys\Studies Posted on the OASIS\Generator Interconnection Study - 80 MW at Eddy County 345.doc
4. Conclusions
The objective of this study was to identify potential major impacts associated with installation of the proposed Eddy County generating station. It was also intended to provide the developers with a preliminary view of the potential efforts, modifications, and costs that would be required to complete a successful integration of the proposed plant. The scope of work for this study was focused on two tasks: the evaluation of the system performance pre-project and post-project, and the interactions between the proposed generators, the Eddy County HVDC terminal, and the Amrad SVC.
Task 1 - Performance Evaluations
In this task, a relative approach was used to determine the impact of the proposed plant on the performance of the power system. First, performance of the existing system was determined in order to establish the baseline. Then system performance with the new generation was determined and compared to the baseline. This relative approach removes any ambiguities as to the actual impact of the proposed plant since existing criteria violations were identified.
The power flow analysis evaluated the impact of the proposed generation with respect to existing system performance and specific branch loading and bus voltage criteria. Criteria violations that occurred in the post-project system, but did not occur in the existing system, are considered attributable to the proposed Eddy County plant.
The original set of study cases represented the year 2003 Heavy Summer system, for one pre-project (benchmark) condition, and three post-project scenarios. A number of violations of thermal and voltage criteria were observed under each of these conditions, both with and without the new generation.
The following elements were not overloaded in the benchmark condition, but were overloaded in at least one of the post-project scenarios studied:
• The two Caliente 345/115kV transformers
• The Airport-Picacho 115kV line
• The Amrad 345/115 transformer
• The Alamogordo Tap-Alamogordo 115kV line
The QV analysis examined the reactive margins for one pre-project and one post-project scenario. Reactive margin curves were developed for ten buses in the EPE area, for the outage of each 345kV line in the EPE control.
In the majority of cases, the reactive margin is improved with the addition of the new plant; however, if the contingency being applied separates the new generation from the bus of interest, the reactive margin is lowered.
An evaluation of the transient stability of the system was also performed. Two disturbances were examined for the post-project condition: a fault on the Caliente-Amrad 345kV line, and a fault at Eddy County, that resulted in the loss of the Eddy County plant. In both cases, the system response was stable. The transient stability analysis does not indicate any negative impacts from the installation of the proposed Eddy County plant.
A preliminary evaluation was performed to evaluate any potential switching surge impacts of switching the 345 kV transmission lines around Amrad/Eddy County on the Eddy County HVDC Terminal/Amrad SVC with the new generating plant in operation. The installation of the proposed Eddy County plant did not worsen the system performance with respect to switching transients; to the contrary, the added generation resulted in some improvement at lower-order harmonics.
The overloads that were caused by the proposed generation, for the outage of the Caliente-Amrad 345kV transmission line, can be mitigated through two different network reinforcement options. The network reinforcements would include either the replacement of the existing transformer at Amrad, or the addition of a second transformer. The Alamogordo Tap-Alamogordo line would also need to be upgraded in either case.
A transfer-trip of the proposed generation was also examined. The transfer-trip scheme would prevent the loading on the line and transformer from rising above present levels, and could be implemented to act within the thermal loading timeframe of the elements of interest. The drawbacks of such a scheme include the geographical distance that a trip signal would have to carried over, as well as the potential for a false plant trip.
Task 2 - Interactions with the HVDC terminal and the Amrad SVC
The proximity of the proposed point of interconnection to the Eddy County HVDC Terminal and the AMRAD SVC raises a number of unique concerns. Additional analyses have been performed in order to evaluate the interactions among the proposed plant, the Amrad SVC, and the HVDC terminal.
The harmonic analysis revealed that installing the peaking generation in the proposed location does not expose the generation to unsatisfactory harmonic current. The voltage distortion on the 13.8 kV generator terminals is within the bounds specified by IEEE-519, and the equivalent negative-sequence current is significantly below the 8% allowed by ANSI-C50. The proposed generators have little effect on the 345-kV voltage distortion.
Torsional screening shows a unit interaction factor (UIF) for the proposed configuration that is above 0.1; guidelines for torsional interaction indicate that such a UIF level may lead to detrimental torsional oscillations. It is recommended that the project assume that a detailed SSTI study will be done in the facility study stage, and that protective relays will be included when the generator is installed. Furthermore, should it be necessary to operate with the generator radial on the HVDC, the torsional interaction will be much more severe, requiring protective relays and likely also requiring a special control in the HVDC system to provide torsional damping.
GE Power Systems Energy Consulting 4.2 D:\AAWork\Interconnecting Generating Companys\Studies Posted on the OASIS\Generator Interconnection Study - 80 MW at Eddy County 345.doc

The control of the Eddy County HVDC terminal and its interaction with the plant has been evaluated for the normal operating mode, and for the condition with the plant radial on the HVDC terminal. When operating with both the HVDC and 345kV line to Amrad, the additional generators will increase the stability of the system. It is expected that HVDC system operation will be improved by this addition, as it provides both increased short-circuit capacity plus steady-state voltage regulation.
The voltage reference will have to be adjusted in a manner similar to the SVC voltage reference, with the objective of maintaining steady-state reactive power within a predetermined range. Because of this added complication, it is recommended that some form of operator assistance be provided via automatic voltage reference setting.
With the generation radial on the HVDC, the short circuit capacity at the converter will be approximately 450MVA, which should be acceptable for HVDC control stability.
The reactions between the Eddy County HVDC terminal and the proposed plant were also evaluated, for the condition that the HVDC is tripped, and for the condition where the 345kV line to Amrad is tripped.
When the HVDC is tripped, the VARs that were being consumed by the HVDC prior to the trip must now be absorbed by the system. In the pre-project system, the system is able absorb the VARs and maintain stability. In the post-project system, the excess VARs are forced into the new units, which become unstable. With the new generation installed, a mitigation scheme will have to be implemented, in order to maintain stability in the event of a trip of the HVDC terminal.
A trip of the Eddy County-Amrad 345kV line will require rapid transition to the isolated mode of operation, which will require a new HVDC control function. This new function will take over adjustment of power command to the HVDC system. It must have rapid response capability, be sensitive to frequency on the west terminal, and will change HVDC power in a rapid, smooth manner to regulate generator speed. The control function will prohibit operation below the minimum HVDC power level.
Should the HVDC system initially be transferring power east to west, then a rapid power reversal will be required as part of the transition. The existing system was not designed to perform this function, so it is uncertain whether it can be done without major modifications to the HVDC control.
GE Power Systems Energy Consulting 4.3 D:\AAWork\Interconnecting Generating Companys\Studies Posted on the OASIS\Generator Interconnection Study - 80 MW at Eddy County 345.doc

GE Power Systems Energy Consulting D.1 D:\AAWork\Interconnecting Generating Companys\Studies Posted on the OASIS\Generator Interconnection Study - 80 MW at Eddy County 345.doc
Appendix D - Harmonic Study Computer Output Explanation
Introduction
The following digital computer harmonic analysis printouts provide details regarding electrical power system responses to harmonic current generated in the power system. Rectifiers, such as used in thyristor drives, represent a typical source of harmonic currents. The digital computer program printouts reflect the power system response to harmonic current sources. Harmonic current distribution is monitored through selected system components such as transformers, capacitors, utility ties, etc., and is printed out in either amperes or as current distribution factors. The current amplification factor represents per-unit harmonic current flow resulting from a one per-unit variable harmonic current source at a single bus location in the power system.
The digital computer program can perform any of four types of harmonic calculations. These are:
1) A current amplification scan
2) An impedance scan
3) Harmonic current summation
4) A voltage amplification scan
A frequency scan calculation, items 1 and 4 above, provides a profile of harmonic current distribution or voltage profile over increments of elevated frequency and is used to determine harmonic resonance frequencies and relative current distribution for a single harmonic source at a assigned location. An impedance scan calculation provides a profile of net system impedance seen looking into specified buses or circuit elements over increments of elevated frequency and is used to determine harmonic resonance frequencies and if the circuit is inductive or capacitive. The harmonic current summation evaluates the effects of multiple sources of harmonic currents acting simultaneously and located throughout the power system. The harmonic current summation calculation provides details on net RSS currents through selected system components, and harmonic bus voltage distortion factors.
Harmonic current distribution is a function of the location of the sources of harmonic currents, the harmonic impedances of the electrical network and the system resonant frequencies. The digital harmonic computer program printouts provide information as to the degree of harmonic distortion and interference in the power system that can be compared with current ANSI/IEEE Standard 519 for allowable levels of harmonics. In addition, the printouts can indicate the effectiveness of various selected harmonic filter circuits in reducing the magnitudes of harmonic distortion encountered in an electrical power system.

Input Data
The output of the computer program can be segregated into several parts. The first part consists of the input data and identifies the system configuration as well as the location of harmonic current sources. The sequence of the input data printout is:
1) The identification of the harmonic analysis program including the system MVA and fundamental frequency upon which system component per-unit impedances are based.
2) The case name and date of the computer run.
3) The customer name and location.
4) Two lines of case conditions.
5) A listing of system component impedances as follows:
Circuit Data ---------------------------------------------------------------------------------------------------- INPUT DATA FILTER BUS BUS R X PU B TAP R^H %ECF AMP LOAD AT KV %TOL1 %TOL2 CKT ID ID 0 DELL 0.00007 0.00092 0.0000 0.0000 0.00 0.00 0.0 0.00 0.0 0.0 UTIL 0 DELL MILL 0.00005 0.00533 0.0000 0.9750 0.00 2.00 335.0 161.00 3.0 -3.0 TRANSF1 0 (A) (B) (C) (D) (E) (F) (G) (H) (I) (J) (K) (L) (M) (N) ----------------------------------------------------------------------------------------------------
Where:
(A) Is the from bus name as identified on the one-line diagram. A zero (O) indicates a connection to the ground node.
(B) Is the to bus name as identified on the one-line diagram. (C) Is the per-unit resistance on the system MVA base. (D) Is the fundamental frequency per-unit reactance on the system MVA base with a positive
number representing an inductive reactance and a negative number representing a capacitive reactance.
(E) Is the PU line charging for the circuit between the two buses identified on the system MVA base.
(F) Is the PU transformer tap voltage. The tap is on the 'From' bus. (G) Represents an exponent to the expression below which allows the resistance to change with the
harmonic.
RHarm = Rpu* (Harm)H
Harm = the harmonic order H = the exponent of the harmonic order Rpu = the fundamental frequency resistance
GE Power Systems Energy Consulting D:\AAWork\Interconnecting Generating Companys\Studies Posted on the OASIS\Generator Interconnection Study - 80 MW at Eddy County 345.doc

(H) Represents the percent eddy current factor (%ECF). This factor allows the resistance to change in the following manner:
RHarm = R *(1 + ECF * H(1 + ECF)pu
2)
H = the harmonic order ECF = the eddy current factor Rpu = the fundamental frequency resistance
(I) is the current rating or loading of the branch (J) is the voltage level at which the preceding current was given. (K) is the upper tolerance factor on the branch element. (L) is the lower tolerance factor on the branch element. (M) is the branch circuit identifier. (N) is the shunt filter identifier.
Harmonic Source Data Harmonic source current data follows and varies with the type of calculation: **** For current or voltage amplification (RHO) scan calculations: ****
------------------------------------------------------------------------------------------------------ HARMONIC SOURCE ON BUS: 1 (A)
-------------------------------------------------------------------------------------------------------
Where
(A) is the location of a single source of one per-unit harmonic current injection or one per-unit voltage source.
**** for harmonic current summation calculations: **** ----------------------------------------------------------------
HARMONIC SOURCE CURRENTS IN PERCENT OF FULL LOAD AMPERES (A) (A) (A) BUS --> BUS 1 BUS 2 UTIL 34.500 KV (B) 34.500 KV (B) 115.000 KV (B) 2180.00 FLA (C) 517.00 FLA (C) 128.00 FLA (C) HARM % AMPS ANG % AMPS ANG % AMPS ANG 3 0.3 0.0 0.5 0.0 0.5 0.0 5 14.9 0.0 20.0 30.0 0.4 0.0 7 9.7 0.0 14.3 30.0 0.4 0.0 11 3.3 0.0 9.1 30.0 0.3 0.0 (D) (E) (F) (E) (F) (E) (F) VALUES FOR 'UTIL' ARE IN PERCENT VOLTAGE DISTORTION
----------------------------------------------------------------
GE Power Systems Energy Consulting D:\AAWork\Interconnecting Generating Companys\Studies Posted on the OASIS\Generator Interconnection Study - 80 MW at Eddy County 345.doc

Where: (A) Identifies the source bus number, referenced to one-line diagram.
(B) Is the operating kV of the harmonic source at which the harmonic currents are generated.
(C) Represents the full load current to which the percent harmonic currents given below are to be applied.
(D) Identifies the harmonic orders of currents generated by the source.
(E) Is the source harmonic currents in percent of the amperes (C) at the operating voltage (B) for each harmonic generated.
(F) Is the angle of the current relative to other source currents.
Output Solution
The second part of the computer printout provides calculated output. The formats of all calculation types identify the case name and run date. The output then follows one of several forms depending on the type of calculation elected. The following describes the current summation option.
Current Summation
***** Current Summation option: ****** --------------------------------------------- HARMONIC CURRENT LEVELS IN AMPERES 34.5 KV 34.5 KV (A) HARM TRANS1 REACT 1 (B) 1 837.0 800.0 3 2.2 3.9 5 24.8 282.6 (C) (D) (D) THD p.u. 3.954 35.325 (E) RSS/FUND. 1.000 1.061 (F) I(h)/H 849.2 857.8 (G) TOT KVAR 8535 5029 (H) KW LOSS 85.2 65.2 (I) IT PROD 5313 6749 (J) D-RATE 0.996 0.699 (K) K-FACT 1.1 4.3 (L) (C) (D) (D) -------------------------------------------------
GE Power Systems Energy Consulting D:\AAWork\Interconnecting Generating Companys\Studies Posted on the OASIS\Generator Interconnection Study - 80 MW at Eddy County 345.doc

Where:
(A) Is the voltage level at which harmonic currents are displayed.
(B) Identifies the system component name as originally appearing in the input data item CKT-ID.
(C) Identifies the harmonic order at which current distribution is displayed.
(D) Are the distributed harmonic currents for the identified system components (item B) at the harmonic order indicated by (C). The value at harmonic order 1.0 is the rating or load value of the circuit at base frequency corrected for circuit tolerance for this case.
(E) Is the total harmonic current distortion (THD) in per unit based on the fundamental current level.
THD
I
I
h
=
(h=2
H2 1 2
1
∑ ) /
(F) Is the per unit RSS (root sum square) harmonic current including the fundamental frequency current for each selected system component (B). This can be used to determine the heating effect of the added harmonic currents.
RSS
I
I
h
=
(h=1
H2 1 2
1
∑ ) /
(G) I(h)/H is the sum of the harmonic current level divided by the harmonic and has use in tuning reactor design.
Ih H Ih( ) / = / Hh=1
H∑
(H) TOT KVAR is the total kvar loss using the equation:
TOT KVAR Ih= Xh=1
H
h2∑
(I) kW LOSS is the total kW loss using the equation:
KW LOSS = Rh=1
H
hIh2∑
(J) IT Product provides a guideline as to the probable telephone interference due to inductive coupling from current in the circuit. IT product is expressed as:
IT PROD Ihh
= ( (weighing factorH
h2
1
2 1 2
=∑ ) ) /
GE Power Systems Energy Consulting D:\AAWork\Interconnecting Generating Companys\Studies Posted on the OASIS\Generator Interconnection Study - 80 MW at Eddy County 345.doc

(K) D-FACT is the derating factor for standard non-harmonic rated transformers due to harmonic per method 1 of C57.110. The derating factor is calculated by:
D - FACT = 1.15
1 + 0.15 (K - FACTOR)
(L) K-FACTOR is an expression used to guild in the specification of transformers for non-sinusoidal load current. A higher value indicates a greater amount of internal heating at the hot spot of the transformer. The expression is:
K Factor
Ihh
H
− −∑
=
h
I
2
rms
( )2
1
The last section of the current summation provides the bus voltages that result from the harmonic currents.
----------------------------------------- PER UNIT HARMONIC VOLTAGES BUS BUS HARM DELL BUS 1 (A) 1 1.000 1.000 3 0.004 0.011 5 0.001 0.004 7 0.008 0.025 (B) (C) (C) V SUM 1.013 1.039 (D) THD pu 0.009 0.027 (E) V RSS 1.000 1.000 (F) TIF pu 5.27 10.82 (G) -----------------------------------------
Where:
(A) Identifies the bus at which the harmonic voltages are determined.
(B) Identifies the individual harmonic orders of the bus voltages.
(C) Are the per-unit harmonic bus voltages for the buses selected in A.
(D) Represents the algebraic sum of harmonic bus voltages in per-unit and gives the peak bus voltage.
This value can be used to help specify capacitors.
V SUM Vh− ∑= h=1
H
GE Power Systems Energy Consulting D:\AAWork\Interconnecting Generating Companys\Studies Posted on the OASIS\Generator Interconnection Study - 80 MW at Eddy County 345.doc
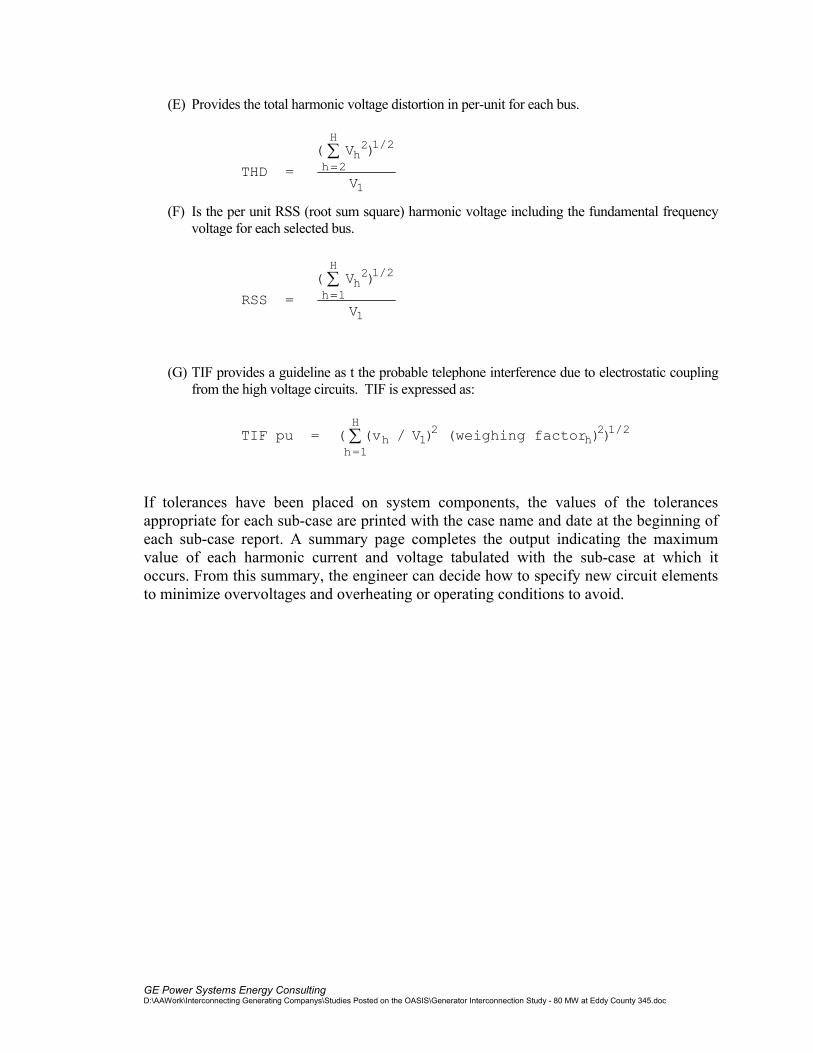
(E) Provides the total harmonic voltage distortion in per-unit for each bus.
THD
V
V
hh
H
=
)1/2( 2
2
1
=∑
(F) Is the per unit RSS (root sum square) harmonic voltage including the fundamental frequency voltage for each selected bus.
RSS
V
V
hh
H
=
( ) /2 1 2
1
1
=∑
(G) TIF provides a guideline as t the probable telephone interference due to electrostatic coupling from the high voltage circuits. TIF is expressed as:
TIF pu V= ( (v (weighing factorhh=1
H
h/ ) )) /12 2∑ 1 2
If tolerances have been placed on system components, the values of the tolerances appropriate for each sub-case are printed with the case name and date at the beginning of each sub-case report. A summary page completes the output indicating the maximum value of each harmonic current and voltage tabulated with the sub-case at which it occurs. From this summary, the engineer can decide how to specify new circuit elements to minimize overvoltages and overheating or operating conditions to avoid.
GE Power Systems Energy Consulting D:\AAWork\Interconnecting Generating Companys\Studies Posted on the OASIS\Generator Interconnection Study - 80 MW at Eddy County 345.doc

GE Power Systems Energy Consulting D.8 D:\AAWork\Interconnecting Generating Companys\Studies Posted on the OASIS\Generator Interconnection Study - 80 MW at Eddy County 345.doc
HARMONIC ANALYSIS PROGRAM - VERSION 2.3 - 04/01/00 3 PHASE LINE IMPEDANCES ON A 100 MVA BASE AT 60 HERTZ CASE G-1 08-28-2001 15:01:44 Generation at ARTESIA El Paso Electric 80 Mvar Reactor in Both Generators on INPUT DATA FILTER BUS BUS R X PU B TAP R^H %ECF AMP LOAD AT KV %TOL1 %TOL2 CKT ID ID 0 Caliente 0.00620 0.03690 0.00000 0.0000 0.00 0.00 0.0 345.00 0.0 0.0 Equiv 0 0 ART_G1 0.01030 0.51670 0.00000 0.0000 0.50 0.00 2519.0 13.80 0.0 0.0 GEN1 0 0 ART_G2 0.01030 0.51670 0.00000 0.0000 0.50 0.00 2519.0 13.80 0.0 0.0 GEN2 0 0 Amrad 0.01600 0.80000 0.00000 0.0000 0.50 0.00 0.0 345.00 0.0 0.0 ShuntR 0 0 2nd 0.09010 -26.66600 0.00000 0.0000 0.00 0.00 0.0 0.00 0.0 0.0 Cap-2 1 Amrad 2nd 0.13340 6.66760 0.00000 0.0000 0.50 0.00 222.0 13.00 0.0 0.0 Rea-2 1 0 5th 0.04140 -13.02540 0.00000 0.0000 0.00 0.00 0.0 0.00 0.0 0.0 Cap-5 2 Amrad 5th 0.01040 0.51080 0.00000 0.0000 0.50 0.00 555.0 13.00 0.0 0.0 Rea-5 2 0 7th 0.04250 -12.76080 0.00000 0.0000 0.00 0.00 0.0 0.00 0.0 0.0 Cap-7 3 Amrad 7th 0.00520 0.26100 0.00000 0.0000 0.50 0.00 551.0 13.00 0.0 0.0 Rea-7 3 0 11th 0.04200 -12.60700 0.00000 0.0000 0.00 0.00 0.0 0.00 0.0 0.0 Cap-11 4 Amrad 11th 0.00210 0.10420 0.00000 0.0000 0.50 0.00 555.0 13.00 0.0 0.0 Rea-11 4 0 HP-1 0.01120 -3.35630 0.00000 0.0000 0.00 0.00 0.0 0.00 0.0 0.0 C-HP-1 5 EDDY-W HP-1 0.00050 0.23310 0.00000 0.0000 0.50 0.00 50.0 345.00 0.0 0.0 Rea-H1 5 EDDY-W HP-1 0.55950 0.00010 0.00000 0.0000 0.50 0.00 0.0 0.00 0.0 0.0 Res-H1 5 0 HP-2 0.01120 -3.35630 0.00000 0.0000 0.00 0.00 0.0 0.00 0.0 0.0 C-HP-2 6 EDDY-W HP-2 0.00050 0.23310 0.00000 0.0000 0.50 0.00 0.0 0.00 0.0 0.0 Rea-H2 6 EDDY-W HP-2 0.55950 0.00010 0.00000 0.0000 0.50 0.00 0.0 0.00 0.0 0.0 Res-H2 6 EDDY-W Artesia 0.00005 0.00050 0.00000 0.0000 0.50 0.00 0.0 0.00 0.0 0.0 Line1 0 Artesia Amrad 0.00690 0.06140 1.11040 0.0000 0.50 0.00 0.0 0.00 0.0 0.0 Line2 0 Amrad Caliente 0.00320 0.02744 0.49410 0.0000 0.50 0.00 0.0 0.00 0.0 0.0 Line3 0 ART_G1 Artesia 0.00400 0.12884 0.00000 1.0000 0.50 0.00 0.0 0.00 0.0 0.0 Tx1 0 ART_G2 Artesia 0.00400 0.12884 0.00000 1.0000 0.50 0.00 0.0 0.00 0.0 0.0 Tx2 0 Artesia DUMMY -0.00040 -0.01450 0.00000 1.0000 0.50 0.00 0.0 0.00 0.0 0.0 Tx3a 0 AmradLD DUMMY 0.00170 0.06750 0.00000 1.0000 0.50 0.00 0.0 0.00 0.0 0.0 Tx3b 0 AmradSV DUMMY 0.00540 0.21550 0.00000 1.0000 0.50 0.00 0.0 0.00 0.0 0.0 Tx3c 0

GE Power Systems Energy Consulting D:\AAWork\Interconnecting Generating Companys\Studies Posted on the OASIS\Generator Interconnection Study - 80 MW at Eddy County 345.doc
CASE G-1 08-28-2001 PAGE 2 HARMONIC SOURCE CURRENTS IN PERCENT OF FULL LOAD AMPERES BUS --> EDDY-W AmradSV 345.000 KV 13.000 KV 394.00 FLA 3331.00 FLA HARM % AMPS ANG % AMPS ANG 5 1.9 0.0 5.1 0.0 7 1.3 0.0 2.6 0.0 11 7.3 0.0 1.1 0.0 13 5.7 0.0 0.8 0.0 17 0.4 0.0 0.4 0.0 19 0.3 0.0 0.4 0.0 23 2.0 0.0 0.2 0.0 25 1.6 0.0 0.2 0.0 29 0.1 0.0 0.2 0.0 31 0.1 0.0 0.1 0.0 35 1.1 0.0 0.1 0.0 37 1.0 0.0 0.1 0.0 41 0.1 0.0 0.1 0.0 43 0.1 0.0 0.1 0.0 47 0.8 0.0 0.1 0.0 49 0.7 0.0 0.1 0.0

GE Power Systems Energy Consulting D:\AAWork\Interconnecting Generating Companys\Studies Posted on the OASIS\Generator Interconnection Study - 80 MW at Eddy County 345.doc
CASE G-1 08-28-2001 PAGE 3
HARMONIC CURRENT LEVELS IN AMPERES 13.8KV 13.8KV 13KV 13KV 13KV 13KV 345KV
HARM GEN1 GEN2 Rea-2 Rea-5 Rea-7 Rea-11 Rea-H1 1 2519.0 2519.0 222.0 555.0 551.0 555.0 50.0
5 19.5/ 245 19.5/ 245 0.9/ 184 308.8/ 57 20.4/ 7 12.7/ 6 3.1/ 14 7 13.6/ 269 13.6/ 269 0.4/ 180 9.3/ 178 282.5/ 94 14.9/ 3 1.9/ 65 11 9.5/ -51 9.5/ -51 0.5/ 266 8.6/ 265 22.4/ 264 781.8/ 177 1.1/ 116 13 10.1/ -28 10.1/ -28 1.5/ -19 21.8/ -20 51.0/ -20 317.0/ -26 1.2/ 144 17 2.1/ 220 2.1/ 220 0.0/ 247 0.2/ 247 0.4/ 246 1.3/ 244 0.2/ 35 19 1.3/ -34 1.3/ -34 0.0/ -27 0.6/ -27 1.3/ -27 4.3/ -29 0.1/ 141 23 1.5/ 199 1.5/ 199 0.2/ 9 3.1/ 9 6.4/ 9 18.9/ 8 0.2/ 14 25 4.2/ 212 4.2/ 212 0.4/ 31 5.1/ 30 10.4/ 30 29.8/ 29 0.5/ 29 29 0.1/ -21 0.1/ -21 0.0/ 173 0.3/ 173 0.7/ 173 1.9/ 173 0.0/ 155 31 0.1/ 203 0.1/ 203 0.0/ 186 0.3/ 186 0.5/ 185 1.4/ 185 0.0/ 19 35 2.6/ -41 2.6/ -41 0.2/ -39 3.0/ -40 5.9/ -40 15.7/ -40 0.3/ 137 37 0.4/ -25 0.4/ -25 0.1/ -9 0.8/ -10 1.7/ -10 4.4/ -10 0.0/ 149 41 0.2/ 213 0.2/ 213 0.0/ 5 0.0/ 5 0.1/ 5 0.1/ 4 0.0/ 31 43 0.2/ -41 0.2/ -41 0.0/ -21 0.0/ -21 0.1/ -22 0.2/ -22 0.0/ 138 47 0.2/ 209 0.2/ 209 0.0/ 9 0.5/ 9 0.9/ 8 2.5/ 8 0.0/ 23 49 0.8/ 208 0.8/ 208 0.1/ 25 0.9/ 25 1.7/ 25 4.4/ 25 0.1/ 26
THD p.u. 0.011 0.011 0.009 0.558 0.524 1.522 0.081 RSS/FUND. 1.000 1.000 1.000 1.145 1.129 1.821 1.003 I(h)/H 2527.0 2527.0 222.4 621.1 602.5 658.3 51.1 TOT KVAR 18750 18750 1667 2055 1202 4428 2178 KW LOSS 373.5 373.5 33.3 27.6 13.9 28.8 4.5 IT PROD 58004 58004 6230 114153 274929 2081878 6692 D-RATE 0.999 0.999 0.999 0.696 0.581 0.158 0.972 K-FACT 1.0 1.0 1.0 9.2 16.0 300.0 1.4

GE Power Systems Energy Consulting D:\AAWork\Interconnecting Generating Companys\Studies Posted on the OASIS\Generator Interconnection Study - 80 MW at Eddy County 345.doc
CASE G-1 08-28-2001 PAGE 4
PER UNIT HARMONIC VOLTAGES HARM BUS BUS BUS BUS ART_G1 ART_G2 Artesia AmradSV 1 1.0000 1.0000 1.0000 1.0000 5 0.0120 0.0120 0.0150 0.0464 7 0.0118 0.0118 0.0147 0.0312 11 0.0128 0.0128 0.0160 0.0144 13 0.0163 0.0163 0.0204 0.0100 17 0.0044 0.0044 0.0055 0.0159 19 0.0030 0.0030 0.0037 0.0073 23 0.0043 0.0043 0.0053 0.0135 25 0.0130 0.0130 0.0162 0.0230 29 0.0004 0.0004 0.0005 0.0061 31 0.0003 0.0003 0.0003 0.0064 35 0.0112 0.0112 0.0140 0.0105 37 0.0019 0.0019 0.0024 0.0030 41 0.0009 0.0009 0.0012 0.0060 43 0.0010 0.0010 0.0013 0.0037 47 0.0012 0.0012 0.0015 0.0063 49 0.0046 0.0046 0.0057 0.0099 V SUM 1.0990 1.0990 1.1237 1.2135 THD pu 0.0329 0.0329 0.0411 0.0695 V RSS 1.0005 1.0005 1.0008 1.0024 TIF pu 159.25 159.25 198.96 273.09

GE Power Systems Energy Consulting D:\AAWork\Interconnecting Generating Companys\Studies Posted on the OASIS\Generator Interconnection Study - 80 MW at Eddy County 345.doc
Appendix E.
Additional Analysis by EPE
GE Power Systems Energy Consulting D:\AAWork\Interconnecting Generating Companys\Studies Posted on the OASIS\Generator Interconnection Study - 80 MW at Eddy County 345.doc
After review of the preliminary results of the study performed by General Electric (GE), EPE investigators found it necessary to expand the analysis with an additional scenario case. This case involves light load system conditions. The area of concern for EPE is overload problems in the 115 KV system between Amrad 115 KV and Newman 115 KV substations during an Amrad-Caliente 345 KV line contingency. This contingency caused significant overloads during heavy load conditions, analyzed by GE, and appeared to have the potential of even higher levels of overload during a light load condition, when the Artesia DC terminal is operating at it’s full capacity. Because of the location of the proposed generation and the nature of the system problems under investigation, only a single scenario was considered in this analysis. This scenario resembles a sale of the proposed generation into the WSCC grid and the results for this scenario appear to be independent of the scheduled delivery point. Re-dispatching of Newman and Rio Grande generation was used to verify the validity of the above statement. The re-dispatch didn’t affect the results of the analysis and therefore it is safe to assume that this analysis will provide results that are independent of the delivery point. The most recent 2002 New Mexico Light Winter base case was used in this analysis, (the 2003 Light Load case was not available at the time of this analysis). Initially, no modifications were made to this case (Benchmark case). A contingency analysis of transmission lines and transformers in the area between Artesia and Newman substations was performed first. Next, the proposed XXX generation was modeled into the Benchmark case and a set of the same contingencies was analyzed. The results of this analysis were compared to the results derived on the Benchmark case. The results of this comparison is shown below.
4.2.1 Results: No transmission system problems were found during power flow analysis for the Benchmark case. No transmission lines or transformers were loaded above their normal ratings for the base case or emergency ratings during contingencies. All voltages were within acceptable limits. The proposed XXX generation was modeled at a new Artesia 13.8 KV bus and connected to the Artesia 345 KV bus through a 13.8/345 autotransformer provided by XXX. As expected, the Amrad-Caliente 345 KV line contingency caused very significant overloads in the 115 KV transmission system between Amrad 115 KV and Newman 115 KV substations. The Amrad 345/115 KV autotransformer was overloaded by more than 12% above it’s emergency rating. The list of overloaded transmission lines and transformers is presented in the table below.

GE Power Systems Energy Consulting D:\AAWork\Interconnecting Generating Companys\Studies Posted on the OASIS\Generator Interconnection Study - 80 MW at Eddy County 345.doc
System elements overloaded during Amrad-Caliente 345 kv line contingency. Case with the proposed Artesia generation*
5. Bus From 6. Bus To Flow MW Flow MVAR Flow MVA Emergency
Rating % overload
Amrad 115 Oro Grande 115 163.0 -29.8 165.7 159.4 103.95Chaparal 115 Oro Grande 115 -135.0 96.7 166.0 159.4 104.14Chaparal 115 Newman 115 131.4 97.6 163.7 159.4 102.67Amrad 115 Amrad 345 -290.9 43.9 294.2 261.0 112.72Alamogordo 115 Alamotap 115 -108.9 32.3 113.6 105.6 107.58* - Values in the table may be slightly different from values on the transmission maps. This is due to the dependency of map values of the location of measurement . As can be seen in the above table the Amrad-Caliente 345 kv line contingency caused a number of loadings in excess of the emergency rating of overloaded element. To mitigate the above overloads upgrades on the EPE transmission system will be required. These upgrades include an additional 345/115 KV autotransformer at Amrad and re-conductoring of the following EPE 115 KV transmission lines: • Amrad-Oro Grande 115 KV transmission line • Oro Grande-Chaparal 115 KV transmission line • Chaparal-Newman 115 KV transmission line Additionally, some modifications to the existing Amrad 345 KV substation will be required in order to accommodate an additional 345/115 KV autotransformer.
GE Power Systems Energy Consulting D:\AAWork\Interconnecting Generating Companys\Studies Posted on the OASIS\Generator Interconnection Study - 80 MW at Eddy County 345.doc
This study has found that the Amrad/Artesia transmission area is prone to large voltage deviations. These voltage swings may negatively affect the proposed generation forcing it to operate at a low power factor value to mitigate problem. It is recommended that the existing 80 MVAR Amrad reactor be replaced with two smaller reactors of 40 Mvar.
GE Power Systems Energy Consulting D:\AAWork\Interconnecting Generating Companys\Studies Posted on the OASIS\Generator Interconnection Study - 80 MW at Eddy County 345.doc
Appendix F.
Cost Estimates

GE Power Systems Energy Consulting D:\AAWork\Interconnecting Generating Companys\Studies Posted on the OASIS\Generator Interconnection Study - 80 MW at Eddy County 345.doc
7. COST ESTIMATES
The following capital cost estimates are for various modifications to the EPE system required for XXX to interconnect 80 MW generation in 2003. These costs are estimates only at this time using as a basis the information about the XXX Project as supplied by XXX. Project dollar amounts shown are in year 2001 U.S. dollars. 2002 FACILITY MODIFICATIONS COST*
1A. ADDITIONAL AUTO TRANSFORMER (200 MVA) AT AMRAD $1.500 MILLION
1B. 345 KV & 115 KV BREAKERS W/STRUCTURES, SWITCHES, bus work at Amrad $1.279 million Subtotal: $2.779 million
2a. Additional (200 MVA) auto transformer at Caliente $1.500 million 2b. 345 kV & 115 kV breakers w/structures, switches,
bus work at Caliente $2.212 million Subtotal: $3.712 million
3. BUS WORK AT ARTESIA 345 KV SUBSTATION breakers, switches. To convert from “Line Bus” to “Breaker And A Half” bus $2.069 million
Subtotal: $2.069 million
4. THE COSTS ASSOCIATED WITH MODIFICATION

GE Power Systems Energy Consulting D:\AAWork\Interconnecting Generating Companys\Studies Posted on the OASIS\Generator Interconnection Study - 80 MW at Eddy County 345.doc
to the EPE relay and communication equipment $0.500 million Subtotal: $0.500 million
5. Amrad-OroGrande 115 kV line upgrade from $1.600 million 556 MCM to 954 MCM Subtotal: $1.600 million 6. OroGrande-Chaparal 115 kV line from $7.200 million 556 MCM to 954 MCM Subtotal: $7.200 million 7. Chaparal-Newman 115 kV line upgrade from $0.526million 556 MCM to 954 MCM Subtotal: $0.526 million
Total Modifications: $18.386 million
Additional modifications: Replacement of 80 MVAR Amrad reactor $1.000 million Subtotal: $1.000 million
The cost of Artesia DC terminal controls upgrades has not been determined.
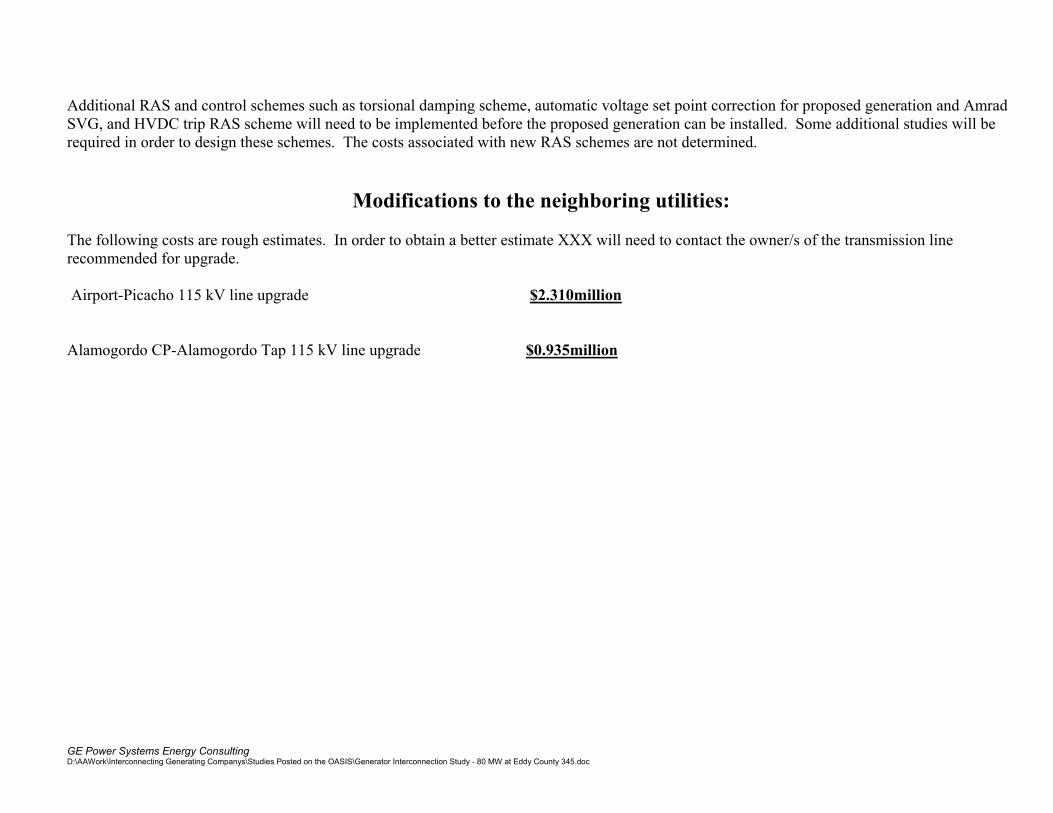
GE Power Systems Energy Consulting D:\AAWork\Interconnecting Generating Companys\Studies Posted on the OASIS\Generator Interconnection Study - 80 MW at Eddy County 345.doc
Additional RAS and control schemes such as torsional damping scheme, automatic voltage set point correction for proposed generation and Amrad SVG, and HVDC trip RAS scheme will need to be implemented before the proposed generation can be installed. Some additional studies will be required in order to design these schemes. The costs associated with new RAS schemes are not determined.
Modifications to the neighboring utilities: The following costs are rough estimates. In order to obtain a better estimate XXX will need to contact the owner/s of the transmission line recommended for upgrade. Airport-Picacho 115 kV line upgrade $2.310million Alamogordo CP-Alamogordo Tap 115 kV line upgrade $0.935million