Embed Size (px)
Citation preview

© 2012, Team Super-mileage and Calvin College
Final Report: Team 16 Supermileage
May 8
2013Andrew D’Agostino (ME) Eric Bixler (ME) Santiago Tinholt-Chiza (ME)

Calvin College Engineering 1
AbstractThis document summarizes the design and manufacturing process taken by the team to build a high fuel economy vehicle to compete in the Society of Automotive Engineers Supermileage® competition. The purpose of the Supermileage® competition is to bring together colleges from the United States and Canada to attempt to achieve the highest possible fuel economy. The competition revolves around good engineering practices. The following design will perform well in the competition.
Table of Content

Calvin College Engineering 2
s
Abstract................................................................................................................................................... 1
1 Project Proposal and Feasibility Study...................................................................................... 31.1 Supermileage® Competition................................................................................................................ 3
1.1.1 Competition Constraints.............................................................................................31.2 Project Management................................................................................................................................ 4
1.2.1 Team Organization.....................................................................................................41.2.2 Schedule......................................................................................................................41.2.3 Budget.........................................................................................................................51.2.4 Method of Approach...................................................................................................6
1.3 Research....................................................................................................................................................... 61.4 Design Process........................................................................................................................................... 7
1.4.1 Aerodynamic Analysis................................................................................................71.4.2 Computer Analysis.....................................................................................................81.4.2.1 Computer Aided Design..........................................................................................81.4.2.2 Computational Fluid Dynamics...............................................................................91.4.2.3 FEA Stress Analysis..............................................................................................121.4.3 Stress Analysis..........................................................................................................121.4.4 Electrical...................................................................................................................161.4.5 Engine Modifications................................................................................................17
1.5 Design Alternatives................................................................................................................................ 181.5.1 Shell Material/Shape.................................................................................................181.5.2 Frame Material/Shape...............................................................................................181.5.3 Engine Tuning Options.............................................................................................211.5.4 Steering.....................................................................................................................221.5.5 Wheels / Tires...........................................................................................................231.5.6 Drivetrain..................................................................................................................24
1.6 Manufacture............................................................................................................................................. 241.6.1 Shell Manufacture.....................................................................................................241.6.2 Frame Manufacture...................................................................................................30
1.7 Conclusion................................................................................................................................................ 32Works Cited..................................................................................................................................................... 33Appendix A: Frame Calculations.............................................................................................................. 34Appendix B: CFD Data………………………………………………………………………………………………………36

Calvin College Engineering 3
1 Final Design Report
1.1 Supermileage® CompetitionThe Society of Automotive Engineers sponsors an annual competition in Marshall, Michigan as part of the Collegiate Design Series. The Supermileage® Competition brings in teams from colleges and universities from not only the United States but Canada as well. Supermileage® began in 1980, but recorded data about the competition begins in 1996. Teams from Calvin College have competed in the competition for two years in a row now. Results from these two teams are presented in the following section.
1.1.1 Competition ConstraintsIn order to promote fair competition between all of the teams, many constraints are put on the vehicles entered into the competition. The complete list of rules and regulations is 28 pages long, so a brief synopsis will be presented here. These rules are presented in the SAE Supermileage® document (http://students.sae.org/competitions/supermileage/rules/rules.pdf)
All power used to propel the car must come from the engine provided by the SAE competition.
The driver must have a forward field of vision ± 80o from the longitudinal axis of the vehicle (perpendicular to the length).
The vehicle needs to be able to maneuver with a 50 foot turning radius The engine used in the competition must be the 1 cylinder, 3.5 horsepower engine
provided by the competition. Modifications are allowed. The engine must be able to run without powering the vehicle. The fuel bottle provided by the competition must be able to be attached and ready to run
in 45 seconds or less. Batteries may only be used for instrumentation, ignition, and other activities that do not
directly power the vehicle. There must be 3 kill switches on the vehicle to ground the engine. (One on each side of
the vehicle, and one within reach of the driver) The roll bar must be 2 inches or more above the driver’s helmet and be able to support a
250 lb force from any direction. The roll bar must also be at least as wide as the driver’s shoulders.
A .032 inch thick firewall made of steel or aluminum must separate the driver from the engine. There are no gaps greater than 0.5 inches allowed in the firewall.
Driver must be able to exit the vehicle in 15 seconds, and driver must be able to be pulled from the vehicle in 20 seconds.
The vehicle must have a 13.2 foot braking distance when traveling at a speed of 15 mph. There must be a brake light on the car that is clearly visible to other drivers.

Calvin College Engineering 4
These are just a few of the important constraints that the team must consider during the entire design process. The rules are checked and enforced during a technical inspection at the beginning of the competition.
1.2 Project Management
1.2.1 Team OrganizationFour mechanical engineering students make up the senior design team from Calvin College Engineering department. The scope of the project was divided into four main categories: frame, aerodynamics, powertrain, and engine. Work was distributed by personal interest and individual skills. The team break down is shown below.
Students Members
Eric Bixler: Frame design and electrical systemSantiago Tinholt-Chiza: Aerodynamic modeling and designAndrew D’Agostino: Drivetrain, steering assembly, and material selection
1.2.2 ScheduleTo manage time, team member Eric Bixler was appointed to maintain the schedule and inform the team of upcoming due dates. When a date for a deliverable was approaching, or if there was an important meeting approaching, the item was added to our senior design station whiteboard. These dates were updated or recognized every team meeting. When a scheduling conflict arose, work was divided and then discussed next team meeting. For long term planning and scheduling, a Gantt chart was created in Microsoft Project. The following figure shows the work plan for the project.
Figure 1: Team Schedule

Calvin College Engineering 5
Table 1: Hours Per PersonTask Hours Research previous design team work 16Fuel injection vs. carbouration 8Economic Analysis 8Plan engine modifications 8Tire and rolling resistance research 10Compression ratio research 8Engine testing 8Ongoing engine modifications 20Research of areodynamic options 8Design of shell 8CAD modeling of shells 6CAD areodnamic testing 4Construction of models for wind tunnel 8Wind tunnel testing 3Analysis of shell shapes 8Find driver and measure for chasis 4Design chasis 8Research shell material options 8Research stearing assemblies 8Integrate stearing with chasis 8Integrate chasis with shell 8Aquire parts 8Assemble vehicle 550Prepartion of PPFS 10Verbal presentations 4Final report preparation 10Compete in SAE competition 20Total Hours 777
1.2.3 Budget Management of the budget was a responsibility of all team members. To keep track of the budget there was a Microsoft Excel spreadsheet that all members had access to. This recorded the monetary amount, description of what was purchased, name of purchaser and the date of purchase. Budget issues are a given in any engineering project. When a budget issue arose (ex. going over budget), the decision on seeking more funds will be based on improvement of

Calvin College Engineering 6
performance versus cost. The specified budget for the Supermileage entry was roughly $2100.
Table 2 Team 16 BudgetTeam Budget $ VendorSAE Registration 650.00$ SAEEngine Modifcation 100.00$ Shell Materials 605.00$ West SystemsGas 20.00$ Plug for Molding -$ Betz IndPlexiglass -$ ShopWheels 190.00$ VelocityTires / Tubes 98.00$ Alger BikeAluminum Tube / Channel 70.00$ Alro MetalsAluminum Sheet 25.00$ Alro MetalsTransmission 140.00$ McMaster CarrPlastic 40.00$ LowesPaint 80.00$ Physical PlantMisc 96.00$ Electronics 70.00$ 3-D Printing 80.00$ CalvinTotal 2,264.00$
1.2.4 Method of ApproachThere are numerous modifications that can be made to a vehicle to increase its fuel efficiency. Our approach to designing a vehicle more efficient than past Supermileage vehicles was to focus on changes that will provide the greatest increase in efficiency. From researching and studying previous team’s reports, we learned from others mistakes and avoided wasting time on changes that have a low success rate or ideas that did not improve the vehicle performance.
1.3 ResearchThis project required constant research regarding various topics that need to be addressed throughout the entire design and construction phase. Reading and gaining knowledge for every component of the vehicle was vital for the success of the project. Many of the design aspects that came into the development of the vehicle were new to the members on the team. Topics that required hours of inquiry are as follows: four-stroke Briggs and Stratton engines, aerodynamics, design norms, electrical power distribution, frame FEA analysis, exhaust heat reduction, gearing and transmission techniques, ICE maintenance, and steering assembly design.

Calvin College Engineering 7
1.4 Design Process
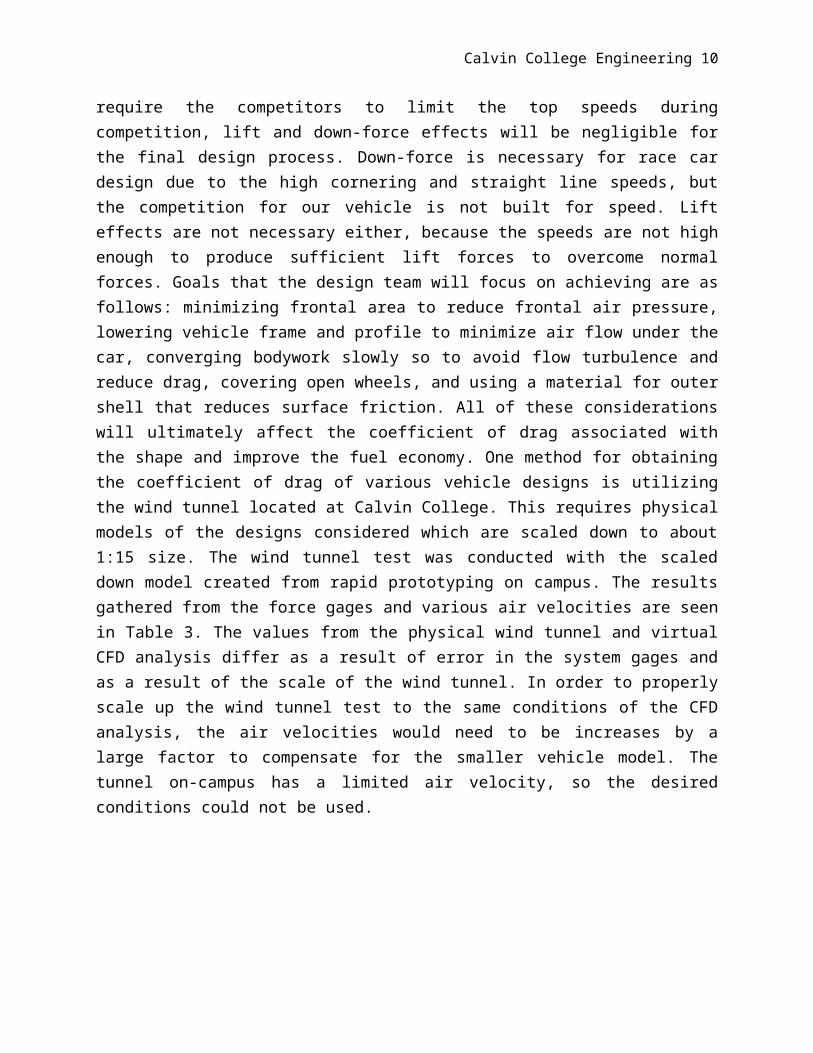
1.4.1 Aerodynamic AnalysisThe drag forces acting on the vehicle during operation can be lessened by designing a more aerodynamic profile for the outer shell. The most important factors regarding drag reduction considered during the design process are frontal area, frontal pressure, and rear vacuum effects on the vehicle. One method for minimizing the air pressure at the front of vehicle is to decrease the frontal surface area. This reduction in surface area for the air to hit will result in less air molecules compressing. It was imperative that the frontal profile was aerodynamically shaped to prevent large pressure differences on the surface of the shell. As a designer, you want to create a streamline that cuts through the air at speed, and prevent turbulent flow. Another consideration was the effect of flow detachment from the rear profile of the vehicle. Flow detachment is the rear vacuum that occurs when vehicles produce holes left in the air when they operate. More aerodynamic shapes will reduce the vacuum area behind the vehicle. The designs we are considering all have the rear profiles converging to one point. Since the SAE regulations require the competitors to limit the top speeds during competition, lift and down-force effects will be negligible for the final design process. Down-force is necessary for race car design due to the high cornering and straight line speeds, but the competition for our vehicle is not built for speed. Lift effects are not necessary either, because the speeds are not high enough to produce sufficient lift forces to overcome normal forces. Goals that the design team will focus on achieving are as follows: minimizing frontal area to reduce frontal air pressure, lowering vehicle frame and profile to minimize air flow under the car, converging bodywork slowly so to avoid flow turbulence and reduce drag, covering open wheels, and using a material for outer shell that reduces surface friction. All of these considerations will ultimately affect the coefficient of drag associated with the shape and improve the fuel economy. One method for obtaining the coefficient of drag of various vehicle designs is utilizing the wind tunnel located at Calvin College. This requires physical models of the designs considered which are scaled down to about 1:15 size. The wind tunnel test was conducted with the scaled down model created from rapid prototyping on campus. The results gathered from the force gages and various air velocities are seen in Table 3. The values from the physical wind tunnel and virtual CFD analysis differ as a result of error in the system gages and as a result of the scale of the wind tunnel. In order to properly scale up the wind tunnel test to the same conditions of the CFD analysis, the air velocities would need to be increases by a large factor to compensate for the smaller vehicle model. The tunnel on-campus has a limited air velocity, so the desired conditions could not be used.

Calvin College Engineering 8
Table 3: Physical Wind Tunnel TestAir Speed (m/s) Force Drag (N) Drag C
18 0.012 0.16626 0.017 0.17135 0.023 0.12643 0.028 0.15645 0.030 0.152
1.4.2 Computer Analysis
1.4.2.1 Computer Aided DesignThe second method used for the project is Solidworks CAD software to model the shell. Using the Solidworks model, a virtual flow simulation will then be performed using Autodesk CFD 2013. Designing and rendering the CAD models in Solidworks has proven to be a useful method as opposed to creating/purchasing physical models. The method for correctly sizing the dimensions of the shell involves importing the CAD frame design and forming a shape around it. The shell designs in Solidworks were modeled as two separate parts. The top and bottom halves of the shell can be seen for prototypes (1-7) in Figure 3. The corresponding drag coefficients and drag forces for each prototype are displayed in the figure below as well. Last year’s shell was designed as well and run through the CFD. This allowed the team to compare data with last year’s car. The team goal of reducing the frontal area of this year’s shell from last year was achieved. The goal set was to reduce frontal area by 15%. All seven prototypes have achieved this goal. The final design chosen P8 has a 30% reduction in frontal area from last year. This design is shown further into the report.
The final optimized shell design P-8 is shown in Figure 2-A, along with the frame oriented inside.
Figure 2-A: Calvin College SM-13 P8 chassis

Calvin College Engineering 9
Figure 2-B: Prototypes 1-7 top and bottom shell
1.4.2.2 Computational Fluid DynamicsComputational fluid dynamics software will be utilized for the aerodynamic properties associated with each prototype design for the shell. The package that the team is using this year will be Autodesk CFD 2013. This program will serve as the primary method to obtain drag forces and drag coefficients of the considered designs. Validation of the software for virtual wind tunnel testing was necessary before any of the new shell designs could be tested. The initial test method done to validate the software was an external flow analysis over a sphere using air as the active fluid. A solid sphere was modeled in Solidworks and then imported into CFD program, where a full range of Reynolds numbers was tested. The range of Reynolds numbers in the flow trials (0.4 < Re < 640,000) allowed for a dataset of drag coefficients and pressure levels to be determined based on air velocity. Numerous iterations were solved for in the full analysis, and using a refined mesh zone consisting of over 900,000 nodes, accurate readings for frontal and rear pressures were determined. Global velocity and pressure profiles are shown in Figure 3. A vital goal that the team will hope to achieve while designing the shell is to reduce the frontal and
Calvin College Engineering 10
rear pressure levels. This would result in a reduced drag force on the vehicle, and thus better fuel economy.
Figure 3: CFD velocity and pressure profiles (velocity of air = 50 m/s)
Comparison of the CFD and existing external flow studies was the next step. It was necessary to construct a plot that represented the average drag coefficient of the sphere as a function of the Reynolds number of flow. Data for the average drag coefficient for flow over a sphere was taken from Çengel, Yunus A., and Michael A. Boles. Thermodynamics: An Engineering Approach. This data is shown in Figure 4 as a plot. The CFD data compounded was then used to create similar data plot including the same parameters. The data from the CFD software is shown in Figure 6. It was concluded that the two sets of data were consistent with each other and that validation for the software was successful. The section of the plots to focus on are the region of (10 < Re < 1000). This is the region where air over the sphere is not yet in the turbulent boundary and the phenomena of flow wake occurs.
Calvin College Engineering 11
Figure 4: Average drag coefficient for flow over cylinder and sphere (Cengel Data)
Figure 5: Average drag coefficient for flow over sphere (CFD data)

Calvin College Engineering 12
1.4.2.3 FEA Stress Analysis
In order to further analyze the frame as a whole, it was drawn using Autodesk Inventor Professional 2012. The 3D model was then exported into Autodesk Simulation Multiphysics 2012 to run a stress analysis with forces applied to the frame based on weights. The program created a mesh that connected all the members, and then made it easy to select the nodes. The sections that were connected to wheels were considered the fixed nodes (circled sections on figures). The results are shown in the figure below. The range on coloring is as follows: dark blue=0 psi, red=30000 psi.
Figure 6: FEA stress analysis results (Rollbar force downward)
As shown, the maximum stress in the entire frame is about 20000 psi, which is a factor of 2 under the yield stress limit for aluminum 6061-T6. This proves that the frame is safe for use in the vehicle. As is evident in both previous figures, the higher stresses are not across the entire frame, but in different localized sections. Most sections of the frame undergo stresses under 5000 psi.
1.4.3 Stress Analysis
The frame has many constraints revolving around it. As was presented in section 1.4.2, the roll bar must support a 250 pound force from any direction, be wider than the driver’s shoulders, and extend at least 2 inches above the driver’s helmet. The frame must also be able to support the

Calvin College Engineering 13
weight of the driver, engine, shell, and any other components of the vehicle. The final result is that the frame must support a weight of over 400 lb.
In the current frame design, the majority of the load will be placed on the four beams at the base of the frame. The beams are shown on a 3D model of the frame in figure 9. For simplified calculations as a material comparison tool, these four beams were combined into two beams that would run the length of the vehicle. The load profile of these simplified beams is shown in figure 9.
Figure 8: Vehicle Frame

Calvin College Engineering 14
Figure 9: Force distribution along the main support beam
A stress analysis was then done in the program EES for the simplified system. This was only to get an idea of what material to use and what thickness. This calculation sheet is presented in appendix A. In the model, all of the forces were combined into one equivalent force at a specific length along the beam. The forces are presented in table 4 below.
Table 4: Forces on the frame
The forces in table 1 were calculated using two simple laws of physics. The first is that the forces on the beam must sum to zero. The second is that the moments must also sum to zero. These two equations were used to calculate the resultant forces, R1 and R2. Then, using the same two principles, the equivalent force and position was calculated for Fequivalent. Using the position for Fequivalent, the maximum moment was calculated. Then, the maximum moment (M max) was used to calculate the maximum stress (σ max) in the beam using equation 1 (Riley 481).
σ max=M max c
IEqn 1
The maximum moment is simply the moment calculated at the position of the equivalent force. The term ‘c’ refers to the furthest distance from the neutral axis, which happens to be half the

Calvin College Engineering 15
height of the beam. The moment of inertia is denoted by I, which is calculated using equation 2 (Riley 660-661,677).
I=bh3
12−
binside hinside3
12Eqn 2
In equation 2, b is the base length on the outside of the rectangular tubing, and b inside is the base length on the inside of the tube. The height is denoted by h, and the inner height is given by hinside. A brief diagram is shown in figure 10.
Figure 10: Beam moment of inertia variables
In EES, a system of equations set the maximum stress in the beam to have a safety factor of 2. Then, given tube wall thickness, a side length of the beam was calculated. The beam dimensions were then turned into a weight, which is presented in table 5.
Table 5: Calculated beam thicknesses to achieve a safety factor of 2
MaterialBeam
Thickness (in)
Beam Mass (lbm)
Aluminum 6061-T6 0.110 2.6Steel ASTM A-500 0.027 2.06304 Stainless Steel 0.160 10.5
hinside
binside
b
h

Calvin College Engineering 16
Going by the results in table 5, the steel appears to be the best choice for the material in the frame. These values are based on a beam base of 1 inch and a height of 1.5 inches. However, when considering the purchase of the tubing, not all sizes are available. The closest size for steel that is readily available is about .0625 inches, and aluminum can be purchased at a thickness of .125 inches. When accounting for these thicknesses, the aluminum becomes the better choice. The updated table is shown below.
Table 6: Updated beam thickness comparison table
MaterialBeam
Thickness (in)
Beam Mass (lbm)
Aluminum 6061-T6 0.125 2.96Steel ASTM A-500 0.048 3.64
After the analysis, it is decided that the aluminum frame will be the best choice. This is to minimize the weight, which will in turn boost the fuel economy.
1.4.4 Electrical Per SAE Competition requirements, the Supermileage vehicle must be equipped with:
Electric Start Brake light 3 Kill Switches Fused Circuit
The following schematic shows the electrical layout for our vehicle:

Calvin College Engineering 17
Figure 11: Electrical Schematic
The kill switches are wired so that if any of them are set to the “kill” position, the magneto is immediately grounded and cannot transmit a current to the spark plug, causing the engine to die. The electric start is connected through a push button to a motor that spins a gear meshed with the flywheel. Assuming all kill switches are set to “run,” this should start the engine almost immediately. The brake light is connected via a switch that connects the circuit when the brakes are activated. Since there are 2 sets of brakes, there are 2 switches that need to be in this circuit. If either one trips, the brake lights turn on. A basic circuit layout is shown in figure 11.
1.4.5 Engine Modifications Modifications to the engine hold vast potential in improving mileage. Engine modification can also be a highly time consuming effort that may result in decreased mileage and reliability. Balancing the risks with the rewards is essential in this endeavor. It is also important to keep engine modifications within budget. These considerations were kept in mind as we researched possible engine modifications. To see a description of the engine as well as alternatives see the engine tuning options section.

Calvin College Engineering 18
1.5 Design Alternatives
1.5.1 Shell Material/ShapeThe desirable material for this design has not only strength-to-weight properties, but also a reasonable application time and purchase cost. Table 7 shows the initial shell material considerations.
Table 7: Summary of potential shell materials
Monokote is a plastic shrink wrap that is used to cover remote controlled airplanes. This material is extremely lightweight and fairly puncture resistant however, it requires an internal structure to support it. With the curvature of our final shell, fabricating a structure to support the material would be difficult therefore this option was not chosen. Vacuum forming a plastic such as PETG was also looked into. This would dramatically shorten shell fabrication time, but the need of a high temperature susceptible mold, ruled out vacuum forming because of costs. In order for the team to create the outer shell using Carbon Fiber, Dacron, or Fiberglass, a Styrofoam plug scaled 1:1 to our desired exterior design was necessary. Betz Industries, a local company, donated the plug. Betz Industries uses a full mold casting process to produce iron castings created from Styrofoam CNC machines. Betz Industries requires a solid model of the desired part the customer wants. A single CAD file was enough to create the plug for our vehicle. The plug can be used to form that shape of the car when a composite fabric is applied over it. The fabric chosen for the shell material was 4 oz. fiberglass. The choice was a function of the material having a necessary strength to weight ratio as well as cost. Carbon Fiber offered unnecessary amounts strength at a high price. Dacron was calculated to be more expensive than fiberglass by $6 / yard.
1.5.2 Frame Material/ShapeWhen designing the frame for a vehicle, the material is one of the main decisions to affect the final product. The main point of the frame material is to provide stability, yet be as low weight as possible. The comparison tool for the materials that was used before analysis is something

Calvin College Engineering 19
referred to as the strength density. This is the yield strength divided by the density, so as to give some sort of number to strength per pound of the material. The values for Aluminum 6061-T6, SAE Steel 4340 and 304 Stainless Steel were analyzed. Results are presented in table 8.
Table 8: Mechanical properties of metals
Density, modulus of elasticity, rigidity, and yield strength were all found in tables (Riley 700, http://asm.matweb.com/search/SpecificMaterial.asp?bassnum=MQ304A). As is shown in table 7, the strength density seems to point to steel as being the best choice. However, after analysis, the aluminum tubes proved to have the greater advantage. This choice was described in section 1.5.3.
For the frame shape, the basic outline comes from the 2011-2012 team design. However, to achieve less aerodynamic drag, the shape is about 8 inches shorter than the previous design. In order to achieve this design, we realized that the only thing keeping the driver sitting more upright was the steering assembly. Even though the driver could slide further down into the vehicle, the steering assembly was in the way. In order to combat this problem, the steering assembly was moved up slightly and forward. The next issue was wasted space beneath the driver. In order to combat this problem, the front beams were moved apart to allow the driver to be seated in between and below the two members.
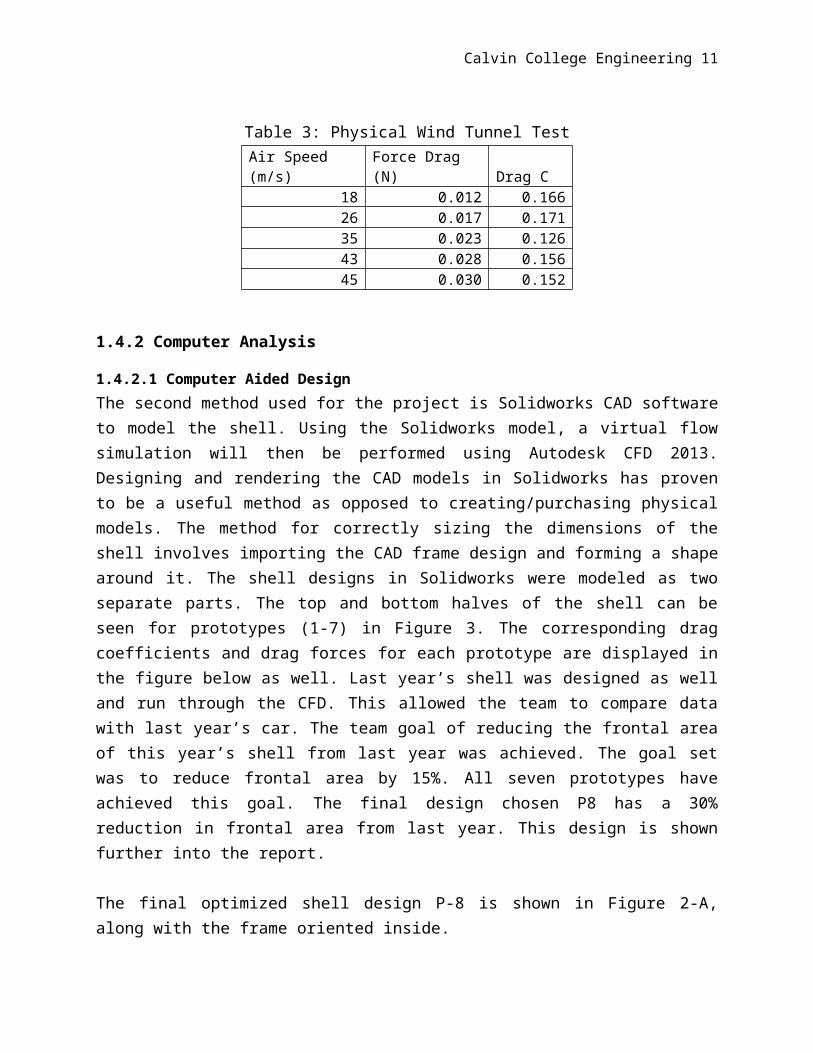
The final design for the roll hoop is presented in figure 12. The height from bottom to top is 21 inches, and from the very right side to the very left side is 17 inches. This fits in the constraints of the competition, as the shoulder width of the driver is only 16.5 inches, and in driving position, the driver’s head is 18 inches above the seat. This gives 3 inches of freedom before running into the roll bar height constraint.

Calvin College Engineering 20
Figure 12: Roll bar geometry to fit in the competition constraints.
In order to make the roll bar, there was a choice between bending the tubing or welding. After some decisions, the decision was made that bending the tube would retain the highest strength in the material.
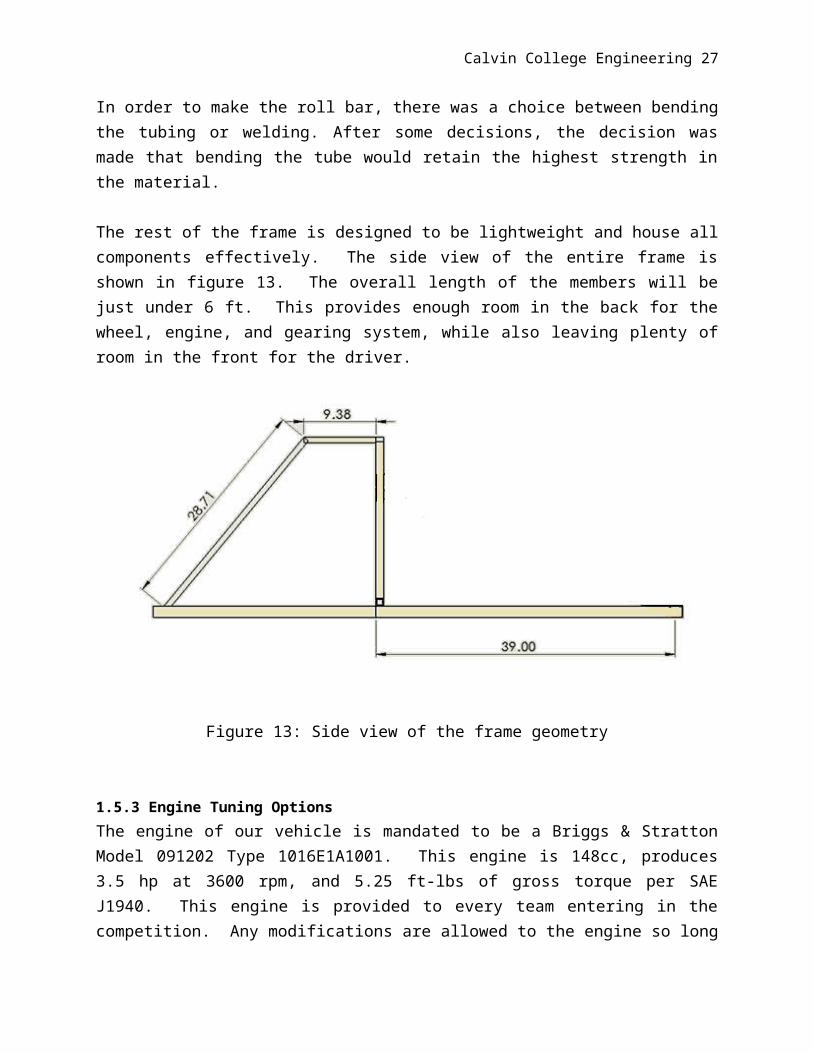
The rest of the frame is designed to be lightweight and house all components effectively. The side view of the entire frame is shown in figure 13. The overall length of the members will be just under 6 ft. This provides enough room in the back for the wheel, engine, and gearing system, while also leaving plenty of room in the front for the driver.

Calvin College Engineering 21
Figure 13: Side view of the frame geometry
1.5.3 Engine Tuning OptionsThe engine of our vehicle is mandated to be a Briggs & Stratton Model 091202 Type 1016E1A1001. This engine is 148cc, produces 3.5 hp at 3600 rpm, and 5.25 ft-lbs of gross torque per SAE J1940. This engine is provided to every team entering in the competition. Any modifications are allowed to the engine so long as the crankcase and cylinder are original. Fuel provided at the completion will be iso-octane (2,2,4-Trimethylpentane). Iso-octane is the standard 100 octane fuel on the 0-100 scale seen by motorist at the pump.
We are currently planning on using an aftermarket carburetor scrapped from last year’s engine to provide air to the combustion process. The carburetor is a Mikuni VM model and allows for easier air-fuel mixture optimizing and idling speed of the motor. The desired idle performance of the engine will need to be as lean as possible, to conserve fuel during start-up and low speed operation.
The best mileage is obtained when the spark plug fires just as the piston has completed its compression stroke and is beginning its power stroke. Adjustments to the ignition timing can result in reliability issues and engine vibrations. Valve timing is closely related to ignition firing. The Briggs & Stratton engine provided to the competitors controls valve timing via an adjustable gear tied to a camshaft housed in the crankcase. The stock valve timing keeps the exhaust and intake stokes completely separate. There is a potential for higher mileage when the intake valve opens slightly before the exhaust valve closes. This flushes out remaining waste gas.

Calvin College Engineering 22
Modification to the cam profile can advance the opening of the intake valve and keep the valve open until the piston reaches bottom dead center (BDC).
Finally, we will increase the compression ratio of the stock engine. When the compression ratio is increased the pressure ratio also increases. The result of these increases is that the potential for expansion in the power stroke is greater. We can increase our compression ration by adding a sleeve to the cylinder or by welding material to the head or piston. The stock head ratio is 6.6:1; we are increasing the ratio to 7.2:1 by adding material to the head.
In summary, we will be running our Briggs & Stratton engine carbureted at an increased compression ratio.
1.5.4 SteeringTo make the make the manufacture of the steering column easier several changes were made from the previous years this can be seen in figure 14.
Figure 14: Comparison of steering assemblies (Left: 2012, Right: 2013)
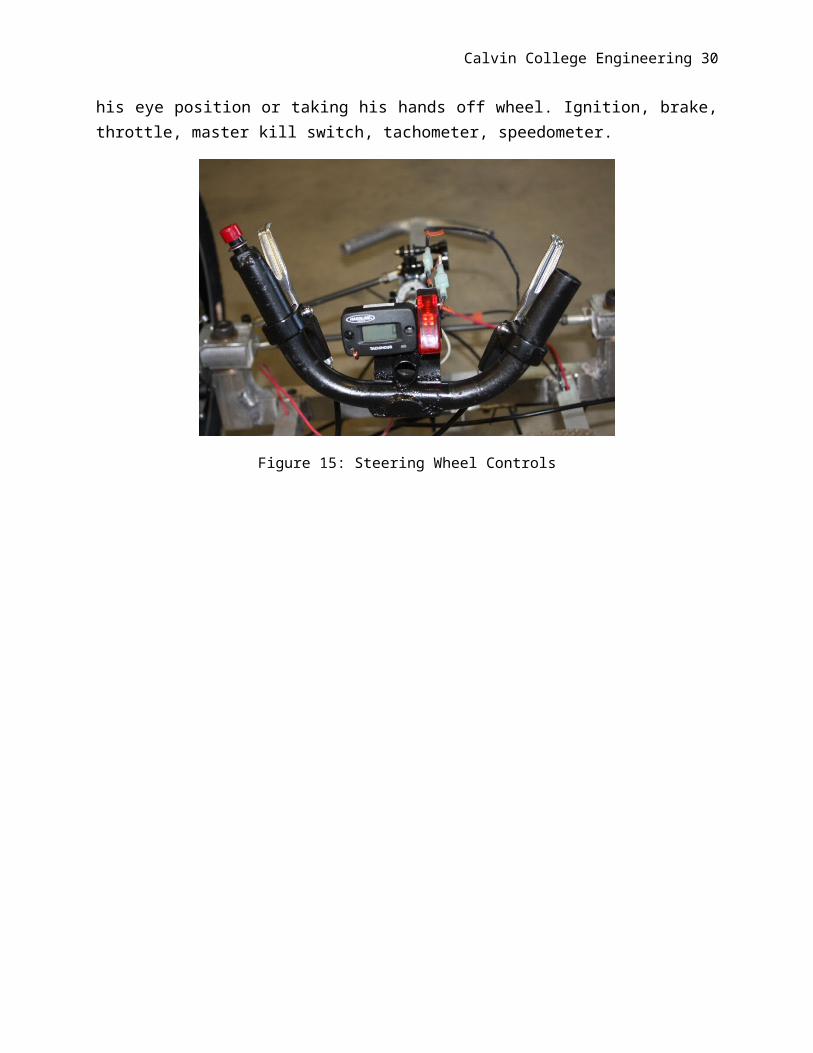
By changing the design of the steering column it allowed for a reduced amount of welds as well as more simple weld geometry- the only angle that has to be accounted for was were the square stock was welded to the cylinder that housed the steering wheel rod. The steering wheel itself was also dramatically changed for this year. On the 2012 car the steering wheel only allowed the driver to steer, brake and accelerate. For the driver to start or kill the engine he would have to take his hands of the steering wheel. For 2013 these controls were added to the steering wheel itself as shown in the following figure. The wheel this year includes the following functions for the driver to engage without changing his eye position or taking his hands off wheel. Ignition, brake, throttle, master kill switch, tachometer, speedometer.

Calvin College Engineering 23
Figure 15: Steering Wheel Controls
1.5.5 Wheels / TiresTo minimize the frontal area of the vehicle, the front wheels will be sized at 20 inches and the rear wheel at 27 inches. Rolling resistance was a sacrifice, for aerodynamic efficiency. The front tires are Maxxis Hookworm rated at 85 to 110 psi. The rear tire will be a 27 inch tubeless Continental Podium rated at 120 psi. The wheels will be mounted to the vehicle using a 20 mm thru axle hub custom axle assemblies. Figure 15 shows the axle assemblies.
Figure 16: Custom Axle Assemblies

Calvin College Engineering 24
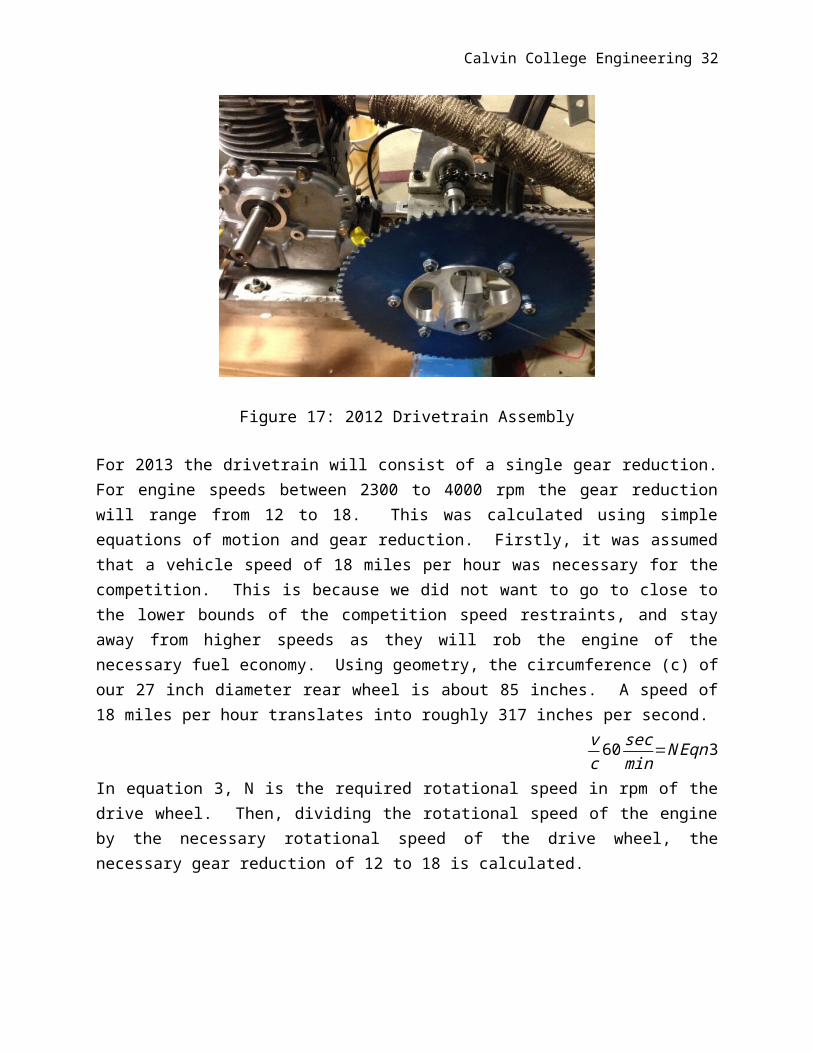
1.5.6 DrivetrainThe following figure shows a picture of the drivetrain used by last year’s Supermileage team.
Figure 17: 2012 Drivetrain Assembly
For 2013 the drivetrain will consist of a single gear reduction. For engine speeds between 2300 to 4000 rpm the gear reduction will range from 12 to 18. This was calculated using simple equations of motion and gear reduction. Firstly, it was assumed that a vehicle speed of 18 miles per hour was necessary for the competition. This is because we did not want to go to close to the lower bounds of the competition speed restraints, and stay away from higher speeds as they will rob the engine of the necessary fuel economy. Using geometry, the circumference (c) of our 27 inch diameter rear wheel is about 85 inches. A speed of 18 miles per hour translates into roughly 317 inches per second.
vc
60 secmin
=N Eqn3
In equation 3, N is the required rotational speed in rpm of the drive wheel. Then, dividing the rotational speed of the engine by the necessary rotational speed of the drive wheel, the necessary gear reduction of 12 to 18 is calculated.
1.6 ManufactureAs with any design, there is always a build stage. This next section details the larger portions of the manufacturing of the vehicle.
1.6.1 Shell ManufactureThe most important part of the shell manufacturing process was the Styrofoam plug donated to the team by Betz Industries. This was made using CNC milling machines that cut out different

Calvin College Engineering 25
blocks of Styrofoam, which were then glued together to form the shape of the shell that was presented in section 1.4.2.1. The employees at Betz took the 3D CAD file that we sent them and made the Styrofoam mold from it. The mold is shown in figure 18.
Figure 18: Styrofoam Mold donated by Betz Industries
The next step was to slice the mold in half so that we could make the shell in 2 halves. This was done using a hot wire mounted in between two wooden posts. These posts were clamped to heavy steel pieces, so that pushing the Styrofoam through the hotwire would not drag the wooden frame with it. The hotwire was set at the height we desired, and then the Styrofoam was slowly pushed through the hotwire.
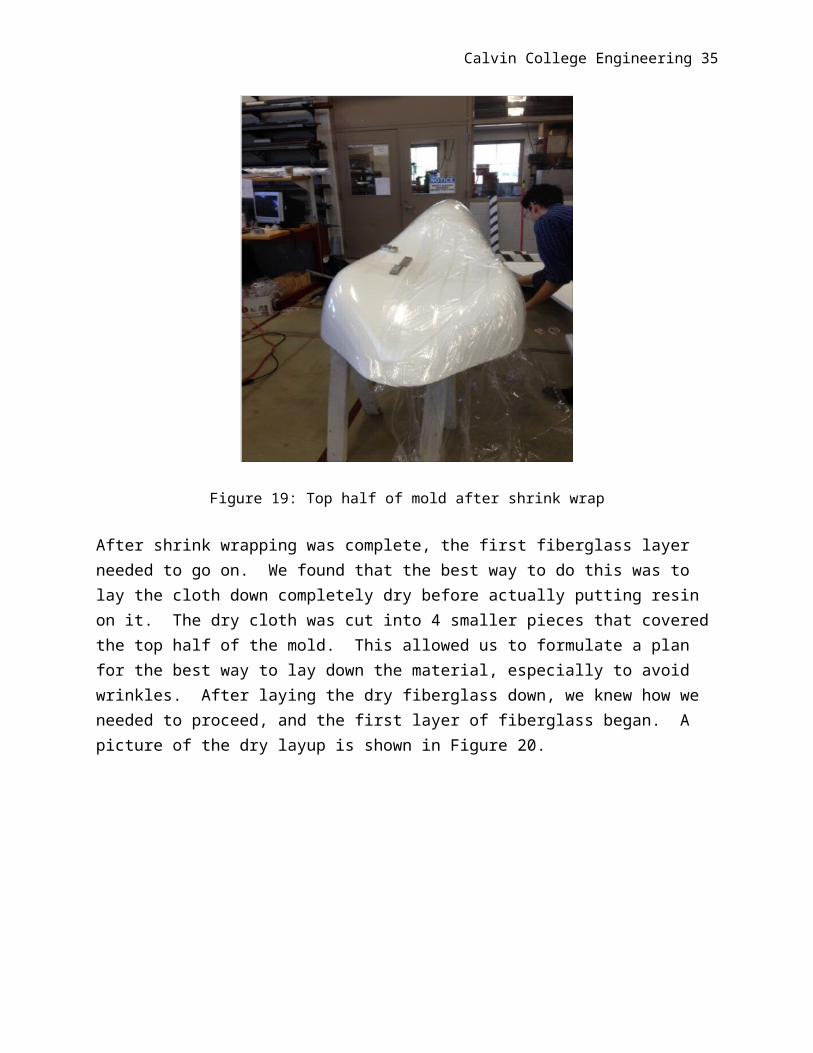
After the mold was in two pieces, the first step was to make sure that the fiberglass would release from the mold. In 2012, the Supermileage team spent a week grinding the Styrofoam out of their shell. This was a time consuming process that we wanted to avoid. The reason that the fiberglass sticks to the Styrofoam is the resin is absorbed by the Styrofoam, creating a bond between the fiberglass and the mold. This is what we didn’t want. After consulting with Phil Jasperse and Professor Nielsen on many occasions, as well as testing ideas we settled on covering the Styrofoam in shrink wrap to create a barrier between the Styrofoam and resin. This was done using standard shrink wrap purchased from Lowe’s hardware store. The wrap was put on the mold, taped down, and blown on with a heat gun to pull the wrap tight and remove any imperfections. Figure 19 shows the top half of the mold halfway through being wrapped. The left half of the mold is complete, and shows a smooth surface on which to lay the fiberglass.
Calvin College Engineering 26
Figure 19: Top half of mold after shrink wrap
After shrink wrapping was complete, the first fiberglass layer needed to go on. We found that the best way to do this was to lay the cloth down completely dry before actually putting resin on it. The dry cloth was cut into 4 smaller pieces that covered the top half of the mold. This allowed us to formulate a plan for the best way to lay down the material, especially to avoid wrinkles. After laying the dry fiberglass down, we knew how we needed to proceed, and the first layer of fiberglass began. A picture of the dry layup is shown in Figure 20.
Calvin College Engineering 27
Figure 20: Dry fiberglass laid out for epoxy coating
After the dry layer was laid down, 3 of the cloths were removed and the epoxy coating was laid down starting back to front. During this process, knowing where to place the next piece of cloth sped up the process a lot.
After the first layer of fiberglass was completely finished, a foam layer was added to increase the rigidity of the shell. The foam was purchased from Lowe’s at $35 for 200 square feet, which was much more than required. Laying the foam layer required a lot of patience. The foam was cut into small strips that were able to follow the contours of the shell. This was more of a trial and error process rather than a planned process. Any strip that required more than adhesion between the epoxy and the foam was tacked into the Styrofoam using nails. After a section was completed, the outside was stretch wrapped to hold all of the foam pieces in place. After the stretch wrap went on, it was important to remove every single nail; otherwise the fiberglass would stick to the mold because of the nails rather than the epoxy. A picture of the top half is shown during the foam laying process in figure 21.

Calvin College Engineering 28
Figure 21: Foam layer of the shell
In the back of figure 21, the stretch wrapping is visible. In the front, the foam laying process is visible. The aluminum blocks are there to keep the shrink wrap underneath from lifting up and deforming the fiberglass. After the foam layer was complete, it was necessary to let the layer cure before removing the stretch wrap. We waited about 15 hours for this, and then removed the stretch wrap and any remaining nails. Then, the final layer of fiberglass was laid down in a similar fashion to the first layer. The top half of the shell (after the final fiberglass layer) is shown in figure 22.

Calvin College Engineering 29
Figure 22: Shell after final layer of fiberglass
After this final layer of fiberglass was laid and cured, the excess was trimmed off the bottom. Then, a flat head screwdriver was used to slightly pry the edges away from the mold. Handles were melted into the mold itself so that we could get a better grip while trying to remove the Styrofoam. After about 15 minutes of rocking the mold and working it, the shell slid right out.
After the shell came out, it was sent to the Calvin Physical Plant to be painted. After painting, a strip of aluminum was riveted along the bottom of the top half of the shell. This provided a way to keep the top half from sliding off of the bottom during operation. The final shell (without plexiglass in the windows) is shown in figure 23.
Calvin College Engineering 30
Figure 23: Final shell shape
1.6.2 Frame Manufacture
As presented in section 1.4.3, aluminum 6061-T6 was the choice of material for the frame. This is a particularly difficult material to weld, so a lot of time was taken to learn how to TIG weld. TIG welding is an arc welding process where the heat is controlled by a foot pedal and the filler material is fed in by hand. It takes a lot of practice to master, and Andrew D’Agostino became a proficient welder. This made him our group welder, so when pieces needed to be welded, Andrew was the guy who did it.
Our material was ordered in 2 sizes: 1”x1.5” tubing and 1”sq tubing. Both tube sizes were 1/8” wall thickness. Then, .75”square L-channel was used for the supports in the rear. Most of the frame was welded; however bending was taken advantage of wherever it was possible. The roll bar was bent using a tube bender that was fabricated by Phil Jasperse. This proved to be a difficult task, as the aluminum was not flexible enough to make the bends without cracking. In order to combat this problem, the material was heated in the bend areas with an acetylene torch, which brought some flexibility to the material. Once the roll bar was completed, the material was placed in an oven overnight to regain the original strength properties.
The rear L-channels were also bent, after cutting a v-shaped area out of the bend area. This allowed the material left in that section to fold in nicely, and the resulting crack in the channel could be welded closed. All other pieces of the frame were welded. An image showing the final frame is shown in figure 24.

Calvin College Engineering 31
Figure 24: Final frame after fabrication (front)
Figure 25: Final frame after fabrication (back)
Calvin College Engineering 32
1.7 Conclusion After completing this project, there are quite a few things we have learned. There is also quite a bit that we would do differently if there was a next time. The main things we learned were:
Budget your time well, and stick to any schedule you make at the beginning. Everything takes longer than you expect it to. There will be problems, so budget extra time at the end of the project. Be looking to save money at any time, because you might need it later.
We believe that this vehicle will perform competitively, and we are excited to see how it matches up against the 27 other teams involved in the competition. We have enjoyed the design and manufacturing processes, and we hope that a team in 2013-2014 will try to take our design and make their own improvements to it.

Calvin College Engineering 33
Works CitedRiley, William F., Leroy D. Sturges, and Don H. Morris. Mechanics of Materials. Hoboken, NJ: John Wiley, 2007. Print.
"ASM Material Data Sheet." ASM Material Data Sheet. Aerospace Specification Metals, n.d. Web. 18 Nov. 2012. <http://asm.matweb.com/search/SpecificMaterial.asp?bassnum=MQ304A>.
Çengel, Yunus A., and Michael A. Boles. Thermodynamics: An Engineering Approach. New York: McGraw-Hill, 2011. Print.
"2013 SAE SUPERMILEAGE® RULES." SAE International. Web. 17 Sep. 2012. <http://www.sae.org/domains/students/competitions/supermileage/>.
Calvin College Engineering 34
Appendix A: Frame Calculations
g=32.2 [ft/s^2]
"Steel"sigma_y=135 [ksi]rho=.283 [lbm/in^3]E=29000 [ksi]
"Aluminum 6061-T6"{sigma_y=40 [ksi]rho=.098 [lbm/in^3]E=10000 [ksi]}
"304 Stainless Steel http://asm.matweb.com/search/SpecificMaterial.asp?bassnum=MQ304A"{sigma_y=31.2 [ksi]rho=.289 [lbm/in^3]E=12500 [ksi]}
"Analysis of 2 main support beams"L_beam=5.75 [ft]L_tot_rollbar=55 [in]L_side_beam=1 [in]t_beam=.0625L_inside_beam=L_side_beam-2*t_beamA_xs=L_side_beam^2-L_inside_beam^2V_rollbar=L_tot_rollbar*A_xsm_rollbar=V_rollbar*rhom_engine= 30 [lbm]m_shell= 25 [lbm]m_driver=140 [lbm]F_rollbar=260 [lbf]F_engine=m_engine*g*convert(lbm-ft/s^2,lbf)F_shell=m_shell*g*convert(lbm-ft/s^2,lbf)F_driver=m_driver*g*convert(lbm-ft/s^2,lbf)x_shell_1=.5 [ft]x_R1=0 [ft]x_driver= 2.5 [ft]x_rollbar=3.6 [ft]x_engine=4 [ft]x_shell_2= 5.5 [ft]x_R2= 5.75 [ft]
"Sum of the forces equal 0"R_1+R_2-.5*(F_shell+F_driver+F_engine+F_rollbar)=0R_1+R_2-F_apparent=0
"Sum of the moments equal 0"
Calvin College Engineering 35
.5*((F_shell/2)*(x_shell_1-x_R1)+F_driver*(x_driver-x_R1)+F_rollbar*(x_rollbar-x_R1)+F_engine*(x_engine-x_R1)+(F_shell/2)*(x_shell_2-x_R1))-R_2*(x_R2-x_R1)=0R_2*(x_R2-x_R1)-F_apparent*(x_apparent-x_R1)=0
"Maximum Deflection: Treated as a single equivalent force"base=1 [in]h=1.5 [in]I_beam=(base*h^3)/12-((base-2*t_beam)*(h-2*t_beam)^3)/12a=x_apparent*convert(ft,in)b=(L_beam-x_apparent)*convert(ft,in)L=L_beam*convert(ft,in)delta_max=(-F_apparent*b*(L^2-b^2)^(3/2))/(9*3^(.5)*L*E*convert(ksi,psi)*I_beam) "Pg 702 Mechanics of Materials"M_max=R_1*X_apparentc=h/2sigma_max*convert(ksi,psi)=M_max*convert(ft,in)*c/I_beam{sigma_max*2=sigma_y}
W_beam= A_xs*L_beam*convert(ft,in)*rho

Calvin College Engineering 36
Appendix B: CFD Data
Prototype Force Drag (N)Frontal Area [m^2] Drag C Speed (m/s)
2012 9.7146 0.2870.31418263
6 13.42 8.06 0.241 0.31042533 13.4
3 9.367 0.2620.33184737
1 13.4
4 6.62 0.2580.23816472
4 13.4
5 6.615 0.2450.25061260
9 13.4
7 6.37 0.239350.24702741
5 13.4
8 6.67 0.2470.25065018
7 13.4