Embed Size (px)
Citation preview
Ministry of Energy and Mineral Resources The Republic of Indonesia
TTHHEE SSTTUUDDYY OONN OOPPTTIIMMAALL EELLEECCTTRRIICC PPOOWWEERR DDEEVVEELLOOPPMMEENNTT IINN JJAAVVAA--MMAADDUURRAA--BBAALLII IINN TTHHEE RREEPPUUBBLLIICC OOFF IINNDDOONNEESSIIAA
FFIINNAALL RREEPPOORRTT
<< SSUUMMMMAARRYY >>
DDeecceemmbbeerr 22000088
JAPAN INTERNATIONAL COOPERATION AGENCY
NEWJEC INC. THE KANSAI ELECTRIC POWER CO., INC.
PREFACE
In response to a request from the Government of Republic of Indonesia, the Government of Japan decided to conduct the Study on the Optimal Electric Power Development in Java-Madura-Bali in the Republic of Indonesia, and the study was implemented by the Japan International Cooperation Agency (JICA). JICA selected and dispatched a study team, headed by Mr. Satoshi YAMAOKA of NEWJEC Inc., and organized by NEWJEC Inc. and The KANSAI Electric Power Co., Inc. four times from January 2008 to December 2008. The Study Team held discussions with the counterparts concerned of the Government of Indonesia and State-owned Electric Power Company, PT. PLN (Persero), and conducted field surveys at the study area. I hope this report will contribute to the promotion of the plan and to the enhancement of friendly relationship between our two countries. Finally, I wish to express my sincere appreciation to the counterparts concerned of the Government of Republic of Indonesia and PT. PLN (Persero) for their close cooperation throughout the Study. December 2008
Seiichi NAGATSUKA Vice President Japan International Cooperation Agency
December 2008
Seiichi NAGATSUKA Vice President Japan International Cooperation Agency Tokyo, Japan
LETTER OF TRANSMITTAL
We are pleased to submit to you the report of “the Study on the Optimal Electric Power Development in Java-Madura-Bali in the Republic of Indonesia”. This Study was implemented by NEWJEC Inc. and The Kansai Electric Power Co., Inc. from January 2008 to December 2008 based on the contract with your Agency. This report presents the optimal power development plan to be proposed with comprehensive assessment of supply stability, reliability, economy and environment, based on current policies and plan, on various power sources and facility, and transmission line system. In addition, power source development, transmission line system, environmental measures and also investment promotion schemes for the power sector are proposed in order to realize the plans. We trust that utilization of our proposal will much contribute to sustainable development in the electric power sector, which will contribute to the improvement of the public welfare in Java-Madura-Bali as well, and recommend that the Government of the Republic of Indonesia prioritize the implementation of our proposal by applying results of technology transfer in the Study. We wish to take this opportunity to express our sincere gratitude to your Agency, the Ministry of Foreign Affairs and the Ministry of Economy, Trade and Industry. We are also wish to express our sincere gratitude to Ministry of Energy and Mineral Resources, PT PLN (Persero), and other authorities concerned for the close cooperation and assistance extended to us throughout the Study.
Very truly yours, __________________________ Satoshi YAMAOKA Team Leader, The Study on the Optimal Electric Power Development in Java-Madura-Bali in the Republic of Indonesia
The Study on Optimal Electric Power Development in Java-Madura-Bali in the Republic of Indonesia
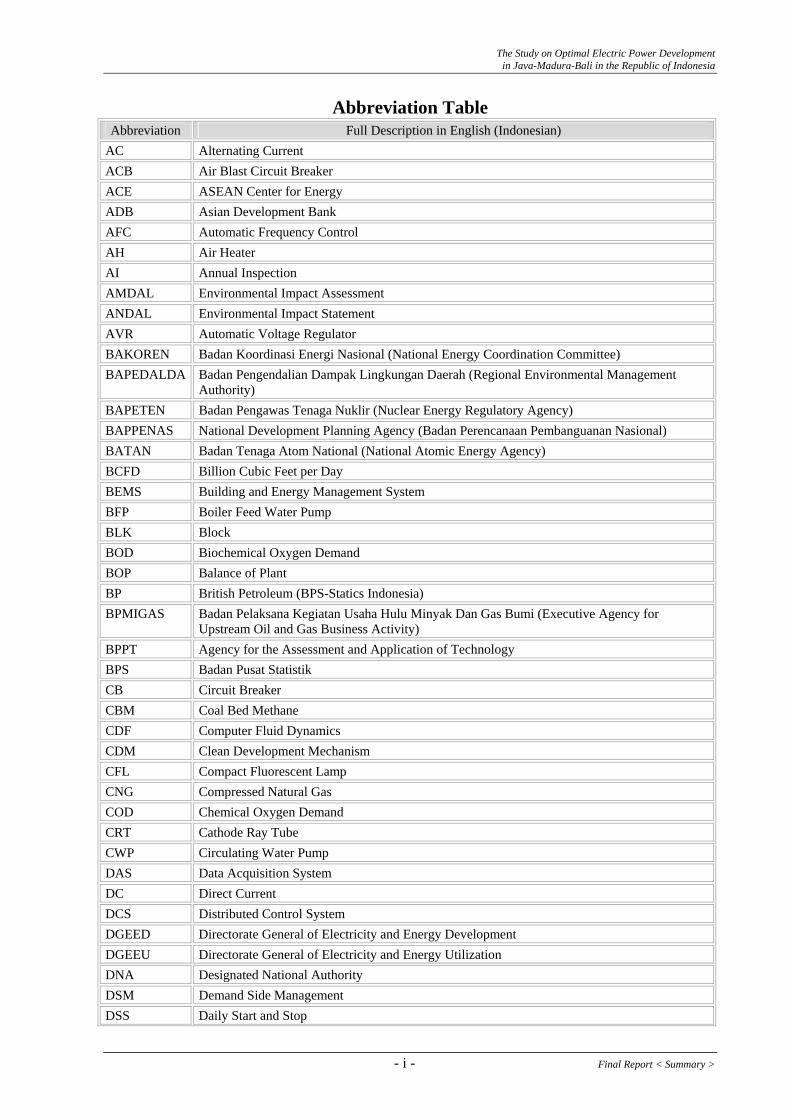
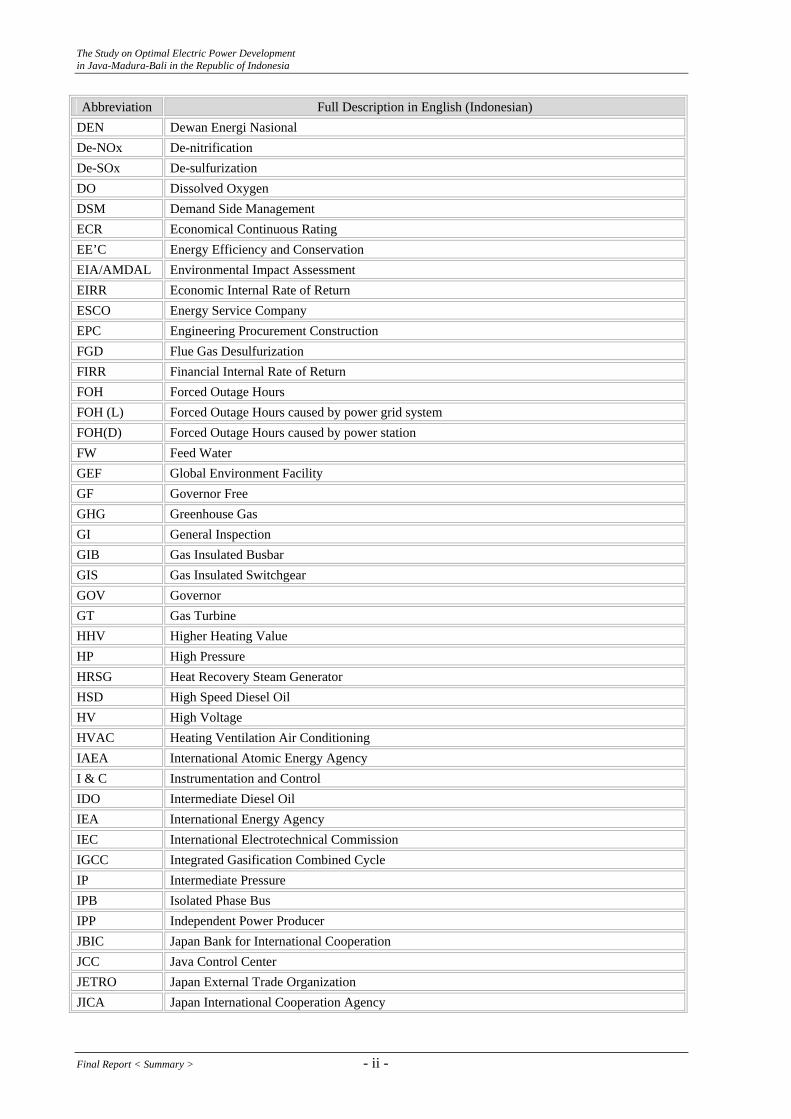
Abbreviation Table Abbreviation Full Description in English (Indonesian)
AC Alternating Current ACB Air Blast Circuit Breaker ACE ASEAN Center for Energy ADB Asian Development Bank AFC Automatic Frequency Control AH Air Heater AI Annual Inspection AMDAL Environmental Impact Assessment ANDAL Environmental Impact Statement AVR Automatic Voltage Regulator BAKOREN Badan Koordinasi Energi Nasional (National Energy Coordination Committee) BAPEDALDA Badan Pengendalian Dampak Lingkungan Daerah (Regional Environmental Management
Authority) BAPETEN Badan Pengawas Tenaga Nuklir (Nuclear Energy Regulatory Agency) BAPPENAS National Development Planning Agency (Badan Perencanaan Pembanguanan Nasional) BATAN Badan Tenaga Atom National (National Atomic Energy Agency) BCFD Billion Cubic Feet per Day BEMS Building and Energy Management System BFP Boiler Feed Water Pump BLK Block BOD Biochemical Oxygen Demand BOP Balance of Plant BP British Petroleum (BPS-Statics Indonesia) BPMIGAS Badan Pelaksana Kegiatan Usaha Hulu Minyak Dan Gas Bumi (Executive Agency for
Upstream Oil and Gas Business Activity) BPPT Agency for the Assessment and Application of Technology BPS Badan Pusat Statistik CB Circuit Breaker CBM Coal Bed Methane CDF Computer Fluid Dynamics CDM Clean Development Mechanism CFL Compact Fluorescent Lamp CNG Compressed Natural Gas COD Chemical Oxygen Demand CRT Cathode Ray Tube CWP Circulating Water Pump DAS Data Acquisition System DC Direct Current DCS Distributed Control System DGEED Directorate General of Electricity and Energy Development DGEEU Directorate General of Electricity and Energy Utilization DNA Designated National Authority DSM Demand Side Management DSS Daily Start and Stop
- i - Final Report < Summary >
The Study on Optimal Electric Power Development in Java-Madura-Bali in the Republic of Indonesia
Abbreviation Full Description in English (Indonesian) DEN Dewan Energi Nasional De-NOx De-nitrification De-SOx De-sulfurization DO Dissolved Oxygen DSM Demand Side Management ECR Economical Continuous Rating EE’C Energy Efficiency and Conservation EIA/AMDAL Environmental Impact Assessment EIRR Economic Internal Rate of Return ESCO Energy Service Company EPC Engineering Procurement Construction FGD Flue Gas Desulfurization FIRR Financial Internal Rate of Return FOH Forced Outage Hours FOH (L) Forced Outage Hours caused by power grid system FOH(D) Forced Outage Hours caused by power station FW Feed Water GEF Global Environment Facility GF Governor Free GHG Greenhouse Gas GI General Inspection GIB Gas Insulated Busbar GIS Gas Insulated Switchgear GOV Governor GT Gas Turbine HHV Higher Heating Value HP High Pressure HRSG Heat Recovery Steam Generator HSD High Speed Diesel Oil HV High Voltage HVAC Heating Ventilation Air Conditioning IAEA International Atomic Energy Agency I & C Instrumentation and Control IDO Intermediate Diesel Oil IEA International Energy Agency IEC International Electrotechnical Commission IGCC Integrated Gasification Combined Cycle IP Intermediate Pressure IPB Isolated Phase Bus IPP Independent Power Producer JBIC Japan Bank for International Cooperation JCC Java Control Center JETRO Japan External Trade Organization JICA Japan International Cooperation Agency
Final Report < Summary > - ii -
The Study on Optimal Electric Power Development in Java-Madura-Bali in the Republic of Indonesia
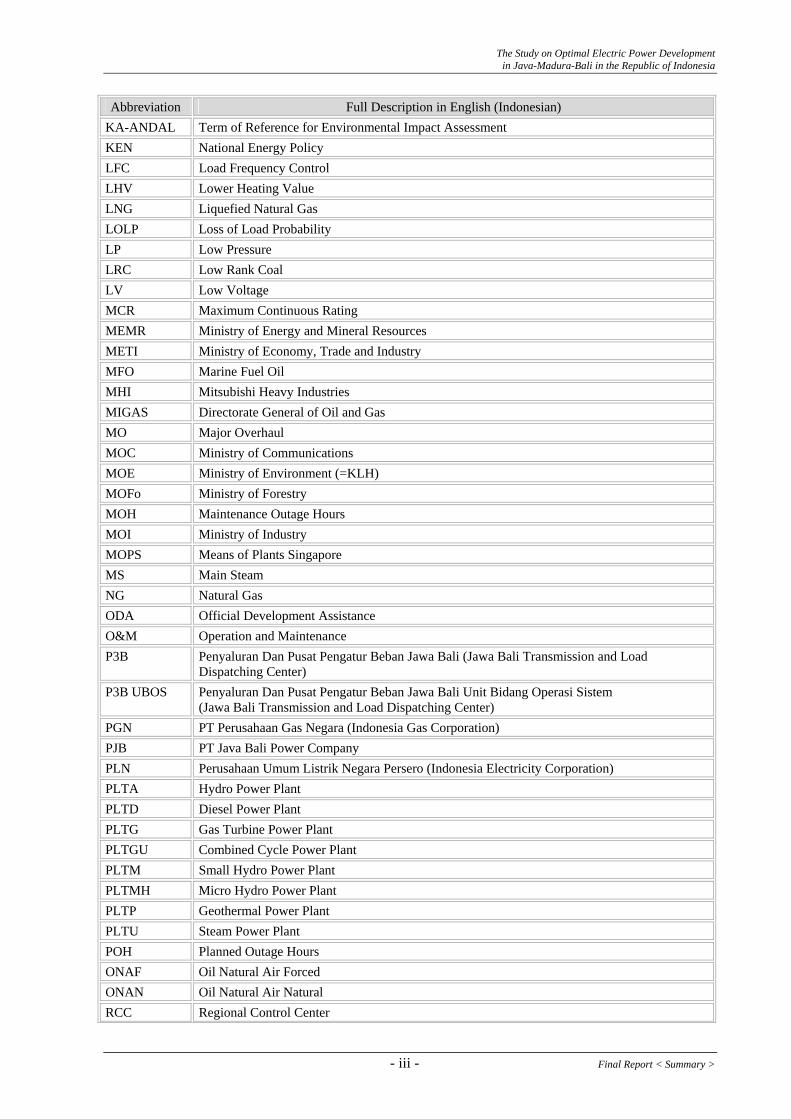
Abbreviation Full Description in English (Indonesian) KA-ANDAL Term of Reference for Environmental Impact Assessment KEN National Energy Policy LFC Load Frequency Control LHV Lower Heating Value LNG Liquefied Natural Gas LOLP Loss of Load Probability LP Low Pressure LRC Low Rank Coal LV Low Voltage MCR Maximum Continuous Rating MEMR Ministry of Energy and Mineral Resources METI Ministry of Economy, Trade and Industry MFO Marine Fuel Oil MHI Mitsubishi Heavy Industries MIGAS Directorate General of Oil and Gas MO Major Overhaul MOC Ministry of Communications MOE Ministry of Environment (=KLH) MOFo Ministry of Forestry MOH Maintenance Outage Hours MOI Ministry of Industry MOPS Means of Plants Singapore MS Main Steam NG Natural Gas ODA Official Development Assistance O&M Operation and Maintenance P3B Penyaluran Dan Pusat Pengatur Beban Jawa Bali (Jawa Bali Transmission and Load
Dispatching Center) P3B UBOS Penyaluran Dan Pusat Pengatur Beban Jawa Bali Unit Bidang Operasi Sistem
(Jawa Bali Transmission and Load Dispatching Center) PGN PT Perusahaan Gas Negara (Indonesia Gas Corporation) PJB PT Java Bali Power Company PLN Perusahaan Umum Listrik Negara Persero (Indonesia Electricity Corporation) PLTA Hydro Power Plant PLTD Diesel Power Plant PLTG Gas Turbine Power Plant PLTGU Combined Cycle Power Plant PLTM Small Hydro Power Plant PLTMH Micro Hydro Power Plant PLTP Geothermal Power Plant PLTU Steam Power Plant POH Planned Outage Hours ONAF Oil Natural Air Forced ONAN Oil Natural Air Natural RCC Regional Control Center
- iii - Final Report < Summary >
The Study on Optimal Electric Power Development in Java-Madura-Bali in the Republic of Indonesia
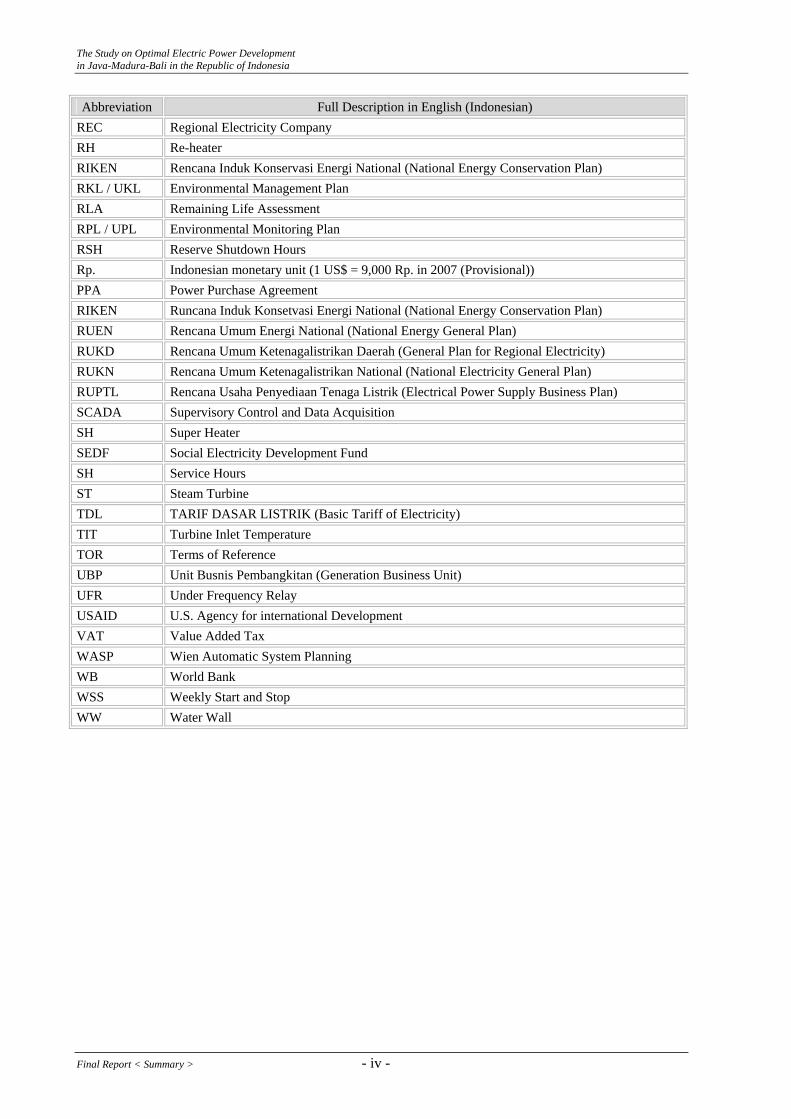
Abbreviation Full Description in English (Indonesian) REC Regional Electricity Company RH Re-heater RIKEN Rencana Induk Konservasi Energi National (National Energy Conservation Plan) RKL / UKL Environmental Management Plan RLA Remaining Life Assessment RPL / UPL Environmental Monitoring Plan RSH Reserve Shutdown Hours Rp. Indonesian monetary unit (1 US$ = 9,000 Rp. in 2007 (Provisional)) PPA Power Purchase Agreement RIKEN Runcana Induk Konsetvasi Energi National (National Energy Conservation Plan) RUEN Rencana Umum Energi National (National Energy General Plan) RUKD Rencana Umum Ketenagalistrikan Daerah (General Plan for Regional Electricity) RUKN Rencana Umum Ketenagalistrikan National (National Electricity General Plan) RUPTL Rencana Usaha Penyediaan Tenaga Listrik (Electrical Power Supply Business Plan) SCADA Supervisory Control and Data Acquisition SH Super Heater SEDF Social Electricity Development Fund SH Service Hours ST Steam Turbine TDL TARIF DASAR LISTRIK (Basic Tariff of Electricity) TIT Turbine Inlet Temperature TOR Terms of Reference UBP Unit Busnis Pembangkitan (Generation Business Unit) UFR Under Frequency Relay USAID U.S. Agency for international Development VAT Value Added Tax WASP Wien Automatic System Planning WB World Bank WSS Weekly Start and Stop WW Water Wall
Final Report < Summary > - iv -

The Study on Optimal Electric Power Development in Java-Madura-Bali in the Republic of Indonesia
Unit Table Abbreviation Unit
bbl Barrel (1 bbl = 159 litter)
BCM Billion Cubic Meter
BCT Billion Cubic Feet
BOE Barrels of Oil Equivalent
BSCF 109 Standard Cubic feet BTU British Thermal Unit (=0.251996 kcal)
dBA Decibel Measured on the A Scale
DWT Dead Weight Tonnage
GWh Gigawatt-hour
Hz Hertz
kJ Kilo Joule
kV Kilovolt
kW Kilowatt
kWh Kilowatt-hour ( 1 kWh = 860 kcal) (1 kcal = 3.968 BTU)
MMCF 106 Cubic Feet (MM = 106)
MMBTU 106 British Thermal Unit (MM = 106)
MMSCF 106 Standard Cubic Feet (MM = 106)
MMSCFD Million Standard Cubic Feet per Day
MMSTB Million Stock Tank Barrel
MPa Mega Pascal
MVA Mega-volt-ampere
MW Megawatt
MWh Megawatt-hour
Nm3 Normal Cubic Meter
pH Potential of Hydrogen
ppb Percent per Billion
ppm Percent per Million
psi Pound per Square Inch
rpm Revolution per Minute
SBM Setara Barrel Minyak (=BOE)
SCF Standard Cubic Feet
STB Stock Tank Barrel
TCF Trillion Cubic Feet
TOE Tons of Oil Equivalent (=107kcal)
VA Volt-ampere
- v - Final Report < Summary >
The Study on Optimal Electric Power Development in Java-Madura-Bali in the Republic of Indonesia
Table of Contents
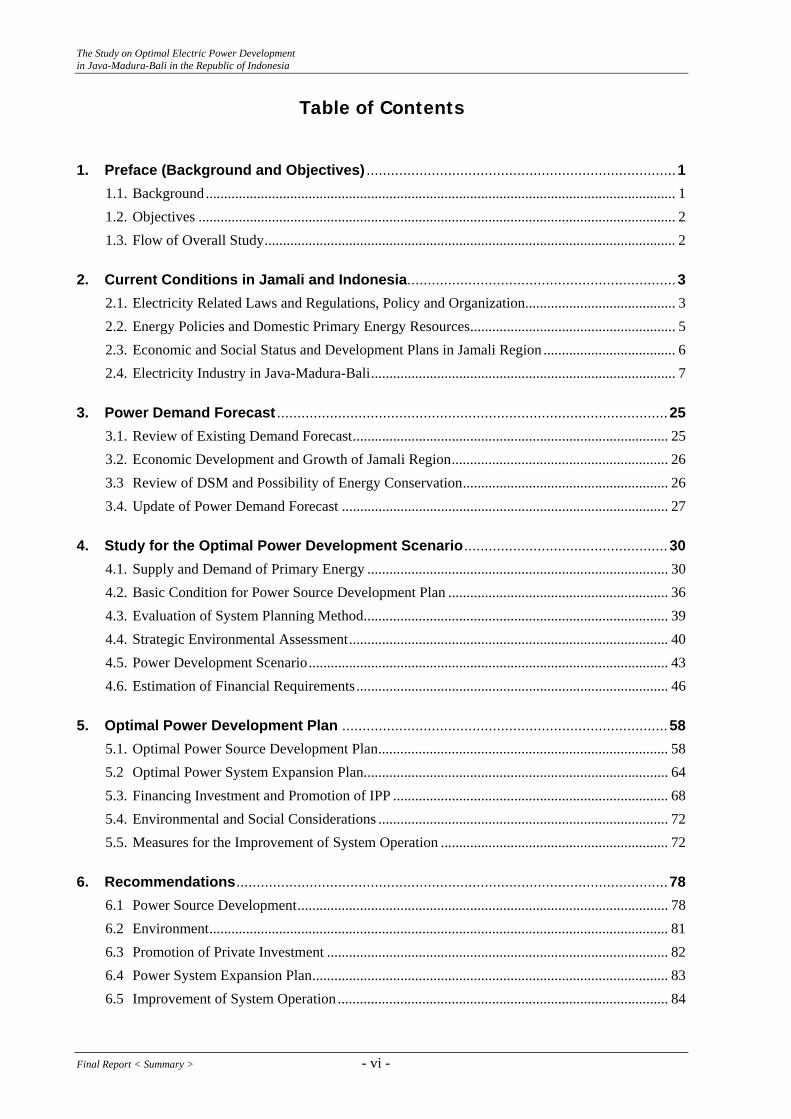
1. Preface (Background and Objectives) ............................................................................1 1.1. Background................................................................................................................................ 1 1.2. Objectives .................................................................................................................................. 2 1.3. Flow of Overall Study................................................................................................................ 2
2. Current Conditions in Jamali and Indonesia..................................................................3 2.1. Electricity Related Laws and Regulations, Policy and Organization......................................... 3 2.2. Energy Policies and Domestic Primary Energy Resources........................................................ 5 2.3. Economic and Social Status and Development Plans in Jamali Region .................................... 6 2.4. Electricity Industry in Java-Madura-Bali................................................................................... 7
3. Power Demand Forecast ................................................................................................25 3.1. Review of Existing Demand Forecast...................................................................................... 25 3.2. Economic Development and Growth of Jamali Region........................................................... 26 3.3 Review of DSM and Possibility of Energy Conservation........................................................ 26 3.4. Update of Power Demand Forecast ......................................................................................... 27
4. Study for the Optimal Power Development Scenario..................................................30 4.1. Supply and Demand of Primary Energy .................................................................................. 30 4.2. Basic Condition for Power Source Development Plan ............................................................ 36 4.3. Evaluation of System Planning Method................................................................................... 39 4.4. Strategic Environmental Assessment....................................................................................... 40 4.5. Power Development Scenario.................................................................................................. 43 4.6. Estimation of Financial Requirements..................................................................................... 46
5. Optimal Power Development Plan ................................................................................58 5.1. Optimal Power Source Development Plan............................................................................... 58 5.2 Optimal Power System Expansion Plan................................................................................... 64 5.3. Financing Investment and Promotion of IPP ........................................................................... 68 5.4. Environmental and Social Considerations ............................................................................... 72 5.5. Measures for the Improvement of System Operation .............................................................. 72
6. Recommendations..........................................................................................................78 6.1 Power Source Development..................................................................................................... 78 6.2 Environment............................................................................................................................. 81 6.3 Promotion of Private Investment ............................................................................................. 82 6.4 Power System Expansion Plan................................................................................................. 83 6.5 Improvement of System Operation .......................................................................................... 84
Final Report < Summary > - vi -
The Study on Optimal Electric Power Development in Java-Madura-Bali in the Republic of Indonesia
List of Tables Table 2.3-1 Regional GDP by Industry and Growth Rate in Jamali (2002-2006) Table 2.3-2 Population of Sub-region in Jamali Table 2.4-1 Brief of Existing Power Generation Facilities in Jamali Table 2.4-2 (1) Existing Power Development Plans (As of February 6, 2008) Table 2.4-2 (2) Latest Progress of the Fast Rack Program Table 2.4-3 Expansion Plan of 500 kV and 150 kV Transmission Line Table 2.4-4 Expansion Plan of 500 kV and 150 kV Transformer Table 2.4-5 Expansion Plan of 500 kV and 150 kV Substation Table 2.4-6 Total Number of Substation with Voltage Drop Table 2.4-7 Number of Deviation of Standard Frequency Table 2.4-8 Causes of Outages Table 2.4-9 Transmission Loss Table 2.4-10 Average Unit Prices by Customer Categories in 2006 Table 2.4-11 PLN’s Revenue Table 2.4-12 PLN Fuel Prices (Cost) from 2000 to 2006 Table 2.4-13 Coal Prices at PLTU Suralaya Coal-Fired Power Plant Table 2.4-14 Unit Prices of Power in PPA Table 4.1-1 Coal Resources/Reserves for Rank of Coal Table 4.1-2 Geothermal Resources in Indonesia Table 4.1-3 Master Plan of Geothermal Development in Java Bali Regions Table 4.1-4 Non-Fossil Energy in Indonesia Table 4.1-5 Hydropower Potential in Java-Bali Region Table 4.1-6 Potential of Wind Power Table 4.1-7 Potential of Solar Energy Table 4.2-1 Common Assumption Table 4.2-2 Candidates of Thermal Power Plants Table 4.2-3 Candidates of Hydropower Plant Table 4.2-4 Candidates of Pumped-Storage Power Plant Table 4.2-5 Fuel Prices for Power Source Development Plan Table 4.4-1 Environmental Performances of Major Types of Power Generation Table 4.5-1 Power Development Scheme in Each Scenario (Target in 2028) Table 4.6-1 Comparison with Target Scenario and Results of WASP Simulation Table 4.6-2 Estimate of Coal Consumption in 2028 Table 4.6-3 Estimate of Oil Consumption in 2028 Table 4.6-4 Estimate of Gas and LNG Consumption in 2028 Table 4.6-5 Capacity Factor of Coal-fired Power Plants in 2028 Table 4.6-6 Capacity Factor of Nuclear Power Plants in 2028 Table 4.6-7 Comparison of Investment Schedule of Four Scenarios Table 4.6-8 Comparison of Unit Generation Cost of Four Scenarios Table 4.6-9 Predicted Annual Emissions of CO2, SOx and NOx in 2028 Table 4.6-10 Main Conclusion in Comparison with Scenarios Table 5.1-1 Cumulative Objective Function for With and Without Nuclear Table 5.1-2 CO2, NOx and SOx Emission in 2028 Table 5.1-3 Generation Energy and Capacity Factor of Pumped Storage Power Plants Table 5.3-1 Investment Scheme for Optimal Electric Power Development Program
- vii - Final Report < Summary >
The Study on Optimal Electric Power Development in Java-Madura-Bali in the Republic of Indonesia
List of Figures Fig.2.1-1 MEMR Organization Chart Fig.2.2-1 National Energy Mix towards 2025 Fig.2.4-1 PLN Organization Chart (2008 April) Fig.2.4-2 Energy Sales Fig.2.4-3 Peak Load Fig.2.4-4 Location of Fast Track Program (6,900 MW) in Jamali Fig.2.4-5 500 kV Bulk Power Network of the Java-Madura-Bali System Fig.2.4-6 Crude Oil Total World Spot Price of FOB Fig.2.4-7 Protected Areas in Java Fig.3.1-1 Demand Forecast in RUKN 2006-2026 Fig.3.1-2 Demand Forecast in RUPTL 2007-2016 Fig.3.1-3 Demand Forecast by JICA in 2002 Fig.3.3-1 Electric Power Saving Roadmap Fig.3.3-2 Effect of Re-powering (Efficiency and Power Generation) Fig.3.4-1 GDP per Capita and Peak Time Fig.3.4-2 Daily Load Curve in Jamali Fig.3.4-3 Energy Sales and Peak Load (Jamali) Fig.3.4-4 Result of Regional Demand Forecast Fig.4.1-1 Crude Oil Balance Fig.4.1-2 Gas Resources in Indonesia Fig.4.1-3 Area Map of Gas Fig.4.1-4 Gas Pipeline in Java Fig.4.1-5 LNG Import Terminal in Java Fig.4.1-6 CNG Application to Pipeline Gas Fig.4.1-7 Operational Flexibility by CNG Fig.4.1-8 Coal Resources in Indonesia Fig.4.2-1 Load Duration Curve for Power Source Development Plan Fig.4.5-1 Change of Primary Energy Consumption by Fuel (Policy oriented scenario) Fig.4.5-2 Energy Production Ratio by Fuel for Scenarios (Total 406.6 TWh, 2028) Fig.4.6-1 Methodology for Reproduction of Each Scenario by WASP IV Fig.4.6-2 Development Stage (Scenario 0) Fig.4.6-3 Results of Simulation for Scenario 0 Fig.4.6-4 Results of Simulation for Scenario 1 Fig.4.6-5 Results of Simulation for Scenario 2 Fig.4.6-6 Results of Simulation for Scenario 3 Fig.5.1-1 Generation Component for Main Countries (2004) Fig.5.1-2 Tentative Java-Sumatra Interconnection Route Fig.5.2-1 Workflow to develop the Optimal Power System Expansion Plan Fig.5.3-1 Component of Investment by 2028
Final Report < Summary > - viii -
The Study on Optimal Electric Power Development in Java-Madura-Bali in the Republic of Indonesia
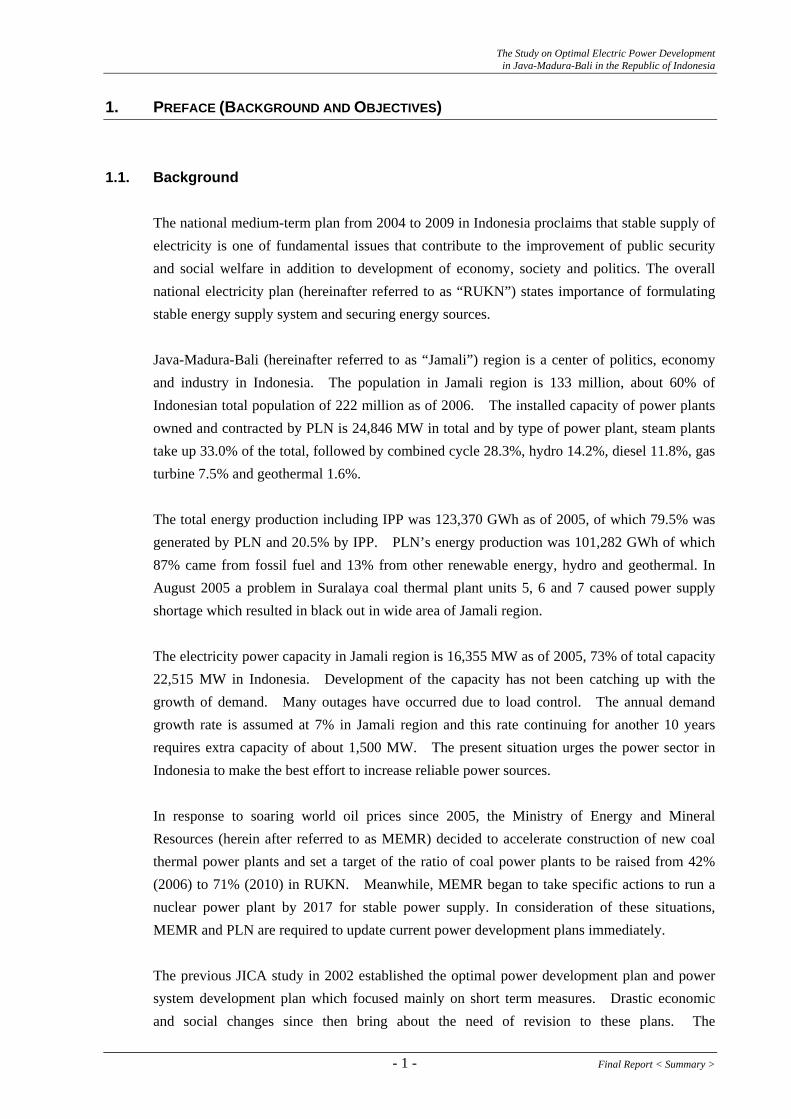
1. PREFACE (BACKGROUND AND OBJECTIVES) 1.1. Background
The national medium-term plan from 2004 to 2009 in Indonesia proclaims that stable supply of electricity is one of fundamental issues that contribute to the improvement of public security and social welfare in addition to development of economy, society and politics. The overall national electricity plan (hereinafter referred to as “RUKN”) states importance of formulating stable energy supply system and securing energy sources. Java-Madura-Bali (hereinafter referred to as “Jamali”) region is a center of politics, economy and industry in Indonesia. The population in Jamali region is 133 million, about 60% of Indonesian total population of 222 million as of 2006. The installed capacity of power plants owned and contracted by PLN is 24,846 MW in total and by type of power plant, steam plants take up 33.0% of the total, followed by combined cycle 28.3%, hydro 14.2%, diesel 11.8%, gas turbine 7.5% and geothermal 1.6%. The total energy production including IPP was 123,370 GWh as of 2005, of which 79.5% was generated by PLN and 20.5% by IPP. PLN’s energy production was 101,282 GWh of which 87% came from fossil fuel and 13% from other renewable energy, hydro and geothermal. In August 2005 a problem in Suralaya coal thermal plant units 5, 6 and 7 caused power supply shortage which resulted in black out in wide area of Jamali region. The electricity power capacity in Jamali region is 16,355 MW as of 2005, 73% of total capacity 22,515 MW in Indonesia. Development of the capacity has not been catching up with the growth of demand. Many outages have occurred due to load control. The annual demand growth rate is assumed at 7% in Jamali region and this rate continuing for another 10 years requires extra capacity of about 1,500 MW. The present situation urges the power sector in Indonesia to make the best effort to increase reliable power sources. In response to soaring world oil prices since 2005, the Ministry of Energy and Mineral Resources (herein after referred to as MEMR) decided to accelerate construction of new coal thermal power plants and set a target of the ratio of coal power plants to be raised from 42% (2006) to 71% (2010) in RUKN. Meanwhile, MEMR began to take specific actions to run a nuclear power plant by 2017 for stable power supply. In consideration of these situations, MEMR and PLN are required to update current power development plans immediately. The previous JICA study in 2002 established the optimal power development plan and power system development plan which focused mainly on short term measures. Drastic economic and social changes since then bring about the need of revision to these plans. The
- 1 - Final Report < Summary >
The Study on Optimal Electric Power Development in Java-Madura-Bali in the Republic of Indonesia
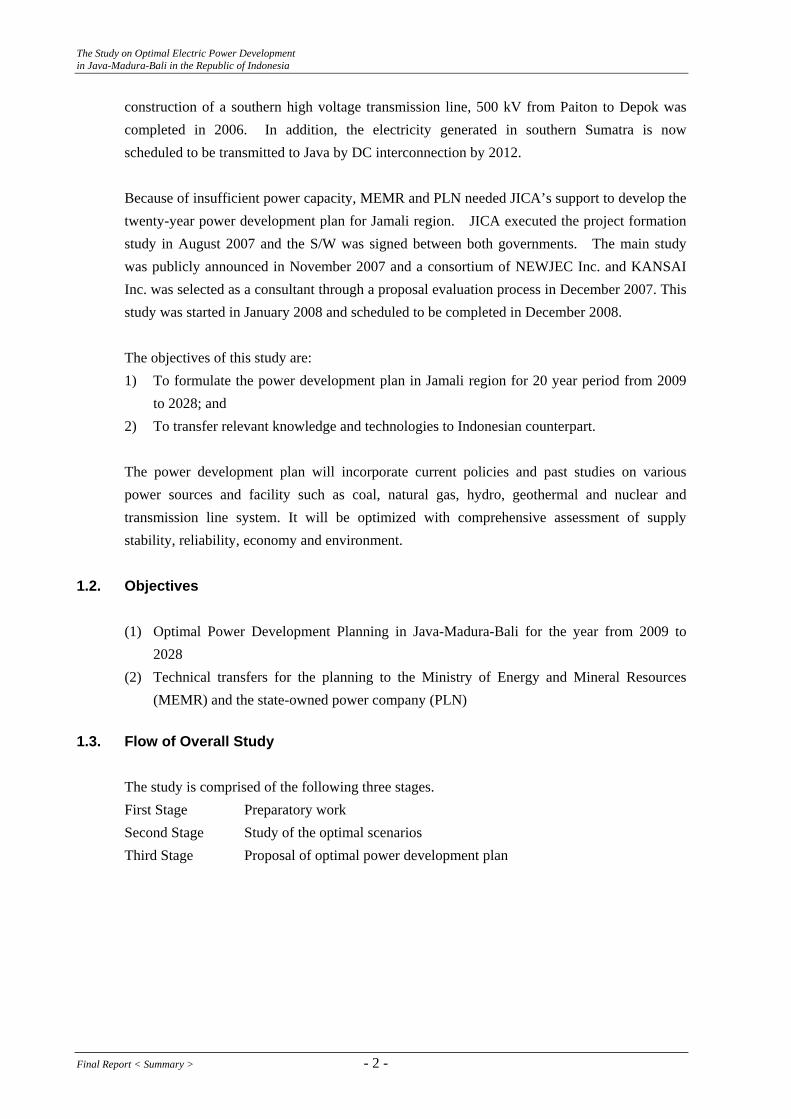
construction of a southern high voltage transmission line, 500 kV from Paiton to Depok was completed in 2006. In addition, the electricity generated in southern Sumatra is now scheduled to be transmitted to Java by DC interconnection by 2012. Because of insufficient power capacity, MEMR and PLN needed JICA’s support to develop the twenty-year power development plan for Jamali region. JICA executed the project formation study in August 2007 and the S/W was signed between both governments. The main study was publicly announced in November 2007 and a consortium of NEWJEC Inc. and KANSAI Inc. was selected as a consultant through a proposal evaluation process in December 2007. This study was started in January 2008 and scheduled to be completed in December 2008. The objectives of this study are: 1) To formulate the power development plan in Jamali region for 20 year period from 2009
to 2028; and 2) To transfer relevant knowledge and technologies to Indonesian counterpart. The power development plan will incorporate current policies and past studies on various power sources and facility such as coal, natural gas, hydro, geothermal and nuclear and transmission line system. It will be optimized with comprehensive assessment of supply stability, reliability, economy and environment.
1.2. Objectives
(1) Optimal Power Development Planning in Java-Madura-Bali for the year from 2009 to
2028 (2) Technical transfers for the planning to the Ministry of Energy and Mineral Resources
(MEMR) and the state-owned power company (PLN) 1.3. Flow of Overall Study
The study is comprised of the following three stages. First Stage Preparatory work Second Stage Study of the optimal scenarios Third Stage Proposal of optimal power development plan
Final Report < Summary > - 2 -

The Study on Optimal Electric Power Development in Java-Madura-Bali in the Republic of Indonesia
2. CURRENT CONDITIONS IN JAMALI AND INDONESIA 2.1. Electricity Related Laws and Regulations, Policy and Organization 2.1.1 Electricity Related Regulations and Policy
To ensure a sound energy development a National Energy Policy that integrates the power sector with other sectors is formulated in consideration of rapid changes in national, regional and global environs. Laws and presidential decrees for national energy were established first and under these laws and decrees presidential instruction and ministerial decrees were announced to promote energy conservation activities and development of biomass or bio-fuel. Under this situation, regulations for renewable energy development and geothermal and ministerial decree to promote IPP were announced. Several presidential decrees are effective for implementation of Fast Track Program. New Electricity Law has been drafted and now is being deliberated in the national parliament. The energy policy has three missions; supply enhancement, diversification and energy conservation. To implement the energy policy, the Presidential Decree No.5/2006 introduced the targets to be satisfied as follows:
1) Energy Elasticity shall be less than 1.0 in 2025.
2) The Optimal Energy Mix shall be established by 2025: proportions of primary energy shall be as follows: • Oil fuel is less than 20% • Gas is more than 30% • Coal is more than 33% • Bio fuel is more than 5% • Geothermal is more than 5% • Other new and Renewable energy, such as bio-mass, nuclear, hydro, solar and wind
power is more than 5% • Liquefied coal is more than 2%
As a campaign against nuclear power development at present is deemed to affect the presidential election in 2009, it is speculated that the current president will not sign the presidential decree on establishing the nuclear program study team before the election. In the road map of the nuclear development program, once the study team is formed, then a period of 10 years will be needed to start the commercial operation. Therefore, the first unit will presumably be able to start in 2018 or later.
- 3 - Final Report < Summary >
The Study on Optimal Electric Power Development in Java-Madura-Bali in the Republic of Indonesia
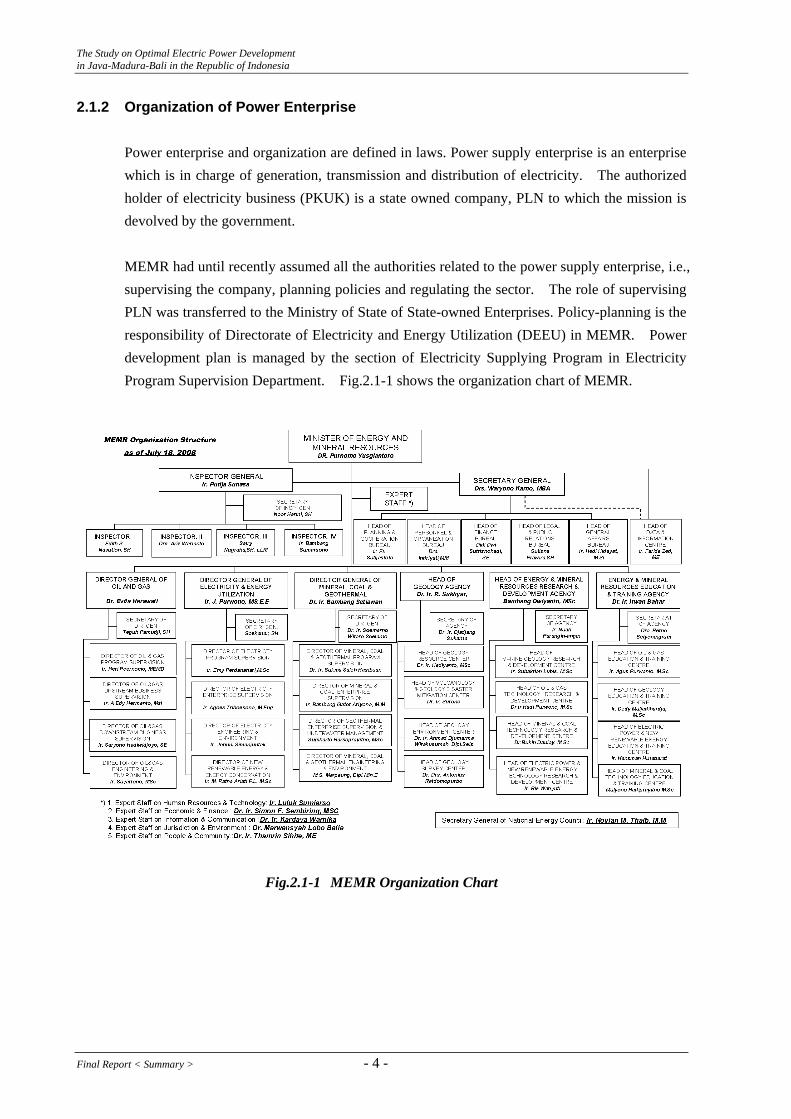
2.1.2 Organization of Power Enterprise Power enterprise and organization are defined in laws. Power supply enterprise is an enterprise which is in charge of generation, transmission and distribution of electricity. The authorized holder of electricity business (PKUK) is a state owned company, PLN to which the mission is devolved by the government. MEMR had until recently assumed all the authorities related to the power supply enterprise, i.e., supervising the company, planning policies and regulating the sector. The role of supervising PLN was transferred to the Ministry of State of State-owned Enterprises. Policy-planning is the responsibility of Directorate of Electricity and Energy Utilization (DEEU) in MEMR. Power development plan is managed by the section of Electricity Supplying Program in Electricity Program Supervision Department. Fig.2.1-1 shows the organization chart of MEMR.
Fig.2.1-1 MEMR Organization Chart
Final Report < Summary > - 4 -
The Study on Optimal Electric Power Development in Java-Madura-Bali in the Republic of Indonesia
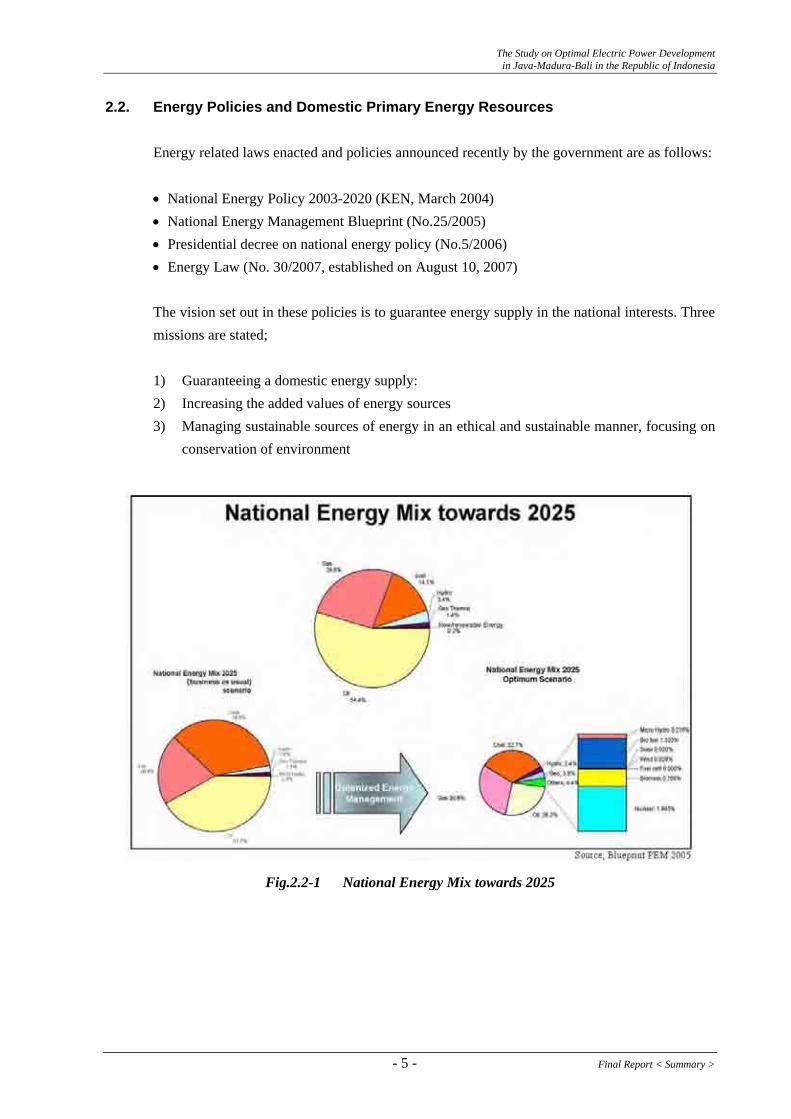
2.2. Energy Policies and Domestic Primary Energy Resources Energy related laws enacted and policies announced recently by the government are as follows: • National Energy Policy 2003-2020 (KEN, March 2004) • National Energy Management Blueprint (No.25/2005) • Presidential decree on national energy policy (No.5/2006) • Energy Law (No. 30/2007, established on August 10, 2007) The vision set out in these policies is to guarantee energy supply in the national interests. Three missions are stated; 1) Guaranteeing a domestic energy supply: 2) Increasing the added values of energy sources 3) Managing sustainable sources of energy in an ethical and sustainable manner, focusing on
conservation of environment
Fig.2.2-1 National Energy Mix towards 2025
- 5 - Final Report < Summary >
The Study on Optimal Electric Power Development in Java-Madura-Bali in the Republic of Indonesia
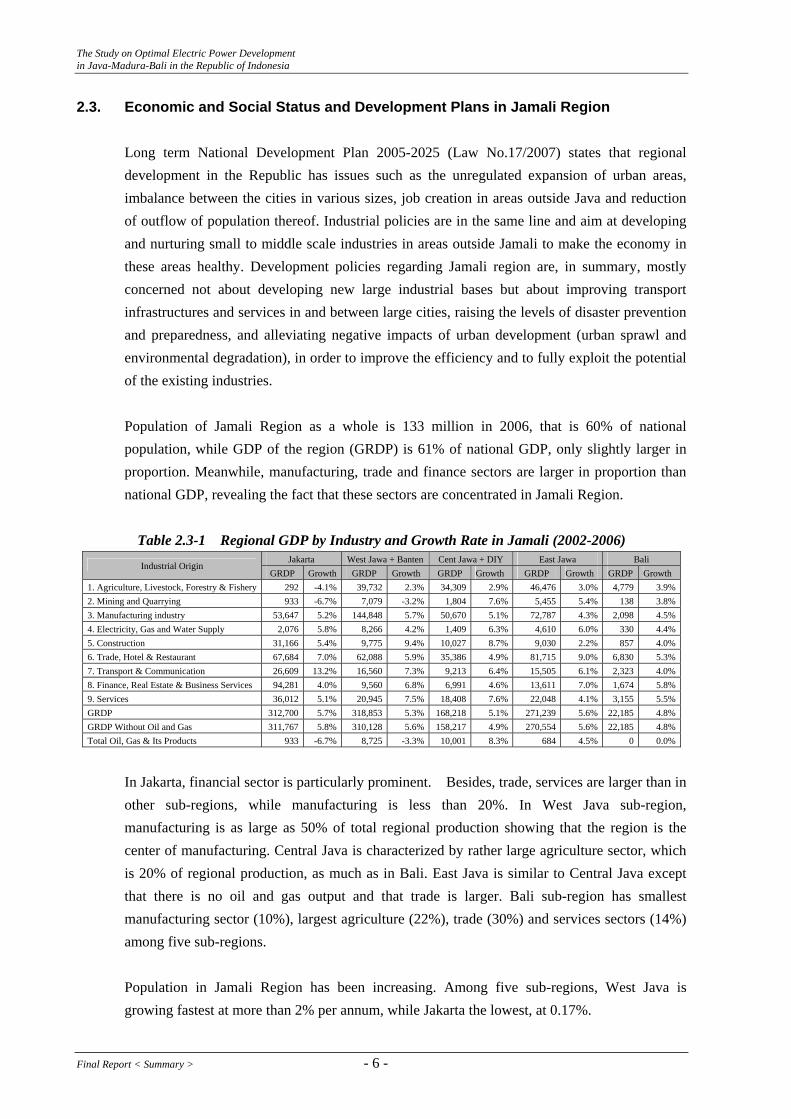
2.3. Economic and Social Status and Development Plans in Jamali Region Long term National Development Plan 2005-2025 (Law No.17/2007) states that regional development in the Republic has issues such as the unregulated expansion of urban areas, imbalance between the cities in various sizes, job creation in areas outside Java and reduction of outflow of population thereof. Industrial policies are in the same line and aim at developing and nurturing small to middle scale industries in areas outside Jamali to make the economy in these areas healthy. Development policies regarding Jamali region are, in summary, mostly concerned not about developing new large industrial bases but about improving transport infrastructures and services in and between large cities, raising the levels of disaster prevention and preparedness, and alleviating negative impacts of urban development (urban sprawl and environmental degradation), in order to improve the efficiency and to fully exploit the potential of the existing industries. Population of Jamali Region as a whole is 133 million in 2006, that is 60% of national population, while GDP of the region (GRDP) is 61% of national GDP, only slightly larger in proportion. Meanwhile, manufacturing, trade and finance sectors are larger in proportion than national GDP, revealing the fact that these sectors are concentrated in Jamali Region.
Table 2.3-1 Regional GDP by Industry and Growth Rate in Jamali (2002-2006) Jakarta West Jawa + Banten Cent Jawa + DIY East Jawa Bali
Industrial Origin GRDP Growth GRDP Growth GRDP Growth GRDP Growth GRDP Growth
1. Agriculture, Livestock, Forestry & Fishery 292 -4.1% 39,732 2.3% 34,309 2.9% 46,476 3.0% 4,779 3.9%2. Mining and Quarrying 933 -6.7% 7,079 -3.2% 1,804 7.6% 5,455 5.4% 138 3.8%3. Manufacturing industry 53,647 5.2% 144,848 5.7% 50,670 5.1% 72,787 4.3% 2,098 4.5%4. Electricity, Gas and Water Supply 2,076 5.8% 8,266 4.2% 1,409 6.3% 4,610 6.0% 330 4.4%5. Construction 31,166 5.4% 9,775 9.4% 10,027 8.7% 9,030 2.2% 857 4.0%6. Trade, Hotel & Restaurant 67,684 7.0% 62,088 5.9% 35,386 4.9% 81,715 9.0% 6,830 5.3%7. Transport & Communication 26,609 13.2% 16,560 7.3% 9,213 6.4% 15,505 6.1% 2,323 4.0%8. Finance, Real Estate & Business Services 94,281 4.0% 9,560 6.8% 6,991 4.6% 13,611 7.0% 1,674 5.8%9. Services 36,012 5.1% 20,945 7.5% 18,408 7.6% 22,048 4.1% 3,155 5.5%GRDP 312,700 5.7% 318,853 5.3% 168,218 5.1% 271,239 5.6% 22,185 4.8%GRDP Without Oil and Gas 311,767 5.8% 310,128 5.6% 158,217 4.9% 270,554 5.6% 22,185 4.8%Total Oil, Gas & Its Products 933 -6.7% 8,725 -3.3% 10,001 8.3% 684 4.5% 0 0.0%
In Jakarta, financial sector is particularly prominent. Besides, trade, services are larger than in other sub-regions, while manufacturing is less than 20%. In West Java sub-region, manufacturing is as large as 50% of total regional production showing that the region is the center of manufacturing. Central Java is characterized by rather large agriculture sector, which is 20% of regional production, as much as in Bali. East Java is similar to Central Java except that there is no oil and gas output and that trade is larger. Bali sub-region has smallest manufacturing sector (10%), largest agriculture (22%), trade (30%) and services sectors (14%) among five sub-regions. Population in Jamali Region has been increasing. Among five sub-regions, West Java is growing fastest at more than 2% per annum, while Jakarta the lowest, at 0.17%.
Final Report < Summary > - 6 -
The Study on Optimal Electric Power Development in Java-Madura-Bali in the Republic of Indonesia
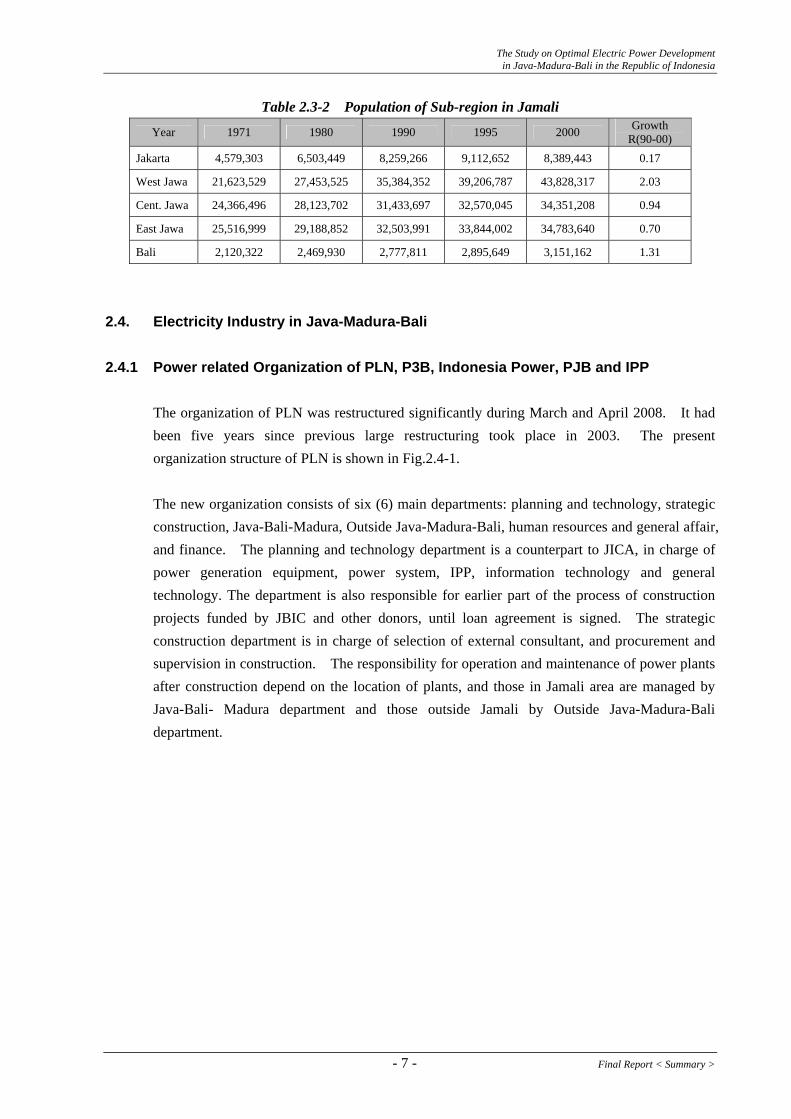
Table 2.3-2 Population of Sub-region in Jamali
Year 1971 1980 1990 1995 2000 Growth R(90-00)
Jakarta 4,579,303 6,503,449 8,259,266 9,112,652 8,389,443 0.17
West Jawa 21,623,529 27,453,525 35,384,352 39,206,787 43,828,317 2.03
Cent. Jawa 24,366,496 28,123,702 31,433,697 32,570,045 34,351,208 0.94
East Jawa 25,516,999 29,188,852 32,503,991 33,844,002 34,783,640 0.70
Bali 2,120,322 2,469,930 2,777,811 2,895,649 3,151,162 1.31
2.4. Electricity Industry in Java-Madura-Bali 2.4.1 Power related Organization of PLN, P3B, Indonesia Power, PJB and IPP
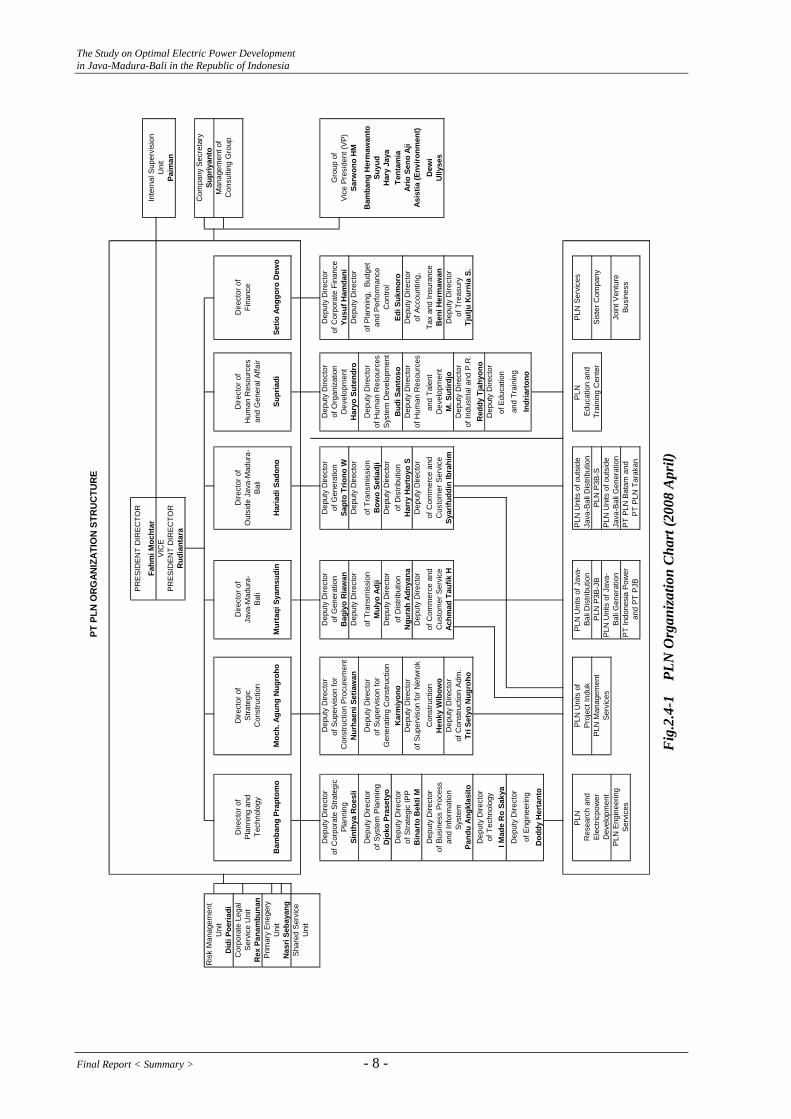
The organization of PLN was restructured significantly during March and April 2008. It had been five years since previous large restructuring took place in 2003. The present organization structure of PLN is shown in Fig.2.4-1. The new organization consists of six (6) main departments: planning and technology, strategic construction, Java-Bali-Madura, Outside Java-Madura-Bali, human resources and general affair, and finance. The planning and technology department is a counterpart to JICA, in charge of power generation equipment, power system, IPP, information technology and general technology. The department is also responsible for earlier part of the process of construction projects funded by JBIC and other donors, until loan agreement is signed. The strategic construction department is in charge of selection of external consultant, and procurement and supervision in construction. The responsibility for operation and maintenance of power plants after construction depend on the location of plants, and those in Jamali area are managed by Java-Bali- Madura department and those outside Jamali by Outside Java-Madura-Bali department.
- 7 - Final Report < Summary >
The Study on Optimal Electric Power Development in Java-Madura-Bali in the Republic of Indonesia
PT P
LN O
RG
ANIZ
ATIO
N S
TRU
CTU
RE
Ris
k M
anag
emen
tU
nit
Did
i Poe
riadi
Cor
pora
te L
egal
Serv
ice
Uni
tR
ex P
anam
buna
nPr
imar
y En
eger
yU
nit
Nas
ri Se
baya
ngSh
ared
Ser
vice
Uni
t
PLN
Uni
ts o
f out
side
Java
-Bal
i Dis
tribu
tion
PLN
Uni
ts o
f Jav
a-PL
N U
nits
of o
utsi
deJa
va-B
ali G
ener
atio
nPT
Indo
nesi
a Po
wer
PT P
LN B
atam
and
Ully
ses
Tent
amia
Ario
Sen
o Aj
iAs
istia
(Env
ironm
ent)
Dew
i
Sarw
ono
HM
Bam
bang
Her
maw
anto
Suyu
dH
ary
Jaya
Vice
Pre
side
nt (V
P)
Dire
ctor
of
Plan
ning
and
Dep
uty
Dire
ctor
of C
orpo
rate
Stra
tegi
cPl
anni
ng
Dire
ctor
of
Stra
tegi
c
Sint
hya
Roe
sli
Dep
uty
Dire
ctor
of S
yste
m P
lann
ing
Djo
ko P
rase
tyo
Dep
uty
Dire
ctor
of S
trate
gic
IPP
Bin
arto
Bek
ti M
Dep
uty
Dire
ctor
of B
usin
ess
Proc
ess
and
Info
rmat
ion
Syst
emPa
ndu
Angk
lasi
toD
eput
y D
irect
orof
Tec
hnol
ogy
I Mad
e R
o Sa
kya
Dep
uty
Dire
ctor
Dep
uty
Dire
ctor
of S
uper
viso
n fo
r
Nur
haen
i Set
iaw
an
of T
reas
ury
Dep
uty
Dire
ctor
of S
uper
viso
n fo
r G
ener
atin
g C
onst
ruct
ion
Kar
miy
ono
Dep
uty
Dire
ctor
of S
uper
viso
n fo
r Net
wro
kC
onst
ruct
ion
Hen
ky W
ibow
oD
eput
y D
irect
orof
Con
stru
ctio
n Ad
m.
Tri S
etyo
Nug
roho
Dire
ctor
of
Java
-Mad
ura-
Dep
uty
Dire
ctor
of G
ener
atio
nB
agiy
o R
iaw
anD
eput
y D
irect
or
of C
omm
erce
and
Cus
tom
er S
ervi
ceAc
hmad
Tau
fik H
Mul
yo A
dji
Dep
uty
Dire
ctor
of D
istri
butio
nN
gura
h Ad
nyan
a
Sapt
o Tr
iono
WD
eput
y D
irect
or
of T
rans
mis
sion
Dep
uty
Dire
ctor
of T
rans
mis
sion
Out
side
Jav
a-M
adur
a-
Dep
uty
Dire
ctor
of G
ener
atio
n
of H
uman
Res
ourc
es
Dep
uty
Dire
ctor
Syst
em D
evel
opm
ent
Bud
i San
toso
Dep
uty
Dire
ctor
of H
uman
Res
ourc
es
Bow
o Se
tiadj
iD
eput
y D
irect
or
of O
rgan
izat
ion
Dev
elop
men
tH
aryo
Sut
endr
o
Dep
uty
Dire
ctor
Red
dy T
jahy
ono
Dire
ctor
of
Fina
nce
Dep
uty
Dire
ctor
of C
orpo
rate
Fin
ance
Yusu
f Ham
dani
Dep
uty
Dire
ctor
of P
lann
ing,
Bud
get
and
Tale
nt
Dep
uty
Dire
ctor
of In
dust
rial a
nd P
.R.
Dev
elop
men
tM
. Sut
irdjo
Dep
uty
Dire
ctor
Tjut
ju K
urni
a S.
Dep
uty
Dire
ctor
Gro
up o
f
Inte
rnal
Sup
ervi
sion
Uni
t
Com
pany
Sec
reta
rySu
priy
anto
Dire
ctor
of
Hum
an R
esou
rces
Dep
uty
Dire
ctor
PLN
Ser
vice
s
Sist
er C
ompa
nyPL
N P
3B-S
Fahm
i Moc
htar
VIC
E
of A
ccou
ntin
g,Ta
x an
d In
sura
nce
Ben
i Her
maw
an
Join
t Ven
ture
Busi
ness
PLN
Ed
ucat
ion
and
Trai
ning
Cen
ter
PT P
LN T
arak
anan
d PT
PJB
PLN
P3B
-JB
Bali
Gen
erat
ion
Serv
ices
Bali
Dis
tribu
tion
PLN
Uni
ts o
f Jav
a-PL
N
Res
earc
h an
d
Serv
ices
PLN
Man
agem
ent
Proj
ect I
nduk
PLN
Uni
ts o
f
PRES
IDEN
T D
IREC
TOR
Elec
tricp
ower
Dev
elop
men
tPL
N E
ngin
eerin
g
of C
omm
erce
and
Cus
tom
er S
ervi
ceSy
arifu
ddin
Ibra
him
of D
istri
butio
nH
arry
Har
toyo
S
Dire
ctor
of
PRES
IDEN
T D
IREC
TOR
Rud
iant
ara
Tech
nolo
gy
Bam
bang
Pra
ptom
o
Con
stru
ctio
n
Moc
h. A
gung
Nug
roho
Bali
Mur
taqi
Sya
msu
din
Bali
Har
iadi
Sad
ono
and
Gen
eral
Affa
ir
Supr
iadi
Setio
Ang
goro
Dew
o
Paim
an
Con
sulti
ng G
roup
Man
agem
ent o
f
and
Perfo
rman
ce
of E
ngin
eerin
gD
oddy
Her
tant
o
Con
stru
ctio
n Pr
ocur
emen
t
Indr
iart
ono
Dep
uty
Dire
ctor
of E
duca
tion
and
Trai
ning
Con
trol
Edi S
ukm
oro
Fig
.2.4
-1
PLN
Org
aniz
atio
n C
hart
(200
8 A
pril)
Final Report < Summary > - 8 -
The Study on Optimal Electric Power Development in Java-Madura-Bali in the Republic of Indonesia
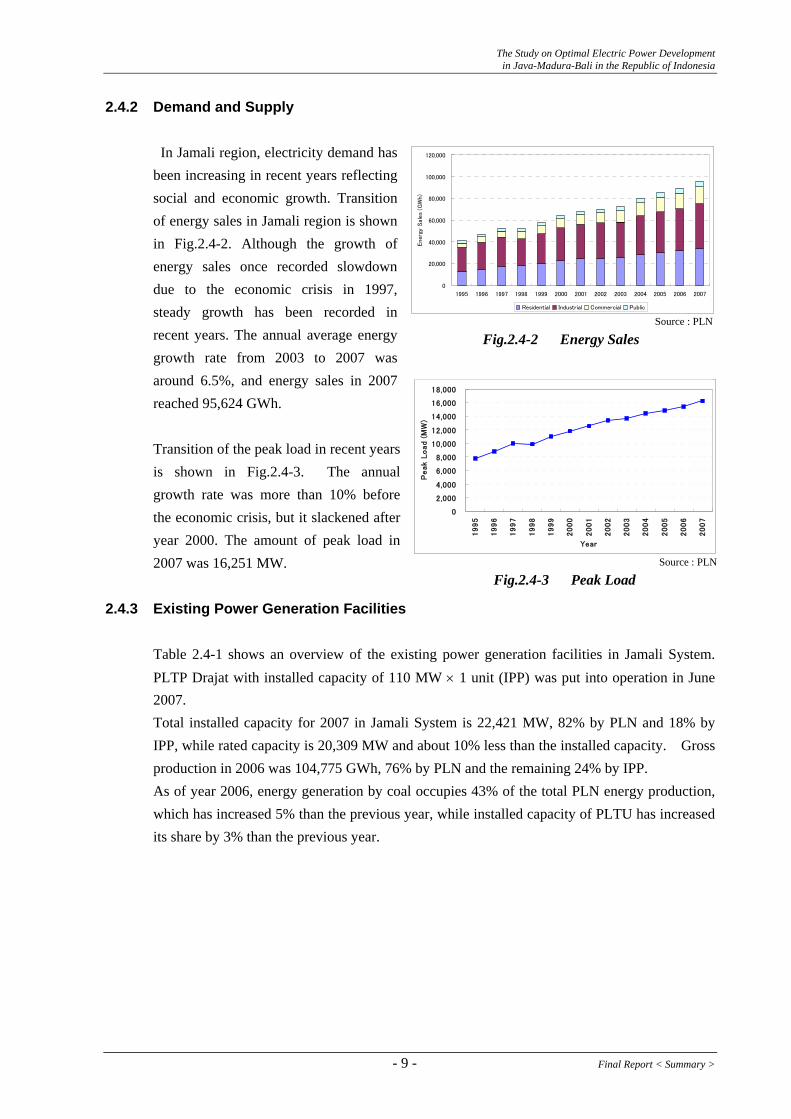
2.4.2 Demand and Supply In Jamali region, electricity demand has been increasing in recent years reflecting social and economic growth. Transition of energy sales in Jamali region is shown in Fig.2.4-2. Although the growth of energy sales once recorded slowdown due to the economic crisis in 1997, steady growth has been recorded in recent years. The annual average energy growth rate from 2003 to 2007 was around 6.5%, and energy sales in 2007 reached 95,624 GWh.
Transition of the peak load in recent years is shown in Fig.2.4-3. The annual growth rate was more than 10% before the economic crisis, but it slackened after year 2000. The amount of peak load in 2007 was 16,251 MW.
0
2,000
4,000
6,000
8,000
10,000
12,000
14,000
16,000
18,000
1995
1996
1997
1998
1999
2000
2001
2002
2003
2004
2005
2006
2007
Year
Peak L
oad (
MW
)
Source : PLN
Fig.2.4-3 Peak Load
0
20,000
40,000
60,000
80,000
100,000
120,000
1995 1996 1997 1998 1999 2000 2001 2002 2003 2004 2005 2006 2007
Ene
rgy
Sale
s (G
Wh)
Residential Industrial Commercial Public
Fig.2.4-2 Energy Sales
Source : PLN
2.4.3 Existing Power Generation Facilities
Table 2.4-1 shows an overview of the existing power generation facilities in Jamali System. PLTP Drajat with installed capacity of 110 MW × 1 unit (IPP) was put into operation in June 2007. Total installed capacity for 2007 in Jamali System is 22,421 MW, 82% by PLN and 18% by IPP, while rated capacity is 20,309 MW and about 10% less than the installed capacity. Gross production in 2006 was 104,775 GWh, 76% by PLN and the remaining 24% by IPP. As of year 2006, energy generation by coal occupies 43% of the total PLN energy production, which has increased 5% than the previous year, while installed capacity of PLTU has increased its share by 3% than the previous year.
- 9 - Final Report < Summary >

The Study on Optimal Electric Power Development in Java-Madura-Bali in the Republic of Indonesia
Table 2.4-1 Brief of Existing Power Generation Facilities in Jamali
PLN Out of PLN PLN Out of PLN InstalledCapacity
RatedCapacity
MW MW MW MW MW MWYear 2005 16,356 N.A 14,225 N.A N.A N.A
Year 2006 18,416 3,895 16,990 3,837 22,311 20,827
**Year 2007 18,416 4,005 16,362 3,947 22,421 20,309
HSD MFO Coal Natural Gas Geothermal HydroGWh GWh GWh GWh GWh GWh GWh
Year 2005 18,880 7,133.0 29,439 12,902 2,870 6,247 77,471
Year 2006 16,575 7,717.0 34,526 13,434 2,975 4,682 79,909
HSD MFO Coal yNatural Gas Geothermal H dro% % % % % % %
Year 2005 24.4% 9.2% 38.0% 16.7% 3.7% 8.1% 100.0%
Year 2006 20.7% 9.7% 43.2% 16.8% 3.7% 5.9% 100.0%
Steam Gas Turbine Combined C. Geothermal Diesel HydroPLTU PLTG PLTGU PLTP PLTD PLTA MW
Year 2005 6,000 2,065.0 5,403 375 103 2,409 16,355
Year 2006 7,320 2,065.0 6,143 375 103 2,409 18,415
Steam Gas Turbine Combined C Geothermal Diesel Hy.
droPLTU PLTG PLTGU 375 PLTD PLTA %
Year 2005 36.7% 12.6% 33.0% 2.3% 0.6% 14.7% 100.0%
Year 2006 39.8% 11.2% 33.4% 2.0% 0.6% 13.1% 100.0%Note: * (75.65) is quoted from "Evaluasi Operasi System Jawa Bali 2007", P3B ** Source "Evaluasi Operasi System Jawa Bali 2007", P3B Source : PLN Statistics 2005, 2006
Year
Installed Capacity Rated Capacity Total for Jamali
YearEnergy Production Share by Type of Fuel (%) PLN Total
Installed
YearEnergy Production Share by Type of Fuel PLN Total
Production
YearInstalled Capacity (MW) PLN Total
Installed
YearPLN TotalProduction
Energy Production by Type of Fuel
2.4.4 Existing Power Development Plan
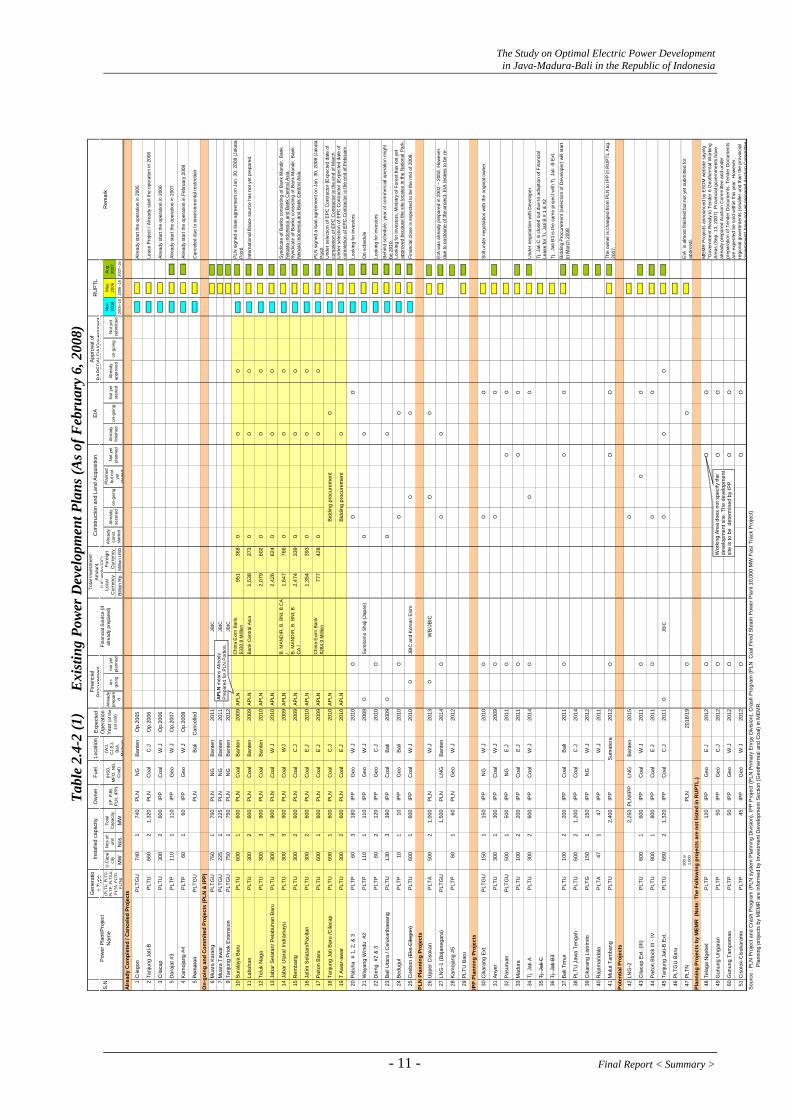
Table 2.4-2 shows the current power development plans listed in RUPTLs 2006 and 2007. As of February 6, 2008, five (5) projects have already started their commercial operation.
(1) Fast Track Program (6,900 MW) in Jamali
The fast track program with total installed capacity of 6,900 MW of coal-fired thermal plants in Jamali is expected to start its commercial operation during 2009 and 2010. Fig.2.4-4 shows locations of ten (10) coal-fired power plants under the fast track program.
Table 2.4-2(1) shows the progress of the Fast Track Program as of February 2008 and Table 2.4-2 (2) shows the latest progress as of November 2008. According to the latest information, eight (8) projects out of ten (10) projects are under construction stage. However, concerning the three (3) projects out of eight (8) projects, their progress are slow because progress payments to EPC contractors are coming from the Advance Payment only at the moment. The remaining two (2) projects have not yet started the construction and their commercial operations are expected to be 2011 or 2012.
Final Report < Summary > - 10 -
The Study on Optimal Electric Power Development in Java-Madura-Bali in the Republic of Indonesia
- 11 - Final Report < Summary >
Gen
erat
ion
Type
Ow
ner
Fuel
Loca
tion
U.C
apa
city
Nos
.of
unit
Tota
lC
apac
ityLo
cal
Cur
renc
yFo
reig
nC
urre
ncy
Nov
.20
06M
a20
06Au
g20
07
MW
Nos
.M
WBi
llion
Rp.
Mill
ion
US
D20
06~1
020
06~1
620
07~1
6
1C
ilego
n
PLTG
U74
01
740
PLN
NG
Bant
enO
p.20
05Al
read
y st
art t
he o
pera
tion
in 2
005
2Ta
njun
g Ja
ti-B
PLTU
660
21,
320
PLN
Coa
lC
.JO
p.20
06Le
ase
Proj
ect /
Alre
ady
star
t the
ope
ratio
n in
200
6
3C
ilaca
p PL
TU30
02
600
IPP
Coa
lW
.JO
p.20
06Al
read
y st
art t
he o
pera
tion
in 2
006
5D
araj
at #
3 P
LTP
110
111
0IP
PG
eoW
.JO
p.20
07Al
read
y st
art t
he o
pera
tion
in 2
007
4Ka
moj
ang
#4
PLT
P60
160
IPP
Geo
W.J
Op.
2008
Alre
ady
star
t the
ope
ratio
n in
Feb
ruar
y 20
08
5Pe
mar
on
y.
PLTG
UP
LNB
ali
Can
celle
dC
ance
led
due
to e
nviro
nmen
tal r
estri
ctio
n
On-
goin
g an
d C
omm
ited
Proj
ects
(PLN
& IP
P)6
Mua
ra K
aran
g PL
TGU
750
175
0P
LNN
GBa
nten
2011
JBIC
7M
uara
Taw
ar
PLTG
U22
51
225
PLN
NG
Bant
en20
11JB
IC9
Tanj
ung
Prio
k Ex
tens
ion
PLTG
U75
01
750
PLN
NG
Bant
en20
12JB
IC
10Su
rala
ya B
aru
PLTU
600
160
0P
LNC
oal
Bant
en20
09A
PLN
Chi
na E
xim
Ban
k$3
30.8
Mill
ion
951
368
OO
OPL
N s
igne
d a
loan
agr
eem
ent o
n Ja
n. 3
0, 2
008
(Jak
ata
Post
)
11La
buha
nPL
TU30
02
600
PLN
Coa
lBa
nten
2009
AP
LN
Bank
Cen
tral A
sia
1,53
837
3O
OO
Inte
rnat
iona
l fin
ace
sour
ce h
as n
ot y
et p
repa
red.
12Te
luk
Nag
aPL
TU30
03
900
PLN
Coa
lBa
nten
2010
AP
LN
2,07
960
2O
OO
13Ja
bar S
elat
an/ P
elab
uhan
Bar
uPL
TU30
03
900
PLN
Coa
lW
.J20
10A
PLN
2,42
662
4O
OO
14Ja
bar U
tara
/ Ind
ram
ayu
PLTU
300
390
0P
LNC
oal
WJ
2009
AP
LN
B. M
AND
IR, B
. BN
I, B.
CA
/1,
647
766
OO
OSy
ndic
ate
of B
anks
con
sist
ing
of B
ank
Man
dir,
Ban
kN
e gar
a In
done
sia
and
Bank
Cen
tral A
sia
15R
emba
ngPL
TU30
02
600
PLN
Coa
lC
.J20
09A
PLN
B. M
AND
IR, B
. BN
I, B.
CA
/2,
474
339
OO
OSy
ndic
ate
of B
anks
con
sist
ing
of B
ank
Man
dir,
Ban
kN
e gar
a In
done
sia
and
Bank
Cen
tral A
sia
16Ja
tim S
elat
an/P
acita
nPL
TU30
02
600
PLN
Coa
lE
.J20
10A
PLN
1,35
439
3O
OO
17Pa
iton
Bar
uPL
TU60
01
600
PLN
Coa
lE
.J20
09A
PLN
Chi
na E
xim
Ban
k$2
84.0
Mill
ion
777
428
OO
OPL
N s
igne
d a
loan
agr
eem
ent o
n Ja
n. 3
0, 2
008
(Jak
ata
Post
)
18Ta
njun
g Ja
ti Ba
ru /C
ilaca
pPL
TU60
01
600
PLN
Coa
lC
.J20
10A
PLN
Bidd
ing
proc
urem
ent
OU
nder
sel
ectio
n of
EPC
Con
tract
or (E
xpec
ted
date
of
com
plet
ion
of E
PC
Con
tract
or is
the
end
of M
arch
19T
Awar
-aw
arPL
TU30
02
600
PLN
Coa
lE
.J20
10A
PLN
Bidd
ing
proc
urem
ent
OU
nder
sel
ectio
n of
EPC
Con
tract
or (E
xpec
ted
date
of
com
plet
ion
of E
PC
Con
tract
or is
the
end
of F
ebru
ary
20Pa
tuha
# 1
, 2, &
3
PLT
P60
318
0IP
PG
eoW
.J20
10O
OO
Look
ing
for i
nves
tors
21W
ayan
g W
indu
#2
P
LTP
110
111
0IP
PG
eoW
.J20
09O
Sum
itom
o Sh
oji (
Japa
n)O
OO
n sc
hedu
le
22D
ieng
#2
& 3
PLT
P60
212
0IP
PG
eoC
.J20
10O
Look
ing
for i
nves
tors
23Ba
li U
tara
/ C
eluk
anba
wan
gPL
TU13
03
390
IPP
Coa
lB
ali
2009
OO
OBe
hind
sch
edul
e, y
ear o
f com
mer
cial
ope
ratio
n m
ight
be 2
010.
24Be
dugu
l P
LTP
101
10IP
PG
eoB
ali
2010
OO
OLo
okin
g fo
r inv
esto
rs, M
inis
try o
f For
est h
as n
ot y
eta p
prov
ed b
ecau
se th
e si
te lo
cate
s in
the
Nat
iona
l Par
k.
25C
irebo
n (E
ks C
ilego
n)PL
TU60
01
600
IPP
Coa
lW
.J20
10O
JBIC
and
Kor
ean
Exim
OO
Fina
ncia
l clo
se is
exp
ecte
d to
be
the
mid
of 2
008.
PLN
Pla
nnin
g Pr
ojec
ts
26U
pper
Cis
okan
PLT
A50
02
1,00
0P
LNW
.J20
13O
WB/
JBIC
OO
27LN
G-1
(Boj
aneg
ara)
PLTG
U1,
500
PLN
LNG
Bant
en20
14O
OO
EIA
was
alre
ady
prep
ared
in 2
002
~ 20
03. H
owev
er,
due
to p
ostp
one
of th
e pr
ojec
t, EI
A re
qire
s to
be
re-
28Ka
moj
ang
#5P
LTP
601
60P
LNG
eoW
.J20
12
29PL
TU B
aru
IPP
Plan
ning
Pro
ject
s
30C
ikar
ang
Ext.
PLTG
U15
01
150
IPP
NG
W.J
2010
OO
OSt
ill un
der n
egot
iatio
n w
ith th
e or
igin
al o
wne
r
31An
yer
PLTU
300
130
0IP
PC
oal
W.J
2009
OO
O
32Pa
suru
anPL
TGU
500
150
0IP
PN
GE
.J20
11O
OO
33M
adur
aPL
TU10
02
200
IPP
Coa
lE
.J20
11O
OO
34Tj
. Jat
i APL
TU30
02
600
IPP
Coa
lW
.J20
14O
OO
Und
er n
egot
iatio
n w
ith D
evel
oper
35Tj
. Jat
i CTj
. Jat
i C is
clo
sed
out d
ue to
ada
ptio
n of
Fin
anci
alLe
ase
for T
j. Ja
ti B
# 1
& #2
36Tj
. Jat
i B3
Tj.
Jati
B3
is th
e sa
me
proj
ect w
ith T
j. Ja
ti -B
Ext
.
37Ba
li Ti
mur
PLTU
100
220
0IP
PC
oal
Bal
i20
11O
OO
Bidd
ing
Pro
cure
men
t (se
lect
ion
of D
evel
oper
) will
star
tin
Mar
ch 2
008
38PL
TU J
awa
Teng
ahPL
TU60
02
1,20
0IP
PC
oal
C.J
2014
39C
ikar
ang
List
rindo
PLTG
150
115
0IP
PN
GW
.J20
12
40R
ajam
anda
laP
LTA
471
47IP
PW
.J20
11
41M
ulut
Tam
bang
PLTU
2,40
0IP
PSu
mat
era
2012
OO
OTh
e ow
ner i
s ch
ange
d fro
m P
LN to
IPP
in R
UPT
L Au
g.20
07.
Pote
ntia
l Pro
ject
s
42LN
G-2
2,25
0PL
N/IP
PLN
GBa
nten
2015
O
43C
ilaca
p Ex
t. (II
I)PL
TU60
01
600
IPP
Coa
lW
.J20
11O
OO
44Pa
iton
Blo
ck II
I - IV
PLTU
800
180
0IP
PC
oal
E.J
2011
OO
O
45Ta
njun
g Ja
ti-B
Ext.
PLTU
660
21,
320
IPP
Coa
lC
.J20
11O
JBIC
O
OO
46PL
TGU
Bar
u
47PL
TN90
0 or
1,00
0P
LN20
18/1
9O
OEI
A is
alm
ost f
inis
hed
but n
ot y
et s
ubm
itted
for
a ppr
oval
.Pl
anni
ng P
roje
cts
by M
EMR
(N
ote:
The
Fol
low
ing
proj
ects
are
not
list
ed in
RU
PTL.
)
48Te
laga
Nge
bel
PLT
P12
0IP
PG
eoE
.J20
12O
OO
49G
unun
g U
ngar
anP
LTP
50IP
PG
eoC
.J20
12O
OO
50G
unun
g Ta
mpo
mas
PLT
P50
IPP
Geo
W.J
2012
OO
O
51C
isol
ok-C
isuk
aram
eP
LTP
45IP
PG
eoW
.J20
12O
OO
Sour
ce :
PLN
Pro
ject
and
Cra
sh P
rogr
am (P
LN s
yste
m P
lann
ing
Div
isio
n), I
PP P
roje
ct (P
LN P
rimar
y E
nrgy
Div
isio
n), C
rash
Pro
gram
(PLN
Coa
l Fire
d St
eam
Pow
er P
lant
10,
000
MW
Fas
t Tra
ck P
roje
ct)
Pl
anni
ng p
roje
cts
by M
EMR
are
info
rmed
by
Inve
stm
ent D
evel
opm
ent S
ectio
n (G
eoth
erm
al a
nd C
oal)
in M
EMR
.
RU
PTL
oie
subm
itted
ME
MR
Pro
ject
s an
noun
ced
by E
SDM
web
site
say
ing
"Gov
ernm
ent R
eady
to T
ende
r 6 G
eoth
erm
al W
orki
ngAr
eas
(Sep
. 13,
200
7). P
rovi
ncia
l gov
ernm
ents
hav
eal
read
y pr
epar
ed A
uctio
n C
omm
ittee
and
und
erpr
epar
atio
n of
Ten
der D
ocum
ents
. Ten
der D
ocum
ents
are
expe
cted
be
sold
with
in th
is y
ear.
How
ever
,re
gion
al g
over
nmen
ts (s
mal
ler u
nit t
han
the
prov
inci
al
on-g
ngN
ot y
t
gove
rnm
ent)
have
noty
etpr
epar
edAu
ctio
nC
omm
ittee
Rem
ark
Alre
ady
prep
are
d
aap
prov
ed
Appr
oval
of
BAPE
DA
LDA/
Gov
ernm
ent
Fina
ncia
lPr
ocur
emen
tFi
nanc
ial S
ourc
e (if
alre
ady
prep
ared
)
Alre
ady
Com
plet
ed /
Can
cele
d Pr
ojec
ts
Alr
finis
hed
yst
arte
don
-go
ing
not y
etpl
anne
d N
ot y
etpl
anne
d
S.N
Pow
er P
lant
/Pro
ject
Nam
e
EIA
(PLT
U, P
LTG
,PL
TP, P
LTG
U,
PLT
A, P
LTD
,P
LTN
)
(IP, P
JB,
PLN
, IP
P)
(HS
D,
MFO
, NG
,C
oal)
(WJ,
CJ,
EJ,
Bali,
Alre
etdy
eady
on-g
oing
Not
Mad
ura)
Inst
alle
d ca
paci
tyEx
pect
edO
pera
tion
Year
(of t
he1s
t uni
t)
Tota
l Inv
estm
ent
Amou
nt(L
/Can
d/or
F/C
)C
onst
ruct
ion
and
Land
Acq
uisi
tion
Alre
ady
cons
t.st
arte
d
Alre
ady
secu
red
on-g
oing
Pla
nned
but n
otye
tst
arte
d
Wor
king
Are
a do
es n
ot s
peci
fy th
e de
velo
pmen
t site
. The
dev
elop
men
t si
te is
to b
e d
eter
min
ed b
y IP
P
APLN
mea
ns A
lread
y Pr
epar
ed fo
r PLN
Por
tion.
Tabl
e 2.
4-2
(1)
E
xist
ing
Pow
er D
evel
opm
ent P
lans
(As o
f Feb
ruar
y 6,
200
8)

The Study on Optimal Electric Power Development in Java-Madura-Bali in the Republic of Indonesia
Table 2.4-2(2) Latest Progress of the Fast Track Program (As of November 06, 2008)
Fast Track Program (6,900 MW Crash Program in Jamali)
10 Suralaya Baru 2009 AlreadyPaid Finance Close (China Exim Bank) Finance Close Under construction
11 Labuhan 2009 AlreadyPaid No Foreign Bankers Finance Close (Bank Central Asia) Under construction
12 Teluk Naga 2010 AlreadyPaid
Under negotiation with Bank of China(Interest and Government concerned)
Determination of loan amount byforeign bankers first, thennegotiation with local bankers.
Under construction but progress is slowdue to the progress payment is coveredby Advance Payment.
13 Jabar Selatan/Pelabuhan Baru 2010 Already
Paid Looking for foreign bankersDetermination of loan amount byforeign bankers first, thennegotiation with local bankers.
Under construction but progress is slowdue to the progress payment is coveredby Advance Payment.
14 Jabar Utara/Indramayu 2009 Already
Paid Finance Close (Bank of China) Finance Close (B. MANDIR, B. BNI,B.CA ) Under construction
15 Rembang 2009 AlreadyPaid Finance Close (Barclays Bank) Finance Close (B. MANDIR, B. BNI,
B. CA ) Under construction
16 Jatim Selatan/Pacitan 2010 AlreadyPaid
Under negotiation with China Exim Bank(waiting signing and governmentsapproval)
Determination of loan amount byforeign bankers first, thennegotiation with local bankers.
Under construction but progress is slowdue to the progress payment is coveredby Advance Payment.
17 Paiton Baru 2009 AlreadyPaid Finance Close (China Exim Bank) Finance Close Under construction
18 Tanjung Jati Baru/Cilacap 2011/12 Not yet Looking for foreign bankers Not yet proceeded
Not yet start construction due to waitingfor the official approval for EPCContract
19 T Awar-awar 2011/12 Not yet Looking for foreign bankers Not yet proceededNot yet start construction due to waitingfor the official approval for EPCContract
Source: PLN
S.N Power Plant/ProjectName
ExpectedOperation Year
(of the 1stunit)
Financial Procurement
Progress of ConstructionPLNAdvancePayment
ForeignBankers
LocalBankers
BALI
2015
RCKEK
2006
JAWA
CLGON
SLAYA
KMBNG
BKASI
GNDUL
CWANG
CBATU
CIBNGCRATA
SGLNG
BDSLNMDCAN
KLTEN
UNGARTSBBR
GRSIK
SB
PITON
KDBRU
MADURA
LTN
BLRJ
TJATI
A
DEPOK
MRTWR
NG
GRATI
TSBNG
MYA2005
2006
2010
LORWA2011
LNGPM2011
2007
TJATI.A/C2010
T.AWAR2012
2006/7
CSKAN2012
PKLANU2012
2006GRABJ
2008
BNGIL2011
NGOR2015
O
MNRJO2012
GDARL2010 2007
CLCAP2011
KA LPA2011
2011
2012
T. Jati B SCPP
LKONG
GU
G
U
G
GU
U
AU
A
GUGU
GU
AU
U
UGU
PLTU Suralaya Ext1 x 600 MW
U
PLTU Labuhan2x300 MW
U
PLTU Teluk Naga3 x300 MW
U
PLTU Jabar Selatan3x300 MW
U
PLTU Jabar Utara3x300 MW
U
PLTU Rembang1x600 MW, 2009
U
PLTU Jatim Selatan2x300 MW
U
PLTU Paiton Baru1x600 MW
PLTU Tanjung Awar-awar2x300 MW
PLTU Cilacap1x600 MW BALI
RCKEK
2015
2006
JAWA
CLGON
SLAYA
KMBNG
BKASI
GNDUL
CWANG
CBATU
CIBNGCRATA
SGLNG
BDSLNMDCAN
KLTEN
UNGARTSBBR
GRSIK
SB
PITON
KDBRU
MADURA
LTN
BLRJ
TJATI
A
DEPOK
MRTWR
NG
GRATI
TSBNG
MYA2005
2006
2010
LORWA2011
LNGPM2011
2007
TJATI.A/C2010
T.AWAR2012
2006/7
CSKAN2012
PKLANU2012
2006GRABJ
2008
BNGIL2011
NGOR2015
O
MNRJO2012
GDARL2010 2007
CLCAP2011
KA LPA2011
2011
2012
T. Jati B SCPP
LKONG
GU
G
U
G
GU
U
AU
A
GUGU
GU
AU
U
UGU
PLTU Suralaya Ext1 x 600 MW
U
PLTU Labuhan2x300 MW
U
PLTU Jabar Utara3x300 MW
PLTU Teluk Naga3 x300 MW
U
PLTU Jabar Selatan3x300 MW
U
U
PLTU Rembang1x600 MW, 2009
PLTU Tanjung Awar-awar2x300 MW
U
PLTU Jatim Selatan2x300 MW
U
PLTU Paiton Baru1x600 MW
PLTU Cilacap1x600 MW
Fig.2.4-4 Location of Fast Track Program (6,900 MW) in Jamali
(2) Geothermal (PLTP) Development
Drajat unit 3 (110 MW, IPP) and Kamojang unit 4 (60 MW, IPP) were put into operation in June 2007 and February 2008, respectively. Four (4) geothermal power plants are already committed or under construction start their commercial operations in 2009 and 2010. However, two (2) out of 4 projects are still looking for investors. All geothermal power development will be implemented by IPP. Apart from
Final Report < Summary > - 12 -
The Study on Optimal Electric Power Development in Java-Madura-Bali in the Republic of Indonesia
RUPTL, MEMR is planning under its own initiative1 to develop four (4) geothermal power plants of 265 MW in total capacity in Jamali, with expected commercial operation from 20122.
(3) Combined Cycle Thermal Power Plant (PLTGU) Development
Development of combined cycle thermal power plants by IPP, such as Cikarang Extension (150 MW) and Pasuruan (500 MW), has been eliminated from the latest development plan (RUPTL in 2007). Future development plan of combined cycle thermal power plants is only by LNG-fired PLTGU (Bojanegara, 2 × 750 MW, PLN) except for the on-going projects under JBIC Loan.
(4) Hydropower (PLTA) Development
Due to the limited potential sites for hydroelectric power development in Jamali, especially for reservoir-type hydroelectric power development, only Upper Cisokan Pumped Storage Power Plant (2 × 500 MW) with expected commercial operation from 2013, is planned. If PLN wishes to start its commercial operation as originally schedule, its construction meets to start in 2008, construction of Upper Cisokan Power Plant requires 5 years. However, its finance since has not been fixed even though World Bank and other international financial institutions show their intention to provide funding. Considering the progress of financial arrangement, its commercial operation seems to delay for 2 years (2015).
(5) Nuclear Power (PLTN) Development
Development of PLTN has been under way even though it is not mentioned in the latest plan (RUPTL 2007). The Indonesia Government has not fixed its location yet.
2.4.5 Power System Reinforcement Plan
The overall power system reinforcement plan in Indonesia is divided into two parts, one for Java-Madura-Bali and the other for the remaining areas, and they are carried out respectively. This power reinforcement plan will be conducted in the next decade. Its accomplishment will be in cooperated to RUPTL and the plan will be revised annually.
(1) Current Situation of Java-Madura-Bali System
The present major power transmission system in Java Island is a 500 kV system extending to all areas of the island.
The 500 kV system is comprised of the north and south corridors that go through Java Island for about 900 km from east to west, and comprised of interconnection lines that connect these 2
1 System Planning Section of PLN has not been informed by MEMR as of Feb. 6, 2008. 2 According to the Jakarta Post of June 7, 2006, Tampomas (50 MW), Cisolok Sukarame (45 MW) and Tangkuban Perahu (220 MW) have
been bided and their operation are expected in 2011.
- 13 - Final Report < Summary >
The Study on Optimal Electric Power Development in Java-Madura-Bali in the Republic of Indonesia
corridors. The system in Bali Island is connected to the Java system with 150 kV submarine cables, and the Java and Bali systems are operated integrally and they configure Java-Bali system.
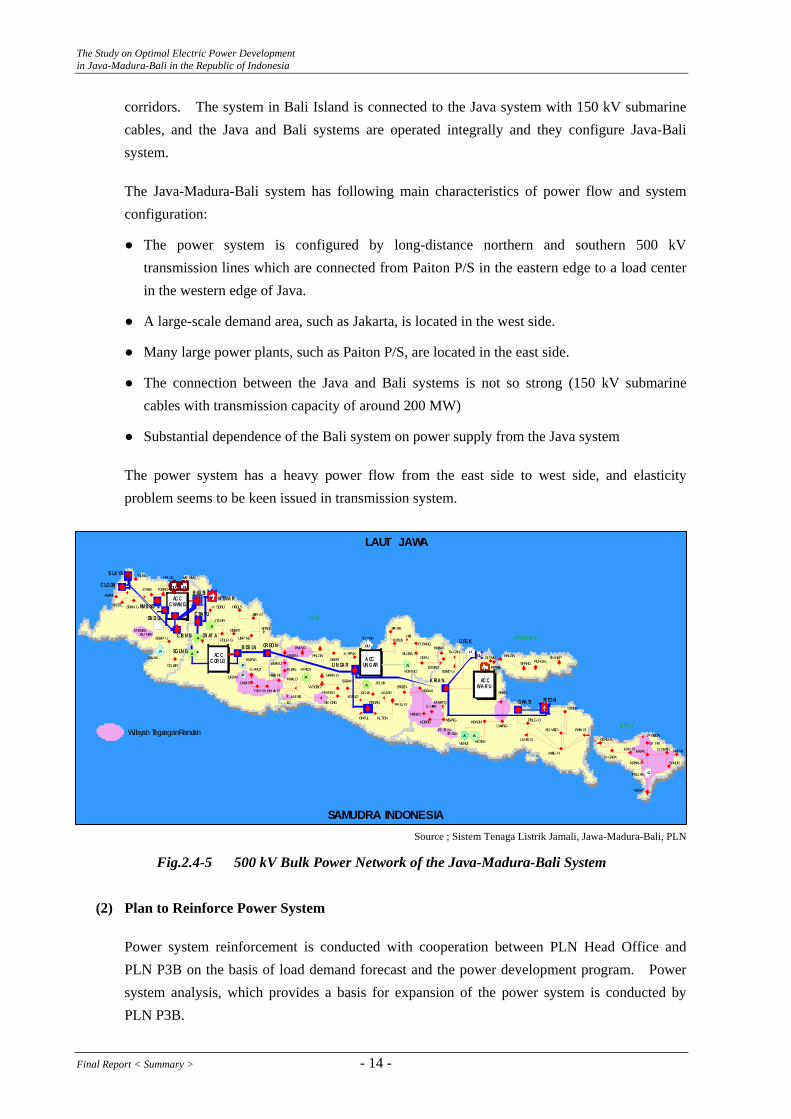
The Java-Madura-Bali system has following main characteristics of power flow and system configuration:
● The power system is configured by long-distance northern and southern 500 kV transmission lines which are connected from Paiton P/S in the eastern edge to a load center in the western edge of Java.
● A large-scale demand area, such as Jakarta, is located in the west side.
● Many large power plants, such as Paiton P/S, are located in the east side.
● The connection between the Java and Bali systems is not so strong (150 kV submarine cables with transmission capacity of around 200 MW)
● Substantial dependence of the Bali system on power supply from the Java system
The power system has a heavy power flow from the east side to west side, and elasticity problem seems to be keen issued in transmission system.
Source ; Sistem Tenaga Listrik Jamali, Jawa-Madura-Bali, PLN
Fig.2.4-5 500 kV Bulk Power Network of the Java-Madura-Bali System
H
S LA YA
SRAN G
CN JUR
K SBRU
JTLHR
PDLR GCR AT A
MRICA
WSOBO
RWALO
BNTUL KLTEN
JELOKSGRAH
BABATG RS IK
K RI A N
KKTES
KBAGN
PMKSN
STBDO
BD WSO
JMBE R
BWN GI
JAJARBOJLI
WLERIU N GA R
SMNEPGLTMR
JTAKE
SLIRA
GARN G
ASAHI
KKSTL
C LG ON
CBBAT
TB ROK
U
A CCUN G AR
GU
BNGI L
(2) Plan to Reinforce Power System
Power system reinforcement is conducted with cooperation between PLN Head Office and PLN P3B on the basis of load demand forecast and the power development program. Power system analysis, which provides a basis for expansion of the power system is conducted by PLN P3B.
JAVA
MADUR A
B AL I
SALAK
U
K RPYK BKLAN
G RA TI
GU
A
MK RNG
BGBR U C IB N G
SG LN G
TGRNG GU
AC CC WAN G
GU
PRI OK
P A
P
B DS LN
KMJNG
SRGEN
A
U MTWA RB KA SI
PA LU R
PERAK
A
A
GU
SPANG
GLNU K
N GARA
AC CWA R U
A
CR BO NAC C
C GR LG
PI TO NU
PEDAN
LWANG
SRAGI
UBR NG
JTBR G
HRGLS
C BA TUGN D UL
KMB NG
AKDMBO
PKLON CEPU
R BANG
BLORA
KUDUSPATI
JPA RA
LMJN G
PBLGO
Wilayah TeganganRandah
SGMD U
ULN GAN
BJGRO
WLNGI
A
MGUNG
MKRTO
MNRJO
NGAWI
KDBRU
S URYA
MJN NG
BN JA R
DRJATCAMI S
GARUTP
TSMYA
MENESBU NAR
PMLNG
BMAYU
KBSEN
KLBKL
LMNISG GB ONG
PWRJOKNTUG
TR GLKPC TA N
LAUT JAWA
SAMUDRA INDONESIA
P MRON
BTR TI AMLRA
SANUR
KAPAL GNYARBT RTI
KRBKN
GPSGRH
NSDUA
Final Report < Summary > - 14 -

The Study on Optimal Electric Power Development in Java-Madura-Bali in the Republic of Indonesia
In accordance with the latest power reinforcement plan by PLN, transmission lines and transformers required for the trunk power system in the next decade are shown in the tables below.
1) Expansion Plan for Transmission Lines
To meet the rapidly increasing demand, trunk transmission lines are reinforces significantly. As for 500 kV transmission lines, although the total length of 3,128 km is already in place as of 2006, substantial addition of 2,557 km is planned for the next decade.
Table 2.4-3 Expansion Plan of 500 kV and 150 kV Transmission Line (km)
Transmission Line 2006*) 2007 2008 2009 2010 2011 2012 2013 2014 2015 2016
500 kV 3,128 129 165 773 462 622 56 20 100 210 20
150 kV 11,055 1,759 2,358 1,767 445 184 534 388 382 46 45
*) Existing as of year 2006 Source : RUPTL 2007-2016
2) Transformer
Also for the trunk transformers, additional 22,164 MVA are planned for 500/150 kV transformers, and additional 28,530 MVA are planned for 150/70 or 20 kV transformers. 70 kV power system is under reduction, and this voltage system should be absorbed to 20 kV system to simplify the system voltage level in future.
Table 2.4-4 Expansion Plan of 500 kV and 150 kV Transformer (MVA)
Transformer 2006*) 2007 2008 2009 2010 2011 2012 2013 2014 2015 2016
500/150kV 15,500 1,832 2,832 1,500 4,000 1,500 2,000 1,500 1,500 3,000 2,500
150/70kV 3,579 480 220 100 - 180 100 30 - - -
150/20kV 24,470 5,220 4,470 2,700 3,090 2,160 2,610 2,010 2,430 1,860 870
*) Existing as of 2006 Source : RUPTL 2007-2016
3) New Trunk Substations
To respond to the increase of demand in the area, installation of new substations are planned to provide basis to satisfy electric demand in the area. New trunk substations, as many as twelve 500 kV substations and eleven for 150 kV substations are planned for the next decade as shown in table below.
- 15 - Final Report < Summary >
The Study on Optimal Electric Power Development in Java-Madura-Bali in the Republic of Indonesia
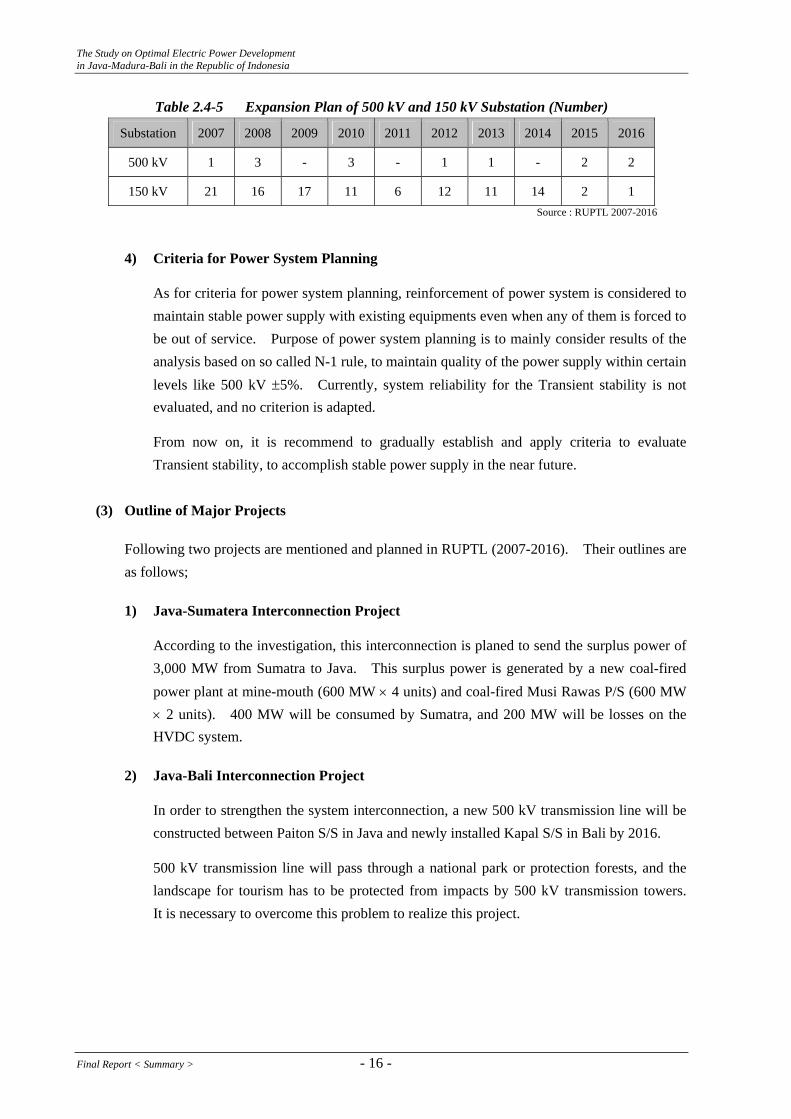
Table 2.4-5 Expansion Plan of 500 kV and 150 kV Substation (Number)
Substation 2007 2008 2009 2010 2011 2012 2013 2014 2015 2016
500 kV 1 3 - 3 - 1 1 - 2 2
150 kV 21 16 17 11 6 12 11 14 2 1 Source : RUPTL 2007-2016
4) Criteria for Power System Planning
As for criteria for power system planning, reinforcement of power system is considered to maintain stable power supply with existing equipments even when any of them is forced to be out of service. Purpose of power system planning is to mainly consider results of the analysis based on so called N-1 rule, to maintain quality of the power supply within certain levels like 500 kV ±5%. Currently, system reliability for the Transient stability is not evaluated, and no criterion is adapted.
From now on, it is recommend to gradually establish and apply criteria to evaluate Transient stability, to accomplish stable power supply in the near future.
(3) Outline of Major Projects
Following two projects are mentioned and planned in RUPTL (2007-2016). Their outlines are as follows;
1) Java-Sumatera Interconnection Project
According to the investigation, this interconnection is planed to send the surplus power of 3,000 MW from Sumatra to Java. This surplus power is generated by a new coal-fired power plant at mine-mouth (600 MW × 4 units) and coal-fired Musi Rawas P/S (600 MW × 2 units). 400 MW will be consumed by Sumatra, and 200 MW will be losses on the HVDC system.
2) Java-Bali Interconnection Project
In order to strengthen the system interconnection, a new 500 kV transmission line will be constructed between Paiton S/S in Java and newly installed Kapal S/S in Bali by 2016.
500 kV transmission line will pass through a national park or protection forests, and the landscape for tourism has to be protected from impacts by 500 kV transmission towers. It is necessary to overcome this problem to realize this project.
Final Report < Summary > - 16 -

The Study on Optimal Electric Power Development in Java-Madura-Bali in the Republic of Indonesia
2.4.6 Current Condition of System Operation Regional operation boundary of Jamali system is shown in the right figure. Central dispatching control center (JCC) conducts dispatching, and observes and controls 500 kV system. While, regional control centers observe and control 150 kV and 70 kV system. Regional control centers are separated into Region 1 (RCC1), Region 2 (RCC2), Region 3 (RCC3) and Region 4 (RCC4). Region 4 is subdivided into East Java and Bali.
Regional Control Area in Jamali System
In PLN, the grid code which describes rules on system operation was revised in 2007, and several documents such as annual operation plan for the next year and monthly and annual operation record are issued. It can be said that structure, facilities and rules for operation are well conditioned. However, problems in power quality such as in voltage and frequency exist, probably because of fundamental lack of facilities. Problems on operation can be classified into voltage, frequency, outage and loss.
(1) Voltage
The table below shows the record of voltage drop below the standard value in recent years. The number in the table represents cumulative number of substations with voltage drop in each year. Although violation of voltage standard was recorded many times, the problem seems to be mitigated briefly due to some factors including the completion of southern 500 kV transmission line in 2006.
Table 2.4-6 Total Number of Substation with Voltage Drop
2002 2003 2004 2005 2006 2007 2008*
500 kV (S/S) 103 158 149 145 75 60 50
150 kV (S/S) 566 551 407 479 288 153 435
70 kV (S/S) 319 248 198 207 169 252 153
* Up to September, 2008 Source : PLN
In order to maintain proper voltage, reactive power shall be supplied to the grid adequately. In Indonesia, lack of reactive power supply equipment including capacitors and the fact that reactive output from generator is not fully utilized are considered to be fundamental reason for voltage problem.
- 17 - Final Report < Summary >
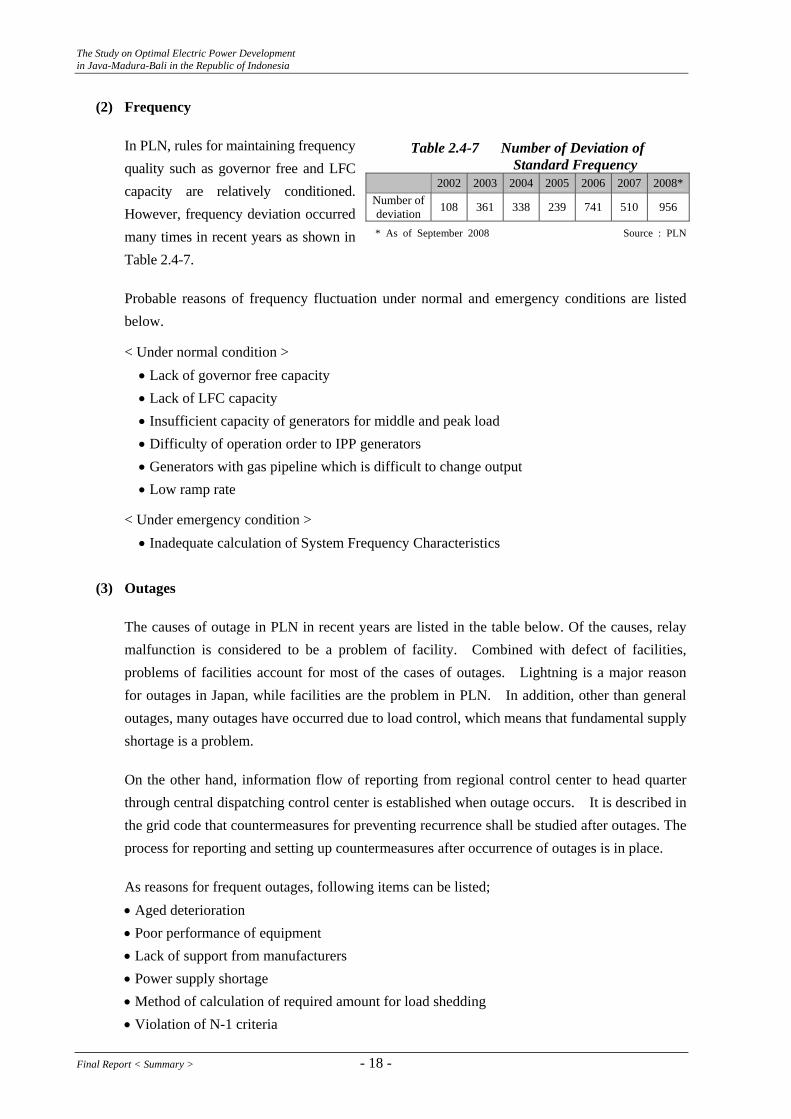
The Study on Optimal Electric Power Development in Java-Madura-Bali in the Republic of Indonesia
(2) Frequency
In PLN, rules for maintaining frequency quality such as governor free and LFC capacity are relatively conditioned. However, frequency deviation occurred many times in recent years as shown in Table 2.4-7.
* As of September 2008 Source : PLN
Table 2.4-7 Number of Deviation of Standard Frequency
2002 2003 2004 2005 2006 2007 2008*Number of deviation 108 361 338 239 741 510 956
Probable reasons of frequency fluctuation under normal and emergency conditions are listed below.
< Under normal condition > • Lack of governor free capacity • Lack of LFC capacity • Insufficient capacity of generators for middle and peak load • Difficulty of operation order to IPP generators • Generators with gas pipeline which is difficult to change output • Low ramp rate
< Under emergency condition > • Inadequate calculation of System Frequency Characteristics
(3) Outages
The causes of outage in PLN in recent years are listed in the table below. Of the causes, relay malfunction is considered to be a problem of facility. Combined with defect of facilities, problems of facilities account for most of the cases of outages. Lightning is a major reason for outages in Japan, while facilities are the problem in PLN. In addition, other than general outages, many outages have occurred due to load control, which means that fundamental supply shortage is a problem.
On the other hand, information flow of reporting from regional control center to head quarter through central dispatching control center is established when outage occurs. It is described in the grid code that countermeasures for preventing recurrence shall be studied after outages. The process for reporting and setting up countermeasures after occurrence of outages is in place.
As reasons for frequent outages, following items can be listed; • Aged deterioration • Poor performance of equipment • Lack of support from manufacturers • Power supply shortage • Method of calculation of required amount for load shedding • Violation of N-1 criteria
Final Report < Summary > - 18 -
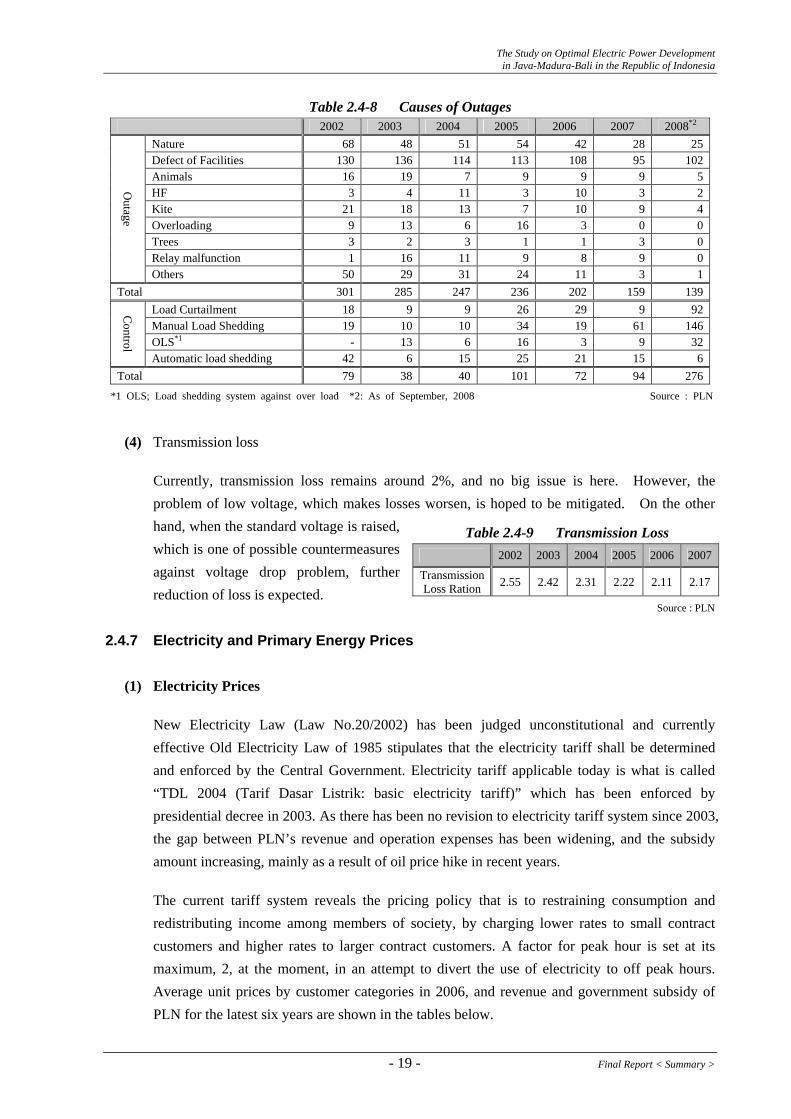
The Study on Optimal Electric Power Development in Java-Madura-Bali in the Republic of Indonesia
Table 2.4-8 Causes of Outages 2002 2003 2004 2005 2006 2007 2008*2
Nature 68 48 51 54 42 28 25Defect of Facilities 130 136 114 113 108 95 102Animals 16 19 7 9 9 9 5HF 3 4 11 3 10 3 2Kite 21 18 13 7 10 9 4Overloading 9 13 6 16 3 0 0Trees 3 2 3 1 1 3 0Relay malfunction 1 16 11 9 8 9 0
Outage
Others 50 29 31 24 11 3 1Total 301 285 247 236 202 159 139
Load Curtailment 18 9 9 26 29 9 92Manual Load Shedding 19 10 10 34 19 61 146OLS*1 - 13 6 16 3 9 32
Control
Automatic load shedding 42 6 15 25 21 15 6Total 79 38 40 101 72 94 276
*1 OLS; Load shedding system against over load *2: As of September, 2008 Source : PLN
(4) Transmission loss
Currently, transmission loss remains around 2%, and no big issue is here. However, the problem of low voltage, which makes losses worsen, is hoped to be mitigated. On the other hand, when the standard voltage is raised, which is one of possible countermeasures against voltage drop problem, further reduction of loss is expected.
Source : PLN
Table 2.4-9 Transmission Loss 2002 2003 2004 2005 2006 2007
Transmission Loss Ration 2.55 2.42 2.31 2.22 2.11 2.17
2.4.7 Electricity and Primary Energy Prices
(1) Electricity Prices
New Electricity Law (Law No.20/2002) has been judged unconstitutional and currently effective Old Electricity Law of 1985 stipulates that the electricity tariff shall be determined and enforced by the Central Government. Electricity tariff applicable today is what is called “TDL 2004 (Tarif Dasar Listrik: basic electricity tariff)” which has been enforced by presidential decree in 2003. As there has been no revision to electricity tariff system since 2003, the gap between PLN’s revenue and operation expenses has been widening, and the subsidy amount increasing, mainly as a result of oil price hike in recent years.
The current tariff system reveals the pricing policy that is to restraining consumption and redistributing income among members of society, by charging lower rates to small contract customers and higher rates to larger contract customers. A factor for peak hour is set at its maximum, 2, at the moment, in an attempt to divert the use of electricity to off peak hours. Average unit prices by customer categories in 2006, and revenue and government subsidy of PLN for the latest six years are shown in the tables below.
- 19 - Final Report < Summary >
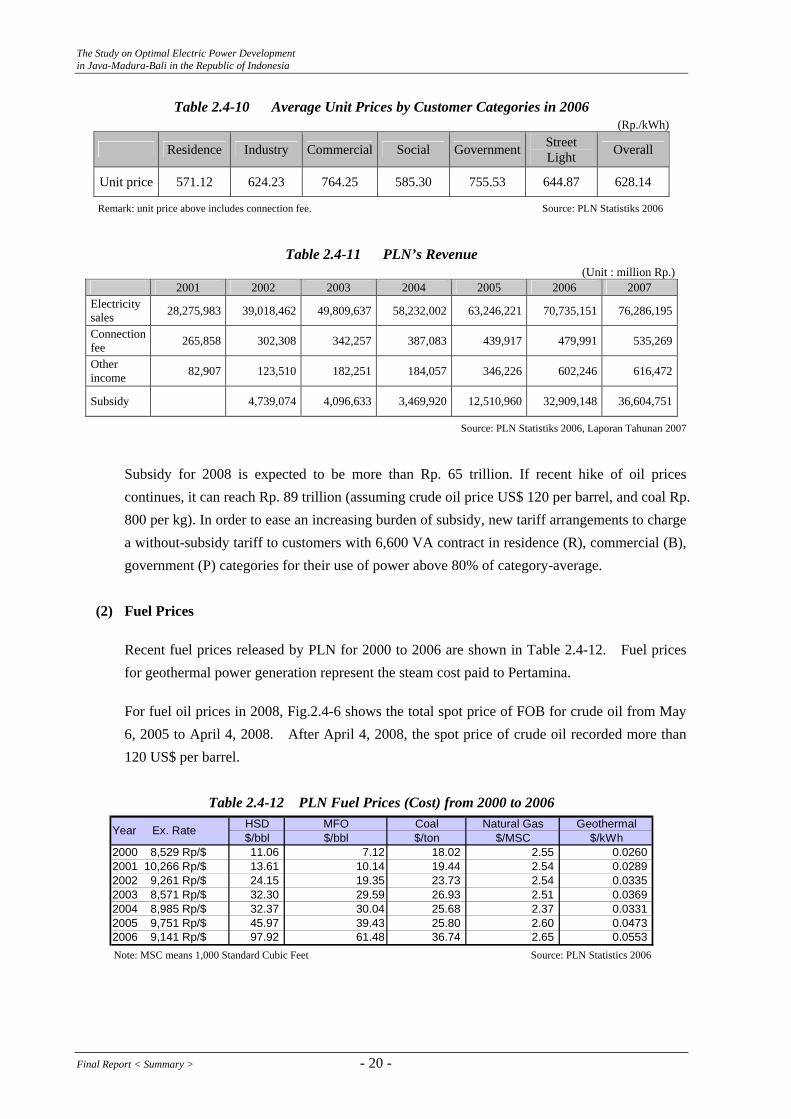
The Study on Optimal Electric Power Development in Java-Madura-Bali in the Republic of Indonesia
Table 2.4-10 Average Unit Prices by Customer Categories in 2006 (Rp./kWh)
Residence Industry Commercial Social Government Street Light Overall
Unit price 571.12 624.23 764.25 585.30 755.53 644.87 628.14
Remark: unit price above includes connection fee. Source: PLN Statistiks 2006
Table 2.4-11 PLN’s Revenue
(Unit : million Rp.) 2001 2002 2003 2004 2005 2006 2007 Electricity sales 28,275,983 39,018,462 49,809,637 58,232,002 63,246,221 70,735,151 76,286,195
Connection fee 265,858 302,308 342,257 387,083 439,917 479,991 535,269
Other income 82,907 123,510 182,251 184,057 346,226 602,246 616,472
Subsidy 4,739,074 4,096,633 3,469,920 12,510,960 32,909,148 36,604,751
Source: PLN Statistiks 2006, Laporan Tahunan 2007
Subsidy for 2008 is expected to be more than Rp. 65 trillion. If recent hike of oil prices continues, it can reach Rp. 89 trillion (assuming crude oil price US$ 120 per barrel, and coal Rp. 800 per kg). In order to ease an increasing burden of subsidy, new tariff arrangements to charge a without-subsidy tariff to customers with 6,600 VA contract in residence (R), commercial (B), government (P) categories for their use of power above 80% of category-average.
(2) Fuel Prices
Recent fuel prices released by PLN for 2000 to 2006 are shown in Table 2.4-12. Fuel prices for geothermal power generation represent the steam cost paid to Pertamina.
For fuel oil prices in 2008, Fig.2.4-6 shows the total spot price of FOB for crude oil from May 6, 2005 to April 4, 2008. After April 4, 2008, the spot price of crude oil recorded more than 120 US$ per barrel.
Table 2.4-12 PLN Fuel Prices (Cost) from 2000 to 2006
HSD MFO Coal Natural Gas Geothermal$/bbl $/bbl $/ton $/MSC $/kWh
2000 8,529 Rp/$ 11.06 7.12 18.02 2.55 0.02602001 10,266 Rp/$ 13.61 10.14 19.44 2.54 0.02892002 9,261 Rp/$ 24.15 19.35 23.73 2.54 0.03352003 8,571 Rp/$ 32.30 29.59 26.93 2.51 0.03692004 8,985 Rp/$ 32.37 30.04 25.68 2.37 0.03312005 9,751 Rp/$ 45.97 39.43 25.80 2.60 0.04732006 9,141 Rp/$ 97.92 61.48 36.74 2.65 0.0553
Year Ex. Rate
Note: MSC means 1,000 Standard Cubic Feet Source: PLN Statistics 2006
Final Report < Summary > - 20 -

The Study on Optimal Electric Power Development in Java-Madura-Bali in the Republic of Indonesia
Total World Spot Price FOB
0
20
40
60
80
100
120
2005
/5/6
2005
/8/6
2005
/11/
6
2006
/2/6
2006
/5/6
2006
/8/6
2006
/11/
6
2007
/2/6
2007
/5/6
2007
/8/6
2007
/11/
6
2008
/2/6
yy/mm/dd
US$
per
Bar
rel
Source: Energy Information Administration, USA http://tonto.eia.doe.gov/dnav/pet
Fig.2.4-6 Crude Oil Total World Spot Price of FOB
As for the current coal prices, 3,400 MW Suralaya Coal-Fired Power Plant purchases fuel coal on CIF basis under conditions as shown in Table 2.4-13.
Table 2.4-13 Coal Prices at PLTU Suralaya Coal-Fired Power Plant
Coal Type Heat Content Coal Price (1) Coal Price (2) Coming from Medium Rank Coal 5,100 kcal/kg 540,000 Rp/ton 58.7 US$/ton Sumatra Low Rank Coal 4,500 kcal/kg 420,000 Rp/ton 45.7 US$/ton Kalimantan
Note: 1 US$ = 9,200 Rp. Caloric value is as received base. Source: Hearing investigation on PLTU Suralaya Thermal Plant on June 3, 2008
As for the current LNG price, no domestic market price is available, since all of LNG production is at present to countries, such as Japan, Korea and Taiwan. For reference, LNG FOB prices to Japan in 2008 are between 9 US$/MMBTU3 to 12 US$/MMBTU, and their contracts include a clause to reflect escalations of the crude oil price.
2.4.8 IPP and Coal-Fired Power Plant Development in Fast Track Program
(1) IPP (Independent Power Producer)
PLN started purchasing power from IPP in 1990s. Since then, the power purchased by PLN has been growing rapidly.
PLN makes power generation plan in RUPTL where some of generation is set to come from IPPs based on which PLN prepares for announcement of IPP project, call for candidates, selection, PPA, etc, while Minister of Energy and Mineral Resources grants license and approves power purchasing prices in PPA. Selection of developers for an IPP project is done
3 Source: MIGAS, MEMR on June 5, 2008
- 21 - Final Report < Summary >
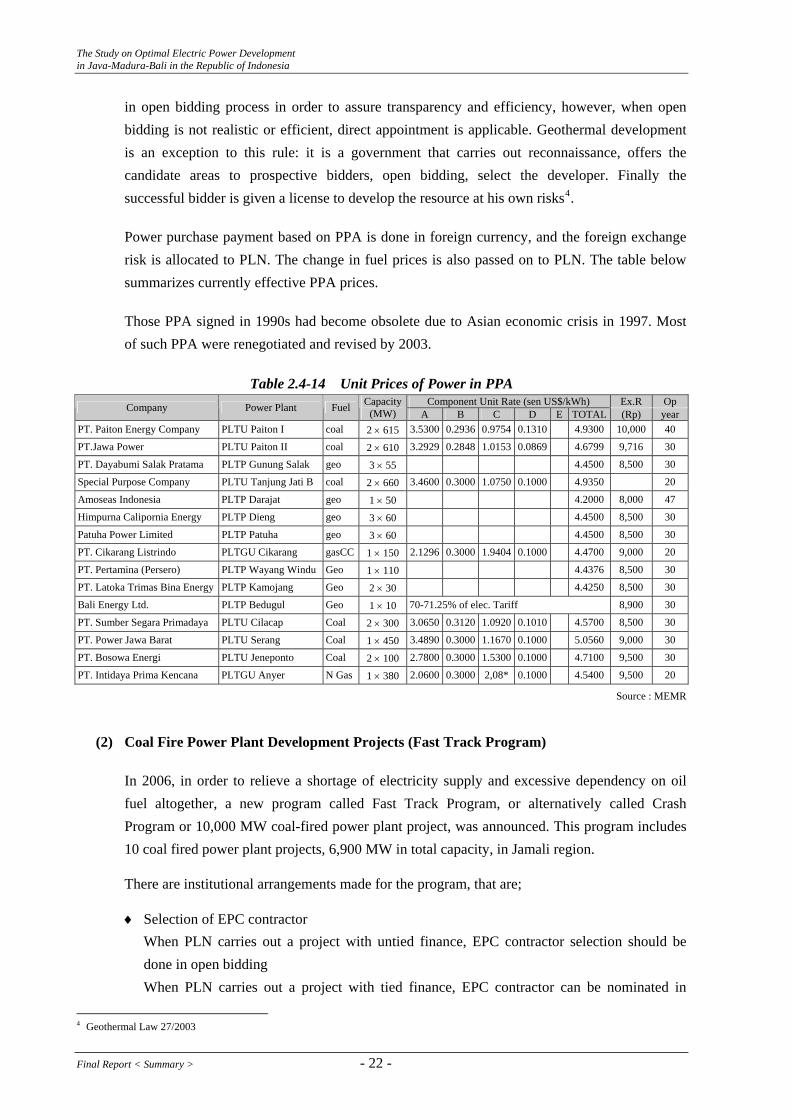
The Study on Optimal Electric Power Development in Java-Madura-Bali in the Republic of Indonesia
in open bidding process in order to assure transparency and efficiency, however, when open bidding is not realistic or efficient, direct appointment is applicable. Geothermal development is an exception to this rule: it is a government that carries out reconnaissance, offers the candidate areas to prospective bidders, open bidding, select the developer. Finally the successful bidder is given a license to develop the resource at his own risks4.
Power purchase payment based on PPA is done in foreign currency, and the foreign exchange risk is allocated to PLN. The change in fuel prices is also passed on to PLN. The table below summarizes currently effective PPA prices.
Those PPA signed in 1990s had become obsolete due to Asian economic crisis in 1997. Most of such PPA were renegotiated and revised by 2003.
Table 2.4-14 Unit Prices of Power in PPA
Component Unit Rate (sen US$/kWh) Ex.R Op Company Power Plant Fuel Capacity(MW) A B C D E TOTAL (Rp) year
PT. Paiton Energy Company PLTU Paiton I coal 2 × 615 3.5300 0.2936 0.9754 0.1310 4.9300 10,000 40
PT.Jawa Power PLTU Paiton II coal 2 × 610 3.2929 0.2848 1.0153 0.0869 4.6799 9,716 30
PT. Dayabumi Salak Pratama PLTP Gunung Salak geo 3 × 55 4.4500 8,500 30
Special Purpose Company PLTU Tanjung Jati B coal 2 × 660 3.4600 0.3000 1.0750 0.1000 4.9350 20
Amoseas Indonesia PLTP Darajat geo 1 × 50 4.2000 8,000 47
Himpurna Calipornia Energy PLTP Dieng geo 3 × 60 4.4500 8,500 30
Patuha Power Limited PLTP Patuha geo 3 × 60 4.4500 8,500 30
PT. Cikarang Listrindo PLTGU Cikarang gasCC 1 × 150 2.1296 0.3000 1.9404 0.1000 4.4700 9,000 20
PT. Pertamina (Persero) PLTP Wayang Windu Geo 1 × 110 4.4376 8,500 30
PT. Latoka Trimas Bina Energy PLTP Kamojang Geo 2 × 30 4.4250 8,500 30
Bali Energy Ltd. PLTP Bedugul Geo 1 × 10 70-71.25% of elec. Tariff 8,900 30
PT. Sumber Segara Primadaya PLTU Cilacap Coal 2 × 300 3.0650 0.3120 1.0920 0.1010 4.5700 8,500 30
PT. Power Jawa Barat PLTU Serang Coal 1 × 450 3.4890 0.3000 1.1670 0.1000 5.0560 9,000 30
PT. Bosowa Energi PLTU Jeneponto Coal 2 × 100 2.7800 0.3000 1.5300 0.1000 4.7100 9,500 30
PT. Intidaya Prima Kencana PLTGU Anyer N Gas 1 × 380 2.0600 0.3000 2,08* 0.1000 4.5400 9,500 20
Source : MEMR
(2) Coal Fire Power Plant Development Projects (Fast Track Program)
In 2006, in order to relieve a shortage of electricity supply and excessive dependency on oil fuel altogether, a new program called Fast Track Program, or alternatively called Crash Program or 10,000 MW coal-fired power plant project, was announced. This program includes 10 coal fired power plant projects, 6,900 MW in total capacity, in Jamali region.
There are institutional arrangements made for the program, that are;
♦ Selection of EPC contractor When PLN carries out a project with untied finance, EPC contractor selection should be done in open bidding When PLN carries out a project with tied finance, EPC contractor can be nominated in
4 Geothermal Law 27/2003
Final Report < Summary > - 22 -
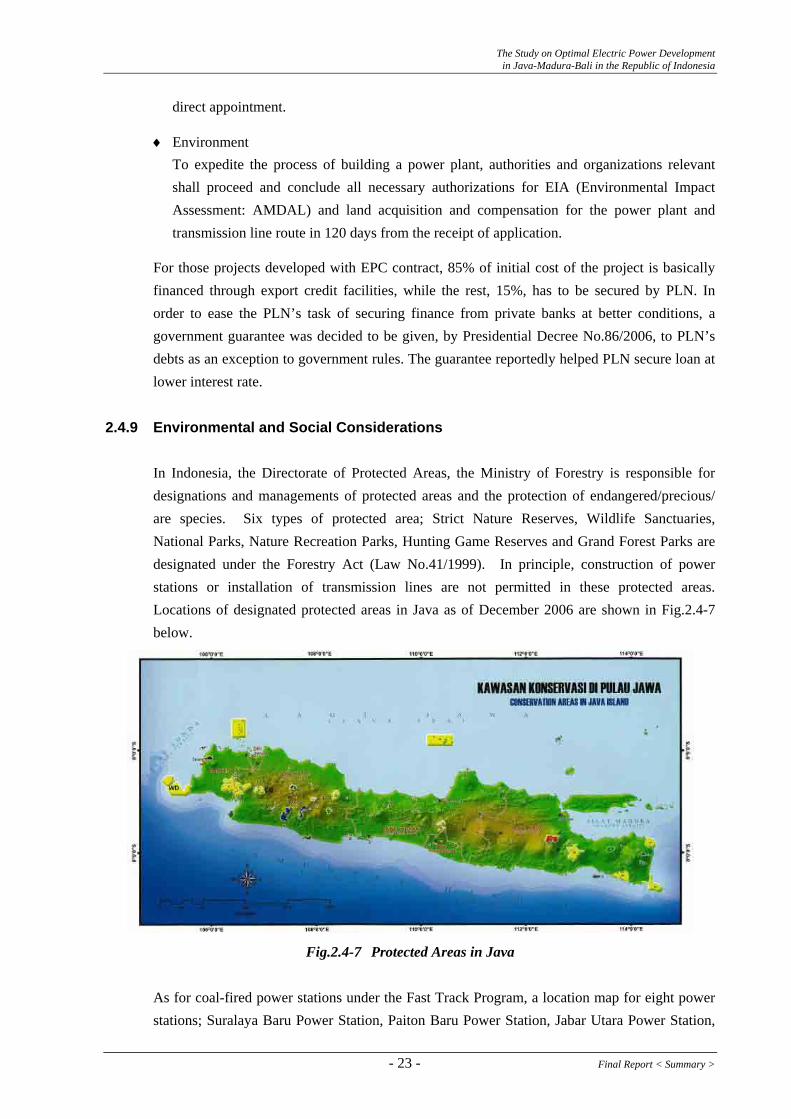
The Study on Optimal Electric Power Development in Java-Madura-Bali in the Republic of Indonesia
direct appointment.
♦ Environment To expedite the process of building a power plant, authorities and organizations relevant shall proceed and conclude all necessary authorizations for EIA (Environmental Impact Assessment: AMDAL) and land acquisition and compensation for the power plant and transmission line route in 120 days from the receipt of application.
For those projects developed with EPC contract, 85% of initial cost of the project is basically financed through export credit facilities, while the rest, 15%, has to be secured by PLN. In order to ease the PLN’s task of securing finance from private banks at better conditions, a government guarantee was decided to be given, by Presidential Decree No.86/2006, to PLN’s debts as an exception to government rules. The guarantee reportedly helped PLN secure loan at lower interest rate.
2.4.9 Environmental and Social Considerations
In Indonesia, the Directorate of Protected Areas, the Ministry of Forestry is responsible for designations and managements of protected areas and the protection of endangered/precious/ are species. Six types of protected area; Strict Nature Reserves, Wildlife Sanctuaries, National Parks, Nature Recreation Parks, Hunting Game Reserves and Grand Forest Parks are designated under the Forestry Act (Law No.41/1999). In principle, construction of power stations or installation of transmission lines are not permitted in these protected areas. Locations of designated protected areas in Java as of December 2006 are shown in Fig.2.4-7 below.
Fig.2.4-7 Protected Areas in Java
As for coal-fired power stations under the Fast Track Program, a location map for eight power stations; Suralaya Baru Power Station, Paiton Baru Power Station, Jabar Utara Power Station,
- 23 - Final Report < Summary >
The Study on Optimal Electric Power Development in Java-Madura-Bali in the Republic of Indonesia
Rembang Power Station, Tanjung Awar-Awar Power Station, Tanjung Jati Baru Power Station, Jatin Selatan Power Station and Labuhan Power Station, indicates that they are not located within or in the vicinity of any protected area. The Fast Track Program officers and environmental officer of PT Perusahaan Umum Listrik Negara (PLN) have confirmed that remaining Teluk Naga Power Station and Jabar Selatan Power Station are also not located within or in the vicinity of any protected area. Location maps of the new power stations to be introduced under RUPTL (National Power Development Plan in Indonesia) suggest that Cirebon Coal-Fired Power Station, Bali Utara Coal- Fired Power Station, Patuha Geothermal Power Station, Dieng Geothermal Power Station and Windu Geothermal Power Station are not located within protected areas. As for reservoir-type hydroelectric power stations, Rajamandala Hydroelectric Power Station and Jatigede Hydroelectric Power Station are already confirmed to operate, but these are not sited within a protected area. Cimandiri Hydroelectric Power Station, Muang Hydroelectric Power Station, Cibuni-3 Hydroelectric Power Station and Cipasang Hydroelectric Power Station are also included in all of the power development scenarios as promising reservoir-type hydroelectric power stations, although these are not included in RUPTL. For those other than Cipasang Hydroelectric Power Station, their location map indicates that they are not located within a protected area. As for pumped-storage power generation, a location map of Upper Cisokan Hydroelectric Power Station, Matennggeng Hydroelectric Power Station and Grindulu Hydroelectric Power Station suggests that they are not located in a protected area. When involuntary resettlement is required to secure a land to construct some public facility, such as a power station and transmission line, consent from local residents shall be obtained in accordance with the Land Appropriation Law (Presidential Decree No.36/2005) administered by the National Land Agency, and compensations shall be conducted under this Law. There is no regulation in Indonesia to require specific actions to obtain consent from those to be resettled.
Final Report < Summary > - 24 -
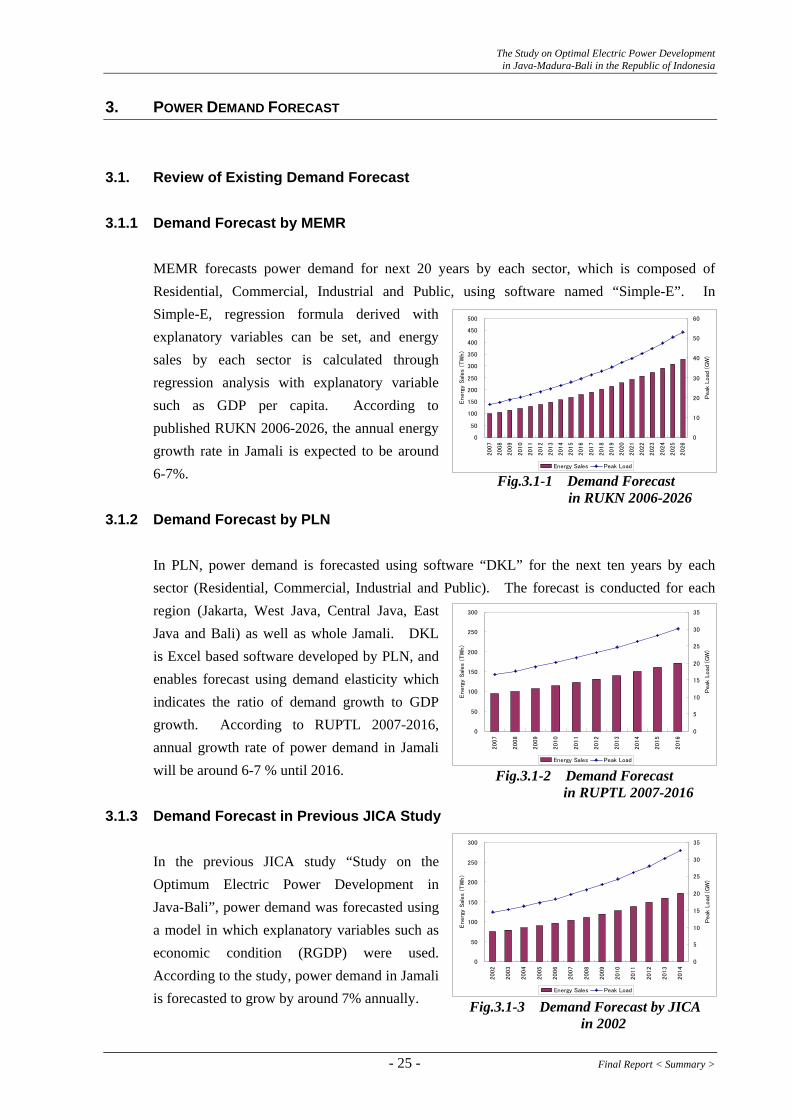
The Study on Optimal Electric Power Development in Java-Madura-Bali in the Republic of Indonesia
3. POWER DEMAND FORECAST
3.1. Review of Existing Demand Forecast 3.1.1 Demand Forecast by MEMR
MEMR forecasts power demand for next 20 years by each sector, which is composed of Residential, Commercial, Industrial and Public, using software named “Simple-E”. In Simple-E, regression formula derived with explanatory variables can be set, and energy sales by each sector is calculated through regression analysis with explanatory variable such as GDP per capita. According to published RUKN 2006-2026, the annual energy growth rate in Jamali is expected to be around 6-7%. Fig.3.1-1 Demand Forecast
in RUKN 2006-2026
0
50
100
150
200
250
300
350
400
450
500
2007
2008
2009
2010
2011
2012
2013
2014
2015
2016
2017
2018
2019
2020
2021
2022
2023
2024
2025
2026
Energ
y Sal
es
(TW
h)
0
10
20
30
40
50
60
Peak
Load
(G
W)
Energy Sales Peak Load
3.1.2 Demand Forecast by PLN In PLN, power demand is forecasted using software “DKL” for the next ten years by each sector (Residential, Commercial, Industrial and Public). The forecast is conducted for each region (Jakarta, West Java, Central Java, East Java and Bali) as well as whole Jamali. DKL is Excel based software developed by PLN, and enables forecast using demand elasticity which indicates the ratio of demand growth to GDP growth. According to RUPTL 2007-2016, annual growth rate of power demand in Jamali will be around 6-7 % until 2016. Fig.3.1-2 Demand Forecast
in RUPTL 2007-2016
0
50
100
150
200
250
300
2007
2008
2009
2010
2011
2012
2013
2014
2015
2016
Energ
y Sal
es
(TW
h)
0
5
10
15
20
25
30
35
Peak
Load
(G
W)
Energy Sales Peak Load
3.1.3 Demand Forecast in Previous JICA Study
In the previous JICA study “Study on the Optimum Electric Power Development in Java-Bali”, power demand was forecasted using a model in which explanatory variables such as economic condition (RGDP) were used. According to the study, power demand in Jamali is forecasted to grow by around 7% annually. Fig.3.1-3 Demand Forecast by JICA
in 2002
0
50
100
150
200
250
300
2002
2003
2004
2005
2006
2007
2008
2009
2010
2011
2012
2013
2014
Energ
y Sal
es
(TW
h)
0
5
10
15
20
25
30
35
Peak
Load
(G
W)
Energy Sales Peak Load
- 25 - Final Report < Summary >
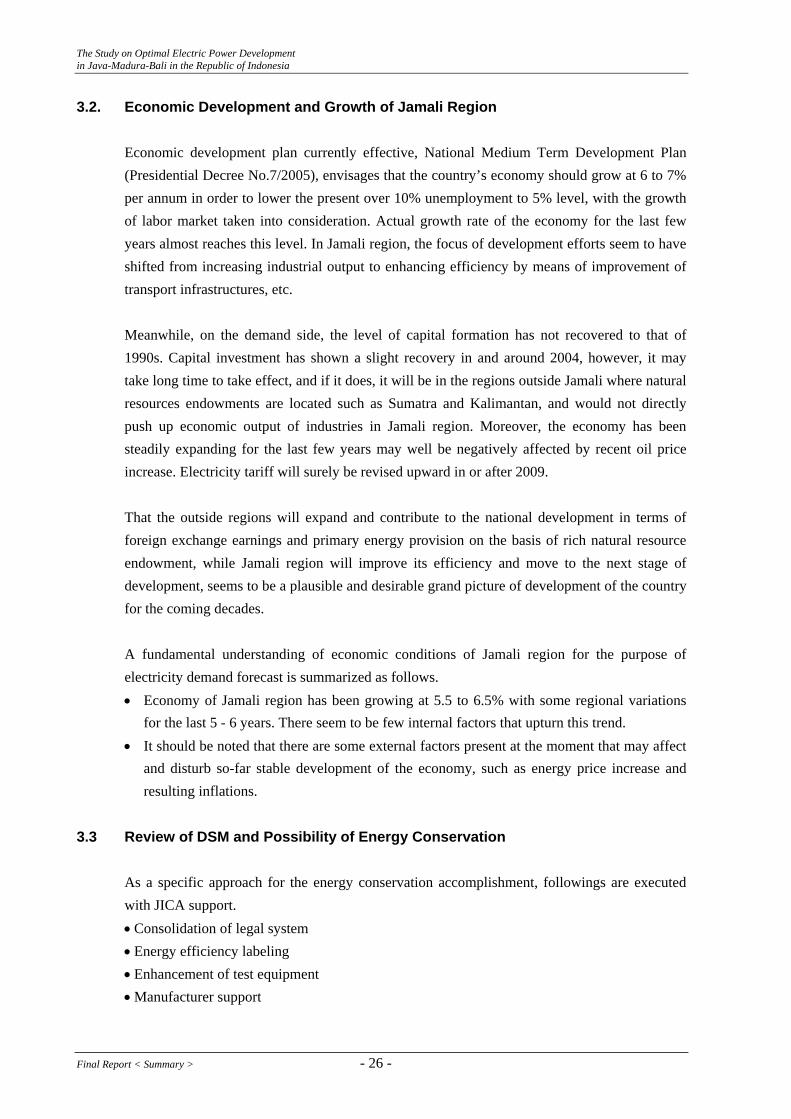
The Study on Optimal Electric Power Development in Java-Madura-Bali in the Republic of Indonesia
3.2. Economic Development and Growth of Jamali Region
Economic development plan currently effective, National Medium Term Development Plan (Presidential Decree No.7/2005), envisages that the country’s economy should grow at 6 to 7% per annum in order to lower the present over 10% unemployment to 5% level, with the growth of labor market taken into consideration. Actual growth rate of the economy for the last few years almost reaches this level. In Jamali region, the focus of development efforts seem to have shifted from increasing industrial output to enhancing efficiency by means of improvement of transport infrastructures, etc. Meanwhile, on the demand side, the level of capital formation has not recovered to that of 1990s. Capital investment has shown a slight recovery in and around 2004, however, it may take long time to take effect, and if it does, it will be in the regions outside Jamali where natural resources endowments are located such as Sumatra and Kalimantan, and would not directly push up economic output of industries in Jamali region. Moreover, the economy has been steadily expanding for the last few years may well be negatively affected by recent oil price increase. Electricity tariff will surely be revised upward in or after 2009. That the outside regions will expand and contribute to the national development in terms of foreign exchange earnings and primary energy provision on the basis of rich natural resource endowment, while Jamali region will improve its efficiency and move to the next stage of development, seems to be a plausible and desirable grand picture of development of the country for the coming decades. A fundamental understanding of economic conditions of Jamali region for the purpose of electricity demand forecast is summarized as follows. • Economy of Jamali region has been growing at 5.5 to 6.5% with some regional variations
for the last 5 - 6 years. There seem to be few internal factors that upturn this trend. • It should be noted that there are some external factors present at the moment that may affect
and disturb so-far stable development of the economy, such as energy price increase and resulting inflations.
3.3 Review of DSM and Possibility of Energy Conservation
As a specific approach for the energy conservation accomplishment, followings are executed with JICA support. • Consolidation of legal system • Energy efficiency labeling • Enhancement of test equipment • Manufacturer support
Final Report < Summary > - 26 -
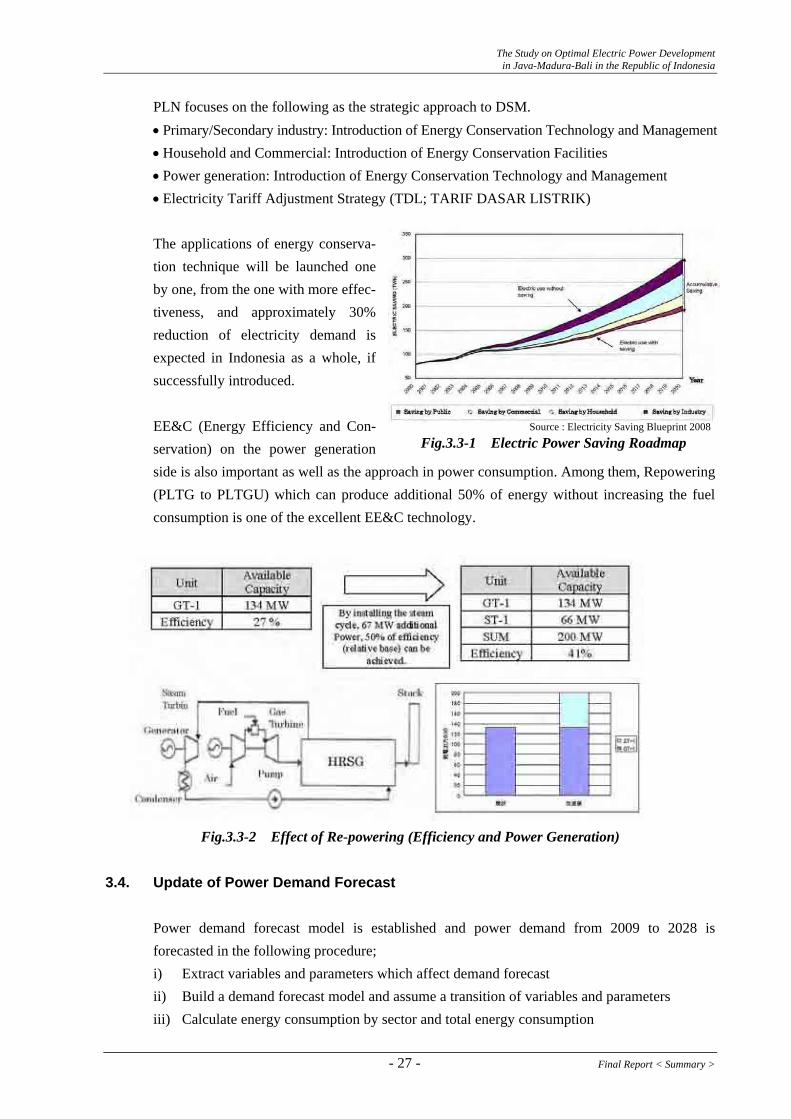
The Study on Optimal Electric Power Development in Java-Madura-Bali in the Republic of Indonesia
PLN focuses on the following as the strategic approach to DSM. • Primary/Secondary industry: Introduction of Energy Conservation Technology and Management • Household and Commercial: Introduction of Energy Conservation Facilities • Power generation: Introduction of Energy Conservation Technology and Management • Electricity Tariff Adjustment Strategy (TDL; TARIF DASAR LISTRIK) The applications of energy conserva-tion technique will be launched one by one, from the one with more effec-tiveness, and approximately 30% reduction of electricity demand is expected in Indonesia as a whole, if successfully introduced. EE&C (Energy Efficiency and Con-servation) on the power generation side is also important as well as the approach in power consumption. Among them, Repowering (PLTG to PLTGU) which can produce additional 50% of energy without increasing the fuel consumption is one of the excellent EE&C technology.
Source : Electricity Saving Blueprint 2008Fig.3.3-1 Electric Power Saving Roadmap
Fig.3.3-2 Effect of Re-powering (Efficiency and Power Generation) 3.4. Update of Power Demand Forecast
Power demand forecast model is established and power demand from 2009 to 2028 is forecasted in the following procedure; i) Extract variables and parameters which affect demand forecast ii) Build a demand forecast model and assume a transition of variables and parameters iii) Calculate energy consumption by sector and total energy consumption
- 27 - Final Report < Summary >
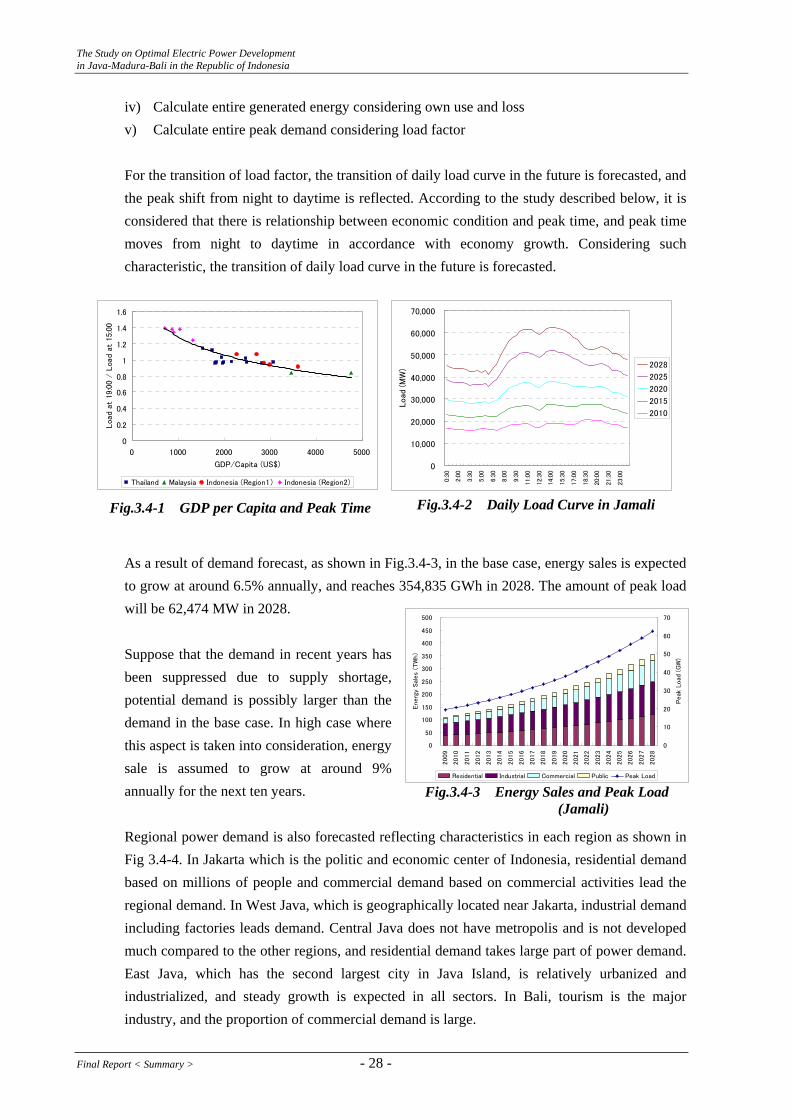
The Study on Optimal Electric Power Development in Java-Madura-Bali in the Republic of Indonesia
iv) Calculate entire generated energy considering own use and loss v) Calculate entire peak demand considering load factor For the transition of load factor, the transition of daily load curve in the future is forecasted, and the peak shift from night to daytime is reflected. According to the study described below, it is considered that there is relationship between economic condition and peak time, and peak time moves from night to daytime in accordance with economy growth. Considering such characteristic, the transition of daily load curve in the future is forecasted. As a result of demand forecast, as shown in Fig.3.4-3, in the base case, energy sales is expected to grow at around 6.5% annually, and reaches 354,835 GWh in 2028. The amount of peak load will be 62,474 MW in 2028. Suppose that the demand in recent years has been suppressed due to supply shortage, potential demand is possibly larger than the demand in the base case. In high case where this aspect is taken into consideration, energy sale is assumed to grow at around 9% annually for the next ten years. Regional power demand is also forecasted reflecting characteristics in each region as shown in Fig 3.4-4. In Jakarta which is the politic and economic center of Indonesia, residential demand based on millions of people and commercial demand based on commercial activities lead the regional demand. In West Java, which is geographically located near Jakarta, industrial demand including factories leads demand. Central Java does not have metropolis and is not developed much compared to the other regions, and residential demand takes large part of power demand. East Java, which has the second largest city in Java Island, is relatively urbanized and industrialized, and steady growth is expected in all sectors. In Bali, tourism is the major industry, and the proportion of commercial demand is large.
0
0.2
0.4
0.6
0.8
1
1.2
1.4
1.6
0 1000 2000 3000 4000 5000
GDP/Capita (US$)
Load
at
19:0
0 /
Loa
d at
15:
00
Thailand Malaysia Indonesia (Region1) Indonesia (Region2)
0
10,000
20,000
30,000
40,000
50,000
60,000
70,000
0:3
0
2:0
0
3:3
0
5:0
0
6:3
0
8:0
0
9:3
0
11:0
0
12:3
0
14:0
0
15:3
0
17:0
0
18:3
0
20:0
0
21:3
0
23:0
0
Load
(M
W) 2028
2025
2020
2015
2010
Fig.3.4-2 Daily Load Curve in Jamali Fig.3.4-1 GDP per Capita and Peak Time
0
50
100
150
200
250
300
350
400
450
500
2009
2010
2011
2012
2013
2014
2015
2016
2017
2018
2019
2020
2021
2022
2023
2024
2025
2026
2027
2028
Energ
y Sal
es
(TW
h)
0
10
20
30
40
50
60
70
Peak
Load
(G
W)
Residential Industrial Commercial Public Peak Load
Fig.3.4-3 Energy Sales and Peak Load (Jamali)
Final Report < Summary > - 28 -
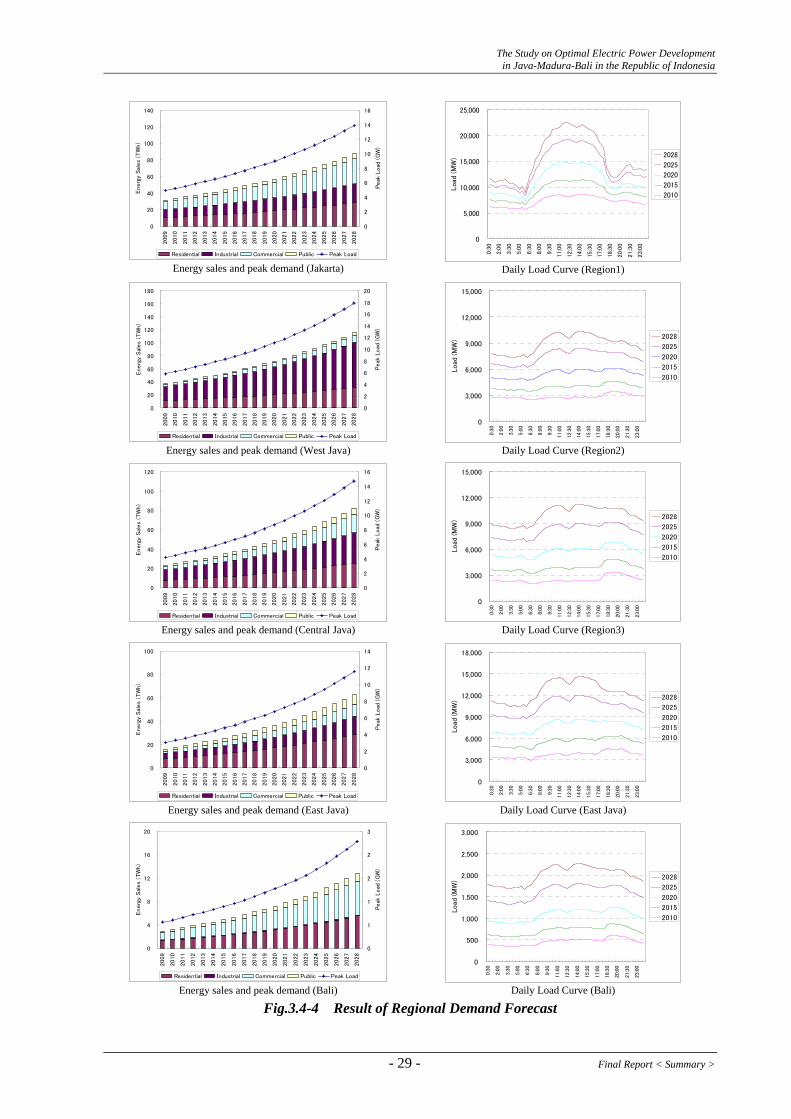
The Study on Optimal Electric Power Development in Java-Madura-Bali in the Republic of Indonesia
0
20
40
60
80
100
120
140
2009
2010
2011
2012
2013
2014
2015
2016
2017
2018
2019
2020
2021
2022
2023
2024
2025
2026
2027
2028
Energ
y Sal
es
(TW
h)
0
2
4
6
8
10
12
14
16
Peak
Load
(G
W)
Residential Industrial Commercial Public Peak Load Energy sales and peak demand (Jakarta)
0
5,000
10,000
15,000
20,000
25,000
0:3
0
2:0
0
3:3
0
5:0
0
6:3
0
8:0
0
9:3
0
11:0
0
12:3
0
14:0
0
15:3
0
17:0
0
18:3
0
20:0
0
21:3
0
23:0
0
Loa
d (M
W) 2028
2025
2020
2015
2010
Daily Load Curve (Region1)
0
20
40
60
80
100
120
140
160
180
2009
2010
2011
2012
2013
2014
2015
2016
2017
2018
2019
2020
2021
2022
2023
2024
2025
2026
2027
2028
Energ
y Sal
es
(TW
h)
0
2
4
6
8
10
12
14
16
18
20
Peak
Load
(G
W)
Residential Industrial Commercial Public Peak Load Energy sales and peak demand (West Java)
0
3,000
6,000
9,000
12,000
15,000
0:3
0
2:0
0
3:3
0
5:0
0
6:3
0
8:0
0
9:3
0
11:0
0
12:3
0
14:0
0
15:3
0
17:0
0
18:3
0
20:0
0
21:3
0
23:0
0
Load
(M
W) 2028
2025
2020
2015
2010
Daily Load Curve (Region2)
0
20
40
60
80
100
120
2009
2010
2011
2012
2013
2014
2015
2016
2017
2018
2019
2020
2021
2022
2023
2024
2025
2026
2027
2028
Energ
y Sal
es
(TW
h)
0
2
4
6
8
10
12
14
16
Peak
Load
(G
W)
Residential Industrial Commercial Public Peak Load Energy sales and peak demand (Central Java)
0
3,000
6,000
9,000
12,000
15,000
0:3
0
2:0
0
3:3
0
5:0
0
6:3
0
8:0
0
9:3
0
11:0
0
12:3
0
14:0
0
15:3
0
17:0
0
18:3
0
20:0
0
21:3
0
23:0
0
Load
(M
W) 2028
2025
2020
2015
2010
Daily Load Curve (Region3)
0
20
40
60
80
100
2009
2010
2011
2012
2013
2014
2015
2016
2017
2018
2019
2020
2021
2022
2023
2024
2025
2026
2027
2028
Energ
y Sal
es
(TW
h)
0
2
4
6
8
10
12
14
Peak
Load
(G
W)
Residential Industrial Commercial Public Peak Load Energy sales and peak demand (East Java)
0
3,000
6,000
9,000
12,000
15,000
18,000
0:3
0
2:0
0
3:3
0
5:0
0
6:3
0
8:0
0
9:3
0
11:0
0
12:3
0
14:0
0
15:3
0
17:0
0
18:3
0
20:0
0
21:3
0
23:0
0
Load
(M
W) 2028
2025
2020
2015
2010
Daily Load Curve (East Java)
0
4
8
12
16
20
2009
2010
2011
2012
2013
2014
2015
2016
2017
2018
2019
2020
2021
2022
2023
2024
2025
2026
2027
2028
Energ
y Sal
es
(TW
h)
0
1
1
2
2
3
Peak
Load
(G
W)
Residential Industrial Commercial Public Peak Load Energy sales and peak demand (Bali)
0
500
1,000
1,500
2,000
2,500
3,000
0:3
0
2:0
0
3:3
0
5:0
0
6:3
0
8:0
0
9:3
0
11:0
0
12:3
0
14:0
0
15:3
0
17:0
0
18:3
0
20:0
0
21:3
0
23:0
0
Load
(M
W) 2028
2025
2020
2015
2010
Daily Load Curve (Bali)
Fig.3.4-4 Result of Regional Demand Forecast
- 29 - Final Report < Summary >
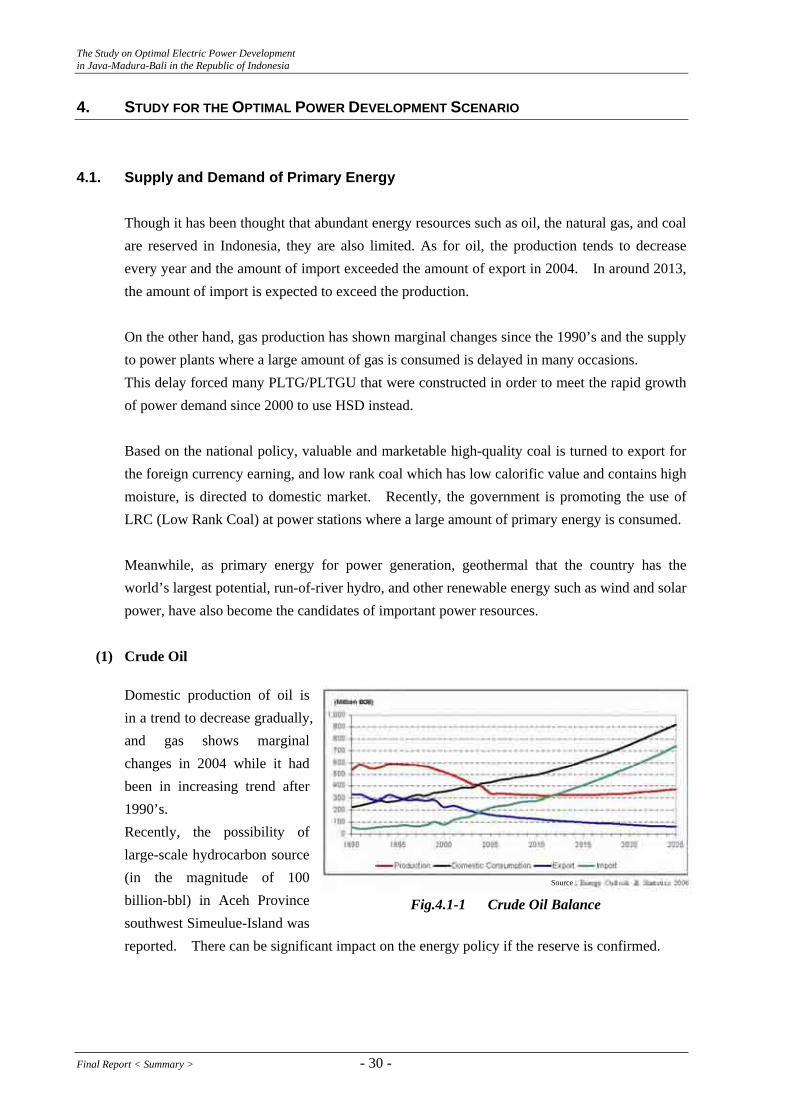
The Study on Optimal Electric Power Development in Java-Madura-Bali in the Republic of Indonesia
4. STUDY FOR THE OPTIMAL POWER DEVELOPMENT SCENARIO
4.1. Supply and Demand of Primary Energy
Though it has been thought that abundant energy resources such as oil, the natural gas, and coal are reserved in Indonesia, they are also limited. As for oil, the production tends to decrease every year and the amount of import exceeded the amount of export in 2004. In around 2013, the amount of import is expected to exceed the production. On the other hand, gas production has shown marginal changes since the 1990’s and the supply to power plants where a large amount of gas is consumed is delayed in many occasions. This delay forced many PLTG/PLTGU that were constructed in order to meet the rapid growth of power demand since 2000 to use HSD instead. Based on the national policy, valuable and marketable high-quality coal is turned to export for the foreign currency earning, and low rank coal which has low calorific value and contains high moisture, is directed to domestic market. Recently, the government is promoting the use of LRC (Low Rank Coal) at power stations where a large amount of primary energy is consumed. Meanwhile, as primary energy for power generation, geothermal that the country has the world’s largest potential, run-of-river hydro, and other renewable energy such as wind and solar power, have also become the candidates of important power resources.
(1) Crude Oil
Domestic production of oil is in a trend to decrease gradually, and gas shows marginal changes in 2004 while it had been in increasing trend after 1990’s. Recently, the possibility of large-scale hydrocarbon source (in the magnitude of 100 billion-bbl) in Aceh Province southwest Simeulue-Island was reported. There can be significant impact on the energy policy if the reserve is confirmed.
Fig.4.1-1 Crude Oil Balance
Source
Final Report < Summary > - 30 -

The Study on Optimal Electric Power Development in Java-Madura-Bali in the Republic of Indonesia
(2) Resources/Reserves of Natural Gas
Proven reserve of the natural gas in Indonesia shows gradual increase as shown in Fig.4.1-2. Proven reserve in 2006 is 94 TSCF, and the production may continue for another 31 years at current production rate, 3 TSCF/year. Because the discovery of new gas field can be expected as the result of the recent exploration, it seems that proven reserves may increase.
Fig.4.1-2 Gas Resources in Indonesia
Fig.4.1-3 Area Map of Gas
Gas supply to power stations of PLN is behind the schedule, and that the supply has materialized are the supply of 150 MMSCFD to the Muara Tawar Power Station through Sumatra-Java sub-sea pipeline (SSWJ-1) and the supply of gas from Kangean gas field to Gresik Power Station which is currently under price negotiation. There are no further plans of gas supply to power stations excluding existing and new power stations that have already started construction.
Existing
Future Plan
Fig.4.1-4 Gas Pipeline in Java Fig.4.1-5 LNG Import Terminal in Java As for the supply flexibility of gas, there are a lot of restrictions of the natural gas which is supplied by the pipeline. Two ideas are considered as countermeasures that enable variable gas supply. i) Application of LNG (Liquefied Natural Gas) ii) Application of CNG (Compressed Natural Gas) System
- 31 - Final Report < Summary >
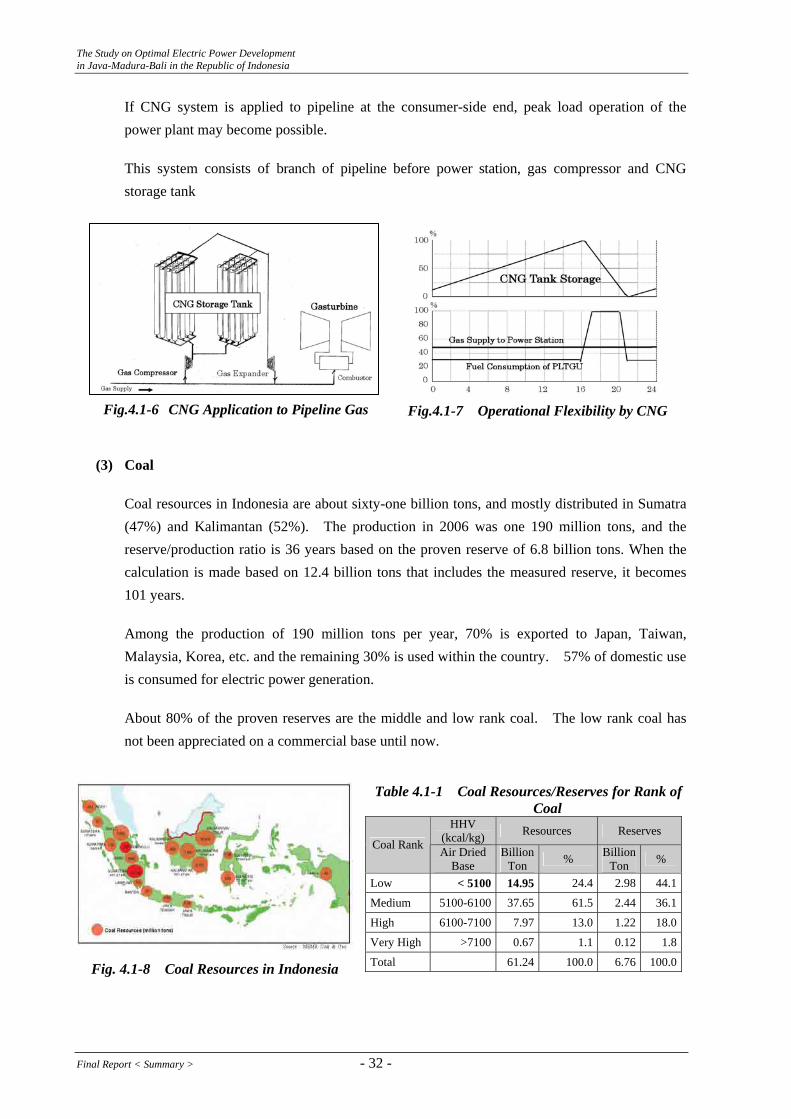
The Study on Optimal Electric Power Development in Java-Madura-Bali in the Republic of Indonesia
If CNG system is applied to pipeline at the consumer-side end, peak load operation of the power plant may become possible.
This system consists of branch of pipeline before power station, gas compressor and CNG storage tank
Fig.4.1-6 CNG Application to Pipeline Gas Fig.4.1-7 Operational Flexibility by CNG
(3) Coal
Coal resources in Indonesia are about sixty-one billion tons, and mostly distributed in Sumatra (47%) and Kalimantan (52%). The production in 2006 was one 190 million tons, and the reserve/production ratio is 36 years based on the proven reserve of 6.8 billion tons. When the calculation is made based on 12.4 billion tons that includes the measured reserve, it becomes 101 years.
Among the production of 190 million tons per year, 70% is exported to Japan, Taiwan, Malaysia, Korea, etc. and the remaining 30% is used within the country. 57% of domestic use is consumed for electric power generation.
About 80% of the proven reserves are the middle and low rank coal. The low rank coal has not been appreciated on a commercial base until now.
Table 4.1-1 Coal Resources/Reserves for Rank of Coal
HHV (kcal/kg) Resources Reserves
Coal Rank Air Dried Base
Billion Ton % Billion
Ton %
Low < 5100 14.95 24.4 2.98 44.1
Medium 5100-6100 37.65 61.5 2.44 36.1
High 6100-7100 7.97 13.0 1.22 18.0
Very High >7100 0.67 1.1 0.12 1.8
Total 61.24 100.0 6.76 100.0 Fig. 4.1-8 Coal Resources in Indonesia
Final Report < Summary > - 32 -

The Study on Optimal Electric Power Development in Java-Madura-Bali in the Republic of Indonesia
♦ Low Rank Coal (LRC)
Major mines of LRC are located in Sumatra and Kalimantan.
A special consideration is required in the design/operation of the boiler in which LRC with the characteristics of high water content and natural-ignition is burned. CO2 emission is larger than in a bituminous coal fired boiler because the boiler efficiency becomes lower with LRC due to the higher water content. Meanwhile, LRC produced in Indonesia also has preferable properties, such as lower contents of ash and sulfur, which result in lower production of fly ash and SOx.
The coal that will be used in the new power plants currently under construction under the “Fast Track Program (total generation capacity 10,000 MW)” is LRC that is categorized as lignite, and is different from the coal used in existing power plants, which is categorized as sub-bituminous. LRC is not distributed in the market. PLN is negotiating with coal suppliers to purchase LRC of 31,900,000 tons/year. As of the end of April 2008, 28 million tons/year which is approximately 90% of total demands has been secured with the contacts with eight suppliers. The contracts are on the long term of 20 years and CIF basis.
Under the present situation where the infrastructure of coal transportation is not quite developed, the transportation of LRC, which is not widely distribute in market, is difficult to be expanded, to prepare for the completion of power plants under “Fast Track Program”. Now we expect that the production of coal for domestic use increases by 50% in a short period, the overall infrastructure development and upgrading is required urgently, and must be coordinated with the development plans of coal fields.
(4) Geothermal
It is reported that Indonesia possesses the geothermal resources that could produce more than 27,000 MW of power, and accounts for 40% of the geothermal potential of the world. To use these resources effectively, the Indonesian government made the development road map and scheduled to develop 9,500 MW by 2025. As of 2007, total 1,020 MW are operating.
Table 4.1-2 Geothermal Resources in Indonesia
Region Installed Capacity Existing Plan Possible New/
Additional Plan Total Resource
Potential Sumatra 2 913 3,605 4,520 Java-Bali 835 785 2,015 3,635 Nusa Tenggara 0 9 138 146 Sulawesi 20 140 575 735 Maluku 0 0 40 40 Total (MW) 857 1,847 6,373 9,076
Source : JICA, MP Study for Geothermal Power Development 2007
The potential of large-scale development is concentrated in Sumatra and Java.
- 33 - Final Report < Summary >
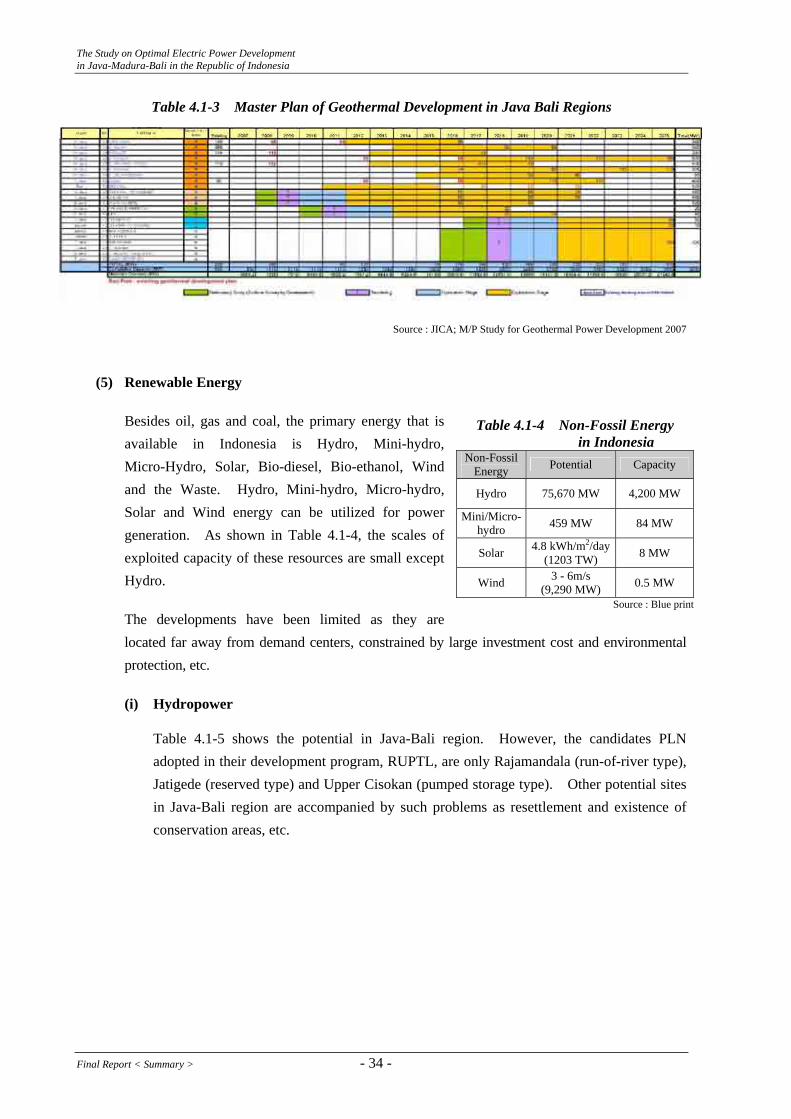
The Study on Optimal Electric Power Development in Java-Madura-Bali in the Republic of Indonesia
Table 4.1-3 Master Plan of Geothermal Development in Java Bali Regions
Source : JICA; M/P Study for Geothermal Power Development 2007
(5) Renewable Energy
Besides oil, gas and coal, the primary energy that is available in Indonesia is Hydro, Mini-hydro, Micro-Hydro, Solar, Bio-diesel, Bio-ethanol, Wind and the Waste. Hydro, Mini-hydro, Micro-hydro, Solar and Wind energy can be utilized for power generation. As shown in Table 4.1-4, the scales of exploited capacity of these resources are small except Hydro.
Table 4.1-4 Non-Fossil Energy in Indonesia
Non-Fossil Energy Potential Capacity
Hydro 75,670 MW 4,200 MW
Mini/Micro-hydro 459 MW 84 MW
Solar 4.8 kWh/m2/day (1203 TW) 8 MW
Wind 3 - 6m/s (9,290 MW)
The developments have been limited as they are located far away from demand centers, constrained by large investment cost and environmental protection, etc.
0.5 MW
Source : Blue print
(i) Hydropower
Table 4.1-5 shows the potential in Java-Bali region. However, the candidates PLN adopted in their development program, RUPTL, are only Rajamandala (run-of-river type), Jatigede (reserved type) and Upper Cisokan (pumped storage type). Other potential sites in Java-Bali region are accompanied by such problems as resettlement and existence of conservation areas, etc.
Final Report < Summary > - 34 -
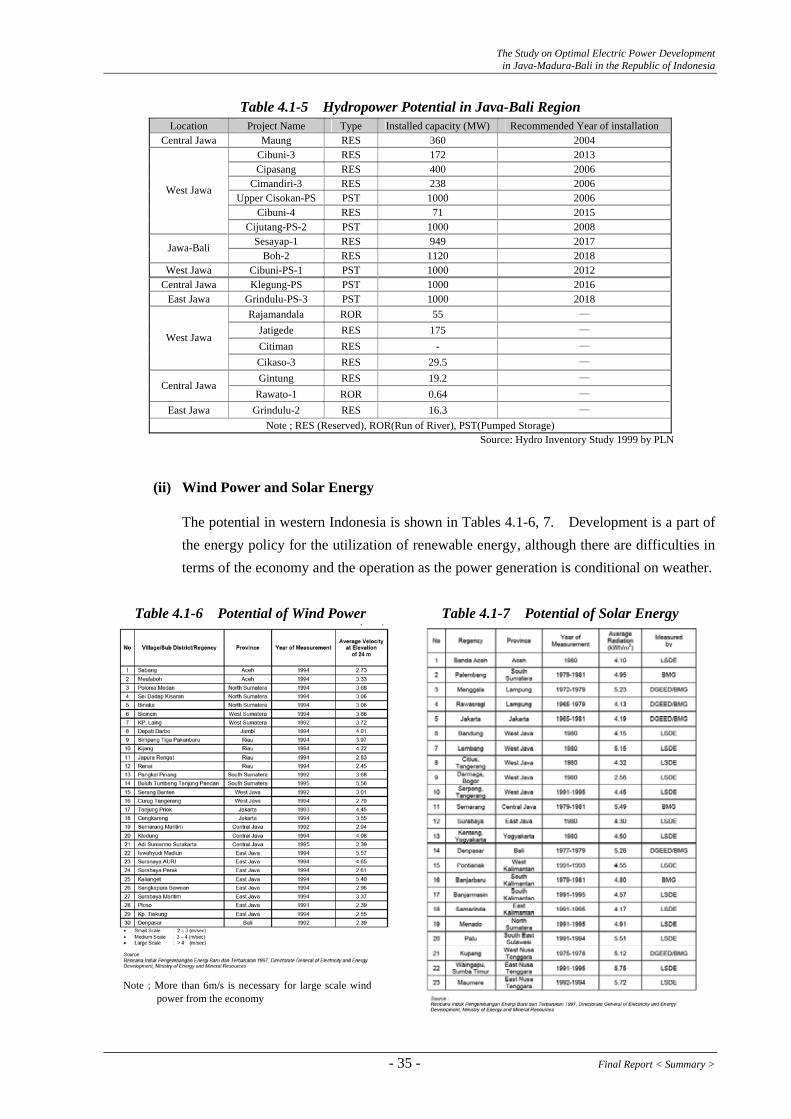
The Study on Optimal Electric Power Development in Java-Madura-Bali in the Republic of Indonesia
Table 4.1-5 Hydropower Potential in Java-Bali Region Location Project Name Type Installed capacity (MW) Recommended Year of installation
Central Jawa Maung RES 360 2004 Cibuni-3 RES 172 2013 Cipasang RES 400 2006
Cimandiri-3 RES 238 2006 Upper Cisokan-PS PST 1000 2006
Cibuni-4 RES 71 2015
West Jawa
Cijutang-PS-2 PST 1000 2008 Sesayap-1 RES 949 2017 Jawa-Bali
Boh-2 RES 1120 2018 West Jawa Cibuni-PS-1 PST 1000 2012
Central Jawa Klegung-PS PST 1000 2016 East Jawa Grindulu-PS-3 PST 1000 2018
Rajamandala ROR 55 ― Jatigede RES 175 ― Citiman RES - ―
West Jawa
Cikaso-3 RES 29.5 ― Gintung RES 19.2 ―
Central Jawa Rawato-1 ROR 0.64 ―
East Jawa Grindulu-2 RES 16.3 ― Note ; RES (Reserved), ROR(Run of River), PST(Pumped Storage)
Source: Hydro Inventory Study 1999 by PLN
(ii) Wind Power and Solar Energy
The potential in western Indonesia is shown in Tables 4.1-6, 7. Development is a part of the energy policy for the utilization of renewable energy, although there are difficulties in terms of the economy and the operation as the power generation is conditional on weather.
Table 4.1-6 Potential of Wind Power Table 4.1-7 Potential of Solar Energy
Note;More than 6m/s is necessary for large scale wind power from the economy
- 35 - Final Report < Summary >
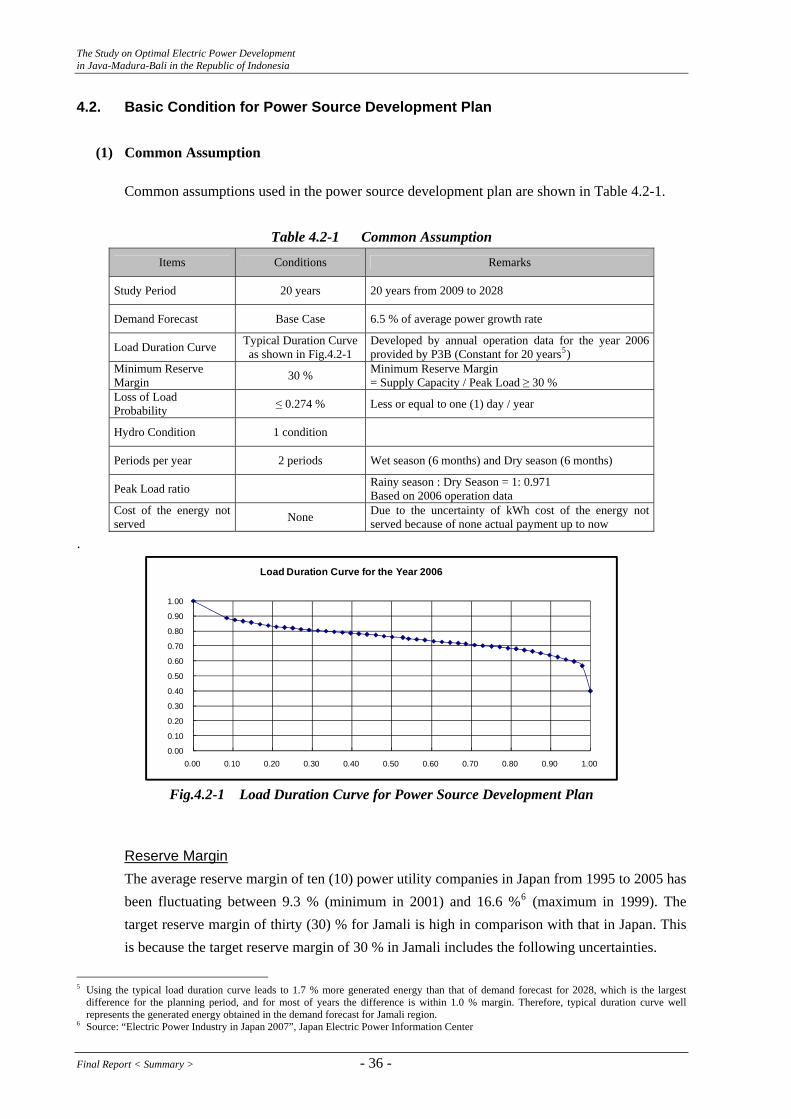
The Study on Optimal Electric Power Development in Java-Madura-Bali in the Republic of Indonesia
4.2. Basic Condition for Power Source Development Plan
(1) Common Assumption
Common assumptions used in the power source development plan are shown in Table 4.2-1.
Table 4.2-1 Common Assumption
Items Conditions Remarks
Study Period 20 years 20 years from 2009 to 2028
Demand Forecast Base Case 6.5 % of average power growth rate
Load Duration Curve Typical Duration Curve as shown in Fig.4.2-1
Developed by annual operation data for the year 2006 provided by P3B (Constant for 20 years5)
Minimum Reserve Margin 30 % Minimum Reserve Margin
= Supply Capacity / Peak Load ≥ 30 % Loss of Load Probability ≤ 0.274 % Less or equal to one (1) day / year
Hydro Condition 1 condition
Periods per year 2 periods Wet season (6 months) and Dry season (6 months)
Peak Load ratio Rainy season : Dry Season = 1: 0.971 Based on 2006 operation data
Cost of the energy not served None Due to the uncertainty of kWh cost of the energy not
served because of none actual payment up to now
.
0.00
0.10
0.20
0.30
0.40
0.50
0.60
0.70
0.80
0.90
1.00
0.00 0.10 0.20 0.30 0.40 0.50 0.60 0.70 0.80 0.90 1.00
Load Duration Curve for the Year 2006
Fig.4.2-1 Load Duration Curve for Power Source Development Plan
Reserve Margin The average reserve margin of ten (10) power utility companies in Japan from 1995 to 2005 has been fluctuating between 9.3 % (minimum in 2001) and 16.6 %6 (maximum in 1999). The target reserve margin of thirty (30) % for Jamali is high in comparison with that in Japan. This is because the target reserve margin of 30 % in Jamali includes the following uncertainties.
5 Using the typical load duration curve leads to 1.7 % more generated energy than that of demand forecast for 2028, which is the largest
difference for the planning period, and for most of years the difference is within 1.0 % margin. Therefore, typical duration curve well represents the generated energy obtained in the demand forecast for Jamali region.
6 Source: “Electric Power Industry in Japan 2007”, Japan Electric Power Information Center
Final Report < Summary > - 36 -
The Study on Optimal Electric Power Development in Java-Madura-Bali in the Republic of Indonesia
• Once malfunction and/or breakage of generation equipment occurs, the duration for restoration cannot be estimated and/or sometimes requires long time7, because main parts and/or spare parts for power generation equipment have to be procured from abroad.
• Negotiations on conditions between PLN/MEMR and international financial institutions sometimes cause the delay8 of project implementation.
• Since peak load always occurs in summer season (July or August) in Japan, periodical maintenance for generation facilities is planned to be conducted in other seasons. On the other hand, timing (month/dates) of peak load in Indonesia cannot be forecasted in advance like Japan. Therefore, there is a possibility that some power stations are under periodical maintenance when peak load occurs, which requires more reserve margin.
• Generation by hydropower fluctuates9 remarkably between dry season and wet season.
• Derating of existing generation facilities10, especially thermal power plants
Based on the above observation, the target reserve margin of 30% is kept for the whole planning period at the moment, although PLN have intension to reduce the reserve margin from 2020 onwards keeping LOLP being less than 0.274 %.
(2) Candidates for Future Power Source Development Plan
1) Candidates of thermal power plants
Table 4.2-2 shows the candidate thermal plants for the power source development plan. Java-Sumatra Interconnection and LNG-fired thermal are seemingly promising candidates to be put into the system in 2014 and 2015 respectively.
Table 4.2-2 Candidates of Thermal Power Plants Power Resource Abbreviation Unit Capacity
PLTU-Coal C6H 600 MW / unit PLTU-Coal C10H 1,000 MW/unit LNG-fired PLTG/TGU LNG 750 MW / unit PLTP GE55 55 MW / unit PLTN N10H 1,000 MW / unit PLTG G150 150 MW / unit Java-Sumatra Interconnection JS-IC 600 MW / unit, Max 5 units
7 Suralaya unit No.5 stopped operation for 241 days in 2007 and still stopped when JICA team visited Suralaya thermal power station on June
3, 2008. 8 Commencements of Engineering Service for T.Priok, M.Tawar and M.Karang projects were delayed for more than one year due to delay of
issuance of gas supply agreement which consist a part of conditionality. 9 Monthly average generation energies from 2003 to 2006 in wet season and in dry season are 166.5 GWh and 66.8 GWh respectively for
Saguling Hydropower Station (Source: data provided by Indonesia Power) 10 As shown in Table 2.4-1, differences between installed capacity and rated capacity in 2007 are estimated about 2,000 MW.
- 37 - Final Report < Summary >
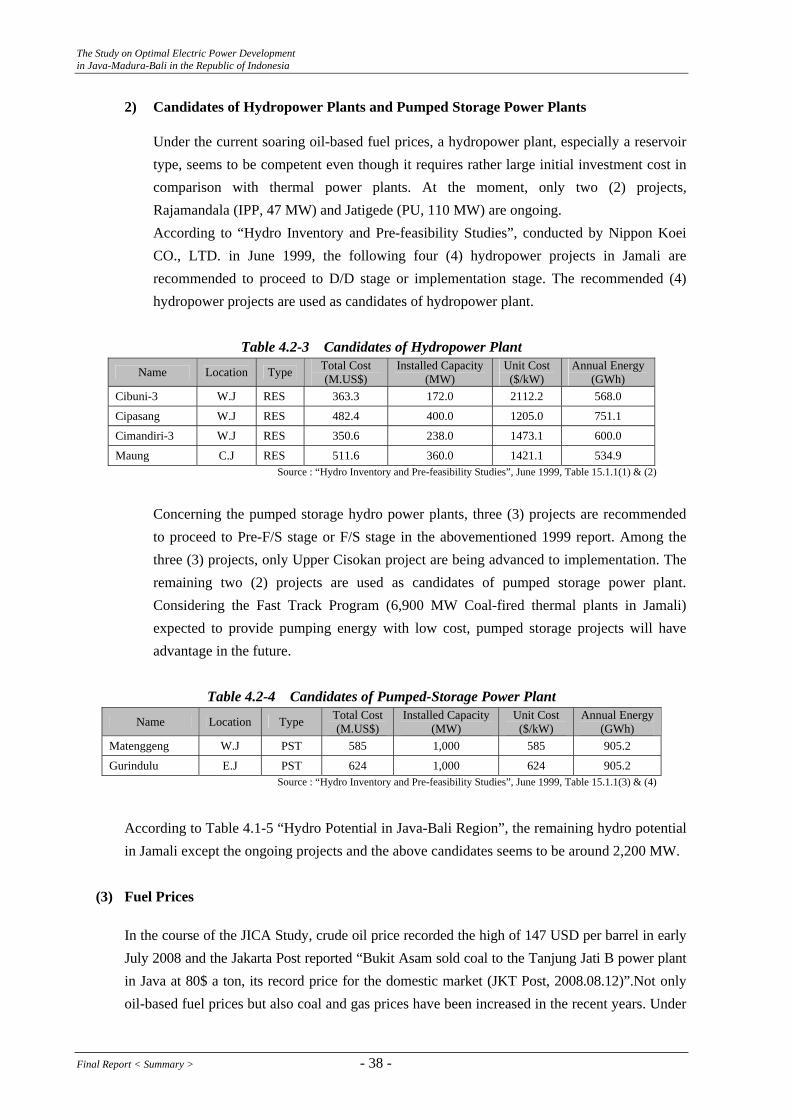
The Study on Optimal Electric Power Development in Java-Madura-Bali in the Republic of Indonesia
2) Candidates of Hydropower Plants and Pumped Storage Power Plants
Under the current soaring oil-based fuel prices, a hydropower plant, especially a reservoir type, seems to be competent even though it requires rather large initial investment cost in comparison with thermal power plants. At the moment, only two (2) projects, Rajamandala (IPP, 47 MW) and Jatigede (PU, 110 MW) are ongoing. According to “Hydro Inventory and Pre-feasibility Studies”, conducted by Nippon Koei CO., LTD. in June 1999, the following four (4) hydropower projects in Jamali are recommended to proceed to D/D stage or implementation stage. The recommended (4) hydropower projects are used as candidates of hydropower plant.
Table 4.2-3 Candidates of Hydropower Plant
Name Location Type Total Cost (M.US$)
Installed Capacity(MW)
Unit Cost($/kW)
Annual Energy (GWh)
Cibuni-3 W.J RES 363.3 172.0 2112.2 568.0
Cipasang W.J RES 482.4 400.0 1205.0 751.1
Cimandiri-3 W.J RES 350.6 238.0 1473.1 600.0
Maung C.J RES 511.6 360.0 1421.1 534.9 Source : “Hydro Inventory and Pre-feasibility Studies”, June 1999, Table 15.1.1(1) & (2)
Concerning the pumped storage hydro power plants, three (3) projects are recommended to proceed to Pre-F/S stage or F/S stage in the abovementioned 1999 report. Among the three (3) projects, only Upper Cisokan project are being advanced to implementation. The remaining two (2) projects are used as candidates of pumped storage power plant. Considering the Fast Track Program (6,900 MW Coal-fired thermal plants in Jamali) expected to provide pumping energy with low cost, pumped storage projects will have advantage in the future.
Table 4.2-4 Candidates of Pumped-Storage Power Plant
Name Location Type Total Cost(M.US$)
Installed Capacity(MW)
Unit Cost ($/kW)
Annual Energy (GWh)
Matenggeng W.J PST 585 1,000 585 905.2
Gurindulu E.J PST 624 1,000 624 905.2 Source : “Hydro Inventory and Pre-feasibility Studies”, June 1999, Table 15.1.1(3) & (4)
According to Table 4.1-5 “Hydro Potential in Java-Bali Region”, the remaining hydro potential in Jamali except the ongoing projects and the above candidates seems to be around 2,200 MW.
(3) Fuel Prices
In the course of the JICA Study, crude oil price recorded the high of 147 USD per barrel in early July 2008 and the Jakarta Post reported “Bukit Asam sold coal to the Tanjung Jati B power plant in Java at 80$ a ton, its record price for the domestic market (JKT Post, 2008.08.12)”.Not only oil-based fuel prices but also coal and gas prices have been increased in the recent years. Under
Final Report < Summary > - 38 -
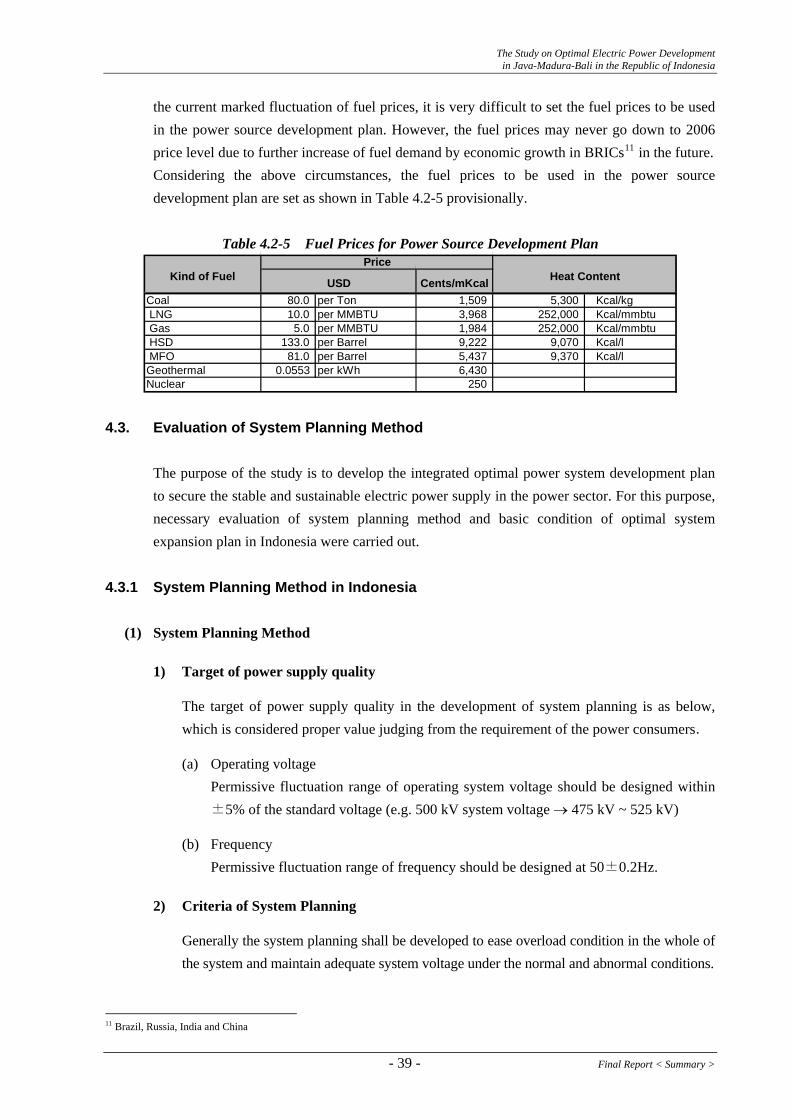
The Study on Optimal Electric Power Development in Java-Madura-Bali in the Republic of Indonesia
the current marked fluctuation of fuel prices, it is very difficult to set the fuel prices to be used in the power source development plan. However, the fuel prices may never go down to 2006 price level due to further increase of fuel demand by economic growth in BRICs11 in the future. Considering the above circumstances, the fuel prices to be used in the power source development plan are set as shown in Table 4.2-5 provisionally.
Table 4.2-5 Fuel Prices for Power Source Development Plan
Heat ContentUSD Cents/mKcalKind of FuelPrice
Coal 80.0 per Ton 1,509 5,300 Kcal/kg LNG 10.0 per MMBTU 3,968 252,000 Kcal/mmbtu Gas 5.0 per MMBTU 1,984 252,000 Kcal/mmbtu HSD 133.0 per Barrel 9,222 9,070 Kcal/l MFO 81.0 per Barrel 5,437 9,370 Kcal/lGeothermal 0.0553 per kWh 6,430Nuclear 250
4.3. Evaluation of System Planning Method
The purpose of the study is to develop the integrated optimal power system development plan to secure the stable and sustainable electric power supply in the power sector. For this purpose, necessary evaluation of system planning method and basic condition of optimal system expansion plan in Indonesia were carried out.
4.3.1 System Planning Method in Indonesia
(1) System Planning Method
1) Target of power supply quality
The target of power supply quality in the development of system planning is as below, which is considered proper value judging from the requirement of the power consumers.
(a) Operating voltage Permissive fluctuation range of operating system voltage should be designed within ±5% of the standard voltage (e.g. 500 kV system voltage → 475 kV ~ 525 kV)
(b) Frequency Permissive fluctuation range of frequency should be designed at 50±0.2Hz.
2) Criteria of System Planning
Generally the system planning shall be developed to ease overload condition in the whole of the system and maintain adequate system voltage under the normal and abnormal conditions.
11 Brazil, Russia, India and China
- 39 - Final Report < Summary >
The Study on Optimal Electric Power Development in Java-Madura-Bali in the Republic of Indonesia
Criteria of system planning are as shown below and they are considered proper in quality in consideration of the present requirement in Indonesia. However it is recommended to develop new criteria to cope with the severe accidents and system stability because the power supply requirement may become severer in the future.
4.3.2 Basic Condition for Developing Optimal System Expansion Plan
Optimal system development plan shall be developed to meet the optimal power development plan for the purpose of securing a stable and flexible power supply in the variable condition of the power sector. Although a system planning shall be basically developed based on the above mentioned criteria, a stability analysis was also carried out to prevent severe accidents. The following conditions were added in this study.
(1) Duration of Study
The objective time span of this study is from 2009 up to 2028. The specified years for the system diagram and system analysis were selected to be years of 2010, 2015, 2020, 2025 and 2028.
(2) Criteria of system planning
Additional criteria for this study are as follows:
1) In case of more severe criteria (N-2 criteria)
To study the case of more severe accident; fault on a certain T/L of 500 kV trunk loop system which may result in a large-scale block-out, N-2 criteria was adopted.
2) Transient Stability Criteria
No stability criterion is adopted with regard to the transient stability in Indonesia, however, a system stability was evaluated to prevent large-scale black-out under the severe accident condition (route accident) partially.
4.4. Strategic Environmental Assessment 4.4.1 Legal Status of Strategic Environmental Assessment
Indonesia has no legislation to require Strategic Environmental Assessment (SEA) at the moment. The Ministry of Environment in Indonesia is now planning to amend the Environmental Management Law to incorporate a provision to require SEA. A Presidential Decree will be issued under the amended Law to require ministries and local governments to conduct SEA when they establish a policy, plan or program. Actual contents of SEA, or those
Final Report < Summary > - 40 -
The Study on Optimal Electric Power Development in Java-Madura-Bali in the Republic of Indonesia
to be assessed and how to assess them will be specified by a Minister of Environment Decree.
4.4.2 Special Features of the Strategic Environmental Assessment for Study on the Optimal Power Development Scenario in Java-Madura-Bali Area In power development scenarios, contribution by each type of power generation is proposed, but as for power stations to start operation after 2017, a candidate site for each power station is mostly not identified. On the other hand, construction sites for most of the power stations to start operation until 2016 are identified in the scenarios, but alternative scenarios are identical up to 2016, and there is no difference between the scenarios in power stations to introduce. In the present Strategic Environmental Assessment, sites for most of the individual power stations are yet to be proposed in the scenarios after 2017 when each scenario introduce different power stations, and it is difficult to compare and assess the scenarios quantitatively for their potential impacts on natural and social environment. Power development scenarios are produced after qualitative considerations of their potential impacts on natural and social environment.
4.4.3 Avoidance of Siting in Habitats of Endangered/Precious/Rare Species and Protected Areas There is no distinct mangrove forest in Jamali area. Coral reefs are observed at many waters in Indonesia. Along the south coast of Java, however, there develop only fringing reefs at limited waters. The largest coral reefs are found at waters off Grajagan Coast and also along from Watu Ulo to Blambangan Peninsula in East Java Province. In contrast, fringing reefs develop only in Banten Bay and Jepara Bay along the north coast of Java. In Indonesia, protected areas are designated under Forestry Act (Law No.41/1999), and the Act requires a permit from the Minister of Forestry to conduct a development project within a protected area. However, construction of a power station within a protected area has not been permitted except for geothermal power stations. There is no regulation to provide for specific review procedures to follow when an application is submitted for a development project within a protected area. There also is no legal time limit on the review period. Even applications for a permit to construct a geothermal power station within a protected area take a very long period to go through the review procedures, and they have not necessarily been granted a permit.
4.4.4 Potential Environmental Concerns of Various Power Generation Options and Possible Measures against Them
Environmental performances of the major power generation options are summarized in the table below. Potential environmental impacts completely subject to the location of power stations are not included in this table.
- 41 - Final Report < Summary >
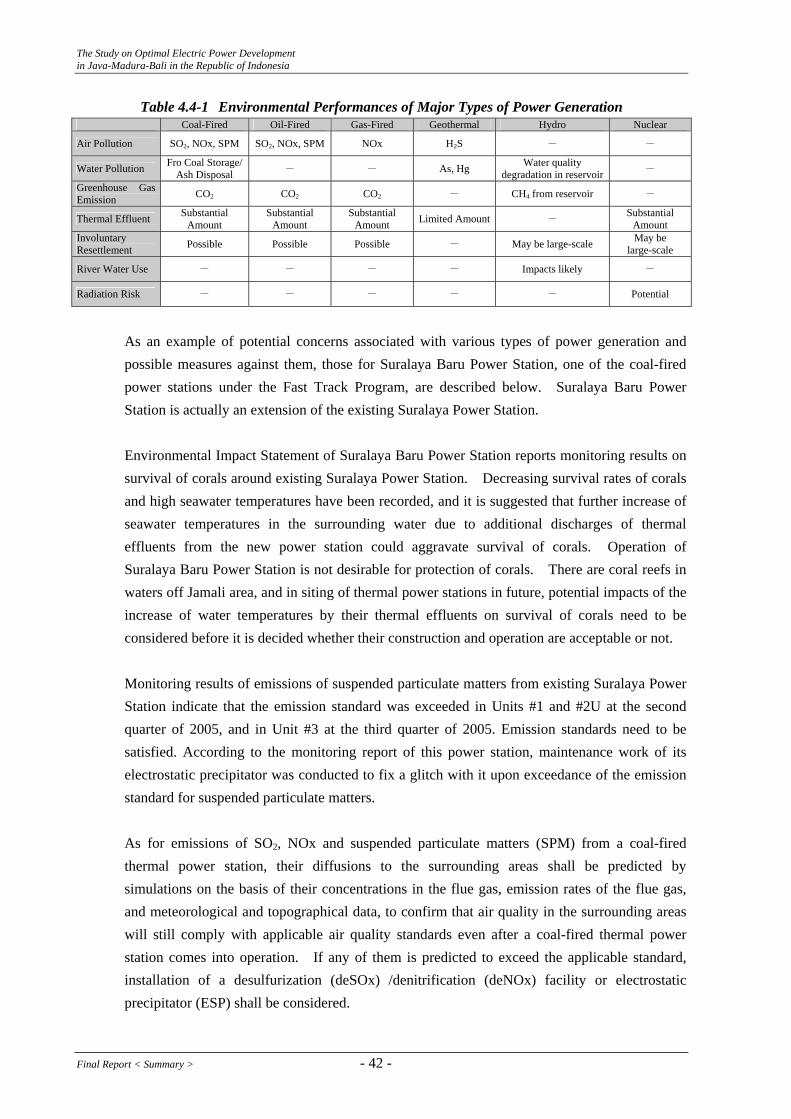
The Study on Optimal Electric Power Development in Java-Madura-Bali in the Republic of Indonesia
Table 4.4-1 Environmental Performances of Major Types of Power Generation Coal-Fired Oil-Fired Gas-Fired Geothermal Hydro Nuclear
Air Pollution SO2, NOx, SPM SO2, NOx, SPM NOx H2S - -
Water Pollution Fro Coal Storage/ Ash Disposal - - As, Hg Water quality
degradation in reservoir -
Greenhouse Gas Emission CO2 CO2 CO2 - CH4 from reservoir -
Thermal Effluent Substantial Amount
Substantial Amount
Substantial Amount Limited Amount - Substantial
Amount Involuntary Resettlement Possible Possible Possible - May be large-scale May be
large-scale
River Water Use - - - - Impacts likely -
Radiation Risk - - - - - Potential
As an example of potential concerns associated with various types of power generation and possible measures against them, those for Suralaya Baru Power Station, one of the coal-fired power stations under the Fast Track Program, are described below. Suralaya Baru Power Station is actually an extension of the existing Suralaya Power Station. Environmental Impact Statement of Suralaya Baru Power Station reports monitoring results on survival of corals around existing Suralaya Power Station. Decreasing survival rates of corals and high seawater temperatures have been recorded, and it is suggested that further increase of seawater temperatures in the surrounding water due to additional discharges of thermal effluents from the new power station could aggravate survival of corals. Operation of Suralaya Baru Power Station is not desirable for protection of corals. There are coral reefs in waters off Jamali area, and in siting of thermal power stations in future, potential impacts of the increase of water temperatures by their thermal effluents on survival of corals need to be considered before it is decided whether their construction and operation are acceptable or not. Monitoring results of emissions of suspended particulate matters from existing Suralaya Power Station indicate that the emission standard was exceeded in Units #1 and #2U at the second quarter of 2005, and in Unit #3 at the third quarter of 2005. Emission standards need to be satisfied. According to the monitoring report of this power station, maintenance work of its electrostatic precipitator was conducted to fix a glitch with it upon exceedance of the emission standard for suspended particulate matters. As for emissions of SO2, NOx and suspended particulate matters (SPM) from a coal-fired thermal power station, their diffusions to the surrounding areas shall be predicted by simulations on the basis of their concentrations in the flue gas, emission rates of the flue gas, and meteorological and topographical data, to confirm that air quality in the surrounding areas will still comply with applicable air quality standards even after a coal-fired thermal power station comes into operation. If any of them is predicted to exceed the applicable standard, installation of a desulfurization (deSOx) /denitrification (deNOx) facility or electrostatic precipitator (ESP) shall be considered.
Final Report < Summary > - 42 -

The Study on Optimal Electric Power Development in Java-Madura-Bali in the Republic of Indonesia
4.4.5 Constraints on Power Development Scenarios by Environmental and Social Considerations In our identification of power development scenarios, we have considered potential impacts of individual types of power generation on natural and social environment, and we have created scenarios so that particular environmental loads will not be produced excessively. For example, while thermal and nuclear power generation may have impacts on marine organisms and local fishery through thermal effluents, hydroelectric power generation may require large-scale resettlement of local residents. In the present study, we have created scenarios without too much reliance on a particular type of power generation, in order to exclude repeated occurrences of a particular environmental impact and to achieve “diversification of risk”.
4.5. Power Development Scenario 4.5.1 Concept of Power Development Scenario
(1) Framework of Planning
The flowchart of alternative power development scenario and its optimization is shown in the figure in the right hand side.
The optimal power development scenario is examined to make overall power supply economical, stable and reliable, and environmentally friendly. Decrease of oil usage in power production is the first priority in power development scenarios.
On the other hand, it is difficult to secure sufficient power sources substituting for oil-burning plants. Gas supply is very slow to materialize and hydropower development has not even started yet. Therefore, large-scale coal-fired power plant development and pumped storage hydro development are being advanced. Negative social and environmental impacts due to exhaust and thermal water discharge may result when several coal thermal power plants are developed on a limited stretch of land. These are perceived as the downside of substituting coal for oil.
Evaluation for Power source development
Evaluation for transmission system
Strategic environmental assessment
Demand forecast
Producing power development scenarios
Optimization of scenarios
Optimization Flowchart
Configuration of power generation and transmission systems that effectively meets the maximum power demand and energy in 2028 is the long-term goal of each scenario. Installed
- 43 - Final Report < Summary >
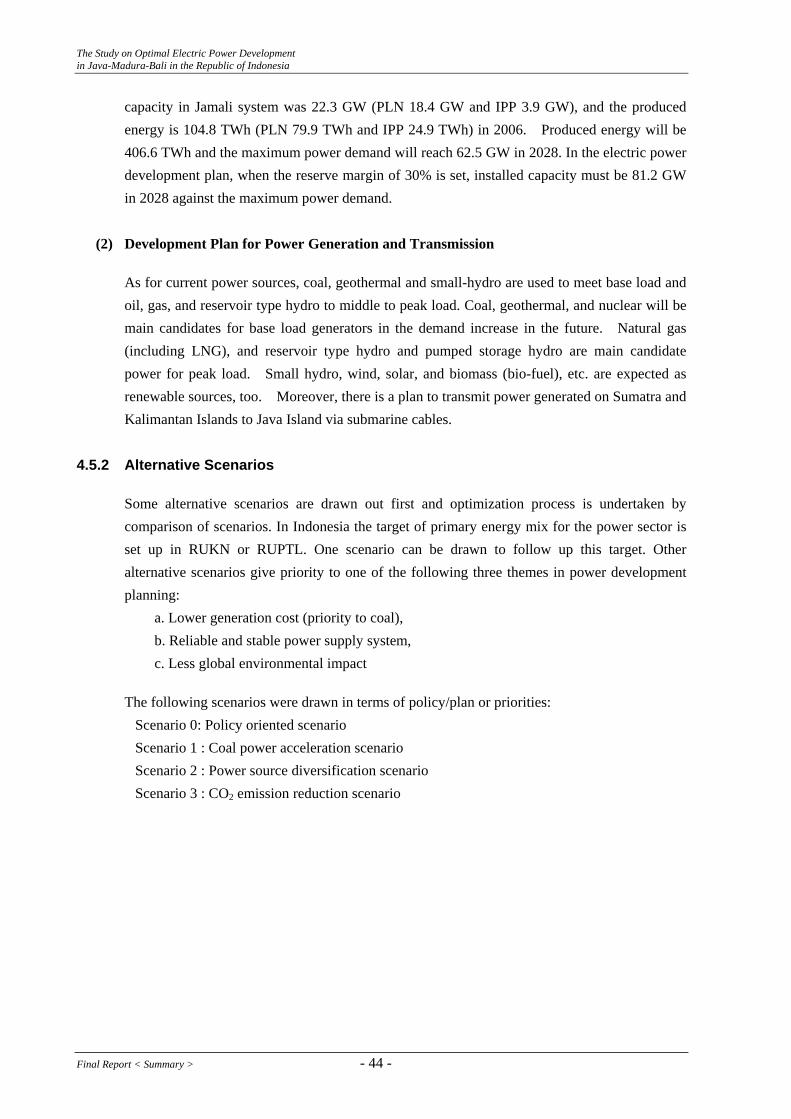
The Study on Optimal Electric Power Development in Java-Madura-Bali in the Republic of Indonesia
capacity in Jamali system was 22.3 GW (PLN 18.4 GW and IPP 3.9 GW), and the produced energy is 104.8 TWh (PLN 79.9 TWh and IPP 24.9 TWh) in 2006. Produced energy will be 406.6 TWh and the maximum power demand will reach 62.5 GW in 2028. In the electric power development plan, when the reserve margin of 30% is set, installed capacity must be 81.2 GW in 2028 against the maximum power demand.
(2) Development Plan for Power Generation and Transmission
As for current power sources, coal, geothermal and small-hydro are used to meet base load and oil, gas, and reservoir type hydro to middle to peak load. Coal, geothermal, and nuclear will be main candidates for base load generators in the demand increase in the future. Natural gas (including LNG), and reservoir type hydro and pumped storage hydro are main candidate power for peak load. Small hydro, wind, solar, and biomass (bio-fuel), etc. are expected as renewable sources, too. Moreover, there is a plan to transmit power generated on Sumatra and Kalimantan Islands to Java Island via submarine cables.
4.5.2 Alternative Scenarios
Some alternative scenarios are drawn out first and optimization process is undertaken by comparison of scenarios. In Indonesia the target of primary energy mix for the power sector is set up in RUKN or RUPTL. One scenario can be drawn to follow up this target. Other alternative scenarios give priority to one of the following three themes in power development planning: a. Lower generation cost (priority to coal), b. Reliable and stable power supply system, c. Less global environmental impact
The following scenarios were drawn in terms of policy/plan or priorities: Scenario 0: Policy oriented scenario Scenario 1 : Coal power acceleration scenario Scenario 2 : Power source diversification scenario Scenario 3 : CO2 emission reduction scenario
Final Report < Summary > - 44 -
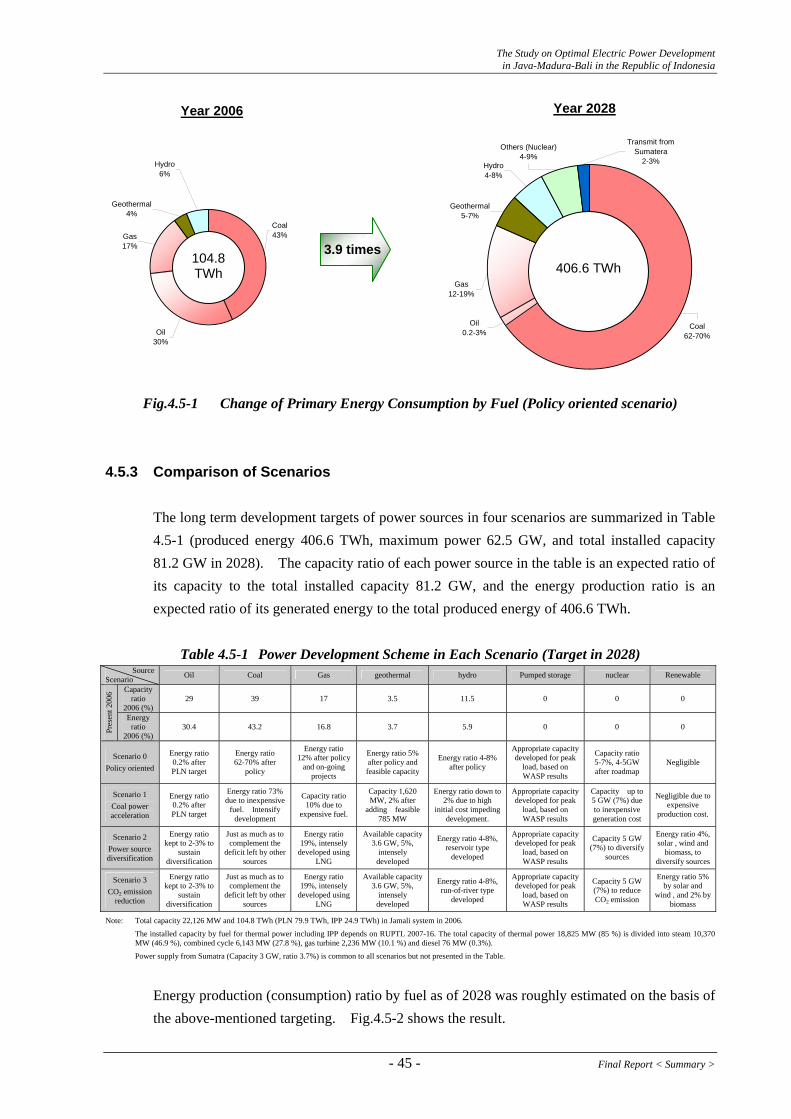
The Study on Optimal Electric Power Development in Java-Madura-Bali in the Republic of Indonesia
Year 2028Year 2006
Coal43%
Transmit fromSumatera
2-3%
Others (Nuclear)4-9%
Gas12-19%
Oil0.2-3%
Coal62-70%
Geothermal5-7%
Hydro4-8%
Geothermal4%
Hydro6%
Gas17%
Oil30%
406.6 TWh 3.9 times104.8
TWh
Fig.4.5-1 Change of Primary Energy Consumption by Fuel (Policy oriented scenario)
4.5.3 Comparison of Scenarios The long term development targets of power sources in four scenarios are summarized in Table 4.5-1 (produced energy 406.6 TWh, maximum power 62.5 GW, and total installed capacity 81.2 GW in 2028). The capacity ratio of each power source in the table is an expected ratio of its capacity to the total installed capacity 81.2 GW, and the energy production ratio is an expected ratio of its generated energy to the total produced energy of 406.6 TWh.
Table 4.5-1 Power Development Scheme in Each Scenario (Target in 2028) Source
Scenario Oil Coal Gas geothermal hydro Pumped storage nuclear Renewable
Capacity ratio
2006 (%) 29 39 17 3.5 11.5 0 0 0
Pres
ent 2
006
Energy ratio
2006 (%) 30.4 43.2 16.8 3.7 5.9 0 0 0
Scenario 0 Policy oriented
Energy ratio 0.2% after PLN target
Energy ratio 62-70% after
policy
Energy ratio 12% after policy
and on-going projects
Energy ratio 5% after policy and feasible capacity
Energy ratio 4-8% after policy
Appropriate capacity developed for peak
load, based on WASP results
Capacity ratio 5-7%, 4-5GW after roadmap
Negligible
Scenario 1 Coal power acceleration
Energy ratio 0.2% after PLN target
Energy ratio 73% due to inexpensive
fuel. Intensify development
Capacity ratio 10% due to
expensive fuel.
Capacity 1,620 MW, 2% after
adding feasible 785 MW
Energy ratio down to 2% due to high
initial cost impeding development.
Appropriate capacity developed for peak
load, based on WASP results
Capacity up to 5 GW (7%) due to inexpensive generation cost
Negligible due to expensive
production cost.
Scenario 2 Power source diversification
Energy ratio kept to 2-3% to
sustain diversification
Just as much as to complement the
deficit left by other sources
Energy ratio 19%, intensely
developed using LNG
Available capacity 3.6 GW, 5%,
intensely developed
Energy ratio 4-8%, reservoir type
developed
Appropriate capacity developed for peak
load, based on WASP results
Capacity 5 GW (7%) to diversify
sources
Energy ratio 4%, solar , wind and
biomass, to diversify sources
Scenario 3 CO2 emission
reduction
Energy ratio kept to 2-3% to
sustain diversification
Just as much as to complement the
deficit left by other sources
Energy ratio 19%, intensely
developed using LNG
Available capacity 3.6 GW, 5%,
intensely developed
Energy ratio 4-8%, run-of-river type
developed
Appropriate capacity developed for peak
load, based on WASP results
Capacity 5 GW (7%) to reduce CO2 emission
Energy ratio 5% by solar and
wind , and 2% by biomass
Note: Total capacity 22,126 MW and 104.8 TWh (PLN 79.9 TWh, IPP 24.9 TWh) in Jamali system in 2006.
The installed capacity by fuel for thermal power including IPP depends on RUPTL 2007-16. The total capacity of thermal power 18,825 MW (85 %) is divided into steam 10,370 MW (46.9 %), combined cycle 6,143 MW (27.8 %), gas turbine 2,236 MW (10.1 %) and diesel 76 MW (0.3%).
Power supply from Sumatra (Capacity 3 GW, ratio 3.7%) is common to all scenarios but not presented in the Table.
Energy production (consumption) ratio by fuel as of 2028 was roughly estimated on the basis of the above-mentioned targeting. Fig.4.5-2 shows the result.
- 45 - Final Report < Summary >
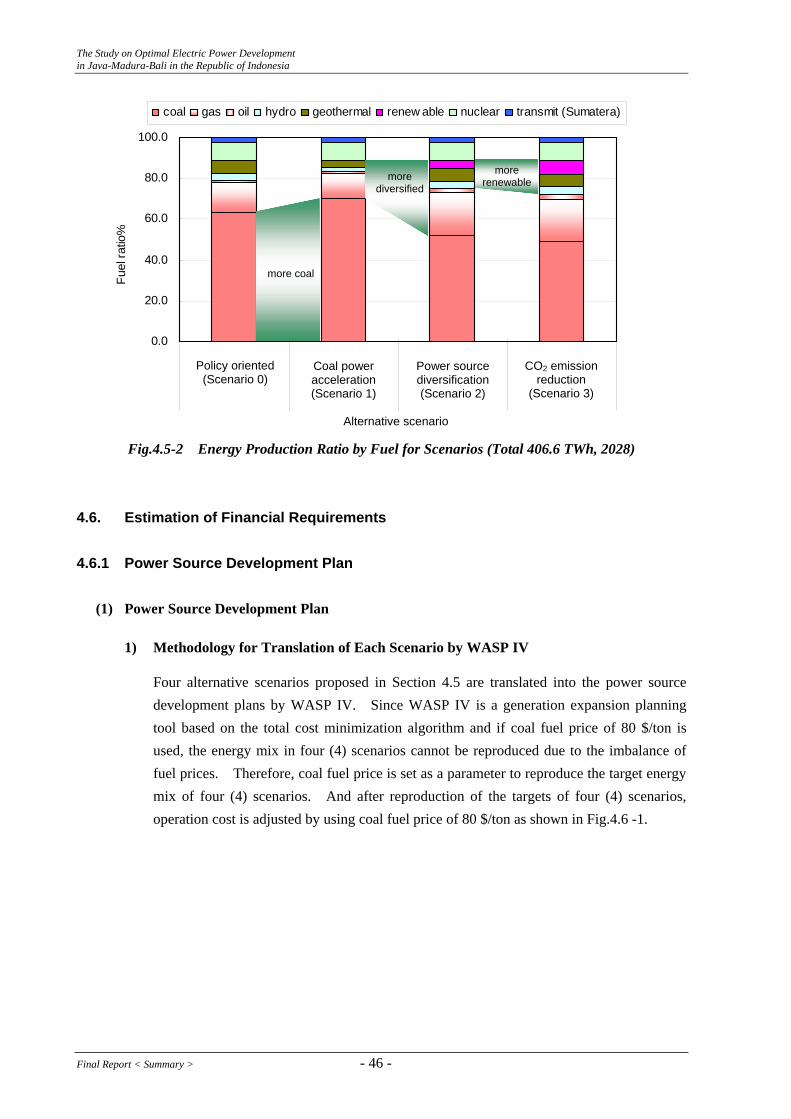
The Study on Optimal Electric Power Development in Java-Madura-Bali in the Republic of Indonesia
0.0
20.0
40.0
60.0
80.0
100.0
Policy oriented Coal pow eracceleration
Pow er sourcediversif ication
CO2 emissionreduction
Alternative senario
Fuel
ratio
%coal gas oil hydro geothermal renew able nuclear transmit (Sumatera)
more coal
more diversified
more renewable
Policy oriented (Scenario 0)
Coal power acceleration (Scenario 1)
Power source diversification(Scenario 2)
CO2 emission reduction
(Scenario 3)
Alternative scenario
Fig.4.5-2 Energy Production Ratio by Fuel for Scenarios (Total 406.6 TWh, 2028)
4.6. Estimation of Financial Requirements 4.6.1 Power Source Development Plan
(1) Power Source Development Plan
1) Methodology for Translation of Each Scenario by WASP IV
Four alternative scenarios proposed in Section 4.5 are translated into the power source development plans by WASP IV. Since WASP IV is a generation expansion planning tool based on the total cost minimization algorithm and if coal fuel price of 80 $/ton is used, the energy mix in four (4) scenarios cannot be reproduced due to the imbalance of fuel prices. Therefore, coal fuel price is set as a parameter to reproduce the target energy mix of four (4) scenarios. And after reproduction of the targets of four (4) scenarios, operation cost is adjusted by using coal fuel price of 80 $/ton as shown in Fig.4.6 -1.
Final Report < Summary > - 46 -
The Study on Optimal Electric Power Development in Java-Madura-Bali in the Republic of Indonesia
Original Case(Fuel price of coal is
set80 $/ton)
Simulation Case
Adjustment of Operation Cost for Coal Candidates
RunWASP IV
RunWASP IV
Setting Coal fuel pricefor Coal Candidates
Satisfy ing Scenario
YesNo
Operation Costof Coal Candidates *1
Start
EndNote : *1 Coal Candidates mean C6H , C10H and J-SIC set in VARSYS and Operation Cost are at Base Load and Full Load in VARSYS.Rep of WASP IV.
Fig. 4.6-1 Methodology for Reproduction of Each Scenario by WASP IV
2) Development Stage
Power source development plan for the 20 years from 2009 to 2028 is divided into three (3) stages, (a) On-going and committed projects development stage, (b) Prospective projects development stage, and (c) Potential projects development stage as shown in Fig.4.6-2, which shows for Scenario 0.
(a) On-going and committed project development stage (2009 ~ 2015) On-going and committed projects in RUPTL are to be developed in this stage.
(b) Prospective projects development stage (2016 ~ 2020) Prospective projects mean the projects whose sites are identified specifically in the relevant studies. Pre-FS, FS and/or D/D including EIA are to be carried out for the future implementation.
(c) Potential projects development stage (2021 ~ 2028) Potential projects mean the projects whose sites have not yet been identified. Inventory list will be prepared and realization methods will be studied and prepared especially for renewable energy development.
- 47 - Final Report < Summary >
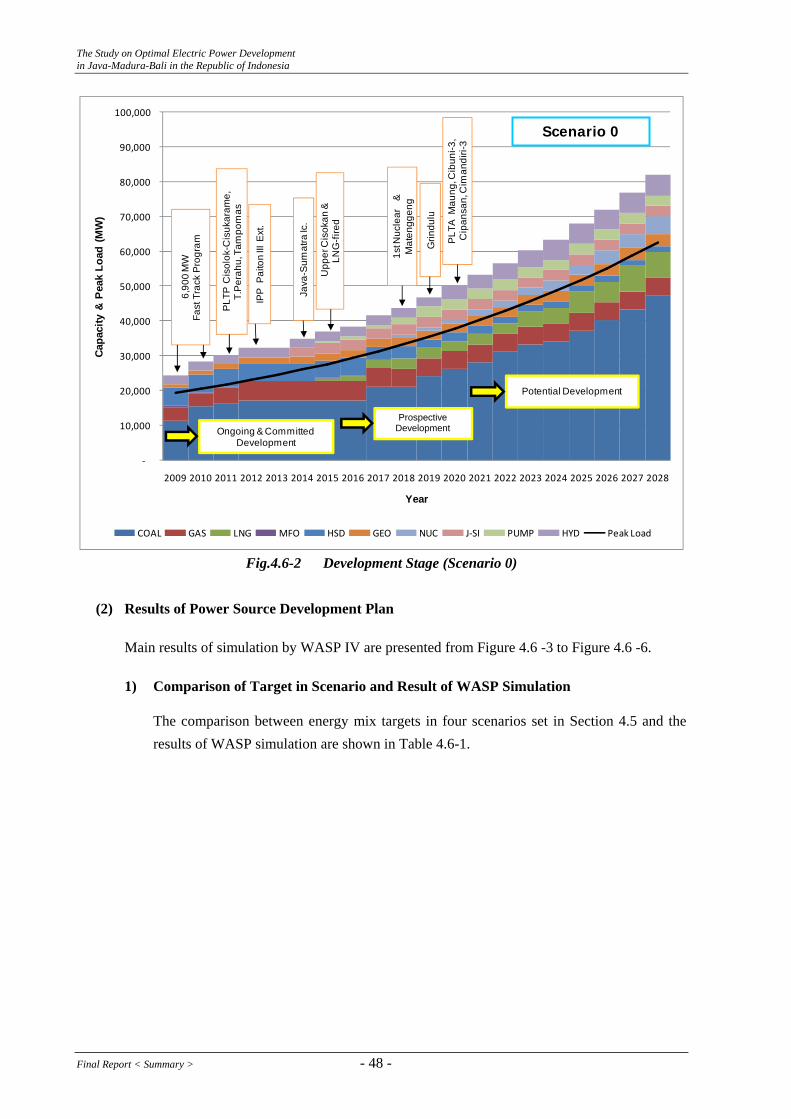
The Study on Optimal Electric Power Development in Java-Madura-Bali in the Republic of Indonesia
‐
10,000
20,000
30,000
40,000
50,000
60,000
70,000
80,000
90,000
100,000
2009 2010 2011 2012 2013 2014 2015 2016 2017 2018 2019 2020 2021 2022 2023 2024 2025 2026 2027 2028
Capa
city
& P
eak
Load
(M
W)
Year
COAL GAS LNG MFO HSD GEO NUC J‐SI PUMP HYD Peak Load
Base Scenario
1st N
ucle
ar&
Mat
engg
eng
Grin
dulu
PLT
A M
aung
, Cib
uni-3
,C
ipan
san,
Cim
andi
ri-3
Scenario 0
Ongoing & CommittedDevelopment
ProspectingDevelopment
Potential Development
6,90
0 M
WFa
st T
rack
Pro
gram
PLT
P C
isol
ok-C
isuk
aram
e,
T.P
erah
u, T
ampo
mas
IPP
Pai
ton
III E
xt.
Java
-Sum
atra
Ic.
Upp
er C
isok
an &
LN
G-fi
red
Prospective Development
Fig.4.6-2 Development Stage (Scenario 0)
(2) Results of Power Source Development Plan
Main results of simulation by WASP IV are presented from Figure 4.6 -3 to Figure 4.6 -6.
1) Comparison of Target in Scenario and Result of WASP Simulation
The comparison between energy mix targets in four scenarios set in Section 4.5 and the results of WASP simulation are shown in Table 4.6-1.
Final Report < Summary > - 48 -
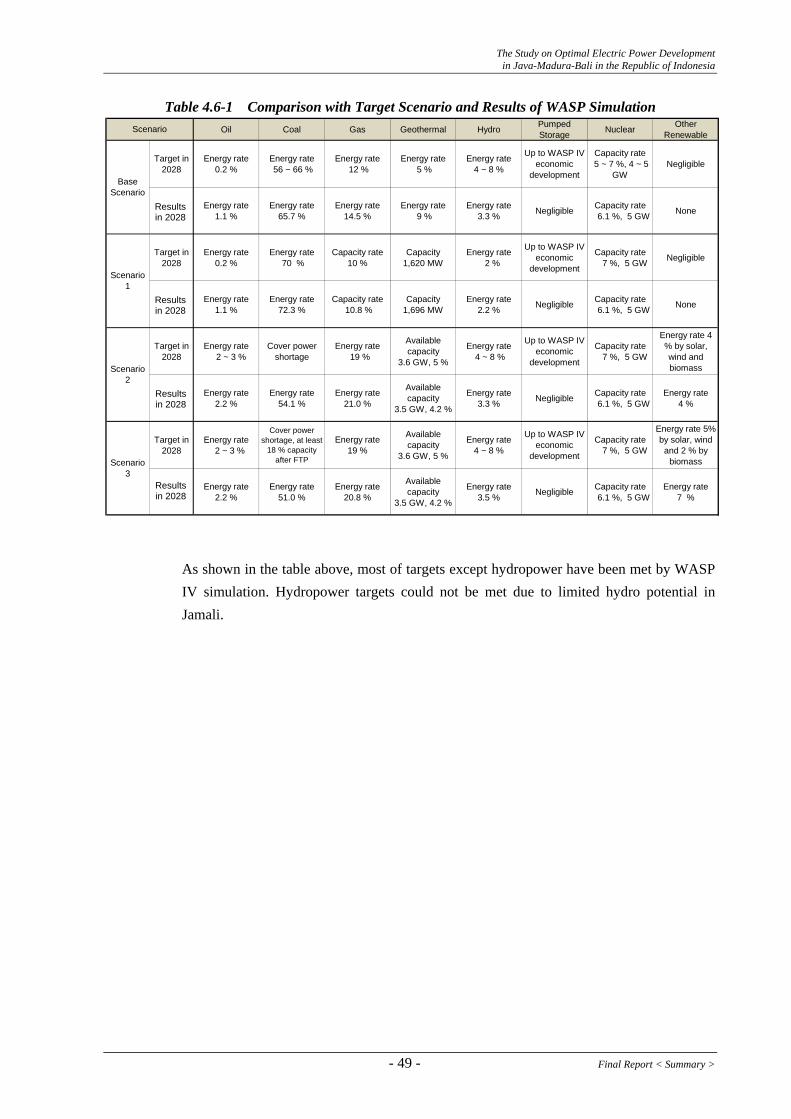
The Study on Optimal Electric Power Development in Java-Madura-Bali in the Republic of Indonesia
Table 4.6-1 Comparison with Target Scenario and Results of WASP Simulation
Oil Coal Gas Geothermal Hydro PumpedStorage Nuclear Other
Renewable
Target in2028
Energy rate0.2 %
Energy rate 56 ~ 66 %
Energy rate 12 %
Energy rate 5 %
Energy rate4 ~ 8 %
Up to WASP IVeconomic
development
Capacity rate 5 ~ 7 %, 4 ~ 5
GWNegligible
Simulation Resultsin 2028
Energy rate1.1 %
Energy rate65.7 %
Energy rate14.5 %
Energy rate 9 %
Energy rate3.3 % Negligible Capacity rate
6.1 %, 5 GW None
Target in2028
Energy rate0.2 %
Energy rate 70 %
Capacity rate10 %
Capacity1,620 MW
Energy rate 2 %
Up to WASP IVeconomic
development
Capacity rate 7 %, 5 GW Negligible
Simulation Resultsin 2028
Energy rate1.1 %
Energy rate72.3 %
Capacity rate 10.8 %
Capacity1,696 MW
Energy rate2.2 % Negligible Capacity rate
6.1 %, 5 GW None
Target in2028
Energy rate 2 ~ 3 %
Cover powershortage
Energy rate 19 %
Availablecapacity
3.6 GW, 5 %
Energy rate 4 ~ 8 %
Up to WASP IVeconomic
development
Capacity rate 7 %, 5 GW
Energy rate 4% by solar,wind andbiomass
Simulation Resultsin 2028
Energy rate2.2 %
Energy rate54.1 %
Energy rate21.0 %
Availablecapacity
3.5 GW, 4.2 %
Energy rate3.3 % Negligible Capacity rate
6.1 %, 5 GWEnergy rate
4 %
Target in2028
Energy rate 2 ~ 3 %
Cover powershortage, at least
18 % capacityafter FTP
Energy rate19 %
Availablecapacity
3.6 GW, 5 %
Energy rate4 ~ 8 %
Up to WASP IVeconomic
development
Capacity rate 7 %, 5 GW
Energy rate 5%by solar, windand 2 % by
biomass
Simulation Resultsin 2028
Energy rate2.2 %
Energy rate51.0 %
Energy rate20.8 %
Availablecapacity
3.5 GW, 4.2 %
Energy rate3.5 % Negligible Capacity rate
6.1 %, 5 GWEnergy rate
7 %
Scenario
BaseScenario
cenario1
cenario2
cenario3
As shown in the table above, most of targets except hydropower have been met by WASP IV simulation. Hydropower targets could not be met due to limited hydro potential in Jamali.
S
S
S
Results in 2028
Results in 2028
Results in 2028
Results in 2028
- 49 - Final Report < Summary >
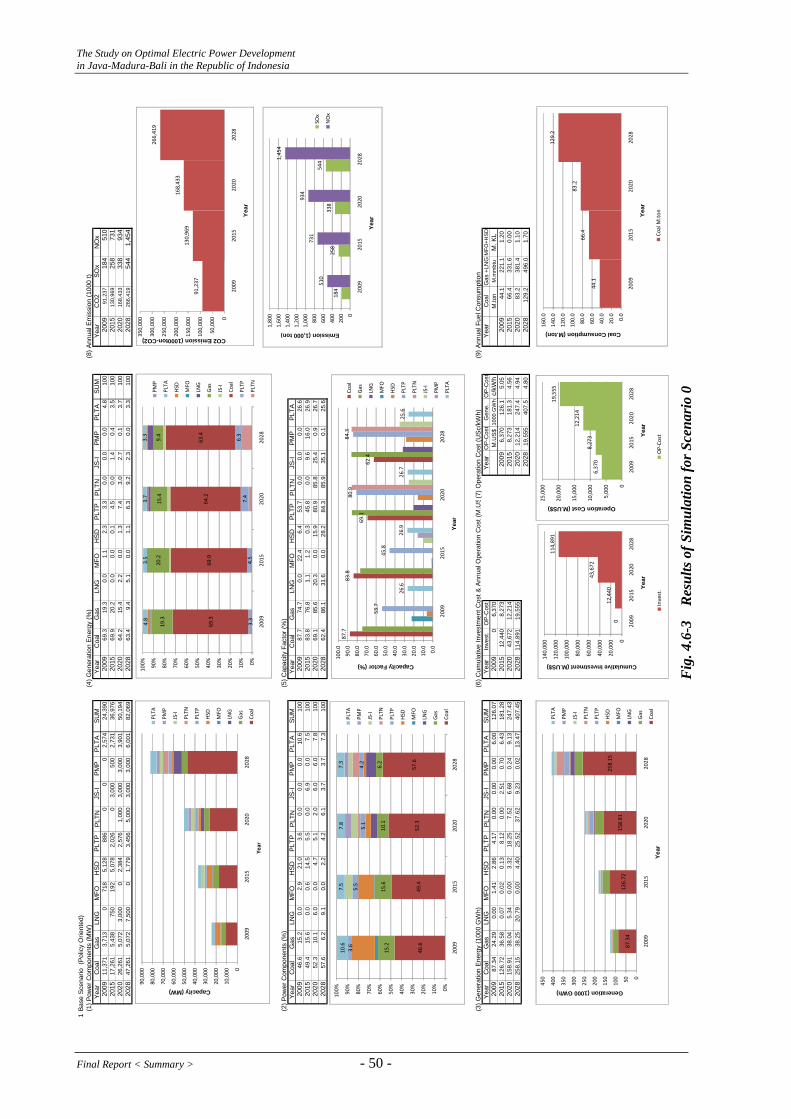
The Study on Optimal Electric Power Development in Java-Madura-Bali in the Republic of Indonesia
1Ba
se S
cena
rio (
Polic
y O
rient
ed)
(1) P
ower
Com
pone
nts
(MW
)(4
) Gen
erat
ion
Ener
gy (%
)(8
) Ann
ual E
mis
sion
(100
0 t)
Year
Coa
lG
asLN
GM
FOH
SDPL
TPPL
TNJS
-IPM
PP
LTA
SUM
Yea
rC
oal
Gas
LNG
MFO
HSD
PLTP
PLTN
JS-I
PMP
PLTA
SUM
Year
CO
2SO
xN
Ox
2009
11,3
713,
713
071
85,
128
886
00
02,
574
24,3
9020
0969
.319
.30.
01.
12.
33.
30.
00.
00.
04.
810
020
0991
,237
184
510
2015
17,2
615,
438
750
192
5,07
82,
026
03,
000
500
2,73
136
,976
2015
69.9
20.2
0.0
0.0
0.1
4.5
0.0
1.4
0.4
3.5
100
2015
130,
969
258
731
2020
26,2
615,
072
3,00
00
2,38
42,
576
1,00
03,
000
3,00
03,
901
50,1
9420
2064
.215
.42.
20.
01.
37.
43.
02.
70.
13.
710
020
2016
8,43
333
893
420
2847
,261
5,07
27,
500
01,
779
3,45
65,
000
3,00
03,
000
6,00
182
,069
2028
63.4
9.4
5.1
0.0
1.1
6.3
9.2
2.3
0.0
3.3
100
2028
266,
419
544
1,45
4
(2) P
ower
Com
pone
nts
(%)
(5) C
apac
ity F
acto
r (%
)Ye
arC
oal
Gas
LNG
MFO
HSD
PLTP
PLTN
JS-I
PMP
PLT
ASU
MY
ear
Coa
lG
asLN
GM
FOH
SDPL
TPPL
TNJS
-IPM
PPL
TA20
0946
.615
.20.
02.
921
.03.
60.
00.
00.
010
.610
020
0987
.774
.70.
022
.46.
453
.70.
00.
00.
026
.620
1549
.415
.60.
00.
614
.55.
50.
06.
90.
07.
510
020
1583
.876
.81.
11.
20.
345
.80.
09.
616
.026
.920
2052
.310
.16.
00.
04.
75.
12.
06.
06.
07.
810
020
2069
.185
.620
.30.
015
.980
.985
.825
.40.
926
.720
2857
.66.
29.
10.
02.
24.
26.
13.
73.
77.
310
020
2862
.486
.131
.60.
028
.284
.385
.935
.10.
125
.6
(3) G
ener
atio
n En
ergy
(100
0 G
Wh)
(6) C
umul
ativ
e In
vest
men
t Cos
t & A
nnua
l Ope
ratio
n C
ost (
M.U
S(7
) Ope
ratio
n C
ost (
USc
/kW
h)(9
) Ann
ual F
uel C
onsu
mpt
ion
Year
Coa
lG
asLN
GM
FOH
SDPL
TPPL
TNJS
-IPM
PP
LTA
SUM
Yea
rIn
vest
.O
P-C
ost
Year
OP
-Cos
tG
ene.
OP-
Cos
tYe
arC
oal
Gas
+LN
GM
FO+H
SD
2009
87.3
424
.29
0.00
1.41
2.86
4.17
0.00
0.00
0.00
6.00
126.
0720
090
6,37
0M
.US$
1000
GW
hc/
kWh
M.to
nM
.mm
btu
M. K
L20
1512
6.72
36.5
80.
070.
020.
138.
120.
002.
510.
706.
4318
1.28
2015
12,4
408,
273
2009
6,37
012
6.1
5.05
2009
44.1
221.
11.
2020
2015
8.91
38.0
45.
340.
003.
3218
.25
7.52
6.68
0.24
9.13
247.
4320
2043
,672
12,2
1420
158,
273
181.
34.
5620
1566
.433
1.6
0.00
2028
258.
1538
.25
20.7
90.
004.
4025
.52
37.6
29.
230.
0213
.47
407.
4520
2811
4,89
119
,555
2020
12,2
1424
7.4
4.94
2020
83.2
381.
41.
1020
2819
,555
407.
54.
8020
2812
9.2
496.
01.
70
0
10,000
20,000
30,000
40,000
50,000
60,000
70,000
80,000
90,000
2009
2015
2020
2028
Capacity (MW)
Year
PLTA
PMP
JS‐I
PLTN
PLTP
HSD
MFO
LNG
Gas
Coal
46.6
49.4
52.3
57.6
15.2
15.6
10.1
6.2
3.6
5.5
5.1
4.2
10.6
7.5
7.8
7.3
0%10%
20%
30%
40%
50%
60%
70%
80%
90%
100%
2009
2015
2020
2028
PLTA
PMP
JS‐I
PLTN
PLTP
HSD
MFO
LNG
Gas
Coal
87.34
126.72
158.91
258.15
050100
150
200
250
300
350
400
450
2009
2015
2020
2028
Generation (1000 GWh)
Year
PLTA
PMP
JS‐I
PLTN
PLTP
HSD
MFO
LNG
Gas
Coal
3.3
4.5
7.4
6.3
69.3
69.9
64.2
63.4
19.3
20.2
15.4
9.4
4.8
3.5
3.7
3.3
0%10%
20%
30%
40%
50%
60%
70%
80%
90%
100%
2009
2015
2020
2028
PMP
PLTA
HSD
MFO
LNG
Gas
JS‐I
Coal
PLTP
PLTN
91,237
130,96
9
168,43
3
266,419
0
50,000
100,00
0
150,00
0
200,00
0
250,00
0
300,00
0
350,00
0
2009
2015
2020
2028
CO2 Emission (1000ton-CO2)
Year
012
,440
43,672
114,891
0
20,000
40,000
60,000
80,000
100,00
0
120,00
0
140,00
0
2009
2015
2020
2028
Cumulative Investment (M.US$)
Year
Invest.
6,37
08,273
12,214
19,555
0
5,00
0
10,000
15,000
20,000
25,000
2009
2015
2020
2028
Operation Cost (M.US$)
Year
OP‐Co
st
87.7
83.8
69.1
62.4
53.7
45.8
80.9
84.3
26.6
26.9
26.7
25.6
0.0
10.0
20.0
30.0
40.0
50.0
60.0
70.0
80.0
90.0
100.0
2009
2015
2020
2028
Capacity Factor (%)Ye
ar
Coal
Gas
LNG
MFO
HSD
PLTP
PLTN
JS‐I
PMP
PLTA
184
258
338
544
510
731
934
1,45
4
0
200
400
600
800
1,00
0
1,20
0
1,40
0
1,60
0
1,80
0
2009
2015
2020
2028
Emission (1,000 ton)
Year
SOx
NOx
44.1
66.4
83.2
129.2
0.0
20.0
40.0
60.0
80.0
100.0
120.0
140.0
160.0
2009
2015
2020
2028
Coal Consumption (M.ton)
Year
Coal M
.ton
Fig
. 4.6
-3
Res
ults
of S
imul
atio
n fo
r Sce
nari
o 0
Final Report < Summary > - 50 -

The Study on Optimal Electric Power Development in Java-Madura-Bali in the Republic of Indonesia
2Sc
enar
io 1
(Coa
l Pow
er A
ccel
erat
ion)
(1) P
ower
Com
pone
nts
(MW
)(4
) Gen
erat
ion
Ener
gy (%
)(8
) Ann
ual E
mis
sion
(100
0 t)
Yea
rC
oal
Gas
LNG
MFO
HSD
PLT
PPL
TNJS
-IP
MP
PLT
AS
UM
Yea
rC
oal
Gas
LNG
MFO
HS
DP
LTP
PLTN
JS-I
PMP
PLTA
SU
MYe
arC
O2
SO
xN
Ox
2009
11,3
713,
713
071
85,
128
886
00
02,
574
24,3
9020
0969
.319
.30.
01.
12.
33.
30.
00.
00.
04.
810
0.0
2009
91,2
3718
451
020
1517
,261
5,43
875
019
25,
078
1,69
60
3,00
050
02,
731
36,6
4620
1569
.920
.30.
10.
00.
14.
00.
01.
60.
43.
510
0.0
2015
131,
642
260
735
2020
26,2
615,
072
3,00
00
2,38
41,
696
1,00
03,
000
3,00
03,
901
49,3
1420
2065
.615
.42.
40.
01.
65.
23.
03.
00.
13.
710
0.0
2020
172,
842
347
960
2028
54,2
615,
072
3,75
00
1,77
91,
696
5,00
03,
000
3,00
03,
901
81,4
5920
2870
.29.
42.
50.
01.
13.
39.
22.
10.
02.
210
0.0
2028
285,
882
598
1,52
8
(2) P
ower
Com
pone
nts
(%)
(5) C
apac
ity F
acto
r (%
)Y
ear
Coa
lG
asLN
GM
FOH
SDP
LTP
PLTN
JS-I
PM
PP
LTA
SU
MY
ear
Coa
lG
asLN
GM
FOH
SD
PLT
PPL
TNJS
-IPM
PPL
TA20
0946
.615
.20.
02.
921
.03.
60.
00.
00.
010
.610
0.0
2009
87.7
74.7
0.0
22.4
6.4
53.7
0.0
0.0
0.0
26.6
2015
49.8
15.7
0.0
0.6
14.6
4.9
0.0
6.9
0.0
7.6
100.
020
1583
.977
.22.
11.
80.
448
.90.
011
.318
.526
.920
2053
.310
.36.
10.
04.
83.
42.
06.
16.
17.
910
0.0
2020
70.6
85.7
23.0
0.0
19.1
86.4
85.8
27.9
0.9
26.7
2028
66.6
6.2
4.6
0.0
2.2
2.1
6.1
3.7
3.7
4.8
100.
020
2860
.286
.030
.40.
028
.889
.585
.932
.90.
026
.7
(3) G
ener
atio
n E
nerg
y (1
000
GW
h)(6
) Cum
ulat
ive
Inve
stm
ent C
ost &
Ann
ual O
pera
tion
Cos
t (M
.US
(7) O
pera
tion
Cos
t (U
Sc/k
Wh)
(9) A
nnua
l Fue
l Con
sum
ptio
nY
ear
Coa
lG
asLN
GM
FOH
SDP
LTP
PLTN
JS-I
PM
PP
LTA
SU
MY
ear
Inve
st.
OP-
Cos
tYe
arO
P-C
ost
Gen
e.O
P-C
ost
Year
Coa
lG
as +
LNG
MFO
+HS
D20
0987
.34
24.2
90.
001.
412.
864.
170.
000.
000.
006.
0012
6.07
2009
06,
370
M.U
S$10
00 G
Wh
c/kW
hM
.ton
M.m
mbt
uM
. KL
2015
126.
8536
.77
0.14
0.03
0.17
7.27
0.00
2.97
0.81
6.43
181.
4420
1511
,665
8,25
820
096,
370
126.
15.
0520
0944
.122
1.1
1.20
2020
162.
3338
.07
6.05
0.00
3.99
12.8
47.
527.
330.
249.
1324
7.50
2020
41,6
0412
,235
2015
8,25
818
1.4
4.55
2015
66.8
334.
30.
0020
2828
6.01
38.2
310
.00
0.00
4.49
13.3
037
.62
8.64
0.01
9.13
407.
4320
2811
6,68
119
,114
2020
12,2
3524
7.5
4.94
2020
85.0
386.
91.
4020
2819
,114
407.
44.
6920
2814
1.5
417.
41.
70
0
10,000
20,000
30,000
40,000
50,000
60,000
70,000
80,000
90,000
2009
2015
2020
2028
Capacity (MW)
Year
PLTA
PMP
JS‐I
PLTN
PLTP
HSD
MFO
LNG
Gas
Coal
46.6
49.8
53.3
66.6
15.2
15.7
10.3
6.2
3.6
4.9
3.4
2.1
10.6
7.6
7.9
4.8
0%10%
20%
30%
40%
50%
60%
70%
80%
90%
100%
2009
2015
2020
2028
PLTA
PMP
JS‐I
PLTN
PLTP
HSD
MFO
LNG
Gas
Coal
87.34
126.85
162.33
286.01
050100
150
200
250
300
350
400
450
2009
2015
2020
2028
Generation (1000 GWh)
Year
PLTA
PMP
JS‐I
PLTN
PLTP
HSD
MFO
LNG
Gas
Coal
3.3
4.0
5.2
3.3
69.3
69.9
65.6
70.2
19.3
20.3
15.4
9.4
4.8
3.5
3.7
2.2
0%10%
20%
30%
40%
50%
60%
70%
80%
90%
100%
2009
2015
2020
2028
PMP
PLTA
HSD
MFO
LNG
Gas
JS‐I
Coal
PLTP
PLTN
91,237
131,64
2
172,842
285,88
2
0
50,000
100,000
150,000
200,000
250,000
300,000
350,000
2009
2015
2020
2028
CO2 Emission (1000ton-CO2)
Year
011,665
41,604
116,681
0
20,000
40,000
60,000
80,000
100,000
120,000
140,000
2009
2015
2020
2028
Cumulative Investment (M.US$)
Year
Invest.
6,370
8,258
12,235
19,114
0
5,000
10,000
15,000
20,000
25,000
2009
2015
2020
2028
Operation Cost (M.US$)
Year
OP‐Co
st
87.7
83.9
70.6
60.2
53.7
48.9
86.4
89.5
26.6
26.9
26.7
26.7
0.0
10.0
20.0
30.0
40.0
50.0
60.0
70.0
80.0
90.0
100.0
2009
2015
2020
2028
Capacity Factor (%)
Year
Coal
Gas
LNG
MFO
HSD
PLTP
PLTN
JS‐I
PMP
PLTA
184
260
347
598
510
735
960
1,528
0
200
400
600
800
1,000
1,200
1,400
1,600
1,800
2009
2015
2020
2028
Emission (1,000 ton)
Year
SOx
NOx
44.1
66.8
85.0
141.5
0.0
20.0
40.0
60.0
80.0
100.0
120.0
140.0
160.0
2009
2015
2020
2028
Coal Consumption (M.ton)
Year
Coal M
.ton
Fig
. 4.6
-4
Res
ults
of S
imul
atio
n fo
r Sce
nari
o 1
- 51 - Final Report < Summary >

The Study on Optimal Electric Power Development in Java-Madura-Bali in the Republic of Indonesia
3Sc
enar
io 2
(Pow
er S
ourc
e D
iver
sific
atio
n)(1
) Pow
er C
ompo
nent
s (M
W)
(4) G
ener
atio
n En
ergy
(%)
(8) A
nnua
l Em
issi
on (1
000
t)Ye
arC
oal
Gas
LNG
MFO
HS
DPL
TPPL
TNJS
-IPM
PPL
T AR
ENE
WSU
MYe
arC
oal
Gas
LNG
MFO
HSD
PLTP
PLTN
JS-I
PM
PPL
TAR
ENEW
SUM
Year
CO
2SO
xN
Ox
2009
11,3
713,
713
071
85,
128
886
00
02,
574
024
,390
2009
69.3
19.3
0.0
1.1
2.3
3.3
0.0
0.0
0.0
4.8
0.0
100.
020
0991
,237
184
510
2015
17,2
615,
438
750
192
5,07
82,
026
03,
000
500
2,73
10
36,9
7620
1569
.720
.40.
60.
00.
14.
50.
00.
80.
53.
50.
010
0.0
2015
130,
423
256
731
2020
23,2
615,
072
4,50
00
2,98
42,
576
1,00
03,
000
3,00
03,
901
049
,294
2020
58.6
15.5
7.3
0.0
1.9
7.4
3.0
2.4
0.1
3.7
0.0
100.
020
2016
2,26
731
193
420
2840
,261
5,07
29,
000
03,
579
3,45
65,
000
3,00
03,
000
6,00
13,
250
81,6
1920
2852
.19.
511
.50.
02.
26.
29.
22.
00.
03.
34.
010
0.0
2028
239,
440
458
1,38
4
(2) P
ower
Com
pone
nts
(%)
(5) C
apac
ity F
acto
r (%
)Ye
arC
oal
Gas
LNG
MFO
HS
DPL
TPPL
TNJS
-IPM
PPL
T AR
ENE
WSU
MYe
arC
oal
Gas
LNG
MFO
HSD
PLTP
PLTN
JS-I
PM
PPL
TAR
ENEW
2009
46.6
15.2
0.0
2.9
21.0
3.6
0.0
0.0
0.0
10.6
0.0
100.
020
0987
.774
.70.
022
.46.
453
.70.
00.
00.
026
.60.
020
1549
.415
.60.
00.
614
.55.
50.
06.
90.
07.
50.
010
0.0
2015
83.7
77.7
15.5
1.2
0.3
45.8
0.0
5.4
20.6
26.9
0.0
2020
47.2
10.3
9.1
0.0
6.1
5.2
2.0
6.1
6.1
7.9
0.0
100.
020
2071
.286
.545
.90.
018
.081
.285
.822
.60.
926
.70.
020
2849
.36.
211
.00.
04.
44.
26.
13.
73.
77.
44.
010
0.0
2028
60.2
87.3
59.4
0.0
28.6
83.9
85.9
30.3
0.1
25.6
20.0
(3) G
ener
atio
n En
ergy
(100
0 G
Wh)
(6) C
umul
ativ
e In
vest
men
t Cos
t & A
nnua
l Ope
ratio
n C
ost (
M.U
S$)
(7) O
pera
tion
Cos
t (U
Sc/k
Wh)
(9) A
nnua
l Fue
l Con
sum
ptio
nYe
arC
oal
Gas
LNG
MFO
HS
DPL
TPPL
TNJS
-IPM
PPL
T AR
ENE
WSU
MYe
arIn
vest
.O
P-C
ost
Year
OP-
Cos
tG
ene.
OP
-Cos
tYe
arC
oal
Gas
+LN
GM
FO+H
SD20
0987
.34
24.2
90.
001.
412.
864.
170.
000.
000.
006.
000.
0012
6.07
2009
06,
370
M.U
S$10
00 G
Wh
c/kW
hM
.ton
M.m
mbt
uM
. KL
2015
126.
5237
.00
1.02
0.02
0.13
8.12
0.00
1.41
0.90
6.43
0.00
181.
5520
1512
,440
8,32
220
096,
370
126.
15.
0520
0944
.122
1.1
1.20
2020
145.
0338
.45
18.1
10.
004.
7018
.32
7.52
5.93
0.24
9.13
0.00
247.
4320
2039
,141
12,9
6920
158,
322
181.
64.
5820
1565
.734
3.5
0.00
2028
212.
1438
.79
46.7
90.
008.
9625
.41
37.6
27.
950.
0213
.47
16.2
740
7.42
2028
102,
438
20,7
9420
2012
,969
247.
45.
2420
2076
.547
9.8
1.60
2028
20,7
9440
7.4
5.10
2028
107.
969
2.1
3.10
0
10,000
20,000
30,000
40,000
50,000
60,000
70,000
80,000
90,000
2009
2015
2020
2028
Capacity (MW)
Year
RENEW
PLTA
PMP
JS‐I
PLTN
PLTP
HSD
MFO
LNG
Gas
Coal
46.6
49.4
47.2
49.3
15.2
15.6
10.3
6.2
3.6
5.5
5.2
4.2
10.6
7.5
7.9
7.4
0.0
0.0
0.0
4.0
0%10%
20%
30%
40%
50%
60%
70%
80%
90%
100%
2009
2015
2020
2028
RENEW
PLTA
PMP
JS‐I
PLTN
PLTP
HSD
MFO
LNG
Gas
Coal
87.34
126.52
145.03
212.14
050100
150
200
250
300
350
400
450
2009
2015
2020
2028
Generation (1000 GWh)
Year
RENEW
PLTA
PMP
JS‐I
PLTN
PLTP
HSD
MFO
LNG
Gas
Coal
69.3
69.7
58.6
52.1
19.3
20.4
15.5
9.5
4.8
3.5
3.7
3.3
0%10%
20%
30%
40%
50%
60%
70%
80%
90%
100%
2009
2015
2020
2028
RENEW
PMP
PLTA
HSD
MFO
LNG
Gas
JS‐I
Coal
PLTP
PLTN
91,237
130,423
162,267
239,440
0
50,000
100,000
150,000
200,000
250,000
300,000
350,000
2009
2015
2020
2028
CO2 Emission (1000ton-CO2)
Year
012,440
39,141
102,438
0
20,000
40,000
60,000
80,000
100,000
120,000
2009
2015
2020
2028
Cumulative Investment (M.US$)
Year
Invest.
6,370
8,322
12,969
20,794
0
5,000
10,000
15,000
20,000
25,000
2009
2015
2020
2028
Operation Cost (M.US$)Ye
ar
OP‐Co
st
87.7
83.7
71.2
60.2
53.7
45.8
81.2
83.9
26.6
26.9
26.7
25.6
0.0
10.0
20.0
30.0
40.0
50.0
60.0
70.0
80.0
90.0
100.0
2009
2015
2020
2028
Capacity Factor (%)
Year
Coal
Gas
LNG
MFO
HSD
PLTP
PLTN
JS‐I
PMP
PLTA
RENEW
Renewable
energy is
exclusive.
184
256
311
458
510
731
934
1,384
0
200
400
600
800
1,000
1,200
1,400
1,600
1,800
2009
2015
2020
2028
Emission (1,000 ton)
Year
SOx
NOx
44.1
65.7
76.5
107.9
0.0
20.0
40.0
60.0
80.0
100.0
120.0
140.0
160.0
2009
2015
2020
2028
Coal Consumption (M.ton)
Year
Coal M
.ton
Fig
. 4.6
-5
Res
ults
of S
imul
atio
n fo
r Sce
nari
o 2
Final Report < Summary > - 52 -
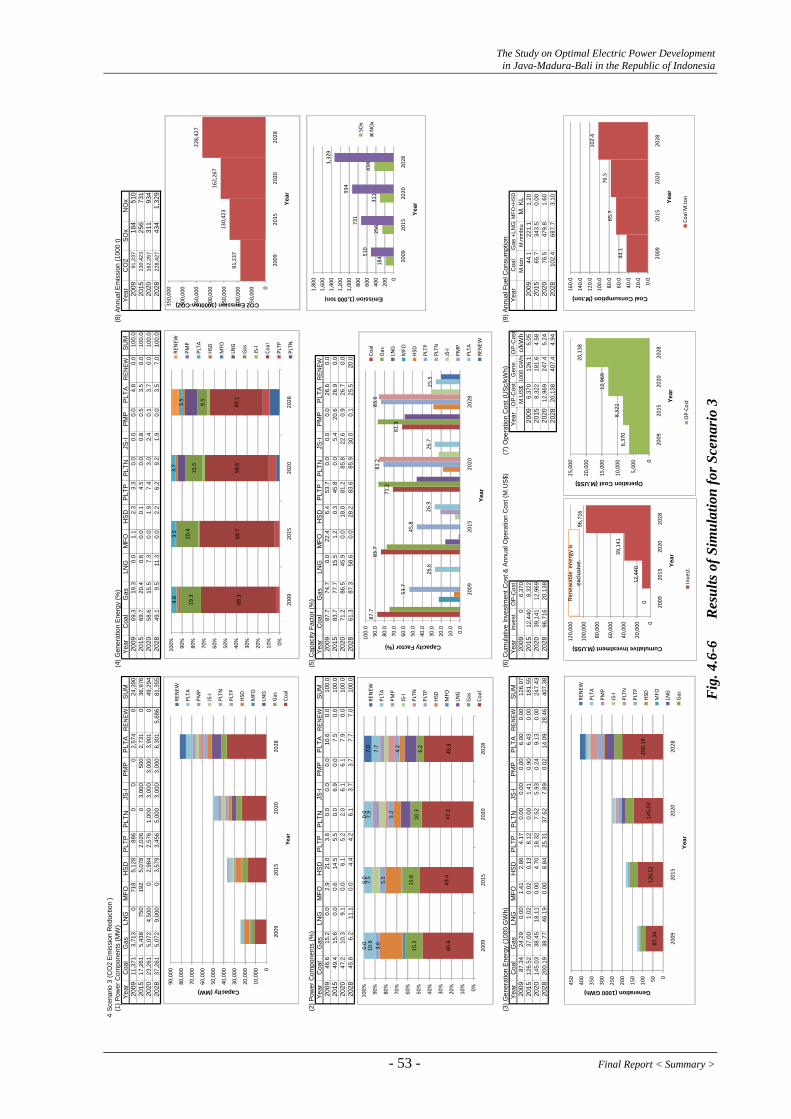
The Study on Optimal Electric Power Development in Java-Madura-Bali in the Republic of Indonesia
4Sc
enar
io 3
(CO
2 Em
issi
on R
educ
tion
)(1
) Pow
er C
ompo
nent
s (M
W)
(4) G
ener
atio
n En
ergy
(%)
(8) A
nnua
l Em
issi
on (1
000
t)Ye
arC
oal
Gas
LNG
MFO
HSD
PLTP
PLTN
JS-I
PMP
PLTA
RE
NEW
SUM
Year
Coa
lG
asLN
GM
FOH
SDPL
TPPL
TNJS
-IPM
PPL
TAR
EN
EWSU
MYe
arC
O2
SOx
NO
x20
0911
,371
3,71
30
718
5,12
888
60
00
2,57
40
24,3
9020
0969
.319
.30.
01.
12.
33.
30.
00.
00.
04.
80.
010
0.0
2009
91,2
3718
451
020
1517
,261
5,43
875
019
25,
078
2,02
60
3,00
050
02,
731
036
,976
2015
69.7
20.4
0.6
0.0
0.1
4.5
0.0
0.8
0.5
3.5
0.0
100.
020
1513
0,42
325
673
120
2023
,261
5,07
24,
500
02,
984
2,57
61,
000
3,00
03,
000
3,90
10
49,2
9420
2058
.615
.57.
30.
01.
97.
43.
02.
40.
13.
70.
010
0.0
2020
162,
267
311
934
2028
37,2
615,
072
9,00
00
3,57
93,
456
5,00
03,
000
3,00
06,
301
5,68
681
,355
2028
49.1
9.5
11.3
0.0
2.2
6.2
9.2
1.9
0.0
3.5
7.0
100.
020
2822
8,42
743
41,
329
(2) P
ower
Com
pone
nts
(%)
(5) C
apac
ity F
acto
r (%
)Ye
arC
oal
Gas
LNG
MFO
HSD
PLTP
PLTN
JS-I
PMP
PLTA
RE
NEW
SUM
Year
Coa
lG
asLN
GM
FOH
SDPL
TPPL
TNJS
-IPM
PPL
TAR
EN
EW20
0946
.615
.20.
02.
921
.03.
60.
00.
00.
010
.60.
010
0.0
2009
87.7
74.7
0.0
22.4
6.4
53.7
0.0
0.0
0.0
26.6
0.0
2015
49.4
15.6
0.0
0.6
14.5
5.5
0.0
6.9
0.0
7.5
0.0
100.
020
1583
.777
.715
.51.
20.
345
.80.
05.
420
.626
.90.
020
2047
.210
.39.
10.
06.
15.
22.
06.
16.
17.
90.
010
0.0
2020
71.2
86.5
45.9
0.0
18.0
81.2
85.8
22.6
0.9
26.7
0.0
2028
45.8
6.2
11.1
0.0
4.4
4.2
6.1
3.7
3.7
7.7
7.0
100.
020
2861
.387
.358
.60.
028
.283
.685
.930
.00.
125
.520
.0
(3) G
ener
atio
n En
ergy
(100
0 G
Wh)
(6) C
umul
ativ
e In
vest
men
t Cos
t & A
nnua
l Ope
ratio
n C
ost (
M.U
S$)
(7) O
pera
tion
Cos
t (U
Sc/k
Wh)
(9) A
nnua
l Fue
l Con
sum
ptio
nYe
arC
oal
Gas
LNG
MFO
HSD
PLTP
PLTN
JS-I
PMP
PLTA
RE
NEW
SUM
Year
Inve
st.
OP
-Cos
tYe
arO
P-C
ost
Gen
e.O
P-C
ost
Year
Coa
lG
as +
LNG
MFO
+HSD
2009
87.3
424
.29
0.00
1.41
2.86
4.17
0.00
0.00
0.00
6.00
0.00
126.
0720
090
6,37
0M
.US$
1000
GW
hc/
kWh
M.to
nM
.mm
btu
M. K
L20
1512
6.52
37.0
01.
020.
020.
138.
120.
001.
410.
906.
430.
0018
1.55
2015
12,4
408,
322
2009
6,37
012
6.1
5.05
2009
44.1
221.
11.
2020
2014
5.03
38.4
518
.11
0.00
4.70
18.3
27.
525.
930.
249.
130.
0024
7.43
2020
39,1
4112
,969
2015
8,32
218
1.6
4.58
2015
65.7
343.
50.
0020
2820
0.19
38.7
746
.19
0.00
8.84
25.3
137
.62
7.89
0.02
14.0
928
.46
407.
3820
2896
,716
20,1
3820
2012
,969
247.
45.
2420
2076
.547
9.8
1.60
2028
20,1
3840
7.4
4.94
2028
102.
468
7.7
3.10
0
10,000
20,000
30,000
40,000
50,000
60,000
70,000
80,000
90,000
2009
2015
2020
2028
Capacity (MW)
Year
RENEW
PLTA
PMP
JS‐I
PLTN
PLTP
HSD
MFO
LNG
Gas
Coal
46.6
49.4
47.2
45.8
15.2
15.6
10.3
6.2
3.6
5.5
5.2
4.2
10.6
7.5
7.9
7.7
0.0
0.0
0.0
7.0
0%10%
20%
30%
40%
50%
60%
70%
80%
90%
100%
2009
2015
2020
2028
RENEW
PLTA
PMP
JS‐I
PLTN
PLTP
HSD
MFO
LNG
Gas
Coal
87.34
126.52
145.03
200.19
050100
150
200
250
300
350
400
450
2009
2015
2020
2028
Generation (1000 GWh)
Year
RENEW
PLTA
PMP
JS‐I
PLTN
PLTP
HSD
MFO
LNG
Gas
69.3
69.7
58.6
49.1
19.3
20.4
15.5
9.5
4.8
3.5
3.7
3.5
0%10%
20%
30%
40%
50%
60%
70%
80%
90%
100%
2009
2015
2020
2028
RENEW
PMP
PLTA
HSD
MFO
LNG
Gas
JS‐I
Coal
PLTP
PLTN
91,237
130,42
3
162,26
7
228,427
0
50,000
100,00
0
150,00
0
200,00
0
250,00
0
300,00
0
350,00
0
2009
2015
2020
2028
CO2 Emission (1000ton-CO2)
Year
012,440
39,141
96,716
0
20,000
40,000
60,000
80,000
100,00
0
120,00
0
2009
2015
2020
2028
Cumulative Investment (M.US$)
Year
Invest.
6,370
8,32
2
12,969
20,138
0
5,000
10,000
15,000
20,000
25,000
2009
2015
2020
2028
Operation Cost (M.US$)
Year
OP‐Co
st
87.7
83.7
71.2
61.3
53.7
45.8
81.2
83.6
26.6
26.9
26.7
25.5
0.0
10.0
20.0
30.0
40.0
50.0
60.0
70.0
80.0
90.0
100.0
2009
2015
2020
2028
Capacity Factor (%)Ye
ar
Coal
Gas
LNG
MFO
HSD
PLTP
PLTN
JS‐I
PMP
PLTA
RENEW
Rene
wable
energy is
exclusive.
184
256
311
434
510
731
934
1,329
0
200
400
600
800
1,00
0
1,20
0
1,40
0
1,60
0
1,80
0
2009
2015
2020
2028
Emission (1,000 ton)
Year
SOx
NOx
44.1
65.7
76.5
102.4
0.0
20.0
40.0
60.0
80.0
100.0
120.0
140.0
160.0
2009
2015
2020
2028
Coal Consumption (M.ton)
Year
Coal M
.ton
Fig
. 4.6
-6
Res
ults
of S
imul
atio
n fo
r Sce
nari
o 3
- 53 - Final Report < Summary >
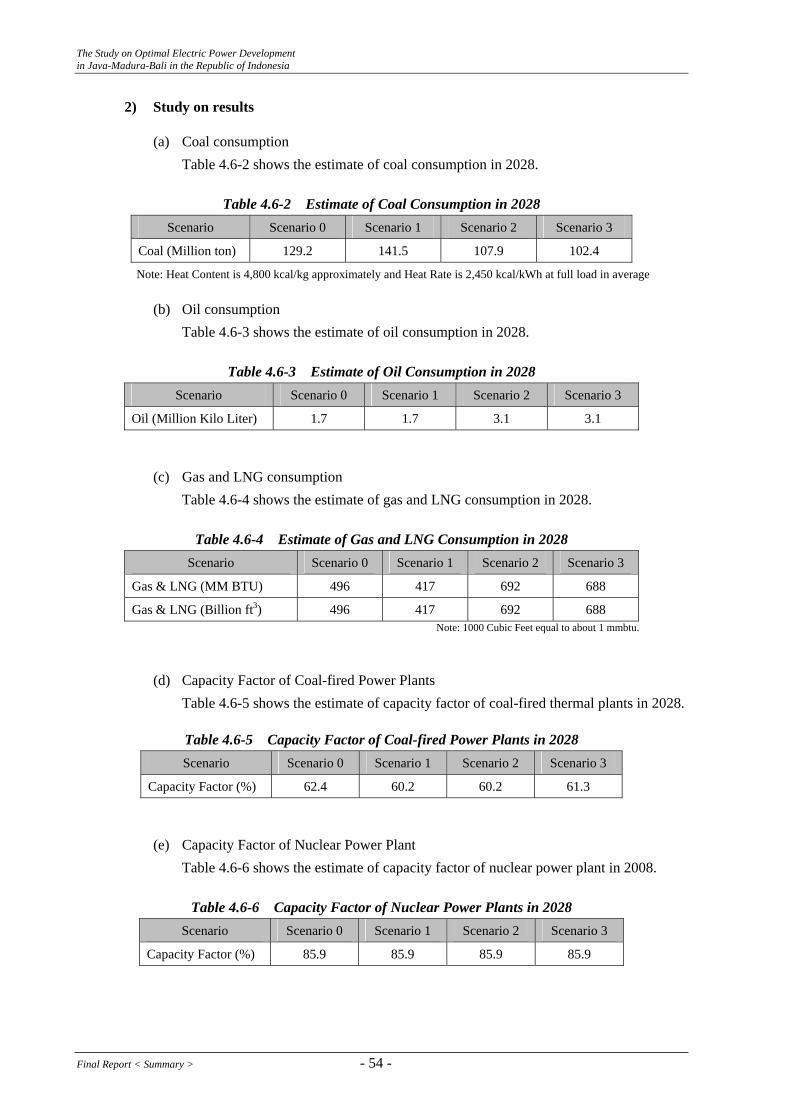
The Study on Optimal Electric Power Development in Java-Madura-Bali in the Republic of Indonesia
2) Study on results
(a) Coal consumption Table 4.6-2 shows the estimate of coal consumption in 2028.
Table 4.6-2 Estimate of Coal Consumption in 2028
Scenario Scenario 0 Scenario 1 Scenario 2 Scenario 3
Coal (Million ton) 129.2 141.5 107.9 102.4
Note: Heat Content is 4,800 kcal/kg approximately and Heat Rate is 2,450 kcal/kWh at full load in average
(b) Oil consumption Table 4.6-3 shows the estimate of oil consumption in 2028.
Table 4.6-3 Estimate of Oil Consumption in 2028
Scenario Scenario 0 Scenario 1 Scenario 2 Scenario 3
Oil (Million Kilo Liter) 1.7 1.7 3.1 3.1
(c) Gas and LNG consumption Table 4.6-4 shows the estimate of gas and LNG consumption in 2028.
Table 4.6-4 Estimate of Gas and LNG Consumption in 2028
Scenario Scenario 0 Scenario 1 Scenario 2 Scenario 3
Gas & LNG (MM BTU) 496 417 692 688
Gas & LNG (Billion ft3) 496 417 692 688 Note: 1000 Cubic Feet equal to about 1 mmbtu.
(d) Capacity Factor of Coal-fired Power Plants Table 4.6-5 shows the estimate of capacity factor of coal-fired thermal plants in 2028.
Table 4.6-5 Capacity Factor of Coal-fired Power Plants in 2028 Scenario Scenario 0 Scenario 1 Scenario 2 Scenario 3
Capacity Factor (%) 62.4 60.2 60.2 61.3
(e) Capacity Factor of Nuclear Power Plant Table 4.6-6 shows the estimate of capacity factor of nuclear power plant in 2008.
Table 4.6-6 Capacity Factor of Nuclear Power Plants in 2028
Scenario Scenario 0 Scenario 1 Scenario 2 Scenario 3
Capacity Factor (%) 85.9 85.9 85.9 85.9
Final Report < Summary > - 54 -
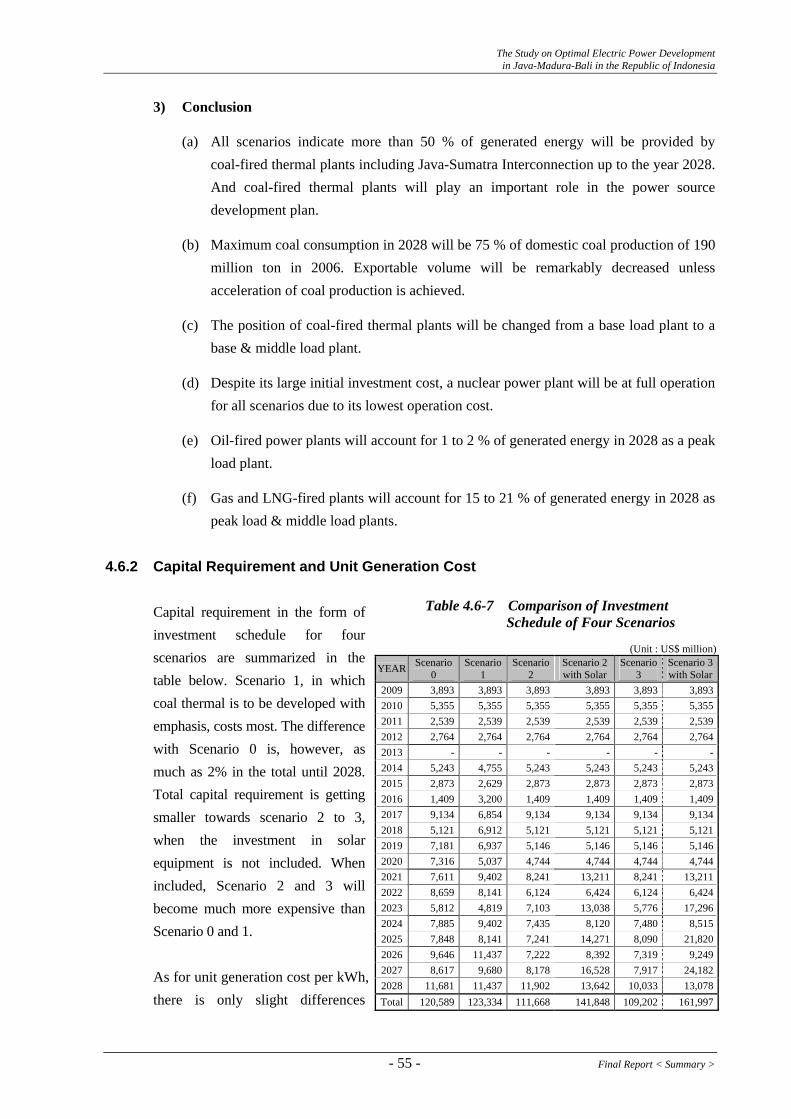
The Study on Optimal Electric Power Development in Java-Madura-Bali in the Republic of Indonesia
3) Conclusion
(a) All scenarios indicate more than 50 % of generated energy will be provided by coal-fired thermal plants including Java-Sumatra Interconnection up to the year 2028. And coal-fired thermal plants will play an important role in the power source development plan.
(b) Maximum coal consumption in 2028 will be 75 % of domestic coal production of 190 million ton in 2006. Exportable volume will be remarkably decreased unless acceleration of coal production is achieved.
(c) The position of coal-fired thermal plants will be changed from a base load plant to a base & middle load plant.
(d) Despite its large initial investment cost, a nuclear power plant will be at full operation for all scenarios due to its lowest operation cost.
(e) Oil-fired power plants will account for 1 to 2 % of generated energy in 2028 as a peak load plant.
(f) Gas and LNG-fired plants will account for 15 to 21 % of generated energy in 2028 as peak load & middle load plants.
4.6.2 Capital Requirement and Unit Generation Cost Capital requirement in the form of investment schedule for four scenarios are summarized in the table below. Scenario 1, in which coal thermal is to be developed with emphasis, costs most. The difference with Scenario 0 is, however, as much as 2% in the total until 2028. Total capital requirement is getting smaller towards scenario 2 to 3, when the investment in solar equipment is not included. When included, Scenario 2 and 3 will become much more expensive than Scenario 0 and 1. As for unit generation cost per kWh, there is only slight differences
Table 4.6-7 Comparison of Investment Schedule of Four Scenarios
(Unit : US$ million)
YEAR Scenario 0
Scenario 1
Scenario 2
Scenario 2 with Solar
Scenario 3
Scenario 3with Solar
2009 3,893 3,893 3,893 3,893 3,893 3,893 2010 5,355 5,355 5,355 5,355 5,355 5,355 2011 2,539 2,539 2,539 2,539 2,539 2,539 2012 2,764 2,764 2,764 2,764 2,764 2,764 2013 - - - - - -2014 5,243 4,755 5,243 5,243 5,243 5,243 2015 2,873 2,629 2,873 2,873 2,873 2,873 2016 1,409 3,200 1,409 1,409 1,409 1,409 2017 9,134 6,854 9,134 9,134 9,134 9,134 2018 5,121 6,912 5,121 5,121 5,121 5,121 2019 7,181 6,937 5,146 5,146 5,146 5,146 2020 7,316 5,037 4,744 4,744 4,744 4,744 2021 7,611 9,402 8,241 13,211 8,241 13,211 2022 8,659 8,141 6,124 6,424 6,124 6,424 2023 5,812 4,819 7,103 13,038 5,776 17,296 2024 7,885 9,402 7,435 8,120 7,480 8,515 2025 7,848 8,141 7,241 14,271 8,090 21,820 2026 9,646 11,437 7,222 8,392 7,319 9,249 2027 8,617 9,680 8,178 16,528 7,917 24,182 2028 11,681 11,437 11,902 13,642 10,033 13,078 Total 120,589 123,334 111,668 141,848 109,202 161,997
- 55 - Final Report < Summary >
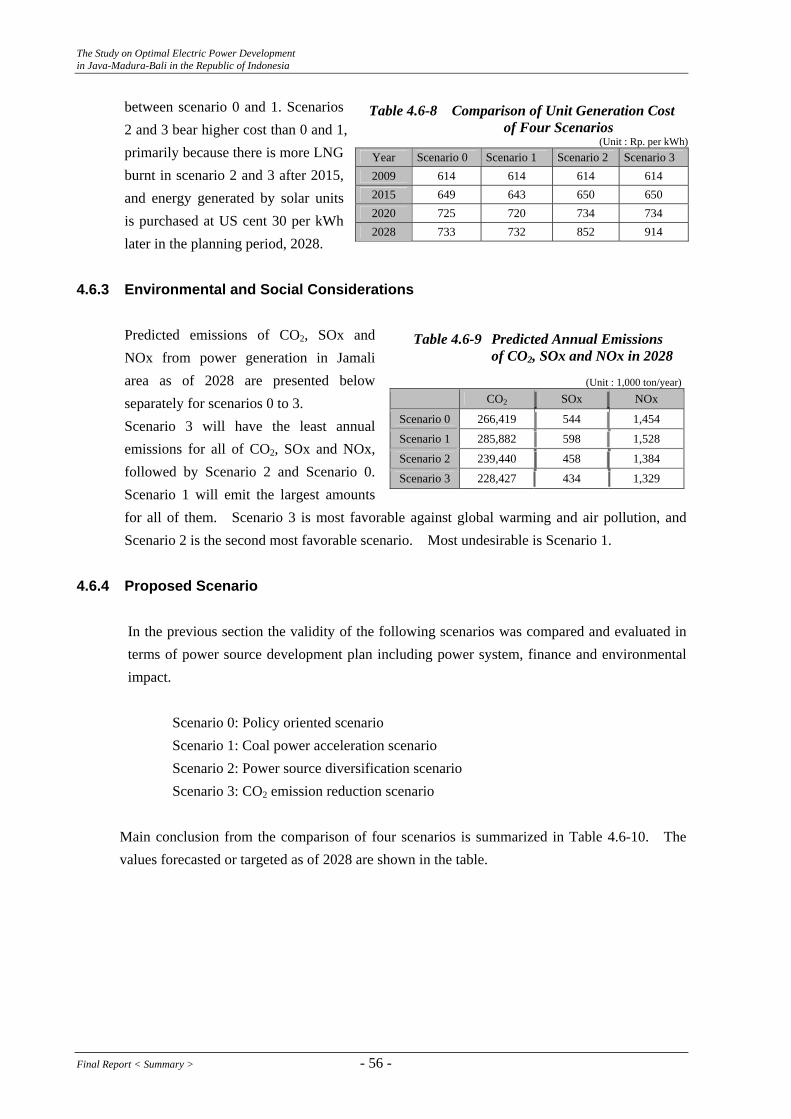
The Study on Optimal Electric Power Development in Java-Madura-Bali in the Republic of Indonesia
between scenario 0 and 1. Scenarios 2 and 3 bear higher cost than 0 and 1, primarily because there is more LNG burnt in scenario 2 and 3 after 2015, and energy generated by solar units is purchased at US cent 30 per kWh later in the planning period, 2028.
Table 4.6-8 Comparison of Unit Generation Cost of Four Scenarios
(Unit : Rp. per kWh)Year Scenario 0 Scenario 1 Scenario 2 Scenario 3 2009 614 614 614 614 2015 649 643 650 650 2020 725 720 734 734 2028 733 732 852 914
4.6.3 Environmental and Social Considerations
Predicted emissions of CO2, SOx and NOx from power generation in Jamali area as of 2028 are presented below separately for scenarios 0 to 3. Scenario 3 will have the least annual emissions for all of CO2, SOx and NOx, followed by Scenario 2 and Scenario 0. Scenario 1 will emit the largest amounts for all of them. Scenario 3 is most favorable against global warming and air pollution, and Scenario 2 is the second most favorable scenario. Most undesirable is Scenario 1.
Table 4.6-9 Predicted Annual Emissions of CO2, SOx and NOx in 2028
(Unit : 1,000 ton/year)
CO2 SOx NOx
Scenario 0 266,419 544 1,454
Scenario 1 285,882 598 1,528
Scenario 2 239,440 458 1,384
Scenario 3 228,427 434 1,329
4.6.4 Proposed Scenario
In the previous section the validity of the following scenarios was compared and evaluated in terms of power source development plan including power system, finance and environmental impact.
Scenario 0: Policy oriented scenario Scenario 1: Coal power acceleration scenario Scenario 2: Power source diversification scenario Scenario 3: CO2 emission reduction scenario
Main conclusion from the comparison of four scenarios is summarized in Table 4.6-10. The values forecasted or targeted as of 2028 are shown in the table.
Final Report < Summary > - 56 -
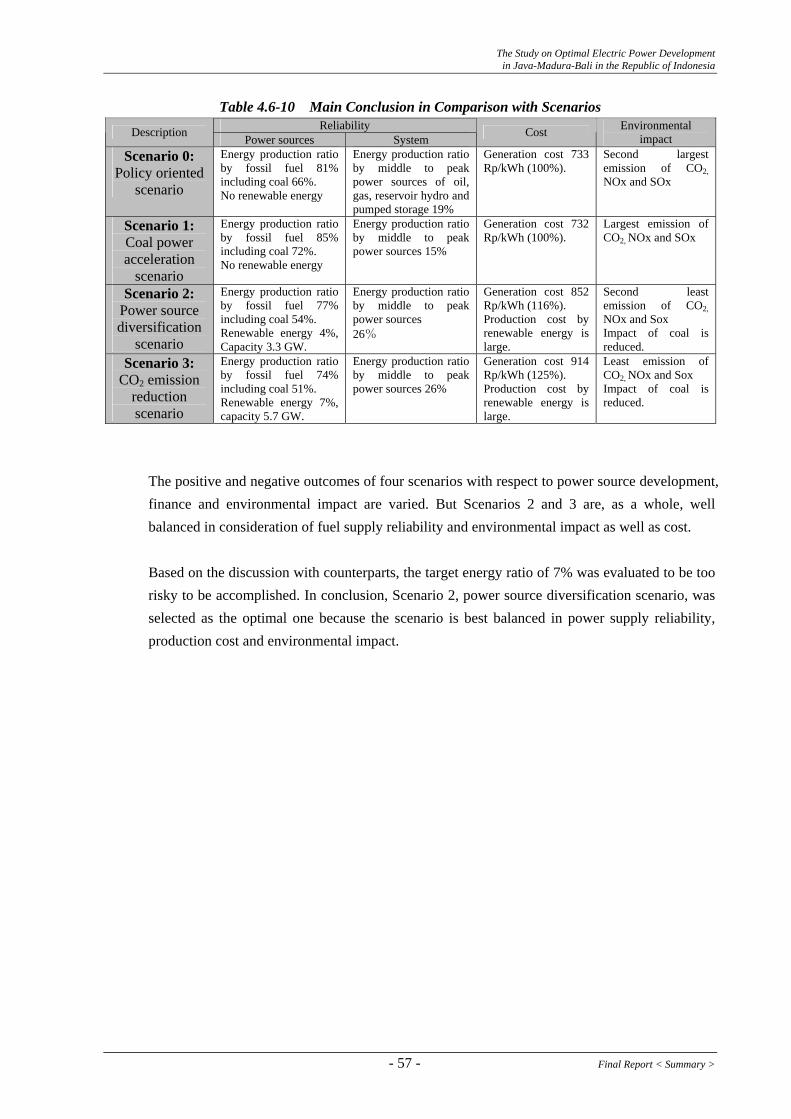
The Study on Optimal Electric Power Development in Java-Madura-Bali in the Republic of Indonesia
Table 4.6-10 Main Conclusion in Comparison with Scenarios Reliability Description Power sources System Cost Environmental
impact Scenario 0:
Policy oriented scenario
Energy production ratio by fossil fuel 81% including coal 66%. No renewable energy
Energy production ratio by middle to peak power sources of oil, gas, reservoir hydro and pumped storage 19%
Generation cost 733 Rp/kWh (100%).
Second largest emission of CO2, NOx and SOx
Scenario 1: Coal power acceleration
scenario
Energy production ratio by fossil fuel 85% including coal 72%. No renewable energy
Energy production ratio by middle to peak power sources 15%
Generation cost 732 Rp/kWh (100%).
Largest emission of CO2, NOx and SOx
Scenario 2: Power source diversification
scenario
Energy production ratio by fossil fuel 77% including coal 54%. Renewable energy 4%, Capacity 3.3 GW.
Energy production ratio by middle to peak power sources 26%
Generation cost 852 Rp/kWh (116%). Production cost by renewable energy is large.
Second least emission of CO2, NOx and Sox Impact of coal is reduced.
Scenario 3: CO2 emission
reduction scenario
Energy production ratio by fossil fuel 74% including coal 51%. Renewable energy 7%, capacity 5.7 GW.
Energy production ratio by middle to peak power sources 26%
Generation cost 914 Rp/kWh (125%). Production cost by renewable energy is large.
Least emission of CO2, NOx and Sox Impact of coal is reduced.
The positive and negative outcomes of four scenarios with respect to power source development, finance and environmental impact are varied. But Scenarios 2 and 3 are, as a whole, well balanced in consideration of fuel supply reliability and environmental impact as well as cost. Based on the discussion with counterparts, the target energy ratio of 7% was evaluated to be too risky to be accomplished. In conclusion, Scenario 2, power source diversification scenario, was selected as the optimal one because the scenario is best balanced in power supply reliability, production cost and environmental impact.
- 57 - Final Report < Summary >

The Study on Optimal Electric Power Development in Java-Madura-Bali in the Republic of Indonesia
5. OPTIMAL POWER DEVELOPMENT PLAN 5.1. Optimal Power Source Development Plan 5.1.1 Optimal Power Source Development Plan and its Salient Feature
As discussed in Section 4.6.4, Scenario 2, Diversification of Power Sources, is selected as the optimal power source development plan for Jamali. Figure 5.1-1 shows primary energy component of generated energy in major countries in 2004. Figure 5.1-1 also includes Jamali 2009 and 2028 for reference.
69.3%
54.1%
77.7%
69.1%
50.1%
50.0%
39.6%
38.6%
33.8%
27.2%
17.3%
17.2%
5.0%
2.7%
19.3%
21.0%
0.9%
9.5%
17.5%
10.0%
19.5%
16.1%
40.3%
22.6%
45.2%
5.4%
3.2%
5.0%
4.8%
3.3%
15.8%
12.7%
7.1%
4.5%
16.5%
1.6%
1.9%
9.5%
19.1%
57.0%
11.3%
82.8%
0% 10% 20% 30% 40% 50% 60% 70% 80% 90% 100%
Jamali 2009
Jamali 2028
China
India
USA
Germany
Italy
Korea
England
Japan
Russia
Canada
France
Brazil
Coal
Oil
N.Gas
Nuclear
Hydro
Others
Source : IEA Electricity Information 2006 Edition
Fig.5.1-1 Generation Component for Main Countries (2004)
5.1.2 Towards Implementation of the Optimal Power Source Development
(1) Coal-fired Thermal Plants
1) Preparation of candidate sites
Coal-fired thermal plants will play a dominant role in the future power source development in Jamali even in the power sources diversification scenario. The additional capacity excluding the fast track program 6,900 MW will be 29,000 MW. If the unit capacity of new coal-fired thermal plant is assumed 1,000 MW, twenty-nine (29) project sites are required. Inventory of candidate sites with the possibility of land acquisition should be prepared as soon as possible.
Final Report < Summary > - 58 -
The Study on Optimal Electric Power Development in Java-Madura-Bali in the Republic of Indonesia
2) Introduction of Supercritical coal-fired thermal plant
Currently, existing coal-fired thermal plants are operated at base load pattern. However, operation pattern of coal-fired thermal plants in the future are expected to cover not only base load but also middle load due to the introduction of a lot of geothermal plants and nuclear power plants, which are to be operated at full base load. The current subcritical coal-fired thermal plant can be operated at middle load pattern. However partial operation of subcritical thermal plants cause less thermal efficiency and offer with stable operation within the range of 50 to 100 % maximum continuous rating (MCR) approximately. On the other hand, supercritical thermal plants offer with stable operation within the range of 35 to 100%12 MCMR approximately and high thermal efficiency of more than 40% in comparison with 30% ~ 37% of the PJB Paiton and IP Suralaya thermal plants. Higher thermal efficiency means less fuel consumption and less air pollution emission. Based on the above reasons, introduction of supercritical coal-fired thermal plants with proven technology is recommended.
3) Introduction of clean coal technology
(a) FGD and low NOx burners Except the introduction of supercritical coal-fired thermal plants, introduction of clean coal technology such as FGD (flue gas desulphurization) equipment and low NOx burners should be introduced to avoid the acceleration of air pollution in Jamali.
(b) IGCC (Integrated Gasification Combined Cycle) IGCC is also one of the latest clean coal technologies. High thermal efficiency of 40 % or more is expected and fuel flexibility is also expected because IGCC fires gas converted from coal.
4) Utilization of Low Rank Coal (LRC)
As mentioned in Section 4.1.3, about 80% of the proven reserves are the middle and low rank coal. Utilization of low rank coal seems to be one of the key issues for not only PLN but also the Indonesian Government.
In order to utilize low rank coal, the following measures are proposed;
(a) Developing coal-fired thermal plants at mine-mouth in Kalimantan and Sumatra, and using low rank coal as fuel because LRC is not suitable for storage/transport for long time due to its more water content and more active oxidizing substances as mentioned in Section 4.1.3.
(b) Using low rank coal by mixture with fuel coal, as being mixed in Suralaya thermal plant and/or using LRC in the form of gasification like IGCC.
12 Source: “Latest Experience of Coal Fired Supercritical Sliding Pressure Operation Boiler and Application for Overseas Utility”,
Babcok-Hitachi
- 59 - Final Report < Summary >
The Study on Optimal Electric Power Development in Java-Madura-Bali in the Republic of Indonesia
(c) Dismantling HSD and MFO-fired thermal plants in outer islands, and constructing LRC-fired coal thermal plants in terms of not only utilization of LRC but also saving of operation cost because fuel price of LRC is far less than HSD and MFO prices at the moment.
(2) Gas-fired Thermal Power Plant
Study on the introduction of CNG (Compressed Natural Gas) System is recommended as proposed in Chapter 4. CNG System is expected to allow gas-fired thermal power plants more flexible operation (such as peak pattern operation) by storing gas at power stations.
(3) Geothermal Plants
1) PLN Participation
According to the optimal power source development, about 2,600 MW of geothermal plants are to be developed from 2010 to 2028 and most of them are presumably to be developed by IPP scheme. To promote the IPP development, MEMR announced the “Ministerial Regulation No.14/2008” as mentioned before.
At the moment, the relevant provincial government13 executes PQ/Bid evaluation of the prospective developers. PLN is formally involved in the PPA negotiation stage and onwards. There is a concern that the capability of provincial government to execute technical evaluation of bidders may not be sufficient. In terms of proper development of geothermal plants, the central government, with a help from PLN if necessary, should prepare the evaluation criteria to be adopted by local governments.
2) Risk Reduction
A preliminary FS level study for potential sites prior to bidding is desirable to lessen the risk burden of developers.
(4) Java-Sumatra Interconnection
Basic concept of Java-Sumatra Interconnection is to develop IPP coal-fired thermal plants at mine-mouth in South Sumatra and to deliver surplus power of 3,000 MW by HVDC (High Voltage Direct Current) to the Jamali system which is under tight power balance condition.
Java-Sumatra Interconnection seems to have the following advantages;
(a) No transportation of coal. This means stable power supply will be available because coal transportation by ships is sometimes interrupted by weather condition.
13 A part (2.5%) of electricity sale is paid to the relevant provincial government as mentioned in 2.2.2.
Final Report < Summary > - 60 -
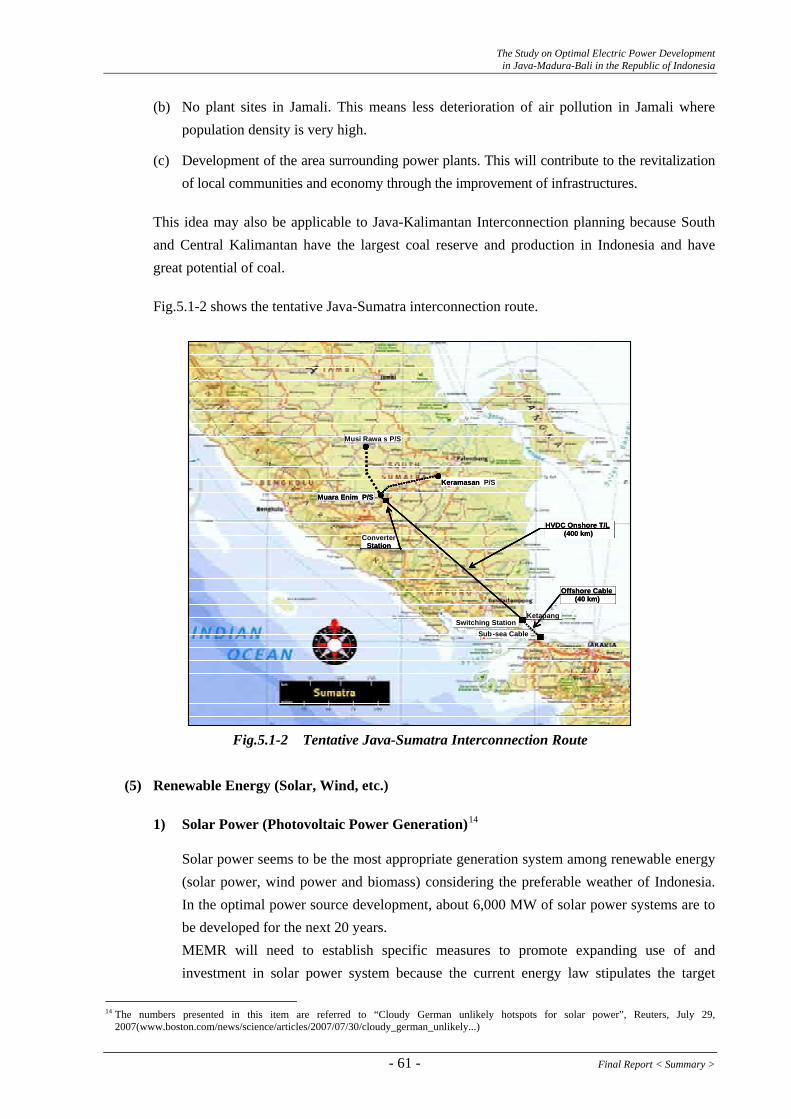
The Study on Optimal Electric Power Development in Java-Madura-Bali in the Republic of Indonesia
(b) No plant sites in Jamali. This means less deterioration of air pollution in Jamali where population density is very high.
(c) Development of the area surrounding power plants. This will contribute to the revitalization of local communities and economy through the improvement of infrastructures.
This idea may also be applicable to Java-Kalimantan Interconnection planning because South and Central Kalimantan have the largest coal reserve and production in Indonesia and have great potential of coal.
Fig.5.1-2 shows the tentative Java-Sumatra interconnection route.
Musi Rawa s P/S
Muara Enim P/S
Keramasan P/S
Converter Station
HVDC Onshore T/L(400 km)
Offshore Cable(40 km)
-
KetapangSwitching Station
Sub sea Cable
Muara Enim P/S
Keramasan
Station
HVDC Onshore T/L(400 km)
Offshore Cable(40 km)
Musi Rawa s P/S
Muara Enim P/S
Keramasan P/S
Converter Station
HVDC Onshore T/L(400 km)
Offshore Cable(40 km)
-
KetapangSwitching Station
Sub sea Cable
Muara Enim P/S
Keramasan
Station
HVDC Onshore T/L(400 km)
Offshore Cable(40 km)
Musi Rawa s P/S
Muara Enim P/S
Keramasan P/S
Converter Station
HVDC Onshore T/L(400 km)
Offshore Cable(40 km)
-
KetapangSwitching Station
Sub sea Cable
Muara Enim P/S
Keramasan
Station
HVDC Onshore T/L(400 km)
Offshore Cable(40 km)
Fig.5.1-2 Tentative Java-Sumatra Interconnection Route
(5) Renewable Energy (Solar, Wind, etc.)
1) Solar Power (Photovoltaic Power Generation)14
Solar power seems to be the most appropriate generation system among renewable energy (solar power, wind power and biomass) considering the preferable weather of Indonesia. In the optimal power source development, about 6,000 MW of solar power systems are to be developed for the next 20 years. MEMR will need to establish specific measures to promote expanding use of and investment in solar power system because the current energy law stipulates the target
14 The numbers presented in this item are referred to “Cloudy German unlikely hotspots for solar power”, Reuters, July 29,
2007(www.boston.com/news/science/articles/2007/07/30/cloudy_german_unlikely...)
- 61 - Final Report < Summary >

The Study on Optimal Electric Power Development in Java-Madura-Bali in the Republic of Indonesia
primary energy mix which, however, does not accompany any specific measures for realization.
2) Wind Power
Wind power system is economical only in locations where average wind velocity is 6 m/s or more at 30 m above the ground level. Wind power totaling 0.5 MW15 in capacity has been installed in Indonesia so far. In the optimal power source development, about 3,200 MW of wind powers are assumed to be developed for the next 20 years. Installation of wind power sometimes accompanies environmental issues as listed below; (a) Installation in and around national parks and conservation forest areas posing
concerns for landscape (b) Radio disturbance caused by metal rotors (c) Threats of rotors hitting birds
MEMR is recommended to develop an Environmental Impact Assessment guidelines or criteria in cooperation with MOE.
(6) Utilization of JICA Reports
JICA has a library and most of JICA reports can be accessed or downloaded from the JICA Library Website. The JICA Library address in English is “http://lvzopac.jica.go.jp/libary/indexeng.html”. Utilization of the JICA Library and its archives is strongly recommended especially for PLN and MEMR local offices16 which may have infrequent access to the relevant JICA reports, not only as references for projects but also for capacity building.
5.1.3 Study on the Leading Power Projects in Indonesia
The validity of the implementation of a nuclear power plant and a pumped storage power plant, which are the leading, first-of-a-kind, power projects in Indonesia, is studied in this section.
(1) Nuclear Power Plant
The first unit of nuclear power plant 1,000 MW is scheduled to be put into the system in 2018 and the total capacity of 5,000 MW by 2028 in the optimal power source development plan. Since the development of nuclear power plants is an unprecedented challenge for Indonesia, the schedule allows for a four year period until 2012 to address key issues, such as safety and environmental assessments, and to develop consensus over the development itself, leaving six years for the
15 Source; Presentation material “Promotion of Renewable Energy, Energy Efficiency and Greenhouse Gas Abatement in Indonesia”, at
Manila 5-8 October 2004 by MEMR 16 P3B Sumatra responsible for power development planning in Sumatra does not know the existence of “Master Plan Study for Geothermal
Power Development in the Republic of Indonesia “
Final Report < Summary > - 62 -

The Study on Optimal Electric Power Development in Java-Madura-Bali in the Republic of Indonesia
construction of the first unit. Considering the current progress17 toward the implementation, the scheduling of implementation of nuclear power plants is full of uncertainties.
1) Power source development plan without nuclear power plants
Influence of delay or postponement of the nuclear power program on power source development plan is studied by the following case.
Case without nuclear power plant (W/O Nuclear): Additional coal-fired thermal plants with unit capacity of 1,000 MW will substitute for nuclear power plants with the same capacity. Reserve margin of 30 % will be kept after 2018.
(a) Net Present Value (NPV) of Objective Function Table 5.1-1 shows the cumulative cost of power source development plan until 2028 converted to 2009 price with discount rate of 12 %. As shown in the table, NPV of the plan will be increased by 1.3 % for w/o Nuclear.
Table 5.1-1 Cumulative Objective Function for With and Without Nuclear
Case Investment Cost (Million US$)
Salvage Value (Million US$)
Operation Cost(Million US$)
Objective Function (Million US$) Ratio
With Nuclear 26,429 -9,505 73,001 89,925 1.000
W/O Nuclear 25,091 -8,834 74,857 91,114 1.013
(b) CO2, NOx and SOx Emission
Table 5.1-5 shows CO2, NOx and SOx emission in 2028. As shown in the table, CO2 emission will be increased by 30.2 Million ton or by 12.6 % for W/O Nuclear case mainly due to increase of generated energy by coal-fired thermal plants. NOx and SOx emission for W/O Nuclear will keep the almost same emission level as those of “With Nuclear”.
Table 5.1-2 CO2, NOx and SOx Emission in 2028
(Million ton)
Case CO2 NOx SOx With Nuclear 239.4 1.4 0.5 W/O Nuclear 269.6 1.5 0.5
(c) Conclusion Increase of total cost, fuel consumption and CO2 emission are confirmed by WASP simulation in the case of “Without Nuclear Plants”.
(2) Pumped Storage Power Plant
Table 5.1-3 shows the generation energy and capacity factor of pumped storage power plant(s) in the case of original coal price of 80 $/ton. Pumped storage power plants will be operated at
17 The national team has not yet established and the establishment are delayed for 1 ~ 2 years against the schedule.
- 63 - Final Report < Summary >
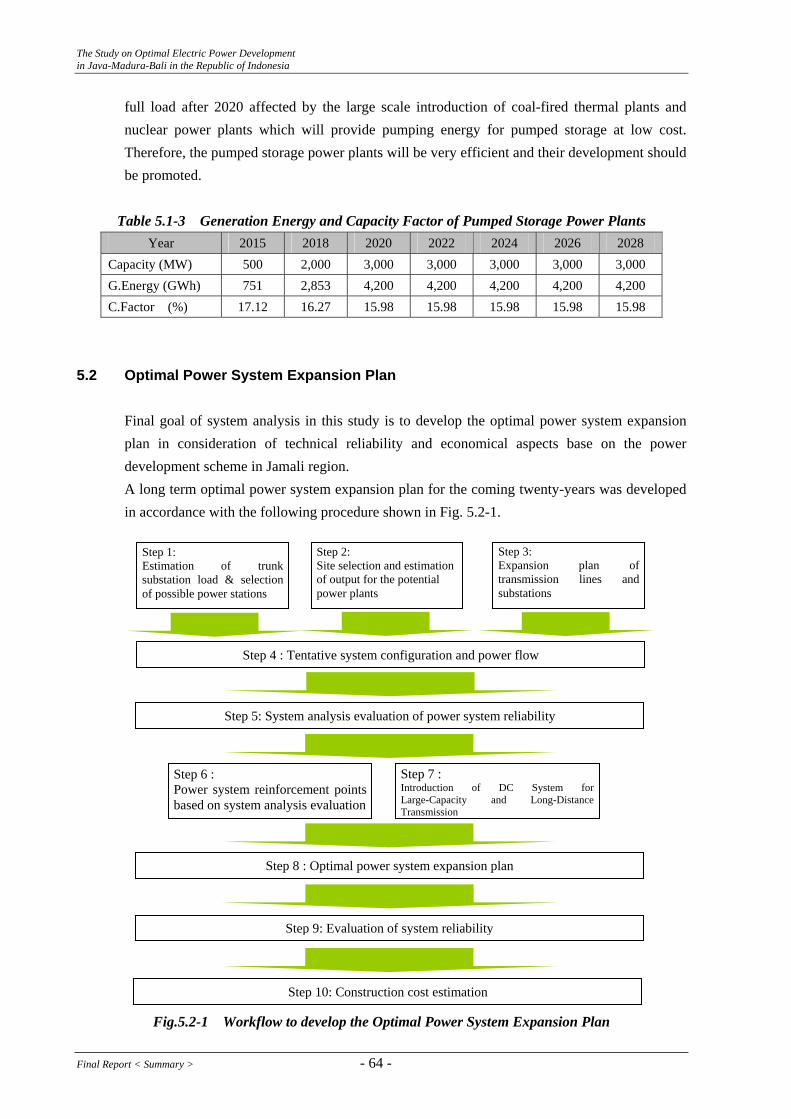
The Study on Optimal Electric Power Development in Java-Madura-Bali in the Republic of Indonesia
full load after 2020 affected by the large scale introduction of coal-fired thermal plants and nuclear power plants which will provide pumping energy for pumped storage at low cost. Therefore, the pumped storage power plants will be very efficient and their development should be promoted.
Table 5.1-3 Generation Energy and Capacity Factor of Pumped Storage Power Plants
Year 2015 2018 2020 2022 2024 2026 2028 Capacity (MW) 500 2,000 3,000 3,000 3,000 3,000 3,000 G.Energy (GWh) 751 2,853 4,200 4,200 4,200 4,200 4,200 C.Factor (%) 17.12 16.27 15.98 15.98 15.98 15.98 15.98
5.2 Optimal Power System Expansion Plan Final goal of system analysis in this study is to develop the optimal power system expansion plan in consideration of technical reliability and economical aspects base on the power development scheme in Jamali region. A long term optimal power system expansion plan for the coming twenty-years was developed in accordance with the following procedure shown in Fig. 5.2-1.
Fig.5.2-1 Workflow to develop the Optimal Power System Expansion Plan
Step 1: Estimation of trunk substation load & selection of possible power stations
Step 2: Site selection and estimation of output for the potential power plants
Step 3: Expansion plan of transmission lines and substations
Step 4 : Tentative system configuration and power flow
Step 5: System analysis evaluation of power system reliability
Step 6 : Power system reinforcement points based on system analysis evaluation
Step 7 : Introduction of DC System for Large-Capacity and Long-Distance Transmission
Step 8 : Optimal power system expansion plan
Step 9: Evaluation of system reliability
Step 10: Construction cost estimation
Final Report < Summary > - 64 -
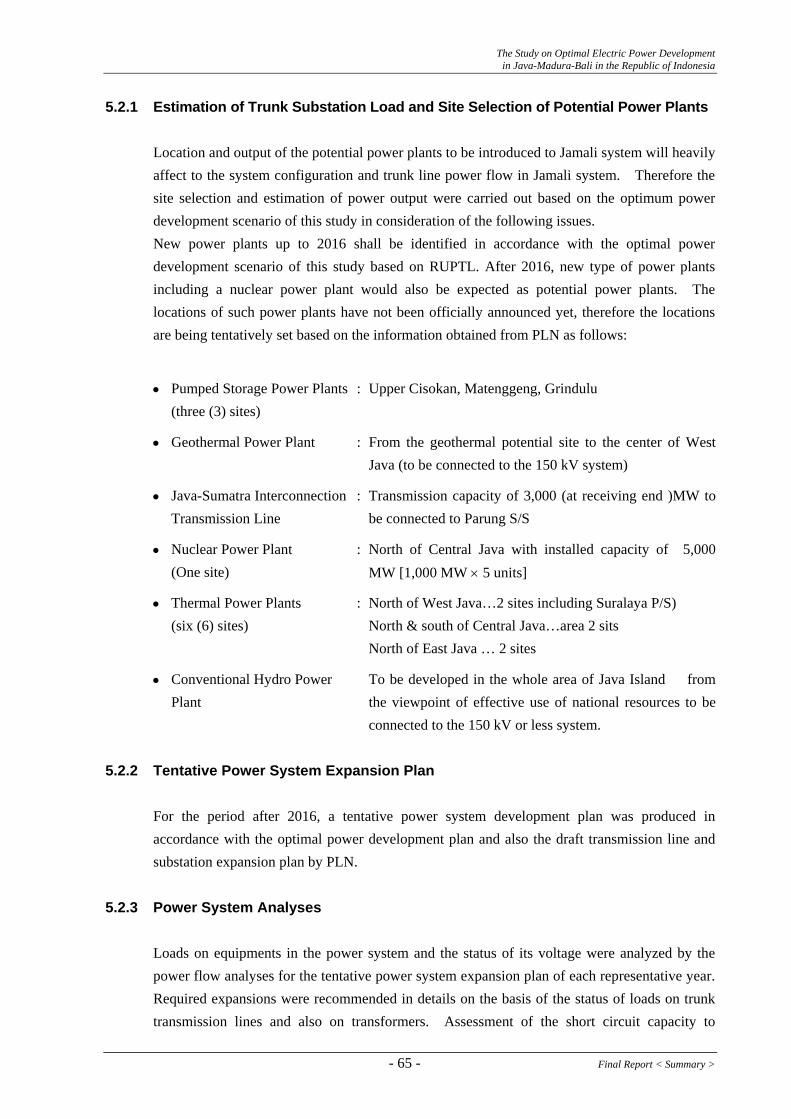
The Study on Optimal Electric Power Development in Java-Madura-Bali in the Republic of Indonesia
5.2.1 Estimation of Trunk Substation Load and Site Selection of Potential Power Plants Location and output of the potential power plants to be introduced to Jamali system will heavily affect to the system configuration and trunk line power flow in Jamali system. Therefore the site selection and estimation of power output were carried out based on the optimum power development scenario of this study in consideration of the following issues. New power plants up to 2016 shall be identified in accordance with the optimal power development scenario of this study based on RUPTL. After 2016, new type of power plants including a nuclear power plant would also be expected as potential power plants. The locations of such power plants have not been officially announced yet, therefore the locations are being tentatively set based on the information obtained from PLN as follows:
Pumped Storage Power Plants (three (3) sites)
: Upper Cisokan, Matenggeng, Grindulu •
Geothermal Power Plant : From the geothermal potential site to the center of West Java (to be connected to the 150 kV system)
•
Java-Sumatra Interconnection Transmission Line
: Transmission capacity of 3,000 (at receiving end )MW to be connected to Parung S/S
•
Nuclear Power Plant (One site)
: North of Central Java with installed capacity of 5,000 MW [1,000 MW × 5 units]
•
Thermal Power Plants (six (6) sites)
: North of West Java…2 sites including Suralaya P/S) North & south of Central Java…area 2 sits North of East Java … 2 sites
•
Conventional Hydro Power Plant
To be developed in the whole area of Java Island from the viewpoint of effective use of national resources to be connected to the 150 kV or less system.
•
5.2.2 Tentative Power System Expansion Plan
For the period after 2016, a tentative power system development plan was produced in accordance with the optimal power development plan and also the draft transmission line and substation expansion plan by PLN.
5.2.3 Power System Analyses Loads on equipments in the power system and the status of its voltage were analyzed by the power flow analyses for the tentative power system expansion plan of each representative year. Required expansions were recommended in details on the basis of the status of loads on trunk transmission lines and also on transformers. Assessment of the short circuit capacity to
- 65 - Final Report < Summary >
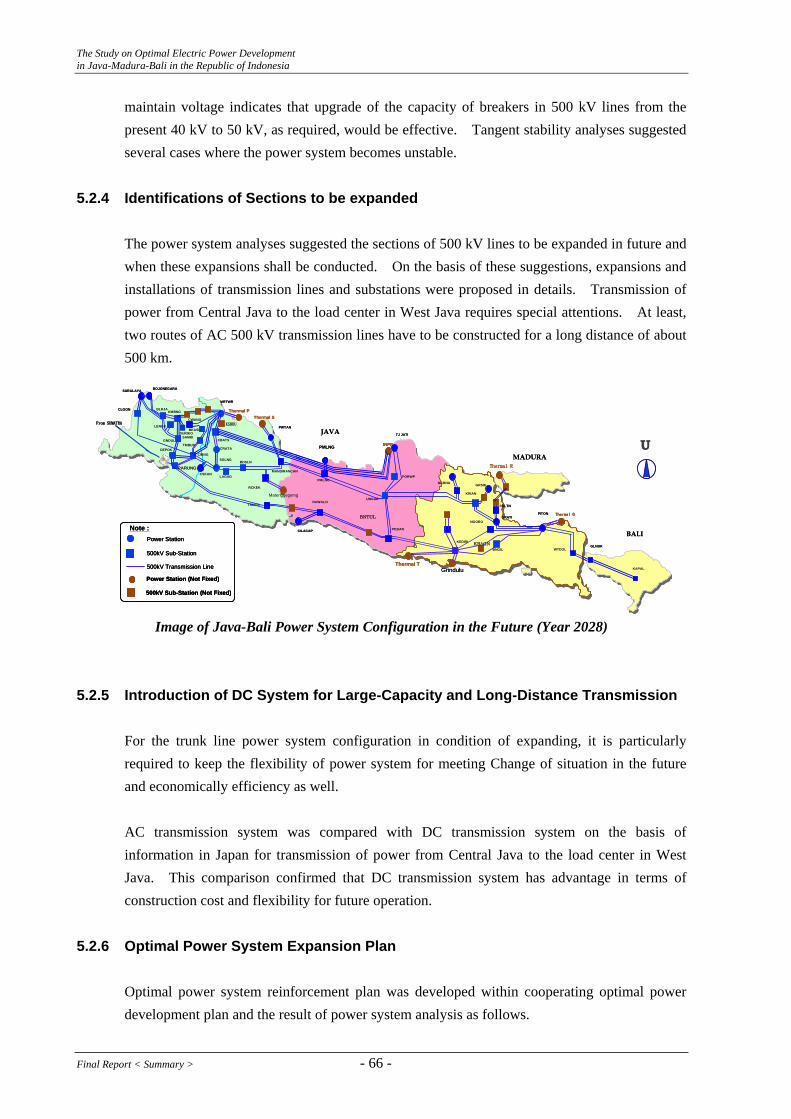
The Study on Optimal Electric Power Development in Java-Madura-Bali in the Republic of Indonesia
maintain voltage indicates that upgrade of the capacity of breakers in 500 kV lines from the present 40 kV to 50 kV, as required, would be effective. Tangent stability analyses suggested several cases where the power system becomes unstable.
5.2.4 Identifications of Sections to be expanded
The power system analyses suggested the sections of 500 kV lines to be expanded in future and when these expansions shall be conducted. On the basis of these suggestions, expansions and installations of transmission lines and substations were proposed in details. Transmission of power from Central Java to the load center in West Java requires special attentions. At least, two routes of AC 500 kV transmission lines have to be constructed for a long distance of about 500 km.
JAVA
CLGON
SURALAYA
KMBNG
BKASI
GNDUL
CWANG
CBATS
CIBNG
CRATA
SGLNGBDSLN
MANDIRANCAN
PEDAN
UNGARKRIAN
GRSIK
SBLTN
PITON
KEDIRI
MADURA
BALI
DEPOK
MRTWR
TJ JATI
NGBNG
GRATI
TSMYA
UTMBUN
BOJONEGARA
CSKAN
CILACAP
RCKEK
PWTAN
PMLNG
BNGIL WTDOLGLNUK
KAPAL
NGORO
RAWALO
LENGK
BLRJA
Note :
DURIKOSAMBI
KSBRU
BNTUL
KBAGN
Thermal R
Thermal Q
Thermal T
Thermal PThermal S
INPP
500kV Sub-Station
500kV Transmission Line
Power Station
Power Station (Not Fixed)
500kV Sub-Station (Not Fixed)
PARUNG
PMLNG
From SUMATRA
LAGAD PORWP
Matenggegemg
Grindulu
JAVA
CLGON
SURALAYA
KMBNG
BKASI
GNDUL
CWANG
CBATS
CIBNG
CRATA
SGLNGBDSLN
MANDIRANCAN
PEDAN
UNGARKRIAN
GRSIK
SBLTN
PITON
KEDIRI
MADURA
BALI
DEPOK
MRTWR
TJ JATI
NGBNG
GRATI
TSMYA
UTMBUN
BOJONEGARA
CSKAN
CILACAP
RCKEK
PWTAN
PMLNG
BNGIL WTDOLGLNUK
KAPAL
NGORO
RAWALO
LENGK
BLRJA
Note :
DURIKOSAMBI
KSBRU
BNTUL
KBAGN
Thermal R
Thermal Q
Thermal T
Thermal PThermal S
INPP
500kV Sub-Station
500kV Transmission Line
Power Station
Power Station (Not Fixed)
500kV Sub-Station (Not Fixed)
500kV Sub-Station
500kV Transmission Line
Power Station
Power Station (Not Fixed)
500kV Sub-Station (Not Fixed)
PARUNG
PMLNG
From SUMATRA
LAGAD PORWP
Matenggegemg
Grindulu
Image of Java-Bali Power System Configuration in the Future (Year 2028)
5.2.5 Introduction of DC System for Large-Capacity and Long-Distance Transmission For the trunk line power system configuration in condition of expanding, it is particularly required to keep the flexibility of power system for meeting Change of situation in the future and economically efficiency as well. AC transmission system was compared with DC transmission system on the basis of information in Japan for transmission of power from Central Java to the load center in West Java. This comparison confirmed that DC transmission system has advantage in terms of construction cost and flexibility for future operation.
5.2.6 Optimal Power System Expansion Plan
Optimal power system reinforcement plan was developed within cooperating optimal power development plan and the result of power system analysis as follows.
Final Report < Summary > - 66 -
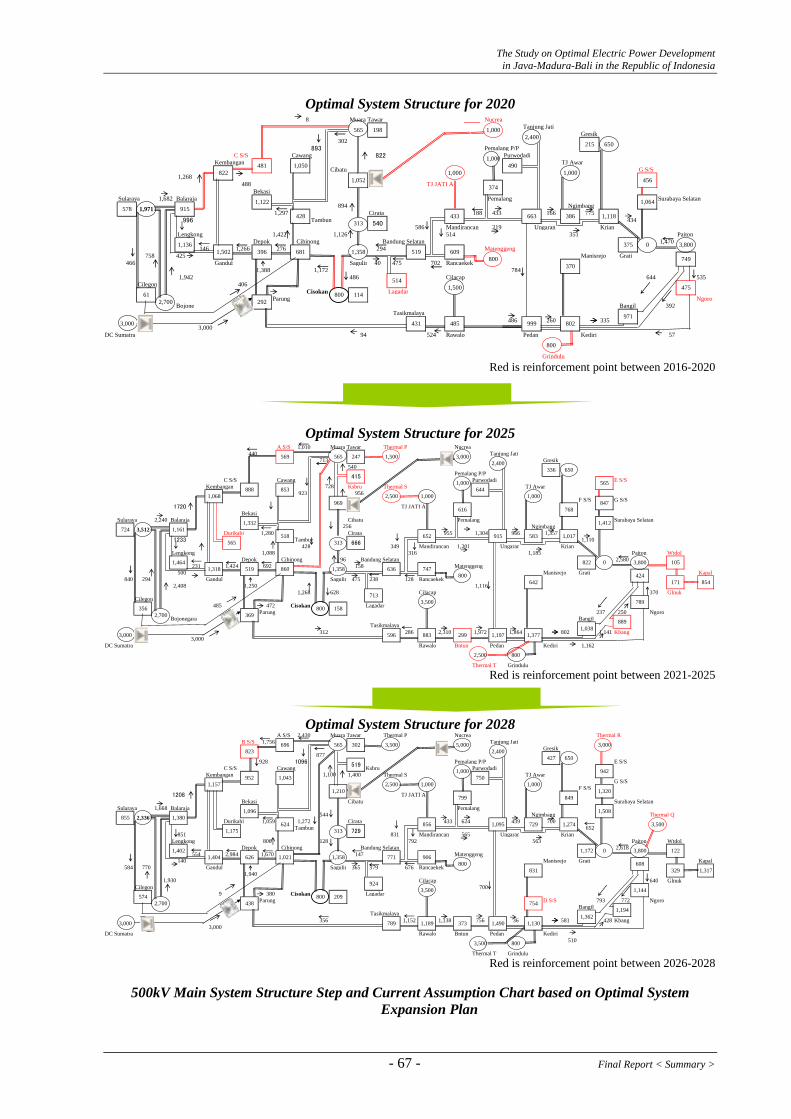
The Study on Optimal Electric Power Development in Java-Madura-Bali in the Republic of Indonesia
Optimal System Structure for 2020 8 Muara Tawar Nucrea
Tanjung JatiGresik
302893 Pemalang P/P
Cawang 822 PurwodadiKembangan TJ Awar
Cibatu1,268
488Bekasi
Sularaya 1,682 Balaraja Pemalang Surabaya Selatan894
C S/S
G S/S
TJ JATI A
Ngimbang1,297 Cirata 188 433 166 775
996 Tambun 434586 Mandirancan 219 Ungaran Krian
Lengkong 1,422 1,126 514 351 PaitonDepok Cibinong Bandung Selatan 1,470
146 1,266 276 294758 425 Manisrejo Grati
466 Gandul Sa
Matenggeng
gulin 40 475 702 Rancaekek1,388 1,172 784
1,942 486 Cilacap 644 535Cilegon 406
Cisokan LagadarParung
BoNgoro
jone Bangil 392Tasikmalaya
486 260 3353,000
C Sumatra 94 524 Rawalo Pedan Kediri 57
578 1,971 915
8221,050 490
1,0001,052
374
1,000
215 650
1,000198565
1,000
2,400
313 540433
456
386 1,118
1,064
1,136 375 0 3,800609
749370
8001,502 396
47561 800 114
2,700 292
5141,500
3,000 431 485971
802999
800
481
428 663
1,122
681 1,358 519
Grindulu
D
Red is reinforcement point between 2016-2020
Optimal System Structure for 2025 A S/S Thermal P
E S/SKsbru Thermal S
1,010 Muara Tawar Nucrea440 Tanjung Jati
713 Gresik540
Pemalang P/PC S/S Cawang Purwodadi
Kembangan TJ Awar923 956
F S/S G S/S1720 TJ JATI A
BekasiSularaya 2,240 Balaraja Cibatu Pemalang Surabaya Selatan
NgimbangDurikabi 1,280 Cirata 955 1,304 966 1,357
1233 Tambun 1,110428 349 Mandirancan 1,201 Ungaran Krian
Lengkong 1,088 316 1,185 PaitonDepok Cibinong 96 Bandung Selatan 2,580
231 1,424 692 158 Matenggeng500 Manisrejo Grati
840 294 Gandul Sa
Wtdol
Kapalgulin 475 238 128 Rancaekek
2,408 1,250 1,1161,268 628 Cilacap 370
Cilegon485 472 Cisokan La
Glnuk
gadarParung 237 250 Ngoro
Bojonegara BangilTasikmalaya
312 286 2,310 1,972 1,864 802 1,1413,000
Kbang
C Sumatra Rawalo Pedan Kediri 1,162
2,400336
565644
650
569 565 247 1,500 3,000
616 768
4151,000
1,068 2,500 1,000 1,000969
888 853 728
847
1,332 1,412724 3,512 1,161 256
518 652 915 583
1,464 822 0 3,800
1,017565 313 666
1051,318 519 860 1,358 636 747
800 424171 854
7133,500 789
8891,038
1,377
642
356 800 1582,700 369
2,500 800
3,000 596 883 299 1,197
Bntun
Thermal T
D
Grindulu Red is reinforcement point between 2021-2025
Optimal System Structure for 2028 A S/S 2,430 Muara Tawar Thermal P Nucrea Thermal R
B S/S 1,756 Tanjung JatiGresik
877928 1096 Pemalang P/P E S/S
C S/S Cawang Ksbru PurwodadiKembangan 1,400 Thermal S TJ Awar
G S/SF S/S
1208 TJ JATI ABekasi Cibatu Surabaya Selatan
Sularaya 1,668 Balaraja Pemalang544 Ngimbang Thermal Q
Durikabi 1,059 1,272 Cirata 433 624 439 700Tambun 652
851 831 Mandirancan 565 Ungaran Krian Lengkong 806 128 792 563 Paiton Wtdol
Depok Cibinong Bandung Selatan 2,618554 2,984 1,670 147 Matenggeng
140 Manisrejo Grati Kapal584 770 Gandul Sagulin 365 579 676 Rancaekek
1,940Cilacap 640 Glnuk
Cilegon 7009 380 Cisokan Lagadar
Parung 793 772 NgoroBangil
Tasikmalaya356 1,152 1,138 756 36 581 428 Kbang
3,000
D S/S
C Sumatra Rawalo Bntun Pedan Kediri510
Therma
942
3,500 800
427
1,317
1,144
1221,172 3,800
608
1,320
650
0
329
3,500
1,194
729 1,274
831
754
2,336
1,1301,362
1,508
1,100
1,490
1,095
906
373
1,380
1,175
438
729
1,0211,402
3,000
855
1,000750
2,400
856
1,000
5,000
800
1,930 924
7711,404
209
3,000
5742,700
1,157
1,096
789
3,500
1,358626
800
1,043
1,189
313624
1,0002,5001,210
696
952
823
849799
565 3,500302
519
D
l T Grindulu Red is reinforcement point between 2026-2028
500kV Main System Structure Step and Current Assumption Chart based on Optimal System
Expansion Plan
- 67 - Final Report < Summary >
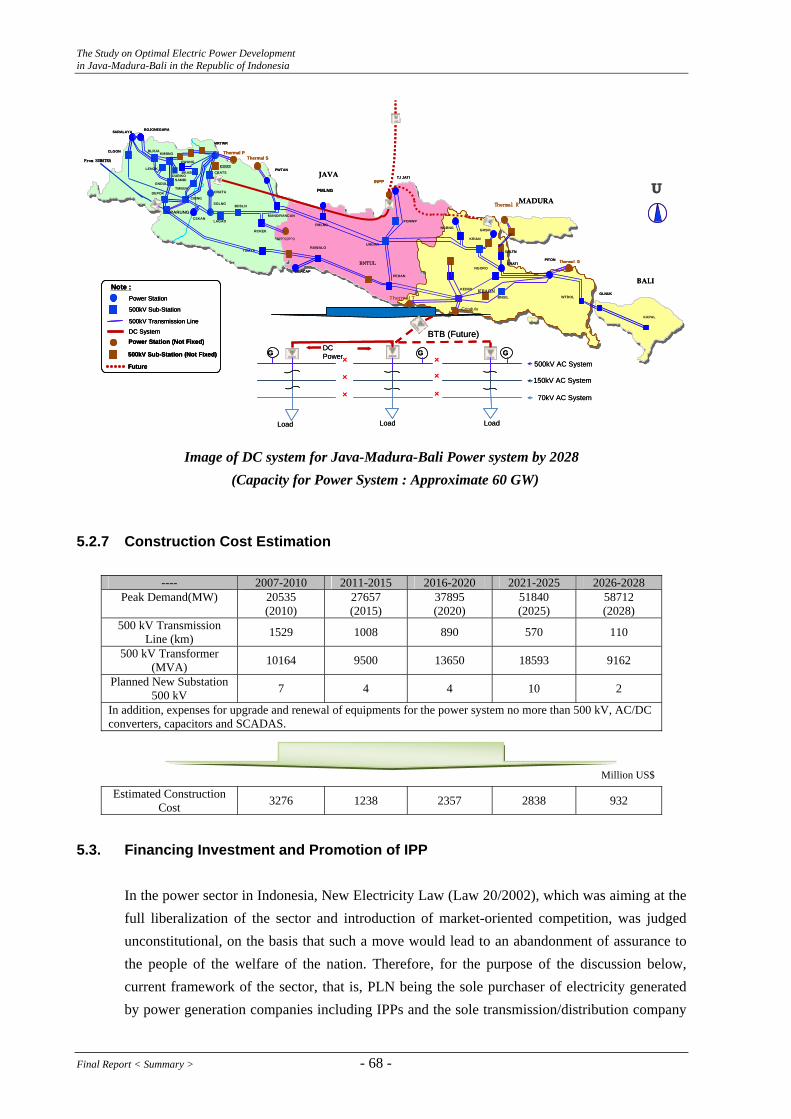
The Study on Optimal Electric Power Development in Java-Madura-Bali in the Republic of Indonesia
From SUMATRA
JAVA
CLGON
SURALAYA
KMBNG
BKASI
GNDUL
CWANG
CBATS
CIBNG
CRATA
SGLNG BDSLN
MANDIRANCAN
PEDAN
UNGARKRIAN
GRSIK
SBLTN
PITON
KEDIRI
MADURA
BALI
DEPOK
MRTWR
TJ JATI
NGBNG
GRATI
TSMYA
UTMBUN
BOJONEGARA
CSKAN
CILACAP
RCKEK
PWTAN
PMLNG
BNGIL WTDOLGLNUK
KAPAL
NGORO
RAWALO
LENGK
BLRJA
BTB (Future)DC Power
500kV AC System
150kV AC System
70kV AC System
LoadLoadLoad
×
×
×
G GG×
×
×
DURIKOSAMBI
KSBRU
BNTUL
KBAGN
Thermal R
Thermal Q
Thermal T
Thermal PThermal S
INPP
PARUNG
PMLNG
LAGAD PORWP
Matenggeng
Grindulu
500kV Transmission Line
DC System
Note :
500kV Sub-Station
Power Station
Power Station (Not Fixed)
500kV Sub-Station (Not Fixed)
Future
From SUMATRA
JAVA
CLGON
SURALAYA
KMBNG
BKASI
GNDUL
CWANG
CBATS
CIBNG
CRATA
SGLNG BDSLN
MANDIRANCAN
PEDAN
UNGARKRIAN
GRSIK
SBLTN
PITON
KEDIRI
MADURA
BALI
DEPOK
MRTWR
BOJONEGARA
TJ JATI
NGBNG
GRATI
TSMYA
UTMBUN
CSKAN
CILACAP
RCKEK
PWTAN
PMLNG
BNGIL WTDOLGLNUK
KAPAL
NGORO
RAWALO
LENGK
BLRJA
BTB (Future)DC Power
500kV AC System
150kV AC System
70kV AC System
LoadLoadLoad
×
×
×
G GG×
×
×
DURIKOSAMBI
KSBRU
BNTUL
KBAGN
Thermal R
Thermal Q
Thermal T
Thermal PThermal S
INPP
PMLNG
PARUNG
LAGAD PORWP
Matenggeng
Grindulu
500kV Transmission Line
Note :
DC System
500kV Sub-Station
Power Station
Power Station (Not Fixed)
500kV Sub-Station (Not Fixed)
Future
500kV Transmission Line
Note :Power Station
500kV Sub-Station
DC SystemPower Station (Not Fixed)
500kV Sub-Station (Not Fixed)
Future
Image of DC system for Java-Madura-Bali Power system by 2028 (Capacity for Power System : Approximate 60 GW)
5.2.7 Construction Cost Estimation
---- 2007-2010 2011-2015 2016-2020 2021-2025 2026-2028 Peak Demand(MW) 20535
(2010) 27657 (2015)
37895 (2020)
51840 (2025)
58712 (2028)
500 kV Transmission Line (km) 1529 1008 890 570 110
500 kV Transformer (MVA) 10164 9500 13650 18593 9162
Planned New Substation 500 kV 7 4 4 10 2
In addition, expenses for upgrade and renewal of equipments for the power system no more than 500 kV, AC/DC converters, capacitors and SCADAS.
Million US$
Estimated Construction Cost 3276 1238 2357 2838 932
5.3. Financing Investment and Promotion of IPP
In the power sector in Indonesia, New Electricity Law (Law 20/2002), which was aiming at the full liberalization of the sector and introduction of market-oriented competition, was judged unconstitutional, on the basis that such a move would lead to an abandonment of assurance to the people of the welfare of the nation. Therefore, for the purpose of the discussion below, current framework of the sector, that is, PLN being the sole purchaser of electricity generated by power generation companies including IPPs and the sole transmission/distribution company
Final Report < Summary > - 68 -
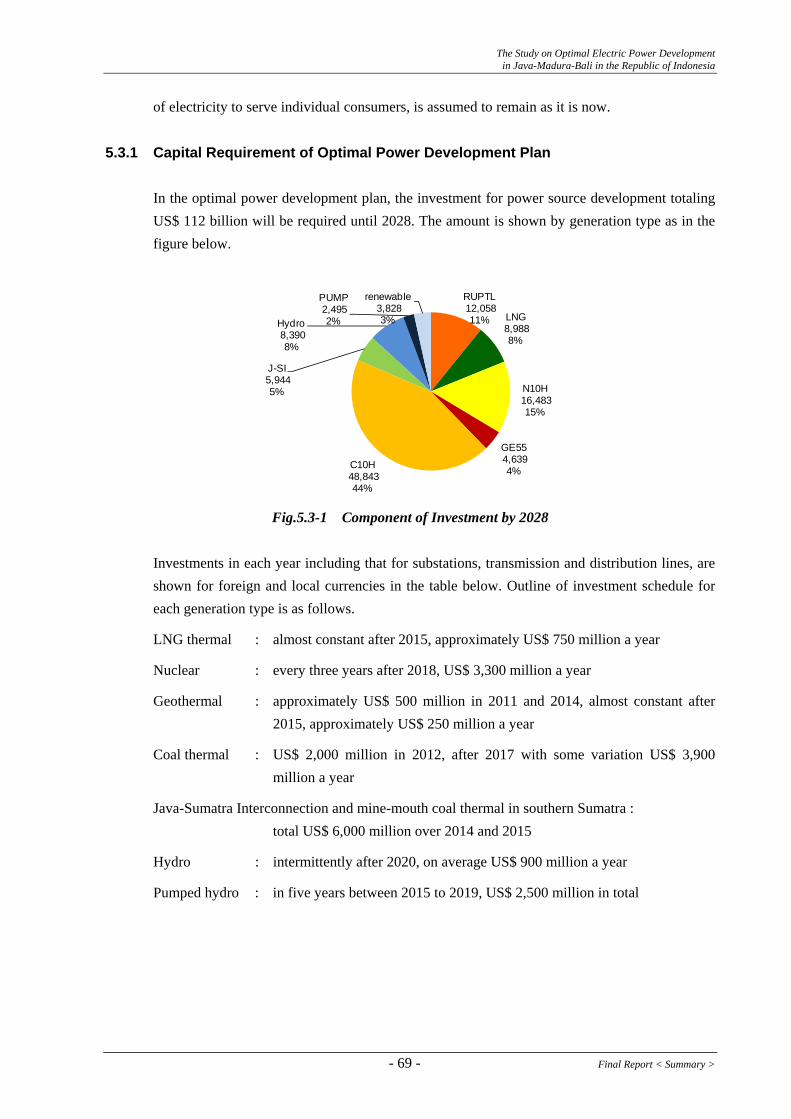
The Study on Optimal Electric Power Development in Java-Madura-Bali in the Republic of Indonesia
of electricity to serve individual consumers, is assumed to remain as it is now. 5.3.1 Capital Requirement of Optimal Power Development Plan
In the optimal power development plan, the investment for power source development totaling US$ 112 billion will be required until 2028. The amount is shown by generation type as in the figure below.
RUPTL12,058 11% LNG
8,988 8%
N10H16,483 15%
GE554,639 4%C10H
48,843 44%
J-SI5,944 5%
Hydro8,390 8%
PUMP2,495 2%
renewable3,828 3%
Fig.5.3-1 Component of Investment by 2028 Investments in each year including that for substations, transmission and distribution lines, are shown for foreign and local currencies in the table below. Outline of investment schedule for each generation type is as follows.
LNG thermal : almost constant after 2015, approximately US$ 750 million a year
Nuclear : every three years after 2018, US$ 3,300 million a year
Geothermal : approximately US$ 500 million in 2011 and 2014, almost constant after 2015, approximately US$ 250 million a year
Coal thermal : US$ 2,000 million in 2012, after 2017 with some variation US$ 3,900 million a year
Java-Sumatra Interconnection and mine-mouth coal thermal in southern Sumatra : total US$ 6,000 million over 2014 and 2015
Hydro : intermittently after 2020, on average US$ 900 million a year
Pumped hydro : in five years between 2015 to 2019, US$ 2,500 million in total
- 69 - Final Report < Summary >
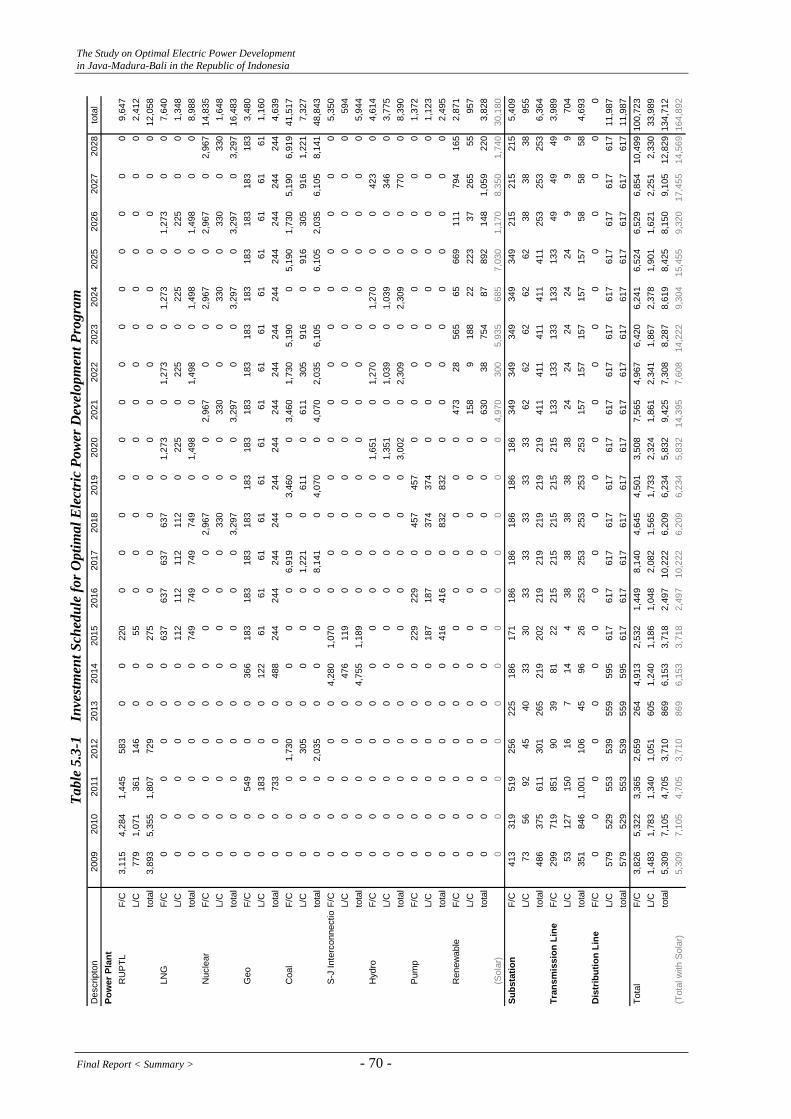
The Study on Optimal Electric Power Development in Java-Madura-Bali in the Republic of Indonesia
Des
crip
ton
2009
2010
2011
2012
2013
2014
2015
2016
2017
2018
2019
2020
2021
2022
2023
2024
2025
2026
2027
2028
tota
lPo
wer
Pla
ntR
UP
TLF/
C3,
115
4,28
41,
445
583
00
220
00
00
00
00
00
00
09,
647
L/C
779
1,07
136
114
60
055
00
00
00
00
00
00
02,
412
tota
l3,
893
5,35
51,
807
729
00
275
00
00
00
00
00
00
012
,058
LNG
F/C
00
00
00
637
637
637
637
01,
273
01,
273
01,
273
01,
273
00
7,64
0L/
C0
00
00
011
211
211
211
20
225
022
50
225
022
50
01,
348
tota
l0
00
00
074
974
974
974
90
1,49
80
1,49
80
1,49
80
1,49
80
08,
988
Nuc
lear
F/C
00
00
00
00
02,
967
00
2,96
70
02,
967
02,
967
02,
967
14,8
35L/
C0
00
00
00
00
330
00
330
00
330
033
00
330
1,64
8to
tal
00
00
00
00
03,
297
00
3,29
70
03,
297
03,
297
03,
297
16,4
83G
eoF/
C0
054
90
036
618
318
318
318
318
318
318
318
318
318
318
318
318
318
33,
480
L/C
00
183
00
122
6161
6161
6161
6161
6161
6161
6161
1,16
0to
tal
00
733
00
488
244
244
244
244
244
244
244
244
244
244
244
244
244
244
4,63
9C
oal
F/C
00
01,
730
00
00
6,91
90
3,46
00
3,46
01,
730
5,19
00
5,19
01,
730
5,19
06,
919
41,5
17L/
C0
00
305
00
00
1,22
10
611
061
130
591
60
916
305
916
1,22
17,
327
tota
l0
00
2,03
50
00
08,
141
04,
070
04,
070
2,03
56,
105
06,
105
2,03
56,
105
8,14
148
,843
S-J
Inte
rcon
nect
io
nF/C
00
00
04,
280
1,07
00
00
00
00
00
00
00
5,35
0L/
C0
00
00
476
119
00
00
00
00
00
00
059
4to
tal
00
00
04,
755
1,18
90
00
00
00
00
00
00
5,94
4H
ydro
F/C
00
00
00
00
00
01,
651
01,
270
01,
270
00
423
04,
614
L/C
00
00
00
00
00
01,
351
01,
039
01,
039
00
346
03,
775
tota
l0
00
00
00
00
00
3,00
20
2,30
90
2,30
90
077
00
8,39
0P
ump
F/C
00
00
00
229
229
045
745
70
00
00
00
00
1,37
2L/
C0
00
00
018
718
70
374
374
00
00
00
00
01,
123
tota
l0
00
00
041
641
60
832
832
00
00
00
00
02,
495
Ren
ewab
leF/
C0
00
00
00
00
00
047
328
565
6566
911
179
416
52,
871
L/C
00
00
00
00
00
00
158
918
822
223
3726
555
957
tota
l0
00
00
00
00
00
063
038
754
8789
214
81,
059
220
3,82
8(S
olar
)0
00
00
00
00
00
04,
970
300
5,93
568
57,
030
1,17
08,
350
1,74
030
,180
Subs
tatio
nF/
C41
331
951
925
622
518
617
118
618
618
618
618
634
934
934
934
934
921
521
521
55,
409
L/C
7356
9245
4033
3033
3333
3333
6262
6262
6238
3838
955
tota
l48
637
561
130
126
521
920
221
921
921
921
921
941
141
141
141
141
125
325
325
36,
364
Tran
smis
sion
Lin
eF/
C29
971
985
190
3981
2221
521
521
521
521
513
313
313
313
313
349
4949
3,98
9L/
C53
127
150
167
144
3838
3838
3824
2424
2424
99
970
4to
tal
351
846
1,00
110
645
9626
253
253
253
253
253
157
157
157
157
157
5858
584,
693
Dis
trib
utio
n Li
neF/
C0
00
00
00
00
00
00
00
00
00
00
L/C
579
529
553
539
559
595
617
617
617
617
617
617
617
617
617
617
617
617
617
617
11,9
87to
tal
579
529
553
539
559
595
617
617
617
617
617
617
617
617
617
617
617
617
617
617
11,9
87To
tal
F/C
3,82
65,
322
3,36
52,
659
264
4,91
32,
532
1,44
98,
140
4,64
54,
501
3,50
87,
565
4,96
76,
420
6,24
16,
524
6,52
96,
854
10,4
9910
0,72
3L/
C1,
483
1,78
31,
340
1,05
160
51,
240
1,18
61,
048
2,08
21,
565
1,73
32,
324
1,86
12,
341
1,86
72,
378
1,90
11,
621
2,25
12,
330
33,9
89to
tal
5,30
97,
105
4,70
53,
710
869
6,15
33,
718
2,49
710
,222
6,20
96,
234
5,83
29,
425
7,30
88,
287
8,61
98,
425
8,15
09,
105
12,8
2913
4,71
2(T
otal
with
Sol
ar)
5,30
97,
105
4,70
53,
710
869
6,15
33,
718
2,49
710
,222
6,20
96,
234
5,83
214
,395
7,60
814
,222
9,30
415
,455
9,32
017
,455
14,5
6916
4,89
2
Tabl
e 5.
3-1
Inv
estm
ent S
ched
ule
for O
ptim
al E
lect
ric
Pow
er D
evel
opm
ent P
rogr
am
Final Report < Summary > - 70 -

The Study on Optimal Electric Power Development in Java-Madura-Bali in the Republic of Indonesia
5.3.2 Promotion of IPP For promotion of IPPs, a key to achieve the optimal power development plan, recommendations are made as follows.
Theme Issue Measures to be taken
General 1) Retail Tariff Financial conditions of PLN should
be strengthened, government’s subsidy decreased
PLN’s profit margin should be increased by a revision to the calculation method of BPP, for example. Limiting electricity subsidy to customer category R-1, 450VA. Possibility of introducing cost-pass-through system to the electricity tariff should be studied.
2) Process of Private Partner Selection
Process of selecting private partners should be open and fair.
Bidding process should be monitored by independent body. Continuous evaluation and improvement of the process.
3) Project Schedule Delay in projects discourage private companies, add costs, negatively affect projects
To study cases of delayed projects and to find solutions streamlining the process of financial closing of foreign loans
4) Land Acquisition Land acquisition is very difficult task for investors
Initiative in land acquisition for power plants and transmission lines should be taken by local government or PLN
5) Long term Perspective and Flexibility in Project Realization
Projects and their implementation details are designed with long term perspective.
Consideration on sustainability in setting bidding and contractual conditions Technical requirements considering system operation - bidding for different power plant operation patterns, - PPA pricing for middle- to peak-operation power plant - setting power plant ramp rate Standardized PPA pricing evaluated and revised, if necessary, for different power plant operations.
6) Use of domestic inputs and increase of local currency portion
Increase of loans and PPA liability expose PLN to foreign exchange risks
A method to evaluate highly the bid with higher local currency portion should be studied.
7) Limitation of Foreign Capital Ownership
limitation of foreign ownership 95% maximum may impede foreign investment.
The efficacy of the regulation should be studied and verified.
For coal thermal 1) Securing Fuel Development and exploitation of
LRC should be given support. For mine-mouth coal thermal, submarine cables provided
Support to the development of LRC should be provided. Submarine cables should be evaluated from difficulties of power plant site finding in Java, advantage of interconnection of grids, regional development in remote areas, etc.
2) Environmental Protection Power plants with low environmental protection capabilities would undermine sustainability of development
Higher environmental standard should be demanded in coal thermal projects even if it leads to higher cost.
For geothermal 1) Institutional Arrangement There are many institutional
uncertainties to investment in geothermal
Regulations/standards for geothermal development should be provided
2) Pre-bid Site Survey More site survey needed to lower the risks of developers
Setting up a revolving fund to supply necessary resources to local governments
3) Utilizing Developer’s Knowledge in Site Selection
Knowledge of private developers should be exploited more.
To offer more candidate sites than to be developed and to have bidders select their preferred sites
4) Development in Protected Forest Potential sites are often located in and around protected forest
A provision for confirming the possibility of geothermal development; for example an establishment of inter-ministry coordination board.
5) Limitation of Standardized PPA prices
Geothermal development cost varies in one project to another.
The regulation and its effect should be monitored and, if necessary, revised.
6) Accumulation and advancement of Geothermal technology by PLN
Geothermal development will be done mainly by IPP
PLN is to be tasked with the accumulation and advancement of geothermal technology. If necessary, technical and financial support should be provided to PLN for this purpose.
For renewable energy 1) Promotion of Expensive
Renewable Energy Specific measures to encourage use of and investment for solar power and wind power should be considered and implemented
Special fund to provide subsidy to investors Mandating PLN to purchase energy generated by renewable sources at fixed prices Tax exemption and/or loan with favorable conditions
- 71 - Final Report < Summary >
The Study on Optimal Electric Power Development in Java-Madura-Bali in the Republic of Indonesia
5.4. Environmental and Social Considerations Even in Power Source Diversification Scenario, coal-fired power generation is a major power source, and there is a concern over potential impacts on air quality. Siting of coal-fired power stations should be determined after the present levels of air pollution at proposed sites are identified and whether additional air pollution loads are acceptable or not is considered. If a power station is constructed in an area already with heavy air pollution, installation of desulfurization/denitrification facility or efficient electrostatic precipitator should be considered. Majority of power sources in Power Source Diversification Scenario are those with substantial amounts of thermal effluents, such as thermal and nuclear power generation. There are many waters with coral reefs off Jamali area, and special attentions should be paid to potential impacts of thermal effluents on corals. Indonesia is not subject to the greenhouse gas emission reduction target under Kyoto Protocol, since it is a non-Annex I country. Thermal power generation to emit substantial amounts of CO2 provides a major power source in Power Source Diversification Scenario. If legally binding greenhouse gas emission reduction target is established to Indonesia in future, it will be required to improve generation efficiencies of thermal power generation to suppress CO2
production or to conduct afforestation to sequester CO2 in the atmosphere. It used to be said that hydroelectric power generation does not emit CO2 and that it is friendly to global environment, but now it is known that it will release methane with strong greenhouse effect when water quality in a reservoir goes down. It is required to take efforts to prevent its eutrophication and subsequent degradation of water quality due to uncontrolled discharges of sewage from around a reservoir.
5.5. Measures for the Improvement of System Operation Against the current situation and causes of problems on system operation, which is mentioned in Section 2.4.6, the suggestions on measures for the improvement of system operation in terms of voltage, frequency and outages are described below.
5.5.1 Voltage
The reasons for system voltage drop in Jamali are that reactive power source to maintain proper voltage is fundamentally lacked and existing reactive source is not fully utilized. Against these reasons, the following countermeasures can be suggested.
Final Report < Summary > - 72 -
The Study on Optimal Electric Power Development in Java-Madura-Bali in the Republic of Indonesia
< Short Term Measures >
1) Raise of system standard voltage By raising standard voltage of higher voltage class, such as 500kV, it is possible to make voltage of whole system higher and mitigate voltage drop at lower voltage class. Raise of system standard voltage can be accomplished by raising generator terminal voltage.
2) Introduction of incentives and penalties for reactive power supply Generally, IPPs are negative to supply reactive power because supply of reactive power doesn’t produce profit for IPP. Against that problem, application of the system where reward is given for reactive power supply to keep system voltage stable can be suggested. In addition, application of penalties for violation of operation order such as to raising terminal voltage can be suggested.
< Long Term Measures >
3) Planning of reactive power equipment It is necessary to install reactive power equipment such as static capacitors and shunt reactors for fundamental solution of voltage problem. Long term plan is required considering reactive supply and demand balance, and the installation of reactive power equipment in accordance with lack and surplus of reactive supply, such as in the following process: a) Study of planning phase b) Reactive demand forecast c) Checking of supply and demand balance in each block d) Calculation of the required amount of reactive power equipment e) Selection of the capacity of single unit f) Power flow analysis
4) Installation of on-load tap changer to step-up transformer It is possible to control reactive output of generator by changing tap of step-up transformer at generation plant. When transformation ratio is fixed, with constant voltage control by AVR, it would be difficult to fully utilize reactive power from generators due to restriction of generator terminal voltage in many cases. On the other hand, when transformer is equipped with tap structure, it is possible to enhance ability on reactive power output by changing tap without restriction of terminal voltage. PLN has already tried to raise voltage by using off-load tap at some generators. However, in case of off-load tap changer, it is difficult to change tap properly against voltage fluctuation, because planned outage is required to change tap. Therefore, in order to change tap properly in accordance with the condition of system voltage and reactive power, and utilize reserve of reactive power from generator, changing tap
- 73 - Final Report < Summary >
The Study on Optimal Electric Power Development in Java-Madura-Bali in the Republic of Indonesia
without outage by on-load tap changer is required.
5) Installation of PSVR (Power System Voltage Regulator) AVR, which is generally used detects generator terminal voltage and controls reactive supply from generator so as to keep the voltage constant. With this system, even if system voltage drops, reactive power supply doesn’t reach limit in many cases. On the other hand, PSVR controls high side of step-up transformer which is closer to grid and try to keep it constant. Therefore, it is possible to utilize margin of reactive power supply from generator speedily and try to keep system voltage against fast change of load.
5.5.2 Frequency
Countermeasures against frequency fluctuation can be classified into normal and emergency frequency control. < Measures for Normal Frequency Control >
1) Application of penalty In case ramp rate is lower than designed value or a generator doesn’t follow operation order, which obstructs frequency control, application of penalties for generators can be suggested.
2) Bidding classified by operation type In general IPP bidding, base type generators have advantage on feasibility, and middle and peak type generators which is capable for frequency control is not likely to be installed. Middle and peak type generators would be competitive by the application of bidding classified by the type considering operation patterns.
3) Application of tariff for middle and peak type generators In past IPP bidding in Indonesia, tariff was set assuming base type operation. However, it is difficult for middle and peak type generators to secure profit with cheap tariff for base type, because operation hours are short and fuel cost is high. On the other hand, in other countries, specific tariff for peak and middle type generators considering operation pattern is already applied. Such tariff system would make it easy for middle and peak type generators to secure profit despite of short operation hours.
4) Application of Capacity Fee It is important to utilize IPP investment as well as generators of PLN in order to keep enough supply against steady growth of demand in the future. In general, power purchase agreement with IPP is based on energy (kWh). However, especially for middle and peak type generators, such system raise the risk that fixed cost is not recovered,
Final Report < Summary > - 74 -

The Study on Optimal Electric Power Development in Java-Madura-Bali in the Republic of Indonesia
because income of IPP fluctuates in accordance with traded energy. Against such problem, application of capacity fee where minimum payment despite of actual generation is secured is considered to enable IPP to recover fixed cost easily and to prompt investment by IPP for middle and peak type generators.
< Measures for Emergency Frequency Control >
5) Proper calculation of system frequency characteristic For frequency control under emergency condition, system frequency characteristic which represents change of frequency against large change of output such as trip of generator shall be ascertained. When system frequency characteristic is calculated, not only the tripped capacity of generators (MW/Hz), but also whole system capacity at the time of trip, shall be considered, and tripped capacity shall be represented by the ratio to system capacity (%MW/Hz). In addition, when system frequency characteristics is calculated based on the past record of trip of generator, as shown in the figure below which represents the result of process of data on the generator trip record in PLN, there is a large difference between the case where data is managed with root mean square (RMS) and the case where data is managed with worst case. When system frequency characteristic is determined, not the value itself calculated through RMS but the value with some margin in consideration with past record and metering error shall be used.
-1.8
-1.6
-1.4
-1.2
-1
-0.8
-0.6
-0.4
-0.2
0
0 2 4 6 8ΔP (%)
Δf
(Hz)
RMSK = 4.3 (%MW/Hz)
Worst case K = 1.1 (%MW/Hz) Some cases exist
worse than RMS
Example of Calculation of System Frequency Characteristic
6) Detailed system frequency characteristic considering KG and KL When system frequency characteristic is calculated precisely, effect of governor free capacity in accordance with tripped capacity shall be considered. In case of large
- 75 - Final Report < Summary >
The Study on Optimal Electric Power Development in Java-Madura-Bali in the Republic of Indonesia
frequency drop such as generator trip, although governor free generators increase output in response to frequency decline, they reach limit and exhaust output margin if frequency drops furthermore. Therefore, system frequency characteristic (K) up to the limit of governor free is represented as K = KL+KG (KL:Load Frequency Characteristic, KG:Generator Frequency Characteristic). After the limit of governor free, it is represented as K = KL. In order to study much adequate amount of load shedding, appropriate amount shall be studied with the calculation of system frequency characteristic in consideration with actual governor free capacity.
5.5.3 Outages
As referred in Section 2.4.6, major reason for frequent outage in Jamali is the problem of facilities. For improvement on the problem of outage, following item can be suggested;
(1) Measures for Same Type of Equipment
It is effective to take measures for same type of equipment against failure of equipment. When failure occurs to some equipment, same type of failure is likely to occur on same type of sound equipment in the near future. Therefore, it is important to execute measures not only for the equipment where failure occurs but for all same type of equipment, after analysis of the cause of failure.
(2) Establishment of Quality Management System
As a reason of equipment failure, there might be shortage of performance from the time of installation. It is appropriate to prompt installation of equipment by manufacturers with high quality through the reinforcement of requirements in bidding document, and the consideration of failure rate of each manufacturer in bidding evaluation. Currently, it is deemed to be difficult to exclude manufactures with bad quality immediately, but it is important to recognize manufacturers with bad quality through managing failure records and quality of installed equipment.
In order to keep quality of manufacturers high, installation of quality management system is suggested. In quality management system, for the adoption of equipment, technical division evaluates internal test result and quality assurance program submitted by manufacturer, and witnesses site test at factory of manufacturer if necessary. Based on the result, not the procurement division but the technical division judges new and continuous adoption of the equipment. Therefore, quality of equipment is considered to be kept high.
Final Report < Summary > - 76 -

The Study on Optimal Electric Power Development in Java-Madura-Bali in the Republic of Indonesia
(3) Cooperation with Manufacturer
Currently, so many manufacturers have supplied equipment to PLN, and PLN could not get enough support from all of them. In order to improve quality of equipment to be installed and get continuous support from manufacturers, it is essential to keep good relationship with manufacturers. Many products are supplied from manufacturers abroad at present, but it is preferable that equipment with high quality will be procured from local manufacturers in Indonesia in the future. For that purpose, it is vital to cooperate with manufacturers with local factories and offices.
In order to enhance cooperation with manufacturers, joint technical development and research among utility and manufacturer are considered to be effective. In Japan, many new technologies have been developed in accordance with needs from utilities through joint development with manufacturers from the past. Continuous joint activities have enhanced cooperation among utilities and manufacturers.
(4) Planned Installation of Facilities based on N-1 Criteria
In PLN, OLS (load shedding system against over load) is used as unavoidable measure against system failure where N-1 criteria is not satisfied, and many outages are caused by the operation of OLS. Fundamentally, generation and transmission facilities shall be planned and installed so as to satisfy N-1 criteria.
(5) Appropriate Calculation of System Frequency Characteristic
With regard to load shedding, not only to secure enough capacity, but also to study the amount of load shedding through proper calculation of system frequency characteristic, as previously mentioned, is required.
(6) Installation of Fault Extension Prevention Relay
It is important to minimize the area of influence by the outage when serious outage occurs in system. In Jamali, although basic protection system such as under frequency load shedding relay is installed, improvement is possible in terms of the prevention of fault extension, and installation of fault extension prevention relay utilized in Japan is recommended.
- 77 - Final Report < Summary >

The Study on Optimal Electric Power Development in Java-Madura-Bali in the Republic of Indonesia
6. RECOMMENDATIONS On the basis of the results of this study, the issues to be recognized and actions to be taken are summarized below, in order for the Government of Indonesia and national power utility, PLN, to proceed to the realization of the optimal power development plan. It should be emphasized here that those projects scheduled for next 7 – 8 years in the power development plan and the matters described below related to such projects need immediate actions to be taken by relevant parties.
6.1 Power Source Development
(1) Coal-fired Thermal Power Plant
• New 29 locations are required for the future development of power plants except the ongoing fast track program projects. Inventory study on new candidate sites including possibility of land acquisition shall be commenced as soon as possible.
• Study on an introduction of supercritical plants, which is a proven technology, is recommended because of its capability for flexible operation (base to middle load operation) and higher thermal efficiency resulting in fuel saving and reduction of emission.
• With respect to the utilization of LRC, developing coal-fired thermal plants at mine-mouth in Sumatra, and possibly in Kalimantan in the long term, and using LRC there, would make the best use of LRC for its physical properties
• Advantage of LRC use is its price per calorific value being much lower than HSD/MFO and its availability from domestic mines. Therefore, the benefit of scrapping existing HSD/MFO burning power plants and replacing with LRC burning coal thermal should also be studied.
• More stringent mitigation measures for air pollution will be required as the number of coal-fired thermal power plants will be increasing rapidly.
(2) Java-Sumatra Interconnection
• PLN should exercise an extreme caution in managing the implementation schedule of IPP coal-fired thermal plants in Sumatra to assure that the Java-Sumatra Interconnection will be able to send power to Jamali system in 2014 on schedule.
(3) Geothermal Power Plant
Although the country is endowed with the world-largest geothermal potential, and the government places a priority on geothermal development in his energy policy, necessary regulations/standards in relation with geothermal development have not been put in place,
Final Report < Summary > - 78 -
The Study on Optimal Electric Power Development in Java-Madura-Bali in the Republic of Indonesia
which leaves private entities considering investment in geothermal business with many uncertainties and risks. To encourage and promote private investment in the development, provisions of institutional arrangements and efforts to lower risks are urgently required.
Institutional Arrangement
• As bidding for geothermal development license is administered by local governments, and regulations/standards concerning its procedure have not been provided, there are many uncertainties to investment in geothermal. Standard procedure including bidding process, bidder evaluation criteria, information provided in bidding documents, etc., should be established and put in place as soon as possible.
• With respect to the provision of such arrangement, PLN can contribute by giving technical supports to local governments in project formulation, bid evaluation, etc., which may greatly improve the efficacy of the procedure.
• For a geothermal project located in and around protected forest, it is important to avoid such project being terminated after it is licensed to a private company. Some institutional arrangement is required that enables the confirmation of permission availability at the early stage of project formation, such as setting up an inter-ministry coordination board.
• To develop geothermal resources more efficiently by employing the knowledge of private developers, a bidding process that offers more candidate sites than to be developed and to have bidders select their preferred sites in their bid can be an effective device.
Reduction of Risks
• Among many risks involved in geothermal development, exploration risk allocated to developers is the one most significant. Preliminary FS level exploration study should be carried out prior to license bidding by PLN of local governments, and its information provided to bidders.
• In case that local government lacks the finance necessary for such a pre-bid exploration, setting up a revolving fund to supply necessary resources may be effective.
Others
• PLN has in-depth technical and operational know-how in geothermal business and it should keep its advantage as the sole electric utility in the country. Such technical supports as an introduction of the latest technologies and financial supports should be considered and provided to PLN, when necessary.
(4) Nuclear Power Plant
• As nuclear power development plan may well face a delay, a study on additional coal-fired thermal plants to substitute for nuclear power would be required.
- 79 - Final Report < Summary >

The Study on Optimal Electric Power Development in Java-Madura-Bali in the Republic of Indonesia
(5) Gas-fired Thermal Power Plant
• For the purpose of improving operational flexibility of gas-fired thermal power plants being provided by gas pipelines, CNG (Compressed Natural Gas) Storage System, which allows the same plant to operate for middle and peak load, is recommended.
• Middle- to small-sized gas fields, which are not suitable for LNG export, may be suitable for supplying fuel to thermal power plants using CNG vessel. Study on such development is recommended. This will also enables conversion of HSD-fired PLTG to CNG-fired PLTGU.
(6) Hydropower
• Re-evaluation of hydropower potential, as a domestic resource of energy, in Jamali is required.
• Pumped storage power plants will be able to fully exploit the advantage of low cost power supply from coal-fired thermal and nuclear power plants for its pumping energy after 2020. As a pumped storage project requires a long lead time, earlier preparation of implementation is recommended.
(7) Solar and Wind Power
• Specific measures to encourage use of and investment for solar power and wind power should be considered and implemented.
• It is recommended to establish Environmental Impact Assessment guidelines and/or criteria for solar and wind power development, in cooperation with Ministry of Environment.
(8) General
• To respond to the climate change, measures to promote energy conservation and use of renewable energy shall be taken.
• To expedite the finding of power plant site, economic measures, such as a support for regional development and/or a subsidy scheme to relevant communities, shall be studied and introduced.
• Initiative in land acquisition for power plants and transmission lines should be taken by local government or PLN, not by private investors.
• Bidding process for power plant/transmission development should be monitored and supervised by an independent body.
• Continuous efforts to evaluate and improve bidding process, particularly concerning the details of tendering information and participation of wide range of bidders should be made.
Final Report < Summary > - 80 -
The Study on Optimal Electric Power Development in Java-Madura-Bali in the Republic of Indonesia
• Cases of significant delays in project schedule should be studied and their solutions to their causes be found and implemented.
• Technical requirements of bidders for IPP projects should be revised on the basis of the results of the study on improvement of power system operation.
6.2 Environment
(1) Air Pollution
• Siting of a coal-fired power station shall be conducted upon due consideration on whether additional air pollution load is acceptable or not, after the present level of air pollution at the proposed site is clarified.
• Construction of a power station in an area already with noticeable air pollution requires installation of a desulfurization/denitrification facility or electrostatic precipitator.
• Continuous monitoring of emission and ambient air quality shall be conducted.
(2) Thermal Effluents
• Thermal power generation and nuclear power generation produce majority of electricity, and they discharge substantial amounts of thermal effluents. There are many coral reefs off Jamali area, so special attentions shall be paid to potential impacts of thermal effluents on corals.
• In Indonesia, it is required to reduce the temperature of thermal effluents down to less than 2 degree Celsius above the temperature of receiving water, while thermal effluents are required to be less than about 6 degree Celsius in Japan. Indonesian requirement is not practical, and it is desirable to conduct rather an impact assessment through the simulation on diffusions of thermal effluents.
(3) CO2 Emissions
• If a legally binding emission reduction target is established in future for greenhouse gas emissions from Indonesia, it will be required to reduce CO2 production through improvements of generation efficiencies in thermal power generation, or to sequester CO2 in the atmosphere through afforestation.
(4) Water Quality Management in the Reservoir of Hydroelectric Power Stations
• Reservoir-type hydroelectric power generation will emit methane of significant greenhouse effects when water quality in a reservoir goes down. It is required to prevent eutrophication through uncontrolled discharges of domestic sewage into reservoirs for prevention of water quality degradation there.
- 81 - Final Report < Summary >
The Study on Optimal Electric Power Development in Java-Madura-Bali in the Republic of Indonesia
(5) Industrial Wastes from Nuclear Power Generation
• Appropriate treatment of spent fuel from nuclear power generation is required. 6.3 Promotion of Private Investment
(1) Retail Tariff
• PLN’s profit margin should be increased to allow for future investment. Such measures as a revision to the calculation method of BPP shall be considered.
• In relation to the increase of PLN’s profit margin, limiting electricity subsidy to customer category R-1, 450 VA is recommended, in order to reduce the government subsidy payment.
• Further, a possibility of introducing cost-pass-through system to the electricity tariff should be studied.
(2) Project Schedule
• The causes of project delay should be studied. Particularly, financial closing process for foreign lending needs to be streamlined.
(3) Standardization of IPP wholesale price
• Regulation on PPA price capping needs to be revised taking into consideration of the difference of plant operation and resulting cost difference.
• As geothermal development cost varies in one project to another, setting PPA price capping on geothermal IPP may preclude investors/developers from participating in bidding. The regulation and its effect should be monitored and, if necessary, revised.
(4) Use of domestic inputs and increase of local currency portion
• A method of valuing higher a bid with larger L/C portion should be considered.
(5) Limitation of Foreign Capital Ownership
• The current regulation on the limitation of foreign capital ownership of power plant, 95% maximum, can be one of factors that impede foreign investment. The efficacy of the regulation in the promotion of domestic industries and private investment in the power sector should be studied and verified.
Final Report < Summary > - 82 -
The Study on Optimal Electric Power Development in Java-Madura-Bali in the Republic of Indonesia
6.4 Power System Expansion Plan
(1) Land Acquisition
• Right-Of-Way for planned transmission lines and substation facilities should be acquired prior to their construction so that the land acquisition would not cause any delay in their realization.
(2) Countermeasures to Avoid Large Power Failure
• Countermeasures against frequency drop, such as an installation of simple load-breaking system by sending trip signal, should be studied.
• Introduction of system disconnection devices as a countermeasure against the whole system collapse should be studied.
(3) Introduction of Higher Voltage to Transmission and Distribution System
(4) Securing Governor Free (GF) Capacity at Nighttime
• To cope with the increase of base load plants such as coal and nuclear, and to meet the demand for quality electricity in night time, methods to secure the governor free (GF) capacity, such as an introduction of Daily Start Stop thermal power plants (DSS Units) and/or Adjustable Speed pumped storage hydro, should be studied.
(5) Study on Power Supply Method to High Load Density Areas (Jakarta)
• Economic power supply method to high load density areas, such as Jakarta, should be studied comprehensively, which may include raising voltage of middle-voltage system and direct connection of 500 kV system.
(6) Java-Sumatra Interconnection
• Countermeasures against upward frequency deviation, which may occur in the Sumatra system in the case of an interruption of Java-Sumatra Interconnection, should be studied.
(7) Other Considerations
• Phase modifying systems will have to be introduced in large numbers. The balance of the installation of the systems as well as their locations must be examined in the whole-region and sub-region scales.
• At load dispatching facilities for 150 kV systems and the below, manual operation is not effective in coping with voltage collapse. It is recommended to provide automatic voltage controllers (e.g., SVC) at limited locations and the breakers using voltage-down relay.
- 83 - Final Report < Summary >
The Study on Optimal Electric Power Development in Java-Madura-Bali in the Republic of Indonesia
6.5 Improvement of System Operation
(1) The result of analysis of current conditions on the system operation
• The important issues to be considered on the system operation are related to voltage, frequency and outages. The suggestions on measures for the improvement of the system operation in terms of these issues are described below:
(2) Voltage
• The reasons for system voltage drop in Jamali are that reactive power source to maintain proper voltage is fundamentally lacked and existing reactive source is not fully utilized. Against these reasons, the following countermeasures are suggested.
• As short term measures, in order to make best use of the reactive supply capability of the existing generators, a) Raise of system standard voltage and b) Introduction of incentives and penalties for reactive power supply are suggested.
• As long term measures, planning of reactive supply equipment is required. In addition, in order to follow deviations of voltage, a) Installation of on-load tap changer to step-up transformer and b) Installation of PSVR (Power System Voltage Regulator are to be considered.
(3) Frequency
• Countermeasures against frequency fluctuation can be classified into normal and emergency frequency control.
• As measures for normal frequency control, a) Application of penalty, b) Bidding classified by operation type, c) Application of tariff for middle and peak type generators, and d) Application of Capacity Fee are effective.
• As measures for emergency frequency control, a) Proper calculation of system frequency characteristics and b) Detailed system frequency characteristics considering KG and KL are effective.
(4) Outages
• Major reason for frequent outage in Jamali is the problem of facilities.
• For improvement on the problem of outage, a) Measures for same type of equipment, b) Establishment of quality management system, c) Cooperation with manufacturer, d) Planned installation of facilities based on N-1 criteria, e) Appropriate calculation of system frequency characteristic and f) Installation of fault extension prevention relay are effective.
Final Report < Summary > - 84 -


![[APPENDICES] - JICA報告書PDF版(JICA Report PDF)open_jicareport.jica.go.jp/pdf/11864667_05.pdf · Envrionmental Management Plan, Project Summary Report,December 2005 Report SGAB,](https://img.pdfslide.us/doc/110x75/5e9cc7d24b3381006b1dab39/appendices-jicapdfcjica-report-pdfopen-envrionmental-management.jpg)