Embed Size (px)
Citation preview

Report No. BDV25-977-31
Final Report
Best Practices for Construction and Repair of Bridge Approaches and Departures
Qing Lu, Ph.D., P.E.
Principal Investigator
Mingyang Li, Ph.D.
Manjriker Gunaratne, Ph.D., P.E.
Co-Principal Investigators
and
Chunfu Xin
Md Mokaddesul Hoque
Manvitha Rajalingola
Graduate Assistants
Submitted to
Florida Department of Transportation, Research Center
605 Suwannee Street, MS 30, Tallahassee, FL 32399-0450
By the
Department of Civil and Environmental Engineering
College of Engineering
University of South Florida
Tampa, FL 33620
Ph. (813) 974-7971
Fax (813) 974-4962
March 2018

ii
DISCLAIMER
The opinions, findings, and conclusions expressed in this publication are those of the authors and
not necessarily those of the State of Florida Department of Transportation.
This document is disseminated under the sponsorship of the U.S. Department of Transportation
in the interest of information exchange. The United States Government assumes no liability for
the contents or use thereof.

iii
SI (MODERN METRIC) CONVERSION FACTORS
* SI is the symbol for the International System of Units. Appropriate rounding should be made to
comply with Section 4 of ASTM E380. (Revised March 2003)
Symbol When You Know Multiply By To Find Symbol
in inches 25.4 millimeters mmft feet 0.305 meters myd yards 0.914 meters mmi miles 1.61 kilometers km
in2 square inches 645.2 square millimeters mm2
ft2 square feet 0.093 square meters m2
yd2 square yard 0.836 square meters m2
ac acres 0.405 hectares hami2 square miles 2.59 square kilometers km2
fl oz f luid ounces 29.57 milliliters mLgal gallons 3.785 liters Lft3 cubic feet 0.028 cubic meters m3
yd3 cubic yards 0.765 cubic meters m3
oz ounces 28.35 grams glb pounds 0.454 kilograms kgT short tons (2000 lb) 0.907 megagrams (or "metric ton") Mg (or "t")
5 (F-32)/9or (F-32)/1.8
fc foot-candles 10.76 lux lxfl foot-Lamberts 3.426 candela/m2 cd/m2
lbf poundforce 4.45 new tons N
lbf/in2 poundforce per square inch 6.89 kilopascals kPa
Symbol When You Know Multiply By To Find Symbol
mm millimeters 0.039 inches inm meters 3.28 feet ftm meters 1.09 yards ydkm kilometers 0.621 miles mi
mm 2 square millimeters 0.0016 square inches in2
m 2 square meters 10.764 square feet ft2
m 2 square meters 1.195 square yards yd2
ha hectares 2.47 acres ackm 2 square kilometers 0.386 square miles mi2
mL milliliters 0.034 fluid ounces fl ozL liters 0.264 gallons galm 3 cubic meters 35.314 cubic feet ft3
m 3 cubic meters 1.307 cubic yards yd3
g grams 0.035 ounces ozkg kilograms 2.202 pounds lbMg (or "t") megagrams (or "metric ton") 1.103 short tons (2000 lb) T
°C Celsius 1.8C+32 Fahrenheit °F
lx lux 0.0929 foot-candles fccd/m 2 candela/m2 0.2919 foot-Lamberts fl
N new tons 2.225 poundforce lbfkPa kilopascals 0.145 poundforce per square inch lbf/in2
Illumination
Approximate Conversions to SI Units
Length
Area
Volume
NOTE: volumes greater than 1000 L shall be show n in m3
Mass
Temperature (exact degrees)°F Fahrenheit Celsius °C
Temperature (exact degrees)
Illumination
Force and Pressure or Stress
Force and Pressure or Stress
Approximate Conversions from SI Units
Length
Area
Volume
Mass
iv
TECHNICAL REPORT DOCUMENTATION PAGE 1. Report No.
2. Government Accession No.
3. Recipient's Catalog No.
4. Title and Subtitle
Best Practices for Construction and Repair of Bridge Approaches
and Departures
5. Report Date
March 2018
6. Performing Organization Code
7. Author(s)
Qing Lu, Mingyang Li, Manjriker Gunaratne, Chunfu Xin, Md
Mokaddesul Hoque, Manvitha Rajalingola
8. Performing Organization Report No.
9. Performing Organization Name and Address
Department of Civil and Environmental Engineering
College of Engineering
University of South Florida, Tampa, FL 33620
10. Work Unit No. (TRAIS)
11. Contract or Grant No.
BDV25-977-31
12. Sponsoring Agency Name and Address
Florida Department of Transportation
605 Suwannee Street, MS 30, Tallahassee, FL 32399
13. Type of Report and Period Covered
Final Report
May 2016 – March 2018
14. Sponsoring Agency Code
15. Supplementary Notes
16. Abstract Florida Department of Transportation (FDOT) has experienced frequent distresses in bridge approach/departure asphalt
pavements in its highway system. Commonly observed distresses include alligator cracking and rutting, which reduce
roadway smoothness and safety. To minimize the pavement distress and improve ride quality, there is a need to determine
the extent and root causes of the problem and to develop pavement rehabilitation strategies and guidelines. This research
serves such purposes by carrying out three research tasks: (1) literature review and extent of the problem; (2) literature
review and rehabilitation criteria; and (3) literature review and rehabilitation guidelines. This report summarizes the work
and findings under all tasks. From the work under Task 1, it was found that in 2014-2015 on Florida Interstate highways,
about 27% of bridges with asphalt pavements on their approaches/departures showed signs of cracking in their approach or
departure asphalt pavements, and about 20% of the bridges have noticeable rutting in their approach or departure asphalt
pavements. Bridges showing distresses in approach/departure asphalt pavements are mainly on I-75 and I-95. A variety of
factors may cause excessive distresses in bridge approach/departure asphalt pavements, among which, inadequate asphalt
layer thickness is one potential cause. The common maintenance and rehabilitation (M&R) techniques used by various states
for bridge approach/departure asphalt pavements include crack sealing, patching, milling and overlay, and reconstruction.
Most states do not have special M&R strategies and guidelines. From the work under Task 2, tentative criteria for
rehabilitation of bridge approach/department pavements were recommended. From the work under Task 3, a step-by-step
procedure was proposed for identifying and comparing feasible rehabilitation strategies for bridge approach/departure
asphalt pavements. The recommended rehabilitation strategy selection procedure includes: (1) pavement condition survey
and evaluation; (2) identification of pavement distress causes; (3) selection of rehabilitation techniques; (4) formation of
rehabilitation strategies; (5) life-cycle cost analysis; and (6) selection of rehabilitation strategy.
17. Key Word
Asphalt Pavement, Bridge Approach, Bridge
Departure, Rehabilitation Criteria, Rehabilitation
Guidelines, Pavement Design
18. Distribution Statement
No restrictions.
19. Security Classif. (of this report)
Unclassified. 20. Security Classif. (of this page)
Unclassified. 21. No. of Pages
152 22. Price
Form DOT F 1700.7 (8-72) Reproduction of completed page authorized
v
EXECUTIVE SUMMARY
Frequent distresses have been observed on bridge approach/departure asphalt pavements in the
Florida highway system. There is a need to determine the extent and causes of the problem and
to develop pavement rehabilitation strategies and guidelines. This study was sponsored by the
Florida Department of Transportation (FDOT) for such purposes. Research work was conducted
under three tasks: (1) literature review and extent of the problem; (2) literature review and
rehabilitation criteria; and (3) literature review and rehabilitation guidelines.
For the first task, the following work was carried out: a comprehensive literature review,
communication with FDOT personnel for FDOT practices and inputs, a nationwide questionnaire
survey, and analysis of condition survey data from Florida highway bridge approach/departure
asphalt pavements. The literature review covered information related to bridge
approach/departure asphalt pavements. A variety of literature sources were reviewed, including
journal papers, technical reports and manuals from various state DOTs. Florida-specific bridge
approach/departure asphalt pavement information was collected through document review and
communication with FDOT personnel. In the nationwide questionnaire survey, eight questions
covering various aspects of bridge approach/departure asphalt pavement were sent to relevant
pavement, maintenance, and field engineers in all state DOTs, and responses from a total of 33
state DOTs were received. In the Florida highway bridge approach/departure asphalt pavement
performance data analysis, pavement condition data were collected and analyzed for 1,155
Florida Interstate highway bridges with approach/departure asphalt pavements, using video log
images and pavement condition survey data. These Interstate highway bridges are deemed a
representative sample of the Florida highway bridges.
It was revealed that a variety of distresses may appear in the bridge approach/departure asphalt
pavements, among which cracking, rutting, settlement issues, and raveling are most common
across states. In Florida, cracking and rutting are commonly observed, and cracking tends to be
more significant than rutting. About 27% of the over 1000 Florida Interstate highway bridges
with approach/departure asphalt pavements showed signs of cracking, and about 20% of bridges
have noticeable rutting in their approach/departure asphalt pavements. Bridges showing
distresses in approach/departure asphalt pavements are mainly on I-75 and I-95. Literature
review showed that the main factors causing excessive distresses in bridge approach/departure
asphalt pavements may include embankment settlement, poor drainage features around bridge
abutments, water intrusion in base and subbase layers, inadequate compaction of the subgrade
and base layers, and stiffness difference among bridge deck, approach slab, and approach
pavements. Thin asphalt layers were noticed on bridge approach/departure asphalt pavements in
9 out of the 33 states surveyed and on many FDOT Interstate highway bridges, particularly in
Districts 2 and 5, and on I-75.
For the second task, a follow-up literature review and a follow-up nationwide questionnaire
survey were conducted. The literature review covered information related to rehabilitation
criteria for bridge approach/departure asphalt pavements, possible causes and countermeasures
for typical pavement distresses, and rehabilitation practices for bridge approach/departure asphalt
pavements. In the survey, a few state DOT agencies that had provided relevant feedback in the
questionnaire survey completed in Task 1 were followed up with a specific focus on

vi
rehabilitation criteria and rehabilitation techniques of bridge approach/departure asphalt
pavements.
Based on the follow-up literature review and survey results, general rehabilitation practices for
bridge approach/departure asphalt pavements include crack sealing, patching, milling and
overlay, and reconstruction. In many states, pavement patches are placed at failed bridge
approach pavement areas until the sections get resurfaced. Most states do not have special
maintenance and rehabilitation (M&R) criteria and guidelines for bridge approach/departure
asphalt pavements. A few criteria proposed by some states, however, were found in the literature,
which are based on differential settlement, approach-relative gradient, smoothness, or bridge
approach index. Based on the literature review findings, rating systems were recommended for
evaluating the performance of bridge approach/departure asphalt pavements based on rut depth,
International Roughness Index (IRI), and crack rating. Bridge approach/departure asphalt
pavements that are rated below “fair” should be visually inspected and targeted for M&R.
For the third task, a step-by-step procedure was developed for condition evaluation and
rehabilitation strategy selection for bridge approach/departure asphalt pavements. The procedure
includes the following six steps:
(1) Conducting pavement condition survey and evaluation;
(2) Identifying pavement distress causes;
(3) Selecting rehabilitation techniques;
(4) Establishing rehabilitation strategies;
(5) Conducting life-cycle cost analysis;
(6) Selecting rehabilitation strategy.
Asphalt patching, milling and asphalt inlay, and reconstruction were identified to be commonly
used in rehabilitation practices for inadequate bridge approach/departure asphalt pavements. In-
place recycling, including full depth reclamation, is recommended as one rehabilitation
technique for bridge approach/departure asphalt pavements. A modified structural deficiency
approach is proposed for the milling and asphalt inlay design. The potential rehabilitation
strategy alternatives for bridge approach/departure asphalt pavements are proposed to address
various possible issues with the pavements. With respect to current FDOT rehabilitation
practices for bridge approach/departure asphalt pavements, several changes are recommended.

vii
TABLE OF CONTENTS
DISCLAIMER ................................................................................................................................ ii
SI (MODERN METRIC) CONVERSION FACTORS ................................................................. iii
TECHNICAL REPORT DOCUMENTATION PAGE ................................................................. iv
EXECUTIVE SUMMARY ............................................................................................................ v
LIST OF FIGURES ........................................................................................................................ x
LIST OF TABLES ........................................................................................................................ xii
CHAPTER 1 INTRODUCTION .................................................................................................. 1
CHAPTER 2 LITERATURE REVIEW ....................................................................................... 3
2.1 Introduction ............................................................................................................................... 3
2.2 Pavement Structures and Materials on Bridge Approaches ...................................................... 3
2.3 Common Types and Potential Causes of Pavement Distresses on Bridge Approaches ........... 4
2.4 M&R Techniques and Strategies .............................................................................................. 9
2.4.1 General Literature Review ......................................................................................... 9
2.4.2 FDOT Repair Practices ............................................................................................ 16
2.5 Summary of Literature Review ............................................................................................... 17
CHAPTER 3 QUESTIONNAIRE SURVEYS ........................................................................... 19
3.1 Introduction ............................................................................................................................. 19
3.2 Nationwide Questionnaire Survey .......................................................................................... 19
3.2.1 Extent of Asphalt Pavement Damage at Bridge Approaches and Departures ......... 20
3.2.2 Causes of Asphalt Pavement Damage on Bridge Approaches and Departures ....... 22
3.2.3 M&R Strategies for Asphalt Pavements at Bridge Approaches and Departures ..... 23
3.3 Survey on Rehabilitation Techniques for Regular Asphalt Pavements with Vertical
Alignment Constraint .............................................................................................................. 25
3.4 Follow-up Survey on Rehabilitation Techniques for Bridge Approach Pavements ............... 26
3.5 Survey on Current FDOT Rehabilitation Practices for Bridge Approach Pavements ............ 27
3.6 Summary of Survey Results ................................................................................................... 28
CHAPTER 4 FLORIDA BRIDGE APPROACH AND DEPARTURE PAVEMENT DATA
COLLECTION AND ANALYSIS ....................................................................... 30
4.1 Introduction ............................................................................................................................. 30
4.2 Pavement Condition Analysis Based on Video Log Images .................................................. 30
4.2.1 Evaluation Procedure of Pavement Distresses Based on Video Log Images .......... 30
4.2.2 Analysis Results of Pavement Distresses Based on Video Log Images .................. 32
4.2.2.1 Overall analysis and results...................................................................... 32
4.2.2.2 District-specific analysis and results ........................................................ 35
4.2.2.3 Route-specific analysis and results ........................................................... 36
4.2.2.4 Hypothesis testing ..................................................................................... 38
4.3 Pavement Condition Analysis Based on 2014-2015 Pavement Condition Data .................... 39
4.3.1 Evaluation Procedure of Pavement Distresses Based on Condition Data ............... 39
4.3.2 Analysis Results of Pavement Distresses Based on Condition Data ....................... 40
4.3.2.1 Overall analysis and results...................................................................... 40

viii
4.3.2.2 Rut rating analysis and results ................................................................. 43
4.3.2.3 IRI analysis and results ............................................................................. 45
4.4 Asphalt Layer Thickness Analysis.......................................................................................... 50
4.4.1 GPR Data Selection Method .................................................................................... 50
4.4.2 General Asphalt Layer Thickness Trends ................................................................ 50
4.4.3 District-Specific Asphalt Layer Thickness Trends .................................................. 51
4.4.4 Route-Specific Asphalt Layer Thickness Trends .................................................... 52
4.5 Analysis of Rutting and Smoothness Characteristics ............................................................. 53
4.5.1 Comparative Analysis of IRI and Rut Depth on Different Pavement Sections ....... 55
4.5.2 Descriptive Statistical Analysis of IRI and Rut Depth on Different Pavement
Sections ............................................................................................................................. 56
4.5.3 Multiple Regression Analysis of IRI and Rut Depth on Different Pavement Sections
........................................................................................................................................... 59
4.5.3.1 Bridge approach/departure asphalt pavement smoothness model ........... 59
4.5.3.2 Bridge approach/departure asphalt pavement rut depth model ............... 60
4.5.4 Analysis of Contributing Factors of Bridge Approach/Departure Asphalt Pavement
Smoothness ....................................................................................................................... 61
4.6 Summary of FDOT Bridge Approach/Departure Asphalt Pavement Data Analysis .............. 64
CHAPTER 5 REHABILITATION CRITERIA FOR BRIDGE APPROACH/DEPARTURE
ASPHALT PAVEMENTS ................................................................................... 66
5.1 Proposed Pavement Rating System Based on Rutting and Smoothness ................................ 66
5.2 Proposed Pavement Rating System Based on Cracking ......................................................... 70
5.3 Rehabilitation Criteria for Bridge Approach/Departure Asphalt Pavements ......................... 71
CHAPTER 6 REHABILITATION GUIDELINES FOR BRIDGE APPROACH/DEPARTURE
ASPHALT PAVEMENTS ................................................................................... 72
6.1 Pavement Condition Survey and Evaluation .......................................................................... 72
6.1.1 Bridge Approach/Departure Asphalt Pavement Section.......................................... 72
6.1.2 Pavement Condition Survey .................................................................................... 73
6.1.3 Pavement Condition Evaluation .............................................................................. 73
6.2 Detailed Data Collection ......................................................................................................... 73
6.2.1 Data Collection and Identification of Pavement Distress Causes ............................ 73
6.2.2 Other Sources of Relevant Information ................................................................... 75
6.3 Selection of Rehabilitation Techniques .................................................................................. 76
6.3.1 Rehabilitation Techniques for Regular Asphalt Pavements .................................... 76
6.3.2 Rehabilitation Techniques for Regular Asphalt Pavements with Vertical Alignment
Constraint .......................................................................................................................... 77
6.3.3 Discussion of Rehabilitation Techniques for Bridge Approach/Departure Asphalt
Pavements ......................................................................................................................... 77
6.4 Formation of Rehabilitation Strategies ................................................................................... 77
6.4.1 Combining Rehabilitation Techniques into Strategies ............................................ 77
6.4.2 Developing Detailed Rehabilitation Strategies ........................................................ 78
6.4.2.1 Milling and asphalt inlay design for bridge approach/departure asphalt
pavements .............................................................................................................. 78

ix
6.4.2.2 In-place recycling design for bridge approach/departure asphalt
pavements .............................................................................................................. 81
6.4.2.3 Reconstruction design for bridge approach/departure asphalt pavements
............................................................................................................................... 81
6.4.3 Summary .................................................................................................................. 81
6.5 Life-cycle Cost Analysis ......................................................................................................... 81
6.5.1 Selecting Analysis Period ........................................................................................ 82
6.5.2 Selecting Discount Rate ........................................................................................... 82
6.5.3 Selecting a Measure of Economic Worth ................................................................ 83
6.5.4 Determining Monetary Agency Costs ..................................................................... 83
6.5.5 Determining User Costs ........................................................................................... 87
6.5.6 Summary .................................................................................................................. 87
6.6 Selection of Rehabilitation Strategy ....................................................................................... 87
6.6.1 Selection of Rehabilitation Strategy ........................................................................ 87
6.6.2 Identification of Obstacles for Bridge Approach/Departure Asphalt Pavement
Repairs .............................................................................................................................. 88
6.6.3 An Example of Selection of Rehabilitation Strategy for Bridge Approach/Departure
Asphalt Pavements ............................................................................................................ 89
6.7 Summary ................................................................................................................................. 98
CHAPTER 7 POTENTIAL CHANGES TO FDOT PAVEMENT PRACTICES.................... 100
REFERENCES ........................................................................................................................... 102
APPENDIX A RESPONSES FROM VARIOUS STATE DOTS IN THE NATIONWIDE
QUESTIONNAIRE SURVEY ........................................................................... 107
APPENDIX B RESPONSES FROM VARIOUS STATE DOTS ON REHABILITATION
TECHNIQUES FOR INADEQUATE ASPHALT PAVEMENT STRUCTURES
............................................................................................................................. 122
APPENDIX C RESPONSES OF FOLLOW-UP SURVEY ON REHABILITATION
TECHNIQUES FOR BRIDGE APPROACH/DEPARTURE ASPHALT
PAVEMENTS..................................................................................................... 126
APPENDIX D SUMMARY OF T-TEST RESULTS ................................................................ 130
APPENDIX E LIST OF BRIDGES WITH SMOOTHNESS AND THICKNESS DATA IN 2014
............................................................................................................................. 133
APPENDIX F POOR/VERY POOR BRIDGE APPROACH/DEPARTURE ASPHALT
PAVEMENTS..................................................................................................... 135
APPENDIX G RESPONSES FROM FDOT DISTRICTS ON AVERAGE COST
INFORMATION ASSOCIATED WITH PAVEMENT REHABILITATION .. 137

x
LIST OF FIGURES
Figure 1-1 Schematic diagram of bridge approach/departure transition areas ............................... 1
Figure 2-1 Elements of a typical bridge approach system (Rufino et al., 2001) ............................ 4
Figure 2-2 Two common types of pavement rutting diseases (Harvey et al., 2001) ...................... 5
Figure 2-3 Rehabilitation technique selection process for regular pavements (Illinois DOT, 2008)
................................................................................................................................... 10
Figure 2-4 Histogram of bridge approach relative gradient in Iowa (White et al., 2007) ............ 11
Figure 2-5 Distributions of IRI on roadway and bridge approaches (White et al., 2007) ............ 12
Figure 2-6 Typical IRI for bridge approach profile (White et al., 2007) ...................................... 12
Figure 2-7 Illustrations of the definition of bridge approach index (BI) (White et al., 2005) ...... 13
Figure 2-8 One rating system of bridge approach performance (White et al., 2005) ................... 13
Figure 2-9 Bridge approach pavement replacement design in South Dakota ............................... 14
Figure 3-1 Is more damage observed in asphalt pavements near bridges..................................... 20
Figure 3-2 To what extent is the pavement damaged ................................................................... 21
Figure 3-3 Frequencies of reported distresses .............................................................................. 21
Figure 3-4 Changes in asphalt layer thickness on bridge approaches and departures .................. 22
Figure 4-1 Schematic depiction of survey area in one lane around a bridge ................................ 31
Figure 4-2 Wheel path designation in a lane (FDOT, 2015) ........................................................ 31
Figure 4-3 Summary of crack rating (CR) of asphalt pavements at all bridges ........................... 33
Figure 4-4 Summary of CR of asphalt pavements at bridges showing pavement distresses ........ 34
Figure 4-5 Distribution of CR ....................................................................................................... 34
Figure 4-6 Distribution of bridges across districts ........................................................................ 35
Figure 4-7 District comparison of asphalt pavement CR at all bridges ........................................ 36
Figure 4-8 District comparison of asphalt pavement CR at bridges showing pavement distresses
................................................................................................................................... 36
Figure 4-9 Distribution of bridges across routes........................................................................... 37
Figure 4-10 Route comparison of asphalt pavement CR at all bridges ........................................ 38
Figure 4-11 Route comparison of asphalt pavement CR at bridges showing pavement distresses
................................................................................................................................... 38
Figure 4-12 Schematic depiction of survey area in one lane around a bridge .............................. 40
Figure 4-13 Summary of rut rating for all bridges ........................................................................ 41
Figure 4-14 Summary of IRI for all bridges ................................................................................. 41
Figure 4-15 Summary of ride rating for all bridges ...................................................................... 42
Figure 4-16 Number of bridges with pavement condition indices indicating distresses .............. 43
Figure 4-17 District comparison of asphalt pavement rut rating at all bridges ............................ 44
Figure 4-18 Route comparison of asphalt pavement rut rating at all bridges ............................... 45
Figure 4-19 Share of bridges in each district showing IRI greater than 95 in/mi on both approach
and departure pavements ........................................................................................... 46
Figure 4-20 District comparison of asphalt pavement IRI at all bridges ...................................... 47
Figure 4-21 District comparison of IRI at bridges showing IRI greater than 95 in/mi on both
approach and departure pavements ........................................................................... 47
Figure 4-22 Share of bridges on each route showing IRI greater than 95 in/mi on both approach
and departure pavements ........................................................................................... 48
Figure 4-23 Route comparison of asphalt pavement IRI at all bridges ........................................ 49
xi
Figure 4-24 Route comparison of IRI at bridges showing IRI greater than 95 in/mi on both
approach and departure pavements ........................................................................... 49
Figure 4-25 Comparison of asphalt layer thickness ...................................................................... 51
Figure 4-26 Comparison of asphalt layer thickness across districts ............................................. 52
Figure 4-27 Comparison of asphalt layer thickness across routes ................................................ 53
Figure 4-28 BMP and EMP of bridge on left/right side of divided highway (FDOT, 2016a) ..... 54
Figure 4-29 Schematic diagram of bridge approach/departure slab and pavement sections ........ 54
Figure 4-30 Average IRI on bridge approaches/departures and control section .......................... 55
Figure 4-31 Average rut depth on bridge approaches/departures and control section ................. 56
Figure 4-32 Distribution of average IRI on bridge Approach Section-3 ...................................... 57
Figure 4-33 Distribution of average IRI on bridge Departure Section-4 ...................................... 57
Figure 4-34 Distribution of average rut depth on bridge Approach Section-1 ............................. 58
Figure 4-35 Distribution of average rut depth on bridge Departure Section-6 ............................. 58
Figure 4-36 Relationship between bridge approach pavement IRI and pavement age ................. 60
Figure 4-37 Relationship between bridge approach pavement rut depth and age ........................ 61
Figure 5-1 Proposed rating system for bridge approach/departure asphalt pavements ................ 67
Figure 5-2 Distribution of bridge approach asphalt pavements by performance rating ............... 67
Figure 5-3 Distribution of bridge departure asphalt pavements by performance rating ............... 68
Figure 5-4 Distribution of poor/very poor bridge approach/departure pavements by district ...... 68
Figure 5-5 Distribution of poor/very poor bridge approach/departure pavements by route ......... 69
Figure 6-1 An example of GPR survey for bridge approach pavement (Bridge: 910097) ........... 74
Figure 6-2 Materials sampling and testing results for one bridge approach pavement (Bridge:
260069) ...................................................................................................................... 75
Figure 6-3 Schematic diagram of milling depth design ................................................................ 80
Figure 6-4 Selection of analysis period for alternatives with unequal performance periods ........ 82
Figure 6-5 A typical design of TTC for a short section work zone (FHWA, 2009) ..................... 85
Figure 6-6 Rehabilitation strategy alternatives over 30-year analysis period ............................... 96
Figure 6-7 Rehabilitation strategy selection procedure for bridge approach/departure asphalt
pavements .................................................................................................................. 99

xii
LIST OF TABLES
Table 2-1 General differences between features of bridge approach/departure pavements and
regular pavements ........................................................................................................... 6
Table 2-2 Common types and potential causes of bridge approach/departure asphalt pavement
distresses ......................................................................................................................... 6
Table 2-3 Subjective rating system for differential settlement (Long et al., 1998) ...................... 10
Table 2-4 Rehabilitation criteria for bridge approach pavements ................................................ 14
Table 2-5 Typical M&R techniques for bridge approach pavements ........................................... 15
Table 3-1 State DOTs responded in the survey ............................................................................ 19
Table 3-2 Rehabilitation techniques for asphalt pavements with structural deficiency ............... 25
Table 3-3 Typical range of empirical service lives for rehabilitation techniques ......................... 26
Table 3-4 Rehabilitation practices for bridge approach pavements .............................................. 27
Table 3-5 Current FDOT rehabilitation practices for bridge approach pavements ...................... 28
Table 4-1 Distribution of bridges across districts ......................................................................... 35
Table 4-2 Distribution of bridges across routes ............................................................................ 37
Table 4-3 Summary of hypothesis test results .............................................................................. 39
Table 4-4 Average pavement condition indices for all bridges .................................................... 41
Table 4-5 Summary of hypothesis test results of rut rating and IRI ............................................. 42
Table 4-6 Distribution of rut rating across districts ...................................................................... 44
Table 4-7 Distribution of rut rating across routes ......................................................................... 45
Table 4-8 Distribution of IRI across districts ............................................................................... 46
Table 4-9 Distribution of IRI across routes .................................................................................. 48
Table 4-10 GPR data point spacing .............................................................................................. 50
Table 4-11 GPR data availability in districts ................................................................................ 51
Table 4-12 GPR data availability on routes .................................................................................. 52
Table 4-13 Descriptive statistics of potential variables influencing pavement smoothness ......... 62
Table 4-14 Estimated parameters for bridge approach/departure pavement smoothness models 63
Table 5-1 Smoothness rating system for bridge approach/departure asphalt pavements ............. 70
Table 5-2 Rutting rating system for bridge approach/departure asphalt pavements .................... 70
Table 5-3 Cracking rating system for bridge approach/departure asphalt pavements .................. 70
Table 6-1 Reduced layer coefficients under different pavement conditions ................................ 79
Table 6-2 List of item average unit cost associated with bridge pavement rehabilitation ............ 85
Table 6-3 Paving and rehabilitation work production rates .......................................................... 87
Table 6-4 Comparison table example for selection of rehabilitation strategy .............................. 88
Table 6-5 Pavement condition survey results ............................................................................... 89
Table 6-6 Performance evaluation result for bridge approach pavement ..................................... 89
Table 6-7 Existing pavement structure ......................................................................................... 90
Table 6-8 Required structural number for rehabilitation strategy alternatives ............................. 90
Table 6-9 Existing structural number of bridge approach pavement without milling .................. 90
Table 6-10 Design structural number for different reconstruction strategies ............................... 92
Table 6-11 Resurfacing/reconstruction design for rehabilitation alternatives .............................. 93
Table 6-12 Construction duration (days) for rehabilitation strategy alternatives ......................... 97
Table 6-13 Comparison analysis for selection of rehabilitation strategy ..................................... 97
Table 7-1 Suggested changes to current FDOT pavement rehabilitation practices .................... 100
Table D-1 T-test results for crack rating (CR) ............................................................................ 130

xiii
Table D-2 T-test results for rut rating (RR) ................................................................................ 131
Table D-3 T-test results for IRI .................................................................................................. 132
Table F-1 List of 21 bridges with poor or very poor approach asphalt pavements .................... 135
Table F-2 List of 34 bridges with poor or very poor departure asphalt pavements .................... 136

1
CHAPTER 1 INTRODUCTION
The Florida Department of Transportation (FDOT) has experienced frequent distresses on the
Interstate highways where concrete bridge pavement transitions to asphalt pavement. Commonly
observed distresses include alligator cracking and rutting, which reduce roadway smoothness and
safety. The problem is particularly common along the outer travel lane that carries the majority
of truck traffic. In some cases, it was observed that the thickness of asphalt concrete (AC) layer
reduces significantly (e.g., as much as 6 in) as the pavement section gets closer to a bridge
approach/departure slab, likely due to repeated resurfacing projects in which the contractors must
transition the asphalt pavement to the bridge approach/departure slab. The inadequate AC layer
thickness might be a potential cause of pavement distresses.
To minimize the pavement distress and improve ride quality, there is a need to determine the
extent and causes of the problem, and to develop pavement rehabilitation strategies and
guidelines. The rehabilitation solutions shall be practical and feasible to overcome obstacles such
as temporary traffic control (TTC) restrictions, equipment accessibility, budget limitations, and
to improve pavement structural number at minimum maintenance and rehabilitation (M&R)
frequency.
The purpose of this research is to understand the extent and causes of frequent distresses in
asphalt pavement transition areas adjacent to a bridge approach/departure slab and to develop
appropriate pavement rehabilitation criteria and guidelines. The transition areas, as illustrated in
Figure 1-1, may have a length of about 200 ft. Asphalt pavements in these areas are referred to as
“bridge approach/departure asphalt pavements” or simply “bridge approach pavements” in
this study. The pavements that are out of the transition areas are referred to as “regular
pavements”, as shown in Figure 1-1. For a regular pavement section that is adjacent to a bridge
approach/departure asphalt pavement, it is also named as a “control section” in this study.
Figure 1-1 Schematic diagram of bridge approach/departure transition areas
The specific objectives of this research include:
• Determine the extent of the problem on Florida roadways. Identify the root causes of
pavement distresses (e.g., fatigue cracking and rutting) and challenges associated with the
repair of bridge approach pavements.

2
• Determine the selection criteria of rehabilitation strategies to alleviate pavement distress
near bridge approaches and improve long term smoothness using the International
Roughness Index (IRI) criteria.
• Develop rehabilitation guidelines based on an extensive literature review, assessment of
critical issues, and construction industry engagement. Reasonably estimate the costs and
benefits associated with developed guidelines.
To achieve the above objectives, four tasks were planned to be carried out
• Task 1: Literature Review and Extent of the Problem
• Task 2: Literature Review and Rehabilitation Criteria
• Task 3: Literature Review and Rehabilitation Guidelines
• Task 4: Prepare Draft Final Report and Final Report
The work performed for Tasks 1-3 consists of comprehensive literature review, nationwide
questionnaire surveys, and collection, survey, and analysis of bridge approach/departure asphalt
pavement data on Florida Interstate highways. This report summarizes the work and findings
under the three tasks.

3
CHAPTER 2 LITERATURE REVIEW
2.1 Introduction
Making a smooth transition from a roadway pavement to a bridge deck has traditionally been
somewhat of a challenge because the pavement side is relatively susceptible to settlement while
the bridge deck is not. Pavements in the areas of bridge approaches may suffer accelerated levels
of deterioration for a variety of reasons (Oregon DOT, 2011). Bridge approaches are defined as
the section of pavement located immediately off the ends of a bridge, regardless of whether they
are located on the approach side or leave side of the bridge (Oregon DOT, 2011). To distinguish
the two sides of a bridge, the approach side and the leave side of a bridge may be denoted as
bridge approach and departure, respectively. The problems with bridge approach/departure
asphalt pavements are widespread and require investigations inclusive of the approach pavement
system (White et al., 2007). Frequent pavement distresses on bridge approaches and departures
will compromise ride quality, increase pavement M&R frequency and expenditure, and increase
user cost such as delay due to traffic interruption by construction and added vehicle damage
(Phares et al., 2011; Long et al., 1998).
This literature review was performed to gather information related to bridge approach/departure
asphalt pavements, including pavement structures and materials used, common types of
pavement distresses, major factors contributing to pavement distresses, and M&R techniques and
strategies. While the objectives of this research focus on asphalt pavement transition sections
adjacent to a bridge approach/departure slab, the review includes not only the pavement
transition sections but also the pavements on bridge approach/departure slabs, due to the fact that
they are sometimes included in the same definition of “bridge approach pavement” in the
literature. Moreover, “bridge approach pavement” is also used to refer to a “bridge departure
pavement” in some literature. In this review, therefore, the discussion on bridge approach
pavements also applies to bridge departure pavements.
2.2 Pavement Structures and Materials on Bridge Approaches
Due to load restrictions and grade constraints on bridge structures, the design and rehabilitation
techniques of new and existing bridge approaches require special consideration (Oregon DOT,
2011). A typical bridge approach pavement system, with one example shown in Figure 2-1
(Rufino et al., 2001), includes several different structures, such as approach slab, compacted
embankment, drainage facility, and pavement layers. Approach slabs are typically used to
provide a smooth vertical transition between the bridge approach pavement and the bridge. They
are supported at the bridge end by the end bent and by the embankment at the roadway approach
end (FDOT, 2012). To account for movement of the bridge, primarily due to temperature
fluctuations, an expansion joint is always provided between the bridge deck and the approach
slab. As shown in Figure 2-1, the bridge approach pavement not only includes pavement
connector or possible asphalt overlay on the approach slab, but also includes a larger area of
existing pavement. For example, in Oregon pavement design guide, bridge approach/departure
asphalt pavement is analyzed for a distance of 200 ft from the ends of the bridge (Oregon DOT,
2011).

4
In Florida, bridge approach/departure pavements are typically constructed on compacted
embankment or fill materials. When an approach slab is provided between the roadway
pavement and the bridge deck, it is also paved, along with roadway pavements. In FDOT Design
Standards (FDOT, 2012), a minimum asphalt overlay thickness of 1.75 in is required over the
approach slab for flexible pavement approaches. Specifically, for FC-5, a 1.0 in structural course
and a 0.75 in friction course are placed; for FC-9.5, a 0.75 in structural course and a 1.0 in
friction course are placed; for FC-12.5, a 1.75 in friction course is placed.
Figure 2-1 Elements of a typical bridge approach system (Rufino et al., 2001)
2.3 Common Types and Potential Causes of Pavement Distresses on Bridge Approaches
Literature review revealed various types of distresses in bridge approach/departure asphalt
pavements, including differential settlement (bump), rutting, longitudinal cracking in wheel
paths, transverse and map cracking, raveling, potholes, shoving, and bleeding.
The typical pavement distress at bridge approaches/departures is differential settlement among
bridge deck, approach slab, and pavement. This is mainly because roadways and embankments
are built on subgrade foundation and compacted fill materials that undergo load induced
compression over time (White et al., 2005). The compression usually leads to pavement
settlement that is much larger than the settlement of a bridge that is supported on deep
foundations. The quality of embankment is critical to pavement performance. A poorly
compacted embankment will result in excessive consolidation and settlement of the embankment
material after the bridge approach is opened to traffic (Phares et al., 2011). More settlement is
expected for higher embankments because of more compression within the embankment and
higher loads applied to the foundation materials (Long et al., 1998). High differential settlements
are also usually associated with water crossings because of the compressible, saturated soils
located near water crossings (Allen, 1985; Hopkins, 1985; Stewart, 1985).
The post-compaction consolidation will not only lead to significant differential settlement, but
may also cause rutting in asphalt pavements. As illustrated in Figure 2-2(a), consolidation rutting
due to poor embankment quality can be identified in the field by the feature that there is no
pavement uplift along the sides of a rut. On the contrary, as illustrated in Figure 2-2(b),
instability rutting due to permanent shear deformation of the asphalt concrete layer can be
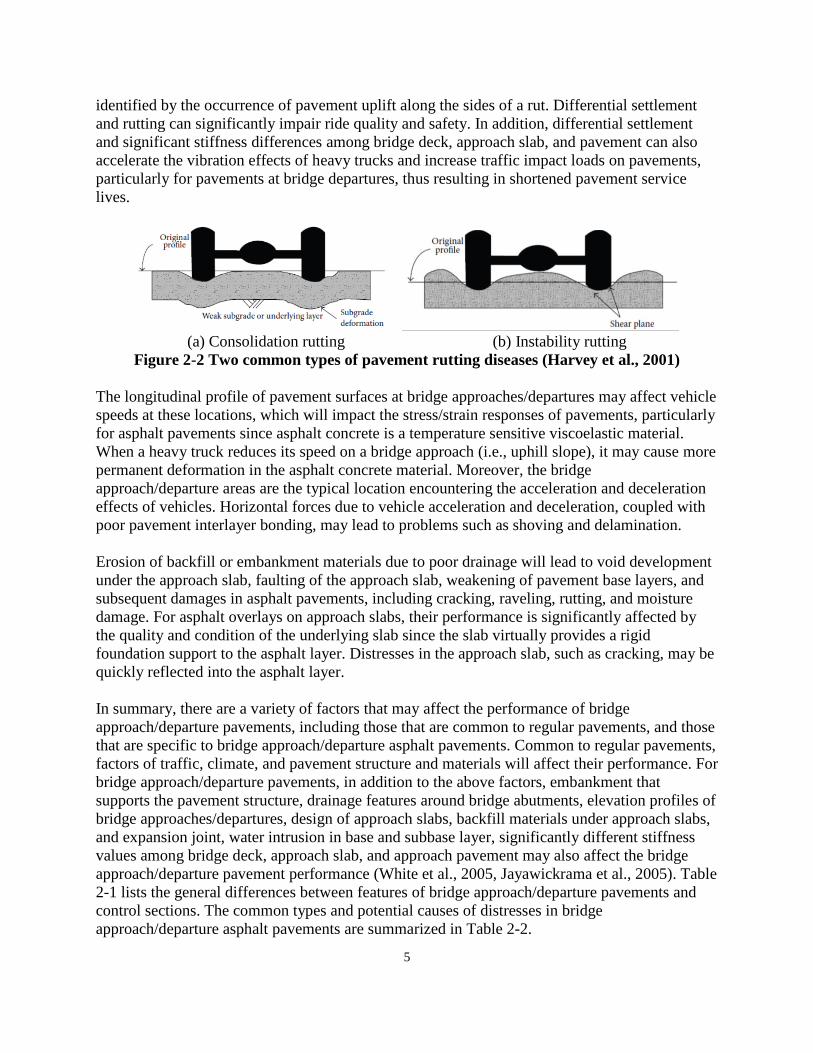
5
identified by the occurrence of pavement uplift along the sides of a rut. Differential settlement
and rutting can significantly impair ride quality and safety. In addition, differential settlement
and significant stiffness differences among bridge deck, approach slab, and pavement can also
accelerate the vibration effects of heavy trucks and increase traffic impact loads on pavements,
particularly for pavements at bridge departures, thus resulting in shortened pavement service
lives.
(a) Consolidation rutting (b) Instability rutting
Figure 2-2 Two common types of pavement rutting diseases (Harvey et al., 2001)
The longitudinal profile of pavement surfaces at bridge approaches/departures may affect vehicle
speeds at these locations, which will impact the stress/strain responses of pavements, particularly
for asphalt pavements since asphalt concrete is a temperature sensitive viscoelastic material.
When a heavy truck reduces its speed on a bridge approach (i.e., uphill slope), it may cause more
permanent deformation in the asphalt concrete material. Moreover, the bridge
approach/departure areas are the typical location encountering the acceleration and deceleration
effects of vehicles. Horizontal forces due to vehicle acceleration and deceleration, coupled with
poor pavement interlayer bonding, may lead to problems such as shoving and delamination.
Erosion of backfill or embankment materials due to poor drainage will lead to void development
under the approach slab, faulting of the approach slab, weakening of pavement base layers, and
subsequent damages in asphalt pavements, including cracking, raveling, rutting, and moisture
damage. For asphalt overlays on approach slabs, their performance is significantly affected by
the quality and condition of the underlying slab since the slab virtually provides a rigid
foundation support to the asphalt layer. Distresses in the approach slab, such as cracking, may be
quickly reflected into the asphalt layer.
In summary, there are a variety of factors that may affect the performance of bridge
approach/departure pavements, including those that are common to regular pavements, and those
that are specific to bridge approach/departure asphalt pavements. Common to regular pavements,
factors of traffic, climate, and pavement structure and materials will affect their performance. For
bridge approach/departure pavements, in addition to the above factors, embankment that
supports the pavement structure, drainage features around bridge abutments, elevation profiles of
bridge approaches/departures, design of approach slabs, backfill materials under approach slabs,
and expansion joint, water intrusion in base and subbase layer, significantly different stiffness
values among bridge deck, approach slab, and approach pavement may also affect the bridge
approach/departure pavement performance (White et al., 2005, Jayawickrama et al., 2005). Table
2-1 lists the general differences between features of bridge approach/departure pavements and
control sections. The common types and potential causes of distresses in bridge
approach/departure asphalt pavements are summarized in Table 2-2.

6
Review of technical reports and memorandums on the conditions of asphalt pavements on some
Interstate highway bridge approaches in Florida showed that fatigue cracking and rutting were
common at many bridge approaches (Parkash and Moseley, 2009). In some cases, there was a
significant difference in the asphalt concrete layer thickness between a bridge
approach/departure asphalt pavement and its control section. Typically, the asphalt concrete
layer of a bridge approach/departure asphalt pavement was much thinner than that of a control
section, and the difference may be as much as 66% of the asphalt layer thickness of control
sections (Moseley, 2009, 2012, 2013; FDOT, 2009a, 2009b). The insufficient asphalt layer
thickness is likely one reason for the excessive damages in bridge approach/departure asphalt
pavements.
Table 2-1 General differences between features of bridge approach/departure pavements
and regular pavements
Features Bridge Approach/Departure
Pavement
Regular Pavement
Structure and
Materials
• Possible inadequate compaction
practice
• Thinner pavement surface layer
• Incompatible stiffness effect
• Possible joints failure problem
• Uniform compaction practice
• Regular pavement surface layer
• Uniform stiffness effect
• No joints
Traffic
Characteristics • Relative low traffic speed
• Possible acceleration/deceleration
effect
• High traffic impact load effect
• Regular traffic speed
• Uniform vehicle speed
• Normal traffic impact load
effect
Environmental
Condition • Possible water intrusion
• Differential settlement effect
• No water intrusion
• Same compression and
settlement
Table 2-2 Common types and potential causes of bridge approach/departure asphalt
pavement distresses
Distress Description Possible Causes Picture
Approach
slab ramp
Differential
settlement between
bridge and approach
slab
• Consolidation of
foundation soil
• Embankment vertical
deformation
• Poor compaction of
filler

7
Table 2-2 Common types and potential causes of bridge approach/departure asphalt
pavement distresses (continued)
Distress Description Possible Causes Picture
Differential
settlement at
pavement-
bridge
interface
Differential
settlement at
pavement-bridge
interface
• Consolidation of
foundation soil
• Embankment vertical
deformation
• Poor compaction of
filler
Alligator
(fatigue)
cracking
Interconnected or
interlaced cracks in
the wheel path,
forming a series of
small polygons.
• Excessive loading
• Weak surface, base, or
subgrade (e.g., poor
drainage, inadequate
compaction)
• Thin surface or base
• Poor drainage
Longitudinal
cracking in
wheel paths
Longitudinal cracks
are predominantly
parallel to pavement
centerline.
• Aging effect of asphalt
• Excessive loading
• Impact factor
• Weak surface, base
• Thin surface or base
• Poor drainage
Transverse
and map
cracking
Transverse cracks
are predominantly
perpendicular to the
pavement centerline.
• Aging effect of asphalt
• Voids exist beneath
the slab
• Embankment
compression
Cracking at
the
expansion
joint
Tensile-extrusion
failure
• Expansion-contraction
cycle
• Impact load effect
• Expansion joints
failure

8
Table 2-2 Common types and potential causes of bridge approach/departure asphalt
pavement distresses (continued)
Distress Description Possible Causes Picture
Rutting (mix
rutting or
subgrade
rutting)
Surface depression in
the wheel paths
• Poor compaction
• Excessive loading
• Weak asphalt mixtures
• Insufficient design
thickness
• Moisture infiltration
Shoving
Longitudinal
displacement of a
localized area of the
pavement
• Braking or
accelerating effects
• Excessive moisture
• Low air voids
• Low vehicle speed
• Excessive loading
• Poor bond between
pavement layers
Bleeding or
flushing
A film of asphalt
binder on the
pavement surface.
• Mixture problems
• Improper construction
practices
• High temperature
Raveling
Loss of bond
between aggregate
particles and the
asphalt binder
• Aggregate segregation
• Inadequate
compaction
• Poor mixture quality
• Asphalt hardening due
to aging
Potholes
Depressions in the
pavement surface
that penetrate all the
way through the
HMA layer down to
the base layer
• Thin surface layer
• Moisture infiltration
Excessive loading

9
Table 2-2 Common types and potential causes of bridge approach/departure asphalt
pavement distresses (continued)
Sources: (Lenke, 2006; White et al., 2005; Asphalt Institute, 2009; Michigan DOT, 2016;
Nebraska DOR, 2002; Phares et al., 2011; Scullion, 2001)
2.4 M&R Techniques and Strategies
2.4.1 General Literature Review
The frequent distresses in bridge approach/departure asphalt pavements require frequent
pavement M&R, which are more difficult to carry out than those on regular pavements due to
factors such as restrictions of equipment accessibility and difficulties in TTC. For regular
pavements, developing an appropriate rehabilitation strategy requires extensive investigation into
the condition of the existing pavement structure, performance history, and laboratory testing of
materials to establish suitability of existing and proposed materials for use in the rehabilitation
design. The preferred rehabilitation strategy should consider cost-effectiveness, repair of the
specific problems of an existing pavement, prevention of future problem, and meeting all
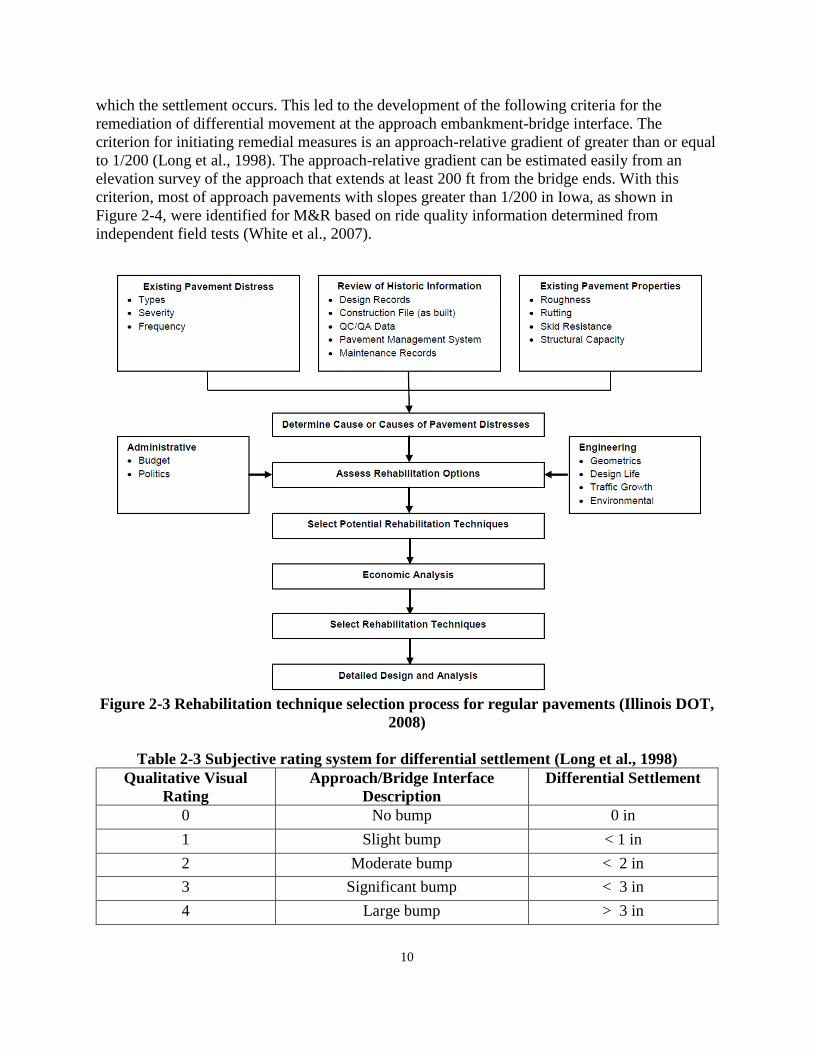
existing constraints of the project (Texas DOT, 2016). Figure 2-3 shows a general rehabilitation
technique selection process for regular flexible pavements (Illinois DOT, 2008). This selection
process should also be followed in the rehabilitation of bridge approach/departure asphalt
pavements.
The literature contains several studies on the criteria for triggering remedial countermeasures for
bridge approach/departure pavements. Wahls suggested that a differential settlement of 0.5 in is
likely to produce a “bump at the end of the bridge” that will require maintenance (Wahls, 1990).
Long et al. (1998) developed a rating system for bridge approach settlement, as shown in Table
2-3. They found that bridge departures exhibit somewhat poorer behavior than bridge
approaches. The difference may be related to impact loading, which is caused by vehicles riding
off the bridge structure and landing on the subsided exit slab. Significant rider discomfort usually
is felt with a settlement of greater than or equal to 2 in. However, it was found that most
approach distress and rider discomfort were manifested in an approach-relative gradient. The
approach-relative gradient is defined as the differential settlement divided by the length over
Cracking at
the transition
from
approach
slab to
pavement
Reflective cracking
at joints
• Poor compaction
• Impact load effect
• Reflection cracks
• Settlement
Dip after
approach
slab
Differential
settlement between
approach slab and
pavement
• Consolidation of
foundation soil
• Embankment vertical
deformation
• Poor compaction of
filler
10
which the settlement occurs. This led to the development of the following criteria for the
remediation of differential movement at the approach embankment-bridge interface. The
criterion for initiating remedial measures is an approach-relative gradient of greater than or equal
to 1/200 (Long et al., 1998). The approach-relative gradient can be estimated easily from an
elevation survey of the approach that extends at least 200 ft from the bridge ends. With this
criterion, most of approach pavements with slopes greater than 1/200 in Iowa, as shown in
Figure 2-4, were identified for M&R based on ride quality information determined from
independent field tests (White et al., 2007).
Figure 2-3 Rehabilitation technique selection process for regular pavements (Illinois DOT,
2008)
Table 2-3 Subjective rating system for differential settlement (Long et al., 1998)
Qualitative Visual
Rating
Approach/Bridge Interface
Description
Differential Settlement
0 No bump 0 in
1 Slight bump < 1 in
2 Moderate bump < 2 in
3 Significant bump < 3 in
4 Large bump > 3 in

11
Figure 2-4 Histogram of bridge approach relative gradient in Iowa (White et al., 2007)
Another method for documenting the ride quality of approach pavements is through evaluating
the IRI data (Sayers, 1995). Smoothness is the single most important indicator of performance
from the standpoint of the traveling public since it affects driver safety, fuel efficiency, ride
quality, and vehicle wear and tear (FHWA, 2006).
Das et al. concluded that an IRI value of 250 in/mi or less at bridge approaches indicates a very
good ride quality. On the other hand, if the IRI value reaches 630 in/mi, the approach leading to
a bridge is considered to have a very poor ride quality (Das et al., 1999).
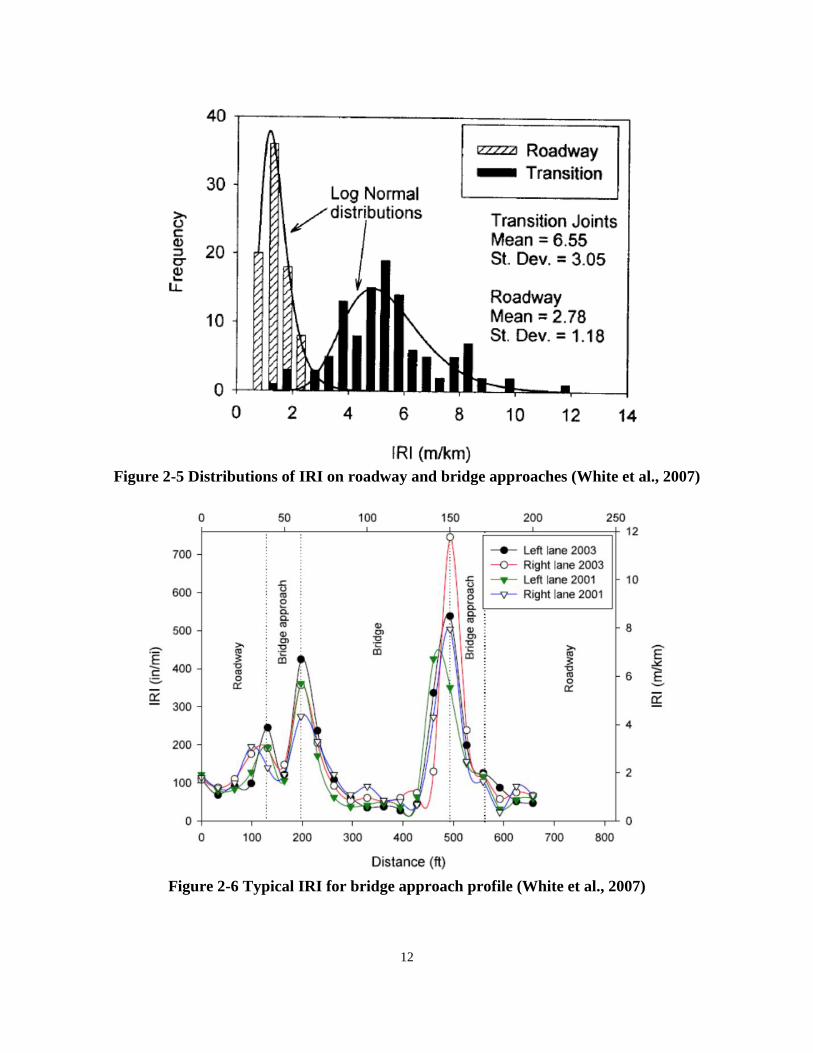
White et al. investigated the IRI values at the transition locations for 23 bridge
approach/departure pavements, with typical results shown in Figure 2-5 and Figure 2-6 (White et
al., 2005). They found that the IRI on bridge approach/departure pavements increased with
pavement age, and was greater on the outer lane than that on the inner lanes. Minimum
smoothness values were observed at transition between bridge-approach slab and approach slab-
roadway. Average IRI values on bridge approach/departure pavements were over two times
higher than those on the adjacent roadways. They also found that minimum smoothness value
can be used as the criterion for initiating remediation. A new indicator, named as Bridge
Approach Index (BI), was defined in their study to evaluate the bridge approach performance.
This indicator was defined graphically as the area between the current bridge approach elevation
profile and the original elevation profile (as shown in Figure 2-7) divided by the bridge approach
length. They used both the maximum IRI and BI values to develop pavement condition rating
criteria, as shown in Figure 2-8 (White et al., 2005).
Lenke stated that bridge approach pavements should be visually inspected once the IRI rating of
the bridge approach/departure pavement is greater than 380 in/mi (Lenke, 2006).
12
Figure 2-5 Distributions of IRI on roadway and bridge approaches (White et al., 2007)
Figure 2-6 Typical IRI for bridge approach profile (White et al., 2007)

13
Figure 2-7 Illustrations of the definition of bridge approach index (BI) (White et al., 2005)
Figure 2-8 One rating system of bridge approach performance (White et al., 2005)

14
The rehabilitation criteria found in the literature for bridge approach pavements are summarized
in Table 2-4.
Table 2-4 Rehabilitation criteria for bridge approach pavements
Performance Indicators Rehabilitation Criteria
Differential Settlement (S) S ≥ 0.5 in (Wahls, 1990)
Approach-relative Gradient (Δ) Δ ≥ 1/100 (Long et al., 1998)
Bridge Approach Index (BI) BI ≥ 0.017 ft (White et al., 2005)
International Roughness Index (IRI) IRImax ≥ 380 in/mi (White et al., 2005)
In addition, the specific criteria about selecting rehabilitation methods for bridge approach
pavements in the state of Montana are summarized as follows. There are three options for bridge
approach pavement treatment: (1) 30-year bridge end treatment: 30-year design life would be
used for reconstruction of bridge approach pavement; (2) Minor bridge end treatment: if the
roadway within 100 ft of the bridge ends is showing increased signs of distress compared with
the overall project roadway condition, mill an additional 2.4 in (of existing plant mix and/or base
course) for the standard 200 ft transition and replace with new plant mix; (3) Applying no
additional treatment at the bridge end: if the roadway within 100 ft of the bridge ends is not
showing increased signs of distress compared with the overall project roadway condition, no
additional treatment is necessary beyond the standard milled transition (Montana DOT, 2015).
The general practice about bridge approach pavement milling and resurfacing design in South
Dakota is shown in Figure 2-9 (Gill L Hedman, personal communication, May 31, 2017).
Figure 2-9 Bridge approach pavement replacement design in South Dakota

15
Once it is decided to initiate the M&R activity, the first step in selecting the optimum M&R
technique for a bridge approach/departure pavement is to identify the causes of existing
pavement distresses. The selection process for M&R technique is often straightforward once the
causes are identified (Scullion, 2001). The common M&R techniques for bridge approach
pavements are listed in Table 2-5.
Table 2-5 Typical M&R techniques for bridge approach pavements
M&R Option Description Distress Addressed Picture
Crack Seals
Rubberized
asphalt materials
are used to fill
cracks that
develop in
pavement.
• Longitudinal
cracks
• Transverse cracks
• Reflection cracks
(For low severity)
Spray
Injection
Patching
The spray
injection process
can mix aggregate
and asphalt binder
together.
• Fatigue cracking
• Transverse
cracking
• Rutting
• Potholes
HMA
Patching
Patches are a
common method
of treating an area
of localized
distress.
• Raveling
• Rutting
• Cracking
• Potholes
• Settlement
Asphalt
Wedge
Asphalt wedge
(ranging in length
from 1 ft to 10 ft)
can be placed to
smooth the vertical
transition.
• Bump
• Rutting
• Cracking
• Potholes
• Settlement
• Patching
HMA
Overlay
Laying hot mix
asphalt layer over
an existing
pavement
structure.
• Bump
• Rutting
• Cracking
• Potholes
• Settlement
• Patching
Sources: (Dupont and Allen, 2002; Johanns and Craig, 2002; Maryland DOT, 2002)

16
Many agencies used asphalt resurfacing over an existing bridge approach as an inexpensive
method for solving the bridge approach problems. However, if the causes of pavement distresses
come from the sub-surface layer, the pavement distresses will not be addressed validly. If the
distresses identified in a pavement are related to structural deficiencies, the pavement section is
most likely not a candidate for preventive maintenance, and should instead be scheduled for
rehabilitation or reconstruction (Jayawickrama et al., 2005). To determine the major causes of
observed pavement distresses, detailed condition survey and analysis are needed.
2.4.2 FDOT Repair Practices
A review of FDOT pavement survey reports and rehabilitation recommendations memorandums
showed that over the last decade, there have been a few pavement rehabilitation projects in
which bridge approach pavements received extra repair effort than regular pavements, and
typically excessively thin asphalt layers were discovered in these bridge approach/departure
sections (Parkash and Moseley, 2009; Moseley, 2009, 2012, 2013; FDOT, 2009a, 2009b).
The FDOT District materials and maintenance offices were contacted for their current repair
practices for bridge approach/departure asphalt pavements. From received responses it is found
that the general repair practices for bridge approach/departure asphalt pavements are patching,
milling and resurfacing, compaction grouting and chemical grouting, and reconstruction.
• In Districts 1 & 7, in most cases the same milling was conducted on the approach slabs,
bridge approach pavements, and mainline pavements. If approach slab settlement and
noted pavement distress are caused by weak subsurface condition, pressure grouting and
chemical grouting are conducted below the approach slab and in the approach roadway
area. For example, in the project numbered as FPN 425032-1-62-01 in Okeechobee
County (completed in 2015), standard compaction grouting of the approach roadway area
and chemical grouting below the approach slab were recommended when it was found
that a combination of ground movement and surface water movement from the
bridge/roadway caused the issues (Bennett and Jean, 2015).
• In District 2, based on several pavement distress exploration reports (FIN 423432-1-52-
01, FIN 428803-1-52-01, and FIN 428804-1-52-01), it was found that there had been a
number of bridges on I-75 in District 2 whose approach/departure pavements exhibited
excessive distresses (i.e., rutting, fatigue cracking, and raveling). The recommended
repair strategy for the outer (truck) lane was typically milling 2.75 in existing pavement,
and resurfacing with 2 in Type SP SUPERPAVE Structural asphalt layer and 0.75 in FC-
5 friction course. However, when the thickness of asphalt layer is inadequate (4-6 in),
milling into the base layer to allow for a thick asphalt layer (one example is at least 7 in)
resurfacing was recommended, because the pavement structure outside of the area
adjacent to the approach and departure slabs is 9 or more inches of asphalt (Moseley,
2009). In addition, reconstruction of the bridge approach/departure asphalt pavements
with thicker asphalt layer was also recommended as needed, particularly for sections with
inadequate asphalt thickness (Moseley, 2009, 2012, 2013).
• In District 3, it was noted that generally pavements in the approach/departure areas
performed similarly to those on regular pavements. Current repair practice is typically
milling 2.75 in existing pavement, and resurfacing with 2 in Type SP SUPERPAVE
structural asphalt layer and 0.75 in FC-5 friction course.

17
• In Districts 4 & 6, due to increase of heavy traffic, the asphalt surface layer thickness of
regular pavements would increase during the resurfacing process. However, asphalt
surface layer thickness on bridge approach pavement does not change with time. When
the structural capacity of bridge approach pavement is not enough, the rehabilitation
practice would be full depth reconstruction.
• In District 5, there have been two projects in which corrective actions were taken on
bridge approaches that had exceeded the milling recommendations on the rest of the
roadways. The two projects are FPN 419437-1-52-01 on I-75 in Marion County
(completed in 2009) and FPN 423567-1-52-01 on I-95 in Brevard County (completed in
2011). The repair strategy was to mill deeper to remove all of the asphalt at the
approaches and even enter the base material. Such a strategy avoided the more expensive
reconstruction recommendations. Generally, District 5 considers a deeper rehabilitation
of bridge approaches than regular pavement based on asphalt layer thickness, the severity
of cracking on or near the approach, and the level of patching required to maintain the
approach.
2.5 Summary of Literature Review
Bridge approach/departure pavement is a complex system that consists of more structural
components than control sections. In addition to the distresses common on control sections (e.g.,
such as cracking and rutting), excessive surface deformation (e.g., dip, ramp, differential
settlement) is also frequently observed due to embankment deformation or foundation soil
consolidation. On Florida Interstate highways, typical distresses in bridge approach/departure
asphalt pavements are fatigue cracking and rutting. The typical causes for cracking and rutting
may include weak base layer or subgrade layer (high moisture content), structural deficiency
(thin layer), poor joints, and steep side slope. The specific causes for each bridge
approach/departure asphalt pavement distress can be identified after conducting one or more
detailed condition surveys, including visual inspection, asphalt pavement core testing, falling
weight deflectometer (FWD) testing, ground penetrating radar (GPR) survey, or standard
penetration test (SPT).
The literature contains several studies on the types and causes of asphalt pavement distresses on
bridge approaches/departures. A variety of contributing factors have been analyzed, but there is
little documentation or discussion on the asphalt layer thickness and its influence on pavement
performance. The technical reports and memorandums from FDOT, however, clearly showed the
presence of very thin asphalt layer adjacent to a bridge approach/departure slab and excessive
distresses in the corresponding pavement sections.
Criteria used to determine M&R needs for bridge approach/departure pavements (including
approach/departure slabs) have included differential settlement, approach-relative gradient,
smoothness (in terms of IRI), and bridge approach index.
M&R techniques for bridge approach/departure asphalt pavements include those for control
sections (e.g, crack sealing, patching, and milling and overlay), and some unique ones such as
asphalt wedging. It is noted in the literature that identification of the main causes of pavement
distresses is important because pavement distress may result from structural deficiencies that

18
have to be addressed at deep layers. In FDOT, the typical repair practice for bridge
approach/departure asphalt pavements is milling 2.75 in existing pavement, and resurfacing with
2 in structural asphalt layer and 0.75 in friction course. For bridge approaches/departures with
excessive pavement distresses and thin asphalt layers, deep milling into the base layer before
resurfacing was practiced in some districts. Reconstructing the approach/departure asphalt
pavements based on pavement design was also recommended as needed.
19
CHAPTER 3 QUESTIONNAIRE SURVEYS
3.1 Introduction
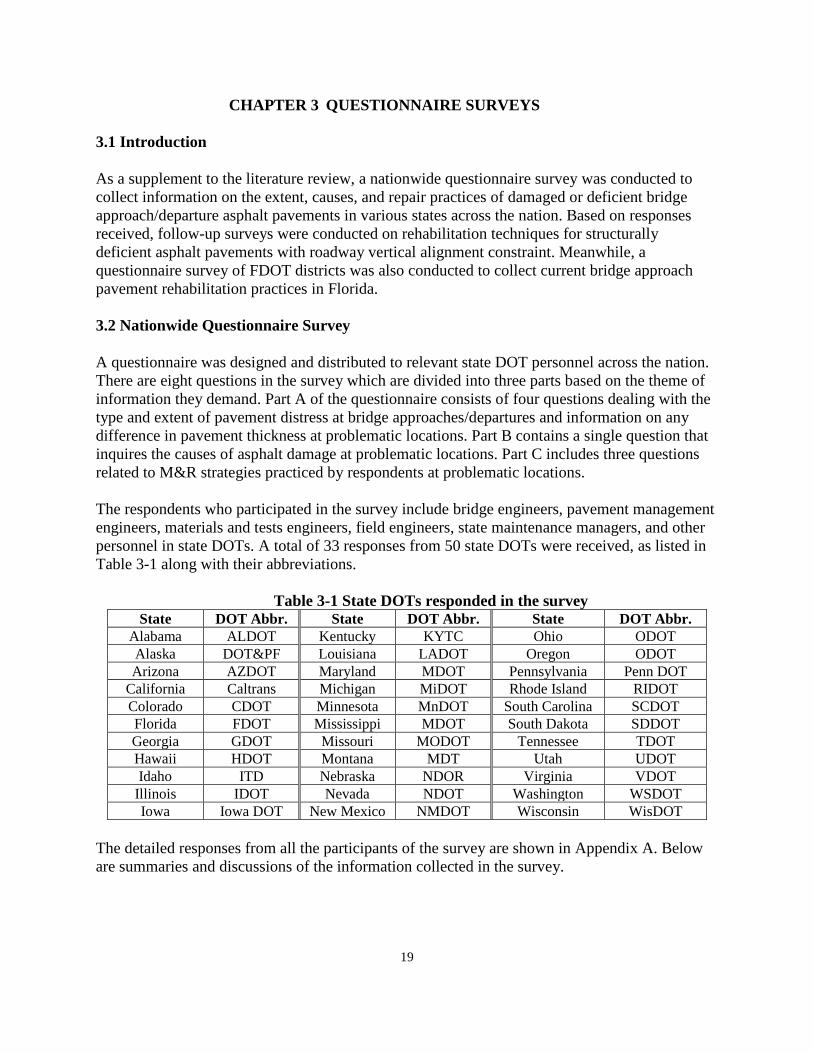
As a supplement to the literature review, a nationwide questionnaire survey was conducted to
collect information on the extent, causes, and repair practices of damaged or deficient bridge
approach/departure asphalt pavements in various states across the nation. Based on responses
received, follow-up surveys were conducted on rehabilitation techniques for structurally
deficient asphalt pavements with roadway vertical alignment constraint. Meanwhile, a
questionnaire survey of FDOT districts was also conducted to collect current bridge approach
pavement rehabilitation practices in Florida.
3.2 Nationwide Questionnaire Survey
A questionnaire was designed and distributed to relevant state DOT personnel across the nation.
There are eight questions in the survey which are divided into three parts based on the theme of
information they demand. Part A of the questionnaire consists of four questions dealing with the
type and extent of pavement distress at bridge approaches/departures and information on any
difference in pavement thickness at problematic locations. Part B contains a single question that
inquires the causes of asphalt damage at problematic locations. Part C includes three questions
related to M&R strategies practiced by respondents at problematic locations.
The respondents who participated in the survey include bridge engineers, pavement management
engineers, materials and tests engineers, field engineers, state maintenance managers, and other
personnel in state DOTs. A total of 33 responses from 50 state DOTs were received, as listed in
Table 3-1 along with their abbreviations.
Table 3-1 State DOTs responded in the survey State DOT Abbr. State DOT Abbr. State DOT Abbr.
Alabama ALDOT Kentucky KYTC Ohio ODOT Alaska DOT&PF Louisiana LADOT Oregon ODOT Arizona AZDOT Maryland MDOT Pennsylvania Penn DOT
California Caltrans Michigan MiDOT Rhode Island RIDOT Colorado CDOT Minnesota MnDOT South Carolina SCDOT Florida FDOT Mississippi MDOT South Dakota SDDOT Georgia GDOT Missouri MODOT Tennessee TDOT Hawaii HDOT Montana MDT Utah UDOT Idaho ITD Nebraska NDOR Virginia VDOT
Illinois IDOT Nevada NDOT Washington WSDOT Iowa Iowa DOT New Mexico NMDOT Wisconsin WisDOT
The detailed responses from all the participants of the survey are shown in Appendix A. Below
are summaries and discussions of the information collected in the survey.

20
3.2.1 Extent of Asphalt Pavement Damage at Bridge Approaches and Departures
Part A of the survey is designed to collect information on the extent of pavement damage found in
each respondent state by posing the following four questions:
1. Do you notice more distress or damage of the asphalt pavement adjacent to bridge
approach/departure slabs than on regular asphalt pavement sections on highways in your
state?
2. Roughly what percentage of asphalt pavements adjacent to bridge approach/departure
slabs have showed more distresses than regular asphalt pavement sections on highways in
your state?
3. Can you please describe the types of asphalt pavement distress you have observed
adjacent to bridge approach and departure slabs?
4. In the areas where you noticed distress or damage on the asphalt pavement, was there a
significant difference in the asphalt thickness adjacent to the bridge approaches or
departures compared to the rest of the roadway?
The responses received from 33 states for each of the above question are summarized hereafter.
For Question 1, 18 out of 33 respondents answered in the affirmative, as shown in Figure 3-1.
Figure 3-1 Is more damage observed in asphalt pavements near bridges
For Question 2, only three states said that they observed over 50% of pavement damage at the
problematic locations. 20 states responded that they typically see less than 25% of pavement
damage at such locations. Figure 3-2 describes the responses to Question 2 in more details.
18
15
Pavement Damage Observed
Yes
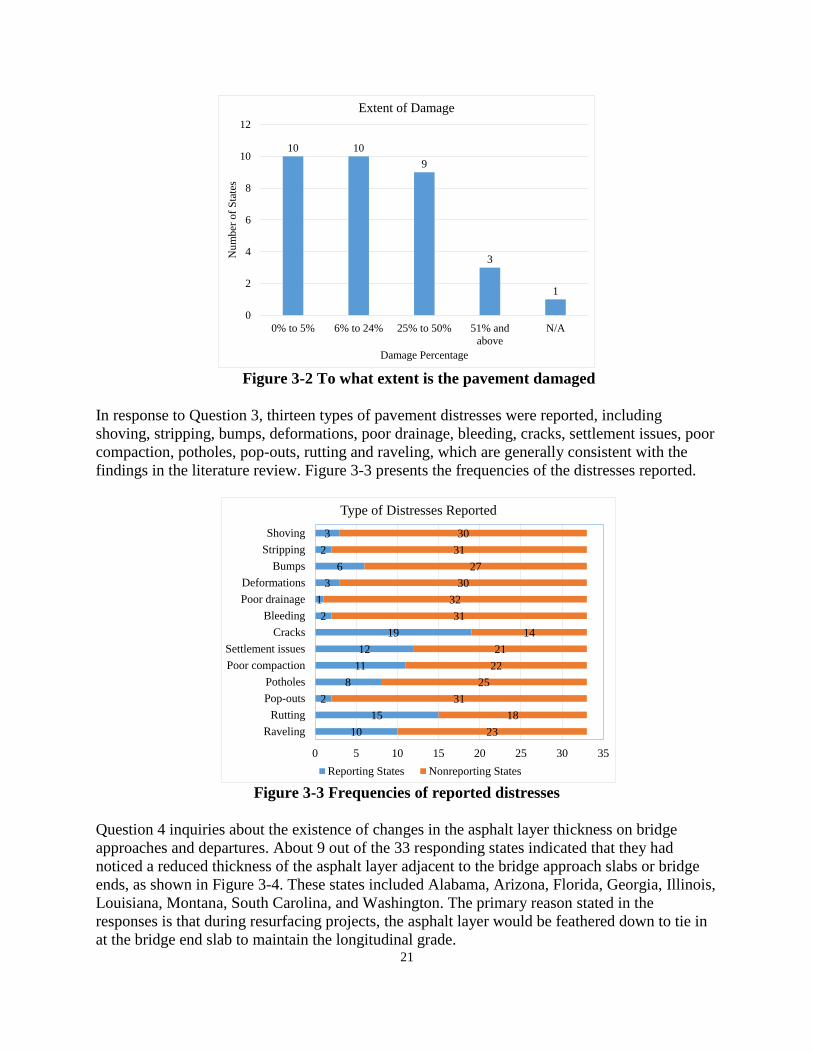
21
Figure 3-2 To what extent is the pavement damaged
In response to Question 3, thirteen types of pavement distresses were reported, including
shoving, stripping, bumps, deformations, poor drainage, bleeding, cracks, settlement issues, poor
compaction, potholes, pop-outs, rutting and raveling, which are generally consistent with the
findings in the literature review. Figure 3-3 presents the frequencies of the distresses reported.
Figure 3-3 Frequencies of reported distresses
Question 4 inquiries about the existence of changes in the asphalt layer thickness on bridge
approaches and departures. About 9 out of the 33 responding states indicated that they had
noticed a reduced thickness of the asphalt layer adjacent to the bridge approach slabs or bridge
ends, as shown in Figure 3-4. These states included Alabama, Arizona, Florida, Georgia, Illinois,
Louisiana, Montana, South Carolina, and Washington. The primary reason stated in the
responses is that during resurfacing projects, the asphalt layer would be feathered down to tie in
at the bridge end slab to maintain the longitudinal grade.
10 10
9
3
1
0
2
4
6
8
10
12
0% to 5% 6% to 24% 25% to 50% 51% and
above
N/A
Nu
mb
er o
f S
tate
s
Damage Percentage
Extent of Damage
10
15
2
8
11
12
19
2
1
3
6
2
3
23
18
31
25
22
21
14
31
32
30
27
31
30
0 5 10 15 20 25 30 35
Raveling
Rutting
Pop-outs
Potholes
Poor compaction
Settlement issues
Cracks
Bleeding
Poor drainage
Deformations
Bumps
Stripping
Shoving
Type of Distresses Reported
Reporting States Nonreporting States

22
Figure 3-4 Changes in asphalt layer thickness on bridge approaches and departures
3.2.2 Causes of Asphalt Pavement Damage on Bridge Approaches and Departures
Part B is aimed at gathering information on the causes of pavement damage on bridge approaches
and departures. There is only one question (Question 5) in this section.
5. What do you think are the potential causes of asphalt pavement distress adjacent to bridge
approach/departure slabs in your state?
The causes of pavement distresses at problematic locations as reported by the respondents are
summarized below.
In Arizona they noticed that the distresses in asphalt pavement transitions are due to material
change from rigid to flexible. For most of the states (Penn DOT, TDOT, VDOT, NMDOT, MI
DOT, ITD, FDOT, CDOT, LADOT, Maryland DOT), damages near bridge approach and
departures are caused by inadequate compaction that eventually leads to a weak base.
Insufficient drainage and settlement issues are also reported by many states. Alaska DOT has
noticed damages near problematic bridges are due to plows and studded tires. Caltrans answered
that most of the cracks appear due to inadequate drainage behind the abutments and not enough
usage of non-erodible base. Georgia and Hawaii DOTs reported that they have observed the
main causes for pavement distress as improperly placed asphalt mixture and also poorly
maintained joint seal. Illinois DOT reported that the main causes of distress are expansion and
contraction of joints at pavement/bridge interface, grade settlement and pavement expansion.
ODOT reported the potential causes of pavement distress at bridge approaches include a
saturated and/or weak subgrade, moisture infiltration into pavement (stripping), and differential
loading responses between asphalt section and bridge ends. Occasionally, the bridge approaches
have been evaluated as structurally deficient. SCDOT reported that temperature changes at
problematic locations and variation in subgrade result in segregation. Also, difficulty in
achieving optimal compaction at problematic lotions also results in poor pavement quality.
MnDOT reported that distresses occur due to poor contractor workmanship. RIDOT noticed the
potential causes of asphalt pavement damage are time and traffic. Mississippi DOT gave two
9
24
Change in Thickness of Pavement
Yes No
23
main causes of pavement distress near bridge ends, which are inadequate compaction efforts of
the base near the bridge ends and the bumping of the pavement from the movement of the
approach/departure slabs over time. Maryland DOT opined that insufficient compaction at the
abutment gives raise to pavement damage at bridge ends. NDOT said that the cracks at bridge
approaches and departures appear due to saturated subgrade. MODOT and UDOT mentioned
differential settlement between the pavement and bridge structure to be the cause of distresses
near bridge approaches and departures. In Washington and Wisconsin states, the distresses are
caused by thin asphalt structure and compression failure of underlying concrete.
3.2.3 M&R Strategies for Asphalt Pavements at Bridge Approaches and Departures
The final part of this survey seeks information on M&R strategies pursued by various state
DOTs for asphalt pavements at bridge approaches and departures. There are three questions in
this section:
6. Are M&R activities more frequent on asphalt pavement sections at bridge
approaches/departures than on regular asphalt pavement sections on highways in your
state? Please explain the reasons.
7. Are there any special M&R strategies and guidelines for defective asphalt pavement
sections adjacent to bridge approach/departure slabs in your state?
8. Please provide other comments regarding the performance of asphalt pavements adjacent
to bridge approach/departure slabs in your state.
For Question 6, 12 out of the 33 respondent states (Caltrans, GDOT, IDOT, Maryland DOT, Iowa
DOT, KYTC, MiDOT, ODOT, SCDOT, Mississippi DOT, LADOT, and VDOT) said that they
perform M&R activities more frequently at problematic locations. Caltrans informed that due to
high load-induced stresses and bumps at problematic locations, the service life of pavements is
reduced. Consequently, the frequency of rehabilitation measures at problematic locations is
increased. GDOT and VDOT attributed the high frequency of maintenance activities in their
respective states to the poor performance of asphalt at the bridge tie-in. In Illinois and Iowa, the
multitude of potholes and settlement problems at bridge approaches and departures leads to
frequent repairs. KYTC remarked that they are continually patching bridge ends with no end in
sight. In Michigan, weak base gives rise to frequent repairs. ODOT takes additional maintenance
activities such as leveling or patching that required more frequently in their state. In regard to
rehabilitation, bridge approaches are typically evaluated at the same time as mainline pavement
is unless otherwise needed. SCDOT informed that presence of a cold joint between the two
different pavement types will give rise to pavement distresses. LADOT said that pavement
distresses at problematic locations are more frequent due to the nature of the transition from a
roadway structure to a bridge, and depending on the roadway pavement structure, the types of
distresses and potential causes may vary. Mississippi DOT said that unless the pavement is in
dire need of immediate repair the pavement will not get repaired until the surrounding roadway
receives an overlay or a mill and overlay. Contrarily, Maryland DOT said that they perform
M&R more frequently in order to add some wedge/level to bring the surface to the same level as
the bridge when settlement occurs.
Responses to Question 7 of the survey showed that most participant states do not have special
M&R strategies and guidelines for defective asphalt pavement sections adjacent to bridge
24
approach/departure slabs. Some states mentioned their specific M&R techniques. These states
include Arizona, Georgia, Illinois, Kentucky, Michigan, Tennessee, Utah, Virginia, Mississippi,
Washington, and Wisconsin. AZDOT said they design thicker pavement sections next to bridge
approaches when compared to the control section thickness. GDOT mainly follows steps like
patching with both hot mix asphaltic concrete and cold-placed mastic type patching material.
Illinois DOT has been following two major strategies, diamond grinding on decks and
approaches and also laying 4 to 6 ft HMA expansion patches utilizing bituminous expansion
particles. NDOT follows a special strategy of installing transverse pipe underdrains in granular
trenches and using a drained foundation course under a rebuilt pavement. NMDOT’s approach to
counter this problem is to jack up the approaches by injecting cementitious grout or polyurethane
into the subgrade/fill to correct the grade. In Tennessee (TDOT), in the event of settled approach
slabs, slab jacking work has been used to repair the deficiency. ODOT said that bridge
approaches and mainline pavement are evaluated according to the same design service life
during a rehabilitation cycle unless reconstruction is needed. Maryland DOT maintenance forces
monitor their respective areas and when the bridge ends get bad enough, maintenance will
usually be performed by either of the following methods: blade path, mill/fill, using rut filling
mastic ½ in rocks- this is very durable, and it is also self-leveling which makes for a smooth,
quality, lasting fix. SCDOT does not have any special maintenance strategies at this time.
However, they are experimenting with several mastic (plant resin) repair materials at problematic
locations. LADOT utilizes a variety of rehabilitation techniques at problematic locations, their
strategies include, full depth patching for base failures, flowable fill to underseal the area (e.g.,
voids under the approach slab, sealing off gaps in the abutment, etc.), partial depth patching,
filling pot holes with cold mix and leveling with hot mix. In Mississippi the pavement is milled
at a deeper depth than just the one lift the project requires. This is done to allow two or more lifts
of asphalt to be laid up next to the approach/departure slabs.
The final question of this survey requests the respondents to provide comments regarding the
performance of asphalt pavements adjacent to bridge approach/departure slabs in their state.
Only 12 states (Alabama, Colorado, Florida, Georgia, Illinois, Kentucky, Nevada, South Dakota,
Montana, Mississippi, Colorado and Tennessee) responded with comments.
ALDOT commented that full depth reconstruction is utilized at problematic locations in an
attempt to provide significant structure to withstand the truck traffic loading. Florida remarked
that pavement failures happen from the bottom up, whether it is settlement occurring due to lack
of compaction, it will eventually make its way to the surface. Georgia DOT said that negligence
of contractors will often lead to pavement damage at problematic locations. Illinois DOT opined
that a specification must be issued for backfilling of abutments to get compaction instead of
relying on engineering judgement. Kentucky commented that the idea of approach and departure
slabs must be reevaluated. Nebraska commented that since they have a dry climate, they do not
face too many problems at bridge approaches and departures. South Dakota DOT attached their
“Bridge approach detail” to their response. Finally, Tennessee remarked that bridges and
pavements being built by separate contractors leading to poor construction and subsequently, to
damaged pavement. CDOT said that it is important to achieve proper compaction of asphalt
pavements at bridge approach/departures-sometimes, which means adjusting the roller pattern.
SCDOT opined that pavement distresses at problematic locations are always treated as first signs
of more prevalent pavement distresses. LADOT remarked that, good drainage and proper
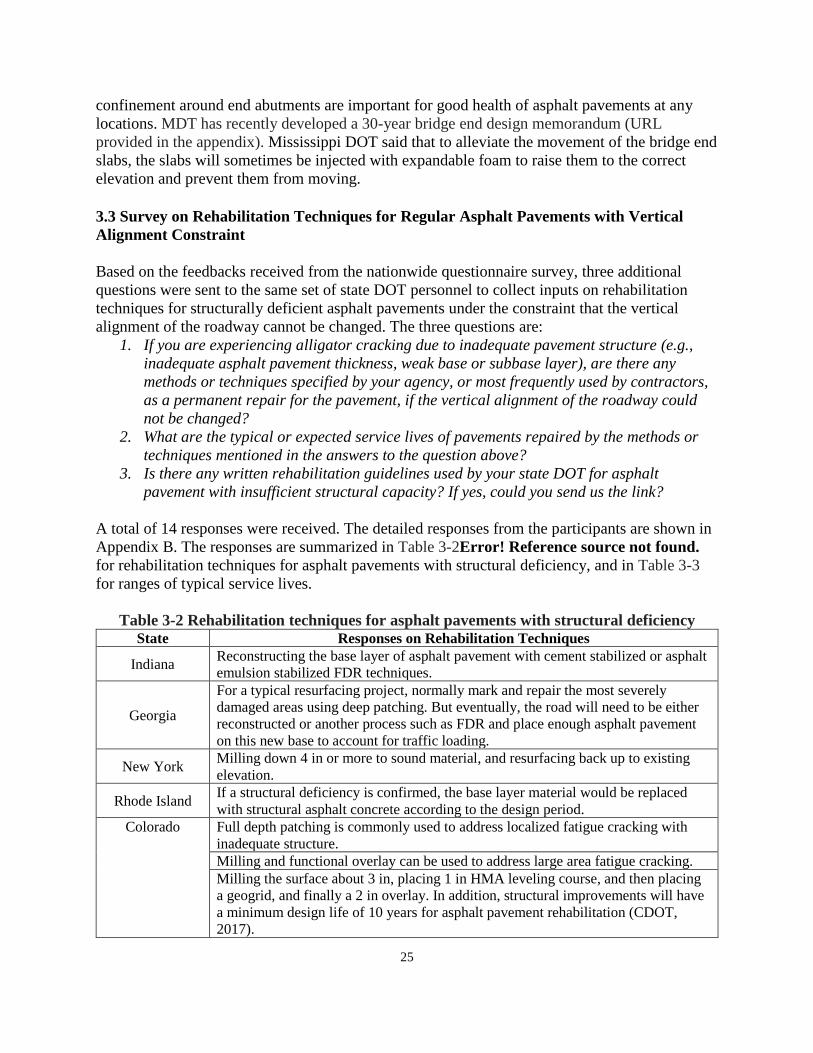
25
confinement around end abutments are important for good health of asphalt pavements at any
locations. MDT has recently developed a 30-year bridge end design memorandum (URL
provided in the appendix). Mississippi DOT said that to alleviate the movement of the bridge end
slabs, the slabs will sometimes be injected with expandable foam to raise them to the correct
elevation and prevent them from moving. 3.3 Survey on Rehabilitation Techniques for Regular Asphalt Pavements with Vertical
Alignment Constraint
Based on the feedbacks received from the nationwide questionnaire survey, three additional
questions were sent to the same set of state DOT personnel to collect inputs on rehabilitation
techniques for structurally deficient asphalt pavements under the constraint that the vertical
alignment of the roadway cannot be changed. The three questions are:
1. If you are experiencing alligator cracking due to inadequate pavement structure (e.g.,
inadequate asphalt pavement thickness, weak base or subbase layer), are there any
methods or techniques specified by your agency, or most frequently used by contractors,
as a permanent repair for the pavement, if the vertical alignment of the roadway could
not be changed?
2. What are the typical or expected service lives of pavements repaired by the methods or
techniques mentioned in the answers to the question above?
3. Is there any written rehabilitation guidelines used by your state DOT for asphalt
pavement with insufficient structural capacity? If yes, could you send us the link?
A total of 14 responses were received. The detailed responses from the participants are shown in
Appendix B. The responses are summarized in Table 3-2Error! Reference source not found.
for rehabilitation techniques for asphalt pavements with structural deficiency, and in Table 3-3
for ranges of typical service lives.
Table 3-2 Rehabilitation techniques for asphalt pavements with structural deficiency State Responses on Rehabilitation Techniques
Indiana Reconstructing the base layer of asphalt pavement with cement stabilized or asphalt
emulsion stabilized FDR techniques.
Georgia
For a typical resurfacing project, normally mark and repair the most severely
damaged areas using deep patching. But eventually, the road will need to be either
reconstructed or another process such as FDR and place enough asphalt pavement
on this new base to account for traffic loading.
New York Milling down 4 in or more to sound material, and resurfacing back up to existing
elevation.
Rhode Island If a structural deficiency is confirmed, the base layer material would be replaced
with structural asphalt concrete according to the design period.
Colorado Full depth patching is commonly used to address localized fatigue cracking with
inadequate structure.
Milling and functional overlay can be used to address large area fatigue cracking.
Milling the surface about 3 in, placing 1 in HMA leveling course, and then placing
a geogrid, and finally a 2 in overlay. In addition, structural improvements will have
a minimum design life of 10 years for asphalt pavement rehabilitation (CDOT,
2017).

26
Table 3-2 Rehabilitation techniques for asphalt pavements with structural deficiency
(continued) State Responses on Rehabilitation Techniques
Nevada
Partial depth patching is used to address localized fatigue cracking.
Milling the existing surface and some of the aggregate base, stabilizing the base
with 2% cement, and then compact and overlay with 3 - 4 in asphalt pavement.
Missouri Stabilizing subgrade with polyurethane injection, then milling and overlay.
Washington If the alligator cracking is not widespread, full depth asphalt patching would be
considered for cracked areas. Then, milling and inlay would be used for the
remaining pavement.
Removing the existing pavement and underlying base and replacing with a new
long-life (50 years) section if the pavement section would need periodic renewal in
the form of milling and inlay.
Table 3-3 Typical range of empirical service lives for rehabilitation techniques State Rehabilitation Technique Service Life (Years)
Indiana Reconstruction > 20
Georgia Deep Patching 10
Full Depth Reclamation 20
New York Partial Depth Patching 2 - 4
Milling and Inlay 8 - 12
Rhode Island Milling and Inlay (to the base layer) 10 - 20
Missouri Milling and Inlay (< 5 in) 7 - 12
Thicker Milling and Inlay (> 5 in) 12 - 20
Washington
Mill and Inlay (3 - 4 in) 10 - 15
Milling and Inlay (with full-depth patching) 10 - 20
Reconstruction 50
Colorado
Full Depth Patching < 15
Milling and Functional Overlay 5 - 12
Milling and Structural Overlay (with a geogrid) 10 - 14
Nevada Partial Depth Patching 1 - 2
Milling and Inlay (3 - 4 in, cement-stabilized base) 12 - 15
3.4 Follow-up Survey on Rehabilitation Techniques for Bridge Approach Pavements
For the nine state DOTs that indicated thin asphalt layers in their bridge approach pavements in
the nationwide questionnaire survey, a follow-up survey was also conducted on their
rehabilitation techniques for bridge approach pavements. The typical questions include:
1. Are there any special M&R strategies and guidelines for defective asphalt pavement
sections adjacent to bridge approach slabs in your state?
2. Is there a rule of thumb (or guideline, manual) for determining the thickness of milling
and inlay for bridge approach pavement?
3. Based on your knowledge, what is the typical overlay thickness for bridge approach
pavement in your state?
4. When will your state choose milling and inlay instead of patching for bridge approach
pavements?
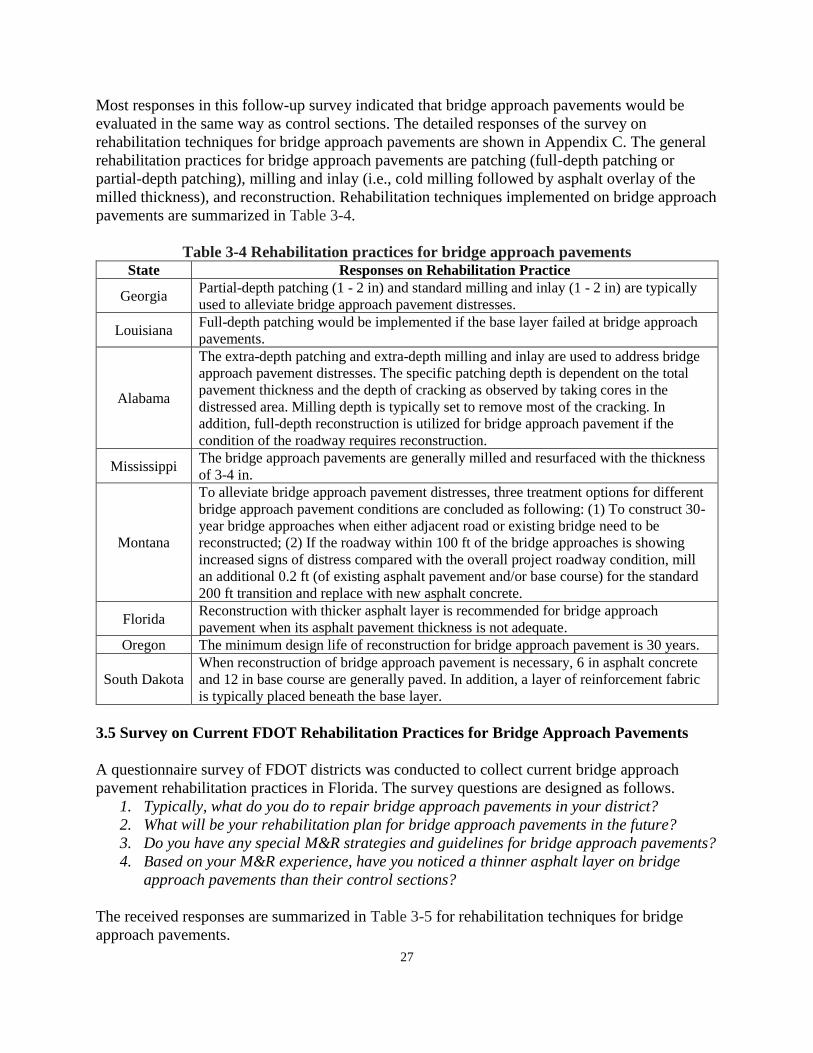
27
Most responses in this follow-up survey indicated that bridge approach pavements would be
evaluated in the same way as control sections. The detailed responses of the survey on
rehabilitation techniques for bridge approach pavements are shown in Appendix C. The general
rehabilitation practices for bridge approach pavements are patching (full-depth patching or
partial-depth patching), milling and inlay (i.e., cold milling followed by asphalt overlay of the
milled thickness), and reconstruction. Rehabilitation techniques implemented on bridge approach
pavements are summarized in Table 3-4.
Table 3-4 Rehabilitation practices for bridge approach pavements State Responses on Rehabilitation Practice
Georgia Partial-depth patching (1 - 2 in) and standard milling and inlay (1 - 2 in) are typically
used to alleviate bridge approach pavement distresses.
Louisiana Full-depth patching would be implemented if the base layer failed at bridge approach
pavements.
Alabama
The extra-depth patching and extra-depth milling and inlay are used to address bridge
approach pavement distresses. The specific patching depth is dependent on the total
pavement thickness and the depth of cracking as observed by taking cores in the
distressed area. Milling depth is typically set to remove most of the cracking. In
addition, full-depth reconstruction is utilized for bridge approach pavement if the
condition of the roadway requires reconstruction.
Mississippi The bridge approach pavements are generally milled and resurfaced with the thickness
of 3-4 in.
Montana
To alleviate bridge approach pavement distresses, three treatment options for different
bridge approach pavement conditions are concluded as following: (1) To construct 30-
year bridge approaches when either adjacent road or existing bridge need to be
reconstructed; (2) If the roadway within 100 ft of the bridge approaches is showing
increased signs of distress compared with the overall project roadway condition, mill
an additional 0.2 ft (of existing asphalt pavement and/or base course) for the standard
200 ft transition and replace with new asphalt concrete.
Florida Reconstruction with thicker asphalt layer is recommended for bridge approach
pavement when its asphalt pavement thickness is not adequate.
Oregon The minimum design life of reconstruction for bridge approach pavement is 30 years.
South Dakota
When reconstruction of bridge approach pavement is necessary, 6 in asphalt concrete
and 12 in base course are generally paved. In addition, a layer of reinforcement fabric
is typically placed beneath the base layer.
3.5 Survey on Current FDOT Rehabilitation Practices for Bridge Approach Pavements
A questionnaire survey of FDOT districts was conducted to collect current bridge approach
pavement rehabilitation practices in Florida. The survey questions are designed as follows.
1. Typically, what do you do to repair bridge approach pavements in your district?
2. What will be your rehabilitation plan for bridge approach pavements in the future?
3. Do you have any special M&R strategies and guidelines for bridge approach pavements?
4. Based on your M&R experience, have you noticed a thinner asphalt layer on bridge
approach pavements than their control sections?
The received responses are summarized in Table 3-5 for rehabilitation techniques for bridge
approach pavements.

28
Table 3-5 Current FDOT rehabilitation practices for bridge approach pavements District Description of Rehabilitation Practice
1 & 7
The typical rehabilitation practice for bridge approach pavements is milling and
resurfacing. In most cases, bridge approach pavements are suggested to be milled with
the same depth as their control sections. Specially, a crack-relief geotextile is typically
placed for bridge approach pavements with reflective cracking.
2
With consideration of several factors (e.g., number of bridges with severe bridge
approach/departure asphalt pavement distresses, high traffic volume on Interstate
highway, and the estimated repair costs), a short-term maintenance approach (e.g.,
patching, crack sealing, etc.) is commonly used to address the distresses (e.g.,
cracking, pothole, etc.). For the rehabilitation plan, a permanent repair would be
performed if it is a localized problem and a short-term maintenance approach would be
performed if it is beyond our capacity. In addition, the District Material Office
investigated and discovered a much thinner wedge of asphalt immediately adjacent to
the approach slab.
3
Bridge approach pavements are typically milled with a thickness of 2-3/4 in and
resurfaced with 2 in Type SP SUPERPAVE structural asphalt and 3/4 in FC-5 friction
course. In addition, several bridge approaches and departures were reconstructed with
8-1/2 in asphalt base, 2-1/2 in structural course, and 3/4 in FC-5 friction course.
4 & 6
As regards to thin bridge approach pavement, the original pavement design consisted
of about 2 in asphalt concrete with lime-rock base. This was adequate for the traffic
volume and loads at that time. Over the years, as traffic volume and loading increased,
resurfacing has increased the thickness of control section except for bridge approach
pavements. The latest resurfacing design include full-depth reconstruction for bridge
approach pavements when the pavement structure is inadequate.
5
Bridge approach pavements are typically rehabilitated at the time their control sections
are to be resurfaced. Then, if bridge approach pavements experienced significant
distresses, a costlier repair approach would be expected. The rehabilitation strategy is
deeper milling (e.g., even enter the base material) and asphalt inlay at bridge
approaches to avoid the expense of reconstruction of bridge approach pavement. In
addition, the differences of asphalt pavement thickness between bridge approach
pavements and their control sections are typically noticed on old roadways which have
been successively overlaid and resurfaced.
As can be seen from Table 3-5, the current rehabilitation practices for bridge approach
pavements adopted by FDOT district offices include patching and crack sealing for short-term
maintenance and repair, milling and inlay (including deep milling into the base layer) and full-
depth reconstruction for long-term rehabilitation. For bridge approach pavements with reflective
cracking, a geotextile is typically used during milling and inlay to reduce reflective cracking
potential. In addition, bridge approach pavements are typically rehabilitated along with their
control sections. Cold or hot in-place recycling was not mentioned as rehabilitation practices for
bridge approach pavements.
3.6 Summary of Survey Results
Based on the nationwide survey results, many states noticed more distresses in asphalt
pavements adjacent to bridge approach/departure slabs than in regular pavements. In some states,
thinner asphalt layers were observed adjacent to a bridge approach/departure slab, primarily due

29
to the practice of feathering down the asphalt layer during resurfacing to tie in at the bridge end
slab to maintain grade. Many states attributed the excessive distresses in bridge approach
pavements to inadequate compaction, insufficient drainage, and differential settlement. Over
30% states perform M&R activities more frequently on bridge approach pavements. However,
many states evaluate and treat the bridge approach pavements in the same way as control
sections and do not have special M&R strategies and guidelines for bridge approach/departure
asphalt pavements.
In the current literature, some performance indicators were proposed to determine M&R needs
for bridge approach pavements include differential settlement, approach-relative gradient, bridge
approach index, and IRI.
Based on the responses from FDOT personnel and other state DOT agencies, the general
rehabilitation techniques are crack sealing, patching (full depth patching or partial depth
patching; hot patching or cold patching), asphalt wedging/leveling (rut-filling), milling and
resurfacing, reconstruction for bridge approach/departure asphalt pavements, and compaction
grouting (slab jacking) and chemical grouting, and reconstruction for approach slabs. In many
states, pavement patches have to be placed at failed bridge approach pavement areas until the
sections get resurfaced. For milling and resurfacing of bridge approach pavements in the states of
Mississippi and Montana, the bridge approach/departure asphalt pavement would be milled to a
deeper depth (1.5 - 2.4 in more) than control section to allow for a thicker asphalt layer. The rule
of thumb for determining the depth of milling for a resurfacing project is normally based on the
pavement condition survey, FWD testing, and cores taken from the roadway. Pavement
condition survey can provide the percentage of distresses and the severity level. FWD testing
will determine if additional structure is required for future traffic loading. Pavement cores reflect
the severity and depth of cracking. Milling depth is typically set to remove the majority of
cracking. Full depth reconstruction of bridge approach/departure asphalt pavement is typically
adopted if the condition of regular pavement or bridge structure requires reconstruction. For
reconstruction of bridge approach pavements in the states of Washington, Montana, and Oregon,
pavement design life is normally longer than that of control sections. That is, the design
thickness of asphalt layer in bridge approach/departure asphalt pavements should be larger than
that in control sections.

30
CHAPTER 4 FLORIDA BRIDGE APPROACH AND DEPARTURE PAVEMENT DATA
COLLECTION AND ANALYSIS
4.1 Introduction
To determine the extent and potential causes of distresses in bridge approach/departure asphalt
pavements on Florida Interstate highways, relevant pavement condition data were collected and
analyzed. Statistical models were developed to evaluate the possible factors influencing
pavement performance and to help determine corresponding rehabilitation criteria.
The pavement condition data analyzed in this study came from two sources: FDOT highway
video log images available at FDOT website, and 2014-2015 pavement condition survey data
provided directly by the FDOT State Materials Office. The two-year pavement condition survey
data were recorded for each 0.001 mi (5.3 ft) highway section, which allows the analysis for
short pavement sections on bridge approaches/departures. A total of 1506 bridges were first
identified on Florida Interstate highways. Among these bridges, 351 have concrete pavements on
their approaches/departures and therefore were excluded. The analysis thus focused on the bridge
approach/departure asphalt pavements for the remaining 1,155 bridges.
4.2 Pavement Condition Analysis Based on Video Log Images
The FDOT video log program records images of FDOT roadways, which can be searched and
viewed from FDOT website based on the ID and mile posts of each roadway section.
4.2.1 Evaluation Procedure of Pavement Distresses Based on Video Log Images
The conditions of the bridge approach/departure asphalt pavements were visually assessed from
the FDOT video log images, following guidelines in the FDOT 2015 Flexible Pavement
Condition Survey Handbook (FDOT, 2015). Key steps in the survey process are discussed
below.
In Step 1, the starting point of a bridge, as illustrated in Figure 4-1, was first identified based on
the beginning mile post of the bridge. From this point going against the traffic direction, three
rectangular segments were surveyed. The first segment is the approach slab, and the other two
segments are each approximately 26 ft in length and usually 12 ft in width. Similarly, three more
segments on the other side of the bridge were surveyed, including the departure slab and two 26
ft segments. The 26 ft segment length was selected due to convenience of data collection from
video logs: any image visible on the video log web-screen moves to a 0.005 mi (26.4 ft) forward
location with one click on the ‘Frame Forward’ button. Backward movement of any image is,
similarly, in a 26.4 ft increment with each click on the ‘Frame Backward’ button.
In Step 2, the survey area was divided into five imaginary longitudinal sections, as shown in
Figure 4-2. Effectively, the survey segment has two sub-segments: wheel path area and outside
wheel path area.
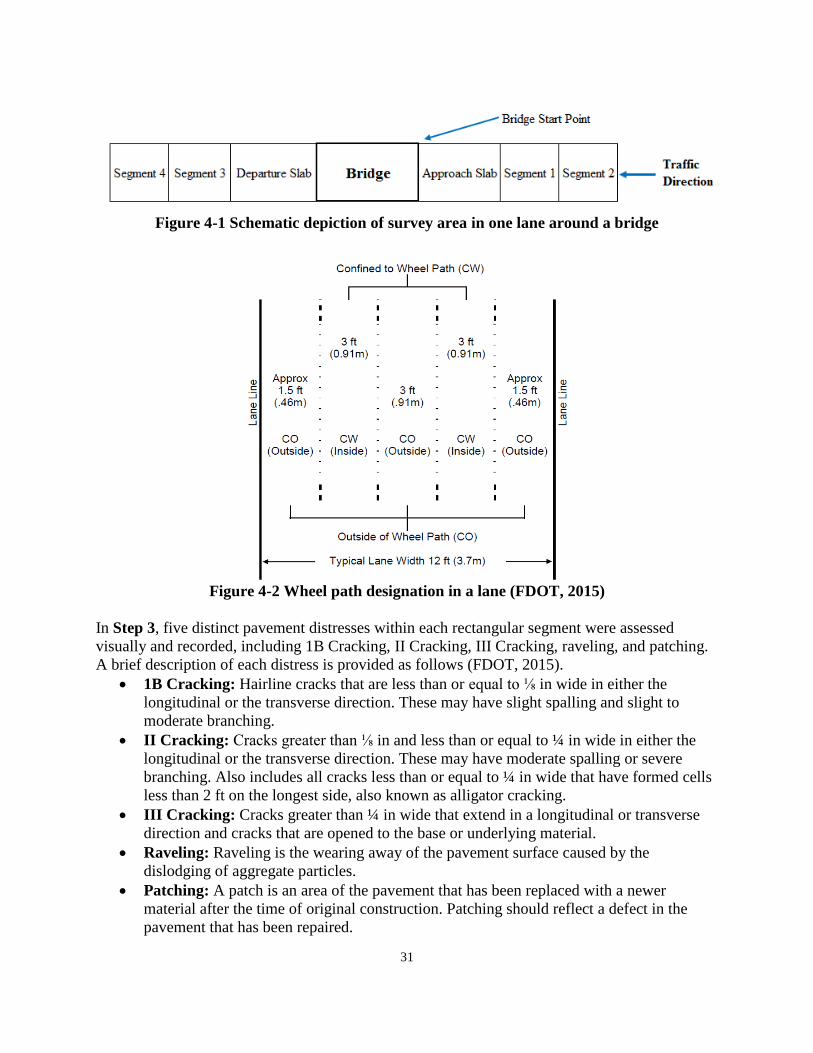
31
Figure 4-1 Schematic depiction of survey area in one lane around a bridge
Figure 4-2 Wheel path designation in a lane (FDOT, 2015)
In Step 3, five distinct pavement distresses within each rectangular segment were assessed
visually and recorded, including 1B Cracking, II Cracking, III Cracking, raveling, and patching.
A brief description of each distress is provided as follows (FDOT, 2015).
• 1B Cracking: Hairline cracks that are less than or equal to ⅛ in wide in either the
longitudinal or the transverse direction. These may have slight spalling and slight to
moderate branching.
• II Cracking: Cracks greater than ⅛ in and less than or equal to ¼ in wide in either the
longitudinal or the transverse direction. These may have moderate spalling or severe
branching. Also includes all cracks less than or equal to ¼ in wide that have formed cells
less than 2 ft on the longest side, also known as alligator cracking.
• III Cracking: Cracks greater than ¼ in wide that extend in a longitudinal or transverse
direction and cracks that are opened to the base or underlying material.
• Raveling: Raveling is the wearing away of the pavement surface caused by the
dislodging of aggregate particles.
• Patching: A patch is an area of the pavement that has been replaced with a newer
material after the time of original construction. Patching should reflect a defect in the
pavement that has been repaired.

32
More details on the distress data collection procedure are available in the literature (FDOT,
2015).
In Step 4, a 26 ft lane section far away from the bridge (usually 0.3 - 0.5 mi away from the
bridge) was selected as the control section. Pavement distresses on this section were assessed
visually and recorded in a way similar to that in Step 3.
In Step 5, the recorded distress data were used to compute a crack rating (CR) for each segment
on a scale of 0 to 10, with 0 representing severe pavement damage and 10 meaning no visible
distress on the pavement. The average CR value of Segments 1 and 2 was used to represent the
CR of the bridge approach pavement, while the average CR value of Segments 3 and 4
represented the CR of the bridge departure pavement.
Due to limitations of visual assessment of distresses from images, rutting was not identified or
estimated. Patching and raveling were not separately recorded for within and outside wheel paths
due to the difficulty in identifying the wheel-path/outside-wheel-path areas precisely from
images. Instead, they were recorded for the entire segment. They were later assumed to be evenly
distributed across the lane width in the data analysis. In most cases, available video logs were for
only the outer lane of a highway. In some cases, the video logs were for the lane next to the outer
lane. These two cases were not distinguished in the visual assessment. Instead, it was assumed
that all the video logs were from the pavement design (truck) lane.
4.2.2 Analysis Results of Pavement Distresses Based on Video Log Images
The CR computed in the visual assessment was used as the pavement condition indicator for
analyzing the extent of distresses in bridge approach/departure asphalt pavements. The analysis
was performed for the entire state for each individual district, and for Interstate highway route. A
general finding is that nearly one third of bridge approach/departure asphalt pavements exhibited
more distresses than control sections.
4.2.2.1 Overall analysis and results
A summary of the CR for asphalt pavements at five distinct locations is presented in Figure 4-3.
In this bar chart, each column represents an average value (shown in the column center) and the
error bar on each column represents the range defined by one positive standard deviation and one
negative standard deviation of the sample from the average value. As can be seen, overall the CR
is similar for bridge approach pavements and departure pavements, with an average value of 9.1.
This value is smaller than the average CR value of 9.5 from control sections, suggesting that on
average the condition of bridge approach/departure asphalt pavements was worse than that of
control sections. It is worthwhile to note that the approach/departure asphalt pavement conditions
have higher variation than those of control sections.

33
Figure 4-3 Summary of crack rating (CR) of asphalt pavements at all bridges
Among the 1,155 bridges surveyed, 317 bridges had a CR value of 9 or less for both approach
and departure asphalt pavements. These approach/departure asphalt pavements showed a general
trend of lower CR compared to control sections. On average, the CR is around 7.4 for bridge
approach/departure asphalt pavements and 8.4 for control sections, as shown in Figure 4-4.
The overall CR differences between approach/departure asphalt pavements and control sections
increase compared to the all-bridge scenario presented in Figure 4-3. Another important point is
the drop of average control section CR from 9.5 in Figure 4-3 to 8.4 in Figure 4-4. This suggests
that the condition of approach/departure asphalt pavements deteriorated faster than that of
control sections.

34
Figure 4-4 Summary of CR of asphalt pavements at bridges showing pavement distresses
Figure 4-5 shows the distributions of CR at approach, departure, and control sections. The
pavement condition in general was good. At approaches and departures, nearly 85 percent
segments showed CR values within a range of 8-10. At control sections, this group rises to over
90 percent which is even better. Error! Reference source not found. also reveals that nearly 15
percent of approach and departure asphalt pavements had a CR value below 8.
Figure 4-5 Distribution of CR
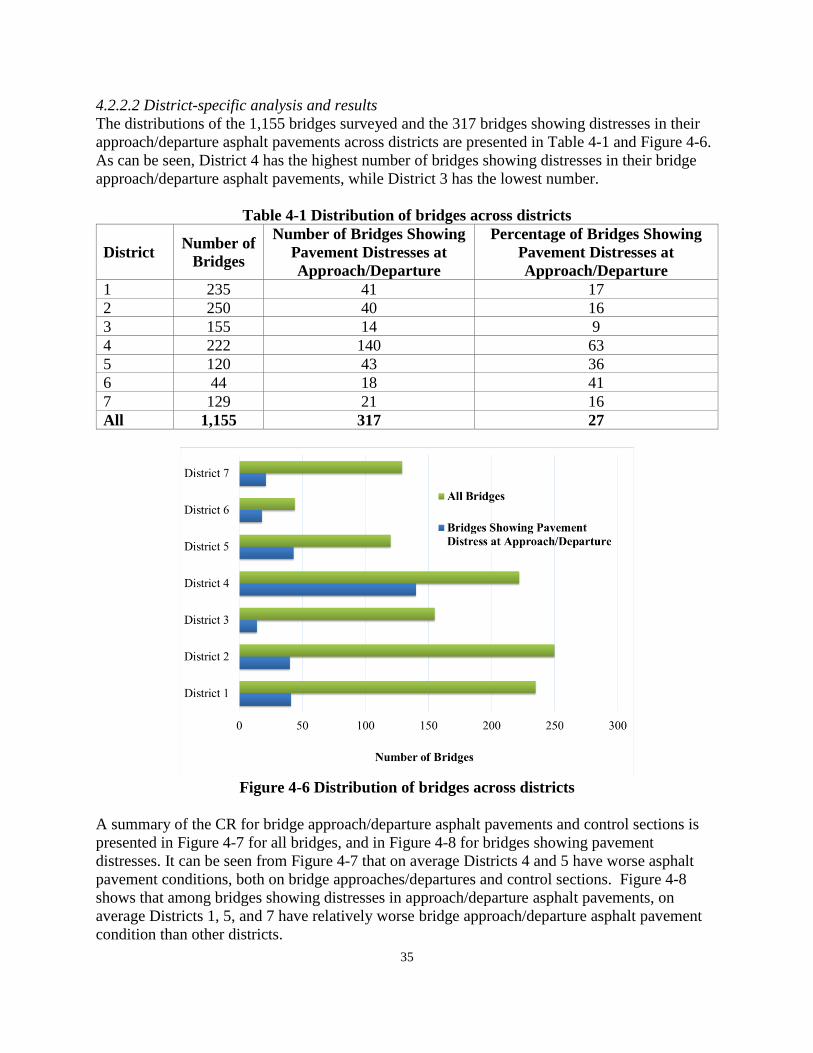
35
4.2.2.2 District-specific analysis and results
The distributions of the 1,155 bridges surveyed and the 317 bridges showing distresses in their
approach/departure asphalt pavements across districts are presented in Table 4-1 and Figure 4-6.
As can be seen, District 4 has the highest number of bridges showing distresses in their bridge
approach/departure asphalt pavements, while District 3 has the lowest number.
Table 4-1 Distribution of bridges across districts
District Number of
Bridges
Number of Bridges Showing
Pavement Distresses at
Approach/Departure
Percentage of Bridges Showing
Pavement Distresses at
Approach/Departure
1 235 41 17
2 250 40 16
3 155 14 9
4 222 140 63
5 120 43 36
6 44 18 41
7 129 21 16
All 1,155 317 27
Figure 4-6 Distribution of bridges across districts
A summary of the CR for bridge approach/departure asphalt pavements and control sections is
presented in Figure 4-7 for all bridges, and in Figure 4-8 for bridges showing pavement
distresses. It can be seen from Figure 4-7 that on average Districts 4 and 5 have worse asphalt
pavement conditions, both on bridge approaches/departures and control sections. Figure 4-8
shows that among bridges showing distresses in approach/departure asphalt pavements, on
average Districts 1, 5, and 7 have relatively worse bridge approach/departure asphalt pavement
condition than other districts.
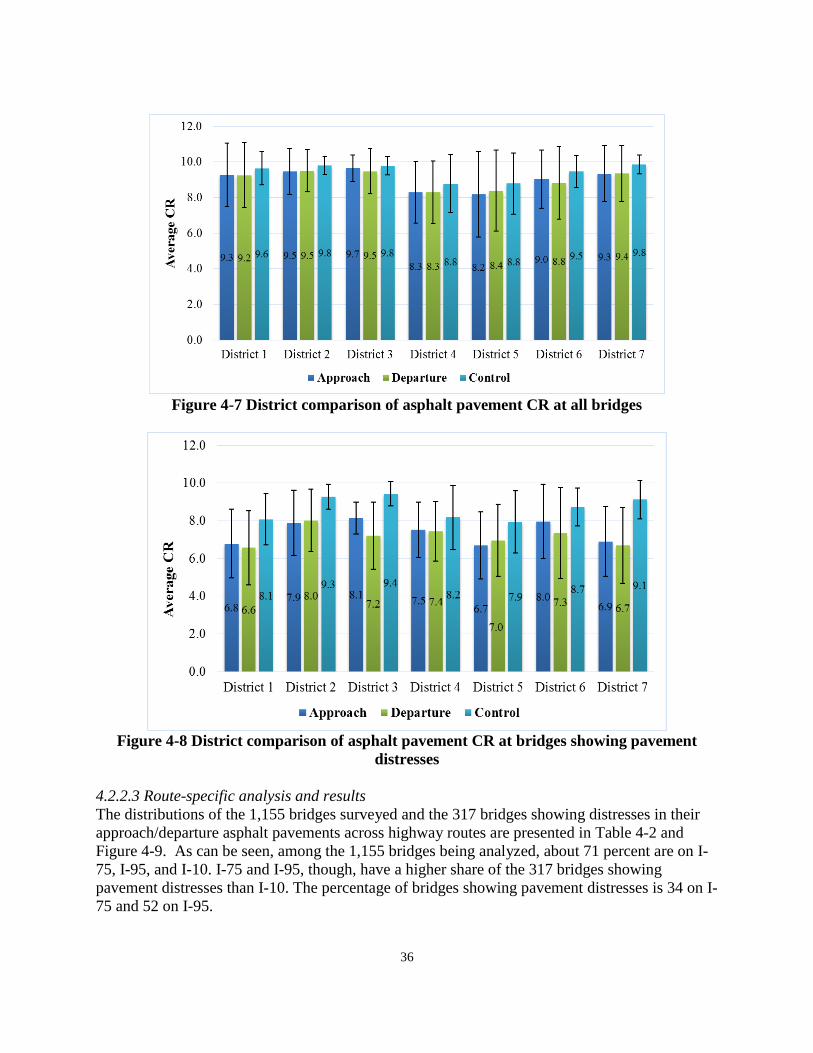
36
Figure 4-7 District comparison of asphalt pavement CR at all bridges
Figure 4-8 District comparison of asphalt pavement CR at bridges showing pavement
distresses
4.2.2.3 Route-specific analysis and results
The distributions of the 1,155 bridges surveyed and the 317 bridges showing distresses in their
approach/departure asphalt pavements across highway routes are presented in Table 4-2 and
Figure 4-9. As can be seen, among the 1,155 bridges being analyzed, about 71 percent are on I-
75, I-95, and I-10. I-75 and I-95, though, have a higher share of the 317 bridges showing
pavement distresses than I-10. The percentage of bridges showing pavement distresses is 34 on I-
75 and 52 on I-95.

37
Table 4-2 Distribution of bridges across routes
Interstate
Highway
Route
Number of
Bridges
Number of Bridges Showing
Distresses in
Approach/Departure Asphalt
Pavements
Percentage of Bridges
Showing Distresses in
Approach/Departure Asphalt
Pavements
I-75 374 127 34
I-95 252 131 52
I-10 202 22 11
I-275 107 2 2
I-295 104 3 3
I-4 48 14 29
I-395 36 16 44
I-595 23 2 9
I-110 9 0 0
All 1,155 317 27
Figure 4-9 Distribution of bridges across routes
A summary of the CR for bridge approach/departure asphalt pavements and control sections is
presented in Figure 4-10 for all bridges and in Figure 4-11 for bridges showing pavement
distresses. It can be seen from Figure 4-10 that on average I-4, I-75, I-95, and I-395 have worse
asphalt pavement conditions, both on bridge approaches/departures and control sections, than
other Interstate highway routes. Figure 4-11 shows that on average I-75 has more pavement
damage around bridges than other routes.
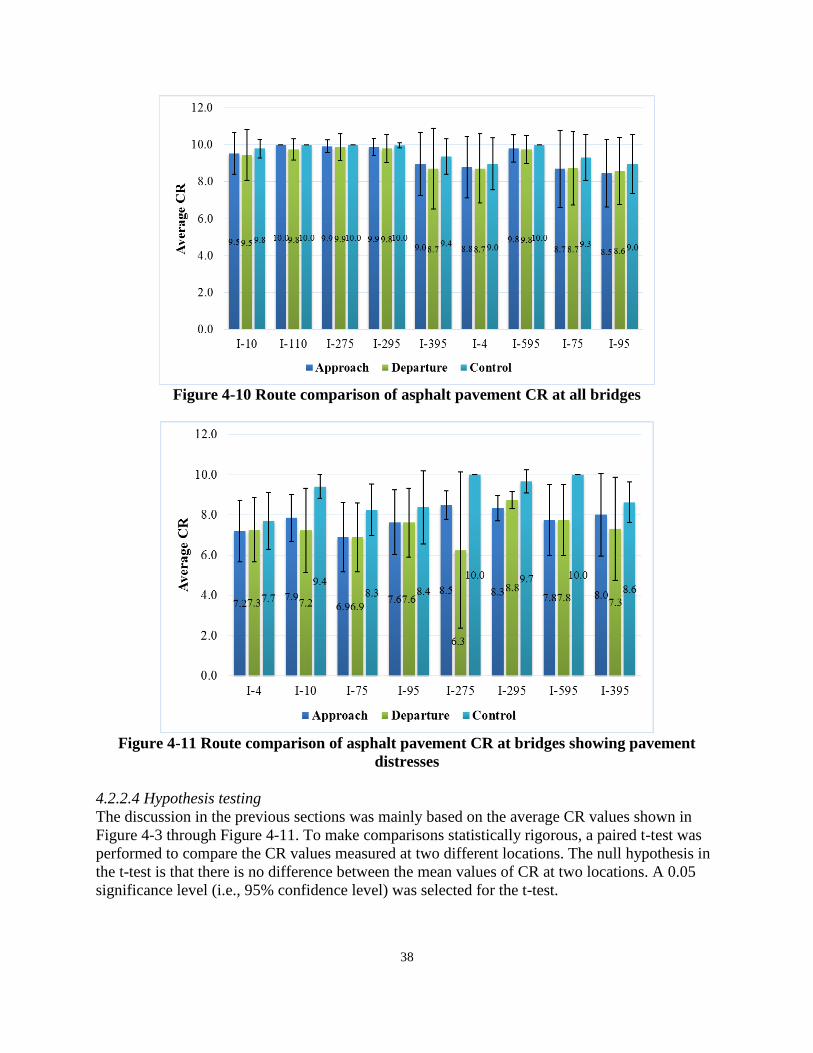
38
Figure 4-10 Route comparison of asphalt pavement CR at all bridges
Figure 4-11 Route comparison of asphalt pavement CR at bridges showing pavement
distresses
4.2.2.4 Hypothesis testing
The discussion in the previous sections was mainly based on the average CR values shown in
Figure 4-3 through Figure 4-11. To make comparisons statistically rigorous, a paired t-test was
performed to compare the CR values measured at two different locations. The null hypothesis in
the t-test is that there is no difference between the mean values of CR at two locations. A 0.05
significance level (i.e., 95% confidence level) was selected for the t-test.

39
A summary of the pairs of locations compared and the two-tailed t-test results is shown in Table
4-3. The details of the t-test results are shown in Appendix D. It can be seen that, either based on
all the 1,155 bridges surveyed or based on the 317 bridges showing distresses in their
approach/departure asphalt pavements, the CR of bridge approach/departure asphalt pavements
is statistically significantly different from that on control sections at the 95% confidence level.
The difference in CR between approach pavement and approach slab, however, is not
statistically significant. Similarly, the difference in CR between departure pavement and
departure slab is statistically insignificant.
Table 4-3 Summary of hypothesis test results
Based on All 1,155 Bridges
Based on 317 Bridges
Showing Pavement
Distresses
Pair of Locations
Compared
Significant
Pavement Condition
Difference?
P-
value
Significant Pavement
Condition
Difference?
P-
value
Approach, Control Yes 0.000 Yes 0.000
Departure, Control Yes 0.000 Yes 0.000
Approach, Approach slab No 0.487 No 0.089
Departure, Departure slab No 0.555 No 0.833
Approach, Departure No 0.913 No 0.461
4.3 Pavement Condition Analysis Based on 2014-2015 Pavement Condition Data
FDOT publishes an annual pavement condition forecast report on its website, which contains
pavement condition data over the last 16 years for each pavement section. The pavement sections
included in this report, however, are generally several miles in length, spanning over one or
several bridges. The performance data from that report do not differentiate bridge approach
pavements from control sections, and therefore cannot be used in this study. Instead, a two-year
(2014 and 2015) pavement condition data set with higher section resolution was provided
directly by the FDOT State Materials Office (SMO). This data set contains pavement condition
for each 0.001 mi (5.3 ft) highway section, in terms of rut depth, IRI, and ride number, and
therefore is analyzed in this section.
4.3.1 Evaluation Procedure of Pavement Distresses Based on Condition Data
The beginning and ending mile posts of each of the 1,155 bridges included in this study were
used to search for the needed pavement condition data from the given data set. A total of 1,013
bridges were identified in the data set. The other bridges were excluded due to missing condition
data on either bridge approaches or bridge departures. For each identified bridge, the following
steps were followed to evaluate pavement distresses.
In Step 1, the starting point of a bridge was first identified, as shown in Figure 4-12. From this
point going against the traffic direction, four rectangular segments were selected. The first
segment is the approach slab, and the other three segments (labelled as Approach 1, 2, and 3) are
each approximately 95 ft in length and usually 12 ft in width. Similarly, four more segments on

40
the other side of the bridge were selected, including the departure slab and three 95 ft segments
(labelled as Departure 4, 5, and 6). Choice of 95 ft as the length of each segment was made due
to the convenience of data collection from the FDOT pavement condition data set. Each
approach or departure segment consists of 18 0.001-mi highway sections, which leads to a length
of 0.018 mi (95 ft). The control section not shown in Figure 4-12 is usually 0.2 mi away from
bridge approach/departure and is 105 ft in length. Pavement condition data from the control
sections were used as benchmark for comparison with bridge approach/departure asphalt
pavement conditions.
Figure 4-12 Schematic depiction of survey area in one lane around a bridge
In Step 2, the rut depth, IRI, and ride number information were extracted for each bridge
approach/departure segment and control section.
In Step 3, Rut Rating and Ride Rating were computed for each segment from the rut depth, IRI,
and ride number data, following the procedures in the literature (FDOT, 2015). The Rut Rating is
obtained by subtracting from ten (10) the deduct value associated with the rut depth. A Rut
Rating of 10 indicates a pavement with only minor rutting. The Ride Rating is converted from
IRI, and is based upon a scale of 0 (very rough) to 10 (very smooth). A Ride Rating of 6 or less
represents a relatively rough pavement. For the IRI, a value less than 95 in/mi is considered to
represent good riding quality (FHWA, 2016).
4.3.2 Analysis Results of Pavement Distresses Based on Condition Data
The three pavement condition indices (i.e., Rut Rating, IRI, and Ride Rating) were used for
analyzing the extent of distresses in bridge approach/departure asphalt pavements. The analysis
was also performed for three scenarios: entire state, district, and route.
4.3.2.1 Overall analysis and results
A summary of the three condition indices on bridge approach and departure pavements and on
control sections for all the 1,013 bridges is presented in Table 4-4 and Figure 4-13 through
Figure 4-15. A summary of paired t-test results for Rut Rating and IRI are shown in Table 4-5,
with details of the t-test results shown in Appendix D. As can be seen from Table 4-4, the
average Rut Rating is slightly higher on bridge approach/departure asphalt pavements than on
control sections, indicating less rutting on bridge approaches/departures. This difference is
statistically significant at the 95% confidence level between the control section and Approaches
2 and 3 or Departures 4 and 5, as shown in Table 4-5. The average IRI and Ride Rating values,
however, show that the bridge approach/departure asphalt pavements are significantly rougher
than control sections. It may also be observed that the closer to the approach/departure slabs, the
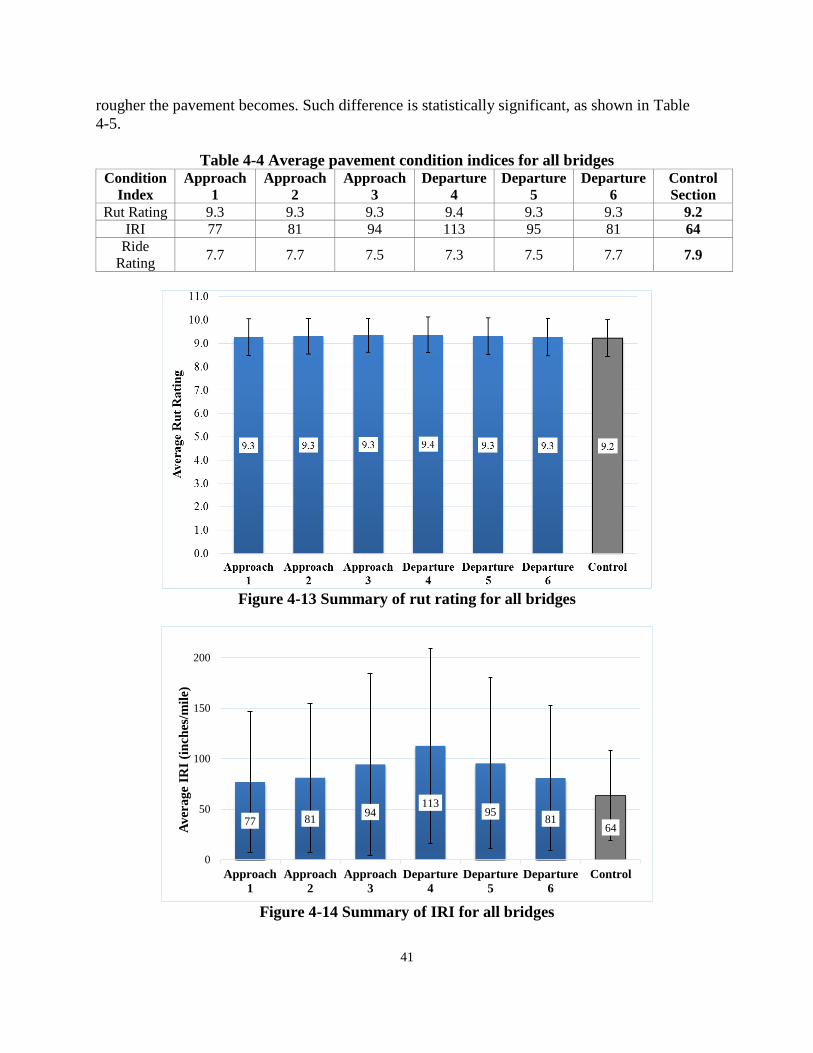
41
rougher the pavement becomes. Such difference is statistically significant, as shown in Table
4-5.
Table 4-4 Average pavement condition indices for all bridges Condition
Index
Approach
1
Approach
2
Approach
3
Departure
4
Departure
5
Departure
6
Control
Section
Rut Rating 9.3 9.3 9.3 9.4 9.3 9.3 9.2
IRI 77 81 94 113 95 81 64
Ride
Rating 7.7 7.7 7.5 7.3 7.5 7.7 7.9
Figure 4-13 Summary of rut rating for all bridges
Figure 4-14 Summary of IRI for all bridges
77 8194
11395
8164
0
50
100
150
200
Approach
1
Approach
2
Approach
3
Departure
4
Departure
5
Departure
6
Control
Av
era
ge
IRI
(in
ches
/mil
e)

42
Figure 4-15 Summary of ride rating for all bridges
Table 4-5 Summary of hypothesis test results of rut rating and IRI
Condition
Index Pair of Locations Compared Significant Difference
in Pavement Condition?
P-value
Rut Rating
Approach 1, Approach 2 No 0.313
Approach 2, Approach 3 No 0.130
Approach 1, Approach 3 Yes 0.010
Approach 1, Control No 0.127
Approach 2, Control Yes 0.012
Approach 3, Control Yes 0.000
Departure 4, Departure 5 Yes 0.032
Departure 5, Departure 6 No 0.245
Departure 4, Departure 6 Yes 0.001
Departure 4, Control Yes 0.000
Departure 5, Control Yes 0.001
Departure 6, Control No 0.154
IRI
Approach 1, Approach 2 No 0.059
Approach 2, Approach 3 Yes 0.000
Approach 1, Approach 3 Yes 0.000
Approach 1, Control Yes 0.000
Approach 2, Control Yes 0.000
Approach 3, Control Yes 0.000
Departure 4, Departure 5 Yes 0.000
Departure 5, Departure 6 Yes 0.000
Departure 4, Departure 6 Yes 0.000
Departure 4, Control Yes 0.000
Departure 5, Control Yes 0.000
Departure 6, Control Yes 0.000
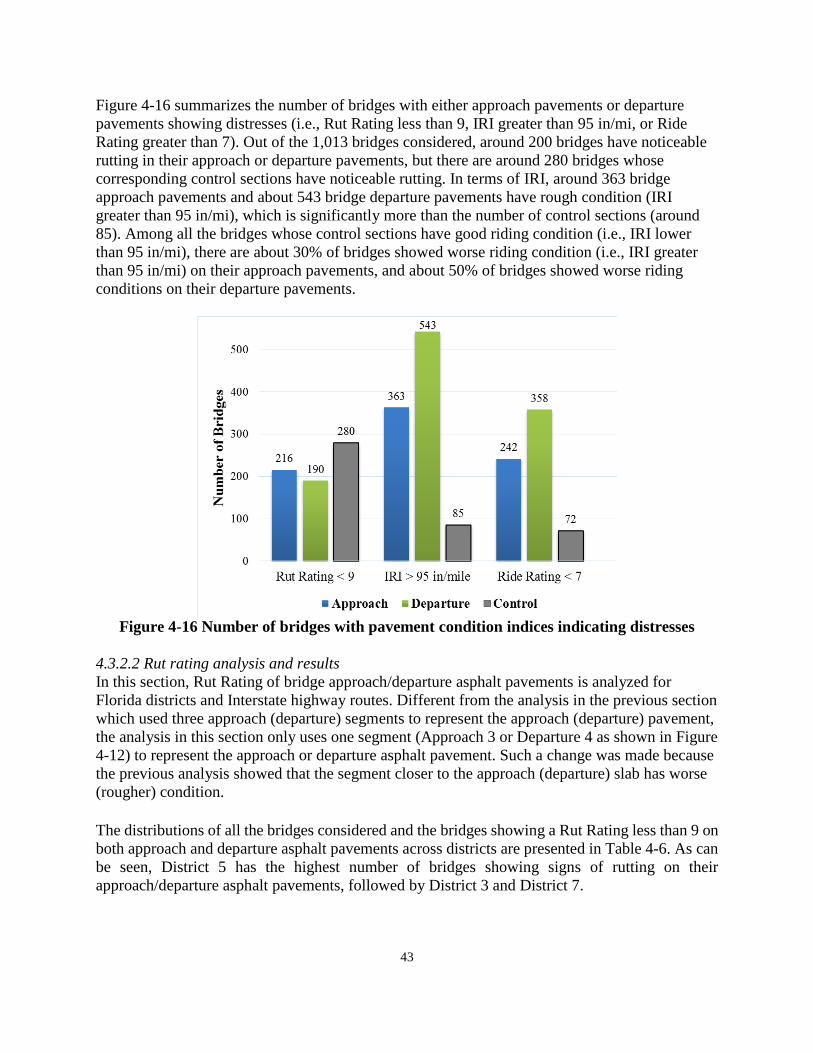
43
Figure 4-16 summarizes the number of bridges with either approach pavements or departure
pavements showing distresses (i.e., Rut Rating less than 9, IRI greater than 95 in/mi, or Ride
Rating greater than 7). Out of the 1,013 bridges considered, around 200 bridges have noticeable
rutting in their approach or departure pavements, but there are around 280 bridges whose
corresponding control sections have noticeable rutting. In terms of IRI, around 363 bridge
approach pavements and about 543 bridge departure pavements have rough condition (IRI
greater than 95 in/mi), which is significantly more than the number of control sections (around
85). Among all the bridges whose control sections have good riding condition (i.e., IRI lower
than 95 in/mi), there are about 30% of bridges showed worse riding condition (i.e., IRI greater
than 95 in/mi) on their approach pavements, and about 50% of bridges showed worse riding
conditions on their departure pavements.
Figure 4-16 Number of bridges with pavement condition indices indicating distresses
4.3.2.2 Rut rating analysis and results
In this section, Rut Rating of bridge approach/departure asphalt pavements is analyzed for
Florida districts and Interstate highway routes. Different from the analysis in the previous section
which used three approach (departure) segments to represent the approach (departure) pavement,
the analysis in this section only uses one segment (Approach 3 or Departure 4 as shown in Figure
4-12) to represent the approach or departure asphalt pavement. Such a change was made because
the previous analysis showed that the segment closer to the approach (departure) slab has worse
(rougher) condition.
The distributions of all the bridges considered and the bridges showing a Rut Rating less than 9 on
both approach and departure asphalt pavements across districts are presented in Table 4-6. As can
be seen, District 5 has the highest number of bridges showing signs of rutting on their
approach/departure asphalt pavements, followed by District 3 and District 7.

44
Table 4-6 Distribution of rut rating across districts
District Number of
Bridges
Number of Bridges Showing
Rut Rating less than 9 at
Approach & Departure
Percentage of Bridges Showing
Rut Rating less than 9 at
Approach & Departure
1 233 10 4
2 203 12 6
3 128 18 14
4 207 16 8
5 102 22 22
6 37 0 0
7 103 10 10
All 1,013 88 9
A summary of the Rut Rating for all the bridges across districts is presented in Figure 4-17. It can
be seen that the average Rut Rating is slightly lower on the control sections than on the bridge
approach/departure asphalt pavements in all districts except District 6.
Figure 4-17 District comparison of asphalt pavement rut rating at all bridges
The distribution of the bridges showing a Rut Rating less than 9 on both approach and departure
asphalt pavements across highway routes is presented in Table 4-7. As can be seen, on I-10, I-4,
and I-95, relatively more percentage of bridges showed signs of rutting on both approach and
departure asphalt pavements.

45
Table 4-7 Distribution of rut rating across routes
District Number of
Bridges
Number of Bridges Showing
Rut Rating less than 9 on
Both Approach and
Departure Pavements
Percentage of Bridges Showing
Rut Rating less than 9 on Both
Approach and Departure
Pavements
I – 10 165 22 13
I – 110 5 0 0
I – 275 99 9 9
I – 295 104 5 5
I – 395 36 0 0
I – 4 46 9 20
I - 595 19 1 5
I – 75 335 19 6
I – 95 204 23 11
All 1,013 88 9
A summary of the Rut Rating for all the bridges across routes is presented in Figure 4-18. It can
be seen that the average Rut Rating is slightly lower on the control sections than on the bridge
approach/departure asphalt pavements on most routes.
Figure 4-18 Route comparison of asphalt pavement rut rating at all bridges
4.3.2.3 IRI analysis and results
In this section, IRI of bridge approach/departure asphalt pavements is analyzed for Florida
districts and Interstate highway routes. Similar to the Rut Rating analysis, the analysis only uses
one segment (Approach 3 or Departure 4) to represent the approach or departure asphalt
pavement.

46
The distributions of all the bridges considered and the bridges showing an IRI greater than 95 in/mi
on both approach and departure asphalt pavements across districts are presented in Table 4-8 and
Figure 4-19. As can be seen, District 5 has the highest percentage of bridges showing a high IRI
value on both approach and departure asphalt pavements, followed by District 7 and District 4.
Table 4-8 Distribution of IRI across districts
District
Number
of
Bridges
Number of Bridges Showing
IRI greater than 95 in/mi on
Both Approach and
Departure Pavements
Percentage of Bridges Showing
IRI greater than 95 in/mi on
Both Approach and Departure
Pavements
1 233 19 8
2 203 19 9
3 128 8 6
4 207 29 14
5 102 27 26
6 37 4 11
7 103 17 17
All 1,013 123 12
Figure 4-19 Share of bridges in each district showing IRI greater than 95 in/mi on both
approach and departure pavements
A summary of the IRI across districts is presented in Figure 4-20 for all bridges, and in Figure
4-21 for bridges showing IRI greater than 95 in/mi on both approach and departure asphalt
pavements. It can be seen that the bridge approach/departure asphalt pavement IRI is
significantly larger than the control section IRI in all districts. Departure pavement IRI is
generally larger than approach pavement IRI in all districts. This is consistent with the findings
in the literature (Long et al., 1998).
233
203
128
207
102
37
103
19 198
29 27
417
0
50
100
150
200
250
District 1 District 2 District 3 District 4 District 5 District 6 District 7
Nu
mb
er o
f B
rid
ges
Total number of bridges
Bridges showing IRI greater than 95 inches/mile at Approach & Departure
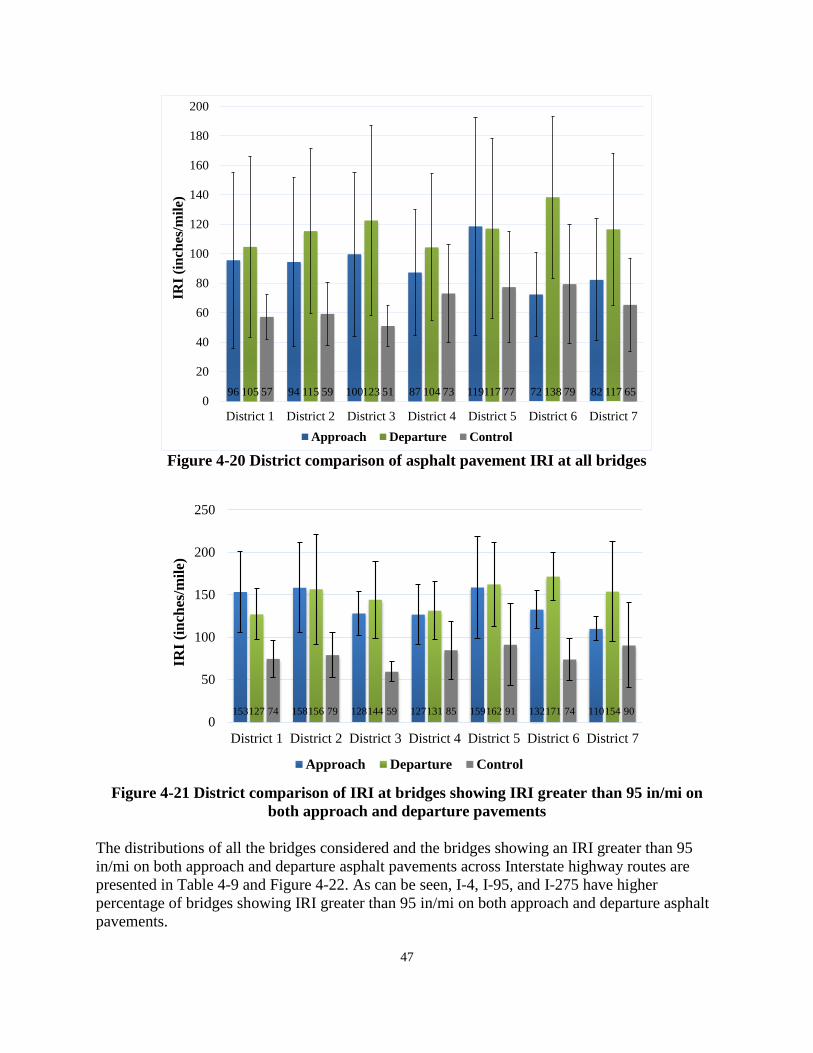
47
Figure 4-20 District comparison of asphalt pavement IRI at all bridges
Figure 4-21 District comparison of IRI at bridges showing IRI greater than 95 in/mi on
both approach and departure pavements
The distributions of all the bridges considered and the bridges showing an IRI greater than 95
in/mi on both approach and departure asphalt pavements across Interstate highway routes are
presented in Table 4-9 and Figure 4-22. As can be seen, I-4, I-95, and I-275 have higher
percentage of bridges showing IRI greater than 95 in/mi on both approach and departure asphalt
pavements.
96 94 100 87 119 72 82105 115 123 104 117 138 11757 59 51 73 77 79 650
20
40
60
80
100
120
140
160
180
200
District 1 District 2 District 3 District 4 District 5 District 6 District 7
IRI
(in
ches
/mil
e)
Approach Departure Control
153 158 128 127 159 132 110127 156 144 131 162 171 15474 79 59 85 91 74 900
50
100
150
200
250
District 1 District 2 District 3 District 4 District 5 District 6 District 7
IRI
(in
ches
/mil
e)
Approach Departure Control
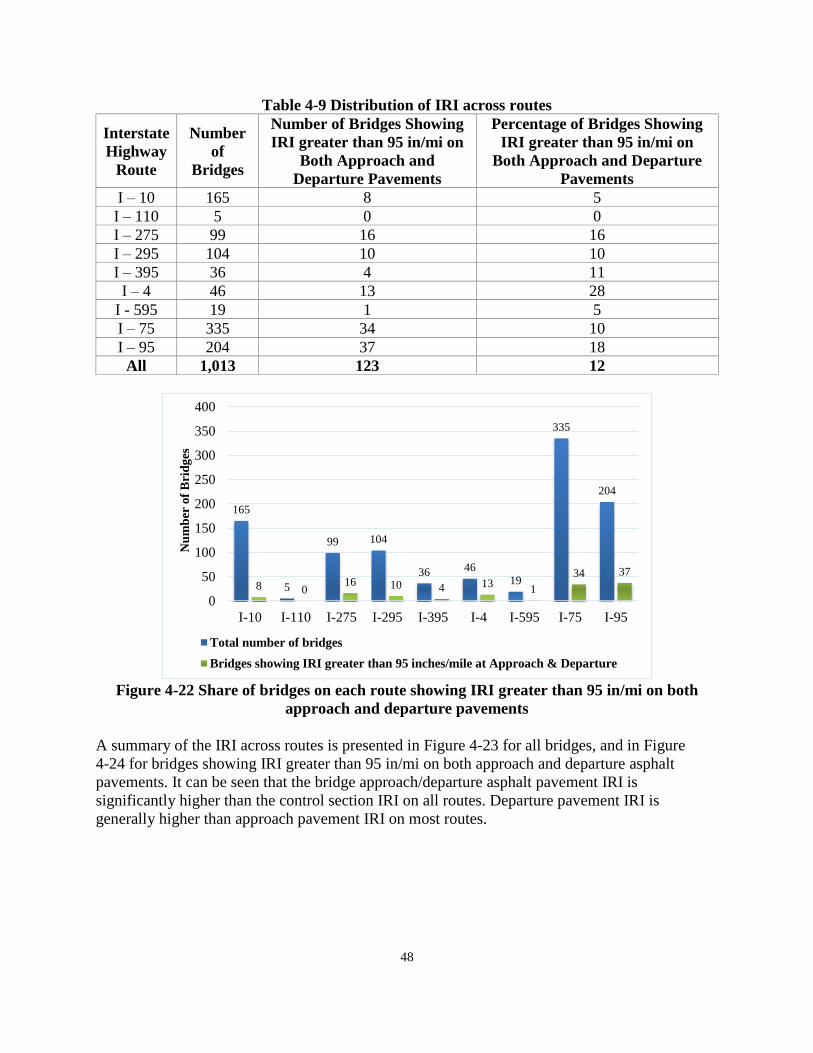
48
Table 4-9 Distribution of IRI across routes
Interstate
Highway
Route
Number
of
Bridges
Number of Bridges Showing
IRI greater than 95 in/mi on
Both Approach and
Departure Pavements
Percentage of Bridges Showing
IRI greater than 95 in/mi on
Both Approach and Departure
Pavements
I – 10 165 8 5
I – 110 5 0 0
I – 275 99 16 16
I – 295 104 10 10
I – 395 36 4 11
I – 4 46 13 28
I - 595 19 1 5
I – 75 335 34 10
I – 95 204 37 18
All 1,013 123 12
Figure 4-22 Share of bridges on each route showing IRI greater than 95 in/mi on both
approach and departure pavements
A summary of the IRI across routes is presented in Figure 4-23 for all bridges, and in Figure
4-24 for bridges showing IRI greater than 95 in/mi on both approach and departure asphalt
pavements. It can be seen that the bridge approach/departure asphalt pavement IRI is
significantly higher than the control section IRI on all routes. Departure pavement IRI is
generally higher than approach pavement IRI on most routes.
165
5
99 104
36 46
19
335
204
8 016 10 4 13
1
34 37
0
50
100
150
200
250
300
350
400
I-10 I-110 I-275 I-295 I-395 I-4 I-595 I-75 I-95
Nu
mb
er o
f B
rid
ges
Total number of bridges
Bridges showing IRI greater than 95 inches/mile at Approach & Departure

49
Figure 4-23 Route comparison of asphalt pavement IRI at all bridges
Figure 4-24 Route comparison of IRI at bridges showing IRI greater than 95 in/mi on both
approach and departure pavements
Since Ride Rating is inversely correlated with IRI, it was not further analyzed for the district and
route scenarios. It is expected that findings from its analysis should be similar to those from the
IRI analysis.
93 170 77 84 72 118 93 99 97118 50 120 128 141 118 93 106 10650 45 65 62 80 79 62 61 730
50
100
150
200
I-10 I-110 I-275 I-295 I-395 I-4 I-595 I-75 I-95
IRI
(in
ches
/mil
e)
Approach Departure Control
128 113 128 132 141 99 166 137144 155 176 171 151 121 136 14159 93 79 74 87 90 82 820
50
100
150
200
250
I-10 I-275 I-295 I-395 I-4 I-595 I-75 I-95
IRI
(in
ches
/mil
e)
Approach Departure Control Location

50
4.4 Asphalt Layer Thickness Analysis
As discussed in the literature review, in several FDOT pavement projects there existed a very
thin asphalt layer adjacent to a bridge approach/departure slab, which contributed to excessive
distresses in the pavement. The nationwide survey revealed that around 30% of the states
surveyed had experienced the thin asphalt layer issue in their bridge approach/departure asphalt
pavements. It is, therefore, worthwhile to investigate the asphalt layer thickness near the bridges
analyzed in this study.
FDOT does not maintain a statewide highway pavement structure database. Instead, a ground
penetration radar (GPR) data set is available from the FDOT SMO. This data set contains asphalt
layer thickness for a portion of the state highway network, which includes 113 bridges with
asphalt approach/departure pavements. This is about 10% of the Florida Interstate highway
bridges with approach/departure asphalt pavements.
4.4.1 GPR Data Selection Method
The GPR data were recorded at a varying spacing (i.e., pavement section length) on different
highways, as summarized in Table 4-10. For the GPR data recorded at a spacing of 100 ft, only
two data points were taken as representation of a bridge approach or departure pavement. This is
based on the assumption that at a distance of beyond 200 ft from the bridge approach or
departure slab, pavement sections may not well represent the bridge approach or departure
pavements. The two data points were used to calculate the average asphalt layer thickness on the
bridge approach or departure. For the GPR data recorded at a smaller spacing (5.28 ft), more data
points were used to calculate the average thickness. A control section was selected at a distance
of 0.2-0.3 mi away from each bridge to calculate the average asphalt layer thickness of control
sections.
Table 4-10 GPR data point spacing
Data Point
Spacing (ft)
Number of
Bridges
Number of Data Points at
Approach/Departure
Number of Data Points
at Control Section
100 83 2 3
47-50 25 2 3
5.28 5 6 6
4.4.2 General Asphalt Layer Thickness Trends
The average asphalt layer thicknesses for different pavement sections are shown in Figure 4-25.
As can be seen, for the 113 bridges investigated, the average asphalt layer thickness is
significantly lower (about 2 in less) on bridge approaches or departures than on control sections.

51
Figure 4-25 Comparison of asphalt layer thickness
4.4.3 District-Specific Asphalt Layer Thickness Trends
The number of bridges with available GPR data in each district is shown in Table 4-11. Note that
there is no GPR data for Districts 3 and 6. The average asphalt layer thicknesses for different
pavement sections are shown in Figure 4-26 for each district. As can be seen, District 5 has the
lowest asphalt layer thickness on bridge approaches/departures. This trend, however, may not
represent the actual scenario since the sample size is very small (GPR data are available for only
6 bridges in District 5). The difference in asphalt layer thickness between bridge
approach/departure asphalt pavements and control sections is most significant in District 2, with
an average value around 5 in, followed by District 5.
Table 4-11 GPR data availability in districts
District Number of Bridges Number of Bridges with Available
GPR Data
1 235 38
2 250 32
3 155 0
4 222 27
5 120 6
6 44 0
7 129 10
All 1,155 113
8.9
11.19.5
11.4
0.0
2.0
4.0
6.0
8.0
10.0
12.0
14.0
16.0
Approach Approach
Control
Departure Departure
Control
Asp
halt
Lay
er T
hic
kn
ess
(in
ches
)
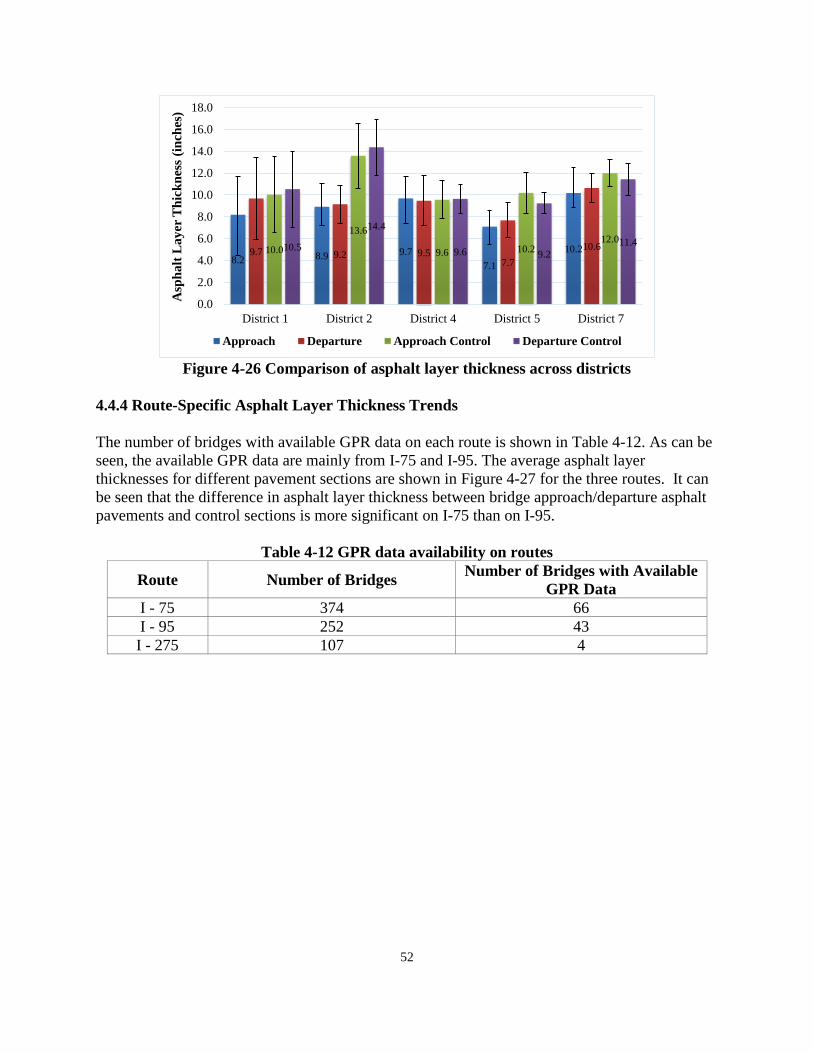
52
Figure 4-26 Comparison of asphalt layer thickness across districts
4.4.4 Route-Specific Asphalt Layer Thickness Trends
The number of bridges with available GPR data on each route is shown in Table 4-12. As can be
seen, the available GPR data are mainly from I-75 and I-95. The average asphalt layer
thicknesses for different pavement sections are shown in Figure 4-27 for the three routes. It can
be seen that the difference in asphalt layer thickness between bridge approach/departure asphalt
pavements and control sections is more significant on I-75 than on I-95.
Table 4-12 GPR data availability on routes
Route Number of Bridges Number of Bridges with Available
GPR Data
I - 75 374 66
I - 95 252 43
I - 275 107 4
8.2 8.9 9.7
7.1
10.29.7 9.2 9.57.7
10.610.0
13.6
9.6 10.212.0
10.5
14.4
9.6 9.2
11.4
0.0
2.0
4.0
6.0
8.0
10.0
12.0
14.0
16.0
18.0
District 1 District 2 District 4 District 5 District 7
Asp
ha
lt L
ay
er T
hic
kn
ess
(in
ches
)
Approach Departure Approach Control Departure Control
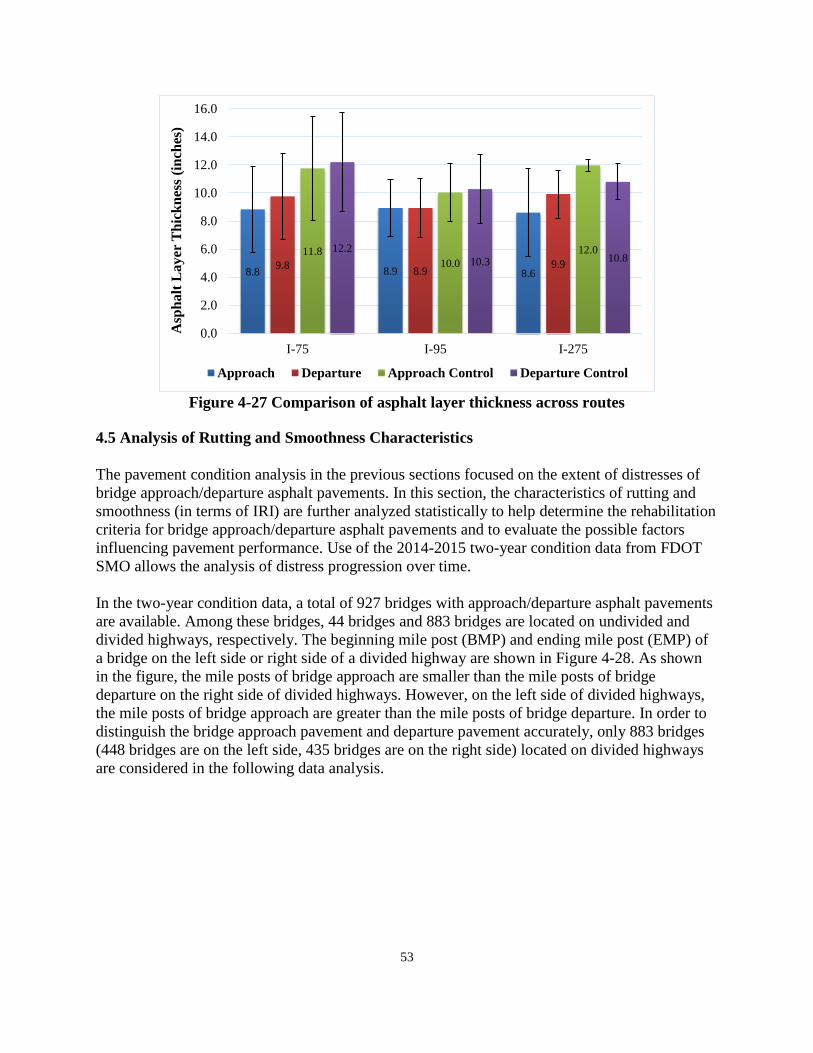
53
Figure 4-27 Comparison of asphalt layer thickness across routes
4.5 Analysis of Rutting and Smoothness Characteristics
The pavement condition analysis in the previous sections focused on the extent of distresses of
bridge approach/departure asphalt pavements. In this section, the characteristics of rutting and
smoothness (in terms of IRI) are further analyzed statistically to help determine the rehabilitation
criteria for bridge approach/departure asphalt pavements and to evaluate the possible factors
influencing pavement performance. Use of the 2014-2015 two-year condition data from FDOT
SMO allows the analysis of distress progression over time.
In the two-year condition data, a total of 927 bridges with approach/departure asphalt pavements
are available. Among these bridges, 44 bridges and 883 bridges are located on undivided and
divided highways, respectively. The beginning mile post (BMP) and ending mile post (EMP) of
a bridge on the left side or right side of a divided highway are shown in Figure 4-28. As shown
in the figure, the mile posts of bridge approach are smaller than the mile posts of bridge
departure on the right side of divided highways. However, on the left side of divided highways,
the mile posts of bridge approach are greater than the mile posts of bridge departure. In order to
distinguish the bridge approach pavement and departure pavement accurately, only 883 bridges
(448 bridges are on the left side, 435 bridges are on the right side) located on divided highways
are considered in the following data analysis.
8.8 8.9 8.69.8
8.99.9
11.810.0
12.012.2
10.3 10.8
0.0
2.0
4.0
6.0
8.0
10.0
12.0
14.0
16.0
I-75 I-95 I-275
Asp
ha
lt L
ay
er T
hic
kn
ess
(in
ches
)
Approach Departure Approach Control Departure Control
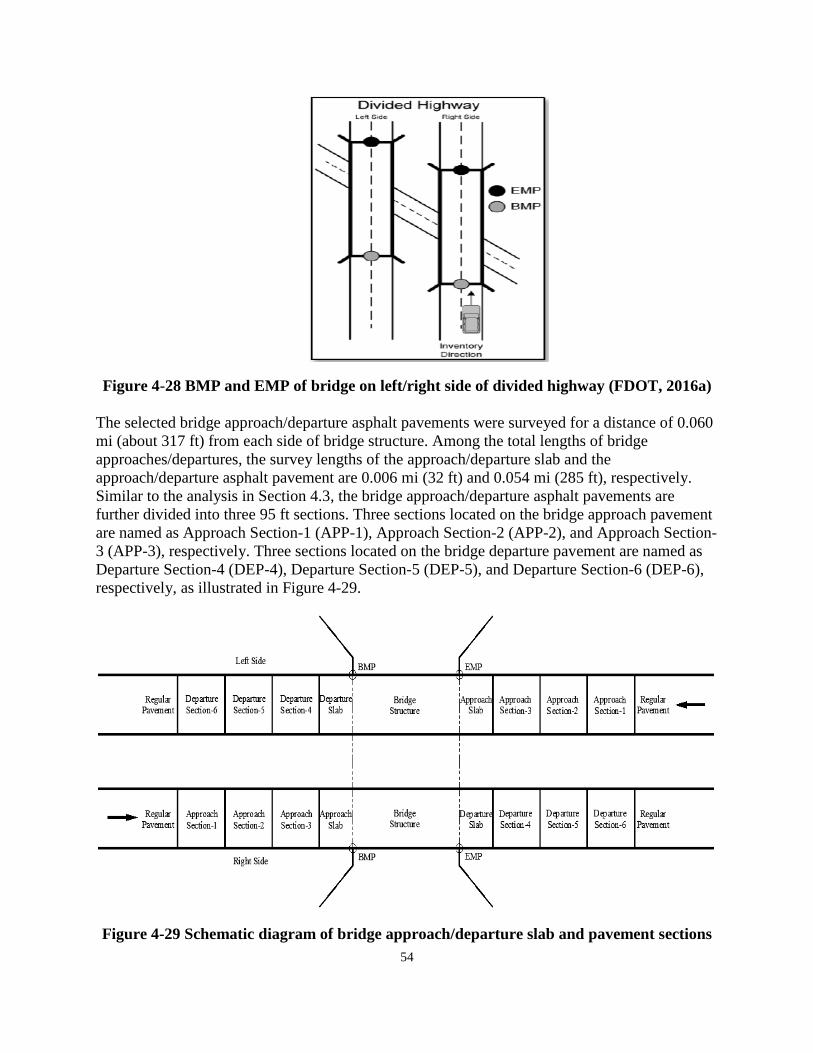
54
Figure 4-28 BMP and EMP of bridge on left/right side of divided highway (FDOT, 2016a)
The selected bridge approach/departure asphalt pavements were surveyed for a distance of 0.060
mi (about 317 ft) from each side of bridge structure. Among the total lengths of bridge
approaches/departures, the survey lengths of the approach/departure slab and the
approach/departure asphalt pavement are 0.006 mi (32 ft) and 0.054 mi (285 ft), respectively.
Similar to the analysis in Section 4.3, the bridge approach/departure asphalt pavements are
further divided into three 95 ft sections. Three sections located on the bridge approach pavement
are named as Approach Section-1 (APP-1), Approach Section-2 (APP-2), and Approach Section-
3 (APP-3), respectively. Three sections located on the bridge departure pavement are named as
Departure Section-4 (DEP-4), Departure Section-5 (DEP-5), and Departure Section-6 (DEP-6),
respectively, as illustrated in Figure 4-29.
Figure 4-29 Schematic diagram of bridge approach/departure slab and pavement sections
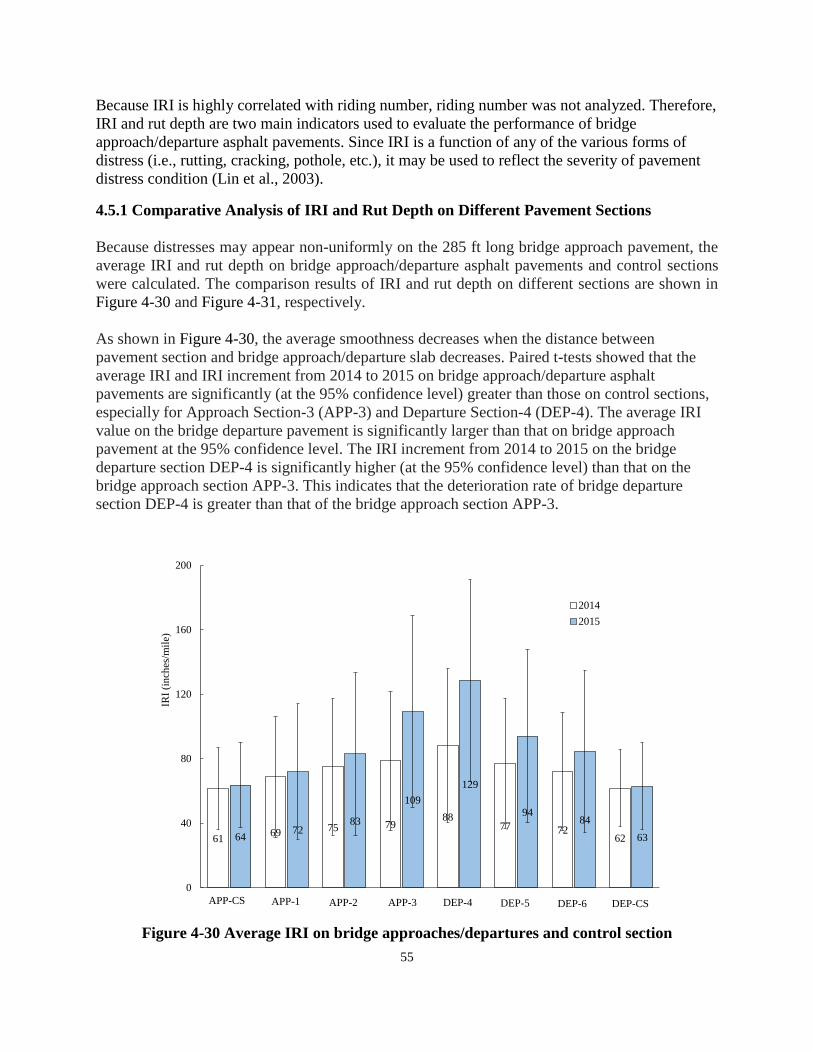
55
Because IRI is highly correlated with riding number, riding number was not analyzed. Therefore,
IRI and rut depth are two main indicators used to evaluate the performance of bridge
approach/departure asphalt pavements. Since IRI is a function of any of the various forms of
distress (i.e., rutting, cracking, pothole, etc.), it may be used to reflect the severity of pavement
distress condition (Lin et al., 2003).
4.5.1 Comparative Analysis of IRI and Rut Depth on Different Pavement Sections
Because distresses may appear non-uniformly on the 285 ft long bridge approach pavement, the
average IRI and rut depth on bridge approach/departure asphalt pavements and control sections
were calculated. The comparison results of IRI and rut depth on different sections are shown in
Figure 4-30 and Figure 4-31, respectively.
As shown in Figure 4-30, the average smoothness decreases when the distance between
pavement section and bridge approach/departure slab decreases. Paired t-tests showed that the
average IRI and IRI increment from 2014 to 2015 on bridge approach/departure asphalt
pavements are significantly (at the 95% confidence level) greater than those on control sections,
especially for Approach Section-3 (APP-3) and Departure Section-4 (DEP-4). The average IRI
value on the bridge departure pavement is significantly larger than that on bridge approach
pavement at the 95% confidence level. The IRI increment from 2014 to 2015 on the bridge
departure section DEP-4 is significantly higher (at the 95% confidence level) than that on the
bridge approach section APP-3. This indicates that the deterioration rate of bridge departure
section DEP-4 is greater than that of the bridge approach section APP-3.
Figure 4-30 Average IRI on bridge approaches/departures and control section
6169
75 7988
77 726264
7283
109
129
9484
63
0
40
80
120
160
200
1 2 3 4 5 6 7 8
IRI
(in
ches
/mil
e)
APP-CS
2014
2015
APP-CS APP-1 APP-2 APP-3 DEP-4 DEP-5 DEP-6 DEP-CS

56
Figure 4-31 Average rut depth on bridge approaches/departures and control section
As can be seen from Figure 4-31, the average rut depth generally increases slightly with the
increasing distance from bridge approach/departure slabs. Paired t-tests, however, revealed that
the average rut depth and rut depth increment from 2014 to 2015 on control sections are not
statistically different from those on bridge approach/departure asphalt pavements at the 95%
confidence level.
4.5.2 Descriptive Statistical Analysis of IRI and Rut Depth on Different Pavement Sections
The distributions of average IRI on bridge Approach Section-3 (APP-3) and Departure Section-4
(DEP-4) (i.e., the two sections adjacent to the approach/departure slabs) are shown in Figure
4-32 and Figure 4-33, respectively. As can be seen from the two figures, the average IRI on
APP-3 or DEP-4 of the 883 bridges approximately follows a log-normal distribution. The mode
of distribution is about 90 in/mi for the average IRI on DEP-4, and only 50 in/mi for the average
IRI on APP -3. For most bridges, the average IRI on APP-3 or DEP-4 is less than 200 in/mi.

57
Figure 4-32 Distribution of average IRI on bridge Approach Section-3
Figure 4-33 Distribution of average IRI on bridge Departure Section-4
The distributions of average rut depth on bridge Approach Section-1 (APP-1) and Departure
Section-6 (DEP-6) (i.e., the two sections away from the approach/departure slabs) are shown in
Figure 4-34 and Figure 4-35, respectively. As can be seen, the average rut depth on APP-1 or
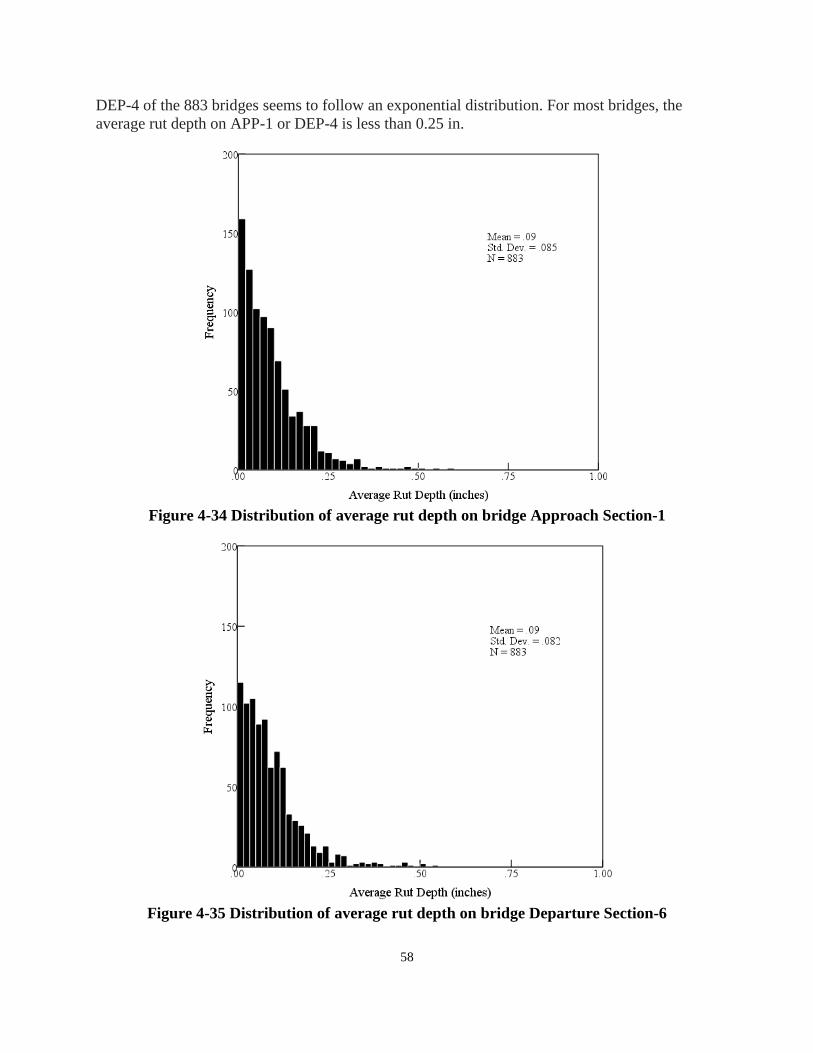
58
DEP-4 of the 883 bridges seems to follow an exponential distribution. For most bridges, the
average rut depth on APP-1 or DEP-4 is less than 0.25 in.
Figure 4-34 Distribution of average rut depth on bridge Approach Section-1
Figure 4-35 Distribution of average rut depth on bridge Departure Section-6
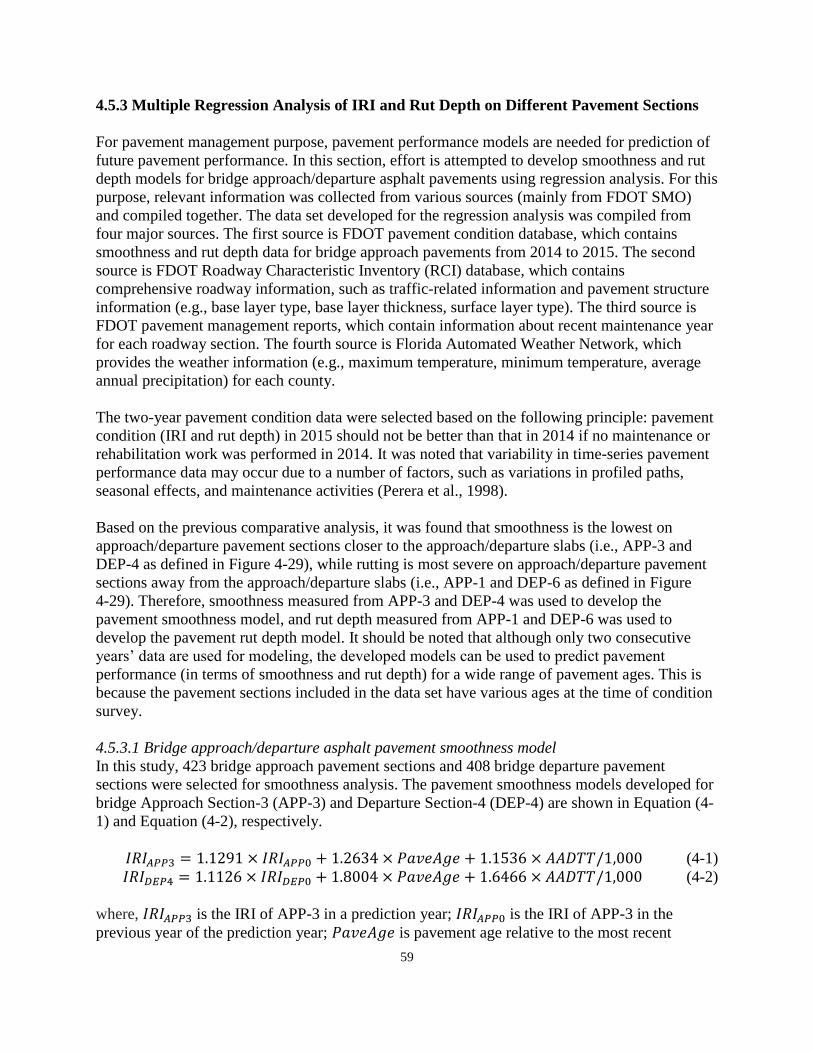
59
4.5.3 Multiple Regression Analysis of IRI and Rut Depth on Different Pavement Sections
For pavement management purpose, pavement performance models are needed for prediction of
future pavement performance. In this section, effort is attempted to develop smoothness and rut
depth models for bridge approach/departure asphalt pavements using regression analysis. For this
purpose, relevant information was collected from various sources (mainly from FDOT SMO)
and compiled together. The data set developed for the regression analysis was compiled from
four major sources. The first source is FDOT pavement condition database, which contains
smoothness and rut depth data for bridge approach pavements from 2014 to 2015. The second
source is FDOT Roadway Characteristic Inventory (RCI) database, which contains
comprehensive roadway information, such as traffic-related information and pavement structure
information (e.g., base layer type, base layer thickness, surface layer type). The third source is
FDOT pavement management reports, which contain information about recent maintenance year
for each roadway section. The fourth source is Florida Automated Weather Network, which
provides the weather information (e.g., maximum temperature, minimum temperature, average
annual precipitation) for each county.
The two-year pavement condition data were selected based on the following principle: pavement
condition (IRI and rut depth) in 2015 should not be better than that in 2014 if no maintenance or
rehabilitation work was performed in 2014. It was noted that variability in time-series pavement
performance data may occur due to a number of factors, such as variations in profiled paths,
seasonal effects, and maintenance activities (Perera et al., 1998).
Based on the previous comparative analysis, it was found that smoothness is the lowest on
approach/departure pavement sections closer to the approach/departure slabs (i.e., APP-3 and
DEP-4 as defined in Figure 4-29), while rutting is most severe on approach/departure pavement
sections away from the approach/departure slabs (i.e., APP-1 and DEP-6 as defined in Figure
4-29). Therefore, smoothness measured from APP-3 and DEP-4 was used to develop the
pavement smoothness model, and rut depth measured from APP-1 and DEP-6 was used to
develop the pavement rut depth model. It should be noted that although only two consecutive
years’ data are used for modeling, the developed models can be used to predict pavement
performance (in terms of smoothness and rut depth) for a wide range of pavement ages. This is
because the pavement sections included in the data set have various ages at the time of condition
survey.
4.5.3.1 Bridge approach/departure asphalt pavement smoothness model
In this study, 423 bridge approach pavement sections and 408 bridge departure pavement
sections were selected for smoothness analysis. The pavement smoothness models developed for
bridge Approach Section-3 (APP-3) and Departure Section-4 (DEP-4) are shown in Equation (4-
1) and Equation (4-2), respectively.
𝐼𝑅𝐼𝐴𝑃𝑃3 = 1.1291 × 𝐼𝑅𝐼𝐴𝑃𝑃0 + 1.2634 × 𝑃𝑎𝑣𝑒𝐴𝑔𝑒 + 1.1536 × 𝐴𝐴𝐷𝑇𝑇/1,000 (4-1)
𝐼𝑅𝐼𝐷𝐸𝑃4 = 1.1126 × 𝐼𝑅𝐼𝐷𝐸𝑃0 + 1.8004 × 𝑃𝑎𝑣𝑒𝐴𝑔𝑒 + 1.6466 × 𝐴𝐴𝐷𝑇𝑇/1,000 (4-2)
where, 𝐼𝑅𝐼𝐴𝑃𝑃3 is the IRI of APP-3 in a prediction year; 𝐼𝑅𝐼𝐴𝑃𝑃0 is the IRI of APP-3 in the
previous year of the prediction year; 𝑃𝑎𝑣𝑒𝐴𝑔𝑒 is pavement age relative to the most recent

60
maintenance or rehabilitation work; 𝐴𝐴𝐷𝑇𝑇 is the average annual daily truck traffic
(AADTT); 𝐼𝑅𝐼𝐷𝐸𝑃4 is the IRI of DEP-4 in a prediction year, 𝐼𝑅𝐼𝐷𝐸𝑃0 is the IRI of DEP-4 in the
previous year of the prediction year. The independent variables included in the pavement
smoothness models (i.e., initial smoothness, pavement age, and truck traffic volume) are all
statistically significant at a confidence level of 95%. The adjusted 𝑅2 values for the APP-3 and
DEP-4 smoothness models, however, are not very high (0.56 and 0.39 respectively). This
indicates that there are other unobserved factors that also influence bridge approach/departure
pavements.
Based on the descriptive statistical analysis, the average AADTT for bridge approaches is about
8,000 trucks/day. The initial IRI is about 80 and 90 in/mi on the bridge approach section APP-3
and the bridge departure section DEP-4, respectively. Based on the average information of
AADTT and initial IRI, the relationship between bridge approach/departure asphalt pavement
smoothness and pavement age was developed, as shown in Figure 4-36.
Figure 4-36 Relationship between bridge approach pavement IRI and pavement age
As shown in Figure 4-36, the increasing rate of IRI increases with pavement age. There is
relatively small change of smoothness in the first few years of the age of a pavement, which is
consistent with findings in the literature (Perera et al., 1998). When a bridge approach/departure
asphalt pavement is initially smooth, the rate of decrease of smoothness with pavement age is
smaller because of less dynamic load effect from vehicles. Rougher pavement surface would
increase the dynamic loading of vehicles on pavement surface and accelerate the deterioration of
pavement structure (Saleh et al., 2000). It can also be observed from Figure 4-36 that the average
difference in IRI between bridge departure pavements and bridge approach pavements increases
with pavement age.
4.5.3.2 Bridge approach/departure asphalt pavement rut depth model
In this study, 247 bridge approach asphalt pavement sections and 440 bridge departure asphalt
pavement sections were used for rut depth analysis. The pavement rut depth models developed
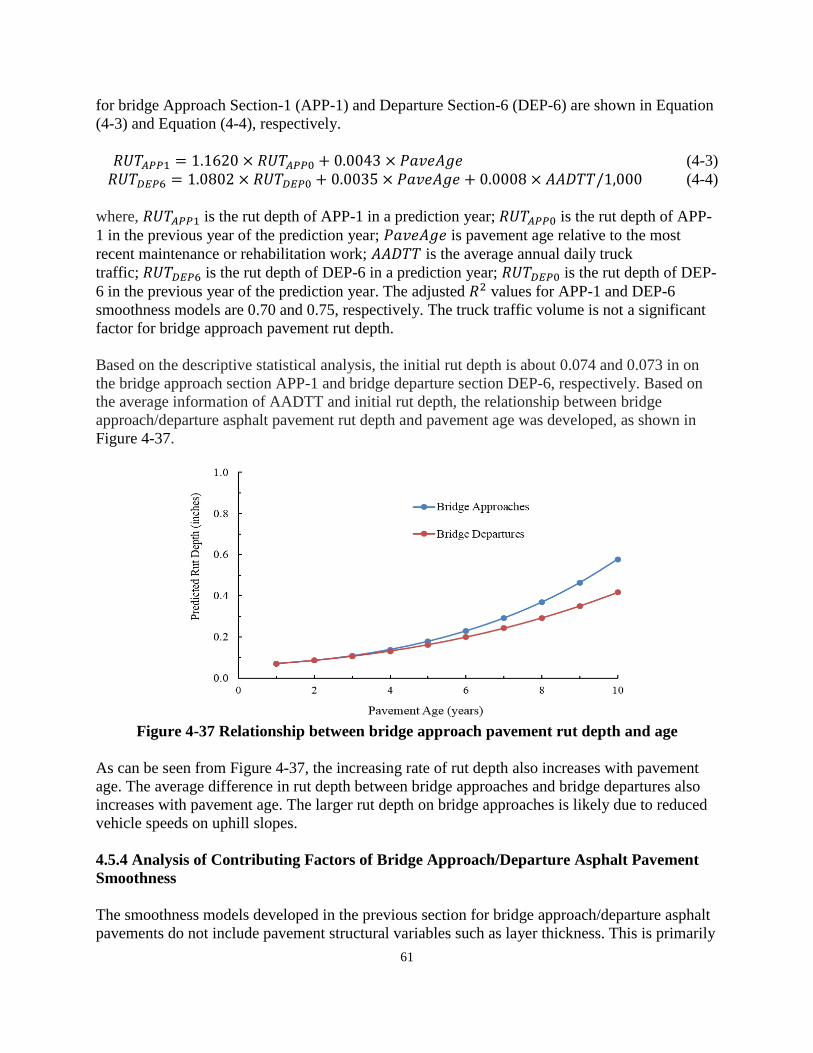
61
for bridge Approach Section-1 (APP-1) and Departure Section-6 (DEP-6) are shown in Equation
(4-3) and Equation (4-4), respectively.
𝑅𝑈𝑇𝐴𝑃𝑃1 = 1.1620 × 𝑅𝑈𝑇𝐴𝑃𝑃0 + 0.0043 × 𝑃𝑎𝑣𝑒𝐴𝑔𝑒 (4-3)
𝑅𝑈𝑇𝐷𝐸𝑃6 = 1.0802 × 𝑅𝑈𝑇𝐷𝐸𝑃0 + 0.0035 × 𝑃𝑎𝑣𝑒𝐴𝑔𝑒 + 0.0008 × 𝐴𝐴𝐷𝑇𝑇/1,000 (4-4)
where, 𝑅𝑈𝑇𝐴𝑃𝑃1 is the rut depth of APP-1 in a prediction year; 𝑅𝑈𝑇𝐴𝑃𝑃0 is the rut depth of APP-
1 in the previous year of the prediction year; 𝑃𝑎𝑣𝑒𝐴𝑔𝑒 is pavement age relative to the most
recent maintenance or rehabilitation work; 𝐴𝐴𝐷𝑇𝑇 is the average annual daily truck
traffic; 𝑅𝑈𝑇𝐷𝐸𝑃6 is the rut depth of DEP-6 in a prediction year; 𝑅𝑈𝑇𝐷𝐸𝑃0 is the rut depth of DEP-
6 in the previous year of the prediction year. The adjusted 𝑅2 values for APP-1 and DEP-6
smoothness models are 0.70 and 0.75, respectively. The truck traffic volume is not a significant
factor for bridge approach pavement rut depth.
Based on the descriptive statistical analysis, the initial rut depth is about 0.074 and 0.073 in on
the bridge approach section APP-1 and bridge departure section DEP-6, respectively. Based on
the average information of AADTT and initial rut depth, the relationship between bridge
approach/departure asphalt pavement rut depth and pavement age was developed, as shown in
Figure 4-37.
Figure 4-37 Relationship between bridge approach pavement rut depth and age
As can be seen from Figure 4-37, the increasing rate of rut depth also increases with pavement
age. The average difference in rut depth between bridge approaches and bridge departures also
increases with pavement age. The larger rut depth on bridge approaches is likely due to reduced
vehicle speeds on uphill slopes.
4.5.4 Analysis of Contributing Factors of Bridge Approach/Departure Asphalt Pavement
Smoothness
The smoothness models developed in the previous section for bridge approach/departure asphalt
pavements do not include pavement structural variables such as layer thickness. This is primarily

62
due to the lack of layer thickness data for bridge approach/departure asphalt pavements in the
FDOT RCI database. As has been revealed, however, on some FDOT Interstate highways, the
asphalt layer in bridge approach/departure asphalt pavements is significantly thinner than that in
control sections (Moseley, 2009, 2012, 2013), which may lead to early deterioration of pavement
smoothness. Pavement layer thickness, therefore, should be included in the statistical analysis.
To this end, the GPR data used for asphalt layer thickness analysis in Section 4.4 are combined
with all other data used for analysis in Section 4.5 and used to analyze the factors affecting
bridge approach/departure asphalt pavement smoothness at a network level. Since the GPR test is
only performed on a pavement section upon special request from district offices, the available
GPR data do not cover all the bridge approach/departure asphalt pavements in Florida. Due to
this limitation, only 73 bridges were identified, whose approach, departure, and control sections
can be included in the analysis. A list of the 73 bridges is shown in Appendix E, among which 7,
31, 31, 2, and 2 bridges are located in Districts 1, 2, 4, 5, and 7, respectively. These bridges are
on either Interstate Highway I-95 or Interstate Highway I-75.
The pavement smoothness data (i.e., IRI) collected in 2014 were used in the analysis. Table 4-13
shows the descriptive statistics of potential variables influencing pavement smoothness.
Table 4-13 Descriptive statistics of potential variables influencing pavement smoothness
Variable Description
(Number of Observations: 73)
Mean
Value
Standard
Deviation
Minimum
Value
Maximum
Value
IRI of control section (in/mi) 72.277 19.502 38.631 141.826
IRI of bridge approach pavement (in/mi) 107.021 29.819 38.961 224.984
IRI of bridge departure pavement (in/mi) 117.461 33.381 54.474 216.654
Surface layer thickness of control section (in) 10.575 2.835 4.436 17.115
Surface layer thickness of bridge approach pavement (in) 8.528 2.635 2.330 14.910
Surface layer thickness of bridge departure pavement (in) 8.689 2.746 2.690 14.320
Total thickness of asphalt pavement layer and base layer on
control section (in) 20.561 2.744 14.075 27.115
Friction course type indicator (1 if friction course of pavement
surface layer is friction course 2 [FC-2], 0 otherwise) 0.151 0.360 0 1
Base layer thickness of control section (in) 9.986 0.589 9.000 13.000
Base layer type indicator (1 if type of base layer is limerock
base [LR], 0 otherwise) 0.753 0.434 0 1
Thin base layer at bridge approach transition area (1 if
thickness of bridge approach pavement base layer is less than
10 in, 0 otherwise)
0.096 0.296 0 1
Thin asphalt pavement at bridge departure transition area (1 if
bridge departure pavement surface layer thickness is
statistically less than corresponding control section surface
layer thickness at a 95% confidence level, 0 otherwise)
0.644 0.482 0 1
Pavement age from the most recent pavement rehabilitation
year (years) 8.301 3.353 2 13
Annual average daily traffic (AADT) (1,000 vehicles per day) 93.828 57.090 45.411 221.000
Annual average daily truck traffic (AADTT) (1,000 vehicles
per day) 12.502 12.105 4.264 55.253
Heavy truck traffic volume indicator (1 if annual average daily
truck traffic volume is more than 10,000 vehicles per day) 0.521 0.503 0 1
Higher speed limit indicator (1 if speed limit is greater than 65
mph, 0 otherwise) 0.795 0.407 0 1

63
Table 4-13 Descriptive statistics of potential variables influencing pavement smoothness
(continued)
Variable Description
(Number of Observations: 73)
Mean
Value
Standard
Deviation
Minimum
Value
Maximum
Value
Number of roadway lanes (1 if number of roadway lanes is
four, 0 otherwise) 0.247 0.434 0 1
Length of bridge structure (ft) 261.613 282.547 79.200 1800.480
I-75 indicator (1 if Interstate highway is I-75, 0 otherwise) 0.411 0.495 0 1
I-95 indicator (1 if Interstate highway is I-95, 0 otherwise) 0.589 0.495 0 1
Since a bridge approach pavement and a bridge departure pavement share a series of unobserved
factors (e.g., drainage design, subgrade condition.), pavement smoothness on roadway-bridge
transition areas and control sections is best modeled by a system of interrelated equations.
Therefore, a simultaneous-equation statistical model was applied to evaluate bridge
approach/departure asphalt pavement smoothness, which can be written as (Greene, 2012)
𝐼𝑅𝐼𝐶 = 𝛼𝐶 + 𝛽𝐶𝑋𝐶 + 𝜀𝐶 (4-1)
𝐼𝑅𝐼𝐴 = 𝛼𝐴 + 𝛽𝐴𝑋𝐴 + 𝜓𝐴𝐼𝑅𝐼𝐶 + 𝜀𝐴 (4-2)
𝐼𝑅𝐼𝐷 = 𝛼𝐷 + 𝛽𝐷𝑋𝐷 + 𝜓𝐷𝐼𝑅𝐼𝐶 + 𝜀𝐷 (4-3)
where 𝐼𝑅𝐼𝐶, 𝐼𝑅𝐼𝐴, and 𝐼𝑅𝐼𝐷 are IRI of control section, bridge approach pavement, and bridge
departure pavement, respectively; 𝑋𝐶, 𝑋𝐴, and 𝑋𝐷 are vectors of pavement and roadway
characteristics influencing control section smoothness, bridge approach pavement smoothness,
and bridge departure pavement smoothness, respectively; 𝛼, 𝛽 and 𝜓 are estimable vectors, and
𝜀𝐶, 𝜀𝐴, and 𝜀𝐷 are error terms. To account for possible cross-equation correlation among the
endogenous dependent variables (𝐼𝑅𝐼𝐶) and equation disturbance terms (𝜀𝐶, 𝜀𝐴, and 𝜀𝐷), the
three-stage least squares (3SLS) estimation method can be used to achieve estimable parameters
(Greene, 2012). The estimated parameters for pavement smoothness models for bridge approach
pavements and bridge departure pavements are shown in Table 4-14. It should be noted that
these estimated parameters are based on the 2014 pavement condition data and the 73 bridge
sites where the GPR data are available.
Table 4-14 Estimated parameters for bridge approach/departure pavement smoothness
models
Variable Description Estimated
Parameter t-Statistic
Dependent Variable: IRI of control section
Constant 80.169 5.63
Pavement age 1.795 2.90
Pavement friction course type indicator -23.873 -4.50
Heavy truck traffic indicator 16.232 3.99
Total thickness of asphalt pavement layer and base layer -1.345 -2.05
Dependent Variable: IRI of Bridge Approach Pavement
Constant 71.690 5.76
IRI of control section (endogenous variable) 0.456 2.75
Absolutely thin base layer at bridge approach transition area 24.988 2.32
Dependent Variable: IRI of Bridge Departure Pavement
Constant 37.208 3.12
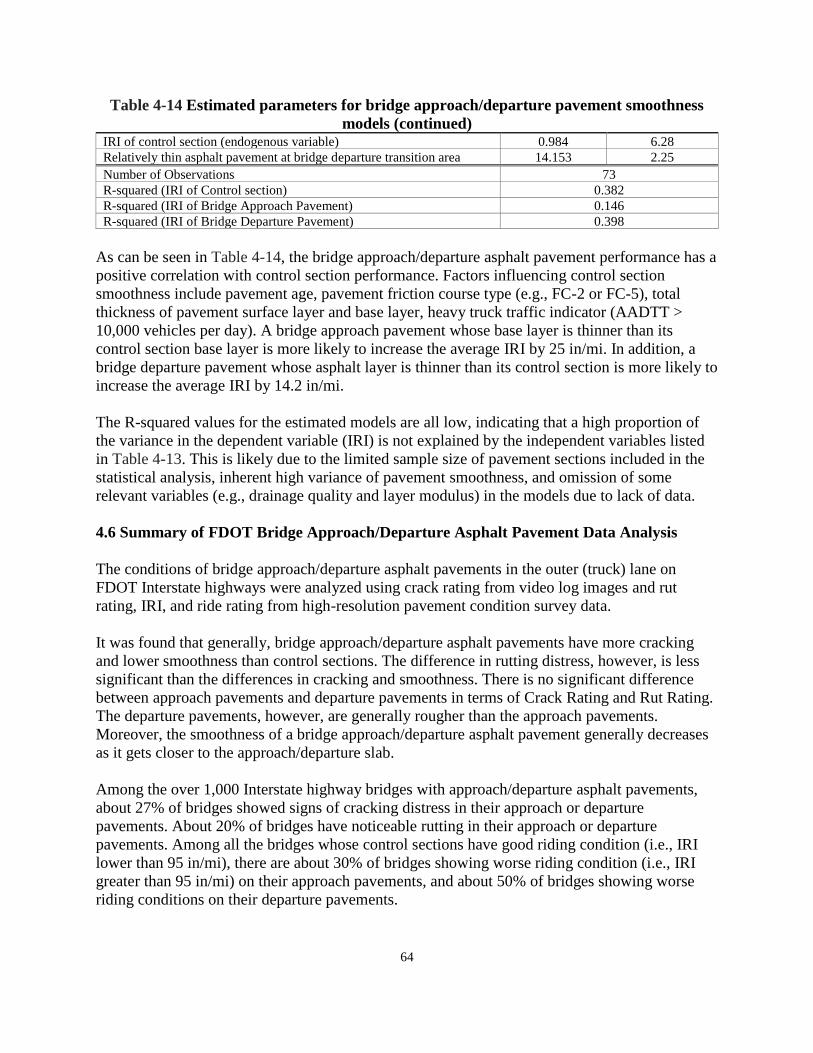
64
Table 4-14 Estimated parameters for bridge approach/departure pavement smoothness
models (continued) IRI of control section (endogenous variable) 0.984 6.28
Relatively thin asphalt pavement at bridge departure transition area 14.153 2.25
Number of Observations 73
R-squared (IRI of Control section) 0.382
R-squared (IRI of Bridge Approach Pavement) 0.146
R-squared (IRI of Bridge Departure Pavement) 0.398
As can be seen in Table 4-14, the bridge approach/departure asphalt pavement performance has a
positive correlation with control section performance. Factors influencing control section
smoothness include pavement age, pavement friction course type (e.g., FC-2 or FC-5), total
thickness of pavement surface layer and base layer, heavy truck traffic indicator (AADTT >
10,000 vehicles per day). A bridge approach pavement whose base layer is thinner than its
control section base layer is more likely to increase the average IRI by 25 in/mi. In addition, a
bridge departure pavement whose asphalt layer is thinner than its control section is more likely to
increase the average IRI by 14.2 in/mi.
The R-squared values for the estimated models are all low, indicating that a high proportion of
the variance in the dependent variable (IRI) is not explained by the independent variables listed
in Table 4-13. This is likely due to the limited sample size of pavement sections included in the
statistical analysis, inherent high variance of pavement smoothness, and omission of some
relevant variables (e.g., drainage quality and layer modulus) in the models due to lack of data.
4.6 Summary of FDOT Bridge Approach/Departure Asphalt Pavement Data Analysis
The conditions of bridge approach/departure asphalt pavements in the outer (truck) lane on
FDOT Interstate highways were analyzed using crack rating from video log images and rut
rating, IRI, and ride rating from high-resolution pavement condition survey data.
It was found that generally, bridge approach/departure asphalt pavements have more cracking
and lower smoothness than control sections. The difference in rutting distress, however, is less
significant than the differences in cracking and smoothness. There is no significant difference
between approach pavements and departure pavements in terms of Crack Rating and Rut Rating.
The departure pavements, however, are generally rougher than the approach pavements.
Moreover, the smoothness of a bridge approach/departure asphalt pavement generally decreases
as it gets closer to the approach/departure slab.
Among the over 1,000 Interstate highway bridges with approach/departure asphalt pavements,
about 27% of bridges showed signs of cracking distress in their approach or departure
pavements. About 20% of bridges have noticeable rutting in their approach or departure
pavements. Among all the bridges whose control sections have good riding condition (i.e., IRI
lower than 95 in/mi), there are about 30% of bridges showing worse riding condition (i.e., IRI
greater than 95 in/mi) on their approach pavements, and about 50% of bridges showing worse
riding conditions on their departure pavements.

65
Among the seven FDOT districts, District 4 had the highest number of bridges showing cracking
distress in the approach/departure asphalt pavements, while District 3 had the lowest number.
However, among the bridges showing cracking distress in approach/departure asphalt pavements,
Districts 1, 5, and 7 had relatively worse pavement condition near bridges than other districts.
About 71 percent of the bridges analyzed in the study were on I-75, I-95, and I-10, but bridges
showing distresses in approach/departure asphalt pavements were mainly on I-75 and I-95.
About 34 of bridges on I-75 and 52% of bridges on I-95 showed distresses in approach/departure
asphalt pavements.
Based on the GPR data for 113 bridges, it was found that the average asphalt layer thickness is
significantly lower on bridge approaches or departures than on control sections, and the
difference is most significant in Districts 2 and 5, and on I-75.
Based on the multiple regression analysis, both average IRI and average rut depth on bridge
approach/departure asphalt pavements increase with pavement age. Due to the existence of
interaction between traffic loading and pavement condition, the increase rates of IRI and rut
depth also increase with pavement age. In addition, the difference between bridge approach
pavement condition and bridge departure pavement condition becomes more significant with
increasing pavement age.

66
CHAPTER 5 REHABILITATION CRITERIA FOR BRIDGE APPROACH/DEPARTURE
ASPHALT PAVEMENTS
5.1 Proposed Pavement Rating System Based on Rutting and Smoothness
Based on the literature review in Chapter 2, it was found that differential settlement, approach-
relative gradient, bridge approach index, and IRI have been proposed as performance indicators
to determine maintenance and repair needs for bridge approach/departure pavements. However,
the literature review and initial and follow-up questionnaire surveys did not reveal any
rehabilitation criteria specifically for bridge approach/departure asphalt pavements.
Based on the analysis of Florida Interstate highway bridge approach/departure asphalt pavement
data in Chapter 4, average rut depth and average IRI may be used to develop the bridge
approach/departure asphalt pavement condition rating system because the rut and ride data are
collected annually by the Pavement Condition Unit (PCU) of the FDOT SMO at a special
resolution (every 0.001 mi) high enough to distinguish a bridge approach/departure asphalt
pavement section.
Since the average rut depth would generally decrease while the average IRI would generally
increase as the pavement section gets closer to the bridge structure, the average rut depth of
bridge Approach Section-1 (APP-1) and bridge Departure Section-6 (DEP-6), as illustrated in
Figure 4-29, and the average IRI of bridge Approach Section-3 (APP-3) and bridge Departure
Section-4 (DEP-4) are preferred as the pavement condition indicators.
For the average rut depth, a threshold value of 0.5 in is also selected since this value is
commonly used to define rutting failure of asphalt pavements. Following the Washington State’s
regular pavement condition rating system (Papagiannakis et al., 2009), this study proposes a
similar rating system for bridge approach/departure asphalt pavements, as shown in Figure 5-1.
In this rating system, if the average rut depth on the bridge Approach Section-1 (APP-1) or the
bridge Departure Section-6 (DEP-6) exceed 0.5 in, the pavement condition is rated as “very
poor”. If the average rut depth is less than 0.5 in, the bridge approach/departure asphalt pavement
condition will then be evaluated based on the average IRI of bridge Approach Section-3 (APP-3)
or bridge Departure Section-4 (DEP-4). If the average IRI (on APP-3 or DEP-4) exceeds 220
in/mi (the value used in the Washington State’s pavement condition rating system), the pavement
condition is rated as “poor” or “very poor”. M&R will be needed when the pavement condition is
rated below “fair”.
Using the proposed rating system, the bridge approach/departure asphalt pavements included in
this study were rated based on their condition data averaged over the 2014-2015 period. The
distributions of the ratings of bridge approach asphalt pavements and departure asphalt
pavements are shown in Figure 5-2 and Figure 5-3, respectively. As can be seen, about 97% of
the bridge approach/departure asphalt pavements are in good or fair condition, 2.4% of the
bridge approach asphalt pavements and 3.8% of the bridge departure asphalt pavements are in
poor or very poor condition.

67
Average Rut
Depth (D)
D ≥ 0.5 inch
D < 0.5 inch
IRImean ≤ 170 inches/mile
170 < IRImean ≤ 220 inches/mile
220 < IRImean ≤ 320 inches/mile
IRImean > 320 inches/mile
Rating: Good
Rating: Fair
Rating: Poor
Rating: Very Poor
Rating: Very Poor
Figure 5-1 Proposed rating system for bridge approach/departure asphalt pavements
Figure 5-2 Distribution of bridge approach asphalt pavements by performance rating

68
Figure 5-3 Distribution of bridge departure asphalt pavements by performance rating
The list of 2.4% (a total of 21) “poor or very poor” bridge approach asphalt pavements and 3.8%
(a total of 34) “poor or very poor” bridge departure asphalt pavements is shown in Appendix F.
The distributions of these “poor or very poor” bridge approach/departure asphalt pavements by
district and highway route are shown in Figure 5-4 and Figure 5-5, respectively.
Figure 5-4 Distribution of poor/very poor bridge approach/departure pavements by district

69
Figure 5-5 Distribution of poor/very poor bridge approach/departure pavements by route
As shown in the figures, most of the poor/very poor bridge approach/departure asphalt
pavements are in Districts 1, 2, and 5, and on Interstate Highway 75 (I-75).
To determine the special rehabilitation needs of a bridge approach/departure asphalt pavement,
its condition should be evaluated relative to its control section. For this purpose, a control section
of the same length as the bridge approach/departure asphalt pavement should be selected. The
pavement condition may be rated based on the IRI and rut depth (RD) data as collected during
pavement condition survey. The proposed rating system based on IRI and RD is modified as
follows.
The rating system for bridge approach/departure asphalt pavements based on IRI is shown in
Table 5-1, explained as follows:
(1) If the mean value of IRI on a bridge approach pavement (IRIAPP) is not statistically
greater than that on the control section (IRICS) at a 95% confidence level, the smoothness
for bridge approach pavement is rated as “Good”. In this case, the bridge approach
pavement would be rehabilitated along with the control section at the same time.
(2) If the mean value of IRI on a bridge approach pavement (IRIAPP) is statistically greater
than that on the control section (IRICS) at a 95% confidence level, and it is less than 220
in/mi, the smoothness for the bridge approach pavement is rated as “Fair”.
(3) If the mean value of IRI on a bridge approach pavement (IRIAPP) is statistically greater
than that on the control section (IRICS) at a 95% confidence level, and it is more than 220
in/mi, the smoothness for the bridge approach pavement is rated as “Poor”.

70
Table 5-1 Smoothness rating system for bridge approach/departure asphalt pavements Smoothness Level Criteria
Good IRIAPP ≤ IRICS
Fair IRIAPP > IRICS & IRIAPP ≤ 220 in/mi
Poor IRIAPP > IRICS & IRIAPP > 220 in/mi
Similar to the rating system based on smoothness, the rating system for bridge
approach/departure asphalt pavements based RD is shown in Table 5-2. In the table, RDAPP
represents the mean value of RD on a bridge approach pavement and RDCS represents the mean
value of RD on a control section.
Table 5-2 Rutting rating system for bridge approach/departure asphalt pavements
Rutting Level Criteria
Good RDAPP ≤ RDCS
Fair RDAPP > RDCS & RDAPP < 1/2 in
Poor RDAPP > RDCS & RDAPP ≥ 1/2 in
5.2 Proposed Pavement Rating System Based on Cracking
The FDOT annual pavement condition database contains a Crack Rating (CR) value for each
pavement section. However, the pavement section is typically much longer than a bridge
approach/departure asphalt pavement section. A bridge approach/departure asphalt pavement
section is not independently defined and thus is typically included as a small portion of a
roadway section. Information from the FDOT annual pavement condition database, therefore,
cannot be used to evaluate the condition of bridge approach pavements.
CR is a composite indicator defined by FDOT to evaluate the type, severity, and quantity of
cracking. It is on a scale of 10 (no cracking) to 0 (severest cracking) (FDOT, 2015). CR is
calculated from visually assessed cracking condition following the procedure detailed in the
FDOT survey handbook (FDOT, 2015). For bridge approach/departure asphalt pavements, extra
effort may be needed from FDOT district offices to visually inspect their cracking condition. In
this study, pavement video log images have been used to estimate the CR of each bridge
approach pavement. Based on the findings as discussed in Chapter 4, a rating system for bridge
approach/departure asphalt pavements based CR is proposed and presented in Table 5-3. In this
table, CRAPP represents the mean value of CR on a bridge approach pavement and CRCS
represents the mean value of CR on a control section.
Table 5-3 Cracking rating system for bridge approach/departure asphalt pavements Cracking Level Criteria
Good CRAPP ≥ CRCS
Fair CRAPP < CRCS & CRAPP > 7
Poor CRAPP < CRCS & CRAPP ≤ 7

71
5.3 Rehabilitation Criteria for Bridge Approach/Departure Asphalt Pavements
Based on the proposed rating systems based on IRI, RD, and CR, a bridge approach/departure
asphalt pavement that is rated as “Good” or “Fair” in all three systems may be maintained or
rehabilitated along with its control section (i.e., adjacent regular pavement) at the same time. If
any of the rating is below “Fair”, the bridge approach/departure asphalt pavement should be
visually inspected and targeted for M&R. If either the RD or the CR rating is “Poor”, it should be
considered for structural improvement.
Applying the proposed rating systems requires collection and analysis of pavement performance
data following specific procedures, which is labor intensive and time consuming. If in a visual
survey a bridge approach/departure asphalt pavement shows distresses that are obviously worse
than its control section, it can be immediately identified as a deficient section in need of
rehabilitation. Collection and analysis of performance data in terms of IRI, RD, and CR and the
proposed rating systems, therefore, may not be needed.
72
CHAPTER 6 REHABILITATION GUIDELINES FOR BRIDGE APPROACH/DEPARTURE
ASPHALT PAVEMENTS
Based on the work and findings presented in the previous chapters, the following procedure is
recommended as general guidelines for condition evaluation and rehabilitation strategy selection
for bridge approach/departure asphalt pavements:
(1) Pavement condition survey and evaluation;
(2) Identification of pavement distress causes and detailed data collection for poor
pavement;
(3) Selection of rehabilitation techniques;
(4) Formation of rehabilitation strategies;
(5) Life-cycle cost analysis;
(6) Selection of rehabilitation strategy.
Details of each step of the proposed procedure are covered in the following sections, with an
illustration example in Section 6.6.3.
6.1 Pavement Condition Survey and Evaluation
The purpose of pavement condition survey and evaluation is to assess the present condition of a
bridge approach/departure asphalt pavement, to identify its key distress types, and to determine
its rehabilitation needs. A field survey of pavement condition can be conducted following FDOT
Flexible Pavement Condition Survey Handbook to accurately determine the types, quantities,
severities, and locations of distresses present (FDOT, 2015).
6.1.1 Bridge Approach/Departure Asphalt Pavement Section
In the literature, bridge approaches are defined as the sections of pavement located immediately
off the ends of a bridge, regardless of whether they are located on the approach or departure side
of the bridge, and so “bridge approach pavement” is also used to refer to a “bridge departure
pavement”. Oregon Department of Transportation (ODOT) analyzes bridge approach pavements
for a distance of 200 ft from the ends of the bridge (Oregon DOT, 2011). This is consistent with
the findings from the analysis of two-year FDOT pavement condition data for each 0.001 mi (5.3
ft) highway section, in terms of rut rating, IRI, and ride rating. Generally, the difference in
condition indices between a bridge approach/departure asphalt pavement and a control section
diminishes when the bridge approach/departure asphalt pavement is located 200-300 ft away
from bridge ends.
In Florida, to make a smooth transition from a regular asphalt pavement to a bridge concrete
pavement, 30 ft concrete slabs are typically constructed at both ends of a bridge. Thus, as
illustrated in Figure 1-1, a typical bridge approach/departure asphalt pavement section may be
identified as a transition area from the ends of a bridge approach/departure slab. The length of
the transition area may be determined based on changes in pavement surface condition or asphalt
layer thickness. If no assisting information is available, a default length in the range of 200-300
ft may be chosen for the transition area. The average value of pavement condition data over
these transition areas may be used to evaluate their pavement performance.

73
6.1.2 Pavement Condition Survey
The Pavement Condition Unit (PCU) of the FDOT SMO conducts annual surveys of the entire
State highway system in terms of crack, ride, and rut measurements of pavements. For asphalt
pavements, their annual conditions are evaluated and recorded in terms of average values of CR,
Rut Rating, and Ride Rating (RR) for each roadway section. However, as explained in Section
5.2, information from the FDOT annual pavement condition database cannot be used for bridge
approach/departure asphalt pavements due to their small section lengths.
Since the PCU collects the RD and IRI data using an inertial profiler for each 0.001 mi (5.3 ft)
highway section, the original measurement files can be used for analysis for short pavement
sections on bridge approaches/departures. Rut Rating and RR, as defined by FDOT, may be
calculated from RD and IRI, respectively (FDOT, 2015). For CR, extra effort may be needed
from FDOT district offices to visually inspect the cracking condition of bridge
approach/departure asphalt pavements either in the field or using pavement video log images.
After the crack, ride, and rut data are obtained for a bridge approach/departure asphalt pavement,
descriptive statistical analysis may be performed to evaluate the present condition and
rehabilitation needs of the pavement. If visual survey reveals that a bridge approach/departure
asphalt pavement has obviously worse distresses than its control section, it can be immediately
identified as a deficient section in need of repair. Collection and analysis of performance data in
terms of CR, RD (or Rut Rating), and IRI (or RR) may be skipped.
6.1.3 Pavement Condition Evaluation
The condition of a bridge approach/departure asphalt pavement may be evaluated relative to its
control section using the rating systems proposed in Chapter 5. For this purpose, a control
section of the same length as the bridge approach pavement should be selected.
6.2 Detailed Data Collection
If a bridge approach/departure asphalt pavement is rated as “Poor” in terms of smoothness,
cracking, or rutting level, it should be considered in need of M&R. To identify the causes of
pavement distresses and to develop appropriate rehabilitation strategies, more detailed data
collection may be needed for the poor bridge approach pavement. Particularly, GPR test and
material sampling and testing can be conducted in the detailed data collection process.
6.2.1 Data Collection and Identification of Pavement Distress Causes
Early fatigue cracking is typically associated with a weak base, a weak subgrade, or an
inadequate asphalt pavement structure, which may be identified with a GPR test (Hall et al.,
2001). The GPR test can collect information to estimate pavement layer thickness, joint
deterioration, and moisture contents in the base, subbase, and subgrade layers. As illustrated in
Figure 6-1, the presence and location of excessive moisture in subsurface layers of bridge
approach pavement can be detected by a GPR survey (Holzschuher, 2015).

74
Figure 6-1 An example of GPR survey for bridge approach pavement (Bridge: 910097)
Rutting is typically caused by inadequate asphalt mixture design (e.g., use of a low-grade asphalt
binder or excessively high binder content, use of rounded aggregates) or permanent deformation
in the base, subbase or subgrade, which can be determined through material sampling and
testing. Material samples can be taken by coring in the pavement, which requires temporary
traffic control. Pavement cores can be measured and tested in the laboratory for needed
information. Specifically, the bonding condition between layers, layer thickness, material type
and characteristics (e.g., asphalt binder content, air-void content, aggregate gradation, moisture
content), pavement deformation layer, and cracking depth may be determined. The bonding
characteristics between layers can significantly affect the traffic and environmental stress and
strain transfer efficiency from one layer to another (Rahman et al., 2017). The most commonly
used test for bonding characteristics is direct shear test. For pavements whose contributing
causes of distresses are below the pavement structure, a more comprehensive geotechnical
investigation may be needed. The FDOT Soil and Foundations Handbook may be referred to for
this purpose (FDOT, 2018).
As one example shown in Figure 6-2, the layer thickness and material type for bridge approach
pavement sections are identified through materials sampling and testing (Prakash and Moseley,
2009). The material types shown in Figure 6-2 include friction course 5 (FC-5), 12.5-mm
Superpave fine graded (SP2F), asphalt rubber membrane interlaced (ARMI), Type S asphaltic
concrete, Type 1 asphaltic concrete, and asphalt binder course (BINDER).
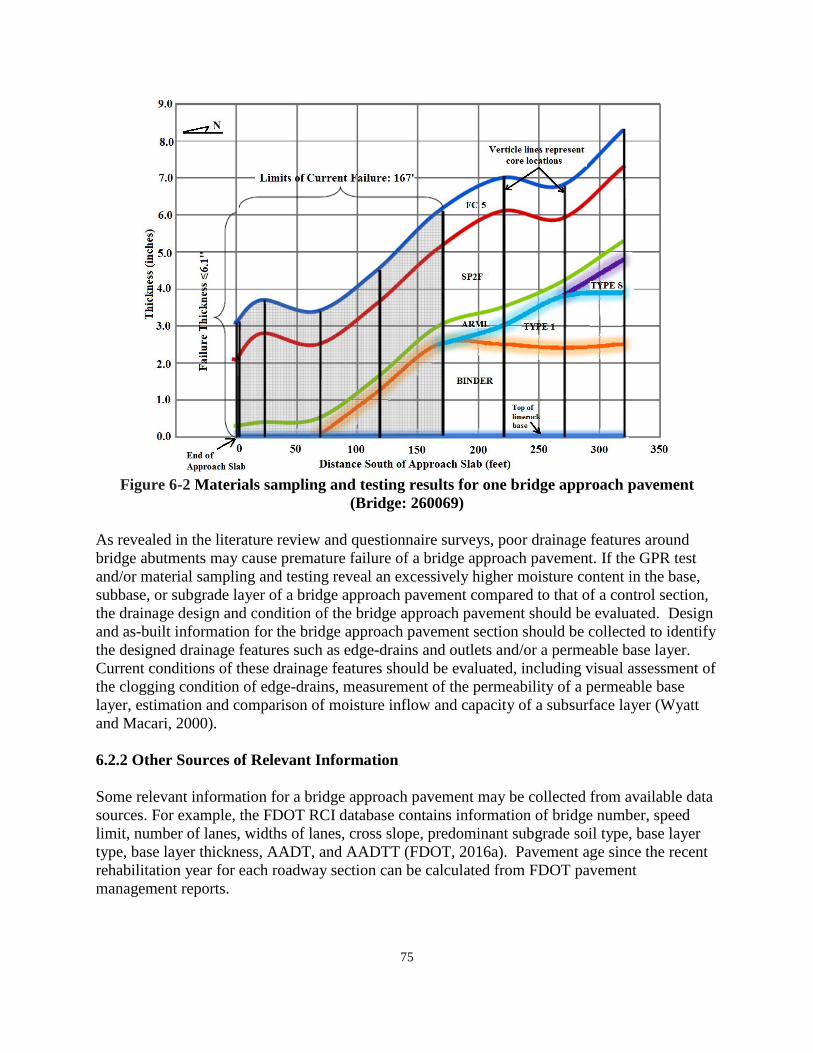
75
Figure 6-2 Materials sampling and testing results for one bridge approach pavement
(Bridge: 260069)
As revealed in the literature review and questionnaire surveys, poor drainage features around
bridge abutments may cause premature failure of a bridge approach pavement. If the GPR test
and/or material sampling and testing reveal an excessively higher moisture content in the base,
subbase, or subgrade layer of a bridge approach pavement compared to that of a control section,
the drainage design and condition of the bridge approach pavement should be evaluated. Design
and as-built information for the bridge approach pavement section should be collected to identify
the designed drainage features such as edge-drains and outlets and/or a permeable base layer.
Current conditions of these drainage features should be evaluated, including visual assessment of
the clogging condition of edge-drains, measurement of the permeability of a permeable base
layer, estimation and comparison of moisture inflow and capacity of a subsurface layer (Wyatt
and Macari, 2000).
6.2.2 Other Sources of Relevant Information
Some relevant information for a bridge approach pavement may be collected from available data
sources. For example, the FDOT RCI database contains information of bridge number, speed
limit, number of lanes, widths of lanes, cross slope, predominant subgrade soil type, base layer
type, base layer thickness, AADT, and AADTT (FDOT, 2016a). Pavement age since the recent
rehabilitation year for each roadway section can be calculated from FDOT pavement
management reports.
76
6.3 Selection of Rehabilitation Techniques
Once the need for repair and the types and potential causes of distresses are identified for a
bridge approach/departure asphalt pavement, candidate rehabilitation techniques need to be
selected. The repair techniques for bridge approach/departure asphalt pavements found from the
literature review and questionnaire surveys, as discussed in Section 2.4, Section 3.4, and Section
3.5, mainly include patching, milling and inlay, and reconstruction. Additionally, rehabilitation
techniques for regular asphalt pavements may also be of reference value. Therefore, they are
summarized below.
6.3.1 Rehabilitation Techniques for Regular Asphalt Pavements
Literature review shows that rehabilitation techniques for regular asphalt pavements may include
asphalt patching, cold milling, hot in-place recycling, cold in-place recycling, and asphalt
overlay (Hall et al., 2001). If the causes of pavement distresses cannot be addressed by the above
rehabilitation techniques, reconstruction should be considered.
Asphalt patching is placing new asphalt mixtures in an area of localized distresses. The original
deteriorated pavement materials in the localized distress area need to be removed before asphalt
patching. Asphalt patching may be full depth (down to the subgrade or an intact subbase layer)
or partial depth (asphalt surface only), depending on the extent of the distress.
Cold milling is the removal of a portion depth of an asphalt concrete surface, using a cold milling
machine. It is often done across the entire width of a traffic lane and is typically followed by an
asphalt overlay. Cold milling cannot completely correct problems that extend throughout the full
thickness of the asphalt concrete layer. Complete removal should be considered for an asphalt
concrete layer with a serious material problem such as stripping or instability.
Hot in-place recycling (HIR) is the on-site rejuvenation of aged asphalt concrete material. It can
be done with or without a subsequent asphalt overlay. HIR only improves the existing asphalt
concrete layer to the depth which is recycled.
Cold in-place recycling (CIR) is the on-site reutilization of the asphalt concrete layer and the
granular layers through a process without heat being added. CIR can be partial depth, which
recycles the asphalt concrete layer to a depth of 3 to 4 in, or full depth, which involves the
recycling of the asphalt concrete layer and the unbound granular layers (Hall et al., 2001). The
full depth CIR is also known as full-depth reclamation (FDR). In the FDR, the asphalt concrete
layer and a predetermined portion of the underlying materials are uniformly pulverized and
blended together with asphalt emulsion or foamed asphalt to produce a homogeneous stabilized
base course. CIR is typically done with a subsequent asphalt overlay. FDR has been successfully
conducted on Interstate pavements (Hall et al., 2001). In-place recycling needs a road reclaimer
or a series of equipment that can pulverize existing pavement materials, add and mix recycling
agent, and place mixed materials on the roadway.
Asphalt overlay is the placement of a new asphalt concrete layer over an existing pavement
structure. A functional overlay is mainly used for pavements with only functional deficiencies,

77
such as excessive roughness, poor surface friction, bleeding, and raveling. A structural overlay
can not only correct functional deficiencies but also increase the pavement structural capacity.
Pavement reconstruction is construction of a new pavement structure which involves complete
removal and replacement of an existing pavement structure down to the subgrade.
6.3.2 Rehabilitation Techniques for Regular Asphalt Pavements with Vertical Alignment
Constraint
As discussed in Section 3.3, a survey was conducted to collect information from other state
DOTs regarding their rehabilitation techniques for structurally deficient asphalt pavements under
the constraint that the vertical alignment of the roadway cannot be changed. The received
responses include partial or full depth patching, milling and inlay of various depths, milling and
functional or structural overlay, full-depth reclamation, and reconstruction with various service
lives.
6.3.3 Discussion of Rehabilitation Techniques for Bridge Approach/Departure Asphalt
Pavements
As shown in Section 3.5, the current FDOT rehabilitation practices for bridge approach/departure
asphalt pavements include patching and crack sealing for short-term maintenance and repair,
milling and inlay (including deep milling into the base layer) and full-depth reconstruction for
long-term rehabilitation. Cold or hot in-place recycling has not been used as a rehabilitation
practice for bridge approach/departure asphalt pavements. Due to its added benefits of material
conservation and short construction periods, in-place recycling, particularly full-depth
reclamation, may be considered in the selection of rehabilitation techniques for bridge
approach/departure asphalt pavements.
6.4 Formation of Rehabilitation Strategies
A rehabilitation strategy is a combination of individual rehabilitation techniques that are
identified in the previous section. The formation of each rehabilitation strategy alternative for
bridge approach/departure asphalt pavements should not only address identified pavement
distresses but also maintain the original longitudinal pavement profile. The objective of
formation of rehabilitation strategies is to develop them with sufficient details so that their costs
can be estimated and compared over the expected service life of the pavement.
6.4.1 Combining Rehabilitation Techniques into Strategies
To improve the structural capacity of a distressed bridge approach pavement, milling and inlay
or reconstruction may be chosen as one rehabilitation technique in the rehabilitation strategy. Hot
or cold in-place recycling, including full-depth reclamation, followed by asphalt overlay may
also be included as one rehabilitation technique. If localized distresses exist to a base layer,
additional repairs (e.g., chemical grouting, full-depth patching) may be performed prior to
milling and inlay. If drainage deficiency exists, a drainage improvement option may be
considered with asphalt inlay, such as repair or installation of edge-drains or a permeable base

78
layer. If reconstruction is chosen, a completely new drainage system may be designed and
included in the strategy.
6.4.2 Developing Detailed Rehabilitation Strategies
A detailed rehabilitation strategy is a sufficiently explicit description of the proposed work to be
implemented for asphalt pavement distresses (Hall et al., 2001). To minimize the M&R
frequency of a bridge approach/departure asphalt pavement, its remaining service life needs to be
extended by increasing its structural capacity and serviceability. Then, a modified structural
deficiency approach can be used to conduct the structural design of asphalt inlay or
reconstruction for bridge approach/departure asphalt pavements.
6.4.2.1 Milling and asphalt inlay design for bridge approach/departure asphalt pavements
The specific milling and asphalt inlay design procedure for bridge approach/departure asphalt
pavements consists of calculation of required structural number (SNR), determination of milling
depth and inlay thickness, asphalt material type selection, and thickness design. To maintain the
original pavement profile, the inlay thickness should equal the milling depth.
The required structural number (SNR) is a weighted thickness representing the required strength
of the pavement structure, which can be calculated according to the AASHTO pavement design
guide published in 1993 (AASHTO, 1993). The AASHTO design equation for calculating SNR
of an asphalt pavement is illustrated as follows:
𝑙𝑜𝑔10𝐸𝑆𝐴𝐿𝐷 = 𝑍𝑅𝑆𝑂 + 9.36𝑙𝑜𝑔10(𝑆𝑁𝑅 + 1) − 0.20 +
𝑙𝑜𝑔10 (∆𝑃𝑆𝐼
4.2−1.5) (0.40 + 1094 (𝑆𝑁𝑅 + 1)5.19⁄ )⁄ + 2.32𝑙𝑜𝑔10(𝑀𝑅) − 8.07 (6-1)
where, 𝐸𝑆𝐴𝐿𝐷 is the accumulated 18-kip equivalent single axle loads (ESALs) predicted over the
design period; 𝑆𝑁𝑅 is the structural number required in inch; 𝑍𝑅 is the standard normal deviate
associated with the corresponding reliability value (%R); 𝑆𝑂 is typically set as 0.45 used in the
design calculations to account for variability in traffic load predictions and construction; ∆𝑃𝑆𝐼 is
the difference between the initial serviceability (PI = 4.2) and terminal serviceability (PT = 2.5);
𝑀𝑅 is resilient modulus of the roadbed soil which can be obtained from FDOT District Materials
Offices (DMOs).
Because the reliability of rehabilitation ranges from 95% to 99% for Interstate highway
pavements in Florida, the standard normal deviation 𝑍𝑅 can be set as -2.327 (at 99% reliability
level) for bridge approach/departure asphalt pavements on the Interstate highways. The specific
value of SNR at different combinations of traffic loads and resilient modulus can be found from
Appendix A of FDOT Flexible Pavement Design Manual (FPDM) (FDOT, 2016b).
To determine the milling depth and inlay thickness, the existing structural number (SNE) needs to
be evaluated with reduced layer coefficient values. FDOT FPDM includes recommended
reduced layer coefficient values for different layer materials under various pavement condition.
(FDOT, 2016b). These recommended values are for regular asphalt pavements. At current stage,
with no further information, these values may be used for the bridge approach pavements, as

79
summarized in Table 6-1 (FDOT, 2016b). The bridge approach/departure asphalt pavement
condition determined previously based on smoothness, cracking, or rutting may be used to select
a reduced layer coefficient value from Table 6-1 for a layer material.
Granular base, subbase, and stabilization, if present in the pavement structure, are assumed to
remain full strength and are not reduced in the SNE calculations. As stated in the FDOT FPDM
(FDOT, 2016b), the inlay structural number should be greater than the difference between the
SNR and the SNE after milling. In addition, to ensure that the vertical alignment of a bridge
approach/departure asphalt pavement is not changed, the milling depth should be the same as the
inlay thickness. The final structural number of a bridge approach/departure asphalt pavement
after milling and inlay would increase with the milling depth.
Table 6-1 Reduced layer coefficients under different pavement conditions
Layer
(with material type)
Original
Design
Pavement Condition
Good Fair Poor
Friction Course, FC-5 0.00 0.00 0.00 0.00
Structural Course, SP-12.5 0.44 0.34 0.25 0.15
Structural Course, SP-19.0 0.44 0.34 0.25 0.15
Base Course, LR 0.18 0.18 0.18 0.18
Base Course, Type B-12.5 0.30 0.25 0.20 0.15
Subbase Course, LR 0.16 0.16 0.16 0.16
Stabilized Subgrade, LBR 40 0.08 0.08 0.08 0.08
The detailed procedure of determining the milling and inlay thickness is illustrated below.
1. Suppose that the entire existing asphalt pavement layer (i.e., the red bold line in Figure
6-3[a]) is milled and inlayed with a new structural course and a new friction course. The
new structural number 𝑆𝑁𝑁 is calculated as:
𝑆𝑁𝑁 = 0.44𝐷1 + ∑ 𝑎𝑖𝐷𝑖4𝑖=2 (6-2)
where, 0.44 is the layer coefficient per inch for the new structural course; 𝑎𝑖(𝑖 =1, 2, 3, 4) is the reduced layer coefficient of the structural course, the base layer, the
subbase layer, or the subgrade layer; 𝐷𝑖(𝑖 = 1, 2, 3, 4) is the layer thickness in inch of the
structural course, the base layer, the subbase layer, or the subgrade layer.
2. Compare values of the 𝑆𝑁𝑅 and the 𝑆𝑁𝑁, and redesign the structural number 𝑆𝑁𝐷.
a. If 𝑆𝑁𝑅 > 𝑆𝑁𝑁, as shown in Figure 6-3(b), a portion of the base layer needs to be
milled to provide enough thickness for structural asphalt pavement resurfacing.
The minimum milling depth of the base layer (𝑑2) can be determined from the
following inequality:
𝑆𝑁𝐷 = (0.44 − 𝑎2)𝑑2 + 𝑆𝑁𝑁 > 𝑆𝑁𝑅 (6-3)

80
b. Then, the final milling depth is the total thickness of the existing asphalt
pavement layer (e.g., friction course, structural course) plus the milling depth of
the base layer (𝑑2). If 𝑆𝑁𝑅 ≤ 𝑆𝑁𝑁, as shown in Figure 6-3(c), the minimum
milling depth of structural course layer (𝑑1) can be determined from the following
inequality:
𝑆𝑁𝐷 = 0.44𝑑1 + 𝑎1(𝐷1 − 𝑑1) + ∑ 𝑎𝑖𝐷𝑖4𝑖=2 > 𝑆𝑁𝑅 (6-4)
Then, the milling depth is the total thickness of friction course plus the milling
depth of the structural course layer (𝑑1).
Figure 6-3 Schematic diagram of milling depth design
3. Check whether the milling depth is enough to remove the cracked asphalt pavement and
rut susceptible mixes. If it is not enough, the milling depth should increase or additional
repairs (e.g., full depth patching, crack sealing) should be implemented prior to inlay
operation. In addition, an asphalt membrane interlayer (AMI) or a geotextile may be
placed beneath the inlay to relief stress concentration at the tip of an existing crack below
the inlay and to delay the crack propagation through the new inlay. Nam et al. proved that
increasing the milling depth followed by geotextile is a most effective mitigation method
for reflective cracking (Nam et al., 2014).
Once the total inlay thickness is determined, asphalt material type and thickness can be
determined according to FDOT FPDM (FDOT, 2016b). For example, the asphalt concrete layer
includes a friction course and a structural course. A friction course FC-5 is typically placed on
Florida Interstate highways with a thickness of 0.75 in. The minimum thickness for the structural
course on Interstate highways is 4 in. The structural course thickness is always designed to the
nearest 1/2 in. The minimum layer thicknesses of SP-12.5 and SP-19.0 are 1-1/2 in and 2 in,

81
respectively. The maximum layer thicknesses of SP-12.5 and SP-19.0 are 2-1/2 in and 4 in,
respectively (FDOT, 2016b).
6.4.2.2 In-place recycling design for bridge approach/departure asphalt pavements
The modified structural deficiency approach may also be followed to design bridge
approach/departure asphalt pavements rehabilitated with CIR or HIR. The structural layer
coefficient (SLC), however, has to be determined for the recycled asphalt layer or the recycled
base layer. FDOT’s Materials Manual may be followed for this purpose, but it may take several
years to determine the SLC for new materials. Information available in the literature may be used
to accelerate this process (Hiltunen, 2014).
6.4.2.3 Reconstruction design for bridge approach/departure asphalt pavements
The reconstruction design of bridge approach/departure asphalt pavements may follow the same
procedure of reconstruction design for regular asphalt pavements, with the additional constraint
that the original pavement profile should not be changed.
Specifically, the reconstruction design of bridge approach/departure asphalt pavements consists
of calculation of required structural number, determination of base group, and asphalt materials
selection and thickness design. The required structural number for reconstruction can be
calculated using the AASHTO flexible pavement design equation (5-1). The typical base group
of bridge approach pavements on Interstate highways in Florida is base group 9 (10 in LR base),
which is also a minimum base group for Interstate highway pavements. If the structural number
for a reconstructed asphalt pavement (SNN) with 10 in LR base is less than the required structural
number, the granular base needs to be changed to an asphalt treated base. For example, if a 10 in
LR base is replaced with a 6 in asphalt treated base (Type B-12.5), 4 in more asphalt structural
course can be paved to increase the structural number. When the base group is determined,
asphalt materials selection and thickness design can be conducted following the FDOT FPDM
(FDOT, 2016b).
6.4.3 Summary
For a bridge approach/departure asphalt pavement, several rehabilitation strategies may be
formed. A rehabilitation strategy is a combination of individual rehabilitation techniques that can
not only address identified pavement distresses but also maintain the original longitudinal
pavement profile. To improve pavement structural capacity, milling and inlay, in-place
recycling, or reconstruction should be chosen as one rehabilitation technique in the rehabilitation
strategy.
6.5 Life-cycle Cost Analysis
With a few rehabilitation strategy alternatives formed for a bridge approach/departure asphalt
pavement, a life-cycle cost analysis (LCCA) may be performed to calculate and compare the
costs of these alternatives over the analysis period (Hall et al., 2001). The purpose of the LCCA
is to identify a rehabilitation strategy alternative with the lowest life cycle cost for the public.
Here the cost is defined as the public cost, including the costs incurred by a highway agency for
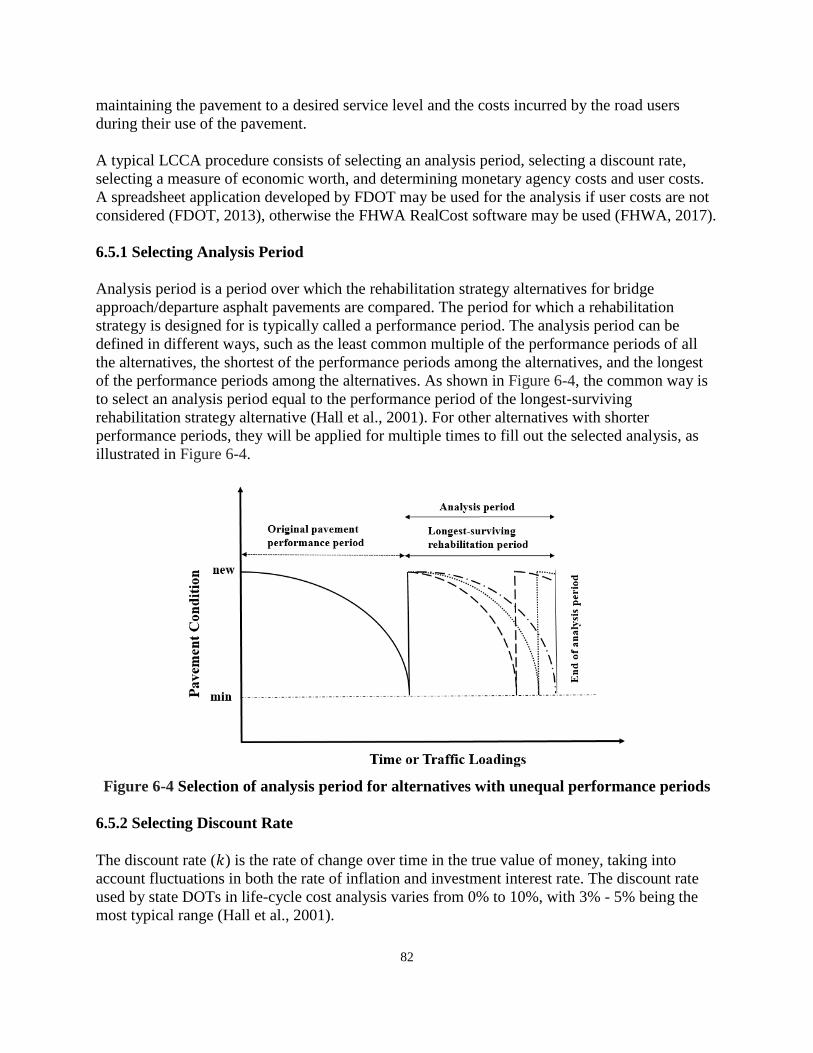
82
maintaining the pavement to a desired service level and the costs incurred by the road users
during their use of the pavement.
A typical LCCA procedure consists of selecting an analysis period, selecting a discount rate,
selecting a measure of economic worth, and determining monetary agency costs and user costs.
A spreadsheet application developed by FDOT may be used for the analysis if user costs are not
considered (FDOT, 2013), otherwise the FHWA RealCost software may be used (FHWA, 2017).
6.5.1 Selecting Analysis Period
Analysis period is a period over which the rehabilitation strategy alternatives for bridge
approach/departure asphalt pavements are compared. The period for which a rehabilitation
strategy is designed for is typically called a performance period. The analysis period can be
defined in different ways, such as the least common multiple of the performance periods of all
the alternatives, the shortest of the performance periods among the alternatives, and the longest
of the performance periods among the alternatives. As shown in Figure 6-4, the common way is
to select an analysis period equal to the performance period of the longest-surviving
rehabilitation strategy alternative (Hall et al., 2001). For other alternatives with shorter
performance periods, they will be applied for multiple times to fill out the selected analysis, as
illustrated in Figure 6-4.
Figure 6-4 Selection of analysis period for alternatives with unequal performance periods
6.5.2 Selecting Discount Rate
The discount rate (𝑘) is the rate of change over time in the true value of money, taking into
account fluctuations in both the rate of inflation and investment interest rate. The discount rate
used by state DOTs in life-cycle cost analysis varies from 0% to 10%, with 3% - 5% being the
most typical range (Hall et al., 2001).
83
6.5.3 Selecting a Measure of Economic Worth
The economic worth of an investment can be measured in different ways, such as present worth
method, annual worth method, future worth method. Rehabilitation alternatives considered in a
life-cycle cost analysis need to be compared with the same measure of economic worth. The
most commonly used measure of economic worth is present worth (Hall et al., 2001). Present
worth method would express all costs and benefits over the analysis period in terms of their
equivalent values in the initial year of the analysis period. To be specific, all costs incurred in the
initial year are expressed as their actual present value. All future costs (e.g., follow-up
rehabilitation construction costs) and future benefits (e.g., residual value at the end of the
analysis period) need to be discounted to their equivalent present values. The general formula for
discounting future cost or benefit ($𝐹) to present value ($𝑃) is shown in the following
$𝑃 = $𝐹 ×1
(1+𝑘)𝑛 (6-5)
where 𝑘 is the discount rate, 𝑛 is the year in which future cost or benefit occurs.
6.5.4 Determining Monetary Agency Costs
Monetary agency costs are all those costs associated with rehabilitation alternatives that are
incurred by the agency (e.g., FDOT) during the analysis period. Monetary agency costs include
initial rehabilitation construction costs, possible follow-up rehabilitation construction, traffic
control costs during construction work, and residual value of the pavement structure at the end of
the analysis period.
To reasonably estimate construction costs and traffic control costs for different rehabilitation
alternatives, a questionnaire survey over FDOT districts was conducted to collect average cost
information about mobilization, TTC, milling, and overlay. The survey questions are designed as
follows.
1. What are the average contract lump sum prices for the item of mobilization (i.e.,
preparatory work and operations in mobilizing for beginning work) in bridge approach
pavement milling/resurfacing and reconstruction project, respectively? (If data for bridge
approach pavements are not available, please provide those for regular highway
pavements.)
2. What is the average contract lump sum for TTC in bridge approach pavement
rehabilitation areas? What are the average number of TTC days for bridge approach
pavement milling/resurfacing and reconstruction project, respectively? (If data for bridge
approach pavement areas are not available, please provide those for regular highway
pavement area.)
3. What is the average cost of milling existing asphalt pavement at a certain depth (e.g., 1
in, 1 1∕2 in, 2 in, 2 3∕4 in, 3 in, 4 in, 5 in, 6 in, and 7 in, etc.) per square yard (SY) in your
district (for example, $2.77 per SY at 1 in depth)?
4. What is the average cost of overlay for a certain asphalt mixture type (e.g., SP-9.5, SP-
12.5, SP-19, FC-5, FC-9.5, and FC-12.5, etc.) per ton (T) in your district?

84
5. Could you provide some previous cost-estimation contracts/reports (including overlay or
reconstruction design, treatment area, cost-estimation lists, etc.) about milling &
resurfacing or reconstruction of bridge approach pavement in your district (If files for
bridge approach pavements are not available, please provide those for regular highway
pavements.)?
The detailed responses from all the participants of the survey are shown in Appendix G. Based
on the responses, mobilization costs can be estimated as 8% to 20% of the total project cost. TTC
costs can be estimated as 8% to 25% of the total project cost. TTC costs would vary depending
on construction duration. Because the least interruption of traffic flow during repair of bridge
approach pavement distresses is required, temporary traffic control plans can be conducted to
facilitate road users through a work zone. The typical design of TTC for a short-section work
zone is shown in Figure 6-5 (FHWA, 2009).
As shown in Figure 6-5, a work zone is typically marked by signs, channelizing devices, barriers,
pavement markings. Based on the questionnaire survey results, the average cost for each
construction pay item associated with bridge approach/departure asphalt pavement rehabilitation
is summarized in Table 6-2. Asphalt concrete cost for overlay/reconstruction can be estimated as
110 lb per square yard per inch. More detailed information about each pay item can be found in
the Basis of Estimates Manual (FDOT, 2010).

85
Figure 6-5 A typical design of TTC for a short section work zone (FHWA, 2009)
Table 6-2 List of item average unit cost associated with bridge pavement rehabilitation Item Description Unit Cost ($)
0101-1 Mobilization Lump Sum -
0102-1 Temporary traffic control Day 500
0102-60 Work zone sign Each Day 0.29
0102-71-13 Temporary barrier wall (Concrete) Linear Foot 30.93
0102-74-1 Temporary channelizing device Each Day 0.14
0102-76 Advance warning arrow panel Each Day 5.55
0102-78 Temporary retroreflective pavement marker Each 3.27
0102-150-1 Portable regulatory sign Each Day 4.92
0285-710 Optional base, base group 10 yd2 15.43
0285-711 Optional base, base group 11 yd2 19.21
0285-712 Optional base, base group 12 yd2 24.50
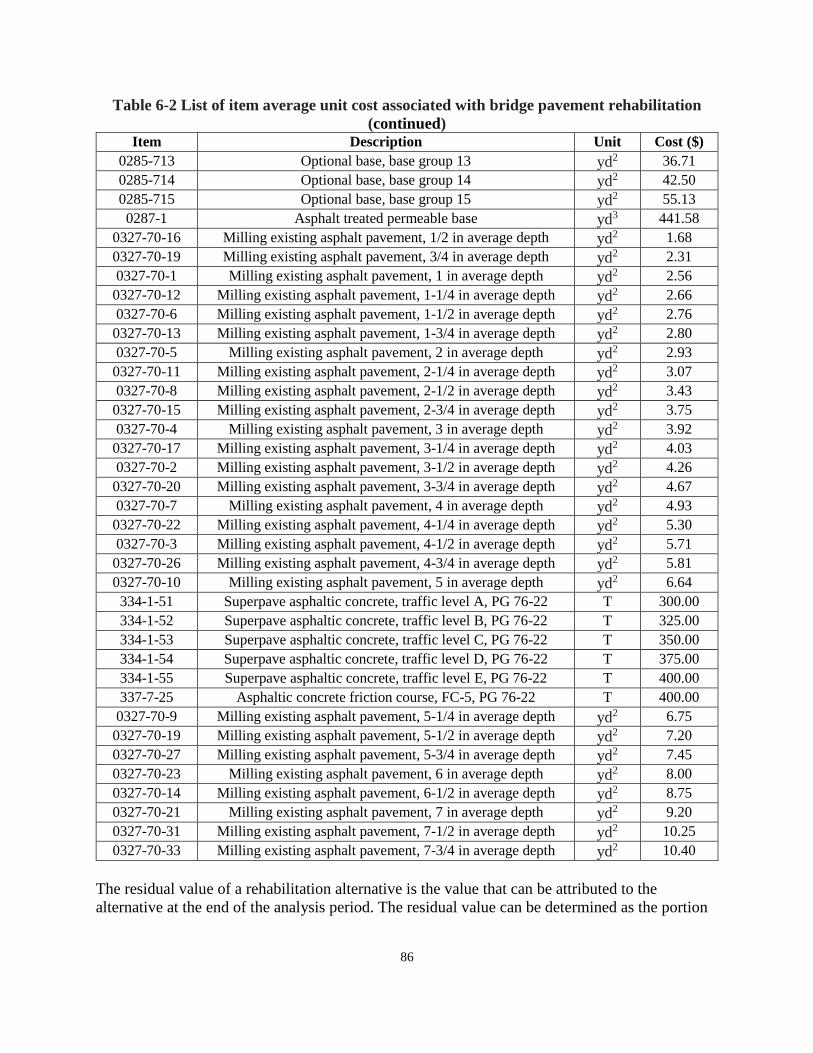
86
Table 6-2 List of item average unit cost associated with bridge pavement rehabilitation
(continued) Item Description Unit Cost ($)
0285-713 Optional base, base group 13 yd2 36.71
0285-714 Optional base, base group 14 yd2 42.50
0285-715 Optional base, base group 15 yd2 55.13
0287-1 Asphalt treated permeable base yd3 441.58
0327-70-16 Milling existing asphalt pavement, 1/2 in average depth yd2 1.68
0327-70-19 Milling existing asphalt pavement, 3/4 in average depth yd2 2.31
0327-70-1 Milling existing asphalt pavement, 1 in average depth yd2 2.56
0327-70-12 Milling existing asphalt pavement, 1-1/4 in average depth yd2 2.66
0327-70-6 Milling existing asphalt pavement, 1-1/2 in average depth yd2 2.76
0327-70-13 Milling existing asphalt pavement, 1-3/4 in average depth yd2 2.80
0327-70-5 Milling existing asphalt pavement, 2 in average depth yd2 2.93
0327-70-11 Milling existing asphalt pavement, 2-1/4 in average depth yd2 3.07
0327-70-8 Milling existing asphalt pavement, 2-1/2 in average depth yd2 3.43
0327-70-15 Milling existing asphalt pavement, 2-3/4 in average depth yd2 3.75
0327-70-4 Milling existing asphalt pavement, 3 in average depth yd2 3.92
0327-70-17 Milling existing asphalt pavement, 3-1/4 in average depth yd2 4.03
0327-70-2 Milling existing asphalt pavement, 3-1/2 in average depth yd2 4.26
0327-70-20 Milling existing asphalt pavement, 3-3/4 in average depth yd2 4.67
0327-70-7 Milling existing asphalt pavement, 4 in average depth yd2 4.93
0327-70-22 Milling existing asphalt pavement, 4-1/4 in average depth yd2 5.30
0327-70-3 Milling existing asphalt pavement, 4-1/2 in average depth yd2 5.71
0327-70-26 Milling existing asphalt pavement, 4-3/4 in average depth yd2 5.81
0327-70-10 Milling existing asphalt pavement, 5 in average depth yd2 6.64
334-1-51 Superpave asphaltic concrete, traffic level A, PG 76-22 T 300.00
334-1-52 Superpave asphaltic concrete, traffic level B, PG 76-22 T 325.00
334-1-53 Superpave asphaltic concrete, traffic level C, PG 76-22 T 350.00
334-1-54 Superpave asphaltic concrete, traffic level D, PG 76-22 T 375.00
334-1-55 Superpave asphaltic concrete, traffic level E, PG 76-22 T 400.00
337-7-25 Asphaltic concrete friction course, FC-5, PG 76-22
T 400.00
0327-70-9 Milling existing asphalt pavement, 5-1/4 in average depth yd2 6.75
0327-70-19 Milling existing asphalt pavement, 5-1/2 in average depth yd2 7.20
0327-70-27 Milling existing asphalt pavement, 5-3/4 in average depth yd2 7.45
0327-70-23 Milling existing asphalt pavement, 6 in average depth yd2 8.00
0327-70-14 Milling existing asphalt pavement, 6-1/2 in average depth yd2 8.75
0327-70-21 Milling existing asphalt pavement, 7 in average depth yd2 9.20
0327-70-31 Milling existing asphalt pavement, 7-1/2 in average depth yd2 10.25
0327-70-33 Milling existing asphalt pavement, 7-3/4 in average depth yd2 10.40
The residual value of a rehabilitation alternative is the value that can be attributed to the
alternative at the end of the analysis period. The residual value can be determined as the portion
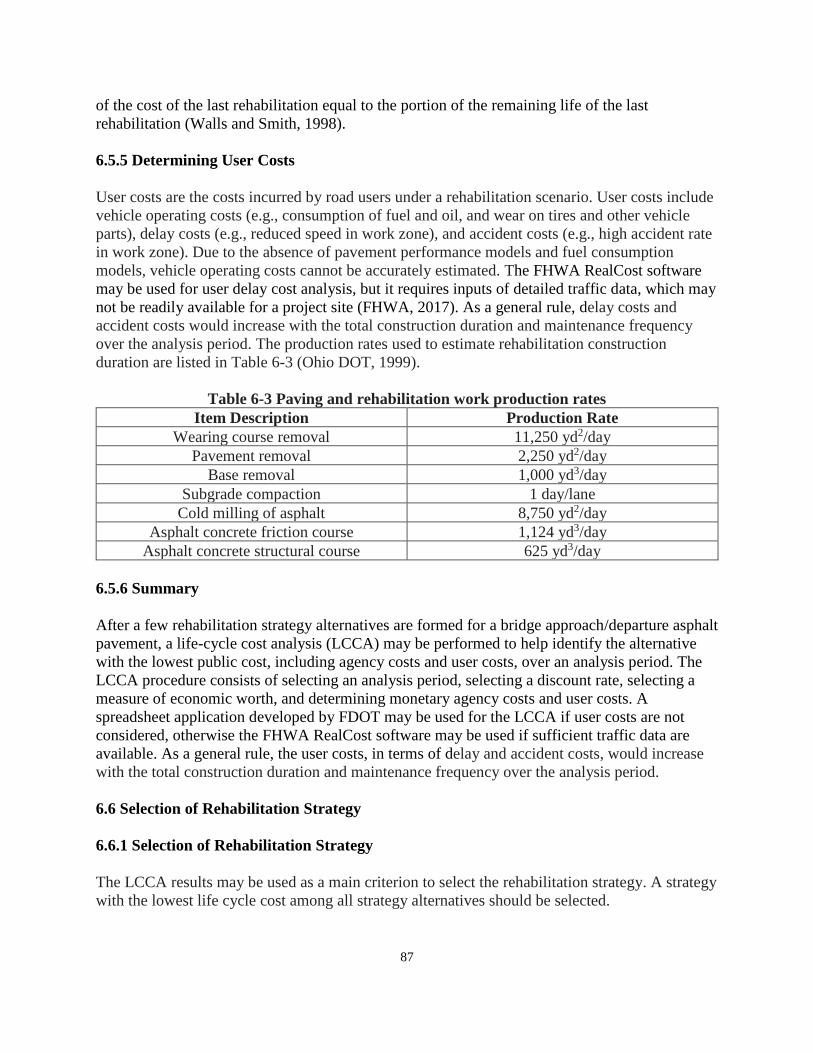
87
of the cost of the last rehabilitation equal to the portion of the remaining life of the last
rehabilitation (Walls and Smith, 1998).
6.5.5 Determining User Costs
User costs are the costs incurred by road users under a rehabilitation scenario. User costs include
vehicle operating costs (e.g., consumption of fuel and oil, and wear on tires and other vehicle
parts), delay costs (e.g., reduced speed in work zone), and accident costs (e.g., high accident rate
in work zone). Due to the absence of pavement performance models and fuel consumption
models, vehicle operating costs cannot be accurately estimated. The FHWA RealCost software
may be used for user delay cost analysis, but it requires inputs of detailed traffic data, which may
not be readily available for a project site (FHWA, 2017). As a general rule, delay costs and
accident costs would increase with the total construction duration and maintenance frequency
over the analysis period. The production rates used to estimate rehabilitation construction
duration are listed in Table 6-3 (Ohio DOT, 1999).
Table 6-3 Paving and rehabilitation work production rates
Item Description Production Rate
Wearing course removal 11,250 yd2/day
Pavement removal 2,250 yd2/day
Base removal 1,000 yd3/day
Subgrade compaction 1 day/lane
Cold milling of asphalt 8,750 yd2/day
Asphalt concrete friction course 1,124 yd3/day
Asphalt concrete structural course 625 yd3/day
6.5.6 Summary
After a few rehabilitation strategy alternatives are formed for a bridge approach/departure asphalt
pavement, a life-cycle cost analysis (LCCA) may be performed to help identify the alternative
with the lowest public cost, including agency costs and user costs, over an analysis period. The
LCCA procedure consists of selecting an analysis period, selecting a discount rate, selecting a
measure of economic worth, and determining monetary agency costs and user costs. A
spreadsheet application developed by FDOT may be used for the LCCA if user costs are not
considered, otherwise the FHWA RealCost software may be used if sufficient traffic data are
available. As a general rule, the user costs, in terms of delay and accident costs, would increase
with the total construction duration and maintenance frequency over the analysis period.
6.6 Selection of Rehabilitation Strategy
6.6.1 Selection of Rehabilitation Strategy
The LCCA results may be used as a main criterion to select the rehabilitation strategy. A strategy
with the lowest life cycle cost among all strategy alternatives should be selected.

88
A complete LCCA to quantify all possible agency and user costs, however, is sometimes difficult
to perform due to lack of information. Some agency or user costs may not be accurately
measured in monetary terms, such as worker risk during construction, user accident and delay
during construction, and increased user vehicle wear and tear and fuel consumption due to
pavement distresses. In this case, those costs may be excluded from the LCCA, treated as
nonmonetary factors and qualitatively assessed. As a general trend, user costs should increase
with the increase of rehabilitation frequency and construction duration. Some other
nonmonetary factors may also influence the strategy selection, such as environmental impact,
agency or contractor’s experience with the rehabilitation techniques, limit on construction space,
and availability of needed equipment. The final selection, therefore, should be based on the
LCCA, budget limitations, and consideration of nonmonetary factors.
A comparison table may be used to list the life cycle cost and nonmonetary factors of each
rehabilitation strategy alternative for overall consideration and comparison. One example of such
a table is shown in Table 6-4. It is recommended that at least two rehabilitation strategy
alternatives be considered.
Table 6-4 Comparison table example for selection of rehabilitation strategy Rehabilitation
Strategy
Life-Cycle
Cost
Rehabilitation
Frequency
Construction
Duration
Equipment
Accessibility
Material
Availability
1
2
3
4
6.6.2 Identification of Obstacles for Bridge Approach/Departure Asphalt Pavement
Repairs
To make the rehabilitation alternatives more feasible and practical, a questionnaire survey over
Florida pavement M&R contractors was conducted to identify the obstacles in the construction
process of bridge approach/departure asphalt pavement repairs. The survey questions are listed
as follows.
1. Do you have any experience with M&R of asphalt pavements on bridge
approaches/departures? (If the answer is No, you may skip the rest of the questions.)
2. Based on your experience, are there any additional rehabilitation obstacles (e.g.,
deployment of equipment, temporary traffic control, efficiency of M&R work) for M&R of
bridge approach/departure asphalt pavements compared to M&R of pavements on regular
roadways? If yes, please give a brief description of them.
3. Have you had a way, or do you have any suggestion, to overcome the obstacles mentioned
above? If yes, please give a brief description.
Based on the responses, the typical obstacle identified in the rehabilitation construction of bridge
approach/departure asphalt pavements is limited work space because at least one lane needs to be
open to the traffic. The practical way to make it easier for the contractor would be narrowing the
open lane or adding temporary asphalt pavement along the median.

89
6.6.3 An Example of Selection of Rehabilitation Strategy for Bridge Approach/Departure
Asphalt Pavements
This section provides an example to illustrate the step-by-step procedure for bridge
approach/departure asphalt pavement rehabilitation strategy selection proposed in this study. The
example is based on the pavement condition survey report (FIN 428804-1-52-01) for bridge
approaches (Bridge Number is 260079) investigated in 2013 (Moseley, 2013). Some of the data
for this example were drawn from this resource, and the other data were reasonably assumed.
Step 1. Pavement Condition Survey and Evaluation
The bridge approach pavement section is firstly identified as a 200 ft transition area from the end
of a bridge approach slab. The mean values of pavement performance indicators (e.g., crack
rating, rut depth, IRI) are calculated over the bridge approach pavement section and the control
section, respectively. The results are listed in Table 6-5.
Table 6-5 Pavement condition survey results
Performance Indicator Bridge Approach Pavement Control Section
Crack Rating 6.9 9.5
Rut Depth (in) 0.58 0.16
IRI (in/mi) 157.7 74.9
The condition of the bridge approach pavement is evaluated with its corresponding control
section from the following three aspects: smoothness, structural distresses, and drainage
condition. The evaluation results are summarized in Table 6-6, from which it can be seen that the
overall evaluation for the bridge approach pavement condition is “poor”.
Table 6-6 Performance evaluation result for bridge approach pavement
Performance Condition Indicator Evaluation Result
Smoothness Poor
Structural Distresses Poor
Drainage Condition No drainage related symptoms in the survey report,
such as excessively high moisture content, clogging of
edge drains.
Step 2. Detailed Data Collection
The detailed information of the poor bridge approach pavement is extracted from pavement
condition survey reports and RCI database, illustrated as follows. This bridge approach pavement
section is in the Alachua County of District 2 in Florida. The speed limit is 70 mph. This section
is a six-lane divided roadway with paved shoulders. The width of lanes is 12 ft. The base for the
travel lane and shoulders is limerock (LR). In 2013, the AADT and AADTT for this section were
70,000 and 12,950 vehicles per day, respectively. The BMP and EMP for the bridge are 9.701
and 9.739, respectively. The resilient modulus of roadbed soil is 18,000 psi. The layer
thicknesses for bridge approach pavement and control section are 6-3/4 in and 15-1/2 in,
respectively. The specific pavement structure extracted from pavement coring and evaluation
report is shown in Table 6-7. The critical cracking depth is identified as 2-1/2 in. The layer

90
causing the rutting was determined as the first structural course layer which is associated with a
lack of stability (Scullion, 2001). Based on GPR test results, subsurface condition was fine.
Table 6-7 Existing pavement structure
Material Layer Thickness (in)
Friction Course, FC-5 3/4
Structural Course, SP-12.5 2
Structural Course, SP-19.0 4
Base Course, LR 10
Stabilized Subgrade, LBR-40 12
Step 3. Selection of Rehabilitation Technique
Based on the existing pavement structure shown in Table 6-7, structural overlay and
reconstruction can be chosen to address the pavement distress issues (e.g., rutting and cracking)
for structural improvement.
Step 4. Formation of Rehabilitation Strategies
Five rehabilitation alternatives are developed based on traffic analysis, existing pavement
structure and condition. The design periods for milling and inlay are set as 8, 15, 20, and 30
years, respectively. The design period for reconstruction is 30 years. The ESALD over the 8-year
design period is 8 million (Traffic Level C) which can be obtained from FDOT District Planning
Office. The ESALD over the 15-year design period is 20 million (Traffic Level D), and the
ESALD values over the 20-year and 30-year design periods are 33 million (Traffic Level E) and
100 million (Traffic Level E), respectively. The design reliability of rehabilitation is set as 99%.
The required structural numbers (SNR) for four rehabilitation alternatives, as shown in Table 6-8,
can be obtained using Appendix A of the FDOT FPDM (FDOT, 2016b).
Table 6-8 Required structural number for rehabilitation strategy alternatives Rehabilitation Strategy ESALD Traffic Level SNR
8-Year Milling and Inlay 8,000,000 C 4.16
15-Year Milling and Inlay 20,000,000 D 4.78
20-Year Milling and Inlay 33,000,000 E 5.13
30-Year Milling and Inlay 100,000,000 E 5.97
30-Year Reconstruction 100,000,000 E 5.97
The existing structural number (SNE) for the bridge approach pavement without milling and
inlay is calculated using the procedure shown in Table 6-9. As can be seen, the existing structural
number (3.66) is lower than the required structural numbers for different design periods.
Table 6-9 Existing structural number of bridge approach pavement without milling
Layer Type Thickness (Di) Reduced Layer Coefficient (ai) SNE
Structural Course, SP 6 0.15 0.90
Base Course, LR 10 0.18 1.80
Subbase Course, LR 0 0.16 0.00
Stabilized Subgrade, LBR-40 12 0.08 0.96
Entire Structure of the Existing Pavement 3.66
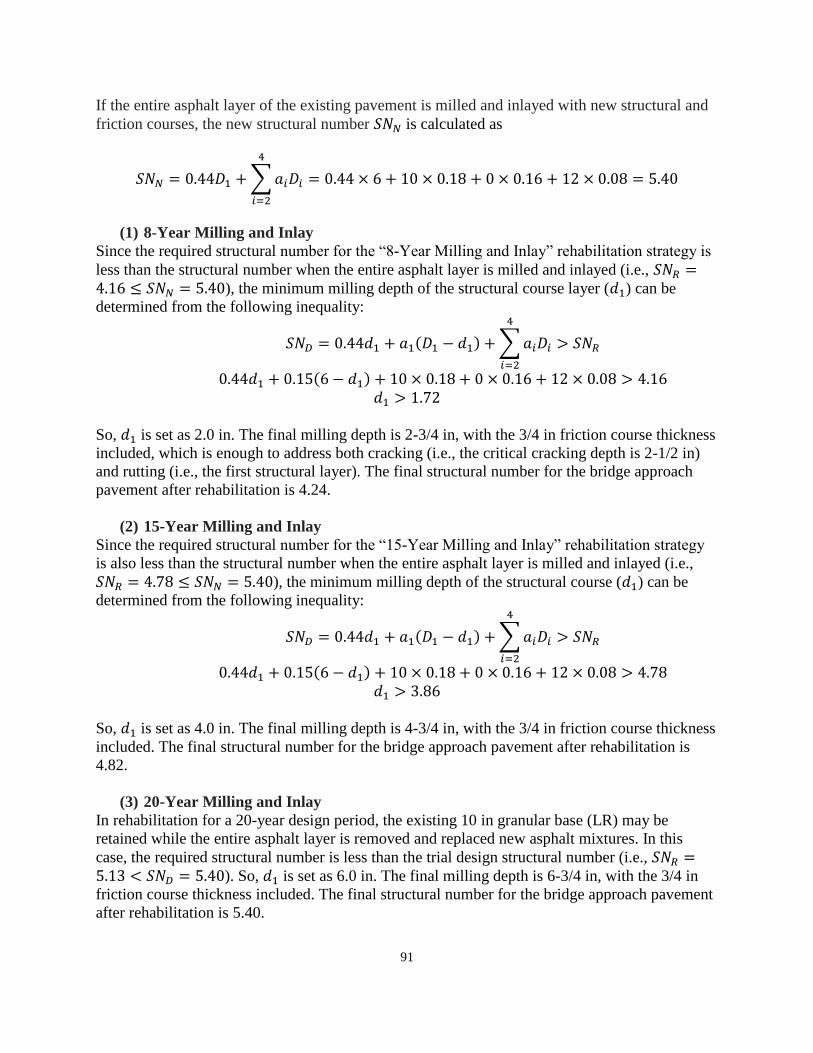
91
If the entire asphalt layer of the existing pavement is milled and inlayed with new structural and
friction courses, the new structural number 𝑆𝑁𝑁 is calculated as
𝑆𝑁𝑁 = 0.44𝐷1 + ∑ 𝑎𝑖𝐷𝑖
4
𝑖=2
= 0.44 × 6 + 10 × 0.18 + 0 × 0.16 + 12 × 0.08 = 5.40
(1) 8-Year Milling and Inlay
Since the required structural number for the “8-Year Milling and Inlay” rehabilitation strategy is
less than the structural number when the entire asphalt layer is milled and inlayed (i.e., 𝑆𝑁𝑅 =4.16 ≤ 𝑆𝑁𝑁 = 5.40), the minimum milling depth of the structural course layer (𝑑1) can be
determined from the following inequality:
𝑆𝑁𝐷 = 0.44𝑑1 + 𝑎1(𝐷1 − 𝑑1) + ∑ 𝑎𝑖𝐷𝑖
4
𝑖=2
> 𝑆𝑁𝑅
0.44𝑑1 + 0.15(6 − 𝑑1) + 10 × 0.18 + 0 × 0.16 + 12 × 0.08 > 4.16
𝑑1 > 1.72
So, 𝑑1 is set as 2.0 in. The final milling depth is 2-3/4 in, with the 3/4 in friction course thickness
included, which is enough to address both cracking (i.e., the critical cracking depth is 2-1/2 in)
and rutting (i.e., the first structural layer). The final structural number for the bridge approach
pavement after rehabilitation is 4.24.
(2) 15-Year Milling and Inlay
Since the required structural number for the “15-Year Milling and Inlay” rehabilitation strategy
is also less than the structural number when the entire asphalt layer is milled and inlayed (i.e.,
𝑆𝑁𝑅 = 4.78 ≤ 𝑆𝑁𝑁 = 5.40), the minimum milling depth of the structural course (𝑑1) can be
determined from the following inequality:
𝑆𝑁𝐷 = 0.44𝑑1 + 𝑎1(𝐷1 − 𝑑1) + ∑ 𝑎𝑖𝐷𝑖
4
𝑖=2
> 𝑆𝑁𝑅
0.44𝑑1 + 0.15(6 − 𝑑1) + 10 × 0.18 + 0 × 0.16 + 12 × 0.08 > 4.78
𝑑1 > 3.86
So, 𝑑1 is set as 4.0 in. The final milling depth is 4-3/4 in, with the 3/4 in friction course thickness
included. The final structural number for the bridge approach pavement after rehabilitation is
4.82.
(3) 20-Year Milling and Inlay
In rehabilitation for a 20-year design period, the existing 10 in granular base (LR) may be
retained while the entire asphalt layer is removed and replaced new asphalt mixtures. In this
case, the required structural number is less than the trial design structural number (i.e., 𝑆𝑁𝑅 =5.13 < 𝑆𝑁𝐷 = 5.40). So, 𝑑1 is set as 6.0 in. The final milling depth is 6-3/4 in, with the 3/4 in
friction course thickness included. The final structural number for the bridge approach pavement
after rehabilitation is 5.40.
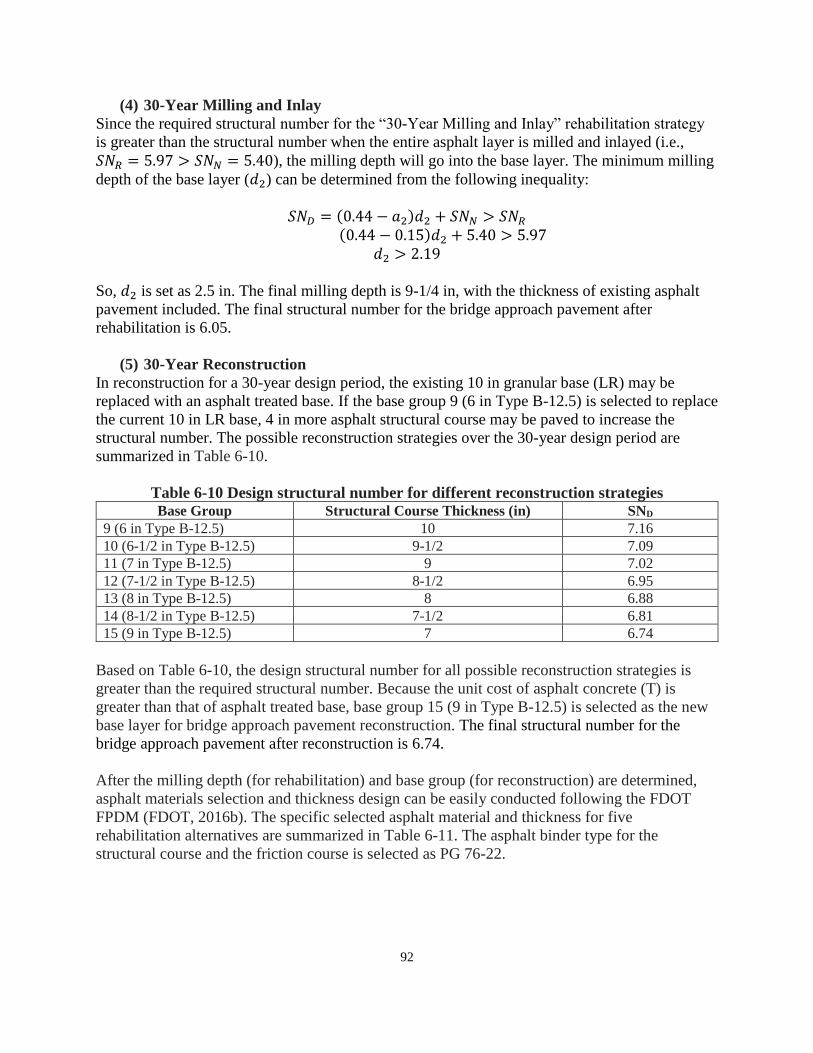
92
(4) 30-Year Milling and Inlay
Since the required structural number for the “30-Year Milling and Inlay” rehabilitation strategy
is greater than the structural number when the entire asphalt layer is milled and inlayed (i.e.,
𝑆𝑁𝑅 = 5.97 > 𝑆𝑁𝑁 = 5.40), the milling depth will go into the base layer. The minimum milling
depth of the base layer (𝑑2) can be determined from the following inequality:
𝑆𝑁𝐷 = (0.44 − 𝑎2)𝑑2 + 𝑆𝑁𝑁 > 𝑆𝑁𝑅
(0.44 − 0.15)𝑑2 + 5.40 > 5.97
𝑑2 > 2.19
So, 𝑑2 is set as 2.5 in. The final milling depth is 9-1/4 in, with the thickness of existing asphalt
pavement included. The final structural number for the bridge approach pavement after
rehabilitation is 6.05.
(5) 30-Year Reconstruction
In reconstruction for a 30-year design period, the existing 10 in granular base (LR) may be
replaced with an asphalt treated base. If the base group 9 (6 in Type B-12.5) is selected to replace
the current 10 in LR base, 4 in more asphalt structural course may be paved to increase the
structural number. The possible reconstruction strategies over the 30-year design period are
summarized in Table 6-10.
Table 6-10 Design structural number for different reconstruction strategies Base Group Structural Course Thickness (in) SND
9 (6 in Type B-12.5) 10 7.16
10 (6-1/2 in Type B-12.5) 9-1/2 7.09
11 (7 in Type B-12.5) 9 7.02
12 (7-1/2 in Type B-12.5) 8-1/2 6.95
13 (8 in Type B-12.5) 8 6.88
14 (8-1/2 in Type B-12.5) 7-1/2 6.81
15 (9 in Type B-12.5) 7 6.74
Based on Table 6-10, the design structural number for all possible reconstruction strategies is
greater than the required structural number. Because the unit cost of asphalt concrete (T) is
greater than that of asphalt treated base, base group 15 (9 in Type B-12.5) is selected as the new
base layer for bridge approach pavement reconstruction. The final structural number for the
bridge approach pavement after reconstruction is 6.74.
After the milling depth (for rehabilitation) and base group (for reconstruction) are determined,
asphalt materials selection and thickness design can be easily conducted following the FDOT
FPDM (FDOT, 2016b). The specific selected asphalt material and thickness for five
rehabilitation alternatives are summarized in Table 6-11. The asphalt binder type for the
structural course and the friction course is selected as PG 76-22.
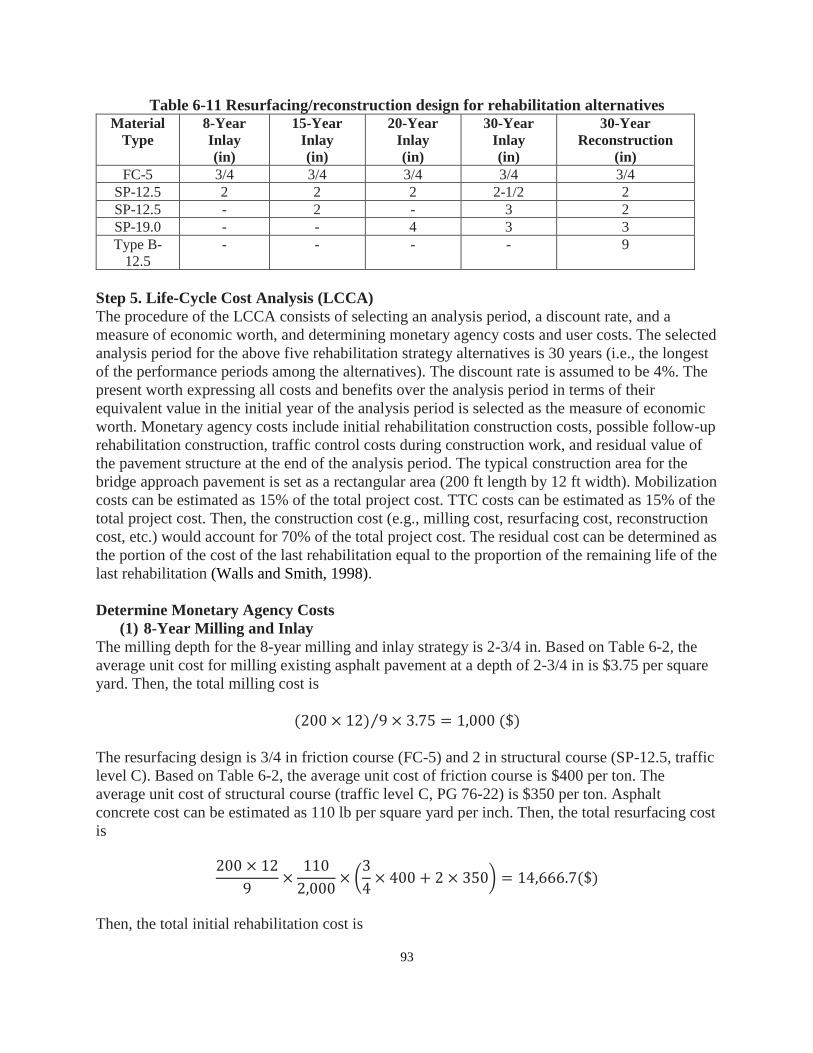
93
Table 6-11 Resurfacing/reconstruction design for rehabilitation alternatives Material
Type
8-Year
Inlay
(in)
15-Year
Inlay
(in)
20-Year
Inlay
(in)
30-Year
Inlay
(in)
30-Year
Reconstruction
(in)
FC-5 3/4 3/4 3/4 3/4 3/4
SP-12.5 2 2 2 2-1/2 2
SP-12.5 - 2 - 3 2
SP-19.0 - - 4 3 3
Type B-
12.5
- - - - 9
Step 5. Life-Cycle Cost Analysis (LCCA)
The procedure of the LCCA consists of selecting an analysis period, a discount rate, and a
measure of economic worth, and determining monetary agency costs and user costs. The selected
analysis period for the above five rehabilitation strategy alternatives is 30 years (i.e., the longest
of the performance periods among the alternatives). The discount rate is assumed to be 4%. The
present worth expressing all costs and benefits over the analysis period in terms of their
equivalent value in the initial year of the analysis period is selected as the measure of economic
worth. Monetary agency costs include initial rehabilitation construction costs, possible follow-up
rehabilitation construction, traffic control costs during construction work, and residual value of
the pavement structure at the end of the analysis period. The typical construction area for the
bridge approach pavement is set as a rectangular area (200 ft length by 12 ft width). Mobilization
costs can be estimated as 15% of the total project cost. TTC costs can be estimated as 15% of the
total project cost. Then, the construction cost (e.g., milling cost, resurfacing cost, reconstruction
cost, etc.) would account for 70% of the total project cost. The residual cost can be determined as
the portion of the cost of the last rehabilitation equal to the proportion of the remaining life of the
last rehabilitation (Walls and Smith, 1998).
Determine Monetary Agency Costs
(1) 8-Year Milling and Inlay
The milling depth for the 8-year milling and inlay strategy is 2-3/4 in. Based on Table 6-2, the
average unit cost for milling existing asphalt pavement at a depth of 2-3/4 in is $3.75 per square
yard. Then, the total milling cost is
(200 × 12) 9⁄ × 3.75 = 1,000 ($)
The resurfacing design is 3/4 in friction course (FC-5) and 2 in structural course (SP-12.5, traffic
level C). Based on Table 6-2, the average unit cost of friction course is $400 per ton. The
average unit cost of structural course (traffic level C, PG 76-22) is $350 per ton. Asphalt
concrete cost can be estimated as 110 lb per square yard per inch. Then, the total resurfacing cost
is
200 × 12
9×
110
2,000× (
3
4× 400 + 2 × 350) = 14,666.7($)
Then, the total initial rehabilitation cost is

94
14,666.7 + 1,000
70%≈ 22,381($)
Finally, the total rehabilitation cost over the analysis period is
22,381
(1 + 4%)0+
22,381
(1 + 4%)8+
22,381
(1 + 4%)16+
22,381
(1 + 4%)24× (1 −
2
8) ≈ 57,232($)
(2) 15-Year Milling and Inlay
The milling depth for the 15-year milling and inlay strategy is 4-3/4 in. Based on Table 6-2, the
average unit cost for milling the existing asphalt pavement at a depth of 4-3/4 in is $5.81 per
square yard. Then, the total milling cost is
(200 × 12) 9⁄ × 5.81 = 1,549.3 ($)
The resurfacing design is 3/4 in friction course (FC-5) and 4 in structural course (SP-12.5, traffic
level D). Based on Table 6-2, the average unit cost of friction course is $400 per ton. The
average unit cost of structural course (traffic level D, PG 76-22) is $375 per ton. Asphalt
concrete cost can be estimated as 110 lb per square yard per inch. Then, the total resurfacing cost
is
200 × 12
9×
110
2,000× (
3
4× 400 + 4 × 375) = 26,400($)
Then, the total initial rehabilitation cost is
26,400 + 1,549.3
70%≈ 39,928($)
Finally, the total rehabilitation cost over the analysis period is
39,928
(1 + 4%)0+
39,928
(1 + 4%)15≈ 62,099($)
(3) 20-Year Milling and Inlay
The total removal work for the 20-year milling and inlay design is 6-3/4 in asphalt pavement.
Based on Table 6-2, the average unit cost for milling existing asphalt pavement at a depth of 6-
3/4 in is $9.00 per square yard. Then, the total cost for removal work is
(200 × 12) 9⁄ × 9.00 = 2,400 ($)
The rehabilitation design is a 3/4 in friction course (FC-5) and a 6 in structural course (traffic
level E). Based on Table 6-2, the average unit cost of friction course is $400 per ton. The average
unit cost of structural course (traffic level E, PG 76-22) is $400 per ton. Asphalt concrete cost
can be estimated as 110 lb per square yard per inch. Then, the total resurfacing cost is

95
200 × 12
9×
110
2,000× (
3
4× 400 + 6 × 400) = 39,600($)
Then, the total initial rehabilitation cost is
2,400 + 39,600
70%= 60,000($)
Assuming a second rehabilitation will be conducted at the end of the 20th year, the total
rehabilitation cost over the 30-year analysis period is
60,000
(1 + 4%)0+
60,000
(1 + 4%)20× (1 −
10
20) ≈ 73,692($)
(4) 30-Year Milling and Inlay
The total milling depth for 30-year milling and inlay strategy is 9-1/4 in (i.e., 6-3/4 in asphalt
pavement and 2-1/2 in base layer). Based on Table 6-2, the average unit cost for milling existing
asphalt pavement at a depth of 6-3/4 in is $9.00 per square yard. The average unit cost for
milling base layer at a depth of 2-1/2 in is assumed to be $10.00 per square yard. Then, the total
milling cost is
(200 × 12) 9⁄ × (9.00 + 10.00) = 5,066.7 ($)
The resurfacing design is a 3/4 in friction course (FC-5) and an 8-1/2 in structural course (traffic
level E). Based on Table 6-2, the average unit cost of friction course is $400 per ton. The average
unit cost of structural course (traffic level E, PG 76-22) is $400 per ton. Asphalt concrete cost
can be estimated as 110 lb per square yard per inch.
Then, the total resurfacing cost is
200 × 12
9×
110
2,000× (
3
4× 400 + 8
1
2× 400) ≈ 54,267($)
Finally, the total rehabilitation cost over the analysis period is
54,267 + 5,066.7
70%≈ 84,762($)
(5) 30-Year Reconstruction
The total removal work for the 30-year reconstruction design is 6-3/4 in asphalt pavement and 10
in limerock base layer. Based on Table 6-2, the average unit cost for milling existing asphalt
pavement at a depth of 6-3/4 in is $9.00 per square yard. The average unit cost for removing the
base layer at a depth of 10 in is assumed to be $50.00 per square yard. Then, the total cost for
removal work is
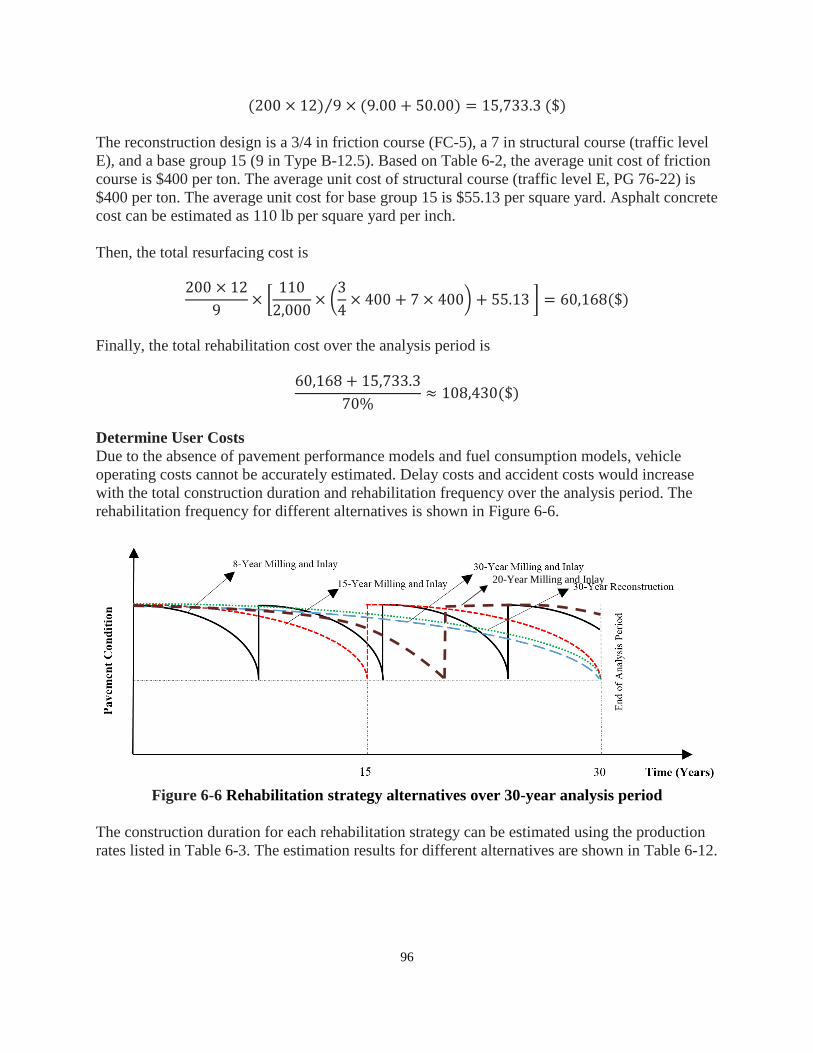
96
(200 × 12) 9⁄ × (9.00 + 50.00) = 15,733.3 ($)
The reconstruction design is a 3/4 in friction course (FC-5), a 7 in structural course (traffic level
E), and a base group 15 (9 in Type B-12.5). Based on Table 6-2, the average unit cost of friction
course is $400 per ton. The average unit cost of structural course (traffic level E, PG 76-22) is
$400 per ton. The average unit cost for base group 15 is $55.13 per square yard. Asphalt concrete
cost can be estimated as 110 lb per square yard per inch.
Then, the total resurfacing cost is
200 × 12
9× [
110
2,000× (
3
4× 400 + 7 × 400) + 55.13 ] = 60,168($)
Finally, the total rehabilitation cost over the analysis period is
60,168 + 15,733.3
70%≈ 108,430($)
Determine User Costs
Due to the absence of pavement performance models and fuel consumption models, vehicle
operating costs cannot be accurately estimated. Delay costs and accident costs would increase
with the total construction duration and rehabilitation frequency over the analysis period. The
rehabilitation frequency for different alternatives is shown in Figure 6-6.
Figure 6-6 Rehabilitation strategy alternatives over 30-year analysis period
The construction duration for each rehabilitation strategy can be estimated using the production
rates listed in Table 6-3. The estimation results for different alternatives are shown in Table 6-12.
20-Year Milling and Inlay

97
Table 6-12 Construction duration (days) for rehabilitation strategy alternatives
Item
8-Year
Milling &
Inlay
15-Year
Milling &
Inlay
20-Year
Milling &
Inlay
30-Year
Milling &
Inlay
30-Year
Reconstruction
Mobilization
and MOT
1 1 1 1 1
Pavement
removal
1 1 1 1 1
Base removal 0 0 0 1 1
Base work 0 0 0 0 1
Resurfacing or
reconstruction
1 1 1 1 1
Equipment
departure
1 1 1 1 1
Overall 4 4 4 5 6
Step 6. Selection of Rehabilitation Strategy
The comparison table for selection of rehabilitation strategy is shown in Table 6-13.
Table 6-13 Comparison analysis for selection of rehabilitation strategy Rehabilitation
Strategy
Life-Cycle
Agency Cost ($)
Rehabilitation
Frequency
Total Construction
Duration (day)
SN
Improvement
8-Year
Milling and Inlay 57,232 4 16 0.58
15-Year
Milling and Inlay 62,099 2 8 1.16
20-Year
Milling and Inlay 73,692 2 8 1.74
30-Year
Milling and Inlay 84,762 1 5 2.39
30-Year
Reconstruction 108,430 1 6 3.08
The selected rehabilitation strategy for bridge approach pavement should minimize the total life-
cycle cost. In this case study, the user costs are not quantitatively determined. However,
considering the high traffic volume (an AADT of 70,000), it is expected that the user delay cost
due to rehabilitation work would be high. Since the differences between the life-cycle agency
costs of the five strategies are small, a rehabilitation strategy with a low rehabilitation frequency
should be selected to reduce traffic interruptions. Based on these considerations, the 30-year
milling and inlay option would be the best rehabilitation strategy for the bridge approach
pavement.
In this example, in the “8-Year Milling and Inlay” and “15-Year Milling and Inlay”
rehabilitation strategies, the milling depths (2.75 and 4.75 in) exceed the critical cracking depth
(2.5 in), but are less than the total asphalt layer thickness (6.75 in). These designs will leave the
original structural course SP-19.0 in place as part of the rehabilitated asphalt concrete layer.

98
Although the remained SP-19.0 course is below the critical cracking depth, it is possible that
cracks exist in this course. Without effective treatment for reflective cracking, cracks may
quickly propagate into the asphalt overlay and lead to premature failure of the rehabilitated
pavement. The actual life cycle costs of the 8-year and 15-year rehabilitation strategies,
therefore, are likely to be higher than those shown in Table 6-13. This concern further supports
the selection of the 30-year milling and inlay option as the best rehabilitation strategy.
The difference in agency costs between the 20-year and 30-year design periods is around
$11,070 (for 20- and 30-year milling and inlay) or $34,738 (for 20-year milling and inlay and 30-
year reconstruction) for a 200 ft by 12 ft bridge approach pavement section for a 30-year analysis
period. If detailed traffic information was available to allow estimation of the user costs, the
increased user costs due to the extra rehabilitation scheduled at the end of the 20th year for the
20-year rehabilitation strategy may be compared with this cost difference, and a decision may be
made with more confidence. For the high AADT in this example, the increased user costs are
likely much higher than $34,738 based on the user cost information available in the literature.
For example, using a typical hourly value of vehicle delay time of $38.27/vehicle-hr for intercity
personal travel (Mallela and Sadasivam, 2011), the user delay cost will amount to
$38.27 × 70,000/2 × 10/60 = $223,242 per day if each vehicle in one travel direction is
assumed to be delayed for only 10 minutes in a day. Therefore, the 30-year design period would
be preferred to the 20-year design period.
6.7 Summary
The procedure proposed for rehabilitation strategy selection for bridge approach/departure
asphalt pavements is summarized in Figure 6-7.

99
IRI, Crack Rating, Rut Depth Visual Survey and Assessment
Pavement Condition Survey and Evaluation
Identification of Distress Causes
Ground-Penetrating
Radar Test
Material Sampling
and Testing
Selection of Rehabilitation Techniques
ReconstructionMilling &
Asphalt Inlay
Asphalt
Patching
Reinforcement
Fabric
Design of Rehabilitation Strategies
Reconstruction Design Milling & Asphalt Inlay Design
Life-Cycle Cost Analysis
Analysis Period Discount Rate Monetary Agency Costs User CostsPresent Worth
Selection of the Optimum Rehabilitation Strategy
Monetary Costs Maintenance Frequency Construction Duration Structural Improvement
In-place
Recycling
In-place Recycling Design
Comprehensive
Geotechnical Investigation
Figure 6-7 Rehabilitation strategy selection procedure for bridge approach/departure
asphalt pavements

100
CHAPTER 7 POTENTIAL CHANGES TO FDOT PAVEMENT PRACTICES
The proposed procedure for rehabilitation strategy selection for bridge approach/departure
asphalt pavements will require some changes to the current FDOT pavement practices for bridge
approach/departure asphalt pavements. Those suggested changes are summarized in Table 7-1.
Table 7-1 Suggested changes to current FDOT pavement rehabilitation practices
Item Current Practice Suggested Changes
Pavement
Condition
Survey and
Evaluation
No special consideration is
given in pavement condition
survey and evaluation to
bridge approach/departure
asphalt pavements.
Bridge approach/departure pavements should be
considered as special sections in pavement condition
survey and evaluation, and recorded as separate
pavement sections in pavement condition database.
As-built Data
Material sampling and testing
are typically not conducted on
bridge approach/departure
asphalt pavements during
pavement construction or
rehabilitation.
As part of quality control (QC) and quality assurance
(QA) during pavement construction or rehabilitation,
material samples (e.g., cores) should be taken from the
bridge approach pavement and tested, in the same way as
for control sections.
Special
Pavement Test
The GPR test is performed on
a pavement section upon
special requests, and the GPR
data are recorded at a spacing
of 100 ft.
If a bridge approach pavement is deemed in need of
rehabilitation and its structure information is not
available, the GPR test may be performed to measure
pavement layer thickness and moisture content, with the
data resolution of around 6 ft of pavement per trace.
Rehabilitation
Techniques
A short-term maintenance
approach (e.g., patching and
crack sealing) is commonly
used to address bridge
approach pavement distresses.
If the condition of a bridge approach pavement is rated
as poor based on condition survey and evaluation, a
long-term rehabilitation plan should be considered to
reduce maintenance frequency and corresponding traffic
interruptions.
Rehabilitation
Strategies
Bridge approach/departure
pavements are typically
rehabilitated at the same time
and in the same way as their
control sections. Bridge
approach/departure asphalt
pavements are typically milled
with a thickness of 2-3/4 in
and resurfaced with a 2 in
Type SP structural asphalt and
a 3/4 in FC-5 friction course.
The design period for flexible
pavement reconstruction is 20
years.
If a bridge approach/departure asphalt pavement shows
distresses worse than its control section, it should be
considered for rehabilitation individually. The milling
and inlay design for bridge approach/departure asphalt
pavements needs to vary with existing pavement
conditions, pavement structures, and truck traffic
volumes. The specific milling and inlay depth can be
determined following the modified structural deficiency
approach, with measures to prevent reflective cracking
such as placement of a geotextile fabric interlayer. In-
place recycling with asphalt overlay may also be
considered as one rehabilitation option, including full
depth reclamation. A 30-year rehabilitation design
period is recommended for bridge approach/departure
asphalt pavements on Interstate highways with high
traffic volumes. This is because the difference in agency
costs would be small compared to the increased user cost
due to increased rehabilitation frequency, as illustrated in
the example in Chapter 6.

101
Table 7-1 Suggested changes to current FDOT pavement rehabilitation practices
(continued) Life-Cycle
Cost Analysis
for
Rehabilitation
Strategy
Alternatives
Life-cycle cost analysis
(LCCA) has not been
considered in the bridge
approach pavement
rehabilitation practices.
LCCA may be conducted to identify the cost-effective
rehabilitation strategy for bridge approach/departure
asphalt pavements. The LCCA spreadsheet application
developed by FDOT or the FHWA RealCost software
may be used for this purpose.
Selection of
the Best
Rehabilitation
Strategy
A short-term maintenance
approach is commonly
accepted. One-time agency
costs are weighed more
important than the other
factors (e.g., maintenance
frequency).
The selected rehabilitation strategy for bridge
approach/departure asphalt pavements should minimize
the total life-cycle cost, including both agency costs and
user costs.
The suggested changes to current FDOT pavement practices will require involvement and
commitment of relevant Department offices such as materials offices and pavement management
sectors at the state and/or district level. Changes of work process will be mainly in the following
aspects:
• During rehabilitation or construction of asphalt pavements incorporating a bridge
approach pavement, material sampling and testing effort is increased to ensure the bridge
approach pavement is tested during QC/QA.
• The current segmentation of pavement sections in pavement annual condition database
needs to be refined to isolate the bridge approach pavement sections. Software used to
collect and process pavement condition data needs to be updated for such change.
• The GPR test may need to be conducted on a large number of bridge approach
pavements. There are about 1,155 bridges with asphalt approach pavements on Florida
Interstate highways, and about 27% of them showed signs of cracking and 20% of them
showed signs of rutting based on video log images and 2014-2015 pavement condition
survey data. GPR data are currently available for only 75 out of the 1,155 bridges.
• Extra design and analysis effort is needed in determining a proper rehabilitation strategy
for a bridge approach pavement, including pavement structural design and LCCA.
The proposed process improvement will enable FDOT to develop a good management system
for bridge approach pavements and make better M&R decisions for these pavements. The long-
term benefit is reduced M&R frequency and life cycle cost at these bridge approach/departure
pavements. Most importantly, the public can benefit from these changes in terms of reduction in
delay time, accident risk, fuel consumption, vehicle wear and tear, and environmental impact that
may all arise in M&R related work zones.
102
REFERENCES
Allen, D.L., 1985. A Survey of the States on Problems Related to Bridge Approaches. (Report
No. UKTRP-85-25). Kentucky Transportation Research Program, Kentucky.
AASHTO, 1993. AASHTO Guide for Design of Pavement Structures. American Association of
State Highway, and Transportation Officials, Washington, D.C.
Asphalt Institute, 2009. Asphalt in Pavement Preservation and Maintenance. ISBN-
193415458X.
ASTM E1926-08, 2015. Standard Practice for Computing International Roughness Index of
Roads from Longitudinal Profile Measurements. ASTM International, West Conshohocken, PA.
Bennett, H.C., and Jean, H.V., 2015. General Engineering Consultant Services Report. (FPN
425032-1-62-01, SR 710 Over Nubbin Slough, Bridge Number 910097). Okeechobee County,
Florida.
Briaud, J.L., James, R.W., and Hoffman, S. B., 1997. Settlement of Bridge Approaches:the Bump
at the End of the Bridge (Synthesis of Highway Practice, Vol. 234). Washington, D. C.:
Transportation Research Board.
CDOT, 2017. Pavement Design Manual. Colorado Department of Transportation. Pp. 278-279.
Das, S.C., Bakeer, R.M., Zhong, J., & Schutt, M.A., 1999. Assessment of Mitigating
Embankment Settlement with Pile-Supported Approach Slabs. Baton Rouge: Louisiana
Department of Transportation.
Dupont, B., and David L.A., 2002. Movements and Settlements of Highway Bridge Approaches.
(Report No. KTC-02-18/SPR-220-00-1F). University of Kentucky, Lexington, Kentucky.
FDOT, 2009a. Rehabilitation Recommendations, FPN 419437-1, SR 93 (I-75), Section #36210,
MP 13.945-18.436. Florida Department of Transportation, Gainesville, Florida.
FDOT, 2009b. Rehabilitation Recommendations, FPN 423567-1, SR 9 (I-95), Section #70225,
MP 22.509-31.190. Florida Department of Transportation, Gainesville, Florida.
FDOT, 2010. Basis of Estimates Manual. Florida Department of Transportation, Tallahassee,
Florida.
FDOT, 2012. FDOT Design Standards FY 2012/2013. Index No. 20900. Florida Department of
Transportation, Gainesville, Florida.
FDOT, 2013. Pavement Type Selection Manual. Pavement Management Section,
Office Of Roadway Design, Florida Department of Transportation, Tallahassee, Florida.

103
FDOT, 2015. Flexible Pavement Condition Survey Handbook. State Materials Office, Florida
Department of Transportation, Gainesville, Florida.
FDOT, 2016a. Roadway Characteristics Inventory (RCI) Features and Characteristics
Handbook. Florida Department of Transportation, Tallahassee, Florida.
FDOT, 2016b. Flexible Pavement Design Manual (FPDM). Florida Department of
Transportation, Tallahassee, Florida.
FDOT, 2018. Soil and Foundations Handbook. Florida Department of Transportation, State
Materials Office, Gainesville, Florida.
FHWA, 2006. Pavement Smoothness Methodologies (Report No. FHWA-HRT-06-041). Federal
Highway Administration, Washington D.C.
FHWA, 2009. Manual on Uniform Traffic Control Devices for Streets and Highways. Federal
Highway Administration, Pp. 552-553.
FHWA, 2016. Status of the Nation's Highways, Bridges, and Transit: Conditions &
Performance. Federal Highway Administration, Washington D.C.
FHWA, 2017. Life-Cycle Cost Analysis. www.fhwa.dot.gov/infrastructure/asstmgmt/lcca.cfm.
Accessed on October 20, 2017.
Greene, J., Choubane, B., Chun, S., and Kim, S., 2012. Effect of asphalt rubber membrane
interlayer (ARMI) on instability rutting and reflection cracking of asphalt mixture (Report No.
FL/DOT/SMO/12-552). Florida Department of Transportation, Tallahassee, Florida.
Greene, W.H., 2012. Econometric Analysis. 7th Edition, New York University.
Hall, K.T., Correa, C.E., Carpenter, S.H. and Elliot, R.P., 2001. Rehabilitation strategies for
highway pavements (Project No. C1-38). National Cooperative Highway Research Program,
Transportation Research Board, National Research Council, Washington D.C.
Harvey, J., Weissman, S., Long, F., and Monismith, C., 2001. “Tests to Evaluate the Stiffness
and Permanent Deformation Characteristics of Asphalt/Binder-Aggregate Mixes, and Their Use
in Mix Design and Analysis.” In Proceedings of the Asphalt Paving Technology, Pp.572-604.
Hiltunen, D.R., 2014. Synthesis/Literature Review for Determining Structural Layer Coefficients
(SLC) of Bases (Report No. BDV31-977-27). Florida Department of Transportation, Tallahassee,
Florida.
Holzschuher, C., 2015. Ground Penetrating Radar Evaluation of SR 710 in Okeechobee County.
Florida Department of Transportation, Gainesville, Florida.
Hopkins, T.C., 1985. Long-Term Movements of Highway Bridge Approach Embankments and

104
Pavements (Report No. UKTRP-85-12). Kentucky Transportation Research Program, Kentucky.
Illinois DOT, 2008. Bureau of Local Roads and Streets Manual. Illinois Department of
Transportation, Springfield, Illinois. Pp. 1645.
Jayawickrama, P., Nash, P., Leaverton, M. and Mishra, D., 2005. Water Intrusion in
Base/Subgrade Materials at Bridge Ends (Report No. 0-5096-1). Texas Department of
Transportation, Lubbock, Texas.
Johanns, M. and Craig, J., 2002. Pavement Maintenance Manual. Nebraska Department of
Roads. Pp.11-19.
Lavin, P., 2003. Asphalt pavements: a practical guide to design, production and maintenance for
engineers and architects. CRC Press.
Lenke, L.R., 2006. Settlement Issues--Bridge Approach Slabs (Final Report Phase 1) (Report
No. NM04MNT-02). New Mexico Department of Transportation, Albuquerque, New Mexico.
Lin, J.D., Yau, J.T. and Hsiao, L.H., 2003. “Correlation analysis between international roughness
index (IRI) and pavement distress by neural network.” In 82nd Annual Meeting of the
Transportation Research Board.
Long, J., Olson, S., Stark, T. and Samara, E., 1998. “Differential Movement at Embankment-
Bridge Structure Interface in Illinois.” Transportation Research Record: Journal of the
Transportation Research Board, (1633), Pp.53-60.
Mallela, J. and Sadasivam, S., 2011. Work Zone Road User Costs: Concepts and Applications
(Report No. FHWA-HOP-12-005). Federal Highway Administration, Washington, DC.
Maryland DOT, 2002. Pavement Design Guide. Maryland Department of Transportation, State
Highway Administration. Pp.176-180.
Montana DOT, 2015. Memorandum of 30-year Pavement Design at Bridge Ends. Montana
Department of Transportation, Helena, Montana.
Michigan DOT, 2016. Project Scoping Manual. Michigan Department of Transportation,
Cadillac, Michigan. Pp. 54-63.
Moseley, H., 2009. Material Considerations for Bituminous Resurfacing, I-75 from South of US
129 to North of SR 6 (Report No. FIN 423432-1-52-01). Florida Department of Transportation,
Gainesville, Florida.
Moseley, H., 2012. Material Considerations for Bituminous Resurfacing, I-75 from South of SR
222 to North of US 441 (Report No. FIN 428803-1-52-01). Florida Department of
Transportation, Gainesville, Florida.

105
Moseley, H., 2013. Material Considerations for Bituminous Resurfacing, I-75 from South of SR
121 to South of SR 222 (Report No. FIN 428804-1-52-01). Florida Department of Transportation,
Gainesville, Florida.
Nam, B.H., Golestani, B., Noori, M., Tatari, O. and An, J., 2014. Investigation of reflective
cracking mitigation techniques (Report No. BDK 78-977-17). Florida Department of
Transportation, Gainesville, Florida.
Nebraska DOR, 2002. Pavement Maintenance Manual. Nebraska Department of Roads, Lincoln,
Nebraska. pp. 11-16.
Ohio DOT. 1999. Pavement Design and Rehabilitation Manual. Ohio Department of
Transportation, West Union, Ohio.
Oregon DOT. 2011. Pavement Design Guide. Oregon Department of Transportation, Salem,
Oregon.
Papagiannakis, A., Gharaibeh, N., Weissmann, J. and Wimsatt, A., 2009. Pavement scores
synthesis (Report No. FHWA/TX-09/0-6386-1). Texas Department of Transportation, Austin,
Texas.
Parkash, B. and Moseley, H., 2009. Report of Geotechnical Exploration, I-75 Bridges Over CR
2054 Approach Pavement Failures & 3 Roadway Depressions Located at Mile Post 396.495,
396.568 & 396.780 Alachua County, FL (Report No. FIN 410213-2-72-15). Florida Department
of Transportation, Gainesville, Florida.
Perera, R.W., Byrum, C. and Kohn, S.D.,1998. Investigation of development of pavement
roughness (Report No. FHWA-RD-97-147). Federal Highway Administration, Washington D.C.
Phares, B.M., White, D.J., Bigelow, J., Berns, M. and Zhang, J., 2011. Identification and
Evaluation of Pavement-Bridge Interface Ride Quality Improvement and Corrective
Strategies (Report No. FHWA/OH-2011/1), Ohio Department of Transportation, Columbus,
Ohio.
Rahman, A., Ai, C., Xin, C., Gao, X. and Lu, Y., 2017. “State-of-the-art review of interface bond
testing devices for pavement layers: toward the standardization procedure.” Journal of Adhesion
Science and Technology, 31(2), Pp.109-126.
Rufino, D., BaRaKa, K., and Darter, M., 2001. Development of a Bridge Smoothness
Specification for Illinois DOT (Report No. FHWA-IL-UI-279). Illinois Department of
Transportation, Springfield, IL.
Saleh, M., Mamlouk, M. and Owusu-Antwi, E., 2000. “Mechanistic roughness model based on
vehicle-pavement interaction.” Transportation Research Record: Journal of the Transportation
Research Board, (1699), Pp.114-120.
106
Sayers, M.W., 1995. “On the Calculation of International Roughness Index from Longitudinal
Road Profile.” Transportation Research Record (1501). Pp. 1–12.
Scullion, T. 2001. Selecting Rehabilitation Options for Flexible Pavements: Guidelines for Field
Investigations (Report No. FHWA/TX-01/1712-4). Texas Department of Transportation, Austin,
Texas. Pp. 1-28.
Sebesta, S. and Scullion, T. 2004. Effectiveness of minimizing reflective cracking in cement-
treated bases by microcracking (Report No. FHWA/TX-05/0-4502-1). Texas Department of
Transportation, Austin, Texas.
Stewart, C.F. 1985. Highway Structure Approaches (Report No. FHWA/CA/SD-85-05).
California Department of Transportation, Sacramento, California.
Texas DOT, 2016. Pavement Manual. Texas Department of Transportation, Austin, Texas. Pp.
268-289.
Wahls, H.E., 1990. Design and Construction of Bridge Approaches. Vol. 159. Transportation
Research Board. Washington, DC.
Walls, J. and Smith, M.R., 1998. Life-Cycle Cost Analysis in Pavement Design-Interim
Technical Bulletin (Report No. FHWA-SA-98-079). Federal Highway Administration,
Washington, DC.
White, D.J., Mekkawy, M.M., Sritharan, S. and Suleiman, M.T., 2007. ““Underlying” Causes for
Settlement of Bridge Approach Pavement Systems.” Journal of performance of constructed
facilities, 21(4), Pp.273-282.
White, D., Sritharan, S., Suleiman, M., Mekkawy, M. and Chetlur, S., 2005. Identification of the
Best Practices for Design, Construction, and Repair of Bridge Approaches (Report No. CTRE
Project 02-118), Iowa Department of Transportation, Ames, Iowa.
Wyatt, T. and Macari, E., 2000. “Effectiveness analysis of subsurface drainage features based on
design adequacy.” Transportation Research Record: Journal of the Transportation Research
Board, (1709), Pp.69-77.

107
APPENDIX A RESPONSES FROM VARIOUS STATE DOTS IN THE NATIONWIDE
QUESTIONNAIRE SURVEY
In this appendix, the responses received from various state DOTs are presented for every
question in the nationwide survey questionnaire. The states that the state DOT acronyms
represent are shown in Table 3-1 of Chapter 3.
PART A: Extent of Asphalt Pavement Damage at Bridge Approaches and Departures
1. Do you notice more distress or damage of the asphalt pavement adjacent to bridge
approach/departure slabs than on regular asphalt pavement sections on highways in your
state? See the picture below for an example of the pavement distress location we are
researching.
Responses:
• Alabama Department of Transportation (ALDOT): Yes
• Alaska Department of Transportation & Public Facilities (DOT&PF): No
• Arizona Department of Transportation (AZDOT): Yes
• California Department of Transportation (Caltrans): Yes
• Colorado Department of Transportation (CDOT): No
• Florida Department of Transportation (FDOT): Yes
• Georgia Department of Transportation (GDOT): Yes
• Hawaii Department of Transportation (HDOT): Sometimes, mostly on old bridges.
• Idaho Transportation Department (ITD): No, it’s the converse.
• Illinois Department of Transportation (IDOT): Yes
• Iowa Department of Transportation (Iowa DOT): Yes
• Kentucky Transportation Cabinet (KYTC): Yes, definitely an issue.
• Louisiana Department of Transportation (LADOT): Yes, The asphalt adjacent to the
approach slabs might experience a little more distresses than regular sections but this is

108
probably due to constructability problems with the transition from roadway construction
to bridge/approach slab construction.
• Maryland Department of Transportation (Maryland DOT): Yes
• Michigan Department of Transportation (MiDOT): Yes
• Mississippi Department of Transportation (Mississippi DOT): Yes, we notice more
distresses in pavement adjacent to bridge end slabs than in regular pavement.
• Missouri Department of Transportation (MODOT): No
• Minnesota Department of Transportation (MnDOT): Yes
• Montana Department of Transportation (MDT): Yes
• Nebraska Department of Roads (NDOR): We have seen distress at a few isolated
locations. Not widespread.
• Nevada Department of Transportation (NDOT): We notice more distress next to
bridge approach slabs. Most bridges have concrete approach slabs next to the bridge and
the asphalt or concrete pavement up to the approach slab.
• New Mexico Department of Transportation (NMDOT): Not in particular.
• Ohio Department of Transportation (Ohio DOT): Ohio has many asphalt surface
pavement with rigid base. We call these “composite pavements”. For the purpose of this
survey, we assume you are interested in “flexible pavements”. Ohio has not noticed any
premature or dissimilar performance of flexible pavements adjacent to bridges.
• Pennsylvania Department of Transportation (Penn DOT): Yes
• Rhode Island Department of Transportation (RIDOT): No
• South Carolina Department of Transportation (SCDOT): Yes. This is a common
issue.
• South Dakota Department of Transportation (SDDOT): Yes. We have actually been
beefing up the section adjacent to the structure to help combat this problem.
• Tennessee Department of Transportation (TDOT): Yes. This is common.
• Utah Department of Transportation (UDOT): We have not really noticed this. We do
have a bump quite often from the settlement of the approach slab or pavement relative to
the bridge.
• Virginia Department of Transportation (VDOT): N/A
• Washington Department of Transportation (WSDOT): It depends on location. This is
true for some routes but not all.
• Wisconsin (WisDOT): In general I would say no. we do not see this type of distress on a
regular basis here in Wisconsin.
• Oregon Department of Transportation (Oregon DOT): No. However, we do have a
number of bridges in our state that show more distresses and/or damage at the
approaches/leaves than in the surrounding pavement.
2. Roughly what percentage of asphalt pavements adjacent to bridge approach/departure
slabs have showed more distresses than regular asphalt pavement sections on highways in
your state? Please highlight one of the following options.
Responses:
• ALDOT: 6-24%

109
• DOT&PF: 0% to 5%
• AZDOT: We do not know the percentage but have seen a lot. Typically, we design
thicker pavement section next to bridge approaches.
• Caltrans: 25% to 50%
• CDOT: 6%-24%
• FDOT: 6%-24%
• GDOT: 6-24%
• HDOT: 6%-24%
• ITD: 0%-5%
• IDOT: 51% and more
• Iowa DOT: 25% to 50%
• KYTC: 51% and more
• LADOT: 51% and more
• MDOT (Maryland): 0%-5%
• MiDOT: 25% to 50%
• MDOT (Mississippi): 25% to 50%
• MODOT: 0%-5%
• MnDOT: 25% to 50%
• ODOT (Ohio): 0%-5%
• MDT: 25% to 50%
• NDOR: 0%-5%
• NDOT: 6%-24%
• NMDOT: 6%-24%
• Penn DOT: 6%-24%
• RIDOT: 0%-5%
• SCDOT: 25% to 50%
• SDDOT: 25% to 50%
• TDOT: 25% to 50%
• UDOT: 0%-5%
• VDOT: 6%-24%
• WSDOT: 0%-5%
• WisDOT: 0%-5%
• ODOT: 6%-24%
3. Can you please describe the types of asphalt pavement distress you have observed
adjacent to bridge approach and departure slabs?
Responses:
• ALDOT: Raveling, pop-outs and pot holes at the interface of the bridge end slab and the
asphalt pavement.
• DOT&PF: Almost nothing other than occasional plow strikes and normal rutting.
• AZDOT: Minor deformations, rutting and cracking.
• Caltrans: Rutting, shoving, raveling, potholes, bleeding, flushing.

110
• CDOT: Occasional distresses as a result of poor compaction at the bridge approach and
departure slabs.
• FDOT: Alligator cracking with lime rock base bleeding through the cracks. The
alligator cracking is severe enough where the pavement is also exhibiting rutting in some
cases.
• GDOT: Raveling, thin sections, rutting, cracking and pop outs.
• HDOT: The common pavement distresses include transverse, longitudinal and alligator
cracking. Sometimes rutting is observed. It could be the result of improper compaction of
the embankment backfill near the bridge abutment. Also, unsealed slab joint and cracks
allow water to enter the pavement structure causing pumping and faulting to occur.
• ITD: Differential compaction between approach slab and roadway slab.
• IDOT: 1) Potholes and pumping due to dynamic loadings of trucks bouncing over the
bridges and rundowns. 2) Bumps at broken pavement due to expansion and bouncing
loads. 3) Settlement issues and expansion of pavements.
• Iowa DOT: Depression in the HMA pavement, causing an uneven surface / rough ride.
• KYTC: We have seen an increase in the asphalt at each end of the bridges, in my opinion
it is from sub grade failures…it is difficult to get compaction so close to the abutments.
• LADOT: 1) Composite pavements where asphalt overlay thins as it approaches bridge;
2) Expansion joints at bridge approaches on composite pavements; 3) Rutting increase
possible due to truck impact when roadway settles and bridge doesn’t; 4) Approach slab
settlement, movement and/or rocking. Many times a gap forms between the asphalt on
the approach slab and the bridge end; 5) Dips/differential settlement due to future
embankment consolidation or due to the loss of fines from lack of confinement around
the bridge’s end bents, fatigue cracking and pumping of fines, transverse/longitude
cracking, etc.
• MDOT (Maryland): Minor settlement
• MiDOT: Fatigue cracking and rutting as a result of weak subbase.
• MDOT (Mississippi): With regards to the asphalt pavement itself, we have noticed
increased rutting, cracking and even some swelling up next to the approach slabs.
• MODOT: Settlement is the primary concern.
• MnDOT: Bumps at the slabs and raveling of mixture.
• MDT: Among the distresses we have observed are: rutting/shoving, alligator cracking,
some stripping.
• NDOR: We have had a few examples recently of failed HMA pavements at bridges in a
sag. Failure was due to saturated subgrades. HMA pavements were generally built on
compacted or stabilized subgrades without a granular drainage layer due to a scarcity of
ledge rock in the state. Failures were addressed by the installation of a drainage system
and replacement of the failed pavement (appr. 100’).
• NDOT: Asphalt paving next to approach slabs have lateral and longitudinal cracking,
with some settlement and rutting.
• NMDOT: Distress due to settlement of the approach roadway fill (for areas in which fill
had to be brought in to raise grade).
• ODOT (Ohio): We have not observed anything of the sort.
• Penn DOT: Cracking and potholes.
111
• RIDOT: Mostly cracking.
• SCDOT: Raveling and stripping are most common failures on the Interstate. Rutting and
Shoving also occur.
• SDDOT: Deformation and alligator cracking.
• TDOT: Settlement.
• UDOT: Settlement related impact damage if any.
• VDOT: Cracking (fatigue, joint), Potholes, Consolidation of underlying sub-structure,
accelerated stripping in asphalt over approach slabs and Delamination’s.
• WSDOT: Asphalt over concrete: delamination caused by compression failures of the
underlying PCCP. In some cases, the asphalt delaminates off the distressed concrete at
bridge ends or approach slabs. In other cases, the underlying concrete compresses
against the bridge end or approach slab, cracks and eventually both the asphalt and
concrete spall leaving potholes.
Concrete surfaces: the concrete roadway abutting approach slabs or bridge ends often
cracks and spalls due to compression.
Full depth asphalt: asphalt pavement abutting approach slabs or bridge ends often cracks
requiring patching.
• WisDOT: The types of distresses we might observe would be possible segregation from
short passes or additional handwork, possibly a rough joint tying in to existing pavements
• ODOT: Distresses at these locations include rutting, fatigue cracking, and potholes.
4. In the areas where you noticed distress or damage on the asphalt pavement, was there a
significant difference in the asphalt thickness adjacent to the bridge
approaches/departures compared to the rest of the roadway? If yes, please describe the
differences.
Responses:
• ALDOT: We began noticing this condition a few years back, at that time the bridge end
slab were flush with the bridge deck and were not paved with asphalt. At that time,
normal resurfacing project would feather the asphalt down to tie in at the bridge end slab.
Thus resulting in thinner pavement at the interface with the bridge end slab. ALDOT
bridge end slabs are a standard 20 ft in length and 9 nine in of reinforced concrete
pavement.
As I stated earlier, during resurfacing projects the contractor would typically feather the
asphalt down to tie in at the bridge end slab. Example condition: The roadway pavement
is 12 in of asphalt. The resurfacing operation calls for milling 2.0 in from the roadway
and placing 3.0 in. The net change in the roadway profile is +1.0 in. The contractor must
then transition the asphalt to the bridge end slab or the roadway will have a 1.0 in “bump”
at the bridge end slab. After repeated resurfacing, the pavement at the bridge end slab
could be as much as 3.0+ in thinner than the rest of the roadway.
• DOT&PF: No
• AZDOT: Yes
• Caltrans: No
• CDOT: No

112
• FDOT: Yes, the thickness was significantly less than the pavement further down the
road. 4-6 in vs. 10+ in.
• GDOT: Yes, sometimes there is a difference in the thickness of the surface mix where
contractors will feather down to tie in to the bridge rather than properly mill and inlay at
the bridge.
• HDOT: No
• ITD: No
• IDOT: Yes, usually rundowns in this area are really thin.
• Iowa DOT: No
• KYTC: No
• LADOT: 1) Yes; often, there is significant difference due to overlay of existing concrete
pavement and asphalt thins to match bridge. We also overlay the approach slab if road
and/or approach have settled. 2) We have recently revised our standards to have a
concrete approach slab with a 2 in asphalt overlay, hasn’t been in place long enough to
describe differences between this design and “older” designs. 3) It should all be the same;
however, as mentioned above, there are some differences in the quality at the transitions
due to small irregular areas that may need to be hand-worked.
• MDOT (Maryland): No
• MiDOT: No
• MDOT (Mississippi): In instances where there is asphalt pavement over the approach
and departure slabs the asphalt thickness is generally less than the rest of the roadway. In
cases where the asphalt pavement butts up to the approach slabs the pavement is usually
the same thickness as the rest of the roadway.
• MODOT: No
• MnDOT: No, typically same structural thickness.
• MDT: In some cases, yes due to the mill/fill operations at the bridge to maintain grade
then 200 ft back from the bridge end there’s just an overlay with no milling so that makes
for a weaker PMS section right at the bridge end.
• NDOR: No
• NDOT: No the asphalt thickness is typically the same.
• NMDOT: Yes. When approach roadway fill would settle, DOT maintenance forces
would bring in more asphalt to correct grade.
• ODOT (Ohio): We match subgrade of surrounding pavement, thus there is not a
difference in buildup.
• Penn DOT: No
• RIDOT: No
• SCDOT: Depends on the tie-down prior to the bridge, often existing pavement is tapered
or butt jointed into the concrete pavement. The tapers often lead to thinner than normal
surface courses which can lead to more fractured aggregate to obtain the required in place
density. The saw cut or milled but joint can be improved with a bobcat (more mobile -
transversely) milling head to provide a more uniform depth at the joint. However, there is
a tendency for water to collect in this area due to inadequate drainage, which often is an
issue with OGFC surfaces that leads to stripping and later raveling, top down and loss of
bond from the bottom up.
113
• SDDOT: Majority is likely poor compaction in this area.
• TDOT: No
• UDOT: The distress again is usually related to settlement related damage. We normally
run the same asphalt thickness up to the approach slab
• VDOT: We have not done enough forensics at these locations to answer.
• WSDOT: Not in areas where the approach slab is overlaid with HMA. Typically the
asphalt is placed on an overlay anywhere from 2 to 3 in over the concrete.
In areas where HMA abuts approach slabs and bridges the HMA is often not as thick as
the rest of the roadway because overlays need to match the approach slab or bridge
elevation preventing an increase in thickness near the bridge.
• WisDOT: Depending on the types of approaches, there are varying thicknesses. We try
our best to stay within the Department specification requirements and pave multiple
layers when necessary.
• ODOT: Generally, there is not a significant difference in asphalt thickness between the
two areas.
PART B: Causes of Asphalt Pavement Damage at Bridge Approaches and Departures
5. What do you think are the potential causes of asphalt pavement distress adjacent to
bridge approach/departure slabs in your state?
Responses:
• ALDOT: It is my opinion that the problem is twofold. One the thinner pavement section
at the bridge end slab interface as previously discussed. Second the length of the bridge
end slab is deficient. Depending on the length of the bridge, the numerous joints in the
bridge deck can develop a harmonic bounce in the truck and when the truck is departing
the bridge the harmonic bounce must be dissipated back to a smooth riding surface. I do
not believe the 20 ft of the bridge end slab is enough length to dissipate the harmonic
bounce and often it is amplified by the condition of the pavement at the interface with the
asphalt roadway. Similarly, as a truck approaches the bridge if damage is present at the
bridge end slab interface then the initial impact of the approach aids in producing the
harmonic bounce associated with the numerous joints in the bridge.
• DOT&PF: Plows and studded tires.
• AZDOT: Material Changes from Rigid to Flexible.
• Caltrans: In the past, during design there was too little attention paid to including
drainage features behind abutments. In the past, during construction, there was too little
use of non-erodible base. Even when aggregate base was compacted to specified density
(e.g. 95% of modified proctor) the base still failed under traffic and subsequently there
was subsidence and uneven settlement under traffic.
• CDOT: Poor compaction at the time of construction
• FDOT: 1) Inadequate structural support (the asphalt isn’t thick enough).2) Often the
transition from the bridge to pavement is not level due to construction, settlement, or
other factors. This creates a bump that generates a dynamic load which accelerated
damage.

114
• GDOT: Inadequate or improperly placed asphalt mixture. Poor joint tie in leading to
increased dynamic loading causing more damage to the pavement.
• HDOT: An expansion joint is used to allow for thermal changes that occur in the bridge
and approach slab, improperly installed or poorly maintained join seal allow water
infiltration and debris accumulation. This will cause distress to both bridge and the
pavement.
• ITD: Drainage, density, compaction, workmanship, experience.
• IDOT: 1) Different expansion/contractions, trapped under pavement, profile over bridges
rough causing trucks to bounce. 2) Expansion and contraction of bridges. 3) Grade
settlements due to pavement expansion.
• Iowa DOT: The main factors are settlement adjacent to bridge approaches due to loss of
fines and inadequate compaction of the subbase materials adjacent to the bridge
approach. Once initial settlement occurs, the problem is amplified by the impact loads of
heavy trucks going on and coming off the bridge. This often leads to additional
distresses, such as rutting / distortion of the HMA.
• KYTC: Our bridges are being designed without approach and departure slabs.
• LADOT: 1) Rutting due to impact loads of trucks especially when road has settled or
been overlaid and approach/departure grades at bridge do not match. 2) Thinning of
asphalt overlay as mentioned above. 3) Soil conditions, settlement over time. 4) Future
construction work performed after the bridge/approach slabs have been constructed.
Hand worked asphalt areas that may be more prone to raveling. A lack of compaction in
subsequent lifts.
• MDOT (Maryland): Differential settlement caused by insufficient compaction at the
abutment.
• MiDOT: Weak base as a result of inadequate compaction.
• MDOT (Mississippi): The two main causes of pavement distresses near bridge ends are
inadequate compaction efforts of the base near the bridge ends and the bumping of the
pavement from the movement of the approach/departure slabs over time.
• MODOT: Settlement.
• MnDOT: Contractor workmanship.
• MDT: We feel one of the causes is the weaker section. Another cause is poor
compaction under the plant mix right at the bridge end. It is very hard to get the material
at the bridge end compacted to the same density as the native soils adjacent to the bridge
end.
• NDOR: Saturated subgrade.
• NDOT: Drainage issues, heavy truck traffic on some roadways, poor compaction of the
subgrade and aggregate base next to the approach slab.
• NMDOT: Most of the time it is due to settlement of the approach roadway fill or poor
drainage resulting in washout of fill material under the concrete approach slab causing
settlement.
• ODOT (Ohio): N/A
• Penn DOT: Compaction of the subbase, and asphalt layers.
• RIDOT: Time and Traffic.

115
• SCDOT: Is there enough tack to bond to existing layers, and was the tack broke prior to
placing the mix (in a hurry to begin paving)?
The tied-own itself with the amount of lute-hand work involved, and the likelihood of
dealing with the first of last load of the day or night having temperature segregation.
Difficulty in compacting and or getting equipment into the area. Differing subgrade
conditions.
• SDDOT: Majority is likely poor compaction in this area.
• TDOT: Either compaction (i.e., lack thereof) of aggregate base materials aka bridge
backfill materials or compaction of supporting materials underneath bridge approach
slabs, when applicable.
• UDOT: Differential settlement between the pavement and bridge structure causing
impact loads.
• VDOT: Drainage issues, trapping water between the approach slab and shoulder,
typically our under drains do not reach to the extents of the bridge decks, Insufficient
compaction of the subgrade at the abutments, Poor tie-ins and bonding on maintenance
overlays at the bridge deck
• WSDOT: Compression failures of the underlying concrete. For full depth asphalt at
bridge ends or approach slabs the failure often results from thin asphalt structure.
• WisDOT: We don’t typically see this type of distress. I would guess that it is a pavement
thickness layer issue (too thin), possibly too much handwork if a crew is trying to feather
in the material, etc.
• ODOT: Potential causes of pavement distress at bridge approaches include a saturated
and/or weak subgrade, moisture infiltration into the pavement (stripping), and differential
loading responses between asphalt section and bridge ends. Occasionally, the bridge
approaches have been evaluated as structurally deficient.
PART C: M&R Strategies for Asphalt Pavements at Bridge Approaches and Departures
6. Are M&R activities more frequent on asphalt pavement sections at bridge
approaches/departures than on regular asphalt pavement sections on highways in your
state? Please explain the reasons.
Responses:
• ALDOT: They are about the same as typical roadway distresses, however, you will
typically have distress at a majority of the bridge ends. The frequencies of maintenance
activities vary with the method of rehabilitation. If cold patch material is used the repair
may last for a very short time under traffic. Hot placed patching material may last a little
longer. The longest rehabilitation activity is an extra depth patch repair that encompasses
both lanes is large enough to cover area outside of the failed pavement.
• DOT&PF: No
• AZDOT: Typically, No. But depends on situation.
• Caltrans: Yes, because asphalt and concrete are dissimilar materials and don’t behave
the same when expanding and contracting. Consequently the asphalt pavement against a
concrete abutment tends to develop a hump at the interface. Vehicle dynamics due to
rough pavement or a rough bridge deck may cause load-induced distress at the approach

116
slabs. Maintenance forces repairing an approach slab may use substandard materials and
the repair will have a brief service life.
• CDOT: No
• FDOT: Yes, patches have to be placed until the section gets resurfaced.
• GDOT: Yes. Because of the earlier issues detailed in previous questions, the asphalt at
the bridge tie is does not perform as well as asphalt placed in other locations.
• HDOT: It might affect the maintenance cycle of the pavement along the older bridges.
But rarely affect the rehabilitation schedule of roadways.
• ITD: No, actually it’s the converse.
• IDOT: Yes potholes repair.
• Iowa DOT: Yes. If the settlement problem near bridge approach occurs, it will lead to
required maintenance earlier than for normal deterioration of the rest of the pavement
section.
• KYTC: We are continually patching the bridge ends…no end in sight.
• LADOT: 1) Extremely more frequent. Asphalt ravels or ruts where it thins approaching
bridges; mostly composite pavements; Composite pavements at expansion joints. The 3
in expansion joint in concrete pavement can’t be successfully transferred through asphalt
overlay. Preformed devices won’t last or fit properly in asphalt over concrete expansion
joint. 2) Yes and No, it depends upon the location of the roadway. 3) A little more
frequent due to the nature of the transition from a roadway structure to a bridge, and
depending on the roadway pavement structure, the types of distresses and potential
causes may vary a good bit.
• MDOT (Maryland): Yes, just to add some wedge/level to bring the surface to the same
level as the bridge when settlement occurs.
• MiDOT: Yes, due to the weak base and the need for reactive maintenance.
• MDOT (Mississippi): No, not usually. Unless the pavement is in dire need of immediate
repair the pavement will not get repaired until the surrounding roadway receives an
overlay or a mill and overlay.
• MODOT: No
• MnDOT: No
• MDT: Yes, due to the distresses, maintenance does more frequently have to deal with
these issues as the bridge ends. The reasons would be the same as #5 above.
• NDOR: Only slightly. Any amount of rutting will lead to a bump at the rigid approach
section which sometimes needs to be smoothed with an HMA maintenance patch until
the next resurfacing addresses it.
• NDOT: No typically the pavements next to bridge approaches are repaired when a
pavement preservation project is completed on the roadway. More repairs may be needed
next to the bridge approach but all work is typically completed with the pavement
preservation project. If work is required before a pavement preservation project then it is
typically done by District forces with a level of repair to get it to last until the next
project.
• NMDOT: M&R activities are more frequent on regular asphalt pavement sections on
highways than at bridge approaches because we have approximately 11,000 mi of
roadway versus only 3000 bridges in NM.
• ODOT (Ohio): N/A

117
• Penn DOT: On average about the time the distress at the bridge approach or departure
requires a maintenance treatment we are also starting to see pavement distress at the
centerline or edge line of the pavement.
• RIDOT: No
• SCDOT: I would say yes; due to the cold joint between the two different pavement types.
• SDDOT: Yes, due to maintaining a smooth transition on and off the bridges.
• TDOT: We currently do not quantify how often rehab activities occur at bridge ends
versus regular pavement repairs.
• UDOT: I think they are a bit more but we have nothing to support this.
• VDOT: Patching quantities are probably higher due to the distresses noted above.
• WSDOT: Not necessarily.
• WisDOT: No, not on our main infrastructures, local government agencies have not
expressed any concerns that we are aware of.
• ODOT: At times, additional maintenance activities such as leveling or patching may be
required more frequently. In regards to rehabilitation, bridge approaches are typically
evaluated at the same time the mainline pavement is unless otherwise needed.
7. Are there any special M&R strategies and guidelines for defective asphalt pavement
sections adjacent to bridge approach/departure slabs in your state?
Responses:
• ALDOT: None that I am aware of for routine maintenance. Resurfacing and rehabilitation
projects tend to address specific repairs for these areas.
• DOT&PF: No, but occasional patching may be done due to studded tire wear to match
grade (pavement to bridge).
• AZDOT: We design thicker pavement section next to bridge approaches.
• Caltrans: See Section 51-5 “Approach Slabs” of the 2015 Standard Specifications
[http://www.dot.ca.gov/hq/esc/oe/construction_contract_standards/std_specs/2015_StdSpec
s/2015_StdSpecs.pdf ]
• CDOT: No
• FDOT: We’ve addressed these issues in the past with reconstruction or deep
milling/resurfacing.
• GDOT: We use patching with both hot mix asphaltic concrete and also cold placed mastic
type patching material.
• HDOT: None
• ITD: Simple remove and replace.
• IDOT: 1) No- typical amazing to fix potholes and bump grinding. Sometimes diamond
girding. 2) 4-6 ft expansion patches. 3) Diamond girding smoothness in decks at
approaches. 3) Utilizing bituminous expansion patches.
• Iowa DOT: In most situations, the affected area is milled (to level out the surface) and
uniform thickness of HMA is placed and compacted.
• KYTC: None
• LADOT: 1) No! On I-20 in Northeast Louisiana, we are currently performing a four
parish/county project to primarily mill and overlay bridge ends.2) Full depth patching if
118
base failures, flow able fill to underseal the area (e.g., voids under the approach slab,
sealing off gaps in the abutment, etc.), partial depth patching and filling pot holes with cold
mix, leveling with hot mix.
• MDOT(Maryland): No
• MiDOT: We typically use a concrete approach slab but have situations where HMA was
used.
• MDOT (Mississippi): In most all cases when a project is let to mill and overlay a section
of road which includes bridges, the pavement is milled at a deeper depth than just the one
lift the project requires. This is done to allow two or more lifts of asphalt to be laid up next
to the approach/departure slabs.
• MODOT: No
• MnDOT: No
• MDT: We deal with them on a case by case basis. Our maintenance forces monitor their
respective areas and when the bridge ends get bad enough, maintenance will usually
perform one of the following measures:
a) Blade patch
b) Mill/fill
c) Use rut filling mastic with ½ in rocks. This is very durable and it is also self-
leveling which makes for a smooth, quality, lasting fix.
• NDOR: The few failures we have had have been corrected by installing transverse pipe
underdrains in granular trenches and using a drained foundation course beneath a rebuilt
pavement (approximately. 100’).
• NDOT: No. NDOT utilizes the same strategies and guidelines as it does for other
pavement maintenance.
• NMDOT: On some occasions we will jack up the approaches by injecting cementitious
grout or polyurethane into the subgrade/fill to correct the grade.
• ODOT (Ohio): N/A
• Penn DOT: Not at this time.
• RIDOT: No
• SCDOT: Not specifically at this time. We are looking into and have tried several mastic
repair materials for smaller fixes. We have also been experimenting with termination of
OGFC prior to the bridge decks so that the transition of the material is easier to work with
and avoids trapping water. Lastly, we try to control cross slope and drainage such that we
avoid trapping water in the OGFC layer. For non-interstate routes that do not include
OGFC, we try to identify if the problem is being caused in the surface or deeper in the
pavement structure and tailor the fix to the problem.
• SDDOT: None that I’m aware of.
• TDOT: In the event of settled approach slabs, slab jacking work has been used to repair the
deficiency.
• UDOT: No
• VDOT: Not at this time.
• WSDOT: Provide sufficient asphalt depth to provide a long lasting pavement for full depth
asphalt sections. For asphalt over concrete, place asphalt on sound concrete, provide
expansion joints (saw cut relief cuts, allow expansion between underlying concrete
(concrete pavement or approach slabs or bridge ends).

119
• WisDOT: N/A
• ODOT: Bridge approaches and mainline pavement are evaluated according to the same
design service life during a rehabilitation cycle unless reconstruction is needed. When
reconstruction is needed (i.e., structurally deficient, bridge replacement), the bridge
approaches are designed to a higher service life.
8. Please provide other comments regarding the performance of asphalt pavements
adjacent to bridge approach/departure slabs in your state.
Responses:
• ALDOT: As discussed earlier, we observed the trend of the contractor feathering down the
asphalt to tie to the bridge end slab interface. Some years back we began modifying the
design for the bridge end slab location during initial construction. The modification is to
place the bridge end slab approximately 3.00 in below the bridge deck. This allows for a
minimum upper binder and wearing surface to be placed on top of the bridge end slab or
for the placement of a wearing surface and a polymer modified open graded friction course,
typically we do not pave over the bridge deck. However, on some projects the polymer
modified open graded friction course is placed on top of the bridge deck. Also during
resurfacing and rehabilitation projects, extra depth milling is incorporated at the bridge end
slab/pavement interface. Although the pavement may be thinner at this location the extra
depth milling allows for removal and replacement of a greater quantity of “older” asphalt
and replacement with “new” high quality material. In some cases, full depth reconstruction
is utilized in these locations in an attempt to provide significant structure to withstand the
truck traffic loading.
• DOT&PF: None
• AZDOT: None
• Caltrans: see the following documents.
http://www.dot.ca.gov/hq/esc/earthquake_engineering/research_reports_site/STAP_Resear
ch_Notes/Research_Note_Approach%20Slab.pdf
NCHRP Synthesis 234
http://d2dtl5nnlpfr0r.cloudfront.net/tti.tamu.edu/documents/4147-S.pdf
• CDOT: It’s important to achieve proper compaction of asphalt pavements at bridge
approach / departures – sometimes, this mean adjusting the roller pattern.
• FDOT: N/A
• GDOT: At times, contractors fail to remove the wedge that is placed at the bridge tie in
when the roadway was milled and prior to resurfacing. When the wedge is left in place, the
resurfacing results in a very thin lift of asphalt mix at the bridge tie in. Over time, the mix
will ravel out leaving a significant bump that results in further deterioration of the asphalt
in these locations.
• HDOT: None
• ITD: N/A
• IDOT: 1) Need a spec on backfilling abutments to get compaction to reduce settling of the
approaches, not to engineer’s satisfaction. 2) Design of approach slabs is critical. Many
times approach pavement settling caused extreme roughness and bouncing loads.
120
• Iowa DOT: No additional comments.
• KYTC: It is my opinion the designers need to rethink the approach and departure slabs that
seemed to work the best.
• LADOT: whether it’s new construction of a bridge and roadway, the type of roadway
pavement structure versus the approach slab, proper drainage of the approach slab, good
confinement around the end abutment, etc.
• MDOT (Maryland): N/A
• MiDOT: There is a lot of impact loading that occurs in these areas and the HMA and weak
base cannot resist these forces without some deformation.
• MDOT (Mississippi): To alleviate the movement of the bridge end slabs, the slabs will
sometimes be injected with expandable foam to raise them to the correct elevation and
prevent them from moving.
• MODOT: N/A
• MnDOT: N/A
• MDT: To counteract future issues, we recently developed a 30-year bridge end design
memo.
http://www.mdt.mt.gov/other/webdata/external/cadd/design_memos/2015-04-
29_30_yr_bridge_ends.pdf
• NDOR: N/A
• NDOT: Because Nevada has a mild and dry climate we do not have as many issues as
other states with our pavements. The approach pavement usually last as long as the rest of
the pavement but may have additional distresses.
• NMDOT: N/A
• ODOT (Ohio): Ohio DOT does see differences in performance for rigid pavement near
bridges, and thus once overlayed with asphalt this issue continues. Our reason for this is
based on our opinion that pressure relief placed near the bridges (by design) to protect back
walls eliminates the compression in the concrete and allows for intermediate slab cracks to
deteriorate.
• Penn DOT: N/A
• RIDOT: The performance of pavements adjacent to bridge decks is similar to the
performance elsewhere.
• SCDOT: They are always suspect to be one of the first signs of pavement distress.
• SDDOT: The attached “Bridge Approach Detail” is this DOT’s standard practice when
replacing adjacent asphalt.
• TDOT: On most occasions with failures at bridge ends, failures can be linked to poor
construction such as low compaction of materials; either base, backfill, and asphalt
materials or supporting materials underneath approach slabs. This can often be the result of
bridges and pavements being built either by separate contracts or by separate contractors
under the same prime contract, but can be remedied with proper field inspection.
• UDOT: Quite often the differential settlement problem is handled with concrete approach
slabs that can be leveled overtime with pumpable material (either a grout or foam).
• VDOT: N/A
• WSDOT: N/A
• WisDOT: So far we are not having pavement performance concerns at these locations.

121
• ODOT: N/A

122
APPENDIX B RESPONSES FROM VARIOUS STATE DOTS ON REHABILITATION
TECHNIQUES FOR INADEQUATE ASPHALT PAVEMENT STRUCTURES
1. If you are experiencing alligator cracking due to inadequate pavement structure or inadequate
asphalt pavement thickness, are there any methods or techniques specified by your agency, or
most frequently used by contractors, as a permanent repair for the pavement, if the vertical
alignment of the roadway could not be changed?
Responses:
• Alaska DOT: We do not address fatigue cracking directly as the reason to perform
repairs. Cracking has not been a major concern for us to date. When we resurface our
roads (usually overlay, mill/fill, or reclaim) it will fix any cracking distresses that might
have been there.
• Indiana DOT: If the vertical alignment of the roadway could not be changed, then
cement stabilized or asphalt emulsion stabilized full-depth reclamation techniques can be
used to reconstruct the pavement base.
• Michigan DOT: We seldom, if ever, experiencing fatigue cracking as result of
inadequate base.
• New York DOT: For small, localized areas of alligator cracking, Maintenance crews
would probably saw cut around edges to sound pavement and excavate distressed asphalt
to sound material, then fill and compact localized patch (2-4 year life). If larger scale
distress over a longer segment of roadway, then it may depend on if it is full depth
asphalt or composite (asphalt over jointed plane concrete pavement). If full depth we
most probably will do a mill & fill, milling down 4 in or more to sound material, the
build back up to existing elevation. If subsurface drainage appears to be a contributing
factor, then edge drains may be installed to help improve the subbase & base materials
from further accelerated damage. If edge drains are already in place, then flush and clean
them. (8-12 year service life). Many of our Interstate highways are composite pavement
over 60 year old (self rubblizing) jointed plane concrete pavement and alligator cracking
over these self rubblized areas does become a predominant distress for longer
segments. In these cases if we’re looking to do just minimal preservation type
treatments, then we’ll mill off the asphalt for the segment length and expose the
concrete. Distressed (self rubblized) sections of concrete are easily identified and
removed, sometimes excavating and replacing some of the base materials in these
localized areas. We have done both localized asphalt patching/paving in place of these
excavated areas of exposed concrete pavement, or replaced in kind with concrete,
depending on temporary traffic control and lane restrictions. Once repairs to the PPC
pavement are complete, then overlay with asphalt. Same comments with edge drain
install if necessary. (6-8 years service life)…shorter service life because we have
witnessed that once the 60 yr old concrete pavement starts to go, then it tends to
accelerate the rate of distresses. Long term on these composite pavement sections, we
would probably mill up the asphalt and do a crack and seat on the existing PPC, then a
complete full depth overlay…but that will increase roadway elevation. (10-15 years
service life)
• Missouri DOT: Mill/Fill Techniques – Cold milling was performed for the three
methods below so that the profile did not change: (1) Used Fiber Reinforced Asphalt
123
using FORTI-FI high tensile strength fibers in asphalt mixtures. (2) Used Krayton
Polymer highly polymerized asphalt binder in the asphalt mixtures. (3) Used a Pavement
Reinforcement Grid under an asphalt mixture. Thicker Mill/Fill Techniques: (1) Mill 5
or 6 in and replace with 5 in or 6 in PCCP with 6 ft x 6 ft joint spacing. (2) Deep
Injection using polyurethane to stabilize subgrade; then mill/fill with HMA or PCCP. (3)
(Pre-mill as necessary) Full Depth Reclamation and cover with HMA.
• Washington DOT: First, we would verify that the alligator cracking is completely
through the bound layers. We have found that what often appears to be full depth
cracking only extends to the interface between the top lift of HMA and the underlying
layers. Assuming that the cracks are all of the way through the bound layers we would
consider the following alternatives: If the alligator cracking is not widespread we would
consider full depth repair of the alligator cracked areas and mill and inlay the remaining
pavement. The expected service life of this type of repair would be 10 - 20 years
depending on which part of Washington it was located. Remove the existing pavement
and underlying base and replace with a new long life section. We would design the new
pavement structure for 50 years knowing that the surface would need periodic renewal in
the form of milling and inlaying. We would consider full depth reclamation but this is not
a common practice for WSDOT. Most of our urban roadways have too high of a traffic
volume roadways to make FDR feasible and we use different techniques (CIR, cushion
course etc.) on our lower volume rural roadways where the grade elevation is not
constrained. With FDR we would need to remove some of the material to ensure the
grade is not changed. We would design the new pavement structure for 50 years
knowing that the surface would need periodic renewal in the form of milling and
inlaying. We would use life cycle cost analysis to determine which of these methods is
most cost effective. If we had a constrained budget, we would consider a thick mill and
inlay (3 – 4 in) if we could get 10 to 15 years of additional pavement life. We would
budget for a permanent solution the next time the pavement needed rehabilitation.
• Rhode Island DOT: The recommended approach, if a structural deficiency is confirmed
by the FWD/ELMOD results, should be the replacement of the asphaltic layer and check
if the aggregate base material is suitable to replace with the appropriate thickness layers
according to the design period evaluated. Another options such as the use of a lean
concrete base or full depth reclamation could be considered, depending of circumstances.
• Colorado DOT: In response to your survey, the Colorado Department of Transportation
has applied a couple different strategies to handle fatigue cracking with inadequate
structure. The most common way CDOT handles this issue is by full-depth removal of
the area affected area and replacing with the same thickness of HMA. The pavement
designer will evaluate the life of this type of treatment and will justify why the typical
design life can't be achieved. These full-depth patches can have a service life of up to 15
years. If it is a large area, the CDOT designer will use a "functional overlay" and will
mention that this is not a permanent repair and the functional overlay is expected to last
for XX years. Each project is different therefore, functional overlays can a service life
from 5 to 12 years. On a couple of CDOT projects, we have milled the surface down
about three in, placed a thin (1 in or less) HMA leveling course, placed a geogrid, and
then a 2 in overlay. This process is new to CDOT and we have not developed a design
process for this situation. The pilot projects are performing as intended. They show very
little to no distress with the pavement expected to meet 10 to 14 years of service life.
124
• Nevada DOT: In two phases we might address the distress as described: First we would
remove and patch full depth if the extent of the distress was not too great. If more
extensive, we might pulverize the existing surface and some of the aggregate base,
remove a portion to lower the compacted profile, treat with 2% cement, compact and
overlay with 3-4 in of new pavement. 1-2 years for the first fix and 12-15 years for the
second strategy.
• Georgia DOT: Not really. If this is occurring on a typical resurfacing project, we will
normally mark and repair the most severely damaged areas using deep patching. But
eventually, the road will need to be either reconstructed or another process such as FDR
and place enough asphalt pavement on this new base to account for traffic loading.
• Kansas DOT: The Kansas Department of Transportation has a little experience with the
situation you describe. The technique we have employed for an inadequate asphalt
pavement thickness where the vertical alignment cannot be raised is a white-
topping. That is, we milled out existing asphalt (6 in) and replaced it with concrete (6 in)
cut into fairly small slabs (6 ft x 6 ft). A sample picture is attached. This actions has
worked fairly well for us where we had old, thick (but inadequate) asphalt sections. We
placed these on interstate sections about 5 years ago and have good performance so
far. We expect 15 or more years out of these sections.
• California DOT: See pages 3-2 to 3-5 of the maintenance technical advisory guide
[http://www.dot.ca.gov/hq/maint/FPMTAGChapter3-TreatmentSelection.pdf ]; See page
12-6 at http://www.dot.ca.gov/hq/maint/FPMTAGChapter12_5-28-09Final.pdf; See
pages 20 and 149 of the LCCA Manual
at http://www.dot.ca.gov/hq/maint/Pavement/Offices/Pavement_Engineering/LCCA_Doc
s/LCCA_25CA_Manual_Final_Aug_1_2013_v2.pdf
• Florida DOT: In Florida, we experience predominately top down cracking as our main
deficiency and the predominant rehabilitation method is to mill (depth to match cracks)
and resurface. The majority of the resurfacing projects are budgeted and scheduled to
begin before alligator cracking occurs. Alligator cracking typically signals a pavement
that is way over due for a resurfacing or there is a base issue. The EOR or Pavement
design engineer should request a core in the area in question. The core will confirm the
existing cross-section and the EOR can do a quick analysis to see if the pavement design
is adequate. If the pavement does not meet our standards, the EOR can at other base
materials with a higher structural number or see if the elevation would allow for a thicker
pavement. Our methods and techniques are presented in the Flexible Pavement Design
Manual linked below. http://www.fdot.gov/roadway/pm/pcs/flexiblepavementmanual.pdf
• Michigan DOT: We seldom, if ever, experience fatigue alligator cracking as a result of
inadequate base.
2. What are the typical or expected service lives of pavements repaired by the methods or
techniques mentioned in the answers to the question above?
Responses:
• Indiana DOT: The reconstructed pavement base, if properly compacted and properly
drained, should perform for 20+ years.
125
• Missouri DOT: Expect 7 to 12 years out of the Mill/Fill Techniques. Expect 12 to 20
years out of Thicker Mill/Fill Techniques.
• Rhode Island DOT: The typical pavement design period for this type of evaluations is
20 years. But, the design period could be changed to 10 or 12 years according to
available funding and project scope.
• Florida DOT: New construction, reconstruction and resurfacing experience on average:
Open Graded Friction Courses (OGFC) 13 years and Dense Graded Friction Course
(DGFC) are lasting around 18 years.
• Georgia DOT: For those with deep patching placed on a resurfacing project, we hope to
get another ~ 10 years. For a FDR project, the normal design life would be 20 years with
surface layer replacement after 12 – 14 years.
• Michigan DOT: N/A.
• New York DOT: See above response.
• Washington DOT: See above response.
• Colorado DOT: See above response.
• Nevada DOT: See above response.
• Kansas DOT: See above response.
3. Is there any written rehabilitation guidelines used by your state DOT for asphalt pavement
with insufficient structural capacity? If yes, could you send us the link of the guide?
Responses:
• Colorado DOT: CDOT does not have a written rehabilitation guideline for these
projects. We require our HMA rehabilitation projects to have a minimum design life of
10 years. How the designer gets there is the million dollar question. When they can't
make 10 years, the designer calculates the years at which the best design hits the
threshold distress. He then states that this design is a functional design with an
anticipated life of X years. https://www.codot.gov/business/designsupport/matgeo/manuals/pdm/2017-m-e-
pavement-design-manual
• Washington DOT: Our pavement design requirements are contained in the WSDOT
Pavement Policy. The WSDOT Pavement Policy is not specific to asphalt pavement with
insufficient structural capacity but it is what we follow on all of our pavement designs.
https://www.wsdot.wa.gov/NR/rdonlyres/EF9AAC9E-6323-4B09-A3D1-
DD2E2C905D02/0/WSDOTPavementPolicyJune2015.pdf
• New York DOT: Please check our comprehensive pavement design manual.
https://www.dot.ny.gov/divisions/engineering/design/dqab/cpdm

126
APPENDIX C RESPONSES OF FOLLOW-UP SURVEY ON REHABILITATION
TECHNIQUES FOR BRIDGE APPROACH/DEPARTURE ASPHALT PAVEMENTS
1. Last time, you sent us an attached file "bridge approach detail" (standard practice when
replacing asphalt pavement in bridge approaches). Could you tell us the reference of the
attached file?
Responses:
• South Dakota DOT: Generally maintenance crews will patch or fill in cracks/ruts and
grind down bumps to smooth out the profile at the bridge approaches as needed. I don’t
know if there is a certain set of guidelines they follow, probably just by monitoring the
highway and routine checks. If the pavement distress continues to be a problem despite
continuous maintenance, my office looks at providing a more permanent form of
mitigation with the thickened approach sections. Most of the issues at bridge approaches
are due to impact loading from heavy traffic (semi-trucks) and an under-designed
surfacing section. The detail calls for the old surfacing section to be removed and a
thicker/stronger section be placed back. The section is spread out to reduce the likelihood
of bumps forming at the bridge ends. We have modified the detail and now require that
18 in of material be removed from the approaches and we replace with 6 in asphalt
concrete and 12 in Base Course over the MSE Fabric (A new Micro-station file of the
detail is attached.
2. Last time, you mentioned that "We use patching with both hot mix asphaltic concrete and also
cold placed mastic type patching material". Could you tell us the typical depths for hot
patching and cold patching at bridge approach pavement sections? Is there a rule of thumb
(or, guideline, manual) for determining the depth of patching and conducting the patching
methods for bridge approach pavements? Regarding to your responses, "compared to the
regular roadway, the asphalt thickness adjacent to bridge approaches/departures is relatively
thinner". Could you tell us the typical difference of surface layer thickness between bridge
approach pavement sections and the adjacent roadway?
Responses:
• Georgia DOT: I can’t really provide you a typical other than it is normally through the
entire surface layer which is ~ 1 -2 in. Again, this is a variable depth that is related to the
contractor trying to tie in to the bridge when paving. Also, we sometimes place thin
overlays ~ 1- 1-1/2 in over the concrete approach slab on many projects but due to the
nature of paving operations, if not milled, the thickness of the surface layers vary at
bridge ends due to the tie in requirement.
3. Is there a rule of thumb (or guideline, manual) for determining the thickness of
patching/milling & resurfacing for bridge approach pavements? Based on your knowledge,
what is the typical/normal overlay thickness for bridge approach pavement in your state? Is
there any special treatments for bridge approach pavement maintenance that are different
from regular pavements?
Responses:
127
• Georgia DOT: 1. Georgia normally mills the required thickness for the surface layer we
are replacing. It is normally 1 in – 2 in as Shelia has stated. This is for standard approach
slabs and recessed. We have two general types of approach slabs in Georgia. One is the
standard approach that we pave up to. The second is a recessed approach slab that allows
us to pave over it in case of any settling. The recessed approach typically allows up to 3
¼ in of hot mix placement. 2. On new construction for recessed approach slabs 3 ¼ in.
We normally try not to overlay our standard approaches and do not have a typical overlay
thickness. If the approach slab has settled it could vary. I have seen anywhere from 1 -
4+ in over them. 3. Not that I am aware of.
4. Last time, you mentioned that "The longest rehabilitation activity is an extra depth patch
repair that encompasses both lanes that are large enough to cover area outside of the failed
pavement". Could you tell us what are the typical depths for extra depth patching and normal
patching. When to choose the extra depth patching repair methods instead of normal
patching?
Responses:
• Alabama DOT: (1) Normal maintenance patching ranges in depth from 2 to 4 in. Extra
depth patching is more with respect to the total pavement thickness and the depth of
cracking as observed by taking cores in the distressed area. Extra depth patching
normally is determined by the crack depth of the cores and the underlying asphalt
material. In the past in some locations we have included a very rich liquid bituminous
layer for crack mitigation, in this case if that material is observed in the cores, then the
depth is removal would be limited to a maximum removal that would not disturb the rich
bottom layer. (2) The choice whether to use normal or extra depth patching is dependent
on the condition of the cores and the depth of cracking observed in the cores. It is our
intent to remove as much of the cracking as is possible.
5. Regarding your response, "Resurfacing and rehabilitation projects tend to address specific for
these areas (asphalt pavement sections adjacent to bridge approach/departure slabs)." Did
your state have the manual about resurfacing design? When will your state choose to milling
& resurfacing method instead of patching for bridge approach pavement sections? And, is
there a rule of thumb for determining the depth of milling and resurfacing?
Responses:
• Alabama DOT: First asphalt pavement sections adjacent to bridge approach/departure
slabs. Typically our bridge end slabs are 20 ft in length limited to the roadway width and
9 in thick. The problem then becomes how do you place an asphalt shoulder 2, 4, 6, 8, or
10 ft in width adjacent to the bridge end slab nine in thick and 20 ft in length. We have
approached our Bridge Bureau and requested that where possible to design the bridge end
slab from front slope to front slope to eliminate this problem. A recommendation you
may need to make to FDOT and investigate just how many bridge end slabs they
currently have that meet this same criteria. Second, as I stated before, a few years back
we started lowering the bridge end slab so that asphalt could be placed on top of the
bridge end slab for a smooth transition to the bridge. In this case the bridge end slab
would be addressed with resurfacing projects. The typical depth below profile for the
128
bridge end slabs is 3 in. This allows us two options during resurfacing. The wearing
surface is normally 2 in and a 1 in Open Graded Friction Coarse (OGFC). This allows
for resurfacing project that Micro mill and replace the OGFC or a resurfacing project that
would remove the wearing surface and OGFC. If distresses are observed between
resurfacing cycles, the local District can utilize their State Maintenance forces and/or a
purchase order to mill and patch bridge end slab distresses along with localized roadway
distresses. This is a routine Maintenance function. The rule of thumb for determining the
depth of milling for a resurfacing project is normally based on the pavement condition
survey, Falling Weight Deflectometer (FWD) testing and cores taken from the roadway.
Pavement condition survey will give you the percentage of distresses and the severity
level. FWD testing will determine if additional structure is required for future traffic
loading. Pavement cores reflect the severity and depth of the cracks. Milling depth are
typically set to remove the majority of the cracking. Replacement build-up is based on
milling removal and/or the need for additional structure.
6. In the end, you mentioned that "In some cases, full depth reconstruction is utilized in these
locations (bridge end slab/pavement interface) in an attempt to provide significant structure to
withstand the truck traffic loading." Could you tell us what are the decision criteria for
selecting the full depth reconstruction to address the bridge approach pavement distresses?
Did your state have the guideline for implementing full depth reconstruction?
Responses:
• Alabama DOT: Typically if the condition of the roadway requires reconstruction, then
bridge end slabs are reconstructed with the roadway. Some projects may require raising
the bridge to meet an increased profile elevation, bridge end slabs are typically
reconstructed at this time even if the roadway is a normal resurfacing project.
7. Last time, you mentioned that "In most cases when a project is let to mill and overlay a
sections of road which includes bridges, the pavement is milled at a deeper depth than just the
one lift the project requires. This is done to allow two or more lifts of asphalt to be laid up next
to the approach/departure slabs". Could you tell us what are the typical overlay thickness for
bridge approach pavement sections and the control section? Is there a guideline (or manual,
or a rule of thumb) to determine the specific milling & overlay design for bridge approach
pavement?
Responses:
• Mississippi DOT: Usually the asphalt is milled approximately 3-4 in at the bridge ends
to allow for two lifts of asphalt each around 1.5-2 in where the top lift will match
whatever the adjacent top lift is required to be as per the project’s contract. I haven’t been
able to find any official guidelines for this as districts in MS tackle this process
differently but generally its what I just stated. If anything different happens then it will be
spelled out in the specific project’s contract.
8. Last time, you mentioned that "In your state, full depth asphalt pavement sections would be
provided to keep a long lasting pavement service life for bridge approaches". Could you tell us
the typical thickness for full depth asphalt pavement? Is there a manual, guideline or rule of
129
thumb about decision criteria for implementing full-depth asphalt pavement at bridge
approaches? Regarding to your response, "The failure of bridge approach pavement (adjacent
to approach slabs) is due to thin asphalt pavement structure". Could you tell us the typical
surface layer thickness for "thin asphalt pavement"?
Responses:
• Washington DOT: Here is a link to WSDOT’s Pavement Policy. Within it, you will find
HMA pavement depths for various ESAL levels. WSDOT designs for a 50-year
pavement life (long life pavement life) and provides for periodic rehabilitation.
Pavement depths at bridge ends are often based on the performance of adjacent HMA
sections. If the pavement is functioning well, even at a lesser depth, WSDOT will
provide the same depth at the bridge end. There are some cases at bridge ends where the
depth was insufficient from the start to an increase in depth would be warranted. The
thickness will depend on the roadway ESALs. Thin pavements are those that are
designed for a 20 or 30-year design.
9. Are there any special M&R strategies and guidelines for defective asphalt pavement sections
adjacent to bridge approach/departure slabs in your state?
Responses:
• Montana DOT: There are three options for bridge end treatments: (1) 30-year bridge end
treatment: this is intended to alleviate bridge end distress using a 30-year design life of
the pavement system where existing bridges will be reconstructed. (2) Minor bridge end
treatment: this is also intended to alleviate bridge end distress and allows for future
milling & resurfacing operations. If the roadway within 100 ft of the bridge ends of the
bridge ends is showing increased signs of distress compared with the overall project
roadway condition, mill an additional 0.2 ft (of existing plant mix and/or base course) for
the standard 200 ft transition and replace with new plant mix. (3) Apply no additional
treatment at the bridge end if the roadway within 100 ft of the bridge ends is not showing
increased signs of distress compared with the overall project roadway condition.

130
APPENDIX D SUMMARY OF T-TEST RESULTS
Table D-1 T-test results for crack rating (CR)
Test Pair Mean Number of
Observations
Hypothesized
Mean Difference t Statistic
P value
(two-tail)
t Critical
(two-tail)
Approach 9.06 1155 0 -6.444 0.000 1.96
Control 9.46
Departure 9.06 1155 0 -6.520 0.000 1.96
Control 9.46
Approach 9.11 1155 0 0.695 0.487 1.96 Approach
Slab 9.06
Departure 9.01 1155 0 -0.590 0.555 1.96 Departure
Slab 9.06
Approach 9.06 1155 0 0.109 0.913 1.96
Departure 9.06
Approach 7.37 317 0 8.220 0.000 1.96
Control 8.42
Departure 7.27 317 0 -8.632 0.000 1.96
Control 8.42
Approach 7.37 317 0 1.701 0.089 1.96 Approach
Slab 7.60
Departure 7.27 317 0 -0.211 0.833 1.96 Departure
Slab 7.30
Approach 7.37 317 0 -0.738 0.461 1.96
Departure 7.27

131
Table D-2 T-test results for rut rating (RR)
Test Pair Mean Number of
Observations
Hypothesized
Mean Difference
t
Statistic
P value
(two-tail)
t Critical
(two-tail)
Approach 1 9.27 1013 0 -1.009 0.313 1.96
Approach 2 9.30
Approach 2 9.30 1013 0 -1.514 0.130 1.96
Approach 3 9.35
Approach 1 9.27 1013 0 -2.574 0.010 1.96
Approach 3 9.35
Approach 1 9.27 1013 0 1.525 0.127 1.96
Control 9.22
Approach 2 9.30 1013 0 2.514 0.012 1.96
Control 9.22
Approach 3 9.35 1013 0 4.117 0.000 1.96
Control 9.22
Departure 4 9.37 1013 0 2.141 0.032 1.96
Departure 5 9.31
Departure 5 9.31 1013 0 1.162 0.245 1.96
Departure 6 9.27
Departure 4 9.37 1013 0 3.282 0.001 1.96
Departure 6 9.27
Departure 4 9.37 1013 0 4.814 0.000 1.96
Control 9.22
Departure 5 9.31 1013 0 2.632 0.009 1.96
Control 9.22
Departure 6 9.27 1013 0 1.426 0.154 1.96
Control 9.22
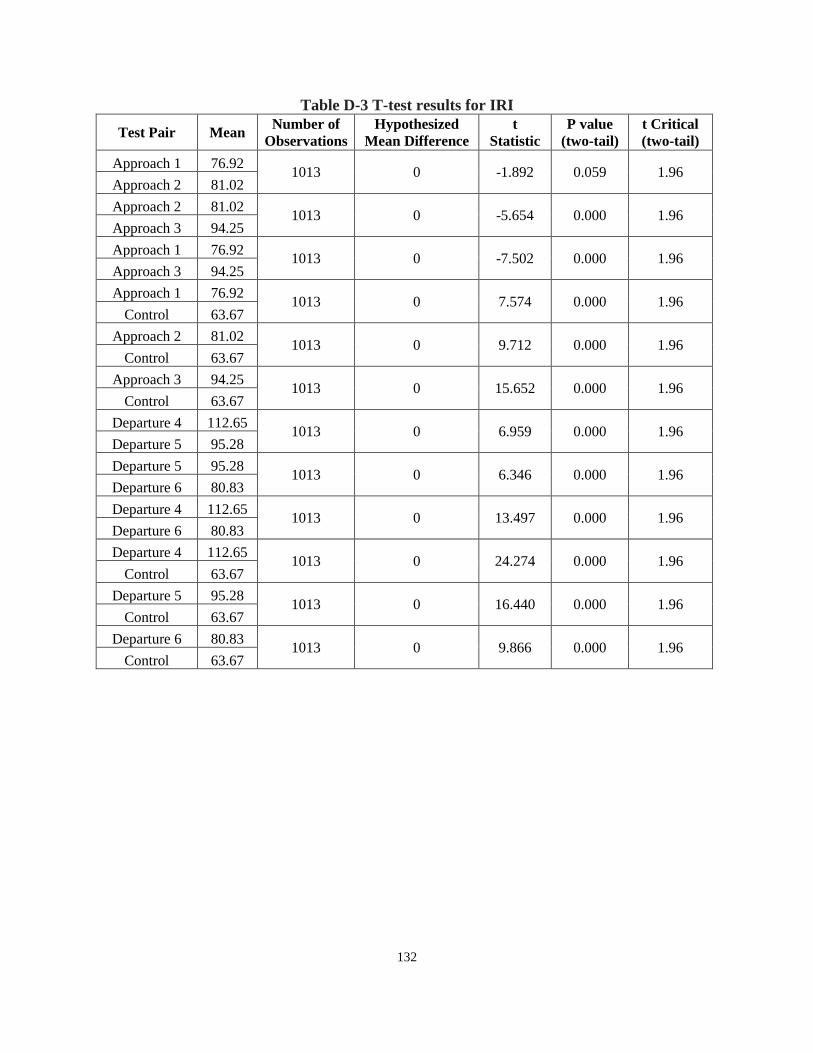
132
Table D-3 T-test results for IRI
Test Pair Mean Number of
Observations
Hypothesized
Mean Difference
t
Statistic
P value
(two-tail)
t Critical
(two-tail)
Approach 1 76.92 1013 0 -1.892 0.059 1.96
Approach 2 81.02
Approach 2 81.02 1013 0 -5.654 0.000 1.96
Approach 3 94.25
Approach 1 76.92 1013 0 -7.502 0.000 1.96
Approach 3 94.25
Approach 1 76.92 1013 0 7.574 0.000 1.96
Control 63.67
Approach 2 81.02 1013 0 9.712 0.000 1.96
Control 63.67
Approach 3 94.25 1013 0 15.652 0.000 1.96
Control 63.67
Departure 4 112.65 1013 0 6.959 0.000 1.96
Departure 5 95.28
Departure 5 95.28 1013 0 6.346 0.000 1.96
Departure 6 80.83
Departure 4 112.65 1013 0 13.497 0.000 1.96
Departure 6 80.83
Departure 4 112.65 1013 0 24.274 0.000 1.96
Control 63.67
Departure 5 95.28 1013 0 16.440 0.000 1.96
Control 63.67
Departure 6 80.83 1013 0 9.866 0.000 1.96
Control 63.67
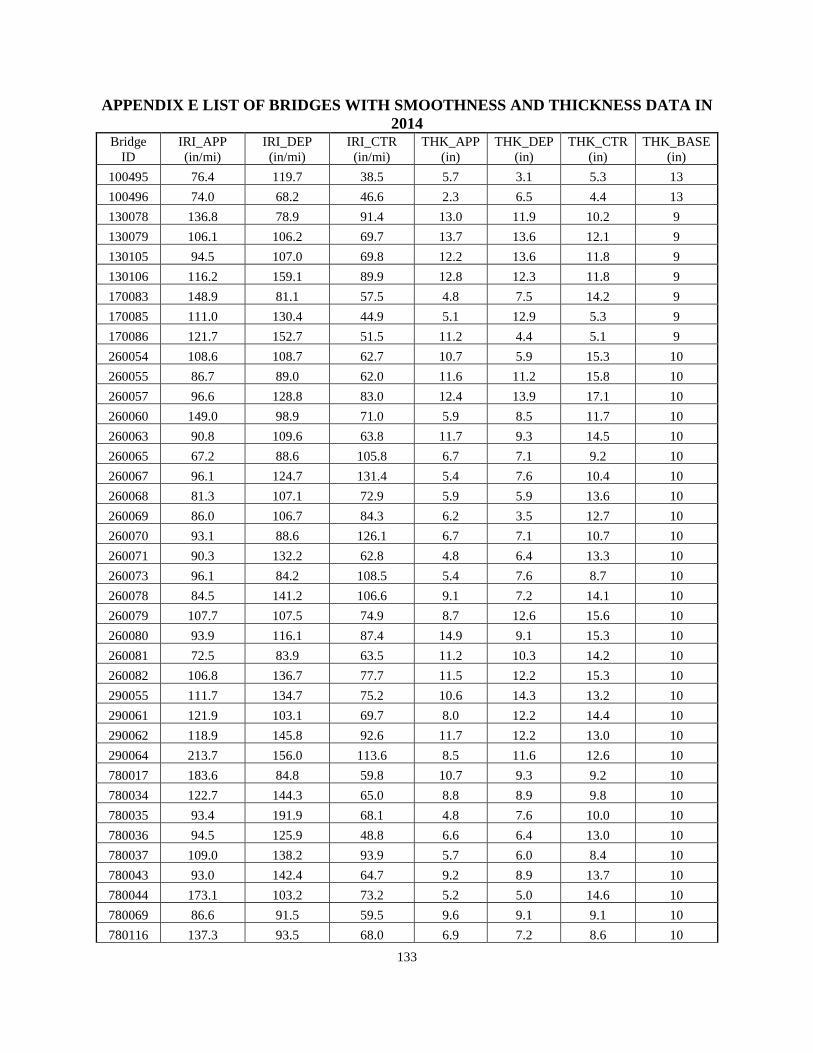
133
APPENDIX E LIST OF BRIDGES WITH SMOOTHNESS AND THICKNESS DATA IN
2014 Bridge
ID
IRI_APP
(in/mi)
IRI_DEP
(in/mi)
IRI_CTR
(in/mi)
THK_APP
(in)
THK_DEP
(in)
THK_CTR
(in)
THK_BASE
(in)
100495 76.4 119.7 38.5 5.7 3.1 5.3 13
100496 74.0 68.2 46.6 2.3 6.5 4.4 13
130078 136.8 78.9 91.4 13.0 11.9 10.2 9
130079 106.1 106.2 69.7 13.7 13.6 12.1 9
130105 94.5 107.0 69.8 12.2 13.6 11.8 9
130106 116.2 159.1 89.9 12.8 12.3 11.8 9
170083 148.9 81.1 57.5 4.8 7.5 14.2 9
170085 111.0 130.4 44.9 5.1 12.9 5.3 9
170086 121.7 152.7 51.5 11.2 4.4 5.1 9
260054 108.6 108.7 62.7 10.7 5.9 15.3 10
260055 86.7 89.0 62.0 11.6 11.2 15.8 10
260057 96.6 128.8 83.0 12.4 13.9 17.1 10
260060 149.0 98.9 71.0 5.9 8.5 11.7 10
260063 90.8 109.6 63.8 11.7 9.3 14.5 10
260065 67.2 88.6 105.8 6.7 7.1 9.2 10
260067 96.1 124.7 131.4 5.4 7.6 10.4 10
260068 81.3 107.1 72.9 5.9 5.9 13.6 10
260069 86.0 106.7 84.3 6.2 3.5 12.7 10
260070 93.1 88.6 126.1 6.7 7.1 10.7 10
260071 90.3 132.2 62.8 4.8 6.4 13.3 10
260073 96.1 84.2 108.5 5.4 7.6 8.7 10
260078 84.5 141.2 106.6 9.1 7.2 14.1 10
260079 107.7 107.5 74.9 8.7 12.6 15.6 10
260080 93.9 116.1 87.4 14.9 9.1 15.3 10
260081 72.5 83.9 63.5 11.2 10.3 14.2 10
260082 106.8 136.7 77.7 11.5 12.2 15.3 10
290055 111.7 134.7 75.2 10.6 14.3 13.2 10
290061 121.9 103.1 69.7 8.0 12.2 14.4 10
290062 118.9 145.8 92.6 11.7 12.2 13.0 10
290064 213.7 156.0 113.6 8.5 11.6 12.6 10
780017 183.6 84.8 59.8 10.7 9.3 9.2 10
780034 122.7 144.3 65.0 8.8 8.9 9.8 10
780035 93.4 191.9 68.1 4.8 7.6 10.0 10
780036 94.5 125.9 48.8 6.6 6.4 13.0 10
780037 109.0 138.2 93.9 5.7 6.0 8.4 10
780043 93.0 142.4 64.7 9.2 8.9 13.7 10
780044 173.1 103.2 73.2 5.2 5.0 14.6 10
780069 86.6 91.5 59.5 9.6 9.1 9.1 10
780116 137.3 93.5 68.0 6.9 7.2 8.6 10
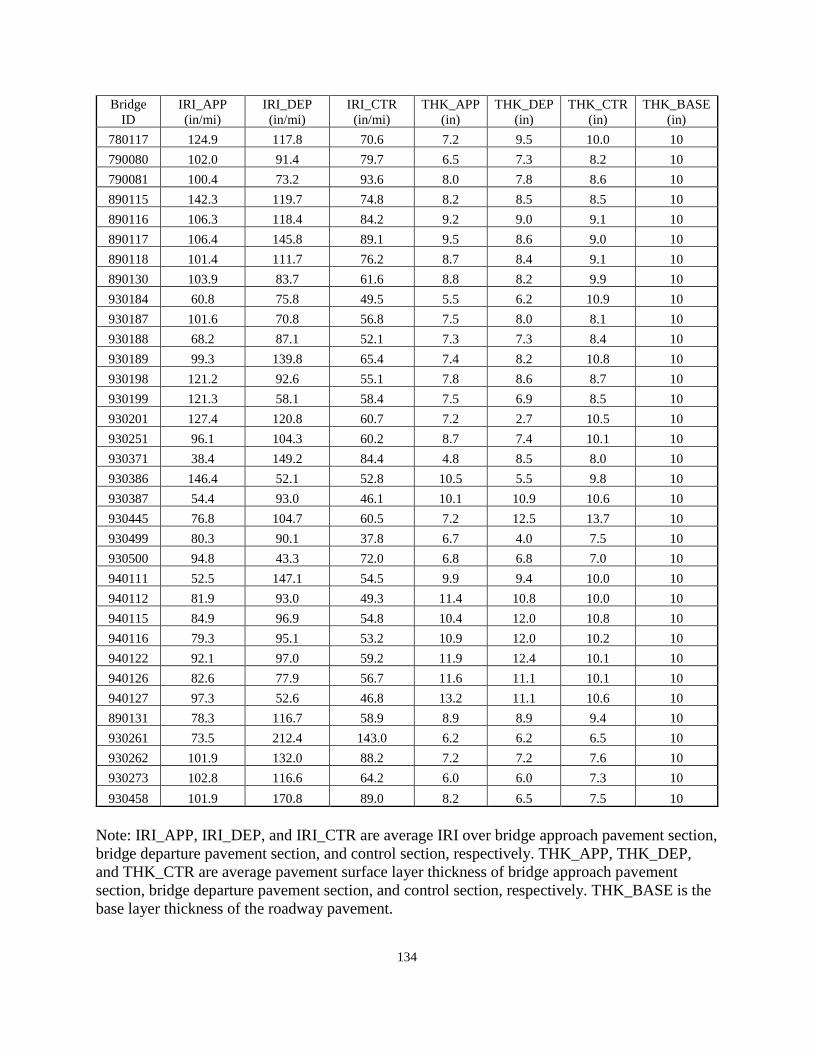
134
Bridge
ID
IRI_APP
(in/mi)
IRI_DEP
(in/mi)
IRI_CTR
(in/mi)
THK_APP
(in)
THK_DEP
(in)
THK_CTR
(in)
THK_BASE
(in)
780117 124.9 117.8 70.6 7.2 9.5 10.0 10
790080 102.0 91.4 79.7 6.5 7.3 8.2 10
790081 100.4 73.2 93.6 8.0 7.8 8.6 10
890115 142.3 119.7 74.8 8.2 8.5 8.5 10
890116 106.3 118.4 84.2 9.2 9.0 9.1 10
890117 106.4 145.8 89.1 9.5 8.6 9.0 10
890118 101.4 111.7 76.2 8.7 8.4 9.1 10
890130 103.9 83.7 61.6 8.8 8.2 9.9 10
930184 60.8 75.8 49.5 5.5 6.2 10.9 10
930187 101.6 70.8 56.8 7.5 8.0 8.1 10
930188 68.2 87.1 52.1 7.3 7.3 8.4 10
930189 99.3 139.8 65.4 7.4 8.2 10.8 10
930198 121.2 92.6 55.1 7.8 8.6 8.7 10
930199 121.3 58.1 58.4 7.5 6.9 8.5 10
930201 127.4 120.8 60.7 7.2 2.7 10.5 10
930251 96.1 104.3 60.2 8.7 7.4 10.1 10
930371 38.4 149.2 84.4 4.8 8.5 8.0 10
930386 146.4 52.1 52.8 10.5 5.5 9.8 10
930387 54.4 93.0 46.1 10.1 10.9 10.6 10
930445 76.8 104.7 60.5 7.2 12.5 13.7 10
930499 80.3 90.1 37.8 6.7 4.0 7.5 10
930500 94.8 43.3 72.0 6.8 6.8 7.0 10
940111 52.5 147.1 54.5 9.9 9.4 10.0 10
940112 81.9 93.0 49.3 11.4 10.8 10.0 10
940115 84.9 96.9 54.8 10.4 12.0 10.8 10
940116 79.3 95.1 53.2 10.9 12.0 10.2 10
940122 92.1 97.0 59.2 11.9 12.4 10.1 10
940126 82.6 77.9 56.7 11.6 11.1 10.1 10
940127 97.3 52.6 46.8 13.2 11.1 10.6 10
890131 78.3 116.7 58.9 8.9 8.9 9.4 10
930261 73.5 212.4 143.0 6.2 6.2 6.5 10
930262 101.9 132.0 88.2 7.2 7.2 7.6 10
930273 102.8 116.6 64.2 6.0 6.0 7.3 10
930458 101.9 170.8 89.0 8.2 6.5 7.5 10
Note: IRI_APP, IRI_DEP, and IRI_CTR are average IRI over bridge approach pavement section,
bridge departure pavement section, and control section, respectively. THK_APP, THK_DEP,
and THK_CTR are average pavement surface layer thickness of bridge approach pavement
section, bridge departure pavement section, and control section, respectively. THK_BASE is the
base layer thickness of the roadway pavement.
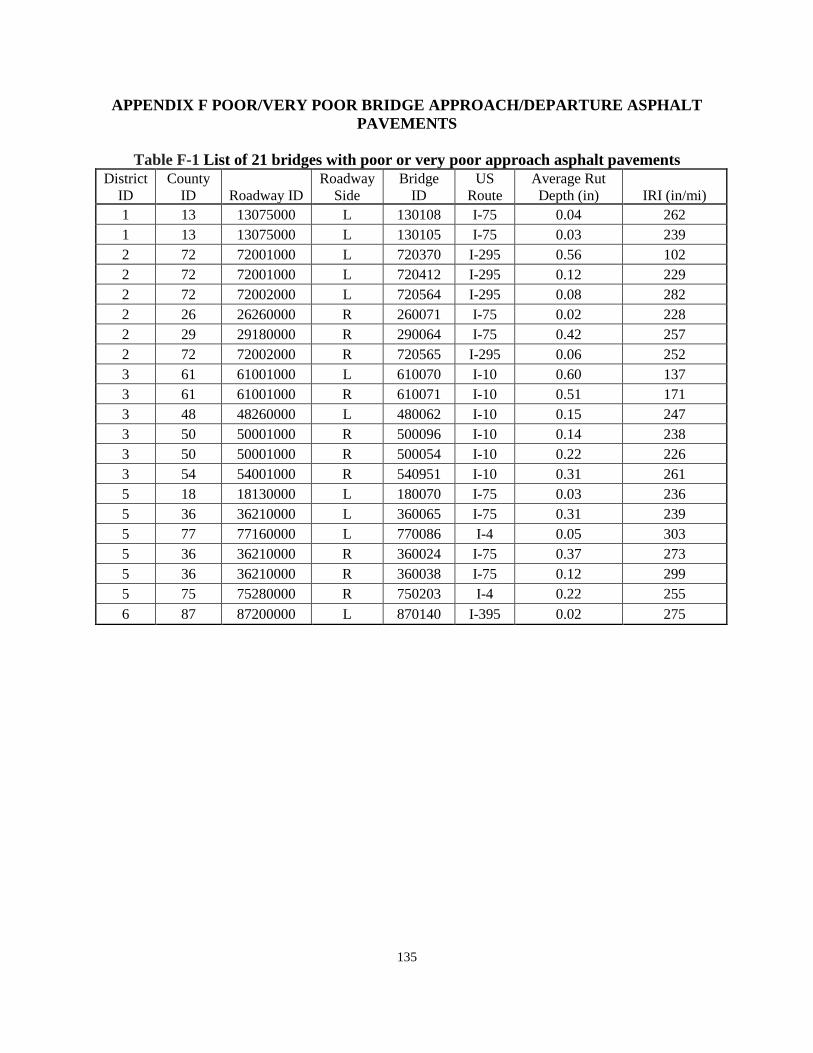
135
APPENDIX F POOR/VERY POOR BRIDGE APPROACH/DEPARTURE ASPHALT
PAVEMENTS
Table F-1 List of 21 bridges with poor or very poor approach asphalt pavements
District
ID
County
ID Roadway ID
Roadway
Side
Bridge
ID
US
Route
Average Rut
Depth (in) IRI (in/mi)
1 13 13075000 L 130108 I-75 0.04 262
1 13 13075000 L 130105 I-75 0.03 239
2 72 72001000 L 720370 I-295 0.56 102
2 72 72001000 L 720412 I-295 0.12 229
2 72 72002000 L 720564 I-295 0.08 282
2 26 26260000 R 260071 I-75 0.02 228
2 29 29180000 R 290064 I-75 0.42 257
2 72 72002000 R 720565 I-295 0.06 252
3 61 61001000 L 610070 I-10 0.60 137
3 61 61001000 R 610071 I-10 0.51 171
3 48 48260000 L 480062 I-10 0.15 247
3 50 50001000 R 500096 I-10 0.14 238
3 50 50001000 R 500054 I-10 0.22 226
3 54 54001000 R 540951 I-10 0.31 261
5 18 18130000 L 180070 I-75 0.03 236
5 36 36210000 L 360065 I-75 0.31 239
5 77 77160000 L 770086 I-4 0.05 303
5 36 36210000 R 360024 I-75 0.37 273
5 36 36210000 R 360038 I-75 0.12 299
5 75 75280000 R 750203 I-4 0.22 255
6 87 87200000 L 870140 I-395 0.02 275
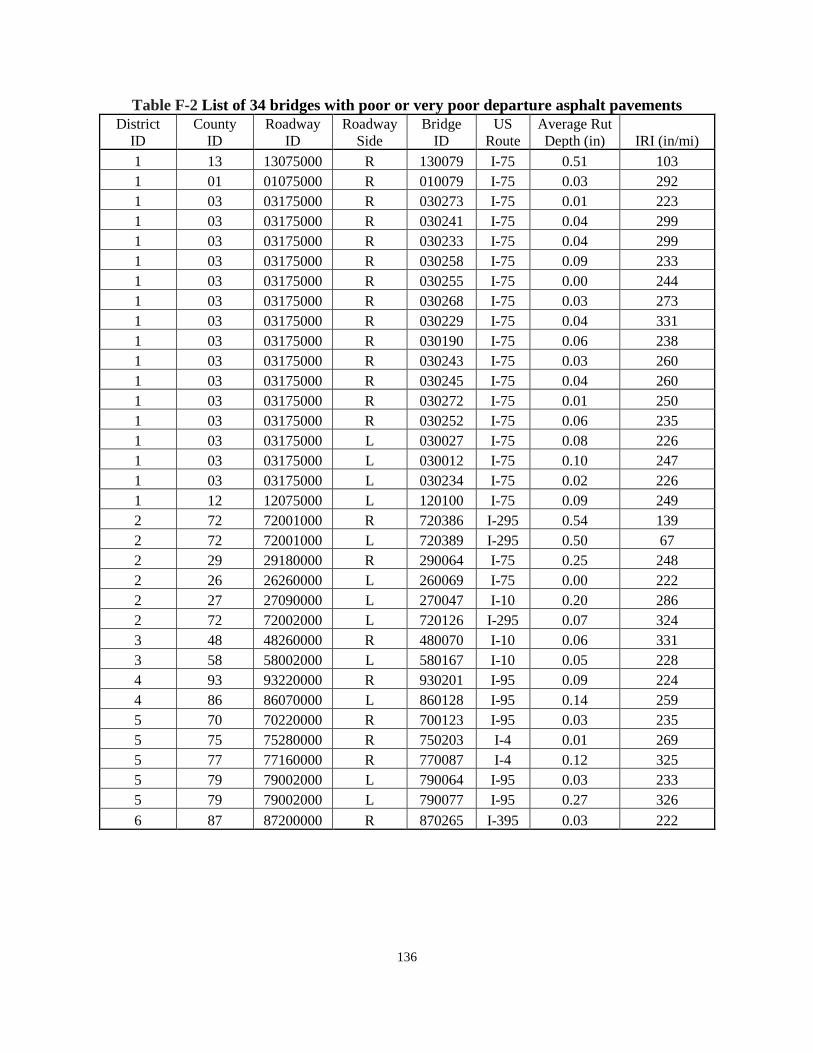
136
Table F-2 List of 34 bridges with poor or very poor departure asphalt pavements
District
ID
County
ID
Roadway
ID
Roadway
Side
Bridge
ID
US
Route
Average Rut
Depth (in) IRI (in/mi)
1 13 13075000 R 130079 I-75 0.51 103
1 01 01075000 R 010079 I-75 0.03 292
1 03 03175000 R 030273 I-75 0.01 223
1 03 03175000 R 030241 I-75 0.04 299
1 03 03175000 R 030233 I-75 0.04 299
1 03 03175000 R 030258 I-75 0.09 233
1 03 03175000 R 030255 I-75 0.00 244
1 03 03175000 R 030268 I-75 0.03 273
1 03 03175000 R 030229 I-75 0.04 331
1 03 03175000 R 030190 I-75 0.06 238
1 03 03175000 R 030243 I-75 0.03 260
1 03 03175000 R 030245 I-75 0.04 260
1 03 03175000 R 030272 I-75 0.01 250
1 03 03175000 R 030252 I-75 0.06 235
1 03 03175000 L 030027 I-75 0.08 226
1 03 03175000 L 030012 I-75 0.10 247
1 03 03175000 L 030234 I-75 0.02 226
1 12 12075000 L 120100 I-75 0.09 249
2 72 72001000 R 720386 I-295 0.54 139
2 72 72001000 L 720389 I-295 0.50 67
2 29 29180000 R 290064 I-75 0.25 248
2 26 26260000 L 260069 I-75 0.00 222
2 27 27090000 L 270047 I-10 0.20 286
2 72 72002000 L 720126 I-295 0.07 324
3 48 48260000 R 480070 I-10 0.06 331
3 58 58002000 L 580167 I-10 0.05 228
4 93 93220000 R 930201 I-95 0.09 224
4 86 86070000 L 860128 I-95 0.14 259
5 70 70220000 R 700123 I-95 0.03 235
5 75 75280000 R 750203 I-4 0.01 269
5 77 77160000 R 770087 I-4 0.12 325
5 79 79002000 L 790064 I-95 0.03 233
5 79 79002000 L 790077 I-95 0.27 326
6 87 87200000 R 870265 I-395 0.03 222
137
APPENDIX G RESPONSES FROM FDOT DISTRICTS ON AVERAGE COST
INFORMATION ASSOCIATED WITH PAVEMENT REHABILITATION
1. What are the average contract lump sum prices for the item of mobilization (i.e., preparatory
work and operations in mobilizing for beginning work) in bridge approach pavement
milling/resurfacing and reconstruction project, respectively? (If data for bridge approach
pavements are not available, please provide those for regular highway pavements.)
Responses:
• District 1: Typically we estimate 10% to 20% of the total project cost for mobilization.
This number could change based on different factors, but this is what we typically
budget.
• District 2: This would vary depending on the overall scope of the project, but would
generally fall within the range of 3.5% to 7% for resurfacing projects, with lower
numbers more likely and the higher numbers on projects with significant amounts of non-
paving work, such as drainage, sidewalk, signals, etc. The most likely number on a
straight resurfacing project would be 3.5% to 4%.
• District 6: Typically, this is estimated at 8.5% - 10% of the total project cost.
2. What is the average contract lump sum for temporary traffic control (TTC) in bridge approach
pavement rehabilitation areas? What are the average number of TTC days for bridge
approach pavement milling/resurfacing and reconstruction project, respectively? (If data for
bridge approach pavement areas are not available, please provide those for regular highway
pavement area.)
Responses:
• District 1: Typically we estimate 10% to 25% of the total project cost for MOT
depending on several factors. I can’t give you an average number of days for MOT. That
would vary depending on how long construction would take.
• District 2: Overall, probably about $550 per day. This could be as much as double in a
congested urban area with heavy traffic.
• District 6: Typically, this is estimated at 10% of the total project cost.
3. What is the average cost of milling existing asphalt pavement at a certain depth (e.g., 1 in, 1 1∕2 in, 2 in, 2 3∕4 in, 3 in, 4 in, 5 in, 6 in, and 7 in, etc.) per square yard (SY) in your district (for
example, $2.77 per SY at 1 in depth)?
Responses:
• District 1: See the following link. You can find a list of pay items averages based on
different timeframes and different locations (statewide or other).
http://www.fdot.gov/programmanagement/Estimates/HistoricalCostInformation/Historica
lCost.shtm
• District 2: For FDOT District 2, over the past year (8/1/16 to 8/1/17), the averages per
SY are as follows: 1 in ($1.98); 1.5 in ($1.92); 2 in ($1.64); 2.75 in ($1.72); 3 in ($2.33);
138
4 in ($2.76); and 5 in ($5.52). In addition, if you use a depth not used on the rest of the
project in a small quantity you can expect significantly higher prices, perhaps double
these numbers
• District 6: $2 – 7$. FDOT’s historic cost information can be found at the following site.
This site has average unit prices on FDOT projects from the last year for 14 areas of the
state. Attached are the latest reports for District 6 (Miami-Dade and Monroe Counties).
These reports are updated monthly and may not include costs for all pay items if it has
not been used on a recent project. The site also has historic statewide averages.
http://www.fdot.gov/programmanagement/Estimates/HistoricalCostInformation/Historica
lCost.shtm; To understand FDOT’s estimating process and pay item numbering system,
you should be familiar with the Basis of Estimates (BOE), the manual and list of pay
items can be found at these links:
http://www.fdot.gov/programmanagement/Estimates/BasisofEstimates/BOEManual/BOE
Online.shtm; https://fdotewp1.dot.state.fl.us/designquantitiesandestimates/#/boe; For
estimating purposes, FDOT does not distinguish between the pavement design in the
“transition area” outside the approach slabs from the regular pavement, so the same pay
items would apply.
4. What is the average cost of overlay for a certain asphalt mixture type (e.g., SP-9.5, SP-12.5,
SP-19, FC-5, FC-9.5, and FC-12.5, etc.) per ton (T) in your district?
Responses:
• District 1: See the following link. You can find a list of pay items averages based on
different timeframes and different locations (statewide or other).
http://www.fdot.gov/programmanagement/Estimates/HistoricalCostInformation/Historica
lCost.shtm
• District 5: I have a site I can access that can get you historical costs by pay item from the
Specifications Office.
http://www.fdot.gov/programmanagement/Estimates/HistoricalCostInformation/Historica
lCost.shtm
• District 6: See pay item series 334-1-xx for structural course, 337-7-xx for friction
course. For pavement reconstruction, additional costs would also be required: see pay
items 110-1-1 (clearing and grubbing), 120-x (excavation or embankment), 160-4
(stabilization), and 285-x (base course). Also note, pavement reconstruction may also
impact other existing roadside features, like curbing (520-x), side walk (522-x), guardrail
(536-x), and sobbing (570-x). Also for either resurfacing or reconstruction, new
pavement markings would be required.
5. Could you provide some previous cost-estimation contracts/reports (including overlay or
reconstruction design, treatment area, cost-estimation lists, etc.) about milling & resurfacing
or reconstruction of bridge approach pavement in your district (If files for bridge approach
pavements are not available, please provide those for regular highway pavements.)?
Responses:
• District 1: I would suggest you view our construction website, where you can view bid
tabs for previous project that were “let”. See the link below. You can find recent projects

139
that were bid along with their bid tabs.
http://www.fdot.gov/contracts/Lettings/Letting_Project_Info.shtm
• District 2: T2639 is replacement of the CR356C bridge over the Fenholloway River and
includes reconstruction of the approaches. That is about all I have that matches this
criteria in the past year. I could provide info on generic milling and resurfacing projects if
needed.

![arXiv:1912.10775v1 [cs.CV] 23 Dec 2019 · Point2Node: Correlation Learning of Dynamic-Node for Point Cloud Feature Modeling Wenkai Han,1 Chenglu Wen,1 Cheng Wang,1 Xin Li,2 Qing Li1](https://img.pdfslide.us/doc/110x75/5f1c209476f5377706511d05/arxiv191210775v1-cscv-23-dec-2019-point2node-correlation-learning-of-dynamic-node.jpg)