Embed Size (px)
Citation preview

SECTION 1.0 –
INTRODUCTION
1
1.1 BACKGROUND The Zone 7 Water Agency serves water to the cities of Pleasanton, Livermore, and Dublin. Zone 7’s main water source is the Sacramento-San Joaquin Delta delivered via the South Bay Aqueduct (SBA). The water is treated at two surface water treatment plants; the Patterson Pass Water Treatment Plant (PPWTP) and the Del Valle Water Treatment Plant (DVWTP). Two other water agencies also use the SBA: the Alameda County Water District (ACWD) and the Santa Clara Valley Water District (SCVWD). SBA water commonly contains chemicals that impart objectionable taste and odor (T&O). These chemicals are produced by algae growing in the water. While algae can produce many chemicals, the primary T&O-related ones in SBA water are geosmin and 2-methylisoborneol (MIB). While these chemicals have no known adverse health effects, they are easily detected by customers at low nanogram per liter (ng/L) levels, resulting in customer complaints about the quality of their drinking water. To treat the T&O problem, Zone 7 has been using powdered activated carbon (PAC) at both plants on a seasonal basis. PAC is effective, but it is difficult to handle, expensive, and the high doses needed to effectively remove MIB and geosmin can cause problems with the other plant processes. 1.2 OZONE APPLICATION IN DRINKING WATER TREATMENT For decades, ozone has been used to disinfect drinking water and to destroy T&O chemicals and other micropollutants that may be present in water. In California, many agencies that draw water from the State Water Project (SWP) system use ozone for meeting the disinfection requirement as well as improving the overall aesthetic quality of their drinking water. In Northern California, the list of agencies that use ozone for water treatment includes the following:
Alameda County Water District Santa Clara Valley Water District Contra Costa Water District San Francisco Public Utilities Commission East Bay Municipal Utilities District City of Vallejo Cities of Vacaville & Fairfield City of Napa City of Martinez
The downside to ozone use for water treatment is twofold: First, it is an expensive process to construct and operate. Second, when ozone is added to water containing elevated levels of bromide, it could generate bromate (BrO3
-) above the maximum allowable limit (MCL) of 10 µg/L in drinking water. SBA water used by Zone 7 frequently contains elevated bromide levels. In fact, an analysis of historical water quality data indicated that the 50th percentile bromide level in SBA water between 1993 and 2007 was 100 µg/L, while the 90th percentile was 290 µg/L. The maximum bromide concentration was recorded at >500 µg/L. At the typical ozone doses

Section 1 – Introduction
2
applied in drinking water treatment, bromide concentrations above 100 µg/L could result in bromate formation above the MCL. For SWP water users, bromate control strategies must be implemented in conjunction with ozone application. 1.3 OZONE VS. PEROXONE Two configurations of an ozone system can be used for T&O control. The first is a conventional configuration where ozone is added into the water as it flows through a multi-chamber, over-under contactor with an average contact time of about 8 to 10 minutes. This contact time is required to give the ozone sufficient time to react with the target contaminants. This configuration is referred to in this report as Conventional Ozone. All the agencies listed above utilize conventional ozone contactors. The other configuration is a process in which ozone and hydrogen peroxide are added to the water. The combination of ozone and hydrogen peroxide generates hydroxyl radicals (OH), which are stronger oxidants than ozone itself and require much shorter contact time to achieve T&O destruction. This process is referred to in this report as the Peroxone process. Due to the fast reaction time, a Peroxone process requires a significantly smaller contactor (2 to 4 minutes) compared to conventional ozone (8 to 10 minutes), and is believed to require a lower ozone dose to meet the same target T&O destruction goals. However, because of its short contact time, and the fact that the added hydrogen peroxide rapidly destroys the ozone residual, it is impractical to claim disinfection credit through a Peroxone contactor. Therefore, if Peroxone is implemented at Zone 7’s treatment plants, disinfection requirements must continue to be met with chlorine. 1.4 OVERALL PROJECT DESCRIPTION This project aimed at determining whether ozone or Peroxone should be implemented at the Zone 7 treatment plants, and defining the practical and financial implications of the implementation of either process. The specific activities included the following: 1. Conduct pilot-scale testing of ozone vs. Peroxone to determine the design criteria required
by each process to meet Zone 7’s T&O goals.
2. Determine whether the ozone-based T&O process should be applied on the raw-water or settled-water side.
3. Develop the design criteria, hydraulic requirements, and general layouts of an ozone or Peroxone process at each plant.
4. Develop probable costs for constructing and operating either process at each plant.
5. Identify the permitting requirements for implementing either process at each plant.
6. Identify the impact of implementing either ozone or Peroxone on the operation of each of Zone 7’s water treatment plants.
A significant portion of this project was dedicated to the pilot testing effort. If conventional ozone were the only process being considered, pilot testing would not have been required since ample experience has been developing on applying conventional ozone for the treatment of SBA water. However, since Zone 7’s primary reason for the ozone process is T&O destruction and not disinfection, there was a reasonable expectation that the implementation of Peroxone instead of conventional ozone could result in a T&O control process that is less costly to build
Section 1 – Introduction
3
and operate. Unfortunately, there is little to no full-scale experience with the design and operation of a Peroxone process for drinking water treatment. In order to quantify the expected cost savings of a Peroxone process over a conventional ozone process, and to determine its design and operational requirements, it was necessary to conduct side-by-side pilot testing of the two processes. 1.5 REPORT ORGANIZATION Following this introductory section, Section 2 presents and discusses the T&O water quality goals. Section 3 presents a thorough review of the available literature on T&O destruction with ozone based processes. Section 4 presents the pilot testing plan, while Section 5 presents the pilot testing results obtained. Section 6 includes the design criteria, layouts, and hydraulic constraints for the addition of ozone or Peroxone at each plant. Section 7 presents the estimated capital and annual O&M costs of implementing ozone or Peroxone at each plant. Section 8 includes the permitting requirements of either process is added to each plant, as well as the anticipated schedule from design through construction. Finally, Section 9 presents the potential operational impacts of implementing ozone or Peroxone at DVWTP and PPWTP.

Section 1 – Introduction
4
THIS PAGE INTENTIONALLY LEFT BLANK

SECTION 2.0 –
WATER QUALITY GOALS
5
The design of a Taste and Odor (T&O) control strategy is anchored at two end-points:
1. The design maximum concentrations of T&O chemicals in the raw water 2. The target finished water quality goals for these chemicals
The design maximum concentrations are selected based on the analysis of historical water quality information. In this Section, the historical levels of T&O causing compounds in South Bay Aqueduct (SBA) water are reviewed and analyzed with the purpose of identifying the design removal percentages required for each chemical. Depending on the selected percent of the time that the treated water from the plants will comply with the targets, the size (and therefore cost) of the system will vary. 2.1 TREATED WATER QUALITY TARGETS Zone 7 Water Quality Policy, Goals, and Targets, adopted by the Zone 7 Board of Directors in 2003, were developed after extensive discussions with, and in cooperation with, local retail water contractors including the California Water Service Company, the Cities of Livermore and Pleasanton, and the Dublin San Ramon Services District. As part of the Water Quality Management Program, formally adopted Water Quality Targets have been defined, as listed in Table 2.1. With regard to taste and odor, Zone 7 has adopted a target of “no events” for earthy/musty T&O, as well as the targets of no more than 9 ng/L of MIB and 4 ng/L of geosmin in the finished water. An event is defined as three or more complaints over a seven-day period. The current project focuses on earthy/musty taste and odor control. However it is important that all of the other adopted water quality targets, as well as all of the drinking water regulations, are not adversely impacted by the selected T&O control strategy. Zone 7’s water quality targets are consistent with those of the general water industry as well as the other South Bay Aqueduct contractors. For example, K. Rakness in Ozone in Drinking Water Treatment: Process Design, Operation, and Optimization (2005) states that taste and odor thresholds for MIB and geosmin are in the range of 6 to 10 ng/L. MWH in Water Treatment Principles and Design, (2005) suggests that MIB and geosmin thresholds are “in the range of” 5 ng/L. McGuire et al. (1981) reported odor thresholds of 4 and 9 ng/L for the two compounds, while Simpson and MacLeod (1991) reported customer complaints at levels above 7 and 12 ng/L, respectively. The AWWA book Water Quality & Treatment: A Handbook of Community Water Supplies (1999) suggests a maximum level of 10 ng/L for either chemical. Alameda County Water District (ACWD) does not have formally-adopted targets for MIB and geosmin levels. Santa Clara Valley Water District (SCVWD) has a goal of less than 5 ng/L for both, and a “trigger level” of 8 ng/L for MIB and 10 ng/L for geosmin. Actions such as increased monitoring and PAC feed are taken if the trigger levels are exceeded. Both agencies have adopted goals of minimal to no taste and odor events. (Cabral, 2007 and Chun, 2007, personal communication). Based on the above comparisons, it is clear that Zone 7’s adopted MIB and geosmin targets are reasonable and consistent with others, and no changes to them are needed or recommended.

Section 2 – Water Quality Goals
6
Table 2.1 – Zone 7 Water Quality Targets Key Parameter of Concern Water Quality Target Appearance Minimize air bubbles/cloudiness events Arsenic (μg/L)1 <5 Chloramines Cl2:NH3-N 4:1 to 5:1 Total Residual (mg/L as Cl2)
2.0 to 2.5 from water treatment plants (WTPs), wells will be operated to be as close to this target range as feasible
Minimize odor Chloraminate above pH 8.0 for WTPs Prevent Nitrification Free Ammonia Residual (mg/L as N) <0.15 Nitrite (mg/L as N) <0.02 Consistency Provide consistent residual at all wells and WTPs Chloride (mg/L) <100 Chromium VI (µg/L) <20, pending new regulations Cryptosporidium 4-log removal, including multi-barrier control Disinfection Byproducts Maximum Leaving WTP Total Trihalomethanes (TTHMs) < 64 µg/L Five Haloacetic acids (HAA5) < 48 µg/L Running Annual Average at Retailer Turnouts TTHMs < 40 µg/L HAA5 < 30 µg/L N-Nitrosodimethylamine (NDMA) (ng/L) < 10, pending new regulations Bromate 8 µg/L Hardness (mg/L as CaCO3) < 150 mg/L pH (units) Non-corrosive
pH leaving WTPs at ± 0.2 units of target Radon (pCi/L) <1,000 pending new regulations Taste and Odor (earthy/musty) 2-Methyisoborneol (MIB) 9 ng/L Geosmin 4 ng/L Events No Events (An event is defined as 3 or more
complaints in a 7-day period.) Total Dissolved Solids (TDS) (mg/L) <500
2.2 RAW WATER MIB AND GEOSMIN CONCENTRATIONS The primary source of the earthy/musty taste and odor compounds is algal byproducts that occur periodically in the South Bay Aqueduct. The most commonly measured T&O culprits are methylisoborneol (MIB) and geosmin. Figures 2.1 and 2.2 show the MIB and geosmin concentrations, respectively, for the past seven years measured by the Department of Water Resources at Del Valle Check 7.2 This sample location is upstream of the Del Valle Water Treatment Plant, but does not include any blend water from Lake Del Valle. It is, therefore, representative of the raw water entering the Patterson Pass WTP and most of the water entering the Del Valle WTP.
1 µg/L = microgram per liter, ng/L = nanogram per liter, pCi/L = picoCurie per liter, mg/L = milligram per
liter 2 2001 is the year that the Department of Water Resources began intensive monitoring for MIB and
geosmin. Data prior to that time in the SBA are sparse.

Section 2 – Water Quality Goals
7
Figure 2.1 – Seven-Year Historical Levels of MIB Measured at Del Valle Check 7 (California Department of Water Resources)
Figure 2.2 – Seven-Year Historical Levels of Geosmin Measured at Del Valle Check 7 (California Department of Water Resources)

Section 2 – Water Quality Goals
8
The historical data indicate two things: 1) the occurrence of the two chemicals in SBA water is seasonal and highly variable, and 2) there are occasional spikes of very high concentrations. The sample collected on July 23, 2007 was reported to have an MIB concentration greater than 50 ng/L, but was not quantified beyond that point. With the exception of powdered activated carbon (PAC), the treatment processes used by the two water treatment plants remove insignificant amounts of these compounds. Therefore when PAC is not used, it can be assumed that the concentrations shown in Figures 2.1 and 2.2 are similar to the levels in the water supplied to the distribution system. Water quality in the delta water is dependent on many factors. Making treatment process decisions in the absence of a very large set of data covering many years can be challenging, since historical levels do not necessarily predict future levels. One of the most important factors influencing delta water quality is the amount of rainfall in the watersheds. According to the Department of Water Resources (DWR) California Snow Survey, the years covered in the above MIB and geosmin graphs (2001 through 2007) were classified as Dry, Dry, Below Normal, Dry, Wet, Wet, and Critical for the Sacramento-San Joaquin River systems. The data were sorted and ranked, and the percentage of time that the measured value was at or below a particular level was plotted (percentile graphs). These are shown in Figures 2.3 and 2.4 for MIB and geosmin, respectively. On each plot, lines are drawn showing the 95th and 99th percentile concentrations for each compound in SBA water, as well as lines showing the percentiles corresponding to each of Zone 7’s goals.
Figure 2.3 – Percentile Occurrence of MIB in SBA Water (2001 – 2007)
40%
50%
60%
70%
80%
90%
100%
0 5 10 15 20 25 30 35 40 45 50 55
MIB concentration, ng/L
Zone 7 goal = 9 ng/L
95th
percentile = 17 ng/L
99th
percentile = 31 ng/L

Section 2 – Water Quality Goals
9
Figure 2.4 – Percentile Occurrence of Geosmin in SBA Water (2001 – 2007) The data plotted in Figure 2.3 show that 89% of SBA water samples contained MIB levels at or below the Zone 7 goal of 9 ng/L. Therefore, T&O removal or destruction will be required up to 11% of the time, which translates into approximately 40 days of the year. Similarly, Figure 2.4 shows that 61% of SBA water samples contained geosmin levels at or below the Zone 7 goal of 4 ng/L. Therefore, T&O removal or destruction will be required up to 39% of the time, which translates to about 142 days (almost five months) of the year. These are significant durations of T&O treatment that should be considered when evaluating the overall operational cost. Table 2.2 includes the calculated percentile rankings of the various concentrations of each compound and the corresponding percent reduction that would be required to meet Zone 7’s water quality targets. For example, if the selected treatment system were to meet the target MIB concentration of 9 ng/L 95% of the time, then it would need to be designed to provide a maximum of 47% reduction in MIB ((17 – 9)/17). This would also mean that the MIB goal of 9 ng/L would not be met 5% of the time, which translates into approximately eighteen 18 days (2.5 weeks). On the other hand, if the treatment system is to meet the MIB goal of 9 ng/L 99% of the time, then it should be designed to achieve a maximum of 71% removal of MIB ((31 – 9)/31). With this treatment level, Zone 7 will not meet its MIB goal 1% of the time, which translates into approximately four (4) days of the year.
Per
cen
t o
f V
alu
es L
ess
Th
an In
dic
ated

Section 2 – Water Quality Goals
10
Table 2.2 – Analysis of MIB and Geosmin Occurrence Data (2001 – 2007)
Concentration,
ng/L % reduction required to meet target levels
Percentile MIB Geosmin MIB Geosmin Average: 4 4 -- --
50th percentile: 2 4 -- --
75th percentile: 4 5 -- 20% 90th percentile: 9 8 -- 50% 95th percentile: 17 10 47% 60% 99th percentile: 31 15 71% 73%
100th percentile: >50 17 83% 76% A design criterion that meets the WQ goals 95% to 99% of the time is typical for taste and odor control processes. For example, the Altamont Water Treatment Plant (AWTP) is designed to use ozone to achieve the target removal of MIB and geosmin. As part of the Altamont WTP design, the anticipated range for MIB was up to 30 ng/L, and that for geosmin was up to 12 ng/L. These values correspond to approximately the 99th and 95th percentiles for these two compounds, respectively, based on the analysis presented in this Section. This is also in line with the testing conducted by ACWD in preparation for the design of Water Treatment Plant No. 2. During their evaluation, ACWD spiked the raw water with about 30 ng/L of MIB and geosmin, and the treatment goal was to reduce each chemical to less than 10 ng/L. 2.3 SUMMARY & RECOMMENDATIONS The occurrence of MIB and geosmin in SBA water during the last seven years (2001 to 2007) was analyzed in this Section and compared to Zone 7’s goals. The analysis showed that, during the last five years, SBA water exceeded Zone 7’s MIB goal of 9 ng/L about forty (40) days each year, and exceeded Zone 7’s geosmin goal of 4 ng/L about five (5) months each year. The maximum geosmin and MIB levels recorded by DWR in SBA water since January 2001 were 17 ng/L and >50 ng/L, respectively. A frequency distribution analysis showed that the 99th percentile levels of geosmin and MIB were 15 ng/L and 31 ng/L, respectively. If Zone 7 were to meet its goals 100% of the time, based on the last five years of record, the new T&O treatment process should be designed to achieve up to 76% removal of geosmin and 83% removal of MIB (assuming the actually maximum MIB concentration was approximately 52 ng/L). On the other hand, if Zone 7 decides to meet its goals only 99% of the time, then the last five years of data suggest that the new T&O treatment process should be designed to achieve up to 73% removal of geosmin and up to 71% removal of MIB. Since MIB is known to be more difficult to remove with ozone or other technologies than geosmin, then the MIB removal requirement is expected to set the process design requirements. Therefore, an MIB removal target of 71% would meet Zone 7’s goals 99% of the time based on the last five years of T&O data in SBA water. This means that a T&O event may occur, on average, during four days each year. If this is to be eliminated and the target T&O removal is to be achieved 100% of the time, then the MIB removal target will be raised to 83%. For the purposes of this project, WQTS recommends that the pilot testing effort focuses on achieving MIB destruction greater than 71%.

SECTION 3.0 –
LITERATURE REVIEW
11
When this water quality improvements project was initiated, Zone 7 staff recognized that extensive work had already been conducted on the control of taste-and-odor (T&O) in water drawn from the Sacramento-San Joaquin Delta, particularly from the South Bay Aqueduct, which is the source of water for both the Del Valle WTP3 and the Patterson Pass WTP. Before planning the pilot-testing activities to be conducted under this project, it was important to review the outcome of the previous work and identify the technical areas that require further investigation, with the idea that the pilot testing effort would then focus on those areas. Information from past work was gathered from three sources: First, an extensive search of the published literature was conducted with specific focus on the application of ozone or Peroxone for T&O destruction in drinking water treatment. Second, while much of the previous work has been published, additional information is contained in internal reports of pilot-scale studies commissioned by the Alameda County Water District (ACWD) and the Santa Clara Valley Water District (SCVWD), as well as by Zone 7. Available pilot study reports were reviewed, and relevant data were analyzed. Third, WQTS staff met with ACWD and SCVWD staffs and obtained full-scale operational and disinfection byproduct (DBP) formation data from their full-scale plants after ozone implementation. This Section provides a summary of the data and information gathered from all three sources. 3.1 DRINKING WATER TASTES AND ODORS 3.1.1 Background An Awwa Research Foundation (AwwaRF)4 survey showed that approximately 70 percent of responding consumers cited factors such as clean, safe, healthy, and good quality as what was desired most from their utility (Hurd, 1993); only about 4 percent listed their top desire as having water that looks and tastes good. However, the same survey showed 65 percent of those who only drink bottled water do so because of having experienced problems with the taste of their tap water. On a scale from 0% (dangerously unsafe) to 100% (extra safe), with 75% assigned to the quality meeting Federal standards, bottled water users ranked the perceived safety of their tap water as 58%, on average. Objectionable taste leads consumers to bottled water, and indicates that the quality of their utility’s water is suspect. Detection of T&O in water has improved a great deal since the 1970s (Suffet and Segall, 1971) with the development of rapid detection methods such as closed-loop stripping analysis (CLSA) (Hwang et al., 1984) and flavor profile analysis (FPA) (Bartels et al. 1986; Bartels et al., 1987; Meng and Suffet, 1992). Advanced techniques now allow detection of T&O at low levels equal to those causing objectionable taste in drinking water (Sclimenti, 2003). This allows utilities to more effectively monitor and control T&O.
3 While the PPWTP receives water only from the Delta, the DVWTP periodically receives water from
Lake Del Valle in addition to the Delta water. 4 In 2008, the Awwa Research Foundation was renamed: Water Research Foundation.

Section 3 – Literature Review
12
3.1.2 Occurrence Section 2 included information on the occurrence of the earthy-musty T&O compound MIB in SBA water, and showed that peaks could exceed 50 ng/L. T&O surveys conducted by the American Water Works Association (AWWA) characterized water from 377 utilities across the United States (U.S.) and Canada, identifying T&O associations from chlorinous, to sour/metallic, and also earthy/musty as experienced by Zone 7 and many other utilities that treat water from the Delta (Suffet et al., 1996). Reservoir conditions and algal blooms are the primary causes of earthy/musty T&O found in surface waters—46 percent of the major causes for T&O in the survey. Earthy-musty algal blooms could also be associated with the production of algal toxins that are harmful to animals and humans (Gottler et al., 2007). It is prudent for utilities to control T&O compounds to increase consumer confidence. A report by Taylor and co-workers evaluated reservoir management practices that provide utilities tools to respond to T&O events (Taylor et al., 1994 & 2006). These tools include applying principles of limnology and system knowledge with a quick response because events can develop logarithmically and become uncontrollable very quickly. If these source-monitoring/treatment tools do not work or are not practical, then the resulting T&O levels must be handled at the water treatment plant before the water is served to the customers. 3.1.3 Treatment Options Control of chemicals that cause T&O in drinking water has been extensively studied. Activated carbon, whether used in the granular form (GAC) or the powdered form (PAC) adsorbs these chemicals from water (Lalezary et al., 1986; Graham et al., 2000; Machenzie et al., 2005). PAC is moderately effective, but due to negative operational impacts is not being considered as Zone 7’s long-term control strategy. GAC would require high cost for regeneration when used as an adsorption technology. Advanced oxidation processes (AOPs) are also effective treatment technologies for destroying T&O chemicals. AOP technologies promote the formation of hydroxyl radicals (OH•) which are highly efficient in oxidizing organic and inorganic impurities (Najm and Trussell, 1999). Several technologies generate hydroxyl radicals, and are therefore classified as AOPs. These include (1) the combination of ultraviolet light (UV) and hydrogen peroxide (Linden et al., 2004; Royce and Stefan, 2005), (2) ozone combined with UV (Mokrini et al., 1997; Oh et al., 2005), and (3) ozone combined with hydrogen peroxide (also known as Peroxone). Treatment of T&O chemicals with UV technology requires a significant amount of energy, especially when it is combined with ozone, and is not practical at the scale required by Zone 7. In addition, while UV-based AOPs have been evaluated at bench-scale or pilot-scale, to our knowledge, they have not been applied for T&O control at full-scale drinking water treatment plants. Ozone or Peroxone offer a more practical, cost effective means to control T&O, while potentially offering additional treatment benefits. 3.2 OZONE AND PEROXONE TREATMENT 3.2.1 Taste and Odor Control Numerous studies have shown that ozone is significantly more effective for treating T&O compounds than chlorine, chloramines, or chlorine dioxide (Mallevialle and Suffet, 1987; Anselme et al., 1988; Lalezary et al, 1986). Glaze and co-workers further identified much of the functionality of how ozone is able to oxidize T&O-causing compounds in both Colorado River water (CRW) and State Water Project (SWP) water conveyed to southern California (Glaze et al., 1990). Their work showed ozone and Peroxone were the most efficient treatment techniques in controlling MIB and geosmin when compared to many other technologies that
Section 3 – Literature Review
13
included chlorine dioxide, potassium permanganate, UV, UV with ozone, and UV with hydrogen peroxide. Oxidation of these T&O chemicals was more effective in SWP water than in CRW. Further work conducted by the Metropolitan Water District of Southern California (MWDSC) showed that MIB and geosmin could be effectively controlled in both pilot-scale and demonstration-scale (5 mgd) over/under contactor designs using either ozone or Peroxone (Ferguson et al., 1990 & 1991; MWDSC, 2000; MWDSC and JMM, 1991; Koch et al., 1992). In conflict with Glaze’s bench-scale work, efficiency of T&O destruction was higher in CRW compared to SWP water. Demonstration-scale test results showed ≥80-percent removal of T&O in CRW with either 4 mg/L ozone or 2.5 mg/L ozone as Peroxone (hydrogen peroxide ratio of 0.2 mg/L per 1 mg/L ozone). Demonstration-scale tests with SWP water showed 4 mg/L ozone alone or 3.2 mg/L ozone with a 0.2 Peroxone ratio provided similar results. A recent study demonstrated that Peroxone more rapidly oxidizes geosmin than MIB and is more effective at higher pH and/or water temperature (Westerhoff et al., 2006). 3.2.2 Micro-pollutant Control Using ozone or Peroxone for control of T&O compounds can have additional benefits such as destruction of micro-pollutants. A bench-scale study in buffered laboratory water found that as little as 1 mg/L applied ozone is able to completely oxidize high concentrations of algal toxin (up to 500 µg/L Microcystin-LR) at dissolved organic carbon (DOC) concentrations of up to 5 mg/L (Shawwa and Smith, 2001). In an AwwaRF-funded pilot-scale study with a DOC up to 6.5 mg/L, 20 µg/L of microtoxins were oxidized with ozone to below World Health Organization (WHO) guideline of <1 µg/L of algal toxins (Falconer, 1994), whereas GAC adsorption was not successful (Newcombe, 2002). Treatment of algal toxins by ozone-induced hydroxyl radicals, such as those produced by Peroxone, is more efficient in the oxidation of algal toxins than ozone alone (Onstad and von Gunten, 2005). Further studies with Peroxone have shown it to be effective against several emerging micro-pollutants. Peroxone is more efficient than ozone in oxidizing trichloroethylene (TCE) and tetrachloroethylene (PCE) (Glaze and Kang, 1988) and readily oxidizes many pesticides (Roche and Prados, 1995; Nelieu et al., 2000; Dyksen et al., 1992). Peroxone is more efficient than ozone in oxidizing dissolved endocrine disrupting compounds (EDCs) and pharmaceuticals and personal care products (P/PCPs), while typical conventional treatment processes (metal-salt coagulation, flocculation, sedimentation, and filtration) were not successful (Snyder et al., 2007). To achieve the same EDC and P/PCP destruction rates with a technology such as UV photolysis, dosages of >5,000 millijoules per square centimeter (mJ/cm2) were required (Adams et al., 2002). For comparison, this is roughly two orders of magnitude higher than typical disinfection doses used in water treatment. Peroxone is also an effective treatment to clarify water by oxidizing dissolved color (Tosik, 2005). Peroxone ratios required for treatments described above ranged from 0.1 to 0.7 by weight. 3.2.3 Disinfection A benefit of ozone disinfection relative to other chemical disinfectants such as chlorine or chloramines is that it is able to provide inactivation of Cryptosporidium (Oppenheimer et al., 1997). When using the Peroxone process, hydrogen peroxide quenches the ozone residual to form OH• that oxidize contaminants. This effectively cancels the ability to demonstrate compliance with the regulatory disinfection requirements. There are studies that have been conducted showing that Peroxone may have disinfection capabilities against the pathogens of concern (Wolfe et al., 1989; Scott et al, 1992). However, Peroxone is not accepted as a disinfectant by the United States Environmental Protection Agency (USEPA) or the California

Section 3 – Literature Review
14
Department of Public Health (CDPH) because disinfection requires the maintenance of a measurable disinfectant residual (USEPA, 1987). Therefore, when utilities use ozone for both disinfection and to achieve T&O control with Peroxone, it is common to employ separate areas of chemical contact—one area to maintain dissolved ozone for disinfection, followed by the addition of hydrogen peroxide as the water enters the second area where Peroxone reactions take place. 3.2.4 Bromate Formation and Control Like chlorine, ozone is not without its by-products. Bromate, the primary ozone by-product of concern, has a State and Federal Maximum Contaminant Level (MCL) of 10 µg/L, based on a running annual average. For decades, ozone has been known to form bromate in waters containing bromide (Haag and Hoigne, 1983; Westerhoff et al., 1994 & 1998; von Gunten and Hoigne, 1993), and reviews of literature describing the highly complex reaction of bromate formation are available (Siddiqui et al., 1995). Bromate is formed either directly by ozone reacting with bromide, or indirectly by the reaction of OH• with bromide. Because of seawater intrusion into the Delta, SBA water periodically contains elevated levels of bromide such that bromate formation during ozone or Peroxone usage is a concern requiring the implementation of some sort of bromate mitigation strategy at the treatment plants (Krasner et al., 1994). Figure 3.1 contains measured SBA bromide concentrations approximately once per week since 1993 (measured by the Alameda County Water District). This percentile plot shows that the 50th percentile bromide concentration is 0.101 mg/L (101 µg/L), which is considered quite high nation-wide.
Figure 3.1 – Percentile Plot of Measured Bromide Concentrations in South Bay Aqueduct
Water, 1993 – 2007, Alameda County Water District
Fra
ctio
n o
f V
alu
es L
ess
th
an In
dic
ate
d

Section 3 – Literature Review
15
Over the years, the most effective and reliable control strategy for bromate has been the addition of acid to reduce pH of the water before ozone addition (Coffey et al., 1998; Krasner et al., 1993; Galey et al., 2001; Williams et al., 2003). Alternative bromate control methods have included the application of ammonia or chlorine dioxide and more recently, chlorine-ammonia (chlorine added prior to ammonia) and chloramines (ammonia added prior to, or with, chlorine) (Krasner et al., 2004). If successful, these alternative bromate control methods can result in significantly lower operating costs compared to pH suppression. Table 3.1 summarizes pilot-scale bromate-control tests with chlorine-ammonia and chloramines. These methods, established with bench-scale testing (Pinkernell and von Gunten, 2001), bind free bromide and restrict its availability for oxidation to bromate with ozone or OH•. Results from pilot tests show very low doses of chlorine and/or ammonia are required to inhibit bromate formation. Operationally, this bromate control strategy provides substantial cost savings to utilities compared to pH control. CRW results have been confirmed in full-scale tests. In SWP water, all conditions reduced bromate below the 10 µg/L MCL. The difference between the tests in CRW and SWP water shown in Table 3.1 are that the amount of chlorine added was substantially lower in CRW than it was in SWP water. It has not yet been shown if bromate reduction would be realized in SWP water with the low chlorine dosages applied during CRW testing. Full-scale tests with SWP water have not yet been reported, but some preliminary testing has been conducted by ACWD and the results appear promising. It should be noted that the bromide level in the SWP water is generally higher and more variable than in the CRW.
Table 3.1 – Bromate Control by Use of Chlorine-Ammonia or Chloramines When Ozonating CRW or SWP water at Ambient pH (~8 units)
(Wert et al., 2007; Krasner, 2007)
Water Type and Reference
Bromide Level (mg/L)
Ozone Dose
(mg/L)
ChlorineDose
(mg/L)
Chlorine Contact
(min)
AmmoniaDose
(mg/L) Bromate
(µg/L)
Percent Bromate
Reduction
Col
orad
o R
iver
Wat
er 0.1 1.5 0.50 7 0 32 0%
0.1 1.5 0 0 0.1a 10 38%
0.1 1.4 0.25 7 0.1a 14 44%
0.1 1.6 0.50 7 0.3a 6 75%
0.1 2.1 0.50 7 0.5a 2 93%
Sta
te W
ater
Pro
ject
W
ater
0.2 ~1.5* 0 0 0.3c 18 0%
0.2 ~1.5* ** 5 0.3b 2 88%
0.2 ~1.5* ** 1 0.3b 2 88%
0.2 ~1.5* ** 6d 0.3d 3 84%
0.2 ~1.5* ** 1d 0.3d 4 76%
0.3 ~2* ** 1 0.3b 3 89%
0.3 ~2* ** 6d 0.3d 2 92%
0.3 ~2* ** 1d 0.3d 4 88% a Ammonia was added immediately prior to the first ozone cell b 1-min ammonia contact time c 6-min ammonia contact time d Ammonia added prior to, or at the same time as chlorine (chloramine contact) * Ozone dose unknown, so it is approximated based on other information in the study ** Chlorine (dose unknown) was added to establish a 1 mg/L residual at end of contact time
Section 3 – Literature Review
16
3.2.5 Effect on Coagulation and Filtration Careful, controlled research regarding the precise effects of ozone on coagulation is somewhat limited. While there is much anecdotal evidence regarding improved performance of conventional treatment plants when using ozone, there are few published reports containing this type of data. In general, plants report improvements in the coagulation and filtration processes when ozone is used compared to other pre-oxidants or no pre-oxidant at all. This is particularly true of plants using delta water. Reported benefits include lower coagulant doses, decreased susceptibility to rapid changes in raw water quality, lower filter effluent turbidity and particle count values, and longer filter run times (Panus and Parsons, 2007; Rakness, 2005; Gillogly et al., 2001; Chun et al., 2007; Cabral and Castro, 2007). Improvement of the coagulation process, rather than disinfection, was the original objective for ozone addition at the 600 mgd LA Aqueduct filtration plant (Rakness, 2005). Rakness notes in his book “the author of this book also has observed that lower filtered water turbidity values have resulted from the application of ozone.” He goes on to say that laboratory scale experiments often fail to show the same beneficial effects that are observed at full scale, perhaps due to differences in operation and design of the systems. Rakness cites several examples of full scale plants that experienced lower coagulant doses, lower turbidities, or both, when ozone was installed (Rakness, 2005). No information specifically describing the effects of Peroxone on coagulation or filtration could be found. A study by Reckhow and co-workers showed mixed results when various waters were ozonated ahead of coagulation (Reckhow et al., 1993). Their data showed that ozone did not improve the alum coagulation process, but did improve coagulation when either using different polymers or in the presence of oxidized iron. Specifically, this study showed that ozonation reduced the particle stability of some algae, but the effect on subsequent coagulation is variable and highly dependent on raw water (and seasonal) parameters. Some pilot-scale studies have shown that ozone preoxidation (when compared to no preoxidant) can improve performance of downstream coagulation/filtration by reducing particle counts or turbidity (Becker et al., 2002; Yates et al., 1997). However, the beneficial effect was also observed evaluating other pre-oxidants (e.g., chlorine, chloramines, chlorine dioxide), and is not necessarily a benefit solely provided by ozone. Of course, pre-chlorination may not be an option for many plants due to excessive formation of chlorinated byproducts. 3.3 OZONE AND PEROXONE SYSTEM DESIGN AND OPERATION Thompson and Drago conducted a Survey of U.S. ozone facilities (Thompson, 2005; Thompson et al., 2005). The database generated shows that in 1975 there was only a single, 4 MGD plant with an ozone capacity of 50 pounds per day. At the time the survey was presented in 2005, there were 204 plants with ozone treating a capacity of 12.6 billion gallons per day with 420,000 pounds per day of ozone generating capacity. While the first facility constructed in 1974 was designed to meet disinfection requirements, there has been an increased use of ozone for T&O control as well as for reduction in chlorinated disinfection byproducts. A few of these facilities operate to oxidize iron, manganese, color or to improve downstream particle removal by conventional treatment. Less than 20 percent of the facilities surveyed operate to inactivate Cryptosporidium. Many of the facility managers identified that these ozone facilities are anticipated to assist in the future control of EDCs and P/PCPs.

Section 3 – Literature Review
17
3.3.1 Over/Under Baffled Contactors Ozone has been used as a disinfectant to treat both SBA water and other sources of SWP water. Figure 3.2 is an illustration of how ozone disinfection can be achieved in the front portion of an ozone contactor while Peroxone may be implemented toward the end of the contactor. This over/under baffled design provides multiple functions. Ozone disinfection allows utilities to obtain necessary disinfection credit while avoiding forming elevated levels of THMs and HAAs typically observed following application of chlorine. This type of dual-purpose contactor was the basis for the design of both ACWD’s and SCVWD’s ozone plants. Sufficient contactor depth (generally 20 feet or more) allows for nearly complete (99%) ozone transfer into the water.
Figure 3.2 – Dual-Stage Contactor Design for Ozone Disinfection and Oxidation of Taste and Odor Compounds (Dyksen et al., 1992)
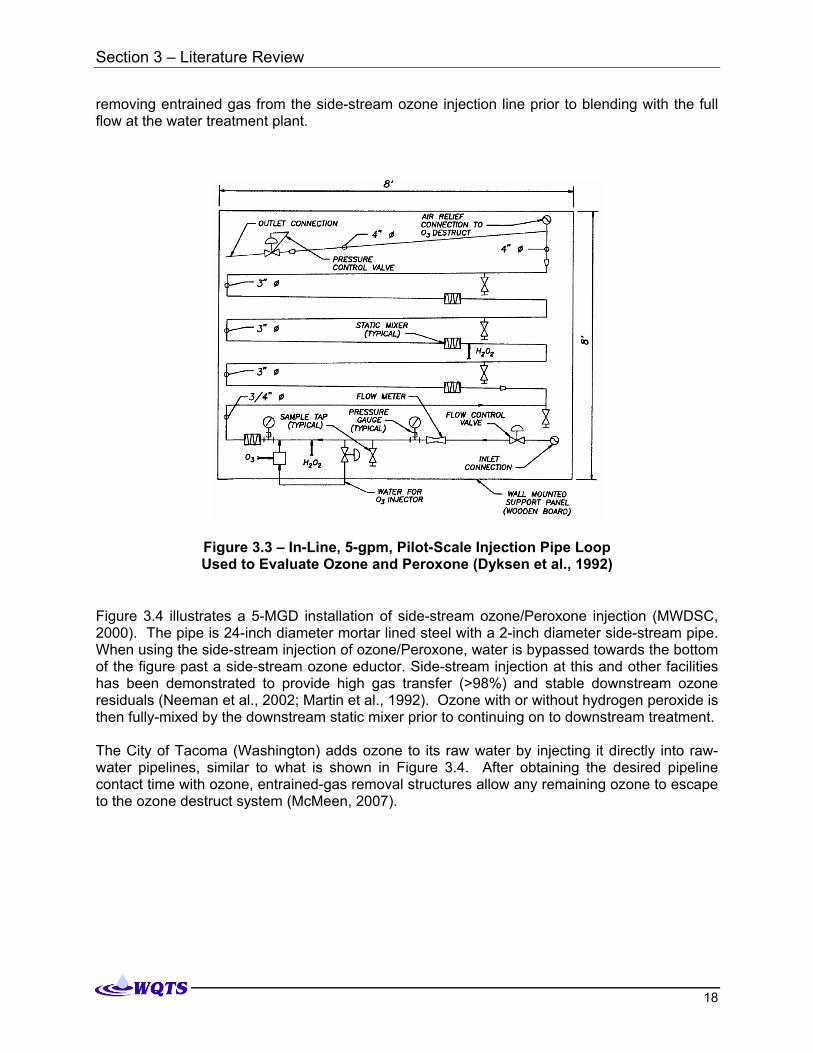
Due to the need to demonstrate adequate disinfection, however, typical ozone systems are understandably different in design compared to a system that would be strictly used for Peroxone addition. This is a challenge when designing a Peroxone process where, because no disinfection credit is intended, pilot work is necessary to evaluate operational challenges and to minimize construction and operational costs. Otherwise, cost effectiveness for Peroxone-only T&O control may not be beneficial compared to a typical, dual-purpose ozone/Peroxone contactor. 3.3.2 In-Line Injection and Pipe Contactors Figure 3.3 illustrates a vertically-mounted, pipe-loop used in a pilot study funded by AwwaRF to evaluate in-line injection of ozone and Peroxone to oxidize TCE, PCE, and MTBE (Dyksen et al., 1992). Pilot work showed that entrained gases produced milky finished water unless proper air-relief was installed and injection was <50 psig. The issue of entrained air needs further research, but may be resolved by using a hydro-pneumatic tank, mechanical gas separation, or
Ozone gas flow Hydrogen Peroxide flow
InletOutlet
Section 3 – Literature Review
18
removing entrained gas from the side-stream ozone injection line prior to blending with the full flow at the water treatment plant.
Figure 3.3 – In-Line, 5-gpm, Pilot-Scale Injection Pipe Loop Used to Evaluate Ozone and Peroxone (Dyksen et al., 1992)
Figure 3.4 illustrates a 5-MGD installation of side-stream ozone/Peroxone injection (MWDSC, 2000). The pipe is 24-inch diameter mortar lined steel with a 2-inch diameter side-stream pipe. When using the side-stream injection of ozone/Peroxone, water is bypassed towards the bottom of the figure past a side-stream ozone eductor. Side-stream injection at this and other facilities has been demonstrated to provide high gas transfer (>98%) and stable downstream ozone residuals (Neeman et al., 2002; Martin et al., 1992). Ozone with or without hydrogen peroxide is then fully-mixed by the downstream static mixer prior to continuing on to downstream treatment. The City of Tacoma (Washington) adds ozone to its raw water by injecting it directly into raw-water pipelines, similar to what is shown in Figure 3.4. After obtaining the desired pipeline contact time with ozone, entrained-gas removal structures allow any remaining ozone to escape to the ozone destruct system (McMeen, 2007).

Section 3 – Literature Review
19
Figure 3.4 – In-Line, 5-MGD, Side-Stream Injection (Eductor Shown) Used to Evaluate Ozone and Peroxone (MWDSC, 2000)
Figures 3.5 and 3.6 illustrate an overview of the City of Seattle (Washington) ozone addition and contacting process (Nilson, 2007; Seattle Public Utilities, 2006). Seattle adds ozone gas into a concrete structure with fine-bubble diffusers with the capacity to remove excess, ozone-rich gas in its headspace. Ozone contact time is achieved in the downstream pipe (Nilson, 2007). This design offers a minimized version of the multi-cell, dual-purpose, disinfection/oxidation contactor shown above while providing the same type of ozone diffusion process—blending water and gas in a counter-current manner. Using a pipeline (instead of a concrete structure) to obtain ozone contact potentially allows for lower capital costs while saving precious hydraulic gradient.

Section 3 – Literature Review
20
Figure 3.5 – Overview of the In-Line, 180-MGD, Pipeline Ozone Contactor System for City of Seattle’s Lake Youngs Source (Nilson, 2007)
Figure 3.6 – Illustration of the Fine-Bubble, Ozone Injection Chamber Operated at the Cedar Water Treatment Facility (Seattle Public Utilities, 2006)
Lake Youngs
Raw water pump station
UV Disinfection
Ozone Addition
Ozone Contact Pipelines
Chlorine Storage and Feed
Chlorination, pHAdjustment, and
Clearwell Storage
Lake Youngs
Raw water pump station
UV Disinfection
Ozone Addition
Ozone Contact Pipelines
Chlorine Storage and Feed
Chlorination, pHAdjustment, and
Clearwell Storage

Section 3 – Literature Review
21
3.3.3 Peroxone Operations and Control MWDSC has constructed full-scale ozone facilities with capability to add hydrogen peroxide when treating SWP water (Mofidi et al., 2005). Although having approximately 1 billion gallons per day Peroxone treatment capacity installed, MWDSC has not fed hydrogen peroxide (Kostelecky and Syfers, 2006). A challenge with the Peroxone process is related to the operational aspects of feeding hydrogen peroxide. This is a significant research gap that needs evaluation prior to designing full-scale facilities. Key issues surrounding the operation of peroxide storage and feed systems include overcoming air-locking of pumps, deterioration and/or reaction of hydrogen peroxide solution stored over long periods of time, and personnel safety in handling high-concentration hydrogen peroxide solutions. Adequate safety and operating flexibility must be designed into the peroxide system such that any potential equipment/chemical dosing problems can be resolved without over-feeding peroxide and destroying downstream chlorine residual. Like many chemicals already in use at water treatment plants, hydrogen peroxide is a hazardous material and the facilities used to store and feed it will be under jurisdictional review of Alameda County Environmental Health Agency (ACDEHA). Similar to the MWDSC plants, both the ACWD and SCVWD ozone systems were designed to feed peroxide, but neither has fed this chemical on a regular basis. Also, CCWD’s Randall Bold plant was designed to feed peroxide, but this has not been done. In all four cases, the plants’ treatment goals have been achieved with ozone alone, and various problems were experienced with the peroxide storage and feed systems. In the case of CCWD, the tank has been emptied of peroxide and is being converted to storage of an ozone quenching chemical (Parsons, 2007). EBMUD has fed peroxide treatment at the Upper San Leandro Water Treatment Plant during extreme T&O events, but their system is a leased skid-mounted unit from the hydrogen peroxide vendor, and it is removed from the facility when not in use (Kachur, 2007). Although their pilot studies indicated that it was necessary to meet their T&O control objectives, ACWD, SCVWD, MWDSC, and CCWD have not added peroxide with ozone and have no immediate plans to do so. The typical over-under ozone contactors designed for the dual-purpose of disinfection and oxidation have demonstrated that the addition of ozone alone adequately meets the required oxidation goals such that the cost and operational complexity of adding peroxide has not been warranted. Another consideration is that all four agencies have biologically active filtration following the ozone process. It may be that additional removal of T&O compounds occurs through these filters, but data to support this theory is very limited. The EBMUD case is clearly the exception, but only because the installed ozone capacity was not sufficient to oxidize the very high geosmin levels in their source water during a large algae bloom. In this case, geosmin levels were consistently near 100 ng/L, with peaks of over 350 ng/L. It is interesting to note that their pilot studies did not indicate that peroxide would be necessary for T&O control, and peroxide storage and feed equipment was not part of the original design of the ozone system. Fortunately, the capability to feed this chemical to the ozone contactors via a spray system was included. 3.3.4 Treatment-Train Placement The location of ozone in the process train can affect the levels of chlorinated DBPs formed upon subsequent chlorine addition. Figure 3.7 shows results from a bench-scale comparison of pre-ozonation (prior to coagulation) and intermediate-ozonation (between flocculation and sedimentation) of various U.S. drinking waters (Singer et al., 2003). Results showed that

Section 3 – Literature Review
22
subsequent THM and HAA formation was lower following pre-ozonation compared to intermediate ozonation. Either ozonation strategy, when compared to enhanced coagulation alone (without ozone), produced lower THMs and HAAs. These data were generated by holding the chlorinated samples for a 24-hour period at a pH of 8.0. Although the pre-ozonated DBP values were lower, they were not sufficiently low enough to warrant further pursuit.
Figure 3.7 – THM Formation by Chlorination of Untreated (Raw), Intermediate-Ozonated, and Pre-Ozonated (Before Coagulation) Wate (Singer et al., 2003)
3.3.5 Biofiltration In 1989, Glaze reported the production of low molecular weight ozonation by-products (i.e., aldehydes) when ozonating SWP water, many of which are readily biodegradable by naturally-occurring bacteria (Glaze et al., 1989). Subsequently, work has been conducted to study the use of biologically-active filtration (i.e., filtration without chlorine) downstream of ozone to remove this ozone-created biodegradable organic matter (BOM) (Weinberg et al., 1993). Reducing the amount of BOM entering the distribution system may decrease the likelihood of biofilm/bacterial growth. One study indicated that factors which increase the likelihood of bacteria growth in drinking water distribution systems include (1) water temperature >15 oC, (2) chloramine residuals <0.5 mg/L, and (3) AOC >100 μg/L (LeChevallier et al., 1996). This study showed that systems may be susceptible to these conditions whether they used ozone or chlorine as disinfectants. Increased levels of distribution system bacteria that subsist on AOC may be an indication of BOM-caused bio-regrowth (Miettinen et al., 1997). The literature suggests risk factors such as declining residual chloramines and increasing water temperature increase the presence of bacteria and enhance growth of ammonia oxidizing bacteria (AOB). The literature also indicates that optimum conditions to grow AOB include the availability of free ammonia, low chloramine residual and poor system hydrodynamics (i.e., long retention times in water tanks and dead-ends) (Cohen et al., 2001; Wolfe and Lieu, 2002; Wolfe

Section 3 – Literature Review
23
et al., 1990). The major group of AOB have been identified as chemolithotrophs—bacteria that oxidize inorganic compounds and subsequently excrete organic by-products that support growth of heterotrophic bacteria (AWWA, 1995). In nearly all full-scale ozone installations, biofiltration is used after ozonation. It is unclear what implications would arise if biofiltration were not instituted downstream of ozonation. A southern California distribution system experiencing nitrification when fed ozonated and non-biofiltered SWP water throughout warm summer months was found to have elevated BOM and temperature while chloramine residual remained manageable (Mofidi, 2003). Furthermore, several monitoring points and storage tanks showed elevated BOM and temperature while the chloramine level remained stable. If elevated levels of BOM had initiated the degradation of chloramine and been responsible for the nitrification episode, it is expected that this would also have been observed in the tanks or at the distribution system sample locations. Also, BOM leaving the WTP did not degrade (average values remained similar to plant effluent values). This event occurred within one year of the ozone system startup. This nitrification event was hypothesized to take place because of poorly-baffled storage tanks, and not because of the ozonated BOM in the system. However, it was noted that once nitrification began, the presence of increased BOM from ozonation may have caused the bacteria to be difficult to control. Surrogate measurements of BOM used to assess biofiltration performance have included assimilable organic carbon (AOC) and biodegradable dissolved organic carbon (BDOC) (Krasner et al., 1996) which are more generalized parameters and include the specific species of BOM actually removed (e.g., aldehydes, carboxylic acids, and many other low-molecular weight compounds). BOM is a fraction of the total organic carbon (TOC), and has been shown to be well removed by biofiltration. This removal has been seen to range between approximately 5 to 20 percent of the total amount of the TOC when biofiltration was practiced with rapid sand, or dual-media, filtration (Bouwer et al., 1995). This TOC removal can also help reduce the downstream formation of DBPs when chlorine is added. An AwwaRF study assessed biological changes in distribution systems resulting from major changes in disinfection practices (Najm et al., 2000). In four full-scale systems, monitoring was done for 12 months before and 12 months after the changes in disinfection. In one case study, the primary disinfectant was switched from chlorine to ozone, and no biofiltration was used. This groundwater system did experience an increase in measured AOC concentrations after the switch, but there were not corresponding problems with distribution system regrowth in the year following the implementation of ozone. The authors stated that the high free chlorine residuals maintained throughout the system prevented bacteriological problems. They concluded that the bacterial concentrations in the distribution system were more sensitive to the chlorine residuals than to the changes in AOC or BDOC. Biofiltration downstream of ozonation can also provide good removal of T&O compounds. An AwwaRF pilot study in Arizona and Colorado evaluated the removal of MIB and geosmin by sand, sand/anthracite, GAC, and GAC/sand biofiltration (Westerhoff et al., 2005). Empty bed contact time (EBCT) ranged between 2 to 4 minutes in these filters and provided between 6 to 19 percent removals in the sand and anthracite filters while the filters with GAC removed from 25 to 86 percent. It is important to note that the authors indicate that both degradation and adsorption were likely occurring in the GAC-containing filters whereas only bio-degradation was taking place in the non-GAC filters. Biofilters are robust and provide a good buffer for changes in water treatment plant operations prior to water entering finished water reservoirs or the distribution system (Urfer et al., 1997;

Section 3 – Literature Review
24
Huck et al., 2000). If excess hydrogen peroxide is added upstream, demand across biofilters may aid in reducing peroxide residuals so that they do not destroy chlorine and/or chloramine in the clearwell or distribution system. Utilities in Texas and Florida have shown that when biofiltration is operating, stability in distribution system water quality is improved (Vokes, 2007; Marda et al., 2007) and biofiltration has also been shown to work well downstream of dissolved air floatation (DAF) (Wojcicka et al., 2005). There is very limited full-scale experience with ozonation without subsequent biofiltration. Modesto Irrigation District has installed a membrane treatment train in parallel to their conventional treatment train at the Modesto Regional Water Treatment Plant (Modesto Irrigation District, 2004; Hidahl and Henderson, 2007), similar to the expansion of Zone 7’s Patterson Pass WTP. The new membrane train has post-membrane ozone with no subsequent biofiltration. They did this because their existing conventional treatment plant has pre-ozone, but the filters are chlorinated, so there is no biofiltration as part of the existing treatment train, and they do not experience distribution system bacteriological problems. MID has fairly low-TOC raw water from the Tuolumne River and they use free chlorine as the residual disinfectant for the distribution system. Contra Costa Water District uses post-filtration ozone at the Randall Bold WTP; however, this plant also uses settled water ozone, and there is a biofiltration step in between the two ozone application points. A significant concern in converting chlorinated filters to biofilters is a potential release of manganese (Mn) from the filter media. Manganese has a secondary MCL of 0.05 mg/L (50 µg/L), but a target of 20 µg/L is desirable to reduce discoloration at consumer’s homes. Within 2 days of moving the point of chlorination from the influent to the filters effluent to begin biofiltration, MWDSC’s Mills WTP filters released Mn in amounts that exceeded 60 µg/L, peaked over 100 µg/L after 7 days, and then did not drop below 50 µg/L until more than 14 days had passed (Gabelich et al., 2005). The filter media (anthracite/sand/gravel) was discovered to have been ‘seeded’ by several years’ worth of combined addition of chlorine and ferric chloride. The ferric chloride was contaminated with Mn at a level of 0.7 µg for every 1 mg of ferric chloride (e.g., when adding 10 mg/L ferric chloride, 7 µg/L of Mn is added). WTPs using ferric chloride, or with significant raw-water levels of Mn, should evaluate potential Mn that may be oxidized onto the filter media prior to converting to biological filtration. Mn release chemistry is highly complex and is based on several water quality factors such as pH, presence of oxidants, as well as biological factors (Knocke, 1989). Although the cause is not immediately clear, it has been observed that some filters – when switched from operating with chlorine to operating in a biological mode – have significantly decreased time of run. For example, MWDSC’s WTPs treating 100-percent SWP water have experienced approximately 25-percent reduction in filter run time when chlorine was moved from the filter influent to the filters effluent application point. At this point, no resolve has come to this issue, although initial evaluation has indicated that it is not due to breakthrough of filter turbidity or change in the initial filter headloss, but an increasing of the slope of the headloss buildup rate during the filter run. The increased filter headloss accumulation rate could be due to changes in the chemistry or structure of particles entering the filter (i.e., they are not being oxidized by chlorine) or changes in coagulation chemistry (i.e., chlorine is not reacting with coagulant or filter polymers). Similar to the MWDCS plants, CCWD (at the Bollman WTP) and SCVWD (at the Penitencia and Santa Teresa WTPs) have added settled water ozone and allowed the filters to operate in a biological mode. Staff from both Districts have not reported any significant changes in their filter

Section 3 – Literature Review
25
run times when their filters were switched to biofiltration mode, although both note that periodic chlorination of the filters is necessary to control excessive biological growth. No data are available regarding the need for biofiltration downstream of a peroxone process. 3.4 PILOT STUDIES CONDUCTED ON SBA WATER Water from the SBA has been studied extensively by the three agencies using this water source. Over the past nearly 20 years, there have been six formal pilot-scale studies that evaluated ozone among other treatment technologies. Table 3.2 summarizes these pilot studies.
Table 3.2 – Pilot Studies of South Bay Aqueduct Water that Investigated Ozone
Title Date of Testing SBA
Agency South Bay Aqueduct Pilot Plant Studies August to April 1989 ACWD Ozonation By-Product Study October to December 1991 ACWD Water Quality Regulation Compliance Project January 1993 to June 1994 SCVWD Water Treatment Improvement Project – Stage 2 March to September 2000 SCVWD Altamont WTP Phase 1 Pilot Study July to December 2005 Zone 7 Altamont WTP Phase 2 Pilot Study March to September 2007 Zone 7
In all of the studies listed in Table 3.2, ozone was evaluated as the primary disinfectant in lieu of chlorine. All of the SBA ozone systems were designed to achieve at least the necessary 0.5-log Giardia inactivation. Also, in all cases, the ozone systems were not intended for cryptosporidium inactivation. Control of T&O chemicals, while important, was only one of the objectives for evaluating ozone in these studies. This objective is markedly different from the current project at Zone 7 in which ozone is intended primarily for T&O control, and free chlorine would continue to be used as the primary disinfectant with chloramine as the secondary disinfectant. One of the objectives of the current project is to compare a T&O-control-only ozone-based process to the disinfection-and-T&O-control ozone process more typical of delta water agencies. It may be that the former would be significantly less costly to construct and operate, but there may be other issues to consider. The existing pilot studies were reviewed for information regarding the “standard” ozonation parameters. The following paragraphs discuss information and conclusions from each of the pilot studies. 3.4.1 South Bay Aqueduct Pilot Plant Studies (CDM 1989) This 8-month pilot study was conducted from August 1988 to April 1989 and was jointly funded by the three SBA contractors. This study served as the basis for the design of ACWD’s WTP2. The report states that “Ozone was found to be essential if the project’s water quality goals are to be met”. The project goals included meeting the disinfection requirements (0.5-log Giardia and 2-log virus inactivation) and keeping THM levels under 20 µg/L, which was consistent with the regulatory climate at the time, as well as removal of T&O causing compounds. During this

Section 3 – Literature Review
26
period of time, there was much discussion regarding the revised THM standards, and numbers as low as 10 – 25 µg/L were being discussed as potential regulated values. 3.4.1.1 Disinfection Byproduct Formation This study evaluated the impact of ozone and Peroxone on TOC removal. The findings indicated that ozone alone (before coagulation) resulted in some TOC removal. Also, Peroxone resulted in marginally greater TOC reduction than ozone alone (up to 0.3 mg/L difference). With regard to THM formation, Peroxone consistently produced water with higher THM formation compared to ozone alone. These results were based on 2-day THM formation testing with free chlorine – perhaps not relevant for utilities using chloramines. Interestingly, THM formation kinetics were “significantly retarded” by pre-ozonation. The study evaluated formation of other DBPs such as haloacetonitriles (HANs), haloacetic acids (HAAs), and chloropicrin, finding that Peroxone resulted in higher DBP levels than ozone alone. Bromate formation was not evaluated during this study since little was known about it at this time (late 1980’s). 3.4.1.2 Taste and Odor Control With regard to T&O control, geosmin was found to be more readily oxidized than MIB. The first phase of testing involved spiking the water with MIB and geosmin at 100 ng/L. During this phase, an ozone dose of 2.4 mg/L was needed to lower the geosmin levels to under 10 ng/L, and a dose of 3.2 mg/L was needed to reduce the MIB levels to under 10 ng/L. A Peroxone combination of 2.4 mg/L ozone and 0.7 mg/L peroxide was needed for the same level of MIB oxidation (a 25% reduction in ozone dose). During these T&O tests, no attempt was made to meet CT first, the ozone and peroxide were just added for MIB and geosmin oxidation. Phase 2 pilot testing involved spiking at more “normal” geosmin and MIB levels of 30 ng/L. Percent removals of MIB and geosmin were similar to the first phase: 73% and 85% for MIB and geosmin, respectively. During this second phase, however, only an additional 3 to 5% reduction was observed when high-dose ozone was coupled with hydrogen peroxide. Phase 3 was conducted with two different ozone doses (2.0 and 3.6 mg/L) and two contact times (3.6 and 7.2 minutes), while MIB and geosmin were spiked at “normal” levels of approximately 30 ng/L. T&O oxidation rates were very similar regardless of contact time, and they concluded that shorter contact times did not have an adverse impact on effectiveness. Times shorter than 3.6 minutes were not evaluated. Bromide in the raw water was found to significantly impact T&O control performance. When bromide was spiked at 2 mg/L to simulate high-bromide delta water events, geosmin removal fell from 90% to 23%, and MIB removal decreased from 74% to 12%. The addition of peroxide negated this bromide effect – good removals were observed when using Peroxone in spite of high bromide concentrations. This report notes that raw water bromide levels as high as 2 mg/L have been reported in the Delta, based on data from Penitencia between 1982 and 1989. Based on an evaluation of four separate studies, CDM concluded that for a target MIB reduction of 80%, an ozone dose between 2 and 4 mg/L was needed, depending on the water source. The recommended design dose, assuming a 90% transfer efficiency, was 3.5 mg/L. For disinfection, the raw water ozone dose needed to meet the CT requirements was estimated to be 2.5 mg/L, (and a contact time of 8 minutes) although there was wide scatter in the data. Therefore, the final recommendation was to select a dose of 4 mg/L and a contact time of 8

Section 3 – Literature Review
27
minutes. It should be noted that this was the total ozone dose – that needed for disinfection plus that needed for T&O control. 3.4.1.3 Process Location and Method of Ozone Addition The study evaluated various filter media designs as well as the effects of different oxidants on filter performance. Oxidants are thought to alter the nature of the natural organic material and render them more susceptible to removal by subsequent coagulation. Better oxidation was observed when ozone was added to the settled water compared to the raw water, for the same ozone dose. There was significant degradation in filter performance, however, each time the settled water was ozonated (high filter effluent turbidity and short filter runs). Significant improvements in coagulation and filtration were reported when raw water was ozonated. (As further discussed in later sections of this Section, the filtration problems associated with settled water ozonation were resolved, and other agencies have installed and successfully operated settled water ozone systems.) Compared to chlorine, raw water ozone and Peroxone were both found to yield lower filtered water turbidities, lower settled water turbidities, and longer filter runs when using the same coagulant dose. The optimum ozone dose for filtration was found to be 3.2 mg/L, although it was a function of the coagulant dose. The effect was more pronounced at higher coagulant doses. Tests were also done using an Accelerator (an up-flow solids-contact clarification unit). These tests compared ozone to chlorine as preoxidant. Neither had a noticeable effect on the required coagulant dose. However, ozone was found to yield lower settled water turbidities, lower filter effluent turbidities, and longer filter runs compared to chlorine. Filters were operated in a biologically active mode. The importance of a short free-chlorine contact time post filtration was noted in order to control HPC bacteria in the filter effluent. Some testing was done comparing ozone and Peroxone in terms of AOC formation. The results were not consistent, which made it impossible to determine whether one process formed more AOC than the other during the pilot study. Settled water required a lower ozone dose for both T&O control and disinfection. However, settled water ozonation adversely impacted filter performance in this pilot study, perhaps due to non-optimized coagulant dosing. A significant amount of the AOC removal was seen through the coagulation-sedimentation process, not just through the biofiltration process. The study also evaluated the idea of splitting the ozone between the raw water and the settled water. However, it was concluded that this approach did not have a significant advantage over a single point of ozonation. No investigations were done regarding ozone residual quenching chemicals, since the ozone residual decayed so quickly and was not detectable at the end of the contact times studied. 3.4.2 Ozone By-Product Study (CDM 1991) This study was conducted from October to December 1991 on SBA water. It was part of an AwwaRF project entitled “Identification and Occurrence of Ozonation By-Products in Drinking Water”. This study evaluated reduced pH as a bromate control technology, and found it to be highly effective. There was an additional benefit observed: the ozone dose needed to meet the CT requirement in raw water was 4 mg/L at a pH of 8. When the pH was reduced to 6.0, the required ozone dose decreased to 3 mg/L. Figure 3.8 shows the bromate formation under

Section 3 – Literature Review
28
various pH values for a constant level of disinfection (ozone dose varied between 1.6 mg/L and 4 mg/L). This study also evaluated the addition of ammonia ahead of ozonation to reduce bromate formation. The results were mixed. Under some conditions, bromate formation was reduced when ammonia was added, but not in other cases. This was suggested as an area for further investigation.
Figure 3.8 – Impact of pH on Bromate Formation For Equivalent Level of Disinfection (0.5- log Giardia inactivation)
Similar to the previous study, the relationship between raw water bromide levels and ozone’s ability to control T&O compounds was observed in this study. When raw water bromide levels increased, there was a higher ozone dose needed to control T&O compounds. This increase in dose was not seen for Peroxone when raw water bromide levels were increased. This study found that Peroxone resulted in much higher bromate formation than ozone alone. However, due to the manner in which these tests were conducted, these results are not applicable in Zone 7’s case. The study authors increased the ozone dose when using peroxide such that the CT’s were constant for both tests. Therefore, the ozone dose was 8 mg/L when using peroxide, compared to 4 mg/L when using ozone alone. In practice, the CT requirement would be met first with ozone only, and then peroxide would be added, which would result in a much lower overall ozone dose and presumably lower bromate formation. The report contained a cautionary note as follows “It is of interest to note that the ozone dose requirements during the period of this study were higher than those observed over the 10-month
0
5
10
15
20
25
30
pH=6 pH=7 pH=80.0
0.5
1.0
1.5
2.0
2.5
3.0
3.5
4.0
4.5
Br = 0.3 mg/L
Br = 1.0 mg/L
ozone dose for 0.5-log Giardia
MCL = 10 µg/L

Section 3 – Literature Review
29
period of the South Bay Aqueduct pilot plant studies.” This highlights the difficulty in capturing all water quality conditions during a pilot study. 3.4.3 Santa Clara Valley Water District’s Pilot Study in support of the Water Quality
Regulation Compliance Project – Volume 7 – Pilot Study Report (1997) and Subsequent Technical Memorandum regarding Full-Scale Implementation (2000)
This study was conducted by SCVWD and CDM from January 1993 to June 1994. Unlike the study conducted for ACWD, this study’s goals for DBP levels were at the regulatory limits (80 µg/L and 60 µg/L for THMs and HAA5, 10 µg/L for bromate, etc.) not the more typical 80% of the limits. Later on, as part of the final TM on the ozone system (November 2000), the DBP goals were listed as half of the regulatory standards (40/30/5 for THM/HAA5/Bromate). Similar to the ACWD study, the goal for the ozonation system was to meet both the disinfection and T&O control objectives while controlling disinfection byproducts. Ozone was found to be superior to chlorine for pre-oxidation, DBP control, settled water turbidity, coagulant demand, and T&O control. However, filter performance was about the same for both oxidants. Raw water Peroxone was found to have “excellent” T&O control performance at all doses tested, with MIB removals ranging from 93% to 98%, and geosmin removals were all 98% at the doses tested. 3.4.3.1 Disinfection Byproduct Formation Bromate formation was higher when ozonating raw water compared to settled water. This is expected, because the ambient raw water pH was typically around 8, while the settled water pH was generally less than 7 as a result of the coagulant addition. At high (spiked) bromide levels, this difference between raw and settled water bromate formation was more pronounced. When using ozone to meet CT requirements, settled-water bromate levels were <10 µg/L when the bromide level was elevated (spiked at 0.5 to 0.7 mg/L). When additional ozone was applied to this settled water (1 to 2 mg/L more for T&O control) bromate levels were over 10 µg/L and additional bromate mitigation was necessary. Ammonia addition ahead of ozone was found to be effective in controlling bromate, and the plants were initially designed with the ability to add up to 0.5 mg/L ammonia ahead of ozone. This is somewhat contradictory to the earlier ACWD pilot study which indicated that ammonia was not consistently effective in controlling bromate formation. A pre-ammonia dose of 0.5 mg/L was found to be effective in lowering bromate levels, although not sufficiently to meet the MCL of 10 µg/L. For raw water ozonation, bromate levels were less than 18 µg/L, and for the settled water they were less than 10 µg/L even under high ozone dose and high bromide conditions. For the full-scale design of the Penitencia WTP, the capability to add ammonia to the settled water was included for bromate control through most of the design process. The anticipated dose was 0.3 mg/L, with a range of 0.1 to 0.5 mg/L. However, the settled water ammonia addition capability was removed from the design near the end of the process, since pH suppression was thought to be sufficient for bromate control. Under high bromide conditions (up to 0.7 mg/L), and high ozone doses (CT dose +1 mg/L and CT dose + 2 mg/L) it was necessary to lower the pH to 6.0 to keep the bromate levels less than 10 µg/L. This is in contrast to the MWDSC work that found no significant additional benefit in lowering the pH below 6.5. For the SCVWD work, the 6.5 pH bromate results were still above 10 µg/L when the ozone dose was greater than that needed for CT. It was predicted that the

Section 3 – Literature Review
30
District would need a sulfuric acid feed system for times of very high raw water bromide. However as of late 2007, additional pH suppression has not been needed to control bromate formation (see full scale bromate data below). Interestingly, the type of filter media was found to have an impact on bromate levels. The GAC filters consistently produced water with bromate 15 to 30% lower than the anthracite filters. No explanation was given for this difference in media type. Spreading the ozone dose out between multiple cells within the contactor was not consistently effective in lowering the bromate formation. Also, changing the percent ozone in the feed gas was not effective. It was recommended that the ozone addition scheme be further investigated at full scale due to the unique hydrodynamics of each ozone contactor. 3.4.3.2 Taste and Odor Control Raw water ozonation was found to provide better T&O control than settled water ozonation. Because the objective for ozonation was both disinfection and T&O control, these tests were structured such that the disinfection requirements were always met first, and then the amount of additional ozone needed for T&O control was evaluated. For meeting the disinfection requirements, an ozone dose of 3 mg/L was needed for the raw water, and 1.5 mg/L for the settled water. The use of peroxide was evaluated in this study, and it was found to improve T&O control. Peroxide was used in a second ozone application after disinfection already was achieved with ozone alone. The relative contributions of the ozone-alone and Peroxone portions of the contactor were not quantified. Contact times evaluated ranged from 7 to 11 minutes. The testing indicated that between 0.7 and 1.6 mg/L ozone was needed for settled water disinfection, and 0.5 to 1.0 mg/L additional ozone (beyond the CT dose) was needed for T&O control. Therefore, the recommended full-scale plant design criteria included 2.0 mg/L maximum ozone dose in the settled water. Raw water ozone doses to meet 0.5 to 1.5 log Giardia inactivation ranged from 2 to 4 mg/L for raw water, which was consistent with the ACWD testing results. Hydrogen peroxide was added to the fourth cell of the contactor, so that CT could be met in the first three cells. MIB and geosmin were spiked at 100 ng/L. Raw water ozone doses between 1 and 4 mg/L were used, and MIB removal varied from 93% to 98%. Removal rates for MIB in the settled water were not as high, presumably due to the lower pH, which is known to hinder formation of hydroxyl radical. Ozone doses of 2 and 4 mg/L were used, and MIB removal was 56% and 84% for these two doses. Geosmin removal under these conditions was 71% to 92%. Adding peroxide did not affect T&O control in the raw water, since excellent removal of T&O chemicals was achieved with ozone alone at the doses tested (>90%). Ozone to peroxide ratios between 1:1 and 10:1 were tested, but the ratio did not seem to matter – MIB removal was about the same at all ratios tested. For settled-water ozonation, the GAC/sand filter performed better for MIB and geosmin removal compared to the anthracite/sand (15 to 35% better). MIB and geosmin removals through the deep bed GAC filters were better, but this was relatively fresh carbon and there was likely some adsorption of these compounds The overall conclusion of the study was that even at low ozone doses between 2 and 4 mg/L in the raw water, excellent (>90%) T&O removal can been achieved without pH adjustment. However, this was not feasible due to the concern over bromate formation. For settled-water ozonation where the ozone dose required for CT compliance was between 1 and 2 mg/L,

Section 3 – Literature Review
31
peroxide addition may be necessary after the disinfection goal is met in the early stages of the contactor. The full-scale peroxide feed system at SCVWD was designed to add between 0.2 and 1.5 mg/L to the seventh or eighth cell of the full-scale contactor. 3.4.3.3 Process Location and Method of Ozone Addition Both raw water and settled water ozonation were found to produce excellent filter performance. This is inconsistent with the ACWD pilot testing which showed that settled water ozonation led to poor filter performance. The authors noted this discrepancy, and stated that careful control/adjustment of the coagulant dose was critical, and this was not done during the ACWD testing. Also, the filter aid polymer dose is very important when ozonating settled water. This pilot study indicated that a pre-oxidant is needed for optimizing filter production. In order to achieve the disinfection goals, the ozone dose needed for raw water ozonation in this study was double that needed for settled water ozonation. Also, the dose needed was more variable when adding ozone to the raw water. This was mainly due to the variation in raw water pH values, whereas the settled water pH is much more stable. Filtered water ozonation (followed by GAC contactors) was briefly considered at the beginning of this project. It was eliminated from further consideration because “filtered water ozonation did not offer any reductions in ozone dose requirements for CT compliance nor any benefits for bromate control when compared to settled water ozonation.” The study also evaluated the removal of atrazine and 2,4-D with ozone and Peroxone. Ozone was effective, particularly with peroxide addition at higher pH values, but peroxide was necessary to ensure greater than 80% removal at the ozone doses required for disinfection. Similar to other work, ozone was found to greatly increase AOC levels, both raw water and settled water ozonation. Biofiltration was found to reduce these concentrations to similar levels as the raw water. The authors noted the following:
“…the exact impact of higher AOC levels in the District’s distribution system, which is chloraminated, is difficult to forecast. LeChevallier et al (1995) however, found that in a survey of 31 water systems, AOC levels greater than 118 µg/L in free chlorinated systems resulted in higher HPC levels and more positive coliform results than in systems with AOC levels below 82 µg/L. Other research by Van Der Kooij and Hijnen (1985) reported that HPC levels may be limited in waters with AOC levels less than 80 µg/L, while LeChevallier et al. (1990) reported that AOC levels greater than 50 µg/L were associated with increased incidence of coliforms. Note that no regrowth problems have been reported for the distribution system served by ACWD’s WTP No. 2, which consistently has finished water AOC levels above 200 µg/L. (1995 data).”
Both raw and settled water ozonation produced good filter effluent quality and good UFRVs. Turbidity and particles were consistently lower with raw water ozonation compared to settled water ozonation, but both met the project goals. Raw water ozonation was found to increase coagulation requirements (this is not consistent with the ACWD study and full-scale experience), and often resulted in marginally lower TOC removal. Turbidity breakthrough was a particular problem for settled water ozonation, but with careful coagulant control, this was avoided. It was noted that EBMUD, the City of Martinez, and Contra Costa Water District all modified conventional plants to use settled water ozonation, and none of them experienced filtered water

Section 3 – Literature Review
32
turbidity breakthrough problems like those seen in the pilot study. Full scale filter performance at the Penitencia WTP has been good since the ozone system has been on line. The sulfuric acid feed system was designed to lower the pH to 6.0. The acid dose ranged from a minimum of 5 mg/L and a maximum of 30 mg/L (average of 20 mg/L). As part of the project, SCVWD up-sized the caustic feed system in anticipation adjusting for the low pH needed for bromate control (typical pH leaving the plant is approximately 7.8). 3.4.4 Additional Pilot Testing by SCVWD for design of Phase 2 project (CDM, 2000) This testing was intended to follow-up on the previous work, and was conducted from March through September 2000. The overall goals of the follow-up study were slightly different from those of the previous work. The disinfection focus was only Giardia inactivation as it was clear by that time that cryptosporidium inactivation would likely not be required. If it were, UV would be a better choice than expanding the ozone system. Another change was investigating ways to keep bromate below 5 µg/L, instead of the 10 µg/L goal adopted in the previous work. An ozone dose as low as 0.5 mg/L was sufficient to meet the disinfection requirements in most cases. The maximum dose of 2.0 mg/L was confirmed as sufficient to handle T&O concerns when coupled with peroxide addition. Ozone alone at this dose was not capable of reducing T&O chemicals to acceptable levels. The testing found that adding hydrogen peroxide along with a second-stage ozone dose (after meeting CT in the first stage) significantly improved the destruction of these compounds. The required peroxide dose was a function of ozone dose and pH. The calculation of the peroxide dose is as follows: the second-stage ozone dose is multiplied by a number between 1/3 and 1, depending on pH, and then the remaining ozone residual from the first stage is added to this number to determine the peroxide dose. Contact time for these reactions was four minutes or less. This study also evaluated ammonia addition for bromate control. An ammonia dose of 0.5 to 1.0 mg/L to the settled water was confirmed to reduce bromate formation to 5 µg/L or less under disinfection conditions. Under most situations, the pH reduction resulting from the use of ferric chloride for coagulation was sufficient to maintain low bromate formation with intermediate ozonation. However, under high raw water bromide conditions, further pH suppression was needed, and they recommended using sulfuric acid rather than adding more ferric. A target pH of 6.0 was needed to keep bromate below 5 µg/L when raw water bromide levels exceeded 0.6 mg/L. Ammonia addition also helped reduce bromate, in lieu further reducing the pH to 6.0. Even at a pH of 6.8, the addition of ammonia helped maintain bromate below 5 µg/L at an ozone dose of 2.5 mg/L when bromide was as high as 0.5 mg/L. The addition of an ozone quenching chemical at the end of the contactor was found to be necessary when pH was reduced to 6.0 because of the long-lasting ozone residual and the fact that the contact time was limited to only 8 minutes at design flow. The use of peroxide for ozone quenching was investigated, but this was found to be inadequate due to the excessive reaction time and potential for excess peroxide doses to exert a chlorine demand. Therefore, the peroxide system was designed just for advanced oxidation, not ozone residual quenching. Other ozone residual quenching chemicals and their necessary contact times were evaluated, and calcium thiosulfate with a 2-min contact time was identified as the best option. The necessary dose was one to three times the ozone residual (on a weight basis) present at the point of quenching.
Section 3 – Literature Review
33
Hydrogen peroxide dose for advanced oxidation was selected at 0.2 to 0.5 mg/L. The addition of peroxide was found to increase bromate formation, but the results were not consistent. Bromate formation seemed to vary with raw water source and other operational factors. The study authors called the relationship “difficult to assess” and stated that peroxide may increase or decrease bromate formation. 3.4.5 Zone 7 Altamont Design Pilot Studies Pilot testing was done as part of the process selection for the Altamont Water Treatment Plant. Testing was conducted between July and December 2005. However, ozone testing was limited because the primary focus of the pilot study was on the performance of the membranes. The authors concluded that post-membrane ozone application effectively oxidized geosmin and MIB. At ozone dosages required to meet disinfection requirements (0.5-log Giardia inactivation), MIB destruction was about 50 percent, whereas higher ozone dosages were required for higher destruction levels. Bromate formation was effectively controlled by lowering the pH of the feed water to the ozone system to less than 7.0. The pilot plant demonstrated 49% to 83% destruction of MIB while applying ozone-only to the filter effluent at disinfection-level doses (0.6 to 1.3 mg/L) with the highest doses resulting in the highest removal percentages. The pilot plant was not spiked with MIB, it was naturally-occurring in the raw water during part of the study. No peroxide testing was done. This study include one day of bromate mitigation testing (December 20, 2005). Three pH values were tested, ranging from ambient (7.7) to 6.4. When the pH was lowered to 7.1, the bromate formed was reduced to less than 5 µg/L. No additional ozone doses were tested other than that needed for CT compliance (1.0 – 1.1 mg/L). The raw water was not spiked with bromide, and the ambient bromide level on the day of testing was not reported in the study. However, according to ACWD’s historical records, the SBA bromide level at that time was approximately 0.4 mg/L. This study recommended installation of post-ozone GAC contactors in order to reduce the concentrations of biodegradable organic matter produced by the ozonation process. Two individual AOC samples were collected from the ozone contactor effluent at the pilot plant. These values were reported to be 170 and 120 µg/L. Two additional AOC samples were collected from the effluent of the biologically active GAC contactors, and these samples contained 100 µg/L and 110 µg/L of AOC. The AOC level in the effluent from the Patterson Plant was reported to be <10 µg/L, however this sample result is suspect. As described above for the work at ACWD and SCVWD, typical treated water AOC levels are generally between 100 and 200 µg/L. As shown in Table 2, an additional phase of pilot testing for the Altamont WTP was done between March and September of 2007. As with the first phase, the primary focus was on the performance of the membrane system, and ozone testing was limited. A final report is not yet available for this second phase pilot test. 3.4.6 Other Studies and Ozone Plants An AwwaRF tailored-collaboration project called “Advanced Water Treatment of Estuarine Water Supplies” included a pilot study at one of SCVWD’s facilities in Los Gatos using SBA
Section 3 – Literature Review
34
water during a 7-month period from September 2005 to March of 2006 (Briggs et al., 2007). The study focused on various disinfectant combinations, including ozone, and their ability to limit formation of byproducts. The study was not focused on T&O control, however, and very little T&O data were collected. Chlorine dioxide was used ahead of ozone, and was found to greatly limit, and in some cases completely prevent, the formation of bromate, even under high raw water bromide concentrations (up to 0.8 mg/L). After the 1989 SBA pilot plant study was completed, Zone 7 commissioned a follow-up study by CDM in 1991 called “Ozone Feasibility Study” which was meant to evaluate the requirements and costs for installing ozone at the Del Valle and Patterson water treatment plants. No further pilot testing was done. The expected costs were found to be 7.7 to 13 million dollars for Del Valle, and 6.6 to 8.6 million dollars for Patterson (1991 dollars). An ozone dose of 4 mg/L and a contact time of 8 minutes was recommended for both plants. Raw water ozonation was recommended for both plants. They anticipated that hydraulic losses in piping and contactors would exceed available head, so intermediate low-lift pumping would be needed at both plants. This study indicated that the available head at both plants upstream of the flash mix was about six feet, and that the ozone contactor would take about eight feet. Several surface water treatment plants in the Bay Area have added ozone to the settled water of existing conventional plants without intermediate pumping. These include East Bay Municipal Utility District’s Upper San Leandro WTP and Sobrante WTP, Contra Costa Water District’s Bollman WTP, and Santa Clara Valley Water District’s Penitencia and Santa Teresa Water Treatment Plants. In the basis-of-design report for the SCVWD ozone project (CDM, 2000), which includes the calculated hydraulic profiles through the plants, the headloss through CCWD’s Bollman contactor is referenced as 0.5 feet, and no intermediate pumping was required. The headloss across the 8-cell contactor at Penitencia is 0.9 feet, while that at Santa Teresa’s contactor is 0.6 feet. These values are just through the contactors, they do not include yard piping, since the units are adjacent to each other. The DAF unit recently installed at the Del Valle WTP was designed to accommodate intermediate ozone without additional pumping. The Altamont WTP is designed for intermediate (post-membrane) pumping. 3.5 FULL SCALE EXPERIENCE WITH OZONATION OF SBA AND DELTA WATERS There are two surface water treatment plants currently using ozone to treat water from the South Bay Aqueduct, and two additional plants are in the design stage. Information regarding these plants is summarized in Table 3.3.

Section 3 – Literature Review
35
Table 3.3 - Treatment Plants using Ozone for South Bay Aqueduct Water
Utility and Facility Names
Ozone Addition Point
Ozone On-Line
Year
Plant capacity,
mgd
Design Ozone Dose
(mg/L)
Design Ozone
Contact Time (min)
Zone 7, Altamont Post-membrane,
pre-GAC ~2010 24
1.2 average 2.0 maximum
10
ACWD – WTP2 Raw water 1993 28 4.0 13
SCVWD, Penitencia Settled water 2006 42 1.5 (for CT)
2.0 (for T&O) 8
SCVWD, Rinconada Settled water ~2013 80
(100 future)1.5 (for CT)
2.0 ( forT&O) 8
ACWD has been operating their raw-water ozonation facility since 1993. District staff report excellent control of T&O-causing compounds by this plant (Chun, 2007). Since the installation of a carbon dioxide (CO2) feed system in early 2002, the plant has consistently been able to comply with the bromate MCL. Figure 3.9 includes the instantaneous bromate measurements taken from the plant effluent approximately every week since the plant came on line. Note that these individual data points are not compliance samples – compliance with the MCL is calculated as a rolling annual average, and is based on a single monthly sample. These data demonstrate that compliance with the bromate MCL can be achieved when using raw water ozonation on SBA water if a control technology such as pH suppression is used.
Figure 3.9 – Measured Plant Effluent Bromate from Water Treatment Plant No. 2 (note that MCL is based on Rolling Annual Average)

Section 3 – Literature Review
36
Since the carbon dioxide feed system was placed into service, the average ozone dose required for disinfection compliance has decreased. This was expected due to the greater persistence of the ozone residual at the lower pH values. However at times, the ozone dose required was higher than the design dose (this is possible by reducing the plant flow rate). Higher ozone doses have been used to control T&O events and resolve filter clogging problems caused by algal blooms in the source water. Table 3.4 includes the average, 99th percentile, and maximum recorded ozone doses for the past five full calendar years.
Table 3.4 – Ozone Dose data for Water Treatment Plant No. 2, in mg/L
Calendar year Average dose 99th percentile dose Maximum dose 2002 1.63 2.60 2.93 2003 1.86 3.40 3.58 2004 2.21 4.31 5.22 2005 2.25 6.21 7.50 2006 2.21 2.79 4.21
There are limited data regarding AOC formation from WTP2. During the spring and summer of 1995 some sampling was done and the results are shown in Figure 3.10. These data indicate that the ozonation process increased AOC levels significantly compared to the raw water levels, but that the filter effluent AOC levels were reduced to near those of the raw water. ACWD reports that they do not experience bacteriological regrowth problems in the areas of the distribution system supplied by WTP2 even though the measured AOC levels were much higher than that suggested in the literature as being associated with this type of problem (>50 to 100 µg/L). It is significant that ACWD’s distribution system generally has relatively short detention times compared to Zone 7, and that their tanks and reservoirs are turned over regularly, and they have a rigorous distribution system flushing and tank cleaning program. Also, they have an extensive nitrification monitoring and response program. These factors all contribute to the low incidence of nitrification and regrowth problems for ACWD.

Section 3 – Literature Review
37
Figure 3.10 – Measured AOC from ACWD Water Treatment Plant No. 2 SCVWD’s Penitencia plant began adding ozone to the settled water in early 2006. District staff report no T&O problems in the area served by this plant since the ozone system has been on line. Figure 3.11 includes the bromate data from the effluent of the Penitencia plant since the startup of the ozone system. Similar to the data in Figure 3.9, these are individual sample results collected each week, and not rolling annual averages based on monthly data. These data indicate that compliance with the bromate MCL can be achieved when ozonating settled water from the SBA. During the time shown on this graph, raw water bromide levels varied between 0.06 mg/L and 0.48 mg/L. It is noted that the single high value reported in October, 2006 was the result of testing the hydrogen peroxide feed system and an associated, very high, ozone dose. Similarly, the high result reported in August 2007 was also related to an incident with the hydrogen peroxide feed system. Also note that no sulfuric acid has yet been used, nor has ammonia been fed to the settled water for bromate control. The pH reduction resulting from the addition of alum (the plant’s primary coagulant) has been sufficient to maintain bromate levels at less than the standard. The pilot work on which this system was based was all done using ferric chloride instead of alum as the primary coagulant; SCVWD has no immediate plans to switch the full-scale plants from alum to ferric.

Section 3 – Literature Review
38
Figure 3.11 – Measured Plant Effluent Bromate from Penitencia WTP (note that MCL is based on Rolling Annual Average)
For the Penitencia system, the average ozone dose during the second half of 2006 was 1.0 mg/L, with a maximum of 1.7 mg/L. For January through October of 2007, the average has been 0.8 mg/L, with a maximum of 1.5 mg/L. The 0.5-log Giardia inactivation requirements are met with ozone whenever the ozone system is on line. Consistent with the pilot plant studies, SCVWD staff reported that careful control of the filter aid polymer system is very important for full scale settled water ozonation in order to avoid turbidity breakthrough problems. SCVWD is currently using a non-ionic polyacrylamide (Polydyne N120P) as a filter aid, and report good success with this chemical when fed as a filter aid at the Penitencia WTP. When the ozone system is off line, this filter aid is not as important for good filter effluent quality. Both the ACWD plant and the SCVWD plant were designed to use ozone in two separate areas within the ozone contactors. The first few cells were intended for disinfection, while the downstream cells were intended for advanced oxidation via the addition of hydrogen peroxide. It is interesting to note that, although both plants received deliveries of hydrogen peroxide into their tanks and tested the storage and feed facilities, neither has used peroxide to control taste and odor events. Both agencies report adequate control of T&O compounds when using ozone to meet their disinfection or pre-oxidation requirements. This is similar to the experience of CCWD at the Randall Bold WTP, were peroxide was added but later removed from the tank. Finally, Table 3.5 provides a summary of several other full-scale WTPs in the Bay area using ozone to treat water originating from various locations within the Delta system. There are some significant differences in raw water quality among these various plants due to the locations at which water is drawn from the Delta and the influence of local storage reservoirs.
0
5
10
15
20
25
30
MCL = 10 µg/L
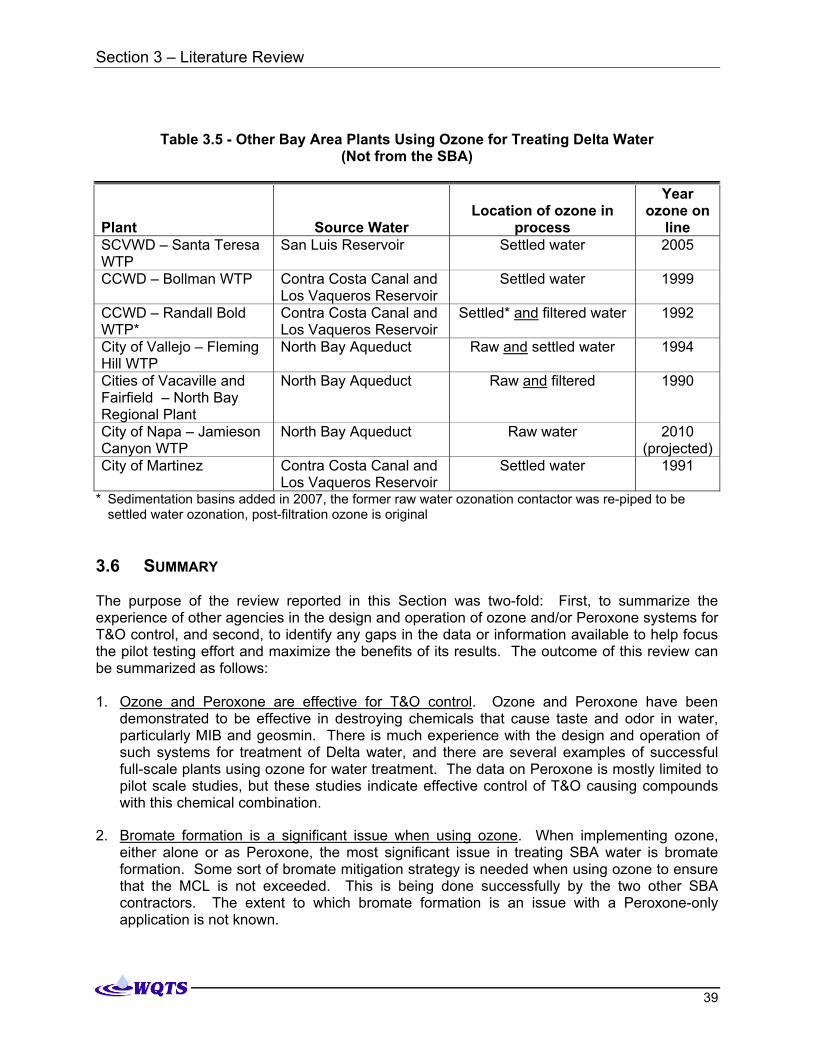
Section 3 – Literature Review
39
Table 3.5 - Other Bay Area Plants Using Ozone for Treating Delta Water (Not from the SBA)
Plant Source Water Location of ozone in
process
Year ozone on
line SCVWD – Santa Teresa WTP
San Luis Reservoir Settled water 2005
CCWD – Bollman WTP Contra Costa Canal and Los Vaqueros Reservoir
Settled water 1999
CCWD – Randall Bold WTP*
Contra Costa Canal and Los Vaqueros Reservoir
Settled* and filtered water 1992
City of Vallejo – Fleming Hill WTP
North Bay Aqueduct Raw and settled water 1994
Cities of Vacaville and Fairfield – North Bay Regional Plant
North Bay Aqueduct Raw and filtered 1990
City of Napa – Jamieson Canyon WTP
North Bay Aqueduct Raw water 2010 (projected)
City of Martinez Contra Costa Canal and Los Vaqueros Reservoir
Settled water 1991
* Sedimentation basins added in 2007, the former raw water ozonation contactor was re-piped to be settled water ozonation, post-filtration ozone is original
3.6 SUMMARY The purpose of the review reported in this Section was two-fold: First, to summarize the experience of other agencies in the design and operation of ozone and/or Peroxone systems for T&O control, and second, to identify any gaps in the data or information available to help focus the pilot testing effort and maximize the benefits of its results. The outcome of this review can be summarized as follows: 1. Ozone and Peroxone are effective for T&O control. Ozone and Peroxone have been
demonstrated to be effective in destroying chemicals that cause taste and odor in water, particularly MIB and geosmin. There is much experience with the design and operation of such systems for treatment of Delta water, and there are several examples of successful full-scale plants using ozone for water treatment. The data on Peroxone is mostly limited to pilot scale studies, but these studies indicate effective control of T&O causing compounds with this chemical combination.
2. Bromate formation is a significant issue when using ozone. When implementing ozone, either alone or as Peroxone, the most significant issue in treating SBA water is bromate formation. Some sort of bromate mitigation strategy is needed when using ozone to ensure that the MCL is not exceeded. This is being done successfully by the two other SBA contractors. The extent to which bromate formation is an issue with a Peroxone-only application is not known.

Section 3 – Literature Review
40
3. Ozone is used primarily for disinfection; data on T&O-only (peroxone) applications is lacking. All of the ozone plants reviewed use ozone primarily for disinfection of Giardia and viruses and secondarily for the control of T&O chemicals. Most plants also realize other operational benefits such as improvements in the conventional treatment process and oxidation of other micro-pollutants. There are no examples of T&O-only ozone installations for treatment of Delta water, nor any examples of intermittent ozone use.
4. The best location for ozone in the process is not apparent. Regarding placement of the ozone process, the reviewed literature does not indicate whether water quality factors favor one location over another. Moving the ozone addition from the raw water to a more intermittent location has been shown to form similar levels of downstream chlorinated DBPs, but has not been shown to have a significant effect on the coagulation process or on filtered water quality. Ozone doses for similar levels of disinfection are lower in settled water, but T&O control performance is poorer at this location compared to raw water.
5. The ideal contactor design and peroxone addition scheme are not apparent. Contactor designs vary depending on whether or not disinfection credit is required. If disinfection is not necessary, hydrogen peroxide may be added simultaneously with ozone to generate OH• (destroying ozone residual) for oxidation of T&O causing compounds. A 0.2 Peroxone ratio (hydrogen peroxide:ozone dose) has been shown to provide effective treatment of T&O compounds in Delta water with an ozone dose of about 3 mg/L. Peroxone designs may include single-cell concrete structures or in-pipe injection followed by pipeline contact to minimize construction cost of building large concrete contact basins. If pipe-injection is used, utilities have installed off-gas structures downstream with capability to destroy ozone off-gas. The effects of an intermittent, Peroxone-only system on bromate formation and on downstream treatment processes are not known.
6. Several full-scale peroxide applications have been built but subsequently removed from service. It is telling that all of the agencies that have designed and built hydrogen peroxide storage and feed systems to be used in conjunction with ozone for treatment of Delta water, are not using these systems. Ozone alone, when used to meet the disinfection requirements, has been adequate for controlling T&O chemicals that have been present in water entering these full-scale facilities. Furthermore, all of these systems use biofiltration downstream of the ozone contactors, and it is not known if ozone-only—or a combination of ozone and biofiltration—has been responsible for the control of T&O compounds at these facilities. A developing problem with the use of biofiltration that is very plant-specific is the issue of reduced filter run time when chlorine is discontinued ahead of filters. This issue is an area needing additional research.
7. Post-ozone biofiltration may or may not be required. If Peroxone is operated intermittently throughout the year, biofiltration may not be necessary to reduce BOM prior to entering the distribution system. If Peroxone is used continuously, then biofiltration may be needed, but this also is not clear. Based on the review reported herein, it is possible to prevent biological growth in the distribution system without biofiltration by maintaining an adequate disinfectant residual in the distribution system. However, when water is passed to other water wholesalers or retailers, it is unknown how those secondary systems will be affected. In these downstream systems, increased BOM may have detrimental effects. Biofiltration can also be an aid in controlling hydrogen peroxide residual, if there is excess following the Peroxone process.

Section 3 – Literature Review
41
8. Many pilot studies using ozone have been performed on SBA water. These tests show that CT can be effectively achieved while DBPs are kept below their regulated MCLs. However, the results show that Peroxone may increase THM/HAA levels when compared to ozone alone. Bromate can be controlled by a variety of methods. However, it is likely that the Peroxone process will be less effective at T&O control if acid is used to control bromate (assuming that bromate is an issue with peroxone, which is not known at this point). This is because reduced pH retards the formation of OH•, the driving force in Peroxone’s T&O destruction capabilities. Both ammonia-alone and the chlorine-ammonia process have the potential to control bromate when ozonating SBA water. However, their impact on T&O destruction with ozone or Peroxone are not known.
Based on the analysis presented in this Section, the following gaps were identified in the available information when it comes to the application of ozone or Peroxone for Zone 7’s Taste and Odor Control installations: A. While there is ample information on the design and performance of conventional ozone
systems, there is no information on the operation and performance of a Peroxone-only system for surface water treatment.
B. There is little understanding of whether disinfection credit could still be achieved with a Peroxone process since earlier work focused on meeting the disinfection goals upstream of the addition of hydrogen peroxide.
C. There is limited information on the levels of biodegradable organic matter formed with Peroxone alone, and whether these levels would necessitate biological filtration.
D. Data on the formation of bromate with a Peroxone process are inconclusive. In addition, the bromate mitigation strategies of pH depression or pre-chloramination have all been tested on ozone only, and not on a Peroxone process.
E. While T&O destruction with Peroxone is well documented, it is not clear whether the performance of the Peroxone process for T&O control would greatly diminish when coupled with a bromate mitigation strategy.
The information identified above is important for the decision on the design and operation of the Peroxone systems that may be implemented at Del Valle and Patterson Pass WTPs. The pilot testing plan was designed to fill in some, if not all, of these gaps.

Section 3 – Literature Review
42
THIS PAGE INTENTIONALLY LEFT BLANK