Embed Size (px)
Citation preview
NASA Contractor Report 195685
Final Report on the Evaluation of ASOS for theKennedy Space Center's Shuttle Landing Facility
Prepared By:Applied Meteorology Unit
Prepared for:Kennedy Space CenterUnder Contract NAS 10-11844
NASANational Aeronautics and
Space Administration
Office of Management
Scientific and Technical
Information Program
1994
https://ntrs.nasa.gov/search.jsp?R=19940020789 2019-02-26T16:17:36+00:00Z
Attributes and Acknowledgments:
NASA/KSC POC:
Dr. Frank Merccret/TM-LLP-2A
Applied Meteorology Unit (AMU):
Ann Yersavich, primary authorMark Wheeler
Greg TaylorRobin SchumannJohn Manobianco
ii
Table of Contents
List of Figures ..................................................................................................................... v
List of Tables ..................................................................................................................... vi
1.0 Introduction ................................................................................................................ 1
1.1 Purpose of the Report ........................................................................................ 1
1.2 Organization of the Report ................................................................................ 1
1.3 ASOS Description ............................................................................................. 1
1.3.1 Background of ASOS .................................................................................. 1
1.3.2 System Architecture .................................................................................... 5
1.3.3 Data Dissemination ..................................................................................... 6
1.3.4 System Specifications ................................................................................. 7
2.0 ASOS Evaluations .................................................................................................... 11
2.1 Comparison of ASOS Observations to Manual Observations ........................ 11
2.1.1 Sites Evaluation Characteristics ................................................................ 11
2.1.2 Evaluation of Meteorological Variables ................................................... 14
2.1.2.1 Sky Cover ......................................................................................... 15
2.1.2.2 Visibility ........................................................................................... 19
2.1.2.3 Pr_ipitation Accumulation and Identification ................................ 22
2.1.2.4 Temperature ..................................................................................... 25
2.1.2.5 Wind ................................................................................................. 27
2.1.2.6 Pressure ....... ,... ................................................................................ 28
2.2 Reliability and Maintainability ....................................................................... 29
2.2.1 Comparison SitesReliability and Maintainability .................................... 31
2.3 System Status .................................................................................................. 34
2.4 Plans for 1994 ................................................................................................. 34
Requirements Analysis ............................................................................................ 363.0
t..
111
Table of Contents
(continued)
3.1 Unsatisfied Requirement Remedies ................................................................ 36
4.0 Meteorological Sensors in the St. Johns River Valley ............................................. 42
5.0 Proposed Concepts of Operations for ASOS at the SLF ......................................... 44
5.1 Recommended ASOS Configuration for use at SLF ...................................... 44
5.2 Proposed Concept of Operations #I ................................................................ 45
5.3 Proposed Concept of Operations #2 ................................................................ 49
6.0 Summary and Conclusion ........................................................................................ 54
6.1 Summary ......................................................................................................... 54
6.2 Conclusion ...................................................................................................... 54
7.0 References ................................................................................................................ 56
iv
Figure 1.1.
Figure 1.2.
Figure 1.3.
Figure 4.1.
List of Figures
ASOS Combined Sensor Group Configuration ....................................... 3
ASOS Touchdown Sensor Group Configuration ..................................... 4
ASOS Data CoLlection and Processing Diagram ..................................... 6
Map of Local Tower Network and Suggested Locations forAdditional Sensors Identified with Large, Bold Numbers ..................... 43
Table 1.1.
Table 1.2.
Table 2.I.
Table 2.2.
Table 2.3.
Table 2.4.
Table 2.5.
Table 2.6.
Table 2.7.
Table 2.8.
Table 2.9.
Table 2.10.
Table 3.I.
Table 3.2.
Table 3.3.
Table 5.1.
Table 5.2.
List of Tables
ASOS Specifications elated to Current SLF and TAL SiteSystem Specifications* .................................................................................. 8
Characteristics of ASOS Algorithms ........................................................... 10
ASOS Comparison MARl) Sitesand AvailableDataInformalion...................................................................................................12
Additional ASOS Evaluation Sites .............................................................. 13
Distribution of Sky Condition Remarks for Multiple and SingleSensor Systems ............................................................................................ 17
MARl) Sites Ceiling Scatter Diagram ......................................................... 19
Criteria Used by the NWS Southern Region for VisibilityComparisons of ASOS and Manual Observations ....................................... 20
Distribution of Visibility Remarks for Multiple and SingleSensor Systems ...................................................................................... . ..... 22
ASOS National and FL Level of Reliability for 30.3 Weeks ofData .............................................................................................................. 30
Current ASOS National and Southern Workload as of June 10,1993 .............................................................................................................. 31
Sterling Research & Development Center System Reliability .................... 33
NWS Maintenance Policy of Maximum Outage Times .............................. 33
Relationship of ASOS and Manual Observing Capabilities ToAirfield Operations Surface Observation Requirements ............................. 37
Relationship of ASOS and Manual Observing Capabilities ToShuttle Operations & Simulations Surface ObservationRequirements ............................................................................................... 38
Relationship of ASOS and Manual Observing Capabilities ToSpaceflight Meteorology Group & Flight Director's SurfaceObservation Requirements ........................................................................... 39
Observation Requirements Now Partially Satisfied or Satisfiedby the Recommended ASOS Configuration ................................................ 46
Observation Requirements that Remain Unsatisfied with theRecommended ASOS Configuration ........................................................... 47
vi
1.0 Introduction
1.1 Purpose of the Report
This report documents the Applied Meteorology Unit's (AMU) evaluation of the
effectiveness and utility of the Automated Surface Observinl_ System (ASOS) interms of spaceflight operations and user requirements. In pamcular, the evaluationdetermines which of the Shuttle Landing Facility (SLF) observation requirements canbe satisfied by ASOS. This report also includes a summary of ASOS' background,current configuration and specifications, system performance, and the possibleconcepts of operations for use of ASOS at the SLF. This evaluation stems from adesire by the Air Force to determine ffASOS units could be used to reduce the cost ofSLF meteorological observations.
1.2 Organization of the Report
The information is presented in six major sections. Section 1, Introduction,describes the ASOS program and its published capabilities. Section 2, ASOSEvaluations, describes and summarizes various evaluations comparing ASOSobservations to manual observations. Section 3, Requirements Analysis, comparesASOS capabilities with spaceflight operations observation requirements. Section 4,Meteorological Sensors in the St. Johns River Valley, discusses the use of themeteorological sensors along the St. Johns River Valley to help improve the fogforecasting skill and supply additional data. Section 5, Proposed Concepts ofOperations for ASOS at the SLF, describes the optimum ASOS configuration for theSLF along with the proposed concepts of operations for ASOS at the SLF. Finally,Section 6, Summary and Conclusion, summarizes the ASOS overall performance,relates it to spaceflight operations and user requirements, and ends with a finalconclusion.
1.3 ASOS Description
This section describes ASOS and its operation including background,instrumentation, system architecture, and data dissemination. In addition, ASOSsystem specifications are noted and compared to the SLF and Transoceanic AbortLanding (TAL) site observational system specifications. This provides the readerwith information on the capabilities of ASOS relative to other observational systemsused by NASA.
1.3.1 Background of ASOS
ASOS, developed by AAI Corporation, is an integral part of the National WeatherService Modernization and Restructm'ing Program. The ASOS program is a jointeffort between the NWS, the Federal Aviation Administration (FAA), and theDepartment of Defense (DOE)). Starting in late summer 1991 and extending through1996, up to 1700 ASOS systems "will be installed across the United States, manyreplacing current part-time and fun-time manual observing sites. As of August 2,1993, there were 311 ASOS units installed. Of these, 22 were commissioned (whichmeans ASOS has assumed the official observing role).
There have been a number of automated weather systems designed and procuredby the federal government in the past that have successfully demonstrated the
automation of temperature, dew point, wind and pressure observations. Researchprojects and studies on the feasibility of automating the observation process date backto the 1960's. The feasibility of automating the more subjective, spatially observedelements such as sky condition and visibility was first demonstrated during the jointFAA-NWS AViation Automated Weather Observing System (AV-WOS) experimentsin the mid 1970's. "It was not until 1981 when the Joint Automated Weather
Observing System (JAWOS) study concluded that the sensor and computertechnology was mature enough to go forward with automation at airports" (Sessa
1993). Additional development and testing of present weather sensors by the NWSproved that rain, snow, and freezing ram could also be successfully detected,discriminated, and reported by an automated system. These advances in surfaceobserving technology are now incorporated in the ASOS under the lead of the NWS0NOAA 1992).
ASOS consists of several meteorological instruments spread out along a single 40foot long framework. Once each minute, ASOS updates the observation of all basicweather elements (sky conditions, visibility and obstructions to vision, sea-level
pressure, temperature, dew point, wind, altimeter setting) and selected automatedremarks. It also accepts manually entered remarks such as variable visibility andtower visibility. Each hour, ASOS automatically generates information in the codedSurface Aviation Observation (SAO) form. In addition, ASOS automatically issues aspecial report in SAO form whenever a parameter violates one of the special criteriathresholds.
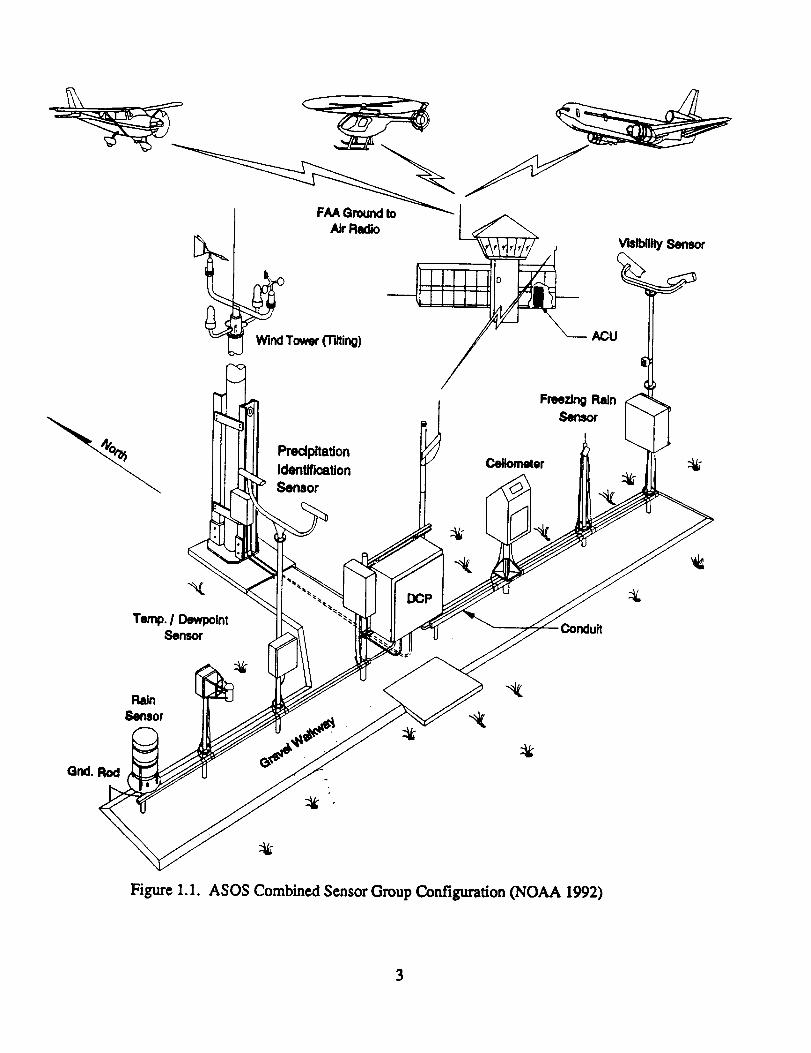
The ASOS User's Guide (NOAA 1992) defines the standard ASOS configuration,the Combined Sensor group, which is illustrated in Figure 1.1. The Combined Sensorgroup consists of the following sensors: ceilometer (cloud height indicator), visibilitysensor, precipitation identification sensor, freezing rain (ZR) sensor (not includedwhere ZR potential is nil), three pressure sensors, ambient temperature/dew pointtemperature sensor, anemometer (wind direction and speed) sensor, and precipitationaccumulation sensor. This group is typically located near the Touchdown Zone of therunway and on occasion at a center field location. At large airports or where the
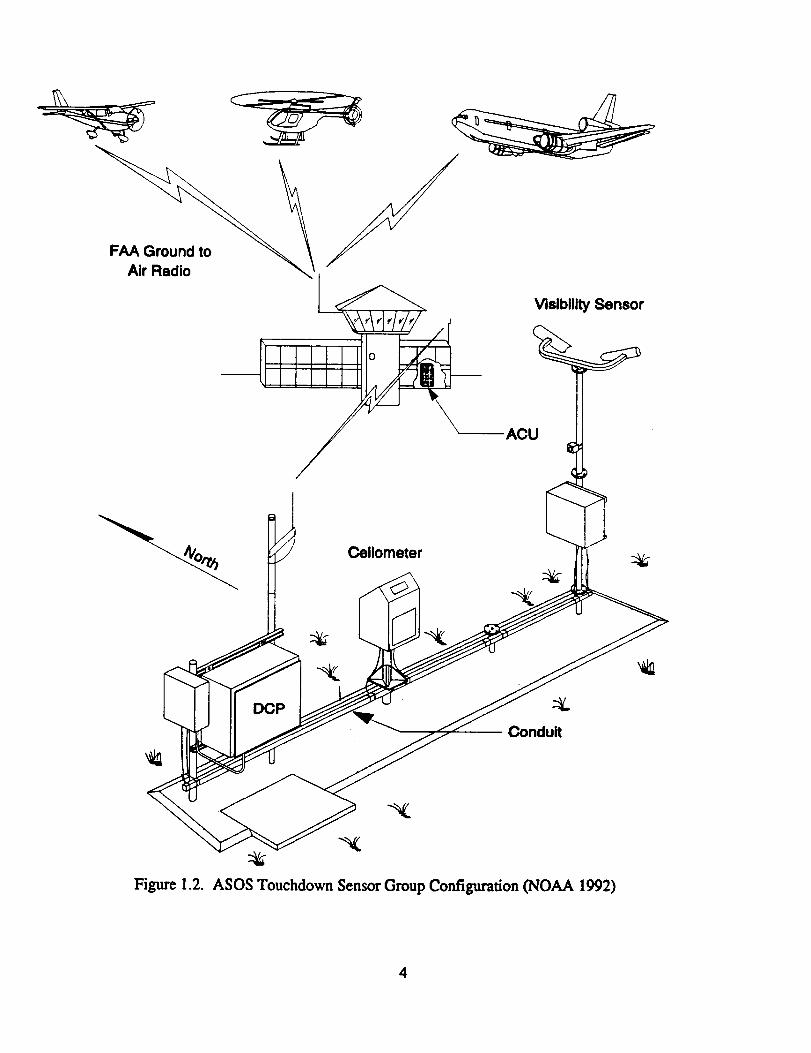
operational need is justified, an additional sensor array may be located at a secondaryTouchdown Zone. The ASOS User's Guide refers to this array as the ASOSTouchdown Sensor group. This sensor array, illustrated in Figure 1.2, consists of aceilomcter and visibility sensor. Site surveys are conducted at each site to determinethe best location(s) for siting the ASOS sensors.
Additional sensors or sensor groups may be added as part of the ASOS setup tofunction in either a backup or discontinuity role. In the backup role, the additional
data are used if the primary sensor fails. Discontinuity sensors are employed wheregeographical or meteorological factors cause significantly different conditions toperszst at two or more locations at an airfield and are installed in these areas ofinterest. When non-prevailing conditions are detected, the ASOS will alert users byautomatically generating remarks which describe the situation (e.g. visibility and/orceiling lower with the appropriate compass direction) and which will be included inthe special SAO report0NOAA 1992).
The ASOS was designed and tested to operate in the most extreme environmentalconditions. For example, some of the tested extremes include temperatures from-80"F to 140"F, desert conditions with high levels of dust to coastal conditions withsalt fogs and sprays, and 120 knot winds with three inches of ice (Sessa 1993). Aproven example of system performance in a severe weather event involves the ASOSunit in Concordia, Kansas. This unit survived a severe gust front with peak gusts to
2
Air Radio Vislbilily Sensor
Tower (Tilting) ACU
r_
Freezing Rain
_, Sensor
Predpitation
Identiflc_tion
Sensor
Ceilometer :_-
Temp. I DewpolntSensor
Gnd. Rod
Figure 1.1. ASOS CombinedSensorGroupConfiguration(NOAA 1992)
FAA Ground to
Air Radio
Vislblllly Sensor
--ACU
Cellometer
DCP
Conduit
Figure 1.2. Agog Touchdown Sensor Group Configuration(NOAA 1992)
4
I I0 mph. Itwas able to continue recording and disseminating minute by minute
reports and operate normally throughout the event, switching onto its internal backuppower when facility power was lost. The Uninterruptable Power Supply (UPS)battery kept it operating and retaining accurate readings for an hour and 20 minutes.The only damage sustained was attributed to flying debris (NWS Central Region1992).
1.3.2 System Architecture
The ASOS isdividedintotwo parts.The outdoor portionconsistsof one or more
sensorsuitesand Data CollectionPackages (DCP). The indoor portionconsistsof a
centralAcquisitionControlUnit (ACU) and a seriesof displaysystems.
The DCP consistsof computer, communications and power subsystems. The
computer subsystem containsa primary CPU and a backup CPU which monitors the
operation of the primary and takes over in the event of a failure. The unit alsocontains a number of communication boards and Built-lnTest Equipment which
continuously monitors the statusof the DCP and sensors. The power subsystem
consistsof theDCP's own internalpower supply (each has a built-inbackup unit),the
UPS (which provides backup facilitypower to the DCP and sensors),and power
monitor, control,and conditioning circuitsfor each sensor. The communications
subsystem alsohas a backup for itsprimary radio telemetrymodule. Each DCP has
the abilityto accommodate up to 16 sensors so the system's capabilitiescan be
expanded as needed.
The ACU isthe centraldata processing/disseminationcomponent of ASOS. It
consistsof a computer, an UPS, a communications subsystem, and the local DCP.
The localDCP allows the threepressure sensors and three additionalsensors to be
directlyconnected to the ACU. The computer collectsdata from allof the sensorsand other weather systems, processes the data in accordance with NWS and FAA
approved algorithms,and formats and distributesthe informationto users. The UPS
isidenticalto the unitinthe DCP and provides backup in the event of lossof facility
power. The ACU alsocontainsfullredundant internalpower supplies(Sessa 1993).
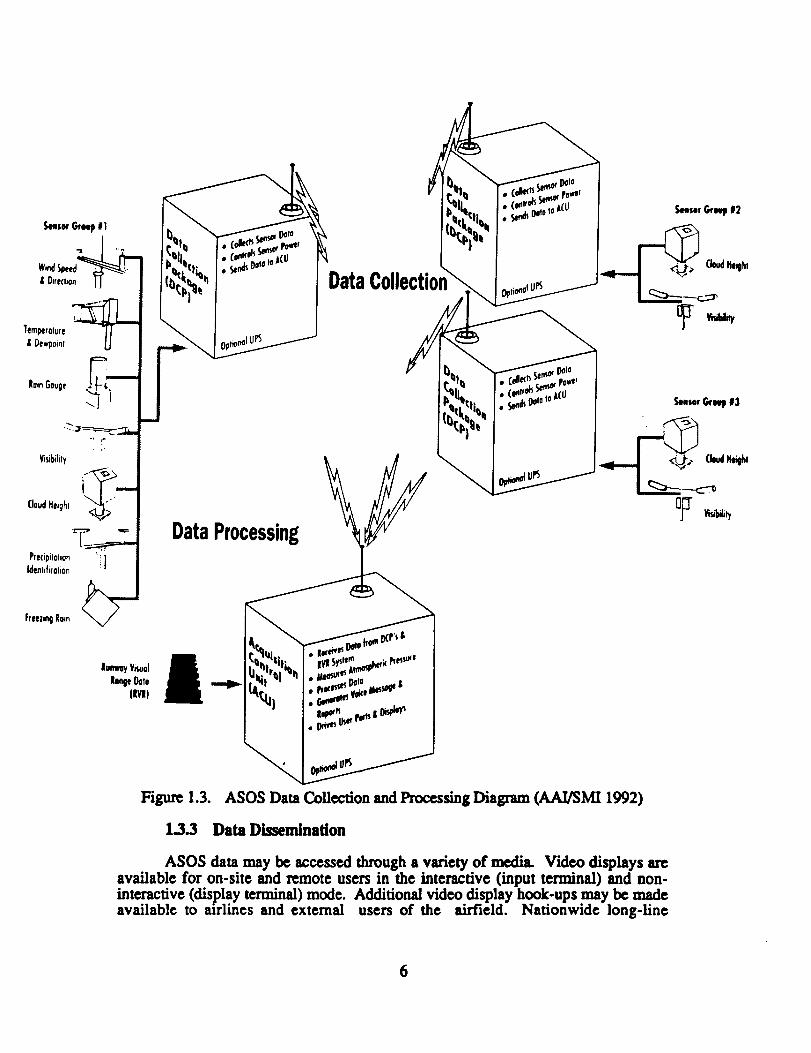
A basic system diagram of the data collectionand data processing operation ofASOS isshown in Figure 1.3.In the normal mode of operationthe DCP makes data
requestsand diagnosticrequestsof each sensorata predetermined rate(e.g.,every 5seconds for wind data,30 seconds for ceilometer,etc.).The DCP collectsthe data
and testresultsfrom the sensorsand periodicallyruns internaltestson itself.All of
this information is then compressed and transmitted via radio modem to the ACU.
The ACU polls all of its DCPs and retrieves weather data and diagnostic testresults at a preset rate. The ACU also retrieves additional information from othersystems (RVR, ADAS) to which it is connected. Once the system has collected thedata and evaluated the test results, the ACU runs data quality checks to determine its
validity and then processes the raw sensor data according to NWS specifiedalgorithms. After the sensor data passes these quality checks, the resulting weatherinformation is output via peripherals and output ports. If the ACU detects a failure ineither the hardware test results or the data quality checks (every ASOS component is
tested at least every seven minutes) any output parameter which may be affected bythe failure is marked as missing on the displays and output channels and amaintenance technician is automatically notified (Sessa 1993).
IoenGouge
\]
lunm_yVnuolhnl_ 0olo
(IVl)
DataProcessing
DataCollection
SemserGrNp 12
_ (loudHeillh!
O_ Vea_l_v
Figure 1.3. ASOS Data CoUecfion and Processing Diagram (AAI/SMI 1992)
1.3.3 Data Dissemination
ASOS data may be accessed through a variety of media. Video displays areavailable for on-site and remote users in the interactive (input terminal) and non-interactive (display terminal) mode. Additional video display hook-ups may be madeavailable to airlines and external users of the airfield. Nationwide long-line
6
ASOS messages occur through the NWS and FAA communications network. TheNWS communications network consists initially of the Automation of FieldOperations and Services (AFOS) system but beginning in the mid 1990s, AFOS willbe replaced with the Advanced Weather Interactive Processing System (AWIPS).This communication modernization is expected to be completed in the late 1990s.
Besides the long-line dissemination through the NWS and FAA, authorizedremote users may also access ASOS data via the ASOS remote user dial-in port. Dataobserved each minute, the ASOS site characteristics, maintenance logs, etc. areavailable through this access port. Computer generated voice messages are providedby ASOS for local FAA radio broadcast to pilots and are made available for generalaviation use through a dial-in telephone number provided at each location (NOAA1992).
1.3.4 System Specifications
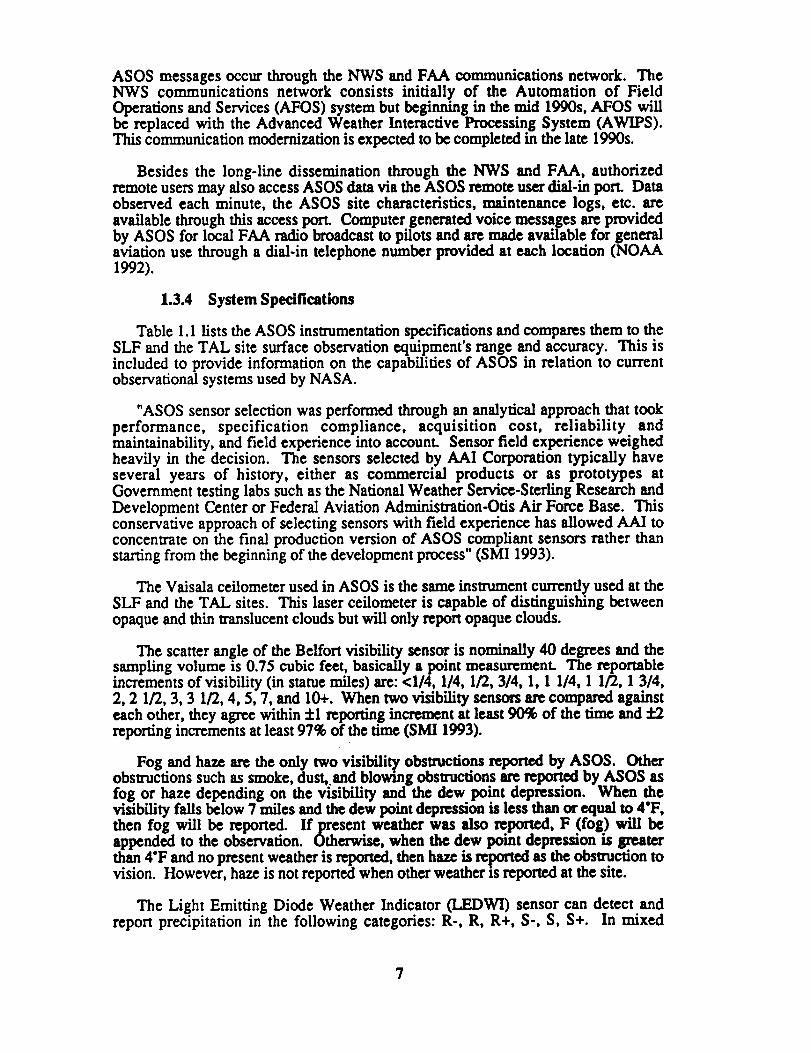
Table 1.1 lists the ASOS instrumentation specifications and compares them to theSLF and the TAL site surface observation equipment's range and accuracy. This is
included to provide information on the capabilities of ASOS in relation to currentobservational systems used by NASA.
"ASOS sensor selection was performed through an analytical approach that tookperformance, specification compliance, acquisition cost, reliability andmaintainability, and field experience into account. Sensor field experience weighedheavily in the decision. The sensors selected by AAI Corporation typically haveseveral years of history, either as commercial products or as prototypes atGovernment testing labs such as the National Weather Service-Sterling Research and
Development Center or Federal Aviation Administration-Otis Air Force Base. Thisconservative approach of selecting sensors with field experience has allowed AAI toconcentrate on the final production version of ASOS compliant sensors rather thanstarting from the beginning of the development process" (SMI 1993).
The Vaisa]a ceilometer used in ASOS is the same insmunent currendy used at theSLF and the TAL sites. This laser ceilometer is capable of distinguishing betweenopaque and thin translucent clouds but will only report opaque clouds.
The scatter angle of the Belfort visibility sensor is nominally 40 degrees and thesampling volume is 0.75 cubic feet, basically a point measurement. The reportableincrements of visibility (in statue miles) are: <I/4, I/4, I/2, 3/4, I, 1 1/4, 1 I/2, 1 3/4,2, 2 I/2, 3, 3 I/2, 4, 5, 7, and I0+. When two visibility sensors are compared against
each other, they agree within :I:I reporting increment at least 90% of the time and :1:2reporting increments at least 97% of the time (SMI 1993).
Fog and haze are the only two visibilit}, obstructions reported by ASOS. Otherobstructions such as smoke, dust, and blowing obstructions are report, by ASOS asfog or haze depending on the visibility and the dew point depresslon. When thevisibility falls below 7 miles and the dew point depression is less than or equal to 4"F,then fog will be reported. If present weather was also reported, F (fog) will beappended to the observation. Otherwise, when the dew point depression is greater
than 4"F and no present weather is reported, then haze is re_:Irted as the obstruction tovision. However, haze is not reported when other weather is reported at the site.
The Light Emitting Diode Weather Indicator (LEDWI) sensor can detect andreport precipitation in the following categories: R-, R, R+, S-, S, S+. In mixed
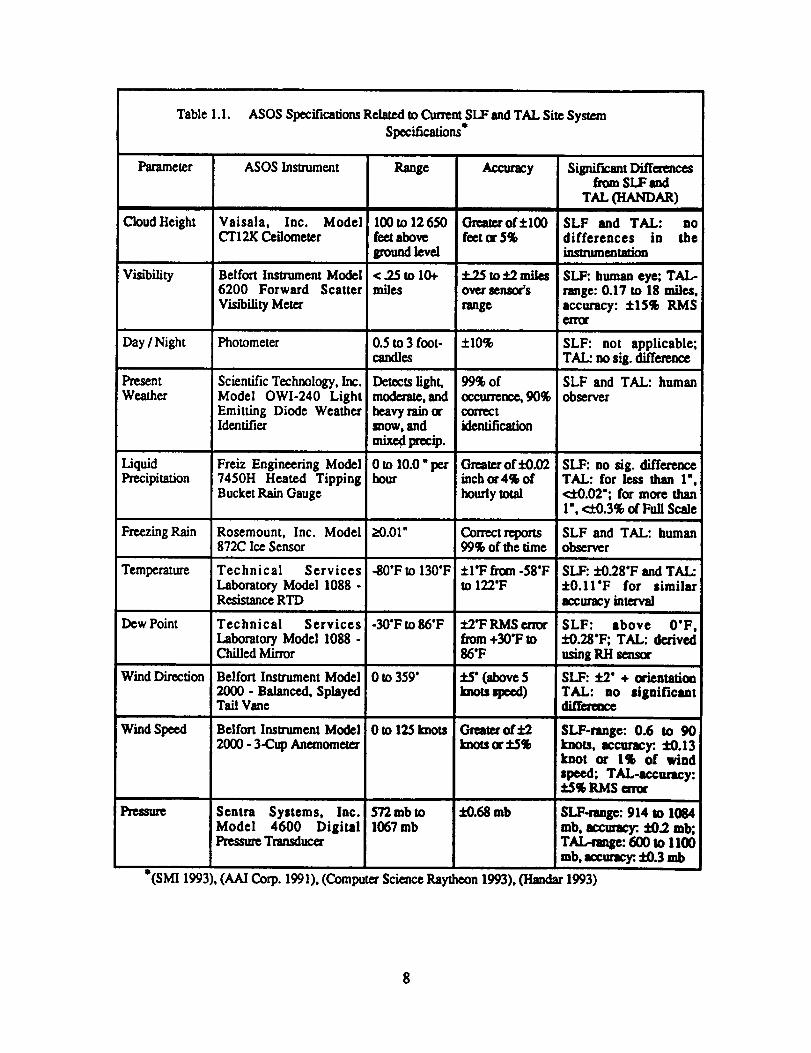
Table I.I. ASOS Specifications Related to Current SLF and TAL Site SystemSpecifications*
Parameter
Cloud Height
Vm'bility
ASOS ]nsmuncnt
Vaisala, Inc. ModelCTI2K Ceilometer
Belfort Insu-ument Model6200 Forward Scatter
V_'bility Meter
Range
I00 to 12 650feet aboveground level
Accuracy
_of+lO0feetor5%
_'.25 to ±2 alliesover sen._r's
range
Signify.antDiffer_sfromSI..F8_I
TAt.ft-tANDAR)
SLF and TAL: nodifferences in thein.mumeatation
SLF: human eye; TAL-range: 0.17 to 18 miles,accuracy: ±15% RMS
Day / Night Photometer 0.5to3foot- ±10% SLF: not applicable;candles TAL: no sig. difference
ScientificTechnology, Inc.Model OWI-240 LightEmittingDiode WeatherIdcnthqer
PresentWeather
LiquidPrecipitation
99% of
occurrence, 90%correctidentification
Greater of:k0.02inchof4% of
hourlytotal
Freiz Engineering Model7450H Heated TippingBucket Rain Gauge
Detectslight,moderate,andheavyrainor_ow, andmix_.ixecip.
0 to 10.0 "perhour
SLF and TAL: humanobserver
SLF: no zig. differenceTAL: for less than 1",<:tO.02"; for more than1", <:L0.3%of Full Scale
Freezing Rain Rosemount, Inc. Model ;_0.01" Contactreports SLF and TAL: human872C Ice Sensor 99% of the time observer
Temperature -80"Fto130"F
-_'Fto_'F
0 to 359"
Oto 125 kno_
Technical ServicesLaboratory Model 1088 -Resistance RTD
Technical ServicesLaboratory Model 1088 -ChilledMirror
Belfort Insu'ument Model2000 - Balanced, SplayedTail Vane
Belfort Instrument Model
2000 - 3-Cup Anemometer
Dew Point
±I'F from -58"Fto 122"F
±2"F RMSfrom +30"F to86"F
_" (above5knot.need)
Greaterof±2Imou or±5%
:£0.68 mb
Wind Direction
Wind Speed
Pressure :Sentra Systems, Inc.Model 4600 DigitalPressure Transducer
572 mb to1067 mb
SLF: ±0.28"F and TAL:±0.11"F for similar
accuracy interval
SLF: above 0"F,i-0.28"F;TAL: derivedusingRH sen_r
SLF: ±2' + orientationTAL: no significantdifference
SLF-range: 0.6 to 90knots, accuracy:. _-0.13knot or 1% of windspeed; TAL-accuracy:
!:1:5%RMS error
;SLF-nmge: 914 to 1084!mb, accuracy: :!:0.2 rob;[TAL-rmge: 600 to 1100i mb, accuracy:. :_0.3 mb
*(SMI 1993), (AAI Corp. 1991), (Computer Science Raytheon 1993), (Handar 1993)
precipitation where the prevailin_ precipitation cannot be determined, it will reportP-. Since ASOS currently has no instrumentation for detecting hail, it is expected thatany hail viewed by the LEDWI will be reported as rain because the ASOS-detectedscintillation signature produced by a falling hailstone is closer to that of rain thansnow (NOAA 1992). The LEDWI data accuracy indicates liquid precipitation iscorrectly detected and reported as R or P not less than 99% of time and correctlyidentified 90% of the time. Solid precipitation is correctly detected and reported as Sor P at least 99% of the time and correctly identified at least 97% of the time (SMI1993).
The hygrothermometer used in the ASOS is a slight modification of the fuUy-automated HO-83 hygrothermometer which has been in operational use since 1985.The minor modifications made were intended to improve its performance.
The ASOS uses a modem automated version of the 1:420 wind sensor, formeasurements of wind direction and speed. The electronics design has been updatedfor ASOS so that the electromagnetic signals generated by the rotating cupanemometer and wind vane are directly convened into reportable values by theASOS. The wind sensors are mounted at the standard 10 meter (32.8 feet) height oncounter balanced tilt-over towers to allow for easier and safer maintenance. Besideswind direction and speed, ASOS will report the following wind related parameters:gusts, squalls, shifts, variable wind direction, peak wind, daily peak wind and thefastest two-minute wind.
The criticality of pressure determination has resulted in the placement of threeseparate and independent pressure sensors at towered airports and two pressuresensors at other locations. The pressure sensors are unique in that they are the onlysensors installed indoors, collocated with the ACU (Acquisition Control Unit).However, they are vented to the outside where required. A pressure report is issuedonly when there is acceptable agreement between at least two sensors. The pressureparameters available from ASOS are: sensor pressure, altimeter setting, pressureremarks (PRESRR, PRIMP, etc.), sea level pressure, density altitude, pressurealtitude, and pressure change/tendency (NOAA 1992).
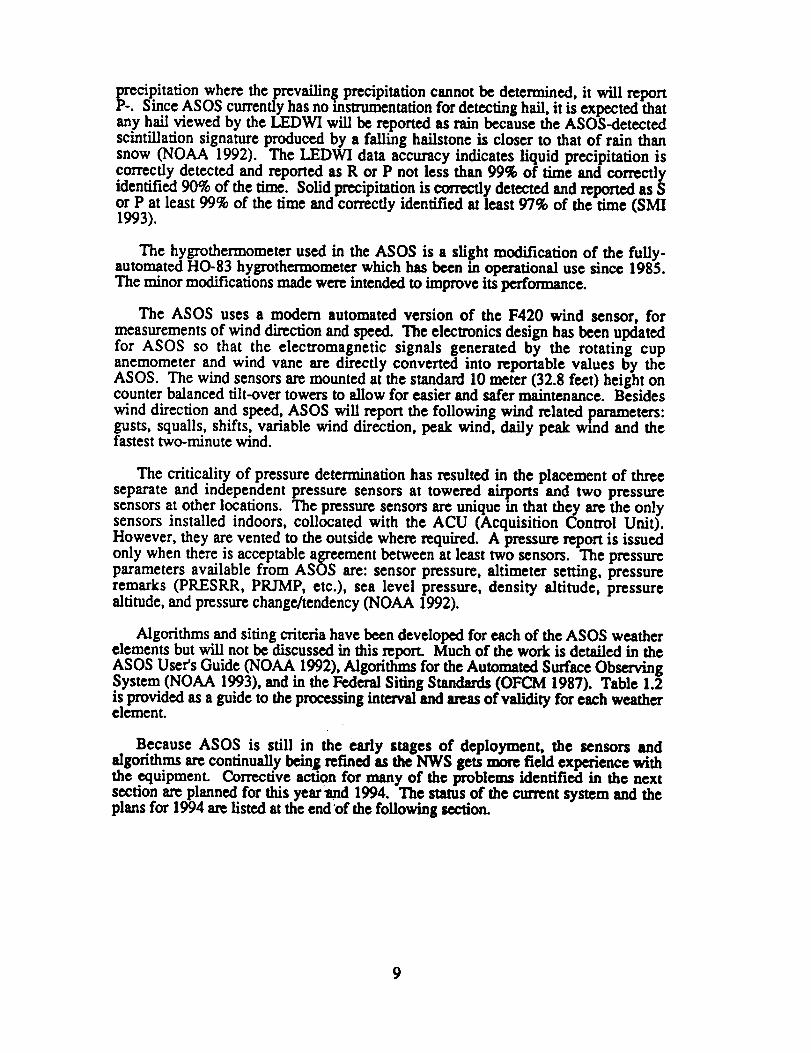
Algorithms and siting criteria have been developed for each of the ASOS weatherelements but wiLl not be discussed in this report. Much of the work is detailed in theASOS User's Guide (NOAA 1992), Algorithms for the Automated Surface ObservingSystem (NOAA 1993), and in the Federal Siting Standards (OFCM 1987). Table 1.2is provided as a guide to the processing interval and areas of validity for each weatherelement.
Because ASOS is still in the early stages of deployment, the sensors andalgorithms are continually being refined as the NWS gets more field experience withthe equipment. Corrective action for many of the problems identified in the nextsection are planned for this year'and 1994. The status of the current system and theplans for 1994 are listed at the end of the following section,
9
Table 1.2. Charactc'ristics of ASOS Algorithms*
Parameter
Sky Conditions
Visibility
Precipitation (R/S)
Freezing Rain
Temperature / Dew Point
Processing Interval(minutes)
3O
I0
I0
15
5
2Wind
Pressure 1 >5
Hail I-I0 <I/4- I
(BradleyandLewis 1993)
Radius of Validityof Sensor Output
(miles)
3-5
2-3
1-2
2-3
5
1-2
10
2.0 ASOS Evaluations
This section describes ASOS measurement accuracy, reliability, andmaintainability. The review is based on previous evaluations of ASOS and includescomparisons of ASOS data to manual observations from various locations in the
United States to highlight ASOS strengths and limitations. The last part of thissection contains the ASOS system stares report and the program's plans for 1994.
2.1 Comparison of ASOS Observations to Manual Observations
Evaluation Sites
Tables 2.1 and 2.2 list ASOS evaluation sites, the begin and end dates for datacollection, and the variables involved. Table 2.1 consists only of the 16 stationswhich comprise the surface observation network in the Modernization And
Restructuring Demonstration (MARD) and Table 2.2 contains a listing of additionalsites that were evaluated at various times. The first 5 stations in Table 2.2 are
contained in evaluations performed by the NWS Southern Observation and FacilitiesBranch, the remaining stations were individual evaluations.
2.1.1 Sites Evaluation Characteristics
A brief description of each evaluation site and the specific evaluation conditions(if any) are noted before presenting the evaluations of the meteorological variables.
NWS Southern Region
The comparisons of ASOS to manual observations from 13 March to 20 June
1993 for the Southern sites included Amarillo, Baton Rouge, Oklahoma City, Tulsa,and West Palm Beach and were compiled by the NWS Southern Region Observationsand Facilities Branch.
Olympia, WA
ASOS was installed with version 1.7 of the operating software at the Olympia,WA airport in late July 1992 and accepted by the NWS in August 1992. The
comparisons from September 1992 through June 1993 were subject to one update(Version 1.8) installed in January 1993. The Weather Service Office OVSO) wherethe manual observations were taken is located approximately 3/8 mile east northeast
of the ASOS sensors (on the other side of the runway). The WSO HO-83 temperatureand 420c wind equipment are located about an 1/8 mile south of the office, and the
laser beam ceilometer is located near the north end of the runway, about a 1/4 milenorth of the office.
Kansas City, MO
The wintertime comparison of ASOS and manual observations at the Kansas CityInternational Airport involved transmitted-only data being processed into hourly,daily, monthly, and event-driven 0ow ceiling and visibility, and precipitation)categories. Hourly comparisons consisted of examining the recorded observationsfrom both sources to measure the variability of the data over the short term.
II
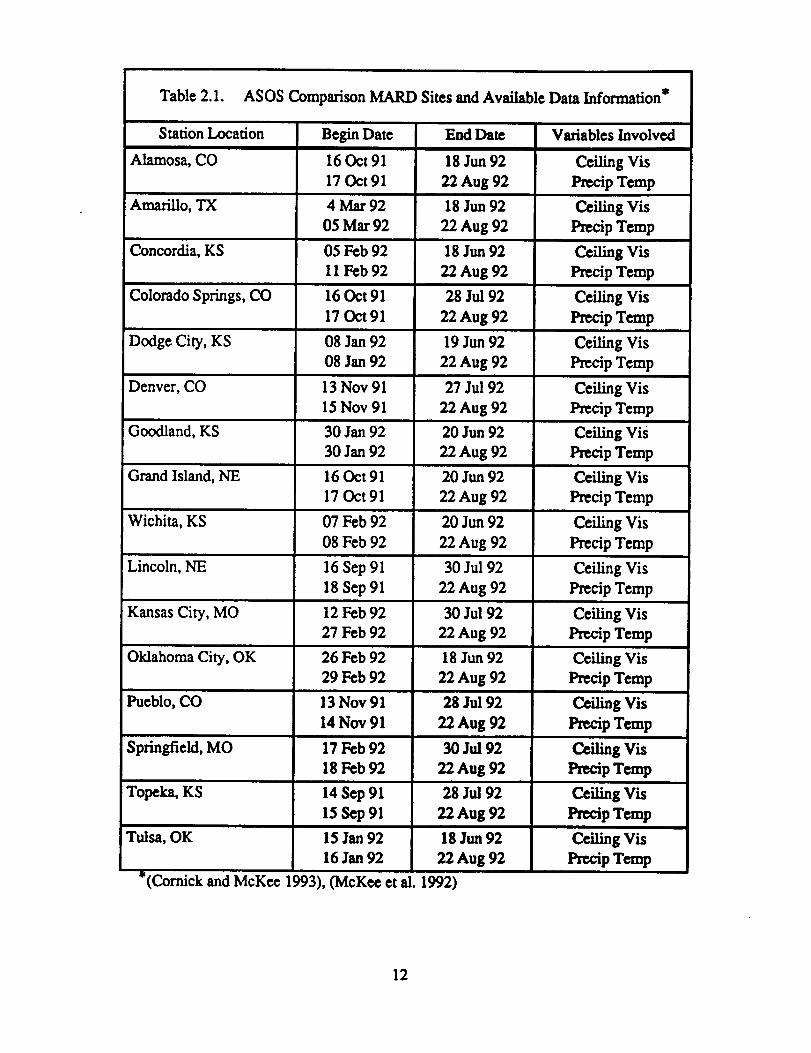
Table2.1. ASOSComparison MARD Sites and Available Data Information*
Station Location
Alamosa, CO
Ama_o, "IX
Concordia, KS
Colorado Springs, CO
Dodge City, KS
Denver, CO
Goodland, KS
Grand Island, NE
Begin Date
16 Oct 91
17 Oct 91
4 Mar92
05 Mar 92
05 Feb 92
11 Feb 92
16 Oct 91
17 Oct 91
08 Jan 92
08 Jan 92
13 Nov 91
15 Nov 91
30 Jan 92
30 Jan 92
16 Oct 91
17 Oct91
End Date
18 Jun 92
22 Aug 92
18 Jun 92
22 Aug 92
18 Jun 92
22 Aug 92
28 Jul 92
22 Aug 92
19 Jun 92
22 Aug 92
27 Jul 92
22 Aug 92
20 Jun 92
22 Aug 92
20 Jun 92
22 Aug 92
Variables Involved
CeilingVis
Precip Temp
Ceiling Vis
Precip Temp
Ceiling Vis
Precip Temp
Ceiling Vis
Precip Temp
Ceiling Vis
Pzecip Temp
Ceiling Vis
Precip Temp
Ceiling Vis
Precip Temp
Ceiling Vis
Precip Temp
Wichita, KS 07 Feb 92 20 Jun 92 Ceiling Vis
08 Feb 92 22 Aug 92 Ptecip Temp
Lincoln, NE 16 Sep 91 30 Jul 92 Ceiling Vis
18 Sep 91 22 Aug 92 Precip Temp
Kansas City, MO 12 Feb 92
27 Feb 92
30 Jul 92
22 Aug 92
17 Feb 92
18 Feb 92
Oklahoma City, OK 26 Feb 92 18 Jun 92
29 Feb 92 22 Aug 92
Pueblo, CO 13 Nov 91 28 Ju192
14 Nov 91 22 Aug 92
Springfield, MO 30 Ju192
22 Aug 92
Topeka, KS 14 Sep 91
15 Sep 91
15 Jan 92
16 Jan 92
et al. 1992)
Tulsa, OK
*(Cornick and McKee 1993), 0VlcKee
28Ju192
22 Aug 92
18 Jun 92
22 Aug 92
Ceiling Vis
Precip Temp
Ceiling Vis
Precip Temp
Ceiling Vis
Precip Temp
Ceiling Vis
Precip Temp
CeilingVis
Precip Temp
CeilingVis
Precip Temp
12
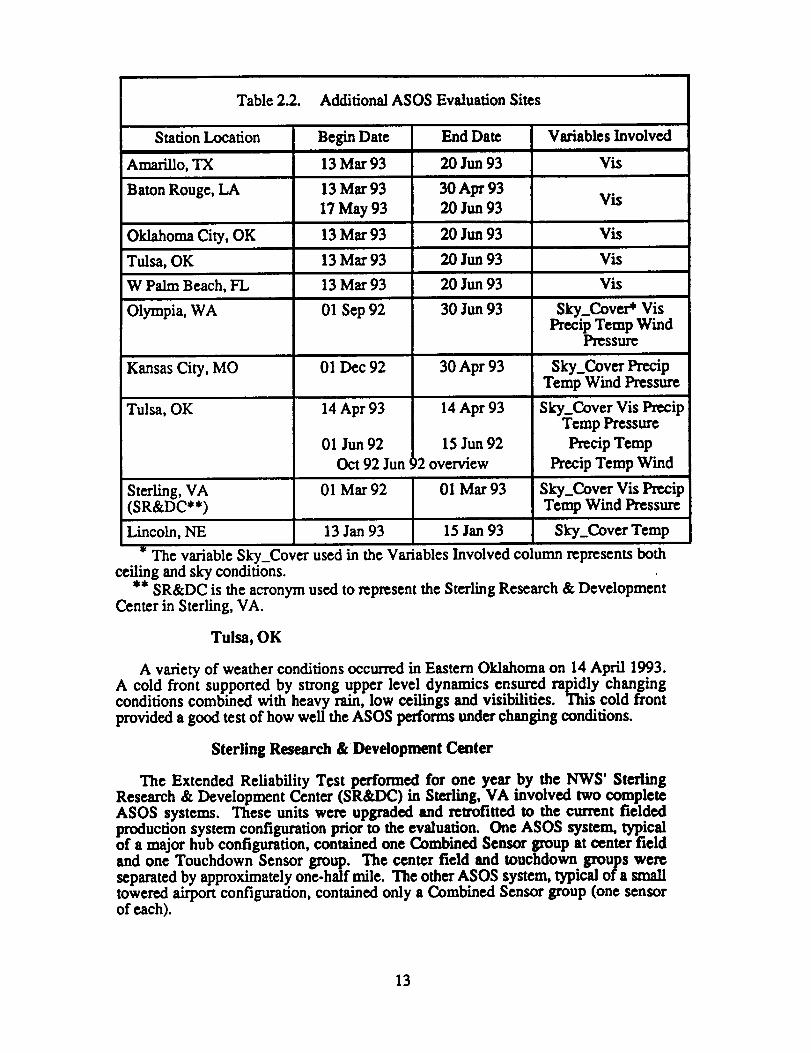
Table 2.2. Additional ASOS Evaluation Sites
Station Location
Amarillo, TX
Baton Rouge, LA
Oklahoma City, OK
Tulsa, OK
W Palm Beach, FL
Olympia,WA
Begin Date
13 Mar 93
13 Mar 93
17 May 93
13 Mar 93
13 Mar93
13 Mar 93
O1 Sep 92
End Date
20 Jun 93
30Apt 9320 Jun 93
20 Jun 93
20 Jun 93
20 Jun 93
30 Jun 93
VariablesInvolved
Vis
Vis
Vis
Vis
Vis
Sky_Cover* VisPrecip Temp Wind
Pressure
Kansas City, MO Ol Dec 92 30 Apr 93 Sky_Cover PrccipTemp Wind Pressure
Tulsa, OK 14 Apr 93
15 Jun 92
c)2overview
14 Apr 93
01 Jun 92
Oct 92 Jun
Sky_Cover Vis PrecipTemp Pressure
PrecipTemp
PrccipTemp Wind
Sterling, VA 01 Mar 92 01 Mar 93 Sky_cover Vis Precip(SR&DC**) Temp Wind Pressure
Lincoln, NE 13 Jan 93 15 Jan 93 Sky_Cover Temp
* The variableSky_Cover usedintheVariablesInvolvedcolumn representsbothceilingand skyconditions.
** SR&DC is the acronym used to represent the Sterling Research & DevelopmentCenter in Sterling, VA.
Tulsa, OK
A variety of weather conditions occurred in Eastern Oklahoma on 14 April 1993.A cold front supported by strong upper level dynamics ensured rapidly changingconditions combined with heavy rain, low ceilings and visibilities. This cold frontprovided a good test of how well the ASOS performs under changing conditions.
Sterling Research & Development Center
The Extended Reliability Test performed for one year by the NWS' SterlingResearch & Development Center (SR&DC) in Sterling, VA involved two completeASOS systems. These units were upgraded and retrofitted to the current fieldedproduction system configuration prior to the evaluation. One ASOS system, typicalof a major hub configuration, contained one Combined Sensor group at center fieldand one Touchdown Sensor group. The center field and touchdown groups wereseparated by approximately one-half mile. The other ASOS system, typical of a smalltowered airport configuration, contained only a Combined Sensor group (one sensorof each).
13
Lincoln, NE
Since the commissioning of ASOS, questions have arose concerning the accuracyof the temperature and dew point sensors. Because of these questions, Lincoln, NEwas selected for a 48 hour field test to evaluate the winter performance and accuracyof the ASOS temperature and dew point sensors. The test was scheduled from 1200
Local Standard Time (LST) 13 January 1993, through 1200 LST 15 January 1993.AThseot_stwas to compare temperatures of an unsheltered sling psychrometer and the
temperature and dew point sensors. The Lincoln ASOS site is approximatelyone mile south and 24 feet lower than the old official temperature site. The centerfield HO-83 temperatures were also collected to determine ff the 24 foot elevation
difference between the new ASOS site and the old HO-83 site produced significanttemperature discrepancies. The sling psychrometer was hung within a foot of theASOS sensor being fully exposed to the environment except for a crude but effectivecardboard shield. All readings were collected every 20 minutes for 48 hours with theexception of the center field temperatures which were collected by the observer at theWSO on the hour and 20 minutes past the hour.
MARD Sites
The MARD (Modernization And Restructuring Demonstration) sites are the 16NWS weather stationswithinthe MARD areaof the centralUnited States.Since the
ASOS units were installedat the MARD sitesat differenttimes, the amount of
simultaneous ASOS and manual observations varies among the differentsites.
Furthermore, theASOS observationswere only compared tothe manual observation
having atleastfourmonths of overlapdataduringthisperiod.The ASOS instruments
used in the study were not commissioned so adjustments and maintenance on the
unitswere likelytohave occurredduring thedatacollectiontime period.
The evaluations performed using hourly observations of temperature andprecipitation are part of the Climate Data Continuity Project. The project waslaunched in 1991 and coincided with the initial deployment of the NWS ASOS. The
overall purpose of this project is to ease the transition into the ASOS era for the manyusers of climate data derived from primary NWS aviation weather stations. This
project will focus on the early objective identification and documentation of potentialtmpacts on climate records resulting from this fundamental change in how weatherconditions are measured and recorded (Comick and McKee 1993).
2.1.2 Evaluation of Meteorological Variables
A brief summary for each meteorological variable is provided prior to eachindividual site's evaluation. The information provided in each evaluation revieweddid reveal some differences in the dam comparisons of ASOS to manual observations.
However, the evaluations did not indicate ff these differences were statisticallysignificant. Of the evaluations reviewed, only one site (Sterling Research and
Development Center) had multiple sensors. One of the two ASOS units at Sterling,VA, consisted of a Combined Sensor group and a Touchdown Sensor group (twoceilometers and two visibility sensors) separated by approximately 1/2 mile.
Comments concerning the multiple sensors are also noted under the appropriateheading.
14
2.1.2.1 Sky Cover
Summarv
Automation of subjective elements such as ceiling and sky conditions containnumerous complexities. The major problem is how to quantify subjective humanjudgment when necessary. Overall. most of the differences observed between themanual and ASOS observations can be ascribed to sensor limitations or the need for a
refined algorithm.
Key points concerning comparison of ASOS to manual observations of ceilingsand sky conditions include:
Reporting of sky conditions compares reasonably well to themanual observation when there is fair cloud movement at or
around the sensor.
Comparing ASOS to manual ceiling observations indicates an
exact match in 86.2% of the observationpairs and 92.7% of the
pairshave ceilingheightswithin +I000 feet. During periods of
activeweather, 76% of the observationpairshave ceilingheightswithin+I000 feet.
Fog has been shown to be the most frequently reported weatherphenomena when large discrepancies occur between ASOS andmanual observations.
Reporting of incorrector falselayersoften occurs due to ASOS
verticalvisibilitybeing obstructed by precipitation,liftingfog,
virga,and invisiblemoisture particles(area of high moistureconcentrationwithout a visiblecloud/layer).
• Timing of reporting significantchanges and trend analysis of
ASOS compares favorablywell tomanual observations.
Individual Site's Evaluation
Olympia, WA
The laser ceilometer of the Olympia, WA WSO office is located approximately1/5 mile northeast of the ASOS site near the north end of the runway. ASOS and
manual observations of sky cover compared well as long as the clouds were movingat a fair speed. When the winds were calm or light, the ASOS sky cover observationquality decreased. During times of little movement, a cloud over the sensor,especially at low levels would produce a broken or even an overcast layer whenvisually less than half the sky was covered. On the other hand, there were occasionswhen broken sky conditions existed but there were limited clouds within view of theASOS ceilometer so ASOS reported scattered clouds to no clouds below 12 000 feet.
Virga falling from cloud layers at 8000 feet and above often masked the cloudheights and no clouds below 12 000 feet were reported by ASOS. However, on other
occasions, scattered clouds at heights from 1000 to 6000 feet would be reported byASOS with no clouds reported at higher altitudes.
15
During the fog season,radiationalcoolingand ground fog conditionsoften causedASOS to report a broken to overcast layer at 100 feet or between 400 and 1000 feet
and occasionally up to as high as 1500 feet when no clouds were visually evident.The layerreportedduring radiationalcoolingevents could be caused by an invisible
moisture layeraround the inversionheight. The layerreportedduring a ground fog
event may be caused by the liftingfog (NWS Western Region 1993).
For nine days in October 1992, winds were light to moderately strong and cloudsmoved rapidly over the ceilometer. Of the 107 visual ceilings (0600 to 1800 LocalStandard Time), 85 (79%) differed by 500 feet or less from the ASOS heights. Forvisual ceiling heights at 5000 feet or less, 54 out of 81 (67%) were within 200 feet ofthe ASOS heights, and over 80% (65 of 81) were within 500 feet of ASOS values. Of
the visual ceilings at 1000 feet or less, 17 of the 19 visual ceilings were within 200feet of the reported ASOS ceiling (Stickney 1992b).
Kansas City, MO
The Kansas City, MO evaluation indicated that in general, both cloud heights andvisibilities compared favorably in trend and in the timing of reporting significantchanges, with ASOS indicating gradual changes earlier. In many of the cases
examined during significant events, cloud heights and visibilities were veryrepresentative of the surroundings. An example of this situation is seen in the
tracking of ceilings versus cloud heights from a snowstorm on 15-16 February 1993between 2100 and 0000 UTC. Multiple cloud layers were reported by ASOS whenthe lower layers over the sensor became scattered or broken. The ASOS ceilingfluctuated between 1000 and 3000 feet during this period while manual observationsremained steady between 700 and 900 feet. ASOS did report scattered clouds nearthe level reported by the human observer but not of sufficient coverage to constitute aceiling (Browning 1993).
Tulsa, OK
Since the commissioning of the Tulsa, OK ASOS on 1 October 1992, periods of
low clouds and visibilities have been handled well by ASOS. Because of the timeneeded to process cloud and visibility data, ASOS reports often lag manualobservations by several minutes. This normally occurs with rapidly changingconditions, and rarely is the time lag great enough to affect aircraft operationsCl'eague 1993).
Sterling Research & Development Center
There was good agreement between ASOS reported ceilings and manualobservations. With few exceptions, the differences observed between the manual andASOS observations can be ascribed to sensor limitations or the need for algorithmrefinement. Specifically, ASOS often relXa'ts false or incorrect cloud layers due to itsvertical visibility being obstructed (status 3 reports) by precipitation, lifting fog,virga, and invisible moisture particles.
"A status 3 output means that the Cloud Height Indicator has not detected the baseof a cloud, but that there is an obstruction present in the atmosphere that has, by thevertical visibility height, reduced the laser power to some nominal fraction of thetransmitted energy, e.g., 50 percent" (Nadolski and Bradley, 1991). One caseresulting from status 3 outputs was noted. During this event, ASOS reported 5 SCTM16 BKN 50 OVC. In this case the layer at 1600 feet did not exist, but was the result
16
of status 3 reports during an ice pellet event. This occurrence of a false cloud layerwas from precipitating clouds that were lower than normal for this phenomena. Ingeneral, false layers from 2000 to 3000 feet were reported when precipitation wasoccurring from clouds at or above 7000 feet.
"During the test on a number of occasions, ASOS reported clouds at variousheights when no apparent clouds were visible. The reporting of clouds at 100 to 200feet occurred on mornings with a strong inversion which could have capped moisture.In one case of higher clouds, a test radiosonde flight taken fairly close in time to anobservation with the reported layer showed a moist layer at the height of the reportedclouds" (NOAA/NWS 1993).
Multiple Sensors at the Sterling Research & Development Center
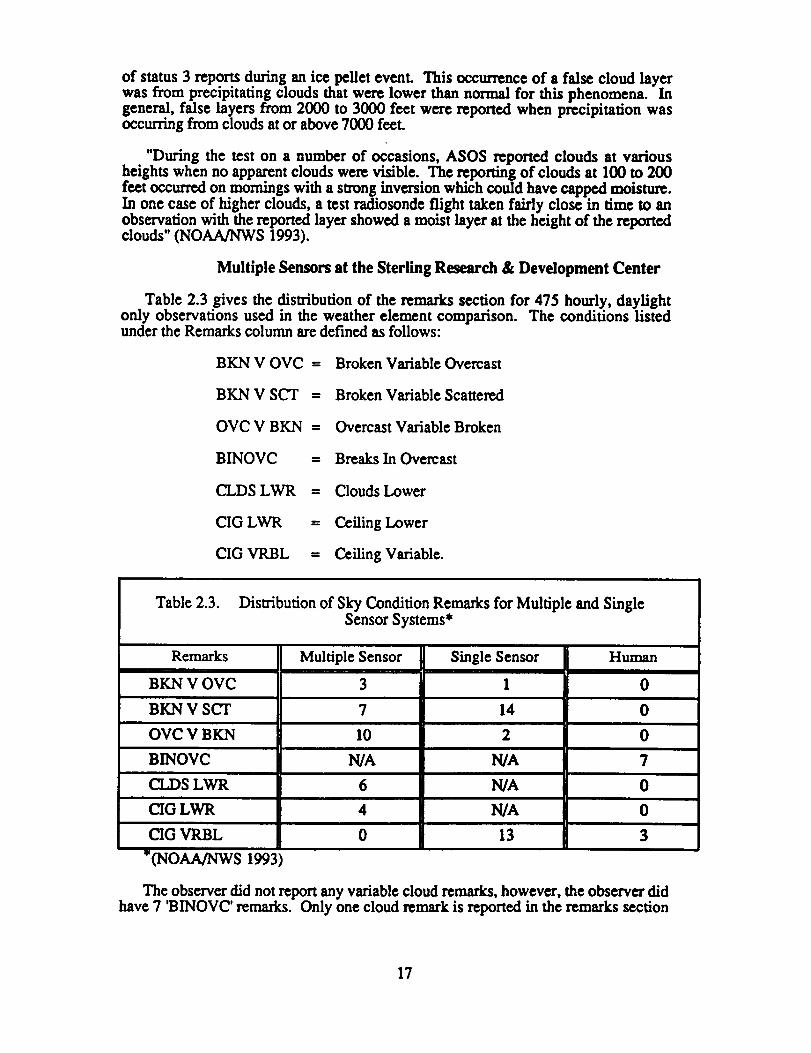
Table 2.3 gives the distribution of the remarks section for 475 hourly, daylightonly observations used in the weather element comparison. The conditions listedunder the Remarks column are defined as follows:
BKN V OVC = Broken Variable Overcast
BKN V SCT = Broken Variable Scattered
OVC V BKN = Overcast Variable Broken
BINOVC = Breaks In Overcast
CLDS LWR = Clouds Lower
CIG LWR = Ceiling Lower
CIG VRBL = CeilingVariable.
Table 2.3. Distributionof Sky Condition Remarks forMultiple and Single
Sensor Systems*
Remarks MultipleSensor SingleSensor Human
BKN V OVC 3 1 0
BKN V scr 7 14 0
OVC V BKN 10 2 0
BINOVC N/A N/A 7
CLDS LWR 6 N/A 0
CIG LWR 4 N/A 0
CIG VRBL 0 13 3
"(NOAA/NWS 1993
The observer did not report any variable cloud remarks, however, the observer didhave 7 'BINOVC' remarks. Only one cloud remark is reported in the remarks section
17
of each ASOS observation with the 'CLDS LWR' and 'CIG LWR' remarks takingprecedence over the other cloud remarks. The multiple sensor site reported 'LWR'remarks while the single ceilometer system reported 13 'CIG VRBL', and the observerreported 3. In the ASOS 'CIG VRBL' remarks, the range of variability was 500 to700 feet as compared to the human reports of only 200 to 300 feet (NOAA/NWS1993).
Lincoln, NE
During the fu'st day of the 48 hour temperature test in Lincoln, NE, the observerhad been reporting mostly clear skies for approximately six and one-half hours whenduring the last half hour ASOS reported a 1500 foot broken deck when no deckexisted. Prior to the special report, ASOS had been reporting 'CLR BLO 120'.Within 50 minutes a visual ceiling at 1800 feet moved in. "It seems ASOS detectspossible moisture density differences even when no clouds are present. It was laterfound that the site was on the edge of the 900 mb moisture layer" (Grosshans andClark 1993).
MARD Sites
In performing the MARD sites comparison of ASOS ceilings with manuallyreported ceilings, some accommodations had to be made since ASOS categories differfrom manual categories. For example, manual observations with clear skies and skieswith no ceiling below 12 000 feet are put into same category.
For the overall comparison of ceilings, the total number of matched pairs forcomparison (64 137) were used and resulted in 86.2% exact matches and 92.7% werewithin +1000 feet. Table 2.4 shows the complete results in the form of a scatterdiagram. Occurrences of clear skies, or at least no ceiling below 12 000 feet (ceilingcategory >110) comprise 67% (42 962) of the matched pairs. Therefore, the completesample results are biased by the large number of "no ceiling" events. The informationprovided did not present any general conditions (e.g., frontal nimbostratus) whichmay have existed in the events in which ASOS did not agree with the manual report(Comick and McKee 1993).
Across the top of Table 2.4 is the category for manual observations of ceilingheights. Down the left side of Table 2.4 is the category for ASOS ceilingobservations for the same event. The diagonal row of cells (shaded) from the upperleft comer to the lower right corner constitutes the number of times ASOS agreedwith the manual report within the range of the category. The other cells of Table 2.4indicate the number of occurrences when ASOS and the manual observations differedby one or more categories. The lower left comer represents the frequency of events inwhich the manual report indicated a much lower ceiling than ASOS reported. Theupper right comer represents the frequency of events where the manual ceiling heightreport is much higher than reported by ASOS (Cornick and McKee 1993).
A comparison of matched pairs characterized by reportable weather (9454 pairs)indicated 76.3% of the ASOS reports were within ±1000 feet of the manual reports.A subset of this data (8828 out of 9454) was created which contains only manualreports of rain, snow, fog, or drizzle. Of this subset, ASOS reported ceilings five ormore categories (a category represents 1000 feet) lower than manual reports in 463cases and, in 343 of the 463 cases, fog was reported. Thus, a possible explanation formany of the events with large discrepancies is the ASOS ceilometer incorrecdyinterprets the return from the fog droplets as a cloud base (Cornick and McKee 1993).
18
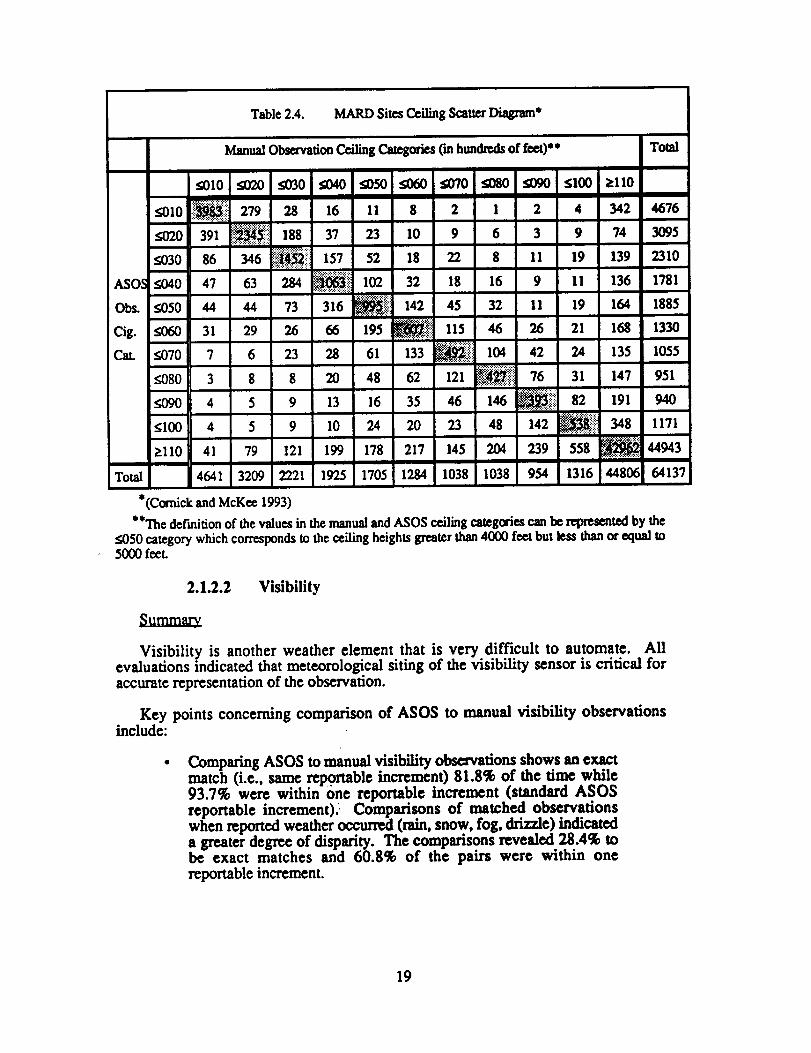
Table 2.4. MARD Sites Ceiling Scatter Diagram*
Manual Observation Ceiling Categories Cmhundreds of feet)** Total
•010 090 100 110_010 i_ii 279 28 16 11 8 2 1 2 4 342 4676
_)20 391 _::i! 188 37 23 10 9 6 3 9 74 3095
_030 86 346 _i_:!! 157 52 18 22 8 11 19 139 2310
ASO._ ._40 47 63 284 i_ii 102 32 18 16 9 11 136 1781
Obs.._350 44 44 73 316 _ii 142 45 32 11 19 164 1885
Cig. _)60 31 29 26 66 195 _i 115 46 26 21 168 1330
Cat. f,070 7 6 23 28 61 133 _i 104 42 24 135 1055
f,080 3 8 8 20 48 62 121 _::iii 76 31 147 951
._)90 4 5 9 13 16 35 46 146 _iill 82 191 940
i<100 4 5 9 10 24 20 23 48 142 _ii: 348 1171
>110 41 79 121 199 178 217 145 204 239 558 _ 44943
Total 4641 3209 2221 1925 1705 1284 1038 1038 954 1316 44806 64137
*(CondckandMcKee 1993)
"*The definition of the values in the manual and ASOS ceiling categories can be represented by the
._050categorywhichcorrespondstotheceilingheighlsgreaterthan4000feetbutlessthanorequalto5000feet.
2.1.2.2 Visibility
Summary_
Visibility is another weather clement that is very difficult to automate. Allevaluations indicated that meteorological siting of the visibility sensor is critical foraccurate representation of the observation.
Key points concerning comparison of ASOS to manual visibility observationsinclude:
Comparing ASOS to manual visibility observations shows an exactmatch (i.e., same reportable increment) 81.8% of the lime while93.7% were within one reportable increment (standard ASOS
reportable increment).' Comparisons of matched observationswhen reported weather occurred (rain, snow, fog, drizzle) indicateda greater degree of disparity. The comparisons revealed 28.4% tobe exact matches and 60.8% of the pairs were within one
reportable increment.
19
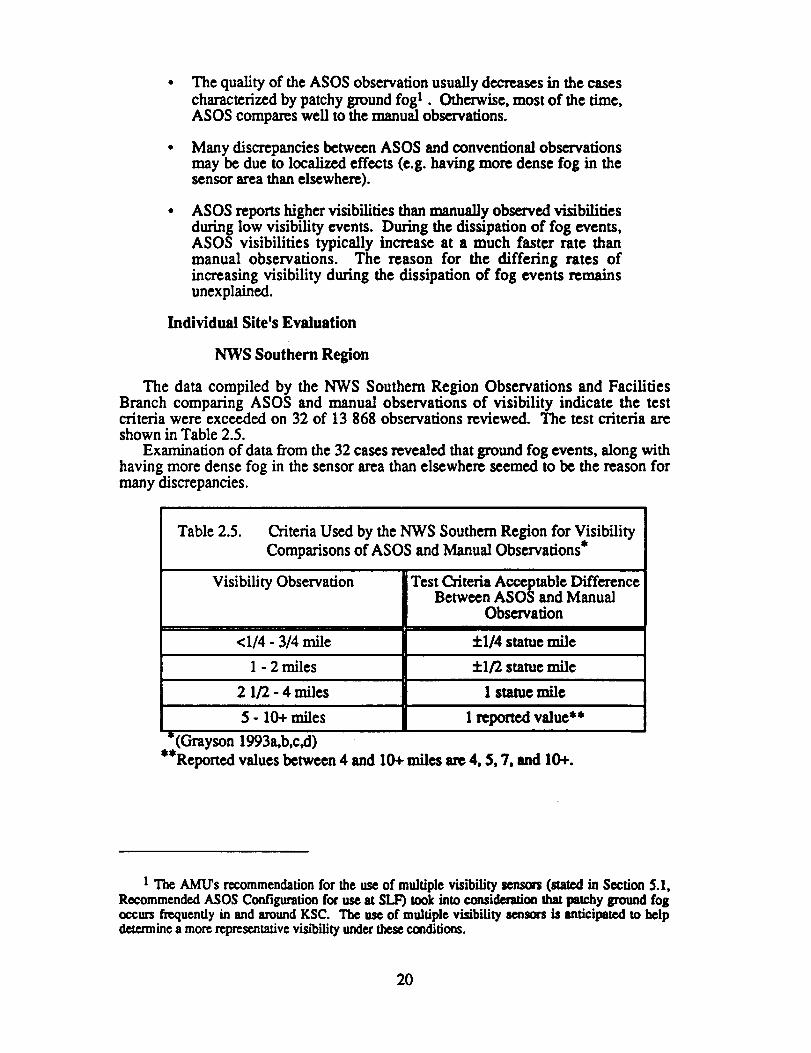
The quality of the ASOS observation usually decreases in the cases
characterized by patchy ground fog I . Otherwise, most of the time,ASOS compares well to the manual observations.
Many discrepancies between ASOS and conventional observationsmay be due to localized effects (e.g. having more dense fog in thesensor area than elsewhere).
ASOS reports higher visibilities than manually observed visibilitiesduring low visibility events. During the dissipation of fog events,ASOS visibilities typically increase at a much faster rate thanmanual observations. The reason for the differing rates ofincreasing visibility during the dissipation of fog events remainsunexplained.
Individual Site's Evaluation
NWS Southern Region
The data compiled by the NWS Southern Region Observations and FacilitiesBranch comparing ASOS and manual observations of visibility indicate the testcriteria were exceeded on 32 of 13 868 observations reviewed. The test criteria areshown in Table 2.5.
Examination of data fxom the 32 cases revealed that ground fog events, along withhaving more dense fog in the sensor area than elsewhere seemed to be the reason formany discrepancies.
Table 2.5. Criteria Used by the NWS Southern Region for Visibility
Comparisons of ASOS and Manual Observations*
VisibilityObservation
<1/4 - 3/4 mile
Test Criteria Acceptable DifferenceBetween ASOS and Manual
Observation
4-1/4statuemile
I -2 miles 4-I/2statuemile
2 1/2 -4 miles Istatuemile
5 - I0+ miles Ireportedvalue**
*(Grayson 1993a, b,c,d)
**Reported values between 4 and 10+ miles ere 4, 5, 7, and 10+.
1 The AMU's recommendation for the use of multiple visibility senso_ (stated in Section 5.1,Recommended ASOS Configuration for use at SLF) took into consideration that patchy ground fogoccurs frequently in and around KSC. The use of multiple visibility sensocs is anticipated to helpdetermine a more representative v_'bility under these conditions.
20
Olympia, WA
In Olympia, WA, comparisons of ASOS and manual visibility observations weremade during September, October, and November 1992. During daylight hours,ASOS visibilities were generally greater than manual when manual visibilities werein the range of one to three miles. ASOS was greater than three miles in nearly 50%of the observations when corresponding manual visibilities were one to three miles.With widespread fog and little or slow change, ASOS and manual visibilities were
comparable. During improving conditions, as fog began to dissipate, ASOSvisibilities increased at a much faster rate. During episodes of strong radiational
cooling and ground fog, the manual and ASOS visibilities differed significantly.
Patchy ground fog under 50 feet was not handled well by ASOS. At this site, thevisibility sensor was located next to the main runway with low cut grass and nativeweeds surrounding it. Ground fog patches would flow around and over the sensorcausing ASOS to lower the derived visibility to less than three miles for a short time,
then increasing to above three miles as the fog moved away from the sensor. Duringthese times when ASOS reported changing visibility, the manual prevailing visibilityremained constant (NWS Western Region 1993).
Tulsa, OK
Since commissioning on October 1, 1992 Tulsa, OK the ASOS has handled lowvisibilities well. Comparisons between ASOS and manual observations taken on 14
April 1993 showed that for visibilities of five miles or less, over half (7 of 12)matched exactly with the manual observations. The remaining five observation pairsdiffered by one-half to three miles (Teague 1993).
Sterling Research & Development Center
At SR&DC the data indicate there was good agreement between ASOS and thehuman observer. For the cases where there was a discrepancy, the data indicate thatpatchy ground fog was present and the visibility was generally one mile or less. A
few of these cases were associated with the human observer having a slant visibilityon certain markers.
Multiple Sensors at the Sterling Research & Development Center
Of the 475 hourly observations used to compare weather elements, thedistribution of visibility remarks generated by ASOS is shown in Table 2.6. All
comparative observations were taken during daylight hours. The observer waslocated approximately 1/3 mile to the east of the Combined Sensor group of themultiple sensor system. The Combined Sensor group of the single system waslocated just to the west of themultiple sensor system (NOAA/NWS 1993). Theconditions listed under the Remarks column are def'med as follows:
VRBL VSBY = Variable Visibility
SECTOR VSBY = Sector Visibility.
21
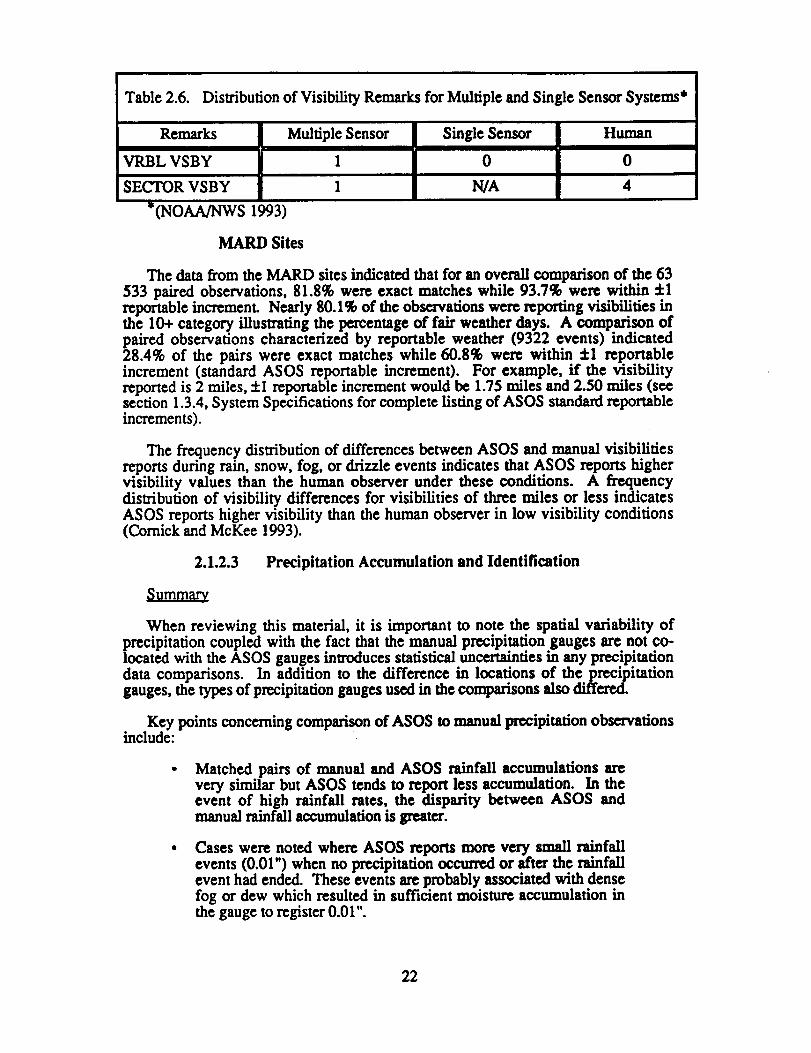
Table2.6. DistributionofVisibilityRemarks forMultipleand SingleSensorSystems*
Remarks Multiple Sensor
VRBL VSBY 1
SECTOR VSBY 1
*(NOAA/NWS 1993)
Single Sensor
0
N/A
Human
0
4
MARD Sites
The data from the MARD sites indicated that for an overall comparison of the 63533 paired observations, 81.8% were exact matches while 93.7% were within :1:1reportable increment. Nearly 80.1% of the observations were reporting visibilities inthe 10+ category illustrating the percentage of fair weather days. A comparison ofpaired observations characterized by reportable weather (9322 events) indicated28.4% of the pairs were exact matches while 60.8% were within +1 reportableincrement (standard ASOS reportable increment). For example, ff the visibilityreported is 2 miles, +1 reportable increment would be 1.75 miles and 2.50 miles (seesection 1.3.4, System Specifications for complete listing of ASOS standard reportableincrements).
The frequency distribution of differences between ASOS and manual visibilitiesreports during rain, snow, fog, or drizzle events indicates that ASOS reports highervisibility values than the human observer under these conditions. A frequencydistribution of visibility differences for visibilities of three miles or less indicatesASOS reports higher visibility than the human observer in low visibility conditions(Comick and McKee 1993).
2.1.2.3 Precipitation Accumulation and Identification
Summary_
When reviewing this material, it is important to note the spatial variability ofprecipitation coupled with the fact that the manual precipitation gauges are not co-located with the ASOS gauges introduces statistical uncertainties in any precipitationdata comparisons. In addition to the difference in locations of the precipitationgauges, the types of precipitation gauges used in the comparisons also differed.
Key points concerning comparison of ASOS to manual precipitation observationsinclude:
Matched pairs of manual and ASOS rainfall accumulations arevery similar but ASOS tends to report less accumulation. In theevent of high rainfall rates, the disparity between ASOS andmanual rainfall accumulation is greater.
Cases were noted where ASOS reports more very small rainfallevents (0.01") when no precipitation occtured or after the rainfallevent had ended. These events are probably associated with densefog or dew which resulted in sufficient moisture accumulation inthe gauge to register 0.01"
22
• Onset and ending of precipitation events by ASOS have been veryaccurate.
Identification of precipitation type was reported conectly by ASOSmost of the time. ASOS precipitation type errors generallyoccurred when the air temperature was close to freezing and thedifferentiation between rain and snow became difficult.
Individual Site's Evaluation
Olympia, WA
For monthly precipitation totals at Olympia, WA from September 1992 to June1993, ASOS' precipitation totals on 8 out of 10 months were less than the station
weighing rain gauge (one month was an exact match). The ASOS total precipitationof 36.7Y' was 93.9% of the 39.12" measured by the station weighing rain gauge(NWS Western Region 1993).
During September, there were eight rain events. The total rainfall reported byASOS for these eight events was 0.09" less than the station reported rainfall total(2.35" vs. 2.44"). For the 14 days of precipitation during October, ASOS reported0.15" less precipitation than the station weighing rain gauge. Of these 14 events, both
sensors reported identical rainfall totals for 4 days, the difference between the gaugeswas either 0.01" or 0.02" for 8 days, and the difference in rainfall was 0.03" and 0.06"for the 2 other days.
November 1992 contained several periods of moderate to heavy rain that mayhave overloaded the ASOS tipping bucket rain gauge sensor. The ASOS total rainfallof 6.27" is 91.9% of the 6.82" measured by the station weighing rain gauge. Part ofthe difference may be explained by the approximate 3/8 mile separation of the ASOSand station weighing rain gauges (Stickney 1992a,b,c).
Kansas City, MO
Precipitation in the form of rain,freezingrain,drizzle,freezingdrizzle,or snow
occurred on 75 of the 151 days inthe Kansas City,MO study. Rainfallaccumulation
by ASOS was near WSO values during rain events (except one instance duringextreme rainfallwhere ASOS observed less).However, ASOS recorded significantly
lower amounts (74% less)of precipitationaccumulation (water equivalent)duringsnow events than the WSO report (Browning, 1993). One possible cause for thelower precipitation accumulation during snow events is the evaporation orsublimation of snow resulting from the heating required to melt and measure frozenprecipitation (NOAh, 1992).
Tulsa, OK
Data for Tulsa, OK also indicatedthatASOS precipitationaccumulation was
similar but generally less than the station Weighing Rain Gauge (WRG)accumulation. The fact that the two rain gauges are over one mile apart accounts for
some of the accumulation differences. Data from Tulsa, OK also indicates the ._¢esentweather sensor (LEDWI) has been very accurate for the onset and ending ofprecipitation.
23

One problem encountered with the ASOS is the reporting of precipitation afterrainfallhad ended. Most of thesecaseswere theresultofheavy dew occun'ingaftertheend ofmeasurablerainfall(Devoreand Teaguc 1993).
The dailytotalsof precipitationfrom the two gauges for 14 April 1993 weresimilar(ASOS: 1.22",WRG: 1.17"),aswere thehourlytotals.Twenty outof the24hours reportedrainfallamounts rangingfrom a traceto 0.28". The differencesbetweenthetwo gaugeswereveryslight,varyingby a maximum of0.04".
October 1992 only had four precipitation events. For the month, there weresubstantial differences in precipxtadon between the gauges on days with heavyprecipitation, although the ASOS' total accumulation exceeded the station observationby only 0.31" (3.53" vs. 3.22"). For June 1992, the monthly total precipitation for thetwo gauges were very similar (ASOS: 8.32", WSO: 8.41"). Example rainfall totalsinclude (June 2) ASOS: 1.79" WRG: 1.33", (June 6) ASOS: 0.80" WRG: 0.89", and(June 14) ASOS: 1.51" WRG: 1.65" (Teague 1992; Teague 1993).
Sterling Research & Development Center
During SR&DC's test, a number of cases indicated ASOS reported incorrectdiscrimination of precipitation. In one event, one ASOS unit reported fight rain whilethe other ASOS reported light snow. The temperature was 38"F, and the precipitationwas determined to be rain. In a second event, a long period of very fight rain wasnotreported by ASOS while 0.03" of precipitation accumulated over many hours. Duringa long-lasting ice pellet event in which two inches of ice accumulated on the ground,both ASOS stations incorrectly identified the solid precipitation as liquid rain.Finally, during a blizzard in 1993, a period of precipitation with ice pellets was againincorrecdy identified as rain by ASOS. In addition, on a number of occasions, ASOSreported precipitation accumulation when dew, resulting from dense fog occurred(NOAA/NWS 1993).
MARDSites
Total ASOS precipitation during the pre.commissionlng period of the MARD siteswas similar to but less than the conventional observation for valid comparison days atall stations except Goodland, NE (GLD). ASOS precipitation totals ranged from109% of conventional observations at GLD down to 70% of conventionatly measuredprecipitation from all 16 stations combined. With the exception of GLD, the largestpercentage differences between ASOS and conventional measurements were observedat the drier stations in the western portion of the test area.
Inthisstudy,940 days were analyzedinwhich measurableprecipitation('_0.01")ateitherASOS ortheconventionalgaugesorbothhad beenreported.Out of the940precipitationdays,ASOS reportedprecipitationon 98 days which theconventionalobservationdid notand theconventionalobservationreportedprecipitationon 105dayswhich ASOS didnot.
For the entire comparison period, ASOS and the conventional precipitationmeasurements were within 10% of each other. The number of reported measurableprecipitation days were nearly identical (ASOS: 842 versus conventional: 835) butASOS tended to report considerably more very small (0.01") events and less dayswith precipitation greater than 0.15". The conventional gauges reported noprecipitation on many of the ASOS limited precipitation days. As mentioned before,many of the ASOS limited precipitation events may have resulted from dew
24
deposition.The frequency of small events (0.04"-0.15"),which makes up a sizable
portion of precipitationdays, shows very similarfrequencies for the two sensorsOV[cKee etal.1992).
2.1.2.4 Temperature
Overall, the evaluations indicated that ASOS temperature measurements are 1" to2"F cooler than the manual observations. Possible reasons for this difference include
sensorsiting,localeffects,elevation,and dataprocessing.
Individual Site's Evaluation
Olympia, WA
In Olympia, WA the WSO HO-83 temperature sensor is located 1/8 mile south ofthe NWS office and the ASOS sensor is located 1/4 mile to the west of the office.
Both sites are over grass or natural vegetation. Comparing the maximumtemperatures of both sensors from September 1992 to June 1993, ASOS maximumtemperatures are O.8"F to 1.9"F cooler than the manual observation. The minimumtemperature comparison for the same time period also shows a cooler reading fromASOS but to a lesser degree, 0"F to 1.5"F, averaging 0.6"F. The cooler measurementsby ASOS may be explained by siting differences, but it is interesting to note that asdaily maximum temperatures increase, the difference between ASOS and the HO-83increases (NWS Western Region 1993).
Kansas City, MO
In each of the five months studied at Kansas City, MO the monthly averages ofmaximum and minimum temperatures between ASOS and the manual observations
differedby lessthan I'F. On a dailybasis,the ASOS maximum temperature rangedfrom 2"F warmer to 4"F cooler than the WSO values and the ASOS minimum
temperature ranged from 4"F warmer to 3"F cooler. ASOS maximum temperatures
were within I"F of manual observations for 95% of the days while minimum
temperatures were within I'F for 82% of the days. Similar results were seen whenhourly temperatures and dew pointswere examined. ASOS hourly temperatures werewithin I'F of manual observations for 93% of the cases and ASOS hourly dew pointmeasurements were within I'F of manual observations for 83% of the cases(Browning 1993).
Tulsa, OK
In June and October 1992, the ASOS temperatures (maximum and minimum)were approximately 2"F cooler than manual measurements. Part of the difference
may be due to sensor siting. The standard WSO sensor was located near a largeaviation ramp to the north, with a busy street about 100 feet south. The ASOS sensor
is located over a large grassy area, several hundred feet from the airport runway and asmaller taxi way. The fetch to the ASOS temperature instrument is from a largegrassy area with some trees, compared to asphalt and concrete for the standard WSOsensor (Devore and "league 1993).
25
Lincoln, NE
The overall performance of the ASOS temperature and dew point sensors duringthe 48 hour temperature test in Lincoln, NE was good. The test indicated that ASOStemperatures (wet and dry bulb) were approximately one degree (0.89"F) cooler thanthe sling psychrometer measurements. The temperature errors are within the ASOSsensor accuracy requirements (temp: 0.90"F - 1.80"F, dew pt: 1.3"F - 7.9"F).
The greatest temperature difference at Lincoln occurred shortly after sunrise(0940 LST) with calm winds and full sunshine. The sling psychrometer measured arapid rise to 10.8"F. The ASOS sensor did not detect this increase and remained sixdegrees cooler. This appeared to be related to a stratification of cooler air near asnow field with calm winds. The aspirator of the ASOS sensor may have pulledcolder air from the lower layer and consequently did not measure the true temperatureat sensor height. By I000 ].,ST, the temperatures from the two systems were againclose. The temperature sensor performance may be improved by reversing theaspirator fan to pull air from above the temperature and dew point sensors and notfrom below. It was suggested that many of the errors or differences in response maybe corrected by improvement in sensor aspiration (Grosshans and Clark 1993).
The ASOS dew point measurement proved more erratic but not beyond acceptablesystem requirements (ASOS User's Guide, B-I). On two occasions, under sunnyskies and some wind, the ASOS dew point measurement did not match the slingpsychrometer consistently, usually _porting a cooler temperature. In contrast, underovercast skies, the ASOS dew point measurement was much closer to the slingpsychrometer's, especially when the relative humidity approached 100%.
There were large temperature differences between the ASOS and the slingpsychrometer when comparing the two sites under conditions of high radiationalcooling. Under clear morning skies (0700 LST), ASOS reported -I'F while the HO-83 reported 4.9"F. By 0820 LST both sensors were within one degree. Anotherincident occurred during an evening of clearing skies that provided a sharptemperature drop. By 1800 LST ASOS reported 6.4 "F compared with 13.1"F at theold site. These two incidents indicate the lower elevation of the ASOS site is onecause of the temperature discrepancies between the two sensors (Grosshans and Clark1993).
MARD Sites
Temperature differences were quite consistent over wide ranges in temperatureduring the precommissioning analysis period of the MARD sites with ASOSreporting cooler temperatures than the manual observations. For the entire period ofcomparison, ASOS daily maximum temperatures were identical to or I'F to 2"Fcooler than the manual daily maximum temperature for 87_, of the days. Similarly,A$O$ daily minimum temperatures were identical to or I'F to 2"F cooler thanmanual daily minimum temperatures for 81% of the days. Temperature differencesbetween ASOS and manual observations of :f.3"For greater occurred on 10.7% of thedays for daily maximum temperatures and on 13.4% of the days for daily minimumtemperatures. In nearly 95% of the cases where large temperature differencesoccurred, ASOS reported cooler temperature readings than the manualinstrumentation. Large differences were more common at some of the sitessuggesting site and exposure differences or data problems.
26
The composite 16-stationaveragesystematictemperaturedifference (ASOSversusmanual)for theperiod September 1991 through May 1992 was -1.51"F fordaffy maximum temperatures and -1.36"F for daily minimum temperatures. A notabledecline in the mean systematic temperature difference between the sensors occurredduring the summer months of June through August. The composite averagedifference (ASOS versus manual) decreased to -1.05"F for daily maximum and-0.7 I'F for daily minimum temperatures.
The differences in daily maximum temperatures at Denver, CO were greater thanthe temperature difference for nearly every other station throughout the winter andspring. During the summer, however, a change occurred in the (ASOS versusmanual) temperature difference which left Denver with one of the smallesttemperature differences. This change was found to be associated with a modificationto the dew point measuring portion of ASOS HO-83 units. The modification of thedew point sensor has been made at all sites in the network to improve the quality ofeach dew point device.
Examination of hourly temperatures indicated larger temperature differencesbetween the sensors were most common from 2300 to 0400 UTC and least likelyfrom 1200 to 1700 UTC. The period from 2300 to 0400 UTC are the evening hoursacross the MARD area while 1200 to 1700 UTC are the morning hours. These are thetimes of day when temperatures rise and fall most rapidly. ASOS reports each hour atprecisely 56 minutes after the hour while manual observations are typically completedseveral minutes earlier. Since most of the time ASOS reports are cooler than manualmeasurements, these differences are enhanced by the slightly later ASOS observationtime when temperatures are falling and diminished where temperatures are rising0VlcKee et al. 1992).
2.1.2.5 Wind
Summary
The evaluations from Olympia, WA and Kansas City, MO indicated that,generally, ASOS reports wind speeds approximately 1 to 2 knots less than the manualobservations. The separation of the ASOS and station wind sensors may account fora portion of the wind speed difference.
Individual Site's Evaluation
Olympia, WA
At Olympia, WA the station 420c wind sensor is approximately 1/4 m]lc southeastof the ASOS sensor, yet monthly average wind speeds from the two sensors werewithin 1 to 2 knots. Generally, the station average wind sp_w.ds were greater thanASOS average wind speeds. During September 1992, the difference in the monthlyaverage of daily peak wind speeds., was within one mile per hour, 18.3 mph (15.9 kts)for ASOS and 18.9 mph (16.4 las) for the station sensor. The daily average windspeeds were 5.7 mph (5 kts) for ASOS and 6.6 mph (5.7 kts) for file station sensor. Ofthe 30 days, both sensors reported identical average wind speeds for 6 days, thestation sensor reported average wind speeds 1 to 4 mph (0.9 to 3.5 Ins) greater thanASOS for 18 days, and ASOS reported average wind speeds 1 to 6 mph (0.9 to 5.2kts) greater than the station sensor on 6 days.
27
During October 1992 ASOS reported daily average wind speeds less than thestation sensor. Of the 31 days, both sensors reported identical wind speeds on 3 days,the station sensor reported wind speeds 1 to 9 mph (.87 to 7.82 kts) greater thanASOS for 23 days, and ASOS reported wind speeds 1 to 3 mph (0.87 to 2.61 kts)greater than the manual sensor on 5 days. For November 1992, the ASO$ monthlyaverage peak wind speed of 15.7 mph (13.6 kts) was 2.6 mph (2.3 kts) less than thestation average peak wind speed of 18.3 mph (15.9 kts). The daily average windspeed of 5.21 mph (4.52 kts) reported by ASO$ was 0.7 mph less than the stationdaily average wind speed of 5.91 mph (5.13 kts) (Stickney 1992a,b,c).
Kansas City, MO
At Kansas City, MO during the 1992-93 wintertime comparison, the ASOSmonthly average wind speeds were consistently less than the WSO monthly averagewind speeds (ASOS average wind speeds were 1.5 knots less than the WSO reports).Daily ASOS wind speed averages ranged from 4.3 knots greater to 6.8 knots less thanthe daily WSO wind speed averages. These daily A$OS wind speed averages werewithin :i:2 knots of the WSO averages 67% of the time and within 4-1 knot 37% of thetime (Browning 1993).
2.1.2.6 Pressure
The documentationreviewed indicatedthe ASOS pressure sensors are the mostsensitive sensor of the ASOS system. Overall, the ASO$ sensors tend to reportpressure values 0.01" to 0.03" (0.34 mb to 1 mb) lower than the manual observations.
NWS maintenance personnel indicated that they are unaware of any systematicbias with the ASOS pressure sensors (Wissman 1994, personal communication).However, they did discuss some of the causes for the incorrect pressure readings fromvarious sites that have since been corrected. Some of the incorrect pressure readingswere caused by:
• On-site personnel changing the site elevation of the airport,
• On-site personnel closing the door on the pressure vent hose,
• Personnel (at two sites) comparing the ASOS pressure readings toeither antique or incorrectly calibrated pressure sensors, and
• Maintenance activities.
Individual Site's Evaluation
Olympia, WA
Olympia, WA indicated that the ASOS and station pressure sensors were the mostcompatible instruments evaluated. From September 1992 to June 1993, ASOSconsistently reported the monthly average pressure values 0.3 mb less than the stationmonthly average values (NWS Western Region 1993). Examination of the pressureobservations taken twice daily from ASOS and the manual observer duringSeptember and October 1992 indicated ASOS values were 0.1 mb to 0.5 mb less thanthe manual readings (Stickney 1992a,b).
28
Kansas City, MO
The wintertime comparison at Kansas City, MO revealed ASOS readings to beconsistently lower than WSO readings, averaging 0.02" Hg (0.68 rob) less. Whenexamined on an hourly basis, pressure differences generally ranged from 0.01" Hg(0.34 mh) to 0.03" Hg (1.02 rob) less than the WSO readings (Browning 1993).
Tulsa, OK
Comparisons between ASOS and manual pressure observations taken on 14 April1993 showed how accurate the ASOS pressure sensor can be during rapidly changingconditions. This day brought numerous showers and a few thunderstorms producinga highly fluctuating surface pressure pattern to Tulsa, OK. "Several pressure risingand falling rapidly remarks were annotated to the observations. The most significantpressure feature turned out to be a pressure jump that was caught by ASOS. Thebarogram chart that was kept at the WSO for comparative pro'poses clearly showed
just how accurate the sensor was during this event. Several significant pressurejumps have been noted since commissioning the ASOS, and each time the sensor andassociated algorithm performed flawlessly" ('reague 1993).
Sterling Research & Development Center
Of the 475 observations in the reliabilitytestdata set from the SR&DC, both
ASOS unitsreported pressure values lessthan the manual observations. A mean
pressuredifferenceof 0.03" Hg (1.02mb) was noted between one of the two ASOS
unitsand themanual observations.The mean pressuredifferencebetween the secondASOS unit and the manual observations was generally 0.02" Hg (0.68 rob)(NOAA/NWS 1993).
2.2 Reliability and Maintainability
This sectionwilldescribethe known reliabilityand maintainabilityof the ASOS
system. The firstpartof thissectionconsistsof datafrom approximately 7.5 months
of ASOS operations.The maintainabilityand reliabilityinformationpresentedin this
report includes data summarized nationallyand for the stateof Florida (FL). In
addition,comments from individualA$0$ sitesare included. The lastpan of thissectiondescribestheoptionalASOS maintenance policyprovided by the NWS.
NWS has a reliabilityreporting system called the Engineering Management
Reporting System (EMRS) which has not been specificallytailored for the
peculiaritiesof ASOS. Data provided by the EMRS for approximately 30 weeks
from November 1992 to June 1993 is shown in Table 2.7. The national regioncontains commissioned and noncommissioned sitesfrom within the east,south,
central,west, and Alaska regions. As of June I0, 1993, the National region had
approximately 245 sites and FL had 9 sites (excluding the western panhandle). Thestandard requirementsfor the parameters listedin Table 2.7 were unavailableatthis
time, therefore,a directcomparison of the systems current performance to the
requiredperformance could not be completed. However, itshould be kept in mindthatASOS is stillin the early stagesof the program and system performance will
improve in_nc.
29
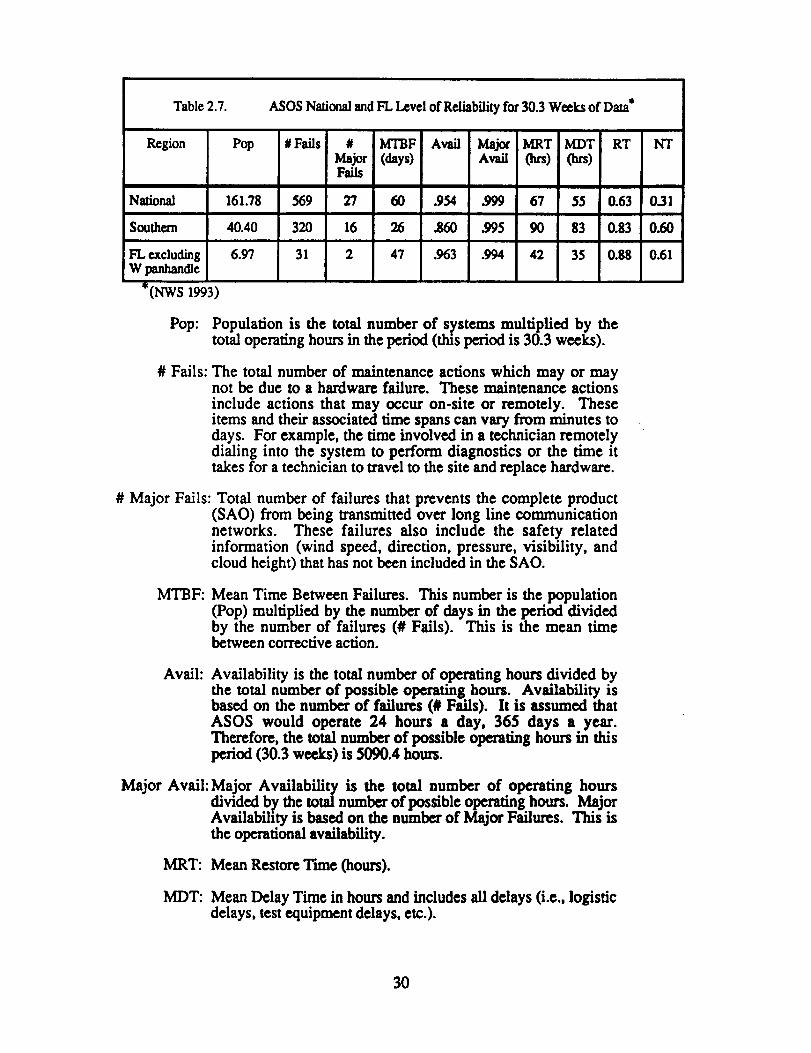
Table 2.7. ASOS National and FL Level of Reliability for 30.3 Weeks of Data*
Region
National
Southern
FL excluding 6.97W panhandle
*(NWS 1993)
Pop #Fails # MTBF Avail Major MRT MDT RT NTMajor (days) Avail 0trs) 0ws)Fails
161.78 569 27 60 .954 .999 67 55 0.63 0.31
40.40 320 16 26 .860 .995 90 83 0.83 0.60
31 2 47 .963 .994 42 35 0.88 0.61
Pop: Population is the total number of systems multiplied by thetotal operating hours in the period (this period is 30.3 weeks).
# Fails: The total number of maintenance actions which may or maynot be due to a hardware failure. These maintenance actions
include actions that may occur on-site or remotely. Theseitems and their associated time spans can vary from minutes todays. For example, the time involved in a technician remotelydialing into the system to perform diagnostics or the time ittakes for a technician to travel to the site and replace hardware.
# Major Fails: Total number of failures that prevents the complete product(SAO) from being transmitted over long line communicationnetworks. These failures also include the safety related
information (wind speed, direction, pressure, visibility, andcloud height) that has not been included in the SAO.
MTBF: Mean Time Between Failures. This number is the population(Pop) multiplied by the number of days in the period dividedby the number of failures (# Fails). This is the mean timebetween corrective action.
Avail: Availability is the total number of operating hours divided bythe total number of possible operating hours. Availability isbased on the number of failures (# Fails). It is assumed thatASOS would operate 24 hours a day, 365 days a year.Therefore, the total number of possible operating hours in thisperiod (30.3 weeks) is 5090.4 hours.
Major Avail: Major Availability is the total number of operating hours
divided by the total number of possible operating hours. MajorAvailability is based on the number of Major Failures. This isthe operational availability.
MRT: Mean Restore Time (hours).
MDT: Mean Delay Time in hours and includes all delays (i.e., logisticdelays, test equipment delays, etc.).
3O
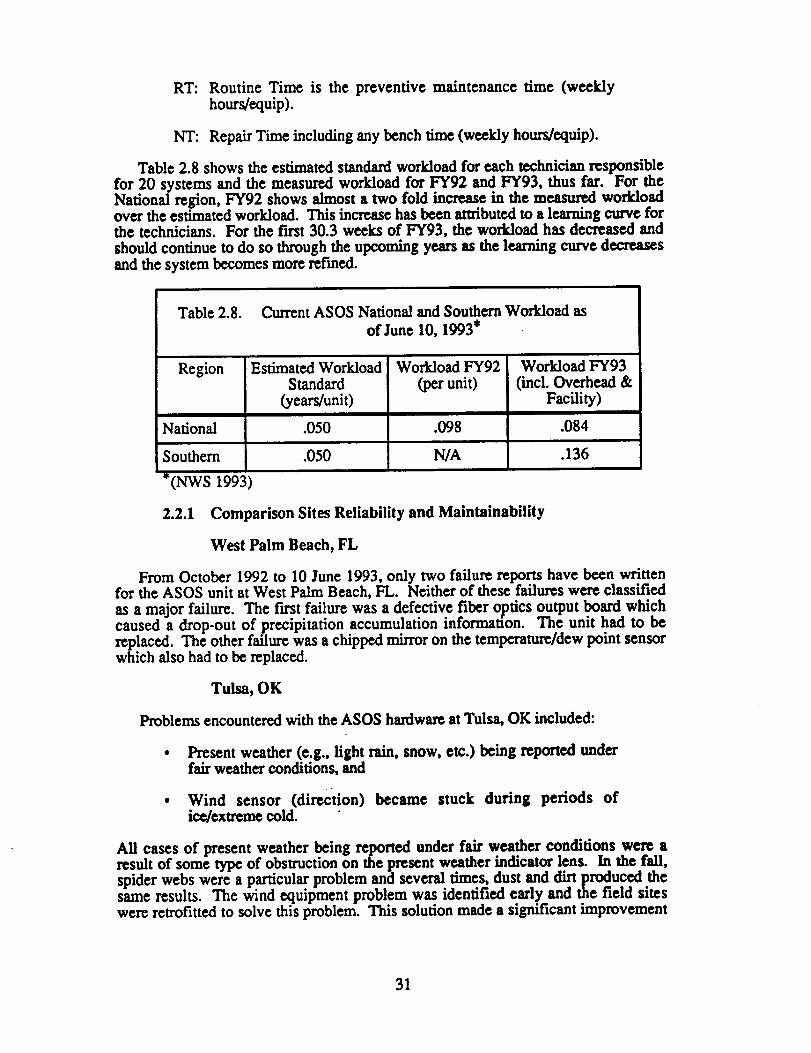
RT: Routine Time is the preventive maintenance time (weeklyhours/equip).
NT: Repair Time including any bench time (weekly hours/equip).
Table2.8shows theestimatedstandardworkloadforeach technicianresponsiblefor20 systemsand themeasured workload forFY92 and FY93, thusfar.For theNationalregion,FY92 shows almosta two foldincreasein themeasured workloadover the estimated workload. This increase has been attributed to a learning curve forthe technicians. For the first 30.3 weeks of FY93, the workload has decreased andshould continue to do so through the upcoming years as the learning curve decreasesand thesystembecomes more refined.
Table 2.8. Current ASOS National and Southern Workload asof June 10, 1993"
Region
National
Southern
*(NWS 1993
Estimated WorkloadStandard
(years/unit)
.050
.050
Workload FY92(per unit)
.O98
N/A
Workload FY93(incl. Overhead &
Facility)
.084
.136
2.2.1 Comparison Sites Reliability and Maintainability
West Palm Beach, FL
From October 1992 to 10 June 1993, only two failure reports have been writtenfor the ASOS unit at West Palm Beach, FL. Neither of these failures were classifiedas a major failure.The firstfailurewas a defectivefiberopticsoutputboard whichcaused a drop-outof precipitationaccumulationinformauon. The unithad to bereplaced.The otherfailurewas a chippedmirroron thetemperature/dewpointsensorwhich alsohad tobc replaced.
Tulsa, OK
Problemsencountered with the ASOS hardware at Tulsa,OK included:
Present weather (e.g., light rain, snow, etc.) being reported underfair weather conditions, and
Wind sensor (direction) became stuck during periods ofice/extreme cold.
All cases of present weather being reported under fair weather conditions were aresult of some type of obstruction on the present weather indicator lens. In the fall,spiderwebs were a particularproblem and severaltimes,dustand dirtproducedthesame results.The wind equipmentproblem was identifiedearlyand thefieldsiteswere retrofittedtosolvethisproblem.Thissolutionmade a significantimprovement
31
in the quality of the wind data; however, continued investigation revealed more subtleproblems which are still being evaluated (Devore and Teague 1993).
Sterling Research & Development Center
The Extended Reliability Test performed at the Sterling Research & DevelopmentCenter in Sterling, VA, focused primarily on reliability. Results of the LEDWI'sprecipitation identification reliability test indicated that the insecticidal paint used onthe LEDWI sensor head as part of Systems Management Incorporated's (SMI, asubsidiary of AAI Corp.) insect abatement program was not totally effective.Approximately three months after the application, spider activity was observed nearthe sensor head and resulted in false sensor reports of snow.
During the reliability test, an excessive number of dew point data quality failuresoccurred. One failure resulted from the reported dew point temperature exceeding theambient temperature by more than two degrees. Another failure caused a dew pointtemperature jump of nine degrees in one minute, which exceeded the data qualitylimit of six degrees in one minute. An investigation of the problem resulted in arevised optical loop adjustment procedure for the hygrothermometers which was
subsequently, validated during the ASOS test at Sterling, VA and also at severalremote test sltes.
Also during the reliability test, there were two cases where the wind directionparameter was reported erroneously by ASOS. Another report documented erraticperformance in the wind direction sensor. Subsequent disassembly and inspection ofthe wind direction bottle revealed that moisture was present. The bottle was returned
to SMI in late April 1992 for examination (NOAA/NWS 1993).
In the March 1993 issue of the ASOS Progress Report, Ulinski states in his article
'Near Term ASOS Changes' that "the wind speed and direction sensor will beimproved to circumvent moisture penetration which causes the sensors to seize upand to improve performance and reliability. Corrosion makes the wind speed anddirection sensor bottles difficult to remove from the wind cross arms. As a result, a
change in design was made for the sensor bottle and wind sensor bearing. Currently,the fixes are being tested before the changes are fielded."
No pressure problems were reported during the reliability test, however, eachpressure sensor was connected into one manifold. The proper configurationaccording to the Federal Siting Standards, includes independent venting for eachsensor with separate outside vents (NOAA/NWS 1993).
The reliability of the two ASOS systems at the Sterling Rese, m_h & DevelopmentCenter during the test period from 6 March 1992 to 2 April 1993 are shown in Table2.9. The Multiple Sensor system and the Single Sensor system contain the sameinstruments with the exception that the Multiple Sensor system has two ceilometersand two visibility sensors instead of just one. The computation of Mean TimeBetween Failures (MTBF) is based on the ratio of total number of system operationalhours to the total number of failures. The MTBF estimates include only those failures
which resulted in the replacement of Field Replaceable Units (FRU) to restore theASOS to normal operation.
32
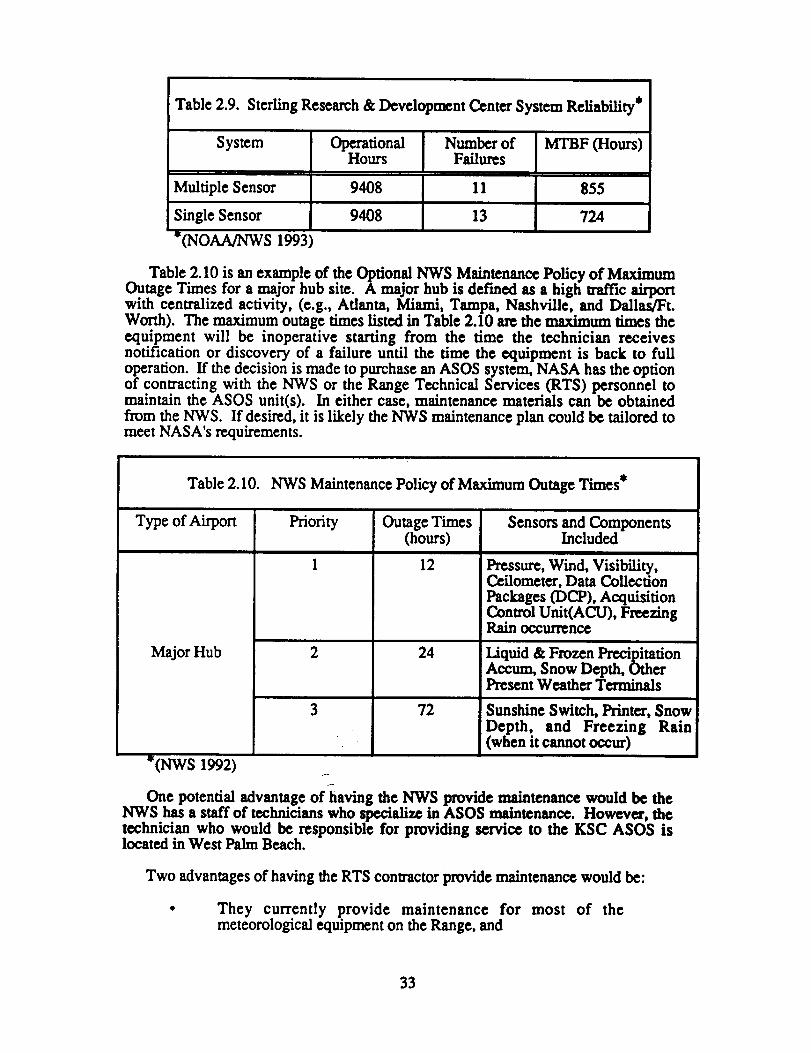
Table2.9. SterlingResearch& DevelopmentCenter System Reliability*
System Operational Number ofHours Failures
Multiple Sensor 9408
Single Sensor 9408
*(NOAA/NWS 1993)
MTBF (Hours)
11 855
13 724
Table 2.10 is an example of the Optional NWS Maintenance Policy of MaximmnOutage Times for a major hub site. A major hub is defined as a high traffic airportwith centralizedactivity,(e.g.,Atlanta, Miami, Tampa, Nashville, and Dallas/Ft.
Worth). The maximum outage times listed in Table 2.10 are the maximum times theequipment will be inoperative starting from the time the technician receivesnotification or discovery of a failure until the time the equipment is back to fulloperation. If the decision is made to purchase an ASOS system, NASA has the optionof contracting with the NWS or the Range Technical Services (RTS) personnel tomaintain the ASOS unit(s). In either case, maintenance materials can be obtained
from the NWS. If desired, it is likely the NWS maintenance plan could be tailored tomeet NASA's requirements.
Table 2.10. NWS Maintenance Policyof Maximum Outage Times*
Type of Airport
Major Hub
*(NWS 1992)
Priority
2
3
Outage Times
(hours)
12
24
72
Sensors and ComponentsIncluded
Pressure, Wind, Visibility,Ceilometer, Data CollectionPackages (DC.P), AcquisitionControlUnit(ACU), FreezingRain occurrence
Liquid & Frozen PrecipitationAccum, Snow Depth, OtherPresent Weather Terminals
Sunshine Switch, Printer, Snow
Depth, and Freezing Rain(when it cannot occur)
One potential advantage °fhaving the NWS provide maintenance would be the
NWS has a staff of technicians who specialize in ASOS maintenance. However, thetechnician who would be responsible for providing service to the KSC ASOS islocated in West Palm Beach.
Two advantages of having the RTS contractorprovide maintenance would be:
They currently provide maintenance for most of themeteorological equipment on the Range, and
33
Outage times could be reduced because the contractor is on-siteand can respond more quickly.
In additionto the major hub sitedefinition,the NWS maintenance plan includes
two other types of ASOS installations,towered and small. The priorityitems alongwith the sensors and components are the same for the towered and small as for the
major hub. However, the maximum outage dines may differamong the threedifferentclassifications.
System Status and Plans
Since ASOS is a new system and is still in the early stages of the program,improvements, modifications,and updates are a continuingoccurrence. Listedbelow
isthe statusof the ASOS system and the plans for 1994 presented by Mr. RichardReynolds, ASOS Program Manager, at the FifthConference on Aviation Weather
Systems on 5 August 1993.
2.3 System Status
Software Version 2.0
- Fieldtestunderway, plan toimplement 1 August 1993
- Contains FAA ATC modificationsand specialslogic
Visibility
- Data quality has been fixed and currentlyworking onheater
- AvailableFall1993
LEDWI
- Improving performance in heavy snowAvailableFall1993
Rain Gauge
Insufficientcatch,currentlybeing testedAvailableFall1993
• HygrothermometerTesting Review Board approval, 19 July 1993
• Wind
Redesigned to correct problems
• Pressure
Maintenance note distributed on venting blockage
• Freezing Rain
Sensor approved for operational test
2.4 Plans for 1994
InstallSoftware Version 2.I (winterload):
- Add dailyand monthly smnmary message toAFOS
- Complete Standard Hydrometeorological ExchangeFormat (SHEF) output change requests
34
- Incorporate and test freezing rain algorithm changes- Dial backup for Alaska and Hawaii
• Meteorological Discontinuity and Backup Algorithms makeobservations more representative (visibility, sky conditions)
• Complete FAA final tower equipment development and test
• Initiate data continuity study (follow-on for commission sites)
• Add hot keys for augmentation-aviation parameters
• Complete freezing rain sensor operational test and commissionsensors
35
3.0 Requirements Analysis
This section discusses the sm'face observation requirements for the support ofshuttle launch and landing operations, airfield operations, and the SMG's shuttleweather support simulations and shows its relationship to ASOS' capabilities. Afterthe unfulfilled requirements are known, the means to satisfy some requirementswithout the use of human augmentation are described. The use of humanaugmentation to satisfy the remaining requirements is described in Section 5,Proposed Concepts of Operations for ASOS at the SLF.
The surface observation requirements were obtained from the Joint OperatingProcedures for Meteorological Support Between the Eastern Space and Missile Centerand the John F. Kennedy Space Center (1990) and the Launch and Landing ProgramRequirements Documentation (1992). ASOS' capabilities were obtained from theASOS User's Guide (1992).
The requirements were compared to ASOS capabilities to determine whichcomponents of the observation requirements could be satisfied by ASOS and whichcomponents must be met by other means (e.g., human augmentation, additionalsensors, etc.). Tables 3.1, 3.2, and 3.3 contain comparison results of ASOScapabilities versus surface observation requirements for the various operations andsimulations. The following conventions are used in the comparison tables:
:The requirement is satisfied by ASOS.
_- :The requirement is partially satisfied by ASOS.
:The requirement is not satisfied by ASOS.
3.1 Unsatisfied Requirement Remedies
It was shown in the previous section that the standard ASOS configuration doesnot satisfy all observation requirements at the SLF. This subsection describes ASOSenhancements that can reduce the number of unsatisfied requirements.
• Ceilings and Sky Conditions above 12 000 Feet
The ASOS ceilometer is currently configured to determine the ceiling and skyconditions up to 12 000 feet. One solution for reporting ceiling and sky conditionsabove 12 000 feet is to replace ASOS Vaisala CT12K ceilometer with the BelfortModel 7013C laser ceilometer. This insmunent is capable of der_cting cloud heightsfrom 50 to 25 000 feet and has a reported accuracy of i25 feet (Belfort Instrument1992). This, coupled with the idea of implementing multiple ceilometers, is apotential solution for a more precise reporting of ceiling and sky conditions up to25 000 feet. The ASOS meteorological discontinuity algorithm (planned for 1994)incorporates the use of multiple sensors (ccilomctcrs and visibility scnsors) to providebetter representation of the surrounding sky conditions. The replacement of the12 000 foot ASOS Vaisala ceilometer with the 25 000 foot Belfort ceilometer wouldnot require any modification of the ceiling and sky condition algorithm. However,this sensor change would require minor engineering changes to the software thatdisplays the observation reports (e.g., CLR BLO 250 instead of CLR BLO 120).
36

Table 3.1. Relationship of ASOS and Manual Observing Capabilities To AirfieldOperations Surface Observation Requirements*
Airfield OperationsObservation Requirements
Manual ASOS
Standard:
Comments
Observations when Aircraft /
Missile Mishap Occurs
Ceiling
Sky Conditions
Prevailing Visibility
Present Weather
lTemperature & Dew Point
Wind Direction & Speed
Altimeter Setting
Remarks
,¢
,J
,/
q-
,/
,/
,/
ASOS provides all standard SAOinformation every minute. However,any specific information relevant to amishap may not be available withoutthe use of human augmentation
ASOS can report ceilings up to12 000 feet only
ASOS can report sky conditions upto 12 000 feet only
ASOS can determine (point)visibility at the sensor location only
iASOS cannot differentiate between
haze and smoke, rain and rain
shower, and light rain and drizzle
ASOS remarks include varyingconditions (wind direction, cig, sky
condition, vis), pressure changes,max/min temp, hrly & aecum precip
Special:
Tornado, Funnel Cloud, or
Waterspout
Thunderstorm
Wind Shifts and Peaks
Precipitation Begins or Ends
Hail Begins or Ends
Freezing PrecipitationBegins or Changes
* Assessment assumes
-,/
q
,/
.¢ q-
;tandard / SOS co_observation deficiencies can be remedied
Cannot be detected by ASOS
Cannot be detected by ASOS(algorithm development in progress)
ASOS cannot detect hail and will
generally report hail as heavy rain
ASOS will report freezingprecipitation as either rain or snowdepending on scintillation pattern
_figuration. Many of the ASOSby hardware and/or software
additions/modifications as discussed in Section 3.1.
37
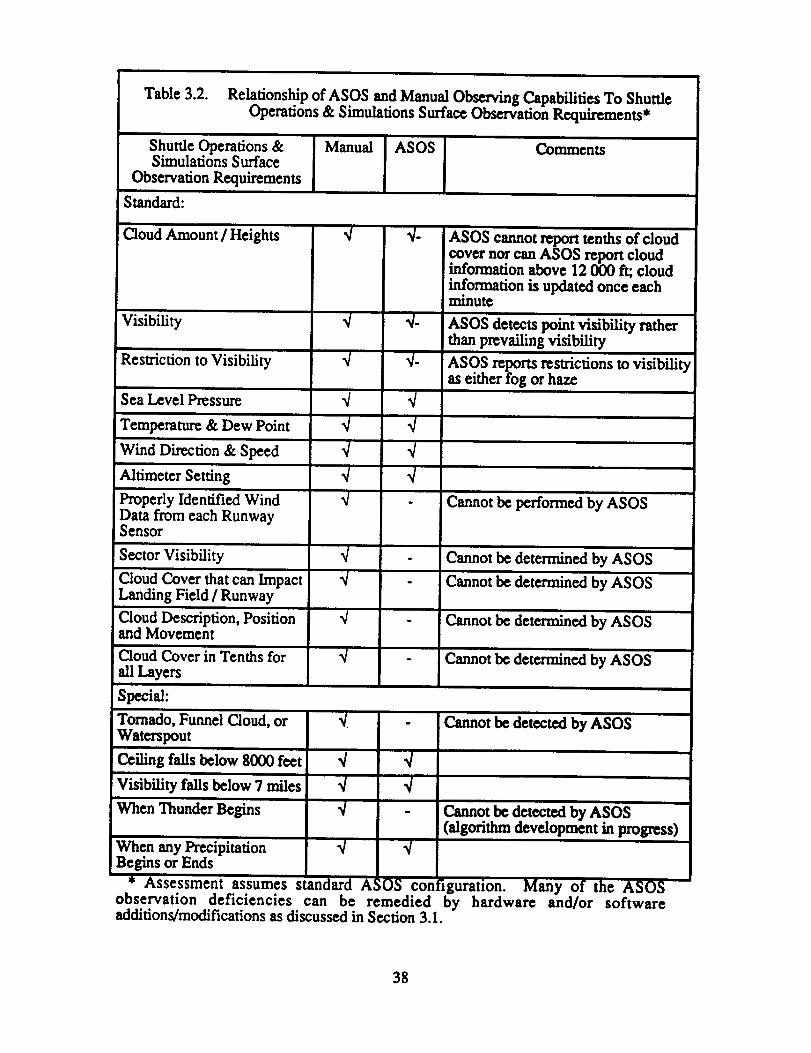
Table3.2. Relationshipof ASOSandManualObservingCapabilitiesTo ShuttleOperations& SimulationsSurfaceObservationRequirements*
Shuttle Operations &Simulations Surface
Observation Requirements
Standard:
Manual ASOS Comments
Cloud Amount / Heights
Visibility
Restrictionto Visibility
Sea Level Pressure
Temperature & Dew Point
Wind Direction& Speed
AltimeterSetting
Properly IdentifiedWind
Data from each RunwaySensor
SectorVisibility
Cloud Cover thatcan Impact
Landing Field/Runway
Cloud Description,Positionand Movement
Cloud Cover inTenths for
allLayers
Special:
,4
`4
`4
`4
`4"4
,4
Tornado, Funnel Cloud, or
Waterspout
Ceiling falls below 8000 feet `4
Visibilityfallsbelow 7 miles `4
When Thunder Begins
When any PrecipitationBegins or Ends
* Assessment assumes stan,
,4
`4
`4
`4
ASOS cannot reporttenthsof cloud
cover nor can ASOS reportcloudinformationabove 12 000 R; cloud
informationisupdated once eachminute
ASOS detects point visibility ratherthan prevailing visibility
ASOS reports restrictionstovisibilityaseitherfog or haze
Cannot be performed by ASOS
- Cannot be determined by ASOS
- Cannot be determined by ASOS
`4
Cannot be determined by ASOS
Cannot be determined by ASOS
Cannot be detected by ASOS
Cannot be detected by ASOS
(algorithm development in progress)
observation deficiencies can be remedied by hardware and/or softwareadditions/modificationsas discussed in Section3. I.
38

Table 3.3. Relationship of ASOS and Manual Observing Capabilities To SpaceflightMeteorology Group & Flight Director's Surface Observation
Requirements*
Spaceflight MeteorologyGroup & Flight Director's
Surface Observation
Requirements
Manual ASOS Comments
Standard:
Ceiling
Sky Conditions
Prevailing Visibility
Present Weather
Temperature & Dew Point
Wind Direction & Speed
Altimeter Setting
Remarks
Tenths of Cloud Coverbelow I0 000 feet
,4
-4
-4-4
-4-4
-4
-4-
IASOS detects ceilings up to 12 000feet only
ASOS r_orts sky conditions up to12 000 feet only
ASOS can determine (point)visibility at the sensor location only
ASOS cannot differentiate betweenhaze and smoke, rain and rain
shower, and fight rain and drizzle
-4
-4 ASOS computes and updates the 2-
minute average wind every 5 seconds
-4
-4- ASOS remarks include varying
conditions (wind direction, cig, skycondition, vis), pressure changes,max/rain temp, hrly & accum pre_p
- Cannot be determined by ASOS
Special:
Tornado, Funnel Cloud, or
Waterspout
Thunderstorm
Wind Shifts
Precipitation Begins or Ends
Hail Begins or Ends
-4
-4
-4
-4
Freezing Precipitation _ -4Begins or Changes in ..Intensity
* Assessment assumes standard ._
- Cannot be detected by ASOS
- Cannot be detected by ASOS
-4
SOS co_
ASOS cannot detect hail and will
generally report hail as heavy rain
ASOS will report freezingprecipitation as either rain or snow
depending on scintillation pattern
figuration. Many of the ASOSobservation deficiencies can be remedied by hardware and/or softwareadditions/modifications as discussed in Section 3.1.
39
Another method for determining ceilings and sky conditions above 12 000 feet isto incorporate a complementary system that detects cloud height and fractional cloudamount for mid and upper levels using GOES data. Information from GOES-7 willbe used to provide mid and upper clouds to support 100 ASOS sites by the end of1993. In addition, the satellite derived cloud cover data is planned as a standardproduct when the GOES-I becomes operational. In the case of a GOES-7 failure, abackup technique that uses Metcosat-3 water vapor data is being developed at theUniversity of Wisconsin (Schreiner and EUrod 1993).
The results of a 30 day NWS reliability evaluation of this sateUite-derived cloudcover data indicated that total sky cover for clouds above 12 000 feet was correct in60% to 75% of the cases with respect to the cloud cover category (CLIL SCT, BKN,OVC), and the difference between satellite and manual observations was one categoryor less in 90% to 95% of the cases. Significant errors of two or more categoriesoccurred in only 5% to 10% of the cases (Schreiner and Ellrod 1993).
• Tenths of Cloud Cover Below I0 000 Feet
Currently, tenths of cloud cover are not reported by ASOS. Communications withseveral ceilometer vendors indicated that no available ceilometer reports tenths ofcloud cover. It was suggested that this information could be retrieved through higherlevel algorithms. Indeed, the ASOS sky condition algorithm internally computestenths of cloud cover which is then degraded to category of cloud coverage (CLRBLO 120, SCT, BKN, OVC). However, only the category and cloud layer height forthe three (if necessary) cloud layers is displayed in the SAO report. Modification ofthe software could be performed to report the tenths of cloud cover for the threeavailable layers. However, the accuracy of the tenths of cloud cover is unknown.
• Sector and Prevailing Visibility
With the current configuration of ASOS, point visibility is the only type ofvisibility information reported. A suggested solution for reporting sector visibilityand partial solution for prevailing visibility is the use of multiple sensors. Onemethod of providing sector visibility and information similar to prevailing visibility isto place ASOS visibility sensors near the approach ends of the runway and one to thewest of the SLF (or some other triangle configuration) and then process the data usingthe ASOS meteorological discontinuity algorithm (planned for 1994).
• Thunderstorm, When Thunder Begins
A thunderstorm algorithm currendy exists for the ASOS system but has not yetbeen implemented and tested. When ASOS is interfaced to the FAA's AWOS DataAcquisition System (ADAS), ASOS will not only provide ADAS with minute byminute updates of weather conditions, but it will also retrieve lightning data from theNWS's nationwide lightning detection network via ADAS (Sessa 1993). ASOS willexamine the ADAS data every minute for an indication of a thunderstorm within thepast minute and store that data for 12 hours. When three or more lighming strikes arereported within 10 miles of the station during the preceding 15 minutes, a specialobservation is issued which contains a "T" and a thunderstorm onset remark. If fewerthan three strikes have been reported during the last 15 minutes, the "T" will beremoved and the thunderstorm ending remark will be included (NOAA 1993). It isnot yet known when this thunderstorm reporting capability will be added to ASOS.
4O
Another approach to the requirement to report when thunder begins is to ingestdata from a local lightning system and then process the data using the ASOSalgorithm. Examples of local lightning systems include the Lightning Location andProtection (LLP), Lightning Detection And Ranging (LDAR), or the NationalLighming Detection Network.
41
4.0 Meteorological Sensors in the St. Johns River Valley
The Applied Meteorology Unit's preliminary report on fog developing at the SLF(Wheeler et al. 1993) suggested the need for Automated Weather Stations (AWS) in
the St. Johns River Valley. The majority of the fog events analyzed in that n:portindicate that fog or stratus develops at the SLF or is advected in from the southwest,west, or northwest. With limited data (wind direction and speed) coming from theregion west of the Indian River, the suggestion was made to install additionalinstrumentation to the existing towers and also install AWS west of Interstate
Highway 95.
There are two approaches to providing this information. One solution would be toinstall one or more ASOS units in the St. Johns River Valley. A standard ASOSproduction unit would provide real-time information on cloud conditions, visibilitywith weather restrictions, present weather, temperature, dew point, pressure and winddirection and speed. Alternatively, an ASOS could be comprised of just a ceilometerand visibility sensor to provide cloud conditions and visibility with weatherrestrictions. However, another solution which may be more cost effective, is to take
advantage of the upgraded Weather Information Network Display System (WINDS)network.
Until recently, the wind towers to the west of the Indian River (Figure 4.1) 0nly
contained wind direction and speed sensors. However, the WINDS is being upgradedand instrumentation to measure temperature and relative humidity has been added to
most of the towers. The upgraded WINDS will provide forecasters with importantinformation to facilitate and improve fog forecasting (e.g., light/calm winds, smalldew point depression).
In addition to the ongoing WINDS upgrade, installing visibility sensors at severalof the towers west of the Indian River would be beneficial. The upgraded WINDSwill have the capability of supporting additional sensors at the mainland towers. One
approach would be to purchase and place four visibility sensors in the St. Johns RiverValley. Possible locations of these sensors could be towers 0819, 2016, 2202, and
1000, northwest, west, southwest, and south-southwest, respectively, of the SLF.Figure 4.1 shows a map of the surrounding area with labeled towers and the suggestedlocations for the sensors identified by the large, bold numbers.
These visibility sensors would provide the Spaceflight Meteorology Group (SMG)and Range Weather Operations (RWO) forecasters real-time informauon on visibilityconditions to the west of the SLF. This information would allow the forecaster to
detect fog development over the St: Johns River Valley and improve fog forecastingskill in support of Shuttle operations.
The biggest technical problem foreseen in installing the sensors is upgrading thesolar power subsystem at each site to accommodate the increased power demands ofthe visibility sensor. In addition to upgrading the power subsystem at the site, theRemote Transmission Unit (RTU) software would need to be mcxiified as well as the
base station software to collect and broadcast the data on various output formats(MIDDS, MARSS, etc.) (Meier 1993).
In addition to the visibility sensors, ceilometers could also be added to theWINDS network. This would further enhance fog forecasting skill plus provide cloud
42
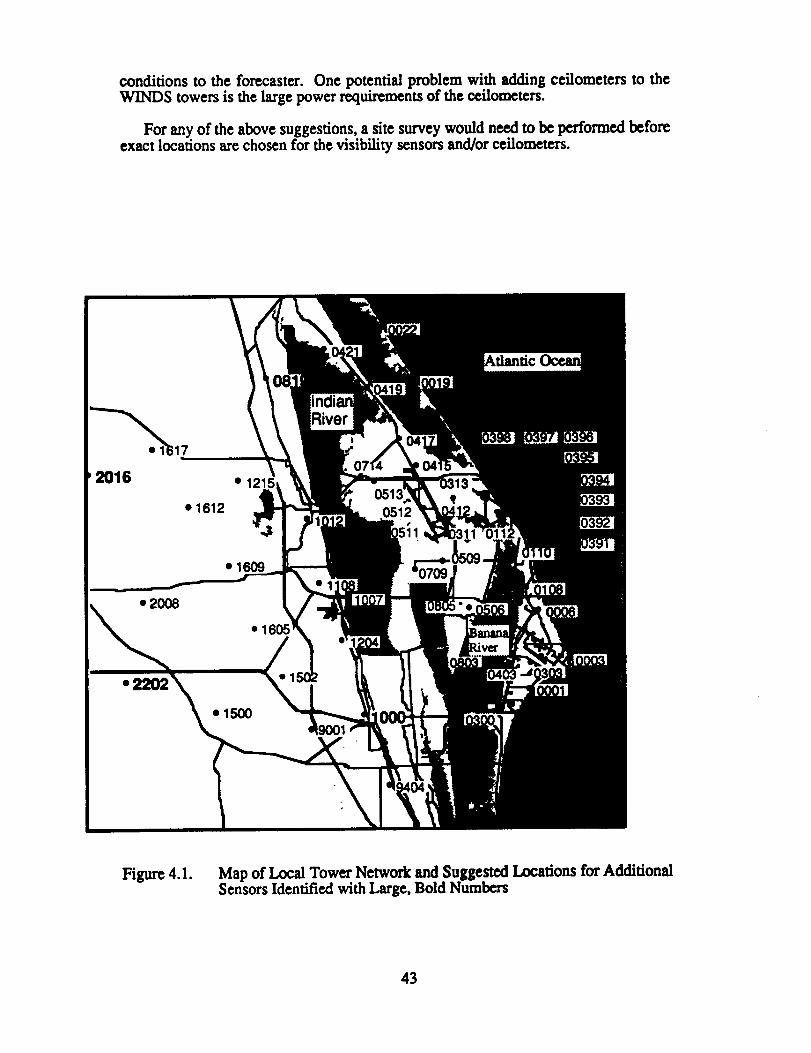
conditions to the forecaster. One potential problem with adding ceilometers to theWINDS towers is the large power requirements of the ceilometers.
For any of the above suggestions, a site survey would need to be performed beforeexact locations are chosen for the visibility sensors and/or ceilometers.
2016
• ;17
e16120513
• 2OO8
•1609
• 160_
•1500
Figure 4.1. Map of Local Tower Network and Suggested Locations for AdditionalSensors Identified with Large, Bold Numbers
43

5.0 Proposed Concepts of Operations for ASOS at the SLF
This section describes the optimum ASOS configuration for use at the SLY. Thisconfiguration includes some modifications/enhancements to the standard ASOSconfiguration which were described in more detail under the Unsatisfied RequirementRemedies, Section 3.1. This section also presents the proposed concepts of
operations for ASOS at the SLY.
It is important to note the AMU is not recomn_nding whether to deploy ASOS atthe SLF or not. The AMU is only recommending how to configure and use ASOS if
it is deployed at the SLY.
5.1 Recommended ASOS Configuration for use at SLF
The recommended ASOS confi_Du'ation is based on the standard ASOSproduction unit and includes modificauons to enhance its capabilities with respect toSLY observation requirements. In addition, the recommended configuration containssuggestions for placement of sensors and display terminals.
Standard ASOS Production Units [illustrated in Figures 1.1 and 1.2)
The ASOS Combined Sensor group consists of the following sensors:
• Temperature• Dew Point• Ceilometer
• Visibility sensor• Wind Direction and Speed• Precipitation Accumulation and Identification• Pressure sensors
The ASOS Touchdown Sensor group consists of the following sensors:• Ceilometer, and
• Visibility sensor
Recommended ASOS Sensor Grouv
Recommended ASOS sensor group for use at SLF consists of (at aminimum):
• Two ASOS Combined Sensor group units plus one Touchdown
Sensor group unit.
Enhancements include:
- Modification of the Touchdown Sensor group to include windinstrmnentation.
- Modification of the ASOS sky condition algorithm to appendtenths of cloud cover to the observation report.
- Replacement of the current ASOS ceilometer (12 000 fo?tcapability) with the Belfort ceilometer (25 000 foot capability).
This configuration would provide three ceilometers, three visibility sensors, andthree wind sensors. One sensor could be used as the primary and two as secondary.
44

Therecommendedlocationfor the two ASOS combined sensor group units is oneat each of the approach ends of the runway. The recommended location for the ASOStouchdown sensor group unit is to the west of the SLF.
Other possible ASOS sensor groups for use at the SLF include:• Three Combined Sensor groups.• One Combined Sensor group and two Touchdown Sensor groups.
Recommended Locations for ASOS Inout and Display Terminals
The recommended locations for the input and display terminals are:
• One input terminal located at the Landing Aids Control Building0.ACB) on the south end of SLF nmway.
• One input terminal at the SLF Control Tower (midfield on SLFrunway).
• One display terminal in the RWO working location (can be astand-alone display terminal or the data could be integrated into theMeteorological Monitoring System or intoanotherdisplaysystem).
• One displayterminalinthe SMG's working location.
• One input terminal in the ASOS CPU rack to be used for
maintenance purposes only,
The recommended ASOS configuration cannot alone meet all the requirements tosupport airfield operations, shuttle launch and landing operations, and the SMG'sshuttle weather support simulations. However, the recommended ASOSconfiguration satisfies more of the requirements than the standard ASOSconfiguration. Table 5.1 contains all requirements of the various operations andsimulations, listed in Tables 3.1, 3.2, and 3.3, that were not satisfied by the standardASOS configuration but are either partially satisfied or satisfied by the recommendedASOS configuration. Table 5.2 contains the requirements of the various operationsand simulations that still remain unsatisfied or only partially satisfied with therecommended ASOS configuration.
5.2 Proposed Concept of Operations #I
The proposed concept of operations is based on having an ASOS system at theSLF and using LACB personnel to augment the ASOS observations. This concept ofoperations would requirethe LACB personnel, who would be tasked to augment
ASOS observations, to be trained as certified weather observers. Another keycomponent of this concept of operatioas is to move the weather instrumentation fromWeather Station B to a location at or near the LACB. This insmunentation would
then be used as backup in the case of a partial or complete ASOS failure. If thisoccurred, LACB personnel would be required to take manual observations of themissing weather elements. This concept of operations would not require any weatherobservers at Weather Station B. This concept of operations would fulfill all of theSLF surface observation requirements 115.5 hours per week.
Key components of this concept of operations include:
• Installing the recommended ASOS sensor group at the SLF.
• Installing the ASOS input and display terminals at'therecommended locations.
45

• Moving the weather instrumentation from Weather Station B to alocation at or near the LACB.
• Monitoring the data from three SLF wind towers on MIDDS ordedicated equipt_nt. In the current procedure, the data fi'om threeSI._ wind towers are manually added to the remarks section of theobservation during shuttle launch and landing operations.
• Having LACB personnel augment the hourly and special ASOSobservations during their normal operating hours (0600 to 2230local time, 7 days/week) in addition to their regular duties andduring shuttle operations to include cloud tenths, type and height,prevailing visibility, present weather, and additive remarks. Inaddition to these elements, the LACB personnel should be capableof taking observations of the elements listed in Tables 3.1, 3.2, and3.3, if the need should arise (i.e., failure of an ASOS component).
Table 5.1. Observation Requirements Now Partially Satisfied or Satisfied by theRecommended ASOS Configuration
Observation Requirements Std RecomASOS ASOS
cei g `7- ,7
Sky Conditions (incl. cloud '_- ,7amount and height)
Prevailing Visibility - ,7-
Sector Visibility
Cloud Cover that can ImpactLandingField/Runway
Cloud Description, Positionand Movement
Cloud Cover in Tenths for allLayers
Comments
The use of the 25 000 ft ccilometer willhelp to satisfy this requirement
The use of the 25 000 fl ceilometer willhelp tosatisfythis requirement
The use of multiple visibility sensorswill provide more visibilityinformation but will not satisfy therequirement
The use of multiple visibility sensorswill help satisfy this requirement
Multiple eeflometers will help satisfythis requirement but still cannotdemrmine cloud type (CO, CB, etc.)
Multiple eeilometers will help indicatesky condition changes over the areas ofthe different eeil_
Modifying ASOS sky conditionalgorithm to append tenths of cloudcover to obs report will help satisfy thisrequirement but the accuracy of thetenths of cloud is unknown
46
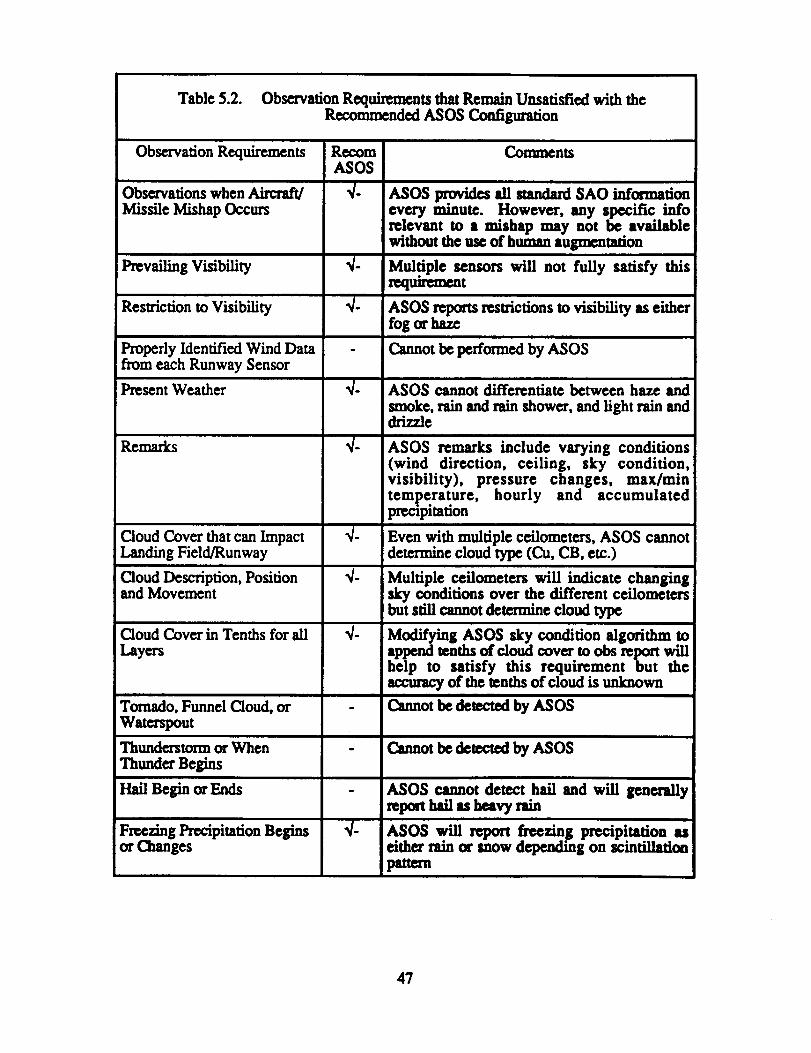
Table5.2. Observation Requirements that Remain Unsatisfied with theRecommended ASOS Configuration
Observation Requirements
Observations when Aircraft/Missile Mishap Occurs
Prevailing Visibility
Restriction to Visibility
Properly Identified Wind Datafrom each Runway Sensor
Present Weather
Remarks
Cloud Cover that can ImpactLanding Field/Runway
Cloud Description, Positionand Movement
Cloud Cover in Tenths for allLayers
Tornado, Funnel Cloud, orWaterspout
Reoom
ASOS
Thunderstorm or WhenThunder Begins
Hail Begin or Ends
Freezing Precipitation Beginsor Changes
Comments
ASOS provides all standard SAO infm-mationevery minute. However, any specific inforelevant to a mishap may not be availablewithout the use of human augmentation
Multiple senmrs will not fully satisfy thisreq_t
ASOS reports restrictions to visibility as eitherfog or haze
Cannot be performed by ASOS
ASOS cannot differentiate between haze andsmoke, rain and rain shower, and light rain and idrizzle
ASOS remarks include varying conditions(wind direction, ceiling, sky condition,visibility), pressure changes, max/raintemperature, hourly and accumulatedprecipitation
Even with multiple ceilometers, ASOS cannotdetermine cloud type (Cu, CB, etc.)
Multiple ceilometers will indicate changingsky conditions over the different ceilometersbut still cannot determine cloud type
Modifying ASOS sky condition algorithm toappend tenths of cloud cov_ to obs report willhelp to satisfy this requirement but theaccuracy of the tenths of cloud is unknown
Cannot be detected by ASOS
}Cannot bedetectedby ASOS
ASOS cannot detect hail and will generallyreport hail as heavy rain
ASOS will report freezing precipitation aseither rain or mow depending on scintillationpattern
47
An additional recommended component of this concept of operations includes:
• Having the RWO observer gather weather observations fromobservers stationed at the Range Operations Control Center(ROCC), Weather Station A, and Vehicle Assembly Building(NAB) during shuttle launch and landing operations (from theVAB only during launch operations). The observer would thenenter the observations into a text file on MIDDS for distribution to
SMO and MSFC. An example of the type of data contained in thetext file follows:
- ROCC: cloud tenths, type and height, present weather andadditive remarks.
- VAB: cloud tenths, type and height, present weather andadditive remarks.
- Weather Station A: complete observation including additiveremarks.
A reduction in Air Force weather observers is scheduled and may
impact the RWO's ability to perform this procedure.
Advantages of Concept of Operations #I
The proposed concept of operations provides a reduction in costsince no weather observers would be required at Weather StationB. Weather observations are currently being taken by the Range
Technical Support Contractor personnel at Weather Station B.These weather observers maintain a continuous weather watch 24
hours a day, 365 days a year.
• The LACB provides a better view of the SLF runway than WeatherStation B. The LACB is located next to the SLF runway and an
observer at the LACB can see a portion of the runway. Weather
Station B is located approximately 3000 feet east of the SLFrunway and low bushes and trees prevent an observer at WeatherStation B from seeing the SLF runway.
• The proposed concept of operations provides supplemental data16.5 hours/day, 7 days a week. A certified weather observer willbe at the LACB for 16.5 hours a day, 7 days a week and duringshuttle launch and landing operations to input human observationsof"
Cloud tenths, _ and heightPrevailing visioilityPresent weatherAdditive remarks.
The proposed concept of operations provides a consolidated textfile of local weather observations (Weather Station A, VAB, andROCC) on MIDDS during shuttle launch and landing operations.
• The use of multiple sensors will provide a more complete depictionof the meteorological conditions at the SLF. The current algorithmfor multiple ceilometers assumes the use of two or more
48
ceilometers separated by a distance of at least three miles. Thecurrent algorithm for multiple visibility sensors assumes the use ofthree visibility sensors separated by a distance of at least two miles(NO/C_ 1993).
• The use of the recommended ASOS units provides:- Consistent observadons.
- Sky conditions up to 25 000 feet.- Tenths of cloud cover.
Defidencies/Disadvantages of Concept of Operations #I
• The cost of acquiring and maintaining the ASOS system.
• There would be an additional cost associated with training LACBpersonnel to become certified weather observers.
• The cost of moving the weather instrumentation from WeatherStation B to a location at or near the LACB.
The accuracy of ASOS tenths of cloud cover is unknown whenused as a stand-alone unit (every day from 2230 to 0600 local time;52.5 hours per week).
• The accuracy of ASOS tenths of cloud cover depends upon cloudmovement and adequate spacing of the ceilometers.
ASOS observations would not include information about
prevailing visibility, haft, thunderstorms and additive remarks from2230 to 0600 local time. However, point visibility would beavailable 24 hours a day from the three ASOS sensor groups at theSLF. If desired, thunderstorm reports could be included in ASOSobservations by ingesting the National Lightning DetectionNetwork, Lightning Location and Protection system, or possibly
Li.ghtning Detection and Ranging system data into the SLF ASOSumt.
5.3 Proposed Concept of Operations #2
The second proposed concept of operations is based on having an ASOS system at
the SLF and using a Weather Station B observer with limited duty hours to augmentASOS observations. In the case of a partial or complete failure of ASOS, theinstrumentation currently at Weather Station B will be used as backup forobservations until the ASOS equipment is returned to operational status. Thisconcept of operations would fulfill all SLF surface observation requirements 40 hoursper week.
Key components of this concept of operations include:
• Installing the recommended ASOS sensor group at the SLF.
• Installing the ASOS input and display terminals at therecommended locations.
49
• Installing one ASOS input terminal at Weather Station B.
• Monitoring the data from three SLF wind towers on MIDDS or
dedicated equipment. In the era'rent procedure, the data from threeSLF wind towers are manually added to the remarks section of theobservation during shuttle launch and landing operations.
• Having an observer at Weather Station B with limited duty hoursto augment/modify ASOS observations to include cloud tenths,type and height, prevailing visibility, present weather, and additive
remarks. Observers would be used at the SLF for five 8-hour daysMonday-Friday and during shuttle launch and landing operations.During non-operation times, the 8-hour shifts could be missionvariable work hours depending on the next shuttle launch andlanding times or have set times such as:
October through April:(fog season)May through September:(thunderstorm season).
0400 to 1300 local time
1000 to 1900 local time
During shuttle launch operations, the proposed weather observerhours would be from launch minus six hours to launch plus twohours from two days prior to launch through launch day. Duringshuttle landing operations, the proposed weather observer hours
would be from landing minus 6 hours to landing plus 2 hours fromone day prior to landing through landing day.
• Having personnel at the LACB and the Control Tower augment theASOS observation ordy when a weather observer was not on dutyat Weather Station B. The augmentation by LACB and ControlTower personnel would be limited to current observation duties
and no additional training would be necessary. The currentobservation duties of the LACB and Control Tower personnelinclude reporting observed visibilities less than four miles, anyrapid changes in weather phenomena that have not yet beenreported (i.e., hail, lighming, tornado, and thunderstorm), and anyrelevant weather information contained in pilot v_xr,,s.
An additional recommended component of this concept of operations includes:
• Having the RWO observer gather weather observations fromobservers stationed at the ROCC, Weather Station A, and Vehicle
Assembly Building (VAB) during shuttle launch and landingoperations (from the VAB only during launch operations). Theobserver would then enter the observations into a text file on
MIDDS for distribution to SMG and MSFC. An example of thetype of data contained in the text file follows:
- ROCC: cloud tenths, type and height, present weather andadditive x_,s.
- VAB: cloud tenths, type and height, present weather andadditive _'ks.
- Weather Station A: complete observation including additiverem_ks.
50
A reduction in Air Force weather observers is scheduled and mayimpact the RWO's ability to perform this procedure.
Advantages of Concept of Operations 02
• The proposed concept of operations provides a potential reductionin cost since there would be a reduced number of hours of manual
weather observations from Weather Station B. Currently, manualweather observations are taken at Weather Station B 24 hours a
day, 365 days a year. In the proposed concept of operations,manual weather observations would only be taken 40 hours perweek.
• The proposed concept of operations would not require additionalweather observer training for LACB personnel. Proposed conceptof operations #1 would require additional weather observertraining for LACB personnel.
The proposed concept of operations provides a consolidated textfoe of local weather observations (Weather Station A, VAB, and
ROCC) on MIDDS during shuttle launch and landing operations.
• The use of multiple sensors will provide a more complete depictionof the meteorological conditions at the SLF. The current algorithmfor multiple ceilometers assumes the use of two or moreceilometers separated by a distance of at least three miles. Thecurrent algorithm for multiple visibility sensors assumes the use ofthree visibility sensors separated by a distance of at least two miles0_OAA 1993).
The use of the recommended ASOS units provides:Consistent observations.
Sky conditions up to 25 000 feet.Tenths of cloud cover.
Deficiencies/Disadvantages of Concept of Operations 02
• The cost of acquiring and maintaining the ASOS system.
The cost of manual weather observations at Weather Station B
would be greater for proposed concept of operations #2 ascompared to proposed concept of operations #1.
• The number of hours per week of manual weather observationswould be less for -proposed concept of operations 02 (Le., 40 hoursa week at Weathe/Sfiition B) as compared to proposed concept ofoperations #1 (115.5 hours per week at the LACB).
• The accuracy of ASOS tenths of cloud cover is unknown whenused as a stand-alone unit (128 hours out of 168 hours per week).
• The accuracy of ASOS tenths of cloud cover depends upon cloudmovement and adequate spacing of the ceilometers.
51
ASOS observations would not include information about
prevailing visibility, hail, thunderstorms and additive remarks from2230 to 0600 local time. However, point visibility would beavailable 24 hours a day from the three ASOS _ groups at theSLF. If desired, thunderstorm reports could be included in ASOSobservations by ingesting the National Lighming DetectionNetwork, Lightning Location and Protection system, or possibly
Li.ghtning Detection and Ranging system data into the SLF ASOSunit.
Additional Options for the Concept of Operations
Any or all of the followinlg three options may be added to enhance concept ofoperations.#1 or #2. Option A revolves a transition period between the time an ASOSsystem Is installed at the SLF and the time the ASOS provides the official weatherobservations for the SLF. Option B involves augmenting the ASOS observationsduring the off hours of the LACB personnel to ensure that all surface observationrequirements are met 24 hours a day. Option C involves the use of mechanicalinstrumentation for backup purposes rather than the weather instrumentation fromWeather Station B.
Option A: Transition Period After Installing ASOS at the SLF
After the ASOS unit is installed and operating at the SLF, manual and ASOSobservations would be taken concurrently at the SLF for a period of at least six
months. This would provide data for comparison tests between human and ASOSobservations and allow the weather support community to develop confidence in the
quality and accuracy of the ASOS observations. In addition, it gives the weathersupport community time to evaluate the multiple sensors/multiple sensor algorithmsof the ASOS at the SLF and, depending upon the transition time period, time toincorporate improvements in ASOS sensors and algorithms. The only disadvantageof this option is the increased cost associated with taking both manual and ASOSobservations concurrently at the SLF.
Option B: Augmented ASOS Observations 24-Hours a Day
This option is based on using a Weather Station B observer to augment the ASOSobservations during the off-duty hours of the LACB certified weather observer toensure augmented ASOS observations 24 hours a day. The Weather Station Bobserver would augment the ASOS observations from 2230 local to 0600 local eachday, 7 days a week from either Weather Station B or the LACB. Advantages to thisoption include:
• The fulfillment of all SLF surface observation requirements.
• Having augmented ASOS observations 24 hours a day that includecloud tenths,Wpe and height, prevailing visibility, present weather,and additive remarks.
The disadvantage to this option would be the labor cost to provide theseobservations.
52
Option C: The Use of Mechanical Instrumentation for BackupPurposes
This option is based on using mechanical insmunentation (i.e., hand-held sensors)for backup purposes rather than the Weather Station B equipment. As a keycomponent in the proposed concepts of operations #1, the weather instrumentation atWeather Station B would be moved to a location at of near the LACB and be used asbackup in the case of a partial or complete ASOS failure. However, the cost ofmoving the weather insmunentation from Weather Station B to near or at the LACBand maintaining this equipment may outweigh the benefits of using the eqmpment forstricdy backup purposes. Cunendy, mechanical instrumentation is used for backuppurposes to Weather Station B. Advantages to this option include:
• The cost savings of disassembling and relocating the WeatherStation B equipment and its associated communication lines.
• The cost effectiveness of using the mechanical instrumentation.
• A reduction in the maintenance cost of the Weather Station Bequipment.
The disadvantage to this option would be the decreased accuracy of themechanical instrumentation.
53
6.0 Summary and Conclusion
6.1 Summary
This evaluation has focused on how ASOS, in conjunction with other systems andprocedures, could be used at the SLF to satisfy SLF surface observationsrequirements. These observation requirements include standard airfield operations
rc_. uirements,, shuttle operations and simulations requirements, and SMG and Flight
Director rcqmrements. These reqmrements wen: compared to ASOS capabilities todetermine which components of the observation requn'cments can be satisfied by astandard ASOS configuration and which components cannot. A further evaluation ofASOS involved the acquisition of documentation concerning the performancecharacteristics, reliability, and maintainability of ASOS. The documentationcontained results of previous evaluations of system performance includingcomparisons of ASOS data to the manual observations to help show data similaritiesand differences, and ASOS strengths and limitations.
The AMU developed recommendations for configurations and concepts ofoperations for the use of ASOS at the SLF. It is important to note the AMU is notproviding a recommendation on whether to use ASOS at the SLF. Rather. we have
recommended specific configurations and concepts of operations for its effective Use.The ASOS configuration recommended for use at the SLF is based on the standard
ASOS production unit and includes modifications to enhance its capabilities withrespect to SLF observation requirements. The proposed concepts of operations arebased on using an ASOS with limited supplemental manual weather observations tosatisfy all SLF surface observation requirements for selected time periods. One of theproposed concept of operations is based on having an ASOS system at the SLF andusing LACB personnel to augment the ASOS observations. The f_cond proposedconcept of operations is based on having an ASOS system at the SLF and using aWeather Station B observer with limited duty hours to augment ASOS. Ultimately, itis the user community that must assess ASOS merits and deficiencies in terms ofmeeting the stated requirements.
This evaluation has also produced recommendations for additional meteorologicalsensors in the St. Johns River Valley. Since there is limited meteorological data(wind direction and speed) collected in the St. Johns River Valley and fog o1"stratus isadvected into the SLF from that region, the AMU recommends the installation ofadditional instrumentation in the St Johns River Valley. One solution would be to
install one or more ASOS .um.'..'.tsin the St. Johns River Valley. However, it is probablymore effective to install vistbility sensors on the existing WINDS tow..e_s in the SLJohns River Valley. These sensors would provide forecasters wsth real-time
information on visibility conditions to the west of the SLF and help detect fog
development to ".unp.rove fog forecasting skill in support of Shuttle operations. Inaddition to the visibility sensors, ceilometers could also be added to the WINDSnetwork. This would further enhance fog forecasting skill plus provide cloudconditions to the forecaster.
6.2 Condusion
After reviewing ASOS' capabilities in relation to SLF surface observationrequirements, it was determined that ASOS alone cannot fulfill all the surfaceobservation requirements. However, many of the ASOS observation deficiencies can
54
be remedied by hardware and/or software Kldition_modifications to the standardASOS configuration. Some of these enhancements include upgrading the currenthardware, modifying the production software, and making use of multiple sensors.
55
7.0 References
AAI Corporation, 1991: pamphlet, Automated Surface Observing System ASOS.
AAPSMI Systems Management Incorporated, 1992: Automated Surface ObservingSystem (ASOS), ASOS Marketing.
Belfort Instrument, 1992: Specifications of Laser CcUomcter.
Bradley, J.T. and R. Lewis, 1993: Representativeness and Responsiveness ofAutomated Weather Systems. Preprint$ , 5th International Conference onAviation Weather Systems, 2-6 August, Vienna, VA.
Browning, P.A., 1993: A Wintertime Comparison of ASOS and Manual Observationsat Kansas City International Airport. Preprint_ , 13¢h Conference on WeatherAnalysis andForecasu'ng, 2-6 August, Vienna, VA, 178-151.
Computer Science Raytheon, 1993: Specifications of SI.F Instrumentation.
Cornick, J.C. and T.B. McKee, 1993: A Comparison of Ceiling and VisibilityObservations for NWS Manned Observation Sitesand ASOS Sites,Colorado
StateUniversity,71 pp.
Devore, D.R. and M.A. Teague, 1993: ASOS in Tulsa, OK A Look at Post-Commissioning Activities. ASOS Progress Report, Vol. IX, No. 1, March 1993,1-3.
Grayson T.H., 1993a: Memorandum, ASOS/Manual Comparative Report #I NWSSouthern Region, April, 3 pp.
Grayson T.H., 1993b: Memorandum, ASOS/Manual Comparative Report #2 NWSSouthern Region, May, 4 pp.
Grayson T.H., 1993c: Memorandum, ASOS/Manual Comparative Report #3 NWSSouthern Region, May, 5 pp.
Grayson T.I-L, 1993d: Memorandum, ASOS/Manual Comparative Report #4 NW'SSouthern Region, July,8 pp.
Grosshans, G. and P. Clark, 1993: Draft, Lincoln ASOS Temperature Test January13-15, 1993, 25 pp.
Hnndar, 1993: Remote Environmental Monitoring System Product Catalog, 29 pp.
Joint Operating Procedm'es for Meteorological Support Between the Eastern Spaceand Missile Center and the John F. Kennedy Space Center, 3 December 1990.ESMC No. 15E-3-7, 8 pp.
Launch and Landing Program Requirements Documentation/PSP-Volume l-Shuttle,
Surface Observations.. CONUS.. Launch, RTLS, AOA, EOM, 2 April 1992.
Maier, M., 1993: Memorandum, WINDS System Capabilities, 6 July.
56
McKee, T.B., N.J. Doesken, and J. Kleist, 1992: Climate Data Continuity withASOS-1992 Final Report (A Precommissioning Comparison of Temperature andPrecipitation), Colorado Climate Center, 72 pp.
Nadolski, V.L., and J.T. Bradley, 1991: The Use of a Laser Ceflometer for SkyCondition Determination. Preprints, 7th Symposium on MeteorologicalObservations and Instrumentation, 14-18 January, New Orleans, LA, J186-J190.
National Oceanic and Atmospheric Administration, 1992:ASO5 Automated SurfaceObserving System User'sGuide" , June, 57 pp.
National Oceanic and Atmospheric Administration, 1993: Draft, Algorithms For theAutomated Surface Observing System (ASOS), March, 91 pp.
National Oceanic and Atmospheric Administration/National Weather Service, 1993:
Draft, ASOS Extended Reliability Test Report, 23 June, 49 pp.
National Weather Service Central Region, 1992: Memorandum. NWS' AutomatedEquipment Proves It Can Perform Even During Severe Storm.
National Weather Service Western Region, 1993: An ASOS to Visual Observations
Comparison at the National Weather Service, Olympia, WA, September 1992Through June 1993.
National Weather Service, 1992: ASOS Maintenance Policy (H-54). ASOSMaintenance Plan NWS Southern Region, Appendix B, January.
National Weather Service, 1993:FY-1993 Engineering Management ReportingSystem Report for Automated Surface Observing System. 10 June.
Office of the Federal Coordinator (OFCM), 1987: Standards for SitingMeteorological Sensors at Airports. FCM-S4-1987, Washington, D.C., 17 pp.
Reynolds, R.R., 1993: Slides, ASOS Program Review for the Fifth Conference onAviation Weather Systems, 5 August.
Schreiner, A.J. and G.P. Ellrod, 1993: Cloud Cover Information Derived from GOES-
VAS to Augment ASOS Above 12,000 Ft. Preprints, 5th InternationalCoherence on Aviation Weather Systems, 2-6 August, Vienna, VA, 135-139.
Sessa, EJ., 1993: Automated Surface Observing System. The Journal of/dr Tr_icControl, April-June.
Stickney, F.W., 1992a: Memorandum, Statistical Comparison ASOS Vs. ManualSurface Airways Observations, National Weather Service Olympia, WA forSeptember 1992, October. •
Stickney, F.W., 1992b: Memorandum, Statistical Comparison of ASOS Vs. ManualSurface Airways Observations National Weather Service Olympia, WA forOctober 1992, November.
Stickney, F.W., 1992c: Memorandum. ASOS-MAPSO Comparison for November1992, National Weather Service Olympia, WA, December.
57
Systems Management Incorporated, 199:3: Automated Surface Observing System(ASOS) System Description, 26 pp.
Teague, M., 1992: ASOS Summary for June 1-15, 1992, 3 pp.
Teague, M., 1993: An Examination of the ASOS Performance During Low Ceilings,Low Visibilities, and Heavy Precipitation, 7 pp.
UIinski,T.,1993:NearTerm ASOS Changes.ASOS Pro&re._Report,VoL IX,No. I,March,9.
Wheeler, M.M., M.IC Atchison, G.E. Taylor, J.T. Warburton, R.S. Schumann, 1993:Preliminary Report, Analysis of Rapidly Developing Fog at the Kennedy SpaceCenter, 15 April, NASA Contractor Report NASI0-11844, 48-49.
58
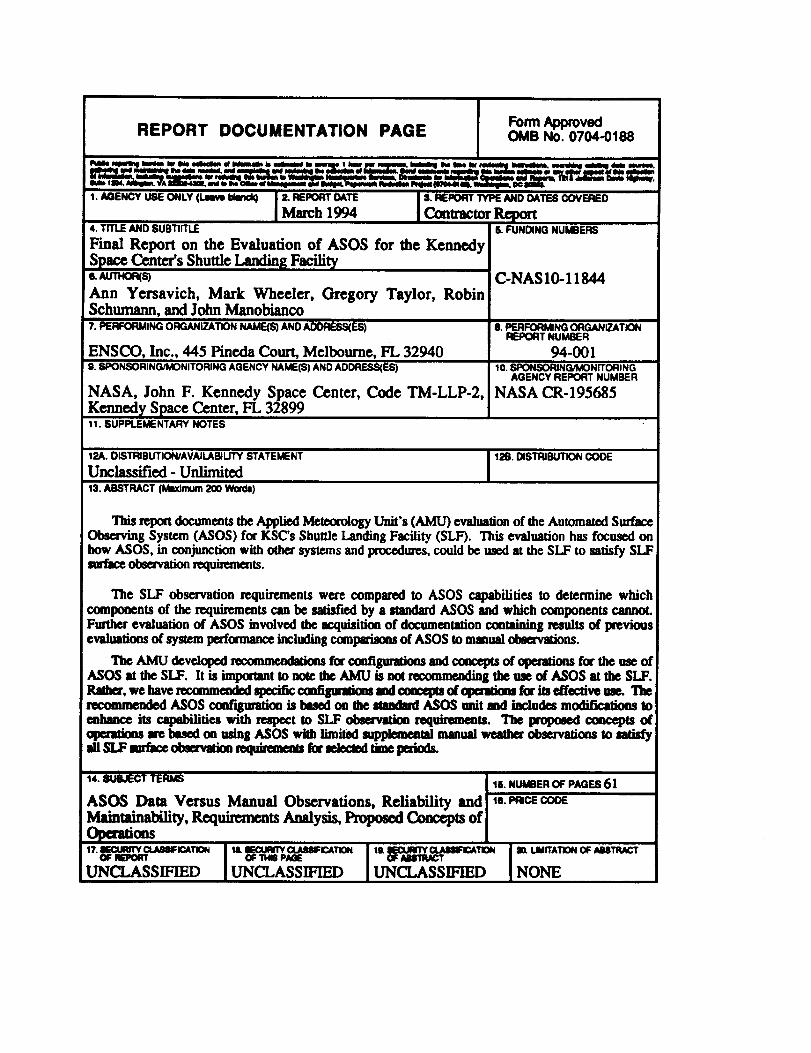
FormApprovedREPORT DOCUMENTATION PAGE _B No. 0704-0188
1. AGENCY _E ONLY (_ _ 2. _ _ 3. REPORT TYPE AND _ _V_O
MarchZ994 ContractorRqx_4, TITLE AND SUBTIITLE 8. FUNDING NUMBERS
Final Report on the Evaluation of ASOS for the KennedySpace Center's Shuttle Landing Facilit_e._,J_4o_s) C-NAS 10-11844
Ann Yersavich, Mark Wheeler, Gregory Taylor, RobinSchumann, and John Manobianco7. PERFORMING ORGANIZATION NAME(S) AND ADDRF.SS(ES)
ENSCO, Inc., 445 Pineda Court, Melbourne, FL 329409._:_:)NSORING/MONITORINGAGENCYNAME(S)ANDADDRF.S_ES)
NASA, John F. Kennedy Space Center, Code TM-LLP-2,Kenned}, Space Center, FL 32899
8. PERFORMNG ORGANIZATIONREPORT NUMBER
94-00110. _N_NR_ING
AGENCY R_ NUMBER
NASA CR-195685
11.SUPPLEMENTAl:IVNOTES
12A.Ol6TRIBUTION/AVAILABILITYSTATEMENTUnclassified- Unlimited
12B. DIS_N CODE
15. ABSTRACT (Maximum 200 Words)
This report documents the Applied Meteorology Unit's (AMU) evaluation of the Automated SurfaceObserving System (ASOS) for KSC's Shuttle Landing Facility (SLF). This evaluation has focused ofthow ASOS, in conjunction with other systems and procedures, could be used at the SLF to satisfy SLFmrface observat_ requirements.
The SLF observation requirements were compared to ASOS capabilities to determine whichcomponents of the requirementscan be satisfiedby a standard ASOS and which compononts cannoLFurther evaluation of ASOS involved the acquisition of documentation containing results of previousevaluations of system performance including comparisons of ASOS to manual obsm, afions.
Tbe AMU developed recommondafions for coefigmatiom and concepts of operations for the use ofASOS at the SLF. It is imlmmnt to note the AMU is not recommeading tbe me of ASOS at the SLF.Rad_, we haveremnmonded _x:ific mafilpnfiom and _ d _ fer iB effective _. 'I'mrecommended ASOS conf_mafion is lined on the mmdad ASOS unit md includes m_ toeahance its capabilities with respect to SI.]F ob_'vltim requirements. The prepcJed concepts _l
are based on .sing ASOS with limited mppimon_ manual wea_er observ_ons to _
14. SUBJECT TERMS 15. NUMBER OF PAGES 61
ASOS Data Versus Manual Observations, Reliability and _e.mc_ coosMaintainability, Req_ts Analysis, Proposed Concepts ofopeaeo.s17. aEOt,lllf]_ UAII_FIr._TION _ IIr_OIJ_fl'V OLA_III:CATION lit 1ECUNTY U.AII:ICATI_N I). LIMITATION OF A88TRAOT
OF REPORT U: M PAGE OF MSTRA_
UNCLASSIFIED UNCLASSIFIED UNCLASSIFIED NONE


![ASOS Product Improvement Implementation Plan Implementation... · ASOS Product Improvement Implementation Plan [Addendum I] For ASOS Processor Board Upgrade February 14, 2002 U.S](https://img.pdfslide.us/doc/110x75/5b4ffd477f8b9a346e8d7182/asos-product-improvement-implementation-plan-implementation-asos-product.jpg)