Embed Size (px)
Citation preview

THE CARNEGIE FOUNDATION FOR THE ADVANCEMENT OF TEACHING Problem Solut ion Explorat ion Papers
5 1 V i s t a L a n e S t a n f o r d , C A 9 4 3 0 5 • t e l e p h o n e : 6 5 0 . 5 6 6 . 5 1 0 0 • f a x : 6 5 0 . 3 2 6 . 0 2 7 8 • w w w . c a r n e g i e f o u n d a t i o n . o r g
FINAL REPORT ON THE DEVELOPMENTAL MATHEMATICS AND LANGUAGE PROJECT
Guadalupe Valdés
Stanford University
&
Bernard Gifford University of California, Berkeley

Final Report on the Developmental Mathematics and Language Project Part I
Guadalupe Valdés & Bernard Gifford
The Developmental Mathematics and Language Project
The Mathematics and Language Project focused broadly on non-English-background
students and, more specifically, on a rapidly growing population of community college
students known as Generation 1.5 (young people who have grown up in this country and
been educated in American schools). While some attention has recently been given to
English language learners (ELLs) at the community college level (e.g., Bunch, 2008),
there is no information available about the demands made by mathematics instruction on
the varying levels of English language proficiencies found in non-English-background
community college students.
The long term goal of the Language and Mathematics Project is to inform the design and
implementation of developmental mathematics courses that can appropriately meet the
needs of this particularly vulnerable group of community college students. In order to do
so, the project was designed to inform an initiative by the Carnegie Foundation focusing
on developmental mathematics at community colleges about the role of language
limitations in the study of mathematics and about the ways in which the receptive and
productive competencies of ELLs at different levels of English development interact with
(a) instructional delivery systems (e.g., lectures); (b) text materials of different types; (c)
classroom activities of different types; and (d) assessment systems.
Focus of the work
During the six month planning period, therefore, we carried out the following two tasks:

DRAFT
2
Task 1: Review of the Literature
Task 1 involved our updating an existing review of the literature on language proficiency
in the study of mathematics (Gifford & Valdés, 2003) in order to inform our collective
understanding of the role of language limitations in moving spontaneously from natural
language to the mathematical writing system, mathematical discourse, or symbolic
language used in mathematics. The original review of the literature was current up to the
year 2000 but did not include more recent work on language in the study of mathematics,
and on newly-promoted pedagogical approaches for working with limited English
proficient students in mathematics classrooms. A fully updated review was produced as a
deliverable at the end of the project period and is included as Part I of this report.
Task 2: Exploratory study of the experiences of linguistic minority students in mathematics courses in community colleges
Task 2 involved an exploratory study of the experiences of language minority students in
math departments in three community colleges. Given limitations of time and resources,
we initially selected three institutions that were well known to members of the team and
that offered opportunities for the examination of the role of language in the study of
developmental mathematics. A description of this work is included as Part II of this
report.

DRAFT
3
Part I
Generation 1.5 Students and the Linguistic Demands of Community College Mathematics Classes: A Review of the
Literature
Prepared for The Carnegie Foundation for the Advancement of Teaching by Bernard Gifford1 and Karen Thompson2
Summer 2009
1 University of California, Berkeley 2 Stanford University

DRAFT
4
Introduction
As President Barack Obama highlighted when announcing a new initiative focusing on
creating more college graduates in the United States, community colleges comprise the
largest portion of the country’s higher education system, enrolling more than six million
students (White House Press Office, 2009). More students of color and students from
low-income backgrounds attend community colleges than attend four-year colleges and
universities (National Center for Education Statistics, 2008a). However, once enrolled,
only small percentages of community college students obtain a certificate or degree
(National Center for Education Statistics, 2008a). Many struggle in remedial classes,
particularly remedial mathematics classes (Bahr, 2008; Bueschel, 2004).
In this literature review, we first provide an overview of the community college context,
including a description of who attends community colleges, how academically prepared
community college students are, what happens to community college students once they
enroll, and what the characteristics of teaching and learning in community colleges are.
Following this overview, we focus on a distinct subset of the community college
population: individuals who are non-native English speakers but who have attended U.S.
schools for many years. This group has been dubbed generation 1.5 students by
numerous researchers (cf. Bueschel, 2004; Bunch, 2008; Harklau, 2003; ICAS ESL Task
Force, 2006). After describing characteristics of generation 1.5 students, we then turn our
focus to the challenges generation 1.5 students face in their community college
mathematics classes. We analyze the existing literature on the linguistic demands of
mathematics that all students encounter and describe the particular linguistic challenges
mathematics presents to students receiving instruction in a second language. We
highlight the specific linguistic demands of mathematics at the community college level,
particularly the linguistic demands of algebra. We conclude by reviewing literature that
describes curricular innovations in community college mathematics classes. It is our
hope that by describing the special linguistic challenges that generation 1.5 students
encounter in community college math classes, in the future educators may design more
effective curriculum and intervention programs specifically targeting the needs of

DRAFT
5
generation 1.5 students in these classes, enabling this subset of the population to develop
greater mathematical skills and experience more success in postsecondary education.
Community College Context
Who Attends Community Colleges?
More than six million Americans attend community colleges; California’s community
colleges alone enroll more than 1.4 million students (National Center for Education
Statistics, 2008a). Furthermore, community college enrollments are increasing rapidly,
up 17 percent from 1996 to 2006 (National Center for Education Statistics, 2008a).
Community colleges serve a more diverse pool of students than other segments of higher
education, enrolling more low-income students than four-year colleges and universities
(National Center for Education Statistics, 2008a). In addition, more than 40 percent of
community college students have parents who did not attend college, compared to
approximately one-fourth of students at four-year colleges and universities (National
Center for Education Statistics, 2008a).
Community colleges also enroll more minority students than other segments of the higher
education system. In 2003-04, 15 percent of community college students were African-
American and 14 percent were Hispanic. In comparison, in public four-year colleges and
universities, 10 percent of students were African-American and 8 percent were Latino
(National Center for Education Statistics, 2008b). More than half of all Latino students
enrolled in higher education are enrolled in community colleges (Saenz, 2002).
Community colleges provide a more affordable higher education option, allow for part-
time enrollment and flexible scheduling, permitting students to maintain full-time jobs.
In addition, community colleges are typically located near residential areas, allowing
students to continue to live with their families. Finally, community colleges generally
have open enrollment processes, enabling all students, regardless of their academic
backgrounds, to attend.
Students have a wide variety of reasons for attending community colleges, not all of
which include degree attainment. According to the most recent national data available,

DRAFT
6
approximately one-third of community college students list future transfer to a four-year
university as one of their principal reasons for attending community college, while 43
percent list obtaining an associate’s degree and 17 percent list obtaining a certificate.
Forty-six percent of students report enrolling for personal interest and 42 percent report
enrolling in order to obtain job skills (National Center for Education Statistics, 2008a).
How academically prepared are community college students?
Many students entering community colleges have significant academic needs and get
placed in non-credit-bearing developmental education classes in mathematics,
reading/writing, or English as a Second Language.3 Detailed data on the academic
readiness of entering community college students at a national level are difficult to come
by for several reasons. First, no uniform assessment and placement system exists across
community college campuses. For example, within California alone, community colleges
use 16 different placement tests in mathematics and English (Brown & Niemi, 2007).
There is also wide variability among community colleges in the cutoff scores for these
placement tests, the amount of student discretion involved in final course selection, the
amount of information about high school course completion used in the placement
process, and the linkages between the standards emphasized in high school courses and
those assessed by the placement exams (Brown & Niemi, 2007; Marwick, 2004; Shelton
& Brown, 2008). Given this variability in the assessment and placement process, a
student who might be placed in a developmental math class at one community college
could easily be placed in a credit-bearing math class at a different community college if
the college used a different placement test or a different cutoff score. This fact
complicates interpretation of the data about the percentages of students enrolled in
developmental courses at community colleges. Nonetheless, these percentages represent
one of the only means of assessing the academic readiness of community college
students, so they still merit consideration.
3 Non-credit bearing courses designed to meet the needs of students not ready for college-level coursework go by many different names in the research literature, including developmental, remedial, and basic skills classes. The various terms are used interchangeably here.

DRAFT
7
Estimates of the percentage of entering community college students who require some
type of remedial coursework range from 33 percent to 95 percent, depending on the
group of students being considered and on the definition of remedial coursework
(Bueschel, 2004). For example, one study using a sample of more than 85,000 California
community college students found that 81 percent of students were initially referred to a
remedial math course (Bahr, 2008). On the other hand, a national study with a sample of
more than 250,000 community college students found that 59 percent of students were
referred to developmental mathematics courses, while 33 percent of students were
referred to developmental reading courses (Bailey, Jeong, & Cho, 2008). Regardless of
the exact figure, it is clear that a large portion of students enter community colleges with
substantial academic needs. Furthermore, African-American and Latino community
college students are more likely to be placed in developmental courses than their peers
(Rosin & Wilson, 2008).
Percentages of community college students requiring English as a Second Language
classes are even more difficult to establish, as no national data is gathered and
concentrations of non-native English speakers vary widely by state and community.
Some community colleges have only minimal numbers of ESL classes, while others serve
thousands of students. Santa Monica Community College in California houses the largest
ESL program in the world, and ESL is now the largest department at Miami Dade
Community College (Crandall & Sheppard, 2004).
What happens to community college students once they enroll?
Because a sizeable portion of community college students do not intend to attain a
degree, traditional methods for calculating graduation rates and degree attainment do not
apply, complicating data reporting. Instead, researchers must confine their samples to
community college students who initially intended to complete a degree and compute the
rate of degree attainment among that group. Even then, gathering accurate data on
community college outcomes presents numerous challenges. Nonetheless, the data that
do exist suggest that more than half of students who enroll in community colleges never
complete a postsecondary degree (Kane & Rouse, 1999, cited in Fry, 2002; National

DRAFT
8
Center of Education Statistics, 2009). Among only those community college students
who intended to transfer to a four-year university, after three years, 39 percent had left
school without completing a degree (National Center of Education Statistics, 2008a). In
California, researchers found that after six years, only 24 percent of community college
students had completed any type of degree or transferred to a four-year university
(Moore, Shulock, & Ceja, 2007).
Latino and African-American community college students have degree attainment,
persistence and transfer rates that are lower than those of their peers (California
Postsecondary Education Commission, 2007; Moore, Shulock, Ceja, & Lang, 2007;
National Center for Education Statistics, 2009). Of students who began their
postsecondary education at a community college, after six years only 34 percent of Latino
students and 38 percent of African Americans had achieved any type of degree, compared
to more than 40 percent of white and Asian students (National Center for Education
Statistics, 2009). While Latino students represented one-third of the community college
population in California, they represented only one-quarter of the students who
successfully transferred to a four-year university (California Postsecondary Education
Commission, 2007). African-American community college students in California
transferred at just half the rate of their proportion of the community college population
(California Postsecondary Education Commission, 2007).
Students who are assigned to developmental courses are particularly unlikely to attain a
degree or transfer to a four-year university. In his study of more than 85,000 California
community college students, Bahr (2008) found, “Eighty-four percent of the
students who did not complete a credential and did not transfer were remedial math
students who did not remediate successfully” (p. 446). Unfortunately, many of those
referred to developmental coursework not only do not attain an associate’s or bachelor’s
degree, many also do not complete even their first developmental class. In Bahr’s (2008)
study, three-fourths of students assigned to remedial math courses did not successfully
complete their remedial coursework within six years. Similarly, in their large national
study of 250,000 community college students, Bailey et al. (2008) found, “Only 31
percent of students referred to math remediation and 44 percent referred to reading

DRAFT
9
remediation completed their sequences [of developmental coursework] within three
years” (p. 11). Furthermore, approximately half of the community college students
referred to developmental coursework failed to complete their first course in the
developmental sequence (Bailey et al., 2008). African-American and Latino community
college students are less likely to pass their developmental courses than their peers (Rosin
& Wilson, 2008).
What characterizes teaching and learning at community colleges?
The most in-depth study of teaching and learning in community colleges remains Norton
Grubb’s (1999) book Honored But Invisible: An Inside Look at Teaching Community
Colleges. Grubb and his colleagues visited 257 classrooms in 32 community colleges in
11 different states, typically observing each instructor for three to six hours and then
conducting an in-depth interview lasting at least one hour. From this rich dataset, Grubb
crafted an analysis of the modal classroom in community colleges. He also analyzed
instructors’ work lives, instructional practices in developmental classrooms, and
institutional forces affecting teaching and learning in community colleges, among other
topics.
As Grubbs and his colleagues point out, community college instructors are hired for their
subject matter expertise and generally have master’s degrees or doctorates in their fields.
Very few have had any formal teacher training, and most community colleges provide no
pedagogical support to instructors. Unlike four-year universities, most community
colleges have no school of education and no repository of pedagogical expertise on which
to draw. Thus, instructors develop highly individualistic approaches to teaching. The
lack of support provided to community college instructors is compounded by the isolation
in which instructors work, with few institutional mechanisms for collaboration and
interaction with their peers. “Except in a small number of exemplary institutions most
instructors speak of their lives and work as individual, isolated, lonely. A teacher’s job is
a series of classes, with the door metaphorically if not literally closed,” Grubb writes (p.
49).

DRAFT
10
The isolation of teaching in community colleges is magnified for the large portion of
community college instructors who have part-time teaching appointments. In the fall of
2007, 69 percent of the faculty at public two-year postsecondary institutions were
employed parttime (National Center for Education Statistics, 2009). Grubb found that
many part-time community college instructors become “freeway flyers,” patching
together teaching loads at several community colleges in their region to create the
equivalent of full-time jobs. Due to their limited time on any one campus, part-time
instructors have few opportunities to interact and collaborate with their colleagues.
Against this background of limited instructional support and interaction with colleagues,
what happens in community college classrooms? Grubb emphasized the variety of
teaching practices he and his team encountered:
We saw everything from a conventional lecture with eighty students to an intense
discussion about Muslim history in a seminar of four students, from conventional
classrooms with seats arranged in neat rows to vocational workshops in dairy
barns and automotive shops, from remedial classes struggling with basic
punctuation to the most sophisticated discussions of microeconomics, calculus,
and the physics of heat transfer (Grubb, 1999, p. 61).
Nonetheless, one format predominated: a combination of lecture and discussion, in which
instructors presented information to students, interspersed with or followed by
opportunities for questions and dialogue. Student engagement in these lecture/discussion
classes varied, depending on the balance of lecture and discussion, instructors’ skills as
presenters, and the types of questions instructors posed to students, among other factors.
Grubb and his colleagues found that the lecture/discussion format predominated in
developmental classes as well to varying degrees of effectiveness: “We found both the
best and the worst teaching [in developmental classes] – the most inspired student- and
meaning-centered approaches and the most deadly drill-and-kill classes” (p. 174). Grubb
describes a selection of highly engaging developmental mathematics classes, some of
which were connected to vocational programs in which students were enrolled.

DRAFT
11
However, he found that overall “some of the most lifeless teaching can be found in
remedial math classes, where students continue to repeat the same errors that have carried
them through elementary and secondary schooling” (p. 194).
Generation 1.5 Students in Community Colleges
Who are generation 1.5 students?
A substantial, growing segment of the community college population that demands
greater attention from research is generation 1.5 students. Rumbaut & Ima (1988) coined
the term “generation 1.5,” which has since been adopted by other researchers and
policymakers to refer to non-native English speakers who have completed substantial
amounts of schooling in the United States (cf. Bueschel, 2004; Bunch, 2008; Harklau,
2003; ICAS ESL Task Force, 2006). Many researchers (cf. Portes, 1996; Suarez-Orozco
& Suarez-Orozco, 2001) analyze immigration patterns in terms of immigrant generations,
with those born outside the receiving county considered first-generation immigrants and
the children of first-generation immigrants born within the receiving country considered
second-generation immigrants. It is within this typology of immigrant generations that
the label generation 1.5 was devised.
Generation 1.5 students can be conceptualized as a distinct subset of immigrant students,
English learners and Latino students. Before explaining the overlap between these
different groups and generation 1.5 students, the relevant terminology should be defined.
For this discussion, we will use the term immigrant students to refer to individuals born
outside the United States. English learner (EL) is a label used primarily within the K-12
educational system to describe individuals who are still in the process of developing
English fluency. Finally, as many researchers have noted, the term “Latino” is extremely
problematic and is not a term commonly used by those it supposedly describes (Farr,
2006; Oboler, 1995). Instead, individuals included in the category “Latino” tend to
describe themselves in terms of nationality – as Mexican, Dominican, Puerto Rican, etc.
Nonetheless, this term has salience in many contexts, including educational contexts, in
which Latin American immigrant students of different nationalities may be grouped
together due to their shared primary language of Spanish. Additionally, the Spanish-

DRAFT
12
language media is increasingly using the term “Latino” as a way of addressing its
audience from a wide variety of national backgrounds.4
As Figure 1 illustrates, generation 1.5 students overlap with these other groups of
students in particular ways. Like all English learners, like most first-generation
immigrant students, and like some Latino students, generation 1.5 students are non-native
English speakers. In addition, like most Latino students, like many English learners, and
like some first-generation immigrant students, generation 1.5 students have completed
substantial amounts of schooling in the U.S.5
As Bunch (2008) notes, detailed data about the number and characteristics of generation
1.5 students in community colleges is very sparse. Community college systems generally
do not collect data about the languages spoken by students, nor do they collect data about
the country of birth of students or their parents (in other words, they do not track the
number of language minority students nor the number of immigrant students enrolled in
community college classes). However, data about the racial/ethnic distribution of
community college students is available. From this limited information, combined with
information about trends in the demographics of the K-12 student population and the
general US population, it is possible to make inferences about trends in the generation 1.5
population at community colleges. As a recent Urban Institute report stated, “The
number and share of immigrants in [K-12] schools have tripled since 1970” (Ruiz-de-
Velasco, Fix, & Clewell, 2000, p. 8). Schools have also experienced a corresponding
increase in the number of English learners, with thirteen states seeing the number of
English learners double in the last decade (National Clearinghouse on English Language
Acquisition, 2006). In California, English learners represent approximately one-quarter
of the K-12 student population (California Department of Education, 2009a). The
4 An article on the Spanish-language news company Univision’s website, for example, has the title “Los latinos deciden” and describes how the Latino vote was crucial in the 2008 Democratic presidential primaries (Retrieved February 23, 2008, from http://www.univision.com/content/content.jhtml?cid=1440404). The term “Latino” is used frequently throughout the article, both as a noun and as an adjective, modifying the word “community.” 5 One further term that is sometimes used in the literature to refer to a group of students that has substantial overlap with generation 1.5 students is the term “language minority students.” In the U.S. context this term refers to students who grew up speaking a language other than English at home – regardless of whether the students are now fluent in English or not.

DRAFT
13
majority of immigrant students in K-12 schools, as well as the majority of English
learners, speak Spanish as their first language (California Department of Education,
2009b; Ruiz-de-Velasco et al., 2000).
Figure 1.
Generation 1.5 students overlap with Latino students, English learners and immigrant students in particular ways. Approximately half of all Latinos are English learners, and approximately half of all foreign-born immigrants are Latino. Most English learners are Latino, and many foreign-born immigrant students are English learners. Generation 1.5 students are predominantly Latino. Many are foreign-born immigrants and some are English learners. Incorporating information from multiple sources, an attempt has been made to size the circles representing each of these groups to approximate the relative size of the corresponding populations. (Sources: California Department of Education, 2009a; California Department of Education, 2009b; National Center for Education Statistics, 2008c; National Center on English Language Acquisition, 2006; Ruiz-de-Velasco, Fix, & Clewell, 2000; Thompson, 2009; U.S. Census Bureau, 2000).

DRAFT
14
Meanwhile, at the postsecondary level the available data do not allow us to track large-
scale trends for immigrant students or English learners. However, the data do show a
rapid increase in both the number and share of the college student population that is
Latino. From 1990 to 2005, Latino student enrollment in degree-granting postsecondary
institutions increased almost two-and-a-half times, jumping from 782,000 to 1.9 million
(National Center for Education Statistics, 2008c). During the same time period, the share
of the college student population that is Latino almost doubled, rising from 5 percent in
1990 to 9 percent in 2005 (National Center for Education Statistics, 2008c). Meanwhile,
Latino students are more likely to enroll in community colleges than in other types of
postsecondary institutions, with two-thirds of Latino postsecondary students beginning
their higher education career in community colleges (Solórzano, Rivas, & Velez, 2005).
In 2003-04, Latino students made up 14 percent of the community college population but
only 9 percent of the population at four-year public universities (National Center for
Education Statistics, 2008a). In California, 30 percent of community college students are
Latino (California Community Colleges Chancellor’s Office, 2009), and close to 75
percent of the state’s first-time college students who are Latino enroll in community
college (Woodlief, Thomas, & Orozco, 2003, cited in Bunch, 2008). Not all the Latino
students in the nation’s community colleges have both characteristics of generation 1.5
students – being nonnative English speakers and having completed a substantial amount
of schooling in the U.S. But many Latino community college students do have both these
characteristics (Bunch, 2008). As community college administrators themselves report,
community colleges find themselves serving large and increasing numbers of generation
1.5 students (Klein & Wright, 2009).
The needs of generation 1.5 students in community colleges
Generation 1.5 students have distinct academic needs, which may not be met by current
community college structures. Having completed substantial amounts of schooling in the
U.S. and having developed oral English proficiency, generation 1.5 students typically do
not benefit from typical English as a Second Language (ESL) classes offered by
community colleges. In fact, generation 1.5 students may deliberately avoid ESL classes
due to the stigma associated with them (ICAS ESL Task Force, 2006). Yet, as we will
DRAFT
15
explore in more detail, academic disciplines, including mathematics, demand a
sophisticated mastery of specific English vocabulary and syntax that generation 1.5
students may need targeted support to master.
Typically, students’ high school transcripts, their standardized test scores, and their
scores on language proficiency assessments from the K-12 educational system do not
follow them into the community college system (Bunch, 2008). Students’ ability to start
with a clean slate in community college may prevent students previously designated as
English learners from being shunted into an “ESL ghetto” (Valdés, 2001) and denied
access to credit-bearing content-area classes. However, valuable information about
students’ educational trajectories and needs may also be lost, preventing them from
receiving necessary services.
The language placement process suffers from other flaws as well. The process by which
students are placed in ESL and English classes varies widely from campus to campus,
with varying assessments, varying degrees of student discretion, and varying degrees of
access to counselors (Bunch & Panayotova, 2008). Generally, students choose whether
to take an ESL placement exam (for placement into an ESL class) or an English
placement exam (for placement into a more traditional reading/composition class).
Students’ decisions about which placement exam to take have far-reaching consequences
for their educational trajectories, and community colleges vary widely in the advice they
provide to students about which exam to take (Bunch & Panayotova, 2008). The
problems with the language placement process mirror those with the math placement
process discussed earlier, in which there is also wide variability across campuses in the
assessments used, the cutoff scores, the advice provided to students, the amount of
student discretion involved in final course selection, the amount of information about
high school course completion used in the placement process, and the linkages between
the standards emphasized in high school courses and those assessed by the placement
exams (Brown & Niemi, 2007; Marwick, 2004; Shelton & Brown, 2008).
As noted earlier, large proportion of incoming community college students get placed
into non-credit-bearing classes in English and mathematics, variously labeled “basic

DRAFT
16
skills,” “developmental,” or “remedial.” Unfortunately, the majority of students placed
into these classes never move on to credit-bearing classes in English or math and never
complete a degree. Once students are placed in developmental courses – both ESL and
basic math courses – they are unlikely to ever get out of these courses. In fact, as noted
earlier, in mathematics almost half fail to complete the first course in the developmental
sequence (Bailey, 2007). Whether students struggle in their developmental mathematics
courses because of language issues, math issues, non-academic issues, or a complex
combination of these factors is difficult to determine. However, thus far, little attention
has been paid to helping generation 1.5 students – and others – master the specific
disciplinary language necessary to be successful in mathematics. By reviewing the
literature about the linguistic demands of mathematics, we will be better equipped to
design a community college mathematics curriculum that enables all students – but
especially generation 1.5 students – to succeed in their mathematics courses.
Methods for the Literature Review
For this literature review, we followed a backward mapping process (Elmore, 1983), first
locating key articles that addressed all topics under consideration - community colleges,
mathematics education, language in mathematics, and generation 1.5 students6 – and
then, using references from these articles, we traced backwards to find other articles on
subsets of these topics. Our search included multiple sources, including online databases,
journals, and organizational and governmental reports. We searched the ERIC database.
We also pulled articles from relevant journals, including specialized journals such as
Educational Studies in Mathematics and Community College Journal of Research and
Practice, as well as general education journals such as Review of Educational Research
and Educational Researcher. In addition, we located reports from relevant organizations
such as the American Mathematical Association of Two Year Colleges, the Association
of Community Colleges, California Tomorrow, and the American Association for the
Advancement of Adult Literacy. Finally, we identified relevant reports and data from 6 As noted earlier, the terminology used to refer to generation 1.5 students varies. Therefore, when searching for articles about nonnative English speakers who have completed substantial amounts of schooling in the U.S., we also included articles that referred to immigrant students, Latina/o students, and English learners, since students who fall into these categories may also be generation 1.5 students. (See Figure 1.)

DRAFT
17
government sources, such as those authored by the California Postsecondary Education
Commission and the California Community Colleges Chancellor’s Office.
Ultimately, we established a database of 341 articles related to our topic. We read the
abstracts of each of these articles, tagging each article with a subset of 130 keywords we
developed inductively in the course of the literature review process. (See Appendix A
for a list of keywords used.) We then identified articles that focused on at least two of
our four topic areas (community colleges, mathematics, language, and generation 1.5
students), and read these 102 articles in full. Table 1 lists numbers of articles addressing
subsets of our topics areas. We will now summarize key themes in these 102 articles.
Table 1. Numberof articles addressing subsets of our four topics.
Topics Number of Articles
Community college + mathematics education 14
Community college + language in mathematics 0
Community college + (generation 1.5 students OR Latino/a students OR immigrant students OR ELs)
16
Mathematics education + (generation 1.5 students OR Latino/a students OR immigrant students OR ELs)
28
Mathematics education + language in mathematics
76
Language in mathematics + (generation 1.5 students OR Latino/a students OR immigrant students OR ELs)
20
Total number of unique articles addressing at least two of the four topic areas 102
Key Ideas from the Literature on the Linguistic Demands of Mathematics
Unique Features of the Mathematics Register
As with other disciplines, linguists and scholars from within the discipline of
mathematics have sought to define how the language of mathematics is distinct from the
languages of other disciplines and from the language of everyday communication.
Researchers have analyzed features of the language in mathematics textbooks and

DRAFT
18
mathematics assessments (cf. Abedi & Lord, 2001; Mestre, 1988; Österholm, 2006), as
well as features of the discourse in mathematics classrooms (cf. Chapman, 2003;
Laborde, 1990; Pimm, 1989; Walshaw & Anthony, 2008). Defining features of the
language of mathematics identified by researchers include:
• extensive borrowing of common, everyday terms that have particular, distinct
meanings in the context of mathematics (e.g. face, product, rational);
• shifts in the grammatical categories of borrowed terms (e.g. the term diagonal
functions as an adjective in general usage but as a noun in mathematics); and
• the use of metaphors to explain mathematical concepts (e.g. regrouping in
subtraction is often referred to as “borrowing” and algebraic equations are
often described as “balances,” but students must understand the limits of these
metaphors).
Summarizing across a variety of studies, Laborde (1990) describes additional linguistic
features that have been shown to affect students’ success in solving mathematical
problems, including:
• how the relationships between given and unknown quantities are expressed;
• the order in which information is presented; and
• the complexity of the syntax and of the vocabulary.
When teachers think about the linguistic demands of their discipline, they often focus on
the specific vocabulary students need to learn. However, as Laborde (1990) suggests,
students often struggle with syntax as well. In fact, one study comparing nonnative
English-speaking high school students’ performance on mathematics assessments in
English to their performance on equivalent assessments in their primary language found
that confusing syntax created more problems for students than technical vocabulary did
(Neville-Barton & Barton, 2005). For example, the sentence, “Subtract three from five,”
contains no sophisticated vocabulary. However, many students, particularly nonnative
English speakers, are likely to be unfamiliar with this syntax for subtraction equations
and may misinterpret which number is the minuend and which is the subtrahend, solving
3 - 5 rather than 5 - 3.

DRAFT
19
In Neville-Barton & Barton’s (2005) study, 40 secondary students who spoke Mandarin
as their primary language took parallel mathematics exams in both English and
Mandarin. Seven weeks elapsed between the two testing sessions, and half the sample
took the English exam first while half took the Mandarin version first. Students
performed significantly worse in English than they did in Mandarin, even though their
math instruction took place in English. While some students had difficulty with
questions that involved mathematics vocabulary terms such as perimeter and coefficient,
the questions in English that posed the greatest difficulty for students were those
containing complex syntactical structures. For instance, only 11 percent of the students
correctly answered a question in English that centered around the sentence, “The square
root of one half of a number is 8.” When the same question was posed in Mandarin,
however, 64 percent of the students answered correctly.
In an interview with a fourth grade English learner, Martiniello (2008) provides a
fascinating example of how difficulties with syntax and vocabulary can interact to
produce misunderstandings. The problem, drawn from the Massachusetts standardized
mathematics assessment for grade 4, read:
To win a game, Tamika must spin an even number on a spinner identical to the one
shown below. A circular spinner divided into tenths is pictured, with the sections labeled
with the digits one through ten. The question is then posed, “Are Tamika’s chances of
spinning an even number certain, likely, unlikely or impossible?” The student
Martiniello interviewed did not understand the words spinner, identical or even. He
instead focused on the word one, surmising that the question was asking what the chances
were of landing on the number one. As Martiniello (2008) writes, the student “failed to
recognize the syntactical function of the word one, used as a pronoun in this sentence,
and instead misinterpreted it as the numeral one. Based on this linguistic
misinterpretation, he offered a reasonable [but, in this case, incorrect] answer: ‘It is
‘unlikely,’ maybe it will not fall’” (p. 344). In the remainder of her study, Martiniello
documents how the combination of difficult syntax and unfamiliar vocabulary words led
English learners to perform more poorly than fluent English speakers on certain items

DRAFT
20
from the Massachusetts math assessment, preventing English learners from
demonstrating their true mathematical knowledge.
Researchers have divided the mathematical problem solving process into two
components, problem comprehension and problem solution (Lewis & Mayer, 1987).
When the vocabulary and syntax of math problems create confusion, the problem
comprehension process breaks down, preventing successful completion of the problem
solution phase.
Specific Challenges Posed by the Mathematical Language Encountered by Community College Students
The linguistic challenges posed by mathematics textbooks, assessments and classrooms
become even more complicated as the mathematics students are learning becomes more
complicated. Algebra represents the key gatekeeper for community college students. In
order to pass out of developmental mathematics classes, students must demonstrate
competence in basic algebra. Yet researchers have clearly documented that the language
in which algebraic problems are expressed poses unique challenges for students (cf.
Humbertson & Reeve, 2008; Lewis & Mayer, 1987; MacGregor & Price, 1999;
MacGregor & Stacey, 1993; Stacey & MacGregor, 2000).
MacGregor & Price (1999) conducted a study of 1500 secondary students in their first to
fourth years of learning algebra in which they gave students an assessment designed to
measure their understanding of symbolic notation in algebra, as well as their
metalinguistic awareness in non-mathematical contexts. Commenting on students’
difficulty in understanding algebraic notation, MacGregor & Price (1999) noted:
Students have not learned how to use syntax as a guide to interpretation in
arithmetic, and they are not likely to understand the significance of symbol order
in algebraic notation. … They frequently misuse and misinterpret algebraic
symbols and syntax even in simple tasks (p. 453).
For example, when students are presented with the following question: “Jason is 5 inches
taller than Leo. Write an expression for Jason’s height,” some students assume that

DRAFT
21
variables represent abbreviated words. Therefore, they express Jason’s height as Jh, with
J standing for Jason and h for height (MacGregor & Price, 1999).
Researchers have long recognized that students have difficulty understanding the role of
variables in mathematics. In a series of recent experimental studies, Malisani &
Spagnolo (2009) presented secondary students with a series of algebraic word problems
that involved different uses of variables. They found that students were more likely to
conceive of a variable as representing a single unknown quantity rather than as element in
a functional relationship representing a set of quantities. For example, students were
asked to solve the following problem: “Charles and Lucy won the total sum of €300 in
the lottery. We know that Charles won triple of the betted money, while Lucy won the
quadruple of her own. Calculate the sums of money Charles and Lucy betted.” Most
students used trial and error to solve this problem, imagining that they were trying to find
two fixed unknown quantities, one representing the amount that Charles betted and the
other representing the amount Lucy betted. Only a small percentage of students
recognized this as a functional relationship with multiple possible answers, constructing
an equation such as 300=3x+4y, transforming that equation into the conventional format
of an equation of a line, y=mx+b (in this case, y=-3/4x+75), and plugging in multiple
values for x to generate various solutions. Furthermore, Malisani & Spagnolo (2009)
found that very few students could successfully generate their own word problems from a
given algebraic equation. Only 7 percent of students wrote an acceptable word problem
that could be solved by the equation 6x-3y=18. The researchers concluded that students
have difficulty switching between natural and algebraic language (and vice versa), in part
because students have incomplete conceptions of what variables represent. In a landmark
study, Lewis & Mayer (1987) demonstrated that students answer algebraic word
problems incorrectly more often when those problems are posed using inconsistent
language. Table 2 displays examples of simple algebraic comparison problems using
Table 2. Algebraic word problems using consistent and inconsistent language (adapted from Lewis & Mayer, 1987).
Consistent Language Inconsistent Language
Addition Maria has three apples. Maria has three apples.

DRAFT
22
example Susana has two more apples than Maria. How many apples does Susana have?
Maria has two less apples than Susana. How many apples does Susana have?
Subtraction example
Jeff has $9 Eric has $4 less than Jeff. How many dollars does Eric have?
Jeff has $9. Jeff has $4 more than Eric. How many dollars does Eric have?
consistent and inconsistent language. Both types of problems are identical except for
their second sentences, which contain the key relational statement. In the problems with
consistent language, this relational statement introduces a new unknown quantity as its
subject and explains how this unknown quantity relates to the known quantity introduced
in the first sentence. Furthermore, in problems with consistent language, the necessary
arithmetic operation is appropriately keyed by the relational term in the second sentence
(i.e. problems that require addition contain a phrase such as more than and problems
requiring subtraction contain a phrase such as less than). However, in problems with
inconsistent language, the relational statement contained in the second sentence has two
features that seem to confuse students. First, the new unknown quantity is the object, not
the subject, of the sentence. Second, the necessary arithmetic operation conflicts with the
relational phrase used in the sentence (i.e. problems that require addition contain a phrase
such as less than and problems requiring subtraction contain a phrase such as more than).
To solve problems with inconsistent language, students must reverse the order of the
quantities and the operation expressed by the relational sentence. Using the subtraction
example with inconsistent language from Table 2, for example, students must recognize
that the sentence, “Jeff has $4 more than Eric,” can be expressed with an equation such as
x = 9 – 4 (since the previous sentence stated that Jeff had $9). Here, the student must
recognize that the unknown quantity – the amount of money Eric has – is the object of
the sentence, and they must recognize that to find the unknown quantity, 4 needs to be
subtracted from 9. Numerous researchers have since replicated Lewis & Mayer’s (1987)
findings, demonstrating that inconsistent algebraic comparison problems pose difficulty
for students at all ages, including college students (cf. Stacey & MacGregor, 2000; Pape,
2003).
But students’ difficulties in translating relational statements into algebraic equations run

DRAFT
23
even deeper than Lewis & Mayer (1987) might lead us to believe. In fact, in one oft-
cited study, a majority of college students could not correctly solve the following
problem: “Write an equation using the variables S and P to represent the following
statement: ‘There are six times as many students as professors at this university.’ Use S
for the number of students and P for the number of professors” (Rosnick & Clement,
1980, p. 4). Some researchers (cf. Mestre, 1988) have postulated that students may be
engaging in “syntactic translation” of natural language sentences into equations, literally
translating word-by-word from left to right. In the student/ professor example above,
such a syntactic translation might lead to the incorrect equation 6S = P. However,
MacGregor & Stacey (1993) demonstrate that syntactic translation accounts for only
some of students’ errors in creating equations from sentences. Students seem to have
pervasive confusion about what variables represent and persistent difficulties in mapping
words to symbols (MacGregor & Price, 2000).
Humbertsone & Reeve (2008) gave high school students an “English Phrase to Algebra
Test” specifically designed to assess how well students could write equations when
presented with simple comparative statements. Students were given 20 phrases, such as,
“Seven is subtracted from t,” and asked to represent those phrases using algebraic
notation. On average, students completed 55.7 percent of the items on this assessment
correctly. After analyzing students’ responses in more detail, Humberstone & Reeve
found that students often used incorrect mathematical operators in their equations and,
even more frequently, ordered mathematical terms incorrectly. Thus, the language of
algebra – specifically, the task of translating statements from natural language into
algebraic notation – poses great difficulty for all students.
As numerous researchers have described, the difficulties all students face in mastering the
language of mathematics can be even greater for generation 1.5 students since they may
have less familiarity with the unique vocabulary and syntactic patterns that they
encounter in the mathematics classroom (cf. Gorgorió & Planas, 1999; Mestre, 1988).
While no study specifically documents the difficulties that the language of algebra poses
for generation 1.5 students in community colleges, other research demonstrates that
bilingual students are more successful at solving mathematical word problems when the

DRAFT
24
problems are presented in their first language – even if they are receiving mathematics
instruction in their second language (Bernardo & Calleja, 2005; Neville-Barton & Barton,
2005).
Furthermore, as Barwell (2005a) demonstrates, students for whom English is an
additional language must attend to both language and content in their mathematics classes
to a greater degree than other students. Barwell (2005a) spent time in elementary school
classrooms, observing and recording interactions between English learners during
mathematics instruction. His detailed analysis of students’ discourse clearly illustrates
the complex layers of linguistic and mathematics knowledge that students are attending to
during their content-area classes. For example, consider this interaction between two
English learners (F and P) working together to write a word problem:
F: if we had/ wh-/ five people/ and we have twenty/ twenty books/ you know what we going to do with them
P: yeah/ that is a hard one// (writing) F: had P: have F: twenty books P: I know/ twenty/ twenty/ no no no/ five children F: five children/ P: and/ twenty/ books// can/ can/ we/ how many/ F: is/ wait/ (. . .) P: how many/ can/ we/ gave/ G A V E/ F: give them (Barwell, 2005a, pp. 211-212, emphasis in the original)
The students’ attention alternates between constructing the context for the mathematics
problem and deciding on the appropriate form of the verbs in the word problem (had vs.
have, gave vs. give). While we do not have specific data about the discourse of
generation 1.5 community college students during mathematics instruction, they likely
also alternate between attending to issues of content and issues of language.

DRAFT
25
Strategies for Supporting Students in Building Fluency in the Language of Mathematics As Moschkovich (2002) points out, by focusing only on what students need to learn
about the language of mathematics, we risk perpetuating a deficit perspective, ignoring
what students do know and the resources they bring to the mathematics classroom. As
numerous researchers have found, students’ primary languages can serve as valuable
assets for mathematics learning (cf. Gorgorió & Planas, 1999; Moschkovich, 2002; Setati
& Adler, 2000), particularly when teachers themselves can use students’ primary
languages to provide explanations and clarification as needed, serving as a bridge to
mathematical fluency in English. For example, in a series of observational studies of
multilingual mathematics classrooms, Setati & Adler (2000) illustrated how teachers
supported students’ mathematics learning by selectively switching from English to
students’ primary language to provide translations for certain unfamiliar vocabulary
words, to clarify a concept, or to press students to elaborate their thinking.
Researchers have found other powerful ways in which teachers can support their
students’ growing fluency in the language of mathematics, as well. Yackel & Cobb
(1996) found that mathematics teachers establish not just social norms about how
members of the classroom community interact with one another but also
“sociomathematical norms” that define for students what kinds of mathematical
communication and thinking are valued in the classroom:
Normative understandings of what counts as mathematically different,
mathematically sophisticated, mathematically efficient, and mathematically
elegant in a classroom are sociomathematical norms. Similarly, what counts as an
acceptable mathematical explanation and justification is a sociomathematical
norm (p. 461).
Other researchers have discussed how Yackel & Cobb’s (1996) notion of
sociomathematical norms applies to multiethnic, multilingual classrooms, like those
found in most community colleges. As Gorgorió & Planas (1999) note, “In these settings

DRAFT
26
the possible interpretations of the norms by some of its participants are often difficult to
understand by the others, and are, therefore, a potential source for cultural conflicts that
may interfere with the learning process” (p. 13). Gorgorió & Planas (1999) provide an
example in which a group of Urdu-speaking secondary students think a mathematical
problem is unsolvable simply because they have misunderstood a key word in the
problem. By taking extra time to look carefully at diagrams the students had drawn and
understand the students’ reasoning, the teacher recognized their confusion and was able
to provide clarification, thus reinforcing for the students the sociomathematical norm that
good-faith problem solving efforts and attempts at mathematical communication are
valued within that classroom.
Other researchers have investigated how curricular innovations could support students in
better understanding the language of mathematics. Reed (2006) conducted a series of
training studies to test the effectiveness of two strategies for supporting students in
correctly translating word problems into algebraic equations. For the first study, Reed
taught students a new strategy for solving problems involving multiple units. With this
new strategy, students were taught to cancel units to simplify expressions. For example,
the problem, “You travel 65 mph for 2.3 hours. How far have you traveled?” can be
solved with the equation:
Students using the canceling units strategy were taught to cross out units that appeared in
the numerator and denominator, just as they would cancel numerical quantities when
multiplying fractions (in this case, they would cancel the unit hours). Following this
procedure, the equation would simplify to:
Reed found that following training students who were taught the canceling units strategy
performed worse than a control group on related word problems. He hypothesized that
the failure of this curricular innovation to facilitate students’ problem solving may have

DRAFT
27
been a result of cognitive overload, with the strategy simply being too confusing for
students to master during the training time allotted. Alternatively, Reed suggested that
the canceling units strategy may have been unsuccessful because it was a mechanical,
procedural strategy that failed to build students’ understanding of the problems
themselves.
The second strategy that Reed tested for improving students ability to correctly translate
word problems into algebraic equations involved identifying referents for quantities in
word problems. As part of the training for this strategy, students were presented with
pairs of numerical expressions involving quantities, and asked to circle the expression in
each pair that represented a possible quantity in the real world. For example, students
were shown the expressions “3 ft x 4 ft” and “3 lb x 4 lb.” Since it is possible to have
square feet but not square pounds, the first is the only sensible expression. After this
training, students were given a variety of rate problems in which they could apply this
strategy, and their results were compared to a control group that had received different
training. For this strategy, Reed demonstrated that after initial training in identifying
which mathematical expressions represented particular real-world referents – in other
words, after practicing translating from natural language to algebraic expressions –
college students were more successful in constructing algebraic equations in later
assessments.
Stacey & MacGregor (2000) noted that although high school students in their overall
sample struggled to solve word problems algebraically, “Students in particular classes
had been well trained in the setting up and solving of equations. In these classes, most
students used conventional formats and manipulation procedures, and their solutions
were correct and usually concise” (p. 153). While investigating the teaching strategies in
use in these particular classes was outside the scope of Stacey & MacGregor’s (2000)
study, this observation does suggest that certain curricular and pedagogical interventions
may improve students’ success with algebraic word problems.
Finally, research from language acquisition demonstrates the importance of extended
contact with fluent English speakers to English learners’ language acquisition. Contact
with trusted, fluent speakers is vital for both first and second language acquisition to

DRAFT
28
occur. In a series of experiments with young children, Sabbagh & Shafman (2009)
demonstrate that children develop judgments about whether particular speakers are
reliable sources of linguistic information and block learning from speakers they conclude
are unreliable. Such research illustrates the importance of contact between fluent and
emergent English speakers in all educational contexts, including community colleges, so
that those still building English proficiency will have exposure to reliable sources of
linguistic information. Yet, as Gifford and Valdés (2006) document, Latino students
generally and Spanish-speaking ELLs in particular experience hypersegregation in the
U.S. K-12 education system, attending schools with very limited racial and linguistic
diversity. Such hypersegregation has profound, negative consequences for students,
since, as Gifford and Valdés argue, “For ELLs, interaction with ordinary English-
speaking peers is essential to their English language development and consequently to
their acquisition of academic English” (p 147). Given the limited data on generation 1.5
students at community colleges, precise information about the level of segregation such
students experience is not available. However, the language acquisition research
underscores the importance of creating instructional settings in which generation 1.5
students who are still in the process of building fluency in academic language generally
and the language of mathematics in particular have extended opportunities for interaction
with native English-speaking peers.
Innovations in the Mathematics Curriculum at Community Colleges A separate, small body of literature documents efforts to improve student success in
community college mathematics courses. While none of the curricular innovations
specifically focus on how to support students in mastering the language of mathematics, a
description of the curricular innovations that were tried can inform future efforts to
develop additional innovations that focus on the language of mathematics.
As noted in Table 1, we identified only 14 articles that specifically focused on
mathematics education in community colleges. We summarize these 14 articles in
Appendix B. Of these 14 articles, nine address curricular innovations and none of these
nine describe randomized, controlled trials or quasi-experimental results. Four provide
descriptive information or recommendations only with no outcome data, three report

DRAFT
29
results but provide no data about the comparability of students in the control or baseline
group and do not isolate the effects of specific curricular innovations, and two are
literature reviews. From this limited body of research, curricular innovations in
mathematics that hold promise include:
• connecting course content to everyday life and to other subject areas;
• integrating technology into the classroom;
• instituting peer tutoring and other types of academic assistance and
support for students;
• fostering inquiry and professional development among faculty members;
and
• modifying the syllabi of courses to prioritize key concepts.
Students in developmental math courses are, by definition, learning material to which
they have already been exposed. Therefore, numerous studies stress the importance of
making the materials relevant to students by connecting it both to other courses and to
everyday life (Bond, 2008; Kane, Beals, Valeau, & Johnson, 2004; Klein & Wright,
2009; Schwartz, 2007). One particular strategy for increasing the material’s relevance to
students is to create learning communities. In these learning communities, groups of
students take the same classes together. For example, a group of students enrolled in an
automotive technology course might also take the same developmental English and
developmental math course. Therefore, the instructors in the developmental English and
developmental math courses could draw on the examples from automotive technology for
their readings and assignments. Additionally, students could study together, and
instructors could collaborate as well. President Obama singled out learning communities
as one innovation his newly announced American Graduation Initiative aims to foster
across community colleges (White House Press Office, 2009). One randomized,
controlled field trial investigating the effectiveness of learning communities in
community colleges is currently underway, with its impact findings slated for release in
2011 (Visher, Wathington, Richberg-Hayes, & Schneider, 2008).

DRAFT
30
Technology also appears in a variety of studies as a potentially powerful strategy for
increasing student success in community college math classes (Bond, 2008; Golfin,
Jordan, Hull, & Ruffin, 2005; Schwartz, 2007). Technology mentioned ranges from
specific mathematics software packages to interactive whiteboards. However, in the
experience of some community colleges, increased integration of technology has led to
increased student interest and participation in mathematics classes but not increased
student success in these classes (Bond, 2008). More research is needed to determine the
specific types of technologies that are associated with improved student achievement in
community college mathematics classes. In particular, future research could explore
whether particular technologies could support generation 1.5 students and others in
developing greater proficiency in the language of mathematics.
Peer tutoring is mentioned as a promising curricular innovation in five articles (Blum,
2007; Bond, 2008; Carnegie Foundation for the Advancement of Teaching, 2008; Center
for Student Success, 2007; Kane, Beals, Valeau, & Johnson, 2004). While generation 1.5
students are not mentioned specifically in these articles, perhaps when a generation 1.5
student tutors another generation 1.5 student, she can provide first-hand
recommendations for strategies to master the linguistic demands of mathematics that
present special challenges to non-native English speakers. Future research could explore
the effectiveness of generation 1.5 students serving as peer tutors for other generation 1.5
students.
Five articles also mention fostering collaboration among community college mathematics
faculty as a strategy for improving student achievement (Bond, 2008; Carnegie
Foundation for the Advancement of Teaching, 2008; Center for Student Success, 2007;
Grubb, 1999; Klein & Wright, 2009). With time and space to work together, instructors
can collaboratively modify curriculum, instructional strategies, and assessments, creating
more coherence across classrooms and establishing best practices. Furthermore, faculty
members can learn from one another and combat the isolation many community college
faculty experience. Again, no article describes a collaboration among faculty specifically
focused on meeting the needs of generation 1.5 students. This remains an area for future
research.

DRAFT
31
Finally, two articles mentioned modifying syllabi of community college mathematics
course to either reduce or increase the number of concepts addressed in a particular
course (Blum, 2007; Klein & Wright, 2009). In one case, in response to student focus
groups, a community college created a more fast-paced basic algebra course (Blum,
2007). The college combined two developmental courses into one by devoting less class
time to reviewing basic arithmetic and instead offering a two-week arithmetic refresher
course to students in the summer before they began the algebra course. With this new
condensed algebra course, students had fewer non-credit-bearing courses to complete. In
another case, following a faculty inquiry project, community college instructors reduced
the number of concepts covered in their pre-algebra courses (Klein & Wright, 2009).
Rather than briefly introducing a multitude of concepts quickly, instructors decided to
spend more time helping students understand select key concepts in greater depth. Initial
data show higher student retention rates in the less-is-more courses, though given the
non-experimental nature of the study, differences in retention rates cannot be definitely
attributed to the curricular modifications.
Conclusion
As President Obama indicated when announcing his effort to increase degree attainment
among community college students, millions of students enter community colleges with
dreams of obtaining a degree or developing job skills (White House Press Office, 2009).
However, too many community college students do not reach their goals. As we have
seen less than half of those intending to obtain a degree or certificate ultimately do so,
and degree attainment rates are even lower for Latino and African-American community
college students (National Center for Education Statistics, 2009). Remedial math courses
represent a major bottleneck for many students. According to recent studies, over half of
entering college students are placed in remedial math courses, yet less than one-third of
those assigned to remedial math courses ever complete their remedial mathematics
sequence, and half do not even complete their first remedial course (Bahr, 2008; Bailey et
al, 2008).
DRAFT
32
Scholars have documented the linguistic challenges that mathematics courses present to
all students; these linguistic challenges are perhaps greatest in algebra, the branch of
mathematics in which community college students must demonstrate proficiency. The
vocabulary and syntactic difficulties students face in translating word problems into
algebraic equations, for example, are compounded for the growing numbers of generation
1.5 students in community colleges who do not speak English as their native language.
Researchers have described a small number of instructional practices designed to help
students master the linguistic demands of mathematics, including using students’ primary
languages for selected explanations and clarification, creating a classroom environment
with positive socio-mathematical norms, and teaching students specific strategies to
connect everyday language with algebraic language, such as recognizing algebraic
expressions with real world referents. In addition, a small number of studies
documenting curricular innovations in community college mathematics classes also exist.
Innovations at the community college level include: organizing students into learning
communities; integrating technology into math classes; initiating peer tutoring;
facilitating professional development and faculty collaboration; and modifying course
syllabi to emphasize key concepts.
However, as of yet, no research exists which documents curricular innovations
specifically designed to support generation 1.5 community college students in mastering
the linguistic demands of their mathematics classes. Future research could explore how
mathematics interventions that have been designed for non-native English speakers at
other grade levels and mathematics interventions that have been designed for the general
community college population could be combined to support generation 1.5 students’
success in mathematics at community colleges. In order to harness the potential of the
large number of generation 1.5 students enrolling in community colleges, developing
mathematics interventions that effectively target this population is vital.

DRAFT
33
Appendix A: Keywords used to tag articles in our database of relevant literature (terms used to identify key articles in bold)
ability grouping epistemology preschool abstraction equity problem solving academic language generation 1.5 professional development activity theory geometry proof affect gesture psychometrics after-school programs graphs reading algebra grouping practices reading comprehension animation high schools real analysis assessment higher education reasoning benchmark assessment identity reform bilingual education immigrant students register bilingualism instructional strategies research methodology calculus international education school districts classroom exemplars intervention science education classroom inquiry language development semiotics classroom interaction language in mathematics situated cognition cognition Latina/o students social justice cognitive factors learning disabilities social practice theory cognitive psychology literacy social studies communication mathematical ideas sociocultural theory community colleges mathematical texts sociolinguistics computational strategies mathematical thinking spatial reasoning conceptual understanding mathematics standards constructivism mathematics achievement strategy development cooperative learning mathematics education student achievement cultural psychology mathematics in the workplace student beliefs culturally relevant pedagogy mathematics learning student conceptions of learning culture mathematics teaching student demographics curriculum material mental representation student interviews developmental disabilities meta-analysis summer school dialectics metalinguistics symbolic representation differentiation middle schools teacher beliefs disciplinary literacy motivation teacher change discourse multilingual issues in
mathematics teacher education
documentation multilingualism teacher knowledge early arithmetic multimodality technology education funding number and operations testing efficacy out-of-school mathematics tracking effort partnerships transfer of learning elementary schools pedagogy transnational youth ELs performance assessments video embodiment phenomenology visualization engagement policy word problems writing

DRAFT
34
App
endi
x B
: Ana
lysi
s of s
tudi
es a
bout
mat
hem
atic
s in
com
mun
ity c
olle
ges.
Aut
hors
T
itle
Sam
ple
Top
ic
Key
Fin
ding
s A
ddre
sses
cu
rric
ular
in
nova
tions
?
Peer
-re
view
ed?
Bah
r, 20
08
Doe
s mat
hem
atic
s re
med
iatio
n w
ork?
: A
com
para
tive
anal
ysis
of
acad
emic
atta
inm
ent
amon
g co
mm
unity
co
llege
stud
ents
85,8
94
Cal
iforn
ia
com
mun
ity
colle
ge
stud
ents
Com
pare
d co
mpl
etio
n of
col
lege
-le
vel m
athe
mat
ics c
ours
e(s)
and
cr
eden
tial/d
egre
e at
tain
men
t of
stud
ents
who
succ
essf
ully
co
mpe
ted
rem
edia
l mat
h co
urse
s to
that
of s
tude
nts n
ot p
lace
d in
re
med
ial c
ours
es
Stud
ents
in b
oth
grou
ps
expe
rienc
ed c
ompa
rabl
e ou
tcom
es, s
ugge
stin
g th
at, f
or
som
e st
uden
ts, r
emed
ial
prog
ram
s suc
cess
fully
reso
lve
skill
def
icie
ncie
s. H
owev
er,
thre
e-fo
urth
s of s
tude
nts p
lace
d in
to re
med
ial m
ath
cour
ses d
o no
t com
plet
e th
ese
cour
ses
succ
essf
ully
.
N
Y
Bai
ley,
Je
ong,
&
Chu
, 200
8
Ref
erra
l, en
rollm
ent,
and
com
plet
ion
in
deve
lopm
enta
l ed
ucat
ion
sequ
ence
s in
com
mun
ity c
olle
ges
~250
,000
co
mm
unity
co
llege
st
uden
ts fr
om
57 c
olle
ges i
n 7
stat
es
Ana
lyze
d pa
ttern
s of c
ours
e-ta
king
fr
om in
itial
refe
rral
to re
med
ial
cour
ses o
nwar
d.
Onl
y 31
per
cent
of s
tude
nts
refe
rred
to m
ath
rem
edia
tion
and
44 p
erce
nt re
ferr
ed to
read
ing
rem
edia
tion
com
plet
ed th
eir
sequ
ence
s with
in th
ree
year
s.
Mor
e th
an h
alf o
f stu
dent
s re
ferr
ed to
rem
edia
l cou
rses
did
no
t com
plet
e th
eir f
irst c
ours
e.
N
N
Blu
m, 2
007
Get
ting
stud
ents
th
roug
h re
med
ial m
ath
is a
con
stan
t stru
ggle
, bu
t thi
s col
lege
kee
ps
tryin
g
One
co
mm
unity
co
llege
Des
crib
ed c
urric
ular
inno
vatio
ns
desi
gned
to im
prov
e st
uden
t su
cces
s in
rem
edia
l mat
h cl
asse
s.
Inno
vatio
ns in
clud
ed: c
onde
nsin
g tw
o co
urse
s int
o on
e; o
ffer
ing
a tw
o-w
eek
mat
h re
fres
her c
ours
e in
th
e su
mm
er; a
nd st
artin
g a
peer
-tu
torin
g pr
ogra
m.
Ane
cdot
al d
escr
iptio
n of
cu
rric
ular
inno
vatio
ns o
nly;
no
outc
ome
data
pro
vide
d
Y
N

DRAFT
35
Bon
d, 2
008
Tow
ard
info
rmat
ive
asse
ssm
ent a
nd a
cu
lture
of e
vide
nce:
R
esul
ts fr
om
stre
ngth
enin
g pr
e-co
llegi
ate
educ
atio
n in
co
mm
unity
col
lege
s
Elev
en
Cal
iforn
ia
com
mun
ity
colle
ge
cam
puse
s
Des
crib
ed c
urric
ular
inno
vatio
ns
desi
gned
to im
prov
e st
uden
t su
cces
s in
deve
lopm
enta
l mat
h an
d En
glis
h cl
asse
s. In
nova
tions
in
clud
ed: e
stab
lishi
ng le
arni
ng
com
mun
ities
aro
und
parti
cula
r co
urse
s or c
ours
e se
quen
ces;
de
velo
ping
facu
lty in
quiry
; usi
ng
asse
ssm
ent i
n ne
w w
ays,
such
as
pre-
and
pos
t-tes
ting;
use
of
tech
nolo
gy; a
nd u
se o
f pee
r as
sist
ance
am
ong
stud
ents
Prel
imin
ary
data
sugg
este
d in
crea
sed
stud
ent s
ucce
ss ra
tes
in d
evel
opm
enta
l mat
h cl
asse
s at
four
out
of f
ive
com
mun
ity
colle
ge c
ampu
ses w
ith su
stai
ned
inno
vatio
ns in
the
mat
hem
atic
s cu
rric
ulum
. Se
ven
out o
f nin
e ca
mpu
ses w
ith su
stai
ned
inno
vatio
ns in
the
deve
lopm
enta
l En
glis
h cu
rric
ulum
had
in
crea
sed
succ
ess r
ates
for
stud
ents
in th
ese
clas
ses.
The
re
wer
e m
ixed
resu
lts fo
r stu
dent
re
tent
ion
and
pers
iste
nce.
Y
N
Bro
wn
&
Nie
mi,
2007
In
vest
igat
ing
the
alig
nmen
t of h
igh
scho
ol a
nd c
omm
unity
co
llege
ass
essm
ents
in
Cal
iforn
ia
Ana
lyze
s 16
diff
eren
t co
mm
unity
co
llege
pl
acem
ent
asse
ssm
ents
in
Engl
ish
and
mat
h
Iden
tifie
s the
stan
dard
s rep
rese
nted
by
the
plac
emen
t ass
essm
ents
and
th
en c
ompa
res t
hese
stan
dard
s to
wha
t hig
h sc
hool
stud
ents
are
ex
pect
ed to
kno
w in
the
11th
gr
ade.
The
Cal
iforn
ia S
tand
ards
Tes
ts
in E
nglis
h La
ngua
ge A
rts
show
ed st
rong
alig
nmen
t with
co
mm
unity
col
lege
pla
cem
ent
test
s but
the
Cal
iforn
ia S
tand
ards
Te
sts i
n m
ath
did
not.
N
N
Car
negi
e Fo
unda
tion
for t
he
Adv
ance
men
t of
Tea
chin
g,
2008
Stre
ngth
enin
g pr
e-co
llegi
ate
educ
atio
n in
co
mm
unity
col
lege
s:
Proj
ect s
umm
ary
and
reco
mm
enda
tions
Elev
en
Cal
iforn
ia
com
mun
ity
colle
ge
cam
puse
s
Con
nect
ed to
sam
e pr
ojec
t as
Bon
d, 2
008
(see
abo
ve).
Lis
ts
reco
mm
enda
tions
for i
mpr
ovin
g st
uden
t out
com
es th
roug
h ac
tions
at
the
facu
lty, c
olle
ge, a
nd sy
stem
le
vel.
Con
nect
ed to
sam
e pr
ojec
t as
Bon
d, 2
008
(see
abo
ve),
but t
his
parti
cula
r rep
ort d
oes n
ot fo
cus
on st
uden
t out
com
e da
ta.
Y
N
Cen
ter f
or
Stud
ent
Succ
ess,
2007
Bas
ic sk
ills a
s a
foun
datio
n fo
r stu
dent
su
cces
s in
Cal
iforn
ia
com
mun
ity c
olle
ges
Lite
ratu
re
revi
ew o
f bes
t pr
actic
es in
de
velo
pmen
tal
educ
atio
n
Bes
t pra
ctic
es w
ere
cate
goriz
ed a
s or
gani
zatio
nal o
r adm
inis
trativ
e pr
actic
es; p
rogr
am c
ompo
nent
s;
staf
f dev
elop
men
t; or
inst
ruct
iona
l pr
actic
es.
Inst
ruct
iona
l bes
t pra
ctic
es
incl
uded
facu
lty c
olla
bora
tion;
on
goin
g m
onito
ring
of st
uden
t le
arni
ng; s
uppo
rt se
rvic
es fo
r st
uden
ts, i
nclu
ding
tuto
ring;
and
Y
N

DRAFT
36
cultu
rally
resp
onsi
ve te
achi
ng
Gol
fin,
Jord
an, H
ull,
& R
uffin
, 20
05
Stre
ngth
enin
g m
athe
mat
ics s
kills
at
the
post
seco
ndar
y le
vel:
liter
atur
e re
view
an
d an
alys
is
Lite
ratu
re
revi
ew o
f st
udie
s pe
rtain
ing
to
adul
t m
athe
mat
ics
lear
ning
Focu
sed
on th
ree
ques
tions
: (1)
W
hat i
s the
def
initi
on o
f ade
quat
e st
uden
t pre
para
tion
in
post
seco
ndar
y le
vel m
ath?
; (2)
W
hat i
nstit
utio
ns p
rovi
de
deve
lopm
enta
l mat
h ed
ucat
ion,
and
ho
w d
oes i
nstru
ctio
n di
ffer
acr
oss
thes
e in
stitu
tions
?; a
nd (3
) Wha
t st
rate
gies
app
ear t
o he
lp a
dult
lear
ners
stre
ngth
en th
eir m
ath
skill
s and
mov
e to
col
lege
leve
l m
ath
cour
ses o
r wor
k as
sign
men
ts
requ
iring
hig
her l
evel
mat
h?
From
the
limite
d lit
erat
ure
avai
labl
e, su
cces
sful
in
stru
ctio
nal p
ract
ices
in
deve
lopm
enta
l mat
h cl
asse
s se
emed
to in
clud
e: g
reat
er u
se o
f te
chno
logy
; int
egra
tion
of
clas
sroo
m a
nd la
bora
tory
in
stru
ctio
n; g
ivin
g st
uden
ts th
e op
tion
to se
lect
from
am
ong
diff
eren
t ins
truct
iona
l met
hods
; us
e of
mul
tiple
app
roac
hes t
o pr
oble
m so
lvin
g; p
roje
ct-b
ased
in
stru
ctio
n; lo
w st
uden
t to
facu
lty ra
tios;
ass
essm
ent a
nd
plac
emen
t of s
tude
nts i
nto
the
appr
opria
te m
athe
mat
ics
cour
ses;
and
inte
grat
ion
of
coun
selin
g, st
aff t
rain
ing,
and
pr
ofes
sion
al d
evel
opm
ent.
Y
N
Gru
bb, 1
999
Hon
ored
but
invi
sibl
e:
An
insi
de lo
ok a
t te
achi
ng in
com
mun
ity
colle
ges
Obs
erva
tions
an
d in
terv
iew
s of
257
co
mm
unity
co
llege
in
stru
ctor
s in
32 c
omm
unity
co
llege
s
Des
crib
es p
atte
rns a
cros
s the
257
in
stru
ctor
s obs
erve
d, a
naly
zing
pe
dago
gy, w
orki
ng c
ondi
tions
, in
nova
tions
, fun
ding
, and
in
stitu
tiona
l inf
luen
ces o
n te
achi
ng.
Sinc
e th
is is
a d
escr
iptiv
e,
qual
itativ
e pi
ece
on in
stru
ctor
s, st
uden
t out
com
e da
ta is
not
the
focu
s. H
owev
er, i
nnov
atio
ns
men
tione
d th
at se
em a
ssoc
iate
d w
ith st
uden
t suc
cess
incl
ude
lear
ning
com
mun
ities
, in
tegr
atin
g ac
adem
ic a
nd
voca
tiona
l lea
rnin
g, a
nd
prov
idin
g in
stitu
tiona
l sup
port
for f
acul
ty c
olla
bora
tion.
Y
N
Kan
e, B
eals
, V
alea
u, &
Jo
hnso
n,
2004
Fost
erin
g su
cces
s am
ong
tradi
tiona
lly
unde
rrep
rese
nted
st
uden
t gro
ups:
One
co
mm
unity
co
llege
Des
crib
es c
olle
ge’s
atte
mpt
to
incr
ease
und
erre
pres
ente
d st
uden
ts’ e
nrol
lmen
t and
succ
ess i
n m
ath,
scie
nce,
and
eng
inee
ring
Stud
ents
par
ticip
atin
g in
MES
A
wor
ksho
ps re
ceiv
ed g
rade
s a fu
ll po
int h
ighe
r tha
n st
uden
ts n
ot
parti
cipa
ting
in th
e w
orks
hops
.
Y
Y

DRAFT
37
Har
tnel
l Col
lege
's ap
proa
ch to
im
plem
enta
iton
of th
e M
ath,
Eng
inee
ring,
an
d Sc
ienc
e A
chie
vem
ent (
MES
A)
prog
ram
cour
ses t
hrou
gh in
nova
tions
in
clud
ing:
outreach and
recr
uitm
ent;
orie
ntat
ion
activ
ities
, a
MES
A st
uden
t cen
ter;
stud
ent
coho
rt cl
uste
ring;
aca
dem
ic
exce
llenc
e w
orks
hops
; and
ac
adem
ic p
lann
ing
and
coun
selin
g su
ppor
t
How
ever
, the
two
grou
ps o
f st
uden
ts m
ay h
ave
diff
er o
n ot
her d
imen
sion
s, as
wel
l, su
ch
as m
otiv
atio
n. S
tude
nt o
utco
mes
ca
nnot
be
caus
ally
link
ed to
the
inno
vatio
ns.
Kle
in &
W
right
, 200
9 M
akin
g pr
ealg
ebra
m
eani
ngfu
l: It
star
ts
with
facu
lty in
quiry
One
co
mm
unity
co
llege
Des
crib
es c
olle
ge’s
atte
mpt
to
impr
ove
stud
ent s
ucce
ss in
pr
ealg
ebra
thro
ugh
facu
lty in
quiry
gr
oups
that
focu
sed
on m
odify
ing
curr
icul
ar a
nd in
stru
ctio
nal
prac
tices
. In
nova
tions
incl
uded
: re
duci
ng th
e nu
mbe
r of c
once
pts
taug
ht, m
akin
g co
nnec
tions
be
twee
n co
urse
con
tent
and
oth
er
subj
ects
; and
impr
ovin
g as
sess
men
ts
Stud
ents
taug
ht b
y fa
culty
in th
e in
quiry
gro
ups s
how
ed
som
ewha
t hig
her s
ucce
ss a
nd
rete
ntio
n ra
tes t
han
othe
r st
uden
ts.
How
ever
, stu
dent
ou
tcom
es c
anno
t be
caus
ally
lin
ked
to th
e in
nova
tions
.
Y
Y
Mar
wic
k,
2004
C
harti
ng a
pat
h to
su
cces
s: T
he
asso
ciat
ion
betw
een
inst
itutio
nal p
lace
men
t po
licie
s and
the
acad
emic
succ
ess o
f La
tino
stud
ents
One
co
mm
unity
co
llege
Des
crib
es c
olle
ge’s
exp
erim
ent
with
mod
ifyin
g th
e pl
acem
ent
proc
ess f
or m
athe
mat
ics c
ours
es
Res
ults
show
ed th
at w
hen
plac
emen
t met
hods
con
side
red
mul
tiple
mea
sure
s of a
cade
mic
pr
epar
edne
ss, s
tude
nts w
ere
initi
ally
pla
ced
into
hig
her l
evel
m
athe
mat
ics c
ours
es in
whi
ch
they
ach
ieve
d eq
ual o
r gre
ater
ac
adem
ic su
cces
s tha
n w
hen
only
stan
dard
ized
test
scor
es o
r on
ly h
igh
scho
ol p
repa
ratio
n w
ere
cons
ider
ed.
N
Y
Schw
artz
, 20
07
New
stan
dard
s for
im
prov
ing
two-
year
m
athe
mat
ics
N/A
D
escr
ibes
how
com
mun
ity c
olle
ge
mat
hem
atic
s ins
truct
ors c
an
impl
emen
t the
reco
mm
enda
tions
of
Rec
omm
enda
tions
onl
y; n
o ou
tcom
e da
ta p
rovi
ded
Y
N

DRAFT
38
inst
ruct
ion
the
Am
eric
an M
athe
mat
ical
A
ssoc
iatio
n of
Tw
o-Y
ear C
olle
ges,
whi
ch in
clud
e in
tegr
atin
g te
chno
logy
; alig
ning
pla
cem
ent
test
s with
hig
h sc
hool
exi
t exa
ms;
us
ing
mul
tiple
mea
sure
s for
the
plac
emen
t pro
cess
; and
con
nect
ing
cour
se c
onte
nt to
qua
ntita
tive
skill
s ne
eded
in e
very
day
life
Shel
ton
&
Bro
wn,
200
8 M
easu
ring
the
alig
nmen
t of h
igh
scho
ol a
nd c
omm
unity
co
llege
mat
h as
sess
men
ts
Ana
lyze
s 16
diff
eren
t co
mm
unity
co
llege
pl
acem
ent
asse
ssm
ents
in
mat
h
“The
Cal
iforn
ia C
omm
unity
C
olle
ge p
lace
men
t tes
t con
tent
was
co
mpa
red
to th
e hi
gh sc
hool
leve
l C
alifo
rnia
Sta
ndar
ds T
ests
in
Gen
eral
Mat
hem
atic
s, A
lgeb
ra 1
an
d G
eom
etry
” (p
. 2).
“Onl
y th
e G
ener
al M
athe
mat
ics
was
alig
ned
acro
ss a
subs
tant
ial
num
ber o
f sta
ndar
ds. …
It
appe
ars t
hat t
he m
ajor
sour
ce o
f m
isal
ignm
ent b
etw
een
the
two
test
ing
syst
ems o
ccur
s with
in th
e co
nten
t are
as o
f Int
eger
s and
R
atio
nals
, Trig
onom
etry
and
G
raph
ing”
(p. 2
).
N
N

DRAFT
39
Bibliography
Abedi, J., & Lord, C. (2001). The language factor in mathematics tests. Applied
Measurement in Education, 14(3), 219-234. Bahr, P. R. (2008). Does mathematics remediation work?: A comparative analysis of
academic attainment among community college students. Research in Higher Education, 49(5), 420-450.
Bailey, T., Jeong, D. W., & Cho, S. (2008). Referral, enrollment, and completion in
developmental education sequences in community colleges. New York: Community College Research Center.
Barwell, R. (2005a). Integrating language and content: Issues from the mathematics
classroom. Linguistics and Education, 16(2), 205-218. Barwell, R. (2005b). Working on arithmetic word problems when English is an additional
language. British Educational Research Journal, 31(3), 329-348. Bernardo, A. B., & Calleja, M. O. (2005). The effects of stating problems in bilingual
students' first and second languages on solving mathematical word problems. The Journal of Genetic Psychology, 166(1), 117-28.
Blum, D. E. (2007). Getting students through remedial math is a constant struggle, but
this college keeps trying. Chronicle of Higher Education, 54(9): B5. Bond, L. (2009). Toward informative assessment and a culture of evidence: Results from
strengthening pre-collegiate education in community colleges. Palo Alto, CA: Carnegie Foundation for the Advancement of Teaching.
Brown, R. S., & Niemi, D. N. (2007). Investigating the alignment of high school and
community college assessments in California. San Jose, CA: National Center for Public Policy and Higher Education.
Bueschel, A. C. (2004). Linkages and disjunctures: California’s K12 and community
college systems. In Improving the transition from high school to postsecondary education. Stanford, CA: Policy Analysis for California Education.
Bunch, G. C. (2008). Language minority students and California community colleges:
Current issues and future directions. Community College Policy Research, 1, 1-17.
Bunch, G. C., & Panayotova, D. (2008). Latinos, language minority students, and the construction of ESL: Language testing and placement from high school to community college. Journal of Hispanic Higher Education, 7(1), 6-30.

DRAFT
40
California Community College Chancellor’s Office. (2009). Student headcount by ethnicity statewide for 2007-2008. Retrieved July 5, 2009, from https://misweb.cccco.edu/mis/onlinestat/studdemo_annual_college.cfm
California Department of Education. (2009a). Time-series – Number of English learners.
Retrieved July 24, 2009, from http://dq.cde.ca.gov/dataquest/lc/NumberElState.asp?Level=State&TheYear=2008-09
California Department of Education. (2009b). Number of English learners by language,
2008-09. Retrieved July 24, 2009, from http://dq.cde.ca.gov/dataquest/LEPbyLang1.asp?cChoice=LepbyLang1&cYear=2008-09&cLevel=State&cTopic=LC&myTimeFrame=S&submit1=Submit
California Postsecondary Education Commission. (2007). California higher education
accountability: Goal – Student success; Measure: California community college students degrees and certificates awarded and successful transfers. Sacramento, CA: California Postsecondary Education Commission.
Carnegie Foundation For The Advancement Of Teaching. (2008). Strengthening pre-
collegiate education in community colleges: Project summary and recommendations. Carnegie Foundation for the Advancement of Teaching. Retrieved July 24, 2009 from http://www.carnegiefoundation.org/dynamic/publications/elibrary_pdf_774.pdf
Center for Student Success. (2007). Basic skills as a foundation for student success in
California community colleges (Vol. 100). Sacramento, CA: California Community Colleges Systems Office.
Chapman, A. P. (2003). Language practices in school mathematics: A social semiotic
approach. Lewiston, NY: Edwin Mellen Press. Crandall, J. & Sheppard, K. (2004). Adult ESL and the community college. New York:
Council for the Advancement of Adult Literacy. Elmore, R. F. (1983). Forward and backward mapping: Reversible logic in the analysis
of public policy. Paper presented at the International Workshop on Interorganizational Implementation Systems. Rotterdam, The Netherlands.
Farr, M. (2006). Rancheros in Chicagoacán: Language and identity in a transnational
community. Austin: University of Texas Press. Fry, R. (2002). Latinos in higher education: Many enroll, too few graduate. Washington
DC: Pew Hispanic Center.

DRAFT
41
Gifford, B. R. & Valdes, G. (2006). The linguistic isolation of Hispanic students in California’s public schools: The challenge of reintegration. Yearbook of the National Society for the Study of Education, 105(2), 125-154.
Gorgorió, N., & Planas, N. (2001). Teaching mathematics in multilingual classrooms.
Educational Studies in Mathematics, 47, 7-33. Golfin, P., Jordan, W., Hull, D., & Ruffin, M. (2005). Strengthening mathematics skills at
the postsecondary level: Literature review and analysis. Washington DC: US Department of Education.
Grubb, W. N. (1999). Honored but invisible: An inside look at teaching in community
colleges. New York: Routledge. Harklau, L. (2003). Generation 1.5 students and college writing. Washington DC: Center
for Applied Linguistics. Humberstone, J., & Reeve, R. A. (2008). Profiles of algebraic competence. Learning and
Instruction, 18(4), 354-367. ICAS ESL Task Force. (2006). ESL students in California public higher education.
Sacramento, CA: Intersegmental Committee of the Academic Senates. Laborde, C. (1990). Language and mathematics. In P. Nesher & J. Kilpatrick,
Mathematics and cognition (pp. 53-69). Cambridge, England: CUP. Kane, M. A., Beals, C., Valeau, E. J., & Johnson, M. J. (2004). Fostering success among
traditionally underrepresented student groups: Hartnell College's approach to implementation of the Math, Engineering, and Science Achievement (MESA) program. Community College Journal of Research and Practice, 28(1), 17-26.
Klein, B., & Wright, L. M. (2009). Making prealgebra meaningful: It starts with faculty
inquiry. New Directions for Community Colleges, 145, 37-77. Lewis, A. B., & Mayer, R. E. (1987). Students' miscomprehension of relational
statements in arithmetic word problems. Journal of Educational Psychology, 79(4), 363-371.
MacGregor, M., & Price, E. (1999). An exploration of aspects of language proficiency
and algebra learning. Journal for Research in Mathematics Education, 30(4), 449- 467.
MacGregor, M., & Stacey, K. (1993). Cognitive models underlying students' formulation of simple linear equations. Journal for Research in Mathematics Education, 24(3), 217-232.

DRAFT
42
Malisani, E., & Spagnolo, F. (2009). From arithmetical thought to algebraic thought: The role of the “variable”. Educational Studies in Mathematics, 71(1), 19-41.
Martiniello, M. (2008). Language and the performance of English-language learners in
math word problems. Harvard Educational Review, 78(2), 1-29. Marwick, J. D. (2004). Charting a path to success: The association between institutional
placement policies and the academic success of Latino students. Community College Journal of Research and Practice, 28(3), 263-280.
Mestre, J. P. (1988). The role of language comprehension in mathematics and problem
solving. In R. R. Cocking & J. P. Mestre, Linguistic and cultural influences on learning mathematics (pp. 201-220). Hillsdale, NJ: Lawrence Erlbaum.
Moore, C., Shulock, N., Ceja, M., & Lang, D. M. (2007). Beyond the open door:
Increasing student success in the California community colleges. Assessment. Sacramento, CA: Institute for Higher Education Leadership and Policy.
Moschkovich, J. (2002). A situated and sociocultural perspective on bilingual
mathematics learners. Mathematical Thinking and Learning, 4(2&3), 189-212. National Center for Education Statistics. (2009). Digest of education statistics – 2008.
Retrieved August 15, 200,9 from http://nces.ed.gov/programs/digest/d07/index.asp National Center for Education Statistics. (2008a). Condition of education 2007: Special
analysis - Community colleges. Retrieved August 14, 2009, from http://nces.ed.gov/programs/coe/2008/analysis/sa02b.asp#info
National Center for Education Statistics. (2008b). Condition of education 2008, Table
SA-9: Percentage distribution of undergraduates, by control and type of institution and student characteristics: 2003–04. Retrieved July 24, 2009, from http://nces.ed.gov/programs/coe/2008/analysis/sa_table.asp?tableID=1006
National Center for Education Statistics. (2008c). Digest of Education Statistics – 2007,
Table 216: Total fall enrollment in degree-granting institutions, by race/ethnicity, sex, attendance status, and level of student: Selected years, 1976 through 2005. Retrieved July 24, 2009, from http://nces.ed.gov/programs/digest/d07/tables/dt07_216.asp?referrer=report
National Clearinghouse for English Language Acquisition. (2006). The growing
numbers of limited English proficient students, 1995/96-2005/06. Washington, DC: NCELA. Retrieved March 16, 2009, from http://www.ncela.gwu.edu/policy/states/reports/statedata/2005LEP/GrowingLEP_0506.pdf

DRAFT
43
Neville-Barton, P., & Barton, B. (2005). The relationship between English language and mathematics learning for non-native speakers. Wellington, NZ: Teaching and Learning Research Initiative.
Oboler, S. (1995). Ethnic labels, Latino lives: Identity and the politics of (re)presentation
in the United States. Minneapolis: University of Minnesota Press. Österholm, M. (2006). Characterizing reading comprehension of mathematical texts.
Educational Studies in Mathematics, 63(3), 325-346. Pape, S. J. (2003). Compare word problems: Consistency hypothesis revisited.
Contemporary Educational Psychology, 28(3), 396-421. Pimm, D. (1989). Speaking mathematically: Communication in mathematics classrooms.
New York: Routledge. Portes, A. (1996). The new second generation. New York: Sage. Reed, S. K. (2006). Does unit analysis help students construct equations? Cognition and
Instruction, 24(3), 341-366. Rosin, M., & Wilson, K. (2008). High school to community college: New efforts to build
shared expectations. Mountain View, CA: EdSource. Rosnick, P., & Clement, R. (1980). Learning without understanding: The effect of
tutoring strategies on algebra misconceptions. Journal of Mathematical Behaviour, 3(1), 3-27.
Ruiz-de-Velasco, J., Fix, M., & Clewell, B. (2000). Overlooked and underserved:
Immigrant students in U.S. secondary schools. Washington, DC: The Urban Institute. Retrieved August 5, 2009 from http://www.urbaninstitute.org/pdfs/overlooked.pdf
Rumbaut, R., & Ima, K. (1988). The adapatation of Southeast Asian refugee youth: A
comparative study. . Washington DC: Office of Refugee Resettlement. Sabbagh, M. A., & Shafman, D. (2009). How children block learning from ignorant
speakers. Cognition, 112(3), 415-22. Saénz, V. B. (2002). Hispanic students and community colleges: A critical point for
intervention. ERIC Digest. ERIC Clearinghouse for Community Colleges. Retrieved from http://www.eric.ed.gov/ERICWebPortal/contentdelivery/servlet/ERICServlet?accno=ED477908.
Schwartz, A. E. (2007). New standards for improving two-year mathematics instruction.
Education Digest: Essential Readings Condensed for Quick Review, 73(2), 39-42.

DRAFT
44
Setati, M., & Adler, J. (2000). Between languages and discourses: Language practices in
primary multilingual mathematics classrooms in South Africa. Educational Studies in Mathematics, 43, 243-269.
Shelton, A. R., & Brown, R. S. (2008, March 26). Measuring the alignment of high
school and community college math assessments. Paper presented at the Annual Meeting of the American Educational Research Association. New York.
Suarez-Orozco, C., & Suarez-Orozco, M. M. (2001). Children of immigration.
Cambridge, MA: Harvard University Press. Solorzano, D. G., Rivas, M. A., & Velez, V. N. (2005). Community college as a pathway
to Chicana/o doctorate production. Latino Policy & Issues Brief. Number 11. Los Angeles: UCLA Chicano Studies Research Center.
Stacey, K., & MacGregor, M. (2000). Learning the algebraic method of solving
problems. The Journal of Mathematical Behavior, 18(2), 149-167. Thompson, G. (2009, March 15). Where education and assimilation collide. The New
York Times. Retrieved August 5, 2009, from http://www.nytimes.com/2009/03/15/us/15immig.html
U.S. Census Bureau. Census 2000 special tabulations (STP-159). Table FBP-1. Profile of
selected demographic and social characteristics for the foreign-born population who entered the United States 1990 to 2000. Retrieved August 5, 2009, from http://www.census.gov/population/cen2000/stp-159/1990-2000.pdf
Valdés, G. (2001). Learning and not learning English: Latino students in American
schools. New York: Teachers College Press. Visher, M. G., Wathington, H., Richburg-Hayes, L., & Schneider, E. (2008). The
learning communities demonstration: Rationale, sites, and research design. New York: MDRC and the National Center for Postsecondary Research.
Walshaw, M., & Anthony, G. (2008). The teacher's role in classroom discourse: A review
of recent research into mathematics classrooms. Review of Educational Research, 78(3), 516-551.
White House Press Office. (2009, July 14). American graduation initiative fact sheet.
Retrieved July 28, 2009, from http://www.whitehouse.gov/the_press_office/Excerpts-of-the-Presidents-remarks-in-Warren-Michigan-and-fact-sheet-on-the-American-Graduation-Initiative/
Yackel, E., & Cobb, P. (1996). Sociomathematical norms, argumentation, and autonomy
in mathematics. Journal for Research in Mathematics Education, 27(4), 458-477.

Appendix 1 Description of the Three Community Colleges
East Los Angeles College
East Los Angeles College (ELAC) is part of the Los Angeles Community College District
(LACCD). The LACCD is the largest community college district in the United States and is one of
the largest in this world. The LACCD consists of nine colleges and it encompasses an area that is
more than 882 square miles. Although ELAC is considered one college, ELAC presently has two
additional satellite campuses (South Gate campus and Rosemead campus).
ELAC main campus provides students various academic, non-credit community services and
vocational courses. In addition, students have access to all campus services (admission, counseling,
financial aid, transfer center, child care, disabled student programs and services, academic
programs, student clubs, special-funded programs, library, computers, tutoring, and laboratories that
supplement student learning such as science, mathematics and English). The college has
institutionalized a program for high school students (Escalante Program) so that high school
students could take mathematics courses. The college not only provides a program for high school
students but for first-year college students (Adelante Program) where first-year college students are
placed in academic learning communities and simultaneously getting the academic and student
support services. Furthermore, the college offers a variety of programs that assist students focusing
in specific academic disciplines.
South Gate Educational Center offers a variety of career and academic courses. In addition, students
have access to a computer lab, bookstore, library and student services. Students who take courses at
the South Gate campus could take courses at the main campus simultaneously. A free shuttle bus
transports students from the South Gate campus to the main campus throughout the day thereby
giving students more flexibility in course offerings.
Rosemead Center offers students academic and non-credit community service courses. Although the
center does not provide students with any student services, the center will be implementing (fall
2009) a computer laboratory that will consist of forty computers for student use. Rosemead Center
will begin its third year of operation this fall 2009.

El Paso Community College El Paso Community College has five campuses. Mission del Paso campus is located east of El Paso
and offers a full range of classes including a state-of-the-art Law Enforcement Training Academy.
In addition, the campus serves instructional services for students such as labs for English as a
Second Language (ESL), reading and general tutoring services. Furthermore, the campus
established an early college program for high school students (Mission Early College High School)
where students earn an associate’s degree and high school diploma concurrently.
Northwest campus provides students with a full range of classes (academic, technical and non-
credit) and student services (admission, registration, financial aid and counseling). In addition, the
campus provides students with facilities for mathematics, biology, geology, ESL and reading. The
Northwest campus library in partnership with the City of El Paso and the El Paso Public Library,
serves as the “Community Library.” Furthermore, the campus established an early college program
for high school students.
Rio Grande campus offers a variety of courses that include the arts, sciences, basic academic skills,
credit courses in ESL and occupational education programs. In addition, students have access to all
of the college and student services (admission, financial aid, counseling, registration, bookstore,
library and cafeteria) that are needed.
Transmountain campus is located northeast of El Paso. The campus provides students with
educational programs and all college services (admissions, registration, financial aid, counseling,
full-service library, bookstore and child care). Transmountain is the only college that has a
performance/ lecture facility for concerts, films, large meetings and community events. In addition,
the campus established a program for high schools students.
Valle Verde campus is the largest and most centrally located facility. The campus provides students
with educational programs and all college services (admissions, registration, financial aid,
counseling, full-service library, bookstore and child care). In addition, students have access to a
computer laboratory of 100 stations networked with Internet access, state-of-the-art laboratories for
foreign language and ESL courses, as well as community interest non-credit classes (e.g., floral
arrangement and cooking). The campus established an early college program for high schools
students.

San Jose City College
San Jose/Evergreen Community College District serves 950,000 residents within the 303 square
miles, including the San Jose and Milpitas Unified School Districts and East Side Union High
School District. The district includes San Jose City College and Evergreen Valley College. A new
science building includes new facilities for physical education, cosmetology, mathematics, arts &
humanities and health sciences.
College Enrollment Data – See pages 1 - 9
Every college generates its own data, collecting data at various times. East Los Angeles College
collects their data every fall semester. Students who enroll in the college during the winter session,
spring semester and summer sessions, are included in the college enrollment data collection for the
following fall semester. In other words, a student could begin her or his college career in the winter
session and continue until the summer session. This particular student would not be counted as part
of the data enrollment until the student registered for the fall semester. El Paso Community College
collected data from the EPCC’s website. The data specifically focused on the fall semester. Data
after fall 2006 was unavailable. San Jose City College’s data collection schedule isn’t known..
SJCC’s website did not provide any research data.
Total number of students enrolled:
El Paso Community College has the largest enrollment compared to East Los Angeles College and
San Jose City College. When comparing ELAC and EPCC, there were similarities in gender
enrollment for the fall 2006 and fall 2007. For both colleges, where approximately 60 percent of the
students were females and 40 percent were males. In terms of ethnicity on campus, approximately
76 percent of the students were Hispanics at ELAC whereas 86 percent were at EPCC. Although the
comparison is between ELAC and EPCC (SJCC did not provide data), the ethnic demographics,
gender and enrollment were similar.

Number of non-English background students –international students who will return to their home countries ELAC does not generate data on the number of students who will return to their home countries.
ELAC students begin their education at the college and are highly encouraged to transfer to a four-
year institution. Presently ELAC does not have the resources to track international students if they
transferred to a four-year institution, transferred to a different community college, remained in the
country illegally/legally, or returned to their home country. ELAC provided date on the number of
students who enroll at ELAC with a “student visa.” For the fall 2006, 1.4 percent (298 students) of
the students were enrolled at ELAC with a student visa. For the fall 2007, 1.9 percent (424 students)
of the students were enrolled with student visas and 2.5 percent for fall 2008. As for EPCC and
SJCC, no data was provided.
Number of non-English background students – immigrant students who were schooled outside the United States ELAC does not specifically track this information. ELAC only accounts for the student’s current
status when students enroll at the college. For instance, if a student is naturalized before enrolling to
ELAC, then the student is counted as a “US citizen.” For the fall 2006, 13 percent of students had
permanent residency (2,738 students), 0.1 percent had temporary residency (30 students), 1.2
percent had a refugee/asylee residency (246 students), and 6.6 percent of students are classified as
“other” (1,393 students). For the fall 2007, 12.5 percent of students had permanent residency
(2,791 students), 0.1 percent had temporary residency (31 students), 1.1 percent had a
refugee/asylee residency (253 students), and 6.6 percent were classified as “other” (1,472 students)..
For the fall 2008, 11.0 percent of ELAC enrolled students had permanent residency, 0.1 percent had
temporary residency, 0.9 percent had a refugee/asylee residency, and 6.2 percent are classified as
“other.” As for the other two colleges, data was not provided.
Number of non-English background students –immigrant origin students who were schooled in the United States (1.5 Generation) ELAC does not track this information (see above). As for the other two colleges, data was not
provided therefore uncertain if the colleges collect this information.

ESL Assessment Instrument(s) used – See page 10
Both ELAC and EPCC assess their students using the Combined English Language Assessment
(CELSA). SJCC, uses the Compass reading, Compass listening and an ESL essay. In general, the
two largest community colleges in the study use the same ESL assessment instruments.
ESL Placement Data – See pages 11 - 15
Number of students who took the ESL placement exam
SJCC did not provide any data. The data below will only reflect ELAC and EPCC. At ELAC,
students are highly encouraged to take the placement exam for both English and mathematics. The
college does not require that students must first take the assessment test before registering for a
course. Students may register for a course without taking the assessment exam except for courses
that have a mathematics or English pre-requisite. Those students who take the English assessment
examare referred to a specific English course or ESL Referral. ESL Referral means that a student’s
English score was below the “cut-off score,” therefore the student was referred to take the ESL
placement exam. Students do not need to take the English assessment test in order to be referred to
take the ESL placement exam. Students could self-select to take the ESL exam. Thosetudents who
take the ESL placement exam, they are referred to a specific ESL course or ENL Referral. ENL
Referral means that a student’s English score is above the “cut-off score,” therefore he or she is
referred to take the English assessment exam. As for EPCC, the ESL placement exam does not
place a student into or out of the ESL program. The exam determines the appropriate level of
courses to be taken by a student who chooses to participate in the ESL program.
For ELAC, 1,810 students and 1,634 students took the ESL placement exam in the academic years
2006 – 2007 and 2007 – 2008, respectively. In addition, 314 students and 386 students were
referred to take the ESL placement exam. At EPCC, 1,146 students, 993 students and 1,098 students
took the ESL placement exam in the academic years 2006 – 2007, 2007 – 2008 and 2008 – 2009,
respectively. In general, more students took the ESL placement exam at ELAC. One might suspect
that EPCC, a college that is physically located closer to the United States/Mexico border, would
have had more students taking the ESL placement exam.

Number of students who placed out of ESL courses and who took the ESL placement exam
SJCC did not provide any data. The data for this question was gathered in two different methods.
ELAC track the students by the number of students who took the ESL placement exam but were
referred to an ENL assessment exam. EPCC data includes the number of students who took the ESL
placement exam during a term and the number of students who completed ESL Level 6 (the last
ESL course at EPCC) during that term or any subsequent term. The ESL placement exam does not
place a student into or out of the ESL program. The exam determines the appropriate level of
courses to be taken by a student who chooses to participate in the ESL program.
At ELAC, 20 students (academic year 2006 – 2007) and 14 students (academic year 2007 – 2008)
took the ESL placement exam but where referred to take the ENL assessment exam. As for EPCC,
their collection of data is different from ELAC. At EPCC, 59 students (academic year 2006 – 2007),
9 students (academic year 2007 – 2008) and no students (academic year 2008 – 2009) were
identified. In general, it is difficult to compare both colleges given that the data was generated
differently.
Number of students placing in various courses
Information regarding the ESL placement exam for all three colleges was collected; however SJCC
did not provide any data. The data will only reflect ELAC and EPCC. At ELAC, students are
allowed to repeat the CELSA placement exam once a semester and there is no fee to take the exam.
ELAC ESL courses are divided into two separate departments, ESL credit and ESL non-credit.
Students taking ESL courses through the non-credit department are allowed to take the courses
numerous times (four courses are available). Students are highly encouraged to meet with a non-
credit ESL coordinator to recommend a placement; however, the student makes the final decision as
to which course to take. Students taking courses through the ESL credit department are placed in
specific course based on the student’s ESL placement scores. The ESL credit courses sequence
consists of four levels (one class per level, a total of four courses). Most of the students who took
the placement exam for the academic years 2006 – 2007 and 2007 – 2008, were placed in level four
(23 percent and 25.7 percent, respectively) which is the highest ESL level at ELAC.
As for EPCC, according to the college’s website, students are allowed to repeat the CELSA exam
once every three months (90 days). If a student would like to retest, they would need to submit a

petition form. EPCC students must pay a fee in order to take the assessment exam with the
exception of the first assessment exam which is free unless a student misses his/her appointment.
EPCC ESL sequence of courses consists of six levels (four courses per level, a total of 24 courses).
Most of the students who took the placement exam for the academic years 2006 – 2007 and 2007 –
2008 were placed in level one which is the second lowest ESL level at EPCC. Based on EPCC
discussions with instructors and administration, some students are not placed correctly. Rather than
having students focus on information that they are familiar with, instructors encourage students to
continue with the next level simultaneously and then reassess; thereby, students are completing their
courses at a faster rate.
As for SJCC, according to the college’s website, students are allowed to retake the English
placement exam after12 months and six months if students took the ESL placement exam; however,
if a student has begun the English sequence, he or she is exempt from retaking the assessment. The
placement exam is for initial placement and cannot be used to skip levels. For SJCC students whose
first language is not English, their assessment exam is conducted by appointment only. SJCC
students do not pay a fee to take the placement exam. SJCC ESL sequence of courses consists of six
levels where students are taking a total of 29 courses.
In comparing the three colleges, there was a similarity with SJCC and EPCC in that more than 20
ESL courses are available. Again, depending on where students place in their ESL placement exam,
some students may take more than 20ESL courses while others might take less than 20ESL courses.
Based on data provided by EPCC on ESL placement, most of the students will take more than 20
ESL courses. Once students complete the ESL sequence courses, students would then be eligible to
take the non-transferable English courses and then the transferable English courses. When
comparing EPCC with ELAC, most of the ELAC students are placing in the highest level of ESL
courses. Since students are not required to pay to take the placement exam, students could assess
every semester in hopes of skipping a course. Although EPCC provides the same opportunity for
their students to reassess, EPCC does not provide the same incentive of a non-charge to reassess.
Data on the number of students who reassess and skip English courses are not available for either
EPCC or ELAC.

ESL Completion Data – See page 16
SJCC did not provide any data. The following data will only reflect ELAC and EPCC. As for ELAC
data, ELAC was only able to collect data from 1994 and current data. The following data reflect the
number of awards, however this data may include duplicate awards, meaning that students could
have received one or more degrees or certificates. As of July 27, 1366 students were awarded an
associate of arts degree, 110 students were awarded an associate of science degree, 406 were
awarded a certificate and 406 were awarded a certificate of skills, for a total of 2,618 degrees and/or
certificates awarded. EPCC was able to collect data from 1988 and current data.. The following data
reflect the number of students who originally took ESL Placement and who completed an associate
of arts degree, associate of science degree, AAS or AAT degree. As of July 22, 316 students at
EPCC were awarded a degree.
ESL Policy Documents – See page 17
ESL Policy Documents – Documents that guide the enrollment/education of students who take the ESL placement exam
All three colleges did not provide any data; perhaps information can be obtained from the
instructors’ interviews.
ESL Policy Documents – Policies on courses that ESL students can and cannot enroll in
SJCC and EPCC did not provide any information. As for ELAC, students may register for any
course with the exception of courses that have mathematics or English pre-requisites. Students are
highly recommended to meet with an academic counselor so that the counselor could guide students
in taking appropriate courses.
ESL Policy Documents – Policies on Credit or Non-Credit basis of ESL sequence course All three colleges did not provide any data; perhaps information can be obtained from the
I\instructors’ interviews.

List of Developmental Mathematical Sequence Courses – See page 18 & 19
For all three colleges, the sequences of courses are similar. The lowest mathematic course is a basic
math course that focuses on arithmetic. The next mathematic course is a pre- algebra course. After
that course is a beginning algebra course and finally, intermediate algebra. These courses are
needed in order for students to begin to take transferable courses. Furthermore, all three colleges
have an analytical geometry course that is considered non-transferable but is needed for some
mathematical courses such as trigonometry and the calculus series.
Mathematics Assessment Instruments used – See page 20
All three colleges usea different mathematical placement instrument. ELAC is in the process of
changing its assessment instrument and may potentially use The Accuplacer, the assessment
instrument that is EPCC presently uses. EPCC does not have the flexibility of selecting from a
variety of assessment instruments. The state of Texas mandates that EPCC and other Texas
community colleges use either The Accuplacer or another assessment instrument. EPCC chose The
Accuplacer.
Do the Mathematics Assessment Procedures Include Language Accommodations for Non-English Background Students – See page 20
EPCC did not provide any information. As for ELAC, students from a non-English background do
not receive any language accommodations. The ELAC matriculation office tries to hire and
schedule bilingual proctors for assistance. All students are provided with sample test questions that
are available online. Similarly to ELAC, SJCC does not provide any language accommodations to
non-English background students.
Data on Backgrounds of Students who Place into the Developmental Sequence Course – See pages 21 & 22
Data Background - Number of students who also took the ESL placement exam
All three colleges did not provide any data. For those students who took the ESL placement exam,
ELAC does not track the student’s mathematical level.

Data Background - Number of students who are graduates of US high schools
All three colleges did not provide any data. For those students who took the ESL placement exam,
ELAC does not track the students who graduated from a U.S. high school.
Data Background - - Number of foreign students (educated outside the US)
All three colleges did not provide any data. For those students who took the ESL placement exam,
ELAC does not track the students who are foreign students. ELAC data consist of students with
student visas that took the mathematic placement exam. For the academic year 2007 – 2008, most
of the students that enter ELAC with a student visa enrolled in an intermediate algebra course (29.6
percent), which is one level below the transferable courses. Other students are taking calculus 1
(23.5 percent), followed by beginning algebra (16.4 percent) and transfer level courses (12.3
percent). Again, beginning algebra is two levels below the transferable courses. In general, ELAC
students who enter the college with student visas and who take the math assessment exam (only 89
percent of the students take the assessment exam) are taking developmental mathematics-level
courses (172 students place into the non-transferable courses compared to 116 who place into the
transferable courses). Although the data for ELAC show that 22 students were referred to a higher
test and 14 students were referred to a lower test, it is unclear which mathematical test students took
(transferable or non-transferable courses).
Data Background – Number of students who took algebra
ELAC does not specifically track this information. SJCC and EPCC did not provide any data.
However, EPCC could provide a modification of this data. In Texas, a new law, “Algebra for all”
has been implemented for students who graduate from high school.. Students must have completed
at least three years of mathematics, including algebra 2. Given the new law in Texas and that EPCC
documents students’ graduation from high school, EPCC data would only reflect recent high school
graduates.
Yearly Pass Rates in Developmental Mathematic Courses – See page 21
ELAC only provided data on students who took the assessment test. The data below will only
reflect EPCC and SJCC data. EPCC’s data was further broken down into three classifications of
Level 6: ESL, No ESL and some ESL as well as per semester. However, the data problem occurs
because some EPCC students could reassess and thereby place at a higher level. SJCC provided

data for the academic year regardless of whether students were ESL or not. Although ELAC did not
provide any data on the number of students passing, the college did provide the number of students
who are taking the assessment test, specifically by mathematical level.
At ELAC, for the academic year 2006 – 2007, 78.8 percent of the students were assessed. From
those students that were assessed, 44.8 percent of the students placed in Arithmetic for College
Students, which is four levels below the transfer course. Arithmetic for College Students is the
lowest mathematics course at East Los Angeles College. The next course that students placed (18.2
percent of the students) was beginning algebra, which is two courses below the transfer course. For
the academic year 2007 – 2008, 84.7 percent of the students were assessed. From those students that
were assessed, 22 percent of the students placed in pre-algebra, which is three levels below the
transfer course. The next course that students placed (20 percent of the students) was Arithmetic for
College Students, which is four courses below the transfer course. Most of the students at ELAC are
placing at either the third or fourth level below the transfer course.
At SJCC, for the academic years 2006 – 2007, 2007 – 2008 and 2008 – 2009, most of the students
took intermediate algebra, which is one level below the transfer course. The next course that most
students took was beginning algebra, which is two courses below the transfer course. The number of
students who passed intermediate algebra is approximately 50 percent53 percent and 55 percent,
respectively. The number of students who passed beginning algebra is approximately 51 percent, 47
percent and 51 percent, respectively. Most of the students at SJCC place either one or two levels
below the transfer course.
EPCC provided data on the number of students who passed the developmental courses, however,
EPCC did not provide information on the number of students who attempted to take the course.
Based on what was provided, most students passed an intermediate algebra course, which is one
level below the transfer course. The next course that most students passed was a split between a
beginning algebra course (two levels below) and a pre-algebra course (three levels below). In
general, the data show that in both colleges, SJCC and EPCC, more students are pass mathematics
courses that are either one or two levels below the transfer course. Trying to incorporate ELAC’s
data, it seems that most students at ELAC take courses that are three and four levels below the
transfer level. However, since data was not provided, it is difficult to predict or assume that more
students would be successful based on more students taking those courses. It could be that more
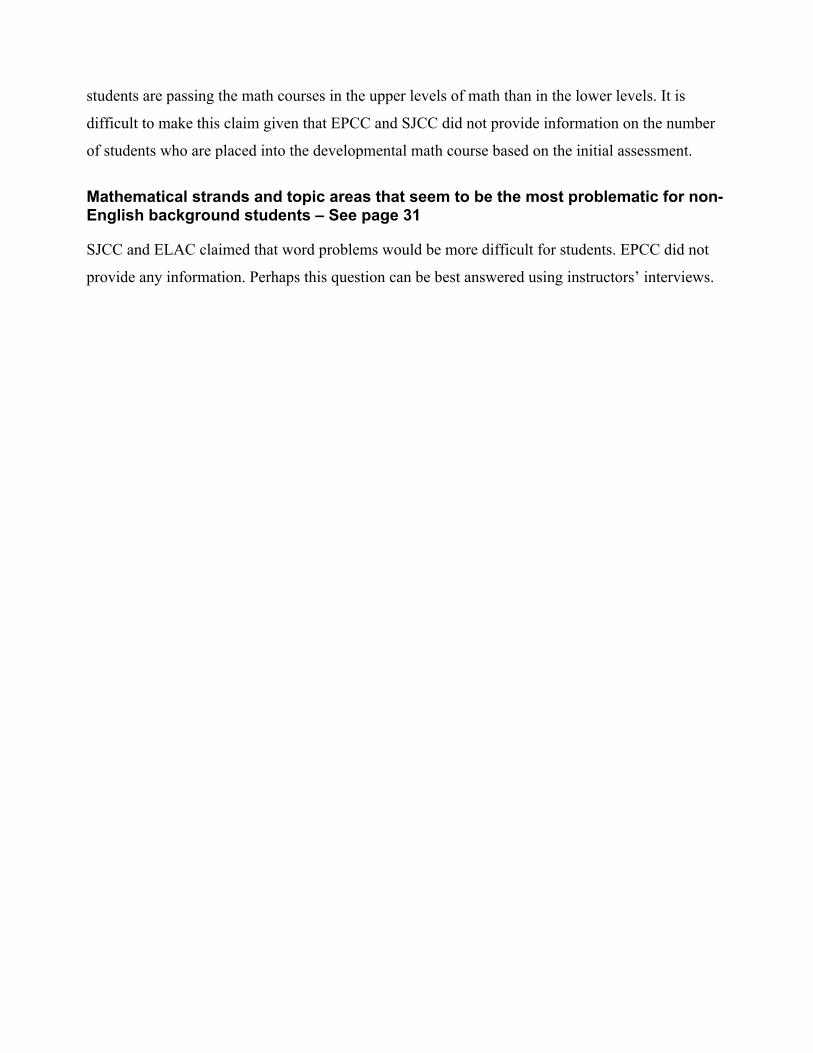
students are passing the math courses in the upper levels of math than in the lower levels. It is
difficult to make this claim given that EPCC and SJCC did not provide information on the number
of students who are placed into the developmental math course based on the initial assessment.
Mathematical strands and topic areas that seem to be the most problematic for non-English background students – See page 31
SJCC and ELAC claimed that word problems would be more difficult for students. EPCC did not
provide any information. Perhaps this question can be best answered using instructors’ interviews.

App
endi
x 2
Inst
itutio
nal D
ata
for L
angu
age
and
Mat
hem
atic
s Pr
ojec
t
V. C
aste
llón
Page
1
2/19
/201
0
Col
lege
Enr
ollm
ent D
ata
Tota
l Num
ber
of S
tude
nts E
nrol
led
2006
– 2
007
2007
– 2
008
2008
– 2
009
East
Los A
ngel
es C
olle
ge
FAL
L 2
006
Con
curr
ent H
S St
uden
ts: 5
31
Firs
t-Tim
e St
uden
ts: 3
,860
Con
tinui
ng S
tude
nts:
13,
768
New
Tra
nsfe
r Stu
dent
s: 1
,863
Ret
urni
ng S
tude
nts:
2,2
98
Unk
now
n: 5
7
Tota
l: 22
,377
FAL
L 2
007
Con
curr
ent H
S St
uden
ts: 9
38
Firs
t-Tim
e St
uden
ts: 4
,626
Con
tinui
ng S
tude
nts:
14,
103
New
Tra
nsfe
r Stu
dent
s: 1
,732
Ret
urni
ng S
tude
nts:
2,3
78
Unk
now
n: 0
Tota
l: 23
,777
FAL
L 2
008
Con
curr
ent H
S St
uden
ts: 7
.9%
Fi
rst-T
ime
Stud
ents
: 16.
3%
Con
tinui
ng S
tude
nts:
46.
8%
New
Tra
nsfe
r Stu
dent
s: 1
0.9%
R
etur
ning
Stu
dent
s: 1
8.8%
Tota
l: 24
,892
El P
aso
Colle
ge
FALL
200
6
Aca
dem
ic T
rans
fer S
tude
nts:
21,
240
Occ
upat
iona
l/Tec
hnic
al S
tude
nts:
4,06
4
Ave
rage
Age
: 25
Mal
es:
10,0
06 (
39.5
%)
Fem
ales
: 15,
298
(60.
5%)
Tota
l: 25
,304
FALL
200
6
Con
tinui
ng E
duca
tion
Stud
ents
: 5,6
86
Ave
rage
Age
: 41
Dat
a w
as o
btai
ned
from
EPC
C w
ebsi
te
FALL
200
7
Mal
e: 1
0,05
5 (4
0.1%
)
Fem
ale:
15,
005
(59.
9%)
Tota
l: 25
,060
D
ata
was
obt
aine
d fr
om E
PCC
web
site

App
endi
x 2
Inst
itutio
nal D
ata
for L
angu
age
and
Mat
hem
atic
s Pr
ojec
t
V. C
aste
llón
Page
2
2/19
/201
0
San
Jose
City
Col
lege
17
,127
18
,228
Tota
l Num
ber
of N
on-E
nglis
h Ba
ckgr
ound
Stu
dent
s Enr
olle
d:
Inte
rnat
iona
l Stu
dent
s who
will
re
turn
to th
eir
hom
e co
untr
ies
20
06 –
200
7
2007
– 2
008
20
08 –
200
9
East
Los A
ngel
es C
olle
ge
Dat
a ba
sed
sole
ly o
n cr
edit
stud
ents
Dat
a in
clud
e cr
edit
and
nonc
redi
t stu
dent
s
Fall
2006
Citi
zens
hip
US
Citi
zens
: 16,
404
(77.
7%)
Perm
anen
t Res
iden
t: 2,
738
(13.
0%)
Tem
pora
ry R
esid
ent:
30 (
0.1%
)
Ref
ugee
/Asy
lee:
246
(1.
2%)
Stud
ent V
isa:
298
(1.
4%)
Oth
er: 1
,393
(6.
6%)
Tota
l: 21
,109
Base
d on
stud
ents
who
pro
vide
d th
e in
form
atio
n R
esid
ency
Sta
tus
Cal
iforn
ia R
esid
ent:
20,2
87 (
90.7
%)
Inte
rnat
iona
l: 1,
562
(7.0
%)
Out
-of-
Stat
e: 5
28 (
2.4%
)
Tota
l: 22
,377
Fall
2007
Citi
zens
hip
US
Citi
zens
: 17,
315
(77.
7%)
Perm
anen
t Res
iden
t: 2,
791
(12.
5%)
Tem
pora
ry R
esid
ent:
31 (
0.1%
)
Ref
ugee
/Asy
lee:
253
(1.
1%)
Stud
ent V
isa:
424
(1.
9%)
Oth
er: 1
,472
(6.
6%)
Tota
l: 22
,287
Base
d on
stud
ents
who
pro
vide
d th
e in
form
atio
n R
esid
ency
Sta
tus
Cal
iforn
ia R
esid
ent:
21,4
42 (
90.2
%)
Inte
rnat
iona
l: 1,
840
(7.7
%)
Out
-of-
Stat
e: 4
94 (
2.1%
)
Unk
now
n: 1
(0.
0%)
Tota
l: 23
,777
Fall
2008
Citi
zens
hip
US
Citi
zens
: 79.
3%
Perm
anen
t Res
iden
t: 11
.0%
Tem
pora
ry R
esid
ent:
0.1%
Ref
ugee
/Asy
lee:
0.9
%
Stud
ent V
isa:
2.5
%
Oth
er: 6
.2%
Tota
l: 24
,892
Base
d on
stud
ents
who
pro
vide
d th
e in
form
atio
n

App
endi
x 2
Inst
itutio
nal D
ata
for L
angu
age
and
Mat
hem
atic
s Pr
ojec
t
V. C
aste
llón
Page
3
2/19
/201
0
El P
aso
Colle
ge
San
Jose
City
Col
lege
Tota
l Num
ber
of N
on-E
nglis
h Ba
ckgr
ound
Stu
dent
s Enr
olle
d:
Imm
igra
nt S
tude
nts w
ho w
ere
scho
oled
out
side
the
US
20
06 –
200
7
2007
– 2
008
20
08 –
200
9
East
Los A
ngel
es C
olle
ge
See
data
abo
ve
See
data
abo
ve
El P
aso
Colle
ge
San
Jose
City
Col
lege
Tota
l Num
ber
of N
on-E
nglis
h Ba
ckgr
ound
Stu
dent
s Enr
olle
d:
Imm
igra
nt O
rigi
n St
uden
ts
Scho
oled
in th
e U
nite
d St
ates
(1.5
G
ener
atio
n)
East
Los A
ngel
es C
olle
ge
See
data
abo
ve
See
data
abo
ve
El P
aso
Colle
ge
San
Jose
City
Col
lege
Oth
er
East
Los A
ngel
es C
olle
ge
Educ
atio
nal G
oal
Dat
a m
ay in
clud
e cr
edit
and
nonc
redi
t stu
dent
s.
FAL
L 2
006
Gen
eral
Edu
catio
n: 2
,046
(9.
5%)
Tran
sfer
: 6,4
39 (
29.9
%)
Tran
sitio
nal:
1,1
21 (
5.2%
)
Unk
now
n/U
ndec
ided
: 4,6
10 (
21.4
%)
FAL
L 2
007
Gen
eral
Edu
catio
n: 2
,071
(9.
1%)
Tran
sfer
: 7,5
05 (
32.9
%)
Tran
sitio
nal:
1,3
53 (
5.9%
)
Unk
now
n/U
ndec
ided
: 4,7
88 (
21.0
%)
FAL
L 2
008
Gen
eral
Edu
catio
n: 1
0.1%
Tran
sfer
: 34.
3%
Tran
sitio
nal:
5.9
%
Unk
now
n/U
ndec
ided
: 19.
2%

App
endi
x 2
Inst
itutio
nal D
ata
for L
angu
age
and
Mat
hem
atic
s Pr
ojec
t
V. C
aste
llón
Page
4
2/19
/201
0
Voc
atio
nal:
7,28
4 (3
3.9%
)
Tota
l: 21
,501
Base
d on
stud
ents
who
pro
vide
d th
e in
form
atio
n
Voc
atio
nal:
7,06
3 (3
1.0%
)
Tota
l: 22
,780
Base
d on
stud
ents
who
pro
vide
d th
e in
form
atio
n
Voc
atio
nal:
30.5
%
Base
d on
stud
ents
who
pro
vide
d th
e in
form
atio
n
Uni
t Loa
d D
ata
base
d so
lely
on
cred
it st
uden
ts
FAL
L 2
006
Less
than
6:
7,39
6 (3
5.0%
)
6 –
11:
8,53
7 (4
0.4%
)
12 o
r mor
e: 5
,176
(24
.5%
)
Tota
l: 2
1,10
9
Base
d on
sole
ly o
n cr
edit
stud
ents
FAL
L 2
007
Less
than
6:
7,85
4 (3
4.8%
)
6 –
11:
8,73
9 (3
9.2%
)
12 o
r mor
e: 5
,793
(26
.0%
)
Tota
l: 2
2,28
7
Base
d on
sole
ly o
n cr
edit
stud
ents
Educ
atio
nal B
ackg
roun
d D
ata
base
d so
lely
on
cred
it st
uden
ts
FAL
L 2
006
US
high
scho
ol g
radu
ate:
14,
641
(6
9.4%
) Fo
reig
n hi
gh sc
hool
gra
duat
e hi
gh sc
hool
: 1,5
40 (
7.3%
) Eq
uiva
lenc
y/Pr
ofic
ienc
y C
ertif
icat
e:
975
(4.6
%)
Con
curr
ently
enr
olle
d hi
gh sc
hool
st
uden
t: 73
9 (3
.5%
)
Not
a h
igh
scho
ol g
radu
ate:
1,1
91
(5.6
%)
FAL
L 2
007
US
high
scho
ol g
radu
ate:
15,
355
(6
8.9%
) Fo
reig
n hi
gh sc
hool
gra
duat
e hi
gh sc
hool
: 1,6
74
(7.5
%)
Equi
vale
ncy/
Prof
icie
ncy
Cer
tific
ate:
98
5 (4
.4%
) C
oncu
rren
tly e
nrol
led
high
scho
ol
stud
ent:
869
(3.9
%)
N
ot a
hig
h sc
hool
gra
duat
e: 1
,297
(5
.8%
)
FAL
L 2
008
US
high
scho
ol g
radu
ate:
68.
4%
Fore
ign
high
scho
ol g
radu
ate
high
sc
hool
: 7.4
%
Equi
vale
ncy/
Prof
icie
ncy
Cer
tific
ate:
4.4
%
Con
curr
ently
enr
olle
d hi
gh sc
hool
st
uden
t: 5.
9%
Not
a h
igh
scho
ol g
radu
ate:
4.1
%
AA
deg
ree:
4.2
%
BA
deg
ree
or h
ighe
r: 5.
5%

App
endi
x 2
Inst
itutio
nal D
ata
for L
angu
age
and
Mat
hem
atic
s Pr
ojec
t
V. C
aste
llón
Page
5
2/19
/201
0
AA
deg
ree:
923
(4.
4%)
BA
deg
ree
or h
ighe
r: 1,
099
(5.2
%)
Tota
l: 21
,109
Base
d on
stud
ents
who
pro
vide
d th
e in
form
atio
n
AA
deg
ree:
933
(4.
2%)
BA
deg
ree
or h
ighe
r: 1,
175
(5.3
%)
Tota
l: 22
,287
Base
d on
stud
ents
who
pro
vide
d th
e in
form
atio
n
Base
d on
stud
ents
who
pro
vide
d th
e in
form
atio
n
Gen
der
Dat
a ba
sed
sole
ly o
n cr
edit
stud
ents
FAL
L 2
006
Fem
ale:
13,
218
(62.
6%)
Mal
e: 7
,891
(37
.4%
)
Tota
l: 2
1,10
9
Base
d on
stud
ents
who
pro
vide
d th
e in
form
atio
n
FAL
L 2
007
Fem
ale:
13,
798
(61.
9%)
Mal
e: 8
,489
(38
.1%
)
Tota
l: 22
,287
Base
d on
stud
ents
who
pro
vide
d th
e in
form
atio
n
FAL
L 2
008
Fem
ale:
15,
223
(61.
2%)
Mal
e: 9
,669
(38
.8%
)
Tota
l: 24
,892
Base
d on
stud
ents
who
pro
vide
d th
e in
form
atio
n A
ge
Dat
a ba
sed
sole
ly o
n cr
edit
stud
ents
FAL
L 2
006
Con
curr
ent H
igh
Scho
ol:
742
(3.5
%)
Und
er 2
0: 4
,261
(20
.2%
)
20 –
24:
7,3
43 (
34.8
%)
25 –
34:
5,1
06 (
24.2
%)
35 a
nd o
ver:
3,6
58 (
17.3
%)
Tota
l: 2
1,10
9
FAL
L 2
007
Con
curr
ent H
igh
Scho
ol:
1,17
8
(5.3
%)
Und
er 2
0: 4
,560
(20
.5%
)
20 –
24:
7,6
79 (
34.5
%)
25 –
34:
5,2
77 (
23.7
%)
35 a
nd o
ver:
3,5
92 (
16.1
%)
Tota
l: 2
2,28
7
FAL
L 2
008
Con
curr
ent H
igh
Scho
ol:
7.9%
Und
er 2
0: 2
0.6%
20 –
24:
34.
4%
25 –
34:
22.
2%
35 a
nd o
ver:
14.
9%
Ethn
icity
D
ata
base
d so
lely
on
cred
it st
uden
ts
FAL
L 2
006
Afr
ican
-Am
eric
an:
492
(2.3
%)
Asi
an:
4,02
8 (1
9.1%
)
FA
LL
200
7
Afr
ican
-Am
eric
an:
430
(1.9
%)
Asi
an:
4,47
8 (2
0.1%
)
FAL
L 2
008
Afr
ican
-Am
eric
an: 1
.9%
Asi
an:
19.5
%

App
endi
x 2
Inst
itutio
nal D
ata
for L
angu
age
and
Mat
hem
atic
s Pr
ojec
t
V. C
aste
llón
Page
6
2/19
/201
0
C
auca
sian
: 46
3 (2
.2%
)
His
pani
c: 1
5,96
5 (7
5.7%
)
Oth
er:
161
(0.7
%)
Tota
l: 2
1,10
9
Base
d on
stud
ents
who
pro
vide
d th
e in
form
atio
n
Cau
casi
an:
461
(2.1
%)
His
pani
c: 1
6,73
9 (7
5.1%
)
Oth
er:
179
(0.8
%)
Tota
l: 2
2,28
7
Base
d on
stud
ents
who
pro
vide
d th
e in
form
atio
n
Cau
casi
an:
2.0%
His
pani
c: 7
5.8%
Tota
l: 2
4,89
2
Base
d on
stud
ents
who
pro
vide
d th
e in
form
atio
n
Prim
ary
Lang
uage
D
ata
base
d so
lely
on
cred
it st
uden
ts
** S
tude
nts c
ould
inte
rpre
t pr
imar
y la
ngua
ge a
s la
ngua
ge sp
oken
at h
ome
or
lang
uage
of p
refe
renc
e.
FAL
L 2
006
Arm
enia
n: 5
5 (0
.3%
)
Chi
nese
: 1,9
67 (
9.3%
)
Engl
ish:
12,
225
(57.
9%)
Fars
i: 15
(0.
1%)
Japa
nese
: 38
(0.2
%)
Kor
ean:
60
(0.3
%)
Rus
sian
: 19
(0.1
%)
Span
ish:
6,0
08 (
28.5
%)
Filip
ino:
102
(0.
5%)
Vie
tnam
ese:
302
(1.
4%)
Oth
er: 3
17 (
1.5%
)
Tota
l: 21
,109
Base
d on
stud
ents
who
pro
vide
d th
e in
form
atio
n
FAL
L 2
007
Arm
enia
n: 7
8 (0
.4%
)
Chi
nese
: 2,1
61 (
9.7%
)
Engl
ish:
13,
053
(58.
6%)
Fars
i: 17
(0.
1%)
Japa
nese
: 40
(0.2
%)
Kor
ean:
44
(0.2
%)
Rus
sian
: 18
(0.1
%)
Span
ish:
5,8
06 (
26.1
%)
Filip
ino:
97
(0.4
%)
Vie
tnam
ese:
376
(1.
7%)
Oth
er: 5
98 (
2.7%
)
Tota
l: 22
,287
Base
d on
stud
ents
who
pro
vide
d th
e in
form
atio
n
FAL
L 2
008
Arm
enia
n: 0
.3%
Chi
nese
: 9.1
%
Engl
ish:
61.
4%
Fars
i: 0.
1%
Japa
nese
: 0.2
%
Kor
ean:
0.3
%
Rus
sian
: 0.1
%
Span
ish:
24.
7%
Filip
ino:
0.4
%
Vie
tnam
ese:
1.9
%
Oth
er: 1
.6%
Tota
l: 22
,287
Base
d on
stud
ents
who
pro
vide
d th
e
info
rmat
ion
El P
aso
Colle
ge

App
endi
x 2
Inst
itutio
nal D
ata
for L
angu
age
and
Mat
hem
atic
s Pr
ojec
t
V. C
aste
llón
Page
7
2/19
/201
0
Gen
der
Dat
a w
as o
btai
ned
from
EPC
C
web
site
FALL
200
6
Aca
dem
ic T
rans
fer S
tude
nts:
21,
240
Occ
upat
iona
l/Tec
hnic
al S
tude
nts:
4,06
4
Mal
es:
10,0
06 (
39.5
%)
Fem
ales
: 15,
298
(60.
5%)
Tota
l: 25
,304
FALL
200
7
Mal
e: 1
0,05
5 (4
0.1%
)
Fem
ale:
15,
005
(59.
9%)
Tota
l: 25
,060
Ethn
icity
D
ata
was
obt
aine
d fr
om E
PCC
w
ebsi
te
FALL
200
6
Aca
dem
ic T
rans
fer S
tude
nts:
21,
240
Occ
upat
iona
l/Tec
hnic
al S
tude
nts:
4,06
4
His
pani
cs:
21,6
25 (8
5.5%
)
Bla
ck: 5
42 (
2.1%
)
Whi
te:
2,13
5 (8
.4%
)
Fore
ign
Bor
n/
Inte
rnat
iona
l/oth
er:
724
(2.9
%)
Am
eric
an In
dian
: 65
(0.3
%)
Asi
an:
213
(0.8
%)
Tota
l: 25
,304
FALL
200
6
Con
tinui
ng E
duca
tion
Stud
ents
: 5,6
86
FALL
200
7
His
pani
cs:
21,4
29 (8
5.5%
)
Bla
ck: 5
37 (
2.1%
)
Whi
te:
2,06
5 (8
.2%
)
Fore
ign
Bor
n/In
tern
atio
nal/o
ther
: 75
1 (3
.0%
) A
mer
ican
Indi
an: 6
6 (0
.3%
)
Asi
an:
212
(0.8
%)
Tota
l: 25
,060

App
endi
x 2
Inst
itutio
nal D
ata
for L
angu
age
and
Mat
hem
atic
s Pr
ojec
t
V. C
aste
llón
Page
8
2/19
/201
0
His
pani
cs: 7
6.1%
Bla
ck: 2
.5%
Whi
te: 1
3.4%
Unk
now
n: 0
.2%
Asi
ans:
1.5
%
Am
eric
an In
dian
: 0.5
%
Fore
ign
Bor
n: 5
.9%
Aw
ards
Gra
nted
by
Gen
der a
nd
Ethn
icity
D
ata
was
obt
aine
d fr
om E
PCC
web
site
AA
deg
rees
for
Fem
ales
Whi
te: 8
4 (6
6%)
Bla
ck:
17 (5
3%)
His
pani
c: 7
72 (6
2%)
Asi
an/P
acifi
c Is
land
er:
9 (6
4%)
Am
eric
an In
dian
: 3
(60%
)
Fore
ign:
21
(78%
)
Tota
l: 96
7 (6
2%)
Ass
ocia
te o
f App
lied
Scie
nce
W
hite
: 27
(21%
)
Bla
ck:
10 (3
1%)
His
pani
c: 2
51 (2
0%)
Asi
an/P
acifi
c Is
land
er:
2 (1
4%)
Am
eric
an In
dian
: 1
(20%
)

App
endi
x 2
Inst
itutio
nal D
ata
for L
angu
age
and
Mat
hem
atic
s Pr
ojec
t
V. C
aste
llón
Page
9
2/19
/201
0
Fore
ign:
4 (1
5%)
Tota
l: 31
1 (2
0%)
Cer
tific
ates
for
Fem
ales
Whi
te: 1
6 (1
3%)
Bla
ck:
5 (1
6%)
His
pani
c: 2
26 (1
8%)
Asi
an/P
acifi
c Is
land
er:
3 (2
1%)
Am
eric
an In
dian
: 1
(20%
)
Fore
ign:
2 (7
%)
Tota
l: 28
5 (1
8%)
AA
deg
rees
for
Mal
es
Whi
te: 5
5 (7
0%)
Bla
ck:
5 (3
3%)
His
pani
c: 3
61 (5
8%)
Asi
an/P
acifi
c Is
land
er: 4
(10
0%)
Am
eric
an In
dian
: 4
(100
%)
Fore
ign:
9 (3
9%)
Tota
l: 4
38 (
58%
)
Ass
ocia
te o
f App
lied
Scie
nce
fo
r M
ales
W
hite
: 10
(13%
)
Bla
ck:
5 (3
3%)

App
endi
x 2
Inst
itutio
nal D
ata
for L
angu
age
and
Mat
hem
atic
s Pr
ojec
t
V. C
aste
llón
Page
10
2/19
/201
0
His
pani
c: 1
05 (
17%
)
Fore
ign:
3 (3
%)
Tota
l: 1
23 (1
6%)
Cer
tific
ate
for
Mal
es
Whi
te: 1
4 (1
8%)
Bla
ck:
5 (3
3%)
His
pani
c: 1
58 (2
5%)
Fore
ign:
11
(48%
)
Tota
l: 1
88 (2
5%)
San
Jose
City
Col
lege
ESL
Ass
essm
ent I
nstr
umen
t(s) u
sed
East
Los A
ngel
es C
olle
ge
Com
bine
d En
glis
h La
ngua
ge A
sses
smen
t (C
ELSA
)
El P
aso
Colle
ge
Com
bine
d En
glis
h La
ngua
ge A
sses
smen
t (C
ELSA
)
San
Jose
City
Col
lege
C
ompa
ss re
adin
g, C
ompa
ss li
sten
ing,
ESL
ess
ay (l
ocal
)

App
endi
x 2
Inst
itutio
nal D
ata
for L
angu
age
and
Mat
hem
atic
s Pr
ojec
t
V. C
aste
llón
Page
11
2/19
/201
0
ESL
Plac
emen
t Dat
a
Num
ber
of st
uden
ts w
ho to
ok th
e ES
L Pl
acem
ent
2006
– 2
007
2007
– 2
008
2008
– 2
009
East
Los A
ngel
es C
olle
ge
Mul
ti-Te
sters
: Eng
lish
Plac
emen
t St
uden
ts w
ho to
ok th
e ex
am m
ultip
le ti
mes
th
roug
hout
the
year
. Onl
y th
e pe
rfor
man
ce o
n th
eir
first
ass
essm
ent t
est i
s con
side
red.
**
Base
d on
the
test
cyc
le (e
.g.,
from
Aug
ust 2
007
thro
ugh
July
200
8)
ESL
Ref
erra
l: 3
65 (
3.4%
)
ESL
Plac
emen
t: 1
,830
(1
7.2%
) EN
L R
efer
ral:
24 (
0.2%
)
ESL
Ref
erra
l: 4
24 (
4.0%
)
ESL
Plac
emen
t: 1
,655
(1
5.5%
) EN
L R
efer
ral:
14
(0.
1%)
Eval
uate
d St
uden
ts: E
nglis
h Pl
acem
ent
Und
uplic
ated
num
ber o
f stu
dent
s tha
t und
erw
ent
asse
ssm
ent a
nd p
lace
men
t.
**Ba
sed
on th
e te
st c
ycle
(e.g
., fr
om A
ugus
t 200
7 th
roug
h Ju
ly 2
008)
ESL
Ref
erra
l: 3
14 (
3.0%
)
ESL
Plac
emen
t: 1
,790
(1
7.2%
) EN
L R
efer
ral:
20
(0.2
%)
ESL
Ref
erra
l: 3
86 (
3.7%
)
ESL
Plac
emen
t: 1
,620
(1
5.6%
) EN
L R
efer
ral:
14 (
0.1%
)
Eval
uate
d St
uden
ts: E
nglis
h Pl
acem
ent
by G
ende
r U
ndup
licat
ed n
umbe
r of s
tude
nts t
hat u
nder
wen
t as
sess
men
t and
pla
cem
ent.
**
Base
d on
the
test
cyc
le (e
.g.,
from
Aug
ust 2
007
thro
ugh
July
200
8)
Fe
mal
e
ESL
Ref
erra
l: 2
07 (
3.7%
)
ESL
Plac
emen
t: 9
92
(17.
7%)
ENL
Ref
erra
l: 7
(0.1
%)
M
ale
ESL
Ref
erra
l: 1
79 (
3.7%
)
ESL
Plac
emen
t: 6
28
(13.
1%)

App
endi
x 2
Inst
itutio
nal D
ata
for L
angu
age
and
Mat
hem
atic
s Pr
ojec
t
V. C
aste
llón
Page
12
2/19
/201
0
ENL
Ref
erra
l: 7
(0.1
%)
Eval
uate
d St
uden
ts: E
nglis
h Pl
acem
ent
by L
angu
age
Und
uplic
ated
num
ber o
f stu
dent
s tha
t und
erw
ent
asse
ssm
ent a
nd p
lace
men
t.
**Ba
sed
on th
e te
st c
ycle
(e.g
., fr
om A
ugus
t 200
7 th
roug
h Ju
ly 2
008)
Sp
anish
ESL
Ref
erra
l: 19
3 (
8.3%
)
ESL
Plac
emen
t: 39
1 (1
6.8%
) EN
L R
efer
ral:
5 (0
.2%
)
Eval
uate
d St
uden
ts: E
nglis
h Pl
acem
ent
by A
ge
Und
uplic
ated
num
ber o
f stu
dent
s tha
t und
erw
ent
asse
ssm
ent a
nd p
lace
men
t.
**Ba
sed
on th
e te
st c
ycle
(e.g
., fr
om A
ugus
t 200
7 th
roug
h Ju
ly 2
008)
U
nder
20
ESL
Ref
erra
l: 1
73 (
3.3%
)
ESL
Plac
emen
t: 4
12 (
7.8%
) EN
L R
efer
ral:
7 (0
.1%
)
20 –
24
ESL
Ref
erra
l: 9
7 (4
.3%
)
ESL
Plac
emen
t: 39
4 (1
7.3%
) EN
L R
efer
ral:
1 (0
.0%
)
25 –
34
ESL
Ref
erra
l: 5
9 (3
.6%
)
ESL
Plac
emen
t: 32
3 (1
9.5%
) EN
L R
efer
ral:
3 (0
.2%
)
35 –
54
ESL
Ref
erra
l: 5
0 (4
.6%
)
ESL
Plac
emen
t: 3
(40
.9%
) EN
L R
efer
ral:
105
(0.3
%)
55 a
nd O
ver

App
endi
x 2
Inst
itutio
nal D
ata
for L
angu
age
and
Mat
hem
atic
s Pr
ojec
t
V. C
aste
llón
Page
13
2/19
/201
0
ESL
Ref
erra
l: 7
(8
.1%
)
ESL
Plac
emen
t: 4
6 (5
3.5%
) EN
L R
efer
ral:
0 (
0%)
El P
aso
Colle
ge
See
Atta
ched
Se
e A
ttach
ed
San
Jose
City
Col
lege
Num
ber
of st
uden
ts w
ho p
lace
d ou
t of E
SL c
ours
es
who
sat f
or th
e ES
L pl
acem
ent
2006
– 2
007
2007
– 2
008
2008
– 2
009
East
Los A
ngel
es C
olle
ge
See
Abo
ve
See
Abo
ve
El P
aso
Colle
ge
See
Atta
ched
Se
e A
ttach
ed
San
Jose
City
Col
lege
Num
ber
of st
uden
ts p
laci
ng in
var
ious
cou
rses
20
06 –
200
7 20
07 –
200
8 20
08 –
200
9 Ea
st Lo
s Ang
eles
Col
lege
Mul
ti-Te
sters
: ESL
Pla
cem
ent
Stud
ents
who
took
the
exam
mul
tiple
tim
es
thro
ugho
ut th
e ye
ar. O
nly
the
perf
orm
ance
on
thei
r fir
st a
sses
smen
t tes
t is c
onsi
dere
d.
**Ba
sed
on th
e te
st c
ycle
(e.g
., fr
om A
ugus
t 200
7 th
roug
h Ju
ly 2
008)
Engl
ish (E
SL) 8
2 28
6 (1
5.6%
) 28
5 (1
7.2%
)
Engl
ish (E
SL) 8
4 28
0 (1
5.3%
) 28
7 (1
7.3%
)
Engl
ish (E
SL) 8
5 31
5 (1
7.2%
) 32
3 (1
9.5%
)
Engl
ish (E
SL) 8
6 42
4 (2
3.2%
) 42
5 (2
5.7%
)
ESL
40CE
21
0 (1
1.5%
) 12
4 (7
.5%
)

App
endi
x 2
Inst
itutio
nal D
ata
for L
angu
age
and
Mat
hem
atic
s Pr
ojec
t
V. C
aste
llón
Page
14
2/19
/201
0
ESL
41CE
31
5 (1
7.2%
) 21
1 (1
2.7%
)
Tota
l
1,83
0 1,
655
Eval
uate
d St
uden
ts: E
SL P
lace
men
t U
ndup
licat
ed n
umbe
r of s
tude
nts t
hat u
nder
wen
t as
sess
men
t and
pla
cem
ent.
**
Base
d on
the
test
cyc
le (e
.g.,
from
Aug
ust 2
007
thro
ugh
July
200
8)
Engl
ish 8
2 27
8 (1
5.5%
) 27
4 (1
6.9%
)
Engl
ish 8
4 27
4 (1
5.3%
) 28
2 (1
7.4%
)
Engl
ish 8
5 30
5 (1
7.0%
) 31
6 (1
9.5%
)
Engl
ish 8
6 41
2 (2
3.0%
) 41
7 (2
5.7%
)
ESL
40CE
20
9 (1
1.7%
) 12
4 (7
.7%
)
ESL
41CE
31
2 (1
7.4%
) 20
7 (1
2.8%
)
Tota
l 1,
790
1,62
0
El P
aso
Colle
ge
Belo
w L
evel
1
Fall
2006
: 2
Sprin
g 20
07: 0
Sum
mer
200
7: 0
Fall
2007
: 0
Sprin
g 20
08: 1
Sum
mer
200
8: 0
Fall
2008
: 0
Sprin
g 20
09: 0
Sum
mer
200
9*: 0
*
Figu
res a
re p
relim
inar
y as
of
Jul
y 22
, 200
9
Leve
l 1
Fall
2006
: 334
Fa
ll 20
07: 2
99
Fall
2008
: 322

App
endi
x 2
Inst
itutio
nal D
ata
for L
angu
age
and
Mat
hem
atic
s Pr
ojec
t
V. C
aste
llón
Page
15
2/19
/201
0
Sprin
g 20
07: 1
86
Sum
mer
200
7: 2
97
Sprin
g 20
08: 2
60
Sum
mer
200
8: 2
41
Sprin
g 20
09: 3
36
Sum
mer
200
9*: 2
58
* Fi
gure
s are
pre
limin
ary
as
of J
uly
22, 2
009
Le
vel 2
Fa
ll 20
06: 8
9
Sprin
g 20
07: 8
3
Sum
mer
200
7: 3
8
Fall
2007
: 39
Sprin
g 20
08: 4
9
Sum
mer
200
8: 3
1
Fall
2008
: 33
Sprin
g 20
09: 4
2
Sum
mer
200
9*: 3
1 *
Figu
res a
re p
relim
inar
y as
of
Jul
y 22
, 200
9 Le
vel 3
Fa
ll 20
06: 4
6
Sprin
g 20
07: 4
5
Sum
mer
200
7: 1
5
Fall
2007
: 27
Sprin
g 20
08: 2
6
Sum
mer
200
8: 1
6
Fall
2008
: 21
Sprin
g 20
09: 2
9
Sum
mer
200
9*: 1
7 *
Figu
res a
re p
relim
inar
y as
of
Jul
y 22
, 200
9 Le
vel 4
Fa
ll 20
06: 2
Sprin
g 20
07: 1
Sum
mer
200
7: 3
Fall
2007
: 0
Sprin
g 20
08: 0
Sum
mer
200
8: 0
Fall
2008
: 3
Sprin
g 20
09: 2
Sum
mer
200
9*: 1
*
Figu
res a
re p
relim
inar
y as
of
Jul
y 22
, 200
9 Le
vel 5
Fa
ll 20
06: 1
Sprin
g 20
07: 1
Sum
mer
200
7: 0
Fall
2007
: 1
Sprin
g 20
08: 2
Sum
mer
200
8: 0
Fall
2008
: 0
Sprin
g 20
09: 1
Sum
mer
200
9*: 1
*
Figu
res a
re p
relim
inar
y as
of
Jul
y 22
, 200
9 Le
vel 6
Fa
ll 20
06: 1
Fa
ll 20
07: 0
Fa
ll 20
08: 0

App
endi
x 2
Inst
itutio
nal D
ata
for L
angu
age
and
Mat
hem
atic
s Pr
ojec
t
V. C
aste
llón
Page
16
2/19
/201
0
Sprin
g 20
07: 1
Sum
mer
200
7:1
Sprin
g 20
08: 0
Sum
mer
200
8: 1
Sp
ring
2009
: 0
Sum
mer
200
9*: 1
*
Figu
res a
re p
relim
inar
y as
of
Jul
y 22
, 200
9 Sa
n Jo
se C
ity C
olle
ge

App
endi
x 2
Inst
itutio
nal D
ata
for L
angu
age
and
Mat
hem
atic
s Pr
ojec
t
V. C
aste
llón
Page
17
2/19
/201
0
ESL
Com
plet
ion
Dat
a
Num
ber
of st
uden
ts w
ho o
rigi
nally
took
the
ESL
Plac
emen
t w
ho c
ompl
eted
an
AA
deg
ree
2006
– 2
007
2007
– 2
008
2008
– 2
009
East
Los A
ngel
es C
olle
ge
See
Atta
ched
Se
e A
ttach
ed
See
Atta
ched
El P
aso
Colle
ge
See
Atta
ched
Se
e A
ttach
ed
See
Atta
ched
San
Jose
City
Col
lege
Se
e A
ttach
ed
See
Atta
ched
Se
e A
ttach
ed
ESL
Polic
y do
cum
ents
: D
ocum
ents
that
gui
de th
e en
rollm
ent/e
duca
tion
of st
uden
ts w
ho ta
ke th
e ES
L pl
acem
ent e
xam
. Ea
st Lo
s Ang
eles
Col
lege
El P
aso
Colle
ge
San
Jose
City
Col
lege
ESL
Polic
y do
cum
ents
: Po
licie
s on
cour
ses t
hat E
SL st
uden
ts c
an a
nd c
anno
t enr
oll i
n.
East
Los A
ngel
es C
olle
ge
El P
aso
Colle
ge
San
Jose
City
Col
lege
ESL
Polic
y do
cum
ents
: Po
licie
s on
cred
it or
non
-cre
dit b
asis
of E
SL se
quen
ce c
ours
es
East
Los A
ngel
es C
olle
ge
El P
aso
Colle
ge

App
endi
x 2
Inst
itutio
nal D
ata
for L
angu
age
and
Mat
hem
atic
s Pr
ojec
t
V. C
aste
llón
Page
18
2/19
/201
0
San
Jose
City
Col
lege
List
of D
evel
opm
enta
l Mat
hem
atic
s Seq
uenc
e C
ours
es
East
Los A
ngel
es C
olle
ge
Cur
rent
ly h
ave:
Mat
h 10
5 –
Arit
hmet
ic fo
r Col
lege
Stu
dent
s (3
units
), 4
leve
ls b
elow
tran
sfer
leve
l mat
h
Mat
h 11
0 (5
uni
ts +
1 u
nit l
ab c
ompo
nent
), 3
leve
ls b
elow
tran
sfer
leve
l mat
h
Mat
h 11
2 –
Pre
Alg
ebra
(3 u
nits
+ 1
uni
t lab
com
pone
nt),
3 le
vels
bel
ow tr
ansf
er le
vel m
ath
Mat
h 11
5 –
Beg
inni
ng A
lgeb
ra (5
uni
ts),
2 le
vels
bel
ow tr
ansf
er le
vel m
ath
Mat
h 12
5 –
Inte
rmed
iate
Alg
ebra
(5 u
nits
), 1
leve
l bel
ow tr
ansf
er le
vel m
ath
The
rest
ruct
ured
cou
rse
will
be
revi
sed
to: (
sche
dule
d to
star
t in
Sprin
g 20
10)
Mat
h 10
5 –
Arit
hmet
ic fo
r Col
lege
Stu
dent
s (3
units
), 4
leve
ls b
elow
tran
sfer
leve
l mat
h
Mat
h 11
0 (5
uni
ts +
1 u
nit l
ab c
ompo
nent
), 3
leve
ls b
elow
tran
sfer
leve
l mat
h
Mat
h 11
5 –
Beg
inni
ng A
lgeb
ra (5
uni
ts),
2 le
vels
bel
ow tr
ansf
er le
vel m
ath
Mat
h 12
5 –
Inte
rmed
iate
Alg
ebra
(5 u
nits
), 1
leve
l bel
ow tr
ansf
er le
vel m
ath
El P
aso
Colle
ge
Cur
rent
ly h
ave:
Mat
h 30
0 - C
olle
ge P
rep
Mat
h
Mat
h 30
1 –
Pre
Alg
ebra
Mat
h 30
3 - I
ntro
duct
ory
Alg
ebra
Mat
h 30
5 - I
nter
med
iate
Alg
ebra
.
The
rest
ruct
ured
cou
rses
will
incl
ude:
(sch
edul
ed to
star
t in
Fall
2010
)

App
endi
x 2
Inst
itutio
nal D
ata
for L
angu
age
and
Mat
hem
atic
s Pr
ojec
t
V. C
aste
llón
Page
19
2/19
/201
0
Mat
h __
__ C
olle
ge P
rep
Mat
h an
d Pr
e A
lgeb
ra (n
ot y
et n
umbe
red)
Mat
h 30
3 -
Intro
duct
ory
Alg
ebra
Mat
h 30
5 - I
nter
med
iate
Alg
ebra
San
Jose
City
Col
lege
M
ath
310
– B
asic
Mat
hem
atic
s (3
units
), 3
leve
ls b
elow
tran
sfer
leve
l mat
h
Mat
h 31
1 –
Pre
Alg
ebra
(3 u
nits
), 3
leve
ls b
elow
tran
sfer
leve
l mat
h
Mat
h 11
A –
Ele
men
tary
Alg
ebra
(5 u
nits
), 2
leve
ls b
elow
tran
sfer
leve
l mat
h
Mat
h 11
R –
Rev
iew
of I
ntro
duct
ory
Alg
ebra
(3 u
nits
), 2
leve
ls b
elow
tran
sfer
leve
l mat
h
Mat
h 11
S –
Self-
Pace
d In
trodu
ctor
y A
lgeb
ra (5
uni
ts),
2 le
vels
bel
ow tr
ansf
er le
vel m
ath
Mat
h 14
– G
eom
etry
(3 u
nits
), 1
leve
ls b
elow
tran
sfer
leve
l mat
h
Mat
h 13
– In
term
edia
te A
lgeb
ra (5
uni
ts),
1 le
vel b
elow
tran
sfer
leve
l mat
h
Mat
h 13
S –
Self-
Pace
d In
term
edia
te A
lgeb
ra (5
uni
ts),
1 le
vel b
elow
tran
sfer
leve
l mat
h

App
endi
x 2
Inst
itutio
nal D
ata
for L
angu
age
and
Mat
hem
atic
s Pr
ojec
t
V. C
aste
llón
Page
20
2/19
/201
0
Mat
hem
atic
s Ass
essm
ent I
nstr
umen
ts(s
) use
d Ea
st Lo
s Ang
eles
Col
lege
M
athe
mat
ics D
iagn
ostic
Tes
ting
Proj
ect (
MD
TP) 4
leve
ls; A
lgeb
ra re
adin
ess,
Elem
enta
ry A
lgeb
ra, I
nter
med
iate
A
lgeb
ra a
nd P
re C
alcu
lus.
El P
aso
Colle
ge
Acc
upla
cer
San
Jose
City
Col
lege
C
ompa
ss N
umer
ical
Ski
lls, P
re-A
lgeb
ra, C
ompa
ss A
lgeb
ra, C
ompa
ss C
olle
ge A
lgeb
ra, C
ompa
ss T
rigon
omet
ry
Do
the
Mat
hem
atic
s Ass
essm
ent p
roce
dure
s inc
lude
lang
uage
acc
omm
odat
ions
for
non-
Engl
ish-b
ackg
roun
d st
uden
ts?
East
Los A
ngel
es C
olle
ge
No.
Onl
y sa
mpl
e te
st q
uest
ions
are
pro
vide
d to
all
non-
exem
pt st
uden
ts a
nd th
ey a
re m
ade
avai
labl
e on
line.
The
m
atric
ulat
ion
offic
e tri
es to
hire
and
sche
dule
bili
ngua
l pro
ctor
s for
ass
ista
nce.
El
Pas
o Co
llege
San
Jose
City
Col
lege
N
o –
ever
yone
get
s the
sam
e te
st a
ccor
ding
to L
aura
Cor
dova
, Ass
essm
ent S
peci
alis
t, Sa
n Jo
se C
ity C
olle
ge, (
408)
288
-31
70
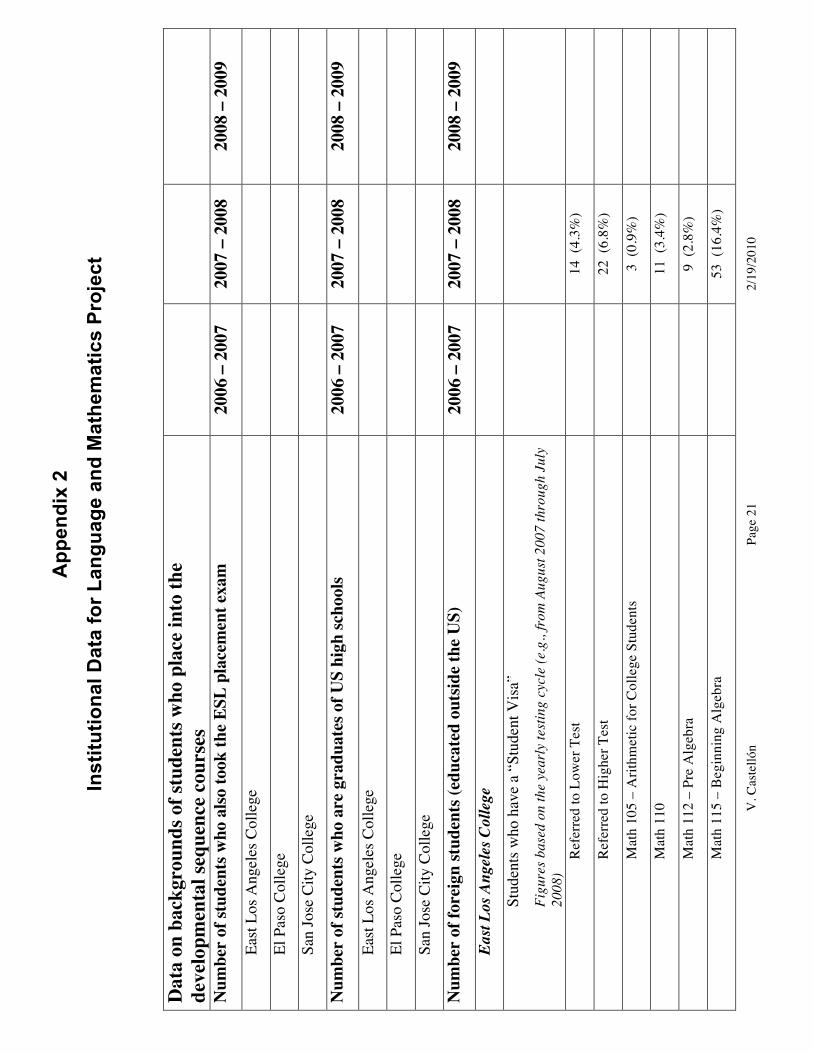
App
endi
x 2
Inst
itutio
nal D
ata
for L
angu
age
and
Mat
hem
atic
s Pr
ojec
t
V. C
aste
llón
Page
21
2/19
/201
0
Dat
a on
bac
kgro
unds
of s
tude
nts w
ho p
lace
into
the
deve
lopm
enta
l seq
uenc
e co
urse
s
Num
ber
of st
uden
ts w
ho a
lso to
ok th
e ES
L pl
acem
ent e
xam
20
06 –
200
7 20
07 –
200
8 20
08 –
200
9 Ea
st Lo
s Ang
eles
Col
lege
El P
aso
Colle
ge
San
Jose
City
Col
lege
Num
ber
of st
uden
ts w
ho a
re g
radu
ates
of U
S hi
gh sc
hool
s 20
06 –
200
7 20
07 –
200
8 20
08 –
200
9 Ea
st Lo
s Ang
eles
Col
lege
El P
aso
Colle
ge
San
Jose
City
Col
lege
Num
ber
of fo
reig
n st
uden
ts (e
duca
ted
outs
ide
the
US)
20
06 –
200
7 20
07 –
200
8 20
08 –
200
9 Ea
st Lo
s Ang
eles
Col
lege
Stud
ents
who
hav
e a
“Stu
dent
Visa
”
Figu
res b
ased
on
the
year
ly te
stin
g cy
cle
(e.g
., fr
om A
ugus
t 200
7 th
roug
h Ju
ly
2008
)
Ref
erre
d to
Low
er T
est
14
(4.
3%)
Ref
erre
d to
Hig
her T
est
22
(6.
8%)
Mat
h 10
5 –
Arit
hmet
ic fo
r Col
lege
Stu
dent
s
3 (0
.9%
)
Mat
h 11
0
11 (
3.4%
)
Mat
h 11
2 –
Pre
Alg
ebra
9 (2
.8%
)
Mat
h 11
5 –
Beg
inni
ng A
lgeb
ra
53
(16
.4%
)

App
endi
x 2
Inst
itutio
nal D
ata
for L
angu
age
and
Mat
hem
atic
s Pr
ojec
t
V. C
aste
llón
Page
22
2/19
/201
0
Mat
h 12
5/12
0 –
Inte
rmed
iate
Alg
ebra
/Geo
met
ry
96
(29
.6%
)
Mat
h 26
1 –
Cal
culu
s
76 (
23.5
)
Tran
sfer
Lev
el
40
(12
.3%
)
No
Plac
emen
t
0 (0
%)
Num
ber A
sses
sed
32
4 (8
9.0%
)
Num
ber N
ot A
sses
sed
40
(11
.0%
)
Tota
l
364
El P
aso
Colle
ge
San
Jose
City
Col
lege
Num
ber
of st
uden
ts w
ho to
ok a
lgeb
ra
2006
– 2
007
2007
– 2
008
2008
– 2
009
East
Los A
ngel
es C
olle
ge
El P
aso
Colle
ge
San
Jose
City
Col
lege

App
endi
x 2
Inst
itutio
nal D
ata
for L
angu
age
and
Mat
hem
atic
s Pr
ojec
t
V. C
aste
llón
Page
23
2/19
/201
0
Yea
rly
Pass
Rat
es in
Dev
elop
men
tal M
ath
Cou
rses
20
06 –
200
7 20
07 –
200
8 20
08 –
200
9
East
Los A
ngel
es C
olle
ge –
Stu
dent
s who
took
the
Asse
ssm
ent E
xam
Mul
ti-Te
sters
: Mat
h Pl
acem
ent
Stud
ents
who
took
the
exam
mul
tiple
tim
es th
roug
hout
the
year
. Onl
y th
e pe
rfor
man
ce o
n th
eir f
irst
ass
essm
ent t
est i
s con
side
red.
**
Base
d on
the
test
cyc
le (e
.g.,
from
Aug
ust 2
007
thro
ugh
July
200
8)
Ref
erre
d to
Low
er T
est
790
(8.9
%)
890
(9.2
%)
Ref
erre
d to
Hig
her T
est
296
(3.3
%)
346
(3.6
%)
Mat
h 10
5 –
Arit
hmet
ic fo
r Col
lege
Stu
dent
s 3,
930
(44.
2%)
1,89
1 (1
9.6%
)
Mat
h 11
0 C
ours
e w
as n
ot
impl
emen
ted
2,09
2 (2
1.7%
)
Mat
h 11
2 –
Pre
Alg
ebra
88
2 (9
.9%
) 93
0 (9
.7%
)
Mat
h 11
5 –
Beg
inni
ng A
lgeb
ra
1,60
2 (1
8.0%
) 1,
778
(18.
5%)
Mat
h 12
5/12
0 –
Inte
rmed
iate
Alg
ebra
/Geo
met
ry
959
(10.
8%)
1,16
7 (1
2.1%
)
Mat
h 26
1 –
Cal
culu
s 22
9 (2
.6%
) 28
1 (2
.9%
)
Tran
sfer
Lev
el
190
(2.1
%)
235
(2.4
%)
No
Plac
emen
t 16
(0.
2%)
19 (
0.2%
)
Tota
l 8,
894
9,62
9
Eval
uate
d St
uden
ts: M
ath
Plac
emen
t U
ndup
licat
ed n
umbe
r of s
tude
nts t
hat u
nder
wen
t ass
essm
ent a
nd p
lace
men
t.
**Ba
sed
on th
e te
st c
ycle
(e.g
., fr
om A
ugus
t 200
7 th
roug
h Ju
ly 2
008)
Ref
erre
d to
Low
er T
est
728
(8.3
%)
817
(8.7
%)
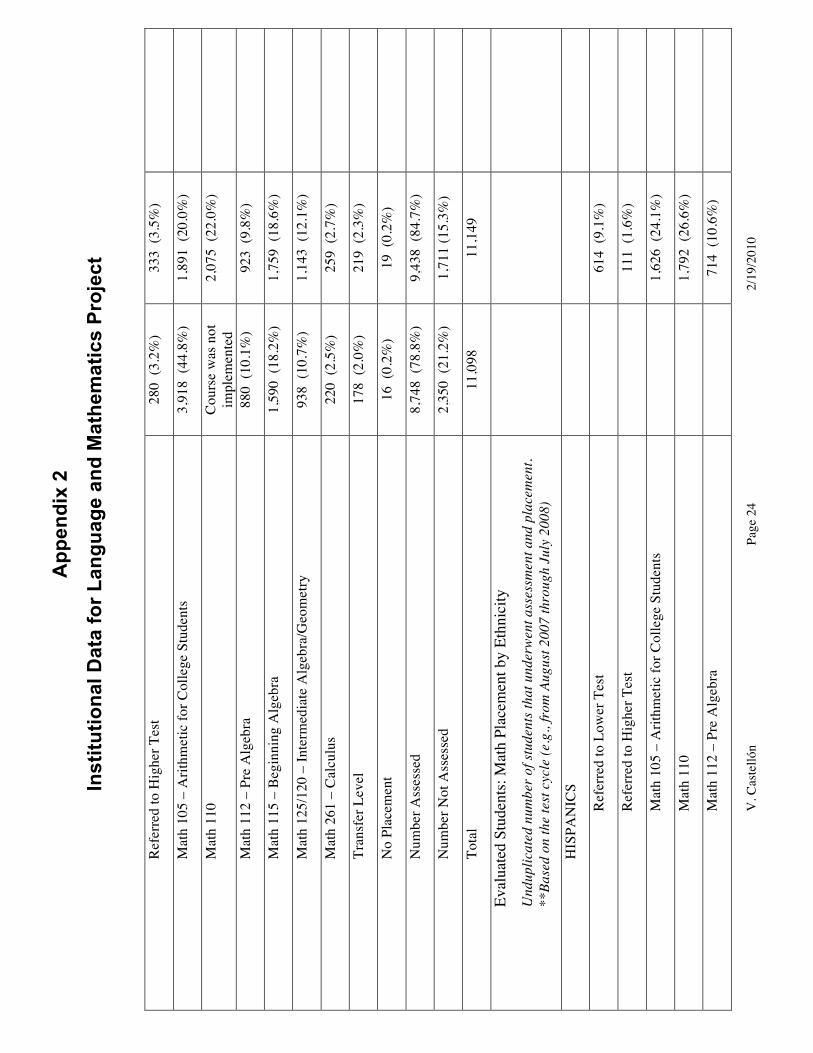
App
endi
x 2
Inst
itutio
nal D
ata
for L
angu
age
and
Mat
hem
atic
s Pr
ojec
t
V. C
aste
llón
Page
24
2/19
/201
0
Ref
erre
d to
Hig
her T
est
280
(3.2
%)
333
(3.5
%)
Mat
h 10
5 –
Arit
hmet
ic fo
r Col
lege
Stu
dent
s 3,
918
(44.
8%)
1,89
1 (2
0.0%
)
Mat
h 11
0 C
ours
e w
as n
ot
impl
emen
ted
2,07
5 (2
2.0%
)
Mat
h 11
2 –
Pre
Alg
ebra
88
0 (1
0.1%
) 92
3 (9
.8%
)
Mat
h 11
5 –
Beg
inni
ng A
lgeb
ra
1,59
0 (1
8.2%
) 1,
759
(18.
6%)
Mat
h 12
5/12
0 –
Inte
rmed
iate
Alg
ebra
/Geo
met
ry
938
(10.
7%)
1,14
3 (1
2.1%
)
Mat
h 26
1 –
Cal
culu
s 22
0 (2
.5%
) 25
9 (2
.7%
)
Tran
sfer
Lev
el
178
(2.0
%)
219
(2.3
%)
No
Plac
emen
t 16
(0.
2%)
19 (
0.2%
)
Num
ber A
sses
sed
8,74
8 (7
8.8%
) 9,
438
(84.
7%)
Num
ber N
ot A
sses
sed
2,35
0 (2
1.2%
) 1,
711
(15.
3%)
Tota
l 11
,098
11
,149
Eval
uate
d St
uden
ts: M
ath
Plac
emen
t by
Ethn
icity
U
ndup
licat
ed n
umbe
r of s
tude
nts t
hat u
nder
wen
t ass
essm
ent a
nd p
lace
men
t.
**Ba
sed
on th
e te
st c
ycle
(e.g
., fr
om A
ugus
t 200
7 th
roug
h Ju
ly 2
008)
HIS
PAN
ICS
Ref
erre
d to
Low
er T
est
61
4 (9
.1%
)
Ref
erre
d to
Hig
her T
est
11
1 (1
.6%
)
Mat
h 10
5 –
Arit
hmet
ic fo
r Col
lege
Stu
dent
s
1,62
6 (2
4.1%
)
Mat
h 11
0
1,79
2 (2
6.6%
)
Mat
h 11
2 –
Pre
Alg
ebra
714
(10.
6%)

App
endi
x 2
Inst
itutio
nal D
ata
for L
angu
age
and
Mat
hem
atic
s Pr
ojec
t
V. C
aste
llón
Page
25
2/19
/201
0
Mat
h 11
5 –
Beg
inni
ng A
lgeb
ra
1,
250
(18.
6%)
Mat
h 12
5/12
0 –
Inte
rmed
iate
Alg
ebra
/Geo
met
ry
56
6 (8
.4%
)
Mat
h 26
1 –
Cal
culu
s
9 (0
.1%
)
Tran
sfer
Lev
el
39
(0.
6%)
No
Plac
emen
t
15 (
0.2%
)
Num
ber A
sses
sed
6,
736
(91.
6%)
Num
ber N
ot A
sses
sed
61
4 (8
.4%
)
Tota
l
7,35
0
Eval
uate
d St
uden
ts: M
ath
Plac
emen
t by
Citiz
ensh
ip
Und
uplic
ated
num
ber o
f stu
dent
s tha
t und
erw
ent a
sses
smen
t and
pla
cem
ent.
**
Base
d on
the
test
cyc
le (e
.g.,
from
Aug
ust 2
007
thro
ugh
July
200
8)
Ref
erre
d to
Low
er T
est
U
S C
itize
n: 6
19
(8.9
%)
Perm
anen
t R
esid
ent:
97
(7.7
%)
Tem
pora
ry
Res
iden
t: 0
(0%
) R
efug
ee/A
syle
e: 8
(6
.4%
) St
uden
t Vis
a: 1
4 (4
.3%
) O
ther
: 77
(10.
5%)
Unk
now
n: 2

App
endi
x 2
Inst
itutio
nal D
ata
for L
angu
age
and
Mat
hem
atic
s Pr
ojec
t
V. C
aste
llón
Page
26
2/19
/201
0
(25.
0%)
R
efer
red
to H
ighe
r Tes
t
US
Citi
zen:
208
(3
.0%
) Pe
rman
ent
Res
iden
t: 78
(6
.2%
) Te
mpo
rary
R
esid
ent:
1 (7
.1%
) R
efug
ee/A
syle
e: 8
(6
.4%
) St
uden
t Vis
a: 2
2 (6
.8%
) O
ther
: 16
(2.2
%)
Unk
now
n: 0
(0%
)
Mat
h 10
5 –
Arit
hmet
ic fo
r Col
lege
Stu
dent
s
U
S C
itize
n: 1
,503
(2
1.5%
) Pe
rman
ent
Res
iden
t: 18
8 (1
5.0%
) Te
mpo
rary
R
esid
ent:
2
(14.
3%)
Ref
ugee
/Asy
lee:
14
(1
1.2%
) St
uden
t Vis
a: 3
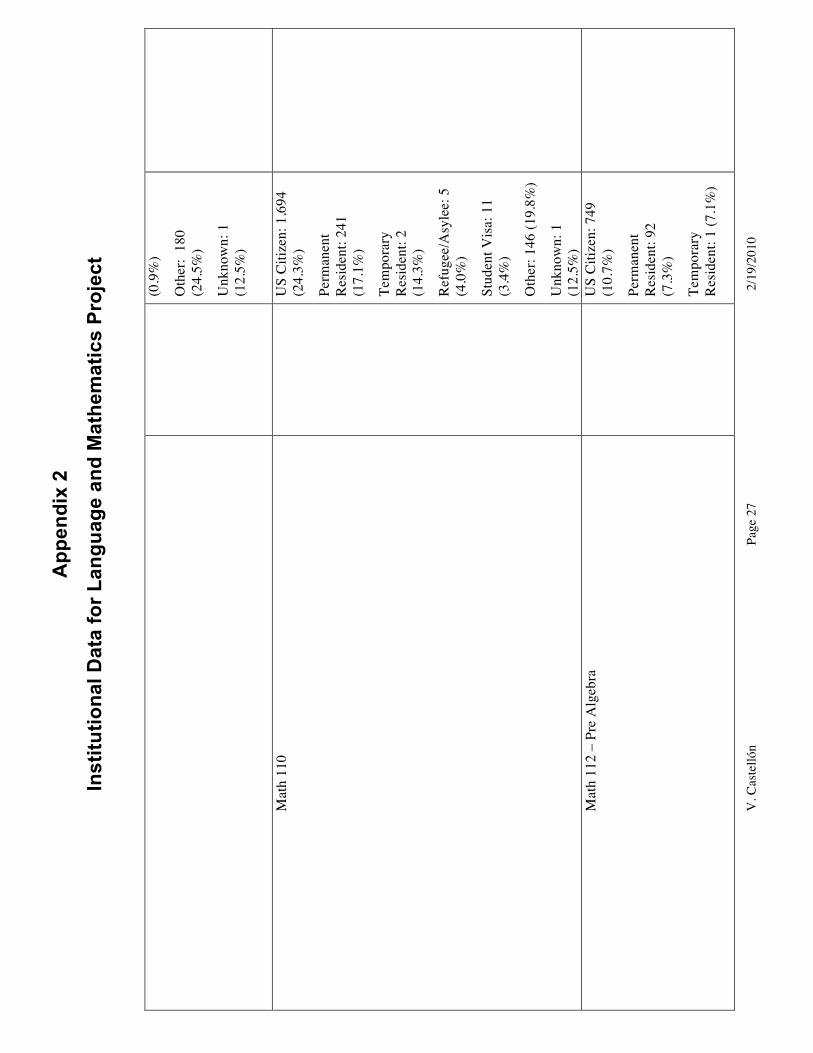
App
endi
x 2
Inst
itutio
nal D
ata
for L
angu
age
and
Mat
hem
atic
s Pr
ojec
t
V. C
aste
llón
Page
27
2/19
/201
0
(0.9
%)
Oth
er:
180
(2
4.5%
) U
nkno
wn:
1
(12.
5%)
Mat
h 11
0
US
Citi
zen:
1,6
94
(24.
3%)
Perm
anen
t R
esid
ent:
241
(1
7.1%
) Te
mpo
rary
R
esid
ent:
2
(14.
3%)
Ref
ugee
/Asy
lee:
5
(4.0
%)
Stud
ent V
isa:
11
(3.4
%)
Oth
er: 1
46 (1
9.8%
) U
nkno
wn:
1
(12.
5%)
Mat
h 11
2 –
Pre
Alg
ebra
U
S C
itize
n: 7
49
(10.
7%)
Perm
anen
t R
esid
ent:
92
(7.3
%)
Tem
pora
ry
Res
iden
t: 1
(7.1
%)

App
endi
x 2
Inst
itutio
nal D
ata
for L
angu
age
and
Mat
hem
atic
s Pr
ojec
t
V. C
aste
llón
Page
28
2/19
/201
0
Ref
ugee
/Asy
lee:
14
(1
1.2%
) St
uden
t Vis
a: 9
(2
.8%
) O
ther
: 58
(7.9
%)
Unk
now
n: 0
(0%
)
Mat
h 11
5 –
Beg
inni
ng A
lgeb
ra
U
S C
itize
n: 1
,313
(1
8.8%
) Pe
rman
ent
Res
iden
t: 22
7
(18.
1%)
Tem
pora
ry
Res
iden
t: 3
(2
1.4%
) R
efug
ee/A
syle
e:
18
(14
.4%
) St
uden
t Vis
a: 5
3
(16.
4%)
Oth
er: 1
44 (1
9.6%
) U
nkno
wn:
0 (0
%)
Mat
h 12
5/12
0 –
Inte
rmed
iate
Alg
ebra
/Geo
met
ry
U
S C
itize
n: 7
15
(10.
2%)
Perm
anen
t R
esid
ent:
203
(16.
2%)
Tem
pora
ry
Res
iden
t: 3

App
endi
x 2
Inst
itutio
nal D
ata
for L
angu
age
and
Mat
hem
atic
s Pr
ojec
t
V. C
aste
llón
Page
29
2/19
/201
0
(21.
4%)
Ref
ugee
/Asy
lee:
24 (
19.2
%)
Stud
ent V
isa:
96
(2
9.6%
) O
ther
: 102
(13.
9%)
Unk
now
n: 3
(3
7.5%
)
Mat
h 26
1 –
Cal
culu
s
US
Citi
zen:
66
(0
.9%
) Pe
rman
ent
Res
iden
t: 88
(7
.0%
) Te
mpo
rary
R
esid
ent:
0 (0
%)
Ref
ugee
/Asy
lee:
20 (
16.0
%)
Stud
ent V
isa:
76
(23.
5%)
Oth
er: 8
(1.1
%)
Unk
now
n: 1
(1
2.5%
)
Tran
sfer
Lev
el
U
S C
itize
n: 9
7 (1
.4%
) Pe
rman
ent
Res
iden
t: 61
(4
.9%
)

App
endi
x 2
Inst
itutio
nal D
ata
for L
angu
age
and
Mat
hem
atic
s Pr
ojec
t
V. C
aste
llón
Page
30
2/19
/201
0
Tem
pora
ry
Res
iden
t: 2
(14.
3%)
Ref
ugee
/Asy
lee:
14 (
11.2
%)
Stud
ent V
isa:
40
(12.
3%)
Oth
er: 5
(0.7
%)
Unk
now
n: 0
(0%
)
No
Plac
emen
t
US
Citi
zen:
15
(0.2
%)
Perm
anen
t R
esid
ent:
4 (0
.3%
) Te
mpo
rary
R
esid
ent:
0 (0
%)
Ref
ugee
/Asy
lee:
0 (0
%)
Stud
ent V
isa:
0
(0%
) O
ther
: 0 (0
%)
Unk
now
n: 0
(0%
)
Num
ber A
sses
sed
U
S C
itize
n: 6
,979
(8
4.7%
) Pe
rman
ent
Res
iden
t: 1,
252
(83.
4%)

App
endi
x 2
Inst
itutio
nal D
ata
for L
angu
age
and
Mat
hem
atic
s Pr
ojec
t
V. C
aste
llón
Page
31
2/19
/201
0
Tem
pora
ry
Res
iden
t: 14
(9
3.3%
) R
efug
ee/A
syle
e:
12
5 (7
4.4%
) St
uden
t Vis
a: 3
24
(89.
0%)
Oth
er:
736
(87.
4%)
Unk
now
n: 8
(5
0.0%
)
Num
ber N
ot A
sses
sed
U
S C
itize
n: 1
,264
(1
5.3%
) Pe
rman
ent
Res
iden
t: 24
9 (1
6.6%
) Te
mpo
rary
R
esid
ent:
1 (6
.7%
) R
efug
ee/A
syle
e:
43
(25
.6%
) St
uden
t Vis
a: 4
0 (1
1.0%
) O
ther
: 106
(12.
6%)
Unk
now
n: 8
(50%
)
San
Jose
City
Col
lege
--
Basic
Mat
hem
atic
s -- M
ath
310
(1, 2
, 3 u
nits)
314/
649 ≈
48%
349/
664 ≈
53%
220/
496 ≈
44%

App
endi
x 2
Inst
itutio
nal D
ata
for L
angu
age
and
Mat
hem
atic
s Pr
ojec
t
V. C
aste
llón
Page
32
2/19
/201
0
Stud
ents
did
not
nec
essa
rily
com
plet
e th
e co
urse
Pre
Alg
ebra
– M
ath
311
(3 u
nits)
10
0/18
9 ≈
53%
14
7/26
1 ≈
56%
14
9/28
5 ≈
52%
Elem
enta
ry A
lgeb
ra –
Mat
h 11
A (5
uni
ts)
430/
845 ≈
51%
47
3/10
07 ≈
47%
58
7/11
53 ≈
51%
Revi
ew o
f Int
rodu
ctor
y A
lgeb
ra –
Mat
h 11
R(3
units
) 12
/20
= 60
%
13/1
6 ≈
81%
n/
a
Self-
Pace
d In
trodu
ctor
y A
lgeb
ra –
Mat
h 11
S (5
uni
ts)
208/
353 ≈
59%
22
7/34
6 ≈
66%
15
6/28
1 ≈
56%
Inte
rmed
iate
Alg
ebra
– M
ath
13 (5
uni
ts)
464/
932 ≈
50%
54
9/10
39 ≈
53%
65
4/11
85 ≈
55%
Self-
Pace
d In
trodu
ctor
y A
lgeb
ra –
Mat
h 13
S (1
, 2, 3
, 4, o
r 5 u
nits)
Stud
ents
did
not
nec
essa
rily
com
plet
e th
e co
urse
75/1
11 ≈
68%
66/1
12 ≈
59%
39/6
6 ≈
59%
Geo
met
ry –
Mat
h 14
(3 u
nits)
85
/145≈
59%
96
/126
≈ 7
6%
100/
134 ≈
75%
El P
aso
Com
mun
ity C
olle
ge
SEE
ATT
AC
HM
ENT
Mat
hem
atic
al st
rand
s and
topi
c ar
eas t
hat s
eem
to b
e th
e m
ost p
robl
emat
ic fo
r no
n-En
glish
-bac
kgro
und
stud
ents
Ea
st Lo
s Ang
eles
Col
lege
D
epen
ding
on
the
mat
h co
urse
, cer
tain
mat
hem
atic
al st
rand
s and
topi
cs a
re d
iffic
ult f
or st
uden
ts. H
owev
er, i
n ge
nera
l, re
gard
less
of t
he m
athe
mat
ical
leve
l, st
uden
ts te
nd to
stru
ggle
with
wor
d pr
oble
ms a
nd fr
actio
ns.
El P
aso
Colle
ge
San
Jose
City
Col
lege
Th
is is
har
d to
ans
wer
bec
ause
we
have
dat
a on
eth
nici
ty b
ut n
ot o
n no
n-En
glis
h ba
ckgr
ound
. I c
an sa
y th
at th
e co
urse
s w
ith th
e lo
wes
t suc
cess
rate
s bel
ow 5
0% fo
r Lat
ino/
a st
uden
ts b
etw
een
2007
sum
mer
and
fall
and
2008
sprin
g, su
mm
er
and
fall
is M
ath
310
(47.
93%
), M
ath
11a
(43.
56%
), M
ath
13 (4
9.33
%) M
ath
21 (P
re C
alcu
lus)
(29.
04%
) and
mat
h 25
(P
re C
alcu
lus w
ith T
rigon
omet
ry)(
38.
84%
). I
will
send
an
atta
chm
ent w
ith a
ll th
is d
ata
atta
ched
. B
ased
on
anec
dota
l dat
a, th
e bi
gges
t iss
ue fo
r non
-Eng
lish-
bac
kgro
und
stud
ents
is w
ord
prob
lem
s. F
ract
ions
in b
asic
m
ath
& ra
tiona
l exp
ress
ions
in a
lgeb
ra a
re a
lso
very
diff
icul
t con
cept
s for
thes
e st
uden
ts. P
re C
alcu
lus i
s a b
ig c
once
rn
for t
hese
stud
ents
as y
ou c
an se
e fr
om th
e nu
mbe
rs. T
he h
unch
is th
at th
e st
uden
ts e
nter
ing
Mat
h 21
and
Mat
h 25
do
not
have
the
func
tiona
l kno
wle
dge
of th
e fu
ndam
enta
l mat
h fr
om d
evel
opm
enta
l cla
sses
they
nee
d to
be
succ
essf
ul in
Mat
h 21
and
Mat
h 25
.

THE CARNEGIE FOUNDATION FOR THE ADVANCEMENT OF TEACHING Problem Solut ion Explorat ion Papers
5 1 V i s ta La n e S ta n fo r d, C A 9 4 3 0 5 • tel eph o n e: 6 5 0 . 5 6 6 . 5 1 0 0 • fa x : 6 5 0 . 3 2 6 . 0 2 7 8 •
w w w . c a r n eg i efo un da t i o n . o r g
About the Problem Solution Exploration Papers A series of background papers was prepared for Carnegie to support its work in developmental mathematics in community colleges, to devise measures for student success, and to help identify problems of practice for potential future work. Student Learner Study “What Community College Developmental Mathematics Students Understand About Mathemat-ics,” James Stigler. Because the research literature did not cover what mathematical knowledge students have, James Stigler undertook fieldwork to learn more about students’ understanding of basic mathematics, and student perceptions of what they believe it means to do mathematics. Language Learning “The Developmental Mathematics and Language Project,” Guadalupe Valdes and Bernard Gif-ford. Includes an extensive review of literature and field work, with interviews of students, fac-ulty, and administrators at three community colleges –San Jose City College, East LA Commu-nity College and El Paso Community College. Human Resources “Community College Faculty and Developmental Education: An Opportunity for Growth and Investment,” by Amy Gerstein provides a descriptive analysis of full- and part-time community college faculty, and their preparation for teaching. Social/Cultural Support The two parts of this paper are a review of literature of current student success courses by Laura Hope of Chaffey College, and a white paper on social and educational psychology by Carlton Fong of the Charles A. Dana Center. These two together map the landscape of current practice and new possibilities. A more detailed introduction to the papers by Rose Asera is also available. Download the series at:
www.carnegiefoundation.org/elibrary/problem-solution-exploration-papers
Copyright Information This work is licensed under the Creative Commons Attribution-Noncommercial-Share Alike 3.0 Unported license.
To view the details of this license, go to: http://creativecommons.org/licenses/by-nc-sa/3.0/