Embed Size (px)
Citation preview
Final Report on APMP.M.FF-K2.a
1
Final Report on the APMP Key Comparison
Liquid Hydrocarbon Flow
(APMP.M.FF-K2.a)
October, 2016
Takashi Shimada1, Chun-Min Su2,
I-Cheng Chen2 and Simon Dignan3
1NMIJ/AIST, Japan (Pilot) 2CMS/ITRI, Chinese Taipei 3NMIA, Australia
Final Report on APMP.M.FF-K2.a
2
1. IntroductionThis key comparison, APMP.M.FF-K2.a has been undertaken by APMP/TCFF,
which is APMP Technical Committee for Fluid Flow, and was piloted by the National Metrology Institute of Japan (NMIJ/AIST). The objective of this key comparison is to demonstrate the degree of equivalence of the hydrocarbon flow standards held at the participating laboratories, to link the key comparison reference value (KCRV) of CCM.FF-K2[1] and to provide supporting evidence for the calibration and measurement capabilities (CMCs) claimed by the participating laboratories in the Asia-Pacific regions. This Final report was prepared in accordance with some guidelines [2]~[5] .
2. Participants and organization of the comparison2.1. List of participants
The participants are listed in Table 1.
Table 1 List of the participating NMIs
Participating NMI (Economy)
Contact Person E-mail Address and Phone Number Shipping Address
1 CMS/ITRI (Chinese Taipei)
Chun-Min Su, I-Cheng Chen [email protected], [email protected], +886-3-5741205 Center for Measurement Standards 30 Ta Hsueh Road, Hsinchu, TAIWAN
2 NMIA (Australia)
Simon Dignan [email protected], +61 2 8467 3514 National Measurement Institute, Australia Bradfield Road, West Lindfield, NSW, 2070, AUSTRTALA
3 Pilot
NMIJ/AIST (Japan)
Takashi Shimada [email protected], +81-29-861-4377 National Metrology Institute of Japan National Institute of Advanced Industrial Science and Technology AIST North site 14, 1497-1 Teragu, Tsukuba, Ibaraki, 300-4201, JAPAN
2.2. Comparison schedule The actual testing dates at each participant are listed in Table 2.
Table 2 Participants and test schedule. Participating NMI From To
NMIJ (#1) January 9, 2013 January 18 CMS February 8 February 22
NMIJ (#2) March 29 April 11 NMIA June 5 June 6
NMIJ (#3) July 1 July 25, 2013
Final Report on APMP.M.FF-K2.a
3
3. Transfer standard and measurement instruction3.1. Description of the transfer standard
A screw type positive displacement flow meter was used as a transfer standard. The specification of the flow meter is shown in Table 3. The schematic of the transfer package is shown in Fig. 1. The pictures of the flowmeter, the display, the strainer with pipe and the box for transportation are shown in Fig. 2 to Fig. 5.
Table 3 Specification of transfer package Flow meter Manufacturers KRAL
Type OMG140 Inlet diameter 150 mm Flange 6” ANSI 150lb RF Size 610 mm (L), 267 mm (D) Weight 180 kg Maximum flow rate (normal)
450 m3/h (300 m3/h)
Converter type BEG 47 Class of protection EEx ia IIC T6
Display with safety barrier
Pulse output type TTL, Open corrector or 24V pulse
Power supply AC85 ~ 264V Size 160 mm X 230 mm X 260 mm
Upstream pipe Flange 6” ANSI 150lb RF Pipe 6” Sch40 Filter 10 mesh per inch
Box A Size, L, W, H (mm) 630 mm X 990 mm X 755 mm Weight 280 kg in total
Box B (Reinforced cardboard box)
Size, L, W, H (mm) 380 mm X 380 mm X 410 mm
Weight 45 kg in total

Final Report on APMP.M.FF-K2.a
4
Fig. 1 Schematic of the package
Fig. 2 Flow meter
Fig. 3 Display with safety barrier
(6" ANSI 150lb RF)
195
(1)~(3) Upstream pipe
610
805
(3) Pipe (6" ANSI 150lb RF, 6" Sch40)
(2) Filter
(1) Flange(6" ANSI 150lb FF)
(4) PD Meter

Final Report on APMP.M.FF-K2.a
5
Fig. 4 Upstream pipe
Fig. 5 Box A for transport
3.2. Quantities to be measured and conditions of measurement The participants calculated actual K factors at calibration condition. The K factors
obtained at the participants were used to calculate a corrected K factor based on 20 ºC expressed as:
( ){ }20 1 3 20f fK K tα= + − (1)
20fK : Corrected K-factor (p/L) fK : K factor (p/L)
α : Coefficient of linear expansion of material. (Carbon steel for flow meter, =1.1 × 10⁻⁵ (ºC-1))
t : Temperature at calibration condition (ºC) The relative K factor against the nominal K factor of the transfer standard K is given
by Equation (2).
20f fnom
fnom
K KK
K−
= (2)
K : Relative K factor (-) fnomK : Nominal K factor (= 8.837 p/L)

Final Report on APMP.M.FF-K2.a
6
The test points are listed in Table 4. The three cardinal points were the flow rates at Reynolds numbers of 70 000, 100 000 and 300 000. The participants calibrated the transfer standard at Re of 100 000 at least. The required flow rate was between 60 m3/h and 300 m3/h at the cardinal points. The liquid temperature through the transfer standard at calibration condition was approximately between 20 ºC and 30 ºC. The viscosity of liquid at calibration condition was between 1.5 mm2/s and 7.0 mm2/s. The back pressure downstream of the flow meter was more than 0.1 MPa. The pressure at the flow meter was between 0.1 MPa and 0.6 MPa.
In NMIA a small volume prover is used as a reference standard. Therefore, the number of passes followed normal procedure at NMIA. The number of passes was reported in the results data sheet.
Table 4 Flow rates and test sequence
Flowrate m3/h (L/s)
Reynolds no Recommended No of repeated measurements
Approx. Frequency (Hz)
60 (16.7) 2 150 120 (33.3) 2 290 180 (50.0) 2 440 240 (66.7) 2 590 300 (83.3) 2 740
Cardinal point 70 000 6 Cardinal point 100 000 6 Cardinal point 300 000 6
Total No of points 28
From the fluid properties and the flow rate, the Reynolds number at each flow rate was calculated. Reynolds number is expressed as
4Re QD
ρπµ
= (3)
Q : Volumetric flow rate (m3/s) ρ : Density (kg/m3) D : Package inlet diameter as given (= 0.15 m) µ : Dynamic viscosity (Pa·s)
Reynolds number is based on the inlet diameter of the flow meter upstream pipe (= 0.15 m). The volumetric flow rate through the flow meter was used to set the Reynolds number. Difference of Reynolds number from the cardinal points was less than ± 5 %.

Final Report on APMP.M.FF-K2.a
7
4. Methods of measurementA summary of the calibration methods used by the participants is shown in Table 5.
Details are given in Appendix B.
Table 5 Calibration method. NMI Calibration method Reference standard CMS Static and gravimetric method with standing
start and stop Weighing scale
NMIA Volumetric method with flying start and stop Small volume prover NMIJ Static and gravimetric method with flying
start and stop Weighing scale
5. Repeated measurements of the pilot institute, behavior of the transferstandardFrom the measurements of the pilot institute, NMIJ, the performance of the transfer
standard and its stability was evaluated.
5.1. Reproducibility The deviation of relative K factors against the averaged K factors obtained at NMIJ
during APMP.M.FF-K2.a is shown in Fig. 6. The maximum standard deviation of K factors during APMP.M.FF-K2.a is 0.004 3 % at a flow rate of 300 m3/h in kerosene. The standard uncertainty due to reproducibility of the transfer standard including transport effect is estimate to be 0.004 3 %.
Fig. 6 Deviation of relative K factors against averaged relative K factors in NMIJ
Liquid Flow rare Marker
Standard deviation (%)
Kerosene Re=300,000 0.0038
Re=100,000 0.0027
Re=70,000 0.0023
300m3/h 0.0043240m3/h 0.0023
180m3/h 0.0007
120m3/h 0.0015
60m3/h 0.0021
Light oil Re=100,000 0.0022
Re=70,000 0.0017
300m3/h 0.0024
240m3/h 0.0022
180m3/h 0.0026
120m3/h 0.0010
60m3/h 0.0016
-0.02
-0.01
0.00
0.01
0.02
Date
Transfer standard 20 ºC
K -
Kav
g(%
)
01-Jan-11 02-Jan-12 02-Jan-13 03-Jan-14
APMP.M.FF-K2.aJan. ~ Aug. 2013

Final Report on APMP.M.FF-K2.a
8
5.2. Temperature and viscosity effect The transfer standard was calibrated at different temperature in kerosene (KE) and
light oil (LO) at NMIJ before the comparison in order to investigate the effect due to temperature and viscosity on the K factors. The calibrated flow rates were between 60 m3/h and 300 m3/h. The calibrated temperatures were 15 ºC, 20 ºC, 25 ºC, 30 ºC and 35 ºC. The relative K factor of the transfer standard at different temperature is shown in Fig. 7. The standard deviation due to temperature and viscosity at the cardinal points is shown in Table 6. The standard uncertainty due to the difference of temperature and viscosity between each pair of the participants is estimated to be 0.005 8 % at maximum.
Table 6 Standard deviation due to temperature and viscosity at the cardinal point.
Re Maximum Viscosity
Minimum Viscosity
Standard deviation of K
(-) (mm2/s) (mm2/s) (%) 300 000 2.13 1.52 0.002 5 100 000 6.95 1.52 0.005 7 70 000 8.18 1.52 0.005 8
Fig. 7 Relative K factor of transfer standard at different temperature in NMIJ
0.02
0.03
0.04
0.05
0.06
0.07
0.08
0.09
0.10
0.11
0.12
10,000 100,000 1,000,000
K (%
)
Re (-)
KE15CKE20CKE25CKE30CKE35CLO35CLO30CLO25CLO20CLO15C
Final Report on APMP.M.FF-K2.a
9
5.3. Linearity The corrected K factor, of which the flow rate is more than 60 m3/h and Re is more
than 50 000, was described by the second function equation of Equation(4).
( ) ( )220 Ln Re +bLn RefK a c= + (4)
a = -1.594998 × 10⁻³, b = 3.527330 × 10⁻², c = 8.65029. The sensitivity coefficient of the corrected K factors against Re is obtained by
Equation(5). ( )20 Ln Re b2 +
Re Re RefK
a∂
=∂
(5)
The relative standard uncertainty of the K factors due to the uncertainty of Re is obtained by Equation(6), assumed that the uncertainty of Re is 5 % since the deviations of Reynolds number at the cardinal points are less than ± 5 %.
( ) ( )20 Re 0.1 Ln Re +0.05bRe
f
fnom fnom
K u aK K
∂=
∂(6)
The relative standard uncertainty due to the differences of Re at the cardinal points between each pair of the participants is estimated to be the largest value of 0.002 8 % at Re of 300 000.
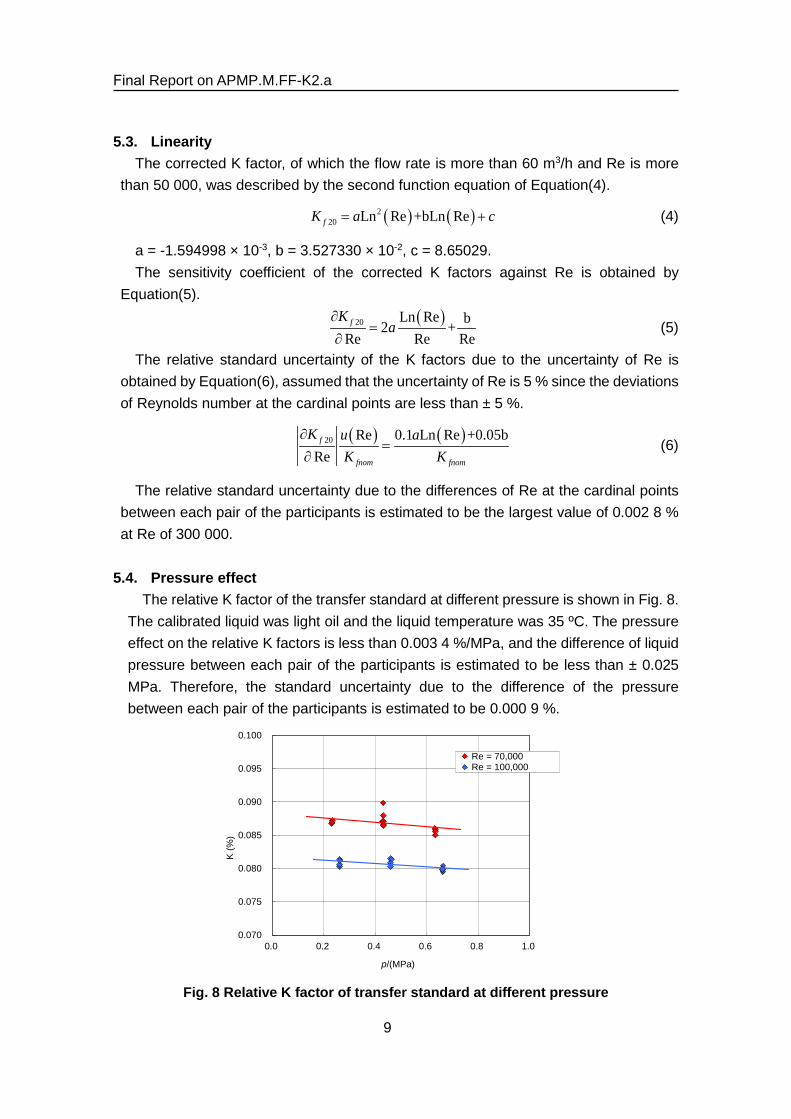
5.4. Pressure effect The relative K factor of the transfer standard at different pressure is shown in Fig. 8.
The calibrated liquid was light oil and the liquid temperature was 35 ºC. The pressure effect on the relative K factors is less than 0.003 4 %/MPa, and the difference of liquid pressure between each pair of the participants is estimated to be less than ± 0.025 MPa. Therefore, the standard uncertainty due to the difference of the pressure between each pair of the participants is estimated to be 0.000 9 %.
Fig. 8 Relative K factor of transfer standard at different pressure
0.070
0.075
0.080
0.085
0.090
0.095
0.100
0.0 0.2 0.4 0.6 0.8 1.0
K (%
)
p/(MPa)
Re = 70,000Re = 100,000

Final Report on APMP.M.FF-K2.a
10
5.5. Effect due to upstream condition The strainer was set upstream the transfer standard at calibration in the comparison
and the PD meter was used as the transfer standard, indicating that the transfer package is hardly affected by the upstream condition in the test rig of the participants. The effect due to the upstream condition was estimated by the difference of the K factors with the strainer from those without the strainer. The relative difference of the K factors with the strainer from those without the strainer is shown in Fig. 9. A PD meter which is the same type of the transfer standard was calibrated with the transfer standard. The calibrated liquid was light oil and the temperature was 20 ºC. The relative standard uncertainty due to the difference of the upstream condition between each pair of the participants STRu is estimated to be 0.003 1 % by Equation (7).
( )STR STR STRu dK u dK= + (7)
STRdK and ( )STRu dK indicate the mean of the relative differences and the standard deviation of the mean.
Fig. 9 Relative difference of K factor with the strainer from those without the strainer
6. Measurement results6.1. Results of the participating institutes
The relative K factor reported from all participants is shown in Fig. 10. All of the reported values are listed Appendix A including the data reduction performed by the pilot lab.
-0.01
0.00
0.01
0 100 200 300 400
K with
stra
iner
-Kw
ithou
t stra
iner
(%)
Q/(m3/h )
Transfer standard
PD meter

Final Report on APMP.M.FF-K2.a
11
Fig. 10 Relative K factors obtained by the all participants.
6.2. Calculation of the reference value and its uncertainty The analysis of the results was carried out according to the methods specified by
Cox[4]. At Reynolds number of 70 000, 100 000 and 300 000, the comparison reference values (KCRV), which provide linkage to CCM.FF-K2[1], is obtained based on the method used for EUROMET Project 345[7]. CMS and NMIJ participated in both comparisons, CCM.FF-K2 and APMP.M.FF-K2.a. Assumed that the calibration results in the both linking laboratories are maintained between CCM.FF-K2 and APMP.M.FF-K2.a, the calibration results obtained at the linking laboratory i in APMP.M.FF-K2.a
iK is corrected by the difference of the calibration results of the linking laboratory from the KCRV of CCM.FF-K2 CCM,id . The relative value corrected by the KCRV of CCM.FF-K2 for APMP.M.FF-K2.a ,C iK is given by Equation (8).
, CCM,C i i iK K d= − (8)
The standard uncertainty of the corrected value ( ),C iu K is obtained by Equation (9) using the standard uncertainty of the calibration results ( )iu K and the standard uncertainty of the difference from the KCRV of CCM.FF-K2 ( )CCM,iu d .
( ) ( ) ( )2 2 2, CCM,C i i iu K u K u d= + (9)
The expanded uncertainty of the corrected value ( ),C iU K is obtained by Equation (10).
0.00
0.02
0.04
0.06
0.08
0.10
0.12
0.14
0.16
1000 10000 100000 1000000
K (%
)
Re (-)
CMS ; Light oil, 20ºC_1, Feb 2013
CMS ; Light oil, 20ºC_2, Feb 2013
CMS ; Light oil, 25ºC, Feb 2013
CMS ; Light oil, 30ºC, Feb 2013
NMIA ; D130, Jun 2013
NMIA ; Norpar, Jun 2013
NMIJ ; Kerosene, 20ºC, Jan 2013
NMIJ ; Light oil, 20ºC, Jan 2013
NMIJ ; Kerosene, 20ºC, Apr 2013
NMIJ ; Kerosene, 30ºC, Apr 2013
NMIJ ; Light oil, 20ºC, Mar 2013
NMIJ ; Light oil, 20ºC, Jun 2013
NMIJ ; Light oil, 25ºC, Jun 2013
NMIJ ; Light oil, 30ºC, Jun 2013
NMIJ ; Kerosene, 20ºC, Jun 2013
NMIJ ; Kerosene, 25ºC, Jun 2013
NMIJ ; Kerosene, 30ºC, Jun 2013
Final Report on APMP.M.FF-K2.a
12
( ) ( ) ( ), , ,2C i C i C iU K k u K u K= ⋅ = (10)
The key comparison reference value (KCRV) of APMP.M.FF-K2.a APMPx is obtained as the weighted average of the corrected values by Equation (11), and the uncertainty of the KCRV of APMP.M.FF-K2.a ( )APMPu x is expressed by Equation (12).
( )( )
( )( )
2, ,
APMP2
,1
n
C i C ii
n
C ii
K u KK
u K=
∑
∑(11)
( ) ( )2 2APMP ,
1 1n
i C iu K u K
=
∑ (12)
The expanded uncertainty of the KCRV of APMP.M.FF-K2.a ( )APMPU x is obtained by Equation (13).
( ) ( ) ( )APMP APMP APMP2U x k u x u x= ⋅ = (13)
The standard uncertainty of the calibration results, that is the relative K factor at each linking laboratory is expressed by Equation (14).
( )2 2 2 2, DUT,
2 2 2 2 2 2 2, DUT, Re
i f i i TS
f i i REP vis p upst
u K u u u
u u u u u u u
= + +
= + + + + + +(14)
,f iu : Standard uncertainty due to calibration facility in the laboratory i , Base uncertainty
DUT,iu : Standard uncertainty due to repeatability of transfer standard at calibration, DUT uncertainty
TSu : Standard uncertainty due to the transfer standard
REPu : Standard uncertainty due to reproducibility of the transfer standard
visu : Standard uncertainty due to the effect of viscosity and temperature differences between each pair of the participants on the transfer standard.
Reu : Standard uncertainty due to the effect of differences of Re between each pair of the participants on the transfer standard.
pu : Standard uncertainty due to the effect of pressure differences between each pair of the participants on the transfer standard.
upstu : Standard uncertainty due to the effect of differences of upstream condition between each pair of the participants on the transfer standard.
The standard uncertainty due to the transfer standard TSu is estimated to be 0.008 4 %. The expanded uncertainty of the relative K factor in the linking laboratories is obtained by Equation (15).
( ) ( ) ( )2i i iU K k u K u K= ⋅ = (15)

Final Report on APMP.M.FF-K2.a
13
The differences of the relative K factors from the KCRV of CCM.FF-K2 in the linking laboratories are shown in Table 7. The calibrated liquid and temperature at CMS and NMIJ in CCM.FF-K2 was light oil at 20 oC and kerosene at 20 oC, respectively. In this analysis, the calibration results of light oil at 20 oC in NMIJ were used in order to obtain KCRV of APMP.M.FF-K2.a at Re of 70 000. The KCRV of APMP.M.FF-K2.a and its uncertainties at the cardinal points are shown in Table 8.
The Chi-squared test was carried out for KCRV of APMP.M.FF-K2.a. The Chi-squared value is calculated by Equation (16).
( )( )
2, APMP2
1 ,
nC i
obsi C i
K Ku K
χ=
−= ∑ (16)
The evaluated Chi-squared values at the cardinal points are shown in Table 8. The Chi-squared values 2
obsχ are less than the Chi-squared value 2χ of 3.84 for the 95% confidence and the degrees of freedom (n - 1 = 1), indicating that the consistency check does not fail at the 95 % confidence level.
Table 7 Difference from KCRV of CCM.FF-K2 in the linkage laboratories.
Name of NMI
Diff. from
KCRV
Expanded
uncertainty of
diff. from KCRV
Ref. in Final
report of
CCM.FF-K2[1]
Averaged
Difference from
KCRV
CCM,id (%) ( )CCM,iU d (%) CCM,id (%)
CMS -0.023 0.044 TABLE 4A
-0.020 5 -0.018 0.044 TABLE 4B
NMIJ -0.022 0.032 TABLE 4A
-0.019 0 -0.016 0.032 TABLE 4B
Table 8 KCRV of APMP.M.FF-K2.a, its uncertainty and Chi-squared value. Re NMI Liquid, Temp iK ( )iU K ,C iK ( ),C iU K APMPK ( )APMPU K obsχ
(-) (%) (%) (%) (%) (%) (%)
70 000 CMS Light oil, 20 oC 0.134 4 0.050 0.154 9 0.067
0.128 2 0.038 0.96 NMIJ Light oil, 20 oC 0.096 0 0.034 0.115 0 0.047
100 000 CMS Light oil, 20 oC 0.125 5 0.050 0.146 0 0.067
0.127 5 0.038 0.46 NMIJ kerosene, 20 oC 0.099 3 0.034 0.118 3 0.047
300 000 NMIJ Kerosene, 20 oC 0.048 5 0.034 0.067 5 0.047 0.068 0 0.047

Final Report on APMP.M.FF-K2.a
14
6.3. Link to the CCM.FF-K2 and degrees of equivalence The degree of equivalence of APMP.M.FF-K2.a of each linking laboratory APMP,id
and its standard uncertainty (u d )APMP,i are expressed by Equations (17) and (18).
APMP, , APMPi C id K K= − (17)
( ) ( ) ( )2 2 2APMP, , APMPi C iu d u K u K= − (18)
The expanded uncertainty of the degree of equivalence of APMP.M.FF-K2.a ( )APMP,iU d is obtained by Equation (19).
( ) ( ) ( )APMP, APMP, APMP,2i i iU d k u d u d= ⋅ = (19)
The En value, that is the standardized degree of equivalence at each linking laboratory, iE is obtained by Equation (20).
( )APMP,
APMP,
= ii
i
dE
U d(20)
The degree of equivalence of each linking laboratory is shown in Table 9.
Table 9 Degree of equivalence of each linking laboratory
Re NMI Liquid, Temp. APMP,id ( )APMP,iU d iE
(-) (%) (%) (-)
70 000 CMS Light oil, 20 oC 0.026 6 0.054 0.49
NMIJ Light oil, 20 oC -0.013 3 0.027 0.49
100 000 CMS Light oil, 20 oC 0.018 5 0.054 0.34
NMIJ Kerosene, 20 oC -0.009 2 0.027 0.34
300 000 NMIJ Kerosene, 20 oC - - -
The degree of equivalence between the KCRV of APMP.M.FF-K2.a and each of the participants APMP,id ′ and its standard uncertainty ( )APMP,iu d ′ are expressed byEquations (21) and (22).
APMP, APMPi id K K′ = − (21)
( ) ( ) ( )2 2 2APMP, APMPi iu d u K u K′ = + (22)
The expanded uncertainty of the degree of equivalence ( )APMP,iU d ′ is obtained by Equation (23).

Final Report on APMP.M.FF-K2.a
15
( ) ( ) ( )APMP, APMP, APMP,2i i iU d k u d u d′ ′ ′= ⋅ = (23)
The En value, that is the standardized degree of equivalence, at each laboratory participated in APMP.M.FF-K2 iE′ is obtained by Equation (24).
( )APMP,
APMP,
= ii
i
dE
U d′
′′
(24)
The degree of equivalence between the KCRV of APMP.M.FF-K2.a and each of the participants is shown in Table 10 and Fig. 11.
Table 10 Degree of equivalence between the KCRV and each of the participants in APMP.M.FF-K2
Re NMI Liquid, Temp. Flow rate APMP,id ′ ( )APMP,iU d ′ iE ′
(-) (m3/h) (%) (%) (-)
70 000
CMS Light oil, 25 oC 113.06 -0.005 1 0.061 0.08
Light oil, 30 oC 99.19 -0.011 3 0.061 0.19
NMIA D 130 168.50 -0.053 6 0.052 1.03
NMIJ Light oil, 25 oC 179.98 -0.038 5 0.052 0.75
Light oil, 30 oC 156.68 -0.038 8 0.052 0.75
100 000
CMS Light oil, 25 oC 160.56 -0.007 4 0.061 0.12
Light oil, 30 oC 141.77 -0.011 1 0.061 0.18
NMIA Norpar 12 72.16 -0.059 3 0.052 1.14
D 130 226.04 -0.059 0 0.052 1.13
NMIJ
Light oil, 20 oC 298.10 -0.034 3 0.052 0.67
Light oil, 25 oC 257.11 -0.038 5 0.052 0.75
Light oil, 30 oC 224.20 -0.040 8 0.052 0.79
Kerosene, 25 oC 78.05 -0.035 4 0.052 0.69
Kerosene, 30 oC 71.81 -0.039 2 0.052 0.76
300 000
NMIA Norpar 12 207.79 -0.037 9 0.059 0.65
NMIJ Kerosene, 25 oC 234.12 -0.020 6 0.058 0.35
Kerosene, 30 oC 215.48 -0.021 2 0.058 0.36

Final Report on APMP.M.FF-K2.a
16
Fig. 11 Degree of Equivalence and its expanded uncertainty
The degree of equivalence between a laboratory i and a laboratory j in APMP.M.FF-K2.a and its standard uncertainty ( )iju d are expressed by Equations(25)(26).
ij i jd K K= − (25)
( ) 2 2, DUT,
2 2, DUT,
2 2 2 2 2Re2
ij f i i
f j j
REP vis p upst
u d u u
u u
u u u u u
= +
+ +
+ + + + +
(26)
The expanded uncertainty of the degree of equivalence between each pair of the participants in APMP.M.FF-K2.a ( )ijU d is obtained by Equation(27).
( ) ( ) ( )2ij ij ijU d k u d u d= ⋅ = (27)
The En value between each pair of the participants in APMP.M.FF-K2 i jE is obtained by Equation (28).
( )= i ji j
i j
dE
U d(28)
The degree of equivalence between a laboratory i and a laboratory j in APMP.M.FF-K2.a is shown in Appendix A.4.
7. Withdrawals of resultsThe result of 51.97 m3/h for Norpar 12 in NMIA was deleted because the flow rate
was less than 60 m3/h.
-0.15
0.00
0.15
d APM
P,i,
d'AP
MP,
i(%
)
CMS ; Light oil, 20 ºC
CMS ; Light oil, 25ºC
CMS ; Light oil, 30ºC
NMIA ; D130
NMIA ; Norpar
NMIJ ; Light oil, 20ºC
NMIJ ; Light oil, 25ºC
NMIJ ; Light oil, 30ºC
NMIJ ; Kerosene, 20ºC
NMIJ ; Kerosene, 25ºC
NMIJ ; Kerosene, 30ºC
Re = 70 000Re = 100 000
Re = 300 000
Re = 70 000Re = 100 000
Re = 300 000
DoE of each linking participantDoE between the KCRV of APMP.M.FF-K2 and each of the participants
Final Report on APMP.M.FF-K2.a
17
8. Summary and conclusionsThree laboratories: CMS, NMIA and NMIJ, participated in the key
comparison for hydrocarbon flow measurement. A screw type positive displacement flow meter was selected as a transfer standard.
The performance of the transfer standard and its stability was evaluated from the measurements of the pilot institute, NMIJ. The transfer standard showed high performance and good stability since the uncertainty due to the transfer standard was less than quoted uncertainties in the participants.
CMS and NMIJ have En values which show consistency with both the relevant KCRV for APMP.M.FF-K2.a and each pair of participants. However some En values for NMIA were from 1 to 1.2, indicating “alert”.
9. References[1] Paton, R., International Key Comparison of Liquid Hydrocarbon Flow Facilities
CCM-FF-K2 (Final Report), October, 2008 [2] Comité International des Poids et Mesures (CIPM), Mutual Recognition of National
Measurement Standards and of Calibration and Measurement Certificates Issued by National Metrology Institutes, Paris, France, October, 1999.
[3] APMP-G2, The Guidelines on conducting comparisons [4] CCM-WGS, CCM Guidelines for approval and publication of the final reports of key
and supplementary comparisons, 29 August 2013. [5] CCEM, CCEM Guidelines for Planning, Organizing, Conducting and Reporting Key,
Supplementary and Pilot Comparisons. [6] Cox, M. G., The Evaluation of Key Comparison Data, Metrologia, 39, 589-595, 2002. [7] Delahaye, F and Witt, T. J., Linking the Results of Key Comparison CCEM-K4 with
the 10 pF Results of EUROMET Project 345, Metrologia, 39, Technical Supplement 01005 , 2002.

Final Report on APMP.M.FF-K2.a
18
APPENDIX A
Tables of final results
A.1 CMS
Table A.1.a Averaged data
Averaged Data
Reynoldsnumber Liquid Kinematic
viscosity Density Flow rate Temperature Pressure K factor Base uncertainty DUT uncertaintyExpanded
Uncertaintyof K factor
Kf20 K
[-] [-] [ ×10-6
m2/s ][kg/m3] [m3/h] [oC] [MPa] [p/L] u [%] u [%] U (k =2) [%] [p/L] [%]
70,000 Light oil 4.281 806.62 125.96 19.91 0.164 8.8489 0.023 0.002 0.047 8.84887 0.1344
70,000 Light oil 3.788 803.16 113.06 24.92 0.156 8.8464 0.023 0.001 0.047 8.84789 0.1232
70,000 Light oil 3.370 799.70 99.19 29.93 0.157 8.8444 0.023 0.001 0.047 8.84733 0.1169
100,000 Light oil 4.274 806.58 178.97 19.97 0.189 8.8481 0.023 0.002 0.047 8.84809 0.1255
100,000 Light oil 3.781 803.10 160.56 25.00 0.180 8.8462 0.023 0.001 0.047 8.84761 0.1201
100,000 Light oil 3.372 799.71 141.77 29.91 0.173 8.8444 0.023 0.001 0.047 8.84729 0.1164
Additional

Final Report on APMP.M.FF-K2.a
19
Table A.1.b CMS, Light oil, 20 ºC, Feb. 2013, No.1
No Date Flowrate Temp. Pressure AmbientTemp.
KinematicViscosity Density Pulses Time K factor Volume Re Kf20 K Kf20avg S. D. of
K uDUT Reavg S.D. ofRe
[ - ] [dd/mm/yy] [m3/h] [oC] [MPa] [oC][ ×10-6
m2/s ][kg/m3] [P] [s] [p/L] [m3] [ - ] [p/L] [%] [p/L] [%] [%] [-] [-]
1 20-Feb-13 59.87 20.08 0.210 18.92 4.264 806.51 56079 390.09 8.8484 6.3378 33109 8.84840 0.12902 20-Feb-13 60.17 20.18 0.210 18.97 4.253 806.44 56222 389.18 8.8485 6.3539 33359 8.84853 0.13053 20-Feb-13 119.93 19.84 0.167 19.34 4.288 806.67 56935 202.14 8.8485 6.4344 65941 8.84842 0.12924 20-Feb-13 120.22 19.71 0.167 19.26 4.302 806.76 57079 202.16 8.8488 6.4505 65886 8.84870 0.13255 20-Feb-13 181.22 19.83 0.195 19.27 4.290 806.68 57909 139.01 8.8482 6.5447 99614 8.84820 0.12676 20-Feb-13 181.20 20.01 0.195 19.39 4.271 806.55 57711 138.58 8.8482 6.5224 100048 8.84819 0.12667 20-Feb-13 238.76 20.04 0.240 19.54 4.267 806.53 58808 109.22 8.8476 6.6468 131922 8.84761 0.12018 20-Feb-13 240.34 20.01 0.243 19.48 4.271 806.56 59096 109.04 8.8482 6.6788 132682 8.84825 0.12739 20-Feb-13 298.16 20.02 0.312 19.62 4.269 806.55 59712 90.49 8.8474 6.7491 164660 8.84742 0.117910 20-Feb-13 298.62 20.03 0.309 19.58 4.268 806.54 59805 90.49 8.8474 6.7596 164957 8.84746 0.118311 20-Feb-13 125.74 19.92 0.164 19.46 4.281 806.62 57068 193.65 8.8486 6.4494 69261 8.84855 0.1307 8.84889 0.0026 0.0011 69376 20012 20-Feb-13 125.84 19.84 0.165 19.63 4.288 806.67 57094 193.57 8.8491 6.4520 69190 8.84906 0.136413 20-Feb-13 125.83 19.84 0.165 19.52 4.289 806.68 57275 194.18 8.8491 6.4724 69172 8.84905 0.136414 20-Feb-13 125.94 19.95 0.165 19.58 4.277 806.60 57221 193.84 8.8491 6.4663 69423 8.84907 0.136615 20-Feb-13 126.10 19.98 0.164 19.52 4.274 806.58 56990 192.87 8.8490 6.4403 69560 8.84896 0.135316 20-Feb-13 126.31 19.96 0.164 19.61 4.276 806.59 57062 192.80 8.8487 6.4487 69651 8.84866 0.131917 20-Feb-13 179.10 19.97 0.189 19.65 4.275 806.58 57615 139.89 8.8479 6.5117 98787 8.84788 0.1232 8.84805 0.0034 0.0014 98724 6218 20-Feb-13 178.96 19.96 0.190 19.73 4.276 806.59 57834 140.48 8.8485 6.5360 98686 8.84853 0.130519 20-Feb-13 179.09 19.97 0.188 19.59 4.275 806.58 57635 139.94 8.8481 6.5138 98781 8.84808 0.125320 20-Feb-13 178.76 19.98 0.188 19.78 4.274 806.57 57943 140.88 8.8481 6.5486 98626 8.84809 0.125521 20-Feb-13 179.01 19.98 0.189 19.58 4.274 806.58 57708 140.16 8.8481 6.5221 98752 8.84812 0.125822 20-Feb-13 178.87 19.99 0.189 19.71 4.273 806.57 57588 140.00 8.8476 6.5089 98709 8.84763 0.1203
Data analysis by the Pilot LabCalibration condition Others CommentsPD meter

Final Report on APMP.M.FF-K2.a
20
Table A.1.c CMS, Light oil, 20 ºC, Feb. 2013, No.2
No Date Flowrate Temp. Pressure AmbientTemp.
KinematicViscosity Density Pulses Time K factor Volume Re Kf20 K Kf20avg S. D. of
K uDUT Reavg S.D. ofRe
[ - ] [dd/mm/yy] [m3/h] [oC] [MPa] [oC][ ×10-6
m2/s ][kg/m3] [P] [s] [p/L] [m3] [ - ] [p/L] [%] [p/L] [%] [%] [-] [-]
1 08-Feb-13 60.01 20.28 0.211 20.44 4.243 806.37 56046 389.01 8.8476 6.3346 33351 8.84773 0.12142 08-Feb-13 60.32 20.29 0.211 20.24 4.242 806.36 56193 388.01 8.8482 6.3508 33533 8.84831 0.12793 08-Feb-13 120.24 20.33 0.162 20.14 4.237 806.33 57001 201.87 8.8485 6.4419 66915 8.84859 0.13124 08-Feb-13 120.28 20.36 0.162 20.33 4.234 806.32 57030 201.90 8.8487 6.4450 66978 8.84883 0.13395 08-Feb-13 179.90 20.39 0.189 20.21 4.231 806.29 57980 140.13 8.8480 6.5529 100252 8.84811 0.12576 08-Feb-13 179.90 20.41 0.190 20.28 4.229 806.28 57810 139.74 8.8485 6.5333 100312 8.84866 0.13197 08-Feb-13 236.01 20.48 0.235 20.34 4.222 806.23 58611 110.05 8.8475 6.6246 131810 8.84768 0.12088 08-Feb-13 238.41 20.54 0.236 20.58 4.215 806.19 58418 108.70 8.8476 6.6027 133367 8.84779 0.12219 08-Feb-13 300.99 20.59 0.311 20.83 4.210 806.15 59723 89.74 8.8472 6.7505 168581 8.84737 0.117310 08-Feb-13 297.63 20.65 0.307 20.97 4.204 806.12 59903 90.90 8.8469 6.7711 166926 8.84710 0.114311 08-Feb-13 125.91 20.29 0.159 20.62 4.241 806.36 56928 192.96 8.8482 6.4339 69999 8.84827 0.1276 8.84836 0.0015 0.0006 70059 6012 08-Feb-13 125.84 20.32 0.160 20.71 4.238 806.34 57175 193.85 8.8483 6.4617 70016 8.84837 0.128613 08-Feb-13 125.98 20.32 0.160 20.77 4.238 806.34 57193 193.70 8.8483 6.4637 70094 8.84843 0.129414 08-Feb-13 125.95 20.34 0.160 20.60 4.236 806.33 56973 193.04 8.8484 6.4388 70101 8.84845 0.129615 08-Feb-13 125.72 20.36 0.158 20.62 4.234 806.32 57016 193.52 8.8484 6.4437 70005 8.84848 0.129916 08-Feb-13 125.82 20.40 0.158 20.63 4.230 806.28 57084 193.60 8.8480 6.4516 70139 8.84813 0.126017 08-Feb-13 179.23 20.50 0.187 20.67 4.219 806.22 57636 139.85 8.8474 6.5144 100161 8.84757 0.1196 8.84806 0.0033 0.0014 99931 19418 08-Feb-13 178.99 20.50 0.187 20.78 4.219 806.22 58008 140.86 8.8479 6.5562 100031 8.84800 0.124519 08-Feb-13 178.75 20.53 0.187 20.73 4.216 806.19 57780 140.52 8.8480 6.5303 99967 8.84820 0.126720 08-Feb-13 177.97 20.55 0.185 20.67 4.214 806.18 58009 141.62 8.8478 6.5563 99583 8.84795 0.123921 08-Feb-13 178.52 20.58 0.184 20.63 4.211 806.16 57818 140.77 8.8482 6.5344 99964 8.84841 0.129222 08-Feb-13 178.27 20.61 0.186 20.71 4.208 806.14 57686 140.66 8.8481 6.5196 99883 8.84823 0.1271
Data analysis by the Pilot LabCalibration condition Others CommentsPD meter

Final Report on APMP.M.FF-K2.a
21
Table A.1.d CMS, Light oil, 25 ºC, Feb. 2013
No Date Flowrate Temp. Pressure AmbientTemp.
KinematicViscosity Density Pulses Time K factor Volume Re Kf20 K Kf20avg S. D. of
K uDUT Reavg S.D. ofRe
[ - ] [dd/mm/yy] [m3/h] [oC] [MPa] [oC][ ×10-6
m2/s ][kg/m3] [P] [s] [p/L] [m3] [ - ] [p/L] [%] [p/L] [%] [%] [-] [-]
1 21-Feb-13 60.34 24.97 0.205 19.85 3.784 803.13 56323 388.87 8.8453 6.3676 37600 8.84675 0.11042 21-Feb-13 60.51 24.75 0.206 19.72 3.804 803.28 56381 388.17 8.8460 6.3736 37512 8.84738 0.11753 21-Feb-13 120.13 24.78 0.161 19.90 3.801 803.26 57180 202.69 8.8466 6.4635 74522 8.84802 0.12474 21-Feb-13 120.18 24.82 0.160 19.96 3.797 803.23 57213 202.72 8.8470 6.4669 74622 8.84840 0.12905 21-Feb-13 180.09 24.91 0.188 20.61 3.790 803.17 57799 139.61 8.8462 6.5338 112051 8.84763 0.12026 21-Feb-13 180.33 24.97 0.189 20.43 3.784 803.12 58287 140.54 8.8459 6.5891 112377 8.84740 0.11777 21-Feb-13 242.35 24.91 0.242 20.45 3.790 803.17 59337 108.65 8.8454 6.7083 150786 8.84680 0.11098 21-Feb-13 237.92 24.85 0.236 20.57 3.795 803.21 58808 109.60 8.8452 6.6486 147821 8.84658 0.10849 21-Feb-13 297.38 24.79 0.304 20.44 3.800 803.25 59798 90.84 8.8452 6.7605 184497 8.84664 0.109110 21-Feb-13 297.91 24.89 0.306 20.29 3.791 803.18 59787 90.68 8.8453 6.7592 185268 8.84674 0.110211 21-Feb-13 112.81 24.93 0.157 20.10 3.788 803.16 57182 215.28 8.8465 6.4638 70221 8.84797 0.1241 8.84789 0.0026 0.0011 70377 14912 21-Feb-13 113.03 24.88 0.157 20.18 3.792 803.19 57115 214.64 8.8462 6.4564 70284 8.84766 0.120613 21-Feb-13 112.81 24.94 0.157 20.10 3.787 803.15 57112 215.02 8.8465 6.4559 70240 8.84798 0.124314 21-Feb-13 112.97 25.00 0.157 19.78 3.781 803.10 57182 214.97 8.8468 6.4636 70451 8.84825 0.127315 21-Feb-13 113.37 24.94 0.155 19.71 3.787 803.15 57144 214.13 8.8463 6.4596 70586 8.84779 0.122116 21-Feb-13 113.38 24.87 0.156 19.70 3.793 803.20 57248 214.48 8.8462 6.4714 70477 8.84766 0.120717 21-Feb-13 160.64 25.03 0.179 19.82 3.778 803.08 57832 155.51 8.8459 6.5378 100252 8.84732 0.1168 8.84761 0.0034 0.0014 100133 7018 21-Feb-13 160.53 25.01 0.180 19.75 3.780 803.10 57775 155.46 8.8466 6.5308 100131 8.84803 0.124819 21-Feb-13 160.61 24.96 0.180 19.77 3.785 803.13 58091 156.19 8.8464 6.5667 100062 8.84781 0.122320 21-Feb-13 160.42 25.04 0.181 19.80 3.778 803.08 57844 155.74 8.8463 6.5388 100122 8.84777 0.121921 21-Feb-13 160.59 25.01 0.179 19.76 3.780 803.10 57652 155.10 8.8458 6.5174 100161 8.84729 0.116422 21-Feb-13 160.56 24.98 0.179 19.85 3.783 803.12 57989 155.98 8.8460 6.5554 100069 8.84745 0.1183
Data analysis by the Pilot LabCalibration condition Others CommentsPD meter

Final Report on APMP.M.FF-K2.a
22
Table A.1.e CMS, Light oil, 30 ºC, Feb. 2013
No Date Flowrate Temp. Pressure AmbientTemp.
KinematicViscosity Density Pulses Time K factor Volume Re Kf20 K Kf20avg S. D. of
K uDUT Reavg S.D. ofRe
[ - ] [dd/mm/yy] [m3/h] [oC] [MPa] [oC][ ×10-6
m2/s ][kg/m3] [P] [s] [p/L] [m3] [ - ] [p/L] [%] [p/L] [%] [%] [-] [-]
1 22-Feb-13 60.31 30.07 0.210 19.54 3.360 799.60 56639 391.26 8.8438 6.4043 42321 8.84677 0.11062 22-Feb-13 60.56 30.02 0.211 19.68 3.364 799.64 56586 389.37 8.8436 6.3986 42445 8.84649 0.10743 22-Feb-13 120.13 29.91 0.162 19.37 3.372 799.71 57542 203.97 8.8446 6.5059 83997 8.84750 0.11894 22-Feb-13 120.03 29.90 0.161 19.56 3.373 799.72 57445 203.80 8.8448 6.4948 83909 8.84765 0.12065 22-Feb-13 180.66 29.97 0.190 19.60 3.368 799.67 58040 139.78 8.8437 6.5628 126478 8.84664 0.10916 22-Feb-13 180.48 29.81 0.189 19.53 3.380 799.78 58377 140.66 8.8441 6.6006 125916 8.84699 0.11317 22-Feb-13 238.04 29.94 0.232 19.38 3.370 799.69 58885 109.70 8.8436 6.6585 166559 8.84649 0.10748 22-Feb-13 238.06 29.97 0.233 19.30 3.368 799.67 58875 109.67 8.8439 6.6571 166668 8.84680 0.11099 22-Feb-13 297.12 30.02 0.303 19.55 3.364 799.63 65475 98.71 8.8432 7.4040 208269 8.84617 0.103710 22-Feb-13 297.04 29.91 0.302 19.47 3.372 799.71 60019 91.26 8.8427 6.7874 207679 8.84561 0.097411 22-Feb-13 98.87 29.87 0.157 19.56 3.375 799.74 57077 243.99 8.8445 6.4534 69068 8.84734 0.1170 8.84733 0.0032 0.0013 69392 22812 22-Feb-13 99.21 29.95 0.157 19.52 3.369 799.69 57312 244.15 8.8443 6.4801 69424 8.84716 0.114913 22-Feb-13 99.22 29.95 0.155 19.61 3.369 799.68 57101 243.26 8.8441 6.4564 69440 8.84702 0.113414 22-Feb-13 99.00 29.90 0.158 19.62 3.373 799.72 57273 244.47 8.8449 6.4752 69199 8.84784 0.122615 22-Feb-13 99.39 29.93 0.157 19.58 3.371 799.70 57201 243.27 8.8444 6.4675 69517 8.84727 0.116216 22-Feb-13 99.45 30.02 0.157 19.63 3.364 799.64 57000 242.29 8.8445 6.4447 69705 8.84738 0.117417 22-Feb-13 141.55 30.00 0.174 19.53 3.365 799.65 57588 174.60 8.8444 6.5112 99176 8.84735 0.1171 8.84729 0.0030 0.0012 99131 10318 22-Feb-13 141.85 29.95 0.173 19.64 3.369 799.68 57558 174.17 8.8439 6.5082 99277 8.84685 0.111419 22-Feb-13 141.84 29.89 0.173 19.57 3.374 799.72 57692 174.56 8.8444 6.5230 99134 8.84729 0.116420 22-Feb-13 141.66 29.89 0.173 19.70 3.374 799.72 57731 174.88 8.8446 6.5273 99007 8.84750 0.118821 22-Feb-13 141.94 29.88 0.173 19.52 3.375 799.73 57831 174.84 8.8443 6.5388 99173 8.84714 0.114822 22-Feb-13 141.77 29.86 0.173 19.70 3.376 799.74 57841 175.06 8.8447 6.5396 99020 8.84760 0.1200
Data analysis by the Pilot LabCalibration condition Others CommentsPD meter

Final Report on APMP.M.FF-K2.a
23
A.2. NMIA
Table A.2.a Averaged data
Averaged Data
Reynoldsnumber Liquid Kinematic
viscosity Density Flow rate Temperature Pressure K factor Base uncertainty DUT uncertaintyExpanded
Uncertaintyof K factor
Kf20 K
[-] [-] [ ×10-6
m2/s ][kg/m3] [m3/h] [oC] [MPa] [p/L] u [%] u [%] U (k =2) [%] [p/L] [%]
70,000 Norpar 12 1.730 745.760 51.970 22.580 0.200 8.8414 0.016 0.001 0.031 8.84215 0.0583
100,000 Norpar 12 1.630 743.070 72.160 26.270 0.206 8.8412 0.016 0.002 0.031 8.84303 0.0682
300,000 Norpar 12 1.610 742.340 207.790 27.270 0.212 8.8375 0.016 0.002 0.031 8.83962 0.0297
70,000 D 130 5.460 817.880 168.500 28.220 0.198 8.8412 0.016 0.001 0.031 8.84360 0.0747
100,000 D 130 5.150 816.360 226.040 30.470 0.196 8.8400 0.016 0.001 0.031 8.84305 0.0685

Final Report on APMP.M.FF-K2.a
24
Table A.2.b NMIA, Norpar 12, Jul. 2013
No Date Flowrate Temp. Pressure AmbientTemp.
KinematicViscosity Density Pulses Time K factor Volume Re Kf20 K Kf20avg S. D. of K uDUT Reavg S.D. of
ReK select-
Kavg
[ - ] [dd/mm/yy] [m3/h] [oC] [MPa] [oC][ ×10-6
m2/s ][kg/m3] [P] [s] [p/L] [m3] [ - ] [p/L] [%] [p/L] [%] [%] [-] [-] [%]
1 05-Jun-13 60.30 19.9100 0.205 16 1.81 747.710 8.8432 78552 8.84317 0.06992 05-Jun-13 61.47 26.1200 0.222 16 1.64 743.180 8.8410 88376 8.84279 0.06553 05-Jun-13 120.89 20.2900 0.209 16 1.80 747.440 8.8428 158356 8.84288 0.06664 05-Jun-13 120.21 26.4500 0.207 16 1.63 742.940 8.8410 173888 8.84288 0.06665 05-Jun-13 180.62 20.8800 0.213 16 1.78 747.010 8.8403 239256 8.84056 0.04026 05-Jun-13 243.39 21.6200 0.210 16 1.76 746.470 8.8383 326067 8.83877 0.02017 05-Jun-13 242.60 29.1600 0.219 16 1.56 740.960 8.8361 366676 8.83877 0.02008 05-Jun-13 51.97 22.5800 0.200 16 1.73 745.760 8.8414 70831 8.84215 0.0583 8.84210 0.0024 0.0010 70453 396 0.00069 05-Jun-13 52.00 22.6200 0.201 16 1.73 745.740 8.8415 70872 70k 8.84226 0.0596
10 05-Jun-13 49.06 25.9800 0.216 16 1.64 743.280 8.8406 70534 70k 8.84234 0.060511 05-Jun-13 49.05 26.0200 0.215 16 1.64 743.260 8.8404 70520 70k 8.84216 0.058312 05-Jun-13 46.26 29.2100 0.213 16 1.56 740.920 8.8392 69919 70k 8.84189 0.055313 05-Jun-13 46.34 29.2300 0.214 16 1.56 740.900 8.8391 70040 70k 8.84179 0.054214 05-Jun-13 75.26 22.4500 0.204 16 1.74 745.860 8.8421 101984 100k 8.84281 0.0658 8.84288 0.0013 0.0006 102689 1326 0.001615 05-Jun-13 75.20 22.4900 0.204 16 1.74 745.830 8.8420 101903 100k 8.84273 0.064816 05-Jun-13 72.21 26.2300 0.207 16 1.64 743.100 8.8411 103817 100k 8.84292 0.067017 05-Jun-13 72.16 26.2700 0.206 16 1.63 743.070 8.8412 104382 8.84303 0.068218 05-Jun-13 67.06 29.3800 0.221 16 1.56 740.790 8.8402 101357 100k 8.84294 0.067219 05-Jun-13 224.66 22.0500 0.210 16 1.75 746.150 8.8390 302694 300k 8.83960 0.0294 8.83969 0.0020 0.0008 304595 1096 -0.000820 05-Jun-13 224.57 22.3200 0.209 16 1.74 745.950 8.8390 304312 300k 8.83968 0.030321 05-Jun-13 216.07 25.0300 0.210 16 1.67 743.980 8.8380 305066 300k 8.83947 0.027922 05-Jun-13 207.79 27.2700 0.212 16 1.61 742.340 8.8375 304309 8.83962 0.029723 05-Jun-13 199.54 30.0100 0.213 16 1.54 740.330 8.8369 305510 300k 8.83982 0.031924 05-Jun-13 199.65 30.1900 0.213 16 1.54 740.200 8.8370 305679 300k 8.83997 0.0336
Reported in summary
Data analysis by the Pilot LabCalibration condition PD meter Others
300k, r=0.0001 Pul/L
Comments
70k, r=0.0001Pul/L
100k, r=0.0001 Pul/L
K factor based on average of 5 strokes of 60L piston prover
n/a n/a

Final Report on APMP.M.FF-K2.a
25
Table A.2.c NMIA, D130, Jul. 2013
No Date Flowrate Temp. Pressure AmbientTemp.
KinematicViscosity Density Pulses Time K factor Volume Re Kf20 K Kf20avg S. D. of K uDUT Reavg S.D. of Re K select-
Kavg
[ - ] [dd/mm/yy] [m3/h] [oC] [MPa] [oC][ ×10-6
m2/s ][kg/m3] [P] [s] [p/L] [m3] [ - ] [p/L] [%] [p/L] [%] [%] [-] [-] [%]
1 06-Jun-13 60.48 20.5100 0.206 15 6.80 823.090 8.8439 20971 8.84405 0.07982 06-Jun-13 120.26 20.8300 0.215 15 6.74 822.880 8.8440 42070 8.84424 0.08203 06-Jun-13 120.21 20.9100 0.214 15 6.72 822.830 8.8440 42178 8.84427 0.08224 06-Jun-13 183.10 21.3600 0.197 15 6.64 822.520 8.8427 65018 8.84310 0.06905 06-Jun-13 181.48 21.5500 0.198 15 6.60 822.390 8.8427 64834 8.84315 0.06966 06-Jun-13 244.99 22.6700 0.201 15 6.39 821.630 8.8417 90399 8.84248 0.06207 06-Jun-13 244.95 22.9600 0.201 15 6.33 821.440 8.8417 91241 8.84256 0.06308 06-Jun-13 170.89 27.9000 0.199 15 5.51 818.100 8.8416 73128 70k 8.84391 0.0781 8.84368 0.0023 0.0012 72827 262 -0.00099 06-Jun-13 168.51 28.1100 0.198 15 5.48 817.960 8.8414 72504 70k 8.84377 0.076610 06-Jun-13 168.50 28.2200 0.198 15 5.46 817.880 8.8412 72765 8.84360 0.074711 06-Jun-13 168.53 28.3400 0.198 15 5.45 817.800 8.8410 72912 70k 8.84343 0.072812 06-Jun-13 226.04 30.4700 0.196 15 5.15 816.360 8.8400 103489 8.84305 0.0685 8.84303 0.0006 0.0004 104450 925 0.000313 06-Jun-13 226.09 30.8400 0.197 15 5.10 816.110 8.8399 104527 100k 8.84306 0.068614 06-Jun-13 226.05 31.1800 0.196 15 5.06 815.880 8.8397 105334 100k 8.84296 0.0675
Data analysis by the Pilot LabCalibration condition PD meter Others Comments
70k, r = 0.0001 Pul/L
100k, r = 0.0001 Pul/L
Reported in summary
K factor based on average of 5 strokes of 60L piston prover
n/a n/a

Final Report on APMP.M.FF-K2.a
26
A.3 NMIJ
Table A.3.a Averaged data
Averaged Data
Reynoldsnumber Liquid Kinematic
viscosity Density Flow rate Temperature Pressure K factor Base uncertainty DUT uncertaintyExpanded
Uncertaintyof K factor
Kf20 K
[-] [-] [ ×10-6
m2/s ][kg/m3] [m3/h] [oC] [MPa] [p/L] u [%] u [%] U (k =2) [%] [p/L] [%]
70,000 Light oil 7.021 837.22 208.67 20.09 0.479 8.8455 0.015 0.0001 0.030 8.84548 0.0960
70,000 Light oil 6.051 833.80 179.98 25.08 0.462 8.8434 0.015 0.0002 0.030 8.84493 0.0897
70,000 Light oil 5.266 830.39 156.68 30.08 0.443 8.8420 0.015 0.0002 0.030 8.84490 0.0894
100,000 Light oil 7.002 837.15 298.10 20.18 0.465 8.8452 0.015 0.0003 0.030 8.84524 0.0932
100,000 Light oil 6.039 833.79 257.11 25.15 0.521 8.8434 0.015 0.0002 0.030 8.84487 0.0891
100,000 Light oil 5.258 830.38 224.200 30.135 0.491 8.842 0.015 0.0002 0.030 8.84466 0.0867
100,000 Kerosene 2.014 794.90 85.31 19.91 0.410 8.8458 0.015 0.0003 0.030 8.84578 0.0993
100,000 Kerosene 1.843 791.22 78.05 24.90 0.409 8.8437 0.015 0.0001 0.030 8.84515 0.0922
100,000 Kerosene 1.695 787.54 71.81 29.90 0.408 8.8419 0.015 0.0001 0.030 8.84481 0.0883
300,000 Kerosene 2.010 794.89 255.86 20.01 0.508 8.8413 0.015 0.0001 0.030 8.84129 0.0485
300,000 Kerosene 1.840 791.20 234.12 25.00 0.490 8.8397 0.015 0.0003 0.030 8.84115 0.0470
300,000 Kerosene 1.692 787.52 215.48 29.99 0.473 8.8382 0.015 0.0003 0.030 8.84109 0.0463
Final Report on APMP.M.FF-K2.a
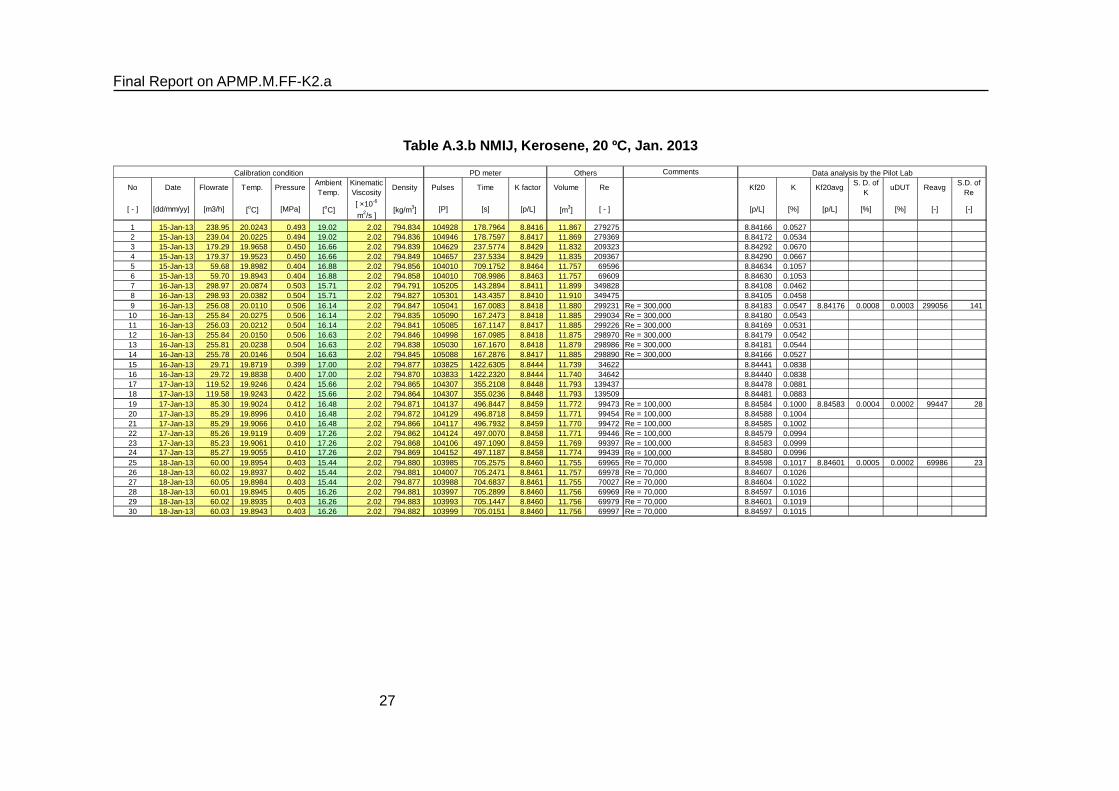
27
Table A.3.b NMIJ, Kerosene, 20 ºC, Jan. 2013
No Date Flowrate Temp. Pressure AmbientTemp.
KinematicViscosity Density Pulses Time K factor Volume Re Kf20 K Kf20avg S. D. of
K uDUT Reavg S.D. ofRe
[ - ] [dd/mm/yy] [m3/h] [oC] [MPa] [oC][ ×10-6
m2/s ][kg/m3] [P] [s] [p/L] [m3] [ - ] [p/L] [%] [p/L] [%] [%] [-] [-]
1 15-Jan-13 238.95 20.0243 0.493 19.02 2.02 794.834 104928 178.7964 8.8416 11.867 279275 8.84166 0.05272 15-Jan-13 239.04 20.0225 0.494 19.02 2.02 794.836 104946 178.7597 8.8417 11.869 279369 8.84172 0.05343 15-Jan-13 179.29 19.9658 0.450 16.66 2.02 794.839 104629 237.5774 8.8429 11.832 209323 8.84292 0.06704 15-Jan-13 179.37 19.9523 0.450 16.66 2.02 794.849 104657 237.5334 8.8429 11.835 209367 8.84290 0.06675 15-Jan-13 59.68 19.8982 0.404 16.88 2.02 794.856 104010 709.1752 8.8464 11.757 69596 8.84634 0.10576 15-Jan-13 59.70 19.8943 0.404 16.88 2.02 794.858 104010 708.9986 8.8463 11.757 69609 8.84630 0.10537 16-Jan-13 298.97 20.0874 0.503 15.71 2.02 794.791 105205 143.2894 8.8411 11.899 349828 8.84108 0.04628 16-Jan-13 298.93 20.0382 0.504 15.71 2.02 794.827 105301 143.4357 8.8410 11.910 349475 8.84105 0.04589 16-Jan-13 256.08 20.0110 0.506 16.14 2.02 794.847 105041 167.0083 8.8418 11.880 299231 8.84183 0.0547 8.84176 0.0008 0.0003 299056 141
10 16-Jan-13 255.84 20.0275 0.506 16.14 2.02 794.835 105090 167.2473 8.8418 11.885 299034 8.84180 0.054311 16-Jan-13 256.03 20.0212 0.504 16.14 2.02 794.841 105085 167.1147 8.8417 11.885 299226 8.84169 0.053112 16-Jan-13 255.84 20.0150 0.506 16.63 2.02 794.846 104998 167.0985 8.8418 11.875 298970 8.84179 0.054213 16-Jan-13 255.81 20.0238 0.504 16.63 2.02 794.838 105030 167.1670 8.8418 11.879 298986 8.84181 0.054414 16-Jan-13 255.78 20.0146 0.504 16.63 2.02 794.845 105088 167.2876 8.8417 11.885 298890 8.84166 0.052715 16-Jan-13 29.71 19.8719 0.399 17.00 2.02 794.877 103825 1422.6305 8.8444 11.739 34622 8.84441 0.083816 16-Jan-13 29.72 19.8838 0.400 17.00 2.02 794.870 103833 1422.2320 8.8444 11.740 34642 8.84440 0.083817 17-Jan-13 119.52 19.9246 0.424 15.66 2.02 794.865 104307 355.2108 8.8448 11.793 139437 8.84478 0.088118 17-Jan-13 119.58 19.9243 0.422 15.66 2.02 794.864 104307 355.0236 8.8448 11.793 139509 8.84481 0.088319 17-Jan-13 85.30 19.9024 0.412 16.48 2.02 794.871 104137 496.8447 8.8459 11.772 99473 8.84584 0.1000 8.84583 0.0004 0.0002 99447 2820 17-Jan-13 85.29 19.8996 0.410 16.48 2.02 794.872 104129 496.8718 8.8459 11.771 99454 8.84588 0.100421 17-Jan-13 85.29 19.9066 0.410 16.48 2.02 794.866 104117 496.7932 8.8459 11.770 99472 8.84585 0.100222 17-Jan-13 85.26 19.9119 0.409 17.26 2.02 794.862 104124 497.0070 8.8458 11.771 99446 8.84579 0.099423 17-Jan-13 85.23 19.9061 0.410 17.26 2.02 794.868 104106 497.1090 8.8459 11.769 99397 8.84583 0.099924 17-Jan-13 85.27 19.9055 0.410 17.26 2.02 794.869 104152 497.1187 8.8458 11.774 99439 8.84580 0.099625 18-Jan-13 60.00 19.8954 0.403 15.44 2.02 794.880 103985 705.2575 8.8460 11.755 69965 8.84598 0.1017 8.84601 0.0005 0.0002 69986 2326 18-Jan-13 60.02 19.8937 0.402 15.44 2.02 794.881 104007 705.2471 8.8461 11.757 69978 8.84607 0.102627 18-Jan-13 60.05 19.8984 0.403 15.44 2.02 794.877 103988 704.6837 8.8461 11.755 70027 8.84604 0.102228 18-Jan-13 60.01 19.8945 0.405 16.26 2.02 794.881 103997 705.2899 8.8460 11.756 69969 8.84597 0.101629 18-Jan-13 60.02 19.8935 0.403 16.26 2.02 794.883 103993 705.1447 8.8460 11.756 69979 8.84601 0.101930 18-Jan-13 60.03 19.8943 0.403 16.26 2.02 794.882 103999 705.0151 8.8460 11.756 69997 8.84597 0.1015
Data analysis by the Pilot Lab
Re = 70,000Re = 70,000
Re = 100,000Re = 100,000Re = 70,000Re = 70,000Re = 70,000Re = 70,000
Re = 100,000Re = 100,000Re = 100,000Re = 100,000
Re = 300,000Re = 300,000Re = 300,000Re = 300,000
Comments
Re = 300,000Re = 300,000
Calibration condition PD meter Others

Final Report on APMP.M.FF-K2.a
28
Table A.3.c NMIJ, Light oil , 20 ºC, Jan. 2013
No Date Flowrate Temp. Pressure AmbientTemp.
KinematicViscosity Density Pulses Time K factor Volume Re Kf20 K Kf20avg S. D. of
K uDUT Reavg S.D. ofRe
[ - ] [dd/mm/yy] [m3/h] [oC] [MPa] [oC][ ×10-6
m2/s ][kg/m3] [P] [s] [p/L] [m3] [ - ] [p/L] [%] [p/L] [%] [%] [-] [-]
1 07-Jan-13 240.73 20.1366 0.512 15.88 6.98 837.186 99804 168.7418 8.8451 11.284 81308 8.84513 0.09202 07-Jan-13 240.68 20.1219 0.512 15.88 6.98 837.196 99807 168.7775 8.8452 11.284 81256 8.84523 0.09323 07-Jan-13 300.80 20.1914 0.458 15.88 6.97 837.113 100052 135.3746 8.8452 11.312 101771 8.84522 0.09314 07-Jan-13 300.59 20.2020 0.458 15.88 6.97 837.106 100112 135.5517 8.8452 11.318 101732 8.84526 0.09355 07-Jan-13 180.41 20.0398 0.462 15.88 7.00 837.219 99447 224.3394 8.8455 11.243 60754 8.84556 0.09686 07-Jan-13 180.34 20.0664 0.463 17.34 7.00 837.202 99446 224.4289 8.8455 11.242 60780 8.84554 0.09677 07-Jan-13 120.23 20.0441 0.428 17.30 7.00 837.195 99095 335.4306 8.8456 11.203 40495 8.84560 0.09738 07-Jan-13 120.22 20.0445 0.429 17.30 7.00 837.195 99119 335.5605 8.8455 11.206 40489 8.84555 0.09679 08-Jan-13 240.67 20.1142 0.509 16.18 6.99 837.200 99800 168.7743 8.8452 11.283 81232 8.84520 0.092810 08-Jan-13 240.62 20.1156 0.509 16.18 6.99 837.199 99739 168.7024 8.8453 11.276 81220 8.84531 0.094111 08-Jan-13 300.66 20.1899 0.461 17.12 6.97 837.117 100102 135.5068 8.8451 11.317 101719 8.84517 0.092412 08-Jan-13 300.44 20.1932 0.459 17.12 6.97 837.114 99992 135.4560 8.8452 11.305 101654 8.84527 0.093613 08-Jan-13 180.33 20.0427 0.466 17.93 7.00 837.221 99436 224.4109 8.8455 11.241 60734 8.84555 0.096714 08-Jan-13 180.35 20.0688 0.462 17.93 7.00 837.201 99474 224.4765 8.8456 11.246 60788 8.84560 0.097315 08-Jan-13 60.02 20.0107 0.406 18.33 7.01 837.204 98783 669.9289 8.8449 11.168 20192 8.84490 0.089416 09-Jan-13 297.25 20.1984 0.472 16.26 6.97 837.119 100122 137.0922 8.8451 11.319 100589 8.84512 0.0919 8.84517 0.0013 0.0005 100469 9317 09-Jan-13 297.33 20.1754 0.473 16.26 6.97 837.135 100141 137.0783 8.8451 11.322 100548 8.84510 0.091718 09-Jan-13 297.25 20.1729 0.472 16.26 6.97 837.136 100071 137.0231 8.8449 11.314 100511 8.84500 0.090519 09-Jan-13 296.93 20.1761 0.473 17.06 6.97 837.135 100060 137.1518 8.8452 11.312 100413 8.84524 0.093320 09-Jan-13 296.77 20.1852 0.474 17.06 6.97 837.129 100045 137.2036 8.8452 11.311 100388 8.84522 0.093021 09-Jan-13 296.78 20.1770 0.474 17.06 6.97 837.134 100071 137.2352 8.8453 11.314 100365 8.84532 0.094222 09-Jan-13 29.84 19.9797 0.400 17.87 7.01 837.220 98603 1345.0327 8.8433 11.150 10031 8.84325 0.070723 09-Jan-13 29.85 19.9936 0.400 17.87 7.01 837.210 98606 1344.7164 8.8433 11.150 10038 8.84332 0.071524 10-Jan-13 208.27 20.0967 0.482 16.11 6.99 837.196 99638 194.7073 8.8453 11.265 70260 8.84536 0.0946 8.84538 0.0003 0.0001 70221 2725 10-Jan-13 208.18 20.0986 0.481 16.11 6.99 837.194 99559 194.6406 8.8453 11.256 70232 8.84537 0.094726 10-Jan-13 208.22 20.0936 0.483 16.11 6.99 837.198 99570 194.6209 8.8454 11.257 70236 8.84538 0.094827 10-Jan-13 208.16 20.0932 0.483 17.35 6.99 837.198 99704 194.9426 8.8453 11.272 70214 8.84537 0.094728 10-Jan-13 208.12 20.0895 0.481 17.35 6.99 837.200 99644 194.8561 8.8454 11.265 70194 8.84539 0.094929 10-Jan-13 208.12 20.0872 0.481 17.35 6.99 837.201 99615 194.8039 8.8454 11.262 70188 8.84543 0.095430 10-Jan-13 60.04 19.9883 0.404 17.92 7.01 837.220 98809 669.8577 8.8449 11.171 20186 8.84493 0.089831 10-Jan-13 60.05 20.0000 0.404 17.92 7.01 837.212 98792 669.6152 8.8449 11.169 20197 8.84490 0.0894
Data analysis by the Pilot Lab
Re = 70,000
Re = 70,000Re = 70,000Re = 70,000Re = 70,000
Re = 100,000Re = 100,000Re = 100,000Re = 100,000Re = 100,000Re = 100,000
CommentsCalibration condition PD meter Others

Final Report on APMP.M.FF-K2.a
29
Table A.3.d NMIJ, Kerosene, 20 ºC, Apr. 2013
No Date Flowrate Temp. Pressure AmbientTemp.
KinematicViscosity Density Pulses Time K factor Volume Re Kf20 K Kf20avg S. D. of
K uDUT Reavg S.D. ofRe
[ - ] [dd/mm/yy] [m3/h] [oC] [MPa] [oC][ ×10-6
m2/s ][kg/m3] [P] [s] [p/L] [m3] [ - ] [p/L] [%] [p/L] [%] [%] [-] [-]
1 11-Apr-13 238.78 20.0229 0.495 19.04 1.99 794.429 104953 178.9636 8.8416 11.870 283231 8.84161 0.05222 11-Apr-13 238.74 20.0214 0.494 19.04 1.99 794.430 104939 178.9725 8.8416 11.869 283171 8.84163 0.05243 11-Apr-13 179.05 19.9312 0.453 19.76 1.99 794.458 104637 237.9171 8.8429 11.833 212022 8.84289 0.06674 11-Apr-13 178.99 19.9780 0.454 19.76 1.99 794.425 104678 238.0816 8.8429 11.837 212139 8.84290 0.06685 11-Apr-13 59.60 19.9102 0.405 20.18 1.99 794.442 104062 710.4997 8.8462 11.763 70554 8.84615 0.10366 11-Apr-13 59.60 19.8991 0.406 20.18 1.99 794.451 104065 710.6006 8.8461 11.764 70533 8.84605 0.10247 11-Apr-13 29.69 19.8998 0.401 20.12 1.99 794.449 103880 1424.1111 8.8441 11.746 35140 8.84405 0.07988 11-Apr-13 29.70 19.9022 0.400 20.12 1.99 794.447 103885 1423.9285 8.8443 11.746 35147 8.84427 0.08239 15-Apr-13 297.75 20.0612 0.509 20.54 1.99 794.411 105222 143.9006 8.8409 11.902 353420 8.84094 0.044610 15-Apr-13 297.85 20.0514 0.509 20.54 1.99 794.418 105362 144.0405 8.8410 11.917 353479 8.84104 0.045711 15-Apr-13 253.10 19.9953 0.504 20.76 1.99 794.457 105054 168.9995 8.8418 11.881 300062 8.84178 0.0541 8.84180 0.0007 0.0003 300064 10712 15-Apr-13 252.86 20.0108 0.504 20.76 1.99 794.445 105016 169.0983 8.8417 11.877 299864 8.84174 0.053613 15-Apr-13 253.05 20.0188 0.504 20.76 1.99 794.440 105099 169.1027 8.8419 11.886 300133 8.84186 0.055014 15-Apr-13 253.02 20.0125 0.505 21.17 1.99 794.446 105136 169.1831 8.8419 11.891 300061 8.84187 0.055115 15-Apr-13 253.07 20.0219 0.505 21.17 1.99 794.439 105064 169.0354 8.8417 11.883 300174 8.84172 0.053416 15-Apr-13 253.00 20.0231 0.505 21.17 1.99 794.438 104996 168.9745 8.8418 11.875 300091 8.84183 0.054617 16-Apr-13 119.22 19.9199 0.422 20.09 1.99 794.462 104352 356.2612 8.8447 11.798 141149 8.84467 0.086818 16-Apr-13 119.29 19.9321 0.423 20.09 1.99 794.455 104395 356.1966 8.8448 11.803 141262 8.84482 0.088519 16-Apr-13 84.57 19.9091 0.412 20.58 1.99 794.464 104197 501.4415 8.8456 11.779 100104 8.84553 0.0966 8.84551 0.0003 0.0001 100089 2720 16-Apr-13 84.56 19.9074 0.412 20.58 1.99 794.465 104159 501.3085 8.8455 11.775 100091 8.84551 0.096321 16-Apr-13 84.56 19.9124 0.412 20.58 1.99 794.461 104194 501.5104 8.8455 11.779 100094 8.84550 0.096222 16-Apr-13 84.59 19.9108 0.412 20.77 1.99 794.462 104160 501.1671 8.8455 11.775 100127 8.84552 0.096423 16-Apr-13 84.54 19.9051 0.413 20.77 1.99 794.468 104165 501.4421 8.8455 11.776 100067 8.84546 0.095724 16-Apr-13 84.51 19.9196 0.412 20.77 1.99 794.457 104185 501.7438 8.8455 11.778 100051 8.84552 0.096525 17-Apr-13 59.17 19.8976 0.407 20.17 1.99 794.476 104050 715.6063 8.8461 11.762 70027 8.84610 0.1030 8.84619 0.0006 0.0002 70012 1526 17-Apr-13 59.15 19.9054 0.407 20.17 1.99 794.471 104059 715.8856 8.8462 11.763 70015 8.84621 0.104227 17-Apr-13 59.17 19.9037 0.407 20.17 1.99 794.472 104051 715.6433 8.8462 11.762 70031 8.84619 0.104028 17-Apr-13 59.15 19.8996 0.404 20.75 1.99 794.473 104056 715.9085 8.8462 11.763 70003 8.84617 0.103729 17-Apr-13 59.14 19.9065 0.403 20.75 1.99 794.467 104051 715.9647 8.8463 11.762 70003 8.84626 0.104830 17-Apr-13 59.15 19.8962 0.404 20.75 1.99 794.475 104032 715.7889 8.8462 11.760 69994 8.84621 0.1042
Data analysis by the Pilot Lab
Re = 70,000Re = 70,000
Re = 100,000Re = 100,000Re = 70,000Re = 70,000Re = 70,000Re = 70,000
Re = 100,000Re = 100,000Re = 100,000Re = 100,000
Re = 300,000Re = 300,000Re = 300,000Re = 300,000Re = 300,000Re = 300,000
CommentsCalibration condition PD meter Others
Final Report on APMP.M.FF-K2.a
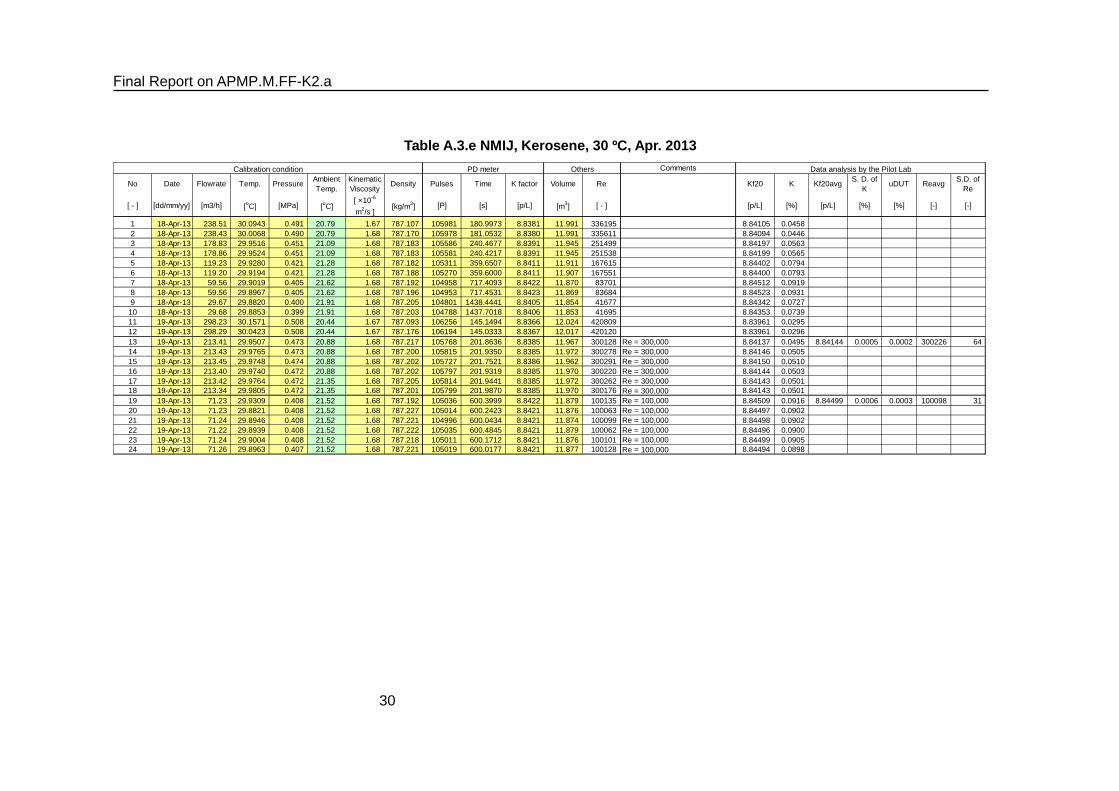
30
Table A.3.e NMIJ, Kerosene, 30 ºC, Apr. 2013
No Date Flowrate Temp. Pressure AmbientTemp.
KinematicViscosity Density Pulses Time K factor Volume Re Kf20 K Kf20avg S. D. of
K uDUT Reavg S.D. ofRe
[ - ] [dd/mm/yy] [m3/h] [oC] [MPa] [oC][ ×10-6
m2/s ][kg/m3] [P] [s] [p/L] [m3] [ - ] [p/L] [%] [p/L] [%] [%] [-] [-]
1 18-Apr-13 238.51 30.0943 0.491 20.79 1.67 787.107 105981 180.9973 8.8381 11.991 336195 8.84105 0.04582 18-Apr-13 238.43 30.0068 0.490 20.79 1.68 787.170 105978 181.0532 8.8380 11.991 335611 8.84094 0.04463 18-Apr-13 178.83 29.9516 0.451 21.09 1.68 787.183 105586 240.4677 8.8391 11.945 251499 8.84197 0.05634 18-Apr-13 178.86 29.9524 0.451 21.09 1.68 787.183 105581 240.4217 8.8391 11.945 251538 8.84199 0.05655 18-Apr-13 119.23 29.9280 0.421 21.28 1.68 787.182 105311 359.6507 8.8411 11.911 167615 8.84402 0.07946 18-Apr-13 119.20 29.9194 0.421 21.28 1.68 787.188 105270 359.6000 8.8411 11.907 167551 8.84400 0.07937 18-Apr-13 59.56 29.9019 0.405 21.62 1.68 787.192 104958 717.4093 8.8422 11.870 83701 8.84512 0.09198 18-Apr-13 59.56 29.8967 0.405 21.62 1.68 787.196 104953 717.4531 8.8423 11.869 83684 8.84523 0.09319 18-Apr-13 29.67 29.8820 0.400 21.91 1.68 787.205 104801 1438.4441 8.8405 11.854 41677 8.84342 0.0727
10 18-Apr-13 29.68 29.8853 0.399 21.91 1.68 787.203 104788 1437.7018 8.8406 11.853 41695 8.84353 0.073911 19-Apr-13 298.23 30.1571 0.508 20.44 1.67 787.093 106256 145.1494 8.8366 12.024 420809 8.83961 0.029512 19-Apr-13 298.29 30.0423 0.508 20.44 1.67 787.176 106194 145.0333 8.8367 12.017 420120 8.83961 0.029613 19-Apr-13 213.41 29.9507 0.473 20.88 1.68 787.217 105768 201.8636 8.8385 11.967 300128 8.84137 0.0495 8.84144 0.0005 0.0002 300226 6414 19-Apr-13 213.43 29.9765 0.473 20.88 1.68 787.200 105815 201.9350 8.8385 11.972 300278 8.84146 0.050515 19-Apr-13 213.45 29.9748 0.474 20.88 1.68 787.202 105727 201.7521 8.8386 11.962 300291 8.84150 0.051016 19-Apr-13 213.40 29.9740 0.472 20.88 1.68 787.202 105797 201.9319 8.8385 11.970 300220 8.84144 0.050317 19-Apr-13 213.42 29.9764 0.472 21.35 1.68 787.205 105814 201.9441 8.8385 11.972 300262 8.84143 0.050118 19-Apr-13 213.34 29.9805 0.472 21.35 1.68 787.201 105799 201.9870 8.8385 11.970 300176 8.84143 0.050119 19-Apr-13 71.23 29.9309 0.408 21.52 1.68 787.192 105036 600.3999 8.8422 11.879 100135 8.84509 0.0916 8.84499 0.0006 0.0003 100098 3120 19-Apr-13 71.23 29.8821 0.408 21.52 1.68 787.227 105014 600.2423 8.8421 11.876 100063 8.84497 0.090221 19-Apr-13 71.24 29.8946 0.408 21.52 1.68 787.221 104996 600.0434 8.8421 11.874 100099 8.84498 0.090222 19-Apr-13 71.22 29.8939 0.408 21.52 1.68 787.222 105035 600.4845 8.8421 11.879 100062 8.84496 0.090023 19-Apr-13 71.24 29.9004 0.408 21.52 1.68 787.218 105011 600.1712 8.8421 11.876 100101 8.84499 0.090524 19-Apr-13 71.26 29.8963 0.407 21.52 1.68 787.221 105019 600.0177 8.8421 11.877 100128 8.84494 0.0898
Data analysis by the Pilot Lab
Re = 100,000Re = 100,000Re = 100,000Re = 100,000Re = 100,000Re = 100,000
Re = 300,000Re = 300,000Re = 300,000Re = 300,000Re = 300,000Re = 300,000
CommentsCalibration condition PD meter Others
Final Report on APMP.M.FF-K2.a
31
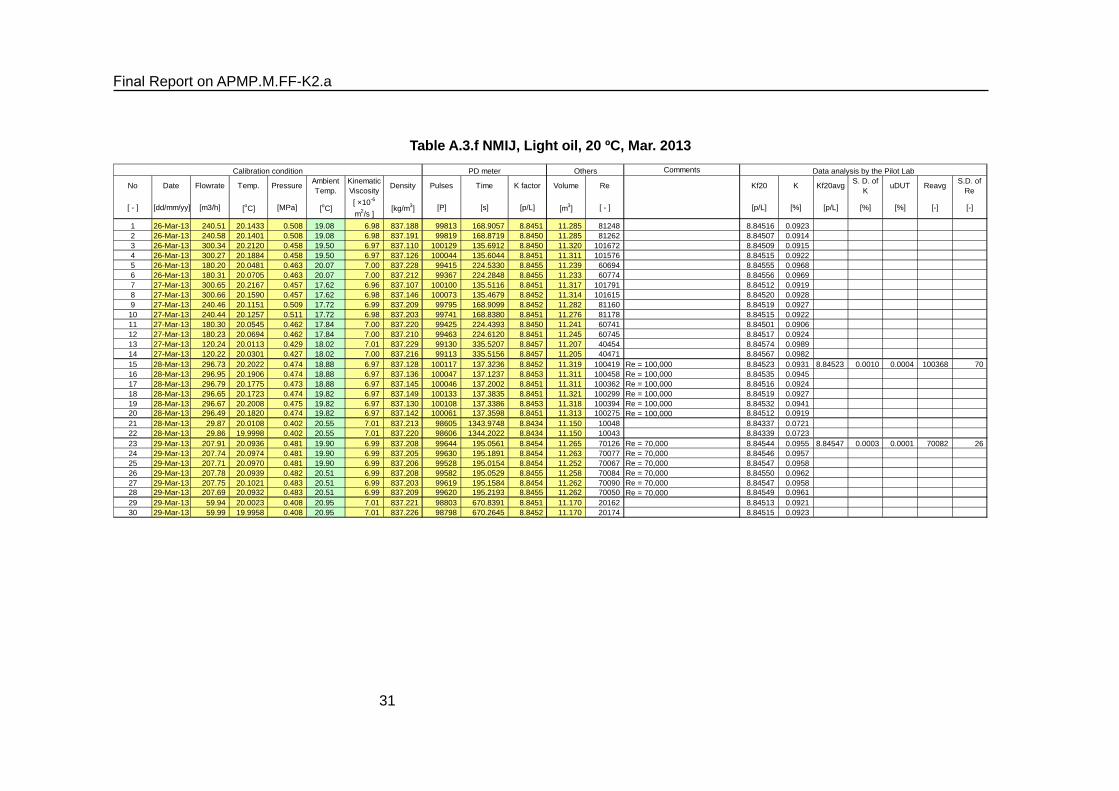
Table A.3.f NMIJ, Light oil, 20 ºC, Mar. 2013
No Date Flowrate Temp. Pressure AmbientTemp.
KinematicViscosity Density Pulses Time K factor Volume Re Kf20 K Kf20avg S. D. of
K uDUT Reavg S.D. ofRe
[ - ] [dd/mm/yy] [m3/h] [oC] [MPa] [oC][ ×10-6
m2/s ][kg/m3] [P] [s] [p/L] [m3] [ - ] [p/L] [%] [p/L] [%] [%] [-] [-]
1 26-Mar-13 240.51 20.1433 0.508 19.08 6.98 837.188 99813 168.9057 8.8451 11.285 81248 8.84516 0.09232 26-Mar-13 240.58 20.1401 0.508 19.08 6.98 837.191 99819 168.8719 8.8450 11.285 81262 8.84507 0.09143 26-Mar-13 300.34 20.2120 0.458 19.50 6.97 837.110 100129 135.6912 8.8450 11.320 101672 8.84509 0.09154 26-Mar-13 300.27 20.1884 0.458 19.50 6.97 837.126 100044 135.6044 8.8451 11.311 101576 8.84515 0.09225 26-Mar-13 180.20 20.0481 0.463 20.07 7.00 837.228 99415 224.5330 8.8455 11.239 60694 8.84555 0.09686 26-Mar-13 180.31 20.0705 0.463 20.07 7.00 837.212 99367 224.2848 8.8455 11.233 60774 8.84556 0.09697 27-Mar-13 300.65 20.2167 0.457 17.62 6.96 837.107 100100 135.5116 8.8451 11.317 101791 8.84512 0.09198 27-Mar-13 300.66 20.1590 0.457 17.62 6.98 837.146 100073 135.4679 8.8452 11.314 101615 8.84520 0.09289 27-Mar-13 240.46 20.1151 0.509 17.72 6.99 837.209 99795 168.9099 8.8452 11.282 81160 8.84519 0.0927
10 27-Mar-13 240.44 20.1257 0.511 17.72 6.98 837.203 99741 168.8380 8.8451 11.276 81178 8.84515 0.092211 27-Mar-13 180.30 20.0545 0.462 17.84 7.00 837.220 99425 224.4393 8.8450 11.241 60741 8.84501 0.090612 27-Mar-13 180.23 20.0694 0.462 17.84 7.00 837.210 99463 224.6120 8.8451 11.245 60745 8.84517 0.092413 27-Mar-13 120.24 20.0113 0.429 18.02 7.01 837.229 99130 335.5207 8.8457 11.207 40454 8.84574 0.098914 27-Mar-13 120.22 20.0301 0.427 18.02 7.00 837.216 99113 335.5156 8.8457 11.205 40471 8.84567 0.098215 28-Mar-13 296.73 20.2022 0.474 18.88 6.97 837.128 100117 137.3236 8.8452 11.319 100419 8.84523 0.0931 8.84523 0.0010 0.0004 100368 7016 28-Mar-13 296.95 20.1906 0.474 18.88 6.97 837.136 100047 137.1237 8.8453 11.311 100458 8.84535 0.094517 28-Mar-13 296.79 20.1775 0.473 18.88 6.97 837.145 100046 137.2002 8.8451 11.311 100362 8.84516 0.092418 28-Mar-13 296.65 20.1723 0.474 19.82 6.97 837.149 100133 137.3835 8.8451 11.321 100299 8.84519 0.092719 28-Mar-13 296.67 20.2008 0.475 19.82 6.97 837.130 100108 137.3386 8.8453 11.318 100394 8.84532 0.094120 28-Mar-13 296.49 20.1820 0.474 19.82 6.97 837.142 100061 137.3598 8.8451 11.313 100275 8.84512 0.091921 28-Mar-13 29.87 20.0108 0.402 20.55 7.01 837.213 98605 1343.9748 8.8434 11.150 10048 8.84337 0.072122 28-Mar-13 29.86 19.9998 0.402 20.55 7.01 837.220 98606 1344.2022 8.8434 11.150 10043 8.84339 0.072323 29-Mar-13 207.91 20.0936 0.481 19.90 6.99 837.208 99644 195.0561 8.8454 11.265 70126 8.84544 0.0955 8.84547 0.0003 0.0001 70082 2624 29-Mar-13 207.74 20.0974 0.481 19.90 6.99 837.205 99630 195.1891 8.8454 11.263 70077 8.84546 0.095725 29-Mar-13 207.71 20.0970 0.481 19.90 6.99 837.206 99528 195.0154 8.8454 11.252 70067 8.84547 0.095826 29-Mar-13 207.78 20.0939 0.482 20.51 6.99 837.208 99582 195.0529 8.8455 11.258 70084 8.84550 0.096227 29-Mar-13 207.75 20.1021 0.483 20.51 6.99 837.203 99619 195.1584 8.8454 11.262 70090 8.84547 0.095828 29-Mar-13 207.69 20.0932 0.483 20.51 6.99 837.209 99620 195.2193 8.8455 11.262 70050 8.84549 0.096129 29-Mar-13 59.94 20.0023 0.408 20.95 7.01 837.221 98803 670.8391 8.8451 11.170 20162 8.84513 0.092130 29-Mar-13 59.99 19.9958 0.408 20.95 7.01 837.226 98798 670.2645 8.8452 11.170 20174 8.84515 0.0923
Data analysis by the Pilot Lab
Re = 70,000Re = 70,000
Re = 70,000Re = 70,000Re = 70,000Re = 70,000
Re = 100,000Re = 100,000Re = 100,000Re = 100,000Re = 100,000Re = 100,000
CommentsCalibration condition PD meter Others

Final Report on APMP.M.FF-K2.a
32
Table A.3.g NMIJ, Light oil, 20 ºC, Jul. 2013
No Date Flowrate Temp. Pressure AmbientTemp.
KinematicViscosity Density Pulses Time K factor Volume Re Kf20 K Kf20avg S. D. of
K uDUT Reavg S.D. ofRe
[ - ] [dd/mm/yy] [m3/h] [oC] [MPa] [oC][ ×10-6
m2/s ][kg/m3] [P] [s] [p/L] [m3] [ - ] [p/L] [%] [p/L] [%] [%] [-] [-]
1 01-Jul-13 239.88 20.1004 0.510 22.48 7.02 837.233 99731 169.2076 8.8454 11.275 80577 8.84544 0.09552 01-Jul-13 239.84 20.1250 0.508 22.53 7.01 837.214 99764 169.2905 8.8454 11.279 80625 8.84540 0.09513 01-Jul-13 299.81 20.1888 0.458 22.53 7.00 837.139 100091 135.8753 8.8452 11.316 100982 8.84528 0.09374 01-Jul-13 299.61 20.1887 0.459 22.53 7.00 837.140 100038 135.8906 8.8454 11.310 100915 8.84548 0.09605 02-Jul-13 180.04 20.0526 0.461 22.19 7.03 837.231 99431 224.7798 8.8451 11.241 60386 8.84511 0.09186 02-Jul-13 179.97 20.0731 0.462 22.19 7.03 837.217 99445 224.8916 8.8451 11.243 60403 8.84513 0.09207 02-Jul-13 119.94 20.0251 0.427 22.46 7.04 837.228 99144 336.4230 8.8456 11.208 40194 8.84564 0.09788 02-Jul-13 119.97 20.0353 0.425 22.46 7.03 837.219 99098 336.1772 8.8456 11.203 40217 8.84560 0.09739 02-Jul-13 59.93 20.0113 0.409 22.75 7.04 837.226 98790 670.9701 8.8451 11.169 20074 8.84509 0.091510 02-Jul-13 59.94 20.0006 0.404 22.75 7.04 837.230 98807 670.9449 8.8450 11.171 20071 8.84502 0.090811 02-Jul-13 29.87 20.0064 0.399 22.85 7.04 837.228 98603 1343.6553 8.8437 11.150 10005 8.84367 0.075412 02-Jul-13 29.87 20.0091 0.399 22.85 7.04 837.226 98605 1343.7115 8.8436 11.150 10006 8.84364 0.075213 03-Jul-13 298.25 20.1751 0.466 21.91 7.00 837.153 100110 136.6156 8.8451 11.318 100413 8.84517 0.0924 8.84524 0.0008 0.0003 100377 3914 03-Jul-13 298.09 20.1702 0.465 21.91 7.00 837.156 100105 136.6799 8.8451 11.317 100345 8.84519 0.092715 03-Jul-13 297.98 20.1790 0.465 21.91 7.00 837.150 100146 136.7839 8.8453 11.322 100336 8.84533 0.094316 03-Jul-13 298.19 20.1831 0.464 22.19 7.00 837.147 100133 136.6709 8.8451 11.321 100420 8.84520 0.092817 03-Jul-13 297.98 20.1815 0.465 22.19 7.00 837.149 100075 136.6880 8.8453 11.314 100343 8.84533 0.094318 03-Jul-13 298.13 20.1855 0.465 22.19 7.00 837.145 100035 136.5686 8.8451 11.309 100404 8.84520 0.092819 03-Jul-13 208.89 20.0792 0.478 22.43 7.02 837.226 99541 193.9396 8.8454 11.253 70121 8.84545 0.0957 8.84547 0.0004 0.0002 70077 6820 03-Jul-13 208.40 20.0897 0.476 22.43 7.02 837.218 99576 194.4642 8.8455 11.257 69979 8.84552 0.096421 03-Jul-13 208.58 20.1012 0.479 22.43 7.02 837.212 99591 194.3291 8.8454 11.259 70063 8.84545 0.095622 03-Jul-13 208.63 20.0965 0.481 22.42 7.02 837.217 99612 194.3203 8.8455 11.261 70071 8.84548 0.096023 03-Jul-13 208.93 20.1000 0.480 22.42 7.02 837.216 99561 193.9442 8.8455 11.256 70178 8.84549 0.096124 03-Jul-13 208.61 20.0883 0.481 22.42 7.02 837.224 99657 194.4250 8.8455 11.266 70047 8.84549 0.0960
Data analysis by the Pilot Lab
Re = 70,000Re = 70,000Re = 70,000Re = 70,000Re = 70,000Re = 70,000
Re = 100,000Re = 100,000Re = 100,000Re = 100,000Re = 100,000Re = 100,000
CommentsCalibration condition PD meter Others

Final Report on APMP.M.FF-K2.a
33
Table A.3.h NMIJ, Light oil, 25 ºC, Jul. 2013
No Date Flowrate Temp. Pressure AmbientTemp.
KinematicViscosity Density Pulses Time K factor Volume Re Kf20 K Kf20avg S. D. of
K uDUT Reavg S.D. ofRe
[ - ] [dd/mm/yy] [m3/h] [oC] [MPa] [oC][ ×10-6
m2/s ][kg/m3] [P] [s] [p/L] [m3] [ - ] [p/L] [%] [p/L] [%] [%] [-] [-]
1 04-Jul-13 239.91 25.1357 0.506 22.04 6.04 833.794 100189 169.9989 8.8434 11.329 93627 8.84493 0.08972 04-Jul-13 239.73 25.1365 0.507 22.04 6.04 833.794 100138 170.0469 8.8434 11.323 93555 8.84487 0.08913 04-Jul-13 299.92 25.2068 0.460 22.22 6.03 833.715 100480 136.3837 8.8432 11.362 117285 8.84468 0.08694 04-Jul-13 299.88 25.1965 0.460 22.22 6.03 833.723 100543 136.4874 8.8432 11.369 117234 8.84474 0.08765 04-Jul-13 179.99 25.0744 0.458 22.25 6.05 833.805 99800 225.7120 8.8434 11.285 70119 8.84486 0.08896 04-Jul-13 179.98 25.0840 0.458 22.25 6.05 833.798 99835 225.8110 8.8434 11.289 70132 8.84493 0.08977 04-Jul-13 119.97 25.0445 0.427 22.46 6.06 833.804 99499 337.6028 8.8440 11.250 46695 8.84546 0.09578 04-Jul-13 120.04 25.0530 0.427 22.46 6.06 833.799 99476 337.3367 8.8439 11.248 46733 8.84540 0.09509 04-Jul-13 59.91 25.0312 0.407 22.63 6.06 833.803 99184 673.9044 8.8434 11.216 23311 8.84485 0.0888
10 04-Jul-13 59.94 25.0222 0.407 22.63 6.06 833.809 99188 673.5889 8.8434 11.216 23317 8.84485 0.088811 05-Jul-13 257.21 25.1728 0.522 22.09 6.04 833.779 100184 158.5617 8.8434 11.329 100482 8.84493 0.0898 8.84487 0.0005 0.0002 100380 5512 05-Jul-13 257.13 25.1482 0.521 22.09 6.04 833.795 100187 158.6126 8.8434 11.329 100382 8.84491 0.089513 05-Jul-13 257.10 25.1450 0.522 22.09 6.04 833.799 100201 158.6573 8.8433 11.331 100360 8.84483 0.088614 05-Jul-13 257.15 25.1457 0.521 22.27 6.04 833.797 100186 158.5985 8.8434 11.329 100383 8.84489 0.089315 05-Jul-13 256.98 25.1501 0.522 22.27 6.04 833.795 100260 158.8219 8.8433 11.337 100329 8.84484 0.088816 05-Jul-13 257.06 25.1436 0.521 22.27 6.04 833.799 100197 158.6730 8.8433 11.330 100342 8.84481 0.088417 05-Jul-13 29.86 25.0107 0.398 22.61 6.06 833.811 98986 1349.5990 8.8416 11.195 11612 8.84309 0.068918 05-Jul-13 29.88 25.0148 0.398 22.61 6.06 833.808 98988 1348.8109 8.8416 11.196 11621 8.84311 0.069119 08-Jul-13 180.00 25.0759 0.462 23.33 6.05 833.809 99806 225.7127 8.8435 11.286 70126 8.84497 0.0902 8.84493 0.0005 0.0003 70136 4820 08-Jul-13 180.12 25.0908 0.461 23.33 6.05 833.798 99785 225.5259 8.8434 11.284 70200 8.84489 0.089221 08-Jul-13 180.06 25.0953 0.461 23.33 6.05 833.795 99791 225.6119 8.8435 11.284 70186 8.84494 0.089822 08-Jul-13 179.86 25.0856 0.463 23.84 6.05 833.803 99877 226.0564 8.8435 11.294 70088 8.84499 0.090423 08-Jul-13 179.85 25.0848 0.461 23.84 6.05 833.801 99797 225.8878 8.8434 11.285 70084 8.84488 0.089224 08-Jul-13 180.02 25.0756 0.463 23.84 6.05 833.809 99783 225.6433 8.8434 11.283 70131 8.84492 0.0896
Data analysis by the Pilot Lab
Re = 70,000Re = 70,000Re = 70,000Re = 70,000Re = 70,000Re = 70,000
Re = 100,000Re = 100,000Re = 100,000Re = 100,000
Comments
Re = 100,000Re = 100,000
Calibration condition PD meter Others

Final Report on APMP.M.FF-K2.a
34
Table A.3.i NMIJ, Light oil, 30 ºC, Jul. 2013
No Date Flowrate Temp. Pressure AmbientTemp.
KinematicViscosity Density Pulses Time K factor Volume Re Kf20 K Kf20avg S. D. of
K uDUT Reavg S.D. ofRe
[ - ] [dd/mm/yy] [m3/h] [oC] [MPa] [oC][ ×10-6
m2/s ][kg/m3] [P] [s] [p/L] [m3] [ - ] [p/L] [%] [p/L] [%] [%] [-] [-]
1 09-Jul-13 239.74 30.1419 0.503 23.87 5.26 830.389 100603 170.8542 8.8418 11.378 107520 8.84475 0.08772 09-Jul-13 239.67 30.1557 0.504 23.87 5.26 830.380 100538 170.7985 8.8417 11.371 107527 8.84463 0.08633 09-Jul-13 299.65 30.2174 0.463 24.09 5.25 830.310 100893 137.0988 8.8413 11.412 134658 8.84431 0.08284 09-Jul-13 299.35 30.1941 0.464 24.09 5.25 830.327 100843 137.1708 8.8413 11.406 134438 8.84424 0.08195 09-Jul-13 179.79 30.0841 0.455 24.42 5.27 830.396 100202 226.9092 8.8421 11.332 80508 8.84504 0.09106 09-Jul-13 179.73 30.0864 0.458 24.42 5.27 830.396 100153 226.8792 8.8421 11.327 80484 8.84504 0.09107 09-Jul-13 119.80 30.0544 0.425 24.66 5.27 830.396 99889 339.4503 8.8426 11.296 53602 8.84555 0.09688 09-Jul-13 119.80 30.0594 0.425 24.66 5.27 830.392 99908 339.5109 8.8425 11.299 53611 8.84547 0.09589 09-Jul-13 59.87 30.0326 0.402 24.79 5.27 830.394 99575 677.1245 8.8419 11.262 26773 8.84487 0.089010 09-Jul-13 59.92 30.0238 0.404 24.79 5.27 830.402 99570 676.5864 8.8419 11.261 26787 8.84481 0.088411 10-Jul-13 224.56 30.1568 0.488 23.85 5.26 830.368 100445 182.1167 8.8418 11.360 100753 8.84475 0.0876 8.84466 0.0006 0.0002 100529 16012 10-Jul-13 224.47 30.1413 0.489 23.85 5.26 830.379 100430 182.1679 8.8417 11.359 100668 8.84467 0.086813 10-Jul-13 224.30 30.1255 0.492 23.85 5.26 830.391 100494 182.4248 8.8417 11.366 100548 8.84463 0.086414 10-Jul-13 224.08 30.1273 0.491 24.33 5.26 830.390 100411 182.4468 8.8417 11.357 100458 8.84464 0.086515 10-Jul-13 223.99 30.1308 0.494 24.33 5.26 830.389 100386 182.4802 8.8416 11.354 100424 8.84461 0.086116 10-Jul-13 223.80 30.1258 0.494 24.33 5.26 830.393 100401 182.6635 8.8417 11.355 100324 8.84468 0.086917 10-Jul-13 29.87 30.0107 0.397 24.88 5.28 830.406 99370 1354.8669 8.8400 11.241 13348 8.84295 0.067418 10-Jul-13 29.88 30.0279 0.398 24.88 5.27 830.395 99375 1354.2343 8.8401 11.241 13361 8.84302 0.068219 11-Jul-13 156.63 30.0842 0.442 23.50 5.27 830.388 100081 260.1504 8.8420 11.319 70137 8.84492 0.0897 8.84492 0.0003 0.0002 70150 3920 11-Jul-13 156.73 30.0865 0.445 23.50 5.27 830.388 100041 259.8876 8.8420 11.314 70184 8.84494 0.089921 11-Jul-13 156.64 30.0795 0.443 23.50 5.27 830.392 100086 260.1496 8.8420 11.319 70132 8.84489 0.089322 11-Jul-13 156.60 30.0712 0.444 24.17 5.27 830.398 100085 260.2164 8.8419 11.319 70098 8.84485 0.088823 11-Jul-13 156.82 30.0758 0.444 24.17 5.27 830.394 100161 260.0442 8.8419 11.328 70206 8.84486 0.089024 11-Jul-13 156.67 30.0777 0.444 24.17 5.27 830.393 100098 260.1264 8.8420 11.321 70143 8.84493 0.0898
Data analysis by the Pilot Lab
Re = 70,000Re = 70,000Re = 70,000Re = 70,000Re = 70,000Re = 70,000
Re = 100,000Re = 100,000Re = 100,000Re = 100,000
Comments
Re = 100,000Re = 100,000
Calibration condition PD meter Others

Final Report on APMP.M.FF-K2.a
35
Table A.3.j NMIJ, Kerosene, 20 ºC, Jul. 2013
No Date Flowrate Temp. Pressure AmbientTemp.
KinematicViscosity Density Pulses Time K factor Volume Re Kf20 K Kf20avg S. D. of
K uDUT Reavg S.D. ofRe
[ - ] [dd/mm/yy] [m3/h] [oC] [MPa] [oC][ ×10-6
m2/s ][kg/m3] [P] [s] [p/L] [m3] [ - ] [p/L] [%] [p/L] [%] [%] [-] [-]
1 23-Jul-13 237.83 19.9956 0.494 23.29 2.01 794.876 104861 179.5247 8.8416 11.860 278876 8.84163 0.05232 23-Jul-13 238.05 19.9970 0.493 23.48 2.01 794.874 104910 179.4401 8.8417 11.865 279144 8.84166 0.05273 23-Jul-13 297.33 20.0520 0.510 23.48 2.01 794.846 105205 144.0859 8.8405 11.900 349011 8.84055 0.04014 23-Jul-13 297.16 20.0462 0.510 23.48 2.01 794.851 105364 144.3843 8.8406 11.918 348775 8.84065 0.04135 23-Jul-13 237.85 19.9996 0.494 23.55 2.01 794.875 104966 179.6834 8.8417 11.872 278929 8.84165 0.05276 23-Jul-13 178.45 19.9431 0.452 23.55 2.01 794.886 104568 238.5501 8.8429 11.825 209054 8.84292 0.06707 23-Jul-13 178.39 19.9638 0.451 23.72 2.01 794.871 104532 238.5581 8.8429 11.821 209054 8.84294 0.06728 23-Jul-13 118.91 19.9369 0.423 23.72 2.01 794.870 104271 356.9127 8.8448 11.789 139284 8.84478 0.08819 23-Jul-13 118.97 19.9141 0.422 23.72 2.01 794.887 104323 356.8987 8.8448 11.795 139301 8.84477 0.087910 23-Jul-13 59.42 19.8985 0.405 23.72 2.01 794.887 103997 712.2770 8.8463 11.756 69549 8.84623 0.104511 23-Jul-13 59.43 19.8995 0.405 23.72 2.01 794.889 103996 712.1735 8.8463 11.756 69560 8.84630 0.105312 24-Jul-13 255.81 19.9893 0.505 22.48 2.01 794.900 105106 167.2999 8.8413 11.888 299930 8.84128 0.0484 8.84129 0.0003 0.0001 300116 13913 24-Jul-13 255.93 20.0234 0.506 22.48 2.01 794.876 105120 167.2463 8.8412 11.890 300255 8.84125 0.048114 24-Jul-13 255.83 20.0159 0.510 22.48 2.01 794.884 105067 167.2232 8.8413 11.884 300102 8.84130 0.048715 24-Jul-13 255.90 20.0221 0.510 22.55 2.01 794.881 105044 167.1406 8.8413 11.881 300220 8.84127 0.048316 24-Jul-13 255.71 20.0179 0.510 22.55 2.01 794.884 105031 167.2454 8.8413 11.880 299970 8.84132 0.048917 24-Jul-13 255.95 20.0117 0.506 22.55 2.01 794.885 105026 167.0793 8.8413 11.879 300219 8.84132 0.048918 24-Jul-13 85.29 19.9053 0.411 22.64 2.01 794.896 104095 496.6782 8.8459 11.767 99850 8.84588 0.1005 8.84581 0.0007 0.0004 99875 1519 24-Jul-13 85.32 19.8964 0.410 22.64 2.01 794.902 104142 496.7322 8.8458 11.773 99869 8.84579 0.099420 24-Jul-13 85.32 19.9072 0.410 22.64 2.01 794.896 104115 496.6254 8.8458 11.770 99885 8.84576 0.099121 24-Jul-13 85.31 19.9092 0.410 22.66 2.01 794.895 104118 496.7064 8.8458 11.770 99875 8.84574 0.098922 24-Jul-13 85.33 19.9069 0.410 22.66 2.01 794.898 104124 496.6099 8.8458 11.771 99896 8.84576 0.099123 24-Jul-13 85.30 19.9160 0.410 22.66 2.01 794.891 104144 496.8858 8.8458 11.773 99876 8.84573 0.098824 25-Jul-13 59.69 19.8943 0.406 22.24 2.01 794.912 103994 709.0343 8.8464 11.755 69859 8.84640 0.1064 8.84636 0.0006 0.0003 69854 2025 25-Jul-13 59.68 19.8952 0.406 22.24 2.01 794.911 103986 709.0797 8.8463 11.755 69851 8.84630 0.105226 25-Jul-13 59.70 19.8962 0.406 22.24 2.01 794.912 103994 708.8723 8.8464 11.755 69877 8.84637 0.106027 25-Jul-13 59.67 19.8940 0.406 22.53 2.01 794.913 103991 709.1679 8.8463 11.755 69845 8.84623 0.104528 25-Jul-13 59.70 19.8948 0.405 22.53 2.01 794.910 103981 708.8346 8.8462 11.754 69872 8.84614 0.103429 25-Jul-13 59.67 19.8841 0.404 22.53 2.01 794.918 103988 709.2676 8.8461 11.755 69821 8.84608 0.102830 25-Jul-13 29.64 19.8975 0.399 22.81 2.01 794.909 103833 1425.8598 8.8459 11.738 34689 8.84592 0.100931 25-Jul-13 29.64 19.8935 0.399 22.81 2.01 794.911 103832 1425.7685 8.8459 11.738 34688 8.84591 0.1009
Data analysis by the Pilot Lab
Re = 70,000Re = 70,000Re = 70,000Re = 70,000
Re = 100,000Re = 100,000Re = 100,000Re = 100,000Re = 70,000Re = 70,000
Re = 300,000Re = 300,000Re = 300,000Re = 300,000Re = 100,000Re = 100,000
Comments
Re = 300,000Re = 300,000
Calibration condition PD meter Others

Final Report on APMP.M.FF-K2.a
36
Table A.3.k NMIJ, Kerosene, 25 ºC, Jul. 2013
No Date Flowrate Temp. Pressure AmbientTemp.
KinematicViscosity Density Pulses Time K factor Volume Re Kf20 K Kf20avg S. D. of
K uDUT Reavg S.D. ofRe
[ - ] [dd/mm/yy] [m3/h] [oC] [MPa] [oC][ ×10-6
m2/s ][kg/m3] [P] [s] [p/L] [m3] [ - ] [p/L] [%] [p/L] [%] [%] [-] [-]
1 18-Jul-13 238.21 24.9995 0.490 22.81 1.84 791.194 105439 180.2635 8.8397 11.928 305291 8.84116 0.04702 18-Jul-13 238.06 25.0030 0.492 22.81 1.84 791.193 105449 180.3929 8.8397 11.929 305121 8.84111 0.04653 18-Jul-13 297.66 25.0750 0.508 23.21 1.84 791.150 105681 144.6054 8.8388 11.956 381982 8.84027 0.03704 18-Jul-13 297.42 25.0623 0.508 23.21 1.84 791.159 105713 144.7644 8.8389 11.960 381591 8.84035 0.03805 18-Jul-13 178.52 24.9138 0.452 23.59 1.84 791.227 105113 239.7585 8.8409 11.889 228455 8.84237 0.06086 18-Jul-13 178.52 24.9635 0.453 23.59 1.84 791.191 105114 239.7655 8.8409 11.889 228647 8.84237 0.06087 18-Jul-13 119.01 24.9462 0.422 23.73 1.84 791.185 104761 358.3559 8.8427 11.847 152390 8.84418 0.08138 18-Jul-13 118.97 24.9243 0.422 23.73 1.84 791.201 104778 358.5401 8.8428 11.849 152279 8.84421 0.08169 18-Jul-13 59.44 24.8974 0.405 24.01 1.84 791.211 104444 715.2310 8.8441 11.809 76046 8.84555 0.0968
10 18-Jul-13 59.45 24.8973 0.405 24.01 1.84 791.211 104425 715.0659 8.8438 11.808 76052 8.84525 0.093411 19-Jul-13 234.11 24.9966 0.490 23.06 1.84 791.203 105365 183.2937 8.8397 11.919 300018 8.84117 0.0472 8.84115 0.0008 0.0003 300057 14112 19-Jul-13 234.28 25.0017 0.490 23.06 1.84 791.200 105465 183.3294 8.8397 11.931 300270 8.84118 0.047313 19-Jul-13 234.10 25.0021 0.490 23.06 1.84 791.199 105363 183.2931 8.8397 11.919 300042 8.84115 0.047014 19-Jul-13 234.18 25.0028 0.489 23.42 1.84 791.200 105416 183.3255 8.8397 11.925 300144 8.84115 0.046915 19-Jul-13 234.07 25.0054 0.490 23.42 1.84 791.199 105378 183.3436 8.8398 11.921 300017 8.84124 0.048016 19-Jul-13 233.97 24.9984 0.492 23.42 1.84 791.205 105357 183.3920 8.8396 11.919 299849 8.84101 0.045417 19-Jul-13 78.03 24.8870 0.409 23.64 1.84 791.228 104543 545.3634 8.8437 11.821 99814 8.84512 0.0919 8.84513 0.0002 0.0001 99866 3218 19-Jul-13 78.07 24.9037 0.409 23.64 1.84 791.216 104543 545.0761 8.8437 11.821 99895 8.84512 0.091919 19-Jul-13 78.05 24.9062 0.409 23.64 1.84 791.214 104536 545.1897 8.8437 11.820 99872 8.84515 0.092220 19-Jul-13 78.04 24.9013 0.409 23.79 1.84 791.222 104547 545.3338 8.8438 11.821 99847 8.84519 0.092621 19-Jul-13 78.06 24.9138 0.408 23.79 1.84 791.212 104539 545.1198 8.8437 11.821 99900 8.84516 0.092422 19-Jul-13 78.04 24.9103 0.408 23.79 1.84 791.215 104558 545.3611 8.8437 11.823 99869 8.84514 0.092223 22-Jul-13 54.64 24.9227 0.402 22.61 1.84 791.210 104405 777.8709 8.8437 11.806 69930 8.84514 0.0921 8.84520 0.0007 0.0004 69893 2324 22-Jul-13 54.63 24.9072 0.402 22.61 1.84 791.221 104414 778.0069 8.8438 11.806 69905 8.84519 0.092725 22-Jul-13 54.62 24.8971 0.402 22.61 1.84 791.232 104420 778.2072 8.8438 11.807 69878 8.84526 0.093526 22-Jul-13 54.62 24.8973 0.402 23.21 1.84 791.231 104421 778.2390 8.8438 11.807 69876 8.84528 0.093727 22-Jul-13 54.61 24.8995 0.402 23.21 1.84 791.229 104416 778.3070 8.8438 11.807 69869 8.84527 0.093528 22-Jul-13 54.64 24.8957 0.402 23.21 1.84 791.232 104415 777.8721 8.8438 11.806 69903 8.84528 0.093729 22-Jul-13 29.64 24.8918 0.401 23.62 1.84 791.239 104266 1431.9418 8.8428 11.791 37921 8.84422 0.081730 22-Jul-13 29.64 24.8921 0.400 23.62 1.84 791.238 104274 1432.1483 8.8429 11.792 37918 8.84430 0.0827
Data analysis by the Pilot Lab
Re = 70,000Re = 70,000Re = 70,000Re = 70,000
Re = 100,000Re = 100,000Re = 100,000Re = 100,000Re = 70,000Re = 70,000
Re = 300,000Re = 300,000Re = 300,000Re = 300,000Re = 100,000Re = 100,000
Comments
Re = 300,000Re = 300,000
Calibration condition PD meter Others

Final Report on APMP.M.FF-K2.a
37
Table A.3.l NMIJ, Kerosene, 30 ºC, Jul. 2013
No Date Flowrate Temp. Pressure AmbientTemp.
KinematicViscosity Density Pulses Time K factor Volume Re Kf20 K Kf20avg S. D. of
K uDUT Reavg S.D. ofRe
[ - ] [dd/mm/yy] [m3/h] [oC] [MPa] [oC][ ×10-6
m2/s ][kg/m3] [P] [s] [p/L] [m3] [ - ] [p/L] [%] [p/L] [%] [%] [-] [-]
1 12-Jul-13 238.08 30.0615 0.491 23.88 1.69 787.453 105895 181.1809 8.8378 11.982 332079 8.84075 0.04242 12-Jul-13 238.02 30.0197 0.491 23.88 1.69 787.484 105906 181.2438 8.8378 11.983 331773 8.84073 0.04223 12-Jul-13 297.46 30.0689 0.508 24.30 1.69 787.462 106247 145.5084 8.8369 12.023 414959 8.83979 0.03164 12-Jul-13 297.35 30.0436 0.509 24.30 1.69 787.481 106261 145.5822 8.8368 12.025 414638 8.83969 0.03045 12-Jul-13 178.45 29.9319 0.450 24.30 1.69 787.519 105555 240.9059 8.8391 11.942 248388 8.84201 0.05676 12-Jul-13 178.42 29.9545 0.450 24.30 1.69 787.503 105496 240.8250 8.8390 11.935 248426 8.84194 0.05597 12-Jul-13 118.89 29.9328 0.423 24.61 1.69 787.503 105215 360.3456 8.8410 11.901 165490 8.84390 0.07818 12-Jul-13 118.87 29.9230 0.422 24.61 1.69 787.510 105249 360.5452 8.8411 11.904 165424 8.84399 0.07929 12-Jul-13 59.41 29.8955 0.405 24.77 1.69 787.520 104927 719.0719 8.8422 11.867 82643 8.84510 0.091610 12-Jul-13 59.45 29.9431 0.408 24.77 1.69 787.488 104919 718.5243 8.8420 11.866 82765 8.84491 0.089511 16-Jul-13 215.55 30.0398 0.474 22.87 1.69 787.478 105814 199.9534 8.8383 11.972 300550 8.84121 0.0476 8.84109 0.0008 0.0003 300219 19112 16-Jul-13 215.53 30.0017 0.473 22.87 1.69 787.505 105705 199.7677 8.8382 11.960 300336 8.84111 0.046513 16-Jul-13 215.49 29.9773 0.473 22.87 1.69 787.526 105791 199.9709 8.8382 11.970 300157 8.84107 0.046014 16-Jul-13 215.39 29.9767 0.473 23.24 1.69 787.527 105714 199.9140 8.8381 11.961 300024 8.84098 0.045115 16-Jul-13 215.48 29.9717 0.473 23.24 1.69 787.533 105737 199.8792 8.8382 11.963 300114 8.84109 0.046316 16-Jul-13 215.46 29.9788 0.473 23.24 1.69 787.528 105768 199.9481 8.8382 11.967 300133 8.84109 0.046317 16-Jul-13 71.82 29.9287 0.408 23.60 1.69 787.516 104987 595.2123 8.8420 11.874 99954 8.84485 0.0888 8.84482 0.0003 0.0002 99895 3218 16-Jul-13 71.81 29.8927 0.408 23.60 1.70 787.542 104969 595.1482 8.8419 11.872 99890 8.84480 0.088319 16-Jul-13 71.79 29.8946 0.407 23.60 1.70 787.542 104996 595.4748 8.8419 11.875 99864 8.84481 0.088420 16-Jul-13 71.80 29.8962 0.407 23.91 1.69 787.542 105001 595.4116 8.8419 11.875 99882 8.84480 0.088321 16-Jul-13 71.80 29.8968 0.407 23.91 1.69 787.542 104963 595.2229 8.8419 11.871 99878 8.84479 0.088222 16-Jul-13 71.82 29.8965 0.408 23.91 1.69 787.543 104980 595.1734 8.8419 11.873 99903 8.84478 0.088023 17-Jul-13 50.27 29.9180 0.403 22.62 1.69 787.532 104856 849.2561 8.8418 11.859 69956 8.84472 0.0873 8.84471 0.0001 0.0001 69956 1324 17-Jul-13 50.28 29.9165 0.403 22.62 1.69 787.533 104845 848.9742 8.8418 11.858 69970 8.84470 0.087125 17-Jul-13 50.29 29.9038 0.403 22.62 1.69 787.545 104874 849.0845 8.8418 11.861 69966 8.84471 0.087326 17-Jul-13 50.29 29.8988 0.404 22.99 1.69 787.549 104849 848.9402 8.8418 11.858 69955 8.84468 0.086927 17-Jul-13 50.27 29.8971 0.403 22.99 1.69 787.552 104852 849.2250 8.8418 11.858 69932 8.84472 0.087428 17-Jul-13 50.28 29.9019 0.404 22.99 1.69 787.549 104852 848.9923 8.8418 11.859 69957 8.84466 0.086729 17-Jul-13 29.64 29.8810 0.400 23.46 1.70 787.564 104736 1439.1341 8.8401 11.848 41218 8.84294 0.067230 17-Jul-13 29.65 29.8866 0.401 23.46 1.70 787.560 104739 1438.5951 8.8402 11.848 41238 8.84307 0.0687
Data analysis by the Pilot Lab
Re = 70,000Re = 70,000Re = 70,000Re = 70,000
Re = 100,000Re = 100,000Re = 100,000Re = 100,000Re = 70,000Re = 70,000
Re = 300,000Re = 300,000Re = 300,000Re = 300,000Re = 100,000Re = 100,000
Comments
Re = 300,000Re = 300,000
Calibration condition PD meter Others
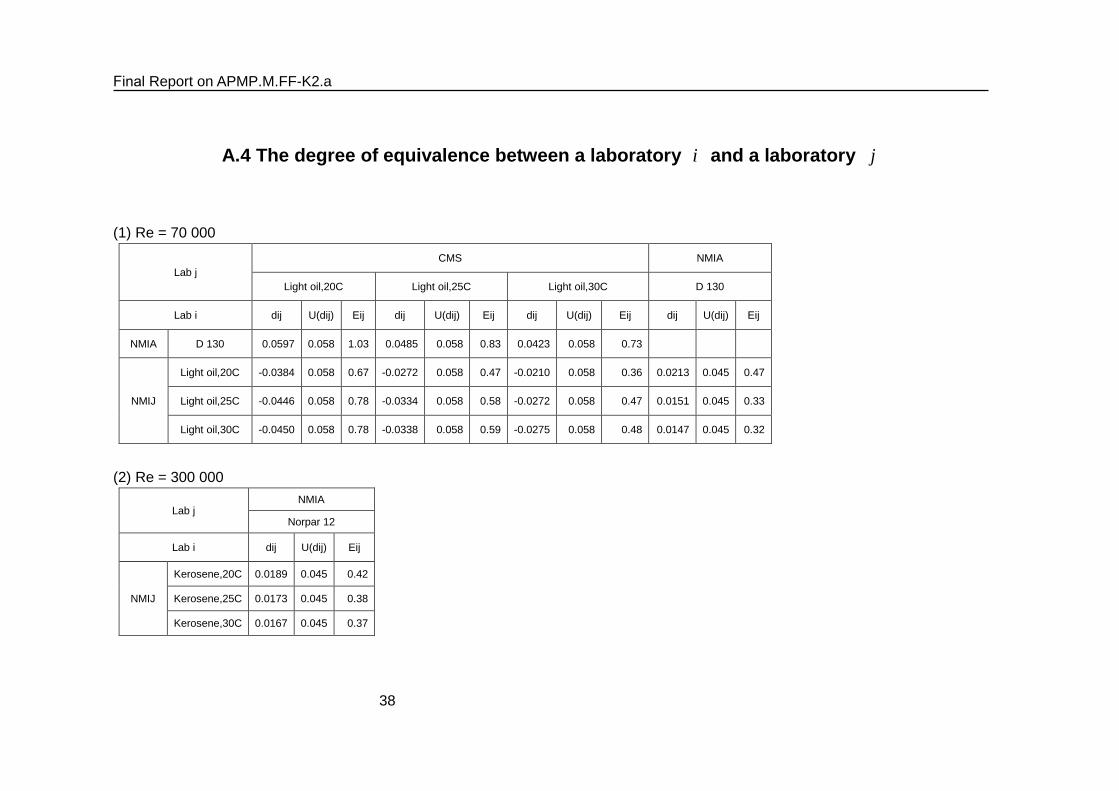
Final Report on APMP.M.FF-K2.a
38
A.4 The degree of equivalence between a laboratory i and a laboratory j
(1) Re = 70 000
Lab j CMS NMIA
Light oil,20C Light oil,25C Light oil,30C D 130
Lab i dij U(dij) Eij dij U(dij) Eij dij U(dij) Eij dij U(dij) Eij
NMIA D 130 0.0597 0.058 1.03 0.0485 0.058 0.83 0.0423 0.058 0.73
NMIJ
Light oil,20C -0.0384 0.058 0.67 -0.0272 0.058 0.47 -0.0210 0.058 0.36 0.0213 0.045 0.47
Light oil,25C -0.0446 0.058 0.78 -0.0334 0.058 0.58 -0.0272 0.058 0.47 0.0151 0.045 0.33
Light oil,30C -0.0450 0.058 0.78 -0.0338 0.058 0.59 -0.0275 0.058 0.48 0.0147 0.045 0.32
(2) Re = 300 000
Lab j NMIA
Norpar 12
Lab i dij U(dij) Eij
NMIJ
Kerosene,20C 0.0189 0.045 0.42
Kerosene,25C 0.0173 0.045 0.38
Kerosene,30C 0.0167 0.045 0.37

Final Report on APMP.M.FF-K2.a
39
(3) Re = 100 000
Lab j CMS NMIA
Light oil, 20C Light oil, 25C Light oil, 30C Norpar 12 D 130
Lab i dij U(dij) Eij dij U(dij) Eij dij U(dij) Eij dij U(dij) Eij dij U(dij) Eij
NMIA Norpar 12 0.0573 0.058 0.99 0.0519 0.058 0.89 0.0482 0.058 0.83
D 130 0.0570 0.058 0.98 0.0516 0.058 0.89 0.0479 0.058 0.82 -0.0003 0.046 0.01
NMIJ
Light oil,20C -0.0323 0.058 0.56 -0.0269 0.058 0.47 -0.0232 0.058 0.40 0.0250 0.045 0.55 0.0247 0.045 0.54
Light oil,25C -0.0365 0.058 0.63 -0.0310 0.058 0.54 -0.0274 0.058 0.48 0.0208 0.045 0.46 0.0206 0.045 0.45
Light oil,30C -0.0388 0.058 0.67 -0.0334 0.058 0.58 -0.0297 0.058 0.52 0.0185 0.045 0.41 0.0182 0.045 0.40
Kerosene,20C -0.0262 0.058 0.46 -0.0208 0.058 0.36 -0.0171 0.058 0.30 0.0311 0.045 0.68 0.0308 0.045 0.68
Kerosene,25C -0.0333 0.058 0.58 -0.0279 0.058 0.48 -0.0242 0.058 0.42 0.0240 0.045 0.53 0.0237 0.045 0.52
Kerosene,30C -0.0372 0.058 0.65 -0.0318 0.058 0.55 -0.0281 0.058 0.49 0.0201 0.045 0.44 0.0198 0.045 0.44

Final Report on APMP.M.FF-K2.a
40
APPENDIX B Methods of measurement
B.1 CMS
The transfer standard (TS) is calibrated by the low viscosity oil flow calibration system. A solvent oil of Exxon D110 is used as the working fluid. Meanwhile, the standing-start-and-finish mode with static weighing method is used to calibrate flowmeters.
The low viscosity oil flow facility is a circulating system. The working fluid is pumped from a reservoir and flows through the meter under test, a flowrate control valve, an on-off valve, and a constant level device. Then the liquid falls freely into the weightank. After being weighed, the liquid in the weightank flows back to the main reservoir by opening a valve on the outlet pipe of the weightank. The process flow diagram is shown as Figure B-1-1. A photograph of the calibration setup is shown in Figure B-1-2.
Figure B-1-1 Process diagram of the low viscosity oil flow facility

Final Report on APMP.M.FF-K2.a
41
Figure B-1-2 Photograph of the calibration setup
The test rig includes 75 mm, 100 mm, 150 mm, and 200 mm pipelines, the TS was installed on the 150 mm pipeline, the sketch drawing of the TS and its upstream and downstream is shown on Figure B-1-3.
Figure B-1-3 Sketch drawing of the TS installation
The following equations were used in the calculation of the K factors: (1 )
(1 )al m
WVP f
ερ
+=
+ ×
a
NKV
=
where aV = actual volume transferred from the collected weight W = net weight measured by weighing scale
lρ = oil density corresponding to the average temperature passing through TS meter during test
mP = average pressure passing through meter during test f = compressibility coefficient ( f = 0.00009 cm2/kg)
1 1( )l w
αε ρρ ρ
= − = air buoyancy, where aρ and wρ are the densities of air and
deadweight, respectively N = number of TS meter output pulses
The combined standard uncertainty of K factor at any flowrate for a single calibration is defined as
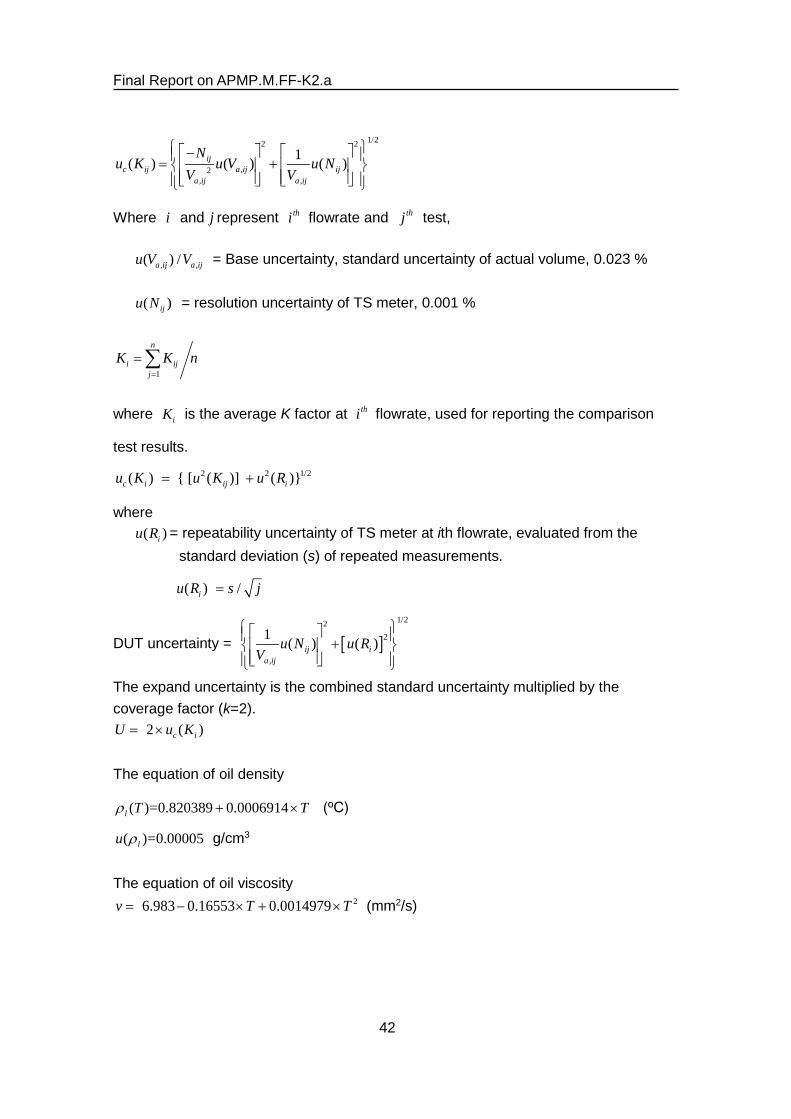
Final Report on APMP.M.FF-K2.a
42
1/22 2
,2, ,
1( ) ( ) ( )ijc ij a ij ij
a ij a ij
Nu K u V u N
V V
− = +
Where i and j represent thi flowrate and thj test,
, ,( ) /a ij a iju V V = Base uncertainty, standard uncertainty of actual volume, 0.023 %
( )iju N = resolution uncertainty of TS meter, 0.001 %
1
n
i ijj
K K n=
= ∑
where iK is the average K factor at thi flowrate, used for reporting the comparison
test results. /2 1 22 ( ) { [ ( ] ) ( )}c i ij iu K u K u R= +
where ( )iu R = repeatability uncertainty of TS meter at ith flowrate, evaluated from the
standard deviation (s) of repeated measurements.
( /)iu R s j=
DUT uncertainty = [ ]1/22
2
,
1 ( ) ( )ij ia ij
u N u RV
+
The expand uncertainty is the combined standard uncertainty multiplied by the coverage factor (k=2).
( ) 2 c iU u K= ×
The equation of oil density
( )=0.820389 0.0006914 l T Tρ + × (ºC)
( )=0.00005lu ρ g/cm3
The equation of oil viscosity 2 6.983 0.16553 0.0014979v T T= − × + × (mm2/s)

Final Report on APMP.M.FF-K2.a
43
B.2 NMIA
1. Flow facility schematic
2. EquipmentThe volumetric standard used is a 60L piston prover (see below)

Final Report on APMP.M.FF-K2.a
44
3. Test methodThe method involves:
1) Establish the desired flow rate and pressure conditions within a closed (approx.6000L) loop using pump speed, pump bypass valves and meter throttle valves;
2) Launch piston prover and determine KF;3) Repeat step 2 4 times, giving 5 values of KF;4) Determine average of KF and report5) Repeat steps 1 to 4 as many time as necessary to charaterise the performance of
the meter
4. Equations
KF = ( n x CPLM x CTLM ) / ( Vp x CPLP x CTLP x CPSP x CTSP) Where: n = Number of pulses [Pulses]
CPLM = Correction for Pressure on the Liquid in MUT [dimless] CTLM = Correction for Temperature on the Liquid in the MUT [dimless] Vp = Volume of the Prover at known conditions of temperature and pressure, [L] CPLP = Correction for Pressure on the Liquid in Prover [dimless] CTLP = Correction for Temperature on the Liquid in Prover [dimless] CPSP = Correction for Pressure on the Steel of the Prover [dimless] CTSP = Correction for Temperaure on the Steel of the Prover [dimless]
5. Pipework
← 60L PROVER
P T Ball valve PACKAGE
670 230 340 150 805 150 490 150 200
320
520
6" to 4" 6" to 4" 4" to 5"
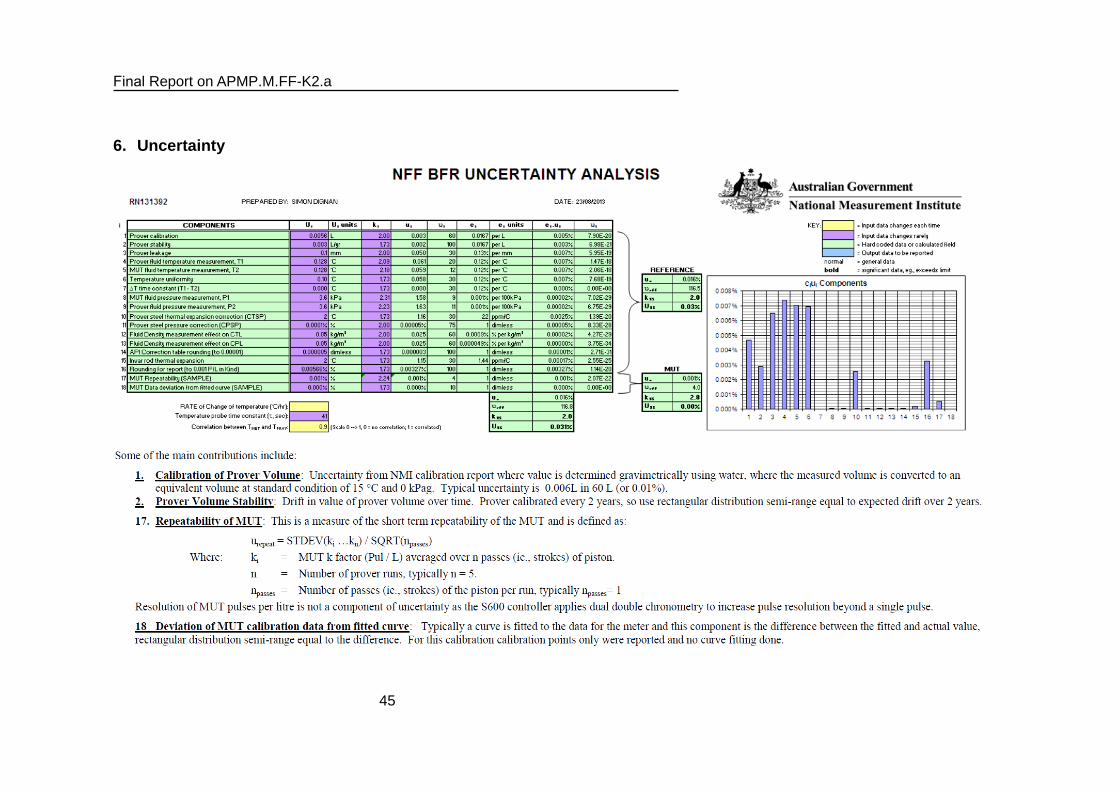
Final Report on APMP.M.FF-K2.a
45
6. Uncertainty

Final Report on APMP.M.FF-K2.a
46
B.3 NMIJ
1. Test rig and Calibration method1) Test rig and Calibration methodA schematic of the primary standard for hydrocarbon flow is shown in Fig. B-3-1. Light oil and kerosene are used as working liquids; each oil has a separate test line. As they share a heat exchanger, however, the two lines cannot be operated at the same time. The flow rate range of the facility capacity is from 3 to 300 m3/h. This primary standard is based on static and gravimetric methods with a flying start and finish, i.e., the total mass of fluid passing through the flowmeter via the diverter in a given time is measured. It consists of a 10 t weighing scale, a 1 t weighing scale, a density meter and the diverter system, which has double diverting wings.
Fig. B-3-1 Schematic of the facility
2) Installation of the meterThe schematic of pipes upstream and downstream of the package are shown in Table B-3-1.
Storage Tank(Kerosene ; 43 m3)
Pump
Storage Tank(Light Oil ; 43 m3)
Diverter/Weighing Tank/Weighing Scale
Heat exchanger
Small Volume Prover
Servo PD Meter
Test Line
Kerosene
Light Oil

Final Report on APMP.M.FF-K2.a
47
Table B-3-1 Pipe size and lengths
Pipe Flange Length (mm)
Diameter (mm)
Material
Upstream Ball Valve 6" ANSI 150lb Pipe 6" Sch 20 ANSI 150lb 2000 155.2 SUS304 Pipe 6" Sch 20 ANSI 150lb 590 155.2 SUS304
Pipe 6" Sch 20 ANSI 150lb/
JIS10K 1500 155.2 SUS304
Pipe 6" Sch 40 JIS10K 500 151.0 SUS304 Flowmeter (OMG140)
6” JIS 10K 610
Pipe 6" Sch 40 JIS 10K/
ANSI 150lb 500 151.0 SUS304
Pipe 6" Sch 20 ANSI 150lb/
JIS10K 1500 155.2 SUS304
Pipe 6" Sch 40 JIS10K 1500 151.0 SUS304 Pipe 6” Sch 40 JIS10K 2000 151.0 SUS304 Pipe 6” Sch 40 JIS10K 1000 151.0 SUS304 Pipe 6” Sch 40 JIS10K 1000 151.0 SUS304 Pipe 6” Sch 40 JIS10K 1000 151.0 SUS304
Pipe 6" Sch 40 JIS10K/
ANSI 150lb 165 151.0 SUS304
Package 805
Pipe 6" Sch 40 ANSI 150lb/
JIS10K 500 151.0 SUS304
Downstream Pipe 6" Sch 40 JIS10K 210 151.0 SUS304
2. Expression of uncertainty.The uncertainty budget as a base uncertainty is shown in Table B-3-2. The combined relative standard uncertainty for volumetric flow at this calibration facility is simplified to be 0.015 %. The relative combined standard uncertainty of the K-factor is estimated in combination with the uncertainty of the experimental standard deviation of the mean due to the random effect, which normally is negligible. Accordingly, the relative expanded uncertainty of the K-factor for volumetric flow is estimated to be 0.030 % (coverage factor k = 2).

Final Report on APMP.M.FF-K2.a
48
Table B-3-2 Relative combined standard uncertainty of volumetric flow rate calibration in large hydrocarbon flow calibration facilities.
Uncertainty Sources Relative standard uncertainty × 10-5
Kerosene Light oil
Number of pulses ~ 0 ~ 0 Duration of pulse counting 1.4 1.4
Resolution < 0.1 < 0.1 Correction 1.0 1.0 Reproducibility 1.0 1.0
Dead volume 0.4 0.4 Fluctuation of flow rate and density < 0.1 < 0.1 Mass of liquid 2.8 ~ 7.7 2.9 ~ 4.0
Calibration factor 2.2 2.4 Resolution 0.1 0.1 Buoyancy correction 0.8 0.8 Vapor and mist 1.5 ~ 7.3 1.4 ~ 3.1
Density of liquid 9.6 ~ 10.4 8.5 ~ 9.2 Density meter 6.6 6.2 Thermal coefficient 0.3 0.3
Temperature measurement 6.6 5.8
Compressibility 0.3 ~ 1.5 0.3 ~ 1.5 Pressure measurement 0.9 ~ 3.9 0.8 ~ 3.2 Reproducibility of working liquid 2.2 0.7
Duration of installation 1.4 ~ 2.5 1.4 ~ 2.6 Timer 1.4 1.4 Correction time (Diverter timing error) 0.2 ~ 2.1 0.2 ~ 2.2
Combined relative standard uncertainty 10.4 ~ 13.1 9.5 ~ 10.2
3. Explanation of calculations of K-factors at NMIJThe following formulas are used in the calculation of the K-factor:
1000P P LFM
fD L
I tKt M
ρ= (pulse/L)
PI (pulse) = the number of pulses generated by the flowmeter Pt (s) = The duration for which flowmeter pulses are counted Dt (s) = diversion time

Final Report on APMP.M.FF-K2.a
49
LM (kg) = the mass of oil accumulating in the weighing tank
LFMρ (kg/m3) = Time-averaged oil density through the flowmeter under calibration
(1) Time-averaged oil density through the flowmeter under calibration LFMρ
( ){ } ( )12
FMmU FMmDLFM LREF L FMm REF L
p pT T Fρ ρ α
+ = + − +
LREFρ (kg/m3) = The oil density measured by the off-line density meter at temperature REFT (ºC)
Lα (kg/(m3 K)) = Thermal coefficient of oil density FMmT (ºC) = Measured temperature downstream the flowmeter during calibration LF (MPa-1) = Compressibility of oil FMmUp (MPa) = Measured pressure upstream the flowmeter during calibration FMmDp (MPa) = Measured pressure downstream the flowmeter during calibration
(2) Thermal coefficient of oil Lα
( )35 15
35 15
L LL T T
ρ ρα
−=
−
35Lρ ( kg/m3 ) = oil density measured by the off-line density meter at temperature 35 35T ≈ (ºC)
15Lρ ( kg/m3 ) = oil density measured by the off-line density meter at temperature 15 15T ≈ (ºC)
(3) Compressibility coefficient of oil LF
( ) ( )2 215 15
0.87096 0.00420920.001 exp 1.6208 0.000215921000 1000
FMmL FMm
TF Tρ ρ
= × − + + +
15ρ (kg/m3) = oil density at 15 ºC obtained from LREFρ , Lα and REFT
(4) Mass oil weight LM
( )1mL L
LGm LW
k mMρ ρ
⋅=
−
mLk (-) = the calibration factor of the weighing scale corresponding to Lm
Lm (kg) = the reading from the weighing scale Gmρ (kg/m3) = the density of the air around the weighing scale

Final Report on APMP.M.FF-K2.a
50
LWρ (kg/m3) = the density of the oil in the weighing tank
(5) Calibration factor of the weighing scale (a) 10 t weighing scale
( ) ( ) ( )( )10,000 9,0009,0009,000
10,000 9,000MS MS
mL L S MSS S
k kk m M k
M M= =
=
−= − +
−
10,000MSk = (-) = The calibration factor corresponding to the dead weight
( )10,000 10000 kgSM ≈
9,000MSk = (-) = The calibration factor corresponding to the dead weight
( )9,000 9000 kgSM ≈
(b) Calibration factor
18000
S GCALS
CAL
Mkm
ρ = −
SM (kg) = Conventional value of dead weights CALm (kg) = The reading from weighing scale during calibration of weighing
scale GCALρ (kg/m3) = The density of air during calibration of weighing scale
(6) Density of the air
( )1.2932 -0.006
1 0.00367 101.325atm
Gmatm
pT
ρ = +
atmT (ºC) = the temperature in the weighing room atmp (kPa) = the atmospheric pressure
(7) Density of oil in the weighing tank
( )LW LREF L FMm REFT Tρ ρ α= + −
4. Fluid Property

Final Report on APMP.M.FF-K2.a
51
1) Uncertainty of DensityThe density of the liquid was measured using the oscillating U-tube density meter,
DMA5000 or DMA5000M, which were manufactured by Anton Paar. This is based on the principle of a U-tube which has a resonant frequency that is inversely proportional to the square root of its mass. The density meter was calibrated using the standard density liquids of water, whose expanded uncertainty (k = 2) is 0.030 kg/m3. The standard uncertainty of the density measurement was estimated to be 0.052 kg/m3, because the uncertainty due to the viscosity effect was estimated to be 0.050 kg/m3.
2) Uncertainty of ViscosityViscosity of liquid was measured using the Viscometer, AMVn or SVM3000, which
was manufactured by Anton Paar. The Viscometers were calibrated using standard viscosity liquids, whose expanded
uncertainty (k = 2) is less than 0.1 %. However the measurement uncertainty of viscosity is dominant on the linearity and the reproducibility of the device. The Expanded uncertainty of viscosity was roughly estimated to be 3 %. The uncertainty of the density is negligible against that of the viscosity. Therefore, the uncertainty of Reynolds Number is estimated to be 3 %.
Final Report on APMP.M.FF-K2.a
52
APPENDIX C
Comparison protocol
Technical Protocol for APMP RMO Comparison
Hydrocarbon Liquids
(APMP.M.FF-K2.a)
Ver.1 November 20, 2012 Ver.2 December 13, 2012
Ver.3 January 11, 2013
Takashi Shimada Ryouji Doihara Yoshiya Terao
NMIJ/AIST Fluid Flow Division

Final Report on APMP.M.FF-K2.a
53
1. PurposeThis key comparison, APMP.M.FF-K2 is performed by APMP Technical Committee
for Fluid Flow (APMP/TCFF) for the purpose of determining the degree of equivalence of the National Standards for hydrocarbon flow measurement among participating National Metrology Institutes (NMIs). The participating NMIs will test a transfer standard and compare their calibration results. National Metrology Institute of Japan, National Institute of Advanced Industrial Science and Technology (NMIJ/AIST) has been assigned as the pilot laboratory.
This protocol has been prepared to perform the key comparison in accordance with the Guidelines for CIPM Key Comparisons (the “Guidelines”) [CIPM 1999] and the Guidelines on conducting comparisons [APMP-G2].
A positive displacement flow meter (KRAL meter) is to be used as the transfer standard. It will be tested by each participating laboratory at Reynolds number of 100,000 and at Reynolds numbers selected from 70,000, and 300,000.
After the measurement is completed, the degree of equivalence (DoE) between the participating NMIs will be obtained at every cardinal point, at Reynolds number of 70,000, 100,000 and 300,000. The key comparison reference value (KCRV) and the DoE between the KCRV and each of the participating NMIs will be also obtained.
2. Administrative information2.1. Package of the Transfer Standard
The transfer standard (TS) will be shipped using an ATA Carnet1 . The TS shall be shipped in two transportation box. Box A measure 630 mm (depth) × 990 mm (width) × 755 mm (height) and weighs 280 kg including the TS. Box B measure 380 mm (depth) × 380 mm (width) × 410 mm (height) and weighs 35 kg including the pipe.
2.2. Participating NMIs, test schedule and transportation A list of the participating labs, their shipping addresses and contact information is
provided in Table 1. Each lab has been allotted three weeks for testing and two weeks are reserved for shipping. Each participating NMI must ship the TS by fastest and safest way and the TS should be insured during shipment for at least 30,000USD. Each participating NMI shall pay the shipping and the insurance cost derived from delivery to the next participating NMI.
2.3. Keeping test schedule After the comparison starts, the participating NMIs must to send the TS to the next
participating NMI at on the schedule to prevent disruptions in the KC schedule even if their measurements are not completed. Participating NMIs, who cannot complete their measurements, will be assigned a new test date by the pilot after the entire original test schedule is accomplished.
1 For transportation between Taiwan and Japan, a SCC Carnet will be used.

Final Report on APMP.M.FF-K2.a
54
2.4. Loss or damage of TS The transfer standard is robust and it is contained in a strong shipping container,
however if the TS is damaged or a participating NMI finds it to be malfunctioning, they should consult the pilot lab for advice. The pilot will have a backup TS if a replacement is needed and spare parts that might be used to repair the entire TS. In the event of total loss, results from the backup TS would be normalized with data from calibrations at the pilot lab.
2.5. Special mailing address for the pilot lab E-mail messages being sent to NMIJ regarding this key comparison should be
addressed to "[email protected]". Then the message will be distributed to the NMIJ personnel in charge.
Table 11 List of the participating NMIs
Participating NMI (Economy)
Contact Person E-mail Address and Phone Number Shipping Address
1 CMS/ITRI (Chinese Taipei)
Chun-Min Su
[email protected] , +886-3-5741205
Center for Measurement Standards 30 Ta Hsueh Road, Hsinchu, CHINESE TAIPEI
2 NMIA (Australia)
SIMON DIGNAN
[email protected], +61 2 8467 3514
National Measurement Institute, Australia Bradfield Road, West Lindfield, NSW, 2070, AUSTRTALA
3 Pilot
NMIJ/AIST (Japan)
Takashi Shimada
[email protected], +81-29-861-4377
National Metrology Institute of Japan National Institute of Advanced Industrial Science and Technology AIST North site 14, 1497-1 Teragu, Tsukuba, Ibraki, 300-4201, JAPAN

Final Report on APMP.M.FF-K2.a
55
3. Description of Transfer StandardThe screw type positive displacement flow meter will be used as a transfer standard.
The specification of the flow meter is shown in Table 3. The pictures of the flowmeter, the display, the strainer with pipe and the box for transportation are shown in Fig. 2 to Fig. 5.
Table 12 Specification of transfer package Flow meter Manufacturers KRAL
Type OMG140 Inlet diameter 150 mm Flange 6” ANSI 150lb RF Size 610 mm (L), 267 mm (D) Weight 180 kg Maximum flow rate (normal)
450 m3/h (300 m3/h)
Converter type BEG 47 Class of protection EEx ia IIC T6
Display with safety barrier
Pulse output type TTL, Open corrector or 24V pulse
Power supply AC85 ~ 264V Size 160 mm X 230 mm X 260 mm
Upstream pipe Flange 6” ANSI 150lb RF Pipe 6” Sch40 Filter 10 mesh per inch
Box A Size, L, W, H (mm) 630 mm X 990 mm X 755 mm Weight 280 kg in total
Box B (Reinforced cardboard box)
Size, L, W, H (mm) 380 mm X 380 mm X 410 mm
Weight 45 kg in total
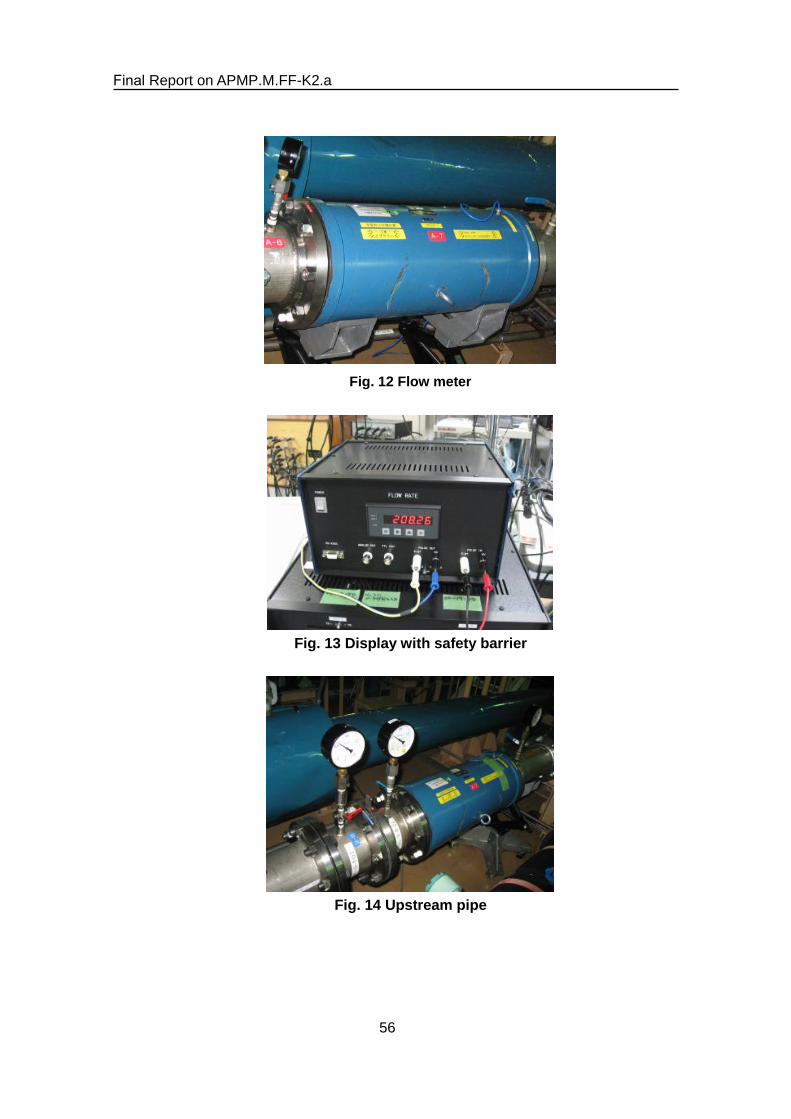
Final Report on APMP.M.FF-K2.a
56
Fig. 12 Flow meter
Fig. 13 Display with safety barrier
Fig. 14 Upstream pipe

Final Report on APMP.M.FF-K2.a
57
Fig. 15 Box A for transport
4. Preparation at a participating labPrior to receiving the transfer standard, each participating NMI should prepare pipes
and signal cables for its calibration facility to accommodate the flowmeter. The schematic of the package is shown in Appendix 1.
Each laboratory should be notified of the actual arrival date of the package by the previous laboratory. If no notification is received when expected, please check with the previous laboratory. Please inform the Pilot laboratory immediately if a problem has arisen.
If during the testing, a problem arises, please inform the Pilot for advice. Inform the next laboratory if a delay in completion is expected.
5. Unpacking the Transfer Standard5.1. Receiving check list
When the transfer standard arrives at a participating lab, Form 1 "Receiving Checklist" (see, Appendix 2) must be filled out and emailed to the pilot lab ([email protected]). The procedure of the receiving check is described in the following sections.
5.2. External examination of Transportation box Make a visual check of the external of the transportation boxes.
5.3. Checking the contents Take out all the items from the boxes and inspect them visually one by one. Take
some pictures of the inlet and outlet of the flow meter and then the pictures should be emailed to the pilot lab ([email protected]). Report any damage or missing parts to the Pilot and the previous laboratory.
5.4. Reporting the receiving check result After the check is completed, the Form 1 "Receiving check list" should be e-mailed
to the pilot lab ([email protected]). If problems are found, the participant should describe them in detail on a separate sheet (preferably in a MS-Word file), and send it along with the Form 1.

Final Report on APMP.M.FF-K2.a
58
6. Measurement Procedure6.1. Preliminaries
1) The required test liquid is clean hydrocarbons such as kerosene and light fuel oiland so on.
2) Prior to the start of testing, measure viscosity and density of the oil across theexpected temperature range. Prepare density and viscosity equation coefficients.
3) Density equation should be in the form of a linear fit to data collected across atemperature range at least 20 to 30 ºC. Density should be quoted as kg/m3.
4) Viscosity should be measured over the same temperature range. Viscosity shouldbe quoted as mPa·s.
5) Remember the equations should relate to the oil at the time of the test but arerequired before testing is started to allow a dynamic calculation of Reynoldsnumber.
6) The fluid density and viscosity data should be provided as an annex to the reportand include an estimated uncertainty. The data should also be provided in thereporting spreadsheet.
6.2. Installation and filling 1) The package should initially be assembled according to the configuration(See
Appendix 1).2) The installation should be carried out according to normal best practice adopted
for a normal client flow meter calibration. No specification has been given as tothe nature, length or type of pipework up or downstream of the package.
3) Set lab's pressure gauges at the two pressure taps of the upstream pipe ifnecessary. Pressure drop at the upstream pipe is approximately 20 kPa at theflow rate of 300 m3/h and the kinematic viscosity of 7.0 cSt.
4) Connect up the meter signal instrumentation. The wiring and connectionspecifications will be provided in Appendix 1.
5) When filling the package and establishing flow, ensure upstream and downstreamvalves are closed to prevent air from over-speeding the meter when the pumpsare started.
6) Gently allow the package to fill with oil and bleed out all air.
6.3. Choice of test points 1) Carry out the test procedure as given in Table 13. The three cardinal points are
the flow rates at Reynolds numbers of 70,000, 100,000 and 300,000. Theparticipants should calibrate the transfer standard at Re of 100,000 at least. Flowrate should be between 60 and 300 m3/h at the cardinal points.
2) The liquid temperature through the transfer standard at calibration conditionshould be approximately between 20 ºC and 30 ºC. The viscosity of liquid at
Final Report on APMP.M.FF-K2.a
59
calibration condition should be between 1.5 cSt (mm2/s) and 7.0 cSt. Back pressure downstream of the flow meter should be more than 0.1 MPa. Pressure at the flow meter should be between 0.1 MPa and 0.6 MPa.
3) The number of reputation measurements at the cardinal points should be thesame as that at normal calibration. If the number of reputation measurements isnot specified, the recommended number is 6 as shown in Table 13.
4) If a small volume prover is used as a reference standard, the number of passesshould follow normal procedure at each lab. The number of passes should bereported in the results data sheet.
5) From the fluid properties and the flow rate, the Reynolds number at each flowrate will be calculated. Reynolds number is expressed as
4Re QD
ρπµ
= (29)
Q : Volumetric flow rate (m3/s) ρ : Density (kg/m3) D : package inlet diameter as given (=0.15 m) µ : Dynamic viscosity (Pa·s)
6) The cardinal flow point has been specified by Reynolds number and not by flowrate. Reynolds number is based on the inlet diameter of the flow meter upstreampipe(=0.15 m). The volumetric flow rate through the flow meter is used to set theReynolds number. Difference of Reynolds number from the cardinal points shouldbe less than ±5 %.
6.4. Limited flow range Where the laboratory can not reach the maximum flow rate, the maximum
achievable flow rate may be reported on the summary sheet in place of the next highest specified point. Cavitation must be avoided at all times.
6.5. Timescales Tests should be carried out within consecutive working days as possible. Durations
of more than one day should be reported in the final report. The laboratory should not have the package longer than three weeks.
6.6. Draining the package Drain the package carefully ensuring the meters do not exceed the maximum flow
rate during draining.
6.7. Uninstallation and dispatch 1) Safely disconnect and pack instrument cables and connectors.

Final Report on APMP.M.FF-K2.a
60
2) Remove the package from the test line. Drain all residual oil from the meters andfilter. Clean or re-install the filter.
3) Deal with anti-rust treatment (ex. anti-rust spray) to the wetted part of the PDmeter.
4) Take pictures of the inlet and outlet of the flow meter in order to confirm conditionof the flow meter and the pictures should be emailed to the Pilot before packing.
5) Re-assemble for dispatch.
Table 13 Flow rates and test sequence
Flowrate m3/h (L/s)
Reynolds no Recommended No of reputation measurements
Approx. Frequency (Hz)
60 (16.7) 2 150 120 (33.3) 2 290 180 (50.0) 2 440 240 (66.7) 2 590 300 (83.3) 2 740
Cardinal point 70,000 6 100,000 6 300,000 6
Total No of points
28
7. Shipping the Transfer Standard1) Please pack the transfer standard in the transportation box properly and fill the
Form 3 "Shipping Checklist" (see Appendix 2). The information needed forpacking is provided in Appendix 1.
2) Each participating lab is responsible to select an appropriate transportationcompany and to ship the transfer standards as precision instruments. Alltransportation cost are to be afforded by the participating laboratory. The TSshould be insured for at least 30,000USD.
3) After shipment, the completed Form 3 "Shipping Checklist" should be e-mailed to"[email protected]" and to the next participating lab.
8. Reporting the measurement result8.1. Test data to be reported
1) Fluid property data as previously specified. This is to be in an annex to the reportand should indicate the density and viscosity measurements across the

Final Report on APMP.M.FF-K2.a
61
temperature range used to establish the fluid property equations. A brief description of the measurement method, uncertainty and fluid property equations should be given. Data should be provided on the report spreadsheet.
2) A description of the calibration test rig, including a sketch drawing indicating thegeneral principle of the test rig and the installation of the meter including pipesizes and lengths immediately upstream and downstream of the package.
3) A brief description of the test method used4) Required data in Form2 (See Appendix 2): The following data may be considered
as a minimum requirement for each test point:-.Point number, Date, flow rate through the flow meter, mean temperature at the flow meter, mean pressure at the flow meter, ambient temperature, kinematic viscosity and density at the flow meter under the calibration, meter pulses collected, measured time, and fluid volume passed through the package at test conditions.
5) The participants should calculate actual K factors at calibration condition. This isnot referenced to standard conditions.
6) The data transcribed to the summary sheets in Form 2 (See Appendix 2) shouldbe included. The following results at the cardinal points should be calculated andreported.
Type of liquid, kinematic viscosity (X10-6 m2/s = cSt), Density (kg/m3), flow rate (m3/h), liquid temperature at the flow meter (ºC), pressure at the flow meter (MPa), K-factor (P/L), base uncertainty (%), DUT uncertainty (%) and expanded uncertainty of K factor (%).
7) If the participants carry out extra calibration, all results should be reported.
8.2. Expression of uncertainty 1) The standard uncertainty of K factor is combined with the base uncertainty of the
reference standard based on the GUM and the standard uncertainty due to therepeatability of calibration results. The expanded uncertainties of K factors shouldbe quoted in percentage term with coverage factor k=2. Each quoted value shouldbe rounded up to two decimal places.
2) It would be helpful if a summary of the main uncertainty components for themeasurement could be given in no more than half a page of text or table(s)
3) To allow a calculation of the uncertainty in Reynolds number, an uncertaintyestimate of the measured viscosity and density should be provided.
4) To report the calibration result, fill the Form 2 (see Appendix 2) and email to [email protected].
9. Data Analysis by the Pilot Lab1) The K-factor is used to calculate a corrected K factor based on 20 ºC expressed
Final Report on APMP.M.FF-K2.a
62
as:
( ){ }20 1 20f fK K Tα= + − (30)
20fK : Corrected K-factor (p/L) fK : K-factor (p/L)
α : Coefficient of linear expansion of material. (Steel for flow meter, =1.1X10-
5 (K-1)) T : Temperature at calibration condition (ºC)
2) At Reynolds number of 70,000, 100,000 and 300,000, the comparison referencevalues (KCRV), which provide linkage to CCM.FF-K2, will be obtained based onthe method used for EUROMET Project 345 [Delahaye and Witt, 2002]. Then thedegree of equivalence (DoE) between the KCRV and each of the participant, andDoE between each pair of the participants will be calculated. NMIJ and CMS willserve as a linking laboratories.
3) At Reynolds number of 70,000, 100,000 and 300,000, the DoE among theparticipants will be calculated.
4) Draft A and Draft B will be distributed to the participants in accordance with the Guidelines.
10. References[1] APMP-G2, The Guidelines on conducting comparisons [2] Comité International des Poids et Mesures (CIPM), Mutual Recognition of National
Measurement Standards and of Calibration and Measurement Certificates Issued by National Metrology Institutes, Paris, France, October, 1999.
[3] Cox, M. G., The Evaluation of Key Comparison Data, Metrologia, 39, 589-595, 2002. [4] Delahaye, F and Witt, T. J., Linking the Results of Key Comparison CCEM-K4 with
the 10 pF Results of EUROMET Project 345, Metrologia, 39, Technical Supplement 01005 , 2002.

Final Report on APMP.M.FF-K2.a
63
Appendix 1 Assembly Manual for Package
1. Schematic of the meter package
Fig. A1-1 Schematic of the package
Fig. A1-2 A picture of the package
(6" ANSI 150lb RF)
195
(1)~(3) Upstream pipe
610
805
(3) Pipe (6" ANSI 150lb RF, 6" Sch40)
(2) Filter
(1) Flange(6" ANSI 150lb FF)
(4) PD Meter
(1) (2) (3) (4)
FLOW

Final Report on APMP.M.FF-K2.a
64
2. Unpacking and packing2.1. Box A
Fig. A1-3 Box A : Flow meter and display (990 X 630 X 755, 280 kg)
Display BEG47sensor etc
Documents
PD meter (KRAL OMG140)

Final Report on APMP.M.FF-K2.a
65
Fig. A1-4 Display and sensors.
Fig. A1-5 Projecting guides of a rotary lock should appear when a box is closed.
×○
BEG47 sensors
AC power cable for display
AC plug adapter

Final Report on APMP.M.FF-K2.a
66
2.2. Box B
Fig. A1-6 Box B : Upstream pipe (380 X 380 X 410, 45 kg)
ATTENTION: Place the upstream pipe on the
box properly so that the formed plastic attached at the inside of the lid comes between the projections of the filter on the pipe.

Final Report on APMP.M.FF-K2.a
67
3. PD meterTable A1-1 Specification of PD meter
Manufacturer KRAL Nominal size 150 mm(6 inch) Model OMG140.6052947 Flanges ANSI 150lb RF S/N 136565 Length 610 mm K factor 8.837 P/L Max. Press. 10 bar Flow Range Q_nom(max)
300(450)m3/h 5000(7500)L/min
Max Temp. 100 ºC
Fig. A1-7 Pictures of the inlet and outlet of the PD meter.
Fig. A1-8 Pictures of the sensor
Please care about dust. BEG47 sensor

Final Report on APMP.M.FF-K2.a
68
Fig. A1-9 Connecting instruction for BEG47sensor
Fig. A1-10 Deal with anti-rust treatment (ex. anti-rust spray) to the wetted part of the PD meter.
Note : Close the inlet and the outlet of the flow meter using the blind flanges except measurement in order to prevent rust.
Note : Before packing the all components into the carriage boxes, please make sure no liquid remained inside the components and deal with anti-rust treatment (ex. anti-rust spray) to the wetted part of the PD meter.
Don’t turn the drysleeve screw. NO PULL
Fix sensor cable to avoid any accidental stress to the sensor.
×

Final Report on APMP.M.FF-K2.a
69
4. Wiring of PD meter signal
Fig. A1-11 Wiring of PD meter signal transmission. Red:Components sent from NMIJ, Blue : Connecting wires, cable glands and a terminal box should be prepared by the participants.
Fig. A1-12 Example:Increased Safety–Explosion Proof Terminal box and Cable glands.
Display Supply 100 ~ 240VAC
OMG140
Pulse out (O.C. pulse, 24V pulse or TTL)
OUT
IN BEG47
Terminal box
Sig+:brown, 0V:blue
Safety area Hazardous area
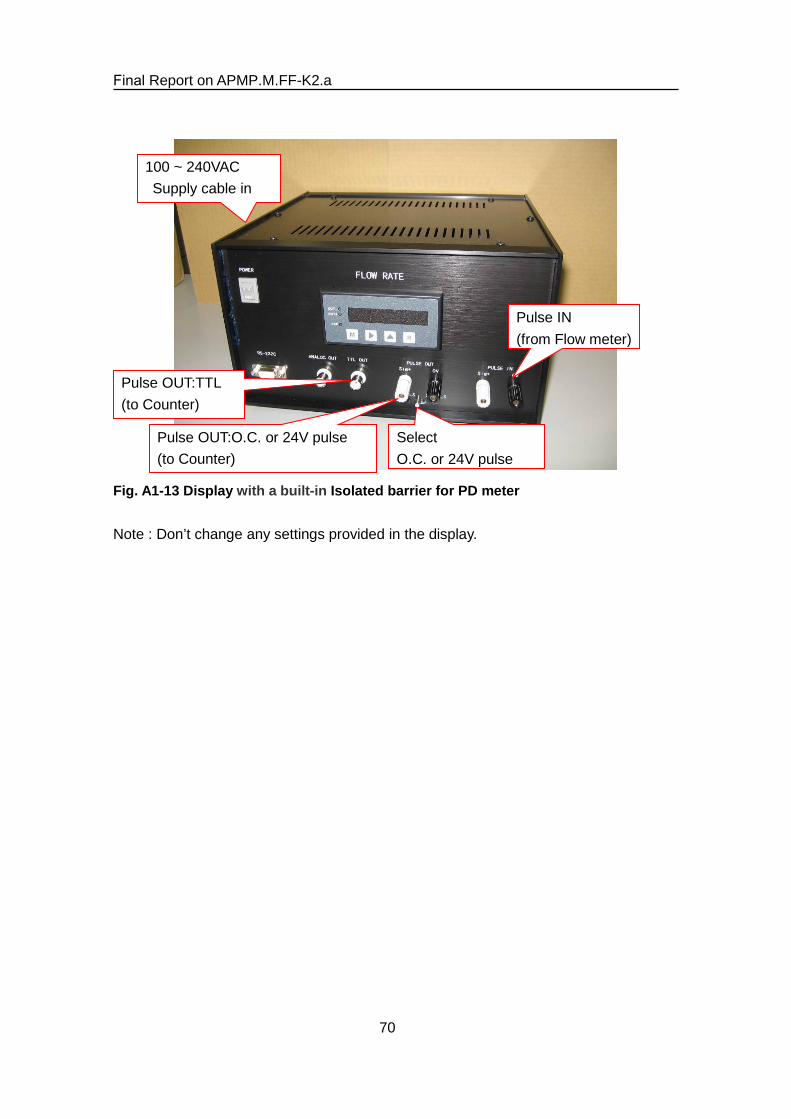
Final Report on APMP.M.FF-K2.a
70
Fig. A1-13 Display with a built-in Isolated barrier for PD meter
Note : Don’t change any settings provided in the display.
Select O.C. or 24V pulse
Pulse IN (from Flow meter)
Pulse OUT:O.C. or 24V pulse (to Counter)
100 ~ 240VAC Supply cable in
Pulse OUT:TTL (to Counter)

Final Report on APMP.M.FF-K2.a
71
5. Upstream pipe
Fig. A1-14 Upstream pipe
Fig. A1-15 Properly align the filter with the pipe center.
BAD GOOD

Final Report on APMP.M.FF-K2.a
72
Fig. A1-16 Pressure measurement at the two pressure taps of the upstream pipe with the filter if necessary.
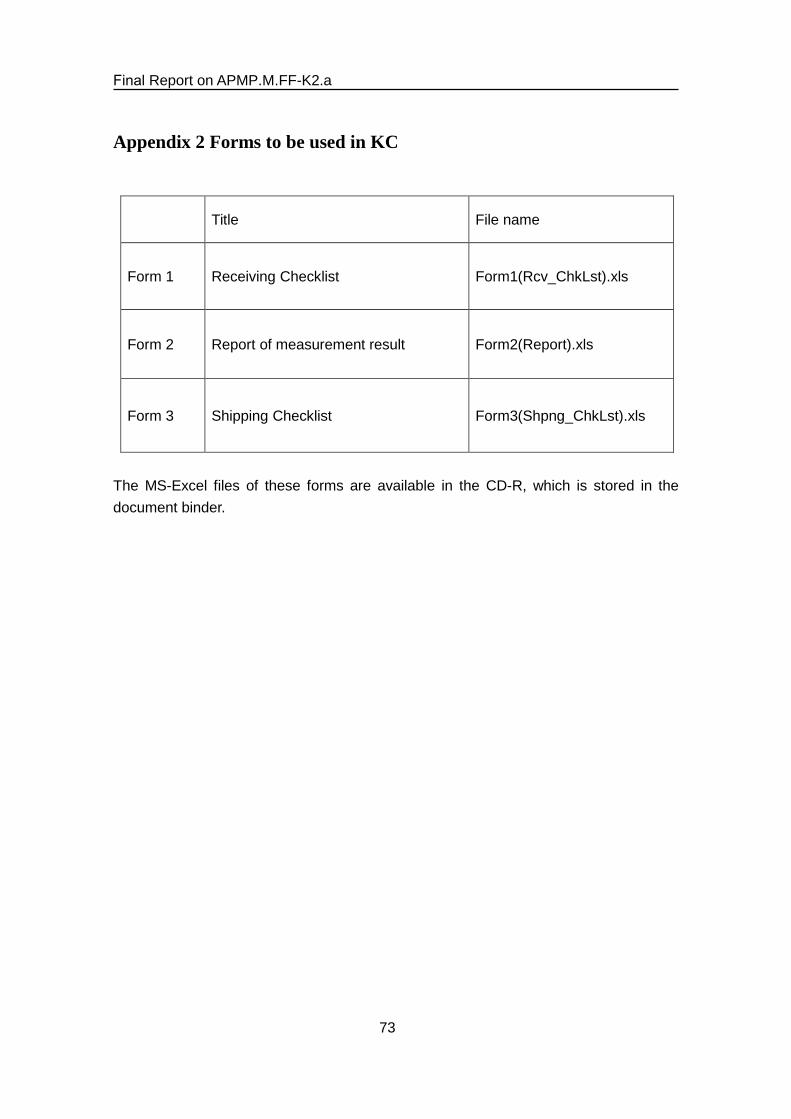
Final Report on APMP.M.FF-K2.a
73
Appendix 2 Forms to be used in KC
Title File name
Form 1 Receiving Checklist Form1(Rcv_ChkLst).xls
Form 2 Report of measurement result Form2(Report).xls
Form 3 Shipping Checklist Form3(Shpng_ChkLst).xls
The MS-Excel files of these forms are available in the CD-R, which is stored in the document binder.
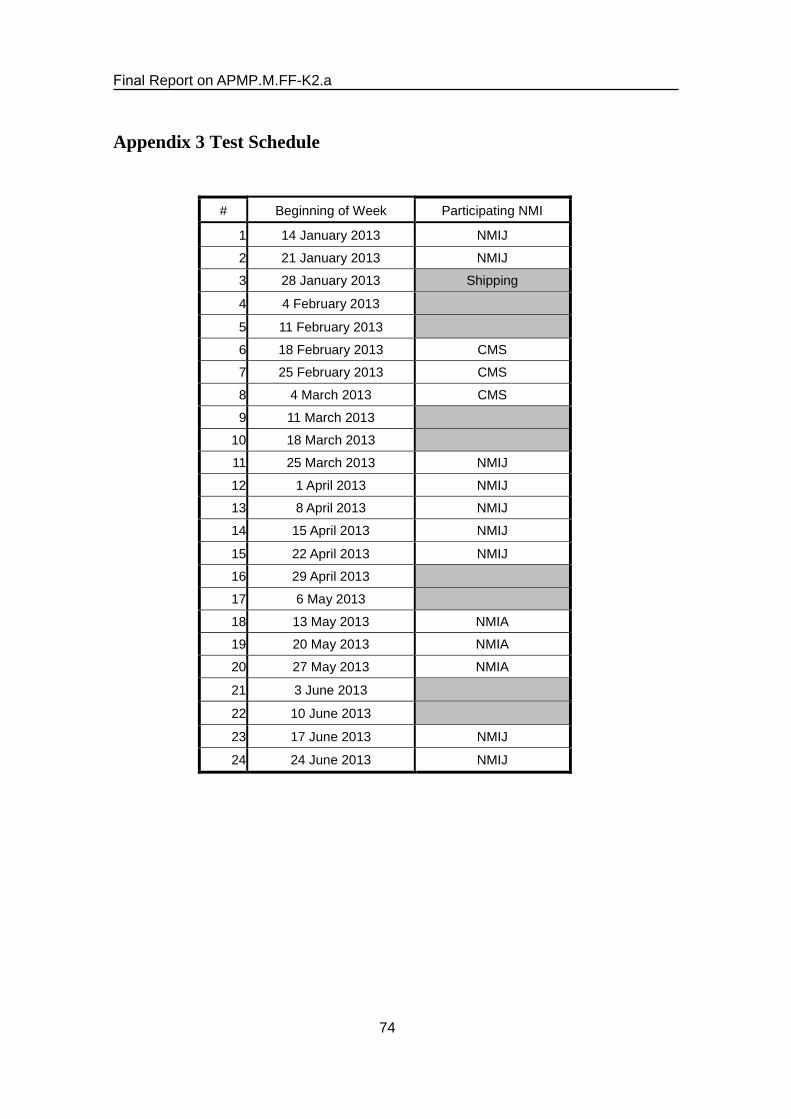
Final Report on APMP.M.FF-K2.a
74
Appendix 3 Test Schedule
# Beginning of Week Participating NMI
1 14 January 2013 NMIJ
2 21 January 2013 NMIJ 3 28 January 2013 Shipping
4 4 February 2013
5 11 February 2013
6 18 February 2013 CMS 7 25 February 2013 CMS
8 4 March 2013 CMS
9 11 March 2013 10 18 March 2013
11 25 March 2013 NMIJ
12 1 April 2013 NMIJ 13 8 April 2013 NMIJ
14 15 April 2013 NMIJ
15 22 April 2013 NMIJ 16 29 April 2013
17 6 May 2013
18 13 May 2013 NMIA 19 20 May 2013 NMIA
20 27 May 2013 NMIA
21 3 June 2013
22 10 June 2013
23 17 June 2013 NMIJ
24 24 June 2013 NMIJ