Embed Size (px)
Citation preview
Final Report on the Annual Proficiency Test EQA2005
AGENCY’S LABORATORIES, A 2444 SEIBERSDORF, AUSTRIA TELEPHONE: (+43 1) 2600 2891, FACSIMILE: (+43 1) 2600 28222
E-MAIL: [email protected], INTERNET: http://www.iaea.or.at/programmes/naal/
Final Report on the Annual Proficiency Test “EQA2005”
for the Measurement of 15N and 13C Isotopic Abundance
and Total Nitrogen- and Carbon Concentration in Plant Materials
Department of Nuclear Sciences and Applications Joint FAO/IAEA Division of Nuclear Techniques in Food and Agriculture
FAO/IAEA Biotechnology and Agriculture Laboratories Soil Science Unit1
& Department of Nuclear Sciences and Applications Physics, Chemistry and Instrumentation Laboratory
Chemistry Unit2
Martina Aigner1, Abdulghani Shakhashiro2, Alexander Trinkl2
Seibersdorf, January 2006

Final Report on the Annual Proficiency Test EQA2005
TABLE OF CONTENTS 1. Abstract……………………………………………………………………… 1 2. Introduction …………………………………………..………………………. 3 3. Objective of the Proficiency Test Introduction ………………………..…… 4 4. Participation in the Proficiency Test …………………………………..…… 5 5. Materials and Methods .…………………………………………………….. 5
Production of the Plant Test Materials …………………………..…... 6 Analytical Evaluation of the Plant Test Materials…………………… 6
Homogeneity…….………………………………………..… 6 Establishing the Target Values …..……………………….… 7
6. Target Values and Associated Uncertainties ……………………………..… 8 Uncertainties of the target values…………………………………..… 9 Accuracies of the target values…………………………………..…… 9
7. Performance criteria ………………………………………………………… 11 (1) Relative Bias ……………………………………………………… 11 (2) The z-score ………………………….………………………….… 11
8. Evaluation criteria …………………………………………………………… 12 9. Results and discussion ………………………………………………….…… 13
9.1. Overview of performance ………………………………….….… 13 9.2. Summary graphs: z-score plots sorted by analyte ………….…… 14 9.3. Participant’s responses to questionnaire F-03D …………….….. 16 9.4. Individual comments and recommendations to participants ….… 17
10. Conclusions and Recommendations ………………………………….….. 21 11. Acknowledgements ……………………………………………………..… 21 12. References ………………………………………………………………… 22 ANNEX: A: Performance evaluation tables sorted by laboratory code…………………… 25 B: Performance evaluation tables sorted by material and by analyte ………… 37 C: Individual monitoring graphs of analytical performance (2000 – 2005)…… 47 D: Covering letter, instruction- and report forms, questionnaire, certificates …. 67 E: Participants in EQA2005, listed by region …….………………………...… 89 F: Standard Operating Procedure of Kjeldahl analysis on plant materials…..… 93


Final Report on the Annual Proficiency Test EQA2005
Page 1
Final Report on the annual Proficiency Test “EQA2005” for the measurement of 15N- and 13C isotopic abundance and total nitrogen- and carbon concentration in plant materials
1. Abstract This report presents the results from Proficiency Test (PT) “EQA2005” on the capability of the participating laboratories to determine the isotopic abundance of two stable isotopes, 15N at enriched levels and 13C at natural abundance level, as well as the total element concentration of nitrogen and carbon in three unknown plant materials. The PT included a questionnaire on the applied quality control measures and on the current status of quality system implementation in the participating laboratories. This PT on stable isotope analysis in plant materials, organised free of charge for all participating laboratories, was initiated in 1995 and has been performed annually since 1998. In 2005, 22 laboratories from 21 countries in Africa, Asia, Europe and Latin America initially agreed to participate. Eighteen weeks were allocated to the analyses and submission of the questionnaire. Seventeen laboratories submitted the complete set of analytical results within this deadline and are thus included in this report. The choice of applied analytical method was decided by the participants and depended mainly on the available instrumentation (see Table (1)).
Applied methods: OES / Kjeldahl
Applied methods: MS / dry combustion
Region
Number of participants
15N / total N
15N / total N
13C / total C
Africa 1 - 1 1 Asia 9 6 3 2 Europe 5 3 2 1 Latin America 2 1 1 1
TOTAL
17
10
7
5
Table (1): Summary of applied methods and instrumentation listed per region (OES = optical emission spectrometry, MS = mass spectrometry). The results were evaluated by statistical methods for assessing laboratory analytical performance (accuracy and precision) by the “z-score test”. The standard deviation
Final Report on the Annual Proficiency Test EQA2005
Page 2
for proficiency assessment was set at a value corresponding ‘to the level of performance that the organizer wishes the laboratories to be able to achieve’ [1]. Individual assessments on sources of possible errors and proposed improvements of the applied methods were provided to each participant (see section 9. Results and discussion). The majority of the participating laboratories, i.e. 11 of 17 (65 %) showed proficiency in the analysis of plant materials for 15N abundance and 4 of 5 (80%) of the laboratories that have a mass spectrometer at their disposal and therefore the possibility to analyse 13C, showed proficiency in the analysis of plant materials for 13C abundance. Total nitrogen concentration was performed well by 13 of 17 laboratories (76 %) and total carbon element concentration by 4 of the 5 participants (80%). The results of the PT demonstrate that, at the technical level, initial appropriate steps towards quality assurance and quality control implementation had been taken by most participating laboratories (see section 9.3. Table (6)). However to ensure the sustainability of these comprehensive quality management processes, a proactive management commitment must be equally ensured. In EQA2005 a total of eleven participating laboratories attained the required level of proficiency for 15N – and total N analysis and four participating laboratories for 13C- and total C analysis. Six of these have attained this high level of quality for 15N – and total N analysis for three consecutive years, thus providing evidence of the sustainable proficiency of these laboratories (see Annex C, laboratory codes 02, 04, 12, 13, 14, 18). For 13C- and total C analysis one more PT is required to estimate the sustainability of analytical quality.
Final Report on the Annual Proficiency Test EQA2005
Page 3
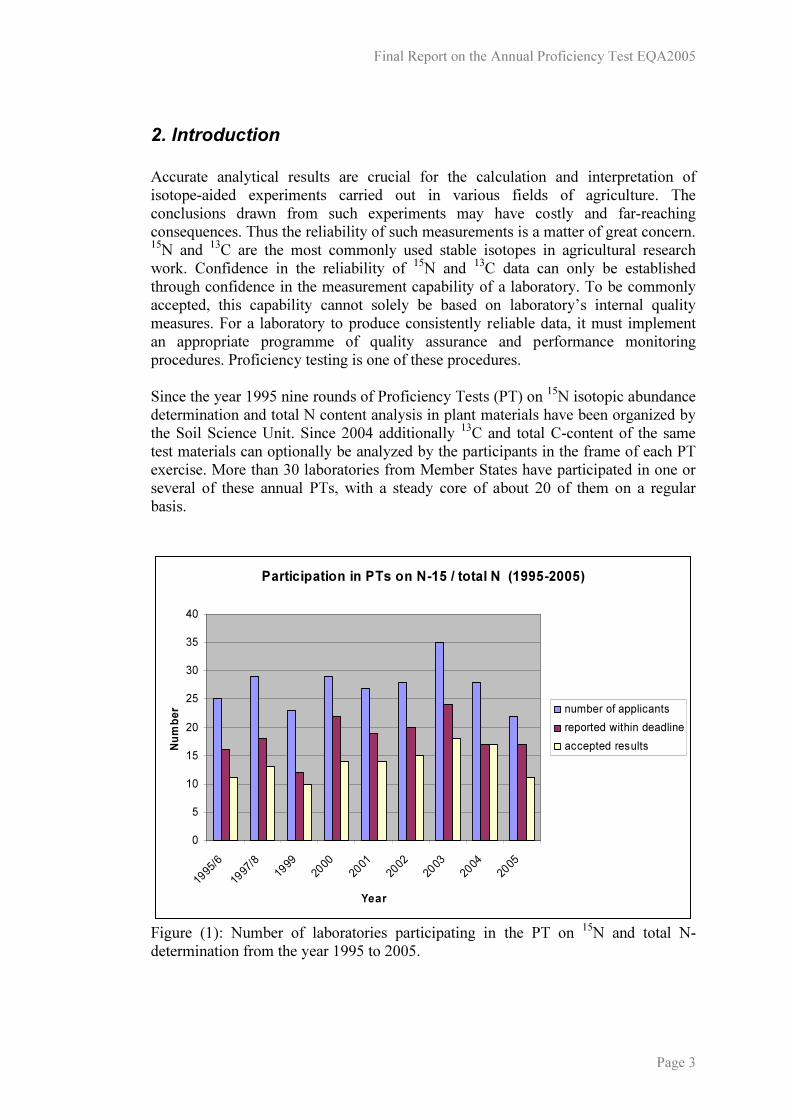
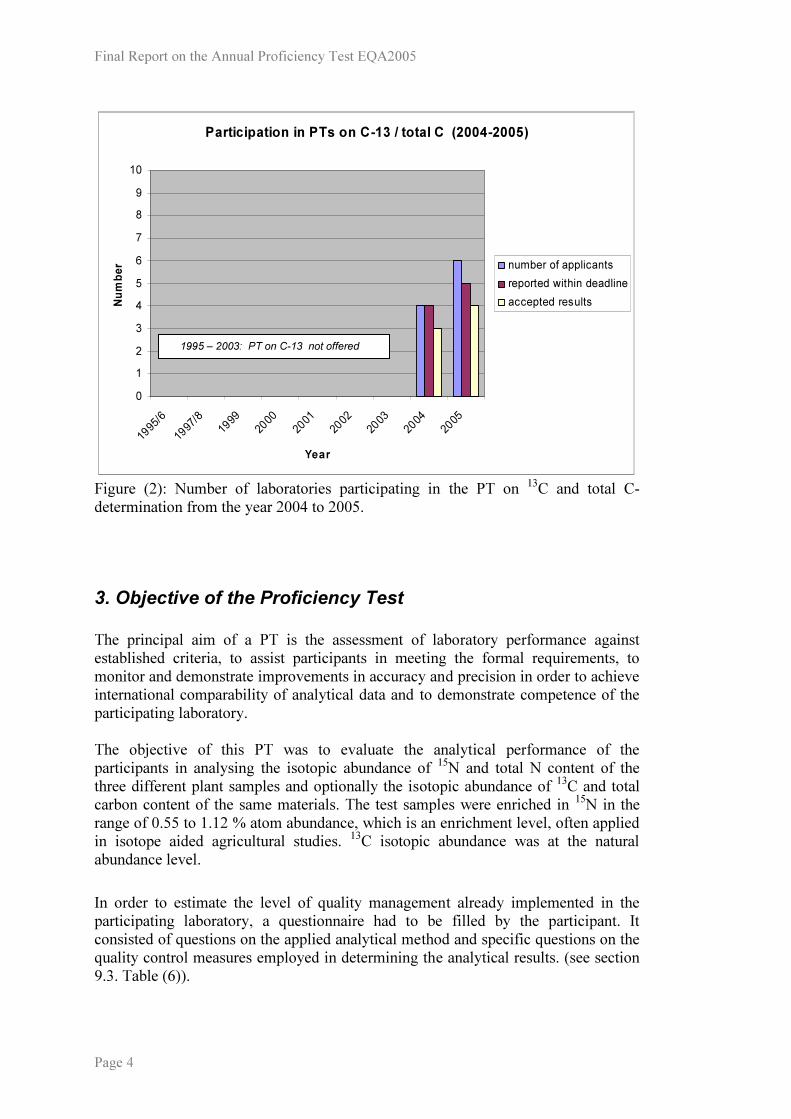
2. Introduction Accurate analytical results are crucial for the calculation and interpretation of isotope-aided experiments carried out in various fields of agriculture. The conclusions drawn from such experiments may have costly and far-reaching consequences. Thus the reliability of such measurements is a matter of great concern. 15N and 13C are the most commonly used stable isotopes in agricultural research work. Confidence in the reliability of 15N and 13C data can only be established through confidence in the measurement capability of a laboratory. To be commonly accepted, this capability cannot solely be based on laboratory’s internal quality measures. For a laboratory to produce consistently reliable data, it must implement an appropriate programme of quality assurance and performance monitoring procedures. Proficiency testing is one of these procedures. Since the year 1995 nine rounds of Proficiency Tests (PT) on 15N isotopic abundance determination and total N content analysis in plant materials have been organized by the Soil Science Unit. Since 2004 additionally 13C and total C-content of the same test materials can optionally be analyzed by the participants in the frame of each PT exercise. More than 30 laboratories from Member States have participated in one or several of these annual PTs, with a steady core of about 20 of them on a regular basis.
Participation in PTs on N-15 / total N (1995-2005)
0
5
10
15
20
25
30
35
40
1995/6
1997/8
1999
2000
2001
2002
2003
2004
2005
Year
Num
ber number of applicants
reported within deadlineaccepted results
Figure (1): Number of laboratories participating in the PT on 15N and total N-determination from the year 1995 to 2005.
Final Report on the Annual Proficiency Test EQA2005
Page 4
Participation in PTs on C-13 / total C (2004-2005)
0123456789
10
1995/6
1997/8
1999
2000
2001
2002
2003
2004
2005
Year
Num
ber number of applicants
reported within deadlineaccepted results
Figure (2): Number of laboratories participating in the PT on 13C and total C-determination from the year 2004 to 2005.
3. Objective of the Proficiency Test The principal aim of a PT is the assessment of laboratory performance against established criteria, to assist participants in meeting the formal requirements, to monitor and demonstrate improvements in accuracy and precision in order to achieve international comparability of analytical data and to demonstrate competence of the participating laboratory. The objective of this PT was to evaluate the analytical performance of the participants in analysing the isotopic abundance of 15N and total N content of the three different plant samples and optionally the isotopic abundance of 13C and total carbon content of the same materials. The test samples were enriched in 15N in the range of 0.55 to 1.12 % atom abundance, which is an enrichment level, often applied in isotope aided agricultural studies. 13C isotopic abundance was at the natural abundance level. In order to estimate the level of quality management already implemented in the participating laboratory, a questionnaire had to be filled by the participant. It consisted of questions on the applied analytical method and specific questions on the quality control measures employed in determining the analytical results. (see section 9.3. Table (6)).
1995 – 2003: PT on C-13 not offered
Final Report on the Annual Proficiency Test EQA2005
Page 5
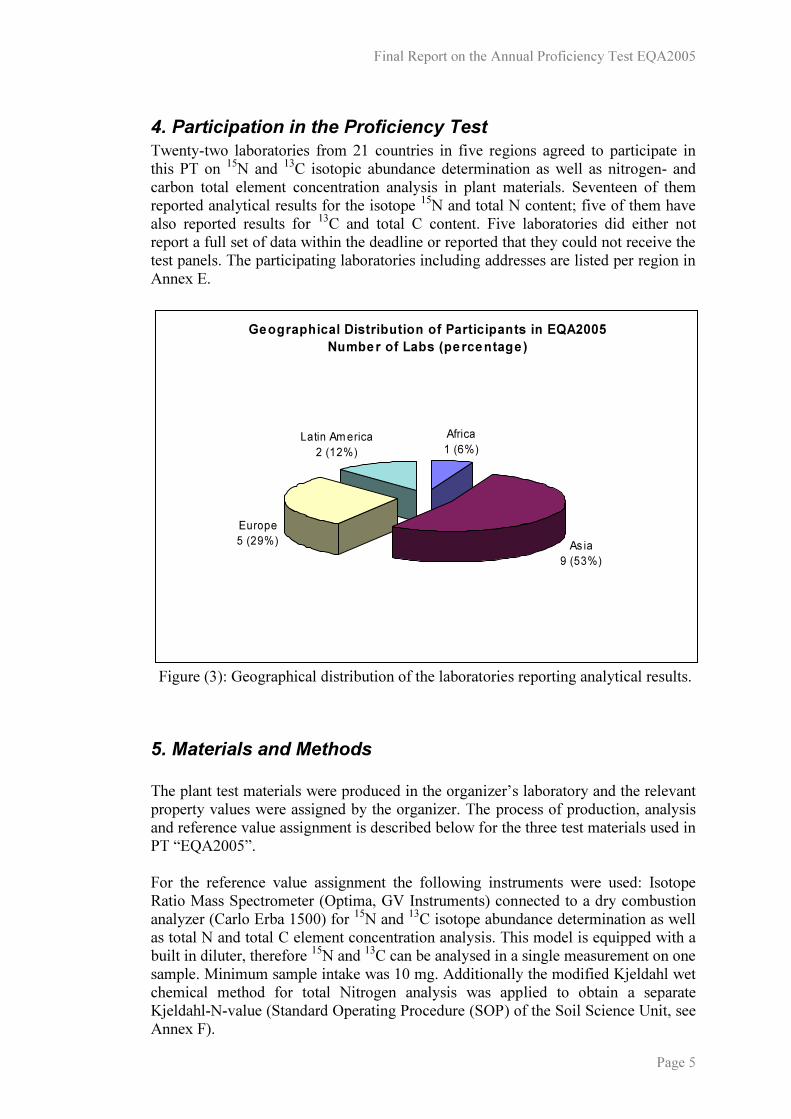
4. Participation in the Proficiency Test Twenty-two laboratories from 21 countries in five regions agreed to participate in this PT on 15N and 13C isotopic abundance determination as well as nitrogen- and carbon total element concentration analysis in plant materials. Seventeen of them reported analytical results for the isotope 15N and total N content; five of them have also reported results for 13C and total C content. Five laboratories did either not report a full set of data within the deadline or reported that they could not receive the test panels. The participating laboratories including addresses are listed per region in Annex E.
Geographical Distribution of Participants in EQA2005 Number of Labs (percentage)
Asia9 (53%)
Europe5 (29%)
Africa1 (6%)
Latin America2 (12%)
Figure (3): Geographical distribution of the laboratories reporting analytical results.
5. Materials and Methods The plant test materials were produced in the organizer’s laboratory and the relevant property values were assigned by the organizer. The process of production, analysis and reference value assignment is described below for the three test materials used in PT “EQA2005”. For the reference value assignment the following instruments were used: Isotope Ratio Mass Spectrometer (Optima, GV Instruments) connected to a dry combustion analyzer (Carlo Erba 1500) for 15N and 13C isotope abundance determination as well as total N and total C element concentration analysis. This model is equipped with a built in diluter, therefore 15N and 13C can be analysed in a single measurement on one sample. Minimum sample intake was 10 mg. Additionally the modified Kjeldahl wet chemical method for total Nitrogen analysis was applied to obtain a separate Kjeldahl-N-value (Standard Operating Procedure (SOP) of the Soil Science Unit, see Annex F).
Final Report on the Annual Proficiency Test EQA2005
Page 6
The Optical Emission Spectrometers (OES, models FAN-NOI6 and FAN-NOI7) were used in previous studies on test materials with a wide range of nitrogen contents and 15N enrichments to obtain a good estimate of the measurement uncertainty associated with the frequently applied method combination of Kjeldahl sample-preparation and 15N abundance determination by OES. Production of the Plant Test Materials. Ryegrass (Lolium perenne) and maize (Zea mays, hybrid) were grown in 4 x 4 m field plots on the experimental site in Seibersdorf from April to September 2004. Ryegrass seeds were distributed evenly over the plot. For maize the between row distance was 50 cm, the between plants distance was 18 cm. All plants were labeled with 15N-enriched ammonia sulphate (AS) solution in 3 split applications at 8, 46 and 73 days after planting (DAP) using watering cans for application of the diluted AS-solutions. Ryegrass received 75 kg nitrogen per ha, 1.4 % 15N atom abundance, uniformly distributed over all plants. Maize received 150 kg nitrogen per hectar, 2.4 % 15N atom abundance, in bands close to the stems onto the soil. Maize was cut 5 cm above ground (avoiding soil contamination of the stems) at 94 DAP and cobs and shoots were separated. Ryegrass was cut at 56 DAP, re-grown and harvested at 134 DAP using a commercial lawn mower with collection bag for the plant material. The materials were chopped into 2 cm pieces immediately after the harvest and then dried for 48 hours at 70 ±1 °C in aluminum tubs (84 x 32 x 8 cm). The dry bulk materials were milled in an ultra centrifugal mill to a particle size of 0.2 mm. After milling, 9.8 kg dry shoots and 13.3 kg dry cobs for maize and 4.3 kg dry ryegrass material were obtained. Homogenization of the three bulk materials after milling was done in a concrete mixer of 150 L volume for 24 hours per material. Thorough cleaning of the mixer with water and drying with compressed air were performed between each new material to avoid cross contamination.
Analytical Evaluation of the Plant Test Materials. Homogeneity. The procedure of homogenization described above was tested in several previous experiments and proved to be sufficient to achieve adequate homogeneity with respect to the distribution of the analytes total nitrogen and total carbon, as well as 15N and 13C atom abundance.
Final Report on the Annual Proficiency Test EQA2005
Page 7
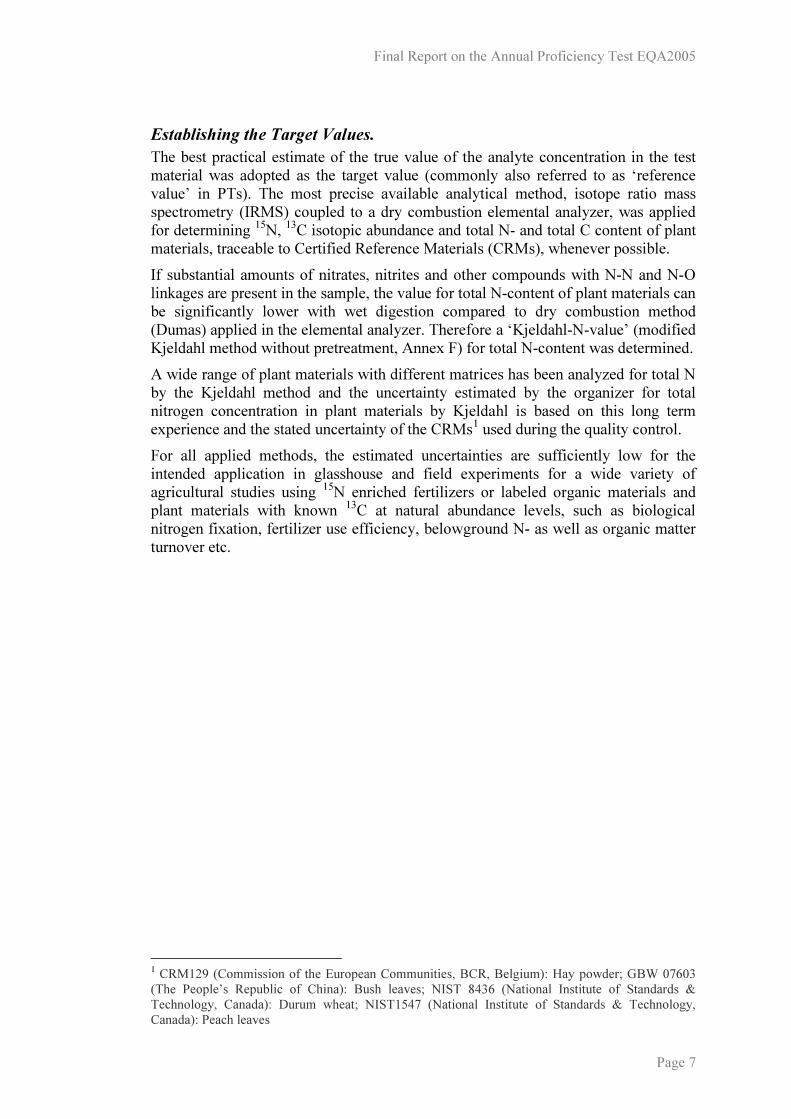
Establishing the Target Values. The best practical estimate of the true value of the analyte concentration in the test material was adopted as the target value (commonly also referred to as ‘reference value’ in PTs). The most precise available analytical method, isotope ratio mass spectrometry (IRMS) coupled to a dry combustion elemental analyzer, was applied for determining 15N, 13C isotopic abundance and total N- and total C content of plant materials, traceable to Certified Reference Materials (CRMs), whenever possible. If substantial amounts of nitrates, nitrites and other compounds with N-N and N-O linkages are present in the sample, the value for total N-content of plant materials can be significantly lower with wet digestion compared to dry combustion method (Dumas) applied in the elemental analyzer. Therefore a ‘Kjeldahl-N-value’ (modified Kjeldahl method without pretreatment, Annex F) for total N-content was determined. A wide range of plant materials with different matrices has been analyzed for total N by the Kjeldahl method and the uncertainty estimated by the organizer for total nitrogen concentration in plant materials by Kjeldahl is based on this long term experience and the stated uncertainty of the CRMs1 used during the quality control. For all applied methods, the estimated uncertainties are sufficiently low for the intended application in glasshouse and field experiments for a wide variety of agricultural studies using 15N enriched fertilizers or labeled organic materials and plant materials with known 13C at natural abundance levels, such as biological nitrogen fixation, fertilizer use efficiency, belowground N- as well as organic matter turnover etc.
1 CRM129 (Commission of the European Communities, BCR, Belgium): Hay powder; GBW 07603 (The People’s Republic of China): Bush leaves; NIST 8436 (National Institute of Standards & Technology, Canada): Durum wheat; NIST1547 (National Institute of Standards & Technology, Canada): Peach leaves

Final Report on the Annual Proficiency Test EQA2005
Page 8
6. Target Values and Associated Uncertainties To determine the target value, 18 analyses per test material were performed on 3 different days, i.e. 6 analyses per day. In each mass spectrometric analysis the four different analytes were determined in one run, i.e. 15N, 13C, total N and total C. The arithmetic means of these 18 analyses results were used as ‘best estimate’ of the true property values. The minimum sample intake was 10 mg2.
Analytical scheme for the determination of the reference valueMaterial Bulk
Sample 01 Sample 02 Sample 03
Day 1 Day 2 Day 3 Day 1 Day 2 Day 3 Day 1 Day 2 Day 3
Figure (4): Analytical scheme for analysis of the test samples.
Evaluation scheme for the determination of the reference value
Value 331Value 332
Value 321Value 322
Value 311Value 312Day 3
Value 231Value 232
Value 221Value 222
Value 211Value 212Day 2
Value 131Value 132
Value 121Value 122
Value 111Value 112Day 1
Sample 03Sample 02Sample 01
Table (2): Evaluation scheme for target value determination. 2 Since the mass spectrometer used for test sample characterization is equipped with a diluter, carbon and 13C as well as nitrogen and 15N can be measured in one sample.
Final Report on the Annual Proficiency Test EQA2005
Page 9
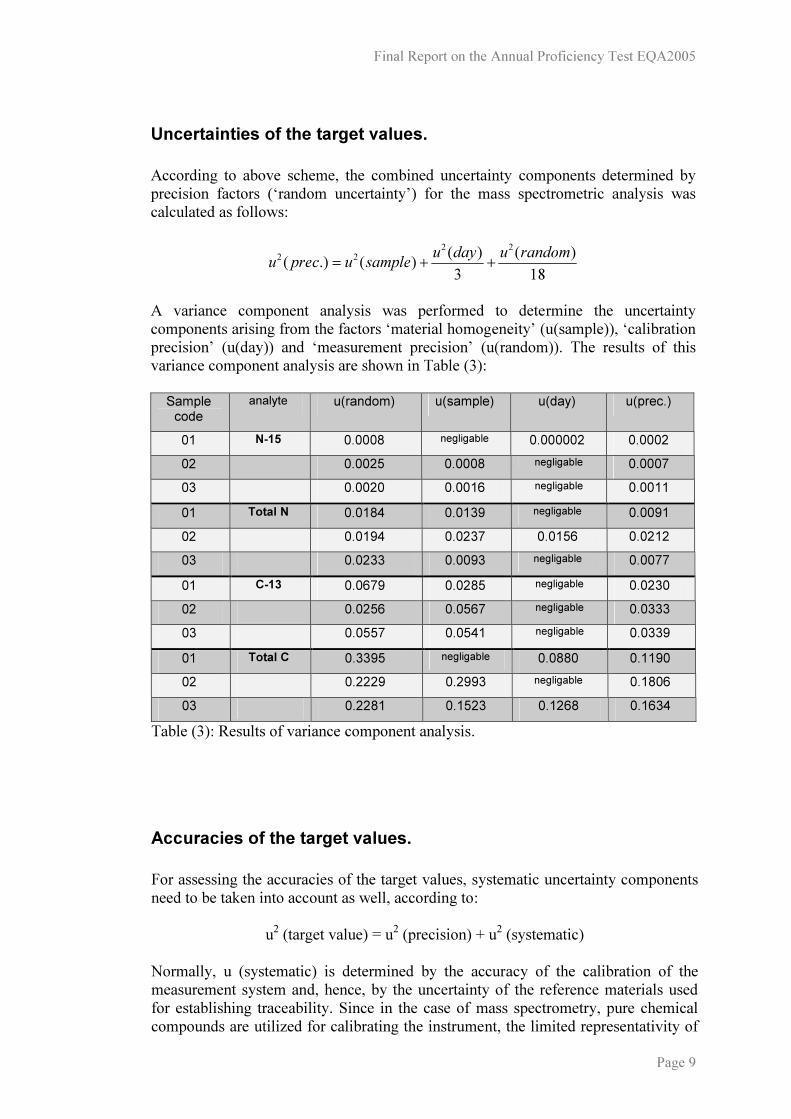
Uncertainties of the target values. According to above scheme, the combined uncertainty components determined by precision factors (‘random uncertainty’) for the mass spectrometric analysis was calculated as follows:
18)(
3)()(.)(
2222 randomudayusampleuprecu ++=
A variance component analysis was performed to determine the uncertainty components arising from the factors ‘material homogeneity’ (u(sample)), ‘calibration precision’ (u(day)) and ‘measurement precision’ (u(random)). The results of this variance component analysis are shown in Table (3): Sample code
analyte u(random) u(sample) u(day) u(prec.)
01 N-15 0.0008 negligable 0.000002 0.0002 02 0.0025 0.0008 negligable 0.0007 03 0.0020 0.0016 negligable 0.0011 01 Total N 0.0184 0.0139 negligable 0.0091 02 0.0194 0.0237 0.0156 0.0212 03 0.0233 0.0093 negligable 0.0077 01 C-13 0.0679 0.0285 negligable 0.0230 02 0.0256 0.0567 negligable 0.0333 03 0.0557 0.0541 negligable 0.0339 01 Total C 0.3395 negligable 0.0880 0.1190 02 0.2229 0.2993 negligable 0.1806 03 0.2281 0.1523 0.1268 0.1634
Table (3): Results of variance component analysis. Accuracies of the target values. For assessing the accuracies of the target values, systematic uncertainty components need to be taken into account as well, according to:
u2 (target value) = u2 (precision) + u2 (systematic) Normally, u (systematic) is determined by the accuracy of the calibration of the measurement system and, hence, by the uncertainty of the reference materials used for establishing traceability. Since in the case of mass spectrometry, pure chemical compounds are utilized for calibrating the instrument, the limited representativity of

Final Report on the Annual Proficiency Test EQA2005
Page 10
which is a known weakness, commutability between sample and calibrant is not completely assured. Therefore values for u (systematic) could only be established on the basis of ‚Type B’ estimates [4]. Note however: Relevant for most agricultural experiments are changes of concentrations. Hence, the absolute accuracy is of minor importance for practical applications. The resulting total combined standard and expanded uncertainties (unc.) are presented below. sample code 01 02 03 plant
material ryegrass maize shoots maize cobs
15N [atom%] unc. 15N [atom%] unc. 15N [atom%] unc.
0.553 0.0071 1.076 0.0071 1.119 0.0071
N Kjeldahl [weight %]
unc.
N Kjeldahl [weight %]
unc.
N Kjeldahl [weight %]
unc.
1.78 0.098 0.85 0.098 1.18 0.098
N dry combustion [weight %]
unc.
N dry combustion [weight %]
unc.
N dry combustion [weight %]
unc.
N
1.94 0.097 0.90 0.045 1.24 0.062
13C [delta‰] unc. 13C [delta‰] unc. 13C [delta‰] unc.
-29.24 0.140 -11.97 0.140 -11.22 0.140
C dry combustion [weight %]
unc.
C dry combustion [weight %]
unc.
C dry combustion [weight %]
unc.
C
36.24 1.812 43.10 2.155 43.71 2.186
Table (4): Summary of reference values and uncertainties of the three test materials
Final Report on the Annual Proficiency Test EQA2005
Page 11
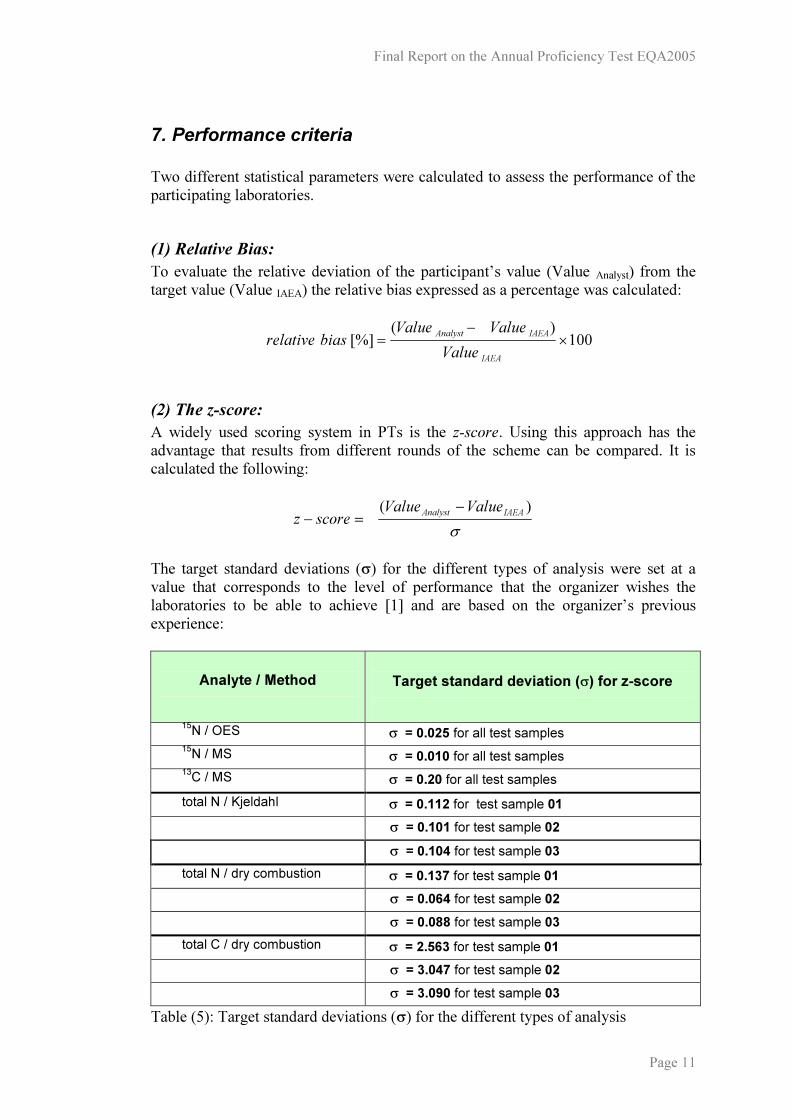
7. Performance criteria Two different statistical parameters were calculated to assess the performance of the participating laboratories. (1) Relative Bias: To evaluate the relative deviation of the participant’s value (Value Analyst) from the target value (Value IAEA) the relative bias expressed as a percentage was calculated:
100)([%] ×−
=IAEA
IAEAAnalystValue
ValueValuebiasrelative (2) The z-score: A widely used scoring system in PTs is the z-score. Using this approach has the advantage that results from different rounds of the scheme can be compared. It is calculated the following:
σ
)( IAEAAnalyst ValueValuescorez
−=−
The target standard deviations (σ) for the different types of analysis were set at a value that corresponds to the level of performance that the organizer wishes the laboratories to be able to achieve [1] and are based on the organizer’s previous experience:
Analyte / Method
Target standard deviation (σ) for z-score
15N / OES σ = 0.025 for all test samples 15N / MS σ = 0.010 for all test samples 13C / MS σ = 0.20 for all test samples total N / Kjeldahl σ = 0.112 for test sample 01 σ = 0.101 for test sample 02 σ = 0.104 for test sample 03 total N / dry combustion σ = 0.137 for test sample 01 σ = 0.064 for test sample 02 σ = 0.088 for test sample 03 total C / dry combustion σ = 2.563 for test sample 01 σ = 3.047 for test sample 02
σ = 3.090 for test sample 03 Table (5): Target standard deviations (σ) for the different types of analysis
Final Report on the Annual Proficiency Test EQA2005
Page 12
8. Evaluation criteria To state the overall performance of the participating laboratory in PT “EQA2005”, the results were exclusively evaluated against the z-score test and received the status “passed”, when the calculated z-score is smaller or equal to the value of ±2 or “rejected”, when the calculated z-score is exceeding the value of ±2. A certificate stating participation in the PT is provided to all participants (see Annex D). Laboratories that achieved the status “passed” in all 3 test samples for the isotope analysis (i.e. 15N and / or 13C analysis) as well as for total analyte content analysis (i.e. total N and / or total C analysis) receive a certificate stating the successful participation in either of the combined analyses (see Annex D).
Final Report on the Annual Proficiency Test EQA2005
Page 13
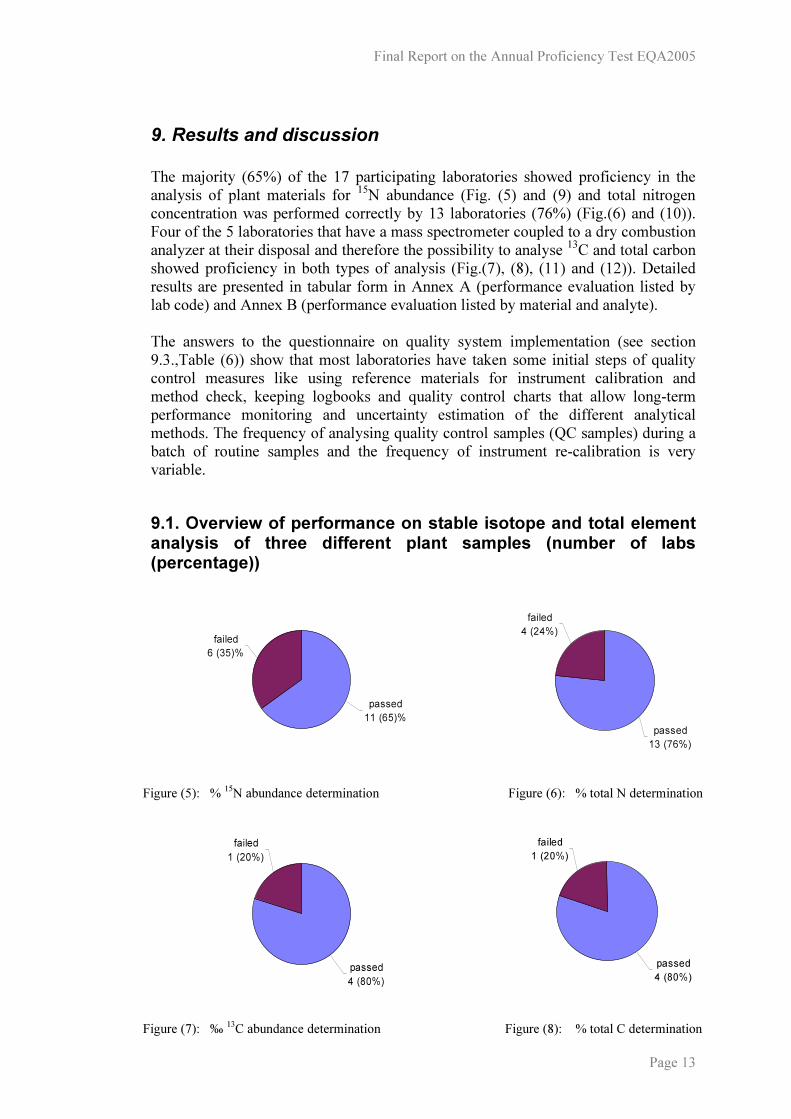
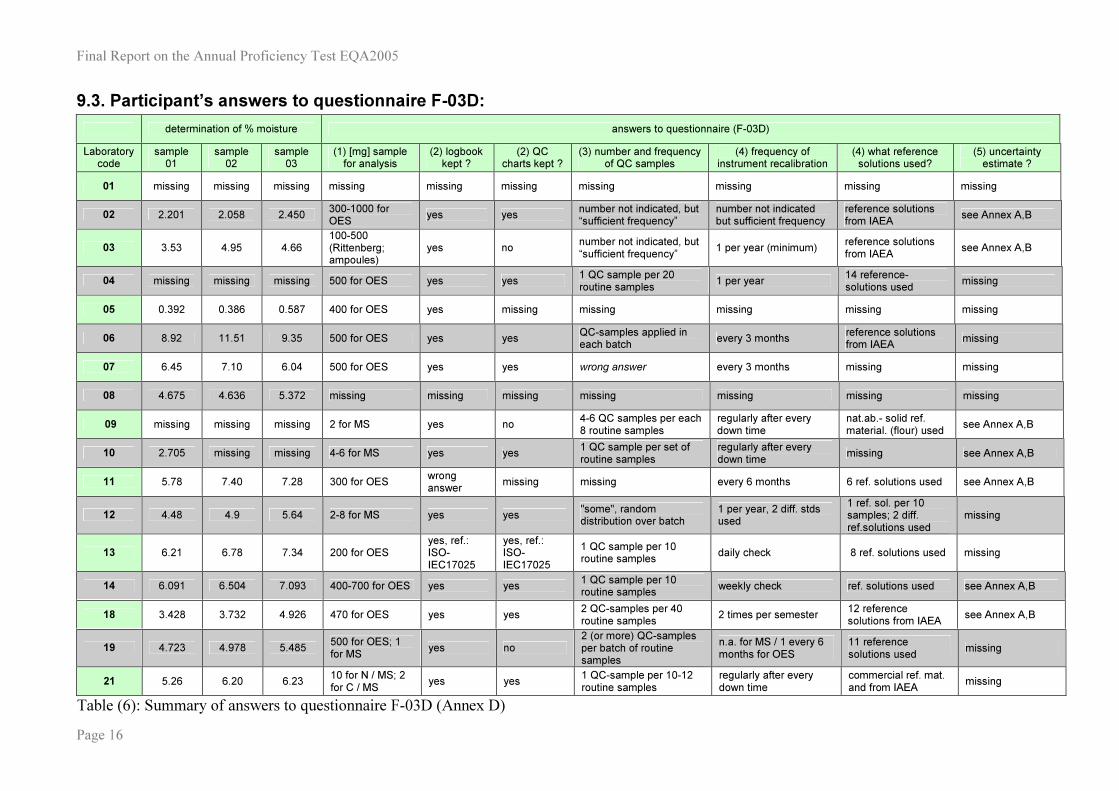
9. Results and discussion The majority (65%) of the 17 participating laboratories showed proficiency in the analysis of plant materials for 15N abundance (Fig. (5) and (9) and total nitrogen concentration was performed correctly by 13 laboratories (76%) (Fig.(6) and (10)). Four of the 5 laboratories that have a mass spectrometer coupled to a dry combustion analyzer at their disposal and therefore the possibility to analyse 13C and total carbon showed proficiency in both types of analysis (Fig.(7), (8), (11) and (12)). Detailed results are presented in tabular form in Annex A (performance evaluation listed by lab code) and Annex B (performance evaluation listed by material and analyte). The answers to the questionnaire on quality system implementation (see section 9.3.,Table (6)) show that most laboratories have taken some initial steps of quality control measures like using reference materials for instrument calibration and method check, keeping logbooks and quality control charts that allow long-term performance monitoring and uncertainty estimation of the different analytical methods. The frequency of analysing quality control samples (QC samples) during a batch of routine samples and the frequency of instrument re-calibration is very variable. 9.1. Overview of performance on stable isotope and total element analysis of three different plant samples (number of labs (percentage))
passed11 (65)%
failed6 (35)%
passed13 (76%)
failed4 (24%)
Figure (5): % 15N abundance determination Figure (6): % total N determination
passed4 (80%)
failed1 (20%)
passed4 (80%)
failed1 (20%)
Figure (7): ‰ 13C abundance determination Figure (8): % total C determination
Final Report on the Annual Proficiency Test EQA2005
Page 14
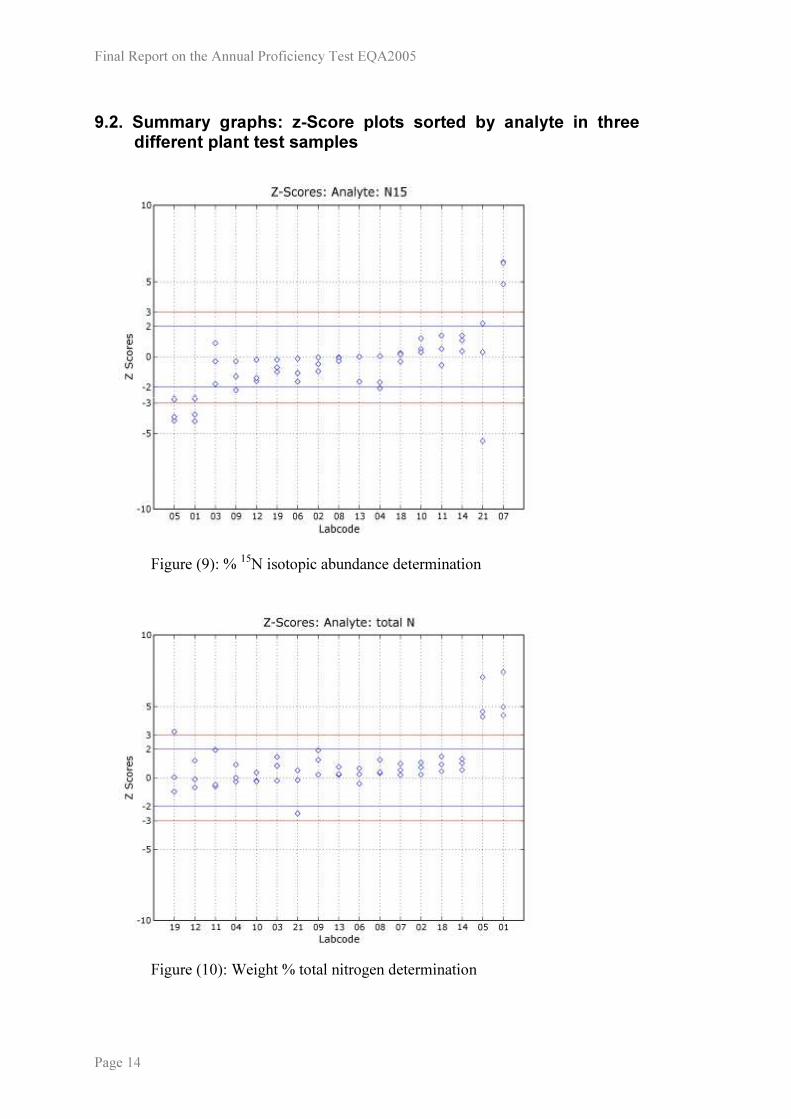
9.2. Summary graphs: z-Score plots sorted by analyte in three different plant test samples
Figure (9): % 15N isotopic abundance determination
Figure (10): Weight % total nitrogen determination
Final Report on the Annual Proficiency Test EQA2005
Page 15
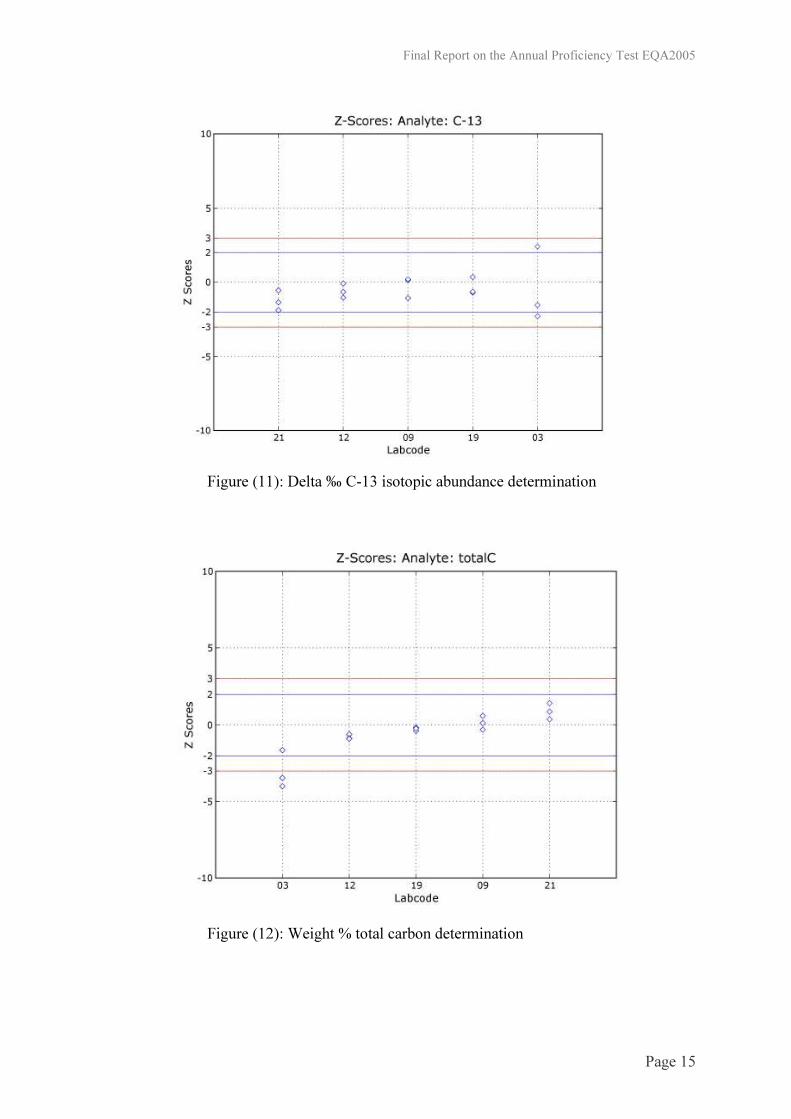
Figure (11): Delta ‰ C-13 isotopic abundance determination
Figure (12): Weight % total carbon determination
Final Report on the Annual Proficiency Test EQA2005
Page 16
9.3. Participant’s answers to questionnaire F-03D: determination of % moisture answers to questionnaire (F-03D)
Laboratory code
sample 01
sample 02
sample 03
(1) [mg] sample for analysis
(2) logbook kept ?
(2) QC charts kept ?
(3) number and frequency of QC samples
(4) frequency of instrument recalibration
(4) what reference solutions used?
(5) uncertainty estimate ?
01 missing missing missing missing missing missing missing missing missing missing
02 2.201 2.058 2.450 300-1000 for OES yes yes number not indicated, but
“sufficient frequency” number not indicated but sufficient frequency
reference solutions from IAEA see Annex A,B
03 3.53 4.95 4.66 100-500 (Rittenberg; ampoules)
yes no number not indicated, but “sufficient frequency” 1 per year (minimum) reference solutions
from IAEA see Annex A,B
04 missing missing missing 500 for OES yes yes 1 QC sample per 20 routine samples 1 per year 14 reference-
solutions used missing
05 0.392 0.386 0.587 400 for OES yes missing missing missing missing missing
06 8.92 11.51 9.35 500 for OES yes yes QC-samples applied in each batch every 3 months reference solutions
from IAEA missing
07 6.45 7.10 6.04 500 for OES yes yes wrong answer every 3 months missing missing
08 4.675 4.636 5.372 missing missing missing missing missing missing missing
09 missing missing missing 2 for MS yes no 4-6 QC samples per each 8 routine samples
regularly after every down time
nat.ab.- solid ref. material. (flour) used see Annex A,B
10 2.705 missing missing 4-6 for MS yes yes 1 QC sample per set of routine samples
regularly after every down time missing see Annex A,B
11 5.78 7.40 7.28 300 for OES wrong answer missing missing every 6 months 6 ref. solutions used see Annex A,B
12 4.48 4.9 5.64 2-8 for MS yes yes "some", random distribution over batch
1 per year, 2 diff. stds used
1 ref. sol. per 10 samples; 2 diff. ref.solutions used
missing
13 6.21 6.78 7.34 200 for OES yes, ref.: ISO-IEC17025
yes, ref.: ISO-IEC17025
1 QC sample per 10 routine samples daily check 8 ref. solutions used missing
14 6.091 6.504 7.093 400-700 for OES yes yes 1 QC sample per 10 routine samples weekly check ref. solutions used see Annex A,B
18 3.428 3.732 4.926 470 for OES yes yes 2 QC-samples per 40 routine samples 2 times per semester 12 reference
solutions from IAEA see Annex A,B
19 4.723 4.978 5.485 500 for OES; 1 for MS yes no
2 (or more) QC-samples per batch of routine samples
n.a. for MS / 1 every 6 months for OES
11 reference solutions used missing
21 5.26 6.20 6.23 10 for N / MS; 2 for C / MS yes yes 1 QC-sample per 10-12
routine samples regularly after every down time
commercial ref. mat. and from IAEA missing
Table (6): Summary of answers to questionnaire F-03D (Annex D)
Final Report on the Annual Proficiency Test EQA2005
Page 17
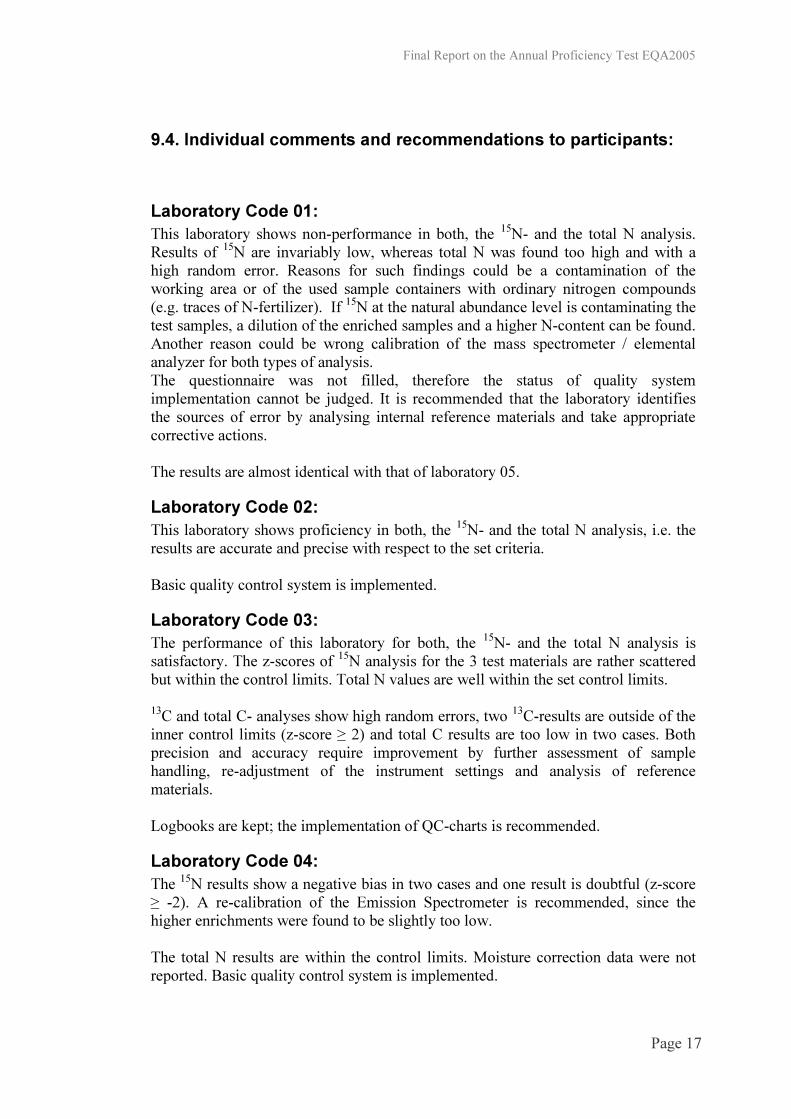
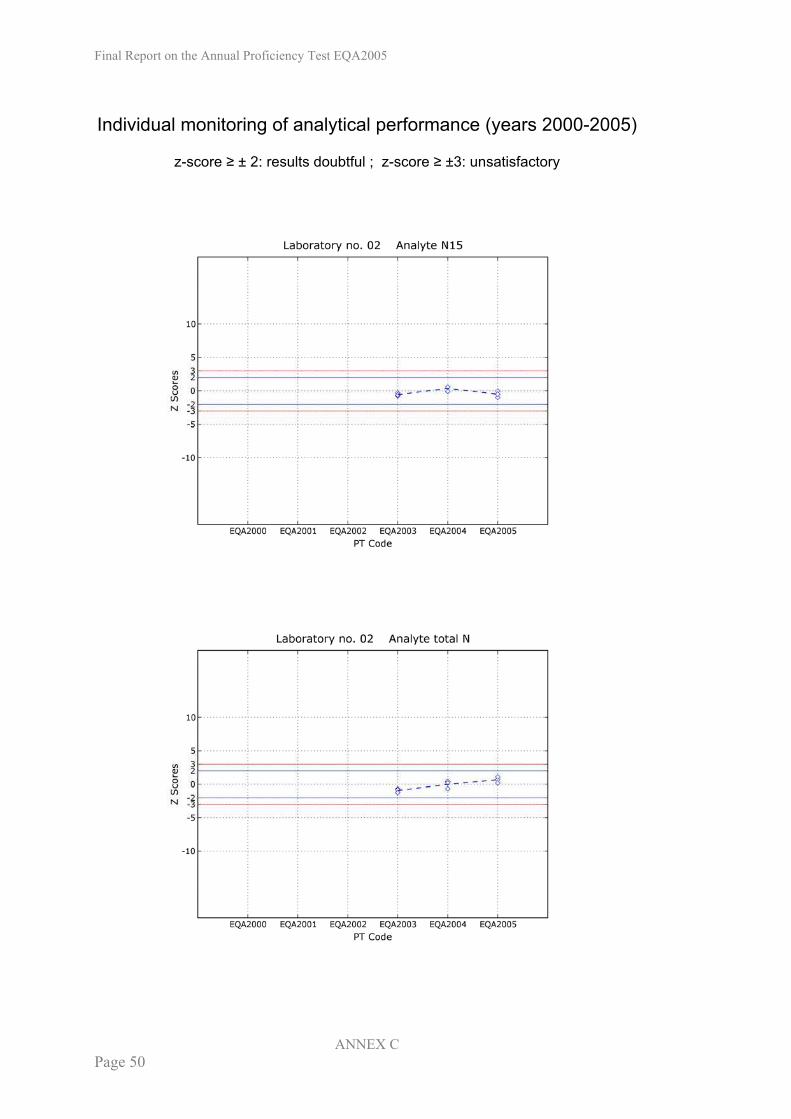
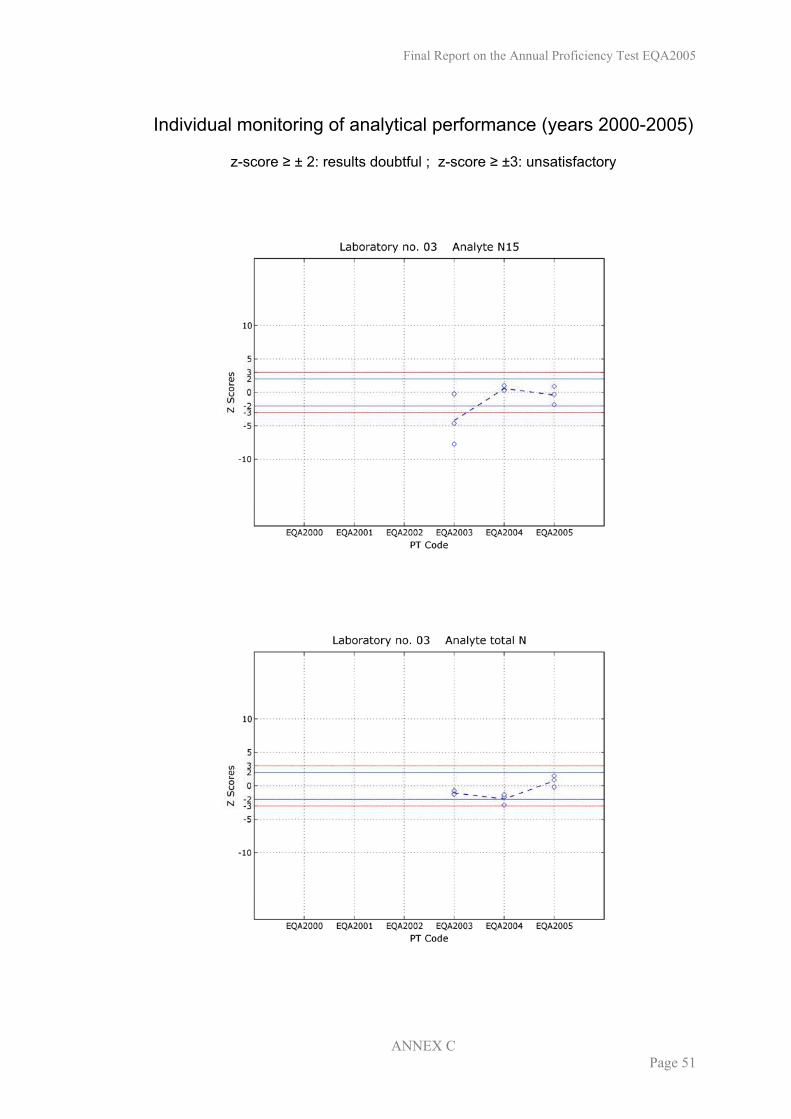
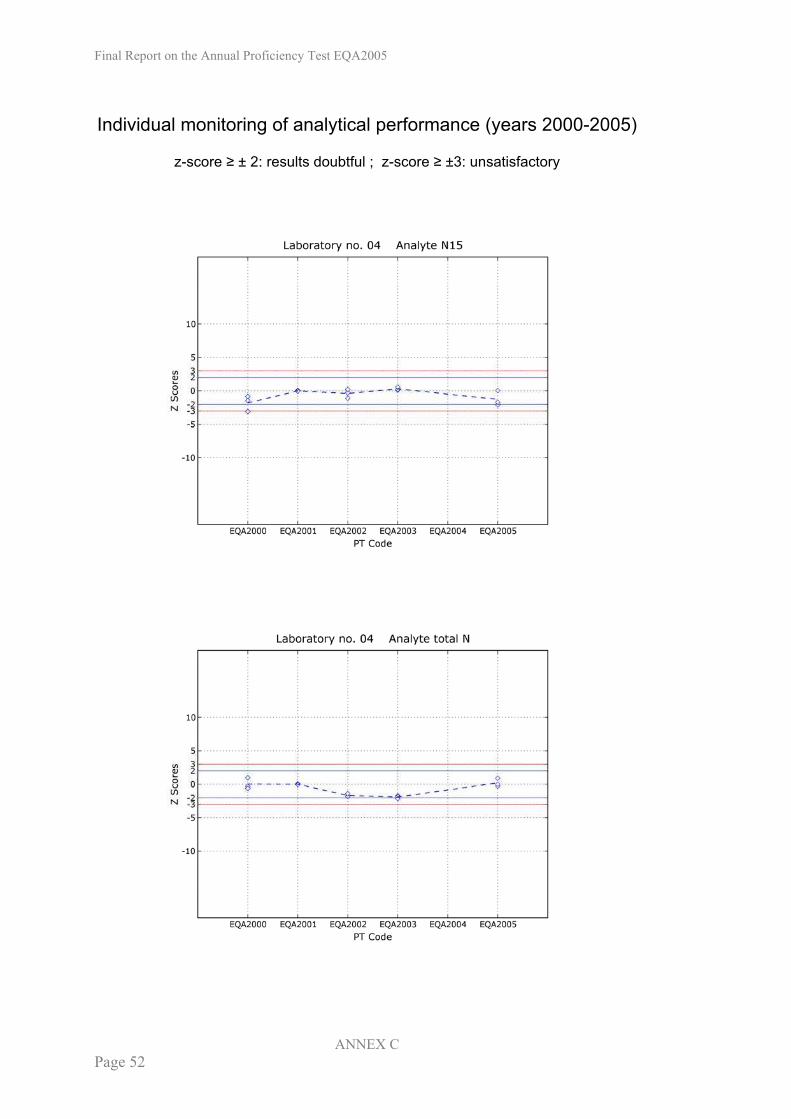
9.4. Individual comments and recommendations to participants: Laboratory Code 01: This laboratory shows non-performance in both, the 15N- and the total N analysis. Results of 15N are invariably low, whereas total N was found too high and with a high random error. Reasons for such findings could be a contamination of the working area or of the used sample containers with ordinary nitrogen compounds (e.g. traces of N-fertilizer). If 15N at the natural abundance level is contaminating the test samples, a dilution of the enriched samples and a higher N-content can be found. Another reason could be wrong calibration of the mass spectrometer / elemental analyzer for both types of analysis. The questionnaire was not filled, therefore the status of quality system implementation cannot be judged. It is recommended that the laboratory identifies the sources of error by analysing internal reference materials and take appropriate corrective actions. The results are almost identical with that of laboratory 05. Laboratory Code 02: This laboratory shows proficiency in both, the 15N- and the total N analysis, i.e. the results are accurate and precise with respect to the set criteria. Basic quality control system is implemented. Laboratory Code 03: The performance of this laboratory for both, the 15N- and the total N analysis is satisfactory. The z-scores of 15N analysis for the 3 test materials are rather scattered but within the control limits. Total N values are well within the set control limits. 13C and total C- analyses show high random errors, two 13C-results are outside of the inner control limits (z-score ≥ 2) and total C results are too low in two cases. Both precision and accuracy require improvement by further assessment of sample handling, re-adjustment of the instrument settings and analysis of reference materials. Logbooks are kept; the implementation of QC-charts is recommended. Laboratory Code 04: The 15N results show a negative bias in two cases and one result is doubtful (z-score ≥ -2). A re-calibration of the Emission Spectrometer is recommended, since the higher enrichments were found to be slightly too low. The total N results are within the control limits. Moisture correction data were not reported. Basic quality control system is implemented.
Final Report on the Annual Proficiency Test EQA2005
Page 18
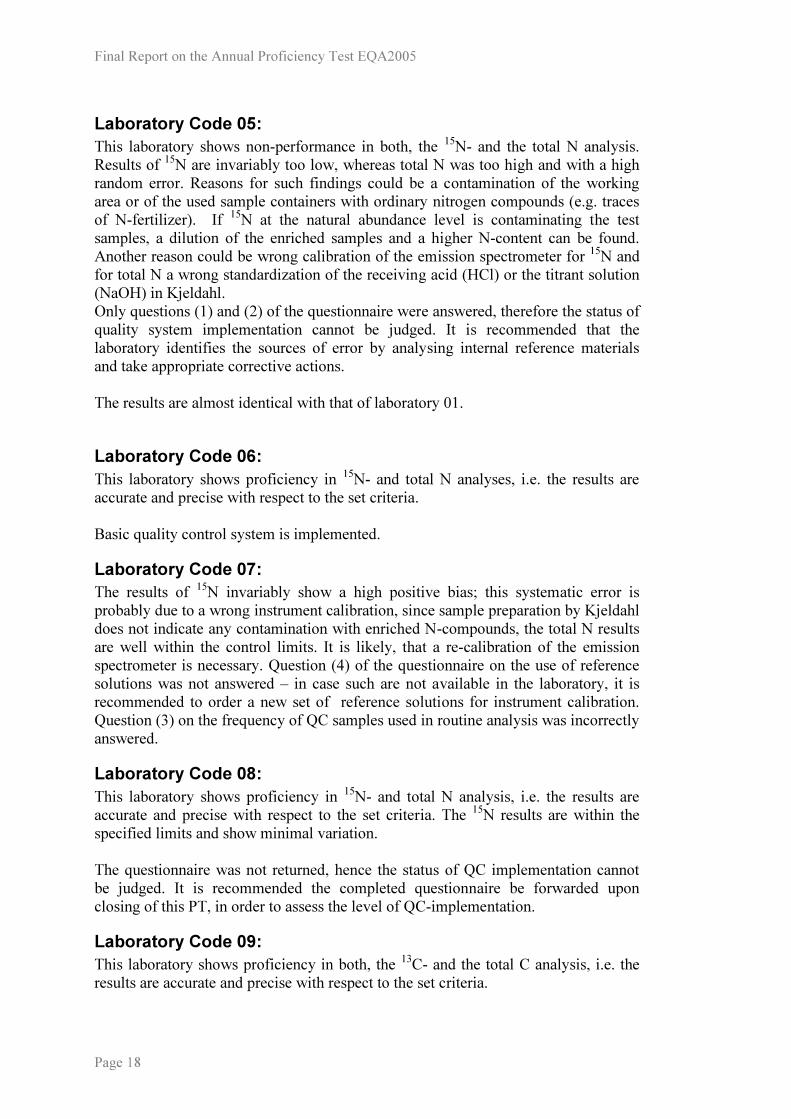
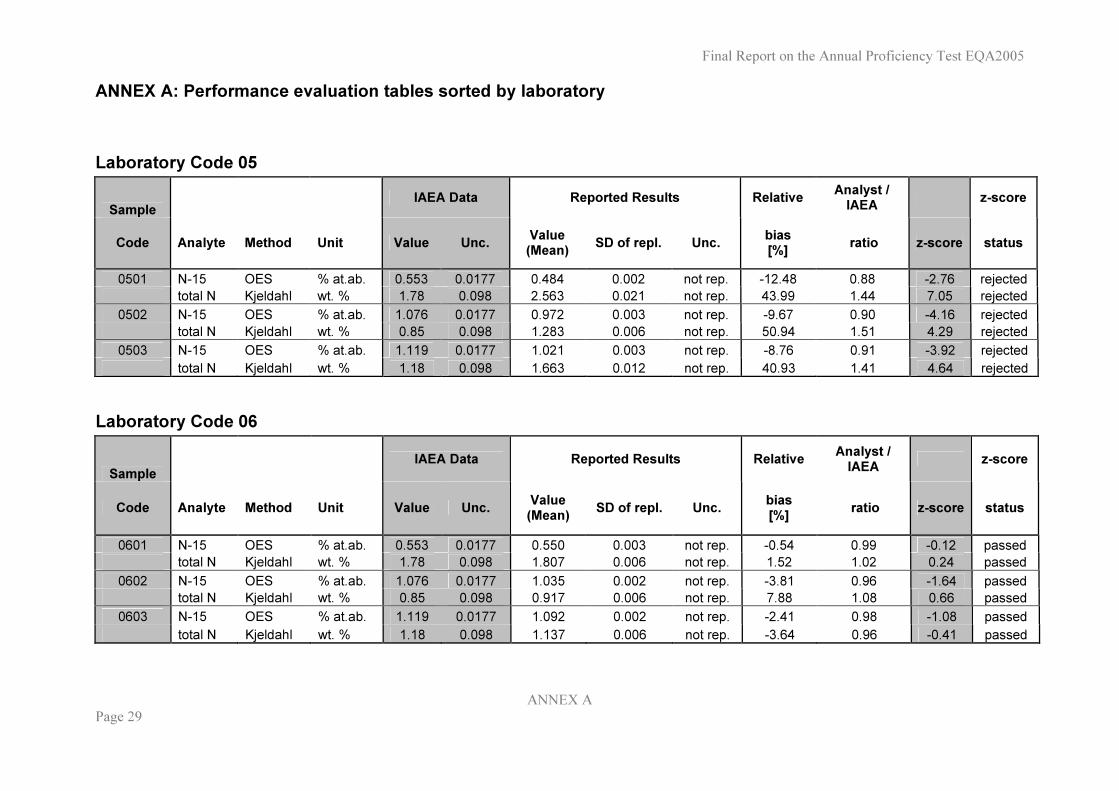
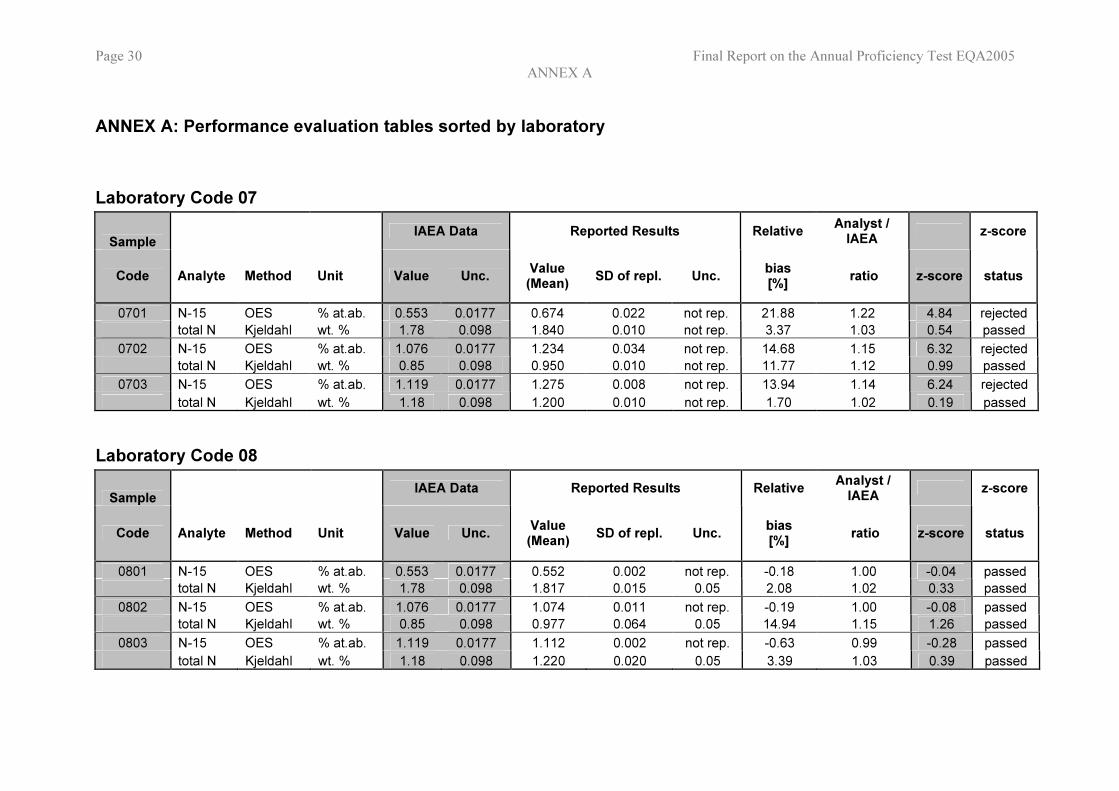
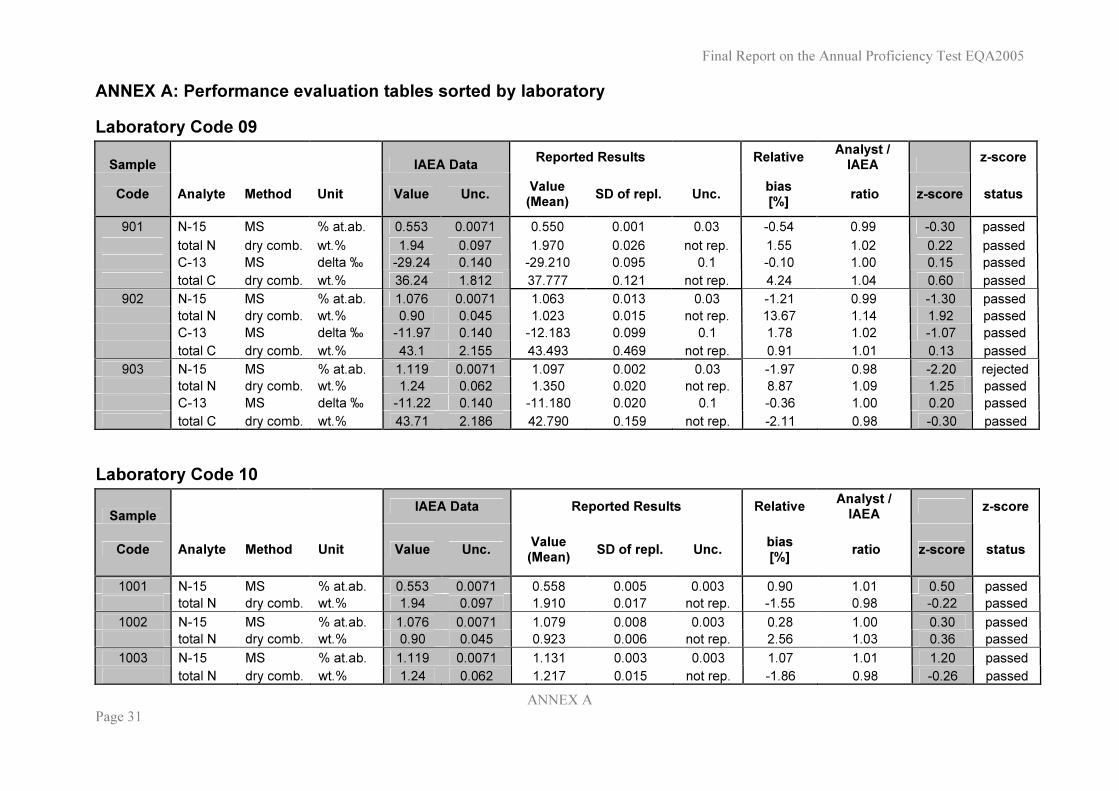
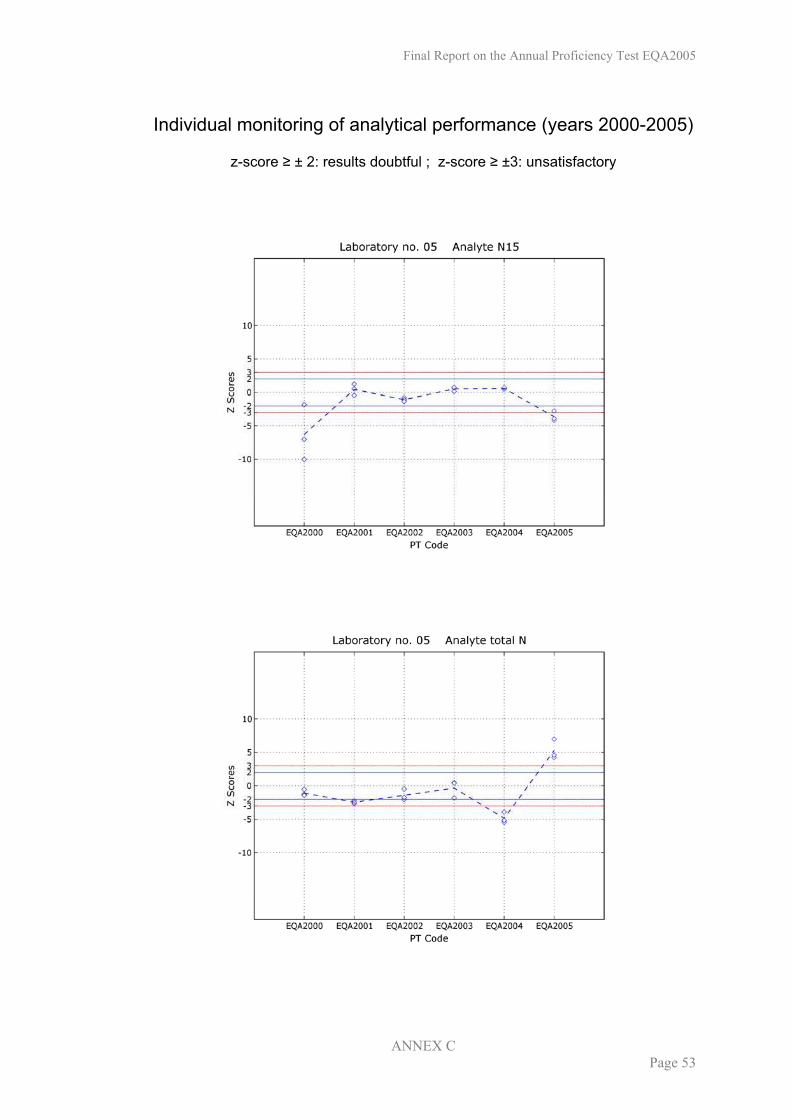
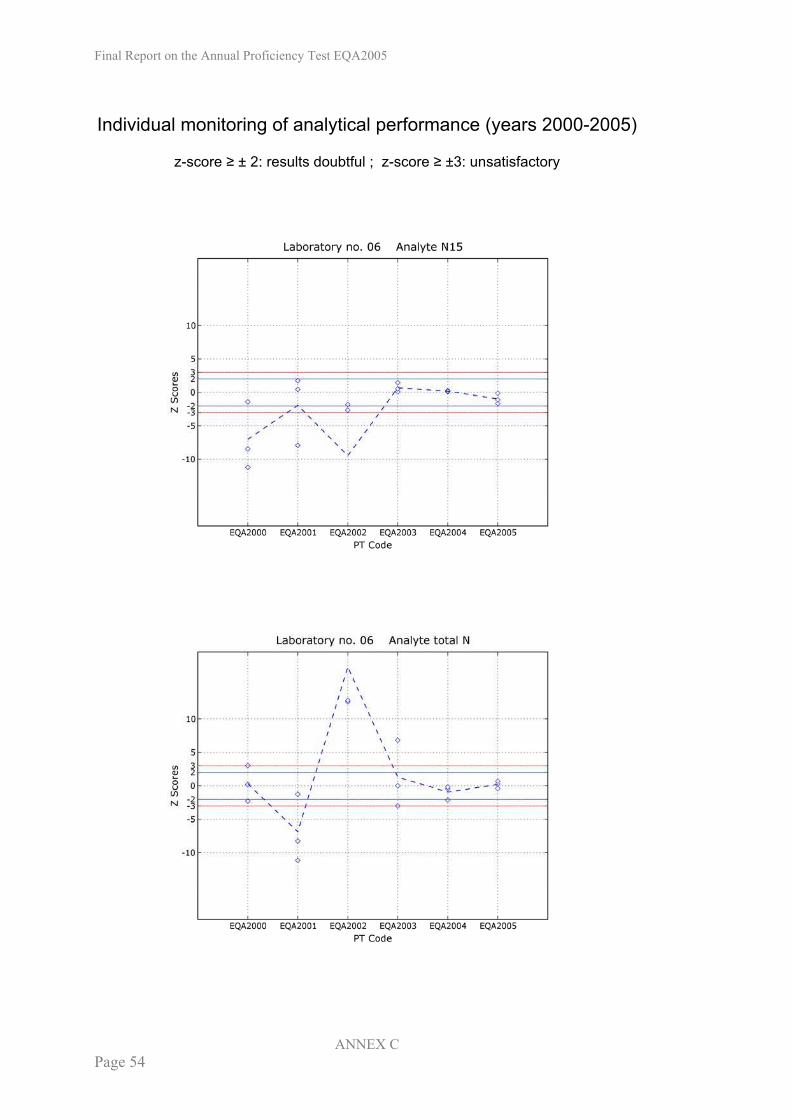
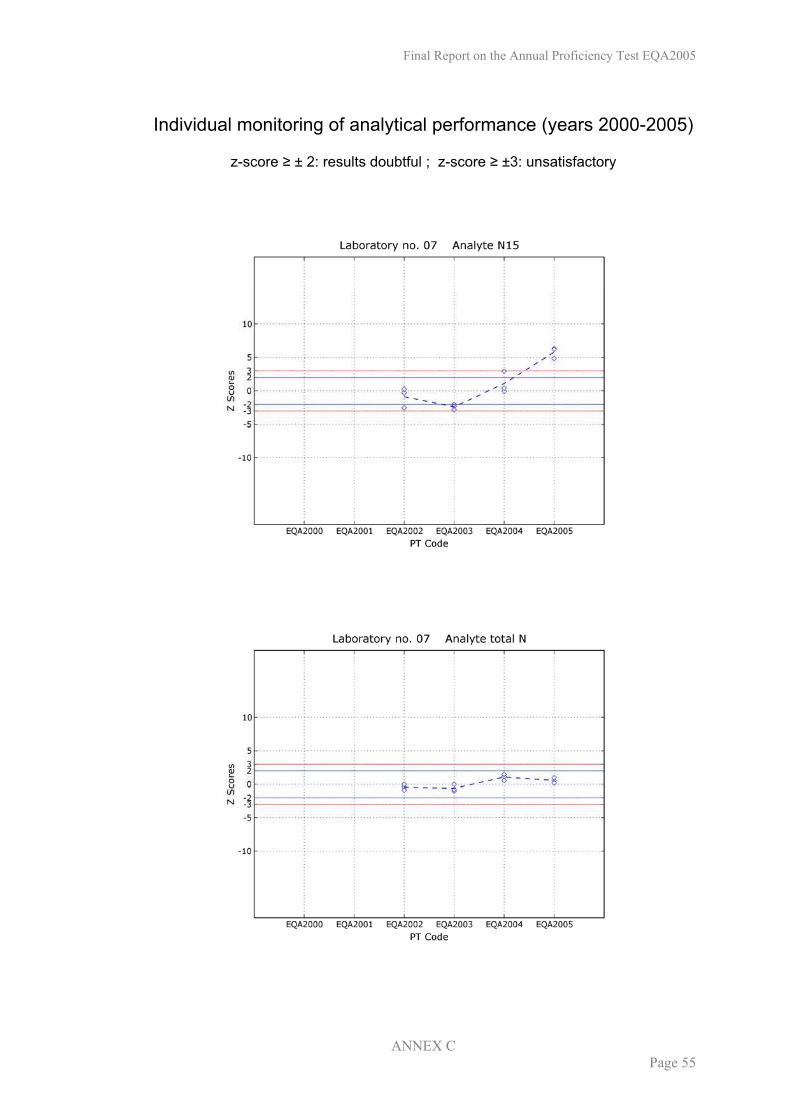
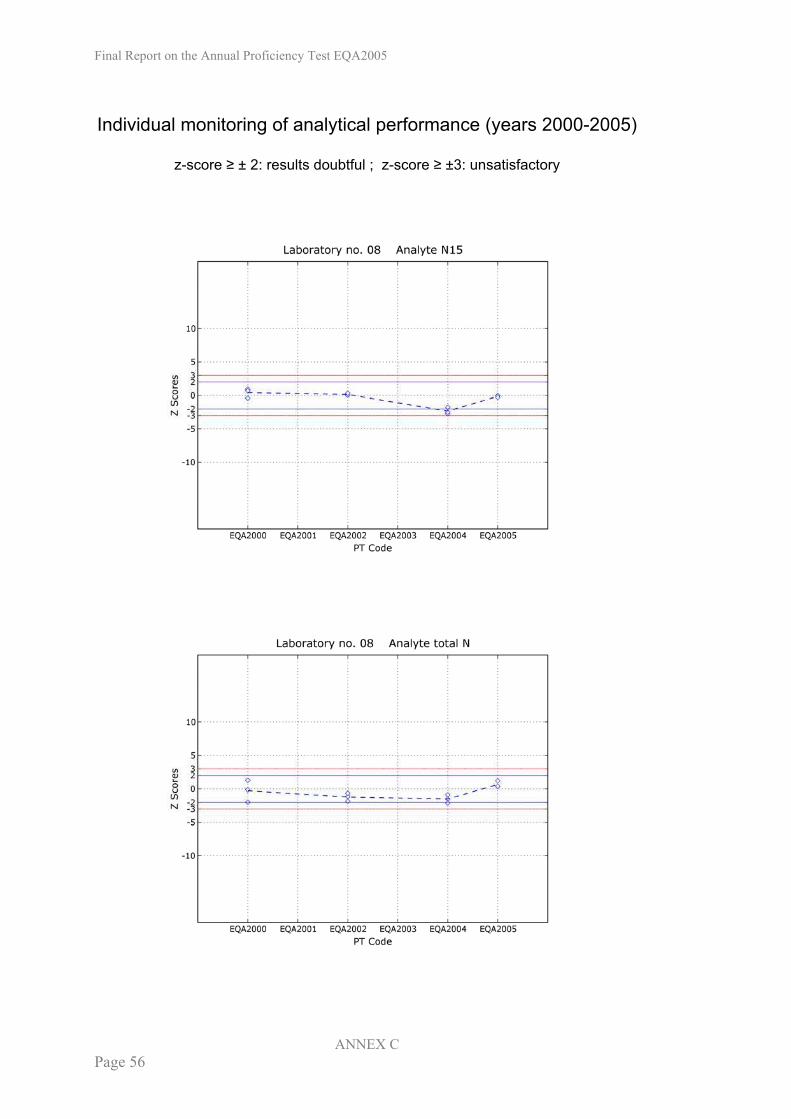
Laboratory Code 05: This laboratory shows non-performance in both, the 15N- and the total N analysis. Results of 15N are invariably too low, whereas total N was too high and with a high random error. Reasons for such findings could be a contamination of the working area or of the used sample containers with ordinary nitrogen compounds (e.g. traces of N-fertilizer). If 15N at the natural abundance level is contaminating the test samples, a dilution of the enriched samples and a higher N-content can be found. Another reason could be wrong calibration of the emission spectrometer for 15N and for total N a wrong standardization of the receiving acid (HCl) or the titrant solution (NaOH) in Kjeldahl. Only questions (1) and (2) of the questionnaire were answered, therefore the status of quality system implementation cannot be judged. It is recommended that the laboratory identifies the sources of error by analysing internal reference materials and take appropriate corrective actions. The results are almost identical with that of laboratory 01. Laboratory Code 06: This laboratory shows proficiency in 15N- and total N analyses, i.e. the results are accurate and precise with respect to the set criteria. Basic quality control system is implemented. Laboratory Code 07: The results of 15N invariably show a high positive bias; this systematic error is probably due to a wrong instrument calibration, since sample preparation by Kjeldahl does not indicate any contamination with enriched N-compounds, the total N results are well within the control limits. It is likely, that a re-calibration of the emission spectrometer is necessary. Question (4) of the questionnaire on the use of reference solutions was not answered – in case such are not available in the laboratory, it is recommended to order a new set of reference solutions for instrument calibration. Question (3) on the frequency of QC samples used in routine analysis was incorrectly answered. Laboratory Code 08: This laboratory shows proficiency in 15N- and total N analysis, i.e. the results are accurate and precise with respect to the set criteria. The 15N results are within the specified limits and show minimal variation. The questionnaire was not returned, hence the status of QC implementation cannot be judged. It is recommended the completed questionnaire be forwarded upon closing of this PT, in order to assess the level of QC-implementation. Laboratory Code 09: This laboratory shows proficiency in both, the 13C- and the total C analysis, i.e. the results are accurate and precise with respect to the set criteria.
Final Report on the Annual Proficiency Test EQA2005
Page 19
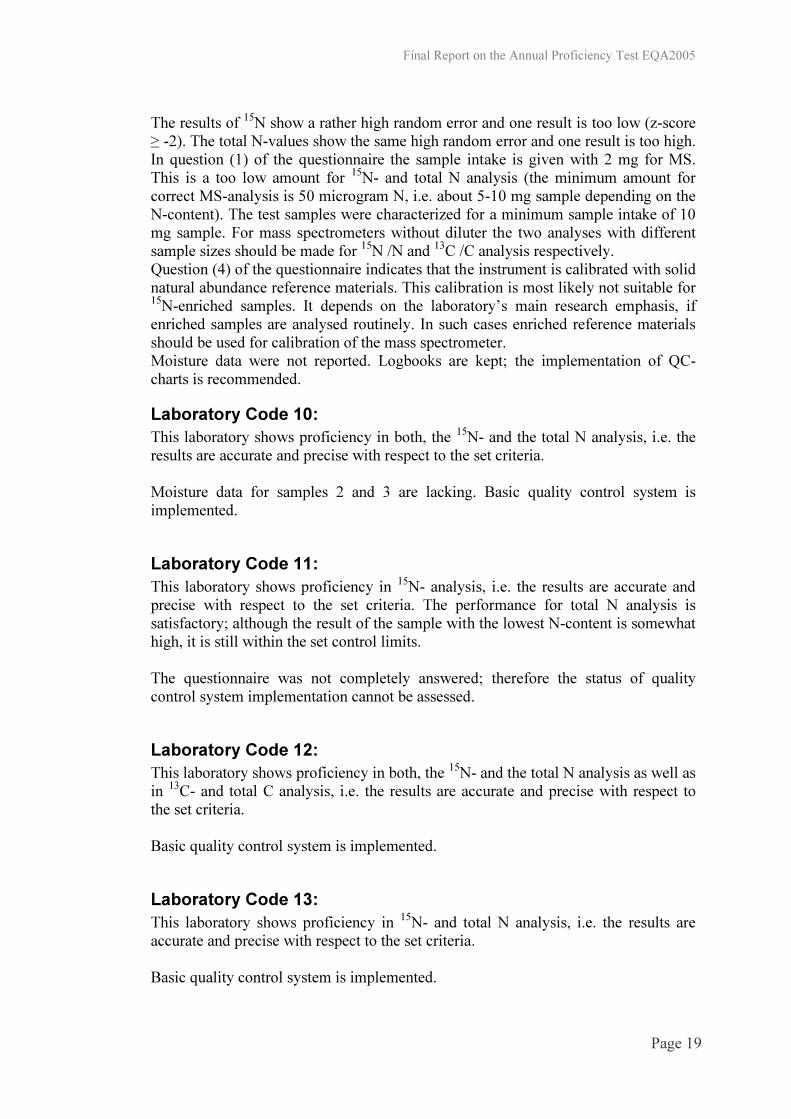
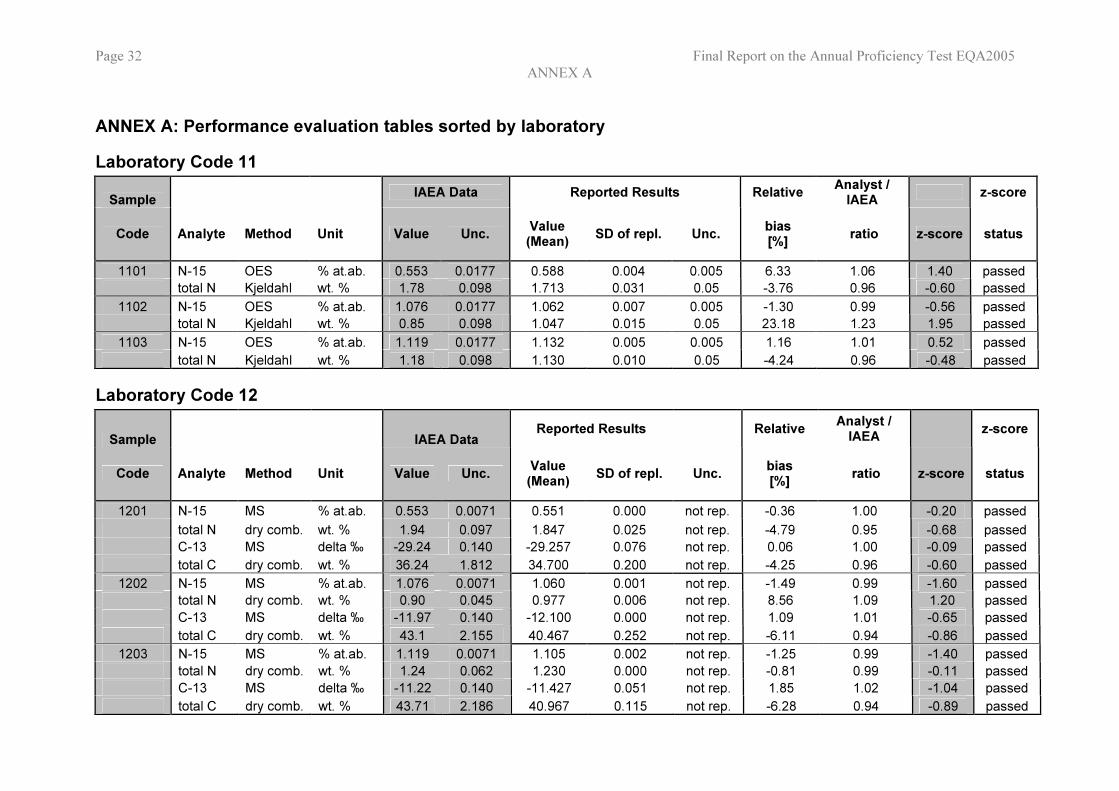
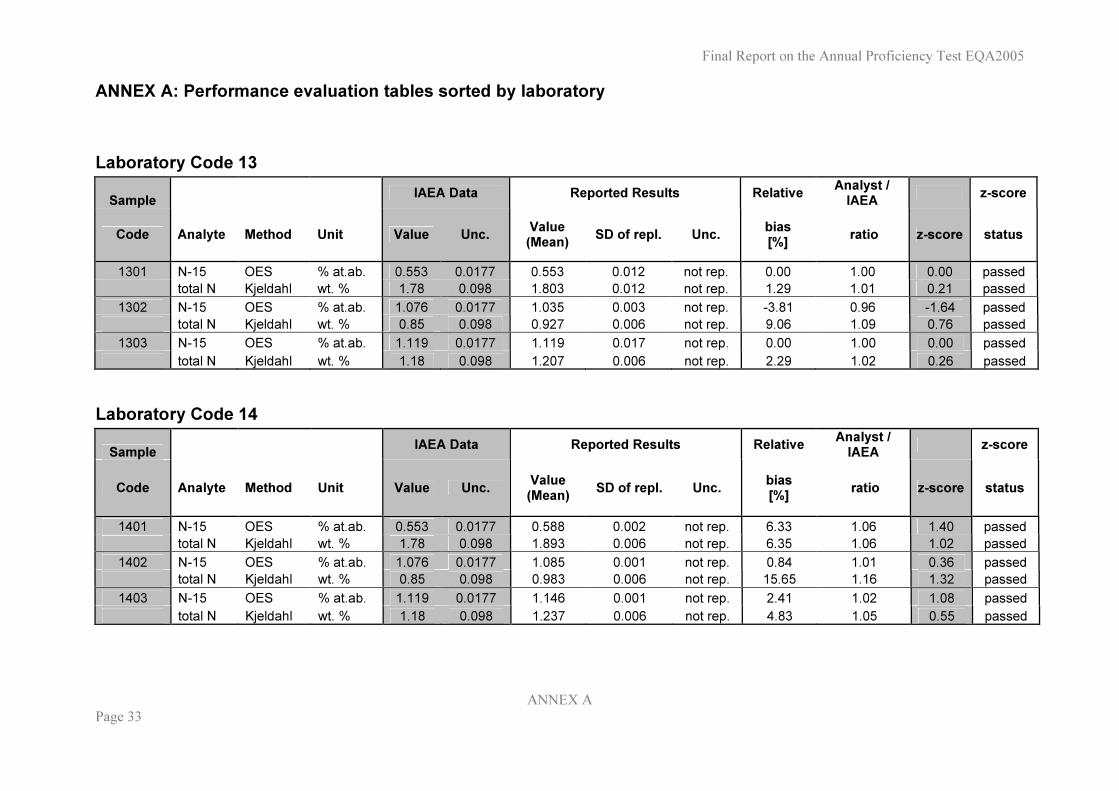
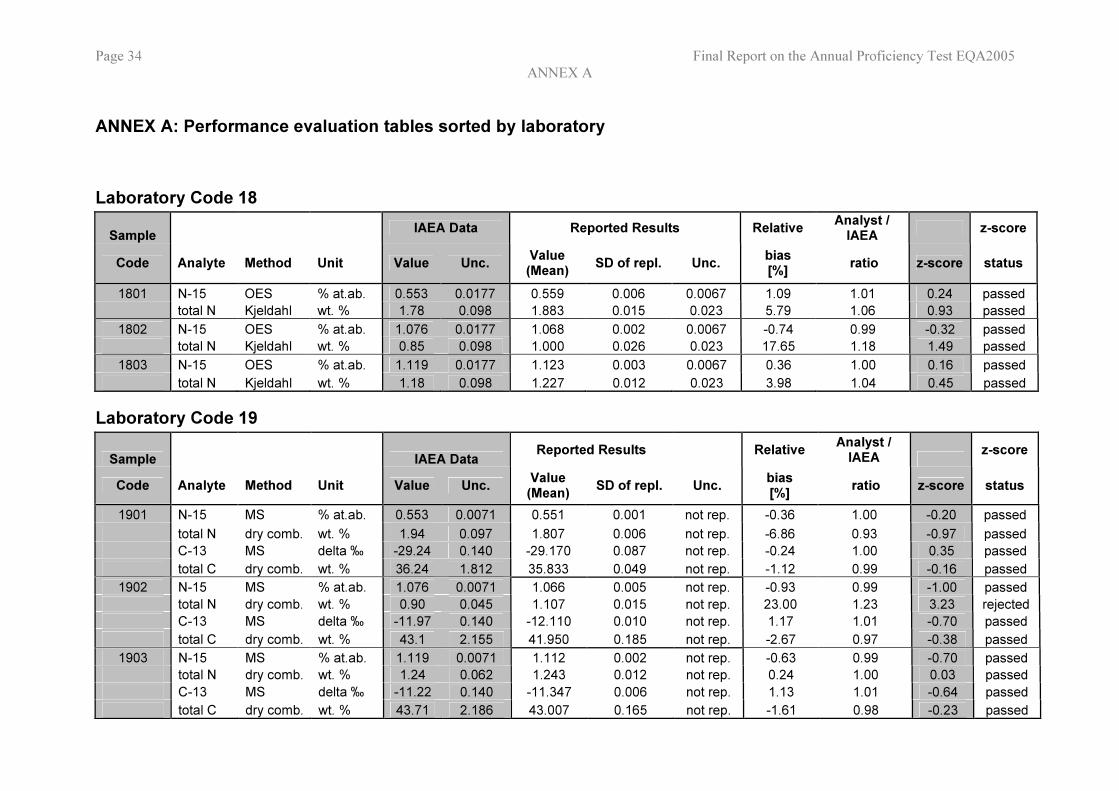
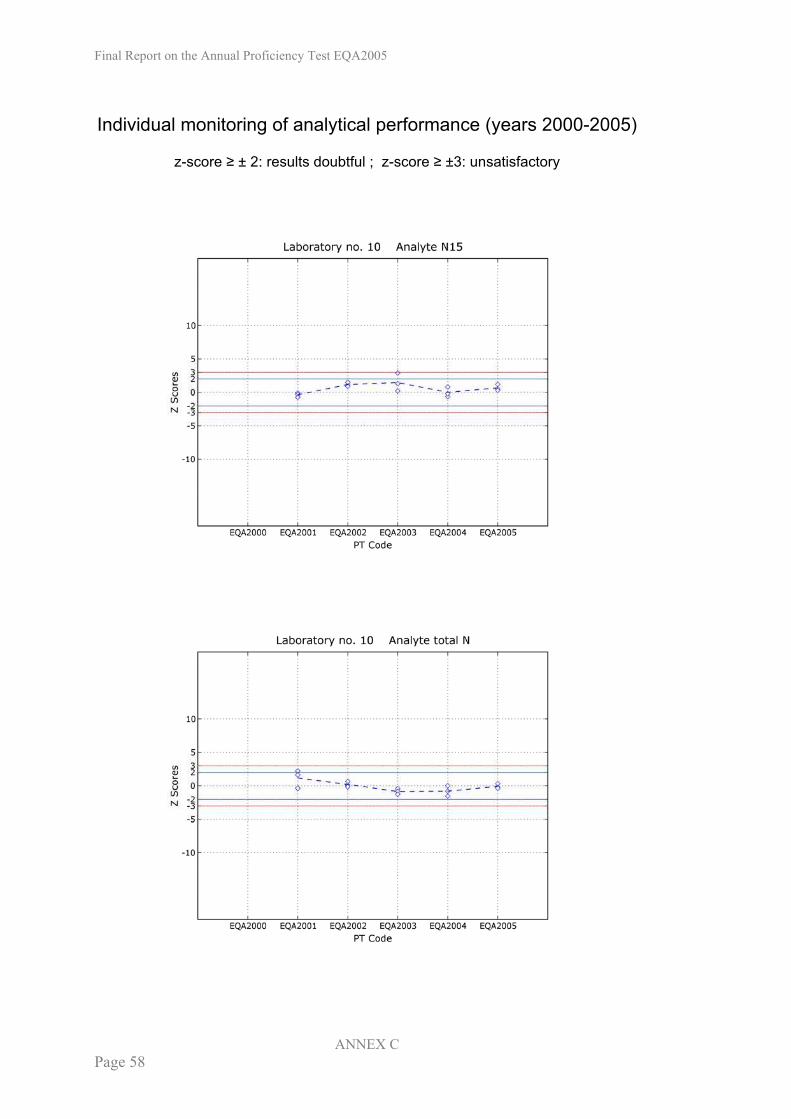
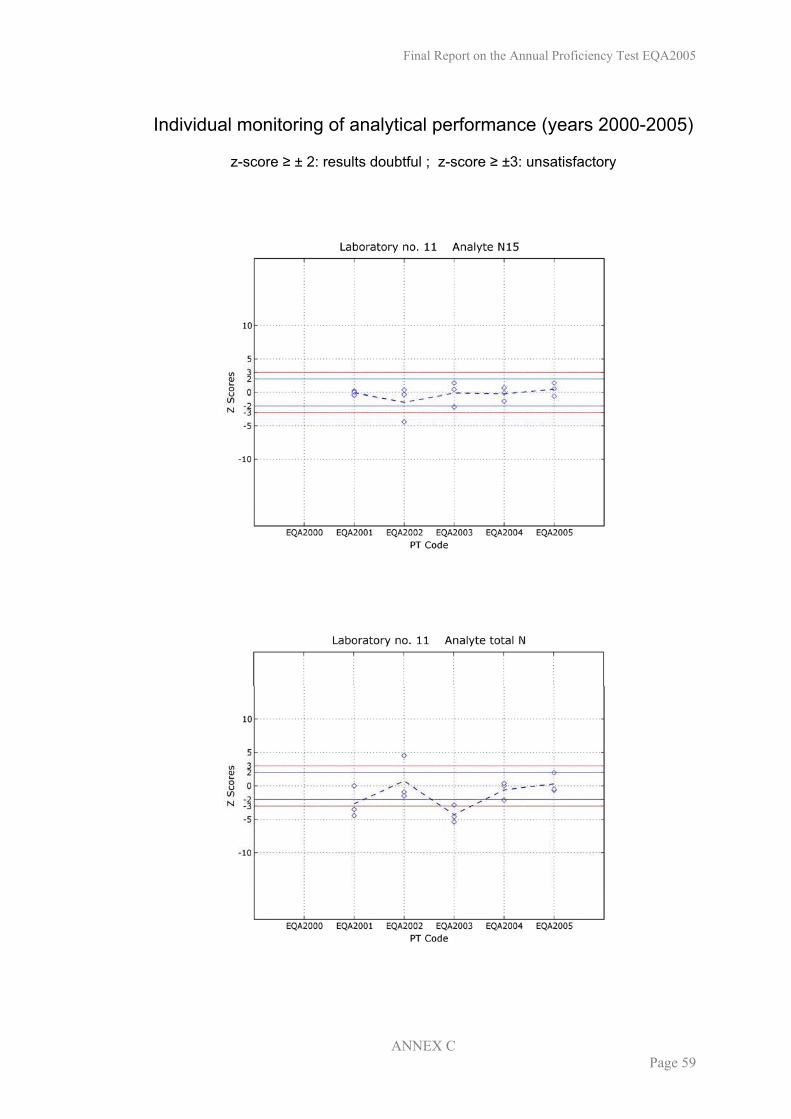
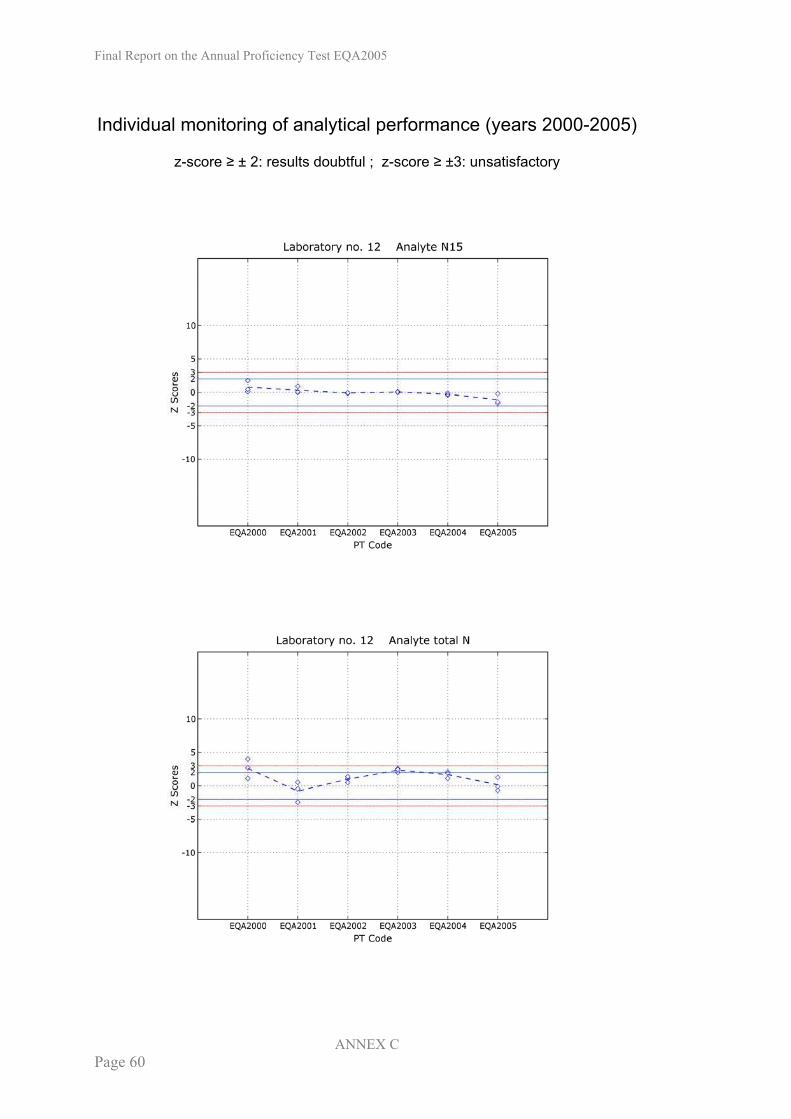
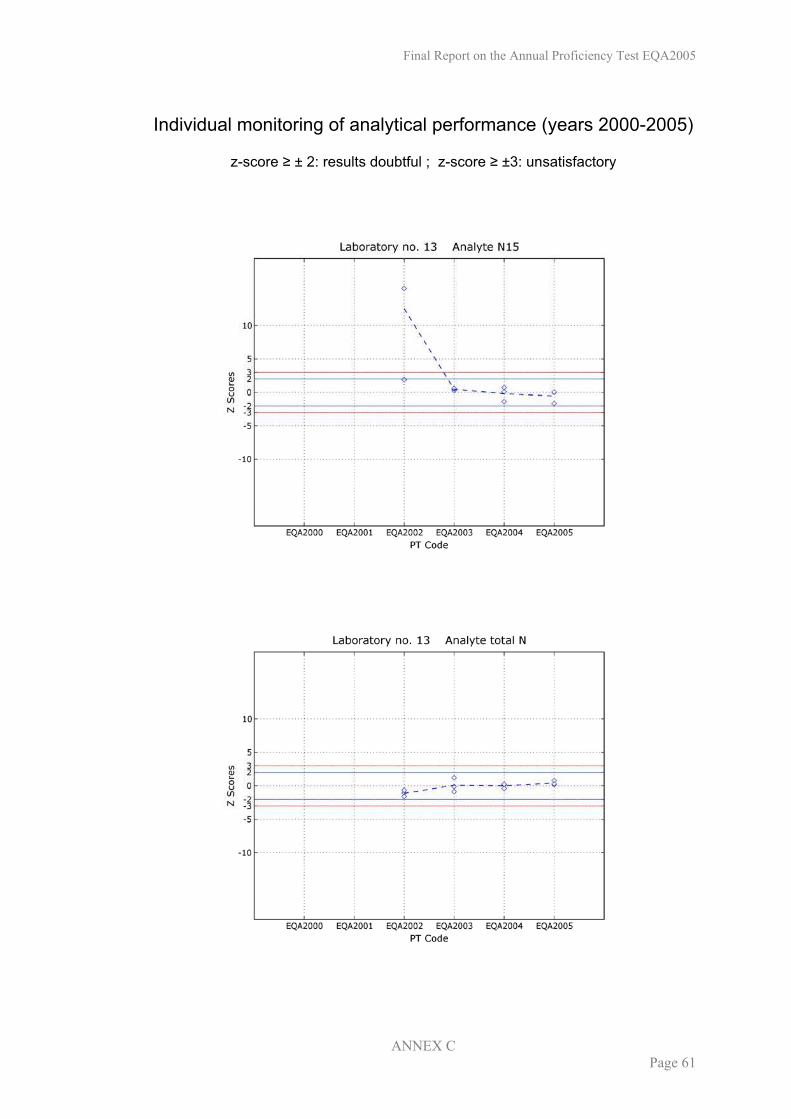
The results of 15N show a rather high random error and one result is too low (z-score ≥ -2). The total N-values show the same high random error and one result is too high. In question (1) of the questionnaire the sample intake is given with 2 mg for MS. This is a too low amount for 15N- and total N analysis (the minimum amount for correct MS-analysis is 50 microgram N, i.e. about 5-10 mg sample depending on the N-content). The test samples were characterized for a minimum sample intake of 10 mg sample. For mass spectrometers without diluter the two analyses with different sample sizes should be made for 15N /N and 13C /C analysis respectively. Question (4) of the questionnaire indicates that the instrument is calibrated with solid natural abundance reference materials. This calibration is most likely not suitable for 15N-enriched samples. It depends on the laboratory’s main research emphasis, if enriched samples are analysed routinely. In such cases enriched reference materials should be used for calibration of the mass spectrometer. Moisture data were not reported. Logbooks are kept; the implementation of QC-charts is recommended. Laboratory Code 10: This laboratory shows proficiency in both, the 15N- and the total N analysis, i.e. the results are accurate and precise with respect to the set criteria. Moisture data for samples 2 and 3 are lacking. Basic quality control system is implemented. Laboratory Code 11: This laboratory shows proficiency in 15N- analysis, i.e. the results are accurate and precise with respect to the set criteria. The performance for total N analysis is satisfactory; although the result of the sample with the lowest N-content is somewhat high, it is still within the set control limits. The questionnaire was not completely answered; therefore the status of quality control system implementation cannot be assessed. Laboratory Code 12: This laboratory shows proficiency in both, the 15N- and the total N analysis as well as in 13C- and total C analysis, i.e. the results are accurate and precise with respect to the set criteria. Basic quality control system is implemented. Laboratory Code 13: This laboratory shows proficiency in 15N- and total N analysis, i.e. the results are accurate and precise with respect to the set criteria. Basic quality control system is implemented.

Final Report on the Annual Proficiency Test EQA2005
Page 20
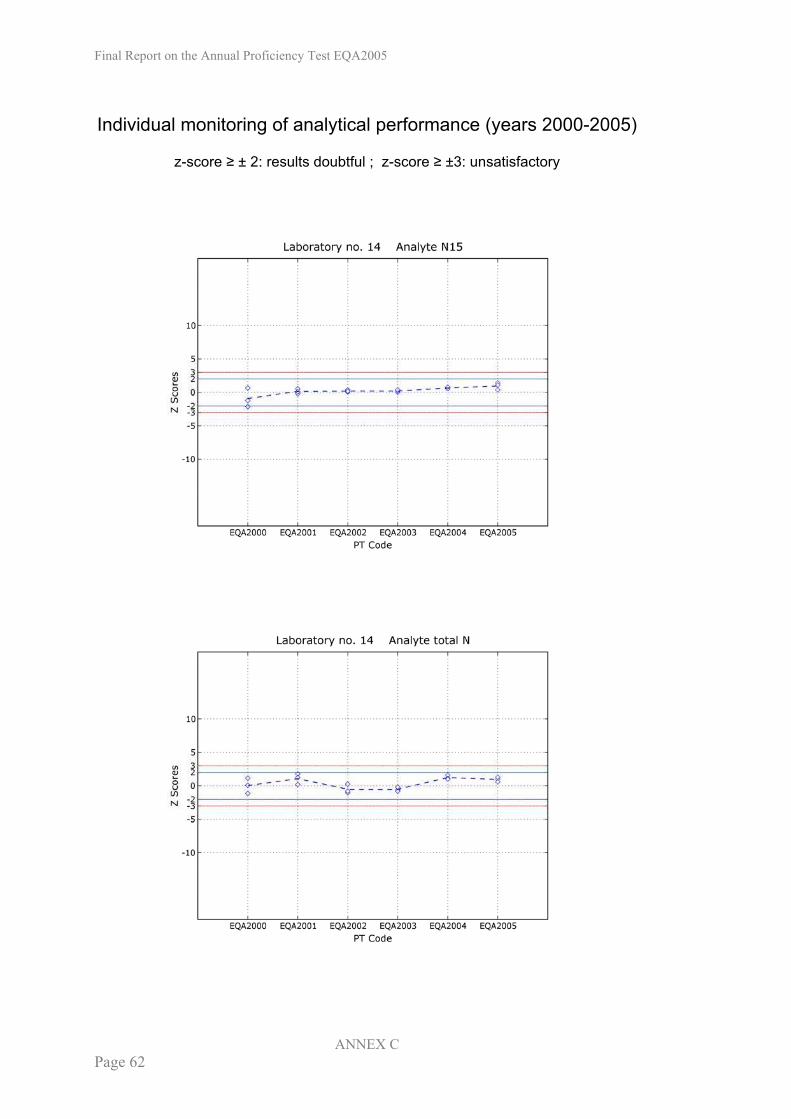
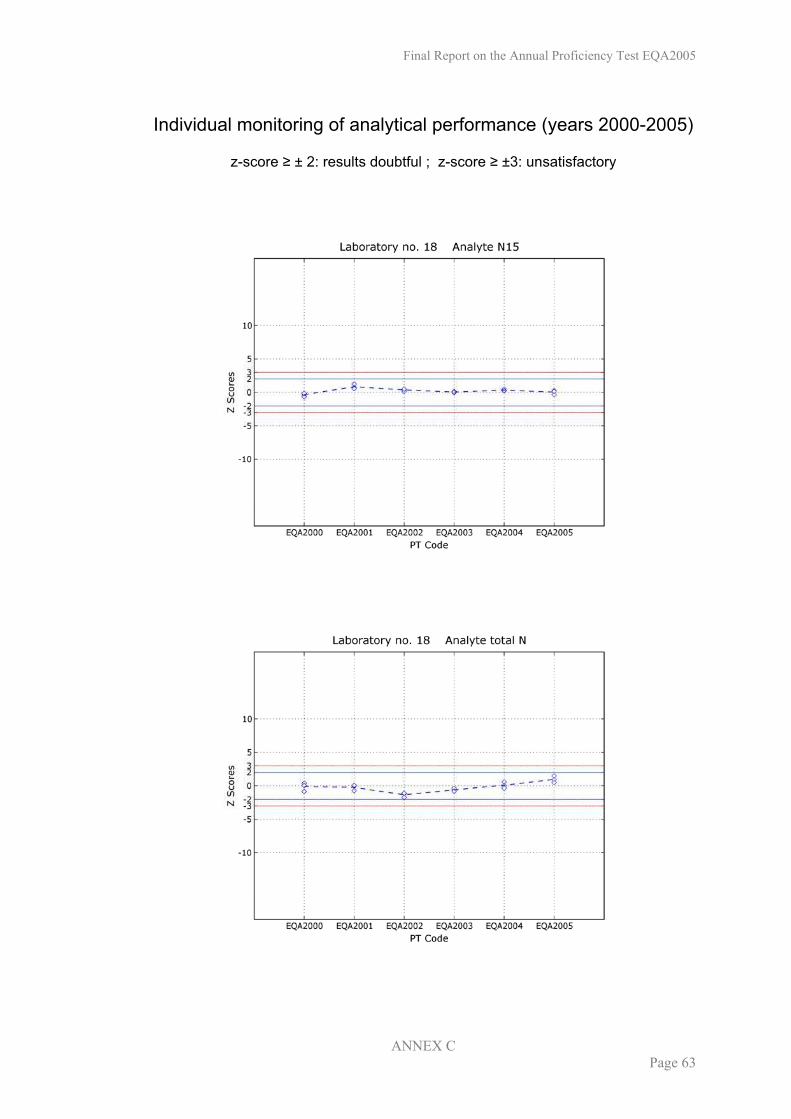
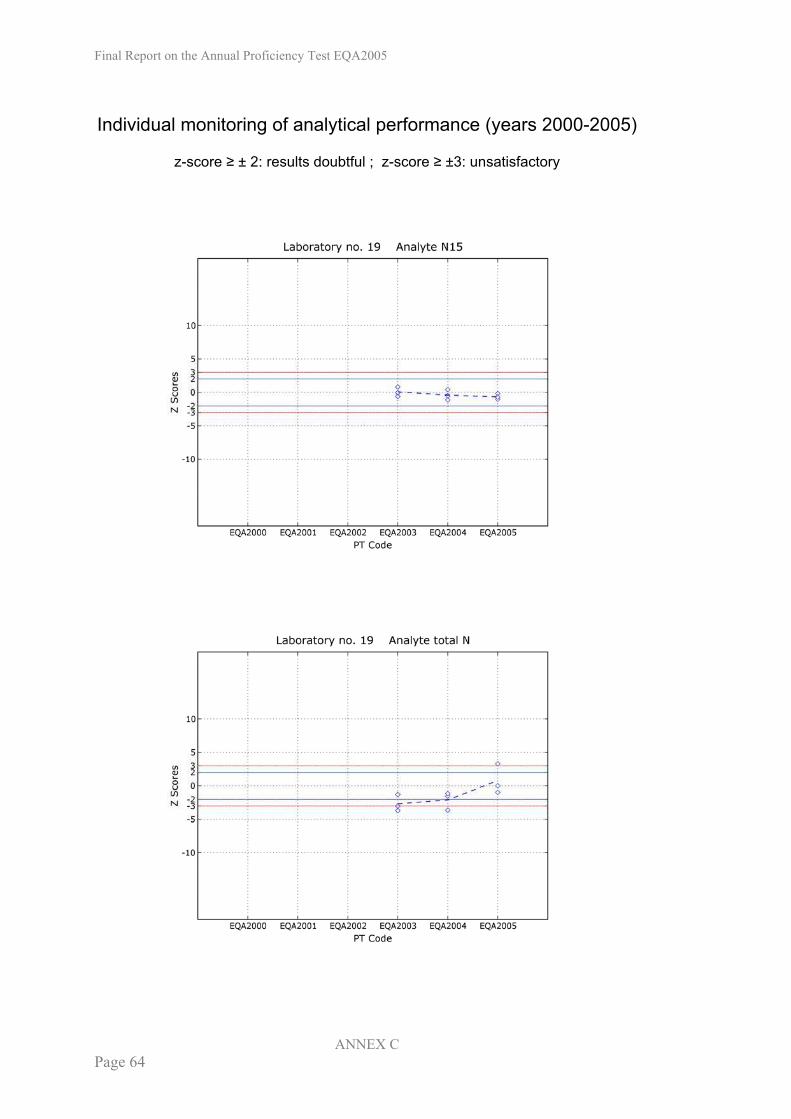
Laboratory Code 14: This laboratory shows proficiency in both, the 15N- and the total N analysis, i.e. the results are accurate and precise with respect to the set criteria. Basic quality control system is implemented. Laboratory Code 18: This laboratory shows proficiency in 15N- and total N analysis, i.e. the results are accurate and precise with respect to the set criteria. The 15N results are within the specified limits and show minimal variation. Basic quality control system is implemented. Laboratory Code 19: This laboratory shows proficiency in both, the 13C- and the total C analysis, i.e. the results are accurate and precise with respect to the set criteria. 15N- results are well within the control limits, but the performance for total N analysis is not within the specified limits. The result of one sample shows a high positive bias. The total N-results show a high random error. In question (1) of the questionnaire the sample intake is given as 1 mg for MS. This is a too low amount for 15N- and total N analysis (the minimum amount for correct MS-analysis is 50 microgram N, i.e. about 5-10 mg sample depending on the N-content). The test samples were characterized for a minimum sample intake of 10 mg sample. For mass spectrometers without diluter the two analyses with different sample sizes should be made for 15N /N and 13C /C analysis respectively. Logbooks are kept; the implementation of QC-charts is recommended. Laboratory Code 21: Results of 13C- and total C-analysis are both within the control limits, however the 13C results invariably show a negative bias, whereas all total C values show a positive bias. 15N results show a very high random error, with one data point being outside of the control limits and one total N result is doubtful (z-score ≥ -2). Further testing of sample handling, re-adjustment of the instrument settings and analysis of reference materials are recommended in order to improve both precision and accuracy. Basic quality control system is implemented, however further improvement are required for 15N / total N analysis.

Final Report on the Annual Proficiency Test EQA2005
Page 21
10. Conclusions and Recommendations The annual Proficiency Test (PT), EQA2005, for the determination of stable isotopes 15N and 13C as well as the total analyte concentrations of total nitrogen and carbon in plant materials was organized to provide an opportunity for participating laboratories to assess the quality of their analytical performance, to compare their performance to that of other laboratories working in the same field and to quantify the measurement uncertainties associated with the applied methods. The evaluation in this PT was based on predetermined target values and target uncertainties (sigma of the z-score) set by the organizer, which allowed an evaluation of the relative bias and a judgement of whether the reported data are within the specified control limits. In addition, the measurement uncertainty of the reported data was compared to the measurement uncertainty reported by the organizer. The majority of laboratories reported results within the specified control limits and a total of 14 participating laboratories was awarded with a certificate stating successful participation in the PT in one or both combined analyses. From the reported data it was noted, that some laboratories lack daily quality control tools such as QC-charts. Reference materials are available and used in most laboratories, but five participating labs did not respond to this point in the questionnaire. Less than half of the laboratories were able to provide an estimation of their uncertainty budget. In most cases the uncertainties reported by the laboratories are substantially lower than that of the organizer, which might be due to an underestimation of the uncertainty components that have to be accounted for. Note, that ‘uncertainty’ does not mean ‘repeatability standard deviation’ of the results of one batch of samples on one day. A good approach to estimate uncertainty is described in [2]. It is recommended that the responsible officer of the laboratory to study the recommended literature on this topic (references [1], [2] and [3]) and advice the analysts in the implementation of these basic quality control measures. To make the high quality of analytical data sustainable, proactive higher management commitments towards establishing a comprehensive quality management system are required to support the effort of the analysts and their supervisors. Completing EQA2005, a total of six laboratories (laboratory codes 02, 04, 12, 13, 14, 18) have fulfilled the specified quality criteria for at least three consecutive years and are thus rated as fully competent in performing the analysis of 15N isotopic abundance and content of total N in 15N-enriched plant materials at the required level established by the IAEA Soil Science Unit. For 13C isotopic abundance and total content of C in natural abundance plant materials this assessment can only be performed after the third consecutive PT in the year 2006.
Final Report on the Annual Proficiency Test EQA2005
Page 22
11. Acknowledgements This work is the result of a cross cutting team work of the Soil Science Unit with the Chemistry Unit staff of the Agency’s Laboratories, Seibersdorf. Special thanks goes to Mr. Ales Fajgelj for revision of the terminology and to Mr. Leo Mayr and Mr. Stefan Borovits for the analytical support.
12. References [1] ISO/DIS 13528, Statistical methods for use in proficiency testing by
interlaboratory comparisons, ISO/TC 69/ SC 6 N 459, (Provisional Version), chapter 6.3.
[2] Quantifying Uncertainty in Analytical Measurement, EURACHEM/CITAC/CG4, second edition 2000
[3] Guidelines for Quality Management in Soil and Plant Laboratories (FAO Soils Bulletin – 74); L.P. van Reeuwijk; V.J.G. Houba; Rome 1998
[4] Guide to expression of uncertainty in measurement, BIPM / IEC / IFCC /ISO / IUPAC / IUPAP / OIML, 1995
[5] International Harmonized Protocol for Proficiency Testing of (chemical) Analytical Laboratories, IUPAC, Pure & Appl. Chem. Vol 65, No.9, pp. 2123-2144, 1993
[6] ISO/IEC guide 43-1, Proficiency Testing by interlaboratory comparisons – Part1: Development and operation of proficiency testing schemes, Second edition 1997
[7] ISO/IEC guide 43-2, Proficiency Testing by interlaboratory comparisons – Part2: Selection and use of proficiency testing schemes by laboratory accreditation bodies, First edition 1997
[8] ISO/IEC 17025, General Requirements for the Competence of Calibration and Testing Laboratories, First edition 1999.
Final Report on the Annual Proficiency Test EQA2005
Page 23
ANNEX

Final Report on the Annual Proficiency Test EQA2005
ANNEX A
Page 25
ANNEX A:
Performance evaluation tables sorted by laboratory

Final Report on the Annual Proficiency Test EQA2005
ANNEX A Page 27
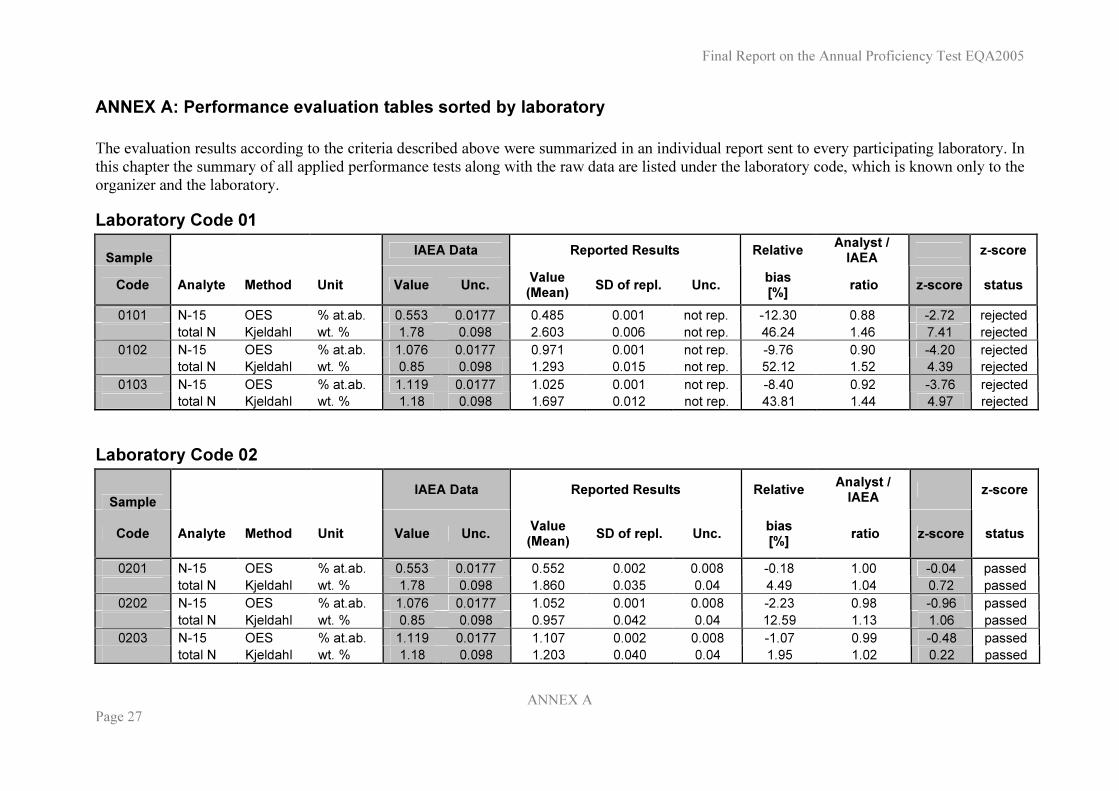
ANNEX A: Performance evaluation tables sorted by laboratory The evaluation results according to the criteria described above were summarized in an individual report sent to every participating laboratory. In this chapter the summary of all applied performance tests along with the raw data are listed under the laboratory code, which is known only to the organizer and the laboratory. Laboratory Code 01 Sample IAEA Data Reported Results Relative Analyst /
IAEA z-score
Code Analyte Method Unit Value Unc. Value (Mean) SD of repl. Unc. bias
[%] ratio z-score status 0101 N-15 OES % at.ab. 0.553 0.0177 0.485 0.001 not rep. -12.30 0.88 -2.72 rejected total N Kjeldahl wt. % 1.78 0.098 2.603 0.006 not rep. 46.24 1.46 7.41 rejected
0102 N-15 OES % at.ab. 1.076 0.0177 0.971 0.001 not rep. -9.76 0.90 -4.20 rejected total N Kjeldahl wt. % 0.85 0.098 1.293 0.015 not rep. 52.12 1.52 4.39 rejected
0103 N-15 OES % at.ab. 1.119 0.0177 1.025 0.001 not rep. -8.40 0.92 -3.76 rejected total N Kjeldahl wt. % 1.18 0.098 1.697 0.012 not rep. 43.81 1.44 4.97 rejected
Laboratory Code 02
Sample IAEA Data Reported Results Relative Analyst / IAEA z-score
Code Analyte Method Unit Value Unc. Value (Mean) SD of repl. Unc. bias
[%] ratio z-score status
0201 N-15 OES % at.ab. 0.553 0.0177 0.552 0.002 0.008 -0.18 1.00 -0.04 passed total N Kjeldahl wt. % 1.78 0.098 1.860 0.035 0.04 4.49 1.04 0.72 passed
0202 N-15 OES % at.ab. 1.076 0.0177 1.052 0.001 0.008 -2.23 0.98 -0.96 passed total N Kjeldahl wt. % 0.85 0.098 0.957 0.042 0.04 12.59 1.13 1.06 passed
0203 N-15 OES % at.ab. 1.119 0.0177 1.107 0.002 0.008 -1.07 0.99 -0.48 passed total N Kjeldahl wt. % 1.18 0.098 1.203 0.040 0.04 1.95 1.02 0.22 passed
Page 28 Final Report on the Annual Proficiency Test EQA2005 ANNEX A
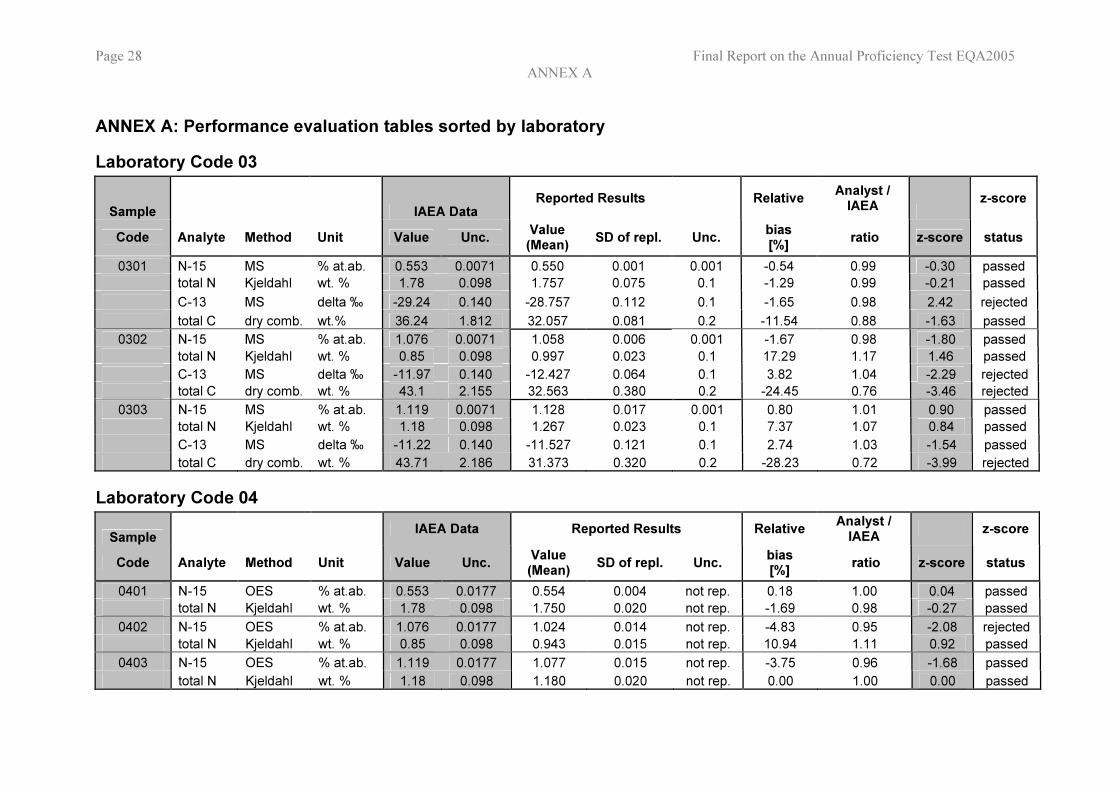
ANNEX A: Performance evaluation tables sorted by laboratory Laboratory Code 03
Sample IAEA Data Reported Results Relative Analyst /
IAEA z-score
Code Analyte Method Unit Value Unc. Value (Mean) SD of repl. Unc. bias
[%] ratio z-score status 0301 N-15 MS % at.ab. 0.553 0.0071 0.550 0.001 0.001 -0.54 0.99 -0.30 passed total N Kjeldahl wt. % 1.78 0.098 1.757 0.075 0.1 -1.29 0.99 -0.21 passed C-13 MS delta ‰ -29.24 0.140 -28.757 0.112 0.1 -1.65 0.98 2.42 rejected total C dry comb. wt.% 36.24 1.812 32.057 0.081 0.2 -11.54 0.88 -1.63 passed
0302 N-15 MS % at.ab. 1.076 0.0071 1.058 0.006 0.001 -1.67 0.98 -1.80 passed total N Kjeldahl wt. % 0.85 0.098 0.997 0.023 0.1 17.29 1.17 1.46 passed C-13 MS delta ‰ -11.97 0.140 -12.427 0.064 0.1 3.82 1.04 -2.29 rejected total C dry comb. wt. % 43.1 2.155 32.563 0.380 0.2 -24.45 0.76 -3.46 rejected
0303 N-15 MS % at.ab. 1.119 0.0071 1.128 0.017 0.001 0.80 1.01 0.90 passed total N Kjeldahl wt. % 1.18 0.098 1.267 0.023 0.1 7.37 1.07 0.84 passed C-13 MS delta ‰ -11.22 0.140 -11.527 0.121 0.1 2.74 1.03 -1.54 passed total C dry comb. wt. % 43.71 2.186 31.373 0.320 0.2 -28.23 0.72 -3.99 rejected
Laboratory Code 04 Sample IAEA Data Reported Results Relative Analyst /
IAEA z-score
Code Analyte Method Unit Value Unc. Value (Mean) SD of repl. Unc. bias
[%] ratio z-score status 0401 N-15 OES % at.ab. 0.553 0.0177 0.554 0.004 not rep. 0.18 1.00 0.04 passed total N Kjeldahl wt. % 1.78 0.098 1.750 0.020 not rep. -1.69 0.98 -0.27 passed
0402 N-15 OES % at.ab. 1.076 0.0177 1.024 0.014 not rep. -4.83 0.95 -2.08 rejected total N Kjeldahl wt. % 0.85 0.098 0.943 0.015 not rep. 10.94 1.11 0.92 passed
0403 N-15 OES % at.ab. 1.119 0.0177 1.077 0.015 not rep. -3.75 0.96 -1.68 passed total N Kjeldahl wt. % 1.18 0.098 1.180 0.020 not rep. 0.00 1.00 0.00 passed
Final Report on the Annual Proficiency Test EQA2005
ANNEX A Page 29
ANNEX A: Performance evaluation tables sorted by laboratory Laboratory Code 05
Sample IAEA Data Reported Results Relative Analyst / IAEA z-score
Code Analyte Method Unit Value Unc. Value (Mean) SD of repl. Unc. bias
[%] ratio z-score status
0501 N-15 OES % at.ab. 0.553 0.0177 0.484 0.002 not rep. -12.48 0.88 -2.76 rejected total N Kjeldahl wt. % 1.78 0.098 2.563 0.021 not rep. 43.99 1.44 7.05 rejected
0502 N-15 OES % at.ab. 1.076 0.0177 0.972 0.003 not rep. -9.67 0.90 -4.16 rejected total N Kjeldahl wt. % 0.85 0.098 1.283 0.006 not rep. 50.94 1.51 4.29 rejected
0503 N-15 OES % at.ab. 1.119 0.0177 1.021 0.003 not rep. -8.76 0.91 -3.92 rejected total N Kjeldahl wt. % 1.18 0.098 1.663 0.012 not rep. 40.93 1.41 4.64 rejected
Laboratory Code 06
Sample IAEA Data Reported Results Relative Analyst /
IAEA z-score
Code Analyte Method Unit Value Unc. Value (Mean) SD of repl. Unc. bias
[%] ratio z-score status
0601 N-15 OES % at.ab. 0.553 0.0177 0.550 0.003 not rep. -0.54 0.99 -0.12 passed total N Kjeldahl wt. % 1.78 0.098 1.807 0.006 not rep. 1.52 1.02 0.24 passed
0602 N-15 OES % at.ab. 1.076 0.0177 1.035 0.002 not rep. -3.81 0.96 -1.64 passed total N Kjeldahl wt. % 0.85 0.098 0.917 0.006 not rep. 7.88 1.08 0.66 passed
0603 N-15 OES % at.ab. 1.119 0.0177 1.092 0.002 not rep. -2.41 0.98 -1.08 passed total N Kjeldahl wt. % 1.18 0.098 1.137 0.006 not rep. -3.64 0.96 -0.41 passed
Page 30 Final Report on the Annual Proficiency Test EQA2005 ANNEX A
ANNEX A: Performance evaluation tables sorted by laboratory Laboratory Code 07
Sample IAEA Data Reported Results Relative Analyst / IAEA z-score
Code Analyte Method Unit Value Unc. Value (Mean) SD of repl. Unc. bias
[%] ratio z-score status
0701 N-15 OES % at.ab. 0.553 0.0177 0.674 0.022 not rep. 21.88 1.22 4.84 rejected total N Kjeldahl wt. % 1.78 0.098 1.840 0.010 not rep. 3.37 1.03 0.54 passed
0702 N-15 OES % at.ab. 1.076 0.0177 1.234 0.034 not rep. 14.68 1.15 6.32 rejected total N Kjeldahl wt. % 0.85 0.098 0.950 0.010 not rep. 11.77 1.12 0.99 passed
0703 N-15 OES % at.ab. 1.119 0.0177 1.275 0.008 not rep. 13.94 1.14 6.24 rejected total N Kjeldahl wt. % 1.18 0.098 1.200 0.010 not rep. 1.70 1.02 0.19 passed
Laboratory Code 08
Sample IAEA Data Reported Results Relative Analyst / IAEA z-score
Code Analyte Method Unit Value Unc. Value (Mean) SD of repl. Unc. bias
[%] ratio z-score status
0801 N-15 OES % at.ab. 0.553 0.0177 0.552 0.002 not rep. -0.18 1.00 -0.04 passed total N Kjeldahl wt. % 1.78 0.098 1.817 0.015 0.05 2.08 1.02 0.33 passed
0802 N-15 OES % at.ab. 1.076 0.0177 1.074 0.011 not rep. -0.19 1.00 -0.08 passed total N Kjeldahl wt. % 0.85 0.098 0.977 0.064 0.05 14.94 1.15 1.26 passed
0803 N-15 OES % at.ab. 1.119 0.0177 1.112 0.002 not rep. -0.63 0.99 -0.28 passed total N Kjeldahl wt. % 1.18 0.098 1.220 0.020 0.05 3.39 1.03 0.39 passed
Final Report on the Annual Proficiency Test EQA2005
ANNEX A Page 31
ANNEX A: Performance evaluation tables sorted by laboratory Laboratory Code 09
Sample IAEA Data Reported Results Relative Analyst / IAEA z-score
Code Analyte Method Unit Value Unc. Value (Mean) SD of repl. Unc. bias
[%] ratio z-score status
901 N-15 MS % at.ab. 0.553 0.0071 0.550 0.001 0.03 -0.54 0.99 -0.30 passed total N dry comb. wt.% 1.94 0.097 1.970 0.026 not rep. 1.55 1.02 0.22 passed C-13 MS delta ‰ -29.24 0.140 -29.210 0.095 0.1 -0.10 1.00 0.15 passed total C dry comb. wt.% 36.24 1.812 37.777 0.121 not rep. 4.24 1.04 0.60 passed
902 N-15 MS % at.ab. 1.076 0.0071 1.063 0.013 0.03 -1.21 0.99 -1.30 passed total N dry comb. wt.% 0.90 0.045 1.023 0.015 not rep. 13.67 1.14 1.92 passed C-13 MS delta ‰ -11.97 0.140 -12.183 0.099 0.1 1.78 1.02 -1.07 passed total C dry comb. wt.% 43.1 2.155 43.493 0.469 not rep. 0.91 1.01 0.13 passed
903 N-15 MS % at.ab. 1.119 0.0071 1.097 0.002 0.03 -1.97 0.98 -2.20 rejected total N dry comb. wt.% 1.24 0.062 1.350 0.020 not rep. 8.87 1.09 1.25 passed C-13 MS delta ‰ -11.22 0.140 -11.180 0.020 0.1 -0.36 1.00 0.20 passed total C dry comb. wt.% 43.71 2.186 42.790 0.159 not rep. -2.11 0.98 -0.30 passed
Laboratory Code 10
Sample IAEA Data Reported Results Relative Analyst / IAEA z-score
Code Analyte Method Unit Value Unc. Value (Mean) SD of repl. Unc. bias
[%] ratio z-score status
1001 N-15 MS % at.ab. 0.553 0.0071 0.558 0.005 0.003 0.90 1.01 0.50 passed total N dry comb. wt.% 1.94 0.097 1.910 0.017 not rep. -1.55 0.98 -0.22 passed
1002 N-15 MS % at.ab. 1.076 0.0071 1.079 0.008 0.003 0.28 1.00 0.30 passed total N dry comb. wt.% 0.90 0.045 0.923 0.006 not rep. 2.56 1.03 0.36 passed
1003 N-15 MS % at.ab. 1.119 0.0071 1.131 0.003 0.003 1.07 1.01 1.20 passed total N dry comb. wt.% 1.24 0.062 1.217 0.015 not rep. -1.86 0.98 -0.26 passed
Page 32 Final Report on the Annual Proficiency Test EQA2005 ANNEX A
ANNEX A: Performance evaluation tables sorted by laboratory Laboratory Code 11
Sample IAEA Data Reported Results Relative Analyst / IAEA z-score
Code Analyte Method Unit Value Unc. Value (Mean) SD of repl. Unc. bias
[%] ratio z-score status
1101 N-15 OES % at.ab. 0.553 0.0177 0.588 0.004 0.005 6.33 1.06 1.40 passed total N Kjeldahl wt. % 1.78 0.098 1.713 0.031 0.05 -3.76 0.96 -0.60 passed
1102 N-15 OES % at.ab. 1.076 0.0177 1.062 0.007 0.005 -1.30 0.99 -0.56 passed total N Kjeldahl wt. % 0.85 0.098 1.047 0.015 0.05 23.18 1.23 1.95 passed
1103 N-15 OES % at.ab. 1.119 0.0177 1.132 0.005 0.005 1.16 1.01 0.52 passed total N Kjeldahl wt. % 1.18 0.098 1.130 0.010 0.05 -4.24 0.96 -0.48 passed
Laboratory Code 12
Sample IAEA Data Reported Results Relative Analyst / IAEA z-score
Code Analyte Method Unit Value Unc. Value (Mean) SD of repl. Unc. bias
[%] ratio z-score status
1201 N-15 MS % at.ab. 0.553 0.0071 0.551 0.000 not rep. -0.36 1.00 -0.20 passed total N dry comb. wt. % 1.94 0.097 1.847 0.025 not rep. -4.79 0.95 -0.68 passed C-13 MS delta ‰ -29.24 0.140 -29.257 0.076 not rep. 0.06 1.00 -0.09 passed total C dry comb. wt. % 36.24 1.812 34.700 0.200 not rep. -4.25 0.96 -0.60 passed
1202 N-15 MS % at.ab. 1.076 0.0071 1.060 0.001 not rep. -1.49 0.99 -1.60 passed total N dry comb. wt. % 0.90 0.045 0.977 0.006 not rep. 8.56 1.09 1.20 passed C-13 MS delta ‰ -11.97 0.140 -12.100 0.000 not rep. 1.09 1.01 -0.65 passed total C dry comb. wt. % 43.1 2.155 40.467 0.252 not rep. -6.11 0.94 -0.86 passed
1203 N-15 MS % at.ab. 1.119 0.0071 1.105 0.002 not rep. -1.25 0.99 -1.40 passed total N dry comb. wt. % 1.24 0.062 1.230 0.000 not rep. -0.81 0.99 -0.11 passed C-13 MS delta ‰ -11.22 0.140 -11.427 0.051 not rep. 1.85 1.02 -1.04 passed total C dry comb. wt. % 43.71 2.186 40.967 0.115 not rep. -6.28 0.94 -0.89 passed
Final Report on the Annual Proficiency Test EQA2005
ANNEX A Page 33
ANNEX A: Performance evaluation tables sorted by laboratory Laboratory Code 13
Sample IAEA Data Reported Results Relative Analyst / IAEA z-score
Code Analyte Method Unit Value Unc. Value (Mean) SD of repl. Unc. bias
[%] ratio z-score status
1301 N-15 OES % at.ab. 0.553 0.0177 0.553 0.012 not rep. 0.00 1.00 0.00 passed total N Kjeldahl wt. % 1.78 0.098 1.803 0.012 not rep. 1.29 1.01 0.21 passed
1302 N-15 OES % at.ab. 1.076 0.0177 1.035 0.003 not rep. -3.81 0.96 -1.64 passed total N Kjeldahl wt. % 0.85 0.098 0.927 0.006 not rep. 9.06 1.09 0.76 passed
1303 N-15 OES % at.ab. 1.119 0.0177 1.119 0.017 not rep. 0.00 1.00 0.00 passed total N Kjeldahl wt. % 1.18 0.098 1.207 0.006 not rep. 2.29 1.02 0.26 passed
Laboratory Code 14
Sample IAEA Data Reported Results Relative Analyst / IAEA z-score
Code Analyte Method Unit Value Unc. Value (Mean) SD of repl. Unc. bias
[%] ratio z-score status
1401 N-15 OES % at.ab. 0.553 0.0177 0.588 0.002 not rep. 6.33 1.06 1.40 passed total N Kjeldahl wt. % 1.78 0.098 1.893 0.006 not rep. 6.35 1.06 1.02 passed
1402 N-15 OES % at.ab. 1.076 0.0177 1.085 0.001 not rep. 0.84 1.01 0.36 passed total N Kjeldahl wt. % 0.85 0.098 0.983 0.006 not rep. 15.65 1.16 1.32 passed
1403 N-15 OES % at.ab. 1.119 0.0177 1.146 0.001 not rep. 2.41 1.02 1.08 passed total N Kjeldahl wt. % 1.18 0.098 1.237 0.006 not rep. 4.83 1.05 0.55 passed
Page 34 Final Report on the Annual Proficiency Test EQA2005 ANNEX A
ANNEX A: Performance evaluation tables sorted by laboratory Laboratory Code 18
Sample IAEA Data Reported Results Relative Analyst / IAEA z-score
Code Analyte Method Unit Value Unc. Value (Mean) SD of repl. Unc. bias
[%] ratio z-score status 1801 N-15 OES % at.ab. 0.553 0.0177 0.559 0.006 0.0067 1.09 1.01 0.24 passed total N Kjeldahl wt. % 1.78 0.098 1.883 0.015 0.023 5.79 1.06 0.93 passed
1802 N-15 OES % at.ab. 1.076 0.0177 1.068 0.002 0.0067 -0.74 0.99 -0.32 passed total N Kjeldahl wt. % 0.85 0.098 1.000 0.026 0.023 17.65 1.18 1.49 passed
1803 N-15 OES % at.ab. 1.119 0.0177 1.123 0.003 0.0067 0.36 1.00 0.16 passed total N Kjeldahl wt. % 1.18 0.098 1.227 0.012 0.023 3.98 1.04 0.45 passed
Laboratory Code 19 Sample IAEA Data Reported Results Relative Analyst /
IAEA z-score
Code Analyte Method Unit Value Unc. Value (Mean) SD of repl. Unc. bias
[%] ratio z-score status 1901 N-15 MS % at.ab. 0.553 0.0071 0.551 0.001 not rep. -0.36 1.00 -0.20 passed total N dry comb. wt. % 1.94 0.097 1.807 0.006 not rep. -6.86 0.93 -0.97 passed C-13 MS delta ‰ -29.24 0.140 -29.170 0.087 not rep. -0.24 1.00 0.35 passed total C dry comb. wt. % 36.24 1.812 35.833 0.049 not rep. -1.12 0.99 -0.16 passed
1902 N-15 MS % at.ab. 1.076 0.0071 1.066 0.005 not rep. -0.93 0.99 -1.00 passed total N dry comb. wt. % 0.90 0.045 1.107 0.015 not rep. 23.00 1.23 3.23 rejected C-13 MS delta ‰ -11.97 0.140 -12.110 0.010 not rep. 1.17 1.01 -0.70 passed total C dry comb. wt. % 43.1 2.155 41.950 0.185 not rep. -2.67 0.97 -0.38 passed
1903 N-15 MS % at.ab. 1.119 0.0071 1.112 0.002 not rep. -0.63 0.99 -0.70 passed total N dry comb. wt. % 1.24 0.062 1.243 0.012 not rep. 0.24 1.00 0.03 passed C-13 MS delta ‰ -11.22 0.140 -11.347 0.006 not rep. 1.13 1.01 -0.64 passed total C dry comb. wt. % 43.71 2.186 43.007 0.165 not rep. -1.61 0.98 -0.23 passed

Final Report on the Annual Proficiency Test EQA2005
ANNEX A Page 35
ANNEX A: Performance evaluation tables sorted by laboratory Laboratory Code 21
Sample IAEA Data Reported Results Relative Analyst /
IAEA z-score
Code Analyte Method Unit Value Unc. Value (Mean) SD of repl. Unc. bias
[%] ratio z-score status
2101 N-15 MS % at.ab. 0.553 0.0071 0.575 0.002 not rep. 3.98 1.04 2.20 rejected 2101 total N dry comb. wt. % 1.94 0.097 1.917 0.006 not rep. -1.19 0.99 -0.17 passed 2101 C-13 MS delta ‰ -29.24 0.140 -29.350 0.030 not rep. 0.38 1.00 -0.55 passed 2101 total C dry comb. wt. % 36.24 1.812 38.490 0.070 not rep. 6.21 1.06 0.88 passed 2102 N-15 MS % at.ab. 1.076 0.0071 1.021 0.004 not rep. -5.11 0.95 -5.50 rejected 2102 total N dry comb. wt. % 0.90 0.045 0.933 0.032 not rep. 3.67 1.04 0.52 passed 2102 C-13 MS delta ‰ -11.97 0.140 -12.347 0.006 not rep. 3.15 1.03 -1.89 passed 2102 total C dry comb. wt. % 43.1 2.155 44.257 0.340 not rep. 2.68 1.03 0.38 passed 2103 N-15 MS % at.ab. 1.119 0.0071 1.122 0.001 not rep. 0.27 1.00 0.30 passed 2103 total N dry comb. wt. % 1.24 0.062 1.020 0.000 not rep. -17.74 0.82 -2.50 rejected 2103 C-13 MS delta ‰ -11.22 0.140 -11.490 0.026 not rep. 2.41 1.02 -1.35 passed 2103 total C dry comb. wt. % 43.71 2.186 48.117 0.253 not rep. 10.08 1.10 1.43 passed

Final Report on the Annual Proficiency Test EQA2005
Page 37
ANNEX B
ANNEX B:
Performance evaluation tables sorted by material and by analyte

Final Report on the Annual Proficiency Test EQA2005
Page 39 ANNEX B
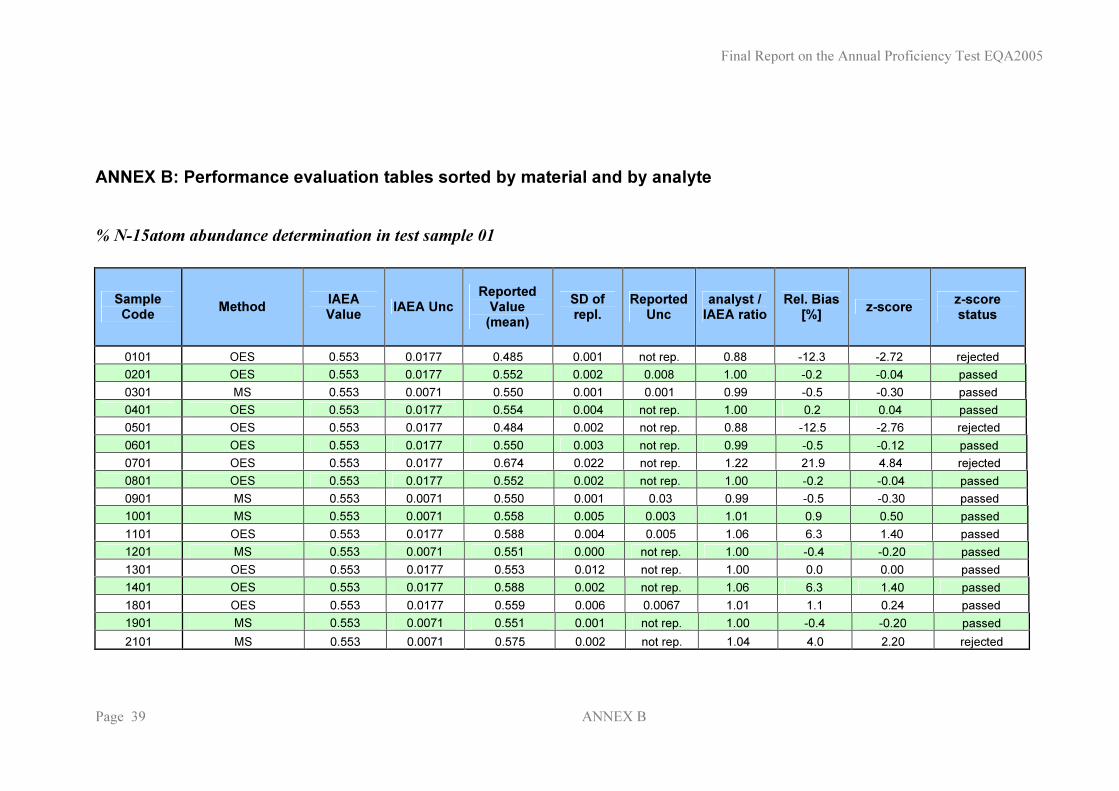
ANNEX B: Performance evaluation tables sorted by material and by analyte
% N-15atom abundance determination in test sample 01
Sample Code Method IAEA
Value IAEA Unc Reported
Value (mean)
SD of repl.
Reported Unc
analyst / IAEA ratio
Rel. Bias [%] z-score z-score
status
0101 OES 0.553 0.0177 0.485 0.001 not rep. 0.88 -12.3 -2.72 rejected 0201 OES 0.553 0.0177 0.552 0.002 0.008 1.00 -0.2 -0.04 passed 0301 MS 0.553 0.0071 0.550 0.001 0.001 0.99 -0.5 -0.30 passed 0401 OES 0.553 0.0177 0.554 0.004 not rep. 1.00 0.2 0.04 passed 0501 OES 0.553 0.0177 0.484 0.002 not rep. 0.88 -12.5 -2.76 rejected 0601 OES 0.553 0.0177 0.550 0.003 not rep. 0.99 -0.5 -0.12 passed 0701 OES 0.553 0.0177 0.674 0.022 not rep. 1.22 21.9 4.84 rejected 0801 OES 0.553 0.0177 0.552 0.002 not rep. 1.00 -0.2 -0.04 passed 0901 MS 0.553 0.0071 0.550 0.001 0.03 0.99 -0.5 -0.30 passed 1001 MS 0.553 0.0071 0.558 0.005 0.003 1.01 0.9 0.50 passed 1101 OES 0.553 0.0177 0.588 0.004 0.005 1.06 6.3 1.40 passed 1201 MS 0.553 0.0071 0.551 0.000 not rep. 1.00 -0.4 -0.20 passed 1301 OES 0.553 0.0177 0.553 0.012 not rep. 1.00 0.0 0.00 passed 1401 OES 0.553 0.0177 0.588 0.002 not rep. 1.06 6.3 1.40 passed 1801 OES 0.553 0.0177 0.559 0.006 0.0067 1.01 1.1 0.24 passed 1901 MS 0.553 0.0071 0.551 0.001 not rep. 1.00 -0.4 -0.20 passed 2101 MS 0.553 0.0071 0.575 0.002 not rep. 1.04 4.0 2.20 rejected
Final Report on the Annual Proficiency Test EQA2005 Page 40 ANNEX B
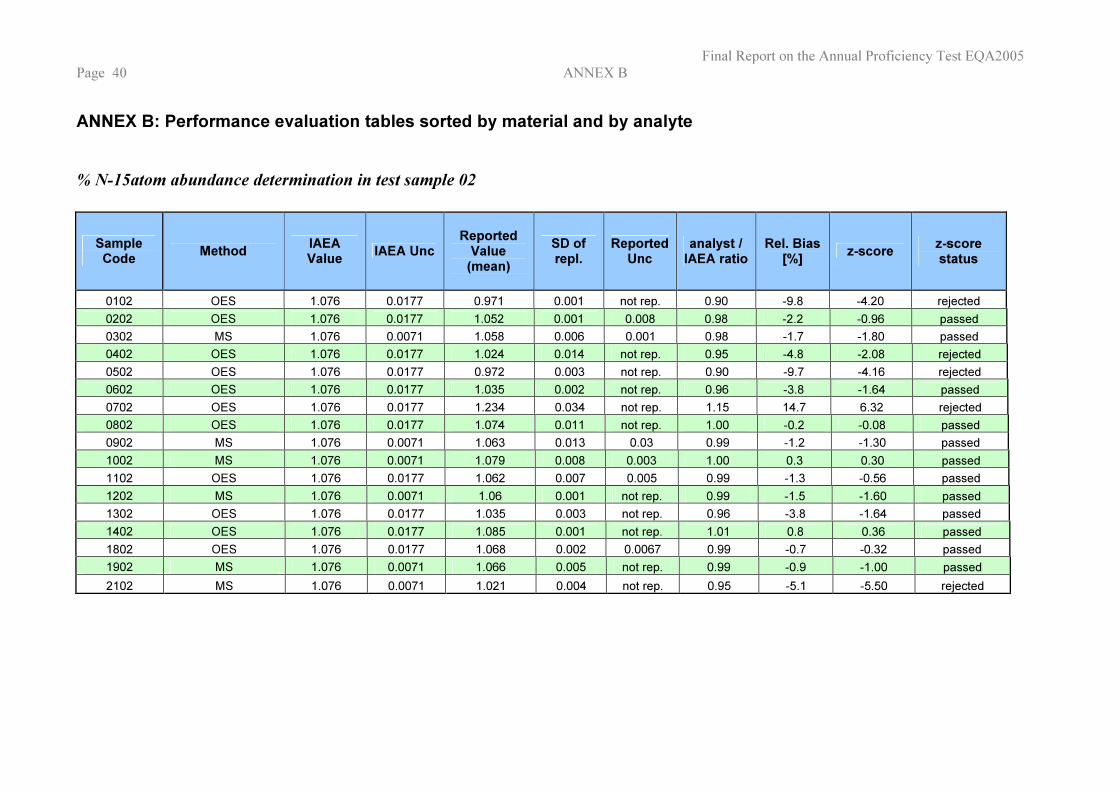
ANNEX B: Performance evaluation tables sorted by material and by analyte
% N-15atom abundance determination in test sample 02
Sample Code Method IAEA
Value IAEA Unc Reported
Value (mean)
SD of repl.
Reported Unc
analyst / IAEA ratio
Rel. Bias [%] z-score z-score
status
0102 OES 1.076 0.0177 0.971 0.001 not rep. 0.90 -9.8 -4.20 rejected 0202 OES 1.076 0.0177 1.052 0.001 0.008 0.98 -2.2 -0.96 passed 0302 MS 1.076 0.0071 1.058 0.006 0.001 0.98 -1.7 -1.80 passed 0402 OES 1.076 0.0177 1.024 0.014 not rep. 0.95 -4.8 -2.08 rejected 0502 OES 1.076 0.0177 0.972 0.003 not rep. 0.90 -9.7 -4.16 rejected 0602 OES 1.076 0.0177 1.035 0.002 not rep. 0.96 -3.8 -1.64 passed 0702 OES 1.076 0.0177 1.234 0.034 not rep. 1.15 14.7 6.32 rejected 0802 OES 1.076 0.0177 1.074 0.011 not rep. 1.00 -0.2 -0.08 passed 0902 MS 1.076 0.0071 1.063 0.013 0.03 0.99 -1.2 -1.30 passed 1002 MS 1.076 0.0071 1.079 0.008 0.003 1.00 0.3 0.30 passed 1102 OES 1.076 0.0177 1.062 0.007 0.005 0.99 -1.3 -0.56 passed 1202 MS 1.076 0.0071 1.06 0.001 not rep. 0.99 -1.5 -1.60 passed 1302 OES 1.076 0.0177 1.035 0.003 not rep. 0.96 -3.8 -1.64 passed 1402 OES 1.076 0.0177 1.085 0.001 not rep. 1.01 0.8 0.36 passed 1802 OES 1.076 0.0177 1.068 0.002 0.0067 0.99 -0.7 -0.32 passed 1902 MS 1.076 0.0071 1.066 0.005 not rep. 0.99 -0.9 -1.00 passed 2102 MS 1.076 0.0071 1.021 0.004 not rep. 0.95 -5.1 -5.50 rejected

Final Report on the Annual Proficiency Test EQA2005
Page 41 ANNEX B
ANNEX B: Performance evaluation tables sorted by material and by analyte % N-15atom abundance determination in test sample 03
Sample Code Method IAEA
Value IAEA Unc Reported
Value (mean)
SD of repl.
Reported Unc
analyst / IAEA ratio
Rel. Bias [%] z-score z-score
status
0103 OES 1.119 0.0177 1.025 0.001 not rep. 0.92 -8.4 -3.76 rejected 0203 OES 1.119 0.0177 1.107 0.002 0.008 0.99 -1.1 -0.48 passed 0303 MS 1.119 0.0071 1.128 0.017 0.001 1.01 0.8 0.90 passed 0403 OES 1.119 0.0177 1.077 0.015 not rep. 0.96 -3.8 -1.68 passed 0503 OES 1.119 0.0177 1.021 0.003 not rep. 0.91 -8.8 -3.92 rejected 0603 OES 1.119 0.0177 1.092 0.002 not rep. 0.98 -2.4 -1.08 passed 0703 OES 1.119 0.0177 1.275 0.008 not rep. 1.14 13.9 6.24 rejected 0803 OES 1.119 0.0177 1.112 0.002 not rep. 0.99 -0.6 -0.28 passed 0903 MS 1.119 0.0071 1.097 0.002 0.03 0.98 -2.0 -2.20 rejected 1003 MS 1.119 0.0071 1.131 0.003 0.003 1.01 1.1 1.20 passed 1103 OES 1.119 0.0177 1.132 0.005 0.005 1.01 1.2 0.52 passed 1203 MS 1.119 0.0071 1.105 0.002 not rep. 0.99 -1.3 -1.40 passed 1303 OES 1.119 0.0177 1.119 0.017 not rep. 1.00 0.0 0.00 passed 1403 OES 1.119 0.0177 1.146 0.001 not rep. 1.02 2.4 1.08 passed 1803 OES 1.119 0.0177 1.123 0.003 0.0067 1.00 0.4 0.16 passed 1903 MS 1.119 0.0071 1.112 0.002 not rep. 0.99 -0.6 -0.70 passed 2103 MS 1.119 0.0071 1.122 0.001 not rep. 1.00 0.3 0.30 passed
Final Report on the Annual Proficiency Test EQA2005 Page 42 ANNEX B
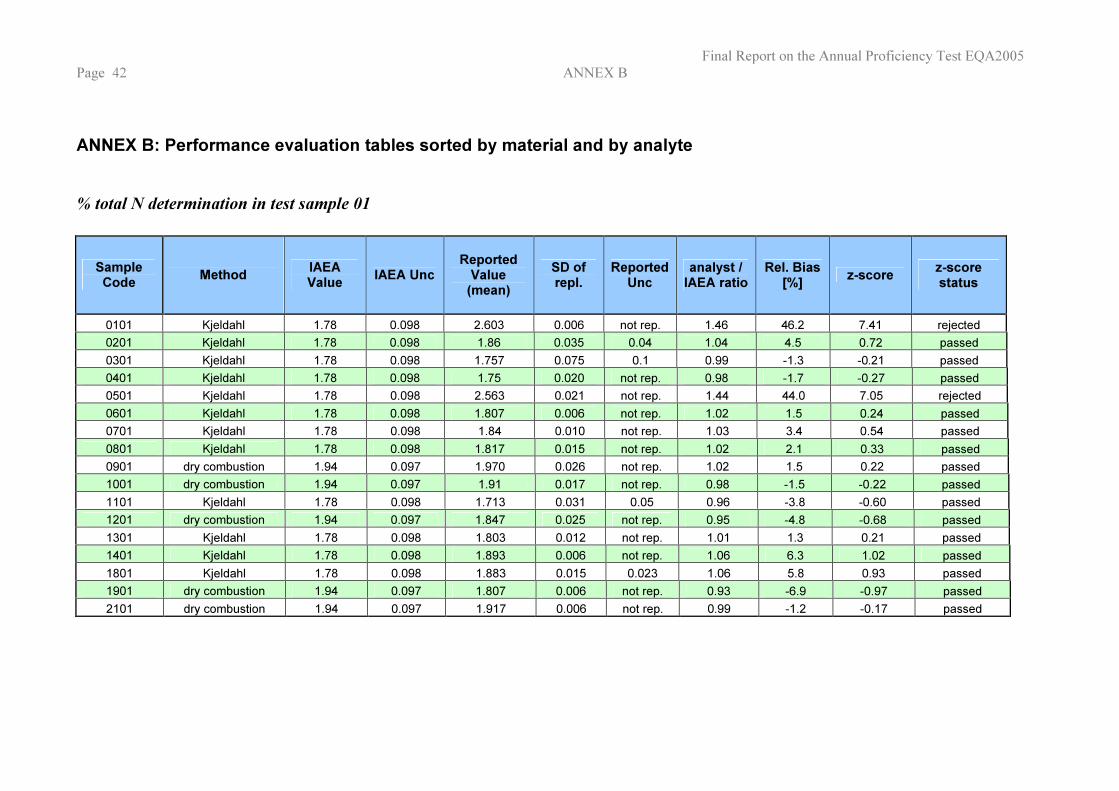
ANNEX B: Performance evaluation tables sorted by material and by analyte
% total N determination in test sample 01
Sample Code Method IAEA
Value IAEA Unc Reported
Value (mean)
SD of repl.
Reported Unc
analyst / IAEA ratio
Rel. Bias [%] z-score z-score
status
0101 Kjeldahl 1.78 0.098 2.603 0.006 not rep. 1.46 46.2 7.41 rejected 0201 Kjeldahl 1.78 0.098 1.86 0.035 0.04 1.04 4.5 0.72 passed 0301 Kjeldahl 1.78 0.098 1.757 0.075 0.1 0.99 -1.3 -0.21 passed 0401 Kjeldahl 1.78 0.098 1.75 0.020 not rep. 0.98 -1.7 -0.27 passed 0501 Kjeldahl 1.78 0.098 2.563 0.021 not rep. 1.44 44.0 7.05 rejected 0601 Kjeldahl 1.78 0.098 1.807 0.006 not rep. 1.02 1.5 0.24 passed 0701 Kjeldahl 1.78 0.098 1.84 0.010 not rep. 1.03 3.4 0.54 passed 0801 Kjeldahl 1.78 0.098 1.817 0.015 not rep. 1.02 2.1 0.33 passed 0901 dry combustion 1.94 0.097 1.970 0.026 not rep. 1.02 1.5 0.22 passed 1001 dry combustion 1.94 0.097 1.91 0.017 not rep. 0.98 -1.5 -0.22 passed 1101 Kjeldahl 1.78 0.098 1.713 0.031 0.05 0.96 -3.8 -0.60 passed 1201 dry combustion 1.94 0.097 1.847 0.025 not rep. 0.95 -4.8 -0.68 passed 1301 Kjeldahl 1.78 0.098 1.803 0.012 not rep. 1.01 1.3 0.21 passed 1401 Kjeldahl 1.78 0.098 1.893 0.006 not rep. 1.06 6.3 1.02 passed 1801 Kjeldahl 1.78 0.098 1.883 0.015 0.023 1.06 5.8 0.93 passed 1901 dry combustion 1.94 0.097 1.807 0.006 not rep. 0.93 -6.9 -0.97 passed 2101 dry combustion 1.94 0.097 1.917 0.006 not rep. 0.99 -1.2 -0.17 passed
Final Report on the Annual Proficiency Test EQA2005
Page 43 ANNEX B
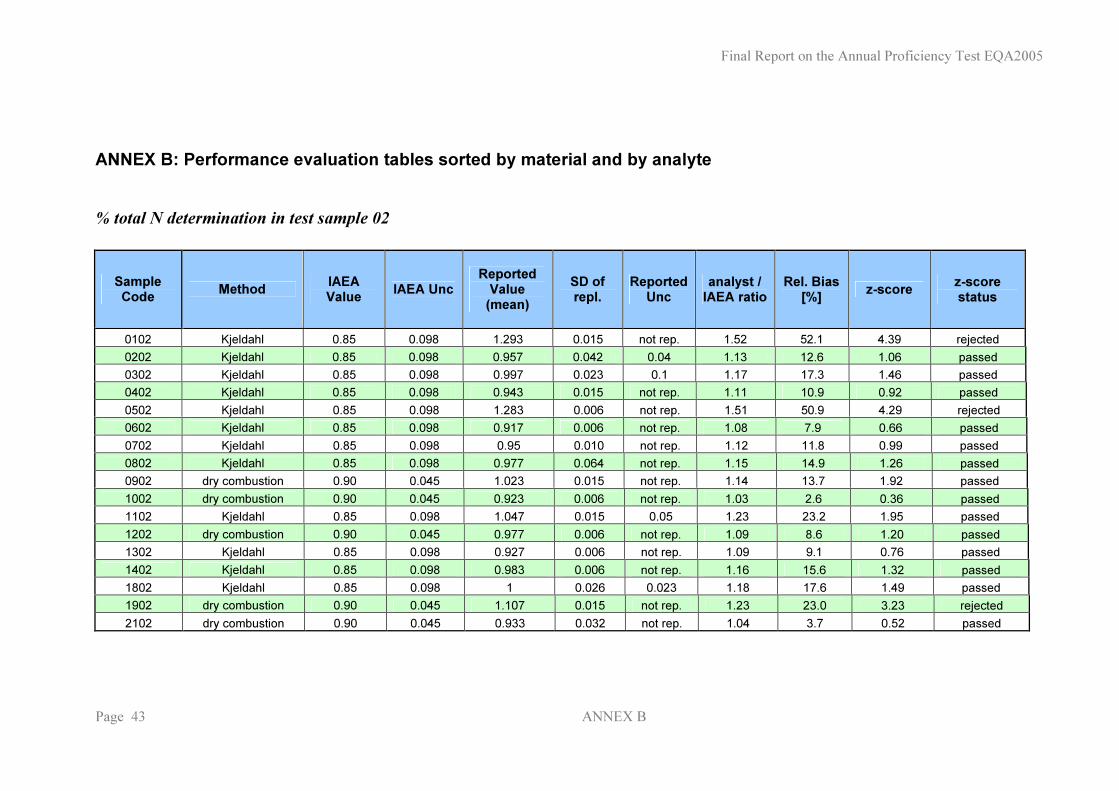
ANNEX B: Performance evaluation tables sorted by material and by analyte
% total N determination in test sample 02
Sample Code Method IAEA
Value IAEA Unc Reported
Value (mean)
SD of repl.
Reported Unc
analyst / IAEA ratio
Rel. Bias [%] z-score z-score
status
0102 Kjeldahl 0.85 0.098 1.293 0.015 not rep. 1.52 52.1 4.39 rejected 0202 Kjeldahl 0.85 0.098 0.957 0.042 0.04 1.13 12.6 1.06 passed 0302 Kjeldahl 0.85 0.098 0.997 0.023 0.1 1.17 17.3 1.46 passed 0402 Kjeldahl 0.85 0.098 0.943 0.015 not rep. 1.11 10.9 0.92 passed 0502 Kjeldahl 0.85 0.098 1.283 0.006 not rep. 1.51 50.9 4.29 rejected 0602 Kjeldahl 0.85 0.098 0.917 0.006 not rep. 1.08 7.9 0.66 passed 0702 Kjeldahl 0.85 0.098 0.95 0.010 not rep. 1.12 11.8 0.99 passed 0802 Kjeldahl 0.85 0.098 0.977 0.064 not rep. 1.15 14.9 1.26 passed 0902 dry combustion 0.90 0.045 1.023 0.015 not rep. 1.14 13.7 1.92 passed 1002 dry combustion 0.90 0.045 0.923 0.006 not rep. 1.03 2.6 0.36 passed 1102 Kjeldahl 0.85 0.098 1.047 0.015 0.05 1.23 23.2 1.95 passed 1202 dry combustion 0.90 0.045 0.977 0.006 not rep. 1.09 8.6 1.20 passed 1302 Kjeldahl 0.85 0.098 0.927 0.006 not rep. 1.09 9.1 0.76 passed 1402 Kjeldahl 0.85 0.098 0.983 0.006 not rep. 1.16 15.6 1.32 passed 1802 Kjeldahl 0.85 0.098 1 0.026 0.023 1.18 17.6 1.49 passed 1902 dry combustion 0.90 0.045 1.107 0.015 not rep. 1.23 23.0 3.23 rejected 2102 dry combustion 0.90 0.045 0.933 0.032 not rep. 1.04 3.7 0.52 passed
Final Report on the Annual Proficiency Test EQA2005 Page 44 ANNEX B
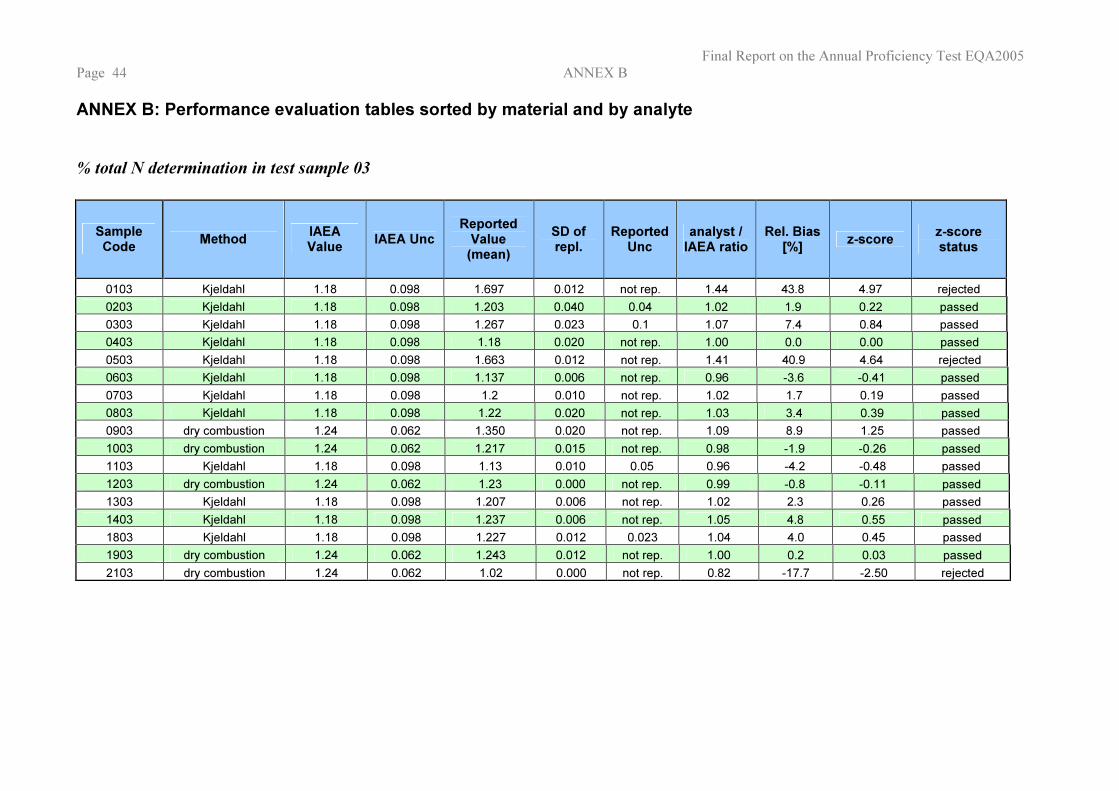
ANNEX B: Performance evaluation tables sorted by material and by analyte
% total N determination in test sample 03
Sample Code Method IAEA
Value IAEA Unc Reported
Value (mean)
SD of repl.
Reported Unc
analyst / IAEA ratio
Rel. Bias [%] z-score z-score
status
0103 Kjeldahl 1.18 0.098 1.697 0.012 not rep. 1.44 43.8 4.97 rejected 0203 Kjeldahl 1.18 0.098 1.203 0.040 0.04 1.02 1.9 0.22 passed 0303 Kjeldahl 1.18 0.098 1.267 0.023 0.1 1.07 7.4 0.84 passed 0403 Kjeldahl 1.18 0.098 1.18 0.020 not rep. 1.00 0.0 0.00 passed 0503 Kjeldahl 1.18 0.098 1.663 0.012 not rep. 1.41 40.9 4.64 rejected 0603 Kjeldahl 1.18 0.098 1.137 0.006 not rep. 0.96 -3.6 -0.41 passed 0703 Kjeldahl 1.18 0.098 1.2 0.010 not rep. 1.02 1.7 0.19 passed 0803 Kjeldahl 1.18 0.098 1.22 0.020 not rep. 1.03 3.4 0.39 passed 0903 dry combustion 1.24 0.062 1.350 0.020 not rep. 1.09 8.9 1.25 passed 1003 dry combustion 1.24 0.062 1.217 0.015 not rep. 0.98 -1.9 -0.26 passed 1103 Kjeldahl 1.18 0.098 1.13 0.010 0.05 0.96 -4.2 -0.48 passed 1203 dry combustion 1.24 0.062 1.23 0.000 not rep. 0.99 -0.8 -0.11 passed 1303 Kjeldahl 1.18 0.098 1.207 0.006 not rep. 1.02 2.3 0.26 passed 1403 Kjeldahl 1.18 0.098 1.237 0.006 not rep. 1.05 4.8 0.55 passed 1803 Kjeldahl 1.18 0.098 1.227 0.012 0.023 1.04 4.0 0.45 passed 1903 dry combustion 1.24 0.062 1.243 0.012 not rep. 1.00 0.2 0.03 passed 2103 dry combustion 1.24 0.062 1.02 0.000 not rep. 0.82 -17.7 -2.50 rejected
Final Report on the Annual Proficiency Test EQA2005
Page 45 ANNEX B
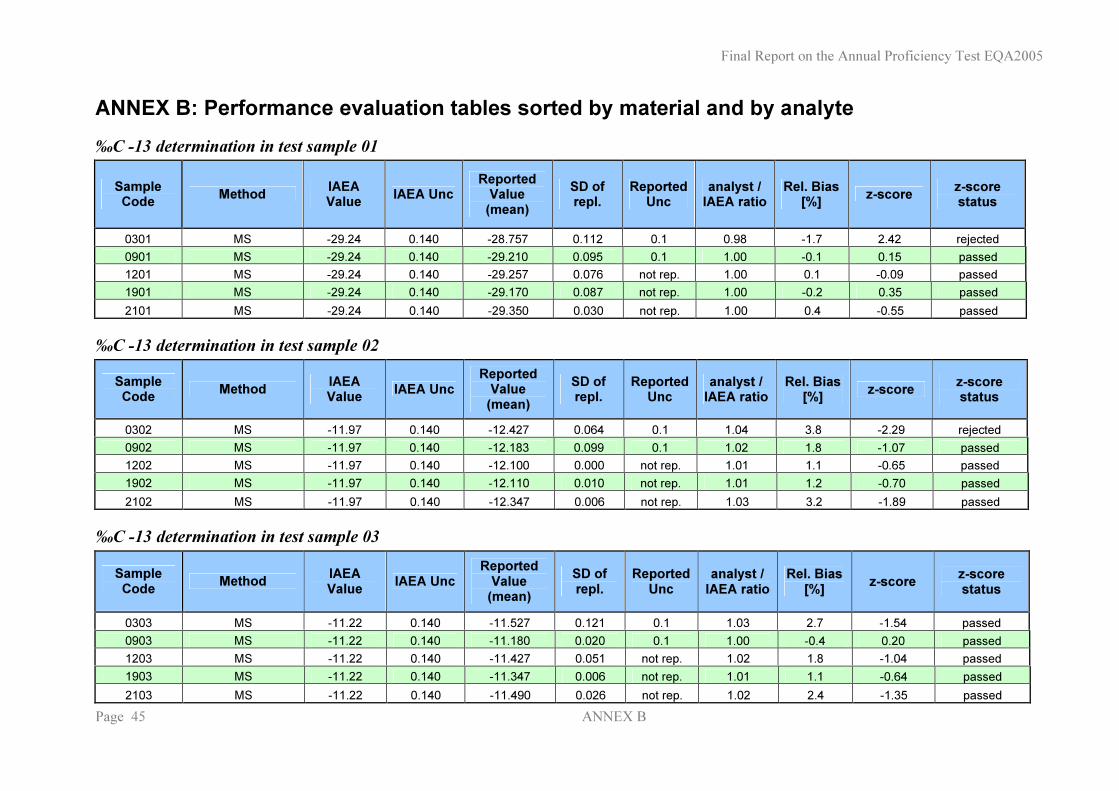
ANNEX B: Performance evaluation tables sorted by material and by analyte ‰C -13 determination in test sample 01
Sample Code Method IAEA
Value IAEA Unc Reported
Value (mean)
SD of repl.
Reported Unc
analyst / IAEA ratio
Rel. Bias [%] z-score z-score
status
0301 MS -29.24 0.140 -28.757 0.112 0.1 0.98 -1.7 2.42 rejected 0901 MS -29.24 0.140 -29.210 0.095 0.1 1.00 -0.1 0.15 passed 1201 MS -29.24 0.140 -29.257 0.076 not rep. 1.00 0.1 -0.09 passed 1901 MS -29.24 0.140 -29.170 0.087 not rep. 1.00 -0.2 0.35 passed 2101 MS -29.24 0.140 -29.350 0.030 not rep. 1.00 0.4 -0.55 passed
‰C -13 determination in test sample 02 Sample Code Method IAEA
Value IAEA Unc Reported
Value (mean)
SD of repl.
Reported Unc
analyst / IAEA ratio
Rel. Bias [%] z-score z-score
status
0302 MS -11.97 0.140 -12.427 0.064 0.1 1.04 3.8 -2.29 rejected 0902 MS -11.97 0.140 -12.183 0.099 0.1 1.02 1.8 -1.07 passed 1202 MS -11.97 0.140 -12.100 0.000 not rep. 1.01 1.1 -0.65 passed 1902 MS -11.97 0.140 -12.110 0.010 not rep. 1.01 1.2 -0.70 passed 2102 MS -11.97 0.140 -12.347 0.006 not rep. 1.03 3.2 -1.89 passed
‰C -13 determination in test sample 03 Sample Code Method IAEA
Value IAEA Unc Reported
Value (mean)
SD of repl.
Reported Unc
analyst / IAEA ratio
Rel. Bias [%] z-score z-score
status
0303 MS -11.22 0.140 -11.527 0.121 0.1 1.03 2.7 -1.54 passed 0903 MS -11.22 0.140 -11.180 0.020 0.1 1.00 -0.4 0.20 passed 1203 MS -11.22 0.140 -11.427 0.051 not rep. 1.02 1.8 -1.04 passed 1903 MS -11.22 0.140 -11.347 0.006 not rep. 1.01 1.1 -0.64 passed 2103 MS -11.22 0.140 -11.490 0.026 not rep. 1.02 2.4 -1.35 passed
Final Report on the Annual Proficiency Test EQA2005 Page 46 ANNEX B
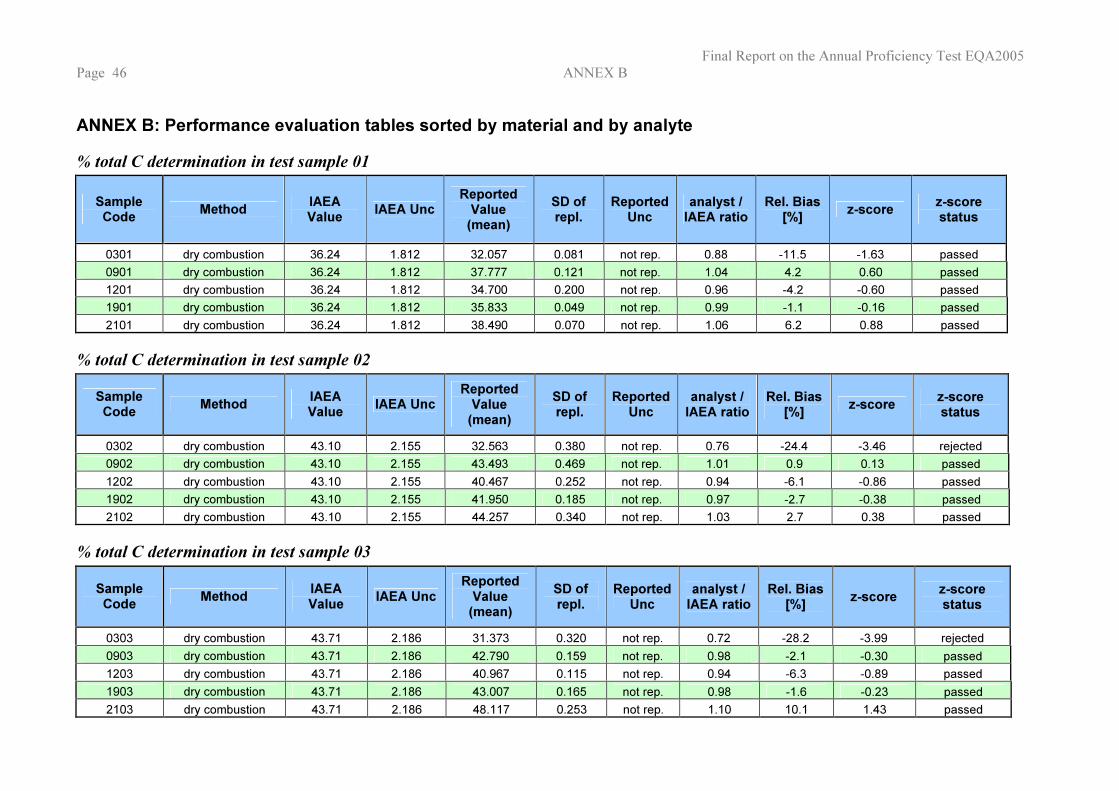
ANNEX B: Performance evaluation tables sorted by material and by analyte % total C determination in test sample 01
Sample Code Method IAEA
Value IAEA Unc Reported
Value (mean)
SD of repl.
Reported Unc
analyst / IAEA ratio
Rel. Bias [%] z-score z-score
status
0301 dry combustion 36.24 1.812 32.057 0.081 not rep. 0.88 -11.5 -1.63 passed 0901 dry combustion 36.24 1.812 37.777 0.121 not rep. 1.04 4.2 0.60 passed 1201 dry combustion 36.24 1.812 34.700 0.200 not rep. 0.96 -4.2 -0.60 passed 1901 dry combustion 36.24 1.812 35.833 0.049 not rep. 0.99 -1.1 -0.16 passed 2101 dry combustion 36.24 1.812 38.490 0.070 not rep. 1.06 6.2 0.88 passed
% total C determination in test sample 02 Sample Code Method IAEA
Value IAEA Unc Reported
Value (mean)
SD of repl.
Reported Unc
analyst / IAEA ratio
Rel. Bias [%] z-score z-score
status
0302 dry combustion 43.10 2.155 32.563 0.380 not rep. 0.76 -24.4 -3.46 rejected 0902 dry combustion 43.10 2.155 43.493 0.469 not rep. 1.01 0.9 0.13 passed 1202 dry combustion 43.10 2.155 40.467 0.252 not rep. 0.94 -6.1 -0.86 passed 1902 dry combustion 43.10 2.155 41.950 0.185 not rep. 0.97 -2.7 -0.38 passed 2102 dry combustion 43.10 2.155 44.257 0.340 not rep. 1.03 2.7 0.38 passed
% total C determination in test sample 03 Sample Code Method IAEA
Value IAEA Unc Reported
Value (mean)
SD of repl.
Reported Unc
analyst / IAEA ratio
Rel. Bias [%] z-score z-score
status
0303 dry combustion 43.71 2.186 31.373 0.320 not rep. 0.72 -28.2 -3.99 rejected 0903 dry combustion 43.71 2.186 42.790 0.159 not rep. 0.98 -2.1 -0.30 passed 1203 dry combustion 43.71 2.186 40.967 0.115 not rep. 0.94 -6.3 -0.89 passed 1903 dry combustion 43.71 2.186 43.007 0.165 not rep. 0.98 -1.6 -0.23 passed 2103 dry combustion 43.71 2.186 48.117 0.253 not rep. 1.10 10.1 1.43 passed
Final Report on the Annual Proficiency Test EQA2005
ANNEX C
Page 47
ANNEX C:
Individual monitoring of analytical performance
(years 2000-2005)

Final Report on the Annual Proficiency Test EQA2005
ANNEX C
Page 49
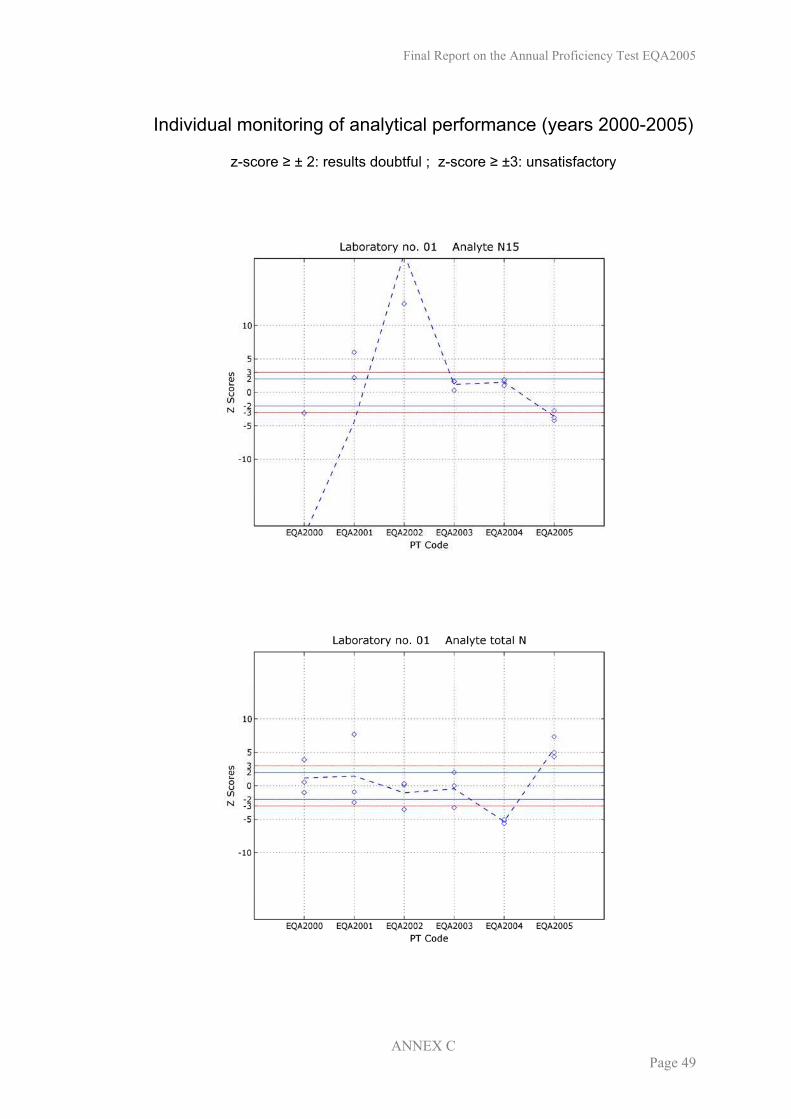
Individual monitoring of analytical performance (years 2000-2005)
z-score ± 2: results doubtful ; z-score ±3: unsatisfactory
Final Report on the Annual Proficiency Test EQA2005
ANNEX C
Page 50
Individual monitoring of analytical performance (years 2000-2005)
z-score ± 2: results doubtful ; z-score ±3: unsatisfactory
Final Report on the Annual Proficiency Test EQA2005
ANNEX C
Page 51
Individual monitoring of analytical performance (years 2000-2005)
z-score ± 2: results doubtful ; z-score ±3: unsatisfactory
Final Report on the Annual Proficiency Test EQA2005
ANNEX C
Page 52
Individual monitoring of analytical performance (years 2000-2005)
z-score ± 2: results doubtful ; z-score ±3: unsatisfactory
Final Report on the Annual Proficiency Test EQA2005
ANNEX C
Page 53
Individual monitoring of analytical performance (years 2000-2005)
z-score ± 2: results doubtful ; z-score ±3: unsatisfactory
Final Report on the Annual Proficiency Test EQA2005
ANNEX C
Page 54
Individual monitoring of analytical performance (years 2000-2005)
z-score ± 2: results doubtful ; z-score ±3: unsatisfactory
Final Report on the Annual Proficiency Test EQA2005
ANNEX C
Page 55
Individual monitoring of analytical performance (years 2000-2005)
z-score ± 2: results doubtful ; z-score ±3: unsatisfactory
Final Report on the Annual Proficiency Test EQA2005
ANNEX C
Page 56
Individual monitoring of analytical performance (years 2000-2005)
z-score ± 2: results doubtful ; z-score ±3: unsatisfactory
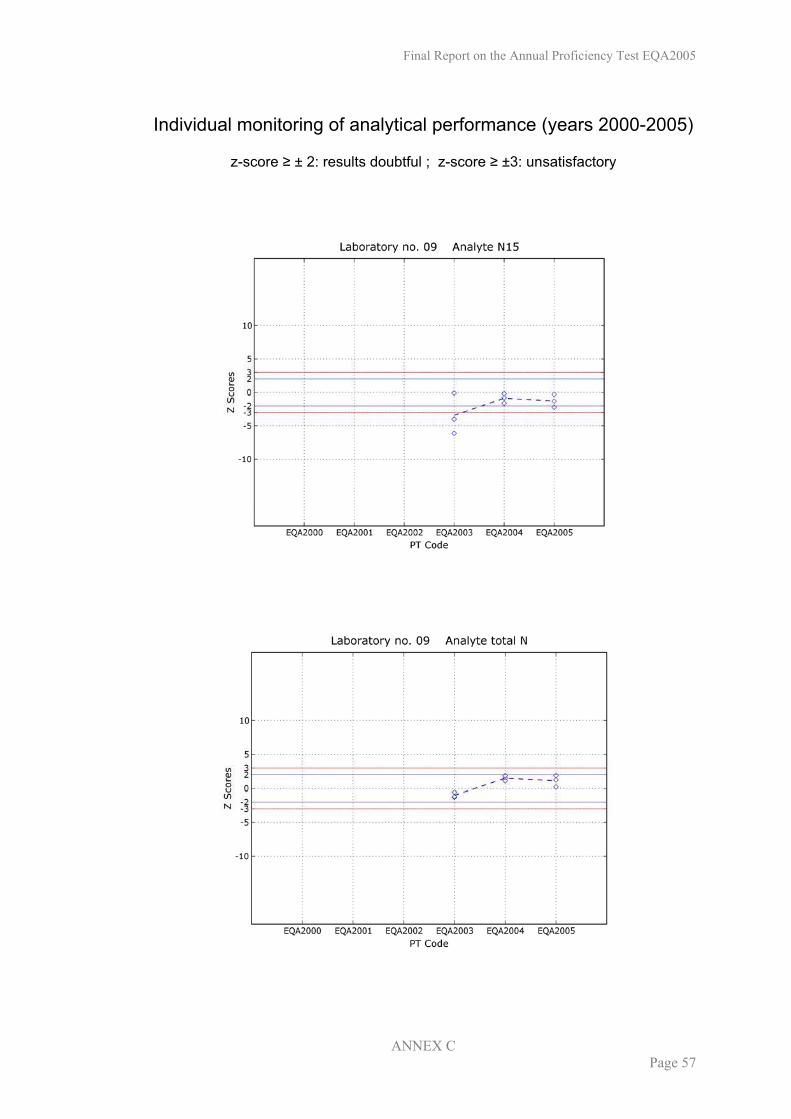
Final Report on the Annual Proficiency Test EQA2005
ANNEX C
Page 57
Individual monitoring of analytical performance (years 2000-2005)
z-score ± 2: results doubtful ; z-score ±3: unsatisfactory
Final Report on the Annual Proficiency Test EQA2005
ANNEX C
Page 58
Individual monitoring of analytical performance (years 2000-2005)
z-score ± 2: results doubtful ; z-score ±3: unsatisfactory
Final Report on the Annual Proficiency Test EQA2005
ANNEX C
Page 59
Individual monitoring of analytical performance (years 2000-2005)
z-score ± 2: results doubtful ; z-score ±3: unsatisfactory
Final Report on the Annual Proficiency Test EQA2005
ANNEX C
Page 60
Individual monitoring of analytical performance (years 2000-2005)
z-score ± 2: results doubtful ; z-score ±3: unsatisfactory
Final Report on the Annual Proficiency Test EQA2005
ANNEX C
Page 61
Individual monitoring of analytical performance (years 2000-2005)
z-score ± 2: results doubtful ; z-score ±3: unsatisfactory
Final Report on the Annual Proficiency Test EQA2005
ANNEX C
Page 62
Individual monitoring of analytical performance (years 2000-2005)
z-score ± 2: results doubtful ; z-score ±3: unsatisfactory
Final Report on the Annual Proficiency Test EQA2005
ANNEX C
Page 63
Individual monitoring of analytical performance (years 2000-2005)
z-score ± 2: results doubtful ; z-score ±3: unsatisfactory
Final Report on the Annual Proficiency Test EQA2005
ANNEX C
Page 64
Individual monitoring of analytical performance (years 2000-2005)
z-score ± 2: results doubtful ; z-score ±3: unsatisfactory

Final Report on the Annual Proficiency Test EQA2005
ANNEX C
Page 65
Individual monitoring of analytical performance (years 2000-2005)
z-score ± 2: results doubtful ; z-score ±3: unsatisfactory

Final Report on the Annual Proficiency Test EQA2005
ANNEX D
Page 67
ANNEX D:
1. Covering letter
2. Receipt Form (F-01)
3. Handling Instructions (F-02)
4. Reporting Forms (F-03 A/B/C)
5. Questionnaire (F03-D)
6. Certificates


ANNEX D
Page 69
Seibersdorf, January 30, 2005
Subject: Samples of the Proficiency Test “EQA2005” for the Determination of Total
Nitrogen and 15
N Isotopic Abundance and/or Total Carbon and 13
C Isotopic
Abundance in plant materials
Dear Participant,
Please find enclosed a set of samples together with the instructions for analysis for
Proficiency Test EQA2005 initiated by the Soil Science Unit, FAO/IAEA Biotechnology
and Agriculture Laboratories, Seibersdorf, Austria. All forms will also be sent in electronic
form to those of you, who have access to the internet.
In the package you should find the following:
3 coded bottles with 15 g powdered plant material each
Receipt form F-01
Instructions for analysis F-02
Reporting forms F-03, F03A, F-03B, F-03C, F03D
Please note, that the forms for the Proficiency Test have been re-designed as a
result of harmonizing related external quality assurance activities within the IAEA under the
consideration of relevant international standards (ISO17025).
Please read the documentation carefully before commencing the analysis and return
the sample receipt form (F-01) at your earliest convenience. Analyze the samples according
to the instructions for analysis (F-02). Send back the filled in reporting sheet (F-03, F-03A,-
B, -C, and -D) before August-31-2005 to the EQA-coordinator, Ms. M.Aigner.
Recipient Name
Recipient Address
Atoms For Peace
Wagramer Strasse 5, P.O. Box 100, A-1400 Wien, Austria
Phone: (+43 1) 2600 Fax: (+43 1) 26007
E-mail: [email protected] Internet: http://www.iaea.org
In reply please refer to:
Dial directly to extension: (+431) 2600-
ANNEX D
Page 70
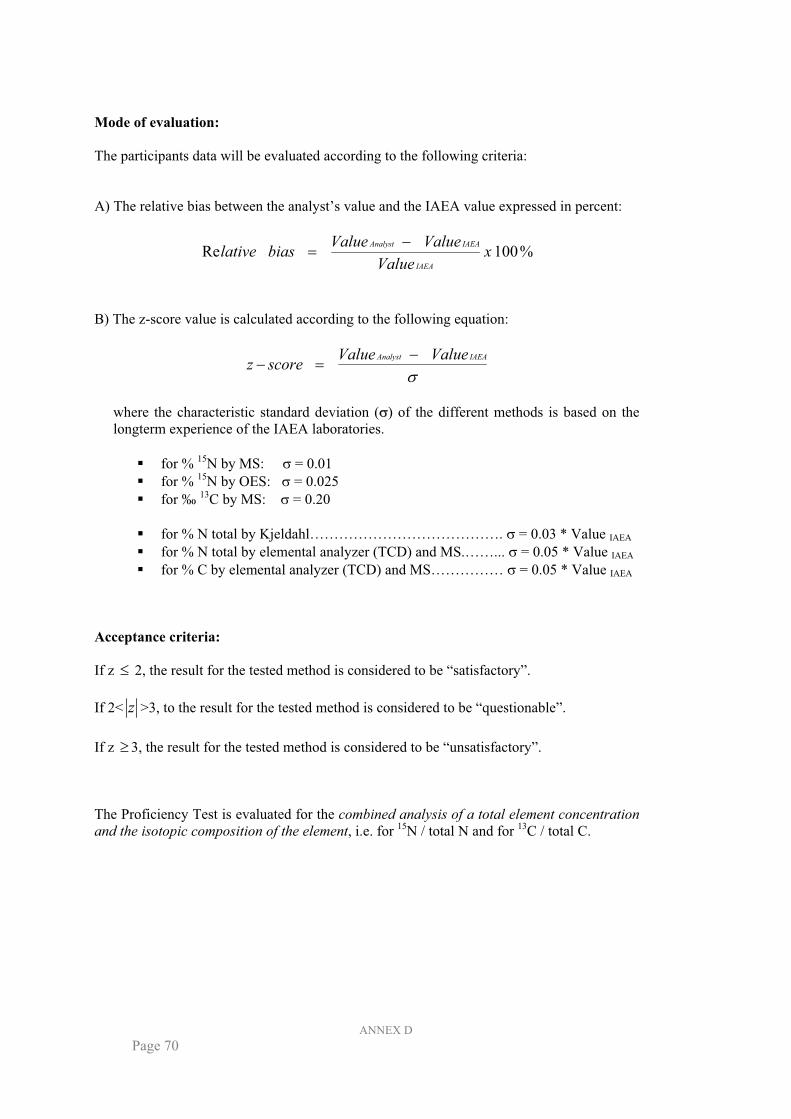
Mode of evaluation:
The participants data will be evaluated according to the following criteria:
A) The relative bias between the analyst’s value and the IAEA value expressed in percent:
%100Re xValue
ValueValuebiaslative
IAEA
IAEAAnalyst
B) The z-score value is calculated according to the following equation:
IAEAAnalyst ValueValuescorez
where the characteristic standard deviation ( ) of the different methods is based on the
longterm experience of the IAEA laboratories.
for % 15N by MS: = 0.01
for % 15N by OES: = 0.025
for ‰ 13C by MS: = 0.20
for % N total by Kjeldahl…………………………………. = 0.03 * Value IAEA
for % N total by elemental analyzer (TCD) and MS.……... = 0.05 * Value IAEA
for % C by elemental analyzer (TCD) and MS…………… = 0.05 * Value IAEA
Acceptance criteria:
If z 2, the result for the tested method is considered to be “satisfactory”.
If 2< z >3, to the result for the tested method is considered to be “questionable”.
If z 3, the result for the tested method is considered to be “unsatisfactory”.
The Proficiency Test is evaluated for the combined analysis of a total element concentration
and the isotopic composition of the element, i.e. for 15N / total N and for 13C / total C.
ANNEX D
Page 71
Therefore :
the test (e.g. for15N/N or for 13C/C) is “passed”, if the isotope composition and the
element concentration are “satisfactory“ in all three test samples
the test is “failed”, if in one or more test samples the isotopic composition and / or
element concentration is “questionable” or “unsatisfactory“
Thank you for your collaboration.
Martina Aigner
EQA-Coordinator, Soil Science Unit
FAO/IAEA Biotechnology and Agriculture Laboratories
A-2444 Seibersdorf
Austria
phone: +43 1 2600 28212
fax: +43 1 2600 28222
E-mail: [email protected]

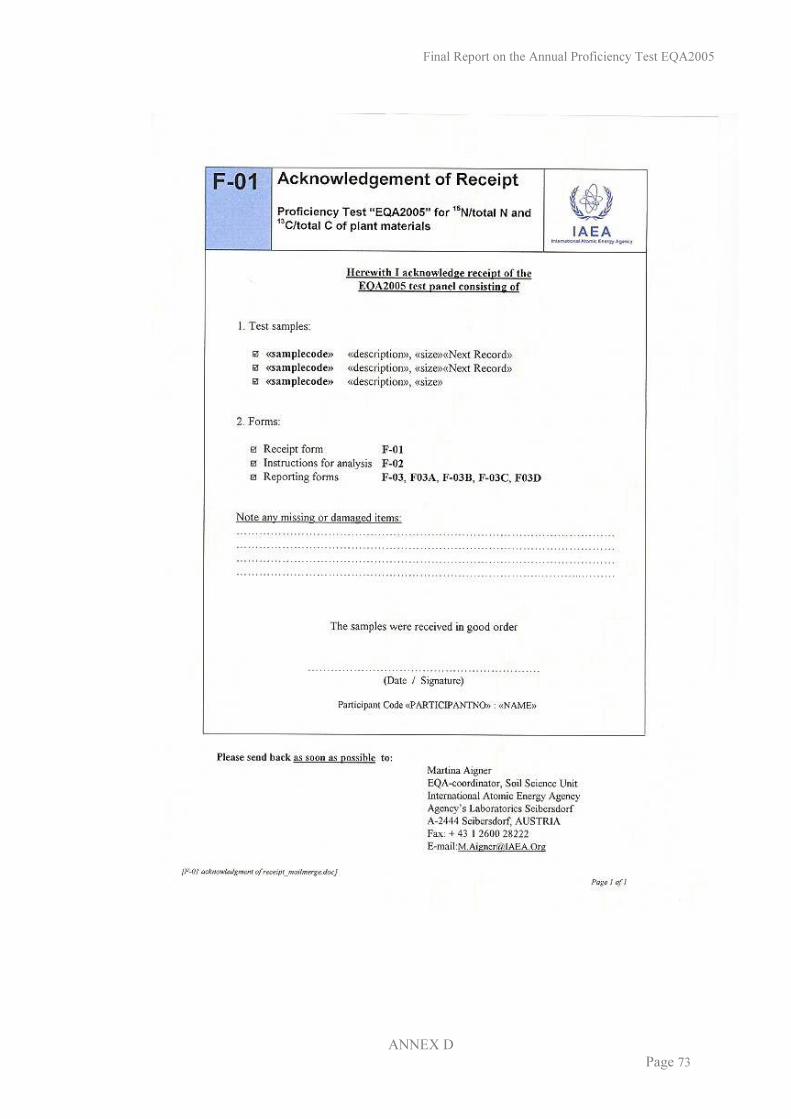
Final Report on the Annual Proficiency Test EQA2005
ANNEX D Page 73

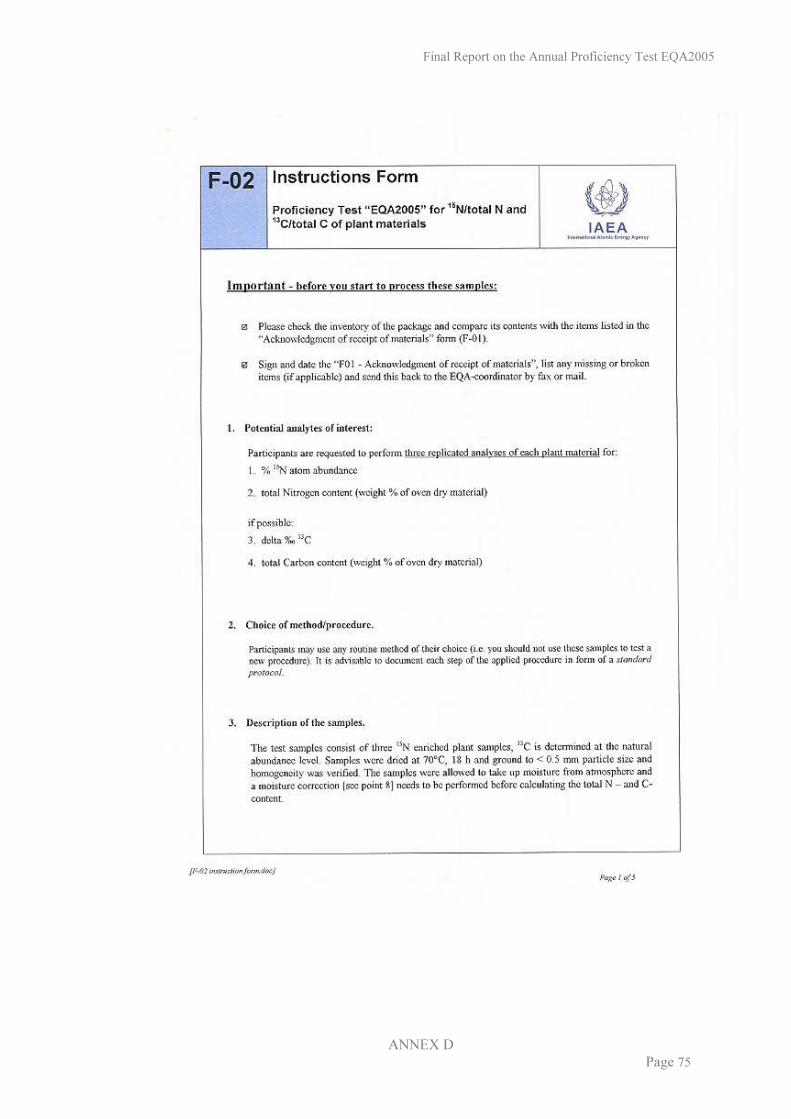
Final Report on the Annual Proficiency Test EQA2005
ANNEX D Page 75
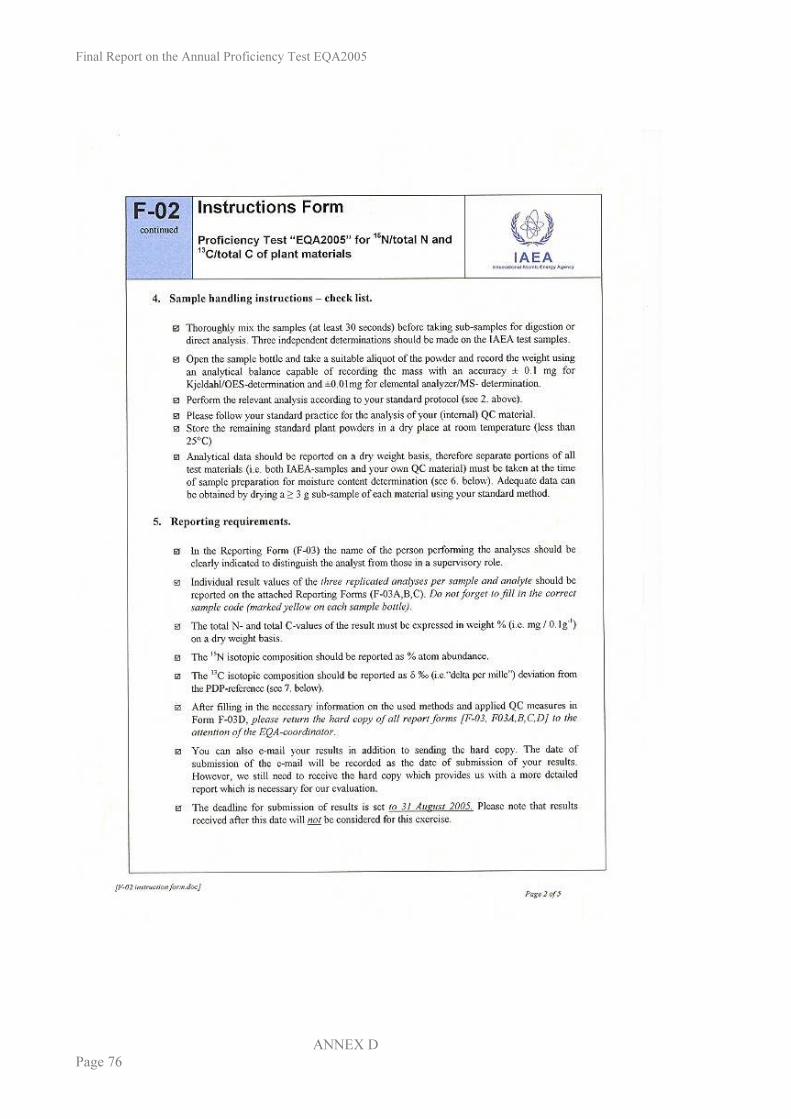
Final Report on the Annual Proficiency Test EQA2005
ANNEX D Page 76
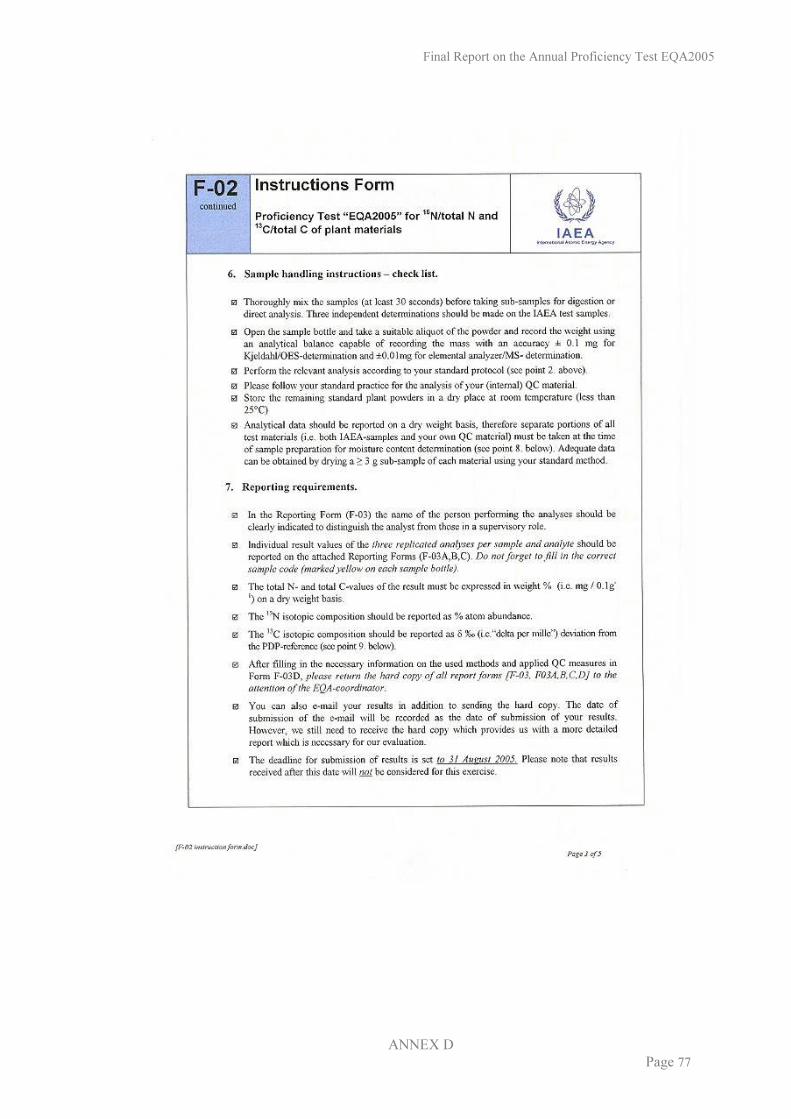
Final Report on the Annual Proficiency Test EQA2005
ANNEX D Page 77
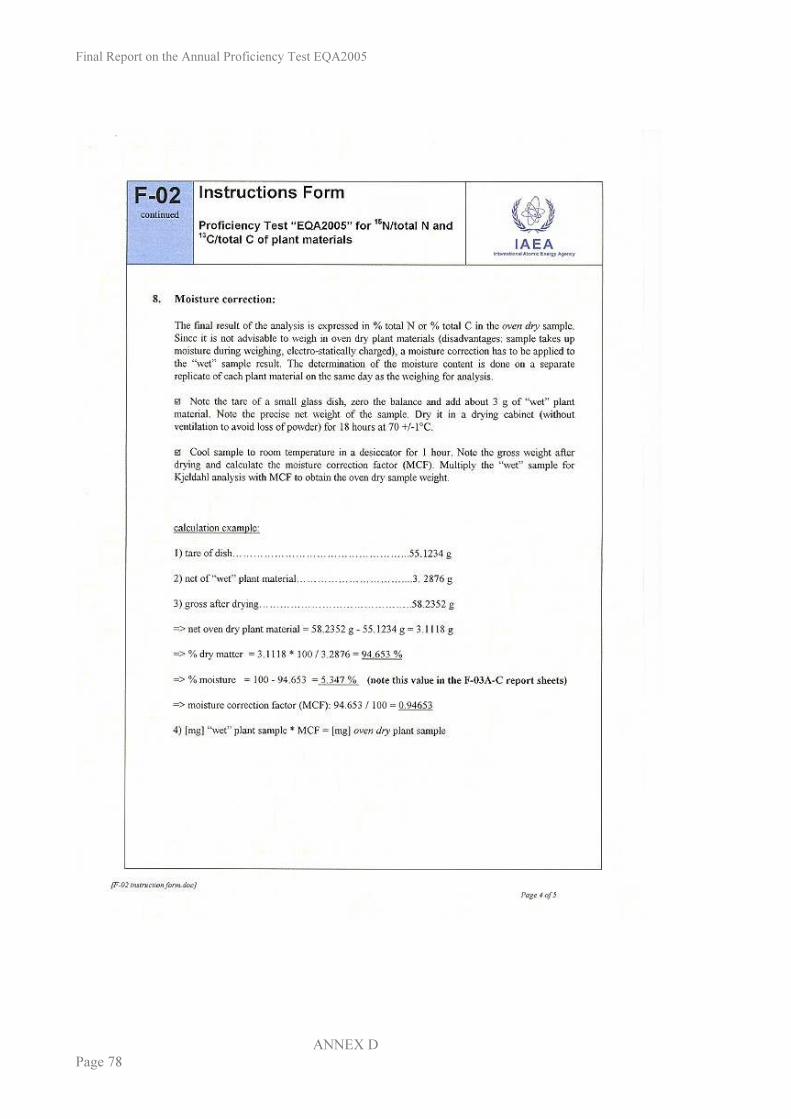
Final Report on the Annual Proficiency Test EQA2005
ANNEX D Page 78
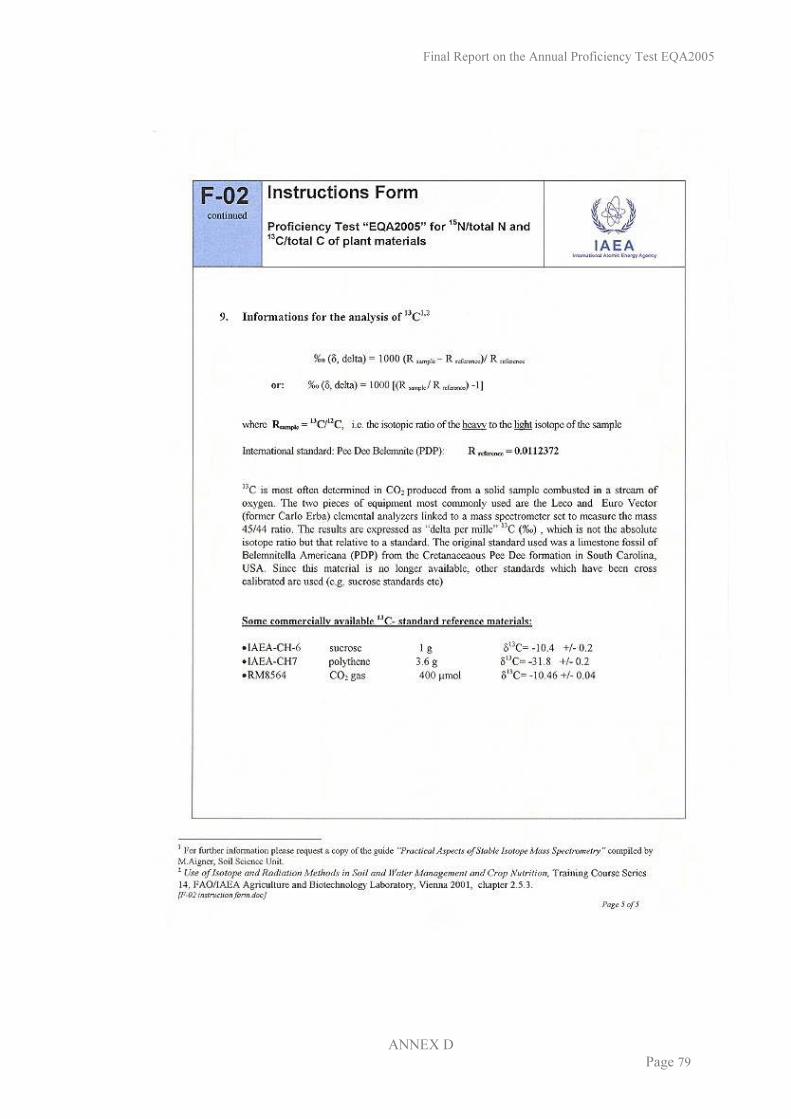
Final Report on the Annual Proficiency Test EQA2005
ANNEX D Page 79

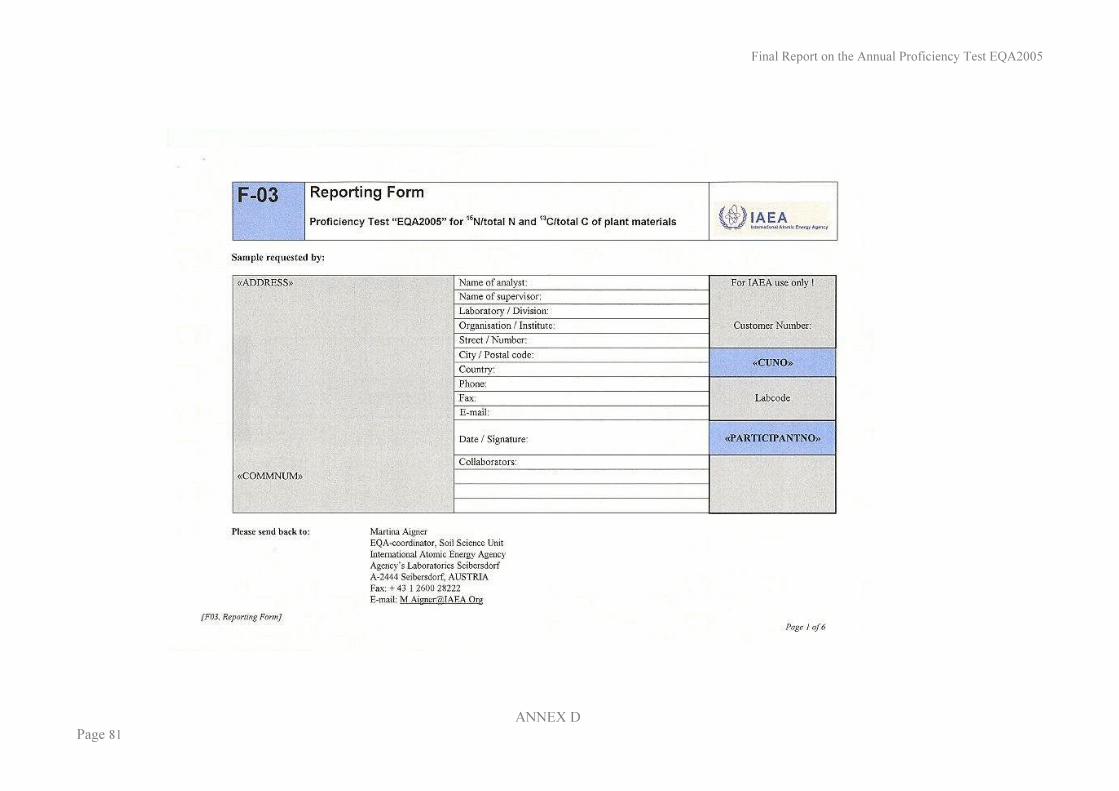
Final Report on the Annual Proficiency Test EQA2005
ANNEX D Page 81
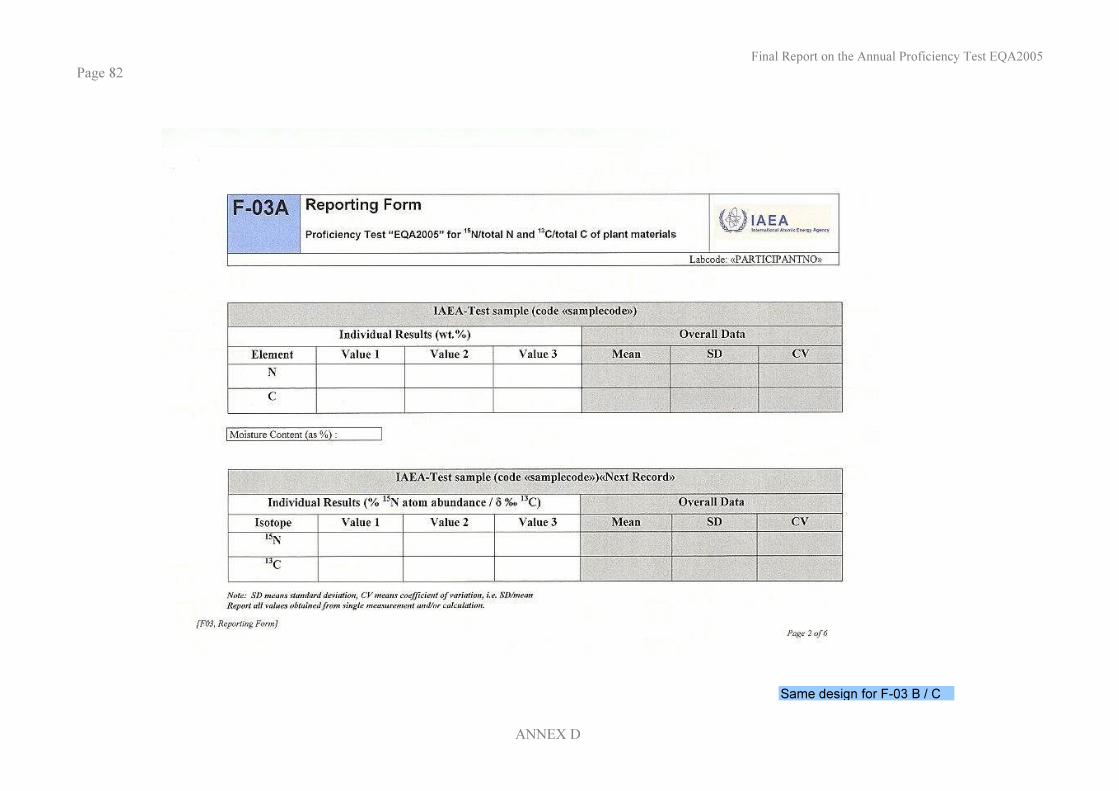
Final Report on the Annual Proficiency Test EQA2005 Page 82
ANNEX D
Same design for F-03 B / C
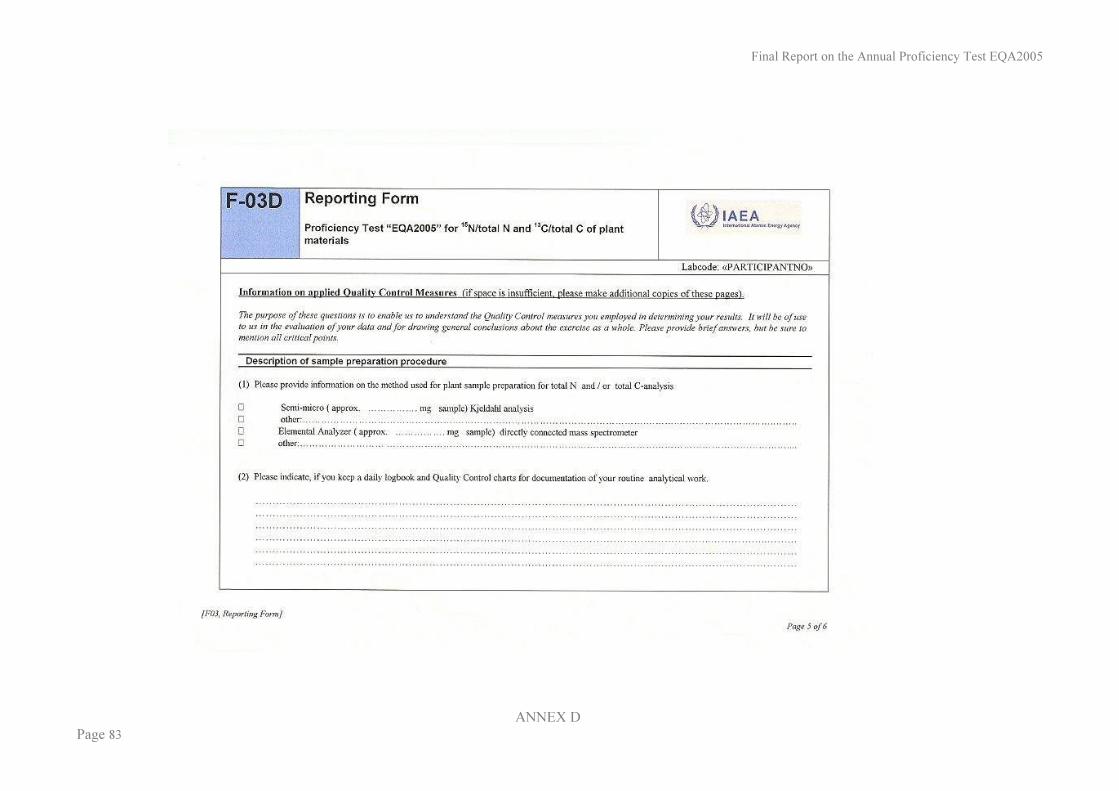
Final Report on the Annual Proficiency Test EQA2005
ANNEX D Page 83
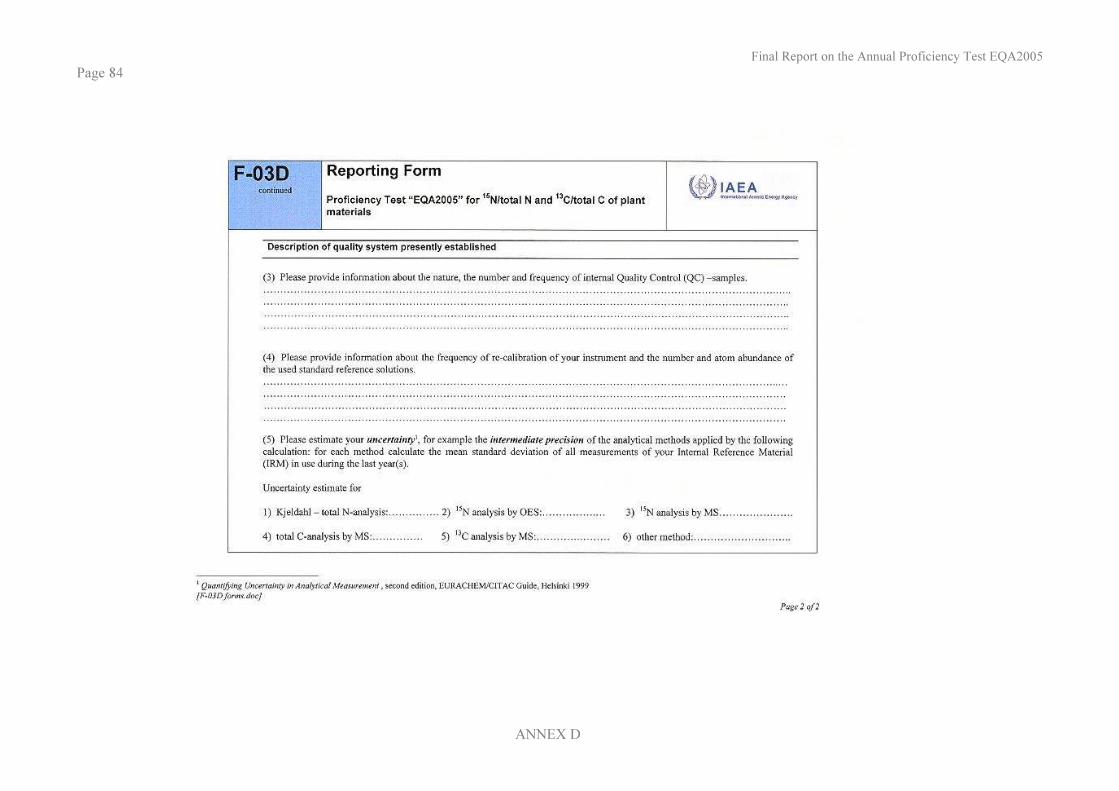
Final Report on the Annual Proficiency Test EQA2005 Page 84
ANNEX D
Final Report on the Annual Proficiency Test EQA2005
ANNEX D Page 85
Final Report on the Annual Proficiency Test EQA2005
ANNEX D Page 86
Final Report on the Annual Proficiency Test EQA2005
ANNEX D Page 87

Final Report on the Annual Proficiency Test EQA2005
ANNEX E Page 89
ANNEX E:
Participants in EQA2005, listed per region

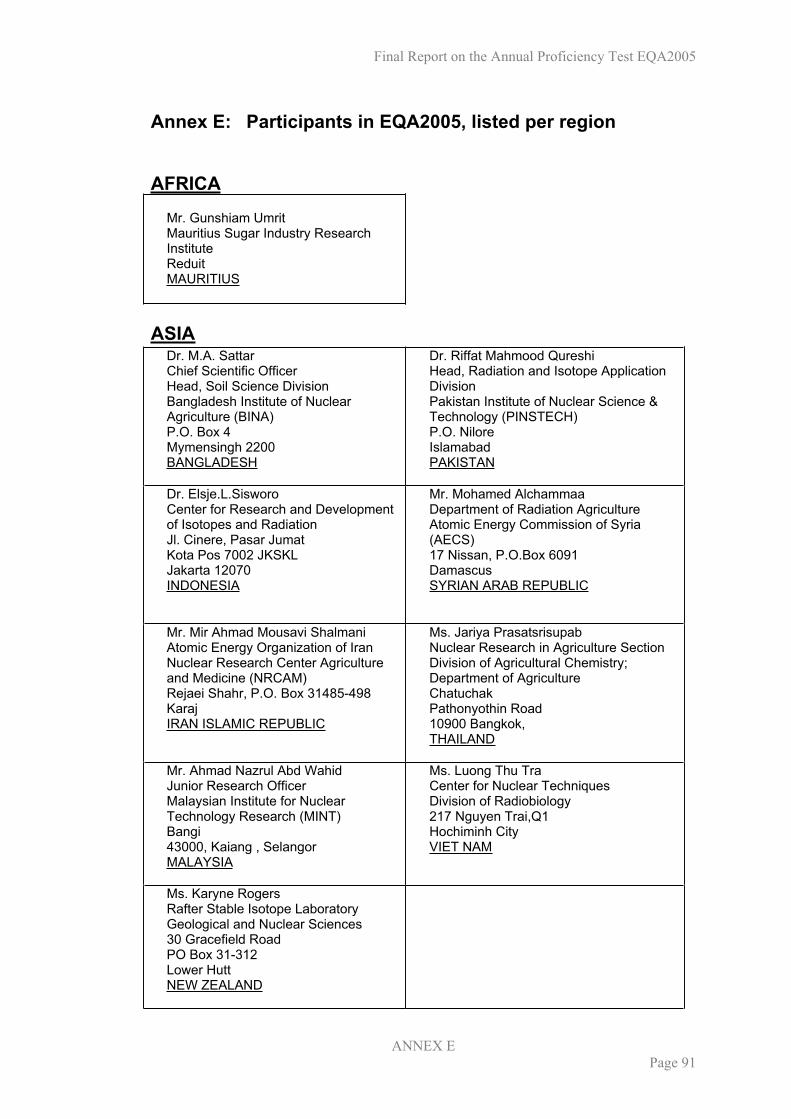
Final Report on the Annual Proficiency Test EQA2005
ANNEX E
Page 91
Annex E: Participants in EQA2005, listed per region
AFRICA
Mr. Gunshiam Umrit Mauritius Sugar Industry Research InstituteReduit MAURITIUS
ASIADr. M.A. Sattar Chief Scientific Officer Head, Soil Science Division Bangladesh Institute of Nuclear Agriculture (BINA) P.O. Box 4 Mymensingh 2200 BANGLADESH
Dr. Riffat Mahmood Qureshi Head, Radiation and Isotope Application Division Pakistan Institute of Nuclear Science & Technology (PINSTECH) P.O. Nilore Islamabad PAKISTAN
Dr. Elsje.L.Sisworo Center for Research and Development of Isotopes and Radiation Jl. Cinere, Pasar Jumat Kota Pos 7002 JKSKL Jakarta 12070 INDONESIA
Mr. Mohamed Alchammaa Department of Radiation Agriculture Atomic Energy Commission of Syria (AECS)17 Nissan, P.O.Box 6091 Damascus SYRIAN ARAB REPUBLIC
Mr. Mir Ahmad Mousavi Shalmani Atomic Energy Organization of Iran Nuclear Research Center Agriculture and Medicine (NRCAM) Rejaei Shahr, P.O. Box 31485-498 KarajIRAN ISLAMIC REPUBLIC
Ms. Jariya Prasatsrisupab Nuclear Research in Agriculture Section Division of Agricultural Chemistry; Department of Agriculture Chatuchak Pathonyothin Road 10900 Bangkok, THAILAND
Mr. Ahmad Nazrul Abd Wahid Junior Research Officer Malaysian Institute for Nuclear Technology Research (MINT) Bangi43000, Kaiang , Selangor MALAYSIA
Ms. Luong Thu Tra Center for Nuclear Techniques Division of Radiobiology 217 Nguyen Trai,Q1 Hochiminh City VIET NAM
Ms. Karyne Rogers Rafter Stable Isotope Laboratory Geological and Nuclear Sciences 30 Gracefield Road PO Box 31-312 Lower Hutt NEW ZEALAND
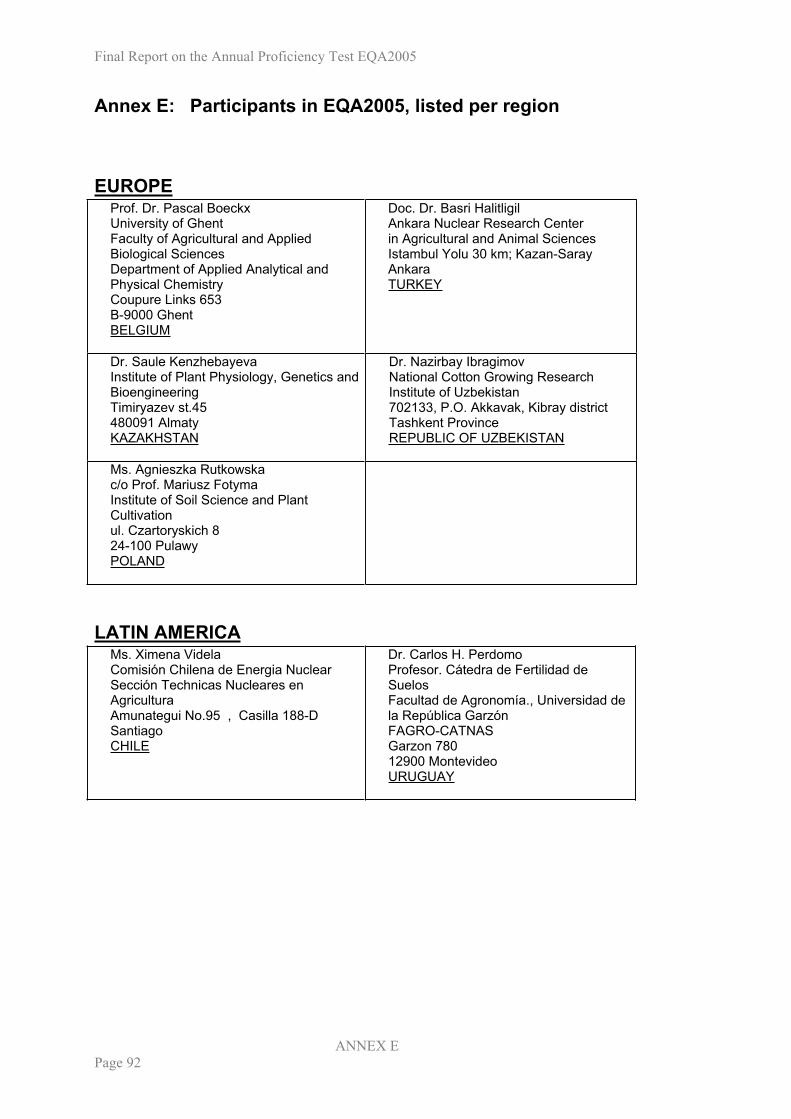
Final Report on the Annual Proficiency Test EQA2005
ANNEX E
Page 92
Annex E: Participants in EQA2005, listed per region
EUROPEProf. Dr. Pascal Boeckx University of Ghent Faculty of Agricultural and Applied Biological Sciences Department of Applied Analytical and Physical Chemistry Coupure Links 653 B-9000 Ghent BELGIUM
Doc. Dr. Basri Halitligil Ankara Nuclear Research Center in Agricultural and Animal Sciences Istambul Yolu 30 km; Kazan-Saray Ankara TURKEY
Dr. Saule Kenzhebayeva Institute of Plant Physiology, Genetics and Bioengineering Timiryazev st.45 480091 Almaty KAZAKHSTAN
Dr. Nazirbay Ibragimov National Cotton Growing Research Institute of Uzbekistan 702133, P.O. Akkavak, Kibray district Tashkent Province REPUBLIC OF UZBEKISTAN
Ms. Agnieszka Rutkowska c/o Prof. Mariusz Fotyma Institute of Soil Science and Plant Cultivationul. Czartoryskich 8 24-100 Pulawy POLAND
LATIN AMERICAMs. Ximena Videla Comisión Chilena de Energia Nuclear Sección Technicas Nucleares en AgriculturaAmunategui No.95 , Casilla 188-D SantiagoCHILE
Dr. Carlos H. Perdomo Profesor. Cátedra de Fertilidad de SuelosFacultad de Agronomía., Universidad de la República Garzón FAGRO-CATNASGarzon 780 12900 Montevideo URUGUAY
Final Report on the Annual Proficiency Test EQA2005
ANNEX F Page 93
ANNEX F:
Standard Operating Procedure (SOP)
Modified1 Semimicro – Kjeldahl Analysis of plant materials for total N- analysis
and sample preparation for 15N analysis by OES
1 modified by Soil Science Unit , FAO/IAEA Laboratories, Seibersdorf, Austria

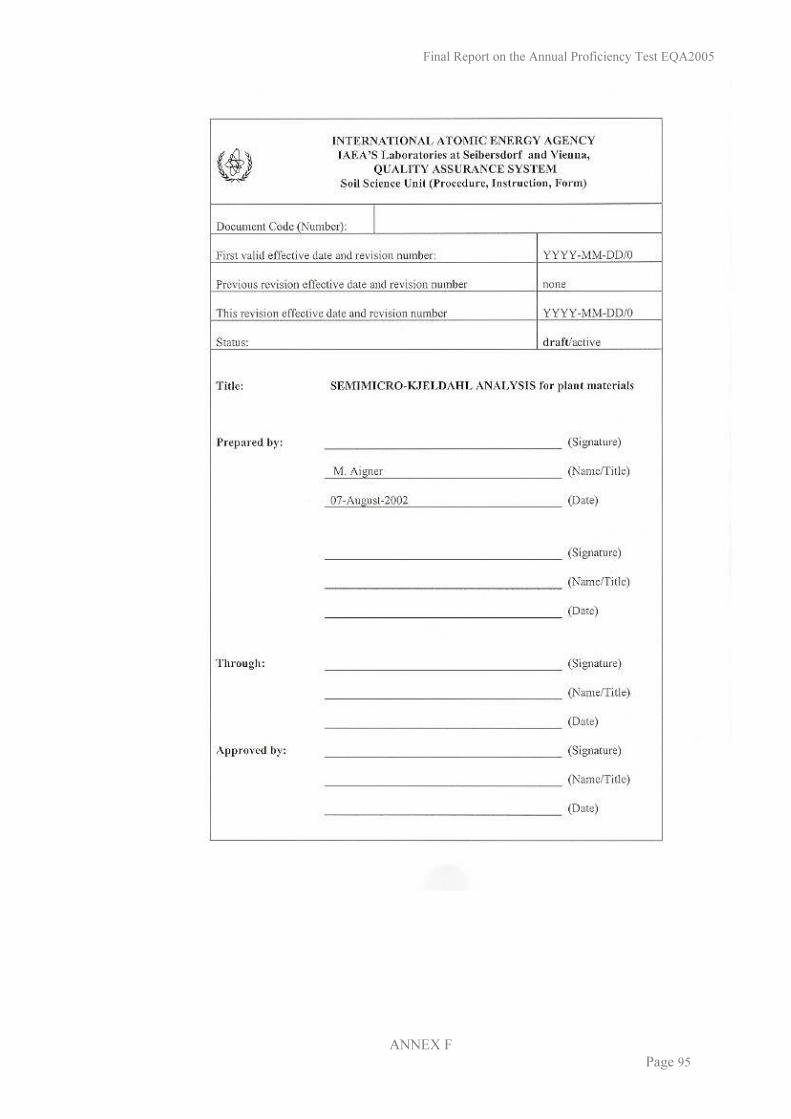
Final Report on the Annual Proficiency Test EQA2005
ANNEX F Page 95
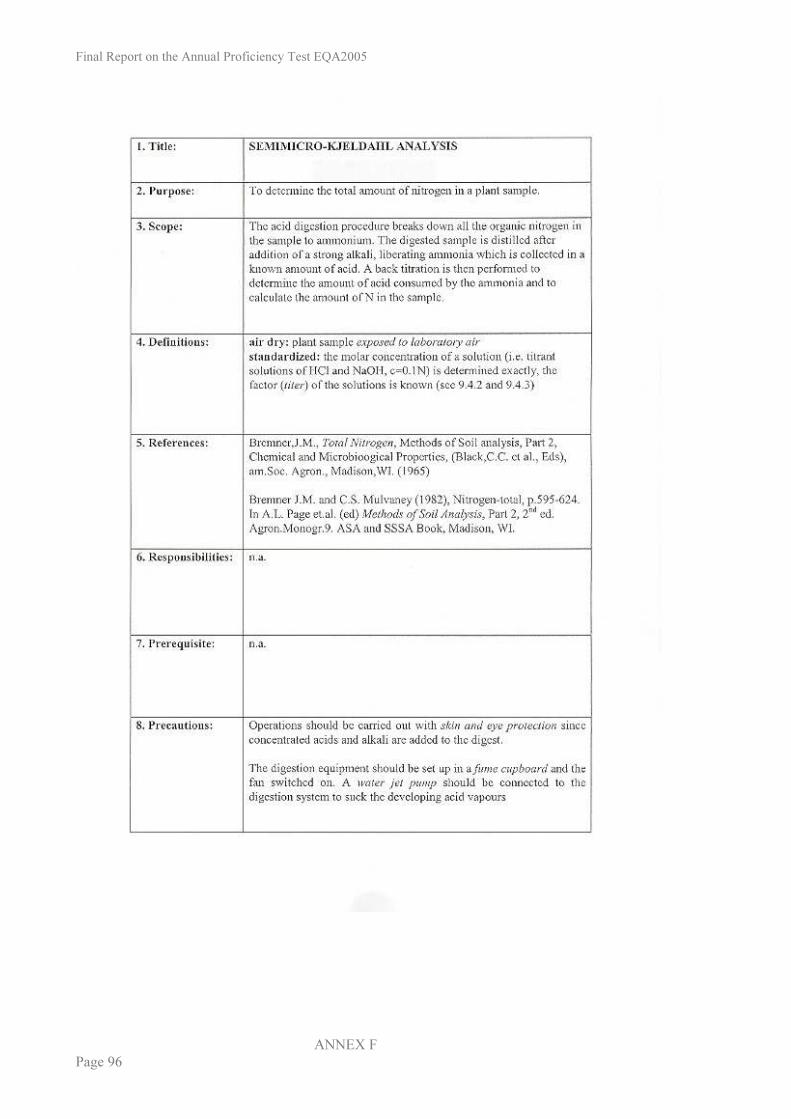
Final Report on the Annual Proficiency Test EQA2005
ANNEX F Page 96
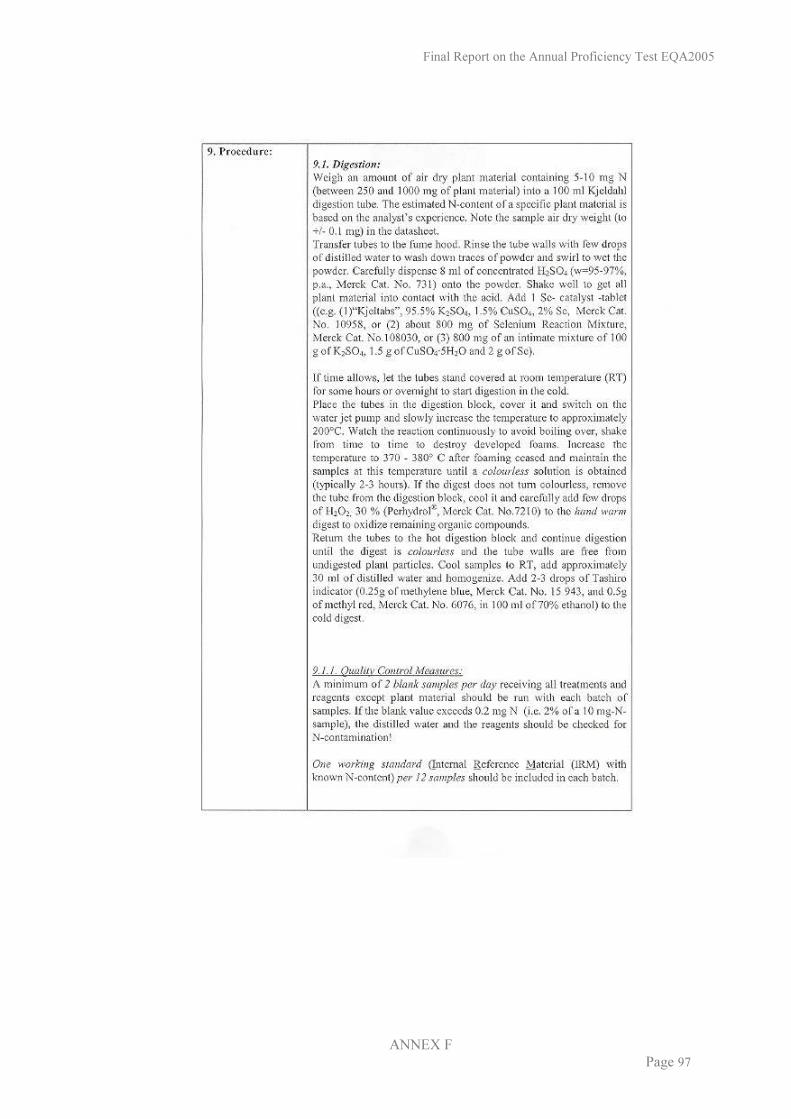
Final Report on the Annual Proficiency Test EQA2005
ANNEX F Page 97
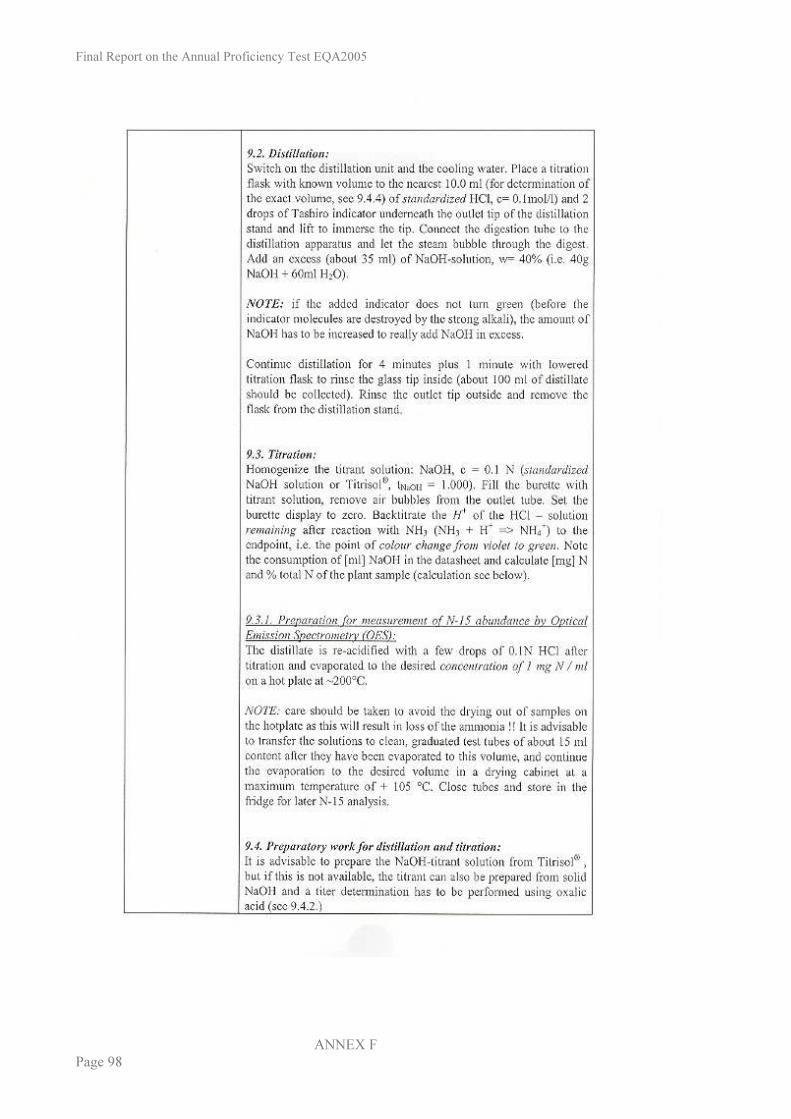
Final Report on the Annual Proficiency Test EQA2005
ANNEX F Page 98
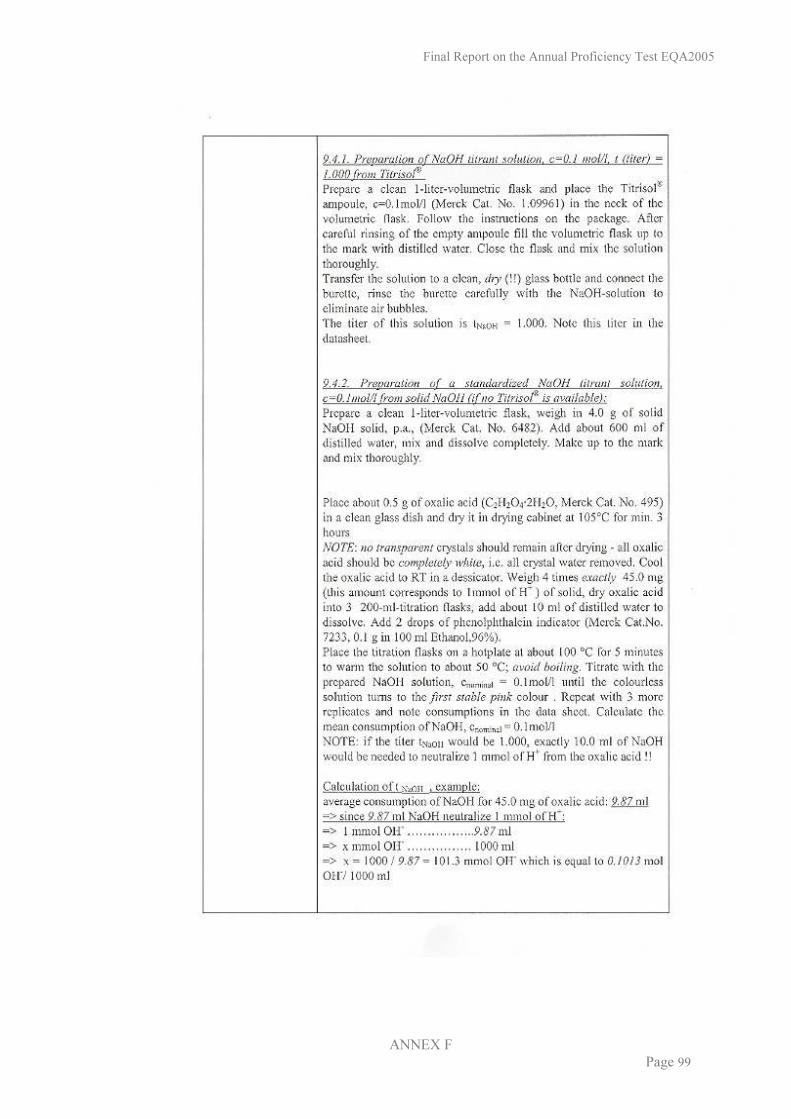
Final Report on the Annual Proficiency Test EQA2005
ANNEX F Page 99
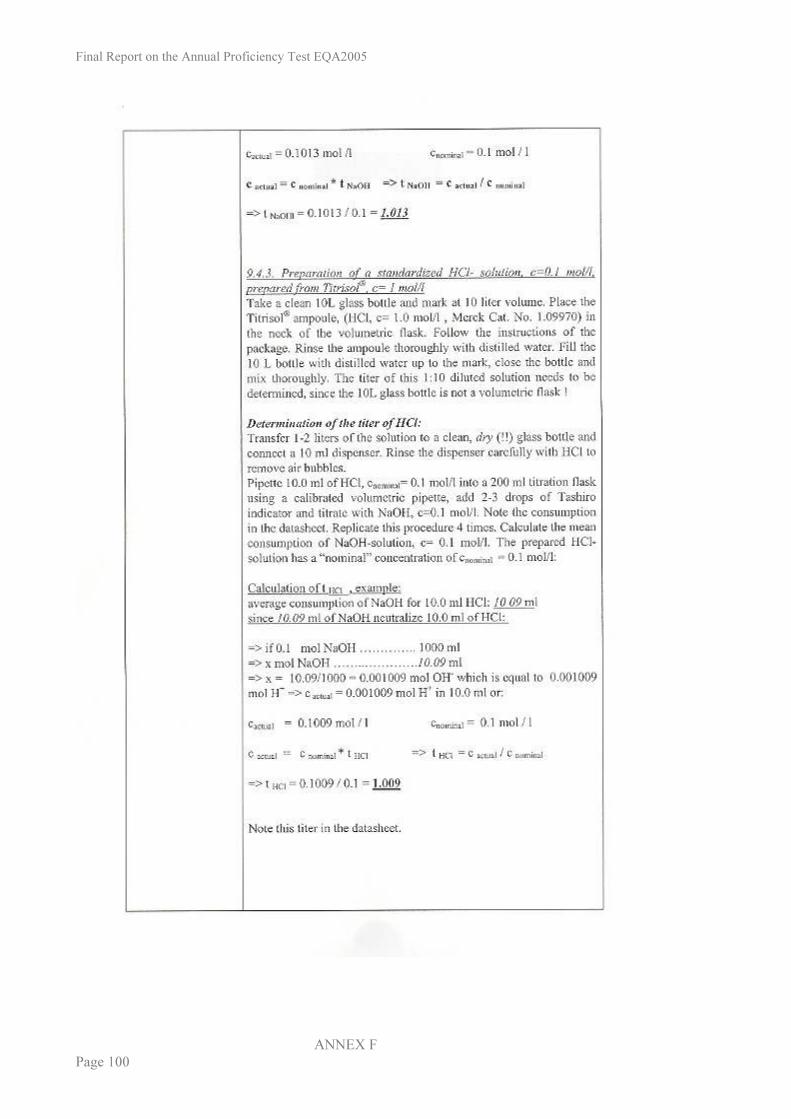
Final Report on the Annual Proficiency Test EQA2005
ANNEX F Page 100
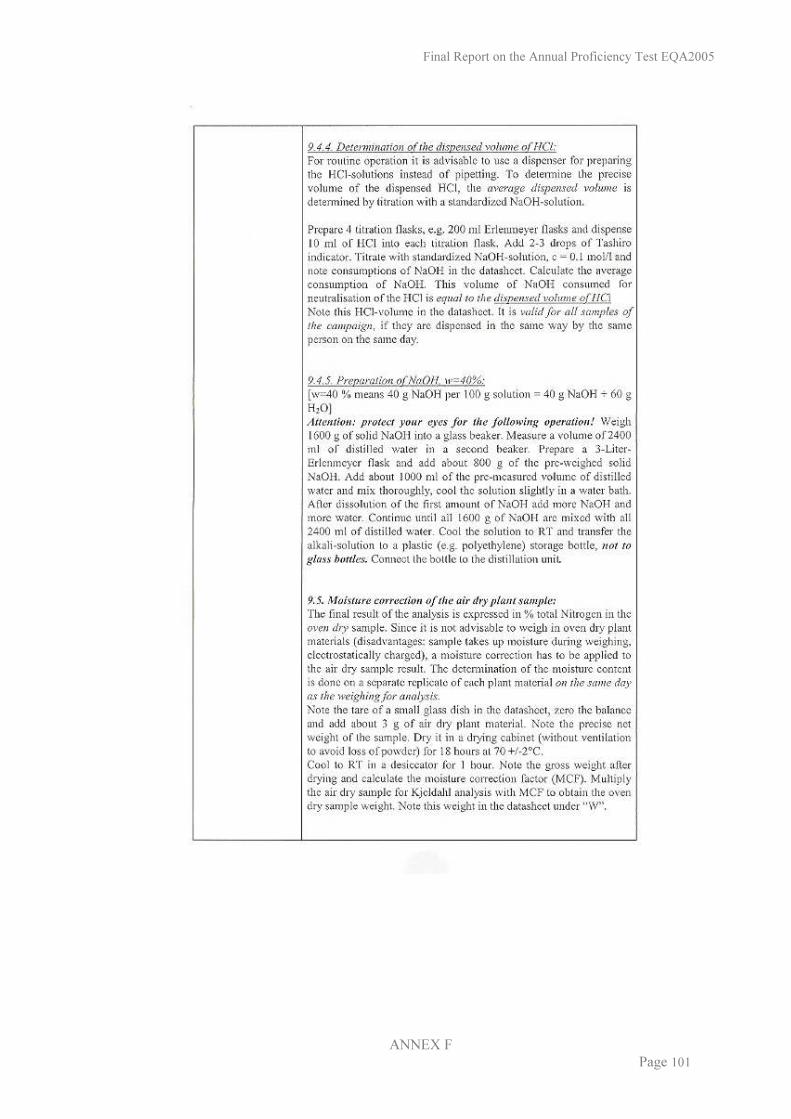
Final Report on the Annual Proficiency Test EQA2005
ANNEX F Page 101
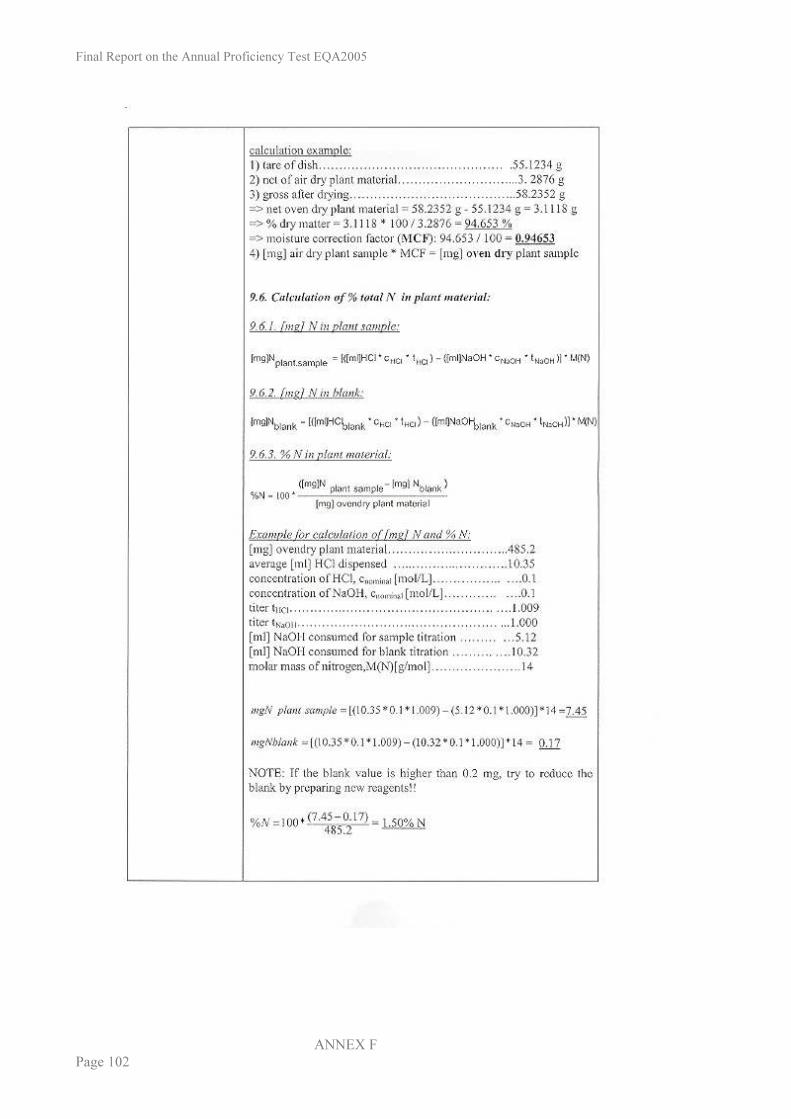
Final Report on the Annual Proficiency Test EQA2005
ANNEX F Page 102
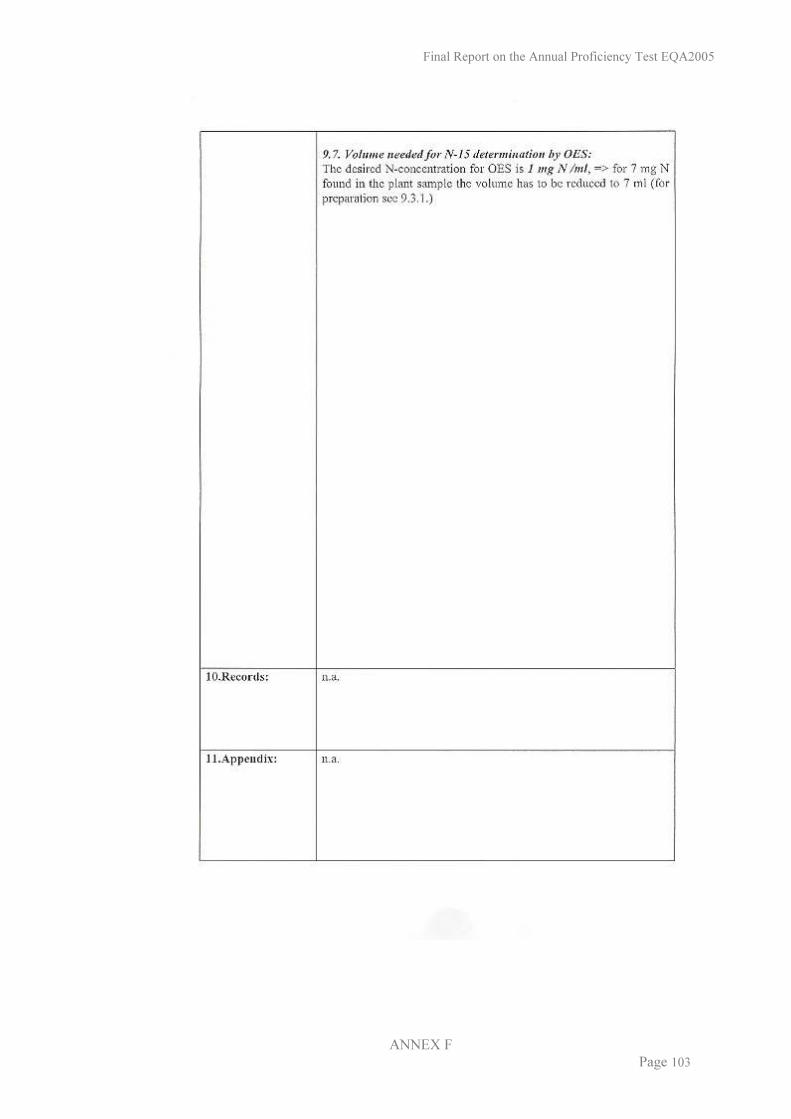
Final Report on the Annual Proficiency Test EQA2005
ANNEX F Page 103

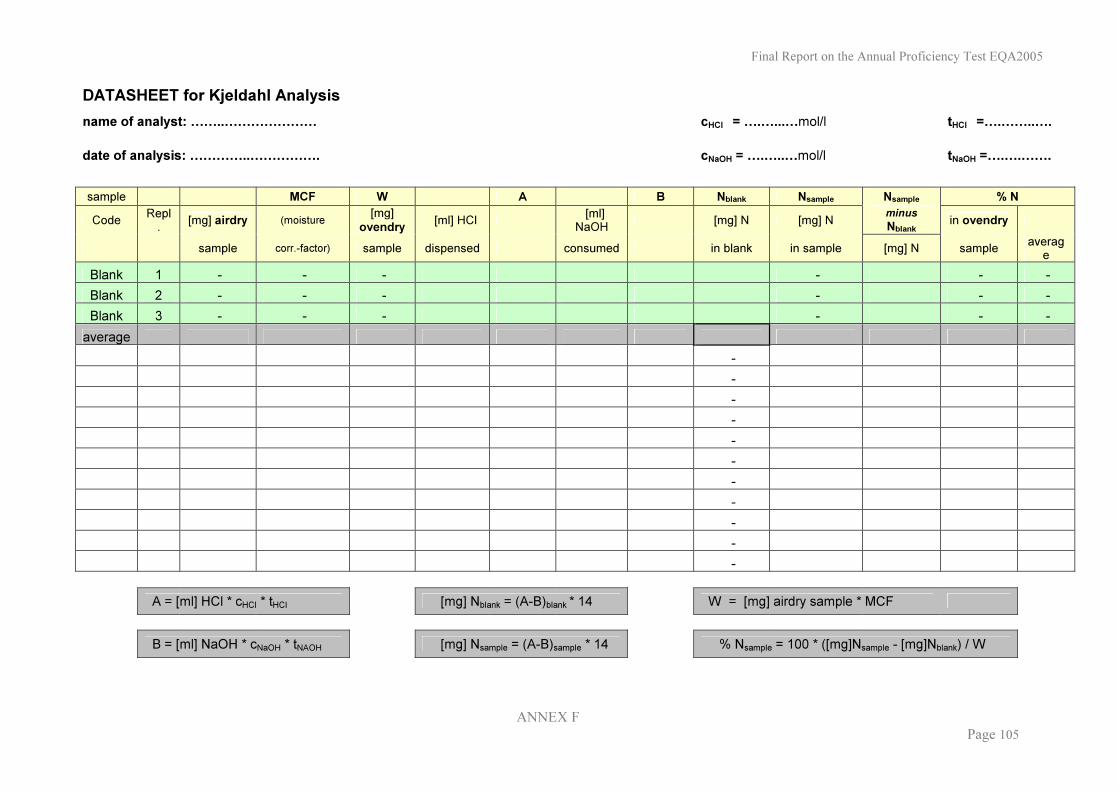
Final Report on the Annual Proficiency Test EQA2005
ANNEX F Page 105
DATASHEET for Kjeldahl Analysis name of analyst: ……..………………… cHCl = ….…...…mol/l tHCl =….……..….
date of analysis: …………..……………. cNaOH = ….…..…mol/l tNaOH =….….……. sample MCF W A B Nblank Nsample Nsample % N Code Repl
. [mg] airdry (moisture [mg] ovendry [ml] HCl [ml]
NaOH [mg] N [mg] N minus Nblank in ovendry
sample corr.-factor) sample dispensed consumed in blank in sample [mg] N sample average
Blank 1 - - - - - - Blank 2 - - - - - - Blank 3 - - - - - -
average - - - - - - - - - - -
A = [ml] HCl * cHCl * tHCl [mg] Nblank = (A-B)blank * 14 W = [mg] airdry sample * MCF B = [ml] NaOH * cNaOH * tNAOH [mg] Nsample = (A-B)sample * 14 % Nsample = 100 * ([mg]Nsample - [mg]Nblank) / W