Embed Size (px)
Citation preview
Final report, On-going Key Comparison BIPM.QM-K1, Ozone at ambient level, comparison with NIST, 2007
1* 1Joële Viallon , Philippe Moussay , Robert Wielgosz1, James E. Norris 2, Frank Guenther2
1 BIPM (Bureau International des Poids et Mesures), Pavillon de Breteuil, F-92312 Sèvres, France
NIST (National Institute of Standards and Technology), 100 Bureau Stop 8383, Gaithersburg, MD 20899, United States
2
Abstract
As part of the on-going key comparison BIPM.QM-K1, a comparison has been performed between the ozone national standard of the National Institute of Standards and Technology (NIST) and the common reference standard of the key comparison, maintained by the Bureau International des Poids et Mesures (BIPM). The instruments have been compared over a nominal ozone mole fraction range of 0 nmol/mol to 500 nmol/mol.
Contents:
FINAL REPORT, ON-GOING KEY COMPARISON BIPM.QM-K1, OZONE AT AMBIENT LEVEL, COMPARISON WITH NIST, 2007 .................................................................................................................... 1
1. FIELD .............................................................................................................................................................. 2 2. SUBJECT .......................................................................................................................................................... 2 3. PARTICIPANTS ................................................................................................................................................. 2 4. ORGANIZING BODY.......................................................................................................................................... 2 5. RATIONALE ..................................................................................................................................................... 2 6. TERMS AND DEFINITIONS................................................................................................................................. 2 7. MEASUREMENTS SCHEDULE............................................................................................................................ 2 8. MEASUREMENT PROTOCOL ............................................................................................................................. 3 9. REPORTING MEASUREMENT RESULTS .............................................................................................................. 5 10. POST COMPARISON CALCULATION................................................................................................................. 5 11. DEVIATIONS FROM THE COMPARISON PROTOCOL .......................................................................................... 5 12. MEASUREMENT STANDARDS ......................................................................................................................... 5 13. MEASUREMENT RESULTS AND UNCERTAINTIES ............................................................................................. 9 14. ANALYSIS OF THE MEASUREMENT RESULTS BY GENERALISED LEAST-SQUARE REGRESSION ......................... 9 15. DEGREES OF EQUIVALENCE ......................................................................................................................... 10 16. STABILITY OF THE TRANSFER STANDARD .................................................................................................... 12 17. HISTORY OF COMPARISONS BETWEEN BIPM SRP27, SRP28 AND NIST SRP2 ........................................... 12 18. SUMMARY OF PREVIOUS COMPARISONS INCLUDED IN BIPM.QM-K1 ......................................................... 13 19. CONCLUSION............................................................................................................................................... 14 20. REFERENCES ............................................................................................................................................... 14
APPENDIX 1 - FORM BIPM.QM-K1-R2-NIST-07........................................................................................ 15
* Author for correspondence. E-mail [email protected], Tel: +33 1 45 07 62 70, Fax: +33 1 45 07 20 21.
BIPM.QM-K1_NIST_0701_final_080915.doc 15-Sep-08 Page 1 of 15
1. Field Amount of substance.
2. Subject Comparison of ozone (at ambient level) reference measurement standards.
3. Participants
BIPM.QM-K1 is an on-going key comparison, which is structured as an on-going series of bilateral comparisons. The results of the comparison with the National Institute of Standards and Technology (NIST) are reported here. The NIST was the first laboratory to participate in BIPM.QM-K1.
4. Organizing body
BIPM.
5. Rationale
The on-going key comparison BIPM.QM-K1 follows the pilot study CCQM-P28 which included 23 participants and was preformed between July 2003 and February 2005 [1]. It is aimed at evaluating the degree of equivalence of ozone photometers that are maintained as national standards, or as primary standards within international networks for ambient ozone measurements. The reference value is determined using the NIST Standard Reference Photometer (BIPM-SRP27) maintained by the BIPM as a common reference.
6. Terms and definitions - xnom: nominal ozone mole fraction in dry air furnished by the ozone generator
- x : ith measurement of the nominal value xA,i nom by the photometer A.
: the mean of N measurements of the nominal value x- Ax nom measured by the
photometer A : ∑=
=N
iix
Nx
1,AA
1
- sA : standard deviation of N measurements of the nominal value xnom measured by the
photometer A : ∑=
−−
=N
ii xx
Ns
1
2A,A
2A )(
11
- The result of the linear regression fit performed between two sets of data measured by the photometers A and B during a comparison is written: . With this notation, the photometer A is compared versus the photometer B. a
BA,BBA,A bxax +=
A,B is dimensionless and b is expressed in units of nmol/mol. A,B
7. Measurements schedule
The key comparison BIPM.QM-K1 is organised in rounds of 2 years. The 2007-2008 round started in January 2007 with a comparison with the NIST. Measurements reported in this
BIPM.QM-K1_NIST_0701_final_080915.doc 15-Sep-08 Page 2 of 15
threport were performed from the 9 of January to the 23th of February 2007 at the NIST and the BIPM.
8. Measurement protocol
The comparison protocol is summarised in this section. The complete version can be downloaded from the BIPM website (http://www.bipm.org/utils/en/pdf/BIPM.QM-K1_protocol.pdf).
This comparison was performed following protocol B, corresponding to a comparison between the NIST national standard SRP2 and the common reference standard BIPM-SRP27 maintained at the BIPM via the transfer standard SRP0. The national standard SRP2 and the transfer standard SRP0 were first compared at the NIST in January. Then SRP0 was compared with the common reference standard SRP27 at the BIPM two weeks later. Finally, the national standard SRP2 and the transfer standard SRP0 were again compared at the NIST in February to test the stability of the transfer standard.
A comparison between two (or more) ozone photometers consists of producing ozone-air mixtures at different mole fractions over the required range, and measuring these with the photometers.
8.1. Comparisons at the NIST
a). Ozone generation
The air is compressed with an oil-free compressor, dried and scrubbed with a commercial purification system so that the mole fraction of ozone and nitrogen oxides remaining in the air is below detectable limits. This air is used to provide reference air as well as the ozone-air mixture to each ozone photometer. Ozone is produced using an external commercial generator. A common dual external manifold in Pyrex is used to furnish the necessary flows of reference air and ozone-air mixtures to the ozone photometers. The two columns of this manifold are vented to atmospheric pressure.
b). Comparison procedure
Prior to the comparison, all the instruments were switched on and allowed to stabilise for a week. Characteristics of the instruments were checked at this time following an internal procedure. Adjustments were made to the SRP 2 and SRP 0 temperature and pressure values according to established NIST technical procedures.
One comparison run includes 10 different mole fractions distributed to cover the range, together with the measurement of reference air at the beginning and end of each run. The nominal mole fractions were measured in a sequence imposed by the protocol (0, 220, 80, 420, 120, 320, 30, 370, 170, 500, 270, and 0) nmol/mol. Each of these points is an average of 10 single measurements.
For each nominal value of the ozone mole fraction xnom furnished by the ozone generator, the standard deviation s on the set of 10 consecutive measurements x recorded by SRP2 SRP2,iSRP2 was calculated. The measurement results were considered as valid if s was less than 1 SRP2
BIPM.QM-K1_NIST_0701_final_080915.doc 15-Sep-08 Page 3 of 15
nmol/mol, which ensures that the photometers were measuring a stable ozone concentration. If not, another series of 10 consecutive measurements was performed.
c). Comparison repeatability
The comparison procedure was repeated continuously to evaluate its repeatability.
8.2. Comparisons at the BIPM
a). Ozone generation
The same source of purified air is used for all the ozone photometers being compared. This air is used to provide reference air as well as the ozone-air mixture to each ozone photometer. Ambient air is used as the source for reference air. The air is compressed with an oil-free compressor, dried and scrubbed with a commercial purification system so that the mole fraction of ozone and nitrogen oxides remaining in the air is below detectable limits. The relative humidity of the reference air is monitored and the mole fraction of water in air typically found to be less than 3 μmol/mol. The mole fraction of volatile organic hydrocarbons in the reference air was measured (November 2002), with no mole fraction of any detected component exceeding 1 nmol/mol.
A common dual external manifold in Pyrex is used to furnish the necessary flows of reference air and ozone-air mixtures to the ozone photometers. The two columns of this manifold are vented to atmospheric pressure.
b). Comparison procedure
Prior to the comparison, all the instruments were switched on and allowed to stabilise for at least 8 hours. The pressure and temperature measurement systems of the instruments were checked at this time. If any adjustments were required, these were noted. For this comparison, no adjustments were necessary.
One comparison run includes 10 different mole fractions distributed to cover the range, together with the measurement of reference air at the beginning and end of each run. The nominal mole fractions were measured in a sequence imposed by the protocol (0, 220, 80, 420, 120, 320, 30, 370, 170, 500, 270, and 0) nmol/mol. Each of these points is an average of 10 single measurements.
For each nominal value of the ozone mole fraction xnom furnished by the ozone generator, the standard deviation s on the set of 10 consecutive measurements xSRP27 SRP27,i recorded by BIPM-SRP27 was calculated. The measurement results were considered as valid if sSRP27 was less than 1 nmol/mol, which ensures that the photometers were measuring a stable ozone concentration. If not, another series of 10 consecutive measurements was performed.
c). Comparison repeatability
The comparison procedure was repeated continuously to evaluate its repeatability. The participant and the BIPM commonly decided when both instruments were stable enough to start recording a set of measurement results to be considered as the official comparison results.
BIPM.QM-K1_NIST_0701_final_080915.doc 15-Sep-08 Page 4 of 15
d). SRP27 stability check
A second ozone reference standard, BIPM-SRP28, was included in the comparison to verify its agreement with BIPM-SRP27 and thus follow its stability over the period of the on-going key comparison.
9. Reporting measurement results
The participant and the BIPM staff reported the measurement results in the result form BIPM.QM-K1-R2 provided by the BIPM and available on the BIPM website. It includes details on the comparison conditions, measurement results and associated uncertainties, as well as the standard deviation for each series of 10 ozone mole fractions measured by the participant standard and the common reference standard. The completed form BIPM.QM-K1-R2-NIST-07 is given in the annex.
10. Post comparison calculation
All calculations were performed by the BIPM using the form BIPM.QM-K1-R2. It includes the two degrees of equivalence that are reported as comparison results in the Appendix B of the BIPM KCDB (key comparison database). For information, the degrees of equivalence at all nominal ozone mole fractions are reported in the same form, as well as the linear relationship between the participant standard and the common reference standard.
11. Deviations from the comparison protocol
In this comparison, there was no deviation from the protocol.
12. Measurement standards
All instruments included in this comparison were Standard Reference Photometers built by the NIST. More details on the instrument's principle and its capabilities can be found in [2]. The following section describes their measurement principle and their uncertainty budgets.
12.1. Measurement equation of a NIST SRP
The measurement of ozone mole fraction by an SRP is based on the absorption of radiation at 253.7 nm by ozonized air in the gas cells of the instrument. One particularity of the instrument design is the use of two gas cells to overcome the instability of the light source. The measurement equation is derived from the Beer-Lambert and ideal gas laws. The concentration (C) of ozone is calculated from:
std
opt std
1 ln( )2
PTCL T Pα
−= D (1)
where α is the absorption cross-section of ozone at 253.7nm in standard conditions of
temperature and pressure. The value used is: 1.1476×10⁻¹⁷ cm2/molecule [3]. Lopt is the optical path length of one of the cells, T is the measured temperature of the cells,
BIPM.QM-K1_NIST_0701_final_080915.doc 15-Sep-08 Page 5 of 15
T is the standard temperature (273.15 K), std P is the measured pressure of the cells, P is the standard pressure (101.325 kPa), stdD is the product of transmittances of two cells, with the transmittance (T) of one cell
defined as
air
ozone
II
T = (2)
where Iozone is the UV radiation intensity measured from cell when containing ozonized air, and I is the UV radiation intensity measured from cell when containing pure air (also
called reference or zero air). air
Using the ideal gas law equation (1) can be recast in order to express the measurement results as a mole fraction (x) of ozone in air:
opt
1 ln( )2 A
T Rx DL P Nσ
−= (3)
where NA is the Avogadro constant, 6.022142 × 10²³ -1 mol , and R is the gas constant, 8.314472 J mol-1 K-1.
12.2. Absorption cross section for ozone
The absorption cross section used within the SRP software algorithm is 308.32 atm-1cm-1. This corresponds to a value of 1.1476×10⁻¹⁷ cm2/molecule, rather than the more often quoted 1.147×10⁻¹⁷ cm2/molecule. In the comparison of two SRP instruments, the absorption cross section can be considered to have a conventional value and its uncertainty can be set to zero. However, in the comparison of different methods or when considering the complete uncertainty budget of the method the uncertainty of the absorption cross section should be taken into account. A consensus value of 2.12% at a 95% level of confidence for the uncertainty of the absorption cross section has been proposed by the BIPM and the NIST in a recent publication [4].
Actual state of the BIPM SRPs12.3.
Compared to the original design described in [2], SRP27 and SRP28 have been modified to deal with two biases revealed by the study conducted by the BIPM and the NIST [4]:
- The SRPs are equipped with a thermo-electric cooling device to remove excess heat from the lamp housing and prevent heating of the cells. Together with a regular calibration of their temperature probe, this ensures the removal of the bias on the gas cell temperature measurement.
- In SRP27 and SRP28 the optical path length is now calculated as being 1.005 times the length of the two cells within each instrument respectively. Together with an increased uncertainty this ensures that the bias on the optical path length is taken into account.
BIPM.QM-K1_NIST_0701_final_080915.doc 15-Sep-08 Page 6 of 15
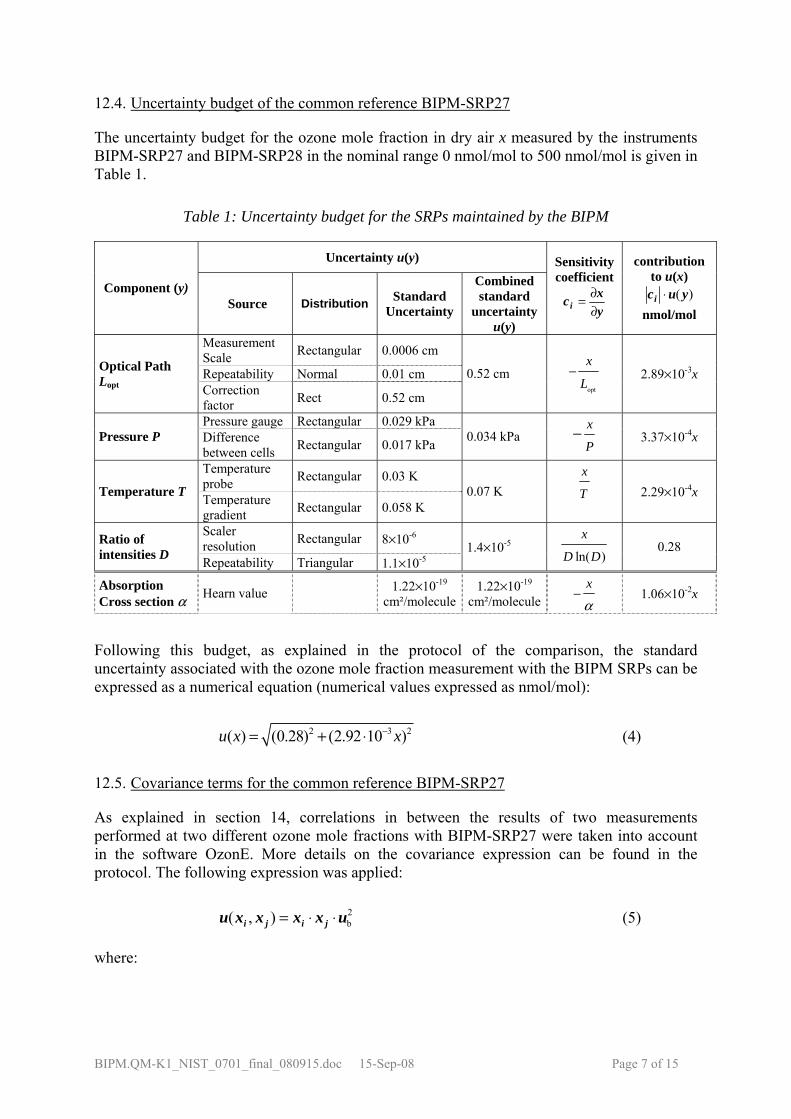
12.4. Uncertainty budget of the common reference BIPM-SRP27
The uncertainty budget for the ozone mole fraction in dry air x measured by the instruments BIPM-SRP27 and BIPM-SRP28 in the nominal range 0 nmol/mol to 500 nmol/mol is given in Table 1.
Table 1: Uncertainty budget for the SRPs maintained by the BIPM
Uncertainty u(y) contribution to u(x)
Sensitivity coefficient Combined
standard uncertainty
u(y)
Component (y)
yxci ∂
∂= )( yuci ⋅ nmol/mol
Standard Source Distribution Uncertainty
Measurement Scale Rectangular 0.0006 cm
Repeatability Normal 0.01 cm opt
x
L−Optical Path
L
opt Correction factor Rect 0.52 cm
0.52 cm 2.89×10⁻³x
Pressure gauge Rectangular 0.029 kPa − x
P Pressure P Difference
between cells Rectangular 0.017 kPa 0.034 kPa 3.37×10⁻⁴x
Temperature probe Rectangular 0.03 K x
T
Temperature T Temperature gradient Rectangular 0.058 K
0.07 K 2.29×10⁻⁴x
Scaler resolution Rectangular 8×10⁻⁶
ln( )
x
D DRatio of intensities D
-5 0.28 1.4×10Repeatability Triangular 1.1×10⁻⁵
x
α−Absorption
Cross section α Hearn value 1.22×10⁻¹⁹ 1.22×10⁻¹⁹ cm²/molecule
cm²/molecule 1.06×10⁻²x
Following this budget, as explained in the protocol of the comparison, the standard uncertainty associated with the ozone mole fraction measurement with the BIPM SRPs can be expressed as a numerical equation (numerical values expressed as nmol/mol):
2( ) (0.28) (2.92 10 )u x x−= + ⋅ 3 2 (4)
12.5. Covariance terms for the common reference BIPM-SRP27
As explained in section 14, correlations in between the results of two measurements performed at two different ozone mole fractions with BIPM-SRP27 were taken into account in the software OzonE. More details on the covariance expression can be found in the protocol. The following expression was applied:
2b( , ) = ⋅ ⋅i j i ju x x x x u (5)
where:
BIPM.QM-K1_NIST_0701_final_080915.doc 15-Sep-08 Page 7 of 15
22 2opt2
b 22 2opt
( )( ) ( )= + +u Lu T u Pu
T P L (6)
The value of ub is given by the expression of the measurement uncertainty: u = 2.92×10⁻³b or
u 2 = 8.5×10⁻⁶. b
12.6. Actual state of the NIST SRP2
Compared to the original design, the NIST SRP2 has been modified to deal with the two biases revealed in [4]. In 2006, an “SRP upgrade kit” was installed by NIST. It consists in two parts:
- A new source block was designed to minimise the gas temperature evaluation bias by better thermally insulating the UV source lamp (heated at a temperature of about 60°C) from the rest of the optical bench, thus avoiding the temperature gradient observed in the SRP when the original source block is used.
- A new set of absorption cells were installed. The new cells are quartz tubes closed at both ends by optically sealed quartz windows. These windows are tilted by 3° with respect to the vertical plane to avoid multiple reflections along the light path. However, to take into account a residual bias due to the beam divergence, the uncertainty is increased by the same amount as in SRP27 and SRP28.
12.7. Uncertainty budget of the NIST SRP2
The uncertainty budget for the ozone mole fraction in dry air x measured by the NIST standard SRP2 in the nominal range 0 nmol/mol to 500 nmol/mol will follow the BIPM/NIST paper [4] (see Table 1) with an additional component based on the temperature probe heating effect. The initial uncertainty can be summarised by the formula:
2( ) (0.28) (1.1 10 )u x x−= + × 2 2 (7)
After correcting for the temperature probe heating bias, the final uncertainty is calculated by:
(8) ( ) ( )( ) 0.001 ( )
u x u xu x u x
+
−
== −
Because the BIPM.QM-K1-R2 spreadsheet does not allow the uncertainty to be expressed by different positive and negative amounts, it has been expressed as:
(9) ( ) 0.001 ( )u x u x= −
No covariance term for the NIST SRP2 was included in the calculations.
12.8. Transfer standard SRP0
SRP0 uncertainty budget is the same as SRP2.
BIPM.QM-K1_NIST_0701_final_080915.doc 15-Sep-08 Page 8 of 15
13. Measurement results and uncertainties
Details of the measurement results, the measurement uncertainties and the standard deviations at each nominal ozone mole fraction can be found in the form BIPM.QM-K1-R2-NIST-07 given in appendix.
14. Analysis of the measurement results by generalised least-square regression
The relationship between the national and reference standards was first evaluated with a generalised least-square regression fit. To this end, the software OzonE was used. This software, which is documented in a publication [5], is an extension of the previously used software B_Least recommended by the ISO standard 6143:2001 [6]. It includes the possibility to take into account correlations between measurements performed with the same instrument at different ozone mole fractions. It also facilitates the use of a transfer standard, by handling of unavoidable correlations, which arise, as this instrument needs to be calibrated by the reference standard.
The two comparisons performed via the transfer standard are treated:
• The first comparison results are calculated by performing a linear regression on the twelve data points from the BIPM visit (xRS, xTS) (calibration of the transfer standard) followed by a second linear regression of the twelve data points from the pre BIPM visit (xNS, x’ ), x’TS TS being the corrected values of the transfer standard calibrated by the reference standard.
• The second comparison results are calculated by performing a linear regression on the twelve data points from the BIPM visit (xRS, xTS) (calibration of the transfer standard) followed by a second linear regression of the twelve data points from the post BIPM visit (x , x’ ), x’NS TS TS being the corrected values of the transfer standard calibrated by the reference standard.
For each comparison, a linear relationship between the ozone mole fractions measured by SRPn and SRP27 is obtained:
(10) SRP2710SRP xaax n +=
The associated uncertainties on the slope u(a ) and the intercept u(a1 0) are given by OzonE, as well as the covariance between them and the usual statistical parameters to validate the fitting function.
14.1. Least-square regression results
BIPM.QM-K1_NIST_0701_final_080915.doc 15-Sep-08 Page 9 of 15
The two relationships between SRP2 and SRP27 are:
(11) SRP2 SRP270.06 0.9985x = − + ⋅ x
x
) = 0.32 nmol/mol, u(afrom the pre BIPM visit, with the uncertainties u(a0 1) = 0.0041, cov(a0, a ) = -4.92×10⁻⁴, 1
and (12) SRP2 SRP270.07 0.9981x = + ⋅
from the post BIPM visit, with the uncertainties u(a0) = 0.32 nmol/mol, u(a1) = 0.0041, cov(a0, a ) = -4.93×10⁻⁴. 1
To assess the agreement of the standards from equations 11 and 12, the difference between the calculated slope value and unity, and the intercept value and zero, together with their measurement uncertainties need to be considered. In both comparisons, the value of the intercept is consistent with an intercept of zero, considering the uncertainty in the value of this parameter; i.e │a0│< 2u(a0), and the value of the slope is consistent with a slope of 1; i.e.│1 - a1│< 2u(a ). 1
15. Degrees of equivalence
Degrees of equivalence are calculated at two nominal ozone mole fractions among the twelve measured in each comparison, in the nominal range 0 nmol/mol to 500 nmol/mol: 80 nmol/mol and 420 nmol/mol. These values correspond to points number 3 and 4 recorded in each comparison. As an ozone generator has limited reproducibility, the ozone mole fractions measured by the ozone standards can differ from the nominal values. However, as stated in the protocol, the value measured by the common reference SRP27 was expected to be within ±15 nmol/mol of the nominal value. Hence, it is meaningful to compare the degree of equivalence calculated for all the participants at the same nominal value.
15.1. Definition of the degrees of equivalence
Within protocol B, the degree of equivalence of the participant i, at a nominal value xnom is defined as:
(13) SRP27ˆiD x x= −
Where x is the measurement results of the national standard at the nominal value xi nom, and is the predicted value of SRP27 at the same nominal value, deduced from the transfer
standard measurement result during its comparison with the national standard. 27ˆSRPx
Its associated standard uncertainty is:
2 2SRP27ˆ( ) ( ) ( )iu D u x u x= + (14)
where u(xi) is the measurement uncertainties of the participant i and is the uncertainty associated with the predicted value of SRP27.
27ˆ( SRPu x )
BIPM.QM-K1_NIST_0701_final_080915.doc 15-Sep-08 Page 10 of 15
15.2. Calculation of SRP27 predicted values and their related uncertainties
The comparison performed at the BIPM between the transfer standard and the reference standard SRP27 is used to calibrate the transfer standard. The data RSx TSx and are fitted using the generalised least square program OzonE, taking into account the associated uncertainties RS(u x TS(u x) and ) , as well as covariance terms between the reference standard measurement results.
The parameters a and b of the linear relationship between xRS,TS RS,TS RS and x ( xTS RS = aRS,TS x +b ) are calculated as well as their uncertainties. TS RS,T
TSxThen, for each value measured with the transfer standard during its comparison with the national standard, a predicted value RSx̂ for the reference standard is evaluated using the linear relationships between the two instruments calculated above.
RSx̂The standard uncertainties associated with the predicted values are evaluated according to the equation:
2 2 2 2 2RS RS,TS TS RS,TS RS,TS TS TS RS,TS RS,TSˆ( ) ( ) ( ) ( ) 2 ( , )u x u b x u a a u x x u a b= + ⋅ + ⋅ + ⋅ ⋅ (15)
Where the uncertainty components u(a ), u(b ) and u(a , bRS,TS RS,TS RS,TS RS,TS) are calculated with the generalised least-square software OzonE.
15.3. Values of the degrees of equivalence
When protocol B is followed, the national and reference standards are compared twice to monitor the transfer standard stability. Therefore, two degrees of equivalence are calculated at each nominal ozone mole fraction.
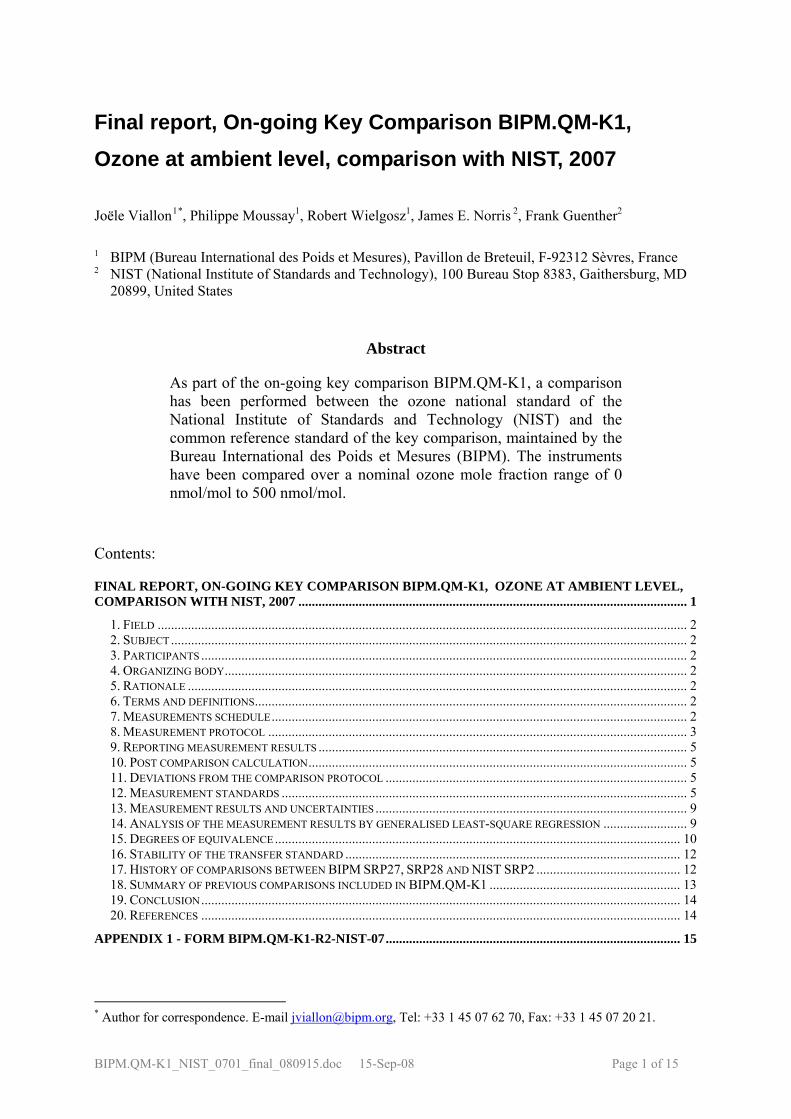
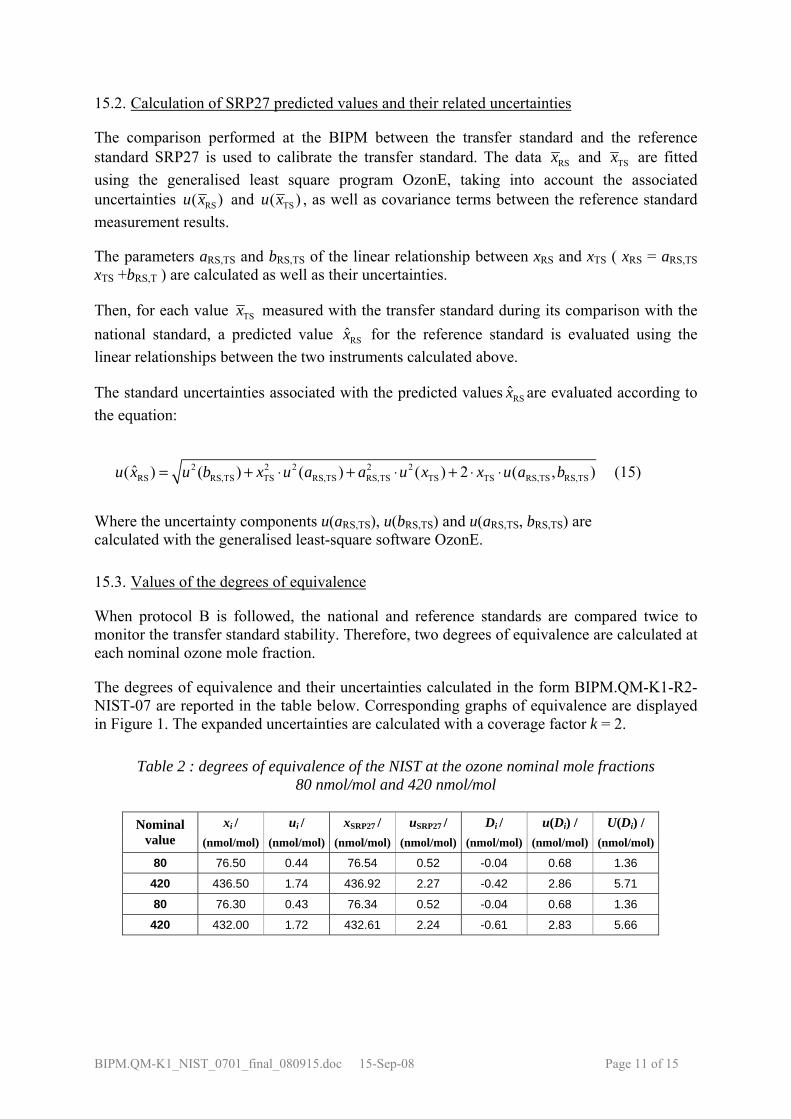
The degrees of equivalence and their uncertainties calculated in the form BIPM.QM-K1-R2-NIST-07 are reported in the table below. Corresponding graphs of equivalence are displayed in Figure 1. The expanded uncertainties are calculated with a coverage factor k = 2.
Table 2 : degrees of equivalence of the NIST at the ozone nominal mole fractions 80 nmol/mol and 420 nmol/mol
xi / ui / x / uSRP27 SRP27 / D u(Di / i) / U(Di) / Nominal
value (nmol/mol) (nmol/mol) (nmol/mol) (nmol/mol) (nmol/mol) (nmol/mol) (nmol/mol)
80 76.50 0.44 76.54 0.52 -0.04 0.68 1.36
420 436.50 1.74 436.92 2.27 -0.42 2.86 5.71
80 76.30 0.43 76.34 0.52 -0.04 0.68 1.36
420 432.00 1.72 432.61 2.24 -0.61 2.83 5.66
BIPM.QM-K1_NIST_0701_final_080915.doc 15-Sep-08 Page 11 of 15
(k = 2)Nominal value 80 nmol/mol
-10
-5
0
5
10
NIST NIST
Di /
(nm
ol/m
ol)
(k = 2) Nominal value 420 nmol/mol
-10
-5
0
5
10
NIST NIST
Di /
(nm
ol/m
ol)
Figure 1: degrees of equivalence of the NIST at the two nominal ozone mole fractions 80 nmol/mol and 420 nmol/mol
The degrees of equivalence between the NIST standard and the common reference standard BIPM SRP27 indicate good agreement between the standards. A discussion on the relation between degrees of equivalence and CMC statements can be found in [1].
16. Stability of the transfer standard
The overall agreement between the national standard SRP2 and the reference standard SRP27 shows an increase of 0.04% when considering the slope of the linear relationship deduced from the two comparisons performed. This is very small compared to the uncertainties.
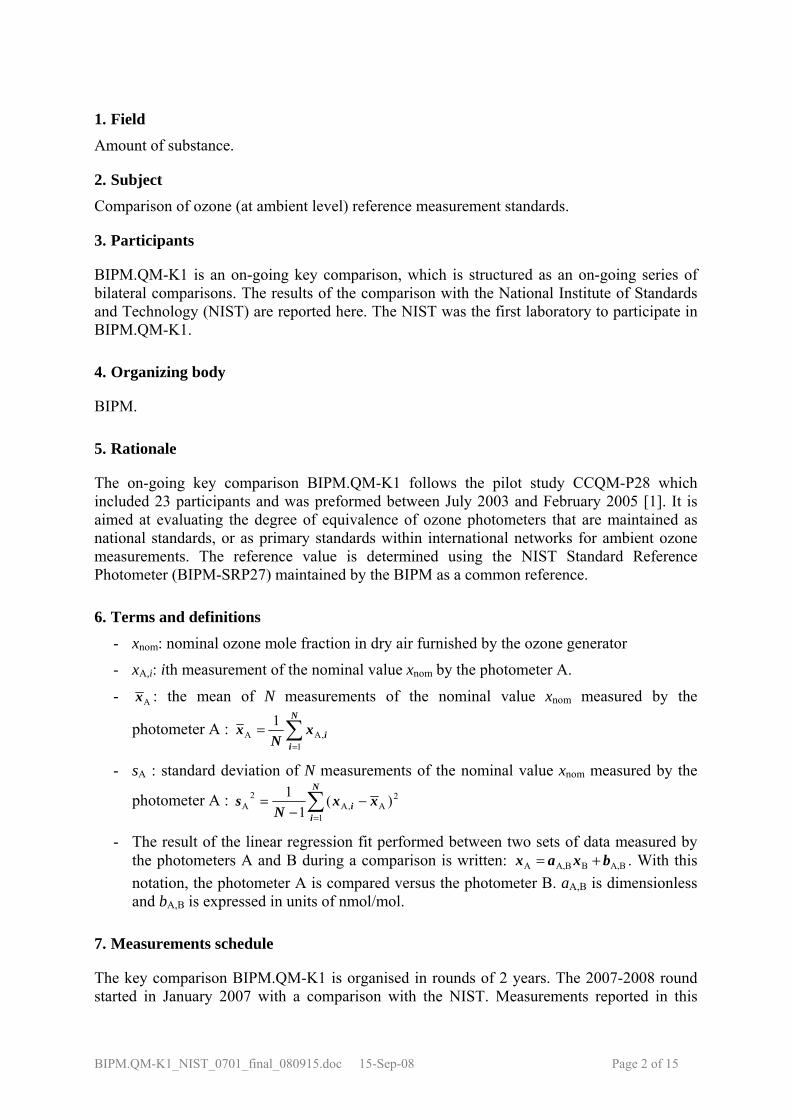
17. History of comparisons between BIPM SRP27, SRP28 and NIST SRP2
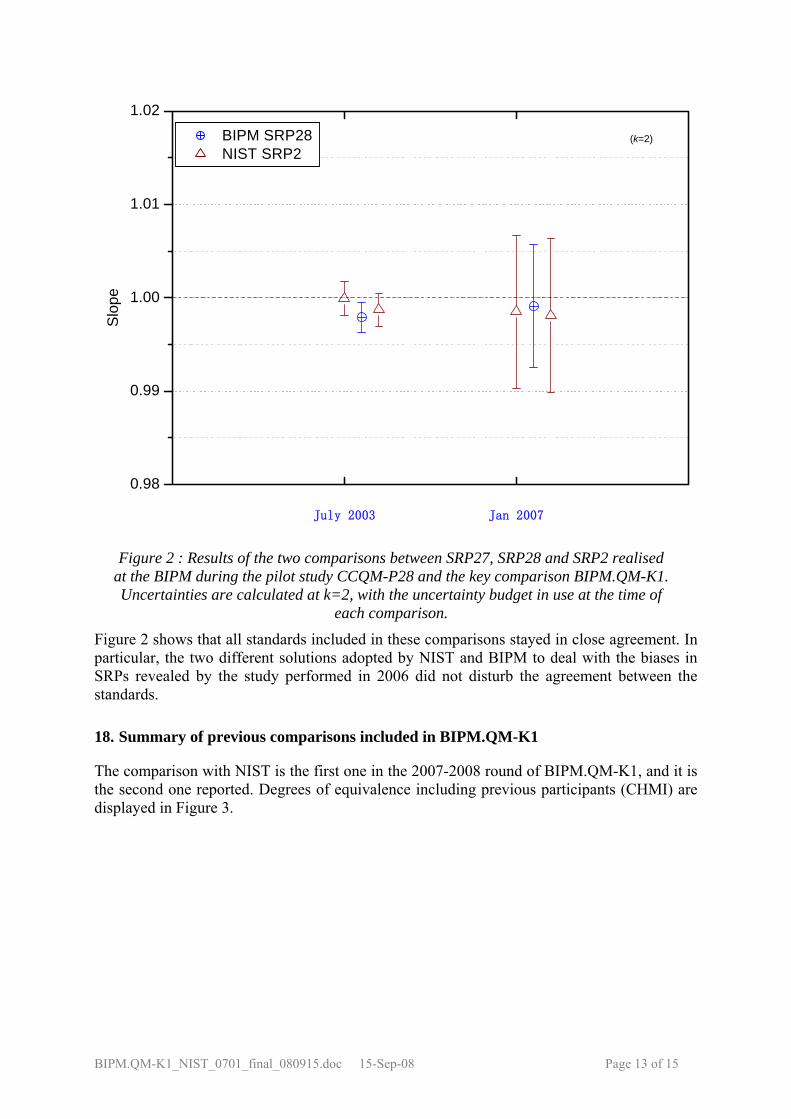
Results of the previous comparison performed with NIST during the pilot study CCQM-P28 are displayed in Figure 2 together with the results of this comparison. The slopes a1 of the linear relation x = a + a xSRPn 0 1 SRP27 are represented together with their associated uncertainties calculated at the time of each comparison.
BIPM.QM-K1_NIST_0701_final_080915.doc 15-Sep-08 Page 12 of 15
July 2003 Jan 2007
0.98
0.99
1.00
1.01
1.02
BIPM SRP28 NIST SRP2
Slop
e(k=2)
Figure 2 : Results of the two comparisons between SRP27, SRP28 and SRP2 realised at the BIPM during the pilot study CCQM-P28 and the key comparison BIPM.QM-K1. Uncertainties are calculated at k=2, with the uncertainty budget in use at the time of
each comparison.
Figure 2 shows that all standards included in these comparisons stayed in close agreement. In particular, the two different solutions adopted by NIST and BIPM to deal with the biases in SRPs revealed by the study performed in 2006 did not disturb the agreement between the standards.
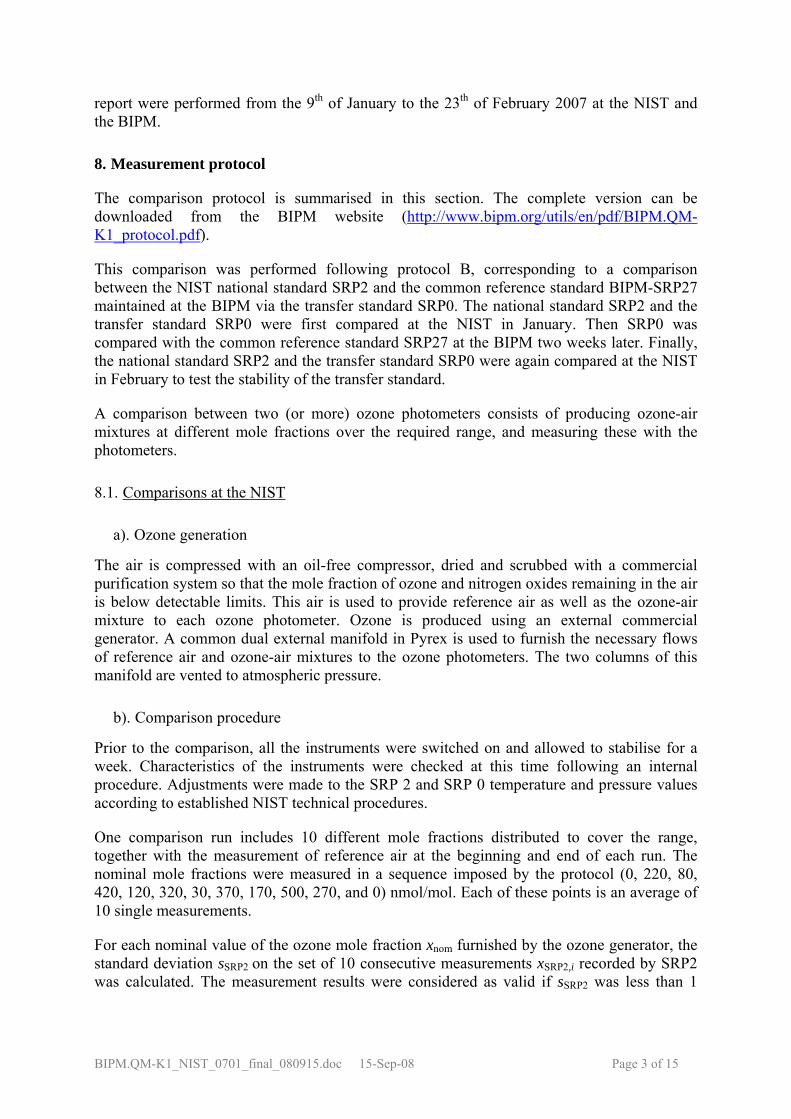
18. Summary of previous comparisons included in BIPM.QM-K1
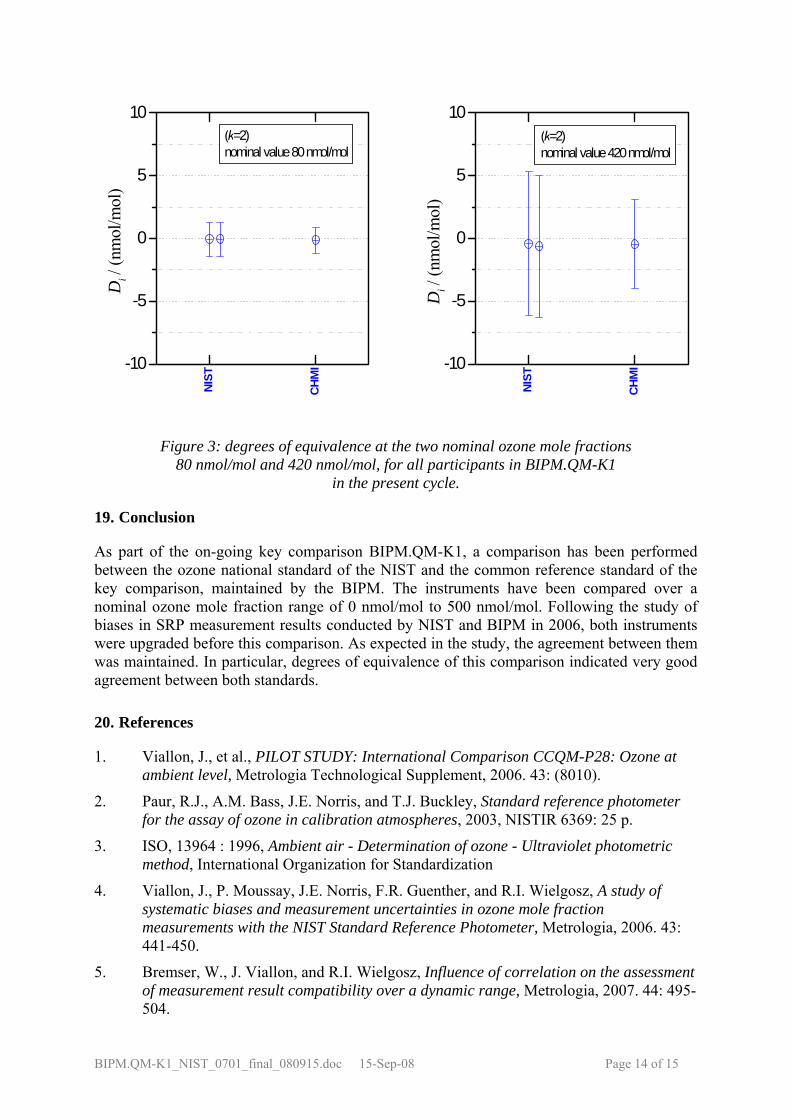
The comparison with NIST is the first one in the 2007-2008 round of BIPM.QM-K1, and it is the second one reported. Degrees of equivalence including previous participants (CHMI) are displayed in Figure 3.
BIPM.QM-K1_NIST_0701_final_080915.doc 15-Sep-08 Page 13 of 15
NIST
CHM
I
NIST
CHM
I-10
-5
0
5
10D
i / (n
mol
/mol
)(k=2)nominal value 80 nmol/mol
-10
-5
0
5
10(k=2)nominal value 420 nmol/mol
Di /
(nm
ol/m
ol)
Figure 3: degrees of equivalence at the two nominal ozone mole fractions 80 nmol/mol and 420 nmol/mol, for all participants in BIPM.QM-K1
in the present cycle.
19. Conclusion
As part of the on-going key comparison BIPM.QM-K1, a comparison has been performed between the ozone national standard of the NIST and the common reference standard of the key comparison, maintained by the BIPM. The instruments have been compared over a nominal ozone mole fraction range of 0 nmol/mol to 500 nmol/mol. Following the study of biases in SRP measurement results conducted by NIST and BIPM in 2006, both instruments were upgraded before this comparison. As expected in the study, the agreement between them was maintained. In particular, degrees of equivalence of this comparison indicated very good agreement between both standards.
20. References
1. Viallon, J., et al., PILOT STUDY: International Comparison CCQM-P28: Ozone at ambient level, Metrologia Technological Supplement, 2006. 43: (8010).
2. Paur, R.J., A.M. Bass, J.E. Norris, and T.J. Buckley, Standard reference photometer for the assay of ozone in calibration atmospheres, 2003, NISTIR 6369: 25 p.
3. ISO, 13964 : 1996, Ambient air - Determination of ozone - Ultraviolet photometric method, International Organization for Standardization
4. Viallon, J., P. Moussay, J.E. Norris, F.R. Guenther, and R.I. Wielgosz, A study of systematic biases and measurement uncertainties in ozone mole fraction measurements with the NIST Standard Reference Photometer, Metrologia, 2006. 43: 441-450.
5. Bremser, W., J. Viallon, and R.I. Wielgosz, Influence of correlation on the assessment of measurement result compatibility over a dynamic range, Metrologia, 2007. 44: 495-504.
BIPM.QM-K1_NIST_0701_final_080915.doc 15-Sep-08 Page 14 of 15
6. ISO, 6143.2 : 2001, Gas analysis - Determination of the composition of calibration gas mixtures - Comparison methods, International Organization for Standardization
Appendix 1 - Form BIPM.QM-K1-R2-NIST-07
See next pages.
BIPM.QM-K1_NIST_0701_final_080915.doc 15-Sep-08 Page 15 of 15
Ozone comparison form BIPM.QM-K1-R2 Version 2.0 Modified 11/01/2007
page 1page 2 Summaryf of the comparison resultspage 3 calculation of the national standard vs reference standard first relationshippage 4 calculation of the national standard vs reference standard second relationshippage 5 Data reporting sheet - first comparison of the transfer standard vs the national standardpage 7 Calibration of the transfer standard by the reference standard at the BIPMpage 9 Data reporting sheet - second comparison of the transfer standard vs the national standardpage 11
This workbook contains macros. It is recommended not to use them.
Please complete the cells containing blue stars only. After completion of the appropriate section of this report, please send to Joële Viallon by email ([email protected]), fax (+33 1 45342021), or mail (BIPM, Pavillon de Breteuil, F-92312 Sèvres)
NIST NISTReference Standard National Standard Transfer Standard
Institute
Address
Contact
SRP SRP2 0
Manufacturer
Serial numberSRP
SRP27Type
NIST
Telephone
Uncertainty budgets
OZONE COMPARISON RESULT - PROTOCOL B - WITH A TRANSFER STANDARD
Instruments information
National Institute of Standards and Technology
100 Bureau Stop 8383, Gaithersburg, MD 20899
James E. Norris
1-301-975-3936
Participating institute information
Page 1
ozone cross-section value 308.32 atm-1 cm-1 308.32 atm-1 cm-1
Content of the reportGeneral informations
308.32 atm-1 cm-1
BIPM.QM-K1-R2-NIST-07_v2.xls 08/04/2008
Ozone comparison form BIPM.QM-K1-R2 Version 2.0 Modified 11/01/2007
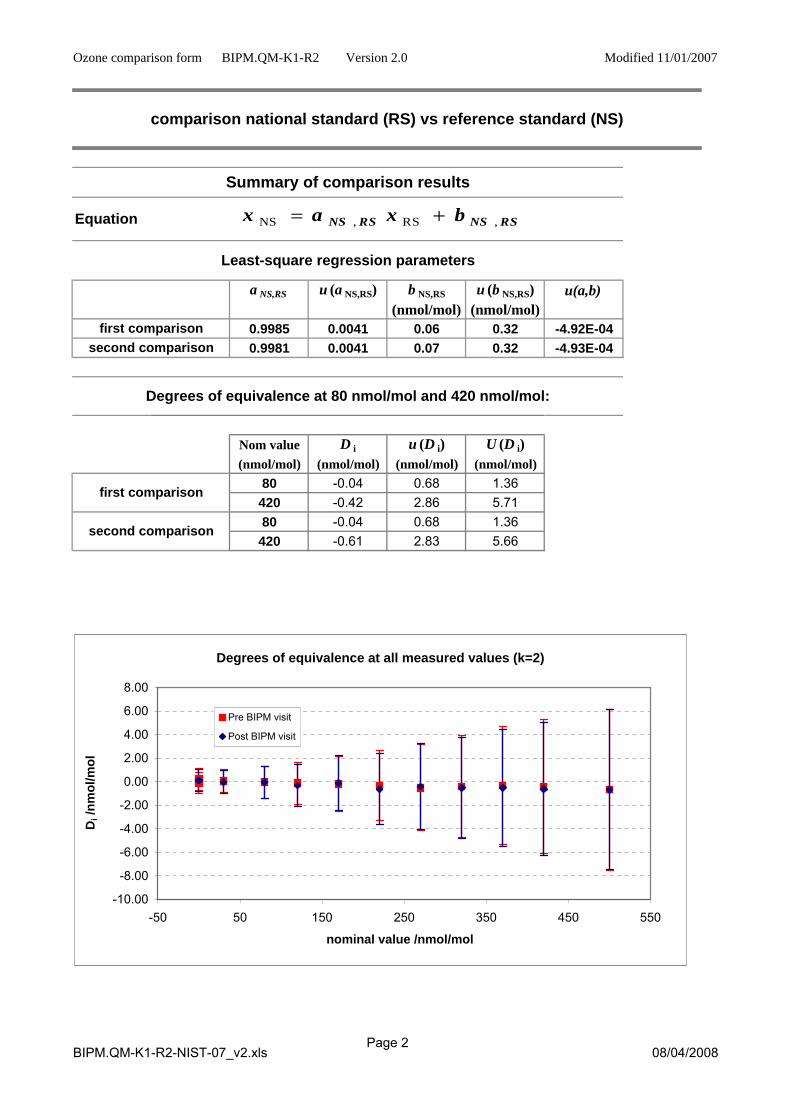
a NS,RS u (a NS,RS) b NS,RS u (b NS,RS) u(a,b)(nmol/mol) (nmol/mol)
0.9985 0.0041 0.06 0.32 -4.92E-040.9981 0.0041 0.07 0.32 -4.93E-04
Nom value D i u (D i) U (D i) (nmol/mol) (nmol/mol) (nmol/mol) (nmol/mol)
80 -0.04 0.68 1.36420 -0.42 2.86 5.7180 -0.04 0.68 1.36420 -0.61 2.83 5.66
comparison national standard (RS) vs reference standard (NS)
first comparison
Equation
Summary of comparison results
Least-square regression parameters
second comparison
first comparison
Degrees of equivalence at 80 nmol/mol and 420 nmol/mol:
second comparison
Page 2
Degrees of equivalence at all measured values (k=2)
-10.00
-8.00
-6.00
-4.00
-2.00
0.00
2.00
4.00
6.00
8.00
-50 50 150 250 350 450 550
nominal value /nmol/mol
Di /
nmol
/mol
Pre BIPM visit
Post BIPM visit
RSNSRSNS bxax ,RS,NS +=
BIPM.QM-K1-R2-NIST-07_v2.xls 08/04/2008
Ozone comparison form BIPM.QM-K1-R2 Version 2.0 Modified 11/01/2007
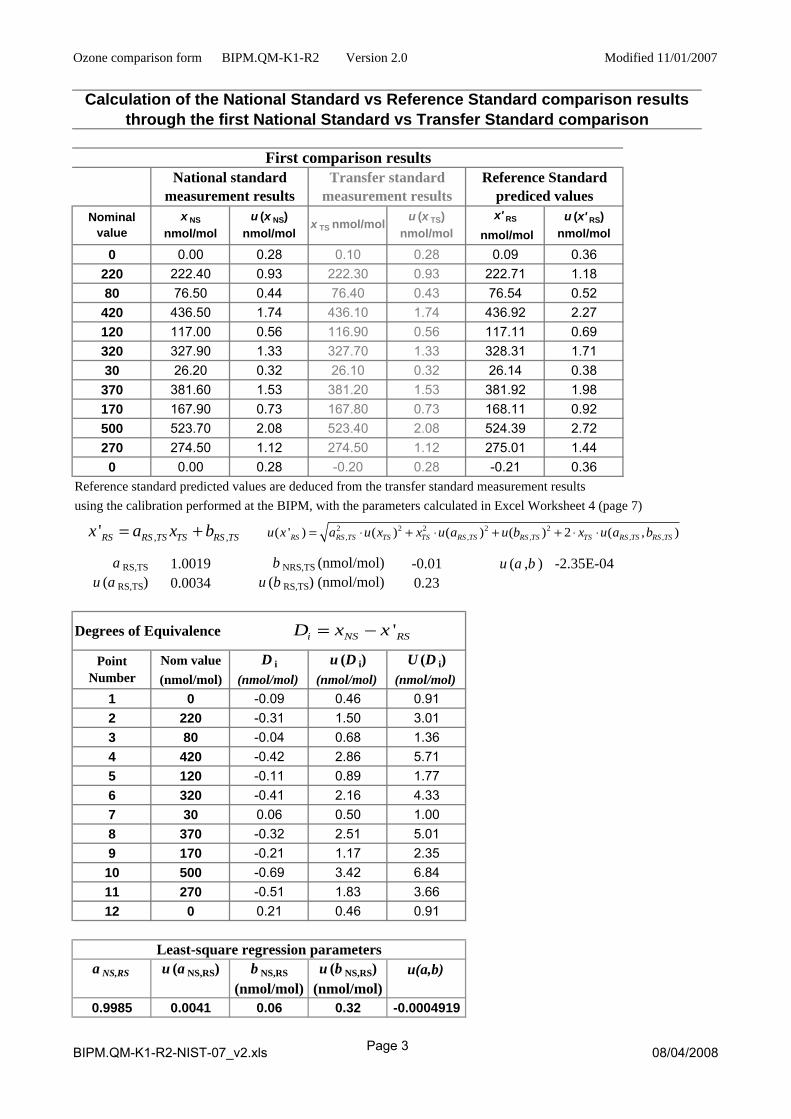
x' RS
nmol/mol0 0.00 0.28 0.10 0.28 0.09 0.36
220 222.40 0.93 222.30 0.93 222.71 1.1880 76.50 0.44 76.40 0.43 76.54 0.52420 436.50 1.74 436.10 1.74 436.92 2.27120 117.00 0.56 116.90 0.56 117.11 0.69320 327.90 1.33 327.70 1.33 328.31 1.7130 26.20 0.32 26.10 0.32 26.14 0.38370 381.60 1.53 381.20 1.53 381.92 1.98170 167.90 0.73 167.80 0.73 168.11 0.92500 523.70 2.08 523.40 2.08 524.39 2.72270 274.50 1.12 274.50 1.12 275.01 1.440 0.00 0.28 -0.20 0.28 -0.21 0.36
Reference standard predicted values are deduced from the transfer standard measurement resultsusing the calibration performed at the BIPM, with the parameters calculated in Excel Worksheet 4 (page 7)
a RS,TS 1.0019 b NRS,TS (nmol/mol) -0.01 u (a ,b ) -2.35E-04u (a RS,TS) 0.0034 u (b RS,TS) (nmol/mol) 0.23
Nom value D i u (D i) U (D i) (nmol/mol) (nmol/mol) (nmol/mol) (nmol/mol)
1 0 -0.09 0.46 0.912 220 -0.31 1.50 3.013 80 -0.04 0.68 1.364 420 -0.42 2.86 5.715 120 -0.11 0.89 1.776 320 -0.41 2.16 4.337 30 0.06 0.50 1.008 370 -0.32 2.51 5.019 170 -0.21 1.17 2.3510 500 -0.69 3.42 6.8411 270 -0.51 1.83 3.6612 0 0.21 0.46 0.91
a NS,RS u (a NS,RS) b NS,RS u (b NS,RS) u(a,b)(nmol/mol) (nmol/mol)
0.9985 0.0041 0.06 0.32 -0.0004919
National standard measurement results
x NS
nmol/molu (x' RS)
nmol/mol
Degrees of Equivalence
x TS nmol/mol u (x TS) nmol/mol
Point Number
Nominal value
Reference Standard prediced values
Transfer standard measurement results
First comparison results
u (x NS) nmol/mol
Calculation of the National Standard vs Reference Standard comparison results through the first National Standard vs Transfer Standard comparison
Least-square regression parameters
Page 3
, ,'RS RS TS TS RS TSx a x b= +
'i NS RSD x x= −
2 2 2 2 2, , , , ,( ' ) ( ) ( ) ( ) 2 ( , )RS RS TS TS TS RS TS RS TS TS RS TS RS TSu x a u x x u a u b x u a b= ⋅ + ⋅ + + ⋅ ⋅
BIPM.QM-K1-R2-NIST-07_v2.xls 08/04/2008
Ozone comparison form BIPM.QM-K1-R2 Version 2.0 Modified 11/01/2007
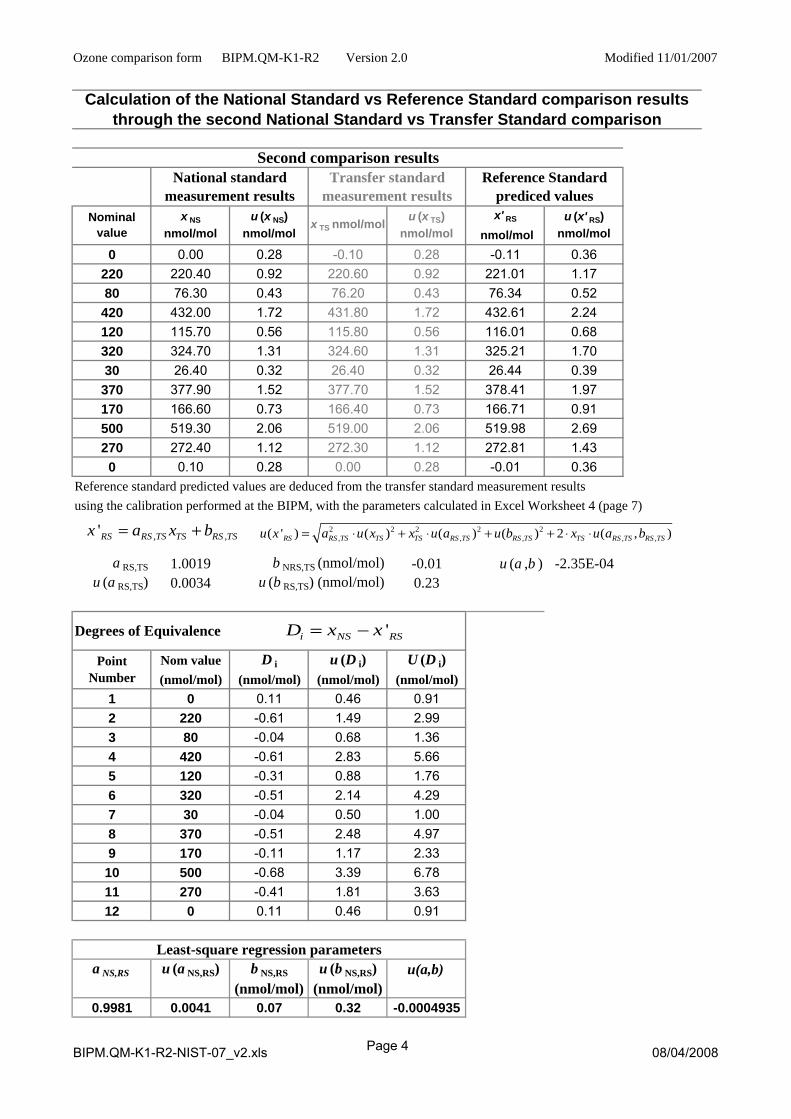
x' RS
nmol/mol0 0.00 0.28 -0.10 0.28 -0.11 0.36
220 220.40 0.92 220.60 0.92 221.01 1.1780 76.30 0.43 76.20 0.43 76.34 0.52420 432.00 1.72 431.80 1.72 432.61 2.24120 115.70 0.56 115.80 0.56 116.01 0.68320 324.70 1.31 324.60 1.31 325.21 1.7030 26.40 0.32 26.40 0.32 26.44 0.39370 377.90 1.52 377.70 1.52 378.41 1.97170 166.60 0.73 166.40 0.73 166.71 0.91500 519.30 2.06 519.00 2.06 519.98 2.69270 272.40 1.12 272.30 1.12 272.81 1.430 0.10 0.28 0.00 0.28 -0.01 0.36
Reference standard predicted values are deduced from the transfer standard measurement resultsusing the calibration performed at the BIPM, with the parameters calculated in Excel Worksheet 4 (page 7)
a RS,TS 1.0019 b NRS,TS (nmol/mol) -0.01 u (a ,b ) -2.35E-04u (a RS,TS) 0.0034 u (b RS,TS) (nmol/mol) 0.23
Nom value D i u (D i) U (D i) (nmol/mol) (nmol/mol) (nmol/mol) (nmol/mol)
1 0 0.11 0.46 0.912 220 -0.61 1.49 2.993 80 -0.04 0.68 1.364 420 -0.61 2.83 5.665 120 -0.31 0.88 1.766 320 -0.51 2.14 4.297 30 -0.04 0.50 1.008 370 -0.51 2.48 4.979 170 -0.11 1.17 2.3310 500 -0.68 3.39 6.7811 270 -0.41 1.81 3.6312 0 0.11 0.46 0.91
a NS,RS u (a NS,RS) b NS,RS u (b NS,RS) u(a,b)(nmol/mol) (nmol/mol)
0.9981 0.0041 0.07 0.32 -0.0004935
Transfer standard measurement results
Reference Standard prediced values
Page 4
Degrees of Equivalence
u (x TS) nmol/mol
Second comparison results
Point Number
Calculation of the National Standard vs Reference Standard comparison results through the second National Standard vs Transfer Standard comparison
x NS
nmol/molu (x' RS)
nmol/mol
Least-square regression parameters
Nominal value
u (x NS) nmol/mol
x TS nmol/mol
National standard measurement results
'i NS RSD x x= −
, ,'RS RS TS TS RS TSx a x b= + 2 2 2 2 2, , , , ,( ' ) ( ) ( ) ( ) 2 ( , )RS RS TS TS TS RS TS RS TS TS RS TS RS TSu x a u x x u a u b x u a b= ⋅ + ⋅ + + ⋅ ⋅
BIPM.QM-K1-R2-NIST-07_v2.xls 08/04/2008
Ozone comparison form BIPM.QM-K1-R2 Version 2.0 Modified 11/01/2007
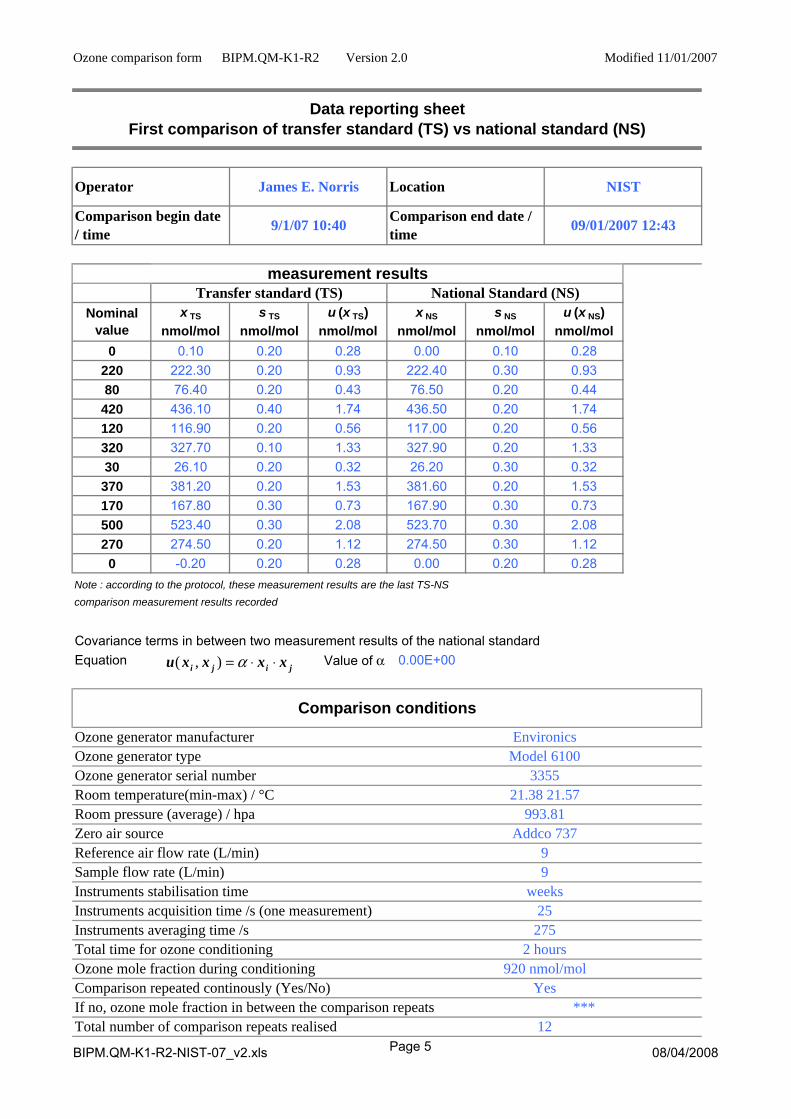
0 0.10 0.20 0.28 0.00 0.10 0.28220 222.30 0.20 0.93 222.40 0.30 0.9380 76.40 0.20 0.43 76.50 0.20 0.44420 436.10 0.40 1.74 436.50 0.20 1.74120 116.90 0.20 0.56 117.00 0.20 0.56320 327.70 0.10 1.33 327.90 0.20 1.3330 26.10 0.20 0.32 26.20 0.30 0.32370 381.20 0.20 1.53 381.60 0.20 1.53170 167.80 0.30 0.73 167.90 0.30 0.73500 523.40 0.30 2.08 523.70 0.30 2.08270 274.50 0.20 1.12 274.50 0.30 1.120 -0.20 0.20 0.28 0.00 0.20 0.28
Note : according to the protocol, these measurement results are the last TS-NS comparison measurement results recorded
Covariance terms in between two measurement results of the national standardEquation Value of α 0.00E+00
Page 5
Comparison repeated continously (Yes/No)
275
Yes
25
Total time for ozone conditioning 2 hours920 nmol/mol
Instruments acquisition time /s (one measurement)Instruments averaging time /s
If no, ozone mole fraction in between the comparison repeats ***
measurement results
Environics
x NS
nmol/mols NS
nmol/mol
Transfer standard (TS) National Standard (NS)s TS
nmol/molu (x NS)
nmol/mol
Data reporting sheet First comparison of transfer standard (TS) vs national standard (NS)
Operator James E. Norris
9/1/07 10:40
NIST
09/01/2007 12:43
Location
Comparison end date / time
Comparison begin date / time
Nominal value
12Total number of comparison repeats realised
x TS
nmol/mol
Model 6100
Comparison conditions
Ozone generator serial number
9
21.38 21.57
9Zero air sourceReference air flow rate (L/min)Sample flow rate (L/min)
Addco 737
Instruments stabilisation time
Ozone mole fraction during conditioning
weeks
u (x TS) nmol/mol
3355Room temperature(min-max) / °CRoom pressure (average) / hpa
Ozone generator typeOzone generator manufacturer
993.81
( , )i j i ju x x x xα= ⋅ ⋅
BIPM.QM-K1-R2-NIST-07_v2.xls 08/04/2008

Ozone comparison form BIPM.QM-K1-R2 Version 2.0 Modified 11/01/2007
Page 6
National Standard
Transfer Standard
Instruments checks and adjustments
Performed SRP Operating Characteristics Checkout following Technical Procedures 839.03-12b
Performed SRP Operating Characteristics Checkout following Technical Procedures 839.03-12b
BIPM.QM-K1-R2-NIST-07_v2.xls 08/04/2008
Ozone comparison form BIPM.QM-K1-R2 Version 2.0 Modified 11/01/2007
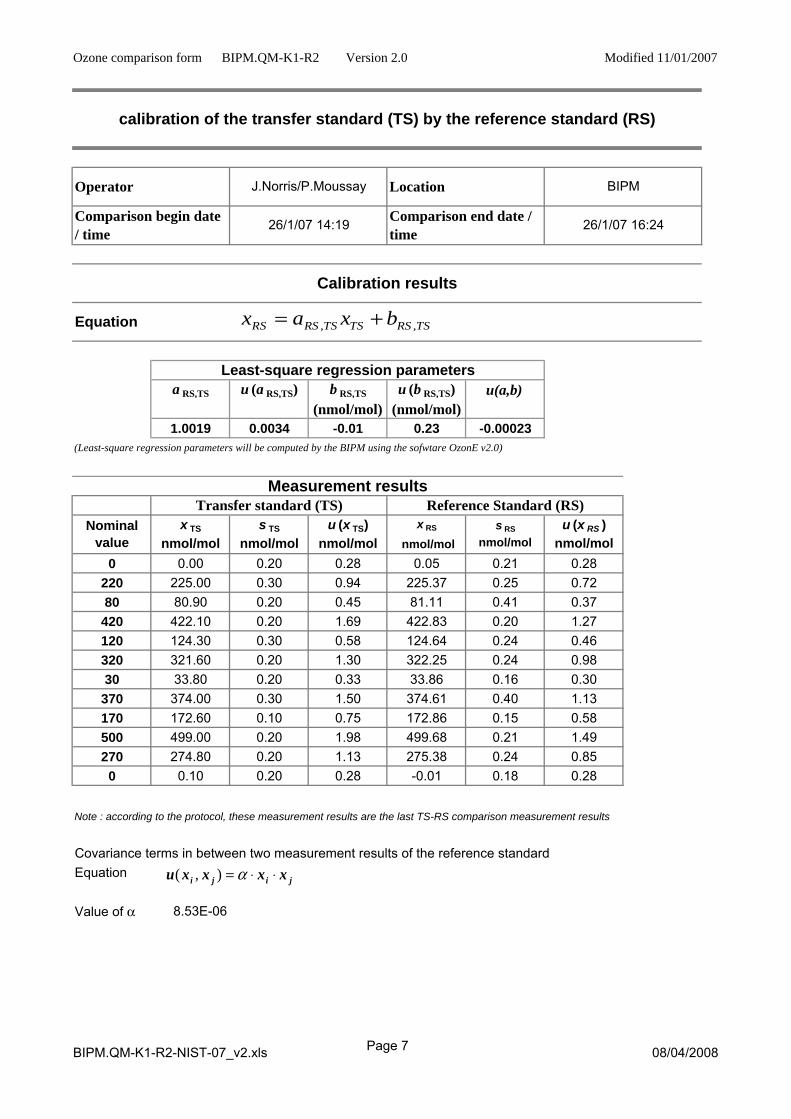
a RS,TS u (a RS,TS) b RS,TS u (b RS,TS) u(a,b)(nmol/mol) (nmol/mol)
1.0019 0.0034 -0.01 0.23 -0.00023(Least-square regression parameters will be computed by the BIPM using the sofwtare OzonE v2.0)
x RS
nmol/mol0 0.00 0.20 0.28 0.05 0.21 0.28
220 225.00 0.30 0.94 225.37 0.25 0.7280 80.90 0.20 0.45 81.11 0.41 0.37420 422.10 0.20 1.69 422.83 0.20 1.27120 124.30 0.30 0.58 124.64 0.24 0.46320 321.60 0.20 1.30 322.25 0.24 0.9830 33.80 0.20 0.33 33.86 0.16 0.30370 374.00 0.30 1.50 374.61 0.40 1.13170 172.60 0.10 0.75 172.86 0.15 0.58500 499.00 0.20 1.98 499.68 0.21 1.49270 274.80 0.20 1.13 275.38 0.24 0.850 0.10 0.20 0.28 -0.01 0.18 0.28
Note : according to the protocol, these measurement results are the last TS-RS comparison measurement results
Covariance terms in between two measurement results of the reference standardEquation
Value of α 8.53E-06
Measurement results
s RS
nmol/molu (x RS )
nmol/molNominal
values TS
nmol/molu (x TS)
nmol/mol
Page 7
Comparison end date / time
26/1/07 16:24
Operator J.Norris/P.Moussay Location BIPM
calibration of the transfer standard (TS) by the reference standard (RS)
Comparison begin date / time
26/1/07 14:19
Calibration results
Equation
Least-square regression parameters
Transfer standard (TS) Reference Standard (RS)x TS
nmol/mol
, ,RS RS TS TS RS TSx a x b= +
( , )i j i ju x x x xα= ⋅ ⋅
BIPM.QM-K1-R2-NIST-07_v2.xls 08/04/2008
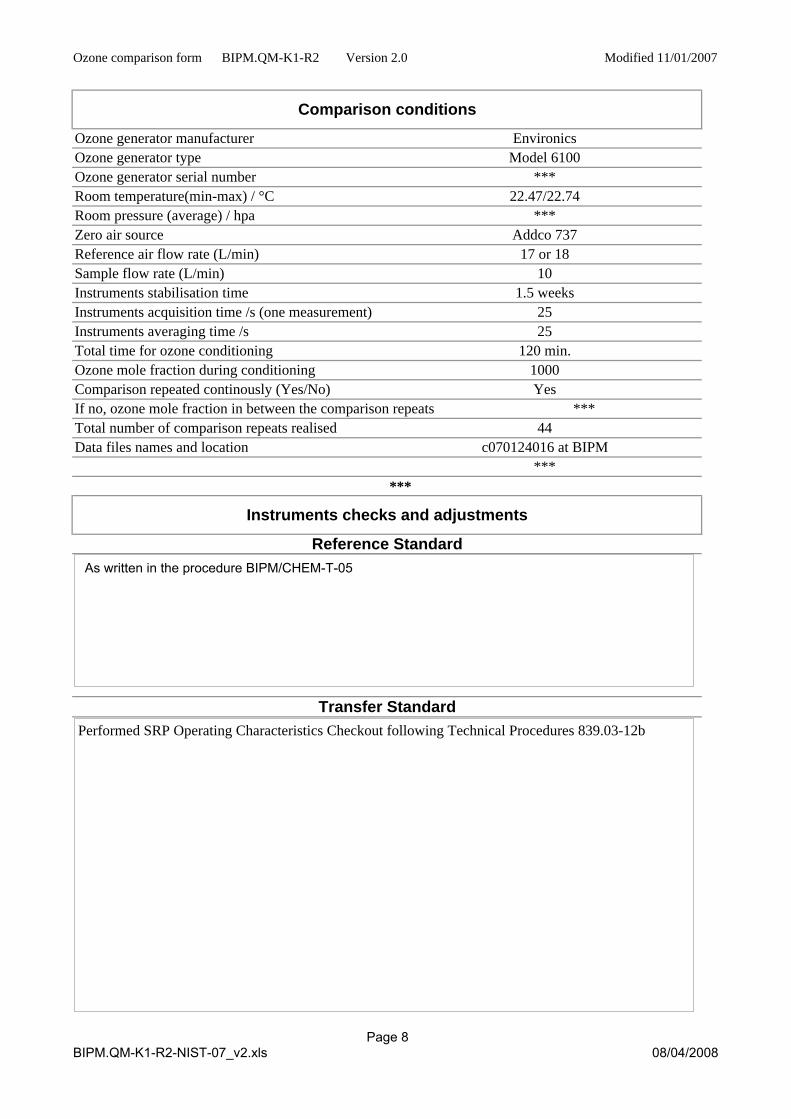
Ozone comparison form BIPM.QM-K1-R2 Version 2.0 Modified 11/01/2007
***
EnvironicsOzone generator type
Instruments checks and adjustments
Reference Standard
Comparison conditions
Data files names and location c070124016 at BIPM***
Page 8
Transfer Standard
Ozone generator manufacturer
Room pressure (average) / hpa ***Zero air source Addco 737
Model 6100Ozone generator serial number ***Room temperature(min-max) / °C 22.47/22.74
Instruments stabilisation time 1.5 weeksInstruments acquisition time /s (one measurement) 25
Reference air flow rate (L/min) 17 or 18Sample flow rate (L/min) 10
Total number of comparison repeats realised 44
Comparison repeated continously (Yes/No) YesIf no, ozone mole fraction in between the comparison repeats ***
Ozone mole fraction during conditioning 1000
Instruments averaging time /s 25Total time for ozone conditioning 120 min.
As written in the procedure BIPM/CHEM-T-05
Performed SRP Operating Characteristics Checkout following Technical Procedures 839.03-12b
BIPM.QM-K1-R2-NIST-07_v2.xls 08/04/2008

Ozone comparison form BIPM.QM-K1-R2 Version 2.0 Modified 11/01/2007
0 -0.10 0.20 0.28 0.00 0.20 0.28220 220.60 0.20 0.92 220.40 0.30 0.9280 76.20 0.20 0.43 76.30 0.20 0.43420 431.80 0.30 1.72 432.00 0.30 1.72120 115.80 0.20 0.56 115.70 0.10 0.56320 324.60 0.30 1.31 324.70 0.30 1.3130 26.40 0.20 0.32 26.40 0.20 0.32370 377.70 0.20 1.52 377.90 0.20 1.52170 166.40 0.20 0.73 166.60 0.30 0.73500 519.00 0.40 2.06 519.30 0.30 2.06270 272.30 0.10 1.12 272.40 0.20 1.120 0.00 0.20 0.28 0.10 0.20 0.28
Note : according to the protocol, these measurement results are the last TS-NS comparison measurement results recorded
Covariance terms in between two measurement results of the national standardEquation Value of α 0.00E+00
Page 9
***
Instruments averaging time /s 275
Total number of comparison repeats realised 19
Comparison repeated continously (Yes/No) Yes
Total time for ozone conditioning 2 hours
Reference air flow rate (L/min) 9Sample flow rate (L/min) 9Instruments stabilisation time at least 1 weekInstruments acquisition time /s (one measurement)
Data reporting sheetSecond comparison of transfer standard (TS) vs national standard (NS)
Comparison conditions
NIST
Comparison begin date / time 23/2/07 13:37
x NS
nmol/mol
Operator James E. Norris Location
Comparison end date / time 23/2/07 15:37
Transfer standard (TS) National Standard (NS)measurement results
Zero air source Addco 737
Nominal value
Ozone generator manufacturer EnvironicsOzone generator type
s NS
nmol/mols TS
nmol/mol
Model 6100Ozone generator serial number 3355
Ozone mole fraction during conditioning 920 nmol/mol
Room temperature(min-max) / °C 21.55, 21.60
25
If no, ozone mole fraction in between the comparison repeats
Room pressure (average) / hpa 1001.81
u (x TS) nmol/mol
x TS
nmol/molu (x NS)
nmol/mol
( , )i j i ju x x x xα= ⋅ ⋅
BIPM.QM-K1-R2-NIST-07_v2.xls 08/04/2008
Ozone comparison form BIPM.QM-K1-R2 Version 2.0 Modified 11/01/2007
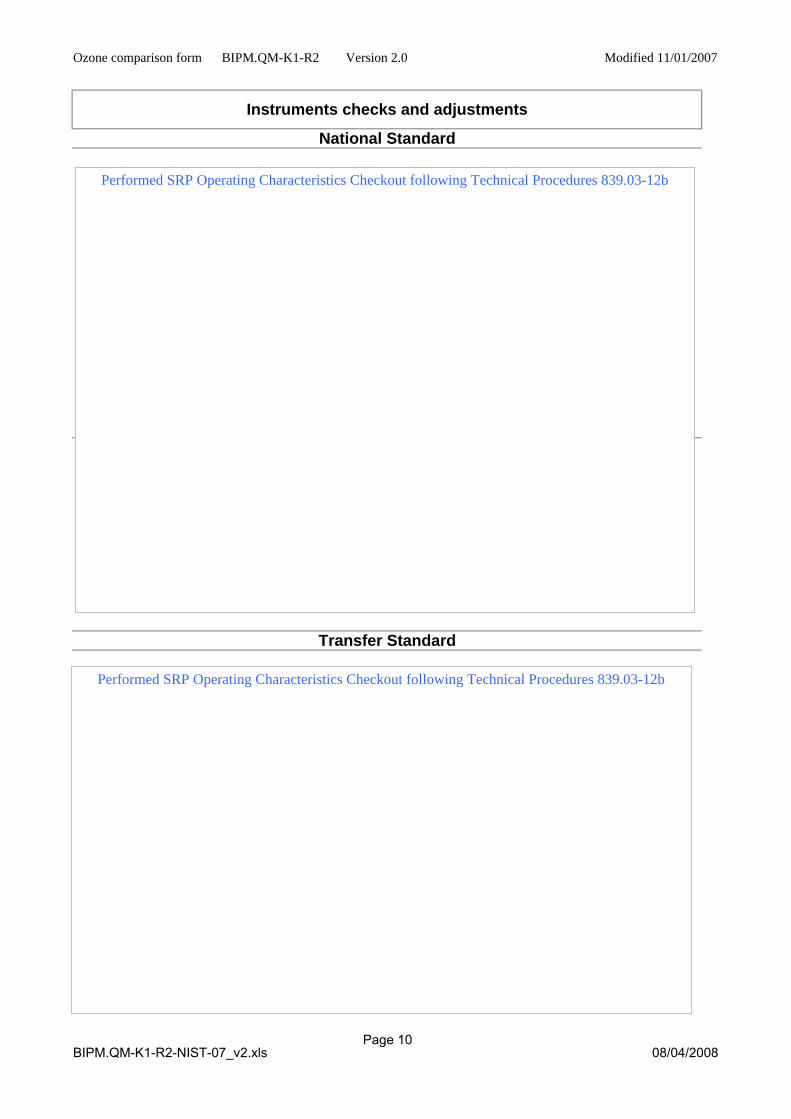
Instruments checks and adjustments
National Standard
Transfer Standard
Page 10
Performed SRP Operating Characteristics Checkout following Technical Procedures 839.03-12b
Performed SRP Operating Characteristics Checkout following Technical Procedures 839.03-12b
BIPM.QM-K1-R2-NIST-07_v2.xls 08/04/2008
Ozone comparison form BIPM.QM-K1-R2 Version 2.0 Modified 11/01/2007
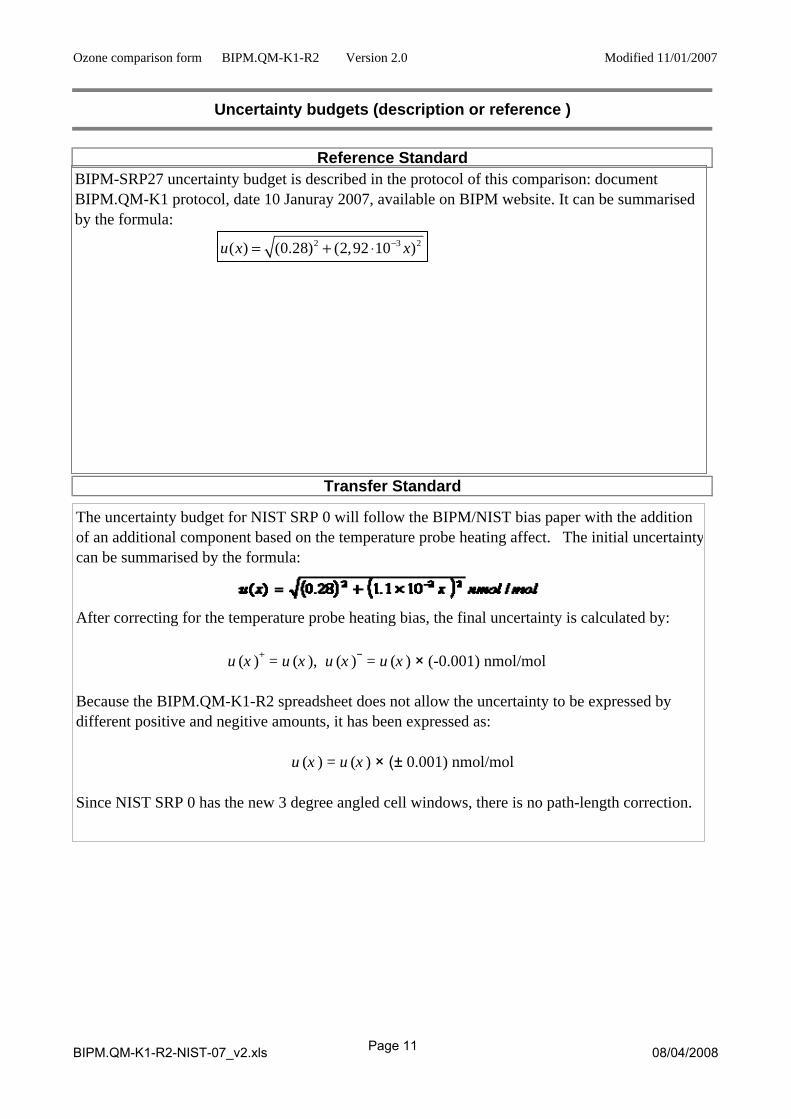
Transfer Standard
Uncertainty budgets (description or reference )
Reference Standard
Page 11
BIPM-SRP27 uncertainty budget is described in the protocol of this comparison: document BIPM.QM-K1 protocol, date 10 Januray 2007, available on BIPM website. It can be summarised by the formula:
The uncertainty budget for NIST SRP 0 will follow the BIPM/NIST bias paper with the addition of an additional component based on the temperature probe heating affect. The initial uncertaintycan be summarised by the formula:
After correcting for the temperature probe heating bias, the final uncertainty is calculated by:
u (x )+ = u (x ), u (x )− = u (x ) × (-0.001) nmol/mol
Because the BIPM.QM-K1-R2 spreadsheet does not allow the uncertainty to be expressed by different positive and negitive amounts, it has been expressed as:
u (x ) = u (x ) × (± 0.001) nmol/mol
Since NIST SRP 0 has the new 3 degree angled cell windows, there is no path-length correction.
2 3 2( ) (0.28) (2,92 10 )u x x−= + ⋅
BIPM.QM-K1-R2-NIST-07_v2.xls 08/04/2008
Ozone comparison form BIPM.QM-K1-R2 Version 2.0 Modified 11/01/2007
Page 12
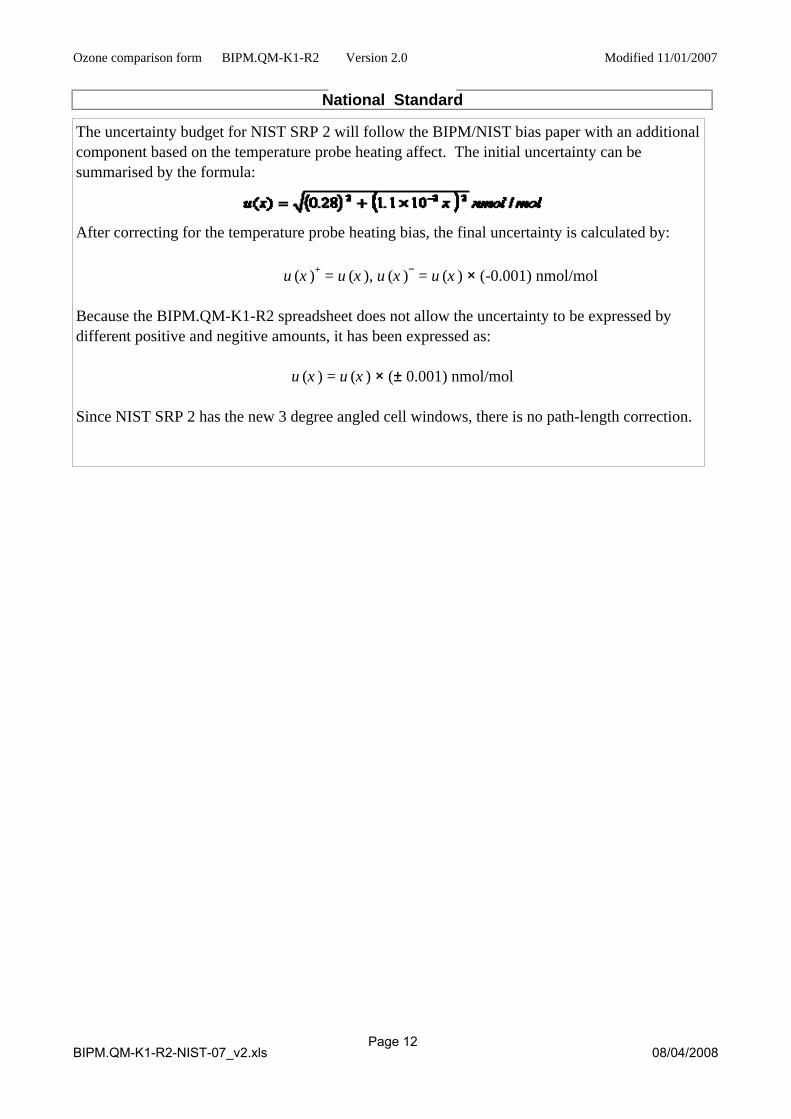
National Standard
The uncertainty budget for NIST SRP 2 will follow the BIPM/NIST bias paper with an additional component based on the temperature probe heating affect. The initial uncertainty can be summarised by the formula:
After correcting for the temperature probe heating bias, the final uncertainty is calculated by:
u (x )+ = u (x ), u (x )− = u (x ) × (-0.001) nmol/mol
Because the BIPM.QM-K1-R2 spreadsheet does not allow the uncertainty to be expressed by different positive and negitive amounts, it has been expressed as:
u (x ) = u (x ) × (± 0.001) nmol/mol
Since NIST SRP 2 has the new 3 degree angled cell windows, there is no path-length correction.
BIPM.QM-K1-R2-NIST-07_v2.xls 08/04/2008


![arXiv:1608.00292v4 [math.GN] 12 Oct 2016 · 2016-10-13 · We show that the answer is no, ... i2!Ki.! K1 K2 K3 K0 K1 K2 K3 K0! K1 K2 K3 K0 K1 K2 K3 K0 Figure 2. K! K1 K2 K3 K0 K1](https://img.pdfslide.us/doc/110x75/5e779fd8cdc8f45d52235a34/arxiv160800292v4-mathgn-12-oct-2016-2016-10-13-we-show-that-the-answer-is.jpg)