Embed Size (px)
Citation preview

1
FINAL REPORT OF THE
THIRTY NINTH NORTH CAROLINA LAYER PERFORMANCE
AND MANAGEMENT TEST1
Vol. 39, No. 5
December 2015
The North Carolina Layer Performance and Management Tests are conducted under the auspices
of the North Carolina Layer Performance and Management Program, Prestage Department of
Poultry Science, Cooperative Extension Service at North Carolina State University and the North
Carolina Department of Agriculture and Consumer Services. The flock is maintained at the
Piedmont Research Station-Poultry Unit, Salisbury, North Carolina. Mr. Joe Hampton is Pied-
mont Research Station Superintendent; Mr. Aaron Sellers is Poultry Unit Manager; Dr. Ramon
D. Malheiros, Research Associate, is coordinator of data compilation and statistical analysis; and
Dr. Kenneth E. Anderson is Project Leader. The purpose of this program is to assist poultry
management teams in evaluation of commercial layer stocks and management systems.
The data presented herein represents the analysis of the first production cycle and molt of the
39th
North Carolina Layer Performance and Management Test. Performance summary tables are
available for each strain, molt, density and the production systems of Enrichable Cage, Enriched
Environmental Housing, and Conventional Cage System.
Copies of current and past reports are maintained for public access at:
https://poultry.ces.ncsu.edu/layer-performance/
For further information contact:
Dr. Kenneth E. Anderson
Poultry Science Department
North Carolina State University
Box 7608
Raleigh, NC 27695-7608
Phone (919) 515-5527
FAX (919) 515-7070
1The use of trade names in this publication does not imply endorsement by the North Carolina
Cooperative Extension Service of the products named nor criticism of similar ones not
mentioned.

2
39th NORTH CAROLINA LAYER PERFORMANCE AND
MANAGEMENT TEST
Volume 39, No. 3
Report on the First Laying Cycle and Molt
Dates of Importance:
Twenty entries were hatched on July 31, 2013. There were twelve commercial white egg
strains and eight commercial brown egg strains that are participating in the current test. The
chicks were all sexed according to their genetics (vent, feather, or color), vaccinated for Marek’s
disease, and wing banded for identification before being transferred to the brood/grow houses.
Table 1 shows the source of the laying stock, strain which was entered, and which environments
the strains are participating in the test. Table 91 is a list of the breeder, source of eggs, and entry
status of each strain. This report will only present the production data from the hens in Houses 5
and 7 representing the production systems are conventional cages (C), enrichable cages (EC),
and the enriched environmental housing system (ECS).
Experimental Components of Importance:
The rearing phase for the systems of conventional cage, enrichable cage, and enriched environ-
mental housing system were completed at 16 weeks, after which the pullets were moved to the
laying phase during their 17th
week of age.
First cycle production records commenced on November 27, 2013 (17 weeks of age), through the
molt period which was induced on November 24, 2014. The molt records commenced on No-
vember 24, 2014 (69 weeks of age), and ended on December 22, 2014 (73 weeks of age). The
second cycle began on December 22, 2014 (73 weeks of age) and ended on September 2, 2015
(109 weeks of age). This report includes production data summarized from 17 to 69 weeks, 69
to 73 weeks, 73 to 109 weeks, and 17 to 109 weeks of age for each production system and densi-
ty. A table showing the changes in body weights from 17 to 69 weeks of age, the weight loss
during the molt period included in the molt period information, and the changes in body weight
during the second cycle.
A maximum of approximately 830 and minimum of 300 white and brown egg pullets per strain
were placed at the initiation of the layer portion of the test depending on which of the test envi-
ronments the strain was entered into.
Strain: Samples of fertile eggs were provided from the breeders according to the rules, which
govern the conductance of the test. All eggs were set and hatched concurrently as described in
the hatch report (39th
Hatch/Serology Report Vol. 39, No. 1). However, due to hatch complica-
tions, additional chicks had to be acquired and delivered to the station; the added chicks had
hatch dates that were within two days of the original hatch. At hatch the chicks were sexed to
remove the males. All strains were sexed according to breeder recommendations (feather, color,
or vent sexing).

3
Table 1. 39th
North Carolina Layer Performance and Management Test Strain
Code Assignments and Participation Strain
No.
Source of Stock
Source
Code
Strain Participation
1
1 Hendrix-genetics ISA Bovans White C, EC, ECS
2 Hendrix-genetics ISA Shaver White C, EC, ECS
3 Hendrix-genetics ISA Dekalb White C, CF, EC, ECS
4 Hendrix-genetics ISA Babcock White C, EC, ECS
5 Hendrix-genetics ISA B-400 C, EC, ECS
6 Hy-Line Int. HL W-36 C, CF, EC, ECS
7 Hy-Line Int. HL CV-26 C, CF
8 Hy-Line Int. HL CV-24 C, CF, EC, ECS
9 Hy-Line Int. HL CV-22 C, CF, R
10 Lohmann L LSL Lite C, CF, EC, ECS
11 H&N International L H&N Nick Chick C, CF, EC, ECS
12 Novogen N White C, CF, EC, ECS
13 Tetra Americana TA TETRA Amber C, CF, EC, ECS
14 Tetra Americana TA TETRA Brown C, CF, EC, ECS
15 Novogen N Brown C, CF, EC, ECS
16 Lohmann L LB-Lite C, CF, EC, ECS
17 Hy-Line Int. HL Silver Brown C, CF, EC, ECS, R
18 Hy-Line Int. HL Brown C, CF, EC, ECS, R
19 Hendrix-genetics ISA ISA Brown C, CF, EC, ECS
20 Hendrix-genetics ISA Bovans Brown C, CF, EC, ECS 1 Participation for each strain in the different components of the tests are indicated by the following codes, a strain may have
more than one code: Cage=C; Enrichable Cage=EC; Enriched Colony Housing System=ECS; Cage Free = CF; Range = R. If the
code is in bold they are included in this report.
Pullet Housing and Management:
The pullets were reared in the environment to which they would be in during the laying phase
(39th
NCLP&MT Grow Report, Vol.39, No. 2). White egg strains occupied approximately 60%
and brown egg strains occupied the other 40% of cage replicates. Individual chicks were identi-
fied by strain assignment codes that indicated the cage arrangement, replicate identification
numbers, and the strain assignments for brood-grow House 8. Strain codes are maintained by the
PI and Poultry Unit Manager for strain and replicate identification and record keeping. Individu-
al birds were identified by a permanent identification tag applied at hatch; at the time they were
transferred to the laying house, each hen was retagged with the laying house replicate number,
indicating row, level and replicate.
4
The brood-grow system in House 8 was used to rear the pullets for the conventional cage, en-
richable cage, and the enriched environmental housing system. House 8 is an environmentally
controlled, windowless brood-grow facility with four rooms, each containing 72 replicates within
a Big Dutchman quad-deck cage layout. This system allows for a total of 3,744 pullets per room.
This study utilized all four rooms for a total of 11,062 pullets. The white and brown egg strains
were randomly assigned to the replicates in a restricted randomized manner with the restrictions
being that all strains were equally represented in all rooms, rows, and levels, as described in the
grow report (39th
NCLP&MT Grow Report, Vol.39, No. 2). Thirteen white-egg or brown-egg
chicks were in the same 60.9 x 66.0 cm (24 x 26 in) cage during the entire 16 week rearing peri-
od. Rearing density was 310 cm2 (48 in
2) for both the white and brown-egg layers.
Pullet Management and Nutrition:
Pullets were fed ad libitum by hand daily. Feed consumption and body weights were monitored
bi-weekly beginning at 2 weeks of age. All mortality was recorded daily, but mortality attributed
to the removal of males (sex slips) and accidental deaths from a replicate have been excluded
from the 39th NCLP&MT Grow Report.
Layer Housing and Cage Layout Description:
The pullets were moved to the laying facilities, Houses 5 and 7, in accordance with NCSU
IACUC approved methods. The strains were randomly assigned to replicate cages with white-
egg strains occupying approximately 60% and brown-egg strains the other 40% of the replicates
being intermingled throughout the houses such that all strains were approximately equally repre-
sented in all rows, levels and cage sizes. Both houses contain a feeder system that allows feed
consumption to be determined by replicate. The replicates are equipped with feed hoppers to
supply and monitor feed consumption for each individual replicate. The feed is distributed by an
automatic feeding system. Laying Hen Cage Facilities reported in this test consist of two houses
shown in Table 2.
House 5 is a standard height, windowless, forced ventilated laying house with the enriched and
enrichable colony cages that utilize a belted manure handling system. It has five rows of the FDI
Condo Layer System; three rows are Enriched Environmental Housing Systems and two rows
are Enrichable Cages. As with the other houses, each side of a row has been designated as a
bank and each bank is divided into nine 8 ft replicates per level. The replicates contain either
four 60.9 cm (24 in) cages or a single 243.8 cm (96 in) cage. The 243.8 cm (96 in) cages were
equipped with a nesting area of 60.9 x 22.9 x 30.5 cm or 731.5 cm2 (24 x 19 x 12 in or 288 in
2)
and 2 roosts of 1.9 x 5.1 x 121.9 cm (¾ x 2 x 48 in) positioned 7.6 cm (3 in) off the floor. The
cages in both houses are 66.0 cm (26 in) deep. Therefore, when the bird population is held con-
stant at 9 hens per cage in the conventional cages and 36 or 18 hens per cage in the enrichable
cages and enriched environmental housing system, the densities 175.3, 175.3 and 353.1 cm2 (69,
69, and 139 in2), respectively. House 5 population is 8,262 hens.

5
House 7 is a standard height, windowless, enclosed force ventilated house. It had four rows of a
FDI Tri-Deck Stacked Layer Cage System that utilizes a belted manure handling system. There
is 18.3 m (60 ft) of cage row with each side being designated as a bank. Each bank is divided
into six 3 m (10 ft) cage row sections consisting of four cages per section with a 60.9 cm (24 in)
space between cage sections for feed hoppers and feed recovery. This system provided for 144
experimental units each consisting of four 60.9 x 50.8 cm (24 x 20 in) cages. Two densities were
examined- 1) 125.3 cm2 (69 in
2), which allowed for 7 hens per cage for a total of 28 hens per
replicate and 2) 304.8 cm2 (120 in
2), which allowed for 4 hens per cage for a total of 16 hens per
replicate, resulting in a house total of 3,168 hens.
Table 2. Replicate numbers and Hen populations in the Enrichable Cage, Enriched Envi-
ronmental Housing, and Conventional Cage System
House Cage
Style1
Number of
Replicates
Hens per
replicate
Hen No. Total Hens
5 EC 104 36 3,744
5 ECS 79 36 2,844
5 ECS 76 18 1,368 7,956
7 C 62 28 1,736
7 C 77 16 1,232 2,968 1Cage=C; Enrichable Cage=EC; Enriched Environmental Housing System=ECS
FDA Egg Safety Plan Testing
In accordance with the Egg Safety Rule and the NCLP&MT Egg Safety Plan, the conventional
cage, enrichable cage, and enriched environmental housing environments were tested between 40
and 44 weeks of age and post-molt between 77 and 79 weeks of age for the presence of Salmo-
nella enteritidis. All of the environments at both time intervals were found to be negative for
Salmonella enteritidis.
Lighting Schedule
The lighting schedule for the hens in controlled environment facilities are outlined in Table 3.

6
Table 3. Layer House Lighting1 Schedules
Light Control Houses
5 7
Age Date Photo Period1
(Daylight Hours) (Daylight Hours)
16-17 weeks Nov 19, 2013 10.0 10.0
17 Weeks Nov. 27, 2013 11.0 11.0
18 Weeks Dec. 4, 2013 11.5 11.5
19 Weeks Dec. 11, 2013 12.0 12.0
20 Weeks Dec. 18, 2013 12.5 12.5
21 Weeks Dec. 24, 2013 13.0 13.0
22 Weeks Jan. 1, 2014 13.5 13.5
23 Weeks Jan. 8, 2014 14.0 14.0
24 Weeks Jan. 15, 2014 14.25 14.25
25 Weeks Jan. 22, 2014 14.5 14.5
26 Weeks Jan. 29, 2014 14.75 14.75
27 Weeks Feb. 5, 2014 15.0 15.0
28 Weeks Feb. 12, 2014 15.25 15.25
29 Weeks Feb. 19, 2014 15.5 15.5
30 Weeks Feb. 26, 2014 15.75 15.75
31 Weeks March 5, 2014 16.0 16.0
Molt Period
Through 69 Weeks Nov. 25, 2014 16.0 9.0
73 Weeks Dec. 23, 2014 16.0 9.0
Post-Molt 2nd
Cycle
73 Weeks Dec. 23, 2014 16.0 15.5
74 weeks Dec. 30, 2014 16.0 16.0
74 Weeks through
end of test (109 wk)
Dec. 30, 2014 to
Sept. 1, 2015 16.0 16.0
1Lighting intensity for Houses 5 and 7 was 0.5 to 0.7 ft candle at the second tier
Test Design:
The arrangement for the laying test involved a completely randomized design and the main ef-
fects were set up in a factorial arrangement. The main effects within Houses 5 and 7 were strain,
density, and production system. Following are general descriptions of the main effects:
Strain: Strains were provided from the breeders according to the rules, which govern the con-
ductance of the test. Fertile eggs were set and hatched concurrently as described in the hatch re-
port (39th
Hatch/Serology Report Vol. 39, No. 1). Additional chicks had to be acquired and de-
livered to the station to provide adequate bird numbers; the added chicks had hatch dates that
were within two days of the original hatch.

7
Density - In Houses 5 and 7, all individual replicates within each section contained one strain of
layers. The cage density in House 5 was dictated by the cage size 243.8 cm (96 in) or 60.9 cm
(24 in) and populations of 9, 36, 18 hens per cage (Table 4). In House 7, all cages were 60.9 cm
(24 in); density was dictated by either 7 or 5 hens per cage.
Table 4. Population and Density Allocations in Enrichable Cage, Enriched Environmental
Housing, and Conventional Cage System
House Hens
per Cage
Cage Size
Width Depth
Floor Space
per Bird
Feeder Space
per Bird
Water Nipples
per Cage
5 361 243.8 cm x 66.0 cm 445.2 cm
2 (69 in
2) 6.9 cm (2.7 in) 6
5 182
243.8 cm x 66.0 cm 890.3 cm2 (138 in
2) 13.5 cm (5.3 in) 6
5 9 60.9 cm x 66.0 cm 445.2 cm2 (69 in
2) 6.9 cm (2.7 in) 2
7 7 60.9 cm x 50.8 cm 445.2 cm2 (69 in
2) 8.7 cm (3.4 in) 2
7 4 60.9 cm x 50.8 cm 774.2 cm2 (120 in
2) 15.2 cm (6.0 in) 2
1Nest area was 51.6 cm2(20.3 in2)/hen , Scratch area 51.6 cm2(20.3 in2)/hen and the roost space was 6.8 cm (2.7 in)/hen 2Nest area was 103.2 cm2(40.6 in2)/hen, Scratch area 103.2 cm2(40.6 in2)/hen and the roost space was 13.5 cm (5.3 in)/hen
Layer Management (Molting):
The non-molted hens were in House 5. The full fed control replicates were maintained according
to the standard layer management program. The molt was conducted utilizing all conventionally
caged hens in House 7. The non-anorexic (NA) molt program hens were fed a low protein, low
energy diet with supplemental Ca for maintenance.
Procedural steps:
Day (-)7 Sample of birds will be weighed to determine the pre-molt weight. Target weight
loss (20% body weight) will be calculated using the pre-molt weight.
Day 0 NA program started with the remaining layer feed being removed and replaced
with the NA molt diet and daylight hours reduced. Controlled light housing, re-
duce the day length to nine hours. Remove morbid birds before commencement of
molt program.
Day +7 Body weights taken on two replicates from each strain and density in Houses 5
and 7.
Day +9 Body weights taken on two replicates from each strain and density in Houses 5
and 7. From the daily weight loss the day post initiation (Day 0) when the hens
would be predicted to reach 20% weight loss. This is verified by body weight.
Day +28 Body weights were taken then the birds were fed layer diet and light stimulated.
The NA program was designed to keep hens out of production and provide balanced nutrition for
body maintenance only. The diet is bulky, such that a full trailer load will only weigh two-thirds
of a normal full load. The birds in the replicates being molted were weighted on days 7 and 9 to
predict body weight loss. They were then weighed every other day until target weight was
reached, at which time that replicate and sister replicates were provided the resting diet until the

8
end of the molting period. The induced molt was started at 69 weeks of age. The standard
weight loss curve developed was utilized to manage the NA molt program.
Specific monitored criteria for all of the molt programs include the following: The birds were to
attain approximately 20% body weight loss ±3%. Maintain house temperature at 80± 5o F, but
the birds should not pant. House temperature management reacted to ambient environmental
temperatures and weight loss rates.
The post-molt production period light schedule (Table 2) was the guide by which the lights were
adjusted following the molt. Actual house conditions and the flock’s reaction to the NCSU Non-
Anorexic Molting Program may affect how the light stimulation was actually given. The hens
ceased egg production by Day 6-10 of the molt program. However, some of the brown-egg
strains never achieved zero egg production. The hens were allowed to consume all of the molt
feed provided between feedings. The molting ration was designed to keep hens out of produc-
tion, and to provide for skeletal and muscle maintenance. Livability was excellent with this pro-
gram.
Layer Nutrition:
Laying hen diets are identified as Diets D, E, F, G, H, I, M, N, and O, which consisted of a pre-
lay diet and a series of layer diets formulated to assure a daily protein, mineral, and amino acid
intake (Table 5). Feed was offered ad libitum in accordance with the guidelines that all birds
should receive acceptable nutrient intake at all times, depending on the bird’s age and production
rate, as shown in the Laying House Feeding Program (Table 6).
The diets provided during the molt consisted of a low protein/energy diet and a resting diet, de-
scribed in the following Molt Diet Tables.
Table 5. Minimum Daily Intake of Nutrients per Bird at Various Stages of
Production in the 39th
NCLP&MT
Production Stage Pre-Peak
> 87%
87-80% 80-70% <70%
White Egg Layers
Protein1(g/day) 19 18 17 16
Calcium (g/day) 4.0 4.1 4.2 4.3
Lysine (mg/day 820 780 730 690
TSAA (mg)day) 700 670 630 590
Brown Egg Layers
Protein1(g/day) 20 19 18 17
Calcium (g/day) 4.0 4.0 4.1 4.2
Lysine (mg/day 830 820 780 730
TSAA (mg)day) 710 700 670 630 1 If the egg production is higher than predicted values, protein intake should be increased by 1%
Note: House temperatures dictate the body maintenance demand of the hen if the house temperature is 75 to 80°F feed
protein content should be increased accordingly to compensate for metabolic heat needed to maintain a homeostatic
body temperature. If the house temperature is at or above 85°F, no adjustment is needed.

9
Table 6 : NCLP&MT Laying House Feeding Program
Consumption Per Diet Fed
Rate of Production (kg/100 Birds/Day) White Egg Strains Brown Egg Strains
Weeks 15-17
< 9.52
D
D
Pre-Peak and > 90%
< 9.52 - 10.43
10.43 - 12.20
12.25 ->13.11
D
E
F
E
F
G
90-80%
10.43 - 11.29
11.34 - 12.20
12.25 ->13.11
F
G
H
G
H
I
70-80%
10.43 - 11.29
11.34 - 12.20
12.25 ->13.11
H
I
M
I
M
N
< 70%
10.43 - 11.29
11.34 - 12.20
12.25 ->13.11
M
N
O
N
O
O Note: Low house temperatures and egg production higher than breeder guides for any given hen age will require an adjust-
ment to the dietary phase feeding program to ensure the hens are in a positive nutrient status.

10
Table 7. 39th
NCLP&MT Laying Periods Feed Formulations1 D through H
Ingredients D E F G H
Corn 1054.24 1166.03 1202.7 1240.88 1285.39
Soybean meal 637.29 564.55 533.71 506.44 473.06
Fat (Lard) 10.00 10.00 15.68
D.L. Methionine 3.41 2.92 2.31 2.04 1.80
Soybean oil 61.8 25.90 36.29 25.06
Ground Limestone 124.15 122.36 121.69 110.55 111.82
Coarse Limestone 70.00 70.00 70.00 75.00 75.00
Bi-Carbonate 2.00 2.00 2.00 3.00 2.00
Phosphate Mono/D 21.93 21.50 17.93 26.03 23.89
Salt 6.96 6.41 5.88 5.00 5.48
Vit. premix 1.00 1.00 1.00 1.00 1.00
Min. premix 1.00 1.00 1.00 1.00 1.00
HyD3 Broiler (62.5 mg/lb) 0.50
Prop Acid 50% Dry 1.00 1.00 1.00 1.00 1.00
T-Premix 1.00 1.00 1.00 1.00 1.00
.06% Selenium Premix 1.00 1.00 1.00 1.00 1.00
Choline Cl 60% 1.62 1.94 1.59 1.00 0.87
Avizyme 1.00 1.00
Ronozyme P-CT 540% 0.40 0.40 0.40
Total 2000.00 2000.00 2000.00 2000.00 2000.00
Calculated Analysis
Protein % 19.43 18.10 17.50 17.00 16.37
ME kcal/kg 2926.0 2904.0 2882 2860.0 2843.0
Calcium % 4.10 4.05 4.00 3.95 3.95
A. Phos. % 0.45 0.44 0.40 0.38 0.35
Lysine % 1.10 1.00 0.96 0.91 0.87
TSAA % 0.80 0.74 0.69 0.66 0.63 1Feeds were manufactured by Southern States

11
Table 8. 39th
NCLP&MT Laying Periods Feed Formulations I through O
Ingredients I M N O
Corn 1330.70 1315.29 1303.73 1290.76
Soybean meal 440.37 417.79 378.54 337.65
Wheat Midds 39.27 89.80 145.56
D.L. Methionine 1.56 1.24 1.14 0.78
Lysine 78.8% 2.23 0.10
Ground Limestone 115.69 119.22 123.59 124.94
Coarse Limestone 75.00 75.00 75.00 75.00
Bi-Carbonate 2.00 2.00 2.00 2.00
Phosphate Mono/D 21.74 19.89 16.49 14.00
Salt 5.20 5.10 4.71 4.31
Vit. premix 1.00 1.00 1.00 1.00
Min. premix 1.00 1.00 1.00 1.00
Prop Acid 50% Dry 1.00 1.00 1.00 1.00
T-Premix 1.00 1.00 1.00 1.00
.06% Selenium Premix 1.00 1.00 1.00 1.00
Choline Cl 60% 0.52 0.10
Total 2000.00 2000.00 2000.00 2000.00
Calculated Analysis
Protein % 15.87 15.49 14.93 14.37
ME kcal/kg 2821.9 2800.0 2777.8 2755.8
Calcium % 4.00 4.05 4.10 4.10
A. Phos. % 0.33 0.31 .28 0.26
Lysine % 0.91 0.80 0.75 0.71
TSAA % 0.60 0.58 0.56 0.53 1Feeds were manufactured by Southern States

12
Table 9. 39th
NCLP&MT Laying Periods Feed Formulations Molt and Resting
Diets
Ingredient Molt Diets
Low ME Resting
Corn 702.50 1427.70
Soybean Hulls 1164.77 226.00
Soybean Meal 48% 117.00
Wheat Midds 18.26 186.50
Coarse Limestone 17.78 16.50
Phosphate Mono/D 69.84 4.00
Salt 9.16 5.00
Methionine 2.69 1.30
Vit. premix 1.00 1.00
Min. premix 1.00 1.00
T - Premix 1.00 1.00
Fat 9.99 10.00
MYC-OUT 65 1.00 2.00
0.06% Sel Premix 1.00 1.00
Total 2000 2000
Calculated Analysis
Protein % 9.92 11.75
Me kcal/kg 1650 2859
Calcium % 1.33 3.80
T. Phos % 0.88 0.44
Lysine % 0.42 0.55
TSAA % 0.35 0.49
13
Data Collection Schedule and Procedures:
Age at 50% Production (Maturity): The first day at which the birds in the individual replicates
achieved 50% production.
Egg Production: All eggs that had the potential of being marketed were credited toward the test
replicates egg production, regardless of the shell condition at the time of collection. All eggs
were collected and recorded daily. Egg production was summarized at twenty-eight day inter-
vals and was calculated and reported on a Hen-Housed and Hen-Day basis.
There were unexpected behaviors in the enriched environmental housing system related to
broody behavior and laying of floor eggs, which may have influenced the overall performance of
the hens in those replicates. In order to mitigate these behavioral issues, the frequency of egg
collection was increased to minimize number of eggs the hens could interact with. There was
egg breakage within these replicates; the broken egg numbers could not be captured.
Egg Weight: At twenty-eight day intervals, all eggs produced in the previous 24-hour period
were weighed and sorted by size (see egg size distribution). Percentages of eggs within each size
category, average egg weight (g), and egg mass (g) were calculated and reported and used to cal-
culate egg income.
Egg Quality: At twenty-eight day intervals, all eggs produced within the previous 24-hours were
examined by candling light and graded according to current USDA standards for egg quality.
Eggs were graded in the pilot processing facility and handled as they would be in a commercial
off-line facility. From 17 to 21 weeks of age (period 1), statistical estimates were made for those
replicates where quality information was missing due to late onset of maturity from sister repli-
cates. Broody behavior was displayed in many replicates in all of the housing environments,
which resulted in hens sitting in the nests longer and attempting to pull eggs back into the nesting
areas from egg trays.
Egg Size Distribution: At twenty-eight day intervals, all eggs produced within the previous 24
hours were weighed and sorted according to current USDA standards for egg size. From 17 to 21
weeks of age (period 1), statistical estimates were made for those replicates where size distribu-
tions were missing due to late onset of maturity from sister replicates.
Egg Income: Egg income was calculated using current production year calendar and applying a 3
year average egg price on egg production and quality evaluation.
Feed Consumption and Conversion: All feed offered for consumption was recorded for each rep-
licate. At twenty-eight day intervals, feed not consumed was weighed back and feed consump-
tion was calculated. Daily feed intake (kg per 100 hens per day) was calculated and reported for
each strain.
The layer diets were reformulated to meet the flock nutrient needs based upon data from
previous test reports. Based on the nutrient analysis conducted on each load of feed, the protein
and Ca levels were in accordance with the calculated analysis. However, in the extensive envi-
ronments where the hen activity levels were greater due to the availability of space to move with-
in the environments, there appears to be a change in the partitioning of nutrients. Even though

14
the diets were formulated to meet the nutritional needs of the hens for optimal performance, there
were pauses in the early stages of the production cycle indicating a need for additional nutrients
in the diet. This was more pronounced in this test with the reduced daily feed consumption rates
and increased bird floor space allowances for the environments to meet recommended density
standards.
Feed Costs: Feed costs were based on the actual current feed prices for each feed delivery which
were calculated and summarized for the complete production cycle.
Body weights: Birds were weighed and weights recorded at housing (17 weeks), end of 1st cycle
(69 weeks), start of the 2nd
cycle (73 weeks), and at the end of the 2nd
cycle (109 weeks of age).
Body weight gain for the 1st cycle was calculated and reported for each strain. In the Molt peri-
od, lowest body weight, percent weight loss, and 73 week body weights were taken or calculated
and reported for each strain. The weight gain during the 2nd
cycle was calculated along with the
overall weight gain.
Mortality: All mortalities were recorded daily. Obvious accidents were not included in reported
mortalities.
Statistical Analyses and Separation of Means:
All data were subjected to ANOVA utilizing the GLM procedure of JMP11 (SAS, 2014), with
main effects of strain, density, and production system used herein. Period was accounted for in
the model within each of the production systems. Separate analyses were conducted for white
and brown-egg strains, the densities within production systems and between the enrichable and
enriched colony housing system. Within each production system the Strain and Strain x Densi-
ty/Housing System interactions were tested for significance. The LSMeans differences from the
GLM Procedure were separated via the Tukey HSD option. Comparisons of overall production
systems of Density or Housing System were tested for significance and their LS Means from the
GLM Procedure were separated via the Student’s t option. Significant differences (P < 0.01)
within white and brown-egg strains are noted by differing letters among columns of means.
DESCRIPTION OF DATA TABLE STATISTICS
First cycle performance of white and brown-egg strains in the three production systems are re-
ported from 119-483 days of age (17-69 weeks), the molt from 483-511 days of age (69-73
weeks), second cycle from 511-763 days of age (73-109 weeks), and 119-763 days of age (17-
109 weeks) for comparative purposes. Conventional cage systems and densities are shown for
the first cycle in Table 13 to 18, molt period performance Tables 19 to 24, second cycle in Tables
25 to 30, overall performance in Tables 31 to 36, and weight loss data summary of the white and
brown egg strains are shown on Tables 37 and 38. The comparison of the Enrichable and En-
riched Environmental Housing System are shown for the first cycle in Table 39 to 44, molt peri-
od performance Tables 45 to 50, second cycle in Tables 51 to 56, overall performance in Tables
57 to 62, and weight loss data summary of the white and brown egg strains are shown on Tables
63 and 64.
The comparison of the Enrichable and Enriched Environmental Housing System comparing den-

15
sities are shown for the first cycle in Table 65 to 70, molt period performance Tables 71 to 76,
second cycle in Tables 77 to 82, overall performance in Tables 83 to 88, and weight loss data
summary of the white and brown egg strains are shown on Tables 89 and 90.
Breeder (Strain): Short identification codes developed for strain and breeder of the stock are
shown in Table 1 and 85.
Hen Housed Eggs per Bird: The total number of eggs produced divided by the number of birds
housed at 119 days.
Hen Day Egg Production: The average daily number of eggs produced per 100 hens per day. Hen
Day Production graphs for each strain, density and environment are shown in Figures 1 through
37.
Egg Mass: The average daily production of egg mass in grams per hen day.
Mortality: The percentage of birds which died between 119 through 483 days of age (1st Cycle)
and 483 through 511 (Molt) which are reported separately. The hens in the Enrichable Cages
and Enriched Environmental Housing System were not molted but the period 483 to 511 days are
reported separately for comparative purposes.
Feed Consumption: The kilograms of feed consumed daily per 100 hens. Feed consumption
graphs for each strain, density and environment are shown in Figures 1 through 37.
Feed Conversion: The grams of egg produced per gram of feed consumed.
Egg Weight: The average egg weight (g) for each period sampled. Weight of all eggs collected
from previous 24-hours divided by the number of eggs collected.
Egg Income: The income from egg production per hen housed for the first cycle was calculated
using the 3 year regional average egg prices November 27, 2011 to December 25, 2014. The
second cycle egg prices used the September 3, 2012 to September 3, 2015 regional average egg
prices.
Table 10. Three Year Regional Average Egg Prices
Grade Size $$/Dozen 1st Cycle $$/Dozen 2
nd Cycle
A Extra Large 1.4445 1.6188
A Large 1.4179 1.5869
A Medium 1.1385 1.3004
A Small 0.9408 1.0247
A1 Pee Wee 0.4612 0.5123
B2 All 0.7367 0.8410

16
Table 10. Three Year Regional Average Egg Prices
Grade Size $$/Dozen 1st Cycle $$/Dozen 2
nd Cycle
Cracks2 All 0.7367 0.8410
1Prices are estimates based upon the formula provided by D.D. Bell (Small x 0.5) 2Prices are estimates based upon the formula provided by D.D. Bell (Large x 0.53)
The regional weighted average prices for small lots was obtained from the, USDA Grade A and
Grade A, white eggs in cartons, from nearby retail outlets of eggs based in North Carolina
(USDA-AMS, RA_PY001). The egg price used for the eggs from House 7 where the hens were
molted were valued using the B grade price. The value of Pee Wee Eggs was based upon the
formula of “Pee Wee value = (Price of Small eggs x 0.5) and under grade eggs (Grade B and
Cracks) was based upon the formula “under grade value = (Price of Large eggs x 0.53). These
calculated value formulas were provided by D. D. Bell, (1990), personal communications.
Grade Information: The average grade of all eggs sampled according to USDA grading standards
over all sampling periods. Grades are established by personnel trained in USDA grading stand-
ards.
Egg Size Distribution: The following table shows the size classifications used for establishing
the USDA egg size grading. There has been blending of egg size in this test with the weight cut-
off between medium and large being 23.5. This maximizes the number of USDA large eggs just
as would occur in a commercial plant. The proportion of the eggs falling into the following size
categories are reported in the tables.
Table 11. USDA Egg Weights Used To Establish The Egg Size Distribution Weighted
for Large Eggs.
Size Category Ounces/Dozen
Pee Wee < 18
Small 18 – 21
Medium 21 - 23.5
Large 23.5 – 27
Extra Large > 27
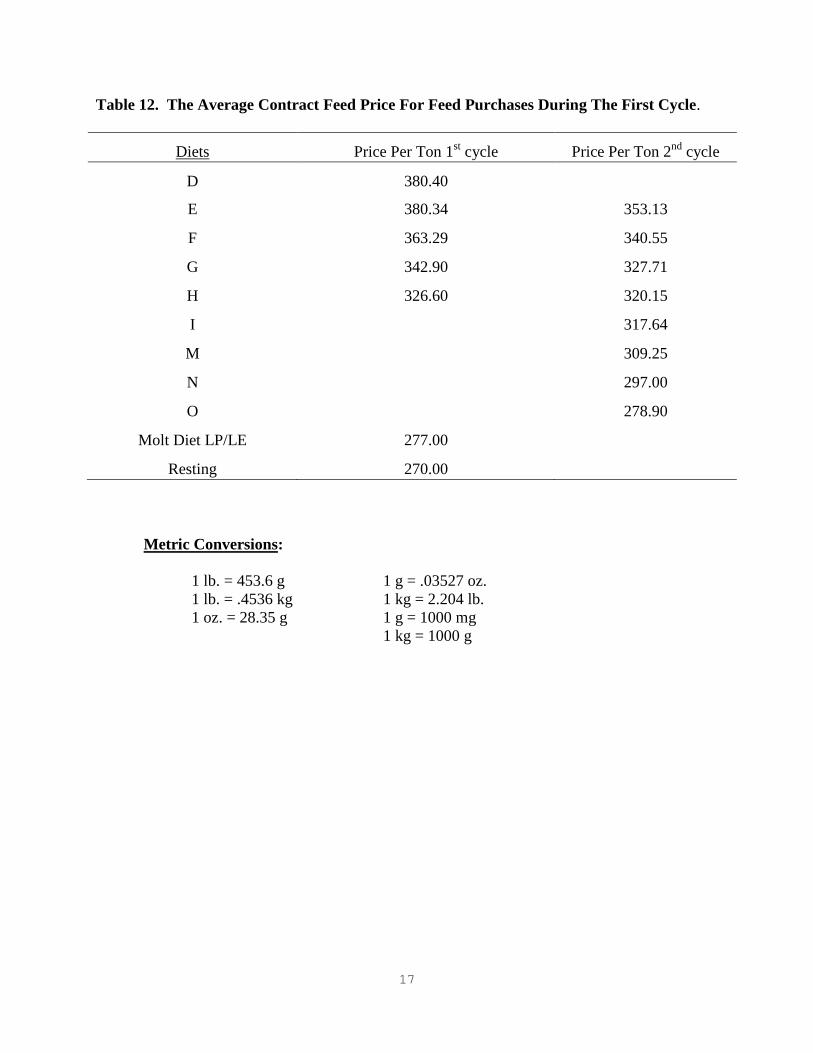
Feed Cost: The calculated feed cost per hen housed at 119 days, using the kilogram/diet con-
sumed and the average price of each diet per ton.
17
Table 12. The Average Contract Feed Price For Feed Purchases During The First Cycle.
Diets Price Per Ton 1st cycle Price Per Ton 2
nd cycle
D 380.40
E 380.34 353.13
F 363.29 340.55
G 342.90 327.71
H 326.60 320.15
I 317.64
M 309.25
N 297.00
O 278.90
Molt Diet LP/LE 277.00
Resting 270.00
Metric Conversions:
1 lb. = 453.6 g 1 g = .03527 oz.
1 lb. = .4536 kg 1 kg = 2.204 lb.
1 oz. = 28.35 g 1 g = 1000 mg
1 kg = 1000 g

18
TABLE 13. EFFECT OF WHITE EGG STRAIN AND DENSITY ON PERFORMANCE OF HENS IN THE 39th
NCLP&MT (119-483 DAYS) IN CONVENTIONAL CAGES
Eggs
Age at
Feed Feed Per Bird Egg Egg
50%
Breeder Density1 Consumption Conversion Housed Production Mass Mortality
Production
(Strain) (in2/hen) (kg/100/hen/d) (g egg/g feed)
(HD%) (g/HD) (%) (Days)
Bovans 69 10.18efghi
0.501bcdef
310.55abcd
85.33bcdefg
51.79fghi
2.70 144.25abcdef
White 120 11.02abcd
0.490defg
315.45efg
86.64abcde
53.80bcdef
4.70 142.75abcdef
Average 10.60AB
0.495BC
313.00AB
85.99CDE
52.79DE
3.70 143.50BCDE
Shaver 69 9.60ij
0.543a
316.70abc
86.93abcd
52.88efghi
4.48 140.50f
White 120 10.10fghij
0.539ab
325.00a
89.32a
54.22bcde
1.58 140.75ef
Average 9.83DE
0.541A
320.85A
88.14AB
53.55CD
3.02 140.63F
Dekalb 69 10.33defghi
0.503abcdef
314.97abcd
86.50abcde
52.79efghi
3.17 142.67abcdef
White 120 10.96abcde
0.492defg
321.12ab
88.23ab
54.79abcde
3.12 141.75cdef
Average 10.64AB
0.497BC
318.04A
87.37ABC
53.79CD
3.14 142.21CDEF
Babcock 69 9.98fghij
0.546a
320.60abc
88.12-abc
55.36abc
1.20 141.67bcdef
White 120 11.28ab
0.495cdefg
324.72a
89.22a
56.45a
1.58 140.75ef
Average 10.63AB
0.521AB
322.66A
88.67A
55.90A 1.39 141.21
EF
ISA 69 10.11efghij
0.529abcd
314.27abcd
86.19abcdef
53.89bcdef
3.97 143.67abcdef
B-400 120 11.05abcd
0.493defg
314.90abcd
86.45abcde
54.70abcde
1.58 144.50abcdef
Average 10.58AB
0.511BC
314.58AB
86.32BCD
54.30BC
2.77 144.08ABCD
Hy-Line 69 9.28j
0.525abcde
296.37bcd
81.29hij
49.46jkl
3.20 146.33ab
W-36 120 10.72bcdef
0.458g
300.02abcd
82.29ghij
49.28kl
2.08 146.25a
Average 10.00CDE
0.492C
298.19BC
81.79F
49.37G
2.64 146.29A
Hy-Line 69 9.24j
0.502bcdefg
288.27d
79.07j
46.88m
3.57 145.00abcde
CV-26 120 9.92ghij
0.479fg
293.70cd
80.69ij
47.72lm
0 144.50abcdef
Average 9.58E
0.490C
290.98C
79.88F
47.30H
1.78 144.75ABC
Hy-Line 69 9.78hij
0.512abcdef
302.33abcd
82.85fghi
50.67ijk
7.57 146.33ab
CV-24 120 10.67bcdefg
0.496cdefg
316.92abc
86.85abcd
53.35cdefg
9.40 142.25abcdef
Average 10.22BCD
0.504BC
309.63AB
84.85DE
52.01EF
8.48 144.29ABCD
Hy-Line 69 9.69ij
0.520abcdef
304.03abcd
83.35efghi
51.01hijk
5.17 142.33abcdef
CV-22 120 10.61bcdefgh
0.484efg
308.82abcd
84.76defg
51.45ghij
4.70 141.25def
Average 10.15BCD
0.502BC
306.43ABC
84.06E
51.21F
4.93 141.79DEF
Lohmann 69 10.05fghij
0.526abcde
314.50abcd
86.25abcdef
52.90cdefghi
5.93 144.67abcdef
LSL Lite 120 11.22abc
0.487defg
319.85ab
87.92abc
55.07abcd
1.58 145.75abc
Average 10.64AB
0.507BC
317.18A
87.09ABC
54.03BCD
3.75 145.21AB
H&N 69 9.85ghij
0.536abc
308.80abcd
84.74cdefgh
53.32cdefgh
4.77 145.33abcd
Nick Chick 120 11.15abcd
0.497cdefg
325.48a
89.35a
56.40a
4.70 144.00abcdef
Average 10.50ABC
0.517ABC
317.14A
87.04ABC
54.86ABC
4.73 144.67ABC
Novogen 69 10.40cdefghi
0.520abcdef
316.03abcd
86.52abcde
55.05abcde
5.97 145.33abcd
White 120 11.58a
0.482fg
326.87ab
88.69a
55.75ab
6.28 144.25abcdef
Average 10.99A
0.501BC
319.95A
87.60ABC
55.37AB
6.12 144.79ABC
All 69 9.87 0.522Z
308.95Z
84.76Z
52.17 4.30 144.00Y
Strains 120 10.85 0.491Y
315.82Y
86.70Y
53.60 3.44 143.23Z
1All strains were housed such that each strain is equally represented in each density.
ABCDEF - Different letters denote significant differences (P<.01), comparisons made among strain average values.
abcdefghijklm - Different letters denote significant differences (P<.01) in the strain*density interactions.
YZ - Different letters denote significant differences (P<.01), comparisons made among density average values. Mortality percentage prior to analyzes was transformed in Square Root Asin

19
TABLE 14. EFFECT OF WHITE EGG STRAIN AND DENSITY ON EGG WEIGHT AND EGG SIZE
DISTRIBUTION OF HENS IN THE 39th NCLP&MT (119-483 DAYS) IN CONVENTIONAL
CAGES
Egg Pee
Extra
Breeder Density1 Weight Wee Small Medium Large Large
(Strain) (in2/hen) (g/egg) (%) (%) (%) (%) (%)
Bovans 69 59.04efgh
0 8.18 9.57ab
26.21a
55.61ef
White 120 61.06abcd
0 4.96 8.07ab
19.94abcd
67.04abc
Average 60.05BCDE
0 6.57 8.82ABC
23.08 61.33BCDE
Shaver 69 59.66cdefgh
0 6.71 9.27ab
26.09ab
57.69def
White 120 59.12defgh
0 5.13 9.41ab
25.17abc
60.31bcde
Average 59.39EF
0 5.92 9.34ABC
25.63 59.00DE
Dekalb 69 58.93defgh
0 6.09 8.33ab
24.03abcd
61.46bcde
White 120 60.53abcdefg
0 5.45 6.46ab
20.50abcd
67.40abc
Average 59.73CDE
0 5.77 7.40ABC
22.26 64.43ABCD
Babcock 69 61.38abc
0 3.70 8.50ab
20.48abcd
67.08abcd
White 120 61.96ab
0.63 4.50 8.26ab
14.56d
71.83a
Average 61.67A
0.32 4.10 8.38ABC
17.52 69.45A
ISA 69 60.78abcdefg
0 7.20 5.19ab
19.72abcd
67.79abc
B-400 120 61.42abc
0 7.21 5.08ab
15.73cd
71.54a
Average 61.10ABC
0 7.21 5.14C
17.72 69.67A
Hy-Line 69 59.95bcdefgh
0 6.70 10.68ab
22.79abcd
59.28bcdef
W-36 120 58.66fgh
0 7.26 12.35ab
24.06abcd
55.77ef
Average 59.31EF
0 6.98 11.51AB
23.43 57.52EF
Hy-Line 69 58.50h
0 7.86 13.67a
28.92a
49.10f
CV-26 120 58.12h
0 8.36 11.72ab
25.96ab
54.02ef
Average 58.31F
0 8.11 12.72A
27.44 51.56F
Hy-Line 69 59.56cdefgh
0.84 5.33 9.52ab
26.54ab
57.61cdef
CV-24 120 59.75cdefgh
0 7.52 7.10ab
25.13abc
60.15bcde
Average 59.66DEF
0.42 6.42 8.31ABC
25.83 58.88DE
Hy-Line 69 58.77cdefgh
1.28 4.24 6.82ab
27.28a
60.26bcde
CV-22 120 59.67cdefgh
0 5.26 8.26ab
25.62ab
60.73bcde
Average 59.72CDEF
0.64 4.75 7.54ABC
26.45 60.49CDE
Lohmann 69 60.78abcdefg
0 5.23 8.19ab
22.92abcd
63.41abcde
LSL Lite 120 60.81abcde
0 4.02 7.98ab
19.71abcd
67.59abc
Average 60.69ABCD
0 4.62 8.09ABC
21.32 65.50ABC
H&N 69 60.82abcdef
0 5.23 7.94ab
20.28abcd
66.51abcd
Nick Chick 120 61.53abc
0.96 5.90 3.80b
21.25abcd
67.75ab
Average 61.18AB
0.48 5.56 5.87BC
20.77 67.13AB
Novogen 69 62.35a
0 7.29 4.39ab
15.56bcd
72.79a
White 120 61.55abc
0 6.71 5.07ab
20.38abcd
67.79ab
Average 61.95A
0 7.00 4.73C
17.97 70.29A
All 69 60.35
0.18 6.15 8.50 23.55Y 61.55
Z
Strains 120 60.13
0.13 6.02 7.80 21.50Z
64.33Y
1All strains were housed such that each strain is equally represented in each density
ABCDEF - Different letters denote significant differences (P<.01), comparisons made among strain average values.
abcdefgh - Different letters denote significant differences (P<.01) in the strain*density interactions. YZ - Different letters denote significant differences (P<.01), comparisons made among density average values

20
TABLE 15. EFFECT OF WHITE EGG STRAIN AND DENSITY ON EGG QUALITY, INCOME
AND FEED COSTS OF HENS IN THE 39th NCLP&MT (119-483 DAYS) IN
CONVENTIONAL CAGES
Grade Grade
Egg Feed
Breeder Density1 A B Cracks Loss Income Costs
(Strain) (in2/hen) (%) (%) (%) (%) ($/hen) ($/hen)
Bovans 69 94.42 2.59 2.50ab
0.48 35.00ab
15.31bcdefg
White 120 98.20 0.13 1.53ab
0.15 35.93ab
16.58abcde
Average 96.31 1.36 2.01AB
0.32 35.46ABCD
15.94AB
Shaver 69 97.61 0 2.10ab
0.29 34.79ab
14.44fg
White 120 96.14 0.15 3.71ab
0 37.20a
15.16bcdefg
Average 96.87 0.07 2.90AB
0.15 35.99ABC
14.80BC
Dekalb 69 97.42 0 2.15ab
0.43 35.62ab
15.55abcdefg
White 120 96.20 0.57 2.74ab
0.49 36.96a
16.50abcde
Average 96.81 0.28 2.45AB
0.46 36.29AB
16.03AB
Babcock 69 96.87 0.28 2.43ab
0.41 37.26a
15.01bcdefg
White 120 96.60 0.72 2.42ab
0.27 37.44a
16.98ab
Average 96.74 0.50 2.42AB
0.34 37.3A
15.99AB
ISA 69 96.89 0.25 2.35ab
0.51 35.58ab
15.23bcdefg
B-400 120 96.20 0.28 3.02ab
0.49 36.00ab
16.62abcde
Average 96.55 0.27 2.69AB
0.50 35.79ABCD
15.93AB
Hy-Line 69 96.07 0 3.19ab
0.74 33.10ab
13.97fg
W-36 120 95.31 0.32 3.77ab
0.60 33.55ab
16.12abcdef
Average 95.69 0.16 3.48AB
0.67 33.32CD
15.04BC
Hy-Line 69 96.78 0.11 2.48ab
0.63 32.45b
13.91g
CV-26 120 98.13 0.46 1.41ab
0 33.82ab
14.94cdefg
Average 97.46 0.28 1.94AB
0.31 33.13D
14.42C
Hy-Line 69 97.52 0.64 1.59ab
0.25 33.67ab
14.70defg
CV-24 120 98.42 0 1.46ab
0.12 35.31ab
16.06abcdefg
Average 97.97 0.32 1.52B
0.18 34.44BCD
15.38ABC
Hy-Line 69 95.70 0.14 4.04ab
0.12 34.43ab
14.58efg
CV-22 120 95.25 0 4.60a
0.15 35.53ab
15.98abcdefg
Average 95.47 0.07 4.32A
0.13 34.98ABCD
15.28ABC
Lohmann 69 97.64 0.24 1.92ab
0.20 35.46ab
15.13bcefg
LSL Lite 120 96.03 0 3.12ab
0.85 36.70ab
16.90abc
Average 96.84 0.12 2.52AB
0.52 36.08ABC
16.01AB
H&N 69 97.10 0.46 2.31ab
0.13 35.40ab
14.82cdefg
Nick Chick 120 97.25 0.27 1.98ab
0.50 37.34a
16.79abcd
Average 97.17 0.36 2.14AB
0.32 36.37AB
15.80ABC
Novogen 69 98.96 0.27 0.77b
0 35.51ab
15.64abcdefg
White 120 98.08 0.30 1.62ab
0 36.78ab
17.43a
Average 98.52 0.28 1.20B
0 36.15ABC
16.53A
All 69 96.92 0.42 2.32
0.35 34.85Z
14.86Z
Strains 120 96.82 0.27 2.61 0.30 36.05Y
16.34Y
1All strains were housed such that each strain is equally represented in each density.
ABCD - Different letters denote significant differences (P<.01), comparisons made among strain average values. abcdefg - Different letters denote significant differences (P<.01) in the strain*density interactions.
YZ - Different letters denote significant differences (P<.01), comparisons made among density average values.
21
1All strains were housed such that each strain is equally represented in each density. ABC - Different letters denote significant differences (P<.01), comparisons made among strain average values.
abcdefgh - Different letters denote significant differences (P<.01) in the strain*density interactions.
YZ - Different letters denote significant differences (P<.01), comparisons made among density average values.
Mortality percentage prior to analyzes was transformed in Square Root Asin
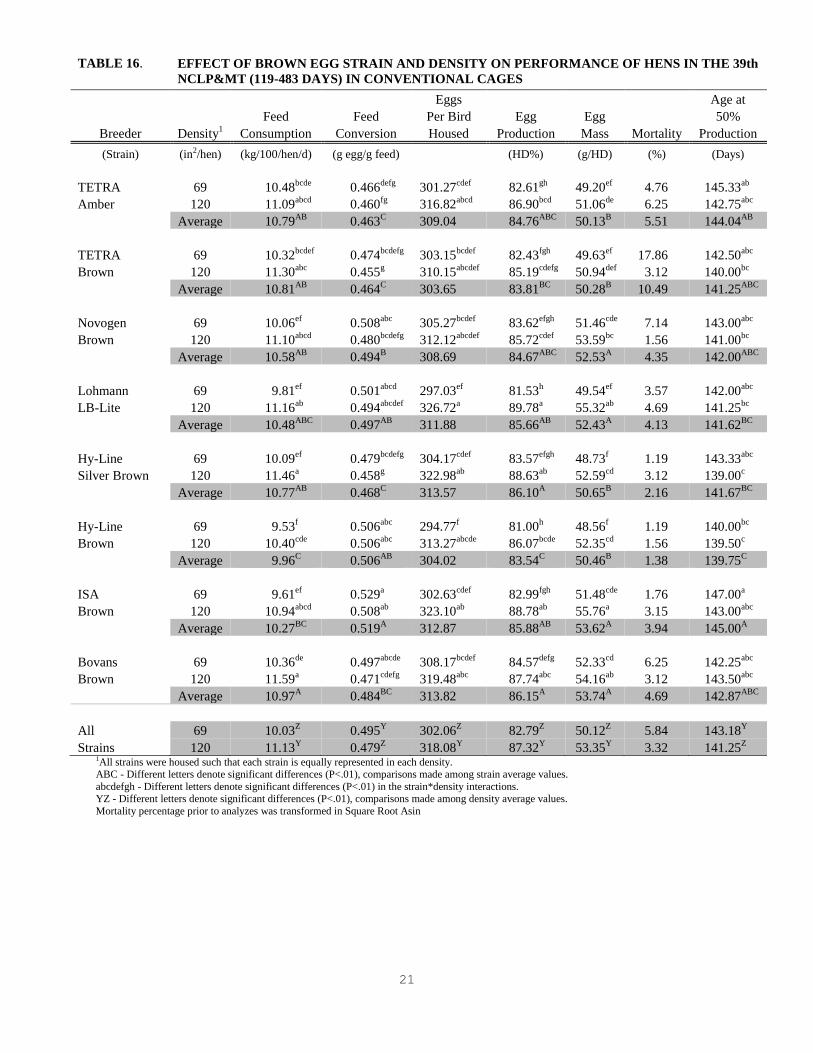
TABLE 16. EFFECT OF BROWN EGG STRAIN AND DENSITY ON PERFORMANCE OF HENS IN THE 39th
NCLP&MT (119-483 DAYS) IN CONVENTIONAL CAGES
Eggs
Age at
Feed Feed Per Bird Egg Egg
50%
Breeder Density1 Consumption Conversion Housed Production Mass Mortality Production
(Strain) (in2/hen) (kg/100/hen/d) (g egg/g feed)
(HD%) (g/HD) (%) (Days)
TETRA 69 10.48bcde
0.466defg
301.27cdef
82.61gh
49.20ef
4.76 145.33ab
Amber 120 11.09abcd
0.460fg
316.82abcd
86.90bcd
51.06de
6.25 142.75abc
Average 10.79AB
0.463C
309.04 84.76ABC
50.13B
5.51 144.04AB
TETRA 69 10.32bcdef
0.474bcdefg
303.15bcdef
82.43fgh
49.63ef
17.86 142.50abc
Brown 120 11.30abc
0.455g
310.15abcdef
85.19cdefg
50.94def
3.12 140.00bc
Average 10.81AB
0.464C
303.65 83.81BC
50.28B
10.49 141.25ABC
Novogen 69 10.06ef
0.508abc
305.27bcdef
83.62efgh
51.46cde
7.14 143.00abc
Brown 120 11.10abcd
0.480bcdefg
312.12abcdef
85.72cdef
53.59bc
1.56 141.00bc
Average 10.58AB
0.494B
308.69 84.67ABC
52.53A
4.35 142.00ABC
Lohmann 69 9.81ef
0.501abcd
297.03ef
81.53h
49.54ef
3.57 142.00abc
LB-Lite 120 11.16ab
0.494abcdef
326.72a
89.78a
55.32ab
4.69 141.25bc
Average 10.48ABC
0.497AB
311.88 85.66AB
52.43A
4.13 141.62BC
Hy-Line 69 10.09ef
0.479bcdefg
304.17cdef
83.57efgh
48.73f
1.19 143.33abc
Silver Brown 120 11.46a
0.458g
322.98ab
88.63ab
52.59cd
3.12 139.00c
Average 10.77AB
0.468C
313.57 86.10A
50.65B
2.16 141.67BC
Hy-Line 69 9.53f
0.506abc
294.77f
81.00h
48.56f
1.19 140.00bc
Brown 120 10.40cde
0.506abc
313.27abcde
86.07bcde
52.35cd
1.56 139.50c
Average 9.96C
0.506AB
304.02 83.54C
50.46B
1.38 139.75C
ISA 69 9.61ef
0.529a
302.63cdef
82.99fgh
51.48cde
1.76 147.00a
Brown 120 10.94abcd
0.508ab
323.10ab
88.78ab
55.76a
3.15 143.00abc
Average 10.27BC
0.519A
312.87 85.88AB
53.62A
3.94 145.00A
Bovans 69 10.36de
0.497abcde
308.17bcdef
84.57defg
52.33cd
6.25 142.25abc
Brown 120 11.59a
0.471cdefg
319.48abc
87.74abc
54.16ab
3.12 143.50abc
Average 10.97A
0.484BC
313.82 86.15A
53.74A
4.69 142.87ABC
All 69 10.03Z
0.495Y
302.06Z
82.79Z
50.12Z
5.84 143.18Y
Strains 120 11.13Y
0.479Z
318.08Y
87.32Y
53.35Y
3.32 141.25Z

22
1All strains were housed such that each strain is equally represented in each density. ABCDE - Different letters denote significant differences (P<.01), comparisons made among strain average values.
abcdef - Different letters denote significant differences (P<.01) in the strain*density interactions.
YZ - Different letters denote significant differences (P<.01), comparisons made among density average values.
TABLE 17. EFFECT OF BROWN EGG STRAIN AND DENSITY ON EGG WEIGHT AND EGG
SIZE DISTRIBUTION OF HENS IN THE 39th NCLP&MT (119-483 DAYS) IN
CONVENTIONAL CAGES
Egg Pee
Extra
Breeder Density1 Weight Wee Small Medium Large Large
(Strain) (in2/hen) (g/egg) (%) (%) (%) (%) (%)
TETRA 69 58.08ef
0 5.00 14.56ab
30.49abcde
49.74def
Amber 120 57.34f
0 4.60 13.12ab
34.19ab
47.56ef
Average 57.71E
0 4.80 13.84AB
32.34AB
48.65CD
TETRA 69 59.48abcdef
0 4.81 9.62abc
29.54abcde
55.73bcde
Brown 120 58.94cdef
0 3.85 8.88abc
32.19abcd
54.85bcdef
Average 59.21CD
0 4.33 9.25BC
30.86AB
55.29BC
Novogen 69 60.56abc
0.74 3.15 11.13abc
25.13bcde
59.72abcd
Brown 120 61.40a
0 2.88 6.87bc
20.33e
69.83a
Average 60.98A
0.37 3.02 9.00BC
22.73C
64.77A
Lohmann 69 60.17abcd
0 5.10 11.29abc
27.44abcde
55.99bcde
LB-Lite 120 60.24abd
2.88 3.67 4.85c
24.27cde
63.88ab
Average 60.20ABC
1.44 4.39 8.07C
25.85BC
59.93AB
Hy-Line 69 57.54f
0 4.26 16.77a
36.13a
42.72f
Silver Brown 120 58.62def
0 2.90 13.67ab
32.40abc
50.69def
Average 58.08DE
0 3.58 15.22A
34.27A
46.70D
Hy-Line 69 59.02cdef
0 2.18 10.36abc
35.00ab
52.18cdef
Brown 120 60.14abcd
0 1.98 8.62bc
26.86abcde
62.52abc
Average 59.58BC
0 2.08 9.49BC
30.93AB
57.35B
ISA 69 60.03abcde
2.56 3.85 6.69bc
24.31bcdef
62.54abc
Brown 120 61.40a
0 4.96 5.71c
20.75de
68.50a
Average 60.72AB
1.28 4.40 6.20C
22.53C
65.52A
Bovans 69 60.64abc
0 3.69 11.52abc
21.67de
63.02ab
Brown 120 61.03ab
0 3.02 7.04bc
20.52de
68.46a
Average 60.84A
0 3.36 9.28BC
21.60C
65.74A
All 69 59.89 0.41 4.00 11.49Y
28.71 55.20Z
Strains 120 59.44 0.36 3.48 8.59Z
26.56 60.79Y

23
1All strains were housed such that each strain is equally represented in each density. AB - Different letters denote significant differences (P<.01), comparisons made among strain average values.
abcde - Different letters denote significant differences (P<.01) in the strain*density interactions.
YZ - Different letters denote significant differences (P<.01), comparisons made among density average values.
TABLE 18. EFFECT OF BROWN EGG STRAIN AND DENSITY ON EGG QUALITY, INCOME
AND FEED COSTS OF HENS IN THE 39th NCLP&MT (119-483 DAYS) IN
CONVENTIONAL CAGES
Grade Grade
Egg Feed
Breeder Density1 A B Cracks Loss Income Costs
(Strain) (in2/hen) (%) (%) (%) (%) ($/hen) ($/hen)
TETRA 69 96.92 0.30 2.26 0.53 33.88cd
15.55abcde
Amber 120 97.82 0.14 2.04 0 35.19abc
16.47abc
Average 97.37 0.22 2.15 0.26 34.54AB
16.01A
TETRA 69 96.07 0.46 2.88 0.59 31.36d
15.32cde
Brown 120 97.02 0.59 2.13 0.26 34.34abc
16.76abc
Average 96.55 0.52 2.50 0.42 33.35B
16.04A
Novogen 69 97.07 0.71 1.89 0.34 33.67cd
14.93cde
Brown 120 98.14 0.12 1.47 0.26 36.53abc
16.48abc
Average 97.60 0.41 1.68 0.30 35.10AB
15.70AB
Lohmann 69 97.33 0 2.34 0.32 33.66cd
14.54de
LB-Lite 120 96.97 0.14 2.12 0.77 37.70a
16.57abc
Average 97.15 0.07 2.23 0.54 35.68A
15.56AB
Hy-Line 69 97.47 0.23 2.09 0.20 34.73abcd
15.00cde
Silver Brown 120 97.39 0.27 2.20 0.13 36.68abc
17.00ab
Average 97.43 0.25 2.15 0.16 35.70A
15.99A
Hy-Line 69 96.84 0.21 2.62 0.32 33.87cd
14.14e
Brown 120 95.28 0.54 3.87 0.30 35.89abc
15.45bde
Average 96.07 0.38 3.24 0.31 34.88AB
14.79B
ISA 69 96.41 0.85 2.54 0.19 35.00abc
14.24e
Brown 120 97.24 0.42 2.22 0.13 37.36ab
16.24abcd
Average 96.82 0.63 2.38 0.16 36.18A
15.24AB
Bovans 69 97.62 0.43 1.77 0.18 34.77abcd
15.36cde
Brown 120 96.51 0.62 2.87 0 37.39ab
17.20a
Average 97.03 0.52 2.32 0.09 36.08A
16.28A
All 69 96.97 0.40 2.30 0.33 33.87Z
14.88Z
Strains 120 97.05 0.36 2.36 0.23 36.51Y
16.52Y
24
1All strains were housed such that each strain is equally represented in each density.
ABC - Different letters denote significant differences (P<.01), comparisons made among strain average values. abcd - Different letters denote significant differences (P<.01) in the strain*density interactions.
YZ - Different letters denote significant differences (P<.01), comparisons made among density average values.
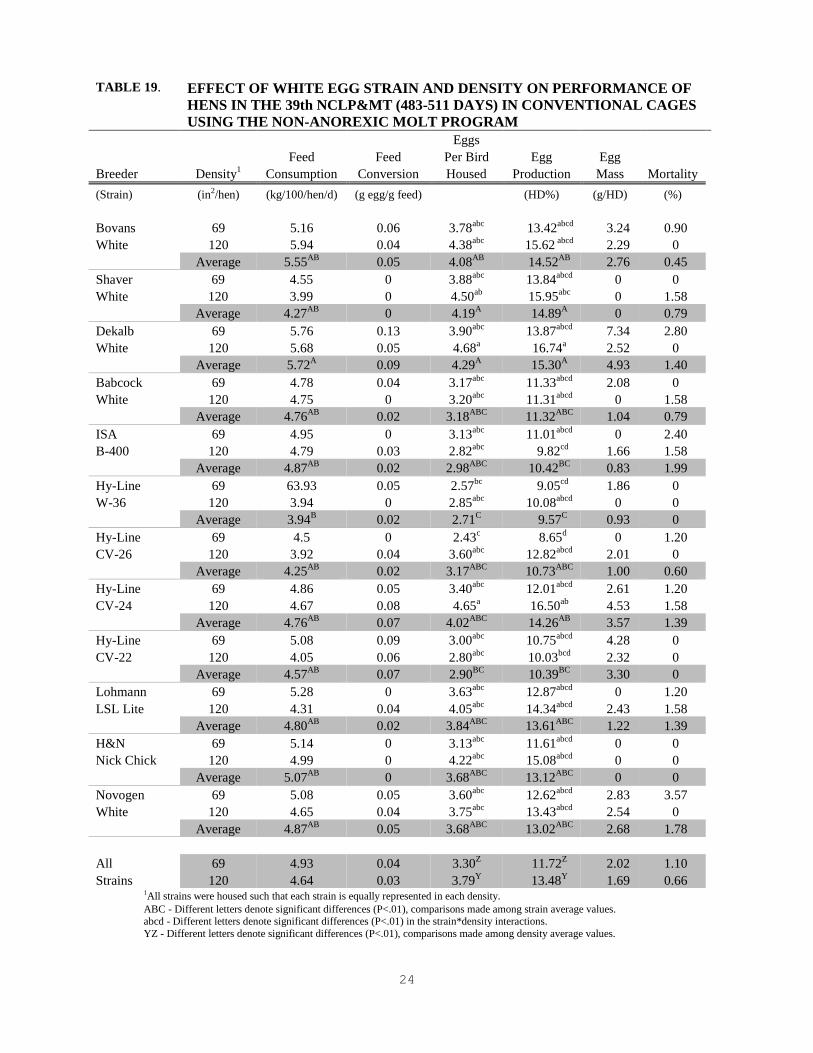
TABLE 19. EFFECT OF WHITE EGG STRAIN AND DENSITY ON PERFORMANCE OF
HENS IN THE 39th NCLP&MT (483-511 DAYS) IN CONVENTIONAL CAGES
USING THE NON-ANOREXIC MOLT PROGRAM
Eggs
Feed Feed Per Bird Egg Egg
Breeder Density1 Consumption Conversion Housed Production Mass Mortality
(Strain) (in2/hen) (kg/100/hen/d) (g egg/g feed)
(HD%) (g/HD) (%)
Bovans 69 5.16 0.06 3.78abc
13.42abcd
3.24 0.90
White 120 5.94 0.04 4.38abc
15.62 abcd
2.29 0
Average 5.55AB
0.05 4.08AB
14.52AB
2.76 0.45
Shaver 69 4.55 0 3.88abc
13.84abcd
0 0
White 120 3.99 0 4.50ab
15.95abc
0 1.58
Average 4.27AB
0 4.19A
14.89A 0 0.79
Dekalb 69 5.76 0.13 3.90abc
13.87abcd
7.34 2.80
White 120 5.68 0.05 4.68a
16.74a
2.52 0
Average 5.72A
0.09 4.29A
15.30A
4.93 1.40
Babcock 69 4.78 0.04 3.17abc
11.33abcd
2.08 0
White 120 4.75 0 3.20abc
11.31abcd
0 1.58
Average 4.76AB
0.02 3.18ABC
11.32ABC
1.04 0.79
ISA 69 4.95 0 3.13abc
11.01abcd
0 2.40
B-400 120 4.79 0.03 2.82abc
9.82cd
1.66 1.58
Average 4.87AB
0.02 2.98ABC
10.42BC
0.83 1.99
Hy-Line 69 63.93 0.05 2.57bc
9.05cd
1.86 0
W-36 120 3.94 0 2.85abc
10.08abcd
0 0
Average 3.94B
0.02 2.71C
9.57C
0.93 0
Hy-Line 69 4.5 0 2.43c
8.65d
0 1.20
CV-26 120 3.92 0.04 3.60abc
12.82abcd
2.01 0
Average 4.25AB
0.02 3.17ABC
10.73ABC
1.00 0.60
Hy-Line 69 4.86 0.05 3.40abc
12.01abcd
2.61 1.20
CV-24 120 4.67 0.08 4.65a
16.50ab
4.53 1.58
Average 4.76AB
0.07 4.02ABC
14.26AB
3.57 1.39
Hy-Line 69 5.08 0.09 3.00abc
10.75abcd
4.28 0
CV-22 120 4.05 0.06 2.80abc
10.03bcd
2.32 0
Average 4.57AB
0.07 2.90BC
10.39BC
3.30 0
Lohmann 69 5.28 0 3.63abc
12.87abcd
0 1.20
LSL Lite 120 4.31 0.04 4.05abc
14.34abcd
2.43 1.58
Average 4.80AB
0.02 3.84ABC
13.61ABC
1.22 1.39
H&N 69 5.14 0 3.13abc
11.61abcd
0 0
Nick Chick 120 4.99 0 4.22abc
15.08abcd
0 0
Average 5.07AB
0 3.68ABC
13.12ABC
0 0
Novogen 69 5.08 0.05 3.60abc
12.62abcd
2.83 3.57
White 120 4.65 0.04 3.75abc
13.43abcd
2.54 0
Average 4.87AB
0.05 3.68ABC
13.02ABC
2.68 1.78
All 69 4.93 0.04 3.30Z
11.72Z
2.02 1.10
Strains 120 4.64 0.03 3.79Y
13.48Y
1.69 0.66

25
TABLE 20. EFFECT OF WHITE EGG STRAIN AND DENSITY ON EGG WEIGHT AND EGG
SIZE DISTRIBUTION OF HENS IN THE 39th NCLP&MT (483-511 DAYS) IN
CONVENTIONAL CAGES USING THE NON-ANOREXIC MOLT PROGRAM
Egg Pee
Extra
Breeder Density1 Weight Wee Small Medium Large Large
(Strain) (in2/hen) (g/egg) (%) (%) (%) (%) (%)
Bovans 69 50.00 0 12.50 12.50 25.00ab
0
White 120 70.00 0 0 0 0b
25.00
Average 60.00 0 6.25 6.25 12.50AB
12.50
Shaver 69 59.70 0 0 0 0b
0
White 120 60.00 0 0 0 0b 0
Average 59.80 0 0 0 0B 0
Dekalb 69 53.30 0 0 0 100.00a
0
White 120 55.00 0 0 0 25.00ab
0
Average 54.60 0 0 0 62.50A
0
Babcock 69 50.00 0 16.67 0 16.67AB
0
White 120 61.30 0 0 0 0b 0
Average 55.60 0 8.33 0 8.33AB
0
ISA 69 60.80 0 0 0 0b 0
B-400 120 50.00 0 0 0 25.00ab
0
Average 55.40 0 0 0 12.50AB
0
Hy-Line 69 62.50 0 0 0 16.67ab
16.67
W-36 120 59.00 0 0 0 0b 0
Average 60.70 0 0 0 8.33AB
8.33
Hy-Line 69 59.00 0 0 0 0b 0
CV-26 120 60.00 0 0 0 25.00ab
0
Average 59.50 0 0 0 12.50AB
0
Hy-Line 69 60.00 0 0 0 0b 33.33
CV-24 120 50.00 0 25.00 0 0b 25.00
Average 55.00 0 12.50 0 0B
29.17
Hy-Line 69 55.00 0 0 0 66.67ab
0
CV-22 120 70.00 0 0 0 0b 25.00
Average 62.50 0 0 0 33.33AB
12.50
Lohmann 69 59.60 0 0 0 0b
0
LSL Lite 120 60.00 0 0 0 25.00ab
0
Average 59.80 0 0 0 12.50AB
0
H&N 69 60.40 0 0 0 0b
0
Nick Chick 120 60.70 0 0 0 0b 0
Average 60.30 0 0 0 0B
0
Novogen 69 60.00 0 0 0 0b 33.33
White 120 60.00 0 0 0 25.00ab
0
Average 60.00 0 0 0 12.50AB
16.17
All 69 57.50 0 2.43 1.04 18.75 6.94
Strains 120 59.60 0 2.08 0 10.42 6.25 1All strains were housed such that each strain is equally represented in each density
AB - Different letters denote significant differences (P<.01), comparisons made among strain average values.
ab - Different letters denote significant differences (P<.01) in the strain*density interactions

26
TABLE 21. EFFECT OF WHITE EGG STRAIN AND DENSITY ON EGG QUALITY, INCOME
AND FEED COSTS OF HENS IN THE 39th NCLP&MT (483-511 DAYS) IN
CONVENTIONAL CAGES USING THE NON-ANOREXIC MOLT PROGRAM
Grade Grade
Egg Feed
Breeder Density1 A B Cracks Loss Income Costs
(Strain) (in2/hen) (%) (%) (%) (%) ($/hen) ($/hen)
Bovans 69 50.00 0 0 0 0.65ab
0.43
White 120 25.00 0 0 0 0.75ab
0.50
Average 37.50 0 0 0 0.70AB
0.47AB
Shaver 69 0 0 0 0 0.67ab
0.38
White 120 0 0 0 0 0.77ab
0.33
Average 0 0 0 0 0.72AB
0.36AB
Dekalb 69 66.67 0 0 0 0.67ab
0.48
White 120 25.00 0 0 0 0.81a
0.48
Average 45.83 0 0 0 0.74A
0.48A
Babcock 69 33.33 0 0 0 0.54ab
0.40
White 120 0 0 0 0 0.55ab
0.40
Average 16.17 0 0 0 0.55ABC
0.40AB
ISA 69 0 0 0 0 0.54ab
0.41
B-400 120 25.00 0 0 0 0.48ab
0.40
Average 12.50 0 0 0 0.51BC
0.41AB
Hy-Line 69 33.33 0 0 0 0.44b
0.33
W-36 120 0 0 0 0 0.46ab
0.33
Average 16.17 0 0 0 0.46C
0.33B
Hy-Line 69 0 0 0 0 0.42b
0.38
CV-26 120 25.00 0 0 0 0.62ab
0.33
Average 12.50 0 0 0 0.52ABC
0.36AB
Hy-Line 69 33.33 0 0 0 0.58ab
0.41
CV-24 120 50.00 0 0 0 0.80a
0.5239
Average 41.67 0 0 0 0.69AB
0.40AB
Hy-Line 69 66.67 0 0 0 0.52ab
0.43
CV-22 120 25.00 0 0 0 0.48ab
0.34
Average 45.83 0 0 0 0.50BC
0.38AB
Lohmann 69 0 0 0 0 0.62ab
0.44
LSL Lite 120 25.00 0 0 0 0.69ab
0.36
Average 12.50 0 0 0 0.66ABC
0.40AB
H&N 69 0 0 0 0 0.54ab
0.43
Nick Chick 120 0 0 0 0 0.73ab
0.42
Average 0 0 0 0 0.63ABC
0.42AB
Novogen 69 33.33 0 0 0 0.62ab
0.42
White 120 25.00 0 0 0 0.65ab
0.39
Average 29.17 0 0 0 0.63ABC
0.41AB
All 69 26.39 0 2.77 0 0.57Z
0.41
Strains 120 18.75 0 0 0 0.65Y
0.39 1All strains were housed such that each strain is equally represented in 0each density.
ABC - Different letters denote significant differences (P<.01), comparisons made among strain average values.
ab - Different letters denote significant differences (P<.01) in the strain*density interactions YZ - Different letters denote significant differences (P<.01), comparisons made among density average values.

27
TABLE 22. EFFECT OF BROWN EGG STRAIN AND DENSITY ON PERFORMANCE OF HENS IN THE
39th NCLP&MT (483-511 DAYS) IN CONVENTIONAL CAGES USING THE NON-ANOREXIC
MOLT PROGRAM
Eggs
Feed Feed Per Bird Egg Egg
Breeder Density1 Consumption Conversion Housed Production Mass Mortality
(Strain) (in2/hen) (kg/100/hen/d) (g egg/g feed)
(HD%) (g/HD) (%)
TETRA 69 5.77ab
0.130 5.00abcd
17.92abcde
7.49 0
Amber 120 5.60ab
0.265 7.55a
26.93a
14.80 0
Average 5.69AB
0.197 6.27A
22.42A
11.14 0
TETRA 69 5.67ab
0 4.30cd
15.38bcde
0 0
Brown 120 6.40a
0.145 6.10abcd
21.91abcde
8.51 0
Average 6.04A
0.073 5.20ABC
18.65ABC
4.25 0
Novogen 69 5.87ab
0.227 6.27abcd
22.35abcd
13.29 0
Brown 120 5.31ab
0.257 6.58abc
22.95abc
13.36 3.15
Average 5.59AB
0.242 6.42A
22.65AB
13.32 1.58
Lohmann 69 4.52b
0.110 3.70d
13.20de
5.02 3.57
LB-Lite 120 5.39ab
0.280 7.18ab
25.64ab
14.98 0
Average 4.95B
0.195 5.44ABC
19.42AB
10.00 1.78
Hy-Line 69 5.52ab
0.177 5.20abcd
18.56abcde
9.73 0
Silver Brown 120 5.08ab
0.117 5.80abcd
20.71abcde
6.16 0
Average 5.30AB
0.147 5.50AB
19.63AB
7.96 0
Hy-Line 69 5.06ab
0.127 4.30cd
15.37cde
6.64 0
Brown 120 4.74b
0.085 3.52d
12.59e
4.08 0
Average 4.90B
0.106 3.91BC
13.98BC
5.38 0
ISA 69 4.74b
0.110 3.70d
13.14de
4.86 0
Brown 120 5.44ab
0.175 5.90abcd
21.12abcde
9.45 0
Average 5.09AB
0.142 4.80ABC
17.31ABC
7.16 0
Bovans 69 5.58ab
0.060 3.70d
13.20de
3.28 0.90
Brown 120 4.80ab
0.097 3.85d
13.78de
4.86 0
Average 5.19AB
0.079 3.78C
13.49C
4.07 0.45
All 69 5.34 0.118 4.52Z
16.14Z
6.29 0.56
Strains 120 5.35 0.178 5.81Y
20.70Y
9.52 0.39 1All strains were housed such that each strain is equally represented in each density.
ABC - Different letters denote significant differences (P<.01), comparisons made among strain average values. abcde - Different letters denote significant differences (P<.01) in the strain*density interactions
YZ - Different letters denote significant differences (P<.01), comparisons made among density average values.

28
TABLE 23. EFFECT OF BROWN EGG STRAIN AND DENSITY ON EGG WEIGHT AND EGG
SIZE DISTRIBUTION OF HENS IN THE 39th NCLP&MT (483-511 DAYS) IN
CONVENTIONAL CAGES USING THE NON-ANOREXIC MOLT PROGRAM
Egg Pee
Extra
Breeder Density1 Weight Wee Small Medium Large Large
(Strain) (in2/hen) (g/egg) (%) (%) (%) (%) (%)
TETRA 69 56.20 0 8.33 0 58.33 0
Amber 120 55.00 0 0 29.25 33.50 37.50
Average 55.60 0 4.17 14.63 45.92 18.75
TETRA 69 59.10 0 0 0 0 0
Brown 120 65.00 0 0 0 25.00 25.00
Average 62.00 0 0 0 12.50 12.50
Novogen 69 59.30 0 0 16.67 44.33 39.00
Brown 120 58.00 0 0 0 77.25 22.75
Average 58.60 0 0 8.33 60.79 30.88
Lohmann 69 55.80 0 0 11.00 44.33 11.00
LB-Lite 120 58.30 0 0 8.25 75.00 16.75
Average 57.00 0 0 9.63 59.67 13.88
Hy-Line 69 52.50 0 8.33 33.33 58.33 0
Silver Brown 120 60.00 0 0 0 41.75 8.25
Average 56.20 0 4.17 16.67 50.04 4.12
Hy-Line 69 61.70 0 0 0 50.00 16.67
Brown 120 50.00 0 0 0 25.00 25.00
Average 55.80 0 0 0 37.50 20.83
ISA 69 57.50 0 0 0 33.33 33.33
Brown 120 57.80 0 0 25.00 33.25 16.75
Average 57.60 0 0 12.50 33.29 25.04
Bovans 69 55.00 0 0 0 50.00 0
Brown 120 60.00 0 0 0 20.75 29.25
Average 57.50 0 0 0 35.38 14.62
All 69 57.30 0 2.08 7.62 42.33 12.50
Strains 120 58.00 0 0 7.81 41.44 22.66 1All strains were housed such that each strain is equally represented in each density.

29
TABLE 24. EFFECT OF BROWN EGG STRAIN AND DENSITY ON EGG QUALITY, INCOME
AND FEED COSTS OF HENS IN THE 39th NCLP&MT (483-511 DAYS) IN
CONVENTIONAL CAGES USING THE NON-ANOREXIC MOLT PROGRAM
Grade Grade
Egg Feed
Breeder Density1 A B Cracks Loss Income Costs
(Strain) (in2/hen) (%) (%) (%) (%) ($/hen) ($/hen)
TETRA 69 66.67 0 0 0 0.64 0.48ab
Amber 120 100.00 0 0 0 0.85 0.47ab
Average 83.33 0 0 0 0.74 0.48AB
TETRA 69 0 0 0 0 0 0.48ab
Brown 120 50.00 0 0 0 0.44 0.54a
Average 25.00 0 0 0 0.22 0.51A
Novogen 69 88.89 11.11 0 0 0.64 0.49ab
Brown 120 83.33 16.67 0 0 0.64 0.45ab
Average 86.11 13.89 0 0 0.64 0.47AB
Lohmann 69 66.67 0 0 0 0.29 0.38b
LB-Lite 120 100.00 0 0 0 0.84 0.45ab
Average 83.33 0 0 0 0.57 0.42B
Hy-Line 69 83.33 16.67 0 0 0.45 0.46ab
Silver Brown 120 50.00 0 0 0 0.34 0.43ab
Average 66.67 8.33 0 0 0.39 0.44AB
Hy-Line 69 66.67 0 0 0 0.35 0.43ab
Brown 120 25.00 25.00 0 0 0.14 0.40b
Average 45.83 12.50 0 0 0.25 0.41B
ISA 69 66.67 0 0 0 0.28 0.40b
Brown 120 75.00 0 0 0 0.51 0.46ab
Average 70.83 0 0 0 0.40 0.43AB
Bovans 69 50.00 0 0 0 0.26 0.47ab
Brown 120 37.50 12.50 0 0 0.28 0.40ab
Average 43.75 6.25 0 0 0.27 0.44AB
All 69 61.11 3.47 0 0 0.36 0.45
Strains 120 65.10 6.77 0 0 0.50 0.45 1All strains were housed such that each strain is equally represented in each density.
AB - Different letters denote significant differences (P<.01), comparisons made among strain average values.
ab - Different letters denote significant differences (P<.01) in the strain*density interactions.

30
TABLE 25. EFFECT OF WHITE EGG STRAIN AND DENSITY ON PERFORMANCE OF HENS IN THE 39th
NCLP&MT (511-763 DAYS) IN CONVENTIONAL CAGES
Eggs
Feed Feed Per Bird Egg Egg
Breeder Density1 Consumption Conversion Housed Production Mass Mortality
(Strain) (in2/hen) (kg/100/hen/d) (g egg/g feed)
(HD%) (g/HD) (%)
Bovans 69 106.69abcd
0.51 208.02 82.84abc
54.60abc
6.25
White 120 110.37abc
0.51 207.38 82.77abc
56.06abc
7.81
Average 108.53ABC
0.51 207.70A
82.81A
55.33A
7.03
Shaver 69 102.62bcde
0.53 203.42 81.79abc
53.71abc
5.36
White 120 103.89bcde
0.54 211.72 85.04ab
56.05abc
3.12
Average 103.26CDE
0.54 207.58AB
83.41A
54.88A
4.24
Dekalb 69 106.76abcd
0.53 215.10 85.44ab
56.15abc
6.35
White 120 110.03abc
0.48 200.20 80.49abc
53.56abc
3.12
Average 108.90ABC
0.51 207.65AB
82.97A
54.86A
4.74
Babcock 69 107.96abc
0.52 204.93 82.40abc
55.41abc
3.57
White 120 112.38ab
0.48 199.65 80.38abc
54.30abc
6.25
Average 110.17ABC
0.50 202.29ABC
81.39ABC
54.85A
4.91
ISA 69 102.76bcde
0.54 207.83 83.21abc
54.34abc
5.16
B-400 120 105.88abcd
0.50 199.52 80.47abc
53.01abc
1.56
Average 104.32BCDE
0.52 203.68ABC
81.84AB
53.68AB
3.36
Hy-Line 69 93.85e
0.52 184.53 74.41bc
49.14bc
6.35
W-36 120 105.46abcd
0.48 186.82 75.16bc
49.82bc
8.33
Average 99.65DE
0.50 185.68BC
74.79BC
49.48BC
7.34
Hy-Line 69 95.33de
0.50 183.23 74.01c
47.71c
2.38
CV-26 120 100.19cde
0.49 184.00 74.17c
48.21c
3.12
Average 97.76E
0.50 183.67C
74.09C
47.96C
2.75
Hy-Line 69 103.75bcde
0.54 208.47 82.82abc
55.42abc
5.95
CV-24 120 107.48abc
0.53 213.58 84.78abc
56.65ab
9.38
Average 105.62ABCD
0.54 211.02A
83.80A
56.04A
7.66
Hy-Line 69 104.63abcde
0.51 198.93 79.79abc
53.01abc
1.19
CV-22 120 106.30abcd
0.52 204.85 82.08abc
54.88abc
0
Average 105.47ABCD
0.52 201.89ABC
80.93ABC
53.94AB
0.60
Lohmann 69 109.74abc
0.52 213.67 85.28ab
57.32ab
5.95
LSL Lite 120 115.18a
0.50 212.85 85.05ab
58.07a
6.25
Average 112.46A
0.51 213.26A
85.16A
57.69A
6.10
H&N 69 104.81abcde
0.54 209.00 83.35abc
56.08abc
5.95
Nick Chick 120 111.63ab
0.53 217.42 86.86a
59.07a
3.12
Average 108.22ABC
0.54 213.21A
85.11A
57.58A
4.54
Novogen 69 111.24abc
0.54 214.87 85.51ab
59.14a
1.19
White 120 110.18abc
0.54 215.65 86.49a
57.95a
1.56
Average 110.71AB
0.54 215.26A
86.00A
58.54A
1.38
All 69 104.18Y 0.52 204.33 81.74 54.33 4.63
Strains 120 108.33Z
0.51 204.48 81.98 54.80 4.47 1All strains were housed such that each strain is equally represented in each density.
ABCDE - Different letters denote significant differences (P<.01), comparisons made among strain average values.
abcde - Different letters denote significant differences (P<.01) in the strain*density interactions.
YZ - Different letters denote significant differences (P<.01), comparisons made among density average values. Mortality percentage prior to analyzes was transformed in Square Root Asin

31
TABLE 26. EFFECT OF WHITE EGG STRAIN AND DENSITY ON EGG WEIGHT AND EGG SIZE
DISTRIBUTION OF HENS IN THE 39th NCLP&MT (511-763 DAYS) IN CONVENTIONAL
CAGES
Egg Pee
Extra
Breeder Density1 Weight Wee Small Medium Large Large
(Strain) (in2/hen) (g/egg) (%) (%) (%) (%) (%)
Bovans 69 65.97bcdefg
0 0 0.75 9.60 89.05
White 120 67.80abcd
0 0 0.73 4.15 94.50
Average 66.89ABC
0 0 0.74 6.87AB
91.78AB
Shaver 69 65.66defg
0 0 0.73 7.88 90.85
White 120 65.82cdefg
0 0 0.55 7.32 92.12
Average 65.74CDE
0 0 0.64 7.60AB
91.49AB
Dekalb 69 65.75cdefg
0 0 0.20 6.53 93.00
White 120 66.48bcdefg
0 0.15 0 3.88 95.75
Average 66.11BCDE
0 0.08 0.10 5.20AB
94.38AB
Babcock 69 67.13abcdefg
0 0 0.27 7.23 92.07
White 120 67.51abcde
0 0 0 5.52 94.08
Average 67.32AB
0 0 0.13 6.38AB
93.07AB
ISA 69 65.13efg
0 0 0 11.07 88.07
B-400 120 65.45efg
0 0 0.62 12.58 86.58
Average 65.29DE
0 0 0.31 11.82A
87.32B
Hy-Line 69 66.04bcdefg
0 0 0.70 7.67 91.20
W-36 120 66.36bcdefg
0 0 0.68 7.25 91.50
Average 66.20BCDE
0 0 0.69 7.46AB
91.35AB
Hy-Line 69 64.50g
0 0 0.20 9.40 89.90
CV-26 120 64.97fg
0 0 0.42 8.52 90.25
Average 64.74E
0 0 0.31 8.96AB
90.08AB
Hy-Line 69 66.87abcdefg
0 0 0.17 7.47 91.77
CV-24 120 66.84abcdefg
0 0 0.20 7.50 92.18
Average 66.86ABCD
0 0 0.18 7.48AB
91.97AB
Hy-Line 69 66.48abcdefg
0 0 0 5.87 93.80
CV-22 120 67.00abcdefg
0 0 0.18 3.08 96.10
Average 66.74ABCD
0 0 0.09 4.47B
94.95A
Lohmann 69 67.18abcdefg
0 0 0.17 5.97 93.37
LSL Lite 120 68.24ab
0 0 0.25 7.62 92.18
Average 67.71AB
0 0 0.21 6.80AB
92.77AB
H&N 69 67.22abcdef
0 0 0 5.90 93.17
Nick Chick 120 68.06abc
0 0 0 4.30 95.58
Average 67.64AB
0 0 0 5.10AB
94.37AB
Novogen 69 69.12a
0 0 0 2.43 97.37
White 120 66.92abcdefg
0 0 1.08 7.10 91.82
Average 68.02A
0 0 0.54 4.77AB
94.60AB
All 69 66.42 0 0 0.26 7.25 91.97
Strains 120 66.79 0 0.01 0.39 6.57 92.72 1All strains were housed such that each strain is equally represented in each density
ABCDE - Different letters denote significant differences (P<.01), comparisons made among strain average values.
abcdefg - Different letters denote significant differences (P<.01) in the strain*density interactions.

32
TABLE 27. EFFECT OF WHITE EGG STRAIN AND DENSITY ON EGG QUALITY, INCOME
AND FEED COSTS OF HENS IN THE 39th NCLP&MT (511-763 DAYS) IN
CONVENTIONAL CAGES
Grade Grade
Egg Feed
Breeder Density1 A B Cracks Loss Income Costs
(Strain) (in2/hen) (%) (%) (%) (%) ($/hen) ($/hen)
Bovans 69 95.35 0.22 4.82 0.62 25.53ab
10.22abc
White 120 95.97 0.50 2.87 0.87 25.23ab
10.52abc
Average 95.16 0.36 3.84 0.74 25.38A
10.37AB
Shaver 69 95.31 0.36 3.76 0.58 24.84ab
9.74abc
White 120 96.47 0 3.52 0 25.94ab
9.96abc
Average 95.89 0.18 3.64 0.29 25.39A
9.85ABC
Dekalb 69 96.57 0.14 2.91 0.62 26.21ab
10.23abc
White 120 96.54 0.68 2.50 0.28 24.46ab
10.57ab
Average 96.56 0.41 2.70 0.45 25.34AB
10.40AB
Babcock 69 96.70 0 2.86 0.44 24.94ab
10.33abc
White 120 95.93 0.80 2.78 0.48 24.33ab
10.74ab
Average 96.32 0.40 2.82 0.46 24.63ABC
10.53AB
ISA 69 95.72 0.59 3.01 0.70 25.23ab
9.73abc
B-400 120 96.29 0.36 3.12 0.22 24.34ab
9.89abc
Average 96.00 0.47 3.07 0.46 24.78ABC
9.85ABC
Hy-Line 69 96.80 0 2.78 0.61 22.28ab
8.97c
W-36 120 96.30 0.28 2.75 0.67 22.63ab
10.11abc
Average 96.55 0.14 2.77 0.64 22.46BC
9.54BC
Hy-Line 69 95.48 0.30 3.64 0.89 22.32ab
9.17bc
CV-26 120 97.08 0.21 1.90 0.82 22.16b
9.60abc
Average 96.28 0.25 2.77 0.85 22.24C
9.38C
Hy-Line 69 96.08 0.54 2.78 0.59 25.38ab
10.03abc
CV-24 120 96.57 0 3.24 0.19 26.10ab
10.26abc
Average 96.33 0.27 3.01 0.39 25.74A
10.14ABC
Hy-Line 69 95.90 0.20 3.60 0.31 24.32ab
10.05abc
CV-22 120 94.04 0.18 5.40 0.38 25.17ab
10.26abc
Average 94.97 0.19 4.50 0.35 24.74ABC
10.16ABC
Lohmann 69 95.06 0.29 4.17 0.49 26.17ab
10.52abc
LSL Lite 120 95.43 0 4.56 0.21 26.17ab
10.96a
Average 95.25 0.14 4.36 0.35 26.17A
10.74A
H&N 69 96.44 0.37 2.22 0.97 25.23ab
9.97abc
Nick Chick 120 96.41 0.57 2.84 0.18 26.56a 10.71
ab
Average 96.42 0.47 2.53 0.57 25.89A
10.34ABC
Novogen 69 97.22 0 2.58 0.21 26.20ab
10.66ab
White 120 95.64 0.60 3.76 0 26.54a
10.38abc
Average 96.43 0.30 3.17 0.10 26.37A
10.52AB
All 69 95.97 0.25 3.26 0.58 24.89 9.97Y
Strains 120 96.06 0.35 3.27 0.36 24.97 10.34Z
1All strains were housed such that each strain is equally represented in each density.
ABC - Different letters denote significant differences (P<.01), comparisons made among strain average values. abc - Different letters denote significant differences (P<.01) in the strain*density interactions.
YZ - Different letters denote significant differences (P<.01), comparisons made among density average values.
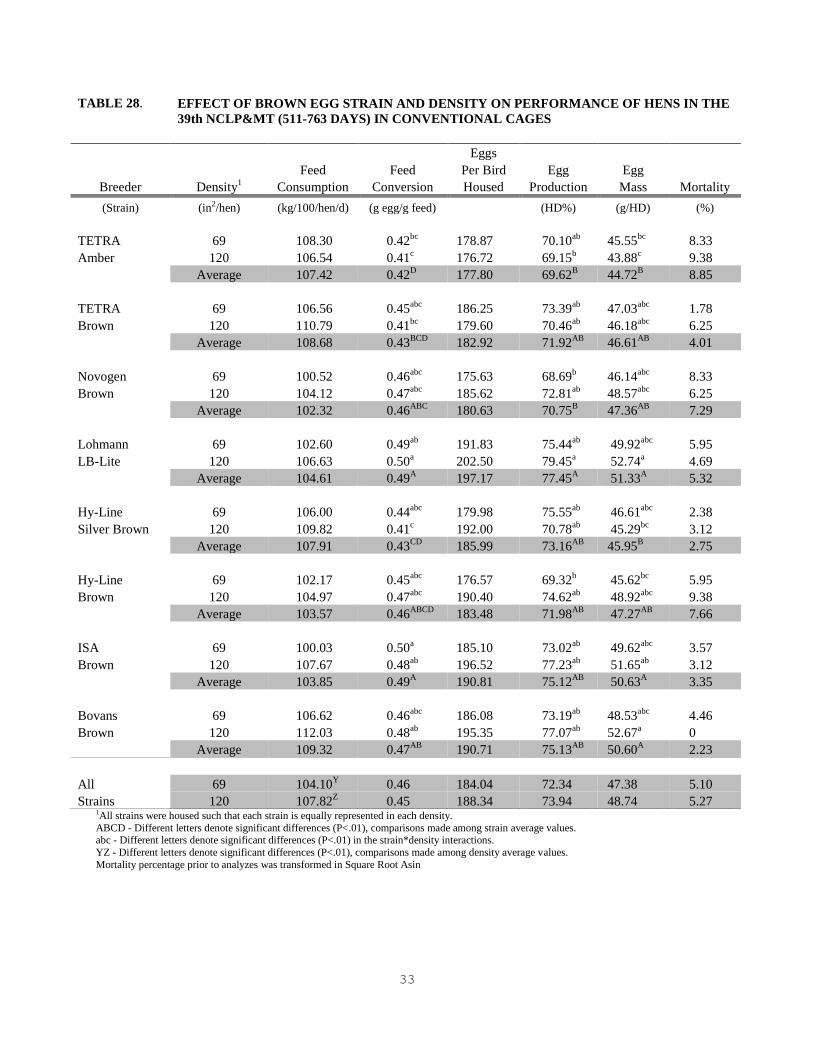
33
1All strains were housed such that each strain is equally represented in each density.
ABCD - Different letters denote significant differences (P<.01), comparisons made among strain average values. abc - Different letters denote significant differences (P<.01) in the strain*density interactions.
YZ - Different letters denote significant differences (P<.01), comparisons made among density average values.
Mortality percentage prior to analyzes was transformed in Square Root Asin
TABLE 28. EFFECT OF BROWN EGG STRAIN AND DENSITY ON PERFORMANCE OF HENS IN THE
39th NCLP&MT (511-763 DAYS) IN CONVENTIONAL CAGES
Eggs
Feed Feed Per Bird Egg Egg
Breeder Density1 Consumption Conversion Housed Production Mass Mortality
(Strain) (in2/hen) (kg/100/hen/d) (g egg/g feed)
(HD%) (g/HD) (%)
TETRA 69 108.30 0.42bc
178.87 70.10ab
45.55bc
8.33
Amber 120 106.54 0.41c
176.72 69.15b
43.88c
9.38
Average 107.42 0.42D
177.80 69.62B
44.72B
8.85
TETRA 69 106.56 0.45abc
186.25 73.39ab
47.03abc
1.78
Brown 120 110.79 0.41bc
179.60 70.46ab
46.18abc
6.25
Average 108.68 0.43BCD
182.92 71.92AB
46.61AB
4.01
Novogen 69 100.52 0.46abc
175.63 68.69b
46.14abc
8.33
Brown 120 104.12 0.47abc
185.62 72.81ab
48.57abc
6.25
Average 102.32 0.46ABC
180.63 70.75B
47.36AB
7.29
Lohmann 69 102.60 0.49ab
191.83 75.44ab
49.92abc
5.95
LB-Lite 120 106.63 0.50a
202.50 79.45a
52.74a
4.69
Average 104.61 0.49A
197.17 77.45A
51.33A
5.32
Hy-Line 69 106.00 0.44abc
179.98 75.55ab
46.61abc
2.38
Silver Brown 120 109.82 0.41c
192.00 70.78ab
45.29bc
3.12
Average 107.91 0.43CD
185.99 73.16AB
45.95B
2.75
Hy-Line 69 102.17 0.45abc
176.57 69.32b
45.62bc
5.95
Brown 120 104.97 0.47abc
190.40 74.62ab
48.92abc
9.38
Average 103.57 0.46ABCD
183.48 71.98AB
47.27AB
7.66
ISA 69 100.03 0.50a
185.10 73.02ab
49.62abc
3.57
Brown 120 107.67 0.48ab
196.52 77.23ab
51.65ab
3.12
Average 103.85 0.49A
190.81 75.12AB
50.63A
3.35
Bovans 69 106.62 0.46abc
186.08 73.19ab
48.53abc
4.46
Brown 120 112.03 0.48ab
195.35 77.07ab
52.67a
0
Average 109.32 0.47AB
190.71 75.13AB
50.60A
2.23
All 69 104.10Y
0.46 184.04 72.34 47.38 5.10
Strains 120 107.82Z
0.45 188.34 73.94 48.74 5.27

34
1All strains were housed such that each strain is equally represented in each density. ABCD - Different letters denote significant differences (P<.01), comparisons made among strain average values.
abcdef - Different letters denote significant differences (P<.01) in the strain*density interactions.
YZ - Different letters denote significant differences (P<.01), comparisons made among density average values.
TABLE 29. EFFECT OF BROWN EGG STRAIN AND DENSITY ON EGG WEIGHT AND EGG
SIZE DISTRIBUTION OF HENS IN THE 39th NCLP&MT (511-763 DAYS) IN
CONVENTIONAL CAGES
Egg Pee
Extra
Breeder Density1 Weight Wee Small Medium Large Large
(Strain) (in2/hen) (g/egg) (%) (%) (%) (%) (%)
TETRA 69 65.00cde
0 0 0.59 13.44ab
85.89ab
Amber 120 63.49ef
0 0 0.67 11.14ab
87.94ab
Average 64.24CD
0 0 0.63 12.29AB
86.92AB
TETRA 69 64.07cdef
0 0 0 13.67ab
85.83ab
Brown 120 65.54abcde
0 0.72 0.72 7.56ab
90.44ab
Average 64.80CD
0 0.36 0.36 10.61AB
88.14AB
Novogen 69 67.17abc
0 0 0 9.89ab
88.41ab
Brown 120 66.68abc
0 0 0 7.36ab
91.36ab
Average 66.92A
0 0 0 8.62AB
89.88AB
Lohmann 69 66.06abcde
0 0 0.41 11.30ab
88.15ab
LB-Lite 120 66.43abcd
0 0 0.39 7.11ab
92.53ab
Average 66.25AB
0 0 0.40 9.20AB
90.34AB
Hy-Line 69 61.82f
0 0 0.22 16.11a
83.56b
Silver Brown 120 64.01def
0 0 0.19 10.89ab
87.03ab
Average 62.91D
0 0 0.21 13.50A
85.29B
Hy-Line 69 65.77abcde
0 0 0.59 10.37ab
88.59ab
Brown 120 65.51bcde
0 0 0.50 8.50ab
90.53ab
Average 65.64ABC
0 0 0.55 9.44AB
89.56AB
ISA 69 67.96ab
0 0 0.37 10.18ab
89.44ab
Brown 120 66.80abc
0 0 0.28 10.39ab
88.11ab
Average 67.38A
0 0 0.32 10.29AB
88.78AB
Bovans 69 66.27abcd
0 0 0.53 8.56ab
90.94ab
Brown 120 68.20a
0 0.20 0 5.44b
94.14a
Average 67.23A
0 0.10 0.26 7.00B
92.54A
All 69 65.51 0 0 0.34 11.69Z
87.60Z
Strains 120 65.83 0 0.11 0.34 8.55Y
90.26Y

35
1All strains were housed such that each strain is equally represented in each density. ab - Different letters denote significant differences (P<.01) in the strain*density interactions.
YZ - Different letters denote significant differences (P<.01), comparisons made among density average values.
TABLE 30. EFFECT OF BROWN EGG STRAIN AND DENSITY ON EGG QUALITY, INCOME
AND FEED COSTS OF HENS IN THE 39th NCLP&MT (511-763 DAYS) IN
CONVENTIONAL CAGES
Grade Grade
Egg Feed
Breeder Density1 A B Cracks Loss Income Costs
(Strain) (in2/hen) (%) (%) (%) (%) ($/hen) ($/hen)
TETRA 69 96.27 0 3.56 0.17 21.80 10.22ab
Amber 120 96.47 0 3.22 0.31 21.44 10.06ab
Average 96.37 0 3.39 0.24 21.63 10.14
TETRA 69 96.81 0 2.63 0.56 22.56 10.08ab
Brown 120 96.46 0.43 1.73 1.39 21.63 10.46ab
Average 96.63 0.21 2.18 0.97 22.09 10.28
Novogen 69 95.18 0.22 2.94 1.67 21.13 9.53ab
Brown 120 96.48 0 2.11 1.41 22.26 9.84ab
Average 95.83 0.11 2.52 1.53 21.69 9.68
Lohmann 69 97.41 0 2.41 0.18 23.27 9.69ab
LB-Lite 120 98.27 0 1.73 0 24.55 10.06ab
Average 97.84 0 2.07 0.09 23.91 9.88
Hy-Line 69 97.22 0 2.60 0.18 23.29 10.01ab
Silver Brown 120 95.58 0 2.52 1.90 21.53 10.38ab
Average 96.40 0 2.56 1.04 22.41 10.20
Hy-Line 69 96.64 0.40 2.46 0.51 21.40 9.67ab
Brown 120 95.44 0.28 3.80 0.48 23.21 9.92ab
Average 96.04 0.33 3.13 0.50 22.30 9.79
ISA 69 97.00 0.85 2.16 0 22.58 9.45b
Brown 120 94.98 1.02 2.76 1.24 23.74 10.18ab
Average 95.99 0.93 2.46 0.62 23.16 9.82
Bovans 69 96.49 0.32 3.19 0 22.73 10.08ab
Brown 120 96.36 0.20 2.96 0.47 23.79 10.60a
Average 96.42 0.26 3.08 0.24 23.26 10.34
All 69 96.63 0.22 2.74 0.40 22.34 9.84Y
Strains 120 96.25 0.24 2.60 0.90 22.77 10.19Z

36
TABLE 31. EFFECT OF WHITE EGG STRAIN AND DENSITY ON PERFORMANCE OF HENS IN THE 39th
NCLP&MT (119-763 DAYS) IN CONVENTIONAL CAGES
Eggs
Feed Feed Per Bird Egg Egg
Breeder Density1 Consumption Conversion Housed Production Mass Mortality
(Strain) (in2/hen) (kg/100/hen/d) (g egg/g feed)
(HD%) (g/HD) (%)
Bovans 69 101.49abcdef
0.49 550.32 80.75 50.67 9.82
White 120 107.82abc
0.48 543.18 81.51 52.61 12.50
Average 104.64A
0.48 546.75A
81.13 51.44ABC
11.16
Shaver 69 95.98def
0.51 552.00 81.04 50.55 9.82
White 120 99.34cdef
0.51 557.22 83.85 52.36 6.25
Average 97.66BC
0.51 554.61A
82.44 51.45ABC
8.03
Dekalb 69 102.66abcde
0.49 559.60 82.55 52.02 12.30
White 120 107.58abc
0.47 542.00 81.44 51.72 6.25
Average 105.12A
0.48 550.80A
81.99 51.87ABC
9.28
Babcock 69 100.66abcdef
0.51 556.73 81.92 52.75 4.76
White 120 109.72ab
0.47 543.62 81.65 52.77AB
9.38
Average 105.19A
0.49 550.18A
81.79 52.76 7.07
ISA 69 99.00cdef
0.51 550.87 81.23 51.44 11.51
B-400 120 105.31abcd
0.48 533.25 80.13 51.33 4.69
Average 102.15AB
0.49 542.06A
80.68 51.39ABC
8.10
Hy-Line 69 90.83f
0.50 504.40 74.76 46.92 9.52
W-36 120 103.64abcd
0.44 501.70 75.70 47.05 10.42
Average 97.24BC
0.47 503.05B
75.23 46.98BC
9.97
Hy-Line 69 91.72ef
0.47 501.93 73.36 44.86 7.14
CV-26 120 97.00def
0.46 496.38 74.53 45.68 3.12
Average 94.36C
0.47 499.15B
73.94 45.27C
5.13
Hy-Line 69 98.27cdef
0.50 539.80 79.37 50.37 14.68
CV-24 120 104.28abcd
0.49 551.15 82.52 52.35 20.31
Average 101.27ABC
0.50 545.48A
80.95 51.36ABC
17.50
Hy-Line 69 98.00cdef
0.49 531.67 78.25 49.52 6.35
CV-22 120 103.60abcd
0.48 532.48 79.97 50.54 4.69
Average 100.80ABC
0.48 532.07AB
79.11 50.03ABC
5.52
Lohmann 69 102.08abcdef
0.50 559.80 82.21 52.23 13.10
LSL Lite 120 110.11a
0.47 552.48 83.03 53.79 9.38
Average 106.10A
0.49 556.14A
82.62 53.01AB
11.24
H&N 69 98.67cdef
0.51 548.90 80.53 51.87 10.72
Nick Chick 120 108.92abc
0.49 563.15 84.66 54.80 7.81
Average 103.80AB
0.50 556.02A
82.60 53.33AB
9.26
Novogen 69 104.45abcd
0.51 562.47 82.59 54.30 10.71
White 120 109.87ab
0.49 559.32 84.02 54.07 7.81
Average 107.16A
0.50 560.90A
83.34 54.18A
9.26
All 69 98.65Y
0.50 543.21 79.88 50.62 10.03
Strains 120 105.60Z
0.48 539.66 81.08 51.56 8.55 1All strains were housed such that each strain is equally represented in each density.
ABC - Different letters denote significant differences (P<.01), comparisons made among strain average values.
abcdef - Different letters denote significant differences (P<.01) in the strain*density interactions.
YZ - Different letters denote significant differences (P<.01), comparisons made among density average values. Mortality percentage prior to analyzes was transformed in Square Root Asin

37
TABLE 32. EFFECT OF WHITE EGG STRAIN AND DENSITY ON EGG WEIGHT AND EGG SIZE
DISTRIBUTION OF HENS IN THE 39th NCLP&MT (119-763 DAYS) IN CONVENTIONAL
CAGES
Egg Pee
Extra
Breeder Density1 Weight Wee Small Medium Large Large
(Strain) (in2/hen) (g/egg) (%) (%) (%) (%) (%)
Bovans 69 60.50
0 5.17 5.94 18.78 67.42
White 120 60.62 0 0.09 4.71 12.67 76.33
Average 60.56 0 2.63 5.03 15.73 71.88
Shaver 69 59.53 0 3.79 5.44 17.63 68.41
White 120 59.34 0 2.90 5.48 16.75 70.54
Average 59.44 0 3.35 5.46 17.19 69.48
Dekalb 69 61.50 0 3.45 4.71 20.29 71.38
White 120 60.94 0 3.14 3.65 14.03 75.70
Average 61.22 0 3.30 4.18 17.16 73.54
Babcock 69 61.79 0 2.81 4.83 15.10 74.06
White 120 61.54 0.36 2.54 4.65 10.11 77.66
Average 61.67 0.18 2.68 4.74 12.60 75.86
ISA 69 58.80 0 1.17 2.94 14.87 73.35
B-400 120 60.47 0 3.26 2.87 15.01 74.16
Average 59.63 0 2.22 2.90 14.94 73.76
Hy-Line 69 60.10 0 2.35 6.16 16.32 70.33
W-36 120 58.29 0 1.92 7.12 16.73 68.13
Average 59.20 0 2.14 6.64 16.02 69.23
Hy-Line 69 57.78 0 3.00 7.75 18.64 64.38
CV-26 120 58.64 0 3.64 6.62 18.01 67.06
Average 58.21 0 3.32 7.19 18.32 65.72
Hy-Line 69 60.91 0 3.01 5.40 17.00 70.88
CV-24 120 61.17 0.24 5.34 4.01 16.62 71.74
Average 61.04 0.72 4.18 4.71 16.81 71.31
Hy-Line 69 60.88 0 1.68 3.13 20.22 71.14
CV-22 120 60.93 0.36 2.97 4.65 14.90 73.84
Average 60.91 0 2.32 3.89 17.56 72.49
Lohmann 69 60.87 0 2.96 4.65 14.75 72.96
LSL Lite 120 61.01 0 1.18 3.54 14.82 74.66
Average 60.94 0 2.07 4.10 14.78 73.81
H&N 69 60.78 0 2.96 4.48 13.51 74.28
Nick Chick 120 61.06 0.54 2.79 1.63 13.58 75.80
Average 60.92 0.27 2.88 3.05 13.54 75.04
Novogen 69 62.69 0 2.67 2.49 9.68 80.75
White 120 60.78 0 1.62 3.34 15.04 74.54
Average 61.73 0 2.14 2.91 12.36 77.65
All 69 60.51 0.10 2.92 4.83 16.40 71.61
Strains 120 60.40 0.08 2.62 4.31 14.77 73.35 1All strains were housed such that each strain is equally represented in each density

38
TABLE 33. EFFECT OF WHITE EGG STRAIN AND DENSITY ON EGG QUALITY, INCOME
AND FEED COSTS OF HENS IN THE 39th NCLP&MT (119-763 DAYS) IN
CONVENTIONAL CAGES
Grade Grade
Egg Feed
Breeder Density1 A B Cracks Loss Income Costs
(Strain) (in2/hen) (%) (%) (%) (%) ($/hen) ($/hen)
Bovans 69 89.00 1.56 3.46ab
0.54 60.72ab
25.90abcd
White 120 89.70 0.29 2.11ab
0.38 61.28ab
27.25abc
Average 89.35 0.92 2.79 0.46 61.00A
26.58AB
Shaver 69 87.97 0.16 2.76ab
0 59.63ab
25.09cd
White 120 88.77 0.08 3.54ab
0.42 63.13a
26.08abcd
Average 88.37 0.12 3.15 0.21 61.38A
25.59ABC
Dekalb 69 92.80 0.06 3.93ab
0.41 62.16ab
26.33abcd
White 120 88.74 0.62 2.63ab
0.40 61.58ab
27.10abcd
Average 90.77 0.34 3.28 0.40 61.87A
27.72AB
Babcock 69 92.74 0.16 2.62ab
0.43 62.32ab
26.17abcd
White 120 88.95 0.76 2.51ab
0.36 61.77ab
27.58abc
Average 90.84 0.46 2.56 0.39 62.04A
26.80AB
ISA 69 87.68 0.40 2.64ab
0.59 60.80ab
25.74abcd
B-400 120 88.73 0.32 2.97ab
0.37 60.46ab
26.32abcd
Average 88.20 0.36 2.80 0.48 60.63A
26.03ABC
Hy-Line 69 89.48 0 2.75ab
0.60 55.48b
24.40d
W-36 120 87.28 0.30 3.09ab
0.63 56.18b
26.30abcd
Average 88.38 0.15 2.92 0.62 55.83BC
25.35BC
Hy-Line 69 89.22 0.13 2.92ab
0.62 54.78b
24.29d
CV-26 120 91.36 0.26 1.50b
0.36 56.10b
25.15bcd
Average 90.29 0.19 2.21 0.49 55.43C
24.72C
Hy-Line 69 94.08 0.59 2.03ab
0.40 59.10ab
25.61abcd
CV-24 120 91.10 0 2.23ab
0.15 61.66ab
26.19abcd
Average 92.59 0.30 2.13 0.27 60.38AB
25.90ABC
Hy-Line 69 90.07 0.16 3.77ab
0.20 59.00ab
25.78abcd
CV-22 120 89.62 0.08 4.62a
0.25 60.81ab
26.48abcd
Average 89.84 0.12 4.20 0.22 59.90ABC
26.13ABC
Lohmann 69 92.30 0.19 2.83ab
0.32 61.62ab
26.90abcd
LSL Lite 120 88.45 0 3.54ab
0.49 63.01a
27.72ab
Average 90.38 0.09 3.19 0.40 62.32A
27.20A
H&N 69 88.18 0.42 2.21ab
0.49 60.63ab
25.37abcd
Nick Chick 120 89.50 0.31 2.28ab
0.37 64.00a 27.80a
Average 88.84 0.37 2.24 0.43 62.26A
26.58AB
Novogen 69 90.96 0.15 1.55ab
0.09 61.87ab
26.32abcd
White 120 91.58 0.43 2.55ab
0 63.46a
26.94abcd
Average 91.27 0.29 2.05 0.04 62.66A
26.63AB
All 69 90.37 0.33 2.79 0.43 59.84Z
25.23Y
Strains 120 89.48 0.29 2.80 0.31 61.11Y
26.74Z
1All strains were housed such that each strain is equally represented in each density.
ABC - Different letters denote significant differences (P<.01), comparisons made among strain average values.
abcd - Different letters denote significant differences (P<.01) in the strain*density interactions.
YZ - Different letters denote significant differences (P<.01), comparisons made among density average values.
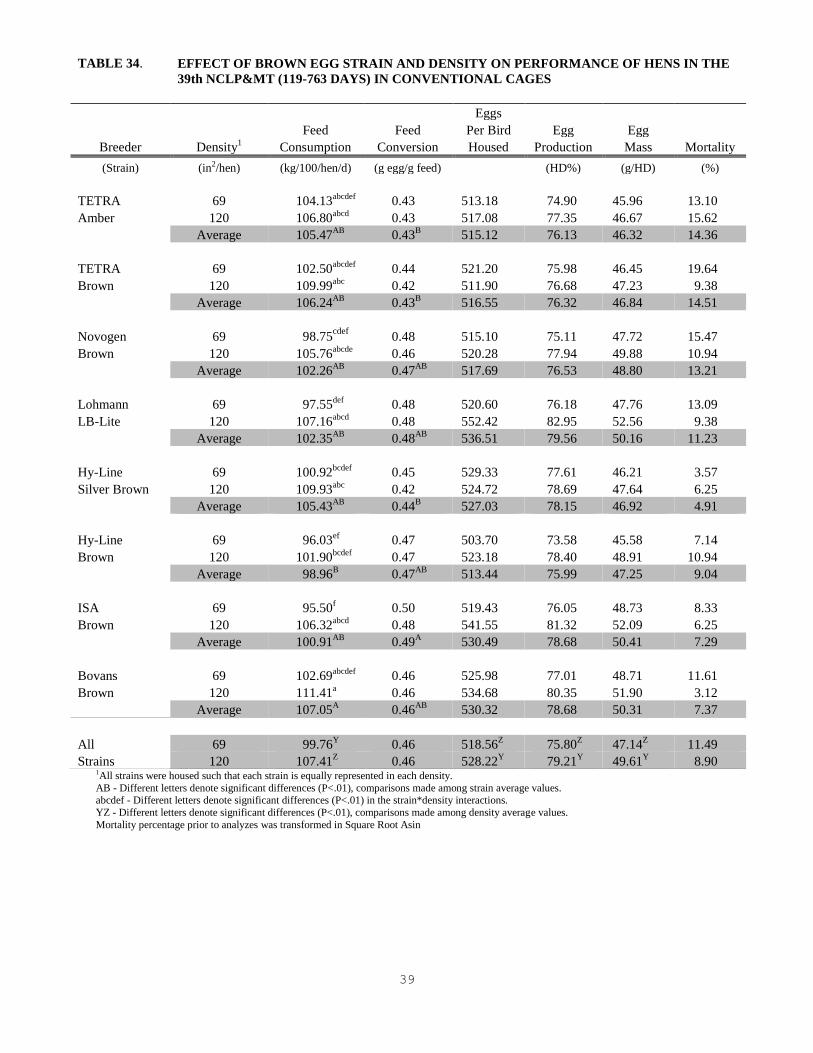
39
1All strains were housed such that each strain is equally represented in each density.
AB - Different letters denote significant differences (P<.01), comparisons made among strain average values.
abcdef - Different letters denote significant differences (P<.01) in the strain*density interactions.
YZ - Different letters denote significant differences (P<.01), comparisons made among density average values.
Mortality percentage prior to analyzes was transformed in Square Root Asin
TABLE 34. EFFECT OF BROWN EGG STRAIN AND DENSITY ON PERFORMANCE OF HENS IN THE
39th NCLP&MT (119-763 DAYS) IN CONVENTIONAL CAGES
Eggs
Feed Feed Per Bird Egg Egg
Breeder Density1 Consumption Conversion Housed Production Mass Mortality
(Strain) (in2/hen) (kg/100/hen/d) (g egg/g feed)
(HD%) (g/HD) (%)
TETRA 69 104.13abcdef
0.43 513.18 74.90 45.96 13.10
Amber 120 106.80abcd
0.43 517.08 77.35 46.67 15.62
Average 105.47AB
0.43B
515.12 76.13 46.32 14.36
TETRA 69 102.50abcdef
0.44 521.20 75.98 46.45 19.64
Brown 120 109.99abc
0.42 511.90 76.68 47.23 9.38
Average 106.24AB
0.43B
516.55 76.32 46.84 14.51
Novogen 69 98.75cdef
0.48 515.10 75.11 47.72 15.47
Brown 120 105.76abcde
0.46 520.28 77.94 49.88 10.94
Average 102.26AB
0.47AB
517.69 76.53 48.80 13.21
Lohmann 69 97.55def
0.48 520.60 76.18 47.76 13.09
LB-Lite 120 107.16abcd
0.48 552.42 82.95 52.56 9.38
Average 102.35AB
0.48AB
536.51 79.56 50.16 11.23
Hy-Line 69 100.92bcdef
0.45 529.33 77.61 46.21 3.57
Silver Brown 120 109.93abc
0.42 524.72 78.69 47.64 6.25
Average 105.43AB
0.44B
527.03 78.15 46.92 4.91
Hy-Line 69 96.03ef
0.47 503.70 73.58 45.58 7.14
Brown 120 101.90bcdef
0.47 523.18 78.40 48.91 10.94
Average 98.96B
0.47AB
513.44 75.99 47.25 9.04
ISA 69 95.50f
0.50 519.43 76.05 48.73 8.33
Brown 120 106.32abcd
0.48 541.55 81.32 52.09 6.25
Average 100.91AB
0.49A
530.49 78.68 50.41 7.29
Bovans 69 102.69abcdef
0.46 525.98 77.01 48.71 11.61
Brown 120 111.41a
0.46 534.68 80.35 51.90 3.12
Average 107.05A
0.46AB
530.32 78.68 50.31 7.37
All 69 99.76Y
0.46 518.56Z
75.80Z
47.14Z
11.49
Strains 120 107.41Z
0.46 528.22Y
79.21Y
49.61Y
8.90

40
1All strains were housed such that each strain is equally represented in each density. ABC - Different letters denote significant differences (P<.01), comparisons made among strain average values.
ab - Different letters denote significant differences (P<.01) in the strain*density interactions.
YZ - Different letters denote significant differences (P<.01), comparisons made among density average values.
TABLE 35. EFFECT OF BROWN EGG STRAIN AND DENSITY ON EGG WEIGHT AND EGG
SIZE DISTRIBUTION OF HENS IN THE 39th NCLP&MT (119-763 DAYS) IN
CONVENTIONAL CAGES
Egg Pee
Extra
Breeder Density1 Weight Wee Small Medium Large Large
(Strain) (in2/hen) (g/egg) (%) (%) (%) (%) (%)
TETRA 69 59.89 0 3.19 8.46 25.03ab
61.72ab
Amber 120 59.64 0 2.60 8.94 25.14ab
62.92ab
Average 59.77AB
0 2.89 8.70 25.08AB
62.32AB
TETRA 69 58.69 0 2.72 5.43 22.04ab
65.09ab
Brown 120 60.37 0 2.46 5.30 22.24ab
67.48ab
Average 59.53AB
0 2.59 5.37 22.14ABC
66.28AB
Novogen 69 63.10 0.42 1.78 7.01 20.00ab
70.04ab
Brown 120 63.32 0 1.63 3.88 17.73ab
76.21a
Average 63.21A 0.21 1.70 5.45 18.84
ABC 73.12
A
Lohmann 69 61.48 0 2.88 7.02 21.86ab
66.62ab
LB-Lite 120 62.58 1.63 2.08 3.25 19.76ab
73.04ab
Average 62.03AB
0.81 2.48 5.13 20.81ABC
69.83AB
Hy-Line 69 58.99 0 2.77 11.01 29.26a
56.84b
Silver Brown 120 58.92 0 1.37 6.99 24.39ab
63.06ab
Average 58.96B
0 2.07 9.00 26.82A
59.95B
Hy-Line 69 60.91 0 1.23 6.09 26.01ab
64.88ab
Brown 120 60.82 0 1.12 5.06 19.60ab
71.85ab
Average 60.87AB
0 1.18 5.58 22.81ABC
68.36AB
ISA 69 62.19 1.45 2.17 3.93 19.17ab
71.80ab
Brown 120 62.29 0 1.99 4.15 17.24ab
73.92ab
Average 62.24AB
0.72 2.08 4.04 18.21BC
72.86A
Bovans 69 61.40 0 2.09 6.72 17.77ab
71.21ab
Brown 120 61.58 0 1.24 3.16 14.65b
76.53a
Average 61.49AB
0 1.66 4.94 16.21C
73.87A
All 69 60.83 0.23 2.35 6.96 22.64 66.02Z
Strains 120 61.19 0.20 1.81 5.09 20.09 70.63Y

41
1All strains were housed such that each strain is equally represented in each density. AB - Different letters denote significant differences (P<.01), comparisons made among strain average values.
abcd - Different letters denote significant differences (P<.01) in the strain*density interactions.
YZ - Different letters denote significant differences (P<.01), comparisons made among density average values.
TABLE 36. EFFECT OF BROWN EGG STRAIN AND DENSITY ON EGG QUALITY, INCOME
AND FEED COSTS OF HENS IN THE 39th NCLP&MT (119-763 DAYS) IN
CONVENTIONAL CAGES
Grade Grade
Egg Feed
Breeder Density1 A B Cracks Loss Income Costs
(Strain) (in2/hen) (%) (%) (%) (%) ($/hen) ($/hen)
TETRA 69 92.42 0.17 2.67 0.36 56.12bcd
26.27ab
Amber 120 94.12 0.08 2.42 0.12 57.48bcd
26.75ab
Average 93.29 0.12AB
2.54 0.24 56.80AB
26.51
TETRA 69 90.55 0.26 2.66 0.55 53.92d
26.78ab
Brown 120 90.77 0.50 1.88 0.69 57.40bcd
26.76ab
Average 90.66 0.38AB
2.27 0.62 55.66B
26.52
Novogen 69 93.08 0.48 2.70 0.84 55.43d
25.09b
Brown 120 92.57 0.06 2.38 0.70 59.43abcd
26.45ab
Average 92.82 0.28AB
2.54 0.77 57.43AB
25.77
Lohmann 69 94.58 0 2.27 0.25 57.21bcd
24.87b
LB-Lite 120 94.42 0.08 1.88 0.44 63.09a
26.90ab
Average 94.50 0.04B
2.07 0.34 60.15A
25.88
Hy-Line 69 92.47 0.13 2.92 0.18 58.47abcd
26.04ab
Silver Brown 120 90.43 0.16 2.24 0.82 58.54abcd
27.48a
Average 91.44 0.14AB
2.58 0.50 58.51AB
26.76
Hy-Line 69 91.10 0.27 2.44 0.38 55.62cd
25.15b
Brown 120 89.35 0.41 4.78 0.36 59.21abcd
26.15ab
Average 90.23 0.34AB
3.61 0.37 57.42AB
25.65
ISA 69 93.95 0.81 2.29 0.11 57.86abcd
24.92b
Brown 120 92.40 0.63 2.33 0.56 61.60ab
26.53ab
Average 93.17 0.72A
2.31 0.33 59.73AB
25.73
Bovans 69 90.76 0.36 2.25 0.10 57.69abcd
25.80ab
Brown 120 90.62 0.43 3.32 0.19 61.39abc
27.64a
Average 90.69 0.40AB
2.79 0.14 59.54AB
26.72
All 69 92.37 0.31 2.53 0.35 56.54Z
26.83Z
Strains 120 91.84 0.29 2.65 0.48 59.77Y
25.55Y

42
TABLE 37.
EFFECT OF WHITE EGG STRAIN AND DENSITY ON BODY WEIGHT OF HENS IN THE 39th
NCLP&MT (119-763 DAYS) IN CONVENTIONAL CAGES USING THE NON-ANOREXIC MOLT
PROGRAM
17 Wk 69 Wk 1st Cycle 73 Wk 109 Wk 2nd
Cycle Total
Breeder Density1 Body Wt Body Wt Wt Gain Body Wt Body Wt Wt Gain Wt Gain
(Strain) (in2/hen) (kg) (kg) (%) (kg) (kg) (kg) (%)
Bovans 69 1.26 1.78 42.9 1.48 1.83 0.46 45.74
White 120 1.28 1.85 48.4 1.44 1.91 0.55 50.02
Average 1.27 1.81 45.7 1.46 1.87ABC
0.51 47.88
Shaver 69 1.31 1.80 36.6 1.45 1.83 0.38 39.69
White 120 1.31 1.98 52.7 1.50 1.95 0.44 49.13
Average 1.31 1.89 44.3 1.48 1.89ABC
0.41 4441
Dekalb 69 1.30 1.77 36.2 1.40 1.94 0.58 49.25
White 120 1.30 1.80 38.5 1.52 1.91 0.33 47.42
Average 1.30 1.78 37.7 1.46 1.92ABC
0.46 48.34
Babcock 69 1.35 1.90 43.0 1.44 2.10 0.68 56.32
White 120 1.36 2.04 52.9 1.52 2.10 0.42 53.26
Average 1.36 1.97 47.8 1.48 2.10A
0.55 54.79
ISA 69 1.22 1.70 37.7 1.36 1.65 0.43 34.70
B-400 120 1.20 1.82 49.2 1.38 1.70 0.28 41.05
Average 1.21 1.76 43.8 1.37 1.67C
0.35 37.87
Hy-Line 69 1.56 1.82 36.5 1.46 1.81 0.26 22.23
W-36 120 1.21 1.92 61.2 1.50 2.00 0.48 66.35
Average 1.38 1.87 47.8 1.48 1.91ABC
0.36 44.29
Hy-Line 69 1.22 1.73 41.0 1.38 1.93 0.56 58.82
CV-26 120 1.22 1.84 50.8 1.43 1.92 0.58 57.45
Average 1.22 1.78 45.9 1.40 1.93ABC
0.57 58.14
Hy-Line 69 1.29 1.79 39.5 1.44 1.73 0.38 34.21
CV-24 120 1.30 1.85 44.6 1.58 1.83 0.38 40.18
Average 1.30 1.82 41.5 1.51 1.78BC
0.38 37.19
Hy-Line 69 1.31 1.88 42.7 1.57 1.95 0.36 48.62
CV-22 120 1.30 1.93 47.7 1.52 2.01 0.44 55.21
Average 1.30 1.90 45.4 1.54 1.98AB
0.40 51.92
Lohmann 69 1.27 1.72 36.2 1.34 1.92 0.58 50.81
LSL Lite 120 1.28 1.85 46.9 1.46 1.96 0.50 53.34
Average 1.28 1.79 41.4 1.40 1.94ABC
0.54 52.07
H&N 69 1.34 1.74 28.4 1.43 1.92 0.49 43.40
Nick Chick 120 1.29 1.84 41.9 0.72 1.92 0.60 48.75
Average 1.31 1.79 35.1 1.07 1.92ABC
0.54 46.07
Novogen 69 1.34 1.79 33.6 1.38 1.92 0.50 42.96
White 120 1.26 1.99 58.7 1.43 1.87 0.50 48.00
Average 1.30 1.89 46.2 1.41 1.90ABC
0.50 45.48
All 69 1.31 1.78Y
38.2Y
1.43 1.88 0.47 43.89
Strains 120 1.28 1.89Z
49.2Z
1.42 1.92 0.46 50.85 1All strains were housed such that each strain is equally represented in each density.
ABC - Different letters denote significant differences (P<.01), comparisons made among strain average values.
YZ - Different letters denote significant differences (P<.01), comparisons made among density average values.

43
TABLE 38. EFFECT OF BROWN EGG STRAIN AND DENSITY ON BODY WEIGHT OF HENS IN THE
39th NCLP&MT (119-763 DAYS) IN CONVENTIONAL CAGES USING THE NON-ANOREXIC
MOLT PROGRAM
17 Wk 69 Wk 1st Cycle 73 Wk 109 Wk 2nd
Cycle Total
Breeder Density1 Body Wt Body Wt Wt Gain Body Wt Body Wt Wt Gain Wt Gain
(Strain) (in2/hen) (kg) (kg) (%) (kg) (kg) (kg) (%)
TETRA 69 1.67 2.30 37.1 1.90 2.20 0.29 32.28
Amber 120 1.60 2.18 36.3 1.86 2.18 0.31 36.76
Average 1.63 2.24 36.8 1.88 2.19 0.30 34.52
TETRA 69 1.58 1.96 23.4 1.69 1.98 0.30 25.28
Brown 120 1.63 2.06 27.0 1.76 2.07 0.31 27.18
Average 1.61 2.01 24.8 1.72 2.03 0.30 26.23
Novogen 69 1.67 2.03 21.0 1.73 2.01 0.34 20.78
Brown 120 1.59 2.06 31.4 1.78 2.06 0.22 29.43
Average 1.63 2.05 26.4 1.76 2.03 0.28 25.10
Lohmann 69 1.63 1.96 21.5 1.61 2.03 0.36 24.42
LB-Lite 120 1.64 2.12 30.5 1.74 2.02 0.24 23.33
Average 1.63 2.04 26.4 1.68 2.02 0.30 23.87
Hy-Line 69 1.62 2.01 25.9 1.75 2.25 0.48 38.63
Silver Brown 120 1.64 2.36 48.2 1.88 2.20 0.50 35.44
Average 1.63 2.19 36.8 1.81 2.22 0.49 37.03
Hy-Line 69 1.61 1.96 21.7 1.66 2.05 0.26 26.78
Brown 120 1.65 2.14 30.3 1.80 2.16 0.32 31.00
Average 1.63 2.05 25.8 1.73 2.10 0.29 28.89
ISA 69 1.53 1.91 24.8 1.64 1.98 0.35 29.13
Brown 120 1.59 2.20 37.7 1.82 2.15 0.33 35.68
Average 1.56 2.06 31.4 1.73 2.06 0.34 32.40
Bovans 69 1.56 2.00 28.2 1.70 2.27 0.42 45.28
Brown 120 1.62 2.06 27.8 1.70 2.12 0.48 31.42
Average 1.59 2.03 27.7 1.70 2.20 0.45 38.35
All 69 1.61 2.02 25.5Y
1.71 2.10 0.35 30.32
Strains 120 1.62 2.15 34.0Z
1.79 2.12 0.34 31.28 1All strains were housed such that each strain is equally represented in each density. YZ - Different letters denote significant differences (P<.01), comparisons made among density average values.

44
TABLE 39. EFFECT OF WHITE EGG STRAIN AND PRODUCTION SYSTEM ON PERFORMANCE OF HENS
IN THE 39th NCLP&MT (119-483 DAYS) IN ENRICHABLE AND ENRICHED COLONY HOUSING
SYSTEMS
Eggs
Age at
Production Feed Feed Per Bird Egg Egg
50%
Breeder System Consumption Conversion Housed Production Mass Mortality Production
(Strain) (kg/100/hen/d) (g egg/g feed)
(HD%) (g/HD) (%) (Days)
Bovans 69 EC 10.28efg
0.505bcdef
311.82ab
85.48D
50.93d
7.78ab
144.90abc
White 69 ECS 10.51bcdef
0.492def
311.22ab
84.74def
50.87d
17.06ab
146.14a
Average 10.40BC
0.499BC
311.52ABC
85.11B
50.90BC
12.42AB
145.52A
Shaver 69 EC 10.16fg
0.542abc
307.19ab
83.79defg
50.89d
16.67ab
142.00bcd
White 69 ECS 10.50bcdef
0.540abcd
318.28ab
85.56bcde
51.91cd
30.55a
140.50d
Average 10.33CD
0.541A
312.74ABC
84.68B
51.40B
23.61A
141.25C
Dekalb 69 EC 10.56abcdef
0.503bcdef
309.92ab
84.92def
51.18cd
7.22ab
144.40abcd
White 69 ECS 10.48bcdefg
0.508bcdef
311.31ab
85.18cdef
51.54cd
9.03ab
144.25abcd
Average 10.52ABC
0.506B
310.62ABC
85.05B
51.36B
8.12AB
144.32AB
Babcock 69 EC 10.31defg
0.560a
314.52ab
86.32bcd
52.84abc
3.09b
141.50cd
White 69 ECS 11.09a
0.539abcd
327.38a
89.54a
54.27ab
11.80ab
140.50d
Average 10.55A
0.549A
320.95AB
87.93A
53.55A
7.44B
140.00C
ISA 69 EC 10.63abcde
0.532abcd
321.48a
88.17abc
54.63a
5.96ab
144.40abcd
B-400 69 ECS 10.68abcde
0.551ab
325.21a
88.61ab
54.75a
17.50ab
141.00d
Average 10.49ABC
0.542A
323.35A
88.39A
54.69A
11.73AB
142.70BC
Hy-Line 69 EC 10.11fg
0.483ef
297.80b
81.72gh
48.79f
3.14b
146.17a
W-36 69 ECS 9.89g
0.493bcdef
298.27ab
81.81fgh
48.22f
4.63ab
145.33abcd
Average 10.00D
0.488BC
298.04C
81.73D
48.51D
3.84B
145.75A
Hy-Line 69 EC 10.83abc
0.474ef
309.24ab
84.57def
50.90de
10.00ab
144.60abcd
CV-24 69 ECS 10.80abcd
0.464ef
295.24b
80.70h
48.93ef
11.11ab
145.75abc
Average 10.82A
0.469C
302.23C
82.63CD
49.91C
10.56AB
145.18AB
Lohmann 69 EC 10.83abc
0.493bcdef
309.41ab
84.63defg
51.55cd
13.20ab
146.00ab
LSL Lite 69 ECS 10.68abcde
0.498bcdef
310.94ab
84.85def
51.60cd
13.19ab
144.75abcd
Average 10.61ABC
0.496BC
310.18ABC
84.74B
51.57B
13.20AB
145.38AB
H&N 69 EC 10.49bcdef
0.500bcdef
307.67ab
84.20defg
51.52cd
9.26ab
145.33ab
Nick Chick 69 ECS 10.66abcde
0.497bcdef
309.98ab
84.44defg
51.63cd
15.97ab
145.75abc
Average 10.57ABC
0.499BC
308.82ABC
84.32BC
51.58B
12.62AB
145.54A
Novogen 69 EC 10.38cdefg
0.519abcde
309.07ab
84.59def
52.31bcd
11.11ab
144.60abcd
White 69 ECS 10.49ab
0.480ef
304.77ab
82.70efgh
50.91de
20.55ab
145.00abcd
Average 10.66AB
0.500BC
306.92BC
83.64BCD
51.61B
15.83AB
144.80AB
All 69 EC 10.43Z
0.511
309.81 84.84 51.55 8.74Y
144.39
Strains 69 ECS 10.62Y 0.506
311.26 84.81 51.46 15.14
Z 143.90
Enrichable Cage=EC; Enriched Colony Housing System=ECS.
ABCD - Different letters denote significant differences (P<.01), comparisons made among strain average values.
abcdefgh - Different letters denote significant differences (P<.01) in the strain*housing system interactions YZ - Different letters denote significant differences (P<.01), comparisons made among production system average values.
Mortality percentage prior to analyzes was transformed in Square Root Asin

45
Enrichable Cage=EC; Enriched Colony Housing System=ECS. ABCDEF - Different letters denote significant differences (P<.01), comparisons made among strain average values.
abcdefgh - Different letters denote significant differences (P<.01) in the strain*production system interactions.
TABLE 40. EFFECT OF WHITE EGG STRAIN AND PRODUCTION SYSTEM ON EGG WEIGHT
AND EGG SIZE DISTRIBUTION OF HENS IN THE 39th NCLP&MT (119-483 DAYS) IN
ENRICHABLE AND ENRICHED COLONY HOUSING SYSTEMS
Production Egg Pee
Extra
Breeder System Weight Wee Small Medium Large Large
(Strain) (g/egg) (%) (%) (%) (%) (%)
Bovans 69 EC 58.46h
0ab
7.72 14.00ab
25.97 51.83de
White 69 ECS 58.97efgh
0ab
7.74 12.37ab
25.18 54.63cde
Average 58.72EF
0 7.73AB
13.19AB
25.57 53.23C
Shaver 69 EC 59.64cdefg
0.04ab
6.28 10.38ab
24.73 58.26abc
White 69 ECS 59.78abcdefg
0ab
4.75 11.86ab
24.22 58.66abc
Average 59.71CD
0.02 5.52AB
11.12BC
24.48 58.46B
Dekalb 69 EC 59.17efgh
0ab
6.33 11.48ab
24.27 57.62abcd
White 69 ECS 59.22defgh
0ab
6.87 10.52ab
23.43 58.78abc
Average 59.19DE
0 6.60AB
11.00BC
23.85 58.20B
Babcock 69 EC 60.29abcd
0ab
5.32 11.06ab
22.39 60.91ab
White 69 ECS 59.65bcdefg
0.52a
5.08 11.98ab
23.34 58.52abc
Average 59.97BC
0.26 5.20AB
11.52ABC
22.87 59.71AB
ISA 69 EC 60.88a
0.05ab
5.30 8.79b
21.47 64.04a
B-400 69 ECS 60.81ab
0ab
4.35 9.28ab
22.25 63.64a
Average 60.85A
0.03 4.83B
9.03C
21.86 63.84A
Hy-Line 69 EC 58.75gf
0ab
7.68 14.63ab
22.45 54.93bcde
W-36 69 ECS 58.02h
0ab
8.30 17.08a
25.58 48.59e
Average 58.38F
0 7.99AB
15.85A
24.02 51.76C
Hy-Line 69 EC 58.97efgh
0ab
5.88 13.77ab
22.40 57.80abc
CV-24 69 ECS 58.86abcdefg
0ab
8.21 11.03ab
22.63 57.69abcd
Average 59.41CD
0 7.04AB
12.40ABC
22.52 57.75B
Lohmann 69 EC 59.90abcdef
0ab
6.25 11.93ab
22.48 59.26abc
LSL Lite 69 ECS 59.66bcdefg
0ab
5.05 10.80ab
24.03 59.66abc
Average 59.78BCD
0 5.65AB
11.36ABC
23.26 59.46AB
H&N 69 EC 59.97abcde
0ab
6.13 9.73ab
22.84 61.15ab
Nick Chick 69 ECS 60.14abcde
0ab
5.35 11.01ab
22.45 60.82abc
Average 60.05BC
0 5.74AB
10.37B
22.64 60.99AB
Novogen 69 EC 60.57abc
0ab
5.24 9.82ab
21.76 63.07a
White 69 ECS 60.51abc
0.01ab
5.31 10.84ab
22.13 61.34ab
Average 60.54AB
0 5.28AB
10.33BC
21.95 62.20AB
All 69 EC 59.66 0.01 6.21 11.56 23.08 58.89
Strains 69 ECS 59.66 0.05 6.10 11.68 23.52 58.23

46
TABLE 41. EFFECT OF WHITE EGG STRAIN AND PRODUCTION SYSTEM ON EGG
QUALITY, INCOME AND FEED COSTS OF HENS IN THE 39th NCLP&MT (119-483
DAYS) IN ENRICHABLE AND ENRICHED COLONY HOUSING SYSTEMS
Production Grade Grade
Egg Feed
Breeder System A B Cracks Loss Income Costs
(Strain) (%) (%) (%) (%) ($/hen) ($/hen)
Bovans 69 EC 96.47 0.40 2.52 0.63 35.22ab
15.37abc
White 69 ECS 94.83 0.50 4.38 0.31 35.17ab
15.71abc
Average 95.65 0.45 3.45 0.47 35.19ABC
15.54AB
Shaver 69 EC 95.80 0.38 3.38 0.48 34.96ab
15.19bc
White 69 ECS 93.62 0.42 5.00 0.95 35.79ab
15.70abc
Average 94.71 0.40 4.19 0.72 35.38ABC
15.44AB
Dekalb 69 EC 97.16 0.40 1.88 0.58 35.48ab
15.78abc
White 69 ECS 92.75 0.55 6.10 0.58 35.19ab
15.68abc
Average 94.96 0.48 3.99 0.58 35.34ABC
15.73AB
Babcock 69 EC 96.72 0.62 2.10 0.60 36.04ab
15.42abc
White 69 ECS 93.50 0.80 5.05 0.68 36.79a
16.56a
Average 95.11 0.71 3.58 0.64 36.42A
15.99A
ISA 69 EC 96.12 0.32 2.82 0.72 36.96a
15.91abc
B-400 69 ECS 93.82 0.45 5.20 0.55 36.91a
15.97abc
Average 94.97 0.38 4.01 0.64 36.94A
15.94A
Hy-Line 69 EC 96.64 0.54 2.46 0.34 33.70b
14.95c
W-36 69 ECS 93.57 0.37 5.23 0.77 32.87b
14.81c
Average 95.10 0.45 3.85 0.55 33.28C
14.88B
Hy-Line 69 EC 96.38 0.46 2.98 0.14 35.22ab
16.20abc
CV-24 69 ECS 93.60 0.38 5.50 0.58 33.04b
16.14abc
Average 94.99 0.42 4.24 0.36 34.13BC
16.17A
Lohmann 69 EC 97.15 0.42 2.30 0.15 35.55ab
15.76abc
LSL Lite 69 ECS 92.90 1.15 5.45 0.52 35.21ab
15.96abc
Average 95.02 0.79 3.88 0.34 35.38ABC
15.86A
H&N 69 EC 95.95 0.87 2.75 0.40 35.31ab
15.68abc
Nick Chick 69 ECS 93.90 0.65 4.58 0.88 35.07ab
15.94abc
Average 94.92 0.76 3.66 0.64 35.19ABC
15.81A
Novogen 69 EC 96.70 0.16 2.82 0.32 35.63ab
15.50abc
White 69 ECS 93.94 0.52 5.02 0.52 34.59ab
16.39ab
Average 95.32 0.34 3.92 0.42 35.11ABC
15.95A
All 69 EC 96.51Y
0.46 2.60Y
0.44 35.40 15.57Z
Strains 69 ECS 93.64Z
0.58 5.15Z
0.63 35.06 15.88Y
Enrichable Cage=EC; Enriched Colony Housing System=ECS.
ABC - Different letters denote significant differences (P<.01), comparisons made among strain average values.
abc - Different letters denote significant differences (P<.01) in the strain*production system interactions YZ - Different letters denote significant differences (P<.01), comparisons made among production system average values.

47
TABLE 42. EFFECT OF BROWN EGG STRAIN AND PRODUCTION SYSTEM ON PERFORMANCE OF
HENS IN THE 39th NCLP&MT (119-483 DAYS) IN ENRICHABLE AND ENRICHED COLONY
HOUSING SYSTEMS
Eggs
Age at
Production Feed Feed Per Bird Egg Egg
50%
Breeder System Consumption Conversion Housed Production Mass Mortality Production
(Strain) (kg/100/hen/d) (g egg/g feed)
(HD%) (g/HD) (%) (Days)
TETRA 69 EC 10.46bc
0.456bc
293.78ab
80.49bcde
46.53fgh
7.14ab
145.00abc
Amber 69 ECS 10.60abc
0.442c
283.01ab
77.69ef
44.55h
1.39b
145.50abc
Average 10.53BC
0.449C
288.40AB
79.09BC
45.54C
4.27AB
145.25AB
TETRA 69 EC 10.20cd
0.475abc
276.75b
75.57f
45.21gh
14.82a
143.67abc
Brown 69 ECS 10.38bcd
0.464abc
282.18ab
77.28ef
45.84fgh
5.56ab
145.00abc
Average 10.29CD
0.469BC
279.46B
76.43D
45.52C
10.19A
144.33ABC
Novogen 69 EC 10.28cd
0.513a
293.64ab
80.45bcde
48.80abcde
7.78ab
144.00abc
Brown 69 ECS 10.49bc
0.510a
297.85ab
81.75abc
49.82abc
3.34ab
144.00abc
Average 10.39BCD
0.512A
295.74AB
81.10AB
49.31A
5.56AB
144.00ABC
Lohmann 69 EC 10.36bcd
0.497abc
301.64ab
82.72ab
49.72abc
4.79ab
145.00abc
LB-Lite 69 ECS 10.36bcd
0.484abc
294.17AB
80.74bcde
48.48abcdef
4.48ab
145.75abc
Average 10.36CD
0.491AB
297.91AB
81.73A
49.10A
4.13AB
145.38AB
Hy-Line 69 EC 10.55abc
0.483abc
297.54ab
81.59abcd
47.14defg
5.79ab
143.50abc
Silver Brown 69 ECS 10.79ab
0.487abc
303.42ab
83.20ab
47.60bcdefg
6.94ab
141.50bc
Average 10.67AB
0.485ABC
300.48A
82.39A
47.37B
6.37AB
142.50BC
Hy-Line 69 EC 10.28cd
0.518a
285.52ab
78.46def
47.03efg
0.46b
141.17c
Brown 69 ECS 10.65abc
0.494abc
289.23ab
79.35cdef
47.64cdefg
4.44ab
142.20abc
Average 10.47BC
0.506AB
287.38AB
78.90C
47.34B
2.45B
141.68C
ISA 69 EC 10.03d
0.499abc
293.07ab
80.41bcde
48.91abcde
3.70ab
147.33a
Brown 69 ECS 10.37bcd
0.504ab
308.91a
84.74a
50.87a
4.45ab
146.00abc
Average 10.20D
0.501AB
300.99A
82.57A
49.89A
4.08AB
146.67A
Bovans 69 EC 10.64abc
0.473abc
296.33ab
81.30bcd
49.06abcd
3.57ab
146.43ab
Brown 69 ECS 10.96a
0.472abc
299.50ab
82.12abc
49.92ab
5.56ab
146.00abc
Average 10.80A
0.472BC
297.92AB
81.74A
49.49A
4.56AB
146.21A
All 69 EC 10.58Z
0.489
292.28 80.13 47.80 6.01 144.51
Strains 69 ECS 10.35Y
0.482
294.78 80.86 48.09 4.39 144.49 Enrichable Cage=EC; Enriched Colony Housing System=ECS.
ABCD - Different letters denote significant differences (P<.01), comparisons made among strain average values.
abcdefgh - Different letters denote significant differences (P<.01) in the strain*production system interactions YZ - Different letters denote significant differences (P<.01), comparisons made among production system average values.
Mortality percentage prior to analyzes was transformed in Square Root Asin

48
TABLE 43. EFFECT OF BROWN EGG STRAIN AND PRODUCTION SYSTEM ON EGG
WEIGHT AND EGG SIZE DISTRIBUTION OF HENS IN THE 39th NCLP&MT (119-
483 DAYS) IN ENRICHABLE AND ENRICHED COLONY HOUSING SYSTEMS
Production Egg Pee
Extra
Breeder System Weight Wee Small Medium Large Large
(Strain) (g/egg) (%) (%) (%) (%) (%)
TETRA 69 EC 56.83cd
0.03 7.10a
21.67ab
29.24 41.57c
Amber 69 ECS 56.51cd
0.48 7.88a
22.25abc
28.06 41.13c
Average 56.67B
0.26 7.49A
21.96A
28.65ABC
41.35B
TETRA 69 EC 59.15ab
0 4.77ab
15.67bcde
26.61 52.67ab
Brown 69 ECS 58.56abc
0 4.38ab
15.79bcde
28.77 51.00ab
Average 58.86A
0 4.58ABC
15.73B
27.69ABC
51.83A
Novogen 69 EC 59.91a
0 3.66ab
11.89de
26.09 57.92a
Brown 69 ECS 60.19a
0 3.24ab
13.49de
25.86 57.09a
Average 60.05A
0 3.45BC
12.69B
25.98BC
57.51A
Lohmann 69 EC 59.03a
0 5.78ab
12.78de
24.97 56.24a
LB-Lite 69 ECS 59.04ab
0 4.96ab
13.32de
24.27 56.92a
Average 59.04A
0 5.37AB
13.05B
24.62C
56.58A
Hy-Line 69 EC 57.12bcd
0.12 4.50ab
19.23abcd
32.75 43.29bc
Silver Brown 69 ECS 55.56d
0.01 4.46ab
25.31a
31.84 38.47c
Average 56.49B
0.06 4.48ABC
22.27A
32.30A
40.88B
Hy-Line 69 EC 59.42a
0.05 2.31b
15.59de
30.00 53.74a
Brown 69 ECS 59.50a
0 1.61b
12.23de
31.83 53.86a
Average 59.46A
0.08 1.96C
12.91B
30.92AB
53.80A
ISA 69 EC 59.90a
0 4.37ab
11.43e
27.59 56.40a
Brown 69 ECS 58.96a
0.51 2.80ab
14.40cde
28.69 53.25a
Average 59.43A
0.25 3.58BC
12.92B 28.14
ABC 54.82
A
Bovans 69 EC 59.48a
0.03 3.70ab
15.53bcde
25.57 54.80a
Brown 69 ECS 60.44a
0 3.60ab
13.83de
26.51 55.78a
Average 59.96A
0.02 3.65BC
14.68B
26.04BC
55.29A
All 69 EC 58.86 0.04 4.52 15.22 27.85 52.08
Strains 69 ECS 58.63 0.12 4.12 16.33 28.23 50.94 Enrichable Cage=EC; Enriched Colony Housing System=ECS.
ABC - Different letters denote significant differences (P<.01), comparisons made among strain average values.
abcde - Different letters denote significant differences (P<.01) in the strain*production system interactions.

49
TABLE 44. EFFECT OF BROWN EGG STRAIN AND PRODUCTION SYSTEM ON EGG
QUALITY, INCOME AND FEED COSTS OF HENS IN THE 39th NCLP&MT (119-
483 DAYS) IN ENRICHABLE AND ENRICHED COLONY HOUSING SYSTEMS
Production Grade Grade
Egg Feed
Breeder System A B Cracks Loss Income Costs
(Strain) (%) (%) (%) (%) ($/hen) ($/hen)
TETRA 69 EC 96.13abc
0.34 2.90bcd
0.66 32.45abc
15.48ab
Amber 69 ECS 92.58d
0.42 6.62a 0.38 30.55
c 15.68
ab
Average 94.35 0.38 4.76 0.52 31.50B
15.58AB
TETRA 69 EC 95.33abcd
0.20 3.83abcd
0.63 31.09bc
15.09ab
Brown 69 ECS 92.87bcd
0.60 5.87abc
0.70 31.43abc
15.38ab
Average 94.10 0.40 4.85 0.67 31.26B
15.23AB
Novogen 69 EC 96.50abc
0.34 2.58cd
0.62 33.61abc
15.21ab
Brown 69 ECS 92.70d
0.62 5.94ab
0.72 33.35abc
15.55ab
Average 94.60 0.48 4.26 0.67 33.50AB
15.38AB
Lohmann 69 EC 96.70ab
0.45 2.32d
0.50 34.44ab
15.34ab
LB-Lite 69 ECS 92.92cd
0.38 5.52abcd
1.18 33.06abc
15.34ab
Average 94.81 0.41 3.92 0.84 33.75A
15.34AB
Hy-Line 69 EC 97.05a
0.08 2.65bcd
0.22 33.45abc
15.61ab
Silver Brown 69 ECS 95.20abcd
0.10 4.70abcd
0 33.45abc
15.97ab
Average 96.12 0.09 3.68 0.11 33.45AB
15.79AB
Hy-Line 69 EC 95.85abcd
0.37 3.27bcd
0.57 32.45abc
15.23ab
Brown 69 ECS 94.06abcd
0.22 5.20abcd
0.56 32.74abc
15.76ab
Average 94.96 0.29 4.23 0.56 32.59AB
15.50AB
ISA 69 EC 95.93abcd
0.98 2.57cd
0.52 33.59abc
14.83b
Brown 69 ECS 94.06abcd
0.22 5.30abcd
0.44 34.95a
15.36ab
Average 95.00 0.60 3.93 0.48 34.27A
15.10B
Bovans 69 EC 95.44abcd
0.43 3.43bcd
0.68 33.49abc
15.75ab
Brown 69 ECS 94.70abcd
0.16 4.48abcd
0.68 33.91abc
16.22a
Average 95.07 0.29 3.95 0.68 33.70A
15.99A
All 69 EC 96.12Y
0.40 2.94Y
0.58 33.07 15.66Y
Strains 69 ECS 93.63Z
0.34 5.45Z 0.55 32.94 15.32
Z
Enrichable Cage=EC; Enriched Colony Housing System=ECS.
AB - Different letters denote significant differences (P<.01), comparisons made among strain average values.
abcd - Different letters denote significant differences (P<.01) in the strain*production system interactions. YZ - Different letters denote significant differences (P<.01), comparisons made among production system average values.

50
TABLE 45. EFFECT OF WHITE EGG STRAIN AND PRODUCTION SYSTEM ON PERFORMANCE
OF HENS IN THE 39th NCLP&MT (483-511 DAYS) IN ENRICHABLE AND ENRICHED
COLONY HOUSING SYSTEMS
Eggs
Production Feed Feed Per Bird Egg Egg
Breeder System Consumption Conversion Housed Production Mass Mortality*
(Strain) (kg/100/hen/d) (g egg/g feed)
(HD%) (g/HD) (%)
Bovans 69 EC 11.45abc
0.476ab
24.85a
87.38ab
54.56ab
3.33
White 69 ECS 11.25abc
0.468ab
23.68ab
83.69ab
52.82ab
1.39
Average 11.35AB
0.472AB
24.27 85.53 53.69 2.36
Shaver 69 EC 10.70bc
0.478ab
22.22ab
78.85ab
50.87ab
0.93
White 69 ECS 11.89abc
0.455ab
24.15ab
83.16ab
53.75ab
3.47
Average 11.30AB
0.467AB
23.18 81.00 52.31 2.20
Dekalb 69 EC 11.20abc
0.490ab
24.38ab
86.98ab
54.91ab
0.56
White 69 ECS 11.10abc
0.495ab
24.41ab
85.55ab
54.68ab
1.39
Average 11.15AB
0.492AB
24.40 86.76 54.79 0.97
Babcock 69 EC 10.7bc
0.521a
25.04a
87.97a
56.00ab
1.85
White 69 ECS 12.82a
0.415ab
23.30ab
82.46ab
52.98ab
2.08
Average 11.78A
0.468AB
24.17 85.22 54.49 1.97
ISA 69 EC 10.98abc
0.522a
24.93a
89.02a
57.06a
0
B-400 69 ECS 10.98abc
0.510ab
24.32ab
86.43ab
56.10ab
0.70
Average 10.98AB
0.516A
24.62 87.73 56.58 0.35
Hy-Line 69 EC 10.34c
0.497ab
22.47ab
80.26ab
51.25ab
0
W-36 69 ECS 10.08c
0.480ab
21.59ab
79.10ab
48.55ab
0
Average 10.21B
0.488AB
22.03 78.68 49.90 0
Hy-Line 69 EC 11.09abc
0.488ab
22.93ab
81.91ab
53.42ab
0
CV-24 69 ECS 12.16ab
0.442ab
22.97ab
82.02ab
53.75ab
0.70
Average 11.62A
0.465AB
22.95 81.96 53.59 0.35
Lohmann 69 EC 11.95abc
0.460ab
24.35ab
83.23ab
55.24ab
4.86
LSL Lite 69 ECS 11.86abc
0.388b
19.92b
71.13b
45.64b
0
Average 11.90A
0.424B
22.13 77.18 50.44 2.43
H&N 69 EC 11.27abc
0.493ab
23.89ab
85.27ab
55.49ab
0.46
Nick Chick 69 ECS 12.03abc
0.458ab
23.96ab
84.76ab
55.11ab
0.70
Average 11.65A
0.475AB
23.92 85.10 55.30 0.58
Novogen 69 EC 11.28abc
0.500ab
24.74ab
86.12ab
56.27ab
1.12
White 69 ECS 11.77abc
0.428ab
22.04ab
76.92ab
50.25ab
1.67
Average 11.53A
0.464AB
23.16 81.52 53.26 1.39
All 69 EC 11.10Z
0.492Z
23.93 84.70 54.51 1.31
Strains 69 ECS 11.59Y
0.454Y
23.03 81.42 52.36 1.21 Enrichable Cage=EC; Enriched Colony Housing System=ECS AB - Different letters denote significant differences (P<.01), comparisons made among strain average values.
abc - Different letters denote significant differences (P<.01) in the strain*production system interactions.
YZ - Different letters denote significant differences (P<.01), comparisons made among production system average values.

51
TABLE 46. EFFECT OF WHITE EGG STRAIN AND PRODUCTION SYSTEM ON EGG
WEIGHT AND EGG SIZE DISTRIBUTION OF HENS IN THE 39th NCLP&MT (483-
511 DAYS) IN ENRICHABLE AND ENRICHED COLONY HOUSING SYSTEMS
Production Egg Pee
Extra
Breeder System Weight Wee Small Medium Large Large
(Strain) (g/egg) (%) (%) (%) (%) (%)
Bovans 69 EC 62.47b
0 0 0.66 32.00 56.00
White 69 ECS 63.08ab
0 0 0 31.71 58.56
Average 62.77B 0 0 0.33 31.86 57.28
Shaver 69 EC 64.52ab
0 0 0 24.13 68.77
White 69 ECS 64.61ab
0 0 0.83 9.28 72.24
Average 64.56AB
0 0 0.42 16.71 70.50
Dekalb 69 EC 63.17ab
0 0 0 33.63 60.90
White 69 ECS 63.18ab
0 0 0 34.29 57.44
Average 63.17AB
0 0 0 33.96 59.17
Babcock 69 EC 63.66ab
0 0 0 28.26 66.74
White 69 ECS 64.23ab
0 0 0 19.77 67.44
Average 63.94AB
0 0 0 24.01 67.09
ISA 69 EC 64.10ab
0 0 0 26.52 67.93
B-400 69 ECS 64.90ab
0 0 0 13.92 74.68
Average 64.50AB
0 0 0 20.22 71.30
Hy-Line 69 EC 63.85ab
0 0 0 27.21 66.50
W-36 69 ECS 62.97ab
0 0 0 12.39 74.28
Average 63.41AB
0 0 0 19.80 70.39
Hy-Line 69 EC 65.18ab
0 0 0 26.41 68.05
CV-24 69 ECS 65.61ab
0 0 0 13.50 76.18
Average 65.39A
0 0 0 19.96 72.11
Lohmann 69 EC 66.29a 0 0 0 5.98 85.44
LSL Lite 69 ECS 64.05ab
0 0 0 21.19 67.32
Average 65.17A
0 0 0 13.58 76.38
H&N 69 EC 64.98ab
0 0 0 16.40 78.24
Nick Chick 69 ECS 65.07ab
0 0 0 13.33 75.00
Average 65.02AB
0 0 0 14.87 76.62
Novogen 69 EC 65.33ab
0 0 0 19.33 76.67
White 69 ECS 65.48ab
0 0 0 8.40 76.48
Average 65.41A
0 0 0 13.87 76.57
All 69 EC 64.36 0 0 0.07 23.99 69.52
Strains 69 ECS 64.31 0 0 0.08 17.78 69.96 Enrichable Cage=EC; Enriched Colony Housing System=ECS.
AB - Different letters denote significant differences (P<.01), comparisons made among strain average values. ab - Different letters denote significant differences (P<.01) in the strain* production system interactions

52
TABLE 47. EFFECT OF WHITE EGG STRAIN AND PRODUCTION SYSTEM ON EGG
QUALITY, INCOME AND FEED COSTS OF HENS IN THE 39th NCLP&MT (483-511
DAYS) IN ENRICHABLE AND ENRICHED COLONY HOUSING SYSTEMS
Production Grade Grade
Egg Feed
Breeder System A B Cracks Loss Income Costs
(Strain) (%) (%) (%) (%) ($/hen) ($/hen)
Bovans 69 EC 88.67 0 10.66 0.67 2.74ab
1.28abc
White 69 ECS 90.27 0 8.80 0.92 2.69ab
1.26abc
Average 89.47 0 9.73 0.80 2.74 1.27AB
Shaver 69 EC 92.90 0 6.43 0.67 2.56ab
1.20bc
White 69 ECS 82.36 0.86 14.28 2.50 2.60ab
1.33abc
Average 87.63 0.43 10.36 1.58 2.58 1.26AB
Dekalb 69 EC 94.53 0 4.63 0.83 2.83ab
1.25abc
White 69 ECS 91.73 0 7.27 1.00 2.78ab
1.24abc
Average 93.13 0 5.95 0.92 2.80 1.25AB
Babcock 69 EC 95.00 0 4.44 0.56 2.92a
1.20bc
White 69 ECS 87.22 0 11.11 1.67 2.59ab
1.44a
Average 91.11 0 7.78 1.11 2.75 1.32A
ISA 69 EC 94.46 0 4.21 1.33 2.89a
1.23abc
B-400 69 ECS 88.60 1.04 8.63 1.72 2.73ab
1.23abc
Average 91.53 0.52 6.42 1.53 2.81 1.23AB
Hy-Line 69 EC 93.71 0 4.70 1.59 2.58ab
1.16c
W-36 69 ECS 86.67 0 13.33 0 2.42ab
1.13c
Average 90.19 0 9.02 0.80 2.50 1.14B
Hy-Line 69 EC 94.46 1.25 2.86 1.43 2.65ab
1.24abc
CV-24 69 ECS 89.68 0 9.45 0.86 2.60ab
1.36ab
Average 92.07 0.62 6.15 1.14 2.63 1.30A
Lohmann 69 EC 91.42 0 8.58 0 2.80ab
1.34abc
LSL Lite 69 ECS 88.52 0 11.48 0 2.56b
1.33abc
Average 89.97 0 10.03 0 2.53 1.33A
H&N 69 EC 94.64 0.56 3.65 1.15 2.77ab
1.26abc
Nick Chick 69 ECS 88.33 0 9.79 1.88 2.69ab
1.35abc
Average 91.48 0.28 6.72 1.51 2.73 1.31A
Novogen 69 EC 96.00 0 4.00 0 2.85a
1.26abc
White 69 ECS 84.88 2.00 11.79 1.33 2.43ab
1.32abc
Average 90.44 1.00 7.90 0.67 2.64 1.29A
All 69 EC 93.58Y
0.18 5.42Y
0.82 2.76Y
1.24Z
Strains 69 ECS 87.82Z
0.39 10.59Z
1.19 2.58Z
1.30Y
Enrichable Cage=EC; Enriched Colony Housing System=ECS. AB - Different letters denote significant differences (P<.01), comparisons made among strain average values.
abc - Different letters denote significant differences (P<.01) in the strain* production system interactions.
YZ - Different letters denote significant differences (P<.01), comparisons made among production system average values.

53
TABLE 48. EFFECT OF BROWN EGG STRAIN AND PRODUCTION SYSTEM ON PERFORMANCE
OF HENS IN THE 39th NCLP&MT (483-511 DAYS) IN ENRICHABLE AND ENRICHED
COLONY HOUSING SYSTEMS
Eggs
Production Feed Feed Per Bird Egg Egg
Breeder System Consumption Conversion Housed Production Mass Mortality
(Strain) (kg/100/hen/d) (g egg/g feed)
(HD%) (g/HD) (%)
TETRA 69 EC 10.87ab
0.454ab
22.79 80.67 49.36 1.59
Amber 69 ECS 11.86a 0.382
b 20.61 73.60 45.41 0
Average 11.36 0.418 21.70 77.14 47.39 0.79
TETRA 69 EC 11.22ab
0.427ab
21.57 75.11 48.03 2.78
Brown 69 ECS 11.19ab
0.420ab
20.77 73.92 46.74 0.93
Average 11.21 0.423 21.17 74.52 47.38 1.85
Novogen 69 EC 11.01ab
0.458ab
22.50 79.45 50.31 1.67
Brown 69 ECS 11.53ab
0.436ab
21.96 77.24 50.26 1.67
Average 11.27 0.447 22.23 78.35 50.29 1.67
Lohmann 69 EC 10.97ab
0.473a
23.19 82.74 52.07 0.62
LB-Lite 69 ECS 11.70ab
0.442ab
22.71 79.98 51.61 2.08
Average 11.33 0.458 22.95 81.36 51.84 1.35
Hy-Line 69 EC 11.54ab
0.447ab
23.52 83.98 51.56 0
Silver Brown 69 ECS 11.75ab
0.425ab
22.87 81.68 49.88 0
Average 11.64 0.436 23.19 82.83 50.72 0
Hy-Line 69 EC 10.33b
0.455ab
21.14 75.20 47.16 0.93
Brown 69 ECS 11.54ab
0.414ab
21.08 75.28 47.49 0
Average 10.94 0.434 21.11 75.24 47.52 0.46
ISA 69 EC 10.68ab
0.462a
22.18 77.83 49.31 2.32
Brown 69 ECS 10.93ab
0.464a
22.91 81.46 50.72 0.56
Average 10.80 0.463 22.54 79.65 50.02 1.44
Bovans 69 EC 11.48ab
0.446ab
22.38 79.78 50.93 0.79
Brown 69 ECS 11.86a
0.438ab
22.93 81.76 52.00 0.56
Average 11.67 0.442 22.66 80.77 51.46 0.68
All 69 EC 11.01Z
0.453Z
22.41 79.35 49.84 1.34
Strains 69 ECS 11.54Y
0.428Y
21.98 78.12 49.31 0.72 Enrichable Cage=EC; Enriched Colony Housing System=ECS. ab - Different letters denote significant differences (P<.01) in the strain* production system interactions.
YZ - Different letters denote significant differences (P<.01), comparisons made among production system average values.

54
TABLE 49. EFFECT OF BROWN EGG STRAIN AND PRODUCTION SYSTEM ON EGG
WEIGHT AND EGG SIZE DISTRIBUTION OF HENS IN THE 39th NCLP&MT (483-
511 DAYS) IN ENRICHABLE AND ENRICHED COLONY HOUSING SYSTEMS
Production Egg Pee
Extra
Breeder System Weight Wee Small Medium Large Large
(Strain) (g/egg) (%) (%) (%) (%) (%)
TETRA 69 EC 61.16cd
0 0 1.12 49.85a
44.23b
Amber 69 ECS 61.70bcd
0 0 2.76 32.62ab
55.08ab
Average 61.43BC
0 0 1.94A
41.23AB
49.65B
TETRA 69 EC 63.96abcd
0 0 0 22.67ab
66.32ab
Brown 69 ECS 63.21abcd
0 0 0 20.68ab
62.92ab
Average 63.59A
0 0 0B
21.68B
64.64AB
Novogen 69 EC 63.40abcd
0 0 0 33.32ab
64.58ab
Brown 69 ECS 65.05a
0 0 0.71 12.32b
74.63a
Average 64.23A
0 0 0.36AB
22.82B
69.61A
Lohmann 69 EC 62.93abcd
0 0 0.46 33.40ab
62.02ab
LB-Lite 69 ECS 64.54ab
0 0 0 18.18ab
69.48ab
Average 63.73A
0 0 0.28AB
25.79B
65.77AB
Hy-Line 69 EC 61.39bcd
0 0 0.83 49.84a
46.82ab
Silver Brown 69 ECS 61.10cd
0 0 0 46.88a
48.75ab
Average 61.25C
0 0 0.42AB
48.36A
47.79B
Hy-Line 69 EC 62.72abcd
0 0 0 35.37ab
57.72ab
Brown 69 ECS 63.55abcd
0 0 0 21.20ab
67.49ab
Average 63.14AB
0 0 0B
28.29AB
62.60AB
ISA 69 EC 63.36abcd
0 0 0 34.47ab
63.23ab
Brown 69 ECS 62.28abcd
0 0 0 38.06ab
50.48ab
Average 62.82ABC
0 0 0B
36.26AB
56.86AB
Bovans 69 EC 63.87abcd
0 0 0 33.25ab
64.28ab
Brown 69 ECS 63.60abcd
0 0 0 24.12ab
63.00ab
Average 63.74A
0 0 0B
28.68AB
63.64AB
All 69 EC 62.85 0 0 0.31 36.25Y
58.66
Strains 69 ECS 63.13 0 0 0.43 26.76Z
61.48 Enrichable Cage=EC; Enriched Colony Housing System=ECS. ABC - Different letters denote significant differences (P<.01), comparisons made among strain average values.
abcd - Different letters denote significant differences (P<.01) in the strain* production system interactions.
YZ - Different letters denote significant differences (P<.01), comparisons made among production system average values.

55
TABLE 50. EFFECT OF BROWN EGG STRAIN AND PRODUCTION SYSTEM ON EGG
QUALITY, INCOME AND FEED COSTS OF HENS IN THE 39th NCLP&MT (483-
511 DAYS) IN ENRICHABLE AND ENRICHED COLONY HOUSING SYSTEMS
Production Grade Grade
Egg Feed
Breeder System A B Cracks Loss Income Costs
(Strain) (%) (%) (%) (%) ($/hen) ($/hen)
TETRA 69 EC 95.20 0 4.80 0 2.65 1.22
Amber 69 ECS 90.45 0 8.59 0.96 2.32 1.33
Average 92.82 0 6.69 0.48 2.48AB
1.27
TETRA 69 EC 89.00 0 11.00 0 2.44 1.26
Brown 69 ECS 83.64 0 16.36 0 2.29 1.25
Average 86.32 0 13.68 0 2.37B
1.25
Novogen 69 EC 97.91 1.33 2.09 0 2.67 1.23
Brown 69 ECS 87.67 0 11.00 0 2.47 1.29
Average 92.79 0.67 6.55 0 2.57AB
1.26
Lohmann 69 EC 96.02 0.64 3.34 0 2.72 1.23
LB-Lite 69 ECS 87.66 0 12.34 0 2.56 1.31
Average 91.84 0.32 7.84 0 2.64A
1.27
Hy-Line 69 EC 97.50 0 2.50 0 2.76 1.29
Silver Brown 69 ECS 95.62 0 4.38 0 2.67 1.32
Average 96.56 0 3.44 0 2.72A
1.30
Hy-Line 69 EC 93.09 0 4.01 2.90 2.40 1.16
Brown 69 ECS 88.70 0 11.30 0 2.38 1.29
Average 90.89 0 7.66 1.45 2.39B
1.22
ISA 69 EC 97.70 0.56 1.74 0 2.62 1.20
Brown 69 ECS 88.54 0 10.79 0.66 2.57 1.22
Average 93.12 0.28 6.27 0.33 2.60AB
1.21
Bovans 69 EC 97.53 0 1.97 0.49 2.64 1.28
Brown 69 ECS 87.12 0 9.48 3.41 2.52 1.33
Average 92.33 0 5.72 1.95 2.58AB
1.30
All 69 EC 95.49Y
0.15 3.93Y
0.42 2.61Y
1.23Z
Strains 69 ECS 88.67Z
0.17 10.53Z
0.63 2.47Z
1.29Y
Enrichable Cage=EC; Enriched Colony Housing System=ECS. AB - Different letters denote significant differences (P<.01), comparisons made among strain average values.
YZ - Different letters denote significant differences (P<.01), comparisons made among production system average values.

56
TABLE 51. EFFECT OF WHITE EGG STRAIN AND PRODUCTION SYSTEM ON PERFORMANCE
OF HENS IN THE 39th NCLP&MT (511-763 DAYS) IN ENRICHABLE AND ENRICHED
COLONY HOUSING SYSTEMS
Eggs
Production Feed Feed Per Bird Egg Egg
Breeder System Consumption Conversion Housed Production Mass Mortality*
(Strain) (kg/100/hen/d) (g egg/g feed)
(HD%) (g/HD) (%)
Bovans 69 EC 116.59bcde
0.42abcde
193.27 75.46ab
48.99abc
11.68
White 69 ECS 119.53abcde
0.40abcdef
188.90 73.81abcd
48.04abc
6.95
Average 118.06ABC
0.41 191.09A 74.63
A 48.51
A 9.31
Shaver 69 EC 113.85def
0.41abcdef
177.57 68.54cdef
45.23cde
20.84
White 69 ECS 120.59abcde
0.39abcdef
183.66 71.19abcde
47.08abc
d 12.51
Average 117.22ABC
0.40 180.61AB
69.86A 46.16
A 16.67
Dekalb 69 EC 116.11bcde
0.43abc
194.69 76.08a 49.38
abc 7.41
White 69 ECS 114.09cdef
0.41abcdef
185.22 72.07abcd
46.62abc
d 13.90
Average 115.10BC
0.42 189.95A 74.08
A 48.00
A 10.65
Babcock 69 EC 115.00cdef
0.44a 194.72 76.00
a 49.92
ab 10.04
White 69 ECS 126.39ab
0.39cdef
186.77 72.73abcd
48.21abc
17.37
Average 120.69AB
0.42 190.75A 74.37
A 49.06
A 13.70
ISA 69 EC 111.00efg
0.43abc
187.39 72.87abcd
47.37abc
11.90
B-400 69 ECS 113.90def
0.42abcde
187.04 72.77abcd
47.71abc
13.61
Average 112.35C 0.42 187.21
A 72.82
A 47.54
A 12.75
Hy-Line 69 EC 103.20g 0.42
abcdef 156.24 64.68
ef 42.71
de 8.50
W-36 69 ECS 103.75fg
0.39bcdef
165.18 61.11f 40.12
e 9.26
Average 103.48D 0.40 160.71
B 62.90
B 41.41
B 8.88
Hy-Line 69 EC 117.60abde
0.43ab
192.71 75.14abc
50.21ab
15.56
CV-24 69 ECS 116.74bcde
0.39bcdef
171.74 67.08def
45.49bcd
e 11.11
Average 117.17ABC
0.41 182.22AB
71.10A 47.85
A 13.34
Lohmann 69 EC 118.14abcde
0.43abcd
190.51 74.35abcd
49.63abc
11.11
LSL Lite 69 ECS 127.83a 0.37
f 180.36 70.17
abcde 47.37
abc 18.06
Average 122.99A 0.40 185.44
AB 72.26
A 48.50
A 14.59
H&N 69 EC 117.21bcde
0.42abcde
184.76 71.93abcd
48.77abc
12.51
Nick Chick 69 ECS 122.37abcd
0.38ef 176.32 68.54
bcdef 45.73
bcd 13.20
Average 119.79AB
0.40 180.54AB
70.23A 47.25
A 12.86
Novogen 69 EC 119.80abcde
0.42abcd
194.34 75.43abc
50.66a 15.57
White 69 ECS 124.85abc
0.38def
182.65 70.25abcde
47.51abc
16.12
Average 122.33A 0.40 188.50
A 72.84
A 49.08
A 15.84
All 69 EC 114.83Y 0.42
Z 187.51 73.05
Y 48.29
Y 12.68
Strains 69 ECS 119.05Z 0.39
Y 179.89 69.97
Z 46.39
Z 13.03
Enrichable Cage=EC; Enriched Colony Housing System=ECS
ABCD. - Different letters denote significant differences (P<.01), comparisons made among strain average values. abcdefg - Different letters denote significant differences (P<.01) in the strain*production system interactions.
YZ - Different letters denote significant differences (P<.01), comparisons made among production system average values.
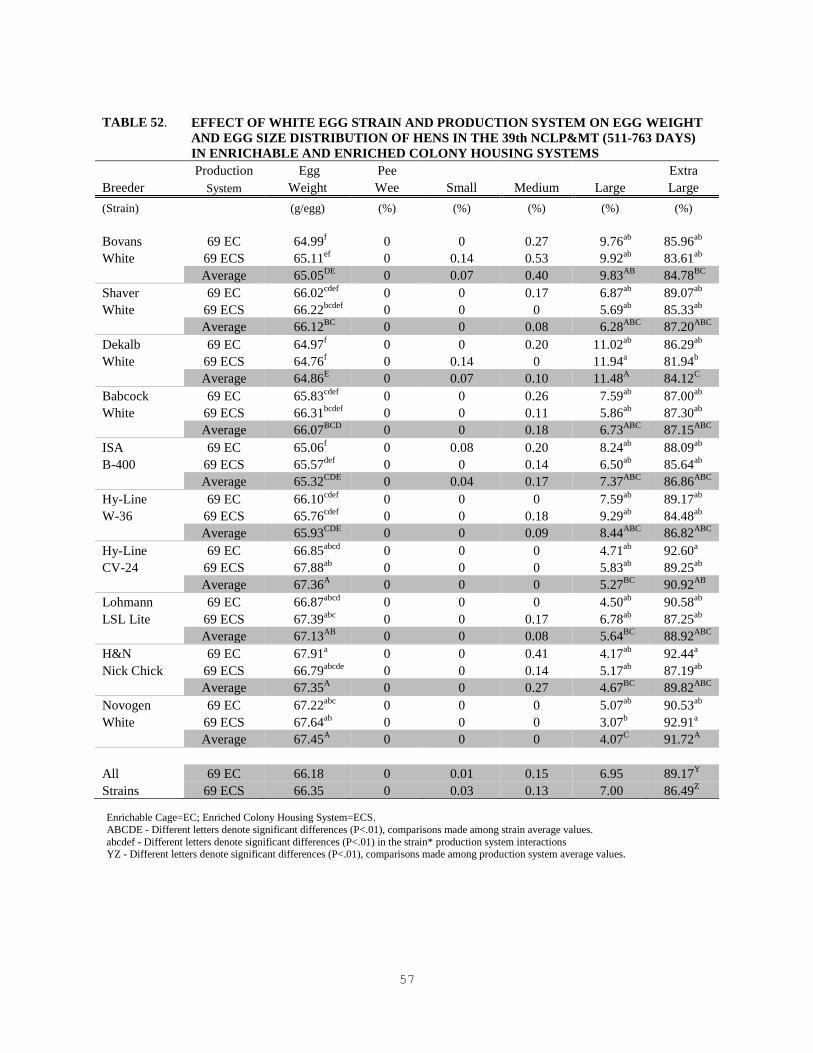
57
TABLE 52. EFFECT OF WHITE EGG STRAIN AND PRODUCTION SYSTEM ON EGG WEIGHT
AND EGG SIZE DISTRIBUTION OF HENS IN THE 39th NCLP&MT (511-763 DAYS)
IN ENRICHABLE AND ENRICHED COLONY HOUSING SYSTEMS
Production Egg Pee
Extra
Breeder System Weight Wee Small Medium Large Large
(Strain) (g/egg) (%) (%) (%) (%) (%)
Bovans 69 EC 64.99f 0 0 0.27 9.76
ab 85.96
ab
White 69 ECS 65.11ef 0 0.14 0.53 9.92
ab 83.61
ab
Average 65.05DE
0 0.07 0.40 9.83AB
84.78BC
Shaver 69 EC 66.02cdef
0 0 0.17 6.87ab
89.07ab
White 69 ECS 66.22bcdef
0 0 0 5.69ab
85.33ab
Average 66.12BC
0 0 0.08 6.28ABC
87.20ABC
Dekalb 69 EC 64.97f 0 0 0.20 11.02
ab 86.29
ab
White 69 ECS 64.76f 0 0.14 0 11.94
a 81.94
b
Average 64.86E 0 0.07 0.10 11.48
A 84.12
C
Babcock 69 EC 65.83cdef
0 0 0.26 7.59ab
87.00ab
White 69 ECS 66.31bcdef
0 0 0.11 5.86ab
87.30ab
Average 66.07BCD
0 0 0.18 6.73ABC
87.15ABC
ISA 69 EC 65.06f 0 0.08 0.20 8.24
ab 88.09
ab
B-400 69 ECS 65.57def
0 0 0.14 6.50ab
85.64ab
Average 65.32CDE
0 0.04 0.17 7.37ABC
86.86ABC
Hy-Line 69 EC 66.10cdef
0 0 0 7.59ab
89.17ab
W-36 69 ECS 65.76cdef
0 0 0.18 9.29ab
84.48ab
Average 65.93CDE
0 0 0.09 8.44ABC
86.82ABC
Hy-Line 69 EC 66.85abcd
0 0 0 4.71ab
92.60a
CV-24 69 ECS 67.88ab
0 0 0 5.83ab
89.25ab
Average 67.36A 0 0 0 5.27
BC 90.92
AB
Lohmann 69 EC 66.87abcd
0 0 0 4.50ab
90.58ab
LSL Lite 69 ECS 67.39abc
0 0 0.17 6.78ab
87.25ab
Average 67.13AB
0 0 0.08 5.64BC
88.92ABC
H&N 69 EC 67.91a 0 0 0.41 4.17
ab 92.44
a
Nick Chick 69 ECS 66.79abcde
0 0 0.14 5.17ab
87.19ab
Average 67.35A 0 0 0.27 4.67
BC 89.82
ABC
Novogen 69 EC 67.22abc
0 0 0 5.07ab
90.53ab
White 69 ECS 67.64ab
0 0 0 3.07b 92.91
a
Average 67.45A 0 0 0 4.07
C 91.72
A
All 69 EC 66.18 0 0.01 0.15 6.95 89.17Y
Strains 69 ECS 66.35 0 0.03 0.13 7.00 86.49Z
Enrichable Cage=EC; Enriched Colony Housing System=ECS.
ABCDE - Different letters denote significant differences (P<.01), comparisons made among strain average values.
abcdef - Different letters denote significant differences (P<.01) in the strain* production system interactions YZ - Different letters denote significant differences (P<.01), comparisons made among production system average values.

58
TABLE 53. EFFECT OF WHITE EGG STRAIN AND PRODUCTION SYSTEM ON EGG
QUALITY, INCOME AND FEED COSTS OF HENS IN THE 39th NCLP&MT (511-763
DAYS) IN ENRICHABLE AND ENRICHED COLONY HOUSING SYSTEMS
Production Grade Grade
Egg Feed
Breeder System A B Cracks Loss Income Costs
(Strain) (%) (%) (%) (%) ($/hen) ($/hen)
Bovans 69 EC 92.52ab
0.40 5.78c 1.30 21.13 10.86
White 69 ECS 89.82abc
0.31 8.65bc
1.22 21.07 11.11
Average 91.17AB
0.36 7.21BC
1.26 21.10 10.98A
Shaver 69 EC 91.52ab
0.33 7.71c 0.44 21.15 10.58
White 69 ECS 80.58d 0.36 16.79
a 2.28 20.82 11.24
Average 86.05C 0.34 12.25
A 1.36 20.98 10.91
A
Dekalb 69 EC 95.46a 0.78 3.54
c 0.22 22.24 10.81
White 69 ECS 88.55abc
0.41 9.50bc
1.55 21.74 10.60
Average 92.00AB
0.60 6.52BC
0.88 21.99 10.70AB
Babcock 69 EC 92.22ab
0.26 6.56c 0.95 21.20 10.69
White 69 ECS 87.79bcd
0.42 9.58bc
2.22 21.16 11.82
Average 90.00ABC
0.34 8.07BC
1.58 21.18 11.25A
ISA 69 EC 93.76ab
0.65 5.10c 0.49 20.15 10.32
B-400 69 ECS 83.12cd
0.29 14.79ab
1.81 18.35 10.60
Average 88.44BC
0.47 9.94AB
1.15 19.25 10.46AB
Hy-Line 69 EC 93.42ab
0.15 4.81c 1.60 20.62 9.58
W-36 69 ECS 88.13abcd
0.40 10.00abc
1.47 20.47 9.67
Average 90.78ABC
0.28 7.41BC
1.54 20.54 9.62B
Hy-Line 69 EC 95.49a 0 4.08
c 0.43 22.24 10.96
CV-24 69 ECS 91.61ab
0.33 6.80c 1.26 20.40 10.90
Average 93.55A 0.16 5.44
C 0.84 21.32 10.93
A
Lohmann 69 EC 90.60abc
0.91 7.08c 1.41 22.06 10.99
LSL Lite 69 ECS 88.68abc
0.20 9.60bc
1.52 21.32 11.90
Average 89.64ABC
0.56 8.34ABC
1.47 21.69 11.44A
H&N 69 EC 92.99ab
1.21 4.92c 0.88 19.57 10.92
Nick Chick 69 ECS 87.05bcd
0.23 9.84bc
2.88 22.66 11.41
Average 90.01ABC
0.72 7.38BC
1.88 21.12 11.17A
Novogen 69 EC 92.10ab
0.73 5.60c 1.58 19.69 11.14
White 69 ECS 91.54ab
0.79 7.08c 0.59 15.61 11.62
Average 91.82AB
0.76 6.34BC
1.08 17.65 11.38A
All 69 EC 93.00Y 0.54 5.52 0.93
Y 21.00 10.69
Y
Strains 69 ECS 87.69Z 0.37 10.26 1.68
Z 20.36 11.09
Z
Enrichable Cage=EC; Enriched Colony Housing System=ECS. ABC - Different letters denote significant differences (P<.01), comparisons made among strain average values.
abcd - Different letters denote significant differences (P<.01) in the strain* production system interactions. YZ - Different letters denote significant differences (P<.01), comparisons made among production system average values.

59
TABLE 54. EFFECT OF BROWN EGG STRAIN AND PRODUCTION SYSTEM ON PERFORMANCE
OF HENS IN THE 39th NCLP&MT (511-763 DAYS) IN ENRICHABLE AND ENRICHED
COLONY HOUSING SYSTEMS
Eggs
Production Feed Feed Per Bird Egg Egg
Breeder System Consumption Conversion Housed
Produc-
tion Mass
Mortali-
ty
(Strain) (kg/100/hen/d) (g egg/g feed)
(HD%) (g/HD) (%)
TETRA 69 EC 113.29cde
0.35bcdef
162.70ab
63.44abc
40.06bcd
11.12
Amber 69 ECS 123.36ab
0.29g 146.45
b 56.84
c 36.37
d 15.98
Average 118.32ABC
0.32E 154.58
B 60.14
C 38.21
C 13.55
TETRA 69 EC 117.30bcde
0.34defg
157.51ab
60.85abc
39.46bcd
18.53
Brown 69 ECS 124.54ab
0.32efg
156.54ab
60.94abc
39.88bcd
14.82
Average 120.92ABC
0.33DE
157.03AB
60.89BC
39.67BC
16.68
Novogen 69 EC 109.19e 0.39
ab 164.10
ab 64.28
abc 42.40
abc 5.56
Brown 69 ECS 122.47ab
0.34cdef
159.21ab
62.07abc
41.72abcd
15.56
Average 115.83BC
0.36ABC
161.66AB
63.17ABC
42.06AB
10.56
Lohmann 69 EC 110.48e 0.42
a 178.23
a 69.58
a 45.86
a 12.50
LB-Lite 69 ECS 121.95abc
0.35bcdef
164.92ab
64.12abc
42.61abc
20.85
Average 116.21BC
0.38A 171.57
AB 66.85
AB 44.23
A 16.67
Hy-Line 69 EC 118.69abcde
0.36bcdef
169.89ab
66.51ab
42.25abcd
7.18
Silver Brown 69 ECS 127.88a 0.32
fg 166.26
ab 64.84
abc 41.18
abcd 14.59
Average 123.29A 0.34
CDE 168.07
AB 65.68
ABC 41.71
ABC 1088
Hy-Line 69 EC 110.86de
0.37bcd
158.88ab
62.30abc
40.93abcd
5.10
Brown 69 ECS 120.13abc
0.34def
155.59ab
60.77bc
40.58bcd
13.34
Average 115.50C 0.35
BCD 157.23
AB 61.53
BC 40.76
BC 9.22
ISA 69 EC 117.59bcde
0.37bcd
168.99ab
65.62ab
43.17abc
14.36
Brown 69 ECS 116.22bcde
0.36bcdef
162.35ab
63.37abc
41.38abcd
9.95
Average 116.90BC
0.36ABC
165.67AB
64.49ABC
42.27AB
12.15
Bovans 69 EC 118.78abcd
0.38bc
173.68ab
67.84ab
44.85ab
10.71
Brown 69 ECS 123.45ab
0.36bcde
174.14ab
67.98ab
44.93ab
9.45
Average 121.12AB
0.37AB
173.91A 67.91
A 44.89
A 10.08
All 69 EC 114.52Z 0.37
Z 166.75 65.05
Y 42.37 10.63
Strains 69 ECS 122.50Y 0.34
Y 160.68 62.61
Z 41.01 14.32
Enrichable Cage=EC; Enriched Colony Housing System=ECS.
ABC - Different letters denote significant differences (P<.01), comparisons made among strain average values. abcdefg - Different letters denote significant differences (P<.01) in the strain* production system interactions.
YZ - Different letters denote significant differences (P<.01), comparisons made among production system average values.

60
TABLE 55. EFFECT OF BROWN EGG STRAIN AND PRODUCTION SYSTEM ON EGG
WEIGHT AND EGG SIZE DISTRIBUTION OF HENS IN THE 39th NCLP&MT (511-
763 DAYS) IN ENRICHABLE AND ENRICHED COLONY HOUSING SYSTEMS
Production Egg Pee
Extra
Breeder System Weight Wee Small Medium Large Large
(Strain) (g/egg) (%) (%) (%) (%) (%)
TETRA 69 EC 63.23f 0 0 0.54
ab 19.46
a 77.27
c
Amber 69 ECS 64.09def
0 0 0.19b 14.50
ab 80.36
abc
Average 63.66C 0 0 0.37 16.98
A 78.81
C
TETRA 69 EC 64.92cdef
0 0 0.74ab
15.52ab
82.22abc
Brown 69 ECS 65.49abcd
0 0 0b 11.59
abcd 84.74
abc
Average 65.20B 0 0 0.37 13.56
ABC 83.48
ABC
Novogen 69 EC 66.02abc
0 0 0.42b 9.78
bcd 87.96
ab
Brown 69 ECS 67.26a 0 0 0.16
b 4.84
cd 89.29
a
Average 66.64A 0 0 0.29 7.31
CD 88.62
A
Lohmann 69 EC 65.97abc
0 0 0.44b 8.42
bcd 89.07
a
LB-Lite 69 ECS 66.49abc
0 0 0b 4.25
d 89.58
a
Average 66.23AB
0 0 0.22 6.34D 89.33
A
Hy-Line 69 EC 63.64ef 0 0 1.86
a 16.89
ab 78.36
bc
Silver Brown 69 ECS 63.60ef 0 0 0.11
b 13.81
abc 81.14
abc
Average 63.62C 0 0 0.99 15.35
AB 79.75
BC
Hy-Line 69 EC 65.75abc
0 0.11 0.41b 10.76
bcd 85.87
abc
Brown 69 ECS 66.85ab
0 0 0.44b 4.29
d 90.04
a
Average 66.30AB
0 0.06 0.42 7.52CD
87.96A
ISA 69 EC 65.85abc
0 0 0.20b 11.67
abcd 84.83
abc
Brown 69 ECS 65.42bcd
0 0 0.33b 9.07
bcd 86.11
abc
Average 65.63B 0 0 0.27 10.37
BCD 85.47
AB
Bovans 69 EC 66.10abc
0 0 0.46b 9.86
bcd 85.92
abc
Brown 69 ECS 66.23bcd
0 0.09 0.07b 7.87
bcd 87.78
ab
Average 66.16AB
0 0.04 0.26 8.86CD
86.35AB
All 69 EC 65.18Z 0 0.01 0.63
Y 12.79
Y 83.94
Strains 69 ECS 65.67Y 0 0.01 0.16
Z 8.78
Z 86.00
Enrichable Cage=EC; Enriched Colony Housing System=ECS. ABCD - Different letters denote significant differences (P<.01), comparisons made among strain average values.
abcdef - Different letters denote significant differences (P<.01) in the strain* production system interactions.
YZ - Different letters denote significant differences (P<.01), comparisons made among production system average values.

61
TABLE 56. EFFECT OF BROWN EGG STRAIN AND PRODUCTION SYSTEM ON EGG
QUALITY, INCOME AND FEED COSTS OF HENS IN THE 39th NCLP&MT (511-
763 DAYS) IN ENRICHABLE AND ENRICHED COLONY HOUSING SYSTEMS
Production Grade Grade
Egg Feed
Breeder System A B Cracks Loss Income Costs
(Strain) (%) (%) (%) (%) ($/hen) ($/hen)
TETRA 69 EC 95.48ab
0.51 3.29d 0.73 16.08 9.77
Amber 69 ECS 91.46abcd
0.31 6.61abcd
1.63 17.48 10.64
Average 93.47 0.41 4.95 1.18 16.78 10.21AB
TETRA 69 EC 95.18abc
0.43 3.85cd
0.53 19.35 10.11
Brown 69 ECS 92.22abcd
0.64 6.35abcd
0.78 17.87 10.76
Average 93.70 0.54 5.10 0.66 18.61 10.44AB
Novogen 69 EC 95.92ab
0.49 3.14d 0.46 16.53 9.43
Brown 69 ECS 89.87cd
1.00 8.04abc
1.08 19.94 10.57
Average 92.89 0.75 5.59 0.77 18.24 10.00B
Lohmann 69 EC 96.38a 0.40 2.47
d 0.75 19.70 9.52
LB-Lite 69 ECS 88.57d 0.10 10.12
a 1.21 18.80 10.51
Average 92.47 0.25 6.30 0.98 19.25 10.01B
Hy-Line 69 EC 94.81abc
0.71 3.46cd
1.02 18.30 10.25
Silver Brown 69 ECS 89.94cd
1.43 7.30abcd
1.34 18.10 11.03
Average 92.38 1.07 5.38 1.18 18.20 10.64A
Hy-Line 69 EC 93.41abcd
0.80 4.36cd
1.42 17.21 9.58
Brown 69 ECS 90.86bcd
0.63 8.09abc
0.42 17.09 10.36
Average 92.14 0.72 6.23 0.92 17.15 9.97B
ISA 69 EC 94.46abc
0.69 3.40cd
0.85 20.57 10.14
Brown 69 ECS 91.78abcd
0.87 6.68abcd
0.68 19.46 10.03
Average 93.12 0.78 5.34 0.77 20.01 10.08AB
Bovans 69 EC 93.30abcd
0.15 5.81abcd
0.75 20.45 10.24
Brown 69 ECS 89.75cd
0.10 9.04ab
1.11 18.80 10.66
Average 91.52 0.12 7.42 0.93 19.62 10.45AB
All 69 EC 94.87Y 0.52 7.78
Z 0.82 18.52 9.88
Y
Strains 69 ECS 90.56Z 0.64 3.80
Y 1.03 18.44 10.57
Z
Enrichable Cage=EC; Enriched Colony Housing System=ECS. AB - Different letters denote significant differences (P<.01), comparisons made among strain average values.
abcd - Different letters denote significant differences (P<.01) in the strain* production system interactions.
YZ - Different letters denote significant differences (P<.01), comparisons made among production system average values.
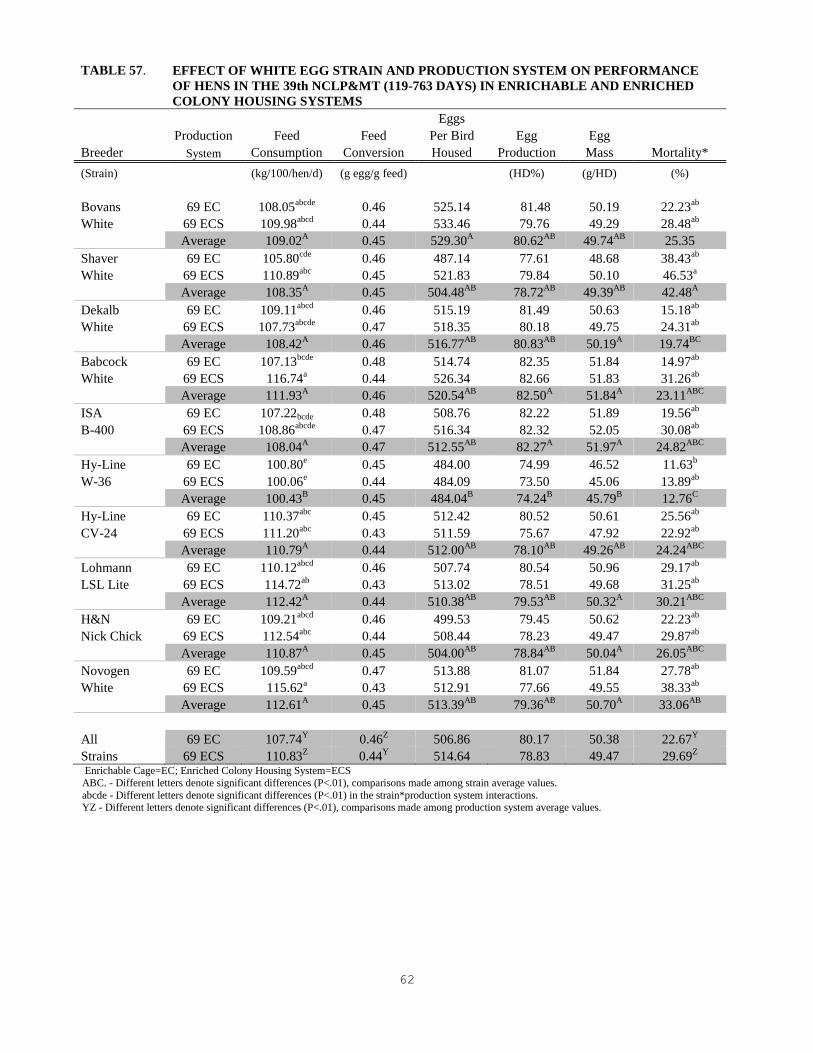
62
TABLE 57. EFFECT OF WHITE EGG STRAIN AND PRODUCTION SYSTEM ON PERFORMANCE
OF HENS IN THE 39th NCLP&MT (119-763 DAYS) IN ENRICHABLE AND ENRICHED
COLONY HOUSING SYSTEMS
Eggs
Production Feed Feed Per Bird Egg Egg
Breeder System Consumption Conversion Housed Production Mass Mortality*
(Strain) (kg/100/hen/d) (g egg/g feed)
(HD%) (g/HD) (%)
Bovans 69 EC 108.05abcde
0.46 525.14 81.48
50.19 22.23ab
White 69 ECS 109.98abcd
0.44 533.46 79.76 49.29 28.48ab
Average 109.02A
0.45 529.30A
80.62AB
49.74AB
25.35
Shaver 69 EC 105.80cde
0.46 487.14 77.61 48.68 38.43ab
White 69 ECS 110.89abc
0.45 521.83 79.84 50.10 46.53a
Average 108.35A
0.45 504.48AB
78.72AB
49.39AB
42.48A
Dekalb 69 EC 109.11abcd
0.46 515.19 81.49 50.63 15.18ab
White 69 ECS 107.73abcde
0.47 518.35 80.18 49.75 24.31ab
Average 108.42A
0.46 516.77AB
80.83AB
50.19A
19.74BC
Babcock 69 EC 107.13bcde
0.48 514.74 82.35 51.84 14.97ab
White 69 ECS 116.74a
0.44 526.34 82.66 51.83 31.26ab
Average 111.93A
0.46 520.54AB
82.50A
51.84A 23.11
ABC
ISA 69 EC 107.22bcde 0.48 508.76 82.22 51.89 19.56ab
B-400 69 ECS 108.86abcde
0.47 516.34 82.32 52.05 30.08ab
Average 108.04A
0.47 512.55AB
82.27A
51.97A
24.82ABC
Hy-Line 69 EC 100.80e
0.45 484.00 74.99 46.52 11.63b
W-36 69 ECS 100.06e
0.44 484.09 73.50 45.06 13.89ab
Average 100.43B
0.45 484.04B
74.24B
45.79B
12.76C
Hy-Line 69 EC 110.37abc
0.45 512.42 80.52 50.61 25.56ab
CV-24 69 ECS 111.20abc
0.43 511.59 75.67 47.92 22.92ab
Average 110.79A
0.44 512.00AB
78.10AB
49.26AB
24.24ABC
Lohmann 69 EC 110.12abcd
0.46 507.74 80.54 50.96 29.17ab
LSL Lite 69 ECS 114.72ab
0.43 513.02 78.51 49.68 31.25ab
Average 112.42A
0.44 510.38AB
79.53AB
50.32A
30.21ABC
H&N 69 EC 109.21abcd
0.46 499.53 79.45 50.62 22.23ab
Nick Chick 69 ECS 112.54abc
0.44 508.44 78.23 49.47 29.87ab
Average 110.87A
0.45 504.00AB
78.84AB
50.04A
26.05ABC
Novogen 69 EC 109.59abcd
0.47 513.88 81.07 51.84 27.78ab
White 69 ECS 115.62a
0.43 512.91 77.66 49.55 38.33ab
Average 112.61A
0.45 513.39AB
79.36AB
50.70A
33.06AB
All 69 EC 107.74Y
0.46Z
506.86 80.17 50.38 22.67Y
Strains 69 ECS 110.83Z
0.44Y
514.64 78.83 49.47 29.69Z
Enrichable Cage=EC; Enriched Colony Housing System=ECS
ABC. - Different letters denote significant differences (P<.01), comparisons made among strain average values.
abcde - Different letters denote significant differences (P<.01) in the strain*production system interactions. YZ - Different letters denote significant differences (P<.01), comparisons made among production system average values.

63
TABLE 58. EFFECT OF WHITE EGG STRAIN AND PRODUCTION SYSTEM ON EGG
WEIGHT AND EGG SIZE DISTRIBUTION OF HENS IN THE 39th NCLP&MT (119-
763 DAYS) IN ENRICHABLE AND ENRICHED COLONY HOUSING SYSTEMS
Production Egg Pee
Extra
Breeder System Weight Wee Small Medium Large Large
(Strain) (g/egg) (%) (%) (%) (%) (%)
Bovans 69 EC 61.11 0.87 3.37 8.27 20.14 65.47
White 69 ECS 61.60 0 2.89 8.14 19.76 66.79
Average 61.36B
0.43 3.13 8.20 19.95 66.13
Shaver 69 EC 62.35 0.02 3.55 5.90 17.98 70.80
White 69 ECS 62.51 0 2.63 6.78 16.96 69.75
Average 62.43AB
0.01 3.09 6.34 17.47 70.26
Dekalb 69 EC 61.66 0 3.54 6.49 19.53 69.26
White 69 ECS 61.49 0 3.99 6.00 19.93 67.46
Average 61.58B
0 3.77 6.24 19.73 68.36
Babcock 69 EC 62.61 0 3.01 6.37 16.98 71.40
White 69 ECS 62.45 0.30 2.92 6.75 16.96 70.15
Average 62.53AB
0.15 2.97 6.56 16.97 70.77
ISA 69 EC 62.66 0.02 3.03 5.04 16.71 73.64
B-400 69 ECS 62.85 0 2.47 5.28 16.17 72.71
Average 62.75AB
0.01 2.75 5.16 16.44 73.18
Hy-Line 69 EC 61.82 0.72 3.61 8.27 17.09 68.83
W-36 69 ECS 61.26 0 4.70 9.74 19.19 63.71
Average 61.54B
0.36 4.15 9.00 18.14 66.27
Hy-Line 69 EC 62.36 0 3.30 7.73 15.72 72.15
CV-24 69 ECS 63.15 1.10 3.59 6.31 16.24 70.50
Average 62.76AB
0.55 3.45 7.02 15.98 71.33
Lohmann 69 EC 62.90 0 3.54 6.76 15.01 72.78
LSL Lite 69 ECS 62.88 0 2.87 6.18 17.63 70.82
Average 62.89AB
0 3.20 6.47 16.32 71.80
H&N 69 EC 63.30 0 3.46 5.64 15.41 74.14
Nick Chick 69 ECS 62.95 0 3.02 6.27 15.67 71.76
Average 63.12AB
0 3.24 5.95 15.54 72.95
Novogen 69 EC 63.38 0 2.96 5.53 15.30 74.38
White 69 ECS 63.54 0 2.99 6.09 14.71 74.34
Average 63.46A
0 2.98 5.81 15.00 74.36
All 69 EC 62.41 0.16 3.34 6.60 16.99 71.28
Strains 69 ECS 62.47 0.14 3.21 6.75 17.32 69.80 Enrichable Cage=EC; Enriched Colony Housing System=ECS.
AB - Different letters denote significant differences (P<.01), comparisons made among strain average values.

64
TABLE 59. EFFECT OF WHITE EGG STRAIN AND PRODUCTION SYSTEM ON EGG QUALITY,
INCOME AND FEED COSTS OF HENS IN THE 39th NCLP&MT (119-763 DAYS) IN
ENRICHABLE AND ENRICHED COLONY HOUSING SYSTEMS
Production Grade Grade
Egg Feed
Breeder System A B Cracks Loss Income Costs
(Strain) (%) (%) (%) (%) ($/hen) ($/hen)
Bovans 69 EC 94.73abcd
0.48 3.87 0.90 60.17abc
27.55abcd
White 69 ECS 92.92abcdef
0.41 5.89 0.77 58.86abc
28.00abcd
Average 93.83A
0.44 4.88B
0.84 59.51A
27.78A
Shaver 69 EC 93.88abcde
0.35 5.32 0.47 57.96abc
26.97bcd
White 69 ECS 87.31g
0.41 10.73 1.50 58.20abc
28.28abcd
Average 90.60B
0.38 8.02A
0.98 58.08AB
27.63A
Dekalb 69 EC 96.38a
0.52 2.68 0.47 61.22ab
27.85abcd
White 69 ECS 90.91defg
0.46 7.66 0.99 58.86abc
27.52abcd
Average 93.64A
0.49 5.17B
0.73 60.04A
27.68A
Babcock 69 EC 94.76abcd
0.46 3.96 0.77 61.33a
27.31abcd
White 69 ECS 90.99defg
0.62 7.20 1.24 60.28abc
29.82a
Average 92.88AB
0.54 5.58B 1.00 60.81
A 28.56
A
ISA 69 EC 94.84abcd
0.43 4.09 0.64 61.71a
27.46abcd
B-400 69 ECS 88.74fg
0.40 9.82 1.10 60.13abc
27.80abcd
Average 91.79AB
0.42 6.95AB
0.87 60.92A
27.63A
Hy-Line 69 EC 95.12abc
0.36 3.60 0.90 55.35bc
25.87d
W-36 69 ECS 90.98defg
0.36 7.65 1.03 52.88c
25.60d
Average 93.05AB
0.36 5.65AB
0.97 54.12B
25.74B
Hy-Line 69 EC 95.90ab
0.31 3.50 0.31 60.49ab
28.41abcd
CV-24 69 ECS 92.33abcdef
0.33 6.49 0.87 55.37abc
28.40abcd
Average 94.12A
0.32 5.00B
0.59 57.93AB
28.40A
Lohmann 69 EC 94.39abcde
0.59 4.40 0.63 60.17abc
28.09abcd
LSL Lite 69 ECS 90.51efg
0.72 7.88 0.89 57.83abc
29.19ab
Average 92.45AB
0.65 6.14AB
0.76 59.00A
28.64A
H&N 69 EC 94.68abcd
0.98 3.70 0.62 59.58abc
27.86abcd
Nick Chick 69 ECS 90.76defg
0.46 7.10 1.66 57.38abc
28.70abc
Average 92.72AB
0.72 5.40B
1.14 58.47AB
28.28A
Novogen 69 EC 94.76abcd
0.37 4.07 0.79 60.86ab
27.91abcd
White 69 ECS 92.05bcdef
0.68 6.70 0.56 58.12abc
29.33ab
Average 93.40A
0.53 5.39B
0.68 59.49A
28.62A
All 69 EC 94.94Y
0.48 3.92Y
0.65Y
59.88Y
27.53Y
Strains 69 ECS 90.75Z
0.48 7.71Z
1.06Z
57.79Z
28.26Z
Enrichable Cage=EC; Enriched Colony Housing System=ECS. AB - Different letters denote significant differences (P<.01), comparisons made among strain average values.
abcdefg - Different letters denote significant differences (P<.01) in the strain* production system interactions.
YZ - Different letters denote significant differences (P<.01), comparisons made among production system average values.

65
TABLE 60. EFFECT OF BROWN EGG STRAIN AND PRODUCTION SYSTEM ON PERFORMANCE
OF HENS IN THE 39th NCLP&MT (119-763 DAYS) IN ENRICHABLE AND ENRICHED
COLONY HOUSING SYSTEMS
Eggs
Production Feed Feed Per Bird Egg Egg
Breeder System Consumption Conversion Housed
Produc-
tion Mass Mortality
(Strain) (kg/100/hen/d) (g egg/g feed)
(HD%) (g/HD) (%)
TETRA 69 EC 107.32 0.41 485.17 73.83 44.12 19.85ab
Amber 69 ECS 112.52 0.37 482.84 69.35 41.38 17.37ab
Average 109.92AB
0.39B
484.00 71.59 42.75C
18.61AB
TETRA 69 EC 107.60 0.40 471.90 69.79 43.08 36.11a
Brown 69 ECS 111.46 0.39 484.05 70.74 43.55 21.30ab
Average 109.53AB
0.39AB
477.97 70.27 43.31BC
28.71A
Novogen 69 EC 104.78 0.44 490.33 74.08 46.36 15.00ab
Brown 69 ECS 111.42 0.42 496.85 73.85 46.67 20.56ab
Average 108.10AB
0.43A
493.59 73.97 46.52AB
17.78AB
Lohmann 69 EC 105.60 0.45 492.53 77.58 48.31 17.90ab
LB-Lite 69 ECS 110.52 0.42 503.69 74.20 46.32 26.40a
Average 108.06AB
0.43A 498.11 75.89 47.32AB
22.15AB
Hy-Line 69 EC 110.08 0.41 488.96 75.93 45.47 12.97ab
Silver Brown 69 ECS 115.38 0.39 491.64 75.81 45.14 21.53ab
Average 112.73A
0.40AB
490.30 75.87 45.30ABC
17.25AB
Hy-Line 69 EC 105.17 0.42 481.45 71.99 44.65 6.48b
Brown 69 ECS 111.40 0.40 487.25 71.90 44.89 17.79ab
Average 108.29AB
0.41AB
484.35 71.95 44.77ABC
12.13B
ISA 69 EC 106.38 0.44 483.80 74.52 46.66 20.38ab
Brown 69 ECS 108.12 0.43 492.30 76.21 47.17 14.94ab
Average 107.25B
0.43A
488.05 75.36 46.92AB
17.66AB
Bovans 69 EC 110.71 0.43 502.47 75.97 47.49 15.08ab
Brown 69 ECS 114.59 0.41 500.96 76.57 48.06 15.56ab
Average 112.65A
0.42AB
501.71 76.27 47.78A
15.32AB
All 69 EC 107.20Y
0.42Z
487.45 74.21 45.77 17.97
Strains 69 ECS 111.93Z
0.40Y
487.08 73.58 45.40 19.43 Enrichable Cage=EC; Enriched Colony Housing System=ECS.
ABC - Different letters denote significant differences (P<.01), comparisons made among strain average values. ab - Different letters denote significant differences (P<.01) in the strain* production system interactions.
YZ - Different letters denote significant differences (P<.01), comparisons made among production system average values.
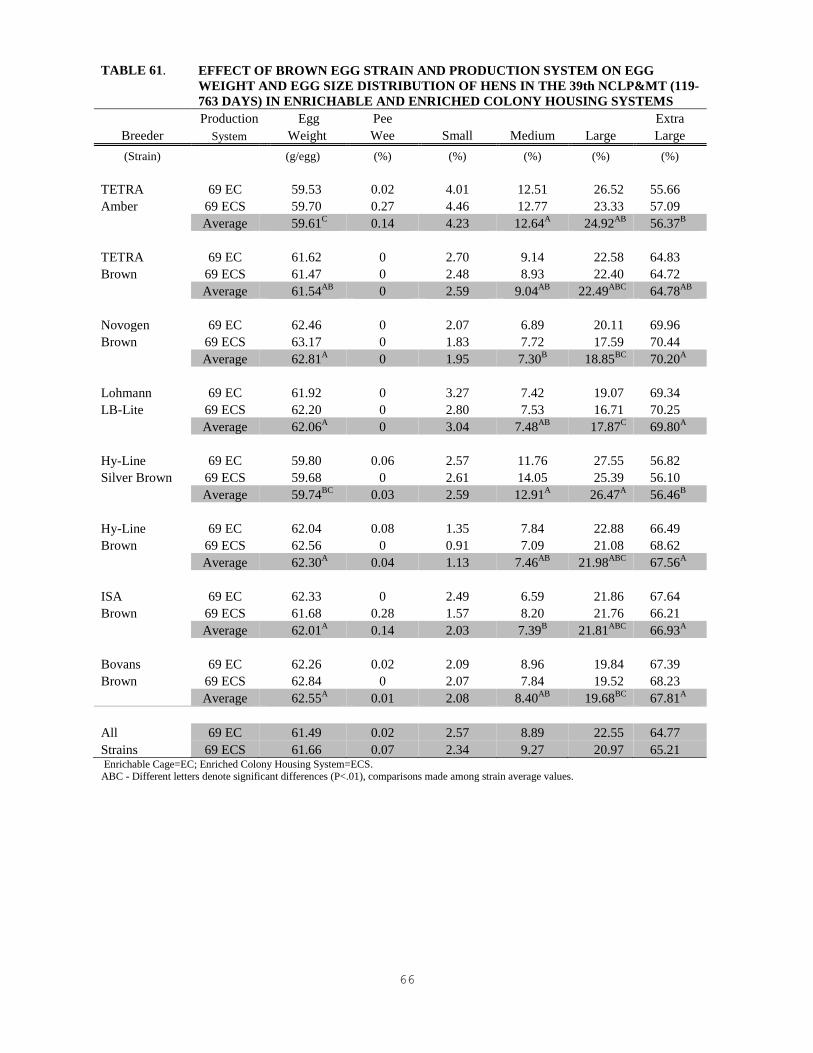
66
TABLE 61. EFFECT OF BROWN EGG STRAIN AND PRODUCTION SYSTEM ON EGG
WEIGHT AND EGG SIZE DISTRIBUTION OF HENS IN THE 39th NCLP&MT (119-
763 DAYS) IN ENRICHABLE AND ENRICHED COLONY HOUSING SYSTEMS
Production Egg Pee
Extra
Breeder System Weight Wee Small Medium Large Large
(Strain) (g/egg) (%) (%) (%) (%) (%)
TETRA 69 EC 59.53 0.02 4.01 12.51 26.52 55.66
Amber 69 ECS 59.70 0.27 4.46 12.77 23.33 57.09
Average 59.61C
0.14 4.23 12.64A
24.92AB
56.37B
TETRA 69 EC 61.62 0 2.70 9.14 22.58 64.83
Brown 69 ECS 61.47 0 2.48 8.93 22.40 64.72
Average 61.54AB
0 2.59 9.04AB
22.49ABC
64.78AB
Novogen 69 EC 62.46 0 2.07 6.89 20.11 69.96
Brown 69 ECS 63.17 0 1.83 7.72 17.59 70.44
Average 62.81A
0 1.95 7.30B
18.85BC
70.20A
Lohmann 69 EC 61.92 0 3.27 7.42 19.07 69.34
LB-Lite 69 ECS 62.20 0 2.80 7.53 16.71 70.25
Average 62.06A
0 3.04 7.48AB
17.87C
69.80A
Hy-Line 69 EC 59.80 0.06 2.57 11.76 27.55 56.82
Silver Brown 69 ECS 59.68 0 2.61 14.05 25.39 56.10
Average 59.74BC
0.03 2.59 12.91A
26.47A
56.46B
Hy-Line 69 EC 62.04 0.08 1.35 7.84 22.88 66.49
Brown 69 ECS 62.56 0 0.91 7.09 21.08 68.62
Average 62.30A
0.04 1.13 7.46AB
21.98ABC
67.56A
ISA 69 EC 62.33 0 2.49 6.59 21.86 67.64
Brown 69 ECS 61.68 0.28 1.57 8.20 21.76 66.21
Average 62.01A
0.14 2.03 7.39B
21.81ABC
66.93A
Bovans 69 EC 62.26 0.02 2.09 8.96 19.84 67.39
Brown 69 ECS 62.84 0 2.07 7.84 19.52 68.23
Average 62.55A
0.01 2.08 8.40AB
19.68BC
67.81A
All 69 EC 61.49 0.02 2.57 8.89 22.55 64.77
Strains 69 ECS 61.66 0.07 2.34 9.27 20.97 65.21 Enrichable Cage=EC; Enriched Colony Housing System=ECS. ABC - Different letters denote significant differences (P<.01), comparisons made among strain average values.

67
TABLE 62. EFFECT OF BROWN EGG STRAIN AND PRODUCTION SYSTEM ON EGG
QUALITY, INCOME AND FEED COSTS OF HENS IN THE 39th NCLP&MT (119-
763 DAYS) IN ENRICHABLE AND ENRICHED COLONY HOUSING SYSTEMS
Production Grade Grade
Egg Feed
Breeder System A B Cracks Loss Income Costs
(Strain) (%) (%) (%) (%) ($/hen) ($/hen)
TETRA 69 EC 95.88ab
0.38 3.08 0.64 54.12ab
26.37
Amber 69 ECS 91.84de
0.35 6.92 0.88 49.60b
27.55
Average 93.86 0.37 5.00 0.76 51.86B
26.96ABC
TETRA 69 EC 95.00abcd
0.26 4.16 0.58 51.99ab
26.37
Brown 69 ECS 91.96de
0.59 6.71 0.71 51.79ab
27.30
Average 93.48 0.43 5.43 0.64 51.89B 26.83ABC
Novogen 69 EC 96.37ab
0.36 2.73 0.51 55.59ab
25.78
Brown 69 ECS 91.17e
0.79 7.22 0.82 54.05ab
27.32
Average 93.77 0.58 4.98 0.66 54.82AB
26.55BC
Lohmann 69 EC 96.59a
0.47 2.41 0.58 58.16a
26.00
LB-Lite 69 ECS 90.89e
0.25 7.68 1.16 54.24ab
27.06
Average 93.74 0.35 5.05 0.87 56.20A
26.53BC
Hy-Line 69 EC 96.24ab
0.32 2.89 0.53 56.03a
27.05
Silver Brown 69 ECS 93.17bcde
0.62 5.70 0.53 55.09ab
28.22
Average 94.71 0.47 4.29 0.53 55.56AB
27.63AB
Hy-Line 69 EC 94.76abcd
0.51 3.73 0.98 53.27ab
25.88
Brown 69 ECS 92.36de
0.37 6.80 0.46 52.99ab
27.32
Average 93.56 0.44 5.27 0.72 53.13AB
26.60BC
ISA 69 EC 95.48abc
0.84 3.01 0.64 55.90a
26.07
Brown 69 ECS 92.78cde
0.47 6.22 0.52 56.24a
26.52
Average 94.13 0.66 4.61 0.58 56.07A
26.30C
Bovans 69 EC 94.70abcd
0.29 4.30 0.71 56.27a
27.18
Brown 69 ECS 92.28de
0.12 6.68 0.96 56.19a
28.11
Average 93.49 0.21 5.49 0.84 56.23A
27.65A
All 69 EC 95.63Y
0.43 3.29Y
0.65 55.17 26.34Y
Strains 69 ECS 92.06Z
0.45 6.74Z
0.76 53.77 27.42Z
Enrichable Cage=EC; Enriched Colony Housing System=ECS. abcde - Different letters denote significant differences (P<.01) in the strain* production system interactions.
ABC - Different letters denote significant differences (P<.01), comparisons made among strain average values.
YZ - Different letters denote significant differences (P<.01), comparisons made among production system average values.

68
Enrichable Cage=EC; Enriched Colony Housing System=ECS. ABC - Different letters denote significant differences (P<.01), comparisons made among strain average values.
(*) All replicates in all strains were weight at 17 wks.
(**) Only a sample of replicates (2 per strain treatment) in each strain were weighted at 69 and 73 wks.
TABLE 63. EFFECT OF WHITE EGG STRAIN AND PRODUCTION SYSTEM ON BODY WEIGHT OF
HENS IN THE 39th NCLP&MT (119-763 DAYS) IN ENRICHABLE AND ENRICHED
COLONY HOUSING SYSTEM: NON-MOLTED PROGRAM
Production 17 Wk* 69 Wk** 1st Cycle 73 Wk** 109 Wk 2nd
Cycle Total
Breeder System Body Wt Body Wt Wt Gain Body Wt Body Wt Wt Gain Wt Gain
(Strain) (kg) (kg) (%) (kg) (kg) (kg) (%)
Bovans 69 EC 1.22 1.74 42.6 1.78 1.83 0.04 49.16
White 69 ECS 1.22 1.64 34.4 1.72 1.80 0.10 48.82
Average 1.22AB
1.69 38.5 1.75 1.82ABC
0.07 48.99AB
Shaver 69 EC 1.35 1.66 23.0 1.71 1.84 0.12 41.13
White 69 ECS 1.28 1.73 34.4 1.74 1.80 0.08 44.46
Average 1.32A
1.70 28.8 1.72 1.82AB
0.10 43.29AB
Dekalb 69 EC 1.20 1.63 36.7 1.73 1.81 0.10 50.27
White 69 ECS 1.20 1.61 35.0 1.72 1.75 0 48.06
Average 1.20AB
1.62 35.8 1.72 1.78BC
0.06 49.16AB
Babcock 69 EC 1.28 1.78 39.1 1.79 1.89 0.10 45.71
White 69 ECS 1.31 1.74 32.1 1.73 1.95 0.16 50.72
Average 1.30AB
1.76 35.4 1.76 1.92A
0.14 48.21AB
ISA 69 EC 1.22 1.67 36.9 1.68 1.75 0.10 44.77
B-400 69 ECS 1.18 1.63 39.0 2.09 1.61 -0.15 34.66
Average 1.20AB
1.65 37.5 1.88 1.68C
-0.02 39.71B
Hy-Line 69 EC 1.22 1.65 35.2 1.72 1.86 0.16 54.31
W-36 69 ECS 1.20 1.60 33.3 1.57 1.81 0.18 52.41
Average 1.21AB
1.62 33.9 1.64 1.83AB
0.17 53.36A
Hy-Line 69 EC 1.22 1.62 32.8 1.62 1.79 0.18 44.31
CV-24 69 ECS 1.22 1.65 36.1 1.69 1.84 0.15 47.75
Average 1.22AB
1.64 34.4 1.66 1.81ABC
0.17 46.03AB
Lohmann 69 EC 1.27 1.68 32.3 1.63 1.86 0.20 49.26
LSL Lite 69 ECS 1.22 1.58 29.5 1.97 1.84 -0.07 48.58
Average 1.24AB
1.63 30.6 1.80 1.85ABC
0.06 48.92AB
H&N 69 EC 1.21 1.66 36.4 1.71 1.84 0.08 43.82
Nick Chick 69 ECS 1.24 1.66 33.9 1.67 1.76 0.07 41.57
Average 1.23AB
1.66 35.0 1.69 1.80ABC
0.07 42.70AB
Novogen 69 EC 1.24 1.71 37.9 1.75 1.85 0.09 45.52
White 69 ECS 1.22 1.64 34.4 1.64 1.81 0.14 46.90
Average 1.23AB
1.68 35.8 1.70 1.83AB
0.12 46.21AB
All 69 EC 1.24 1.68 35.5 1.71 1.83 0.12 46.96
Strains 69 ECS 1.22 1.66 36.1 1.76 1.81 0.06 48.47

69
TABLE 64. EFFECT OF BROWN EGG STRAIN AND PRODUCTION SYSTEM ON BODY WEIGHT
OF HENS IN THE 39th NCLP&MT (119-763 DAYS) IN ENRICHABLE AND ENRICHED
COLONY HOUSING SYSTEM: NON-MOLTED PROGRAM
Production 17 Wk* 69 Wk** 1st Cycle 73 Wk** 109 Wk 2nd
Cycle Total
Breeder System Body Wt Body Wt Wt Gain Body Wt Body Wt Wt Gain Wt Gain
(Strain) (kg) (kg) (%) (kg) (kg) (kg) (%)
TETRA 69 EC 1.50 2.10 40.0 2.07 1.89 0.02 22.48
Amber 69 ECS 1.50 1.89 26.7 2.02 1.84 0.04 20.75
Average 1.50 1.99 33.3 2.04 1.86 0.03 21.61
TETRA 69 EC 1.64 1.94 18.3 1.81 1.90 0.25 16.24
Brown 69 ECS 1.54 1.88 22.1 1.87 1.92 0.18 26.18
Average 1.58 1.91 20.3 1.84 1.91 0.22 21.71
Novogen 69 EC 1.60 1.79 11.9 1.95 1.94 -0.02 24.52
Brown 69 ECS 1.55 1.94 25.2 1.91 1.82 0.07 16.02
Average 1.58 1.86 18.4 1.93 1.88 0.02 20.27
Lohmann 69 EC 1.44 1.79 25.0 1.82 1.86 0.10 23.22
LB-Lite 69 ECS 1.52 2.00 31.6 1.91 1.93 0.07 26.16
Average 1.48 1.89 28.4 1.86 1.90 0.08 24.69
Hy-Line 69 EC 1.64 1.86 13.4 2.02 2.10 0.14 20.72
Silver Brown 69 ECS 1.42 1.98 39.4 1.98 1.80 0.16 21.66
Average 1.53 1.92 25.5 2.00 1.95 0.15 26.19
Hy-Line 69 EC 1.62 2.00 23.5 2.00 1.91 0.13 20.16
Brown 69 ECS 1.53 1.87 22.2 2.38 1.96 -0.26 29.75
Average 1.58 1.94 22.8 2.19 1.94 -0.07 24.96
ISA 69 EC 1.47 1.92 31.3 1.92 2.04 0.06 38.97
Brown 69 ECS 1.45 1.82 25.5 1.87 1.87 0.08 30.73
Average 1.46 1.87 28.8 1.89 1.95 0.07 34.85
Bovans 69 EC 1.52 1.98 30.3 1.99 1.93 0.03 28.34
Brown 69 ECS 1.60 1.94 21.3 1.94 1.89 0.04 22.78
Average 1.56 1.96 25.6 1.96 1.91 0.04 25.56
All 69 EC 1.55 1.92 23.9 1.95 1.94 0.09 25.71
Strains 69 ECS 1.51 1.92 26.5 1.98 1.88 0.04 24.25
Enrichable Cage=EC; Enriched Colony Housing System=ECS.
(*) All replicates in all strains were weight at 17 wks.
(**) Only a sample of replicates (2 per strain treatment) in each strain were weighted at 69 and 73 wks.

70
TABLE 65. EFFECT OF WHITE EGG STRAIN AND DENSITY ON PERFORMANCE OF HENS IN THE 39th
NCLP&MT (119-483 DAYS) IN THE ENRICHED COLONY HOUSING SYSTEMS
Eggs
Age at
Feed Feed Per Bird Egg Egg
50%
Breeder Density1 Consumption Conversion Housed Production Mass Mortality Production
(Strain) (in2/hen) (kg/100/hen/d) (g egg/g feed)
(HD%) (g/HD) (%) (Days)
Bovans 69 ECS 10.51abc
0.492cde
311.22abc
84.47efg
50.87fg
17.06 146.14a
White 138 ECS 10.80ab
0.501abcde
317.25abc
86.78abcde
53.13bcde
9.52 143.14abcd
Average 10.66AB
0.496C
314.24ABC
85.76C
52.00B
13.30 144.64A
Shaver 69 ECS 10.50abc
0.540ab
318.28abc
85.56bcdef
51.91cdef
30.55 140.50cd
White 138 ECS 10.53abc
0.527abcd
319.98abc
87.67abcd
53.52abcde
2.78 142.00abcd
Average 10.52B
0.534AB
318.83AB
86.61BC
52.72B
16.17 141.25B
Dekalb 69 ECS 10.48bc
0.508abcde
311.31abc
85.18cdefg
51.54ef
9.03 144.25abcd
White 138 ECS 10.66ab
0.500abcde
322.68ab
88.51ab
53.33bcde
4.17 142.25abcd
Average 10.57AB
0.504ABC
316.99ABC
86.84BC
52.44B
6.60 143.25AB
Babcock 69 ECS 11.09a
0.539abc
327.78a
89.54a
54.27ab
11.80 140.50cd
White 138 ECS 10.72ab
0.538abc
325.23ab
89.33a
55.64a
3.33 141.20bcd
Average 10.90A
0.538A
326.30A
89.44A
54.96A
7.57 140.85B
ISA 69 ECS 10.68ab
0.551a
325.21ab
88.61ab
54.74ab
17.50 141.00bcd
B-400 138 ECS 10.95ab
0.518abcde
321.20abc
87.96abc
54.84ab
6.95 139.75d
Average 10.81AB
0.534AB
323.20A
88.28AB
54.79A
12.22 140.38B
Hy-Line 69 ECS 9.89cd
0.493abcde
298.27bc
81.81gh
48.22h
4.63 145.33abc
W-36 138 ECS 9.79d
0.503abcde
299.15abc
82.07fgh
49.02gh
1.85 145.67abc
Average 9.84C
0.498BC
298.71C
81.94D
48.62D
3.24 145.50A
Hy-Line 69 ECS 10.80ab
0.464e
295.21c
80.70h
48.93gh
11.11 145.75ab
CV-24 138 ECS 10.67ab
0.483de
310.53abc
85.17cdefg
51.67def
6.95 145.25abc
Average 10.74AB
0.474C
302.87BC
82.93D
50.30C
9.03 145.50A
Lohmann 69 ECS 10.68ab
0.498abcde
310.94abc
84.85cdefg
51.60def
13.19 144.75abc
LSL Lite 138 ECS 10.77ab
0.503abcde
319.88abc
87.34abcde
54.10abc
11.11 144.25abcd
Average 10.73AB
0.500BC
315.14ABC
86.10C
52.85B
12.15 144.50A
H&N 69 ECS 10.66ab
0.497abcde
309.98abc
84.44defg
51.63def
15.97 145.75ab
Nick Chick 138 ECS 10.85ab
0.495abcde
315.70abc
86.60abcde
53.82abcd
6.94 144.25abcd
Average 10.76AB
0.496C
312.84ABC
85.52C
52.73B
11.46 145.00A
Novogen 69 ECS 10.95ab
0.480de
304.77abc
82.70fgh
50.90fg
20.55 145.00abc
White 138 ECS 10.77ab
0.513abcde
318.44abc
87.24abcde
54.47ab
7.78 143.67abcd
Average 10.86AB
0.496C
316.61ABC
84.97C
52.69B
14.17 144.33A
All 69 ECS 10.62 0.506
311.26Z
84.81Z
51.46Z
15.14Z
143.90
Strains 138 ECS 10.65 0.508
316.94Y
86.86Y
53.36Y
6.14Y
143.14 1All strains were housed such that each strain is equally represented in each density.
Enriched Colony Housing System=ECS
ABCD - Different letters denote significant differences (P<.01), comparisons made among strain average values.
abcdefgh - Different letters denote significant differences (P<.01) in the strain*density interactions.
YZ - Different letters denote significant differences (P<.01), comparisons made among density average values.
Mortality percentage prior to analyzes was transformed in Square Root Asin

71
TABLE 66. EFFECT OF WHITE EGG STRAIN AND DENSITY ON EGG WEIGHT AND EGG SIZE
DISTRIBUTION OF HENS IN THE 39th NCLP&MT (119-483 DAYS) IN THE ENRICHED
COLONY HOUSING SYSTEMS
Egg Pee
Extra
Breeder Density1 Weight Wee Small Medium Large Large
(Strain) (in2/hen) (g/egg) (%) (%) (%) (%) (%)
Bovans 69 ECS 58.90ghi
0.31 8.10 12.04abc
25.21 54.58de
White 138 ECS 60.02abcdefg
3.44 3.53 7.97c
25.48 59.46bcd
Average 59.46DE
1.87 5.81 10.00B
25.35AB
57.02C
Shaver 69 ECS 59.77cdefgh
0 4.75 11.85abc
24.27 58.67cd
White 138 ECS 60.05abcdefg
0.96 4.31 9.36abc
23.31 61.90abcd
Average 59.91BCD
0.48 4.53 10.61B
23.79AB
60.29ABC
Dekalb 69 ECS 59.22efghi
0 6.88 10.50abc
23.42 58.83cd
White 138 ECS 58.48hi
2.23 3.02 13.67abc
24.33 56.54cde
Average 58.85E
1.11 4.95 12.08AB
23.87AB
57.68BC
Babcock 69 ECS 59.65defghi
0.52 5.08 11.96abc
23.36 58.54cd
White 138 ECS 61.31a
0.37 4.55 7.01c
20.01 67.86a
Average 60.48AB
0.44 4.82 9.49B
21.69AB
63.20AB
ISA 69 ECS 60.81abcd
0 4.34 9.26abc
22.29 63.62abc
B-400 138 ECS 61.33ab
1.44 3.02 8.03bc
19.43 67.63ab
Average 61.07A
0.72 3.68 8.65B
20.86AB
65.63A
Hy-Line 69 ECS 58.02i
0 8.31 17.10a
25.54 48.51e
W-36 138 ECS 59.01fghi
2.99 1.41 16.13ab
25.51 54.00de
Average 58.52E
1.49 5.86 16.61A
25.52AB
51.26D
Hy-Line 69 ECS 59.86abcdefgh
0.27 8.20 11.04abc
22.62 57.67cde
CV-24 138 ECS 59.09fghi
1.74 3.58 13.70abc
22.15 59.00bcd
Average 59.47CDE
1.00 5.89 12.37AB
22.38AB
58.34BC
Lohmann 69 ECS 59.66defghi
0 5.06 10.83abc
23.98 59.71abcd
LSL Lite 138 ECS 60.58ef
2.25 3.48 9.51abc
19.48 65.08abc
Average 60.12ABCD
1.12 4.26 10.17B
21.73AB
62.39AB
H&N 69 ECS 60.14abcdefg
0 5.35 11.00abc
22.38 60.83abcd
Nick Chick 138 ECS 60.71abcde
3.85 2.33 10.56abc
18.85 64.54abc
Average 60.42ABC
1.92 3.84 10.78B
20.62AB
62.68AB
Novogen 69 ECS 60.51abcdef
0.20 5.34 10.82abc
22.13 61.31abcd
White 138 ECS 61.20abc
1.53 5.91 6.16c
18.39 67.38ab
Average 60.86AB
0.86 5.62 8.49B
20.26B
64.34A
All 69 ECS 59.65Z
0.13Z
6.14Y
11.54
23.52Y
58.23Z
Strains 138 ECS 60.18Y
2.08Y
3.51Z
10.21
21.69Z
62.34Y
1All strains were housed such that each strain is equally represented in each density.
Enriched Colony Housing System=ECS. ABCDE - Different letters denote significant differences (P<.01), comparisons made among strain average values.
abcdefghi - Different letters denote significant differences (P<.01) in the strain*density interactions.
YZ - Different letters denote significant differences (P<.01), comparisons made among density average values.

72
TABLE 67. EFFECT OF WHITE EGG STRAIN AND DENSITY ON EGG QUALITY, INCOME
AND FEED COSTS OF HENS IN THE 39th NCLP&MT (119-483 DAYS) IN THE
ENRICHED COLONY HOUSING SYSTEMS
Grade Grade
Egg Feed
Breeder Density1 A B Cracks Loss Income Costs
(Strain) (in2/hen) (%) (%) (%) (%) ($/hen) ($/hen)
Bovans 69 ECS 94.83 0.50 4.38 0.31 35.17abc
15.71abc
White 138 ECS 91.60 0.44 7.66 0.31 35.67abc
16.17abc
Average 93.21 0.47 6.02 0.31 35.42AB
15.94A
Shaver 69 ECS 93.62 0.42 5.00 0.95 35.79abc
15.70abc
White 138 ECS 89.80 0.68 9.05 0.48 35.45abc
15.77abc
Average 91.71 0.55 7.02 0.71 35.62AB
15.74AB
Dekalb 69 ECS 92.75 0.55 6.10 0.58 35.19abc
15.68abc
White 138 ECS 93.98 0 5.22 0.80 36.23abc
15.96abc
Average 93.36 0.28 5.66 0.69 35.17AB
15.82AB
Babcock 69 ECS 93.50 0.80 5.05 0.68 36.79ab
16.56a
White 138 ECS 92.38 0.40 6.76 0.48 36.77ab
16.06abc
Average 92.94 0.60 5.90 0.58 36.78A
16.31A
ISA 69 ECS 93.82 0.45 5.20 0.55 36.91a
15.97abc
B-400 138 ECS 90.00 0.28 8.90 0.82 35.89abc
16.39abc
Average 91.91 0.36 7.05 0.69 36.40A
16.18A
Hy-Line 69 ECS 93.57 0.37 5.23 0.77 32.87c
14.81bc
W-36 138 ECS 93.13 0 6.17 0.73 33.30bc
14.66c
Average 93.35 0.18 5.70 0.75 33.08C
14.73B
Hy-Line 69 ECS 93.60 0.38 5.50 0.58 33.04c
16.14abc
CV-24 138 ECS 93.38 0.15 6.35 0.12 34.87abc
15.97abc
Average 93.49 0.26 5.92 0.35 33.96BC
16.07A
Lohmann 69 ECS 92.90 1.15 5.45 0.52 35.21abc
15.96abc
LSL Lite 138 ECS 93.18 0.20 6.35 0.25 36.24abc
16.11abc
Average 93.04 0.68 5.90 0.39 35.72AB
16.04A
H&N 69 ECS 93.90 0.65 4.58 0.88 35.07abc
15.94abc
Nick Chick 138 ECS 93.58 0.50 5.80 0.12 35.77abc
16.25abc
Average 93.74 0.58 5.19 0.50 35.42AB
16.09A
Novogen 69 ECS 93.74 0.52 5.02 0.52 34.59abc
16.08abc
White 138 ECS 90.56 0.66 8.00 0.78 35.58abc
16.39ab
Average 92.25 0.59 6.51 0.65 35.09ABC
16.24A
All 69 ECS 93.64 0.58 5.15Y
0.63 35.06 15.88
Strains 138 ECS 92.16 0.33 7.02Z
0.49 35.58 15.94 1All strains were housed such that each strain is equally represented in each density. Enriched Colony Housing System=ECS.
ABC - Different letters denote significant differences (P<.01), comparisons made among strain average values.
abc - Different letters denote significant differences (P<.01) in the strain*density interactions. YZ - Different letters denote significant differences (P<.01), comparisons made among density average values.

73
TABLE 68. EFFECT OF BROWN EGG STRAIN AND DENSITY ON PERFORMANCE OF HENS IN THE 39th
NCLP&MT (119-483 DAYS) IN THE ENRICHED COLONY HOUSING SYSTEMS
Eggs
Age at
Feed Feed Per Bird Egg Egg
50%
Breeder Density1 Consumption Conversion Housed Production Mass Mortality Production
(Strain) (in2/hen) (kg/100/hen/d) (g egg/g feed)
(HD%) (g/HD) (%) (Days)
TETRA 69 ECS 10.60cdef
0.442bc
283.01 77.69bc
44.55d
1.39 145.50ab
Amber 138 ECS 11.04abcd
0.432c
290.02 79.44abc
46.57bcd
6.94 143.00ab
Average 10.82B
0.437D
286.52 78.57BC
45.56C
4.17 144.25ABC
TETRA 69 ECS 10.38ef
0.464abc
282.18 77.28bc
45.84cd
5.56 145.00ab
Brown 138 ECS 10.98abcde
0.438bc
278.31 76.31bc
45.49cd
1.85 140.33ab
Average 10.68BC
0.450CD
280.24 76.79C
45.66C
3.70 142.67ABC
Novogen 69 ECS 10.49def
0.510a
297.85 81.75abc
49.82abc
3.34 144.00ab
Brown 138 ECS 11.18ab
0.439bc
276.89 75.91c
46.91bcd
8.89 141.80ab
Average 10.84B
0.475ABCD
287.37 78.83BC
48.36ABC
6.11 142.90ABC
Lohmann 69 ECS 10.36f
0.485abc
294.17 80.74abc
48.49abcd
3.48 145.75ab
LB-Lite 138 ECS 10.44ef
0.515a
310.48 85.34a
51.87a
0 142.25ab
Average 10.40C
0.500A
302.32 83.04AB
50.18AB
1.74 144.00ABC
Hy-Line 69 ECS 10.79bcdef
0.487abc
303.42 83.20ab
47.73abcd
6.94 141.50ab
Silver Brown 138 ECS 10.981abcdef
0.463abc
304.12 83.43ab
48.37abcd
4.17 140.00ab
Average 10.85AB
0.475ABCD
303.77 83.32A
48.05ABC
5.56 140.75BC
Hy-Line 69 ECS 10.65cdef
0.494ab
289.23 78.35abc
47.64abcd
4.44 142.20ab
Brown 138 ECS 11.11abc
0.458abc
284.33 78.11bc
47.81abcd
0 139.40b
Average 10.88AB
0.476BC
286.78 78.73BC
47.73BC
2.22 140.80C
ISA 69 ECS 10.37f
0.504a
308.91 84.73a
50.87ab
4.45 146.00a
Brown 138 ECS 10.76bcdef
0.480abc
296.40 81.29abc
50.71ab
2.22 144.60ab
Average 10.56BC
0.492AB
302.65 83.01A
50.79A
3.34 145.30A
Bovans 69 ECS 10.96abcde
0.472abc
299.50 81.12abc
49.93abc
5.56 146.00a
Brown 138 ECS 11.40a
0.444bc
286.05 78.51abc
49.28abc
4.17 144.00ab
Average 10.18A
0.458BCD
292.78 80.31ABC
49.60AB
4.86 145.00AB
All 69 ECS 10.58Z
0.482Z
294.78 80.86 48.11 4.39 144.49Y
Strains 138 ECS 10.98Y
0.459Y
290.82 79.79 48.38 3.53 141.92Z
1All strains were housed such that each strain is equally represented in each density.
Enriched Colony Housing System=ECS.
ABCd - Different letters denote significant differences (P<.01), comparisons made among strain average values
abcdef - Different letters denote significant differences (P<.01) in the strain*density interactions. YZ - Different letters denote significant differences (P<.01), comparisons made among density average values.
Mortality percentage prior to analyzes was transformed in Square Root Asin
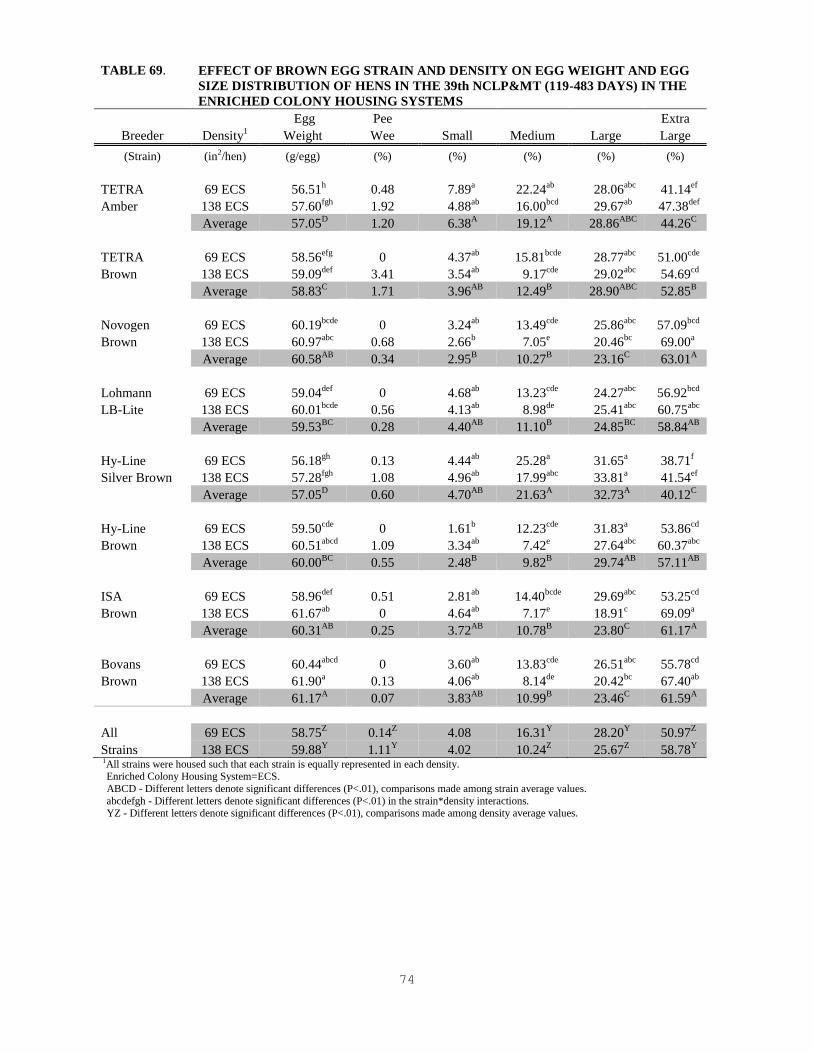
74
TABLE 69. EFFECT OF BROWN EGG STRAIN AND DENSITY ON EGG WEIGHT AND EGG
SIZE DISTRIBUTION OF HENS IN THE 39th NCLP&MT (119-483 DAYS) IN THE
ENRICHED COLONY HOUSING SYSTEMS
Egg Pee
Extra
Breeder Density1 Weight Wee Small Medium Large Large
(Strain) (in2/hen) (g/egg) (%) (%) (%) (%) (%)
TETRA 69 ECS 56.51h
0.48 7.89a
22.24ab
28.06abc
41.14ef
Amber 138 ECS 57.60fgh
1.92 4.88ab
16.00bcd
29.67ab
47.38def
Average 57.05D
1.20 6.38A
19.12A
28.86ABC
44.26C
TETRA 69 ECS 58.56efg
0 4.37ab
15.81bcde
28.77abc
51.00cde
Brown 138 ECS 59.09def
3.41 3.54ab
9.17cde
29.02abc
54.69cd
Average 58.83C
1.71 3.96AB
12.49B
28.90ABC
52.85B
Novogen 69 ECS 60.19bcde
0 3.24ab
13.49cde
25.86abc
57.09bcd
Brown 138 ECS 60.97abc
0.68 2.66b
7.05e
20.46bc
69.00a
Average 60.58AB
0.34 2.95B
10.27B
23.16C
63.01A
Lohmann 69 ECS 59.04def
0 4.68ab
13.23cde
24.27abc
56.92bcd
LB-Lite 138 ECS 60.01bcde
0.56 4.13ab
8.98de
25.41abc
60.75abc
Average 59.53BC
0.28 4.40AB
11.10B
24.85BC
58.84AB
Hy-Line 69 ECS 56.18gh
0.13 4.44ab
25.28a
31.65a
38.71f
Silver Brown 138 ECS 57.28fgh
1.08 4.96ab
17.99abc
33.81a
41.54ef
Average 57.05D
0.60 4.70AB
21.63A
32.73A
40.12C
Hy-Line 69 ECS 59.50cde
0 1.61b
12.23cde
31.83a
53.86cd
Brown 138 ECS 60.51abcd
1.09 3.34ab
7.42e
27.64abc
60.37abc
Average 60.00BC
0.55 2.48B
9.82B
29.74AB
57.11AB
ISA 69 ECS 58.96def
0.51 2.81ab
14.40bcde
29.69abc
53.25cd
Brown 138 ECS 61.67ab
0 4.64ab
7.17e
18.91c
69.09a
Average 60.31AB
0.25 3.72AB
10.78B
23.80C
61.17A
Bovans 69 ECS 60.44abcd
0 3.60ab
13.83cde
26.51abc
55.78cd
Brown 138 ECS 61.90a
0.13 4.06ab
8.14de
20.42bc
67.40ab
Average 61.17A
0.07 3.83AB
10.99B
23.46C
61.59A
All 69 ECS 58.75Z
0.14Z
4.08 16.31Y
28.20Y
50.97Z
Strains 138 ECS 59.88Y
1.11Y
4.02 10.24Z
25.67Z
58.78Y
1All strains were housed such that each strain is equally represented in each density. Enriched Colony Housing System=ECS.
ABCD - Different letters denote significant differences (P<.01), comparisons made among strain average values.
abcdefgh - Different letters denote significant differences (P<.01) in the strain*density interactions. YZ - Different letters denote significant differences (P<.01), comparisons made among density average values.

75
TABLE 70. EFFECT OF BROWN EGG STRAIN AND DENSITY ON EGG QUALITY, INCOME
AND FEED COSTS OF HENS IN THE 39th NCLP&MT (119-483 DAYS) IN THE
ENRICHED COLONY HOUSING SYSTEMS
Grade Grade
Egg Feed
Breeder Density1 A B Cracks Loss Income Costs
(Strain) (in2/hen) (%) (%) (%) (%) ($/hen) ($/hen)
TETRA 69 ECS 92.58 0.42 6.62 0.38 30.55 15.68ab
Amber 138 ECS 91.18 1.40 7.20 0.25 31.87 16.37ab
Average 91.88 0.91 6.91 0.31 31.21 16.02AB
TETRA 69 ECS 92.87 0.60 5.87 0.70 31.43 15.38ab
Brown 138 ECS 93.67 0.17 6.03 0.17 31.26 16.29ab
Average 93.27 0.38 5.95 0.43 31.34 15.83AB
Novogen 69 ECS 92.70 0.62 5.94 0.72 33.39 15.55ab
Brown 138 ECS 92.62 0.54 6.38 0.50 31.44 16.59ab
Average 92.66 0.58 6.16 0.61 32.42 16.07AB
Lohmann 69 ECS 92.92 0.38 5.52 1.18 33.06 15.34b
LB-Lite 138 ECS 91.10 0.52. 8.12 0.25 34.83 15.47ab
Average 92.10 0.45 6.82 0.71 33.95 15.40B
Hy-Line 69 ECS 95.20 0.10 4.70 0 33.46 15.97ab
Silver Brown 138 ECS 94.10 0.32 4.82 0.72 33.62 16.17ab
Average 94.65 0.21 4.76 0.36 33.54 16.07AB
Hy-Line 69 ECS 94.06 0.22 5.20 0.56 32.74 15.76ab
Brown 138 ECS 91.92 0.48 7.10 0.52 31.91 16.47ab
Average 92.99 0.35 6.15 0.54 32.33 16.12AB
ISA 69 ECS 94.06 0.22 5.30 0.44 34.96 15.36b
Brown 138 ECS 92.42 0.10 7.26 0.20 33.69 15.95ab
Average 93.24 0.16 6.28 0.32 34.32 15.65B
Bovans 69 ECS 94.70 0.16 4.48 0.68 33.91 16.22ab
Brown 138 ECS 92.78 0.25 6.82 0.15 32.57 16.90a
Average 93.74 0.20 5.65 0.41 33.24 16.56A
All 69 ECS 93.63 0.34 5.45Y
0.58 32.94 15.66Z
Strains 138 ECS 92.47 0.47 6.72Z
0.34 32.65 16.28Y
1All strains were housed such that each strain is equally represented in each density. Enriched Colony Housing System=ECS.
AB - Different letters denote significant differences (P<.01), comparisons made among strain average values.
ab - Different letters denote significant differences (P<.01) in the strain*density interactions. YZ - Different letters denote significant differences (P<.01), comparisons made among density average values.

76
TABLE 71. EFFECT OF WHITE EGG STRAIN AND DENSITY ON PERFORMANCE OF HENS
IN THE 39th NCLP&MT (483-511 DAYS) IN THE ENRICHED COLONY HOUSING
SYSTEMS
Eggs
Feed Feed Per Bird Egg Egg
Breeder Density1 Consumption Conversion Housed Production Mass Mortality
(Strain) (in2/hen) (kg/100/hen/d) (g egg/g feed)
(HD%) (g/HD) (%)
Bovans 69 ECS 11.25abc
0.468abcd
23.68ab
83.69ab
52.82ab
1.39
White 138 ECS 11.38abc
0.495abcd
25.22a
89.36a
56.26ab
1.39
Average 11.32BC
0.481 24.45AB
86.52 54.54 1.39
Shaver 69 ECS 11.89abc
0.455abcd
24.15ab
83.16ab
53.75ab
3.47
White 138 ECS 10.83abc
0.545a
25.45a
90.89a
58.97a
0
Average 11.36AB
0.500 24.80AB
87.02 56.36 1.74
Dekalb 69 ECS 11.10abc
0.495abcd
24.41ab
86.55ab
54.68ab
1.39
White 138 ECS 10.96abc
0.522abc
25.84a
91.21a
57.38ab
2.78
Average 11.03AB
0.509 25.12A
88.84 56.03 2.08
Babcock 69 ECS 12.82a
0.415cd
23.30ab
82.46ab
52.98ab
2.08
White 138 ECS 11.16abc
0.532ab
25.33a
90.49a
59.24a
0
Average 11.99A
0.474 24.32AB
86.48 56.11 1.04
ISA 69 ECS 10.98abc
0.510abc
24.32ab
86.44ab
56.10ab
0.69
B-400 138 ECS 11.06abc
0.512abc
24.16ab
85.52ab
56.55ab
1.39
Average 11.02AB
0.511 24.24AB
85.98
56.32 1.04
Hy-Line 69 ECS 10.08bc
0.480abcd
21.59ab
77.10ab
48.55ab
0
W-36 138 ECS 9.98c
0.497abcd
21.59ab
77.11ab
49.37ab
0
Average 10.03B
0.488 21.59B
77.10 48.96 0
Hy-Line 69 ECS 12.16ab
0.442abcd
22.97ab
82.02ab
53.75ab
0.69
CV-24 138 ECS 10.89abc
0.530abc
25.17a
89.90a
57.55ab
0
Average 11.52A
0.486 24.07AB
85.96 55.65 0.35
Lohmann 69 ECS 11.86abc
0.388d
19.92b
71.13b
45.64b
0
LSL Lite 138 ECS 11.28abc
0.528abc
25.03a
89.40a
59.23a
0
Average 11.57A
0.458 22.47AB
80.26 52.44 0
H&N 69 ECS 12.03abc
0.458abcd
23.96ab
87.76ab
55.11ab
0.69
Nick Chick 138 ECS 11.29abc
0.520abc
25.11a
88.65ab
58.72a
1.39
Average 11.66A
0.489 24.54AB
86.81 56.91 1.04
Novogen 69 ECS 11.77abc
0.428bcd
22.04ab
76.92ab
50.25ab
1.67
White 138 ECS 11.76abc
0.514abc
25.48a
91.01a
59.99a
0
Average 11.77A
0.471 23.76AB
83.96 55.12 0.83
All 69 ECS 11.59Y
0.454Y
23.03Z
81.42Z
52.36Z
1.21
Strains 138 ECS 11.06Z
0.519Z
24.84Y
88.36Y
57.33Y
0.69 1All strains were housed such that each strain is equally represented in each density.
Enriched Colony Housing System=ECS
ABC - Different letters denote significant differences (P<.01), comparisons made among strain average values. abcd - Different letters denote significant differences (P<.01) in the strain*density interactions.
YZ - Different letters denote significant differences (P<.01), comparisons made among density average values.
Mortality percentage prior to analyzes was transformed in Square Root Asin

77
TABLE 72. EFFECT OF WHITE EGG STRAIN AND DENSITY ON EGG WEIGHT AND EGG
SIZE DISTRIBUTION OF HENS IN THE 39th NCLP&MT (483-511 DAYS) IN THE
ENRICHED COLONY HOUSING SYSTEMS
Egg Pee
Extra
Breeder Density1 Weight Wee Small Medium Large Large
(Strain) (in2/hen) (g/egg) (%) (%) (%) (%) (%)
Bovans 69 ECS 63.08 0 0 0 31.71 58.56
White 138 ECS 62.98 0 0 0 27.16 59.69
Average 63.03B
0 0 0 29.43A
59.12
Shaver 69 ECS 64.61 0 0 0.83 9.28 72.24
White 138 ECS 64.90 0 0 0 1.32 76.54
Average 64.75AB
0 0 0.42 5.30AB
74.39
Dekalb 69 ECS 63.18 0 0 0 34.29 57.44
White 138 ECS 62.99 0 0 0 23.10 65.41
Average 63.08AB
0 0 0 28.70A
61.42
Babcock 69 ECS 64.23 0 0 0 19.77 67.44
White 138 ECS 65.46 0 0 0 6.35 66.32
Average 64.84AB
0 0 0 13.06AB
66.88
ISA 69 ECS 64.90 0 0 0 13.92 74.68
B-400 138 ECS 66.08 0 0 0 0 71.44
Average 65.49AB
0 0 0 6.96AB
73.06
Hy-Line 69 ECS 62.97 0 0 0 12.39 74.28
W-36 138 ECS 64.06 0 0 0 19.46 68.93
Average 63.52AB
0 0 0 15.92AB
71.60
Hy-Line 69 ECS 65.61 0 0 0 13.50 76.18
CV-24 138 ECS 64.07 0 0 1.92 16.42 62.48
Average 64.84AB
0 0 0.96 14.96AB
69.33
Lohmann 69 ECS 64.05 0 0 0 21.19 67.32
LSL Lite 138 ECS 66.25 0 0 0 6.61 82.82
Average 65.15AB
0 0 0 13.90AB
75.07
H&N 69 ECS 64.98 0 0 0 13.33 75.00
Nick Chick 138 ECS 66.10 0 0 0 6.36 79.46
Average 65.54AB
0 0 0 9.84AB
77.23
Novogen 69 ECS 65.48 0 0 0 8.40 76.48
White 138 ECS 65.93 0 0 0 0 76.75
Average 65.70A
0 0 0 4.20B
76.61
All 69 ECS 64.31 0 0 0.08 17.78 69.96
Strains 138 ECS 64.88 0 0 0.19 10.68 70.98 1All strains were housed such that each strain is equally represented in each density.
Enriched Colony Housing System=ECS.
AB - Different letters denote significant differences (P<.01), comparisons made among strain average values.

78
TABLE 73. EFFECT OF WHITE EGG STRAIN AND DENSITY ON EGG QUALITY, INCOME
AND FEED COSTS OF HENS IN THE 39th NCLP&MT (483-511 DAYS) IN THE
ENRICHED COLONY HOUSING SYSTEMS
Grade Grade
Egg Feed
Breeder Density1 A B Cracks Loss Income Costs
(Strain) (in2/hen) (%) (%) (%) (%) ($/hen) ($/hen)
Bovans 69 ECS 90.28 0 8.80 0.92 2.69 1.26abc
White 138 ECS 86.85 0 11.83 1.32 2.81 1.28abc
Average 88.56 0 10.31 1.12 2.75 1.27AB
Shaver 69 ECS 82.36 0.86 14.28 2.50 2.60 1.33abc
White 138 ECS 77.86 0 22.14 0 2.73 1.22abc
Average 80.11 0.43 18.21 1.25 2.66 1.27AB
Dekalb 69 ECS 91.73 0 7.27 1.00 2.78 1.24abc
White 138 ECS 88.51 0 11.49 0 2.92 1.23abc
Average 90.12 0 9.38 0.50 2.85 1.24AB
Babcock 69 ECS 87.22 0 11.11 1.67 2.559 1.44a
White 138 ECS 72.67 0 27.33 0 2.63 1.25abc
Average 79.95 0 19.22 0.83 2.61 1.34A
ISA 69 ECS 88.60 1.04 8.63 1.72 2.73 1.23abc
B-400 138 ECS 71.44 0 27.16 1.39 2.48 1.24abc
Average 80.02 0.52 17.90 1.56 2.61 1.23AB
Hy-Line 69 ECS 86.67 0 13.33 0 2.42 1.13bc
W-36 138 ECS 88.39 0 11.61 0 2.44 1.12c
Average 87.53 0 12.47 0 2.43 1.12B
Hy-Line 69 ECS 89.68 0 9.45 0.86 2.60 1.36ab
CV-24 138 ECS 80.82 0 18.05 1.14 2.71 1.22abc
Average 85.25 0 13.75 1.00 2.66 1.29A
Lohmann 69 ECS 88.52 0 11.48 0 2.26 1.33abc
LSL Lite 138 ECS 89.42 0 10.58 0 2.85 1.26abc
Average 88.97 0 11.03 0 2.55 1.30A
H&N 69 ECS 88.33 0 9.79 1.88 2.69 1.35abc
Nick Chick 138 ECS 85.82 0 14.18 0 2.81 1.26abc
Average 87.08 0 11.99 0.94 2.75 1.30A
Novogen 69 ECS 84.88 2.00 11.79 1.33 2.43 1.32abc
White 138 ECS 76.75 0 22.07 1.18 2.70 1.32abc
Average 80.81 1.00 16.93 1.25 2.57 1.32A
All 69 ECS 87.82Y
0.39 10.59Y
1.19 2.58 1.30Y
Strains 138 ECS 81.85Z
0 17.64Z
0.50 2.71 1.24Z
1All strains were housed such that each strain is equally represented in each density.
Enriched Colony Housing System=ECS. AB - Different letters denote significant differences (P<.01), comparisons made among strain average values.
abc - Different letters denote significant differences (P<.01) in the strain*density interactions
YZ - Different letters denote significant differences (P<.01), comparisons made among density average values.

79
TABLE 74. EFFECT OF BROWN EGG STRAIN AND DENSITY ON PERFORMANCE OF HENS
IN THE 39th NCLP&MT (483-511 DAYS) IN THE ENRICHED COLONY HOUSING
SYSTEMS
Eggs
Feed Feed Per Bird Egg Egg
Breeder Density1 Consumption Conversion Housed Production Mass Mortality
(Strain) (in2/hen) (kg/100/hen/d) (g egg/g feed)
(HD%) (g/HD) (%)
TETRA 69 ECS 11.86 0.382b
20.61 73.60 45.41 0
Amber 138 ECS 11.23 0.420ab
21.61 77.18 47.35 0
Average 11.55 0.401B
21.11 75.39 46.38 0
TETRA 69 ECS 11.19 0.420ab
20.77 73.92 46.74 0.93
Brown 138 ECS 11.51 0.420ab
21.48 76.70 48.25 0
Average 11.35 0.420AB
21.12 75.31 47.49 0.46
Novogen 69 ECS 11.53 0.436ab
21.96 78.41 50.26 1.67
Brown 138 ECS 10.97 0.454ab
22.19 77.24 49.62 2.22
Average 11.25 0.445AB
22.07 77.83 49.94 1.95
Lohmann 69 ECS 11.70 0.442ab
22.71 79.98 51.16 2.08
LB-Lite 138 ECS 10.92 0.505a
24.32 85.87 55.16 1.39
Average 11.31 0.474 AB
23.51 82.93 53.39 1.74
Hy-Line 69 ECS 11.75 0.425ab
22.87 81.68 49.88 0
Silver Brown 138 ECS 12.07 0.425ab
23.50 83.94 51.52 0
Average 11.91 0.425AB
23.19 82.81 50.69 0
Hy-Line 69 ECS 11.54 0.414ab
21.08 75.28 47.89 0
Brown 138 ECS 11.26 0.412ab
20.50 73.22 46.46 0
Average 11.40 0.413AB
20.79 74.25 47.17 0
ISA 69 ECS 10.93 0.464ab
24.09 81.46 50.72 0.56
Brown 138 ECS 11.58 0.492ab
22.91 85.54 56.78 1.11
Average 11.26 0.078A
23.50 83.50 53.75 0.83
Bovans 69 ECS 11.86 0.438ab
22.93 81.76 52.00 0.56
Brown 138 ECS 11.28 0.480ab
23.38 83.11 53.50 1.39
Average 11.57 0.459AB
23.15 82.43 52.75 0.97
All 69 ECS 11.54 0.428 21.98 78.12 49.31 0.72
Strains 138 ECS 11.35 0.451 22.63 80.50 51.08 0.76 1All strains were housed such that each strain is equally represented in each density.
Enriched Colony Housing System=ECS. AB - Different letters denote significant differences (P<.01), comparisons made among strain average values.
ab - Different letters denote significant differences (P<.01) in the strain*density interactions.
Mortality percentage prior to analyzes was transformed in Square Root Asin

80
TABLE 75. EFFECT OF BROWN EGG STRAIN AND DENSITY ON EGG WEIGHT AND EGG
SIZE DISTRIBUTION OF HENS IN THE 39th NCLP&MT (483-511 DAYS) IN THE
ENRICHED COLONY HOUSING SYSTEMS
Egg Pee
Extra
Breeder Density1 Weight Wee Small Medium Large Large
(Strain) (in2/hen) (g/egg) (%) (%) (%) (%) (%)
TETRA 69 ECS 61.70cd
0 0 2.76 32.62ab
55.08
Amber 138 ECS 61.40cd
0 0 0 42.12a
48.07
Average 61.55BC
0 0 1.38 37.37AB
51.58
TETRA 69 ECS 63.21abcd
0 0 0 20.68ab
62.96
Brown 138 ECS 62.92bcd
0 0 0 31.84ab
61.01
Average 63.06ABC
0 0 0 26.26AB
61.99
Novogen 69 ECS 65.05ab
0 0 2.50 12.32ab
74.63
Brown 138 ECS 63.19bcd
0 0 0.71 22.37ab
65.19
Average 64.12A
0 0 1.61 17.35B
69.91
Lohmann 69 ECS 64.54abc
0 0 0 18.18ab
69.71
LB-Lite 138 ECS 64.25abcd
0 0 0 9.92ab
68.71
Average 64.39A
0 0 0 14.04B
69.09
Hy-Line 69 ECS 61.10d
0 0 0 46.88a
48.75
Silver Brown 138 ECS 61.34cd
0 0 0 40.38a
52.73
Average 61.22C
0 0 0 43.63A
50.74
Hy-Line 69 ECS 63.55abcd
0 0 0 21.20ab
67.49
Brown 138 ECS 63.39abcd
0 0 1.43 22.96ab
63.89
Average 63.47AB
0 0 0.71 22.08AB
65.69
ISA 69 ECS 66.41a
0 0 0 38.06a
50.48
Brown 138 ECS 62.28bcd
0 0 0 3.33b
74.28
Average 64.34A
0 0 0 20.70B
62.38
Bovans 69 ECS 63.60abcd
0 0 0 24.12ab
63.00
Brown 138 ECS 64.26abcd
0 0 0 26.50ab
64.35
Average 63.93A
0 0 0 25.31
63.68
All 69 ECS 63.13 0 0 0.43 26.76 61.48
Strains 138 ECS 63.39 0 0 0.49 24.93 62.28 1All strains were housed such that each strain is equally represented in each density. Enriched Colony Housing System=ECS.
ABC - Different letters denote significant differences (P<.01), comparisons made among strain average values.
abcd - Different letters denote significant differences (P<.01) in the strain*density interactions.

81
TABLE 76. EFFECT OF BROWN EGG STRAIN AND DENSITY ON EGG QUALITY, INCOME
AND FEED COSTS OF HENS IN THE 39th NCLP&MT (483-511 DAYS) IN THE
ENRICHED COLONY HOUSING SYSTEMS
Grade Grade
Egg Feed
Breeder Density1 A B Cracks Loss Income Costs
(Strain) (in2/hen) (%) (%) (%) (%) ($/hen) ($/hen)
TETRA 69 ECS 90.45 0 8.59 0.96 2.32 1.33
Amber 138 ECS 90.20 1.67 5.86 2.27 2.43 1.26
Average 90.32 0.83 7.22 1.62 2.38 1.29
TETRA 69 ECS 83.64 0 16.36 0 2.29 1.25
Brown 138 ECS 92.86 0 4.76 2.38 2.45 1.29
Average 88.25 0 10.56 1.19 2.37 1.27
Novogen 69 ECS 87.67 1.33 11.00 0 2.47 1.29
Brown 138 ECS 90.06 0 9.94 0 2.50 1.23
Average 88.86 0.67 10.47 0 2.49 1.26
Lohmann 69 ECS 87.66 0 12.34 0 2.56 1.31
LB-Lite 138 ECS 78.62 0 21.38 0 2.61 1.22
Average 83.14 0 16.86 0 2.58 1.27
Hy-Line 69 ECS 95.62 0 4.38 0 2.67 1.32
Silver Brown 138 ECS 93.11 0 6.89 0 2.70 1.35
Average 94.37 0 5.63 0 2.69 1.34
Hy-Line 69 ECS 88.70 0 11.30 0 2.38 1.29
Brown 138 ECS 88.28 0 8.65 3.08 2.27 1.26
Average 88.49 0 9.98 1.54 2.33 1.28
ISA 69 ECS 88.54 0 10.79 0.66 2.57 1.22
Brown 138 ECS 77.61 0 22.39 0 2.58 1.30
Average 83.08 0 16.59 0.33 2.58 1.26
Bovans 69 ECS 87.12 0 9.48 3.41 2.52 1.33
Brown 138 ECS 90.85 0 6.65 2.50 2.64 1.26
Average 88.98 0 8.06 2.95 2.58 1.30
All 69 ECS 88.67 0.16 10.53 0.63 2.47 1.29
Strains 138 ECS 87.70 0.21 10.82 1.28 2.52 1.27 1All strains were housed such that each strain is equally represented in each density. Enriched Colony Housing System=ECS.

82
TABLE 77. EFFECT OF WHITE EGG STRAIN AND DENSITY ON PERFORMANCE OF HENS
IN THE 39th NCLP&MT (511-763 DAYS) IN THE ENRICHED COLONY HOUSING
SYSTEMS
Eggs
Feed Feed Per Bird Egg Egg
Breeder Density1 Consumption Conversion Housed Production Mass Mortality
(Strain) (in2/hen) (kg/100/hen/d) (g egg/g feed)
(HD%) (g/HD) (%)
Bovans 69 ECS 119.53abcd
0.40efg
188.90ab
73.81abcd
48.04abc
6.95
White 138 ECS 111.16cdef
0.46abcde
199.30ab
77.76abc
50.03abc
6.95
Average 115.34AB
0.43AB
194.10A 75.79
A 49.03
A 6.95
Shaver 69 ECS 121.11abc
0.39fg
183.66ab
70.92abcdef
46.92bcd
12.51
White 138 ECS 108.14efg
0.46abcd
192.03ab
75.17abcd
49.86abc
8.34
Average 114.62AB
0.43AB
187.84A 73.05
A 48.39
A 10.42
Dekalb 69 ECS 113.95bcdef
0.41efg
185.22ab
72.02abcde
46.47bcde
13.90
White 138 ECS 105.80fg
0.48ab
202.78a 79.03
ab 51.04
abc 9.73
Average 109.87B 0.45
A 194.00
A 75.53
A 48.78
A 11.81
Babcock 69 ECS 126.07a 0.39
fg 186.77
ab 72.73
abcd 48.19
abc 17.37
White 138 ECS 105.80fg
0.47abc
193.28ab
75.62abcd
50.30abc
6.67
Average 115.94AB
0.43AB
190.02A 74.17
A 49.24
A 12.02
ISA 69 ECS 114.31bcdef
0.42defg
187.04ab
73.09abcd
47.91abc
11.90
B-400 138 ECS 109.13def
0.43bcdef
182.15ab
71.22abcde
47.48bcd
12.50
Average 111.72AB
0.43AB
184.59AB
72.16A 47.69
A 12.20
Hy-Line 69 ECS 103.75fg
0.39fg
156.24b 61.11
f 40.12
e 9.26
W-36 138 ECS 96.27g 0.42
cdefg 158.71
ab 62.20
ef 40.97
de 5.56
Average 100.01C 0.41
B 157.48
B 61.66
B 40.54
B 7.41
Hy-Line 69 ECS 118.21abcde
0.39fg
171.74ab
68.02def
46.11cde
11.12
CV-24 138 ECS 106.53fg
0.47abc
191.24ab
75.58abcd
49.92abc
12.51
Average 112.37AB
0.43AB
181.49AB
71.30A 48.02
A 11.81
Lohmann 69 ECS 127.83a 0.37
g 180.36
ab 70.17
bcdef 47.37
bcd 18.06
LSL Lite 138 ECS 108.79def
0.45abcde
185.99ab
72.20abcde
48.61abc
12.51
Average 118.31A 0.41
B 183.18
AB 71.19
A 47.99
A 15.29
H&N 69 ECS 122.37ab
0.38g 176.32
ab 68.54
cdef 45.73
cde 13.20
Nick Chick 138 ECS 109.42def
0.49a 203.66
a 79.08
a 53.03
a 19.46
Average 115.90AB
0.43AB
189.99A 73.81
A 49.51
A 16.33
Novogen 69 ECS 124.85a 0.38
g 182.65
ab 70.24
bcdef 47.51
bc 16.12
White 138 ECS 111.33cdef
0.47abc
196.51ab
76.64abcd
51.92ab
11.12
Average 118.09A 0.43
AB 189.58
A 73.44
A 49.72
A 13.62
All 69 ECS 119.20Z 0.39
Y 179.89
Z 70.07
Z 46.44
Z 13.04
Strains 138 ECS 107.24Y 0.46
Z 190.56
Y 74.35
Y 49.34
Y 10.53
1All strains were housed such that each strain is equally represented in each density.
Enriched Colony Housing System=ECS
ABC - Different letters denote significant differences (P<.01), comparisons made among strain average values. abcdefg - Different letters denote significant differences (P<.01) in the strain*density interactions.
YZ - Different letters denote significant differences (P<.01), comparisons made among density average values.
Mortality percentage prior to analyzes was transformed in Square Root Asin

83
TABLE 78. EFFECT OF WHITE EGG STRAIN AND DENSITY ON EGG WEIGHT AND EGG SIZE
DISTRIBUTION OF HENS IN THE 39th NCLP&MT (511-763 DAYS) IN THE
ENRICHED COLONY HOUSING SYSTEMS
Egg Pee
Extra
Breeder Density1 Weight Wee Small Medium Large Large
(Strain) (in2/hen) (g/egg) (%) (%) (%) (%) (%)
Bovans 69 ECS 65.11efgh
0 0.14 0.53ab
9.92abc
83.61abc
White 138 ECS 64.35h 0 0 1.25
a 12.97
a 78.80
c
Average 64.73E 0 0.07 0.89
A 11.44
A 81.21
C
Shaver 69 ECS 66.24abcdefg
0 0 0b 5.54
abc 85.73
abc
White 138 ECS 66.45abcdef
0 0 0.19ab
4.30abc
88.39abc
Average 66.34BCD
0 0 0.10B 4.92
BC 87.06
ABC
Dekalb 69 ECS 64.68fgh
0 0.14 1b 12.28
ab 81.43
bc
White 138 ECS 64.65gh
0 0 0.19ab
9.22abc
85.47abc
Average 64.66E 0 0.07 0.10
B 10.75
AB 83.45
BC
Babcock 69 ECS 66.29abcdefg
0 0 0.11b 6.14
abc 87.25
abc
White 138 ECS 66.53abcde
0 0 0b 3.09
c 93.22
a
Average 66.41BCD
0 0 0.06B 4.61
C 90.24
AB
ISA 69 ECS 65.56defgh
0 0 0.13b 6.63
abc 85.92
abc
B-400 138 ECS 66.68abcde
0 0 0b 4.28
abc 88.37
abc
Average 66.12CD
0 0 0.06B 5.46
BC 87.15
ABC
Hy-Line 69 ECS 65.76cdefgh
0 0 0.18ab
9.30abc
84.48abc
W-36 138 ECS 65.98bcdefgh
0 0 0b 5.55
abc 88.70
abc
Average 65.87DE
0 0 0.09B 7.42
ABC 86.59
ABC
Hy-Line 69 ECS 67.86a 0 0 0
b 5.89
abc 89.32
abc
CV-24 138 ECS 67.02abcd
0 0 0.39ab
3.86bc
86.56abc
Average 67.44AB
0 0 0.19B 4.88
C 87.94
ABC
Lohmann 69 ECS 67.39abc
0 0 0.17b 6.78
abc 87.25
abc
LSL Lite 138 ECS 67.36abc
0 0 0b 3.53
bc 91.14
ab
Average 67.38AB
0 0 0.08B 5.15
BC 89.19
AB
H&N 69 ECS 67.79abcde
0 0 0.14b 5.17
abc 87.19
abc
Nick Chick 138 ECS 67.46abc
0 0 0.50ab
4.83abc
88.19abc
Average 67.12ABC
0 0 0.32AB
5.00BC
87.69ABC
Novogen 69 ECS 67.68ab
0 0 0b 3.07
c 92.91
a
White 138 ECS 67.85a 0 0 0
b 3.70
bc 88.55
abc
Average 67.77A 0 0 0
B 3.38
C 90.70
A
All 69 ECS 66.34 0 0 0.13 7.07Y 86.51
Strains 138 ECS 66.43 0 0 0.25 5.54Z 87.74
1All strains were housed such that each strain is equally represented in each density.
Enriched Colony Housing System=ECS.
ABCDE - Different letters denote significant differences (P<.01), comparisons made among strain average values.
abcdefg - Different letters denote significant differences (P<.01) in the strain*density interactions.
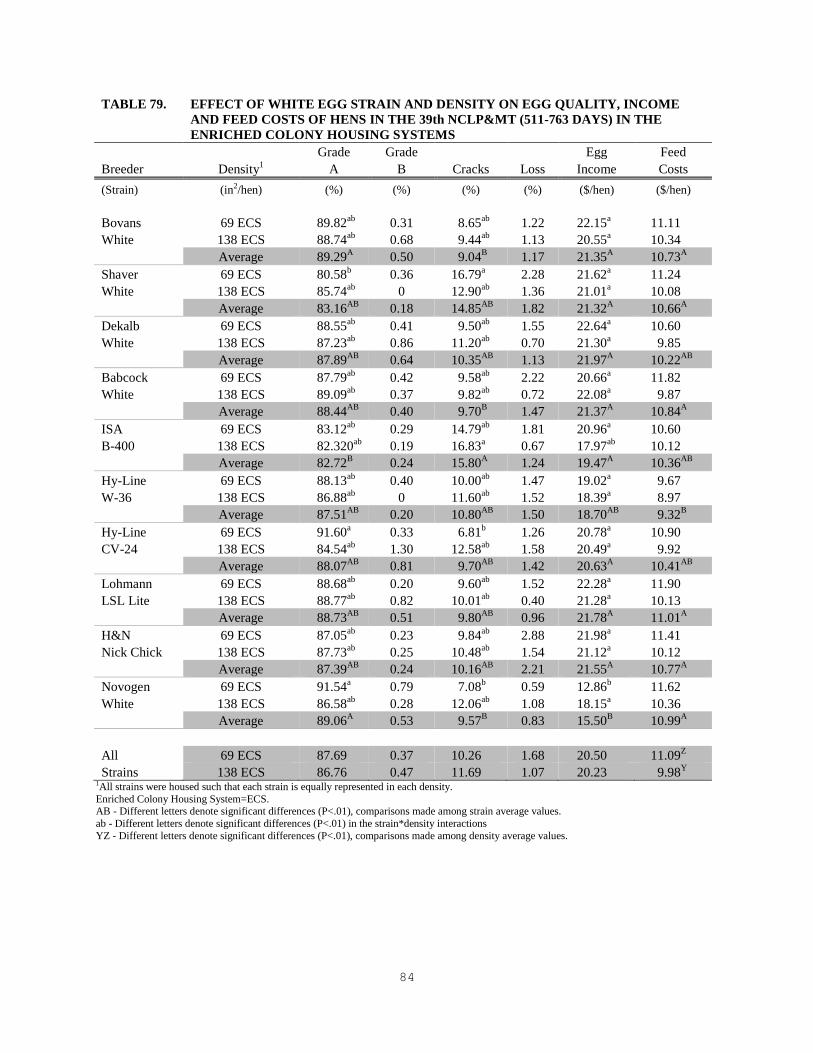
84
TABLE 79. EFFECT OF WHITE EGG STRAIN AND DENSITY ON EGG QUALITY, INCOME
AND FEED COSTS OF HENS IN THE 39th NCLP&MT (511-763 DAYS) IN THE
ENRICHED COLONY HOUSING SYSTEMS
Grade Grade
Egg Feed
Breeder Density1 A B Cracks Loss Income Costs
(Strain) (in2/hen) (%) (%) (%) (%) ($/hen) ($/hen)
Bovans 69 ECS 89.82ab
0.31 8.65ab
1.22 22.15a 11.11
White 138 ECS 88.74ab
0.68 9.44ab
1.13 20.55a 10.34
Average 89.29A 0.50 9.04
B 1.17 21.35
A 10.73
A
Shaver 69 ECS 80.58b 0.36 16.79
a 2.28 21.62
a 11.24
White 138 ECS 85.74ab
0 12.90ab
1.36 21.01a 10.08
Average 83.16AB
0.18 14.85AB
1.82 21.32A 10.66
A
Dekalb 69 ECS 88.55ab
0.41 9.50ab
1.55 22.64a 10.60
White 138 ECS 87.23ab
0.86 11.20ab
0.70 21.30a 9.85
Average 87.89AB
0.64 10.35AB
1.13 21.97A 10.22
AB
Babcock 69 ECS 87.79ab
0.42 9.58ab
2.22 20.66a 11.82
White 138 ECS 89.09ab
0.37 9.82ab
0.72 22.08a 9.87
Average 88.44AB
0.40 9.70B 1.47 21.37
A 10.84
A
ISA 69 ECS 83.12ab
0.29 14.79ab
1.81 20.96a 10.60
B-400 138 ECS 82.320ab
0.19 16.83a 0.67 17.97
ab 10.12
Average 82.72B 0.24 15.80
A 1.24 19.47
A 10.36
AB
Hy-Line 69 ECS 88.13ab
0.40 10.00ab
1.47 19.02a 9.67
W-36 138 ECS 86.88ab
0 11.60ab
1.52 18.39a 8.97
Average 87.51AB
0.20 10.80AB
1.50 18.70AB
9.32B
Hy-Line 69 ECS 91.60a 0.33 6.81
b 1.26 20.78
a 10.90
CV-24 138 ECS 84.54ab
1.30 12.58ab
1.58 20.49a 9.92
Average 88.07AB
0.81 9.70AB
1.42 20.63A 10.41
AB
Lohmann 69 ECS 88.68ab
0.20 9.60ab
1.52 22.28a 11.90
LSL Lite 138 ECS 88.77ab
0.82 10.01ab
0.40 21.28a 10.13
Average 88.73AB
0.51 9.80AB
0.96 21.78A 11.01
A
H&N 69 ECS 87.05ab
0.23 9.84ab
2.88 21.98a 11.41
Nick Chick 138 ECS 87.73ab
0.25 10.48ab
1.54 21.12a 10.12
Average 87.39AB
0.24 10.16AB
2.21 21.55A 10.77
A
Novogen 69 ECS 91.54a 0.79 7.08
b 0.59 12.86
b 11.62
White 138 ECS 86.58ab
0.28 12.06ab
1.08 18.15a 10.36
Average 89.06A 0.53 9.57
B 0.83 15.50
B 10.99
A
All 69 ECS 87.69 0.37 10.26 1.68 20.50 11.09Z
Strains 138 ECS 86.76 0.47 11.69 1.07 20.23 9.98Y
1All strains were housed such that each strain is equally represented in each density.
Enriched Colony Housing System=ECS. AB - Different letters denote significant differences (P<.01), comparisons made among strain average values.
ab - Different letters denote significant differences (P<.01) in the strain*density interactions
YZ - Different letters denote significant differences (P<.01), comparisons made among density average values.

85
TABLE 80. EFFECT OF BROWN EGG STRAIN AND DENSITY ON PERFORMANCE OF HENS
IN THE 39th NCLP&MT (511-763 DAYS) IN THE ENRICHED COLONY HOUSING
SYSTEMS
Eggs
Feed Feed Per Bird Egg Egg
Breeder Density1 Consumption Conversion Housed Production Mass Mortality
(Strain) (in2/hen) (kg/100/hen/d) (g egg/g feed)
(HD%) (g/HD) (%)
TETRA 69 ECS 123.28ab
0.30e 146.45 56.97
cd 36.46
bc 15.98
Amber 138 ECS 101.36e 0.35
de 147.80 57.23
bcd 35.68
c 16.68
Average 112.32AB
0.32C 147.13 57.10
C 36.07
E 16.33
TETRA 69 ECS 124.54ab
0.32de
156.54 60.94abcd
39.88abc
14.82
Brown 138 ECS 106.75de
0.32de
137.11 53.67d 34.72
c 5.56
Average 115.65AB
0.32C 146.83 57.31
BC 37.30
DE 10.19
Novogen 69 ECS 122.43ab
0.34de
159.21 62.36abcd
41.91abc
15.56
Brown 138 ECS 104.27e 0.42
abc 171.75 66.41
abc 43.16
ab 17.20
Average 113.35AB
0.38AB
165.48 64.39AB
42.53ABC
16.38
Lohmann 69 ECS 121.95abc
0.35de
164.92 64.12abcd
42.61abc
20.85
LB-Lite 138 ECS 103.35e 0.45
a 180.95 70.78
a 46.58
a 5.56
Average 112.65AB
0.40A 172.94 67.45
A 44.60
AB 13.20
Hy-Line 69 ECS 127.66a 0.32
de 166.26 64.79
abcd 41.17
abc 14.59
Silver Brown 138 ECS 109.34de
0.37bcd
164.07 64.25abcd
40.50abc
6.95
Average 118.50A 0.34
BC 165.17 64.52
AB 40.84
BCD 10.77
Hy-Line 69 ECS 120.13abc
0.34de
155.59 60.77abcd
40.58abc
13.34
Brown 138 ECS 104.51e 0.35
de 144.30 55.91
d 36.63
bc 5.56
Average 112.32AB
0.34C 149.94 58.34
BC 38.61
CDE 9.45
ISA 69 ECS 116.62bcd
0.36d 162.35 63.62
abcd 41.59
abc 9.95
Brown 138 ECS 106.72e 0.41
abc 172.13 66.48
abc 44.38
a 21.12
Average 111.67B 0.38
A 167.24 65.05
A 42.98
AB 15.53
Bovans 69 ECS 123.45ab
0.36cd
174.14 67.98ab
44.93a 9.45
Brown 138 ECS 111.26cde
0.42ab
178.14 69.51a 47.05
a 15.28
Average 117.35AB
0.39A 176.14 68.74
A 45.99
A 12.37
All 69 ECS 122.51Y 0.34
Y 160.68 62.69 41.14 14.32
Strains 138 ECS 105.95Z 0.39
Z 162.03 63.03 40.09 11.74
1All strains were housed such that each strain is equally represented in each density.
Enriched Colony Housing System=ECS. ABCDE - Different letters denote significant differences (P<.01), comparisons made among strain average values.
abcde - Different letters denote significant differences (P<.01) in the strain*density interactions.
Mortality percentage prior to analyzes was transformed in Square Root Asin
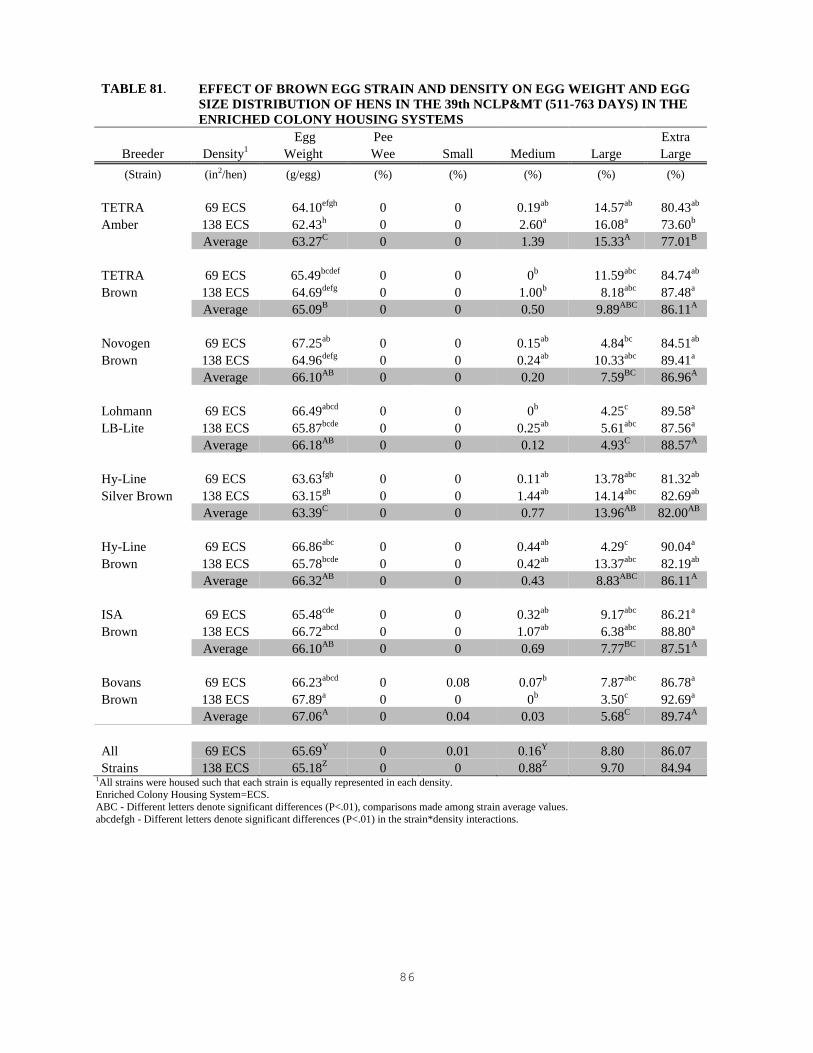
86
TABLE 81. EFFECT OF BROWN EGG STRAIN AND DENSITY ON EGG WEIGHT AND EGG
SIZE DISTRIBUTION OF HENS IN THE 39th NCLP&MT (511-763 DAYS) IN THE
ENRICHED COLONY HOUSING SYSTEMS
Egg Pee
Extra
Breeder Density1 Weight Wee Small Medium Large Large
(Strain) (in2/hen) (g/egg) (%) (%) (%) (%) (%)
TETRA 69 ECS 64.10efgh
0 0 0.19ab
14.57ab
80.43ab
Amber 138 ECS 62.43h 0 0 2.60
a 16.08
a 73.60
b
Average 63.27C 0 0 1.39 15.33
A 77.01
B
TETRA 69 ECS 65.49bcdef
0 0 0b 11.59
abc 84.74
ab
Brown 138 ECS 64.69defg
0 0 1.00b 8.18
abc 87.48
a
Average 65.09B 0 0 0.50 9.89
ABC 86.11
A
Novogen 69 ECS 67.25ab
0 0 0.15ab
4.84bc
84.51ab
Brown 138 ECS 64.96defg
0 0 0.24ab
10.33abc
89.41a
Average 66.10AB
0 0 0.20 7.59BC
86.96A
Lohmann 69 ECS 66.49abcd
0 0 0b 4.25
c 89.58
a
LB-Lite 138 ECS 65.87bcde
0 0 0.25ab
5.61abc
87.56a
Average 66.18AB
0 0 0.12 4.93C 88.57
A
Hy-Line 69 ECS 63.63fgh
0 0 0.11ab
13.78abc
81.32ab
Silver Brown 138 ECS 63.15gh
0 0 1.44ab
14.14abc
82.69ab
Average 63.39C 0 0 0.77 13.96
AB 82.00
AB
Hy-Line 69 ECS 66.86abc
0 0 0.44ab
4.29c 90.04
a
Brown 138 ECS 65.78bcde
0 0 0.42ab
13.37abc
82.19ab
Average 66.32AB
0 0 0.43 8.83ABC
86.11A
ISA 69 ECS 65.48cde
0 0 0.32ab
9.17abc
86.21a
Brown 138 ECS 66.72abcd
0 0 1.07ab
6.38abc
88.80a
Average 66.10AB
0 0 0.69 7.77BC
87.51A
Bovans 69 ECS 66.23abcd
0 0.08 0.07b 7.87
abc 86.78
a
Brown 138 ECS 67.89a 0 0 0
b 3.50
c 92.69
a
Average 67.06A 0 0.04 0.03 5.68
C 89.74
A
All 69 ECS 65.69Y 0 0.01 0.16
Y 8.80 86.07
Strains 138 ECS 65.18Z 0 0 0.88
Z 9.70 84.94
1All strains were housed such that each strain is equally represented in each density. Enriched Colony Housing System=ECS.
ABC - Different letters denote significant differences (P<.01), comparisons made among strain average values.
abcdefgh - Different letters denote significant differences (P<.01) in the strain*density interactions.
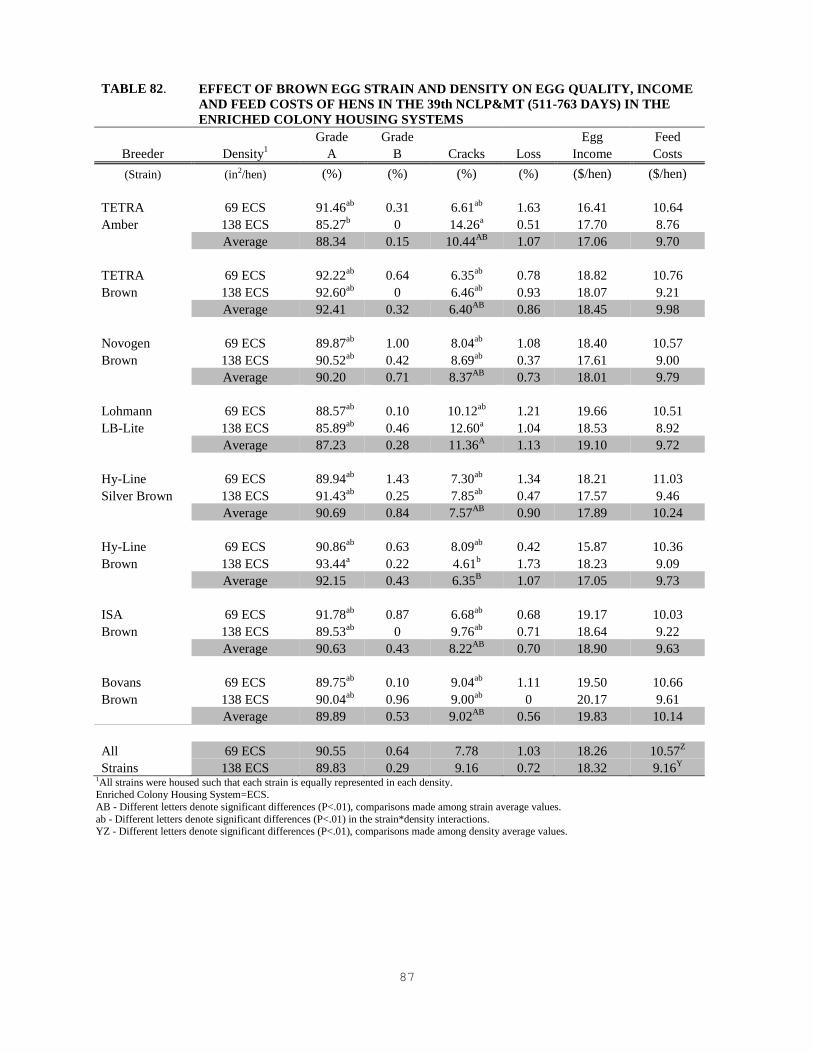
87
TABLE 82. EFFECT OF BROWN EGG STRAIN AND DENSITY ON EGG QUALITY, INCOME
AND FEED COSTS OF HENS IN THE 39th NCLP&MT (511-763 DAYS) IN THE
ENRICHED COLONY HOUSING SYSTEMS
Grade Grade
Egg Feed
Breeder Density1 A B Cracks Loss Income Costs
(Strain) (in2/hen) (%) (%) (%) (%) ($/hen) ($/hen)
TETRA 69 ECS 91.46ab
0.31 6.61ab
1.63 16.41 10.64
Amber 138 ECS 85.27b 0 14.26
a 0.51 17.70 8.76
Average 88.34 0.15 10.44AB
1.07 17.06 9.70
TETRA 69 ECS 92.22ab
0.64 6.35ab
0.78 18.82 10.76
Brown 138 ECS 92.60ab
0 6.46ab
0.93 18.07 9.21
Average 92.41 0.32 6.40AB
0.86 18.45 9.98
Novogen 69 ECS 89.87ab
1.00 8.04ab
1.08 18.40 10.57
Brown 138 ECS 90.52ab
0.42 8.69ab
0.37 17.61 9.00
Average 90.20 0.71 8.37AB
0.73 18.01 9.79
Lohmann 69 ECS 88.57ab
0.10 10.12ab
1.21 19.66 10.51
LB-Lite 138 ECS 85.89ab
0.46 12.60a 1.04 18.53 8.92
Average 87.23 0.28 11.36A 1.13 19.10 9.72
Hy-Line 69 ECS 89.94ab
1.43 7.30ab
1.34 18.21 11.03
Silver Brown 138 ECS 91.43ab
0.25 7.85ab
0.47 17.57 9.46
Average 90.69 0.84 7.57AB
0.90 17.89 10.24
Hy-Line 69 ECS 90.86ab
0.63 8.09ab
0.42 15.87 10.36
Brown 138 ECS 93.44a 0.22 4.61
b 1.73 18.23 9.09
Average 92.15 0.43 6.35B 1.07 17.05 9.73
ISA 69 ECS 91.78ab
0.87 6.68ab
0.68 19.17 10.03
Brown 138 ECS 89.53ab
0 9.76ab
0.71 18.64 9.22
Average 90.63 0.43 8.22AB
0.70 18.90 9.63
Bovans 69 ECS 89.75ab
0.10 9.04ab
1.11 19.50 10.66
Brown 138 ECS 90.04ab
0.96 9.00ab
0 20.17 9.61
Average 89.89 0.53 9.02AB
0.56 19.83 10.14
All 69 ECS 90.55 0.64 7.78 1.03 18.26 10.57Z
Strains 138 ECS 89.83 0.29 9.16 0.72 18.32 9.16Y
1All strains were housed such that each strain is equally represented in each density. Enriched Colony Housing System=ECS.
AB - Different letters denote significant differences (P<.01), comparisons made among strain average values.
ab - Different letters denote significant differences (P<.01) in the strain*density interactions. YZ - Different letters denote significant differences (P<.01), comparisons made among density average values.

88
TABLE 83. EFFECT OF WHITE EGG STRAIN AND DENSITY ON PERFORMANCE OF HENS
IN THE 39th NCLP&MT (119-763 DAYS) IN THE ENRICHED COLONY HOUSING
SYSTEMS
Eggs
Feed Feed Per Bird Egg Egg
Breeder Density1 Consumption Conversion Housed Production Mass Mortality
(Strain) (in2/hen) (kg/100/hen/d) (g egg/g feed)
(HD%) (g/HD) (%)
Bovans 69 ECS 109.98 0.44 520.46abc
79.76 49.29 28.48
White 138 ECS 107.71 0.47 537.26abc
82.66 51.55 19.45
Average 108.85A
0.45 528.95AB
81.21AB
50.42A
23.96
Shaver 69 ECS 110.89 0.45 526.09abc
79.83 50.10 46.53
White 138 ECS 104.88 0.49 536.87abc
82.92 52.32 11.12
Average 107.88A
0.47 531.48AB
81.38AB
51.21A
28.82
Dekalb 69 ECS 107.73 0.47 520.94abc
80.18 49.75 24.31
White 138 ECS 104.77 0.49 551.30a
84.91 52.58 16.67
Average 106.25A
0.48 536.12AB
82.55A
51.16A
20.49
Babcock 69 ECS 116.74 0.44 537.44abc
82.66 51.83 31.26
White 138 ECS 105.18 0.50 543.84ab
84.01 53.64 10.00
Average 110.96A
0.47 540.64AB
83.33A
52.74A
20.63
ISA 69 ECS 108.86 0.47 536.58abc
82.32 52.05 30.08
B-400 138 ECS 107.61 0.48 527.07abc
81.30 52.03 20.84
Average 108.24A
0.47 531.82AB
81.81AB
52.04A
25.46
Hy-Line 69 ECS 100.06 0.44 476.10c
73.50 45.06 13.89
W-36 138 ECS 95.66 0.47 479.45bc
74.08 45.86 7.41
Average 97.86B
0.46 477.78B
73.79B
45.46B
10.65
Hy-Line 69 ECS 111.20 0.42 489.92abc
75.67 47.92 22.92
CV-24 138 ECS 105.09 0.48 527.18abc
81.23 51.25 19.46
Average 108.15A
0.45 508.55AB
78.45AB
49.58AB
21.19
Lohmann 69 ECS 114.72 0.43 511.22abc
78.51 49.68 31.25
LSL Lite 138 ECS 106.68 0.48 531.01abc
81.51 52.18 23.62
Average 110.70A
0.46 521.12AB
80.01AB
50.93A
27.43
H&N 69 ECS 112.54 0.43 510.26abc
78.23 49.47 28.87
Nick Chick 138 ECS 107.40 0.49 544.47ab
83.76 53.83 27.79
Average 109.97A
0.46 527.36AB
81.00AB
51.65A
28.83
Novogen 69 ECS 115.62 0.43 509.46abc
77.66 49.55 38.33
White 138 ECS 107.78 0.49 540.55abc
83.27 53.73 18.90
Average 111.70A
0.46 525.01AB
80.46AB
51.64A
28.62
All 69 ECS 110.83Z
0.48Z
513.86Z
78.83Z
49.47Z
29.69Z
Strains 138 ECS 105.28Y
0.44Y
531.90Y
81.96Y
52.00Y
17.52Y
1All strains were housed such that each strain is equally represented in each density.
Enriched Colony Housing System=ECS AB - Different letters denote significant differences (P<.01), comparisons made among strain average values.
abc - Different letters denote significant differences (P<.01) in the strain*density interactions.
YZ - Different letters denote significant differences (P<.01), comparisons made among density average values. Mortality percentage prior to analyzes was transformed in Square Root Asin

89
TABLE 84. EFFECT OF WHITE EGG STRAIN AND DENSITY ON EGG WEIGHT AND EGG
SIZE DISTRIBUTION OF HENS IN THE 39th NCLP&MT (119-763 DAYS) IN THE
ENRICHED COLONY HOUSING SYSTEMS
Egg Pee
Extra
Breeder Density1 Weight Wee Small Medium Large Large
(Strain) (in2/hen) (g/egg) (%) (%) (%) (%) (%)
Bovans 69 ECS 61.60 0 2.89 8.14 19.76 66.79
White 138 ECS 61.76 3.40 1.20 4.53 22.06 65.90
Average 61.68B
1.70 2.05 6.34 20.91A
66.35
Shaver 69 ECS 62.51 0 2.63 6.78 16.96 69.75
White 138 ECS 62.76 0.54 2.44 5.37 15.66 73.12
Average 62.63AB
0.27 2.54 6.08 16.31AB
71.43
Dekalb 69 ECS 61.49 0 3.99 6.00 16.93 67.46
White 138 ECS 61.65 1.09 1.16 7.26 19.22 68.98
Average 61.57B
0.54 2.58 6.63 19.58AB
68.22
Babcock 69 ECS 62.45 0.29 2.92 6.75 16.96 70.15
White 138 ECS 63.48 0.96 2.14 3.53 13.38 78.32
Average 62.96AB
0.62 2.53 5.14 15.17AB
74.24
ISA 69 ECS 62.85 0 2.47 5.28 16.17 72.71
B-400 138 ECS 63.62 0.81 1.64 4.60 13.14 76.73
Average 63.23AB
0.41 2.05 4.94 14.66AB
74.72
Hy-Line 69 ECS 61.26 0 4.70 9.74 19.19 63.71
W-36 138 ECS 61.98 1.45 1.04 8.64 18.19 68.23
Average 61.62B
0.72 2.87 9.19 18.69AB
65.97
Hy-Line 69 ECS 63.15 1.10 3.59 6.31 16.24 70.50
CV-24 138 ECS 62.68 0.81 0.93 8.72 15.80 70.01
Average 62.92AB
0.96 2.26 7.51 16.02AB
70.26
Lohmann 69 ECS 62.88 0 2.87 6.18 17.63 70.81
LSL Lite 138 ECS 63.48 1.27 1.97 5.38 13.13 76.05
Average 63.18AB
0.64 2.41 5.78 15.38AB
73.43
H&N 69 ECS 62.95 0 3.21 6.27 15.67 71.76
Nick Chick 138 ECS 63.58 2.17 1.31 6.16 13.09 74.79
Average 63.27AB
1.09 2.17 6.21 14.38AB
73.28
Novogen 69 ECS 63.54 0 2.99 6.09 14.71 74.34
White 138 ECS 63.94 1.74 2.50 3.47 12.30 76.60
Average 63.74A
0.87 2.74 4.78 13.50B
75.47
All 69 ECS 62.47 0.14Y
3.21Z
6.76 17.32 69.80
Strains 138 ECS 62.89 1.43Z
1.63Y
5.76 15.60 72.87 1All strains were housed such that each strain is equally represented in each density.
Enriched Colony Housing System=ECS.
AB - Different letters denote significant differences (P<.01), comparisons made among strain average values.
YZ - Different letters denote significant differences (P<.01), comparisons made among density average values.

90
TABLE 85. EFFECT OF WHITE EGG STRAIN AND DENSITY ON EGG QUALITY, INCOME
AND FEED COSTS OF HENS IN THE 39th NCLP&MT (119-763 DAYS) IN THE
ENRICHED COLONY HOUSING SYSTEMS
Grade Grade
Egg Feed
Breeder Density1 A B Cracks Loss Income Costs
(Strain) (in2/hen) (%) (%) (%) (%) ($/hen) ($/hen)
Bovans 69 ECS 92.92 0.41 5.89 0.77 58.86abc
28.00
White 138 ECS 90.03 0.48 8.76 0.76 60.27abc
27.75
Average 91.48A
0.44 7.32B
0.77 59.56A
27.88A
Shaver 69 ECS 87.31 0.41 10.73 1.50 58.20abc
28.28
White 138 ECS 85.72 0.32 13.18 0.79 59.47abc
27.06
Average 86.52C
0.36 11.96A
1.15 58.83A
27.67A
Dekalb 69 ECS 90.91 0.46 7.66 0.99 58.86abc
27.52
White 138 ECS 90.67 0.34 8.28 0.73 62.01a
27.04
Average 90.79A
0.40 7.97B 0.86 60.43
A 27.28
AB
Babcock 69 ECS 90.99 0.62 7.20 1.24 60.28abc
29.82
White 138 ECS 88.91 0.37 10.23 0.55 61.41ab
27.18
Average 89.95ABC
0.50 8.72AB
0.89 60.85A
28.50A
ISA 69 ECS 88.74 0.40 9.82 1.10 60.13abc
27.80
B-400 138 ECS 84.80 0.24 14.25 0.78 58.36abc
27.75
Average 86.77BC
0.32 12.03A
0.94 59.25A
27.78A
Hy-Line 69 ECS 90.98 0.36 7.65 1.03 52.88C
25.60
W-36 138 ECS 90.03 0 8.97 1.01 53.48bc
24.75
Average 90.51ABC
0.18 8.31AB
1.02 53.18B
25.17B
Hy-Line 69 ECS 92.33 0.33 6.50 0.87 55.37abc
28.40
CV-24 138 ECS 88.74 0.59 9.94 0.75 58.75abc
27.11
Average 90.53AB
0.46 8.22B
0.81 57.06AB
27.76A
Lohmann 69 ECS 90.51 0.72 7.88 0.89 57.83abc
29.19
LSL Lite 138 ECS 91.12 0.43 8.20 0.29 60.26abc
27.51
Average 90.82A
0.58 8.04B
0.59 59.04A
28.35A
H&N 69 ECS 90.76 0.46 7.10 1.66 57.38abc
28.70
Nick Chick 138 ECS 90.43 0.38 8.55 0.66 61.46ab
27.63
Average 90.60A
0.42 7.82B
1.16 59.42A
28.17A
Novogen 69 ECS 92.05 0.68 6.70 0.56 58.12abc
29.30
White 138 ECS 87.34 0.48 11.31 0.91 60.27abc
27.76
Average 89.70ABC
0.58 9.01AB
0.74 59.20A
28.54A
All 69 ECS 90.75Y
0.48 7.71Y
1.06Z
57.79Z
28.26Z
Strains 138 ECS 88.78Z
0.36 10.17Z
0.72Y
59.57Y
27.16Y
1All strains were housed such that each strain is equally represented in each density.
Enriched Colony Housing System=ECS. ABC - Different letters denote significant differences (P<.01), comparisons made among strain average values.
abc - Different letters denote significant differences (P<.01) in the strain*density interactions
YZ - Different letters denote significant differences (P<.01), comparisons made among density average values.

91
TABLE 86. EFFECT OF BROWN EGG STRAIN AND DENSITY ON PERFORMANCE OF HENS
IN THE 39th NCLP&MT (119-763 DAYS) IN THE ENRICHED COLONY HOUSING
SYSTEMS
Eggs
Feed Feed Per Bird Egg Egg
Breeder Density1 Consumption Conversion Housed Production Mass Mortality
(Strain) (in2/hen) (kg/100/hen/d) (g egg/g feed)
(HD%) (g/HD) (%)
TETRA 69 ECS 112.52 0.37d
450.08 69.35 41.38 17.37
Amber 138 ECS 105.28 0.39bcd
459.43 70.77 42.42 23.62
Average 108.90AB
0.38C
454.76 70.06 41.90B
20.49
TETRA 69 ECS 111.46 0.39bcd
459.49 70.74 43.55 21.30
Brown 138 ECS 107.18 0.38cd
436.90 67.47 41.39 7.41
Average 109.32AB
0.38BC
448.19 69.10 42.47B
14.36
Novogen 69 ECS 111.42 0.42bcd
479.02 73.85 46.67 20.56
Brown 138 ECS 107.09 0.42bcd
470.82 72.30 45.56 28.31
Average 109.25AB
0.42AB
474.92 73.08 46.11AB
24.44
Lohmann 69 ECS 110.52 0.42bcd
481.80 74.20 46.32 26.40
LB-Lite 138 ECS 102.55 0.48a
515.76 79.66 49.95 6.95
Average 106.53B
0.45A
498.78 76.93 48.13A
16.67
Hy-Line 69 ECS 115.38 0.39bcd
492.55 75.81 45.14 21.53
Silver Brown 138 ECS 108.03 0.41bcd
491.70 75.95 45.43 11.12
Average 111.70AB
0.40BC
492.13 75.88 45.28AB
16.32
Hy-Line 69 ECS 111.40 0.40bcd
465.90 71.90 44.89 17.79
Brown 138 ECS 107.22 0.40bcd
449.13 69.48 43.58 5.56
Average 109.31AB
0.40BC
457.52 70.69 44.23AB
11.67
ISA 69 ECS 108.12 0.43abc
494.17 76.21 47.17 14.94
Brown 138 ECS 105.93 0.45ab
492.61 75.68 48.50 24.45
Average 107.02A
0.44A
493.39 75.95 47.84A
19.70
Bovans 69 ECS 114.59 0.41bcd
496.57 76.57 48.06 15.56
Brown 138 ECS 111.23 0.43abc
487.56 75.18 48.57 20.84
Average 112.91A
0.42AB
492.06 75.88 48.32A 18.20
All 69 ECS 111.93Z
0.40Y
477.45 73.58 45.40 19.43
Strains 138 ECS 106.81Y
0.42Z
475.49 73.31 45.67 16.03 1All strains were housed such that each strain is equally represented in each density.
Enriched Colony Housing System=ECS. ABC - Different letters denote significant differences (P<.01), comparisons made among strain average values.
abcd - Different letters denote significant differences (P<.01) in the strain*density interactions.
YZ - Different letters denote significant differences (P<.01), comparisons made among density average values. Mortality percentage prior to analyzes was transformed in Square Root Asin

92
TABLE 87. EFFECT OF BROWN EGG STRAIN AND DENSITY ON EGG WEIGHT AND EGG
SIZE DISTRIBUTION OF HENS IN THE 39th NCLP&MT (119-763 DAYS) IN THE
ENRICHED COLONY HOUSING SYSTEMS
Egg Pee
Extra
Breeder Density1 Weight Wee Small Medium Large Large
(Strain) (in2/hen) (g/egg) (%) (%) (%) (%) (%)
TETRA 69 ECS 59.70d
0.27 4.46 12.77 23.33 57.09abc
Amber 138 ECS 59.66d
1.09 2.75 10.04 25.04 57.96ab
Average 59.68C 0.68 3.60 11.41
AB 24.18
AB 57.52
B
TETRA 69 ECS 61.47abcd
0 2.48 8.93 22.40 64.72abc
Brown 138 ECS 61.45abcd
1.93 2.00 5.58 21.20 67.80abc
Average 61.46BC
0.96 2.24 7.25ABC
21.80ABC
66.26AB
Novogen 69 ECS 63.17ab
0 1.83 7.72 17.59 70.44abc
Brown 138 ECS 62.62ab
0.38 1.50 4.19 17.00 75.91abc
Average 62.90AB
0.19 1.67 5.96C
17.30C
72.68A
Lohmann 69 ECS 62.20abcd
0 2.80 7.53 16.71 70.25abc
LB-Lite 138 ECS 62.49abc
0.32 2.34 5.17 17.76 71.75abc
Average 62.34AB
0.16 2.57 6.35BC
17.23C
71.00A
Hy-Line 69 ECS 59.68d
0 2.61 14.05 25.39 56.10a
Silver Brown 138 ECS 59.75cd
0.61 2.81 10.73 26.70 58.13a
Average 59.72C
0.30 2.71 12.39A
26.04A
57.11B
Hy-Line 69 ECS 62.56ab
0 0.91 7.09 21.08 68.62abc
Brown 138 ECS 62.73ab
0.62 1.89 4.41 22.17 69.20abc
Average 62.64AB
0.31 1.40 5.75C
21.63ABC
68.91A
ISA 69 ECS 61.69abcd
0.28 1.57 8.20 21.76 66.22abc
Brown 138 ECS 63.85ab
0 2.62 4.47 13.85 77.48c
Average 62.77AB
0.14 2.09 6.33BC
17.80BC
71.85A
Bovans 69 ECS 62.84ab
0 2.07 7.84 19.52 68.23abc
Brown 138 ECS 64.28a
1.09 1.22 4.60 14.36 77.16bc
Average 63.56A
0.54 1.64 6.22BC
16.94C
72.70A
All 69 ECS 61.66 0.07Y
2.34 9.27Y 19.76 65.21
Z
Strains 138 ECS 62.11 0.75Z
2.14 6.15Z
20.97 69.30Y
1All strains were housed such that each strain is equally represented in each density. Enriched Colony Housing System=ECS.
ABC - Different letters denote significant differences (P<.01), comparisons made among strain average values.
abcd - Different letters denote significant differences (P<.01) in the strain*density interactions. YZ - Different letters denote significant differences (P<.01), comparisons made among density average values.

93
TABLE 88. EFFECT OF BROWN EGG STRAIN AND DENSITY ON EGG QUALITY, INCOME
AND FEED COSTS OF HENS IN THE 39th NCLP&MT (119-763 DAYS) IN THE
ENRICHED COLONY HOUSING SYSTEMS
Grade Grade
Egg Feed
Breeder Density1 A B Cracks Loss Income Costs
(Strain) (in2/hen) (%) (%) (%) (%) ($/hen) ($/hen)
TETRA 69 ECS 91.84ab
0.35 6.92ab
0.88 49.60 27.55
Amber 138 ECS 88.71ab
0.87 10.04ab
0.44 50.72 26.30
Average 90.27AB
0.61 8.48AB
0.66 50.16 26.92AB
TETRA 69 ECS 91.96ab
0.59 6.71ab
0.71 51.79 27.30
Brown 138 ECS 93.04a
0.10 6.35ab
0.56 49.50 26.69
Average 92.50AB
0.35 6.52AB
0.64 50.64 26.99AB
Novogen 69 ECS 91.17ab
0.79 7.23ab
0.82 54.05 27.32
Brown 138 ECS 91.63ab
0.47 7.55ab
0.44 53.59 26.73
Average 91.40AB
0.63 7.39AB
0.63 53.82 27.02AB
Lohmann 69 ECS 90.89ab
0.25 7.68ab
1.16 54.24 27.06
LB-Lite 138 ECS 88.05b
0.48 10.97a
0.55 57.63 25.52
Average 89.47B
0.36 9.33A
0.86 55.94 26.29B
Hy-Line 69 ECS 93.17a
0.62 5.70b
0.54 55.09 28.22
Silver Brown 138 ECS 93.01a
0.29 6.14b
0.60 55.14 26.87
Average 93.09A
0.46 5.92B
0.57 55.12 27.54AB
Hy-Line 69 ECS 92.36ab
0.37 6.80ab
0.46 52.99 27.32
Brown 138 ECS 92.27ab
0.36 6.26b
1.12 50.90 26.73
Average 92.31AB
0.36 6.53AB
0.79 51.95 27.03AB
ISA 69 ECS 92.78a
0.47 6.22b
0.52 56.24 26.52
Brown 138 ECS 89.78ab
0.06 9.80ab
0.39 55.85 26.37
Average 91.28AB
0.27 8.01AB
0.45 56.04 26.44AB
Bovans 69 ECS 92.28ab
0.12 6.68ab
0.96 56.19 28.11
Brown 138 ECS 91.03ab
0.52 8.29ab
0.20 55.69 27.68
Average 91.66AB
0.32 7.48AB
0.58 55.94 27.89A
All 69 ECS 92.06 0.45 6.74Y
0.76 53.77 27.42Z
Strains 138 ECS 90.94 0.40 8.17Z
0.54 53.63 26.61Y
1All strains were housed such that each strain is equally represented in each density.
Enriched Colony Housing System=ECS.
AB - Different letters denote significant differences (P<.01), comparisons made among strain average values. ab - Different letters denote significant differences (P<.01) in the strain*density interactions.
YZ - Different letters denote significant differences (P<.01), comparisons made among density average values.

94
TABLE 89. EFFECT OF WHITE EGG STRAIN AND DENSITY ON BODY WEIGHT OF HENS IN THE
39th NCLP&MT (119-763 DAYS) IN THE ENRICHED COLONY HOUSING SYSTEM
THAT WERE NON-MOLTED
17 Wk* 69 Wk** 1st Cycle 73 Wk** 109 Wk 2nd
Cycle Total
Breeder Density1 Body Wt Body Wt Wt Gain Body Wt Body Wt Wt Gain Wt Gain
(Strain) (in2/hen) (kg) (kg) (%) (kg) (kg) (kg) (%)
Bovans 69 ECS 1.22 1.64ab
34.4 1.72 1.84 0.10 50.60
White 138 ECS 1.32 1.82ab
37.9 1.86 1.80 -0.02 38.08
Average 1.27 1.73 36.2 1.79 1.82AB
0.04 44.34
Shaver 69 ECS 1.28 1.73ab
34.4 1.74 1.80 0.08 44.46
White 138 ECS 1.34 1.92ab
43.3 1.96 1.90 -0.04 46.11
Average 1.32 1.82 38.6 1.85 1.85AB
0.02 45.28
Dekalb 69 ECS 1.20 1.61ab
45.0 1.72 1.75 0 48.06
White 138 ECS 1.20 1.74ab
35.0 1.72 1.77 0.05 43.60
Average 1.20 1.68 40.0 1.72 1.76B
0.03 45.83
Babcock 69 ECS 1.31 1.74ab
48.1 1.73 1.95 0.16 50.72
White 138 ECS 1.36 1.99a
30.9 2.02 1.99 0.08 50.90
Average 1.34 1.86 39.6 1.88 1.97A
0.12 50.81
ISA 69 ECS 1.18 1.63ab
39.0 2.09 1.61 -0.36 34.66
B-400 138 ECS 1.23 1.72ab
39.8 1.78 1.84 0.10 50.82
Average 1.20 1.68 39.2 1.94 1.72B
-0.13 42.74
Hy-Line 69 ECS 1.20 1.60ab
33.3 1.57 1.81 0.18 52.41
W-36 138 ECS 1.22 1.70ab
39.3 1.70 1.86 0.20 54.47
Average 1.21 1.65 36.4 1.64 1.83AB
0.19 53.44
Hy-Line 69 ECS 1.12 1.74ab
54.5 1.87 1.90 0.03 69.31
CV-26 138 ECS 1.19 1.74ab
46.2 1.79 1.81 0.02 51.90
Average 1.16 1.74 50.0 1.83 1.86AB
0.02 60.60
Hy-Line 69 ECS 1.22 1.66ab
36.1 1.69 1.84 0.17 47.75
CV-24 138 ECS 1.24 1.82ab
46.8 1.75 1.82 0.10 44.71
Average 1.23 1.74 41.5 1.72 1.83AB
0.13 46.23
Lohmann 69 ECS 1.22 1.58b
29.5 1.97 1.84 -0.15 48.58
LSL Lite 138 ECS 1.24 1.65ab
33.1 1.69 1.80 0.08 44.68
Average 1.23 1.62 30.9 1.83 1.82AB
-0.03 46.63
H&N 69 ECS 1.24 1.66ab
33.9 1.67 1.76 0.07 41.57
Nick Chick 138 ECS 1.24 1.83ab
46.8 1.80 1.82 0.08 44.80
Average 1.24 1.74 40.3 1.74 1.79AB
0.08 43.18
Novogen 69 ECS 1.22 1.64ab
34.4 1.64 1.81 0.14 46.90
White 138 ECS 1.26 1.83ab
46.0 1.87 1.86 -0.06 45.59
Average 1.24 1.74 40.3 1.76 1.84AB
0.04 46.24
All 69 ECS 1.22 1.66Y
36.1Y
1.76 1.81 0.04 48.64
Strains 138 ECS 1.26 1.80Z
42.9Z
1.81 1.84 0.05 46.88
1All strains were housed such that each strain is equally represented in each density.
Enriched Colony Housing System=ECS. AB - Different letters denote significant differences (P<.01), comparisons made among strain average values
ab - Different letters denote significant differences (P<.01) in the strain*density interactions.
YZ - Different letters denote significant differences (P<.01), comparisons made among density average values. (*) All replicates in all strains were weight at 17 wks,
(**) Only a sample of replicates (2 per strain treatment) in each strain were weighted at 69 and 73 wks.

95
TABLE 90. EFFECT OF BROWN EGG STRAIN AND DENSITY ON BODY WEIGHT OF HENS IN
THE 39th NCLP&MT (119-763 DAYS) IN THE ENRICHED COLONY HOUSING SYSTEM
THAT WERE NON-MOLTED
17 Wk* 69 Wk** 1st Cycle 73 Wk** 109 Wk 2nd
Cycle Total
Breeder Density1 Body Wt Body Wt Wt Gain Body Wt Body Wt Wt Gain Wt Gain
(Strain) (in2/hen) (kg) (kg) (%) (kg) (kg) (kg) (%)
TETRA 69 ECS 1.50 1.89 26.7 2.02 1.84 0.10 20.75
Amber 138 ECS 1.55 2.04 31.0 2.15 1.77 0 13.08
Average 1.52 1.96 28.9 2.07 1.80 0.05 17.92
TETRA 69 ECS 1.54 1.88 22.1 1.87 1.92 0.18 26.18
Brown 138 ECS 1.58 1.95 22.8 2.02 2.07 0.04 30.66
Average 1.56 1.92 22.4 1.94 2.00 0.11 28.42
Novogen 69 ECS 1.55 1.94 24.5 1.91 1.82 0.04 16.02
Brown 138 ECS 1.58 1.94 22.8 2.02 1.93 -0.05 21.45
Average 1.56 1.94 23.7 1.97 1.88 0 18.73
Lohmann 69 ECS 1.52 2.00 31.6 1.90 1.93 0.08 26.16
LB-Lite 138 ECS 1.57 1.92 22.9 2.04 2.02 -0.06 29.12
Average 1.54 1.96 27.3 1.97 1.98 0.01 27.64
Hy-Line 69 ECS 1.42 1.98 39.4 1.98 1.80 0.16 21.66
Silver Brown 138 ECS 1.70 2.16 27.1 2.18 2.25 -0.06 27.25
Average 1.56 2.07 32.7 2.08 1.93 0.05 24.45
Hy-Line 69 ECS 1.53 1.87 22.2 2.38 1.96 -0.26 29.75
Brown 138 ECS 1.64 2.08 28.0 2.09 1.84 0 13.80
Average 1.58 1.98 25.3 2.24 1.90 -0.13 21.78
ISA 69 ECS 1.45 1.82 25.5 1.87 1.87 0.08 30.73
Brown 138 ECS 1.48 2.06 39.2 2.06 1.88 -0.04 26.04
Average 1.46 1.94 32.9 1.96 1.87 0.02 28.38
Bovans 69 ECS 1.60 1.94 21.3 1.94 1.89 0.05 22.78
Brown 138 ECS 1.60 2.04 27.5 2.06 1.90 -0.04 19.16
Average 1.60 1.99 24.4 2.00 1.89 0 20.97
All 69 ECS 1.51 1.92Z
26.5 1.98 1.88 0.05 24.25
Strains 138 ECS 1.58 2.02Y
27.8 2.07 1.93 -0.02 22.57 Enriched Colony Housing System=ECS. YZ - Different letters denote significant differences (P<.01), comparisons made among density average values.
(*) All replicates in all strains were weighed at 17 wks,
(**) Only a sample of replicates (2 per strain treatment) in each strain were weighed at 69 and 73 wks.

96

97

98

99

100

101
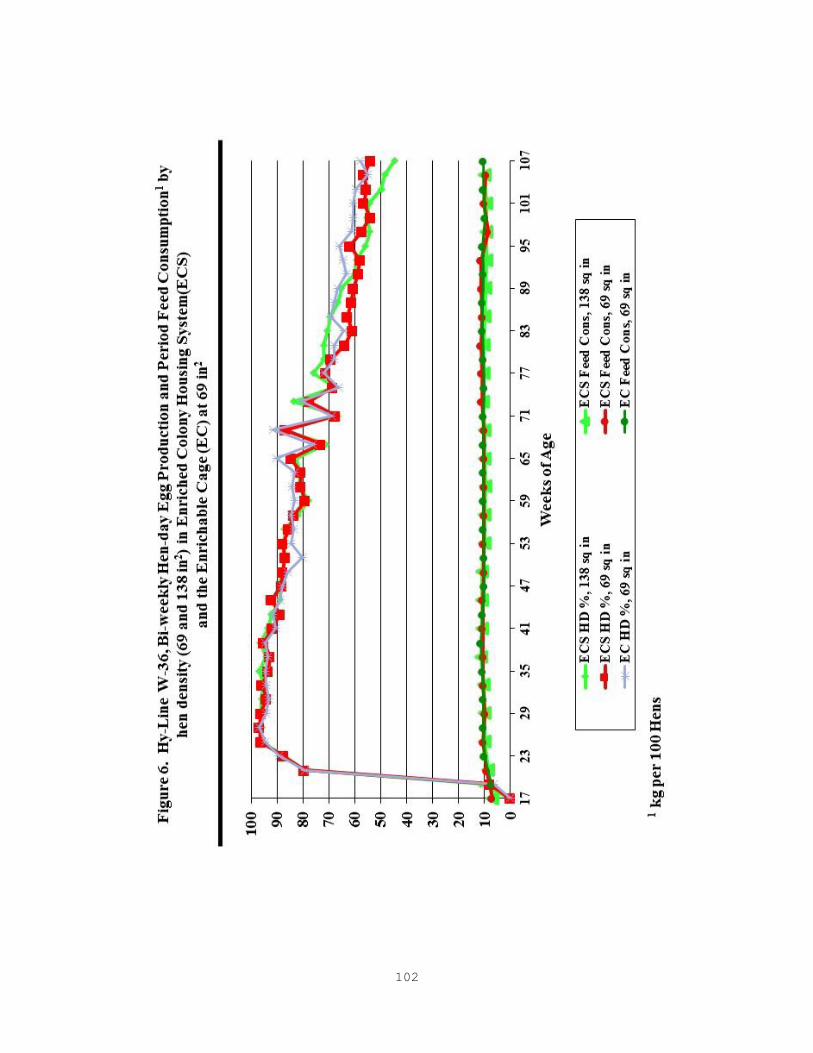
102

103

104

105

106

107
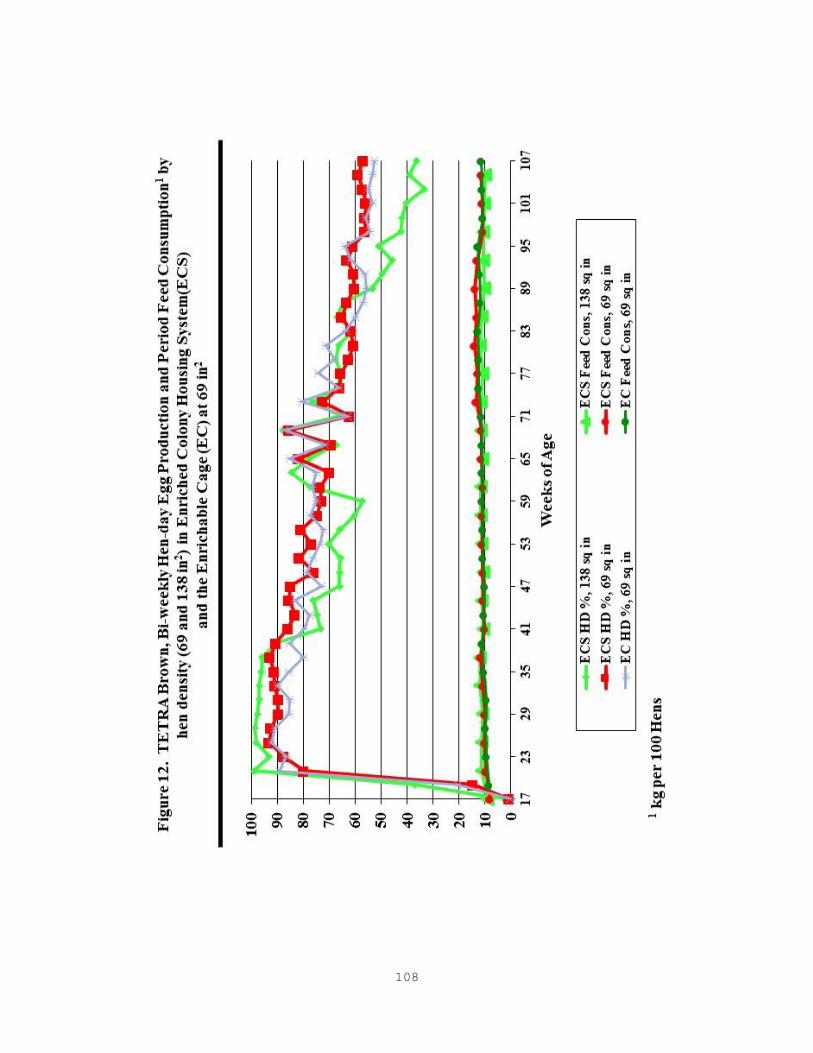
108

109

110

111

112

113

114
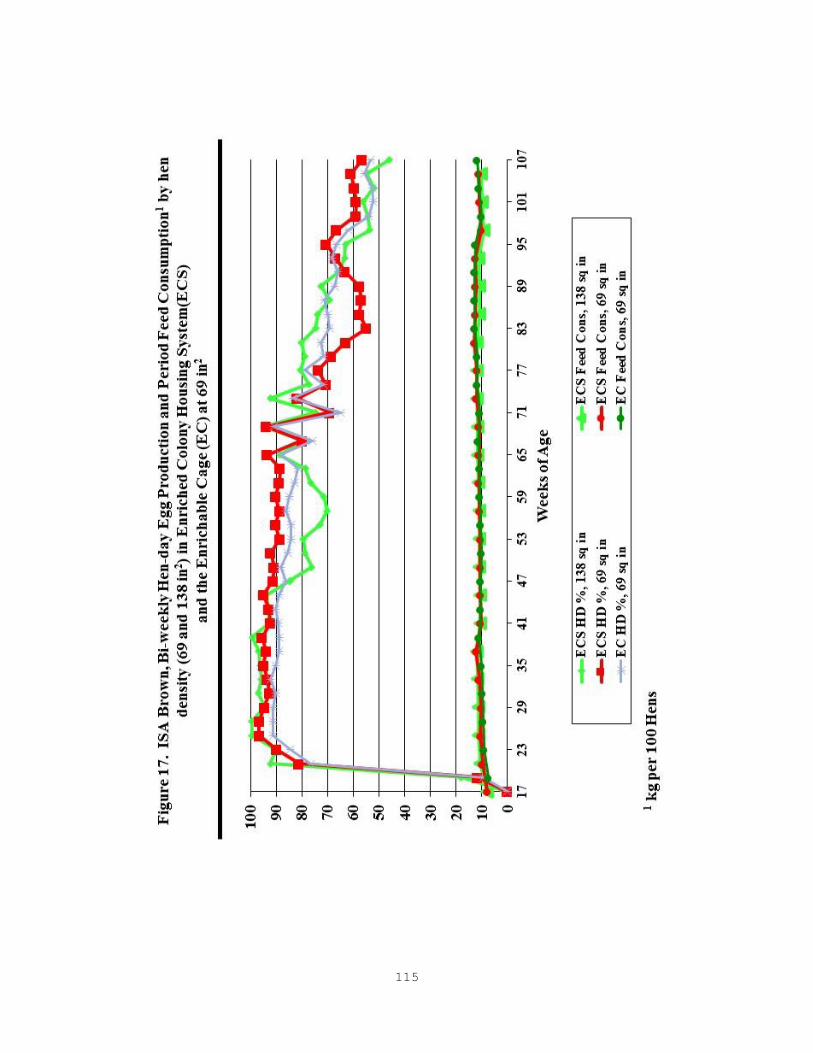
115
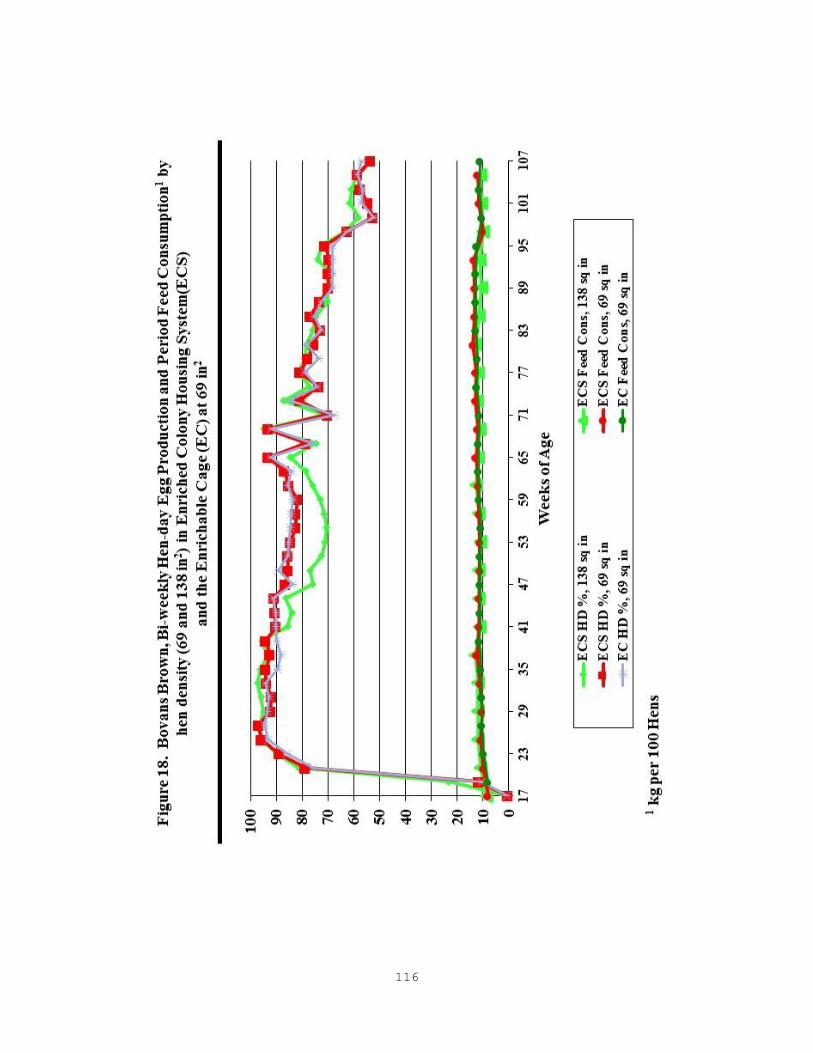
116
117

118

119

120

121

122

123

124

125
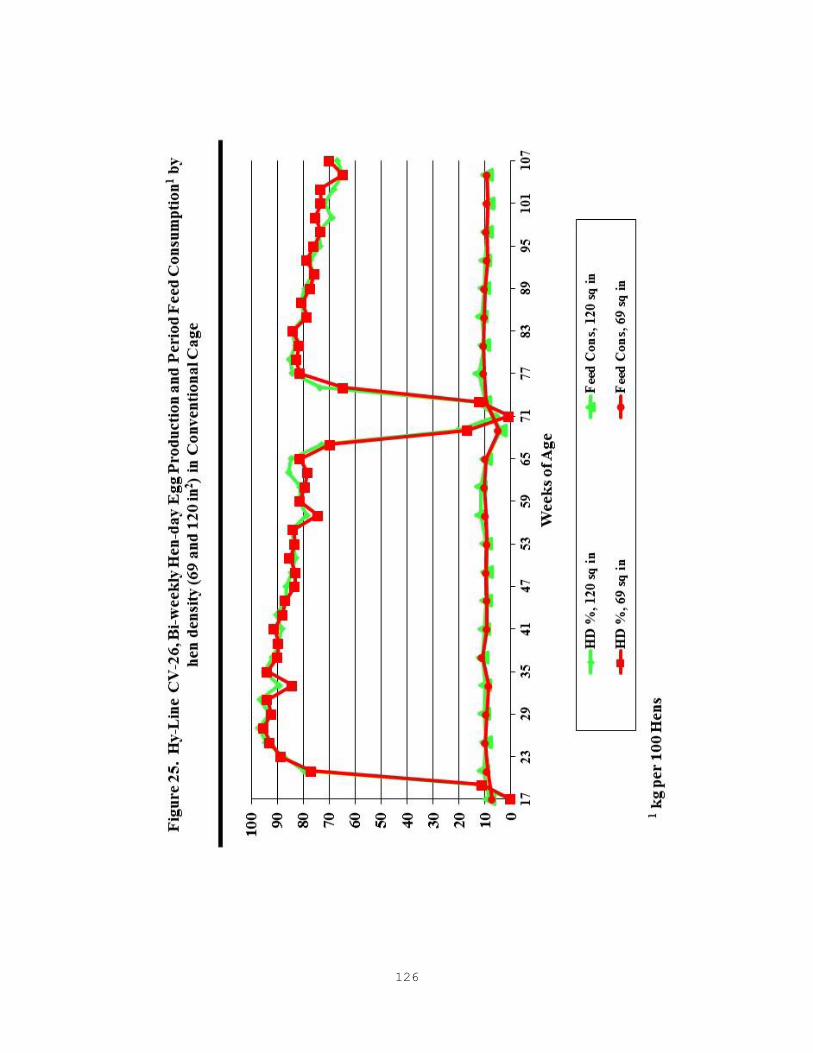
126

127

128
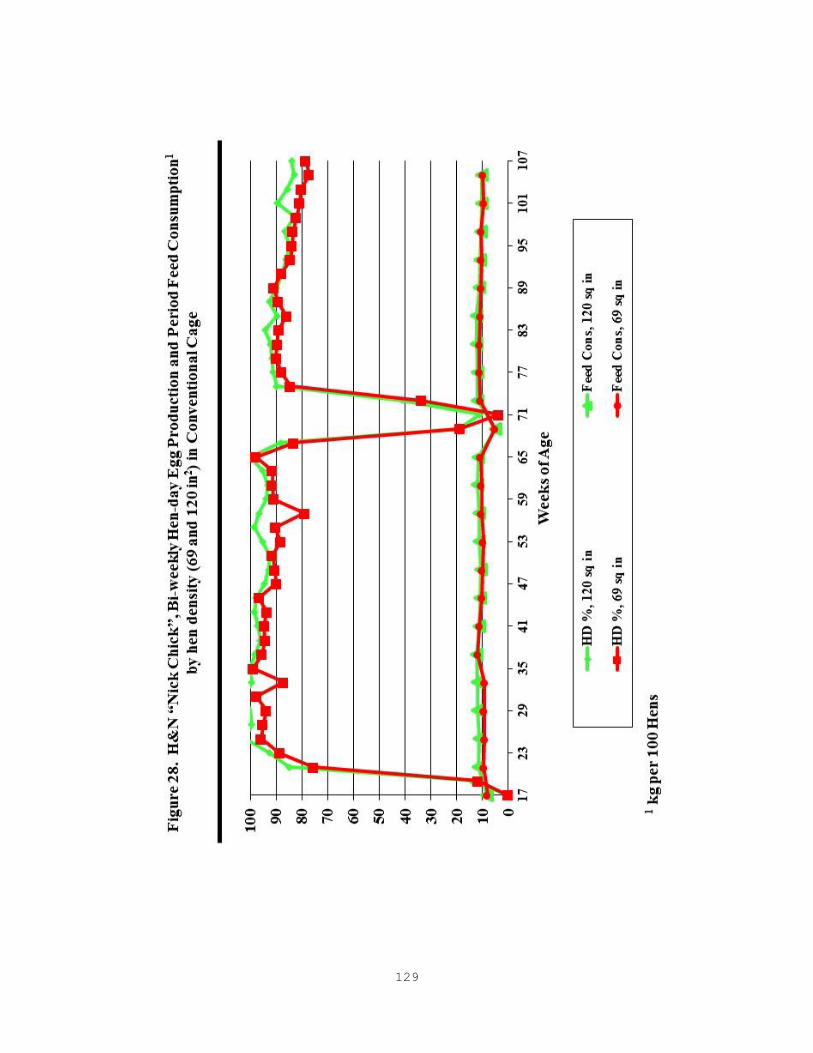
129

130

131

132

133

134

135

136
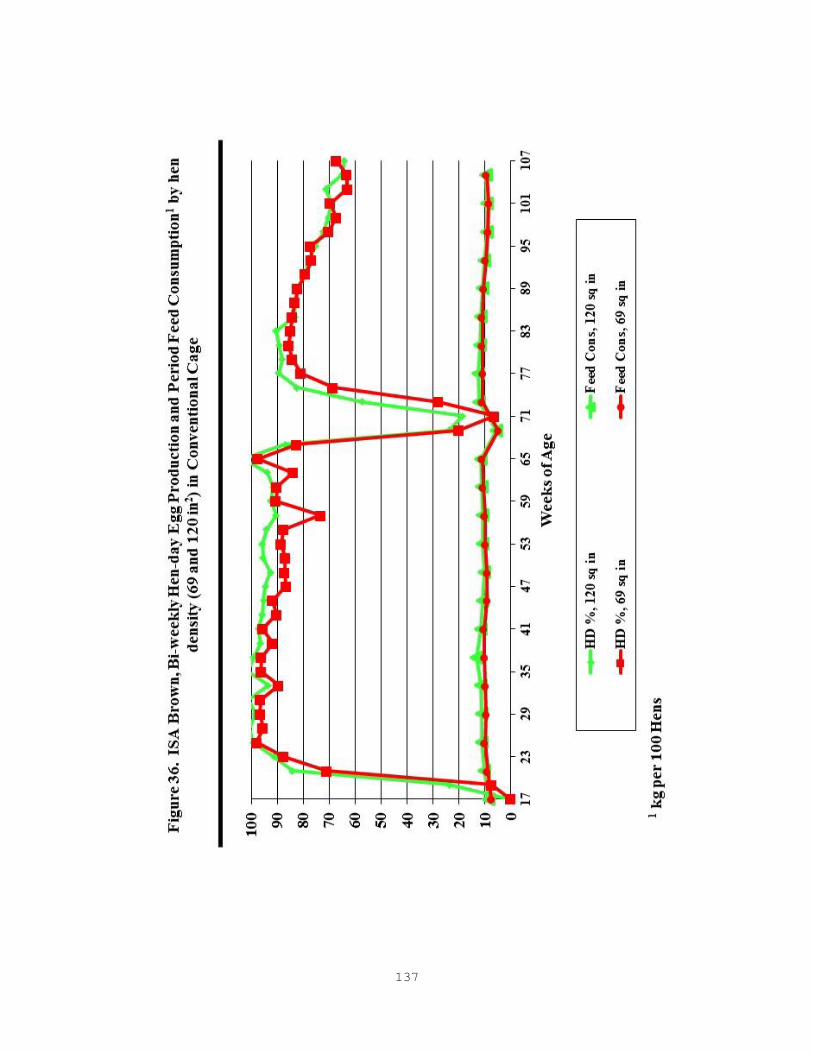
137

138

139
Table 91. Entries in the 39th NCLP&MT by Breeder, Stock Suppliers, and Categories Breeder Stock Category
1 Source
Hy-Line International
2583 240th Street
Dallas Center, IA 50063
W-36
Hy-Line Brown
Hy-Line Silver Brown
CV22
CV24
CV26
I-A
I-A
III-A
II-A
II-A
II-A
Hy-Line North America
4432 Highway 213, Box 309
Mansfield, GA 30255
(Same)
(Same)
(Same)
(Same)
(Same)
Lohmann Tierzucht Gmbh
Am Seedeich 9-11 .
P.O.Box 460
D-27454 Cuxhaven, Germany
Lohmann LSL-Lite
Lohmann LB-Lite
I-A
I-A
Hy-Line North America Elizabeth-
town
79 Industrial Rd
Elizabethtown, PA 17022
(Same)
H&N International
321 Burnett Ave South, Suite 300
Renton, Washington 98055
H&N “Nick Chick” I-A Feather Land Farms
32832 E. Peral Road
Coberg, OR 97408
Instiut de Selection Animale (A
Hendrix Genetic Company)
ISA North America
650 Riverbend Drive, Suite C
Kitchener, Ontario N2K 3S2
Canada
Bovans White
Dekalb White
Bovans Brown
Babcock White
B 400
Shaver White
ISA Brown
I-A
I-A
I-A
II-A
II-A
I-A
I-A
CPI-South Central Hatchery
5087 County Road 35
Bremen, AL 35033
(Same)
(Same)
Institute de Sélection Animale
650 Riverbend Dr. Suite C
Kitchener, Ontario N2K 3S2
Canada
(Same)
Midwest Farms, LLC.
135 S. Epes St.
Blackstone, VA 23824
(Same)
Tetra Americana, LLC
1105 Washington Road
Lexington, GA 30648
TETRA Brown
TETRA Amber
I-A
I-A
CPI-MidAmerica Hatchery
Lexington, GA 30648
(Same)
NOVOGEN S.A.S.
Mauguérand – Le Foeil
BP 265
22 800 QUINTIN - FRANCE
NOVOgen BROWN
NOVOgen WHITE
I-A
I-A
Morris Hatchery
18370 SW 232 Street,
Goulds, FL 33170-5399
Pennovo Hatchery
621 Stevens Road
Ephrata, PA 17522 1 I = Extensive distribution in southeast United States A = Entry requested
II = Little or no distribution in southeast United States
III = Unavailable for commercial distribution in United States