Embed Size (px)
Citation preview

FINAL REPORT OF RISK ASSESSMENT OF BIOGAS
PRODUCTION IN THE BALTIC SEA REGION FROM A
NUTRIENT MANAGEMENT PERSPECTIVE.
By: Ekwe Awasume & Thomas Pettersson
Dept. of Civil and Env’t. Engineering,
Chalmers University of Technology,
Göteborg, Sweden

2
Contents
1.0 Brief history and list of Biogas Installations .............................................................................. 4
1.1 Feedstocks/Substrates............................................................................................................. 7
1.2 Biogas production process. Case example: Linköping Biogas AB Plant ............................... 9
1.3 Biogas as vehicle fuel ........................................................................................................... 12
1.4 Biogas produced ................................................................................................................... 12
2.0 Review of treatment methods used for solid and liquid digestate from biogas processes ....... 15
2.1 No treatment option .............................................................................................................. 16
2.2 Partial processing of digestate .............................................................................................. 17
2.3 Reject water treatment methods ........................................................................................... 19
2.4 Efficiencies of some reject water treatment techniques compared ...................................... 22
2.5 Uses of digested sewage sludge from WWTP ..................................................................... 23
3.0 Legislative framework and permitting procedures for biogas installations ............................. 24
3.1 Application of Environmental code ..................................................................................... 26
3.2 Self-control ........................................................................................................................... 26
3.3 Supervisory Authority .......................................................................................................... 27
3.4 Cross Compliance ................................................................................................................ 27
3.5 Sanctions .............................................................................................................................. 28
3.6 Certification of digestate ...................................................................................................... 28
3.7 Reduction of nutrient leakages ............................................................................................. 31
3.8 Restrictions on applied quantities of manure, bio-manure and fertilizer. ............................ 31
3.9 Action plan against nutrient losses ....................................................................................... 32
3.9a Storage of manure and digestate ................................................................................... 33
3.9b Covering and filling of slurry stores ................................................................................ 33
3.9c Spreading of fertilizer and digestate .............................................................................. 33
3.9d Spreading liquid manure in growing crops .................................................................... 35
3.9e Rules concerning land under vegetative cover in the autumn and winter .................... 35
3.9f Extension services ........................................................................................................... 36
3.9g Focus on Nutrients ......................................................................................................... 36
3.9h Information material ...................................................................................................... 37
4.0 Risk assessment of case examples of installations with potential adverse environmental
impacts ...................................................................................................................................... 38
4.1 Sweden’s soil maps .............................................................................................................. 38
4.2 Nitrogen and phosphorus balances for agricultural land and agricultural sector in 2013 .... 41
3
4.3 Risk assessment remarks for various biogas facilities. ........................................................ 43
4.3.a Farm scale facilities ....................................................................................................... 43
4.3.b Co-digestion facilities .................................................................................................... 44
4.3.c Wastewater Treatment plants ...................................................................................... 44
4.3.d Industrial facilities ......................................................................................................... 44
4.4 Nitrates sensitive areas ......................................................................................................... 46
4.5 Transportation of Digestate. ................................................................................................. 47
4.6 Accident Cases ..................................................................................................................... 47
5.0 Subsidies and profitability (e.g. gate fees, electricity sold out) of production ......................... 50
5.1 Electricity Certificates .......................................................................................................... 51
5.2 Investment support - agricultural program ........................................................................... 51
5.3 Super-environmentally-friendly car premium ...................................................................... 52
5.4 Dispensation from traffic tolls for environmentally-friendly cars ....................................... 52
5.5 Climate investment grant for municipalities ........................................................................ 52
5.6 No carbon dioxide or energy tax on biogas .......................................................................... 53
5.7 Reduction of income tax by 40% for company natural gas vehicles (NGVs) ...................... 53
6.0 Case examples (if any) of commercial products from digestates ............................................. 53
7.0 Case examples (if any) of circular economy, where biogas is a part of a larger chain ............ 54
8.0 Proposals for mitigating adverse environmental impacts of biogas production ....................... 56
References ...................................................................................................................................... 58
Appendix 1. Summary of SPCR 120 – Certification rules for digestate from bio-waste by the
quality assurance system of Swedish Waste Management (December 2007). ......................... 61
Appendix 2 List of some Biogas plants in Sweden ........................................................................ 62
4
1.0 Brief history and list of Biogas Installations
Biogas production is one of several alternatives to meet the goals of sustainable energy
solutions and waste management. Biogas is produced by microbial degradation of organic
material (biomass) under oxygen free (anaerobic) conditions. This is also called anaerobic
digestion (AD) (Harrysson and Von Bahr, 2014; Wellinger et al., 2013). Even though the
potential of biogas production is still growing all over the world, it gained its popularity in
1970s, amidst rises of energy prices and worries about the detrimental impact of fossil fuels
on global warming (Nkoa R, 2014). In addition, it would be worth noting that China and
India are the two countries to which the history of biogas production rooted since the mid-
19th century (Biogasportalen, 2015).
Swedish history of biogas production only began in the mid-20th century, when wastewater
treatment plants (WWTP) were trying to reduce sludge volumes but also to reduce odour
and eliminate infectious matter. The city of Stockholm has two sewage treatment plants
dating back to 1934 and 1941 respectively; where biogas production began already in
1940s (Biogasportalen, 2015, Olsson L. & Fallde M., 2013).
Today, there is a total of 282 biogas plants in Sweden and they comprise of various types,
namely: Sewage treatment plants, 140 in number, producing 36% of the total biogas (1974
GWh); Co-digestion plants 35 (44% of the biogas); Farm-based installations 40 (3% of the
biogas); Industrial plants 6 (6% of the biogas); one Gasification plant (2% of the biogas);
and 60 Landfill installations (9% of the biogas). However, landfills and gasification plants
will not be further discussed in this report because they are classified under an older,
different legislation.
A recent report of Swedish efforts in development of waste treatment, indicates that there
has been a reduction of 6 landfills within a year, from 60 in 2015 to 54 in 2016. (Avfall
Sverige., 2016)

5
http://www.biogasportalen.se/BiogasISverigeOchVarlden/BiogasISiffror/Anlaggningar.2017/04/07.
Table 1: County-wise distribution of Biogas plants, reactor volumes and the amount of biogas produced in
2015. Landfills and gasification plant not included.
County Number of plants Reactor volume (M3) Biogas produced (GWh)
Blekinge 3 2, 850 10,1
Dalarna 9 10, 271 22,1
Götland 1 8, 700 22,9
Gävleborg 5 5, 410 15,5
Halland 14 40, 900 71,0
Jämtland 10 6, 805 10,5
Jönköping 10 23, 170 51,8
Kalmer 11 21, 125 41,4
Kronoberg 5 16, 483 32,3
Norrbrotten 6 12, 380 7,6
Skåne 37 139, 815 379,9
Stockholm 10 90, 163 203,3
Södermanland 6 14, 824 44,7
Uppsala 7 17, 160 53,5
Värmland 7 4, 640 9,4
Västerbotten 6 21, 540 52,5
Västernorrland 10 40, 750 93,1
Västmanland 8 23, 510 61,7
Västra Götaland 38 106, 570 332,1
Örebro 12 34, 060 95,3
1
Fig.1; Plot of various types
and number of biogas plants
in Sweden.

6
http://prescriptionmotorcycleeyewear.com/lan-karta-over-sverige.html accessed (30-06-2016)
Fig 2. Map of Sweden showing all the counties to support the table of biogas plants grouped by counties.
Biogas production in Sweden has increased over the years due to a high degree of
environmental consciousness in the legislature and for economic reasons. The Swedish Gas
association’s long-term vision of “Green gas 2050” describes how Sweden can reach a
carbon neutral industry with gas (fossil-free road transport, heat and electricity sector, as
well as cleaner maritime sector with gas) and it predicts a further increase in the number of
biogas installations in the future. (http://www.energigas.se,15/05/2017).
Östergötland 12 34, 957 149,7
Total 227 676, 083 1721,1

7
1.1 Feedstocks/Substrates
Substrates are the organic feedstocks for anaerobic digestion (AD) (Quanguo Zhang et al,
2016). As researchers continue to discover new organic material for AD, one can say that
there are probably many more types of organic material that can potentially be used for
biogas production, than those used today.
The main source of organic material for biogas production in Sweden today is sludge from
municipal wastewater treatment plants; reason why the number of biogas plants of
wastewater treatment type is the highest.
Sewage sludge refers to the residual of a dilute suspension of solids which contains more
than 90% moisture, captured by a wastewater treatment process (Christensson K. et al.,
2009, Solon K., 2015). Due to strict environmental regulations, sludge from WWTPs
cannot be disposed of or reused in any arbitrary manner. Cost is an important factor to
consider in sludge disposal. Typical methods of sludge management are: reuse (anaerobic
digestion for gas production), disposal in landfills and incineration (Solon K., 2015). To
dispose of the sludge, it is worthwhile to remove water from the sludge. The removed water
with special characteristics, called reject water, is prohibited to be discharged into surface
waters as WWTP effluents. It is assumed, that for just 2 % of the total influent flow in a
WWTP; 10-30 % of nitrogen load and 10-80 % of phosphorous load, is found in reject
water (Dosta et al., 2007 as stated in Solon K., 2015).
Other common substrates for biogas production in co-digestion plants include:
slaughterhouse waste, waste from the food and feed industries, source-sorted food waste
and manure. Examples of other materials which are also treated in these facilities include
waste from grease traps, fryer fat, wastes from the dairy and pharmaceutical industries,
grass silage, and distillation waste (residues from ethanol production). Different crops and
waste from the agricultural sector are also quite important substrates for biogas production.
8
Other, less common materials that are currently being evaluated for biogas production
include algae, grass, feathers and woody biomass (e.g. willow) (Anna Schnürer and Åsa
Jarvis, 2009). Of all animal manures in Sweden, a fraction, containing 28 and 38 % of total
(N) and phosphorus (P), has the economic and technical potential to be digested. In
addition, the introduction of source-separating systems is a major step in achieving high-
quality digestate from organic residues containing a small proportion of N and P; from an
agricultural perspective (Salomon. E & Wivstad. M., 2014).
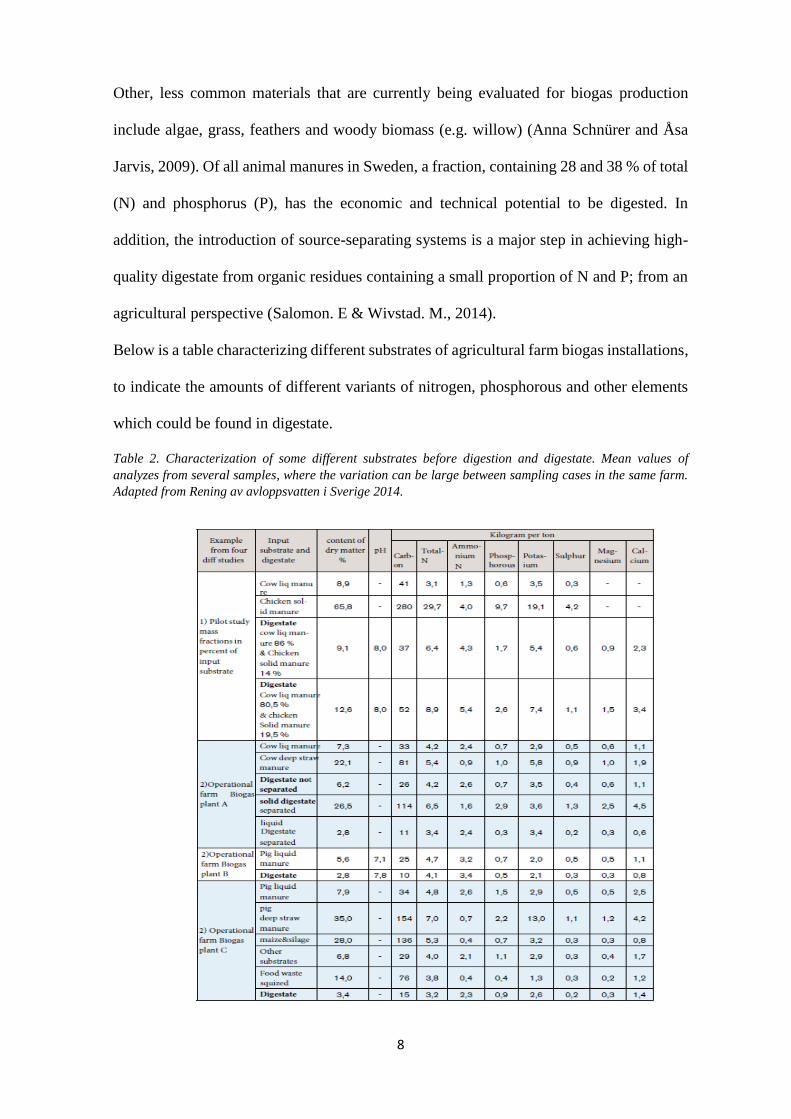
Below is a table characterizing different substrates of agricultural farm biogas installations,
to indicate the amounts of different variants of nitrogen, phosphorous and other elements
which could be found in digestate.
Table 2. Characterization of some different substrates before digestion and digestate. Mean values of
analyzes from several samples, where the variation can be large between sampling cases in the same farm.
Adapted from Rening av avloppsvatten i Sverige 2014.

9
The table above shows an overview of how much total nitrogen and total phosphorous can
be found in substrates. However, these values would vary with the digestion technology
utilized, especially in a co-digestion plant.
Table 3: Feedstocks or substrates of biogas production by anaerobic treatment in 2015; tons by wet weight.
Type of plant Organic house
whole waste
Waste water
sludge
manure Industrial
food waste
Slaughterhouse
waste
Energy
crop
Others
Wastewater
treatment
63 385 6160 292 0 38 914 0 0 185 309
Co-digestion 299 909 0 586 526 274 830 141 884 80 441 203 803
Farm
installations
0 0 307 233 4 565 4 235 0 4 310
Industrial 0 0 0 114 792 0 0 0
Total 363 294 6 160 292 893 759 433 101 146 119 80 441 393 244
Adapted from: produktion och användning av biogas och rötrester år 2015. (Production and use of biogas
and digestate in 2015)
1.2 Biogas production process. Case example: Linköping Biogas AB Plant
In 2009, the total digester volume in Sweden was estimated to be a little less than
500,000m3 and the reactors’ sizes ranging between 100 m3 to about 30,000 m3. Generally,
biogas production can be a one step (single digester) or two steps (hydrolysis and
acidogenesis separated from acetogenesis and methanogenesis) process. Linköping biogas
AB has a permit to process up to 125,000 tons of substrate each year. It consists mainly of
food waste (43 %), waste from industrial food processing spillage (28 %), slaughter house
waste (23 %) and of other vegetable substrate (6 %). The production of biogas occurs in a
total of four Continuously Stirred Tank Reactors. Three digesters with volume of 3700 m3,
are working in parallel and the fourth one (post digester) with a volume of 6000 m3,
specifically adapted for methane production, completes the digestion process
(Biogasportalen, 2015, Eriksson L. & Runevad D. 2014).

10
The complex process of AD, converting organic material into biogas by micro-organic
enzymatic activity, can be divided into four stages; hydrolysis, acidogenesis, acetogenesis
and methanogenesis. During hydrolysis, insoluble substrates are degraded into monomers
and oligomers by use of water. Acidogenesis further breaks down the monomers and
oligomers into volatile fatty acids (VFA), carbon dioxide (CO2), hydrogen gas (H2) and
acetate. It is the quickest step of AD conversions and therefore small changes do not affect
the overall speed of AD (Gerardi, 2003). Acetogenesis is carried out by acetate-forming
bacteria which grow in symbiotic relationship with methanogens. Acetate forming bacteria
digest VFA by fermentation into acetate, hydrogen and carbon dioxide. Lastly,
methanogenesis takes place when methanogens convert acetate, carbon dioxide and
hydrogen into methane (Gerardi, 2003). The optimum temperature (in which the micro-
organism grows fastest and works most efficiently), varies among species. And depending
on this temperature, they can be divided into different groups: psychrophilic, mesophilic,
thermophilic, and extremophilic/hyperthermophilic (Noha and Wiegel 2008, in Anna
Schnürer & Åsa Jarvis, 2009). Typically, the optimum temperature for a specific organism is
strongly linked to the environment from which it originates. For example, low optimum
temperature (around 10º C) micro-organisms (psychrophilic temperature range), can be
found in marshland or in a septic tank, whereas human intestinal bacteria, such as
Escherichia coli, grow best at 37° C (mesophilic temperature range). Organisms with an
optimum temperature above 50° C are called thermophiles, and those that grow above 65°
C are called extreme thermophiles (Noha and Wiegel 2008, in Schnürer A. & Åsa J., 2009).
Like Linköping Biogas AB, most biogas plants in Sweden are operating at a mesophilic
temperature, though, there are a few thermophilic plants. The raw biogas produced contains
45-85 % methane, 15-45 % carbon dioxide and, depending on the conditions of production,
it may also contain hydrogen sulphide, ammonia and nitrogen. While the substrate is
usually pumped into the digester, the biogas is collected from the top of the container, and
11
the residue (digestate) is removed by pumping or through an overflow for later storage or
recirculation into the process (Biogasportalen.se- Swedish Gas Association, March 2011).
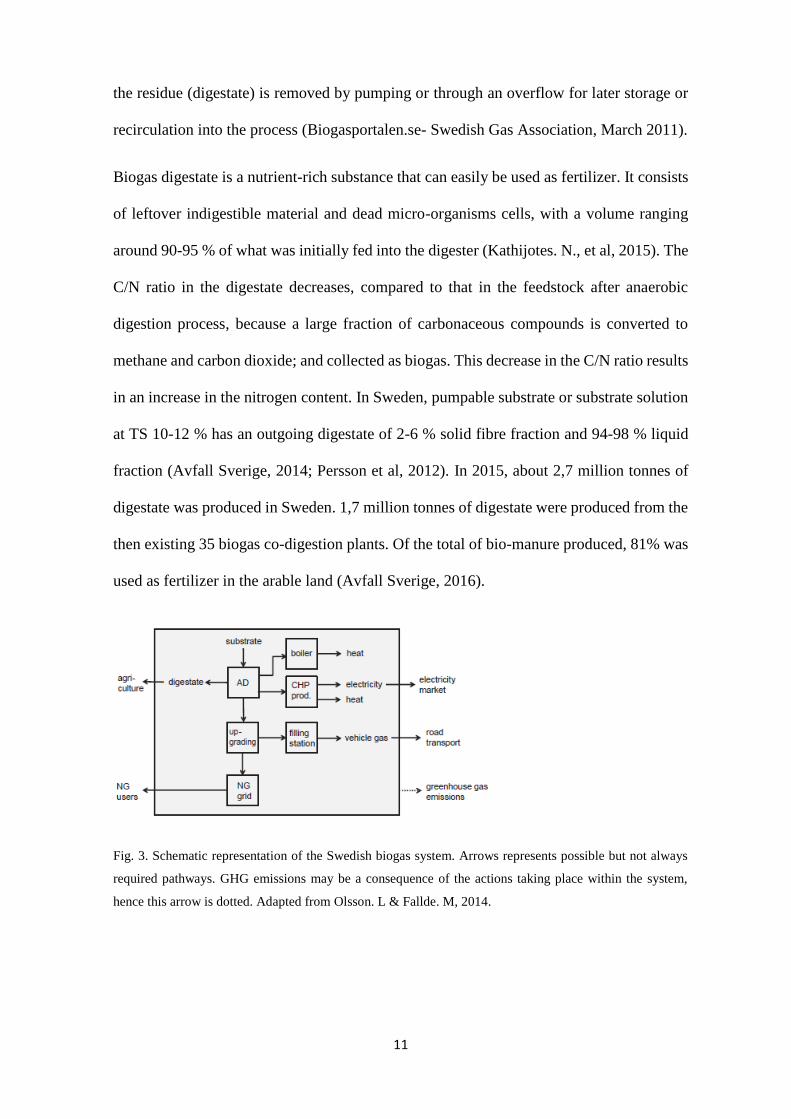
Biogas digestate is a nutrient-rich substance that can easily be used as fertilizer. It consists
of leftover indigestible material and dead micro-organisms cells, with a volume ranging
around 90-95 % of what was initially fed into the digester (Kathijotes. N., et al, 2015). The
C/N ratio in the digestate decreases, compared to that in the feedstock after anaerobic
digestion process, because a large fraction of carbonaceous compounds is converted to
methane and carbon dioxide; and collected as biogas. This decrease in the C/N ratio results
in an increase in the nitrogen content. In Sweden, pumpable substrate or substrate solution
at TS 10-12 % has an outgoing digestate of 2-6 % solid fibre fraction and 94-98 % liquid
fraction (Avfall Sverige, 2014; Persson et al, 2012). In 2015, about 2,7 million tonnes of
digestate was produced in Sweden. 1,7 million tonnes of digestate were produced from the
then existing 35 biogas co-digestion plants. Of the total of bio-manure produced, 81% was
used as fertilizer in the arable land (Avfall Sverige, 2016).
Fig. 3. Schematic representation of the Swedish biogas system. Arrows represents possible but not always
required pathways. GHG emissions may be a consequence of the actions taking place within the system,
hence this arrow is dotted. Adapted from Olsson. L & Fallde. M, 2014.

12
1.3 Biogas as vehicle fuel
In Sweden, 63% of the biogas produced is upgraded to vehicle fuel as LNG/CNG, or
injected into the gas grid. There are 59 upgrading plants with different technologies (water
scrubber, chemical scrubber, membrane filtration, pressure swing adsorption (PSA),
organic physical scrubber and cryogenic upgrading) purifying biogas for 217 filling
stations, suppling gas to 44,000 cars, 2,200 buses and 750 trucks. Part of the upgraded
biogas is injected into the existing natural gas network for district heating. A total of 465
GWh was injected into the gas grid in 2015 (Persson T., IEA Bioenergy task 37).
1.4 Biogas produced
Table 4: Total amount of biogas production in Sweden from 2005 to 2015 (GWh), excluding the amount from
landfills and gasification plant.
Adapted from: produktion och användning av biogas och rötrester år 2015. (Production and use of biogas
and digestate in 2015)
Type of Plant 2005 2006 2007 2008 2009 2010 2011 2012 2013 2014 2015
Wastewater
treatment
559 582 573 605 615 614 638 660 672 679 697
Co-digestion 163 184 205 240 299 344 416 507 580 717 854
Farm
Installations
12 14 13 15 18 16 20 47 77 44 50
Industrial plants 94 91 125 130 106 114 129 121 117 123 121
Sum 828 871 916 990 1038 1088 1203 1335 1446 1563 1722

13
Table 5. Amount of digested sewage sludge and solid digestate produced by respective types of biogas
installation, amount and % used as biofertilizer and the number of biogas plants certified by either REVAQ
or SPCR 120 in 2015.
Type of Biogas
plant
Production of
digestate (tons
wet weight)
Use of digestate
as biofertilizer
(tons wet weight)
Use of digestate
as biofertilizer
(%)
N0 of certified
installations
(REVAQ and
SPCR 120)
Wastewater
treatment
650 694 182 057 28 35
Co-digestion 1 710 412 1 689 834 99 19
Farm
Installations
314 895 314 895 100
Industrial
Plants
10 576 0 0 0
Total 2 686 577 2 186 786 81 54
Adapted from: produktion och användning av biogas och rötrester år 2015. (Production and use of biogas
and digestate in 2015)
Depending on the feedstock(s) material, anaerobic digestate applied in agricultural fields
has shown to have positive results on soil, in terms of fertilizer value and as soil organic
amendment when properly handled and managed. As soil amendment it would as an
addition to the soil improve or maintain the soil’s physical, chemical or biological
properties (AFNOR: FD CR 13456, 2001 as stated in Nkoa R., 2013). Biochemical
analyses of digestate reveal that some solid digestates show a greater mineral nitrogen
fraction (51-68 % total N) relative to the organic fraction (Paavola. T et al., 2008) and
suggesting that they are best used as fertilizers. On the other hand, digestate that have a
low mineral nitrogen fraction (24-36% total N) relative to the organic fraction, has a higher
potential of valorization as organic amendment (Teglia et al, 2011b).
However, it is documented that the application of digestate from biogas production to
arable land as fertilizer or organic soil amendment, in addition to the risks of atmospheric
pollution as ammonia and nitrous oxide emission, leads to significant nutrient leakage in
to the soil and water bodies (Colazo. Ana-B. et al, 2015 & Nkoa R., 2013). Nutrient
Pollution (eutrophication) is a major environmental concern when excess nitrogen and

14
phosphorous leak and contaminate surface and ground water courses as well as major water
bodies.
Table 6. Average values of nutrient and heavy metal content in bio-fertilizer from Linköping biogas plant
(Tekniska verken, 2015). Components between and within plants vary depending on substrate composition.
Adapted from Eriksson Linnea and Runevad David, 2016.
Parameter Quantity Unit
Total Nitrogen (N-tot) 3,6–5,7 kg/m³
Available Nitrogen (NH4-N) 2,3–3,3 kg/m³
Total Phosphorus (P-tot) 0,3–0,9 kg/m³
Total Potassium (K) 1,1–1,5 kg/m³
Sulphur (S) 0,3–0,6 kg/m³
Calcium (Ca) 1,1–1,7 kg/m³
Magnesium (Mg) 0,07–0,1 kg/m³
PH 8,0–8,5
Total Solids (TS) 3,0–4,3 %
Lead (Pb) 1,1–12 mg/kg TS
Cadmium (Cd) 0,3–0,5 mg/kg TS
Copper (Cu) 47–76 mg/kg TS
Chrome (Cr) 5,5–12 mg/kg TS
Mercury (Hg) 0,05–0,06 mg/kg TS
Nickel (Ni) 10–35 mg/kg TS
Zink (Zn) 144–184 mg/kg TS
Silver (Ag) 1,0–1,0 mg/kg TS
In a wastewater treatment plant, the residue of sewage sludge treatment is called digested
sewage sludge and contains a high-water content. De-watering is therefore required before
spreading the digestate sewage sludge in arable land. The liquid from this de-watering
process is called reject water (Swedish gas association 2011). In Sweden, digested sewage
sludge which has been certified can be used as fertilizer, while the liquid fraction (reject
water) is returned into the system.

15
2.0 Review of treatment methods used for solid and liquid digestate
from biogas processes
The cost of handling digestate due to its high-water content is relatively high compared to
the revenues from digestate value. A solution to this could be to process the digestate (i.e.
reduce the mass and volume), leading to high concentration of nutrients and to ease the
handling of the digestate. It could also have a positive impact on all subsequent activities
in the whole digestate management chain (Berglund, 2010; Persson et al, 2012, as stated in
Eriksson. L & Runevad D., 2016).
Although, the technology of processing the digestate is costly compared to the revenues, it
can be especially motivating in livestock intensive areas where there is a high accumulation
of nutrients. High levels of nutrients may restrict the application, or otherwise overload the
land and which, if it occurs, eventually leads to leaching and eutrophication (Dahlin et al.,
2015). The nutrient distribution problem (long and expensive transport), due to legislative
pressure on nutrient management and environmental protection, can be solved by either
reducing the total volume of the digestate to be handled or by reducing the limiting factors
for land application (Wellinger et al., 2103).
Digestate can be partially or completely treated. Partial treatment usually targets volume
reduction while the complete treatment upgrades the digestate to pure water, fibers/solids
and concentrates of mineral nutrients. Digestate processing begins with the separating the
solid phase from the liquid. The solid fraction can subsequently be directly applied as
fertilizer in agriculture or it can be composted. Additionally, there are several different
techniques that can be used for each digestate treatment option. Depending on the desired
end product, partial, complete or variations of treatments can be applied.

16
2.1 No treatment option
In Sweden, as in many EU countries, the no-treatment option is the most common in-use
for digestate from co-digestion plants and farm installations (Saveyn & Eder 2014.,
Olausson. J). This option is attractive because of low or no processing cost, as well as its
simplicity (uncomplicated process with little or no wrong). This is achievable through
contacts for sufficient land disposal on surrounding areas. As stated above, where land
application is limited, transportation distances and cost become very high. The application
of composted digestate is to some extent said to be problematic due to the odour emissions.
However, the process can further be improved to decrease the odour emissions by
increasing the process time and increasing aeration or operating the composting process in
a closed chamber (Sheets et al., 2015, as stated by Eriksson. L & Runevad D., 2016). Also,
the investment cost of composting digestate is considered high. Though the cost might be
difficult to determine in detail, given that the techniques vary considerably, it is estimated
to be at a minimum of 10 MSEK (Svenska Renhållningsverksföreningen., 2005 as stated
by Eriksson. L & Runevad D., 2016).
Fig 4. No treatment. Digestate is being directly land applied without further treatment. An attractive option
when sufficient farmland is available nearby. Adapted from (Eriksson L. & Runevad D., 2016).

17
2.2 Partial processing of digestate
Screw Press is a common mechanical solid-liquid separation technique, used for partial
processing of digestate (Drosg et al.,2015, as stated in Eriksson. L & Runevad D., 2016).
Fig. 5 Partial treatment: Digestate is treated with simple techniques resulting in two fractions. Adapted
from (Eriksson L. & Runevad D., 2016).
The method uses pressurized filtration where digestate is pumped into the center of the
press and forced against a surrounding cylindrical sieve. A screw rotates within this sieve,
slowly transporting the digestate along the cylinder while the liquid can filtrate through
and be collected by the surrounding container. By thickening the central shaft of the screw,
pressure against the sieve is increased and water is discharged. The solid fiber fraction exits
at the plate opening. The degree of dewatering is adjusted mechanically by increasing or
decreasing the flaps opening at the discharge end of the screw. Screw press dewatering
requires relatively low energy consumption of about 0.4-0.5 KWh/m3 digestate and a solid
fraction from the dewatering process is typically around 20-30 % TS (Drosg et al., 2015).
Digestate separation into solid and liquid is greatly influenced by the mesh size,
flocculants, and characteristics of the digestate, such as fibre and TS content (Drosg et al.,
2010). The distribution of nutrients and other elements is affected by separation efficiency

18
which varies with the techniques. The efficiency of separation could be determined based
on how clean the filtrate is or how dewatered is the solid fraction.
Table 7. Separation efficiency for each fraction. Outcome can vary greatly depending on several factors, e.g.
Separation technique, digestate, flowrate etc.
SEPARATION
EFFICIENCY
Solid high TS
Solid low TS
Liquid Low TS
Good separation
Clear liquid fraction Bad
dewatering of solid fraction
Liquid High TS
Unclean liquid fraction
Good dewatering of solid
fraction
Bad separation
During mechanical separation, nutrients and other constituents, both organic and inorganic,
will distribute between each fraction individually. Fig.6 illustrates the separation
characteristics of the technique hitherto mentioned. The separation efficiency varies with
the technique applied and digestate characteristics, but also on the effectiveness of
anaerobic digestion. The degree of digestion determines the amount of organically bound
nutrients against mineralized nutrients. And, a concentration of an organically bound
substance (i.e. in solids) is more likely to shift towards the solid fraction, while the
concentration of a mineralized substance (i.e. soluble in liquid) shift towards the liquid
fraction (Drosg et al., 2010). However, the separation characteristics can be manipulated
by for example adding chemicals. For example, the addition of flocculation additives (e.g.
polymers) can increase separation of up to 95 % (Meixner et al., 2015, as stated by Eriksson
L. & Runevad D., 2016). Polymers are a commonly used processing aid used in the waste
water treatment sector, due to its flocculation properties. Therefore, there is an interest of
using polymers in the biogas sector when dewatering digestate (Eriksson L. & Runevad
D., 2016).

19
The WWTP where I visited uses polymers and the screw press method - the literature I
referred to for studies conducted in Sweden stated the same. Across the spectrum of the
plants in Sweden; in my opinion, I say about 80 % uses polymers. The polymers are
obviously digested in the digester but however form part of the digestate applied in arable
land (personal communication with I’Ons David-development engineer Gryaab AB,
Göteborg).
Fig 6. Distribution of the principal constituents after solid–liquid separation; adapted after Bauer et al. (2009)
as stated by Drosg et al., 2015).
2.3 Reject water treatment methods
Based on the history of the techniques employed in treating reject water in most of the
wastewater treatment plants in Sweden, it can be concluded that in 2017, nitrification
denitrification in Sequence Batch Reactor (SBR) is still the dominant method for separate
reject water treatment (Stenström F. et al; 2017). Nitrification denitrification in an SBR is
a variant of activated sludge technology. It refers to the bio flocks which naturally occur
when the residence time of the sludge is longer than the hydraulic residence time (i.e.,
SRT> HRT) and a noticeable sludge concentration is obtained in the system.

20
The first permanent full-scale wastewater treatment in Sweden was a SBR for nitrification
denitrification, which was commissioned in 1991 at Nykvarn’s wastewater treatment plant
in Linköping.
The reason why SBR became common for reject water treatment, is that it is cheaper to
build than a separate bioreactor and separate sedimentation basin, and partly because the
even flow of reject water fits well for an SBR with minimal risk of hydraulic overload.
Another reason is its process flexibility, where it is easy to vary pre- or post-denitrification,
different times for anoxic and aerobic phases, as well as sedimentation time. SBR systems
are designed with a leveling tank prior to the reactor to enable batch-wise pumping
(Stenström F. et al; 2017).
The Nykvarn’s sewage treatment plant located in Linköping uses the SHARON technique;
and it is the only plant in Sweden which came into operation in 2009. SHARON is an
acronym for Single Reactor System for High Activity Ammonia Removal Over Nitrite. As
the acronym suggests, ammonium is not oxidized all the way to nitrate but only to nitrite.
The process is cheaper and more environmentally friendly than conventional nitrification
denitrification because theoretically 25 % less air volume and 40 % less carbon source is
required. According to Hellinga et al., 1998, as cited by Stenström et al., 2017, the primary
idea behind this process is to achieve high conversion rates and to be a volume-effective
process. Obtaining very low nitrogen levels in the effluent water is therefore subordinate
purpose.
Sjölunda in Malmö and, Sundets in Växjö uses the ANITA TM Mox process in treating
digestion returns by Moving Bed Biofilm Reactor (MBBR). The process is especially
recommended for plants with digestion systems combined with thermal hydrolysis, a
combination that is used to increase biogas production and reduce the amount of sludge
produced. The increased nitrogen load after thermal hydrolysis is preferentially treated in

21
the ANITA™ Mox process under sustainable conditions (Stenström et al., 2017,
www.veoliawatertechnologies.com).
The Slottshagen’s sewage treatment plant in Norrköping treats wastewater with
nitrification-denitrification in SBR. The purpose of the SBR is to increase the overall
reduction of nitrogen in the winter as well as reduce load to the main treatment step
(Stenström et al., 2017).
In some plants, for example Gryaab AB in Göteborg, the reject water is returned into the
system at a point where it will not affect the process but is easily recovered downstream.
The extra nitrogen loading of about 20 % does not cause capacity nor operational problems
as the plant is designed to cope with this factor (personal communication with I’Ons David-
development engineer Gryaab AB, Göteborg). When the legislative limits of nutrients have
been reached, the effluent can be released into the receiving waters. Effluent release is also
permissible for plants without set nutrient limits but their locations or regions form the
basis upon which this is agreed. The regions in the east coast of Sweden (from Norrtälje
upwards in the north) have no regulation nor limit on the amount of discharge into the
watercourses. This area has a very small population and large water bodies, and has a
history of low effluent concentration. (Mattsson Ann; Gryaab AB, Göteborg).

22
Table 8. Reject water treatment techniques/ management process in some facilities.
2.4 Efficiencies of some reject water treatment techniques compared
As selected examples, the table below is a comparison of three different reject water
treatment techniques of some plants in Sweden. The comparison is intended to show the
efficiencies of the treatment techniques at favorable conditions of temperature, PH and
concentration of different substances.
Table 9. Comparison of reject water treatment techniques
Operational Characteristics SHARON at
Nykvarn in
Linköping
ANITA™ Mox
in Växjö
SBR at
Slottshagens in
Norrköping Reactor Volume 1 240 m3
297 m3
1 050 m3
Reject water flow 250 m3/d 150 m3/d
215 m3/d
Hydraulic Rention Time (HRT) 5,0 d 2,0 d
4,7 d
Incoming conc of Total Nitrogen 1 800 mg/L 950 mg/L
1 370 mg/L
Outgoing conc of Total Nitrogen 350 mg/L 200 mg/L
270 mg/L
Wastewater treatment
Plant
Reject water treatment technique or treatment related information
Sörmland Vatten och
Avfall AB. 10 treatment
plants in the county.
All reject water passes through the inlet of the plant and back to
the process. A buffer volume of reject water is added for
dilution. Applies to all the ten facilities (Öberg E. research engineer)
Klippans Kommun Reject water is pumped into a leveling pool to get a dilution of
the ammonium and re-pumping into the plant. In this way, the
ammonium peaks are reduced during the operation (Andersson B.
Klippans Kommun, VA-department)
Stockholm Vatten VA AB ANITA MOX – It has been operational since February 2017 (Gottås H.)
Kalmer Vatten AB The reject water goes back into the process (Arnesdotter B.
Environmental engineer)
Skebäcksverket in Örebro
No specific treatment for reject water. Reject water is added to
the biological treatment. The process is an ARP (Active Return
Sludge Process), which means that the return sludge is pre-
treated in an ARP-tank before entering the biological tank. Both
the ARP and the biological tank are intermittently aerated for
nitrification and denitrification. The ARP has extra capacity
when it comes to nitrification (and denitrification), since the
microorganisms are “hungry” for substance and waste water
has not yet been added. (Sundvall T. process engineer)

23
Reduction grade of Total Nitrogen 81% 79 %
81 %
Reduction grade NH4-N 94% 92 %
99 %
Fraction of rejectwater flow of the
incoming mainstream flow
0,6% 0,7 %
0,5 %
Volumetric reduction of TN by actual
load
0,29 kg TNred /m3, d 0,38 kg TNred/m3, d
0,23 kg TNred/m3, d
Energy consumption (aeration + stirrers) 1,8kWh/kg TNred 1,4 kWh/kg TNred
3,5 kWh/kg TNred
Working time (operational surveillance,
maintenance, analysis)
11,5h/v 6 h/v
5,5 h/v
Operational cost (energy + worktime +
ethanol)
9kr/kg TNred 5 kr/kg TNred
19 kr/kg TNred
Operational cost distribution
energy/worktime/ ethanol
11/25/64% 24/76 %
16/8/76 %
2.5 Uses of digested sewage sludge from WWTP
Fertilization of arable land has been the single largest use area of digested sewage sludge
in the 1980s and 1990s. Agricultural use, including the cultivation of energy crops, has
varied between 10 and 50 %, but has in recent years been around 25-28 %. Most of the
Swedish sludge (close to 90 %) meets the quality standards for metals (limit values) and
organic substances (target values) but the public, for aesthetic reasons, is still concerned on
its use in agriculture. Sewage plants recycle only a small fraction of the sludge. It is
historically regarded with suspicion, basically, it is about trust. There is an unwillingness
to use sewage sludge as it has a long history of high metal content. Anaerobic digestion
uses well defined substrates that are easy to trace back, whereas sludge in the end of
wastewater treatment includes chemicals and e.g. pharmaceuticals. Even though the
sewage sludge meets standards and limits for pollutants, and, has come a long way
regarding quality, it still has a bad reputation.
Digested sewage sludge also attracts increased interest among forest research scientists and
forest companies, and therefore the possibility to be used in forest fertilization. Sludge
could be used to fertilize forests and to compensate the forest land for the nutrients and
metals (Ca, Mg, K) that leak out due to acidification and intensive forestry. Planting
products, in which sludge can be used in a proper amount to achieve a good nutritional

24
balance for plants, is another alternative way for the use of sludge. This plant ground (area)
can then be used for the construction of golf courses, and in various types of landscaping
projects, for example noise fields or in the plant foundation layer for the coverage and
restoration of waste dumps and different types of landfills.
Combustion with energy recovery: Dried or dewatered sludge can be burned separately or
with biofuels or waste. Sludge can be used in the production of products such as
precipitation chemicals, concentrated and clean fertilizer products from hydrolyzed sludge,
and ash after sludge combustion. Sludge that has undergone some pretreatment, such as
composting, is an exception of the ban on landfill disposal (Börje Andersson- wastewater
department Personnel., Klippans Kommun, Sundin., 2017).
Fig 7. Digested sewage sludge uses in Sweden, 2014. Adapted from Sundin., 2017.
3.0 Legislative framework and permitting procedures for biogas
installations
The legislation concerning biogas projects in Sweden addresses a range of aspects, such as
environment, emergency management, technology, animal by-products, nature
conservation, infrastructure, district planning, etc. (Scandinavian Biogas handbook,
Aspects of planning a biogas plant, 2014). In Sweden, the national, regional and the
municipal authorities are involved in the approval process of a biogas installation with
Uses of digested sewage sludge
Agriculture 25%
Soil products 29%
Landfill cover 24%
Stocked 7%
Lanfill 2%
Incineration 1%
other uses 10%

25
respect to different aspects. Municipal authorities handle aspects concerning spatial
planning, neighbours, building and techniques. The municipality handles the primary
inquiry of safety related issues but further inquiries and final decision making are done by
the national authority. Where specific parameters are exceeded; for example, large gas
production capacities and animal by-products, the national authority takes charge. The
owner of the biogas plant is responsible for the coordination, approval and control of the
biogas installation. The owner of a plant usually involves the different authorities in
planning and organising the project from the beginning, to ensure an optimised process,
and to gain the support of the local politicians.
The government has put in place a series of guidelines which must be followed to acquire
a permit to operate a biogas plant. Among these is the guidance of environmental testing
of biogas plants, requiring the proprietor or the owner of the plant to show how much of
biogas he intends to produce, nature of the substrate(s) and respective proportions, an
outline of the advantages for which they are the best choices and, the source of the
substrates. Any changes in the substrate streams, other than those listed during the
application, must be notified to the supervisory authority to assess their potential
environmental impacts. He must further show how digestate will be stored to avoid
methane and nutrient leakages. This is contained in a document called
“Växtnäringsförluster, miljömål och åtgärdsprogram” which means, nutrient losses,
environmental goals and action plans. The proprietor is required to outline his strategy of
bio-manure management, wherein a detailed description of how he intends to use the bio-
manure is stated, as well as the storage and the transportation to the area of use. A more
detailed description of the function of each guideline is found in the application
documentation (Steinwig C. et al. 2013, www.msb.se).
The owners of farm-biogas installations must carry out analyzes of nitrogen and
phosphorus content of bio-manure at least once a year, while those of co-digestion plants
26
must do the same analysis at least four times a year, and the recipient(s) of bio-manure
must be informed of the results of the analysis (Steinwig C. et al. 2013).
3.1 Application of Environmental code
Farmers who operate plants with biological treatment of waste: if the amount of manure
and bio-manure (digestate) is greater than 500 tonnes per year, or less, they are always
required to apply for environmental code B or C, respectively. The License application
must be in writing, and containing (among others) information, drawings and technical
descriptions needed to access the nature and the extent of the operation or measure;
information on how the general rules of consideration in the environmental code have been
met; suggestions for the safeguards or other precautions that are needed to prevent (or
manage) any inconvenience caused by the operation; an environmental impact assessment;
and proposals for checking the operation (Eskilsson J., 2013, Christensson K. et al., 2009).
3.2 Self-control
It is a system which is adapted to the environmental risk of the business to prevent
environmental damage or damage on human health. Anyone who operates activities that
can cause inconveniences to people’s health or the environment is subject to self-
assessment. Also, self-control does not only keep the owner informed of his activities’
impact on the environment but also a way for the company to plan and organize work to
counteract and prevent damage to the environment or human being’s health. The farmers
find out through self-check, that they are following the provisions and show to the
regulatory authority that they know how to do it. A self-control exercise can be summarized
by the following four steps which can always take place in parallel:
• Plan your own-control work regarding environmental impact.
• Perform control of operations.
• Follow the result of the check, and
27
• Improve control (Eskilsson J., 2013, Christensson et al., 2009).
3.3 Supervisory Authority
It is the environmental organ of the municipalities that carry out environmental surveillance
over agriculture, except for animal husbandry activities, which are monitored by the
administrative board. The board, however, can delegate powers to the municipality to do
the monitoring. The supervisory authority controls that operations comply with the
Environmental Code's requirements, as well as regulations and decisions taken from the
Environmental Code. The supervisory authority shall also provide advice and information,
as well as create conditions for achieving good environmental quality (Eskilsson J., 2013).
3.4 Cross Compliance
To get the full payment of farmer’s support, farmer will have to meet the so-called cross-
compliance; which states that:
• Farmer must follow certain rules that are available to achieve positive effects in e.g.
the areas of environment and plant protection. This is called operational
requirements.
• Farmer must handle all their farmland so that it is kept in good condition and that
the farmland is managed in an environmentally friendly manner. This is called a
maintenance requirement.
For agriculture in sensitive areas under the Nitrates Directive, several of the provisions are
on storage and spreading of manure and bio-manure; cross compliance for the area and
animal based supports (Eskilsson J., 2013). These regulations also apply to the spreading
of digestate and digested sewage sludge as sub-classes of organic fertilizer. The limits of P
and N application on arable land are the same as for manure (IEA bioenergy task 37).

28
3.5 Sanctions
Violations of regulations in the Environmental Code, provisions or rules, may lead to
environmental sanctions or punishment in the form of fines or imprisonment, if convicted.
The environmental sanction fees for violations of fertilizer management regulations and
eco/green mark is between 1000 SEK (~€ 100) and 50,000 SEK (~€ 500). After a certain
period, the fine can be repeated and increased to multiple folds (depending on the size of
the farm) if the violation has not been terminated or the situation taken care of. Violations
of the provisions that are in cross-compliance for the farm can also result in deduction of
farm support.
3.6 Certification of digestate
Ecological food, and by extension ecological farming, is gaining popularity in EU and in
Sweden. This increases the demand for certified biofertilizer (Facts and figures on organic
agriculture in the European Union, 2013).
The certification of both liquid digestate and solid digestate in Sweden per SPCR 120 is
optional and handled by RISE (Research Institute of Sweden) and its subsidiaries SP and
JTI. SPCR 120 are certification rules, containing quality requirements for certified reuse
of digestate from biogas production.
If SPCR 120 requirements are met, SP (Technical Research institute of Sweden) offers
manufacturers permission to mark their products with the quality label “Certifierad
Återvinning”; meaning certified for reuse (SPCR 120 Certifieringsregler för Biogödsel, SP
Technical Research Institute of Sweden Certification, Januari 2009). The purpose of the
Certification system is to increase reliability from an independent third party and create a
market with high quality products. The presentation of product content and instructions for
use of the digestate are also regulated (SPCR 120 Certifieringsregler för Biogödsel, SP

29
Technical Research Institute of Sweden Certification, Januari 2009; Eriksson. L &
Runevad D., 2016). Today, 70 % of all digestate produced in co-digestion plants and used
in agriculture, is certified (Avfall Sverige, 2016). For an overview of SPCR 120 document,
please see appendix 1. The nutrient content of biofertilizer varies from different plants
depending on the raw materials digested, the type of process digestion and how the process
works. Biofertilizers contain nutrients and trace elements found in raw materials. What
goes away during the process is the easily digestible carbonaceous material
(http://www.biogodsel.se/vaxtnaring/).
Table 10. Nutrient content in SPCR 120 certified digestate. Data analysis from 18 co-digestion plants in
2014. Raw materials consisted of 35% industry food waste, 24% source sorted food waste, 23% manure,
12% slaughterhouse waste and 6% others.
In the case of digested sewage sludge; the cooperation between stakeholders in agriculture,
food industry, retailers and sludge management has led to a certification system called
REVAQ with the slogan: “Clean water for better sludge.” The certification aims at
improving sludge quality to guarantee safe reuse of sludge and to meet the demands from
agricultural and food producer markets (Mattsson A. et al, 2012). The REVAQ trademark
may be used by certificate holders for information and advertisement about upstream work.
It may only be used on the product description of the sludge meeting the requirements for
spreading to arable land (REVAQ regler för certifieringsystemet, 2017). Today, certified
digestate is accepted by all Swedish food industries or associations as fertilizer. Even the
Swedish organic food certification system KRAV accepts certified digestate to be used as
TS content (%)
Tot-N (Kg/ton)
NH4-N (Kg/ton)
Tot-P (Kg/ton)
Tot-K (Kg/ton)
Mean 3,9 5,2 3,3 0,7 2,0
Median 3,6 4,5 2,8 0,5 1,5
Max 8,3 23,2 16,6 3,3 11,6
Min 1,1 0,8 0,5 0,1 0,4

30
fertilizer, if the substrates follow what is accepted according to the EU directive for
ecological production. That is, slaughter house waste is not accepted but source separated
organic household waste is accepted by KRAV (Avfall Sverige, 2016). Based on the
acceptance of well sorted organic household waste that could contain micro plastics, there
is routine follow up of separation procedure/techniques by landlords in collaboration with
the municipal authorities. It is currently unclear exactly how microplastics affect nature,
but it is known that these can be taken up by different animals and organisms, such as
plankton and mussels, if they come into the sea (Blomquist, 2014).
The figures in the table below are the certification marks of digestate from farm and co-
digestion plants and digested sewage sludge from WWTPs.
Fig 8. Trademark certification of digestate and digested sewage sludge from biogas co-digestion plants and
wastewater treatment plants respectively.
Table 11. Guidelines of maximum metal content in digestate certified per SPCR-120 (SPCR 120
Certifieringsregler för Biogödsel, SP Technical Research Institute of Sweden Certification, Januari 2009)
Certifierad Återvinning
REVAQ Certification
Metal Max. content, mg/KgTS
Lead 100
Cadmium 1
Copper 600
Chromium 100
Silver 1
Nickel 50
Zinc 800
31
3.7 Reduction of nutrient leakages
Many activities in agriculture and forestry risk harming or disturbing the environment, thus,
consideration is necessary in such activities. Regulations regarding the environment are
gathered in Environmental Code, and its ordinances. For certain activities and measures,
there are clear rules in the legislation, and for others the rules are of a more general nature.
Whether there is detailed legislation concerning certain measures, the Environmental
Code’s general rules of consideration always apply.
In brief, they state that “every person who carries out, or intend to carry out, activities on
the soil must obtain the knowledge and take the measures necessary for protecting human
health and the environment against damage or inconvenience”. More detailed rules about
the handling of plant nutrients are available in the Ordinance (1998:915) on environmental
concern in agriculture, and in the Swedish Board of Agriculture rules and general guidance
(SJVFS 2004:62) on environmental concern in agriculture about plant nutrients.
The Ordinance on environmental concern in agriculture includes rules on manure storage
capacity and minimum shares of land under vegetative cover during autumn or winter (so
called green land) (www.jordbruksverket.se).
The Swedish Board of Agriculture rules and general guidance on environmental concern
in agriculture, includes rules on covering of slurry stores, and filling of stores under a cover,
rules on spreading area and other aspects of spreading, restrictions on applied quantities of
manure and bio-manure, as well as detailed rules on green land.
3.8 Restrictions on applied quantities of manure, bio-manure and fertilizer.
The spreading of manure and other organic fertilizers is limited by its content of
phosphorus. The supply of phosphorus from manure and organic fertilizers (digestate for
example) may not exceed 22 kg per hectare available land, counted as a five-year average.
32
Within nitrate vulnerable zones (Stockholm, Södermanland, Östergötland, Kalmer,
Blekinge, Skåne, Halland and Västra Götaland), manure and organic fertilizer may not be
applied in quantities larger than the equivalent of 170 kg nitrogen per hectare available land
and year. Furthermore, the supply of nitrogen via manure and fertilizers may not exceed
the quantities considered necessary for the crop in the site in question. That is 22 kg of
phosphorous is maintained everywhere in the country while the amount of nitrogen may
vary depending on the crop needs (www.jordbruksverket.se).
In terms of nutrient accumulation, there may occur a certain degree of accumulation in
some parts of the nitrate sensitive region, but there are fertilizer spreading rules that makes
it all manageable (see below). The rules determine how much P can be spread per hectare
and year, as also stated in Ch. 3.3. They also regulate, among other things, the fertilizer’s
content of cadmium per kilogram of phosphorus (Christensson K. et al., 2009).
3.9 Action plan against nutrient losses
Sweden’s actions against plant nutrient losses and eutrophication are based on EU
directives, international commitments and the environmental quality objectives adopted by
Sweden.
The measures to reduce plant nutrient losses from agriculture are carried out via:
• Legislation (see chapter. 3.2)
• Financial instruments (Agri-Environmental payments, Non-productive
investments)
• Extension services and information, for example through Focus on Nutrients
(www.jordbruksverket.se).

33
3.9a Storage of manure and digestate
Manure shall be stored in a way that minimizes the risk of contamination of surface and
ground water. This storage must be designed in a way that it prevents runoff or leaching to
surrounding areas. Rainwater that runs off from manure facilities is regarded as manure, or
as contaminated water, and must be collected and stored.
There are requirements regarding manure storage capacity for all agricultural enterprises
with more than ten livestock units. In the nitrate vulnerable zones, storage capacity
requirements apply to all enterprises with more than two livestock units. An enterprise shall
be able to store manure for at least six to ten months before spreading, depending on which
part of the country is concerned and what species the manure comes from.
3.9b Covering and filling of slurry stores
To prevent ammonia losses from the stored slurry, the air directly above it must be
prevented from circulating. A method that efficiently reduces ammonia losses is to cover
the slurry stores with, for instance, a roof, a floating plastic cover or a stable natural crust.
In the south of Sweden, and in parts of the plains in central Sweden, special requirements
regarding the filling and covering of slurry stores apply to agricultural enterprises that keep
livestock (www.jordbruksverket.se).
3.9c Spreading of fertilizer and digestate
The rules on precautionary measures when spreading fertilizers are not the same in all parts
of Sweden. In the nitrate vulnerable zones, the rules are more far-reaching than in the rest
of the country. There are also specific rules which only apply in the counties of Blekinge,
Skåne and Halland (www.jordbruksverket.se).

34
To minimize ammonia losses during spreading, mineral fertilizers (based on urea) that are
spread on bare soil shall always be incorporated into the soil within four hours of the
spreading. This rule applies in all of Sweden.
Manure and organic fertilizers that are spread during the period 1 December – 28 February,
outside the areas identified as vulnerable, shall be incorporated into the soil within 12
hours.
In the counties of Blekinge, Skåne and Halland, manure that are spread on bare soil shall
be incorporated into the soil within four hours. This applies during the entire year. With
regards to the nitrate vulnerable zones, the following precautionary measures apply:
• Fertilizers may not be spread on water-saturated or flooded ground.
• Fertilizers may not be spread on frozen or snow-covered ground.
• Fertilizers may not be spread on agricultural land closer than two meters from an
edge adjacent to a watercourse or a lake. Fertilizers may not be spread on
agricultural land adjacent to a watercourse or a lake where the slope exceeds 10 %.
Manure produced by animals themselves when outdoors, should not be counted in
the term spreading.
• No fertilizers may be spread during the period 1 November – 28 February.
• During the period 1 August – 31 October, manure and other organic fertilizers may
only be spread on growing crops or before autumn sowing. Spreading in catch crops
is not allowed.
• Solid manure (except from poultry) may however be spread on bare soil during the
period 1 October – 31 October, even if the land is not about to be sown.
• Solid manure spread on bare soil during the period 1 October – 31 October shall be
incorporated into the soil within four hours in the areas identified as vulnerable
within the counties of Blekinge, Skåne and Halland. For other areas identified as
35
vulnerable, rules apply that solid manure spread on bare soil shall be incorporated
into the soil within 12 hours during this period (www.jordbruksverket.se)
3.9d Spreading liquid manure in growing crops
The largest part of ammonia losses due to the spreading of manure takes place in the first
hours after spreading. This means that if the manure is quickly incorporated into the soil or
placed directly into the ground, the losses are efficiently reduced. In the counties of
Blekinge, Skåne and Halland, the spreading of liquid manure in growing crops shall be
carried out using one of the following options that efficiently reduces ammonia losses.
• A method that places the manure directly on the ground underneath the green
cover, for instance band spreading.
• Liquid manure drill or a similar method that places the manure directly into the
ground.
• Any method that dilutes the manure with water before spreading (1-part manure
and at least ½ part water).
• Spreading followed by irrigation supplying at least 10 mm of water. The supply of
water shall begin no later than four hours, and be completed within 12 hours, after
the spreading began. Rain counts towards fulfillment of the 10 mm requirement.
3.9e Rules concerning land under vegetative cover in the autumn and winter
During autumn and winter arable land is kept under vegetative cover (green land)
especially where the soils are light with climate gentle to efficiently reduce plant nutrient
losses. In the counties of Blekinge, Skåne and Halland, the rules state that 60 % of arable
land shall be under vegetative cover during the autumn and winter. In the rest of southern
Sweden, the requirement is 50 % (www.jordbruksverket.se).

36
3.9f Extension services
Extension services and information are important tools for achieving an improved plant
nutrient management and to reduce the negative impact on environment. Extension services
help to adapt measures brought up to local conditions and circumstances on the individual
farm.
The Board of Agriculture employs plant nutrient advisors in Alnarp, Skara, Linköping and
Uppsala. The regional offices coordinate advisory service in their respective parts of
Sweden. They work to ensure that actions to reduce plant nutrient losses from agriculture
are implemented efficiently. This means that regional activities in plant nutrients shall be
run in a way that:
• adapts the use of plant nutrients to need, about cultivation,
• adapts feeding to needs,
• ensures that mineral fertilizers and manure are spread in a way that makes optimal
use of the plant nutrients and avoids negative effects on the environment,
• stimulates the use of cropping systems and cropping techniques that combine
financial profitability with minimal environmental effects,
• minimizes ammonia losses from agriculture.
Regional advisors shall spread information about results from research and trials in plant
nutrients to the operators in the region, as well as other important information (e.g.
legislation). Furthermore, they shall support other advisors in their work, and take part in
various regional projects and studies within their special fields (www.jordbruksverket.se).
3.9g Focus on Nutrients
Focus on Nutrients (Greppa Näringen) is a joint venture (project) between The Swedish
Board of Agriculture, The County Administration Boards, The Federation of Swedish

37
Farmers and a number of companies in the farming business which offers advice, free of
charge, for farmers (http://www.greppa.nu, www.jordbruksverket.se).
Through Focus on Nutrients, agriculture is to contribute to the fulfillment of the
Environmental Quality Objectives Zero Eutrophication, A Non-Toxic Environment, and
Reduced Climate Impact.
Advisory service within Focus on Nutrients is procured by The County Administration
Boards and provided by a variety of advisory firms. Farmers can choose between about 30
different advisory visits, which are divided by theme into “advice modules”. At the initial
advisory visit on the farm, the farmer and the advisor discuss the need of additional
counseling and establish a nutrient balance for the farm. The nutrient balance shows the
farm’s starting position, and it is followed up one or several times during future visits. The
farmer also receives a plan for the continuation of advisory visits, based on his/her own
interests and the needs of the individual farm (www.jordbruksverket.se).
3.9h Information material
Brochures and other information material concerning plant nutrients and manure are
produced by the Board of Agriculture on a regular basis. Several reports are published that
are used as a basis for extension services and for monitoring compliance with the
environmental legislation. Brochures and reports can be ordered from the Board of
Agriculture’s webpage www.jordbruksverket.se. Furthermore, the Board of Agriculture
has designed computer software called Cofoten; as an aid for plant nutrient extension
services focused on environmental issues. It can, for instance, be used for evaluating how
various ways of handling manure affect the use of the plant nutrient content, or, for
calculating plant nutrient balances at the farm (www.jordbruksverket.se).
38
4.0 Risk assessment of case examples of installations with potential
adverse environmental impacts
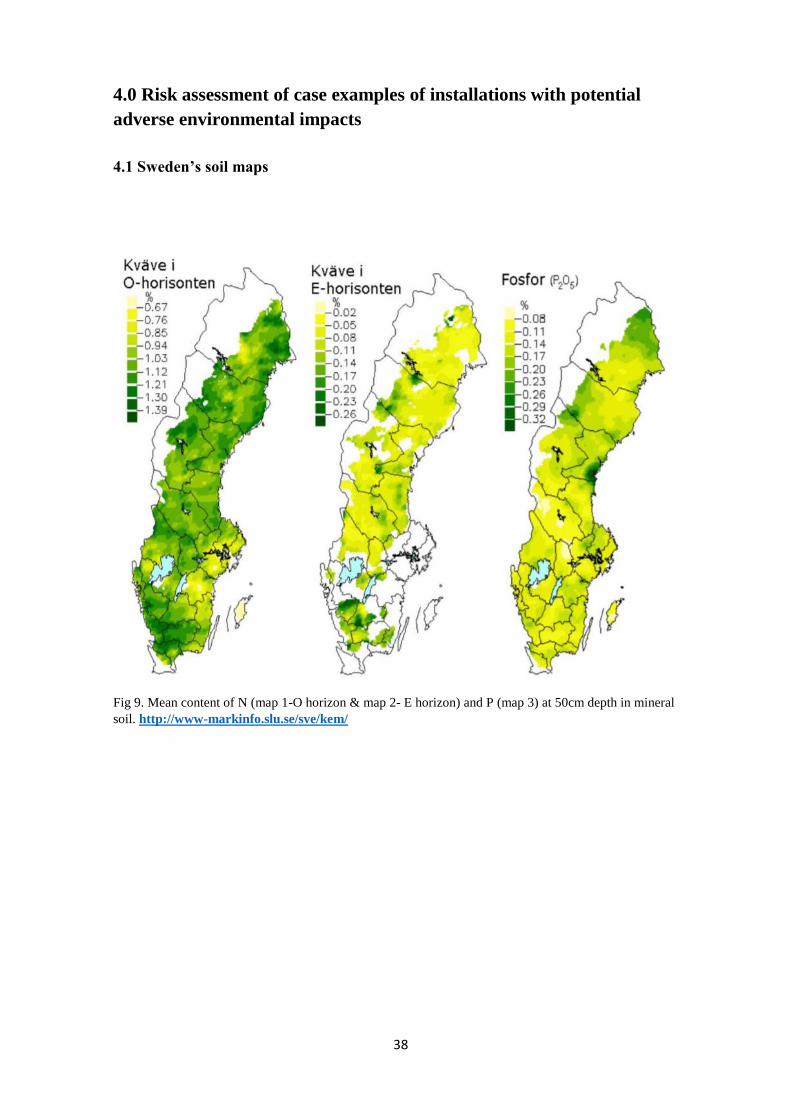
4.1 Sweden’s soil maps
Fig 9. Mean content of N (map 1-O horizon & map 2- E horizon) and P (map 3) at 50cm depth in mineral
soil. http://www-markinfo.slu.se/sve/kem/

39
Fig 12. Use of nitrogen (N) and phosphorous (P) from fertilizers and animal manure/digestate 2015/2016
adapted from Sverige officiella statistik.

40
Table 13. Risk of nitrogen leaking from arable land with mineral mixed organic soil
Adapted from http://www.naturvardsverket.se
Table 14. Risk of nitrogen leaking from arable land with organic soil.
Adapted from http://www.naturvardsverket.se
Table 15. Risk of phosphorous leaking from arable land in Sweden’s soils
Adapted from http://www.naturvardsverket.se
From the table 13 above: only 12 % of the soil in Sweden with P-AL (soluble phosphorous)
greater than 16mg /100g of soil, has the potential of causing meaningful risk if phosphorous
leaks.
Class Humus layer
depth(m)
TN Conc
(%)
Calculated Nitrogen
mineralization (kg/h
year)
Description
1 1 < 0,25 < 250 Moderate risk for nitrogen leaking
1 0,5 < 0,5 <250 Moderate risk for nitrogen leaking
3 1 0,25-0,4 250-400 Large risk for nitrogen leaking
5 1 > 0,4 > 400 Much risk for nitrogen leaking
Class Humus layer
depth(m)
TN Conc
(%)
Calculated Nitrogen
mineralization (kg/h
year)
Description
1 1 < 0,85 < 250 Moderate risk for nitrogen leaking
1 0,5 < 1,7 <250 Moderate risk for nitrogen leaking
3 1 0,85-1,35 250-400 Large risk for nitrogen leaking
3 0,5 1,7-2,7 250- 400 Large risk for nitrogen leaking
5 1 >1,35 > 400 Much risk for nitrogen leaking
5 0,5 >2,7 > 400 Much risk for nitrogen leaking
Class P-AL-class P-AL
(mg P/100g soil)
Description Distribution (%)
1 I-III < 8 Low risk for high P leaking 49
3 IV 8-16 Certain risk for high P leaking 34
5 V >16 Meaningful risk for high P leaking 12

41
4.2 Nitrogen and phosphorus balances for agricultural land and agricultural sector
in 2013
Fig 11; Input (tillförsel, output (bortförsel) and balance (balans), kg/ha, of nitrogen (kväve) for agricultural
land in 1995–2013.
Fig12; Input (tillförsel, output (bortförsel) and balance (balans), kg/ha, of phosphorus (fosfor) for
agricultural land in 1995–2013.
The graphs above are Sweden’s nitrogen and phosphorus balances calculated for
agricultural land in different regions for 2013 according to the soil surface gross method

42
(SCB MI 40 SM 1501, 2013). The method of calculation is partly adjusted to the method
recommended by OECD and Eurostat (2007), starting from the balances of 2003. At
national level, balances for the agricultural sector have been calculated according to the
farm gate method (OSPAR, 1995) as stated in SCB MI 40 SM 1501, 2013.
According to the report, the following variables have been used in the soil surface method:
– Nutrient inputs: mineral fertilizer, soil amendments, stable and grazing manure, seed,
atmospheric deposition, sewage sludge, digestate and biological nitrogen fixation.
– Nutrient outputs: yield and harvested plant residues.
The difference between nutrient inputs and nutrient outputs results in a soil surface balance
that is either positive or negative. If positive, it shows a surplus. For nitrogen, it consists of
ammonia volatilization from ventilation, storage and application, leaching, denitrification
and built-up of the nutrient reserve in the soil. For phosphorus, the surplus consists of
leaching and built-up of the soil nutrient reserve.
From the graphs above, it can clearly be seen that in Sweden, the input of nutrients through
mineral and organic fertilizers as well as the surplus in nutrient balances has declined
steadily over the past decade (Swedish Board of Agriculture).
Fig 13. Different sources of human-related strain in term of nutrients (N & P) to the Proper Baltic Sea
The table below is a summary of how much digestate is produced from different types of
biogas installations.
43
Table 16. Amount of digested sewage sludge and solid digestate produced by respective types of biogas
installation, amount and % used as biofertilizer and the number of biogas plants certified by either REVAQ
or SPCR 120 in 2015.
4.3 Risk assessment remarks for various biogas facilities.
After the holistic description of the situation of biogas in Sweden, in this section, possible
scenarios through which nutrient leakages may occur in various facilities will briefly be
discussed and remarks associated on whether there is any risk.
4.3.a Farm scale facilities
They produce good quality digestate ensued by the nature of the feedstocks and the AD
process. Almost all the methane in the feedstock is extracted. Digestate is properly covered
to avoid emission of ammonium. Digestate can only be applied seasonally on to the farms
to avoid runoff. Its application is done by injection to ensure immediate uptake. Nutrient
balances are performed by either the farmer himself or with the help of advisory firms like
“Grippa näringen”. Farmers commend the use of digestate compared to raw manure or
organic fertilizer.
On the bases of the visits I carried out and the literature upon which this report is written,
there is no risk of nutrient leakages except on accident cases which have not been reported.
Type of Biogas
plant
Production of
digestate (tons
wet weight)
Use of digestate
as biofertilizer
(tons wet weight)
Use of digestate
as biofertilizer
(%)
N0 of certified
installations
(REVAQ and
SPCR 120)
Wastewater
treatment
650 694 182 057 28 35
Co-digestion 1 710 412 1 689 834 99 19
Farm
Installations
314 895 314 895 100
Industrial
Plants
10 576 0 0 0
Total 2 686 577 2 186 786 81 54

44
4.3.b Co-digestion facilities
They digest mixed substrate with organic material being the major component. Quality
checks are carried out in the whole chain of collection of the organic waste and especially
at the biogas plants. There are different strategies of these quality checks in different
regions but the goal is the same. The liquid fraction of the digestate is recycled back into
the digester while the solid fraction can easily be transported to farmers who are either co-
owners of the facilities or pay a fee within 100 km. There is land ready for the application
of digestate which is governed by regulations. Operators are advised to protect their
facilities to avoid digestate spread in case there is a spillage. There is no risk of nutrient
leakages and no accident cases have so far been reported.
4.3.c Wastewater Treatment plants
They are mostly involved in sludge reduction volumes. Effluent release into watercourses
is regulated by EU Urban wastewater treatment directives and national regulations through
set limits of N and P loads. Some situated in the North-East coast with low population and
large water bodies may release effluents directly into the water courses. Those that are
incorporated with biogas production voluntarily seek for REVAQ certification to increase
the acceptability of digested sewage sludge. The proportion of digested sewage sludge used
in agriculture is low. Depending on their uses, there might be risk of leaching.
4.3.d Industrial facilities
They are very few and are basically set up for the treatment of industrial wastewater coming
from their operations. Until the Sweden’s biogas statistic report of 2016 where it is stated
that 62 % of the digestate from the industry is used as bio-fertilizer, digestate or residue
emerging from these industries were basically sent to the wastewater treatment plants. The

45
digestate is classified as digested sewage sludge from WWTP which are not REVAQ
certified. As a result, the environmental impact of the digestate will depend on it’s use. The
regulations put in place in the management and application of digestate are sufficient to
prevent nutrient management risks.
From the example above (borrowed from the seminar), the amount of total nitrogen present
in the digestate can be calculated.
25,000 m3 digestate will produce 63.7 tonnes of Nitrogen
2186 786 tonnes of digestate = 918 450.12m3 digestate, ( http://www.traditionaloven.com).
918 450.12m3 digestate = 918 450.12m3 digestate ÷ 25,000m3 * 63.7 tonnes N
= 2,340.2 tonnes of total nitrogen.
According to the restrictions of applying bio-manure, the amount of nitrogen content may
not exceed 170 kg/ha/year. This means that the total land needed to accommodate this
amount of nitrogen will be 2,340,200 kg ÷ 170 kg = 13,765.8 hectares.
If 2,340,200 kg of total nitrogen is applied to 13,765.8 hectares, the plants will then take
up how much they need in the form of nitrate and the rest are potential risk of leaching to
any of the catchment areas of the Baltic Sea as shown by the following diagram.

46
4.4 Nitrates sensitive areas
According to the EU Nitrates Directives, the sensitive areas, which are reviewed every four
years, led to further areas being added to the nitrate sensitive 2014 review. The map below
is the region of the sensitive areas in Sweden. For these areas, there are further provisions
to reduce plant nutrient losses from agriculture than in the rest of the country. The red line
shows sensitive areas before the 2014 review and the gray areas are current sensitive areas.
Fig 14. Map of nitrate sensitive areas in Sweden. Adapted from Eskilsson J., 2013.
Mitigation programs have been initiated in the agricultural sector to reduce nutrient losses
(nitrogen and phosphorus concentrations discharging from arable land). To this effect there
are two sub-programs within the Swedish Environmental Monitoring program to provide
data to support the evaluation of mitigation programs. One focuses on water draining from
individual arable fields (ca. 4-34 hectares in size), while the second is carried out at a larger
scale, focusing on streams draining agricultural catchments ranging from 200 to 3500
hectares in size (www.slu.se).
As specified by Section 5, sub section 1,
of the Regulation on Environmental
consideration in Agriculture (Agricultural
Agency's Regulations 2004: 62). The
areas considered as nitrate sensitive are as
follows: Stockholm, Södermanland,
Östergötland, Kalmer, Blekinge, Skåne,
Halland and Västra Götaland (Eskilsson
J., 2013)

47
4.5 Transportation of Digestate.
How far you can reasonably transport raw materials depends roughly on the energy content
of the material per unit of weight. Even in case of pre-treatment, it is how well the material
fits into the raw material mix. If you get paid to take care of the material e.g waste in the
case of the municipality; the authorities are attracted to low cost. On the other hand, if the
owner of a plant is to buy the raw materials, they are after energy content incentive. Thus,
different economic parameters play a role. In the case of digestate transportation from
biogas plant, there are readily available farmers especially those that supplied manure for
the digestion to take care of the digestate. The biogas plant at Vårgårda is one that has a
symbiotic relationship with its farmers within 100 km (Christensson K Skåne
municipality., Olausson J. Biogas operative Vårgarda). Manure and certified digestate
could be applied on the same arable land but there is always the precaution of not to exceed
the limits as specified in the environmental code.
4.6 Accident Cases
Energigas Sverige (Swedish Gas Association) continuously gathers information about
incidents and accidents involving any of the energy gases: natural gas, liquid petroleum
gas (LPG), biogas, vehicle gas, hydrogen and liquid methane. The incidents and accidents
reported span across for example, corrosion, material failure, wear, instrument or
component failure, construction failure, assembly error, welding error, operational error,
shaft error, crash or collision, fire, fire with gas, other causes, and unclear causes. Those
reported under biogas segment in the latest biogas report (2015) are 4, although what
happened specifically has not been mentioned. However, the table below gives information
on incidents and accidents that occurred from the year 2000- 2012.

48
Table 17. Incidents and accidents reported within Biogas energy sector from 2000- 2012.
Date Incident/accident Personnel
injury
04/04/2011 Gas heater to the gas dryer had melted the metal enclosure. Gas
heaters are now replaced with new units through the security fence
and alarm to the safety PLC
-
19/08/2011 Drill into the gas pipeline. -
24/08/2011 Excavated biogas pipeline (high pressure). -
12/09/2011 Damaged biogas pipeline (high pressure). -
12/04/2010 Explosion in the room where slaughterhouse waste is sanitized
before being used as raw material in Biogas process. It is likely that
methane formed and for some reason ignited.
-
11/11/2010 Methane gas leakage in connection with manure handling in the
farm. Fire fighters were consulted.
-
25/02/2009 Air holder meter exploded in the upgrading plant -
09/04/2009 Foaming digester gave vigorous effervescence in edge pipe and gas
pushed up through the water trap into the staff toilet in the digestion
facility. The toilet and the control room were all gas filled. The
stream was broken because of explosion risk and the rescue services
were summoned.
-
07/05/2008 Biogas at a sewage treatment plant leaked out from a container
where gas is stored in separate tanks. The lid of the container is
lifted and the gas could be released.
-
30/05/2007 Leakage of gas (biogas) at 200 bar pressure is reported from 2
pipelines, 200m long. Leaks occurred around the heat affected areas
around the welds.
-
10/05/2007 A large area of sewage treatment plant was blocked and later gas
leak occurred in the plant. The leak seemed to have occurred from
a pipe near the digester. The cause of the leak is not known.
-
01/06/2006 Leakage in a 4bar network. Cause unknown. -
13/02/2006 Corrosion! Incorrect material. Stainless pipe.
09/03/2005 A subscriber center leaked gas due to a pipe vibration caused by
infrastructural damage. Gas spread through a wall where there was
a fresh air intake.
-
26/01/2005 Biogas leakage at a biogas plant. -
23/08/2004 A leakage of compressed air in the compressor at the gas cleaning
sector in a biogas production plant. The reason was that a
-

49
compressed air hose to have come loose when air pressure was on
and the compressor was not in operation.
12/06/2004 The filling valve to a biogas truck was leaking gas, probably
because of poor parking. The main valve was closed.
-
22/02/2004 Motorist drove away with the hose after refueling. Break away
connector did not lose as it should have and the dispenser
overturned. No gas flowed out.
-
02/02/2004 Leaks in the furnace routes, which was not discovered in connection
with the self-monitoring /inspection installation. The gas alarm was
misplaced and therefore could not detect the fault immediately.
-
25/05/2003 A connection on the gas pipeline between the gas storage and the
dispenser started leaking gas due to the combination of compression
fittings and PV400 pipes.
-
24/09/2002 A ten-year-old stepped down into the silo of digestate. -
18/08/2002 Fire in a treatment plant. The gas engine was suspected first but
indications of the switch gear emerged.
-
08/01/2002 Gas leak because a shaft agitator got detached and feel into the
biogas digester at a sewage treatment plant.
-
xx/xx/2002 Small explosion at a biogas plant. Intermittent operation, leading to
condensation in the gas system and subsequent corrosion with loss
of function. The cause of the explosion might have resulted from it.
-
19/03/2001 Fire in the sludge storage tank that is part of a biogas plant. -
xx/xx/2001 Biogas supplied is not odorized -
xx/xx/2001 Fire in a biogas plant, stirrer in the digester tank should have been
replaced. The gas ignited and it took several hours before it was
extinguished.
-
xx/xx/2001 Breakdown of the compressor due to moist air used to raise the
pressure on the biogas.
-
Avfall Sverige utveckling, Report U2012: 17
It should be noted that the incidents and accidents reported in this report and its source are
not directly relevant to the digestion facilities and its processes. They include among others,
incidents related to distribution networks, vehicle fuel-refilling and at central subscription.
However, from the background, the following risks can occur in the digestion plants.
• In case of extensive foaming in the digester, there may be a risk of gas leakage via
pipes and water paths.

50
• Digestate that get stocked between shut-off valves risks causing uncontrolled
pressure increase due to gas extraction. This can lead to pipe cracking, for example,
regarding digestate pumps.
• Gas leakage has occurred from gas pipes that connect to digester.
• Gas leakage has also been caused by the shaft of a stirrer loosening and falling into
the container.
• Smaller fires have occurred with electrical equipment, smoking and welding as
potential ignition sources.
5.0 Subsidies and profitability (e.g. gate fees, electricity sold out) of
production
Table 18. Use of biogas from 2005-2015 in GWh
Biogas produced in Sweden can be used in various ways. It can be used for local heating
(via district heating network) or to generate electricity, thus contributing to an increased
proportion of ‘green electricity’ distributed through the grid. Biogas that has been
upgraded, i.e. when the carbon dioxide has been removed, to a methane content of about
97 %, may be used as vehicle fuel. This presents a good alternative for petrol and diesel
(Biogas in Sweden-Swedish gas association., March 2011).
Area 2005 2006 2007 2008 2009 2010 2011 2012 2013 2014 2015
Upgrading 112 218 303 355 488 608 734 845 907 1017 1219
Heat 687 678 732 720 667 606 562 524 521 434 387
Electricity 37
99 62 59 64 56 47 41 46 58 70
Industrial
Use
75 49
Others
19
Flaring
122 158 195 195 135 112 115 165 186 191 198
Missing
data
327 60 21 30 9 3 16 26 26 9 13
Total 1285 1213 1258 1359 1363 1387 1473 1589 1686 1784 1955

51
5.1 Electricity Certificates
A support system based on electricity certificate was introduced in 2003 to encourage the
production of electricity from renewable resources; biogas included (Swedish gas
association 2011). In January 2012, Sweden went into corporation with Norway for a joint
market for electricity certificates with the goal to develop new energy production, based
on renewable energy sources in a cost-effective way, amounting to 28.4 TWh by the end
of 2020. Sweden will finance 15.2 TWh and Norway 13.2 TWh (The Norwegian-Swedish
electricity certificate market annual report., 2015). Based on this certificate system,
producers receive one certificate for each MWh of electricity generated from renewable
resources over a maximum of 15 years. The certificate can be sold which generate
additional income for the producer. And at the same time, all electricity consumers (except
for some heavy industrial consumers) are required to buy a certain proportion of renewable
electricity by purchasing certificates. The cost of the certificates is distributed among the
consumers. The price span for the year 2014/2015 was 140-190 SEK/MWh (~15-20 €)
(Biogas in Sweden - Swedish gas association., March 2011, IEA Bioenergy task 37, 2015).
The municipality always pays a fee to the biogas plants for handling waste where the
substrate is manure. Sometimes the farmers are co-owners of the plant and therefore get
the digestate for free. If the raw material is energy crop, e.g ley crop as it is the case at
Växtkraft biogas AB in Västerås, the plant pays for the substrate (ley crop) and the farmers
in turn pay a fee for the digestate.
5.2 Investment support - agricultural program
In 2009, an investment support for farm-based biogas production and industrial production
for the marketing of new technologies and new solutions for biogas was introduced by the
government. Farms and other rural businesses investing in biogas production receive a
maximum support of 35 %, while industrial or large-scale plants receive a maximum of 45
% or 25MSEK (~3 M€), of the investment costs. This investment support is included in the

52
rural development program and comprises 200 MSEK (~21 M€) for the period 2009-2013
with an extension. However, the conditions imposed by the program are, that manure
represents at least half of the substrate digested, and that the digestion residues are stored
leak-free (Biogas in Sweden - Swedish Gas Association., March 2011, IEA Bioenergy task
37, 2015).
5.3 Super-environmentally-friendly car premium
A 'super-environmentally-friendly car premium' worth 40 000 SEK (~ 4100 €) was
announced by the Government in 2011. It can be paid out for cars with carbon dioxide
emissions of less than 50 grams/km, which will mostly be relevant for electric cars and the
best gas-driven cars. In 2011, it was estimated that 5000 cars will be covered by this
program in the next four years, which will cost the Treasury about 200 million SEK (Biogas
in Sweden - Swedish Gas Association., March 2011).
5.4 Dispensation from traffic tolls for environmentally-friendly cars
In the Swedish capital (Stockholm), environmentally-friendly cars have been given
dispensation from traffic tolls to promote their use. This dispensation is valid for cars
bought after 1 January 2009, and will cease completely for all environmentally-friendly
cars from 1 August 2012 (Biogas in Sweden - Swedish Gas Association., March 2011).
5.5 Climate investment grant for municipalities
There are climate investment grants for municipalities with a total budget of 1,925 MSEK
(~200 M €) until the end of 2018. This is like KLIMP, the development of new biogas
plants supported by central Government funding through local climate investment

53
programs (IEA Bioenergy task 37., 2015, BiogasinfoEngGodaExampel- Swedish Gas
Association).
5.6 No carbon dioxide or energy tax on biogas
The government announced that there will be no carbon dioxide or energy tax on biogas
until the end of 2015 (extension 2020 pending EU approval). Corresponding to around 708
SEK/MWh (76 €) compared to petrol, and 570 SEK/MWh (61 €) compared to diesel (IEA
Bioenergy task 37., 2015).
5.7 Reduction of income tax by 40% for company natural gas vehicles (NGVs)
Income tax has been reduced for company vehicles running on natural gas by 40 % until
the end of 2019, amounting to a total of 10,000 SEK (~1000 €).
Biogas produced from manure is subsidized by 0,2 SEK/KWh (~0,02 €/KWh) to reduce
methane emission from manure. A total budget of 355 MSEK has been allocated to cover
a period of 10 years (IEA Bioenergy task 37., 2015).
6.0 Case examples (if any) of commercial products from digestates
A market analysis was carried out in Sweden on biogas digestate to provide valuable
information regarding the current market for digestate, as well as to find out new potential
areas of its application. The approach of the study was to present a review of other reports,
complementing with interviews from different stakeholders, such as biogas plants.
The result showed that digestate is mainly used in agriculture as a soil improver and, that
this will probably be the main market in the future as well. However, the operators at the
biogas plants could see a development of digestate use in areas such as horticulture and
landscaping (Eriksson L. & Runevad D., 2016).
During the study, another report was reviewed that aimed at comparing the whole digestate,
liquid fraction and solid fraction with commercial fertilizers. Results presented two

54
promising areas for digestate use; one was co-composting the solid digestate with
woodchips, creating a product that could be suitable for landscaping and urban forestry.
Another was the use as a multi-purpose growing media, for example gardening (Eriksson
L. & Runevad D., 2016). Rigby and R Smith (2011) as stated by Eriksson L. & Runevad
D., 2016, also concluded that peat is a finite resource and other composting products could
be interesting as replacement.
Case examples of commercial products of biogas digestate certified by SPCR 120 are
simply called Biogödsel (bio-manure or bio-fertilizer).
In addition, GASUM, a Finnish biogas and biofertilizer producing company with its
headquarters in Finland, has four establishments in Sweden where biogas and biofertilizers
are produced. Recently it is thought that GASUM has bought over Biogas Sverige
International renamed as GASUM AB. The biogas is mainly produced from locally
produced, crop-based raw material. It uses grains, oil seeds and peas among the varied
substrate group. The bio fertilizer is rich in both nutrients and humus. The solid product
ensues from the separation of the liquid bio-fertilizer produced in the digestion process.
The product is approved according to the requirements for RISE certification for
biofertilizer, SPCR 120, as well as allowed to be use in KRAV-certified ecological
production. These four establishments of bio-manure production are known as biogödsel
Örebro, biogödsel Lidköping, biogödsel Västerås and biogödsel Jordberga
(www.Gasum.com).
7.0 Case examples (if any) of circular economy, where biogas is a part
of a larger chain
The Ellen McArthur foundation (2015) defines circular economy as stated in Hagman L.
& Eklund M., 2016 as restorative and regenerative by design, and aims at all times to keep

55
products, components, and materials at their highest utility and value. The concept thus
implies circular flows considering aspects like the value and quality of what is being
circulated.
Fig 15. Biogas carbon chain illustrating nutrient recycling and circular economy
Aquaculture requires energy input which is used to power the pump installations and to
heat the basins in wintertime. By inference therefore, the 387 GWh of heat produced is
likely used for the mentioned reasons.
Fish processing wastes are also suitable for biogas production. However, these materials
would be added as a co-substrate to boost the biogas production of plants treating
agricultural or municipal wastes. They cannot be used as the main substrate due to the
inhibitory effects of long chain fatty acids and high protein concentrations.
There are two case examples where Biogas plants are connected to the fishing industry in
Sweden. A few months ago, a company called “Rena hav” (renahav.se) just got its permit
for this business and they will fully be in operation from next year (Gunnarsson Bengt-
CEO).
As illustrated in the diagram below, large amounts of fish processing waste from the fish
industry in Sotenäs is received and mixed with co-substrates including sewage sludge (in
the industrial area where transportation is not required). The mix is then digested and
56
biogas is produced. The gas is then fed into a generator to produce electricity and heat
which is returned to the fish industry to heat the basins and power the pumps. The resulting
digestate is certified and used by farmers for ecological farming. Process water from the
fish basins is sent to the waste water treatment plant where it is cleaned and purged into the
sea (Rena hav.se).
Fig 16. Circular economy of biogas production by Rena hav. Adapted from Rena hav, energi och växtkraft.
8.0 Proposals for mitigating adverse environmental impacts of biogas
production
Based on environmental and sustainability goals that Sweden has set, biogas production is
likely to increase. No incidents regarding negative effects of digestate have been recorded.
More research should be carried out on digestate and digestate products that are easily
transported, including the possibility of drying-making pellets as biomass which in turn
could be used for incineration to produce energy. As a proposal of dealing with nutrient
leakages, “Grippa näringen” suggest mandatory reporting of nutrient balances by the

57
farmers, but also noted that it should be done with flexibility as it may risk imposing focus
on figures rather than a more profound understanding.
The authorities should develop more inclusive strategies of information campaign to
increase the acceptance of certified digestate.

58
References
Akselsson, C. et al., 2010. Assessing the risk of N leaching from forest soils across a steep
N deposition gradient in Sweden.
Andersen. H et al., 2016. Identifying Hot Spots of Agricultural Nitrogen Loss
Within the Baltic Sea Drainage Basin. Springer International Publishing Switzerland.
Andersson Åsa Scott., 2004. Environmental-Accident Index (EAI): A planning tool to
protect the environment in case of a chemical accident.
Avfall Sverige., 2016. Trender för avfallsanläggningar med deponi statistiks 2008–2014.
Rapport 2016:01 Sverige avfall utvecklingssatsning ISSN 1103–4092
Avfall Sverige, 2016. Solid waste management.
Avfall Sverige, 2014. Nya förbehandlingstekniker för ökad koncentration av växtnäring i
biogödsel.pdf (No. ISSN 1103–4092). Avfall Sverige.
Avfall Sverige utveckling, Skyddavstådd inom biogasanläggningar. Report U2012: 17,
ISSN 1103–4092
Blomquist., 2014. Bördighetseffekt av biogödsel.
Biogasanläggningar, Vägledning vid tillståndsprövning, Myndigheten för samhällsskydd
och beredskap. ISBN 978-91-7383-404-9, 2013
BiogasinfoEngGodaExampel- Swedish Gas Association., May 2008.
Biogas in Sweden - Swedish Gas Association, March 2011.
Christensson K. et al., 2009. Gårdsbiogashanbok. Rapport SGC 206 •1102–7371 • ISRN
SGC-R-206-SE.
Colazo Ana-B., et al.,2015. Environmental impact of rejected materials generated in
organic fraction of municipal solid waste anaerobic digestion plants: Comparison of wet
and dry process layout.
Dahlin, J., Herbes, C., Nelles, M., 2015. Biogas digestate marketing: Qualitative insights
into the supply side. Resource. Conserv. Recycling. 104, Part A, 152–161.
Drosg, B., Fuchs, W., Al Seadi, T., Madsen, M., Linke, B., 2015. Nutrient Recovery by
Biogas Digestate Processing. IEA Bioenergy.
Eriksson. L & Runevad. D, 2016. Evaluating digestate processing methods at Linköping
biogas plant: A resource efficient perspective. Master’s Thesis Linköping University.
Eskilsson J., 2013 Gödsel och miljö 2014.
Facts and figures on organic agriculture in the European Union, 2013. DG Agriculture and
Rural Development.
59
Frandsen, T. Q. Rodhe, L., Baky, A., Edström, M., Sipilä, I., K., Petersen, S.L., Tybirk,
K., 2011. Best Available Technologies for pig Manure Biogas Plants in the Baltic Sea
Region. Published by Baltic Sea 2020, Stockholm.
Gerardi, M.H., 2003. The microbiology of anaerobic digesters. Wiley-Interscience,
Hoboken, N.J.
Hagman L. & Eklund M., 2016. The role of biogas solutions in the circular and bio-based
economy.
IEA BIOENERGY TASK 37, (2015). REVAQ Certified Wastewater Treatment Plants in
Sweden for Improved Quality of Recycled Digestate Nutrients, Case Study, April 2015.
Available from: http://www.iea-biogas.net/case-studies.html
Naturvårdverket; Rening av avloppsvatten i Sverige 2014.
Nkoa. R., 2013 Agricultural benefits and environmental risks of soil fertilization with
anaerobic digestates: a review.
Olausson Jan., Operational Leader to Vårgårda Biogas plant
http://www.vhbiogas.se/index.php
Olsson. L & Fallde. M., 2014: Waste(d) potential: a socio-technical analysis of biogas
production and use in Sweden. Journal of Cleaner Production.
Paavola.T., et al 2008. Biogas from energy crops—optimal pre-treatments and storage,
co-digestion and energy balance in boreal conditions.
Persson, E., Tamm, D., Fransson, M., 2012. Ökad koncentation av växtnäring i biogödsel
(No. ISSN 1103–4092). Avfall Sverige, BioMil AB.
Persson T., IEA Bioenergy task 37, Country Report Sweden
Policy Based Scenarios for Waste-to-Energy Use: Swedish Perspective. Waste and
Biomass Valorization August 2014, Volume 5, Issue 4, pp 679–688
Saveyn, H., Eder, P., 2014. End-of-waste criteria for biodegradable waste subjected to
biological treatment (compost & digestate): technical proposals.
Schnürer Anna and Jarvis Åsa., 2009. Microbiological Handbook for Biogas Plants.
Solon K., 2015. Reject Water Treatment Models- Master thesis
Steinwig Caroline et al. 2013; Vägledning; Miljöprövning av Biogasansläggningar, 2013.
Stenström F. et al .2017; Rejektvattenbehandling–en kunskaps-sammanställning.
Sundin Anna M., 2017. Naturvårdsverkets arbete med slamfrågan
Svensson Fredrik and Harrysson Johan, 2015. Produktion och användning av biogas och
rötrester år 2015. ES 2016:04 Energigas Sverige.
Sverige officiella statistik. Statistiska meddelande (SCB MI 40 SM 1501, 2013). Nitrogen and
phosphorous Balances for agricultural land and agricultural sector in 2013.
60
Swedish Waste Management U2009:03 Swedish Gas Centre Report 207.
Teglia C, Tremier A, Martel JL (2011b) Characterization of solid digestates: part 2,
assessment of the quality and suitability for composting of six digested products. Waste
Biomass Valor 2:113–126.
Tekniska Verken., 2016. Miljörapport 2015.
Travnicek Petr et al., 2015. Environmental Risk Assessment of a Biogas Station.
Travnicek Petr, and Kotek Lubos., 2015. Risks Associated with the Production of Biogas
in Europe.
Wellinger, A., Murphy, J., Baxter, D. (Eds.), 2013. The biogas handbook: science,
production and applications, Woodhead publishing series in energy. Woodhead Publ,
Oxford.
www.biogasportalen.se
www.sgc.se
european-biogas.eu
www.biogasvast.se
biofuelregion.se
www.energigas.se
http://www.biogasreports.com/
http://www.biogasresearchcenter.se/projects/?lang=en
http://www.biogasportalen.se/Sitemap
http://www.biogasportalen.se/BiogasISverigeOchVarlden/Anlaggningar-i-lan
http://prescriptionmotorcycleeyewear.com/lan-karta-over-sverige.html
http://www.biogodsel.se/vaxtnaring/
www.jordbruksverket.se. Actions against Plant Nutrient Losses from Agriculture.

61
Appendix 1. Summary of SPCR 120 – Certification rules for digestate from bio-
waste by the quality assurance system of Swedish Waste Management (December
2007).
Anneli Petersson, Swedish Gas Centre - 2008.
This is not a complete translation of SPCR 120, but should be seen as an overview of
the SPCR 120 document.
Substrates for certificated digestate should be clean, source separated and easily
biodegradable (of the types shown in Tab.1). Only approved additives and process
chemicals may be used (see Tab. 2 and Tab. 3). Before digestate from a plant can be
marked with the quality label it has to pass a qualification year. The qualification year
starts when an un-objective authority takes its first sample at the plant. To pass the
qualification year, both the plant’s own samples (for sample frequency see Tab. 5), and
the samples taken by the authority must passed the test (for analysis see Tab. 6). All
documentation must be in order (e.g. process parameters that must be documented, see
Tab. 4). The qualification year starts over if samples do not pass the test and if no
satisfying explanation can be found and the problem cannot be solved. After a passed
qualification year, digestate produced during the qualification year can be labeled, as
well as new digestate produced on the plant. During the qualification year there is also
a hygienization control which is repeated every 5 years (depending on the utilization of
the digestate). The certificate is valid for 5 years.
The labeled product may not contain higher metal concentrations than specified (see
Tab. 7), the labeled digestate should include declaration of content (see Tab.8), guide
of how to use it, testing report and a process description. Depending on types of
substrates and utilization of the digestate, hygenization control and bacteriological
testing of the digestate have to be done and passed (for sample frequency see Tab. 5).

62
Visible contaminants (> 2mm) may not be more than 0.5 weight% of DM. For solid
digestate there may not be more than 2 germinative seeds / liter and the organic
substance must be more than 20 %. The un-objective authority visits the plant 1-2 times
per year (depending on plant size). Samples are taken and the plant’s own control is
checked.
Substrates for certificated digestate.
Source Example
Parks, gardens, etc. Leafs, grass, branches, fruit, flowers, plants
and parts of plants. Greenhouses, etc. Tops, soil, peat products.
Households, kitchens, restaurants1 Fruit and vegetables remainders, coffee and
tea remainders, remainders of food, egg
shells, cardboard, paper, paper bags,
biodegradable bags, plants och flower soil.
Bags for source separated house hold waste
should fulfill EN 13432 from 1/1 2005.
Food related shops1 Fruits, vegetables, potatoes, diary waste,
paper towels, paper napkins, bread, meat,
meat parts, charcuterie parts, flowers, plants,
soil and peat. Food containing additives
allowed for food production are allowed in
the substrates.
1If the substrate contains animal by-products regulation for this should be followed
Food industry1 Remainders from food industry that
contains additives allowed I food
production are allowed as substrates. Agriculture1 Manure, straw, by-products from
harvesting, ensilage, energy crops. Forrest Bark, wood chips, fiber sludge from the
cellulosic industry. Animal by-products, category 2 Only manure, content stomach and intestine
separated from stomach and intestine, milk
and raw milk. Animal by-products, category 3 See ABF

63
Additives and process Chemicals
Allowed additives
1Animal by-products regulation for this should be followed
Allowed process chemical
Allowed additives according to SPCR 120
Organic1 or mineral fertilizers
Lime
Allowed process chemicals according to SPCR 120
Iron chloride
Iron oxide
Bentonite
KMB1
Diatomaceous earth

64
Process control. The following parameters should be measured and documented:
Lowest allowed frequency of sample taking and analysis. Sample taking should be
spread over the year.
SPCR 120 also regulates how samples should be taken
Types and amounts of substrates, additives and process chemicals
Temperature and pH in the reactor
Time between feeding of substrate
Hydraulic retention time
Time and temperature in the hygenization tank
Organic loading rate
Volumetric loading
Actions taken to avoid re-contamination
Process disturbances
Samples per year taken by plant personnel
Amount received of
substrate for
biological treatment
/ton/year) received
Qualification year After qualification year
Samples except bacterial sample
Bacterial sample
Samples except bacterial sample
Bacterial sample
<5000 2 4 1 4
from 5000 4 4 2 4
from 10 000 8 4 4 4

65
Methods for analyses. Equal methods may be used if the same or better measuring
accuracy can be reached.
1These parameters should be measured by the NMKL methods stated in the table.
Maximal content of metals in the digestate
Metal Maximal amount (mg/kg DM)
Pb 100
Cd 1
Cu 600
Cr 100
Hg 1
Ni 50
Zn 800
Declaration of content
Paramter Unit
Tot. N kg/ton and kg/m3
NH4-N kg/ton and kg/m3
Tot. P kg/ton and kg/m3
Tot. K kg/ton and kg/m3
Mg kg/ton and kg/m3
S kg/ton and kg/m3
Ca kg/ton and kg/m3
Organic substance % of DM
pH -
DM Weight percent
Analyses parameter Method
Metal content (Pb, Cd, Cu, Cr, Hg, Ni, Zn) SS-EN 13346mod/SS11885-1
Visible contaminates BGKII:10 1998:4
Germinative seeds and plant parts (only for
solid digestate)
BGKII:9 1998:4
Dry matter SS 12880
VS SS-EN 12879-1
Total N SS02801-1/SS-ISO 11261
Total P SS-EN13346/mod SS11885-1
Total K SS-EN13346/mod SS11885-1
N-NH4 St. Meth.16417A+D
Mg SS-EN13346/modSS11885-1
S SS-EN13346/modSS11885-1
Ca SS-EN13346/modSS11885-1
pH SS-EN12176
Microbial parameters1
Esherichia coli NMKL no 125, 2005, version 4
Enterococaceae NMKL no 68, 2004, version 4
Salmonella NMKL no 71, 1999, version 5

66
Municipality County Type of plant
Alingsås Västra Götaland Sewage treatment plant
Alvesta Kronoberg Sewage treatment plant
Arboga Västmanland Sewage treatment plant
Arvika Värmland Sewage treatment plant
Askersund Örebro Sewage treatment plant
Avesta Dalarna Sewage treatment plant
Bjuv Skåne Sewage treatment plant
Bollnäs Gävleborgs Sewage treatment plant
Borgholm Kalmar Sewage treatment plant
Borlänge Dalarna Sewage treatment plant
Borås Västra Götaland Sewage treatment plant
Botkyrka Stockholm Sewage treatment plant
Degerfors Örebro Sewage treatment plant
Eksjö Jönköping Sewage treatment plant
Enköping Uppsala Sewage treatment plant
Eskilstuna Södermanland Sewage treatment plant
Eslöv Skåne Sewage treatment plant
Falkenberg Halland Sewage treatment plant
Falkenberg Halland Sewage treatment plant
Falköping Västra Götaland Sewage treatment plant
Finspång Östergötland Sewage treatment plant
Forshaga Värmland Sewage treatment plant
Gislaved Jönköping Sewage treatment plant
Gotland Gotland Sewage treatment plant
Gävle Gävleborgs Sewage treatment plant
Göteborg Västra Götalands Sewage treatment plant
Götene Västra Götaland Sewage treatment plant
Hagfors Värmland Sewage treatment plant
Hallsberg Örebro Sewage treatment plant
Hallstahammar Västmanland Sewage treatment plant
Halmstad Halland Sewage treatment plant
Haninge Stockholm Sewage treatment plant
Haparanda Norrbotten Sewage treatment plant
Hedemora Dalarna Sewage treatment plant
Hedemora Dalarna Sewage treatment plant
Helsingborg Skåne Sewage treatment plant
Hudiksvall Gävleborgs Sewage treatment plant
Hässleholm Skåne Sewage treatment plant
Hässleholm Skåne Sewage treatment plant
Hässleholm Skåne Sewage treatment plant
Höganäs Skåne Sewage treatment plant
Appendix 2 List of some Biogas plants in Sweden

67
Höganäs Skåne Sewage treatment plant
Höör Skåne Sewage treatment plant
Jönköping Jönköping Sewage treatment plant
Jönköping Jönköping Sewage treatment plant
Kalmar Kalmar Sewage treatment plant
Karlshamn Blekinge Sewage treatment plant
Karlshamn Blekinge Sewage treatment plant
Karlskoga Örebro Sewage treatment plant
Karlstad Värmland Sewage treatment plant
Katrineholm Södermanland Sewage treatment plant
Klippan Skåne Sewage treatment plant
Kristianstad Skåne Sewage treatment plant
Kristinehamn Värmland Sewage treatment plant
Kumla Örebro Sewage treatment plant
Kävlinge Skåne Sewage treatment plant
Laholm Halland Sewage treatment plant
Laholm Halland Sewage treatment plant
Landskrona Skåne Sewage treatment plant
Lerum Västra Götaland Sewage treatment plant
Lidingö Stockholm Sewage treatment plant
Linköping Östergötland Sewage treatment plant
Ljungby Kronoberg Sewage treatment plant
Ljusnarsberg Örebro Sewage treatment plant
Ludvika Dalarna Sewage treatment plant
Ludvika Dalarna Sewage treatment plant
Luleå Norrbotten Sewage treatment plant
Lund Skåne Sewage treatment plant
Lund Skåne Sewage treatment plant
Lund Skåne Sewage treatment plant
Lysekil Västra Götaland Sewage treatment plant
Lysekil Västra Götaland Sewage treatment plant
Malmö Skåne Sewage treatment plant
Malmö Skåne Sewage treatment plant
Mariestad Västra Götaland Sewage treatment plant
Mellerud Skåne Sewage treatment plant
Motala Östergötland Sewage treatment plant
Mönsterås Kalmar Sewage treatment plant
Nora Örebro Sewage treatment plant
Norberg Västmanland Sewage treatment plant
Norrköping Östergötland Sewage treatment plant
Norrtälje Stockholm Sewage treatment plant
Norrtälje Stockholm Sewage treatment plant
Nyköping Östergötland Sewage treatment plant
Nynäshamn Stockholm Sewage treatment plant
Oskarshamn Kalmar Sewage treatment plant
Perstorp Skåne Sewage treatment plant
Piteå Norrbotten Sewage treatment plant
Rättvik Dalarna Sewage treatment plant

68
Sala Västmanland Sewage treatment plant
Sandviken Gävleborgs Sewage treatment plant
Sjöbo Skåne Sewage treatment plant
Skara Västra Götaland Sewage treatment plant
Skellefteå Västerbotten Sewage treatment plant
Skövde Västra Götaland Sewage treatment plant
Smedjebacken Dalarna Sewage treatment plant
Sollefteå Västernorrland Sewage treatment plant
Sotenäs Västra Götaland Sewage treatment plant
Stockholm Stockholm Sewage treatment plant
Stockholm Stockholm Sewage treatment plant
Sundsvall Västernorrland Sewage treatment plant
Sundsvall Västernorrland Sewage treatment plant
Sundsvall Västernorrland Sewage treatment plant
Surahammar Västmanland Sewage treatment plant
Tibro Västra Götaland Sewage treatment plant
Tomelilla Skåne Sewage treatment plant
Tranås Jönköping Sewage treatment plant
Trelleborg Skåne Sewage treatment plant
Trollhättan Västra Götaland Sewage treatment plant
Uddevalla Västra Götaland Sewage treatment plant
Ulricehamn Västra Götaland Sewage treatment plant
Umeå Västerbotten Sewage treatment plant
Uppsala Uppsala Sewage treatment plant
Uppsala Uppsala Sewage treatment plant
Vadstena Östergötland Sewage treatment plant
Varberg Halland Sewage treatment plant
Vimmerby Kalmar Sewage treatment plant
Vingåker Södermanland Sewage treatment plant
Vänersborg Västra Götaland Sewage treatment plant
Värmdö Stockholm Sewage treatment plant
Värnamo Jönköping Sewage treatment plant
Västervik Kalmar Sewage treatment plant
Västerås Västmanland Sewage treatment plant
Växjö Kronoberg Sewage treatment plant
Ystad Skåne Sewage treatment plant
Åstorp Skåne Sewage treatment plant
Åtvidaberg Östergötland Sewage treatment plant
Älmhult Kronoberg Sewage treatment plant
Ängelholm Skåne Sewage treatment plant
Örebro Örebro Sewage treatment plant
Örkelljunga Skåne Sewage treatment plant
Örnsköldsvik Västernorrland Sewage treatment plant
Örnsköldsvik Västernorrland Sewage treatment plant
Örnsköldsvik Västernorrland Sewage treatment plant
Östersund Jämtland Sewage treatment plant
Östhammar Uppsala Sewage treatment plant
Östra Göinge Skåne Sewage treatment plant

69
Eslöv Skåne Industrial
Umeå Västerbotten Industrial
Örnsköldsvik Västernorrland Industrial
Bjuv Skåne Farm-based
Gotland Gotland Farm-based
Götene Västra Götaland Farm-based
Halmstad Halland Farm-based
Lerum Västra Götaland Farm-based
Luleå Norrbotten Farm-based
Malmö Skåne Farm-based
Nyköping Södermanland Farm-based
Boden Norrbotten Co-digestion
Borås Västra Götaland Co-digestion
Falköping Västra Götaland Co-digestion
Helsingborg Skåne Co-digestion
Huddinge Stockholm Co-digestion
Jönköping Jönköping Co-digestion
Kalmar Kalmar Co-digestion
Kil Värmland Co-digestion
Kristianstad Skåne Co-digestion
Laholm Halland Co-digestion
Linköping Östergötland Co-digestion
Skellefteå Västerbotten Co-digestion
Skövde Västra Götaland Co-digestion
Uppsala Uppsala Co-digestion
Vetlanda Jönköping Co-digestion
Vänersborg Västra Götaland Co-digestion
Vårgårda AB Västra Götaland Co-digestion
Västerås Västmanland Co-digestion
Älmhult Kronoberg Co-digestion


![RISK ASSESSMENT [ASSESSMENT]](https://img.pdfslide.us/doc/110x75/6212412fca52115ed803cf10/risk-assessment-assessment.jpg)