Embed Size (px)
Citation preview

A Project Report Submitted to: National Aeronautics and Space Administration
by. The University of Hawaii at Manoa Honolulu, HI, 96822
Final Report: NAG59038
“Validation and Analysis of SRTM and VCL Data Over Tropical Volcanoes ”
PRINCIPAL INVESTIGATOR: Dr. Peter 3. Mouginis-Mark HIGP/SOEST University of Hawaii 1680 East-West Road, POST Room 504 Honolulu, HI 96822 (808) 956-8760
Date Submitted
https://ntrs.nasa.gov/search.jsp?R=20040075898 2018-06-02T16:41:04+00:00Z

FINAL REPORT NAGS-9038
“Validation and Analysis of SRTM and VCL Data Over Tropical Volcanoes”
1. INTRODUCTION
2. RESULTS 2.a The Philippines 2.b Java 2.c Galapagos Islands
3 . PUBLICATIONS
4. FUTUREWORK
5. REFERENCES
6. FIGURES
Page No.
1
4
5
5
6

, Final Report: NAGS9038 Page 1
1. Introduction The focus of our investigation was on the application of digital topographic data in
conducting first-order volcanological and structural studies of tropical volcanoes, focusing on the Java, the Philippines and the Galapagos Islands. Kilauea volcano, Hawaii, served as our test site for SRTM data validation. Volcanoes in humid tropical environments are frequently cloud covered, typically densely vegetated and erode rapidly, so that it was expected that new insights into the styles of eruption of these volcanoes could be obtained from analysis of topographic data. For instance, in certain parts of the world, such as Indonesia, even the regional structural context of volcanic centers is poorly known, and the distribution of volcanic products (e.g., lava flows, pyroclastic flows, and lahars) are not well mapped (Newhall and Dzurisin, 1988; Cam, 1999). SRTM and Vegetation Canopy Lidar (VCL) data were expected to provide new information on these volcanoes. Due to the cancellation of the VCL mission, we did not conduct any lidar studies during the duration of this project.
Digital elevation models (DEMs) such as those collected by SRTM provide quantitative information about the time-integrated typical activity on a volcano and allow an assessment of the spatial and temporal contributions of various constructional and destructional processes to each volcano's present morphology. For basaltic volcanoes, P_c?w!m-d and Garbed (2000) have shown that gradual slopes (6") occur where lava and tephra pond within calderas or in the saddles between adjacent volcanoes, as well as where lava deltas coalesce to form coastal plains. Vent concentration zones (axes of rift zones) have slopes ranging from 10" to 12". Differential vertical growth rates between vent concentration zones and adjacent mostly-lava flanks produce steep constructional slopes up to 40". The steepest slopes (locally approaching 90") are produced by fluvial erosion, caldera collapse, faulting, and catastrophic avalanches, all of which are usually identifiable.
Due to the delay in the release of the SRTM data following the February 2000 flight, a significant part of our effort was devoted to the analog studies of the SRTM topographic data using topographic data from airborne interferometric radars. As part of the original SRTM Science Team, we proposed four study sites (Kilauea, Hawaii; Mt. Pinatubo, Philippines; Cerro Am1 and Femandina volcanoes, Galapagos Islands; and Tengger caldera, Java) where we could conduct detailed geologic studies to evaluate the uses of SRTM data for the analysis of lava flows, lahars, erosion of ash deposits, and an evaluation of the structural setting of the volcanoes. Only near the end of this project was one of these SRTM Science Team products (Luzon Island, the Philippines) released to the community, and we only had limited time to work on these data.
2. Results During our participation in the SRTM Science Team project, we worked extensively
with Tom Farr at JPL to try to define our highest priority areas for data to be processed, as well as helped JPL advocate the release of science data to the SRTM Team. We were able to perform preliminary processing and analysis of SRTM data for Luzon Island in the Philippines, including Mt. Pinatubo, which are of good quality and show some fascinating structures not only around Mt. Pinatubo but also Taal volcano to the south of Manila.
‘ I
Final Report: NAG5-9038 Page 2
In preparation for the release of the SRTM data, we conducted several studies of volcanoes using digital elevation data collected either from airborne interferometric radars (the TOPSAR and Star-3i systems) or from repeat-pass radar interferometry from the ERS-2 spacecraft. We describe here on our results from these preparatory studies in the Philippines, Java and the Galapagos Islands, and indicate how our membership of the new SRTM data analysis team will provide new geologic insight in these areas.
2a. The Philippines The 1991 eruption of Mt. Pinatubo, Philippines, provided a unique opportunity to
study the effects of a large eruption in part because it took place after the advent of satellite-based observations. Using five SPOT multispectral satellite images (obtained 4/88, 12/91, 12/94, 2/96 and 12/98) and four Landsat 7 scenes (from October 1999 until January 2001), we have documented the drainage evolution on the “Western Fan”, which is a large (>lo0 km2) ignimbrite sheet extending from O’Donnell Valley in the north to Marella Valley in the SW (Bailey et al., 2001).
Detailed knowledge of topography and slope is important for documenting these changes, and are relevant for the study of the evolving “sediment budget” (near-summit sediments eroded during storms and deposited at lower elevations) which controls lahar production. These lahars can result in extensive damage downstream even years after the eruption. Our topographic studies of Mt. Pinatubo (e.g., Mouginis-Mark et al., 2001; Bailey et al., 2001) have so far relied on the morphologic analysis of TOPSAR data of the western fan collected during the 1996 and 2000 NASA PacRim deployments. Co- registering the TOPSAR and SPOT data enables the degree of erosion to be assessed over the 5 year, 4 month, period between the eruption and TOPSAR data collection. This is important because during the project we focused on assessing the role played by the topography that existed prior to the eruption in controlling the development of new drainage system on the ignimbrite sheet. A maximum of >50 m of erosion has been identified in areas buried by the eruption. Numerous small (10 - 15 m deep) new canyons have also been measured from TOPSAR data.
One of the main problems with the TOPSAR data is the lack of coverage over the western fan of Mt. Pinatubo. TOPSAR coverage in both 1996 and 2000 was limited to the summit region and the lahar fans to the southeast (Pasig-Potrero River). Although we were not able to conduct an analysis of the rate of erosion of areas only covered by SRTM, we were able to determine the total extent of incision into the ignimbrite fan between the eruption (in June 1991) and the collection of SRTM data (in February 2000).
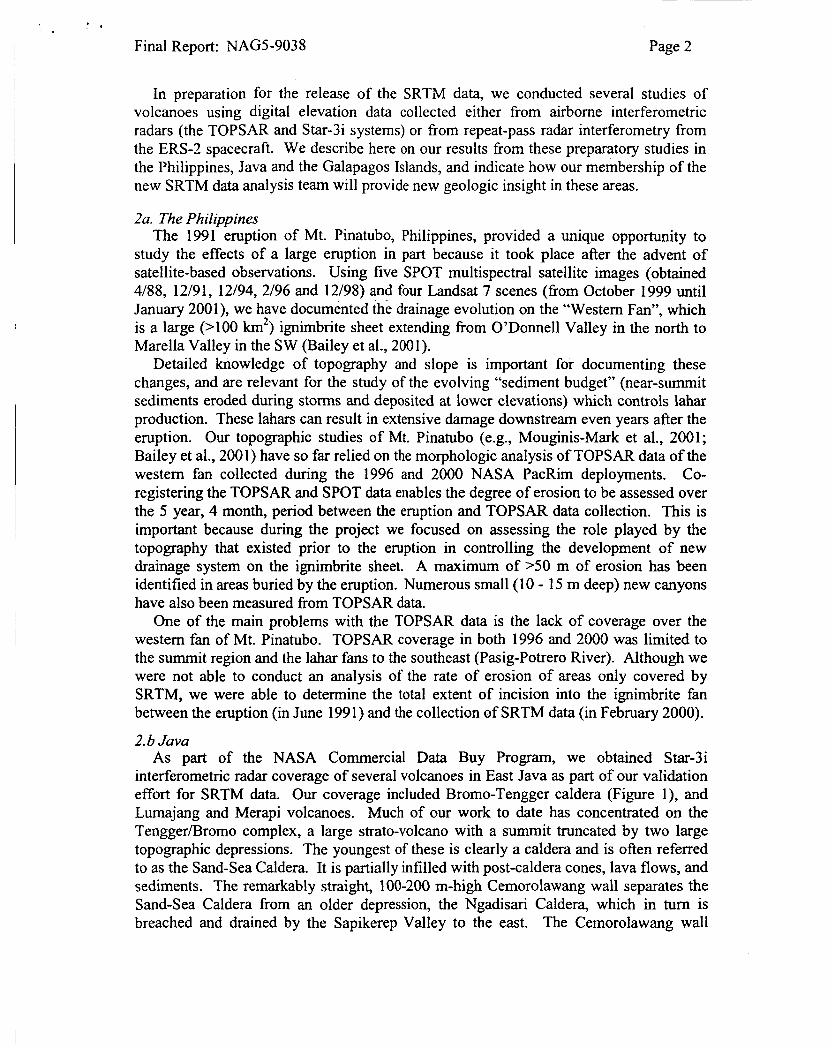
2.b Java As part of the NASA Commercial Data Buy Program, we obtained Star-3i
interferometric radar coverage of several volcanoes in East Java as part of our validation effort for SRTM data. Our coverage included Bromo-Tengger caldera (Figure l), and Lumajang and Merapi volcanoes. Much of our work to date has concentrated on the Tengger/Bromo complex, a large strato-volcano with a summit truncated by two large topographic depressions. The youngest of these is clearly a caldera and is often referred to as the Sand-Sea Caldera. It is partially infilled with post-caldera cones, lava flows, and sediments. The remarkably straight, 100-200 m-high Cemorolawang wall separates the Sand-Sea Caldera from an older depression, the Ngadisari Caldera, which in turn is breached and drained by the Sapikerep Valley to the east. The Cemorolawang wall

Final Report: NAG59038 Page 3
exposes the youngest pyroclastic materials and lava flows in the Ngadisari Caldera, showing that the Sand-Sea Caldera is the younger of the two large structures. The floor of the Ngadisari Caldera is distinctly non-horizontal and maintains a continuous slope all the way out the Sapikerep Valley breach, evidence that the Valley existed at the time the units comprising this Ngadisari Caldera floor were deposited. The Ngadisari Caldera and Sapikerep Valley combined have the morphology of an amphitheater-headed (erosional) valley, much like those that truncate E. Maui Volcano in Hawai'i.
We also used the STAR-3i data to investigate the structural relationships of the summit caldera(s) of the TenggerBromo complex in E. Java (Figure 2). In particular we found morphological evidence that the so-called Ngadisari Caldera may be partially or even wholly an erosional rather than volcanic feature. Ngadisari is open to the northeast via the Sapikerep valley. Units within Ngadisari dip northeast and extend out the Sapikerep valley. These include the 152 Ka Sakapura ignimbrite, indicating that the Ngadisari depression has been open via Sapikerep Valley for at least that long. Moreover these units also dip northeast, indicating that Ngadisari has not been an enclosed depression during this time period. Sapikerep is by far the largest valley on TenggerElromo. The next largest valley is roughly parallel to Sapikerep, displaced some 6 km to the NW, and extends high enough to merge with the Ngadisari Caldera in a complex region previously mapped as downdropped blocks within Ngadisari (Cam, 1999). A scenario consistent with our observations is as follows: 1) large-scale sector collapse occurred to the NE; 2) the sector collapse scar refilled (although not completely) during subsequent activity and its margins remained as roughly parallel, NE-oriented structural weaknesses that coincided with topographic barriers capable of concentrating stream erosion; 3) erosion concentrated along these structural weaknesses, particularly at Sapikerep, leading to stream piracy and the formation of the Ngadisari depression as a large amphitheater-headed valley; 4) renewed volcanic activity, including the Sakapura ignimbrite partially infilled the Ngadisari depression with NE-dipping units; and 5) the Sand-Sea Caldera formed by caldera collapse.
2.c Galapagos Islands The September 1998 eruption of Volcan Cerro Azul, Galapagos Islands (Mouginis-
Mark et al., 2000) allowed us to quantify the volume of erupted material, and to test models for the down-slope movement of a large (>14 km long) a'a lava flow. Unlike earlier eruptions (such as the flows fiom Kilauea, Hawaii, or the 1995 Femandina eruption), none of the lava from the 1998 eruption entered the ocean. Thus the entire flow volume can be studied.
We used a suite of remotely-sensed images, numerical modeling, and constraints from limited field observations to determine quantitative characteristics of the 1995 Femandina and 1998 Cerro h l eruptions in the Westem Galapagos Islands. Flank lava flow areas, volumes, instantaneous effusion rates, and average effusion rates were all determined for these two eruptions, for which only limited syn-eruptive observations are available. Our calculations allowed us to make inferences about supply rates and magma chamber pressurization during the eruptions.
Using SPOT, TOPSAR, ERS-1 and -2, we determined that the 1995 Femandina flow covers a subaerial area of 6.5 x lo6 m2 (Figure 3) and has a subaerial dense rock equivalent (DRE) volume of 90 x lo6 m3. Field observations, Along Track Scanning Radiometer satellite data, and the FLOWGO numerical model (Harris and Rowland,

I I ‘
Final Report: NAG5-9038 Page 4
2001; Rowland et al., 2003) allowed us to determine that the effision rate declined exponentially from a high of -100 m3/sec during the first couple days to <5 m3/sec prior to ceasing after 73 days, with an average effusion rate of -20 m3/sec. Combining the effusion rate and duration values produced a total (subaerial + submarine) DRE volume of between 2.5 and 1 1.4 x lo7 m3. Using SPOT, TOPSAR, ERS-1 and -2, we determined that the 1998 Cerro Am1 flow is 16 km long, covers approx. 16 km2, and has a DRE volume of 173 x lo6 m3. FLOWGO allows us to model a peak effusion rate. The average effusion rate (volume/duration) was 55 m3/sec. Both eruptions show evidence of exponentially declining eruption rates, which in turn suggested to us that the eruptions were driven by an elastically relaxing magma chamber.
3. Publications and Presentations Here is a listing of the oral and poster presentations given in support of our analysis
of SRTM data. We also supported the SRTM Project Office at JPL, attending special conference sessions to inform the community about the SRTM mission and providing press release information on Mt. Pinatubo in the Philippines (one of our main study sites) as earlier this year was the loth anniversary of the major eruption of the volcano.
Rowland, S.K., P.J. Mouginis-Mark, and H. Garbeil (2000). Analysis of new topographic data of eastern Java from airborne interferometric radar. Abstracts submitted to the General Assembly, IAVCEI 2000, Bali, Indonesia, p. 254.
Garbeil H, F. Amelung, P. Mouginis-Mark and S. Rowland (2001). Volume Analysis of the 1998 Lava Flow from Volcan Cerro Azul, Galapagos Islands. Abstract volume for “Cities on Volcanoes 2 Conference”, Auckland, NZ, p. 43.
Harris, A.J.L. and S.K. Rowland (2001). FLOWGO: a kinematic thermo-rheological model for lava flowing in a channel. Bulletin Volcanology 63: 20 - 44.
Mouginis-Mark, P.J., H. Garbeil, and R. Torres (2001). Topographic change at Mt. Pinatubo from SRTM and TOPSAR observations. Fall 2001 American Geophysical Union meeting, San Francisco.
Mouginis-Mark P.J. (2001). Satellite observations of volcanoes. Abstract volume for “Cities on Volcanoes 2 Conference”, Auckland, NZ, p. 103.
Mouginis-Mark P.J., S. K. Rowland, Harold Garbeil and Falk Amelung (2001). Topographic Change on Volcanoes from SRTM and Other Interferometric Radars. Proc. IGARSS Conference, Sydney, Australia.
Rowland, S.K., A.J.L. Harris, M.J. Wooster, F. Amelung, H. Garbeil, L. Wilson, and P.J. Mouginis-Mark (2003). Volumetric characteristics of lava flows from interferometric radar and multispectral satellite data: The 1995 Fernandina and 1998 Cerro Azul eruptions in the Western Galapagos. Bulletin Volcanology 65: 3 1 1 - 330.
We also worked with NASA Goddard’s Press Office (Steve Cole) to release other information on how SRTM data can be used to study volcanoes. We provided numerous interviews to local (3 TV stations and 2 local newspapers), national (NASA’s Earth Observatory and USA Today) and international (the London Times) media on the uses of SRTM data for volcano studies in Hawaii and the Philippines. We expect that this media interaction will continue to be a component of our work during the Data Analysis Program. Two of the stories that were published can still be found on-line at:
http://starbulletin.com/2OOO/O2/ 1 9/news/story3. html http://starbulletin.corn/2OOO/O 1 /28/news/story4.html

I‘ . . Final Report: NAG5 -903 8 Page 5
4. Future Work We were successful in obtaining continuation fun( ing for this project under the re- competition of the SRTM Science Team. Work to be included under this new grant (NAGS-1 3729) includes an analysis of SRTM data for the Philippines, Indonesia, and the Kuriles-Kamchatka region. This last study area is part of the new APANL study supported by NASA’s Code YS.
5. References Bailey, J., S. Self, R. Torres, and P. Mouginis-Mark (2001) Fall AGU, San Francisco. Cam, SA. (1999). Application of synthetic aperture radar (SAR) imagery to volcano
mapping in the humid tropics: a case study in East Java, Indonesia. Bulletin Volcanol. 6 1 : 92 - 105.
Harris, A.J.L. and S.K. Rowland (200 1). FLOWGO: a kinematic thermo-rheological model for lava flowing in a channel. Bulletin Volcanology 63: 20 - 44.
Mouginis-Mark, P.J., H. Snell and R. Ellisor (2000). GOES satellite and field observations of the 1998 eruption of Volcan Cerro Aml, Galapagos Islands. Bull. Volcanol. 62: 188 - 198.
Mouginis-Mark, P.J., H. Garbeil, and R. Torres (2001). Topographic change at Mt. Pinatubo from SRTM and TOPSAR observations. Fall 200 1 American Geophysical Union meeting, San Francisco.
Newhall, C. G. and D. Dzurisin (1988). Historical unrest at large calderas of the world. US. Geolocal Survey Bulletin 1855, 1097 pp.
Rowland, S. K. and H. Garbeil(2000). Slopes of oceanic basalt volcanoes. In: “Remote Sensing ofActive Volcanoes”, AGU Monograph #116, eds. P.J. Mouginis-Mark, J. A. Crisp and J. Fink, pp. 223 247.
Rowland, S.K., A.J.L. Harris, M.J. Wooster, F. Amelung, H. Garbeil, L. Wilson, and P.J. Mouginis-Mark (2003). Volumetric characteristics of lava flows from interferometric radar and multispectral satellite data: The 1995 Femandina and 1998 Cerro Azul eruptions in the Western Galapagos. Bulletin Volcanology 65: 3 1 1 - 330.

Final Report: NAG59038 Page 6
Fig. 1: Backscatter radar coverage obtained of East Java using the Star-3i radar. Analysis of Bromo- Tengger caldera is one of the top priorities for both geologic mapping and validation of the SRTM data set.
Fig. 2: Oblique view of Tengger caldera, produced by combining the Star-3i topographic data and Ikonos panchromatic data obtained under the Data Commercialization Program.

: * 8 '
Final Report: NAG5-9038 Page 7
Thickness of January 1995 Fernandfna Lava Flow ERS-2 Tandem minus TOPSAR
Fig. 3: Thickness map for the 1995 lava flow from Fernandina volcano, Galapagos islands, generated by subtracting a DEM produced fiom ERS-2 tandem data obtained after the eruption from TOPSAR measurements made in may 1993. This analysis was part of an experiment we conducted to prepare for the use of SRTM data to determine the volumes of lava flows from future eruptions. Image from Rowland et al. (2003).