Embed Size (px)
Citation preview
Final Report - Monitoring and Evaluation of the Innovation Project, Gampaha, Sri Lanka (March 2010 – April 2011)
1
Monitoring and Evaluation of the Innovation Project,
Gampaha, Sri Lanka
RUAF - FROM SEED TO TABLE PROGRAMME (FStT)
Final Report Submitted to
Dr. (Mrs.) Priyanie Amerasinghe (Regional RUAF Coordinator)
By
Prof. J. M. U. K. Jayasinghe (Consultant on Monitoring & Evaluation)
&
Prof. S. J. B. A. Jayasekara (MSF Facilitator of the Project)
Faculty of Agriculture & Plantation Management
Wayamba University of Sri Lanka Makandura, Gonawila (NWP)
Final Report - Monitoring and Evaluation of the Innovation Project, Gampaha, Sri Lanka (March 2010 – April 2011)
2
INTRODUCTION Monitoring and Evaluation (M&E) is a management tool that helps to: (a) measure progress and to obtain indications how a project may improve its strategies; (b) to stimulate the participatory and learning process and to enhance the capacity of the participants to observe, analyse, reflect and take decisions and action; (c) to increase accountability to partners, beneficiaries, policymakers and funding organisations on the relevancy, effectiveness and cost efficiency of the programme, and (d) to enable decisions about the continuation of the programme.
Monitoring refers to a continuous process of collection of information about the performance of the project. Evaluation refers to the interpretation and judgement of the collected information in order identify the extent to which the project realises its planned objectives (results) and the effectiveness and cost efficiency of the strategies applied.
In the case of Monitoring and Evaluation of the RUAF-FStT project, the following THREE Modes are in use:
1. Built-in Monitoring – process documentation and systematisation in all main activities that implemented by the RUAF and their Local Partners, a monitoring component will be built in, in order to measure progress, document the process and outputs or direct results of the activities implemented, to enable a joint learning process among those actively involved in the preparation and implementation of the local FStT innovation projects or in the upgrading and implementation of the “City Strategic Agenda on Urban Agriculture” and to improve the strategies and working methods of the FStT programme and to create an information base for evaluation in a later stage.
2. Outcome Mapping – method to monitor the changes in the behaviour of the people, groups
and organizations with whom the FStT programme works directly and that whose capacities, policies, programmes that project wants to influence.
3. Impact Monitoring – is “monitoring of what the impacts of the RUAF-FStT programme on the
urban producer households”. There was an already developed specific Impact Monitoring (IM) methodology for purpose of monitoring and evaluation of the impact of the FStT innovation projects.
The role of Consultants appointed by the IWMI was to undertake the Mode 3 – “Impact Monitoring” explained above according to the specific guidelines provided in the RUAF Manual (please refer to Phase 4 – Project Implementation and Monitoring). The “Expected Results” and “Role of Consultants” of the M&E study is highlighted in Annex 1 extracted from the RUAF Manual. As per RUAF Manual, we are supposed to utilize the following Monitoring Tools for this purpose (details on each are given below):
(1) Household registration on income and expenditure (2) Registration of home consumption of food produced (3) Semi-structured household interviews (4) Focus-group discussions (5) Field observations (6) Gender tools (e.g. Decision Making Matrix)
Empirically, the whole process of Impact Monitoring was planned to have 12 rounds of collection of data from a representative sample of 75 households participated to the RUAF – FStT program in Gampaha Municipal Council area from March 2010 to April 2011, Two Graduate Research Assistants (GRAs) were appointed to proceed with collection and coding of primary data and the RUAF-FStT Regional Coach in Gampaha has extended her fullest support throughout this process to make sure that entire M&E process is in order.
1. ORGANIZING AND METHODOLOGY
Final Report - Monitoring and Evaluation of the Innovation Project, Gampaha, Sri Lanka (March 2010 – April 2011)
3
1.1 The activities and methodology applied
Impact monitoring workshop
The first step towards the M&E of this project was, and as specified in the M&E Manual provided by the RUAF for the FStT project, to have an “Impact Monitoring Workshop” to discuss about the, amongst the other things: (a) Work plan of the M&E process; (b) Preparation of relevant formats to collect data; (c) Training of data enumerators, and (d) Data coding and analysis techniques etc. This workshop was held on 12
October 2009 at the Faculty of Agriculture & Plantation Management
(FAPM) of the Wayamba University of Sri Lanka (WUSL) (Makandura premises) with the participation of Prof. S. J. B. A. Jayasekara (Dept. of Horticulture & Landscape Gardening) and Prof. U. K. Jayasinghe-Mudalige (Dept. of Agribusiness Management) [i.e. the Senior University Academics appointed as the M&E Consultants] and Mr. C. G. Yadave (RUAF-FStT Regional Coach – India); Mr. K. B. Suleman (KIM Officer), and Ms. K. M. A. Wijenayake (RUAF-FStT Regional Coach - Gampaha). Development of monitoring plans and tools, interview guidelines and data recording formats
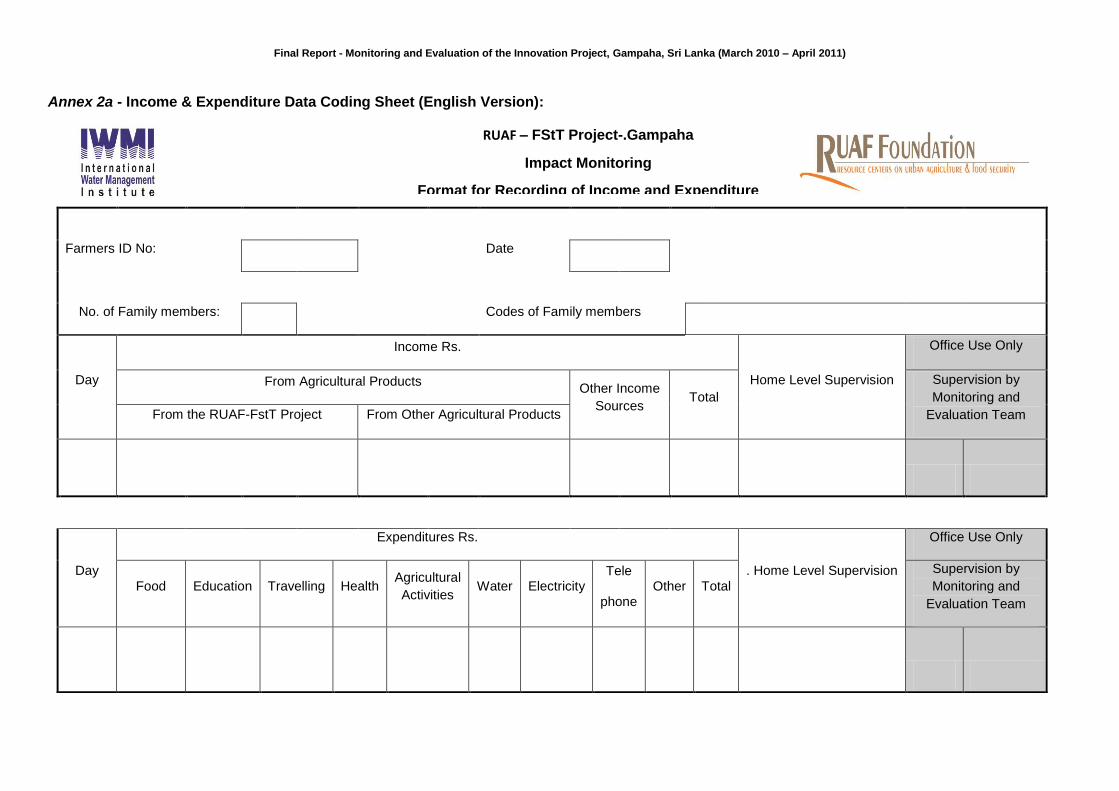
The guidelines specified in the “RUAF-FStT Monitoring & Evaluation Manual” were followed to develop the monitoring and evaluation plan and tools, data recording formats and interview guidelines listed above, which must be designed to facilitate “self-registration” of relevant information by the households selected to the study on daily basis and the preliminary formats that can be used with appropriate adjustments were provided in the RUAF-FStT manual. The data collection process was characterised by pre-approved Work Plan by the RUAF Regional Co-ordinator. One such Data Coding Sheet (DCS) was designed to collect primary data with regard to “Household Food Consumption” during one full week (of a given month). Here, the respondents were requested to record all the food items that they consume in a day from the morning to night separately (i.e. break-fast, lunch, dinner and other). They were requested to fill both the “type” of food as well as the “quantity” consumed in the DCS using their own units of measurements, for example cups, tins, spoons etc. Given that 100% of households included in the sample comprised of “Sinhala” speaking households, the standard DCS prepared in English using the MS Word was translated into “Sinhala” language (see, Annex 2 - “Food Consumption Data Coding Sheet”) [both in English and Sinhala]. Another Data Coding Sheet was designed to collect primary data with regard to “Income and Expenditure” of the household. As per the M&E Manual, we need to develop this specific DCS to collect information with regard to two distinguish categories of household income (HHI), namely: (1) “income from agriculture”, and (2) “income from other sources”. The “income from agriculture” was further divided into two categories, namely: (1.1) “income generated from RUAF- FStT project”, and (1.2) “income generation from other agricultural activities”. It was designed to record the data pertaining to the household expenditure on a given day of a week with respect to several specific categories, including: (i) food; (ii) agricultural production; (iii) education; (iv) health; (v) travelling; (vi) water, electricity and telephones, and (vii) any other. Each type of expenditure was, in turn, reported in a separate column of the DCS and it was set to include data from seven consecutive days of the week (i.e. Day 1 to Day 7). This DCS was also translated into “Sinhala” (see, Annex 3 - “Income and Expenditure Data Coding Sheet”). To facilitate an effective use of these two DCS, an “Instruction Sheet” explaining the ways and means a given household should fill respective DCS was also prepared in both English (for official purposes) and Sinhala (to be used with UAPs (see, Annex 4 - “Instruction Sheet”). In addition to these several other DCS and Interview Guidelines were formulated to facilitate Focus Group Discussions and Semi-Structured Interviews scheduled with the UAPs (see below).
Final Report - Monitoring and Evaluation of the Innovation Project, Gampaha, Sri Lanka (March 2010 – April 2011)
4
Training of data enumerators and testing of procedures and formats
Two data enumerators (DE) were selected for the project and both of them are B.Sc. (Agriculture) graduates of the FAPM, WUSL and specialized on Horticulture and Landscape Gardening. They were provided with an extensive training on the work plan of the M&E study and on the duties that they have to undertake throughout the project. Both DCS (i.e. Food consumption and Income & expenditure) were piloted in April 2010 for a one week period using the members from five households participated in the RUAF-FStT project in Gampaha. Both Consultants to the project and the DEs participated in this process and DEs were trained on all aspects in related to collection of data on consumption, income and expenditure patterns etc. The data from these two DCS were then coded in two specific MS Excel Data Coding Sheets develop for this purpose
1. The final DCS were printed in two distinct colours (attached to the
hard copy) so that once they are kept in a distinct place in a household, potential members in the households can identify the status easily and record the respective data accurately without any hassle.
Sampling and household selection
To facilitate collection of valid and reliable data from each household participated to the study over a period of one year; the entire study was divided into two Phases, namely: (1) Phase I, and (2) Phase II. Each phase comprises of 6 rounds (i.e. R1 to R6 in Phase I and R7 to R12 in Phase II) and each round is characterized by seven consecutive days. The “Visiting Schedule” shown in Annex 5 was adopted to collect data. This shows that almost all the days of a month (i.e. 1
st to 31
st) are covered at
least one time by the end of the 4th round (i.e. 4 rounds x 7 days = 28 days) and R5 and R6 were set
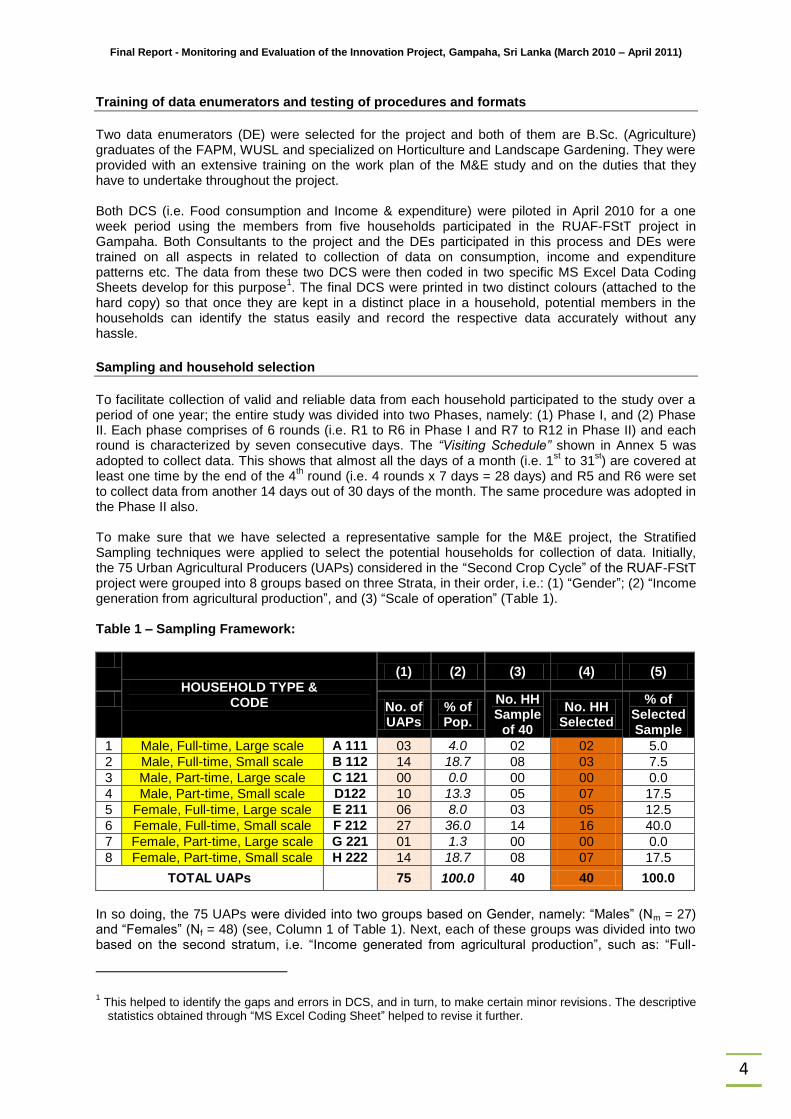
to collect data from another 14 days out of 30 days of the month. The same procedure was adopted in the Phase II also. To make sure that we have selected a representative sample for the M&E project, the Stratified Sampling techniques were applied to select the potential households for collection of data. Initially, the 75 Urban Agricultural Producers (UAPs) considered in the “Second Crop Cycle” of the RUAF-FStT project were grouped into 8 groups based on three Strata, in their order, i.e.: (1) “Gender”; (2) “Income generation from agricultural production”, and (3) “Scale of operation” (Table 1). Table 1 – Sampling Framework:
HOUSEHOLD TYPE & CODE
(1) (2) (3) (4) (5)
No. of UAPs
% of Pop.
No. HH Sample
of 40
No. HH Selected
% of Selected Sample
1 Male, Full-time, Large scale A 111 03 4.0 02 02 5.0
2 Male, Full-time, Small scale B 112 14 18.7 08 03 7.5
3 Male, Part-time, Large scale C 121 00 0.0 00 00 0.0
4 Male, Part-time, Small scale D122 10 13.3 05 07 17.5
5 Female, Full-time, Large scale E 211 06 8.0 03 05 12.5
6 Female, Full-time, Small scale F 212 27 36.0 14 16 40.0
7 Female, Part-time, Large scale G 221 01 1.3 00 00 0.0
8 Female, Part-time, Small scale H 222 14 18.7 08 07 17.5
TOTAL UAPs 75 100.0 40 40 100.0
In so doing, the 75 UAPs were divided into two groups based on Gender, namely: “Males” (Nm = 27) and “Females” (Nf = 48) (see, Column 1 of Table 1). Next, each of these groups was divided into two based on the second stratum, i.e. “Income generated from agricultural production”, such as: “Full-
1 This helped to identify the gaps and errors in DCS, and in turn, to make certain minor revisions. The descriptive
statistics obtained through “MS Excel Coding Sheet” helped to revise it further.
Final Report - Monitoring and Evaluation of the Innovation Project, Gampaha, Sri Lanka (March 2010 – April 2011)
5
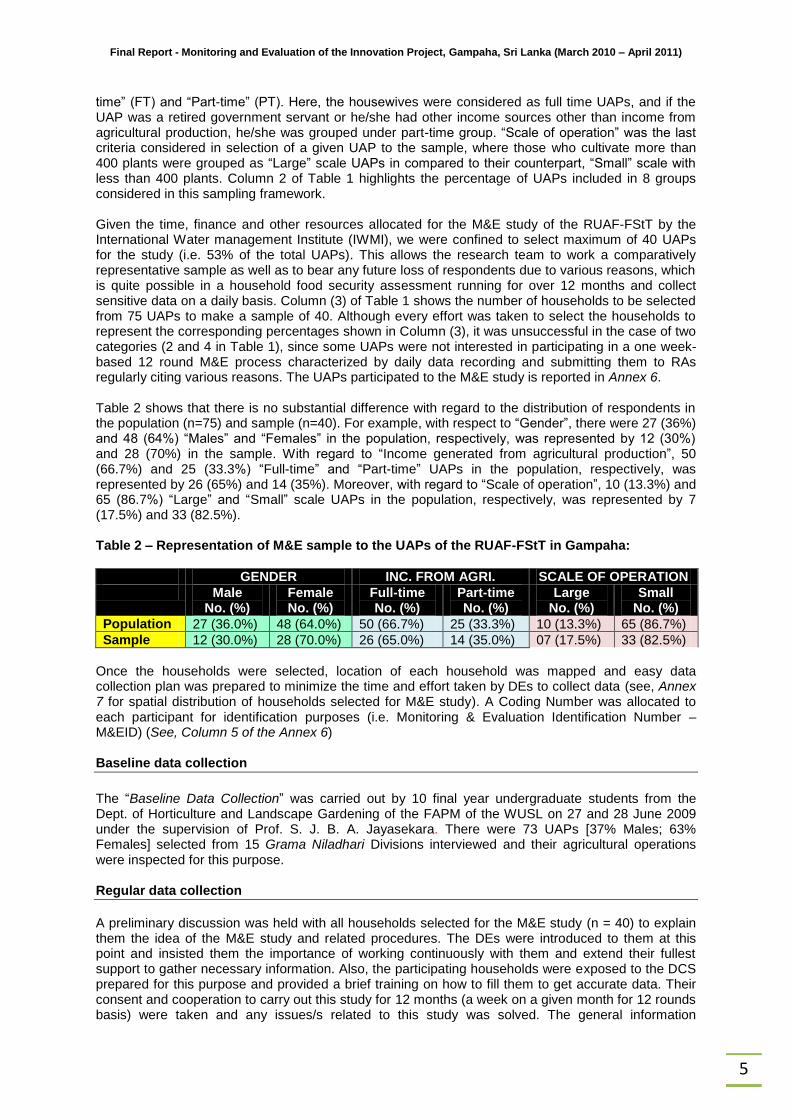
time” (FT) and “Part-time” (PT). Here, the housewives were considered as full time UAPs, and if the UAP was a retired government servant or he/she had other income sources other than income from agricultural production, he/she was grouped under part-time group. “Scale of operation” was the last criteria considered in selection of a given UAP to the sample, where those who cultivate more than 400 plants were grouped as “Large” scale UAPs in compared to their counterpart, “Small” scale with less than 400 plants. Column 2 of Table 1 highlights the percentage of UAPs included in 8 groups considered in this sampling framework. Given the time, finance and other resources allocated for the M&E study of the RUAF-FStT by the International Water management Institute (IWMI), we were confined to select maximum of 40 UAPs for the study (i.e. 53% of the total UAPs). This allows the research team to work a comparatively representative sample as well as to bear any future loss of respondents due to various reasons, which is quite possible in a household food security assessment running for over 12 months and collect sensitive data on a daily basis. Column (3) of Table 1 shows the number of households to be selected from 75 UAPs to make a sample of 40. Although every effort was taken to select the households to represent the corresponding percentages shown in Column (3), it was unsuccessful in the case of two categories (2 and 4 in Table 1), since some UAPs were not interested in participating in a one week-based 12 round M&E process characterized by daily data recording and submitting them to RAs regularly citing various reasons. The UAPs participated to the M&E study is reported in Annex 6. Table 2 shows that there is no substantial difference with regard to the distribution of respondents in the population (n=75) and sample (n=40). For example, with respect to “Gender”, there were 27 (36%) and 48 (64%) “Males” and “Females” in the population, respectively, was represented by 12 (30%) and 28 (70%) in the sample. With regard to “Income generated from agricultural production”, 50 (66.7%) and 25 (33.3%) “Full-time” and “Part-time” UAPs in the population, respectively, was represented by 26 (65%) and 14 (35%). Moreover, with regard to “Scale of operation”, 10 (13.3%) and 65 (86.7%) “Large” and “Small” scale UAPs in the population, respectively, was represented by 7 (17.5%) and 33 (82.5%). Table 2 – Representation of M&E sample to the UAPs of the RUAF-FStT in Gampaha:
GENDER INC. FROM AGRI. SCALE OF OPERATION
Male No. (%)
Female No. (%)
Full-time No. (%)
Part-time No. (%)
Large No. (%)
Small No. (%)
Population 27 (36.0%) 48 (64.0%) 50 (66.7%) 25 (33.3%) 10 (13.3%) 65 (86.7%)
Sample 12 (30.0%) 28 (70.0%) 26 (65.0%) 14 (35.0%) 07 (17.5%) 33 (82.5%)
Once the households were selected, location of each household was mapped and easy data collection plan was prepared to minimize the time and effort taken by DEs to collect data (see, Annex 7 for spatial distribution of households selected for M&E study). A Coding Number was allocated to each participant for identification purposes (i.e. Monitoring & Evaluation Identification Number – M&EID) (See, Column 5 of the Annex 6) Baseline data collection
The “Baseline Data Collection” was carried out by 10 final year undergraduate students from the Dept. of Horticulture and Landscape Gardening of the FAPM of the WUSL on 27 and 28 June 2009 under the supervision of Prof. S. J. B. A. Jayasekara. There were 73 UAPs [37% Males; 63% Females] selected from 15 Grama Niladhari Divisions interviewed and their agricultural operations were inspected for this purpose. Regular data collection
A preliminary discussion was held with all households selected for the M&E study (n = 40) to explain them the idea of the M&E study and related procedures. The DEs were introduced to them at this point and insisted them the importance of working continuously with them and extend their fullest support to gather necessary information. Also, the participating households were exposed to the DCS prepared for this purpose and provided a brief training on how to fill them to get accurate data. Their consent and cooperation to carry out this study for 12 months (a week on a given month for 12 rounds basis) were taken and any issues/s related to this study was solved. The general information
Final Report - Monitoring and Evaluation of the Innovation Project, Gampaha, Sri Lanka (March 2010 – April 2011)
6
pertaining to each household were gathered and verified and each person’s ability to participate in this study was evaluated. It was asked to work together to provide the M&E team a better and accurate set of data and remind each other to fill the DCS regularly. Data collection process at the household level followed the following steps:
At the first day of the selected week, the DEs have visited each household selected for the study and delivered the two DCS together with the Instruction Sheet.
A sample demonstration about filling the DCS was conducted at each and every household during the initial visit. Each UAP was instructed to register his/her daily food consumption and income and expenditure on the corresponding DCS, and one member amongst them (i.e. a member of the household with better education and time to deal with the DCS), to check on daily basis weather all members in his/her family has recorded all types of food items consumed with respective quantities and all sources of income received and expensed during the day correctly, and in turn, to paste a “sticker” provided by the M&E team on each DCS at the end of the each day.
The DEs visited each house under the M&E study in every other day during the selected week of data collection. The DEs tried, both in person and over the phone, with the members of the household to correct if certain data were missing due to reasons beyond the control of the participants (e.g. emergency, out-of-house) or ignorance (e.g. easy taking) and/or very unrealistic (e.g. cannot judge the measurements and values) etc. by discussing with the relevant members/s. Sometimes, the DE had to visit certain homes more frequently at the initial stages (i.e. every other day), if DEs realized that a particular household needs more training to fill these DCS correctly.
To avoid any confusion arising from standard measurement units, the UPAs were allowed to record their consumption amounts in their own units practiced by the household regularly (e.g. cups, tins, bottles, spoons etc.) and DE has inspected these “items / equipments” and converted those “locally” used measures into standard units / measurements by taking equivalents of which to the standard Measuring Cylinders and Table Balance.
Spread of data collection process over 12 rounds (i.e. 7 days x 12 weeks = 84 days) helped to identify various income sources (salary, income transfers) and expenses (utility bills, stationeries for school children, medical bills etc.) regularly occurred in a household over a period of one month, and if they were not recorded at the end of 4
th round (after collection
data pertaining to all 30 days of a month), DEs asked about them from the head of household to avoid possible ignorance, especially in the case of sources of income. The M&E team has prepared a list of potential income and expenditure that a typical household may come across in a given month to facilitate this process.
We had opportunity to participate several meetings arranged by the RUAF Regional Coordinator and the Regional Coach to discuss the progress of the project, on invitation and at various times. In addition, we had several informed and uninformed visits to the households of UAPs to inspect the data collection process. In addition to the routine visits by DEs to collect data on food consumption and income & expenditure, as specified in the RUAF Manual, we have conducted several Focus Group Discussions with selected major stakeholders to the project such as officials from Dept. of Agriculture and Agrarian Services etc. Following the guidelines given in the RUAF Manual, a Semi-Structured Interview (SSI) was carried out with members in each households participated to this study on 03
rd February 2011
2 with aid of several
DCS designed for that purpose (see below).
2 SSIs were organized in two locations in the Gampaha (i.e. Dambuwawaththa and Eksath Pedesa). A group of
experts on socio-economic and agronomic aspects in urban agriculture has participated under the supervision of Consultants to the M&E study, including: Prof. D. B. Kelaniyangoda, Dr. J. Edirisinghe, Dr. (Ms.) T. Athauda, Dr. (Mrs.) R. Abeynayake, Ms. J. M. M. Udugama, Mr. S. M. M. Ikram and Ms. D. R. R. W. Dissanayake from
Final Report - Monitoring and Evaluation of the Innovation Project, Gampaha, Sri Lanka (March 2010 – April 2011)
7
Data entry and control
The data collected from each household were coded into the predesigned coding sheets in MS-Excel simultaneously. The “home-based units” were used to record the data, more specifically on food consumption, were later converted into standard units
3 in the process of data coding. The food items
consumed by the households were categorized into several groups, including: cereal and grain legumes, milk, other animal products, vegetables, fruits and sweets. This information was used to get the amount of consumption of each of the above items per week. The frequency of consumption of vegetables, fruits and sweets etc. were calculated for each round separately. In the case of frequency of consumption of vegetables, it was categorized further into three groups, namely: (a) up-country; (b) low-country, and (c) seasonal vegetables. All the data included in DCS, including those used in the SSIs were coded into respective databases.
Data analysis and reporting
The primary data collected on consumption, income & expenditure were used to derive a number of other indicators related to which such as: Net income from agriculture; Share of agriculture related income in total overall income (absolute and relative); Share of food expenditures in total household expenditures (absolute and relative), and Total week income and expenditures as well as Monthly income/expenditure. Further, the consumption of cereals and grain legumes, animal products (except milk) and vegetables were interpreted as Average Daily Consumption per Person (in grams) and dairy products were interpreted as Average Daily Consumption per Person (in ml). Frequency of consumption of vegetables, leafy vegetables fruits and sweets were reported as Frequency of Average Weekly Consumption (in days). Accessibility to food items were taken by means of the Percentage of consumption of a given item in each round
4.
1.2 Lessons learnt and recommendations It is vital to look back at the shortcomings and lessons learnt throughout the M & E exercise to suggest recommendations to foster any further improvement. First and foremost, we must stress that this project itself can be considered a whole new experience not only to the UAPs in Gampaha, but also to the majority of members in the Project Management Team. The concept of Urban Agriculture is novel to many of them and all have undergone a systematic learning exercise to which the RUAF manual provided very good assistance. The RUAF manual can be considered a very detailed and accurately written document that helped to keep all stakeholders to the project in line and to do this M & E exercise systematically. I would say that, this whole exercise would if otherwise, have been subject to many failures in the management of the project. Where the data collection from the UAPs, which is a crucial component, is of concern, a vast majority of them had never undergone any kind of a survey nor had been on a systematic study that focuses on household food security and other important aspects such as health, nutrition, livelihood development, technology transfer, agricultural financing etc. Thus, as the DEs tried to involve with them to record data on regular basis, they faced with many challenges. It would have been best if the selected sample of UAPs to this M&E exercise could have been given a pre-study workshop to introduce them the study objectives, authorities involved, the research team, expected outcome, the benefits they would gain and most importantly the fact that the data are strictly confidential as it took some time and effort to convince the respondents that the data will not be given to any other party nor
the Faculty of Agriculture & Plantation Management, Wayamba University of Sri Lanka. Also, the RUAF Regional Coach Ms. K. M. A. Wijenayake and two Graduate Research Assistants, namely Ms. M. R. Y. Saumyapali and Ms. H. G. T. S Priyarshani participated.
3 Bread (1 loaf = 450g); String hoppers (80 =1 kg); Egg = 58g; Soya meat (1 Packet = 80g); Noodles (1 packet = 500g); Yoghurt / Ice cream (80ml); Banana (75g); Papaya (650g); Mango (165g).
4 Every action was taken to go by the specific indicators provided in the RUAF Manual, but given difficulties in collecting data from all households on a given issue for 12 rounds covering 12 month, at times, we have resolved to report the results using other valid and reliable indicators.
Final Report - Monitoring and Evaluation of the Innovation Project, Gampaha, Sri Lanka (March 2010 – April 2011)
8
disclosed to the neighbouring households. It also would give them the opportunity to clarify their problems as the DEs had to explain these facts to most of the household time to time which took considerable amount of time away from interview schedules. However, we must gratefully appreciate the support and cooperation extended throughout the study by individual household in their capacity to fulfil this task amidst their busy day to day routines. Anyone who intends to implement a similar project would be really benefitted, if a well planned baseline survey is conducted to get a clear idea about the producers, their assets, and their capacity to be retained in the project. Also, it is important to have an idea of the respondents’ attitude perception in the local context and extent of candidness to enumerators to make the data collection process effective and efficient. For example, majority were reluctant to state their real income, and thus, recording expenditure values as a proxy and indirectly converting that into income was practiced to avoid unreliable data. It is important to make the respondents aware of the data collection and recording through a Demonstration Workshop, in prior, as the DEs had to constantly remind and show how certain measurements are to be taken, why they are taken etc. Also the questions should be kept simple as most found it difficult to fill certain matrices and keep recordings systematically. Though the information collected through those pre-formatted Data Coding Sheets helped much to come up with strong conclusions, the collection of data to achieve thus was really a difficult task that consumed both money and time unnecessarily. Therefore, for any project with limited budget this kind of a procedure would not be possible and will have to be planned in a more “respondent-friendly” simpler manner for a more reliable outcome. The DEs tried, both in person and over the phone, with the members of the household to correct if certain data were missing due to reasons beyond the control of the participants (e.g. emergencies, out-of-house situations) or ignorance (e.g. less attention to instructions and negligence) and/or very unrealistic reasons (e.g. not being able to judge the measurements and values) etc. by discussing with the relevant participants. At times, the DE had to visit certain homes more frequently at the initial stages (i.e. every other day), if DEs realized that a particular household needs more training to fill these DCS correctly. For example if the UAPs paid their 2-3 months due bills at once and record as their expenditure for that particular day. To avoid this type mis-recording and duplications, general monthly expenditure on electricity, water, telephone, insurance, loans, tuition fee and monthly fixed income were separately recorded by DEs through family discussions. So, care must be taken, in a new project to forecast how much time that UAPs can contribute to this type of recording and participation for nearly a year. The crop of concern in the study was green chili. Thus recording of amounts consumed showed difficulties, as it is a condiment and is not eat as a curry vegetable hence is difficult to collect consumed amounts using the data recording sheets. Another limitation was that, evaluating the changes of food consumption and Income & Expenditure with minor crops (Green chillie) in small quantities does not show any visible effect. Also certain factors such as efficiency and effectiveness of the marketing channel, sustainability of the project which the project expects to identify cannot be well evaluated within a short time frame. Another challenge faced was to maintain continued interest of the UAPs for a period of one year. The DEs could see that producers were fed up with entering data continuously for a long period of time as they have to pay more attention on consumption and accurate entering on a daily basis for seven days for a round. And most producers did not like to spend more time on this. We strongly suggest some incentive scheme (i.e. provision of a household item at the beginning) for participation since many, very naturally, do not want to continue in data collection for a year if they do not see any short term benefit for participation over and above the non-participants. More attention could have been paid while selecting the sample of farmers to the study. It is easy to collect data from producers who have the ability of grasping, thus they actively participate to the project. If they find it difficult to get involved in the system they tend to leave during the project which is a failure. Training of UAPs to self map their own garden at the initial stage and middle of the each crop cycle was also an effective method to evaluate infrastructure development, sanitation and landscaping etc and many direct and indirect cost and benefits which cannot be captured through self recording of food consumption pattern, income and expenditure. Another challenge faced during the project was that some of the successful producers leave the association to start their own business after getting the guidance from the project and impact on those UAPs was unable to evaluate.
Final Report - Monitoring and Evaluation of the Innovation Project, Gampaha, Sri Lanka (March 2010 – April 2011)
9
Among the many benefits gained, most of the producers are very satisfied and requested for more workshops and trainings to update their knowledge. Many hope to continue UA practices sustainably. The producers were also aware on hygienic practices and waste management, recycling, compost production etc which helped them earn extra income as well. From an economic point of view, Gampaha, which is subject to the phenomenon of urbanization brings severe challenges to ensuring household food security in a context characterized by high rates of unemployment, overcrowding and environmental degradation. In addition, there are instances of poverty and food insecurity. Therefore many find the program as a sustainable alternative to food security and to the roaring food prices. They also see more potential in terms of access to consumer markets; potential agricultural-related jobs and incomes, availability of fresh food etc. For example it was seen that many who used to practice food sharing and barter system now opt to price their products and sell to the adjoining community as well. These producers have realized that intensive horticulture can be practiced on small plots, making efficient use of limited water and land resources i.e. use of used vehicle tires for growing and making a profit by selling carved tire-pots. They even tend to practice livestock rearing as the fertilizer for the plots can be made at home and they now find markets for these products as well. Therefore, it was evident that the project has given rise to many income potential strategies identified within them and the growers are self motivated from satisfaction earned. Last but not least, the success of this type of a project is undoubtedly depends on the effort of the DEs as they connect the project to the UAPs. Any inefficiency, lack of desire, free-riding and carelessness from their part would have a significant loss on the entire project. The success of this project is, for the most part, due to high commitment of Project Management Team, very specifically the Regional Coach in Gampaha and the DEs appointed to M&E project.
2 FINDINGS
2.1 Description of household characteristics
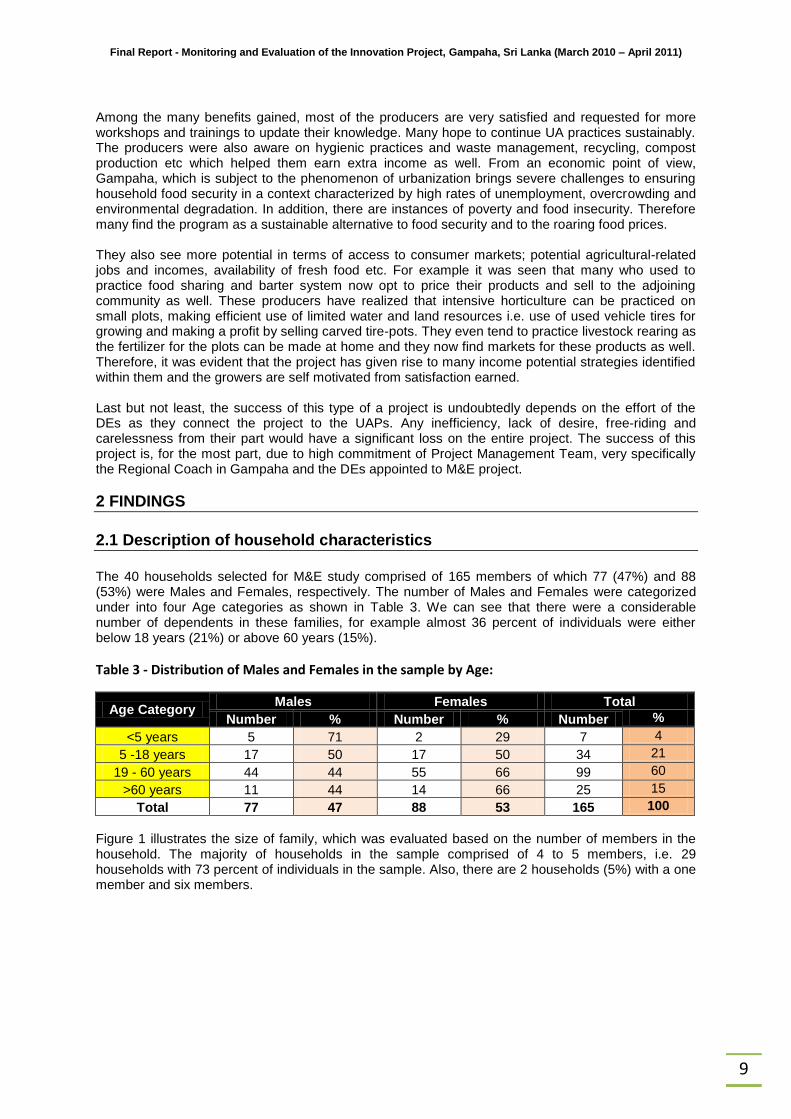
The 40 households selected for M&E study comprised of 165 members of which 77 (47%) and 88 (53%) were Males and Females, respectively. The number of Males and Females were categorized under into four Age categories as shown in Table 3. We can see that there were a considerable number of dependents in these families, for example almost 36 percent of individuals were either below 18 years (21%) or above 60 years (15%).
Table 3 - Distribution of Males and Females in the sample by Age:
Age Category Males Females Total
Number % Number % Number %
<5 years 5 71 2 29 7 4
5 -18 years 17 50 17 50 34 21
19 - 60 years 44 44 55 66 99 60
>60 years 11 44 14 66 25 15
Total 77 47 88 53 165 100
Figure 1 illustrates the size of family, which was evaluated based on the number of members in the household. The majority of households in the sample comprised of 4 to 5 members, i.e. 29 households with 73 percent of individuals in the sample. Also, there are 2 households (5%) with a one member and six members.
Final Report - Monitoring and Evaluation of the Innovation Project, Gampaha, Sri Lanka (March 2010 – April 2011)
10
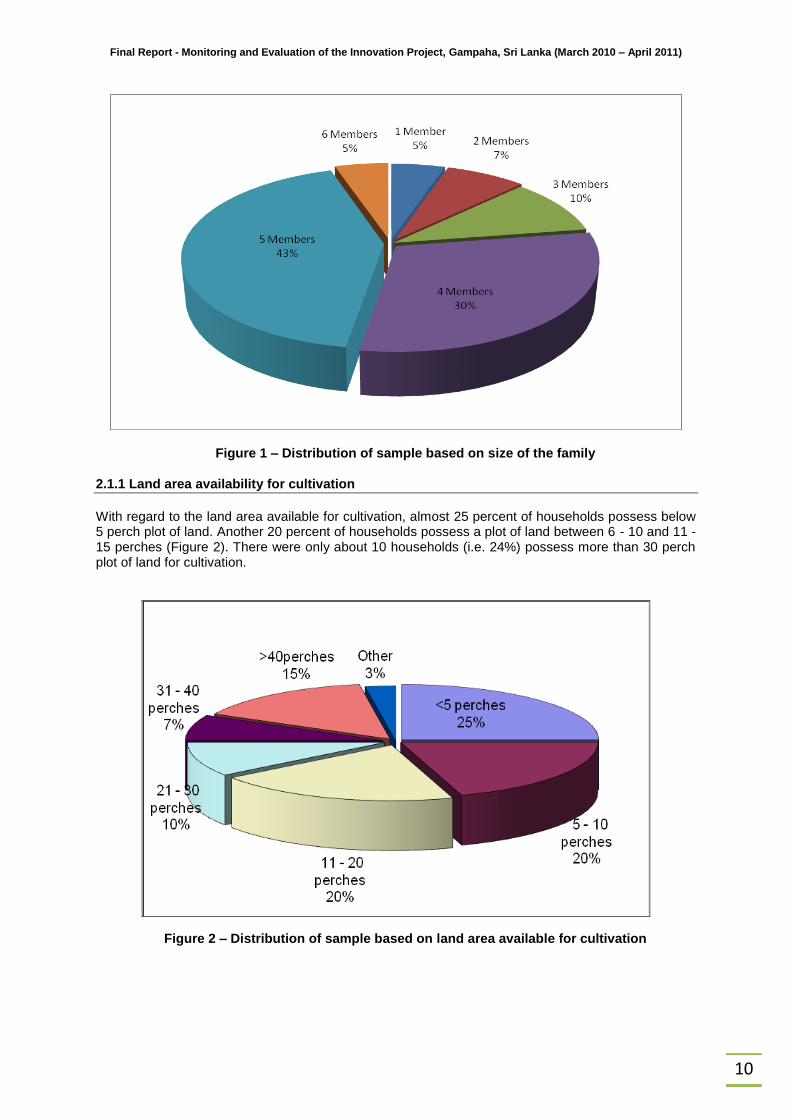
Figure 1 – Distribution of sample based on size of the family 2.1.1 Land area availability for cultivation
With regard to the land area available for cultivation, almost 25 percent of households possess below 5 perch plot of land. Another 20 percent of households possess a plot of land between 6 - 10 and 11 - 15 perches (Figure 2). There were only about 10 households (i.e. 24%) possess more than 30 perch plot of land for cultivation.
Figure 2 – Distribution of sample based on land area available for cultivation
Final Report - Monitoring and Evaluation of the Innovation Project, Gampaha, Sri Lanka (March 2010 – April 2011)
11
2.2 Impact analysis The “Monitoring Tools” expressed above, including: (1) registration of home consumption of food produced; (2) household registration on income and expenditure; (3) semi-structured household interviews (SSIs); (4) focus-group discussions (FGDs); (5) field observations, and (6) gender tools (i.e. decision making matrix) are used to present the outcome of analysis in terms of a number of issues, including: (a) changes in livelihood of urban producers; (b) enhanced sustainability of the UA production and marketing system; (c) gender mainstreaming, and (d) any other impacts (Annex 1).
2.2.1 Changes in livelihoods of urban producers
This section reports the outcome of analysis with respect UAPs access to food/diets, income, production and infrastructure as well as land and water etc. Under this, the project is aimed to achieve the targets specified in Annex 1 under the Expected Result 1 “Target for 2010”, i.e.: minimum 75% all households participated to the project register improvements in income and nutrition of 10-15%, and the remaining 25% register improvements of 5-10%, and 30% of these benefits accrue to women.
Enhanced access to food (improved diet)
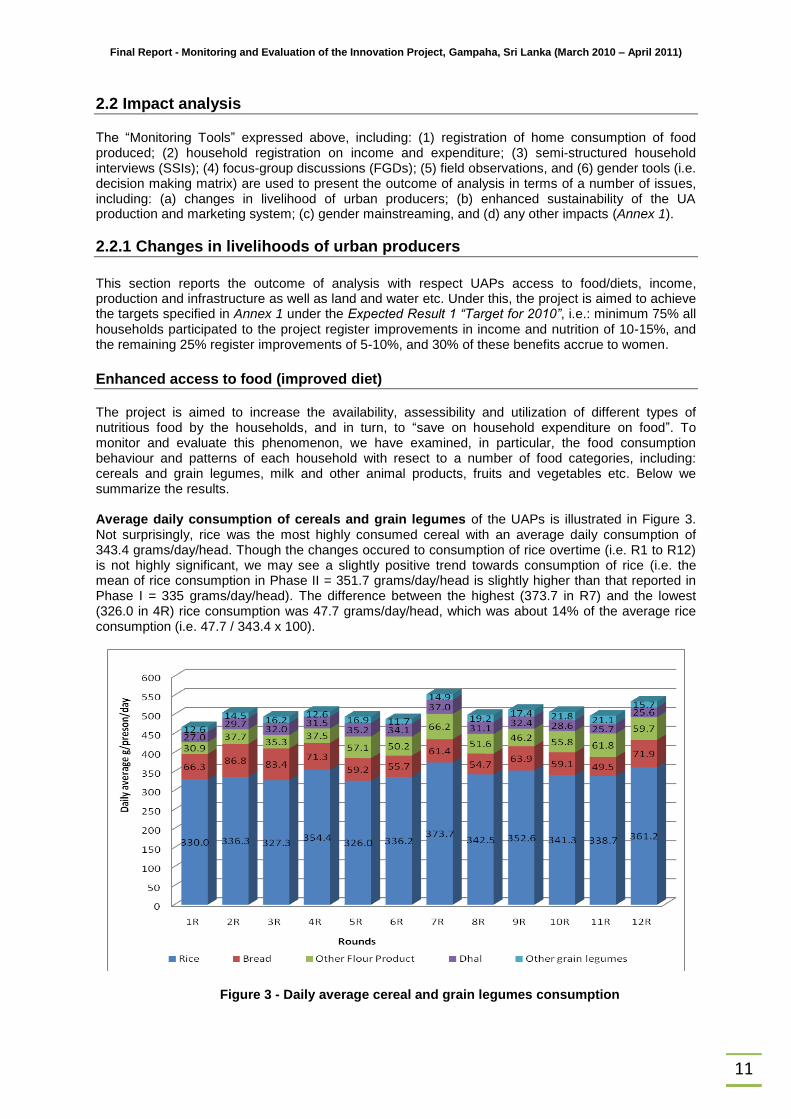
The project is aimed to increase the availability, assessibility and utilization of different types of nutritious food by the households, and in turn, to “save on household expenditure on food”. To monitor and evaluate this phenomenon, we have examined, in particular, the food consumption behaviour and patterns of each household with resect to a number of food categories, including: cereals and grain legumes, milk and other animal products, fruits and vegetables etc. Below we summarize the results. Average daily consumption of cereals and grain legumes of the UAPs is illustrated in Figure 3. Not surprisingly, rice was the most highly consumed cereal with an average daily consumption of 343.4 grams/day/head. Though the changes occured to consumption of rice overtime (i.e. R1 to R12) is not highly significant, we may see a slightly positive trend towards consumption of rice (i.e. the mean of rice consumption in Phase II = 351.7 grams/day/head is slightly higher than that reported in Phase I = 335 grams/day/head). The difference between the highest (373.7 in R7) and the lowest (326.0 in 4R) rice consumption was 47.7 grams/day/head, which was about 14% of the average rice consumption (i.e. 47.7 / 343.4 x 100).
Figure 3 - Daily average cereal and grain legumes consumption
Final Report - Monitoring and Evaluation of the Innovation Project, Gampaha, Sri Lanka (March 2010 – April 2011)
12
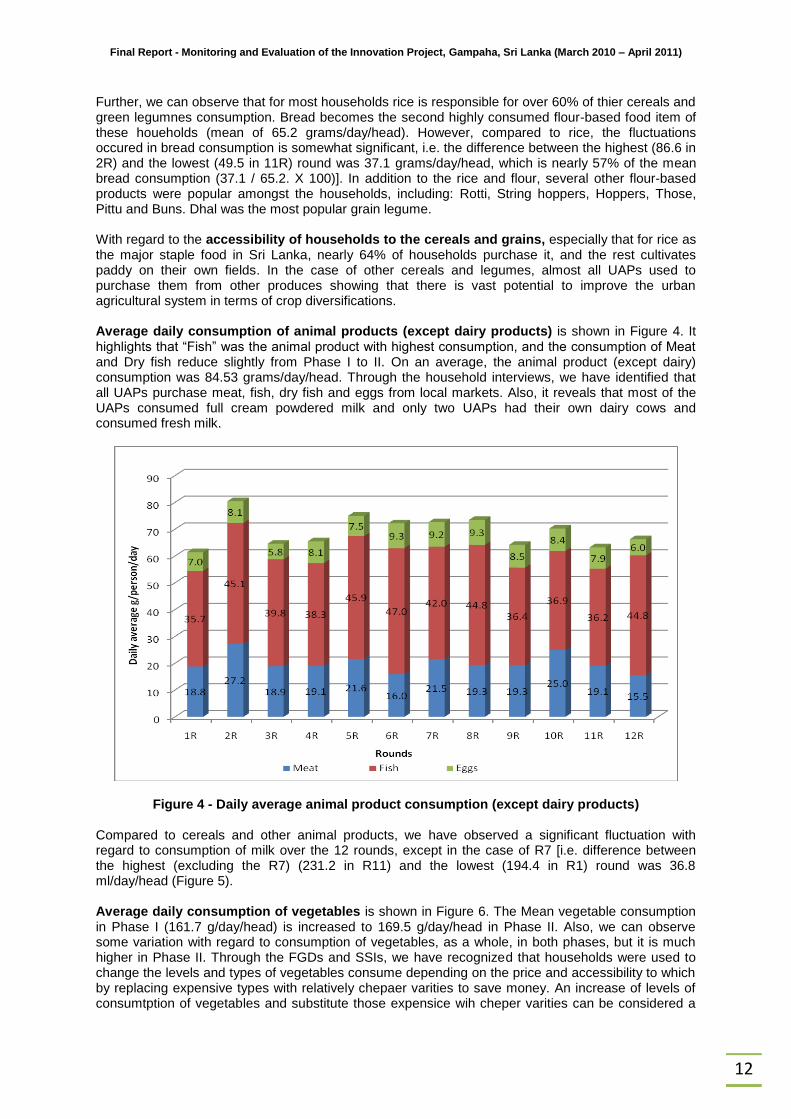
Further, we can observe that for most households rice is responsible for over 60% of thier cereals and green legumnes consumption. Bread becomes the second highly consumed flour-based food item of these houeholds (mean of 65.2 grams/day/head). However, compared to rice, the fluctuations occured in bread consumption is somewhat significant, i.e. the difference between the highest (86.6 in 2R) and the lowest (49.5 in 11R) round was 37.1 grams/day/head, which is nearly 57% of the mean bread consumption (37.1 / 65.2. X 100)]. In addition to the rice and flour, several other flour-based products were popular amongst the households, including: Rotti, String hoppers, Hoppers, Those, Pittu and Buns. Dhal was the most popular grain legume. With regard to the accessibility of households to the cereals and grains, especially that for rice as the major staple food in Sri Lanka, nearly 64% of households purchase it, and the rest cultivates paddy on their own fields. In the case of other cereals and legumes, almost all UAPs used to purchase them from other produces showing that there is vast potential to improve the urban agricultural system in terms of crop diversifications. Average daily consumption of animal products (except dairy products) is shown in Figure 4. It highlights that “Fish” was the animal product with highest consumption, and the consumption of Meat and Dry fish reduce slightly from Phase I to II. On an average, the animal product (except dairy) consumption was 84.53 grams/day/head. Through the household interviews, we have identified that all UAPs purchase meat, fish, dry fish and eggs from local markets. Also, it reveals that most of the UAPs consumed full cream powdered milk and only two UAPs had their own dairy cows and consumed fresh milk.
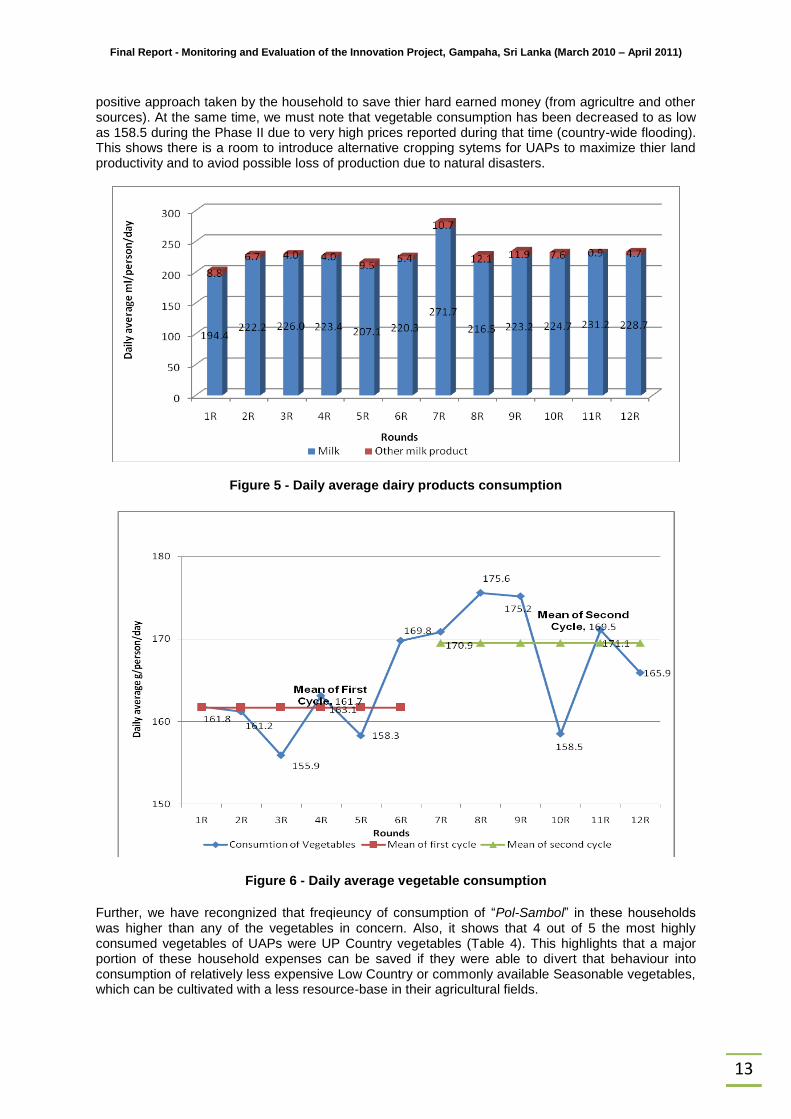
Figure 4 - Daily average animal product consumption (except dairy products) Compared to cereals and other animal products, we have observed a significant fluctuation with regard to consumption of milk over the 12 rounds, except in the case of R7 [i.e. difference between the highest (excluding the R7) (231.2 in R11) and the lowest (194.4 in R1) round was 36.8 ml/day/head (Figure 5). Average daily consumption of vegetables is shown in Figure 6. The Mean vegetable consumption in Phase I (161.7 g/day/head) is increased to 169.5 g/day/head in Phase II. Also, we can observe some variation with regard to consumption of vegetables, as a whole, in both phases, but it is much higher in Phase II. Through the FGDs and SSIs, we have recognized that households were used to change the levels and types of vegetables consume depending on the price and accessibility to which by replacing expensive types with relatively chepaer varities to save money. An increase of levels of consumtption of vegetables and substitute those expensice wih cheper varities can be considered a
Final Report - Monitoring and Evaluation of the Innovation Project, Gampaha, Sri Lanka (March 2010 – April 2011)
13
positive approach taken by the household to save thier hard earned money (from agricultre and other sources). At the same time, we must note that vegetable consumption has been decreased to as low as 158.5 during the Phase II due to very high prices reported during that time (country-wide flooding). This shows there is a room to introduce alternative cropping sytems for UAPs to maximize thier land productivity and to aviod possible loss of production due to natural disasters.
Figure 5 - Daily average dairy products consumption
Figure 6 - Daily average vegetable consumption
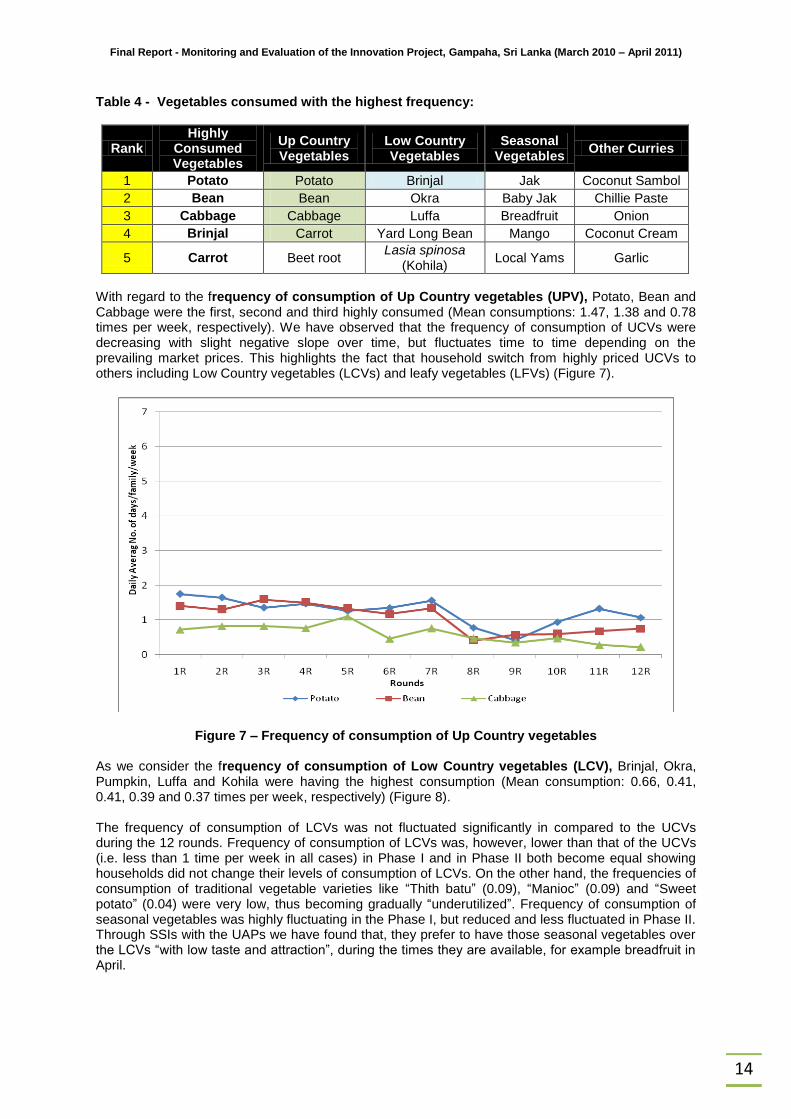
Further, we have recongnized that freqieuncy of consumption of “Pol-Sambol” in these households was higher than any of the vegetables in concern. Also, it shows that 4 out of 5 the most highly consumed vegetables of UAPs were UP Country vegetables (Table 4). This highlights that a major portion of these household expenses can be saved if they were able to divert that behaviour into consumption of relatively less expensive Low Country or commonly available Seasonable vegetables, which can be cultivated with a less resource-base in their agricultural fields.
Final Report - Monitoring and Evaluation of the Innovation Project, Gampaha, Sri Lanka (March 2010 – April 2011)
14
Table 4 - Vegetables consumed with the highest frequency:
Rank Highly
Consumed Vegetables
Up Country Vegetables
Low Country Vegetables
Seasonal Vegetables
Other Curries
1 Potato Potato Brinjal Jak Coconut Sambol
2 Bean Bean Okra Baby Jak Chillie Paste
3 Cabbage Cabbage Luffa Breadfruit Onion
4 Brinjal Carrot Yard Long Bean Mango Coconut Cream
5 Carrot Beet root Lasia spinosa
(Kohila) Local Yams Garlic
With regard to the frequency of consumption of Up Country vegetables (UPV), Potato, Bean and Cabbage were the first, second and third highly consumed (Mean consumptions: 1.47, 1.38 and 0.78 times per week, respectively). We have observed that the frequency of consumption of UCVs were decreasing with slight negative slope over time, but fluctuates time to time depending on the prevailing market prices. This highlights the fact that household switch from highly priced UCVs to others including Low Country vegetables (LCVs) and leafy vegetables (LFVs) (Figure 7).
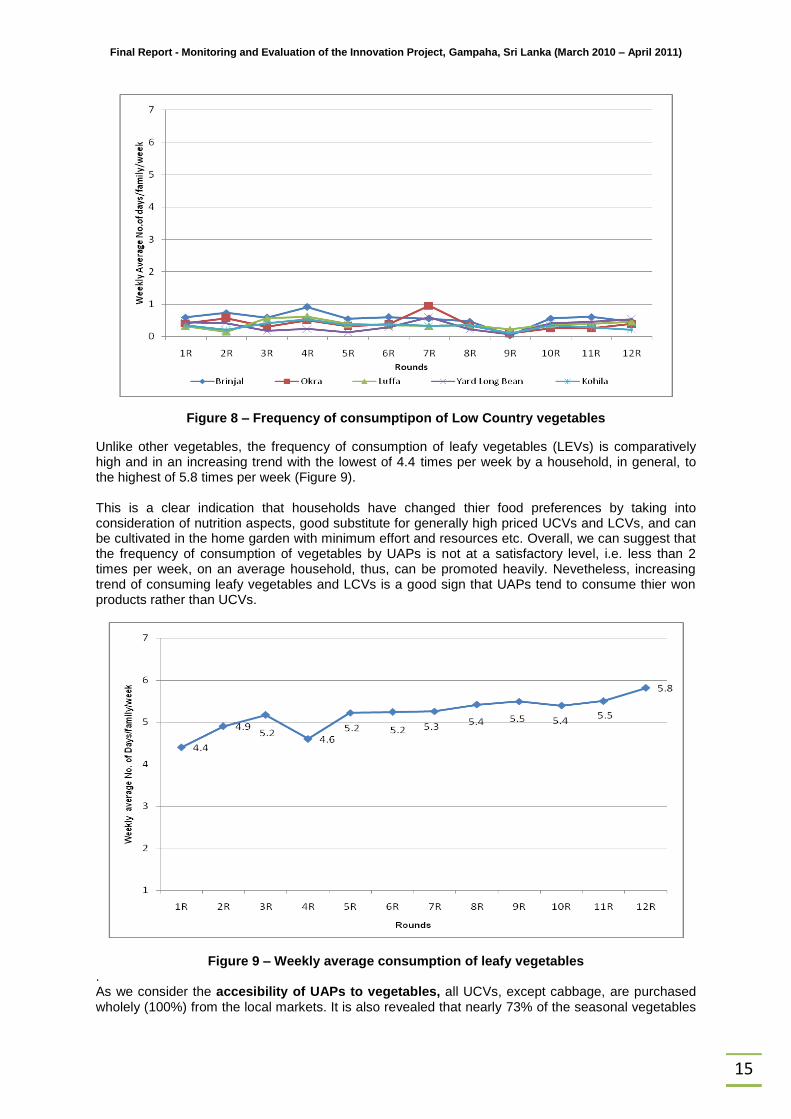
Figure 7 – Frequency of consumption of Up Country vegetables As we consider the frequency of consumption of Low Country vegetables (LCV), Brinjal, Okra, Pumpkin, Luffa and Kohila were having the highest consumption (Mean consumption: 0.66, 0.41, 0.41, 0.39 and 0.37 times per week, respectively) (Figure 8). The frequency of consumption of LCVs was not fluctuated significantly in compared to the UCVs during the 12 rounds. Frequency of consumption of LCVs was, however, lower than that of the UCVs (i.e. less than 1 time per week in all cases) in Phase I and in Phase II both become equal showing households did not change their levels of consumption of LCVs. On the other hand, the frequencies of consumption of traditional vegetable varieties like “Thith batu” (0.09), “Manioc” (0.09) and “Sweet potato” (0.04) were very low, thus becoming gradually “underutilized”. Frequency of consumption of seasonal vegetables was highly fluctuating in the Phase I, but reduced and less fluctuated in Phase II. Through SSIs with the UAPs we have found that, they prefer to have those seasonal vegetables over the LCVs “with low taste and attraction”, during the times they are available, for example breadfruit in April.
Final Report - Monitoring and Evaluation of the Innovation Project, Gampaha, Sri Lanka (March 2010 – April 2011)
15
Figure 8 – Frequency of consumptipon of Low Country vegetables
Unlike other vegetables, the frequency of consumption of leafy vegetables (LEVs) is comparatively high and in an increasing trend with the lowest of 4.4 times per week by a household, in general, to the highest of 5.8 times per week (Figure 9). This is a clear indication that households have changed thier food preferences by taking into consideration of nutrition aspects, good substitute for generally high priced UCVs and LCVs, and can be cultivated in the home garden with minimum effort and resources etc. Overall, we can suggest that the frequency of consumption of vegetables by UAPs is not at a satisfactory level, i.e. less than 2 times per week, on an average household, thus, can be promoted heavily. Nevetheless, increasing trend of consuming leafy vegetables and LCVs is a good sign that UAPs tend to consume thier won products rather than UCVs.
Figure 9 – Weekly average consumption of leafy vegetables . As we consider the accesibility of UAPs to vegetables, all UCVs, except cabbage, are purchased wholely (100%) from the local markets. It is also revealed that nearly 73% of the seasonal vegetables
Final Report - Monitoring and Evaluation of the Innovation Project, Gampaha, Sri Lanka (March 2010 – April 2011)
16
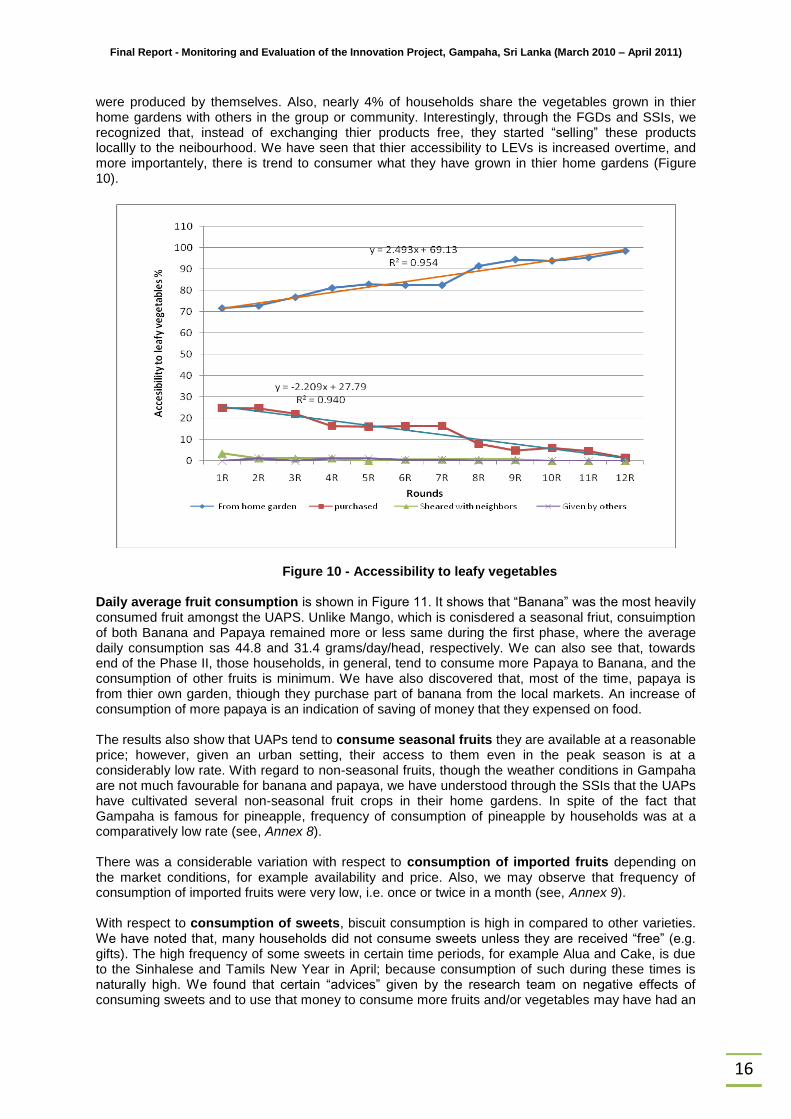
were produced by themselves. Also, nearly 4% of households share the vegetables grown in thier home gardens with others in the group or community. Interestingly, through the FGDs and SSIs, we recognized that, instead of exchanging thier products free, they started “selling” these products locallly to the neibourhood. We have seen that thier accessibility to LEVs is increased overtime, and more importantely, there is trend to consumer what they have grown in thier home gardens (Figure 10).
Figure 10 - Accessibility to leafy vegetables
Daily average fruit consumption is shown in Figure 11. It shows that “Banana” was the most heavily consumed fruit amongst the UAPS. Unlike Mango, which is conisdered a seasonal friut, consuimption of both Banana and Papaya remained more or less same during the first phase, where the average daily consumption sas 44.8 and 31.4 grams/day/head, respectively. We can also see that, towards end of the Phase II, those households, in general, tend to consume more Papaya to Banana, and the consumption of other fruits is minimum. We have also discovered that, most of the time, papaya is from thier own garden, thiough they purchase part of banana from the local markets. An increase of consumption of more papaya is an indication of saving of money that they expensed on food. The results also show that UAPs tend to consume seasonal fruits they are available at a reasonable price; however, given an urban setting, their access to them even in the peak season is at a considerably low rate. With regard to non-seasonal fruits, though the weather conditions in Gampaha are not much favourable for banana and papaya, we have understood through the SSIs that the UAPs have cultivated several non-seasonal fruit crops in their home gardens. In spite of the fact that Gampaha is famous for pineapple, frequency of consumption of pineapple by households was at a comparatively low rate (see, Annex 8). There was a considerable variation with respect to consumption of imported fruits depending on the market conditions, for example availability and price. Also, we may observe that frequency of consumption of imported fruits were very low, i.e. once or twice in a month (see, Annex 9).
With respect to consumption of sweets, biscuit consumption is high in compared to other varieties. We have noted that, many households did not consume sweets unless they are received “free” (e.g. gifts). The high frequency of some sweets in certain time periods, for example Alua and Cake, is due to the Sinhalese and Tamils New Year in April; because consumption of such during these times is naturally high. We found that certain “advices” given by the research team on negative effects of consuming sweets and to use that money to consume more fruits and/or vegetables may have had an
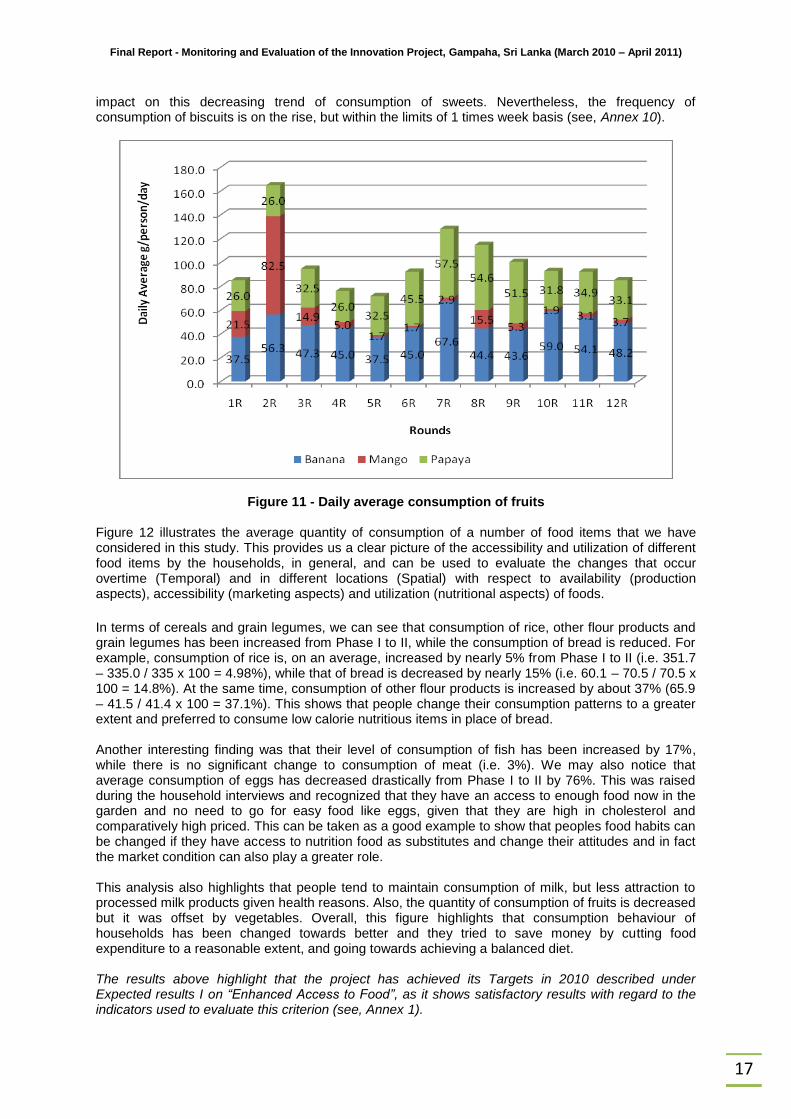
Final Report - Monitoring and Evaluation of the Innovation Project, Gampaha, Sri Lanka (March 2010 – April 2011)
17
impact on this decreasing trend of consumption of sweets. Nevertheless, the frequency of consumption of biscuits is on the rise, but within the limits of 1 times week basis (see, Annex 10).
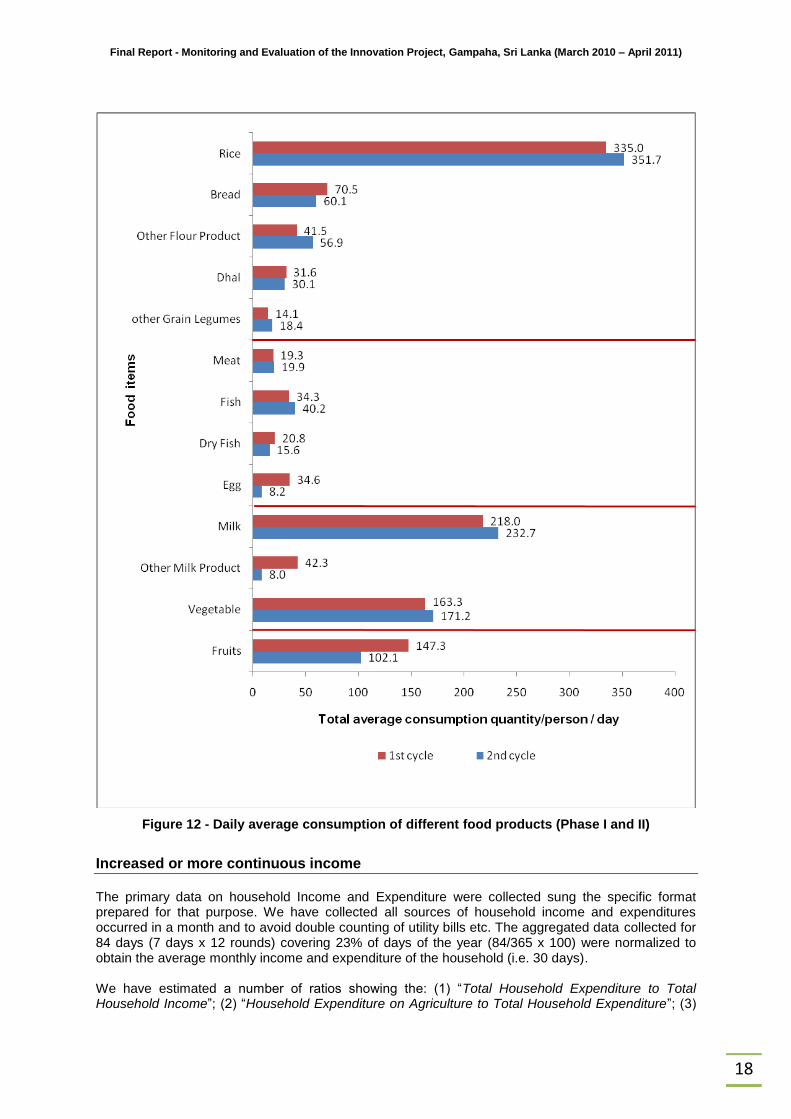
Figure 11 - Daily average consumption of fruits Figure 12 illustrates the average quantity of consumption of a number of food items that we have considered in this study. This provides us a clear picture of the accessibility and utilization of different food items by the households, in general, and can be used to evaluate the changes that occur overtime (Temporal) and in different locations (Spatial) with respect to availability (production aspects), accessibility (marketing aspects) and utilization (nutritional aspects) of foods.
In terms of cereals and grain legumes, we can see that consumption of rice, other flour products and grain legumes has been increased from Phase I to II, while the consumption of bread is reduced. For example, consumption of rice is, on an average, increased by nearly 5% from Phase I to II (i.e. 351.7 – 335.0 / 335 x 100 = 4.98%), while that of bread is decreased by nearly 15% (i.e. 60.1 – 70.5 / 70.5 x 100 = 14.8%). At the same time, consumption of other flour products is increased by about 37% (65.9 – 41.5 / 41.4 x 100 = 37.1%). This shows that people change their consumption patterns to a greater extent and preferred to consume low calorie nutritious items in place of bread. Another interesting finding was that their level of consumption of fish has been increased by 17%, while there is no significant change to consumption of meat (i.e. 3%). We may also notice that average consumption of eggs has decreased drastically from Phase I to II by 76%. This was raised during the household interviews and recognized that they have an access to enough food now in the garden and no need to go for easy food like eggs, given that they are high in cholesterol and comparatively high priced. This can be taken as a good example to show that peoples food habits can be changed if they have access to nutrition food as substitutes and change their attitudes and in fact the market condition can also play a greater role. This analysis also highlights that people tend to maintain consumption of milk, but less attraction to processed milk products given health reasons. Also, the quantity of consumption of fruits is decreased but it was offset by vegetables. Overall, this figure highlights that consumption behaviour of households has been changed towards better and they tried to save money by cutting food expenditure to a reasonable extent, and going towards achieving a balanced diet. The results above highlight that the project has achieved its Targets in 2010 described under Expected results I on “Enhanced Access to Food”, as it shows satisfactory results with regard to the indicators used to evaluate this criterion (see, Annex 1).
Final Report - Monitoring and Evaluation of the Innovation Project, Gampaha, Sri Lanka (March 2010 – April 2011)
18
Figure 12 - Daily average consumption of different food products (Phase I and II)
Increased or more continuous income
The primary data on household Income and Expenditure were collected sung the specific format prepared for that purpose. We have collected all sources of household income and expenditures occurred in a month and to avoid double counting of utility bills etc. The aggregated data collected for 84 days (7 days x 12 rounds) covering 23% of days of the year (84/365 x 100) were normalized to obtain the average monthly income and expenditure of the household (i.e. 30 days). We have estimated a number of ratios showing the: (1) “Total Household Expenditure to Total Household Income”; (2) “Household Expenditure on Agriculture to Total Household Expenditure”; (3)
Final Report - Monitoring and Evaluation of the Innovation Project, Gampaha, Sri Lanka (March 2010 – April 2011)
19
“Total Household Income from Agriculture to Total Household Income”, and (4) “Total Household Expenditure on Food to Total Household Expenditure”. Table 5 summarises the Mean, Standard Deviation (SD) and Coefficient of Variation (CV)
5 of these ratios.
Table 5 – Mean, SD and CV of the selected expenditure and income ratios:
Total Expenditure
: Total Income
Total Expenditure from Agriculture : Total Expenditure
Food Expenditure:
Total Expenditure
Total Expenditure Agriculture : Total
Income from Agriculture
Total Income from
Agriculture / Total Income
Mean 0.52 0.08 0.47 1.17 0.16
SD Value 0.15 0.08 0.02 2.85 0.20
CV Value 30.03 106.0 4.43 244.15 125.63
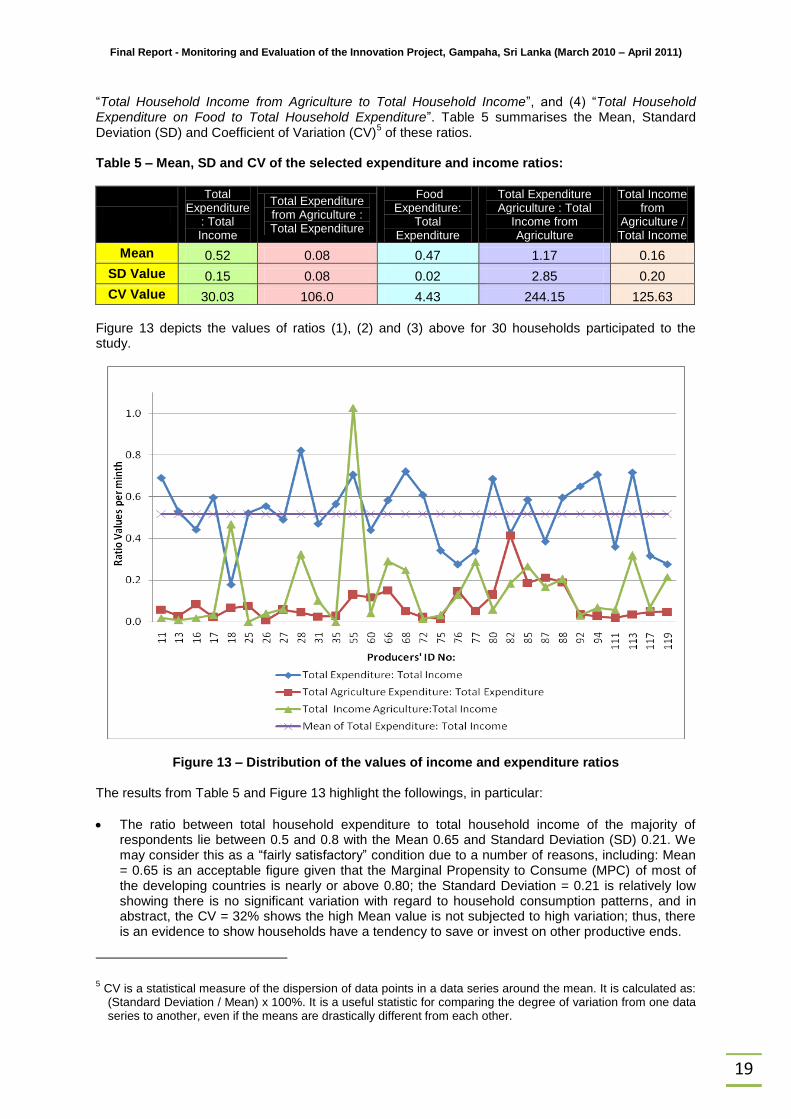
Figure 13 depicts the values of ratios (1), (2) and (3) above for 30 households participated to the study.
Figure 13 – Distribution of the values of income and expenditure ratios
The results from Table 5 and Figure 13 highlight the followings, in particular:
The ratio between total household expenditure to total household income of the majority of respondents lie between 0.5 and 0.8 with the Mean 0.65 and Standard Deviation (SD) 0.21. We may consider this as a “fairly satisfactory” condition due to a number of reasons, including: Mean = 0.65 is an acceptable figure given that the Marginal Propensity to Consume (MPC) of most of the developing countries is nearly or above 0.80; the Standard Deviation = 0.21 is relatively low showing there is no significant variation with regard to household consumption patterns, and in abstract, the CV = 32% shows the high Mean value is not subjected to high variation; thus, there is an evidence to show households have a tendency to save or invest on other productive ends.
5 CV is a statistical measure of the dispersion of data points in a data series around the mean. It is calculated as:
(Standard Deviation / Mean) x 100%. It is a useful statistic for comparing the degree of variation from one data series to another, even if the means are drastically different from each other.
Final Report - Monitoring and Evaluation of the Innovation Project, Gampaha, Sri Lanka (March 2010 – April 2011)
20
He total expenditure on agriculture of the UAPs in relation to their expenditure on other items is comparatively low. For the majority of cases, it was less than 0.1 and the value of which in all, except in one case, it lie below 0.15. This highlights the fact that households, in general, invest their income heavily on capital intensive technologies, but on other utilities not directly related to agriculture.
The ratio between the total household income from agriculture to total household income is also less than 0.2 for the majority of cases. We may expect such a situation in this sample, since the majority of UAPs are engaged in off-farm activities that generate the major part of their income. But, at the same time, we may notice that his ratio for most of the families is equal or above their total expenditure on agriculture in relation to their expenditure on other items considered above showing there exists a balance with respect to expenditure on agriculture and income from agriculture.
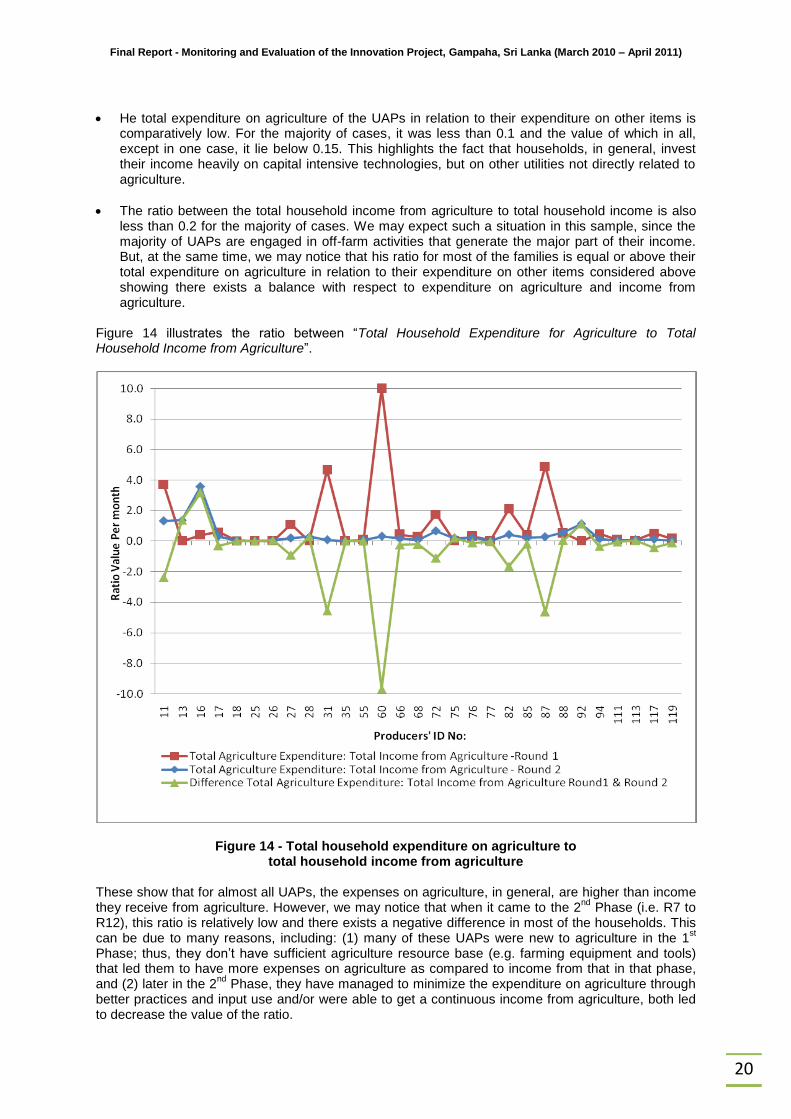
Figure 14 illustrates the ratio between “Total Household Expenditure for Agriculture to Total Household Income from Agriculture”.
Figure 14 - Total household expenditure on agriculture to total household income from agriculture
These show that for almost all UAPs, the expenses on agriculture, in general, are higher than income they receive from agriculture. However, we may notice that when it came to the 2
nd Phase (i.e. R7 to
R12), this ratio is relatively low and there exists a negative difference in most of the households. This can be due to many reasons, including: (1) many of these UAPs were new to agriculture in the 1
st
Phase; thus, they don’t have sufficient agriculture resource base (e.g. farming equipment and tools) that led them to have more expenses on agriculture as compared to income from that in that phase, and (2) later in the 2
nd Phase, they have managed to minimize the expenditure on agriculture through
better practices and input use and/or were able to get a continuous income from agriculture, both led to decrease the value of the ratio.
Final Report - Monitoring and Evaluation of the Innovation Project, Gampaha, Sri Lanka (March 2010 – April 2011)
21
We have stated the following hypothesis in order to test the positive changes occurred in the household with respect to each ratio:
1. “Total Expenditure to Total Income ratio” – this must be reduced over time, because UAPs would be able to save their expenditure on food items purchased as they involve with agricultural production and their income may be increased or be remained at the same level.
2. “Total Agriculture Expenditure to Total Expenditure ratio” – this must be increased to show
that UAPs invest more on agriculture overtime in compared to their investments on other (non-agricultural) items/utilities.
3. “Total Income from Agriculture to Total Income ratio” – this must be increased, because this is
an indication of expanding the marketing activities of UAPs, and they earn from what they cultivate in their plots.
4. “Total Expenditure on Agriculture to Total Income from Agriculture ratio” – this must be
decreased, as a wider gap between income from, and expenditure on, agriculture tells us that it has become profitable business over time.
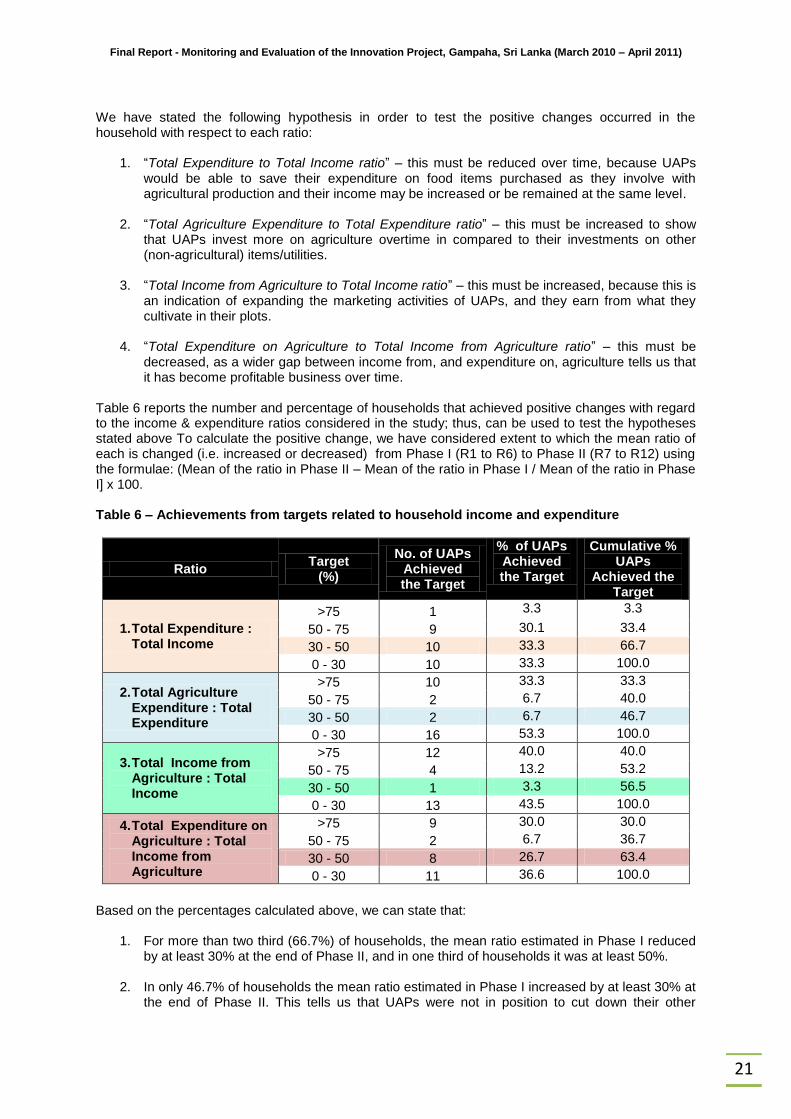
Table 6 reports the number and percentage of households that achieved positive changes with regard to the income & expenditure ratios considered in the study; thus, can be used to test the hypotheses stated above To calculate the positive change, we have considered extent to which the mean ratio of each is changed (i.e. increased or decreased) from Phase I (R1 to R6) to Phase II (R7 to R12) using the formulae: (Mean of the ratio in Phase II – Mean of the ratio in Phase I / Mean of the ratio in Phase I] x 100. Table 6 – Achievements from targets related to household income and expenditure
Ratio Target
(%)
No. of UAPs Achieved the Target
% of UAPs Achieved the Target
Cumulative % UAPs
Achieved the Target
1. Total Expenditure : Total Income
>75 1 3.3 3.3
50 - 75 9 30.1 33.4
30 - 50 10 33.3 66.7
0 - 30 10 33.3 100.0
2. Total Agriculture Expenditure : Total Expenditure
>75 10 33.3 33.3
50 - 75 2 6.7 40.0
30 - 50 2 6.7 46.7
0 - 30 16 53.3 100.0
3. Total Income from Agriculture : Total Income
>75 12 40.0 40.0
50 - 75 4 13.2 53.2
30 - 50 1 3.3 56.5
0 - 30 13 43.5 100.0
4. Total Expenditure on Agriculture : Total Income from Agriculture
>75 9 30.0 30.0
50 - 75 2 6.7 36.7
30 - 50 8 26.7 63.4
0 - 30 11 36.6 100.0
Based on the percentages calculated above, we can state that:
1. For more than two third (66.7%) of households, the mean ratio estimated in Phase I reduced by at least 30% at the end of Phase II, and in one third of households it was at least 50%.
2. In only 46.7% of households the mean ratio estimated in Phase I increased by at least 30% at the end of Phase II. This tells us that UAPs were not in position to cut down their other
Final Report - Monitoring and Evaluation of the Innovation Project, Gampaha, Sri Lanka (March 2010 – April 2011)
22
expenditure reasonably and/or increased their investments on agricultural production relatively. However, we can see that in about 33% of households this ratio was increased by 75% showing that they did heavy investments in agriculture.
3. In 56.5% of households the mean ratio estimated in Phase I was increased by at least 30% at the end of Phase II. Here too, similar to the previous case, we can see that in about 40% households this ratio was increased by 75% showing that they have expended their marketing of agricultural products considerably.
4. In 63.4% of households the mean ratio estimated in Phase I was decreased by at least 30% at the end of Phase II, and in nearly 30% of households it was over 75%..
These highlight that the project has achieved its Targets in 2010 described under Expected results I on “Increased or More Continuous Income”, as it shows satisfactory results with regard to all the indicators used to evaluate this criterion (see, Annex 1).
2.2.2 Enhanced sustainability of the UA production and marketing system The second key area dealt by the Consultants is to monitor the technical and organizational innovations realized in the production, processing and marketing systems of the involved urban producers, the degree in which these innovations effectively build on local resources, knowledge and institutions and improvements in the recycling of organic waste and waste water etc. (see, Expected Result 2 – Enhanced sustainability of the UA production and marketing system in Annex 1). The target for 2010 for this case was specified as: Minimum 65% all households (30% women) have adopted one or more of the innovations in their farming and marketing systems and all projects effectively use/built on local resources, technologies and institution. The major tools used to monitor these aspects include the Semi-structured interviews and Focus Group Discussions. We have used two specific data collection sheets to collect necessary information to evaluate these criteria to: (1) gather information on extent to which the project has an impact on the day-to-day life of the UAPs, and (2) evaluate the changes occurred in the production and marketing systems related to project over time.
Impact of project on household life
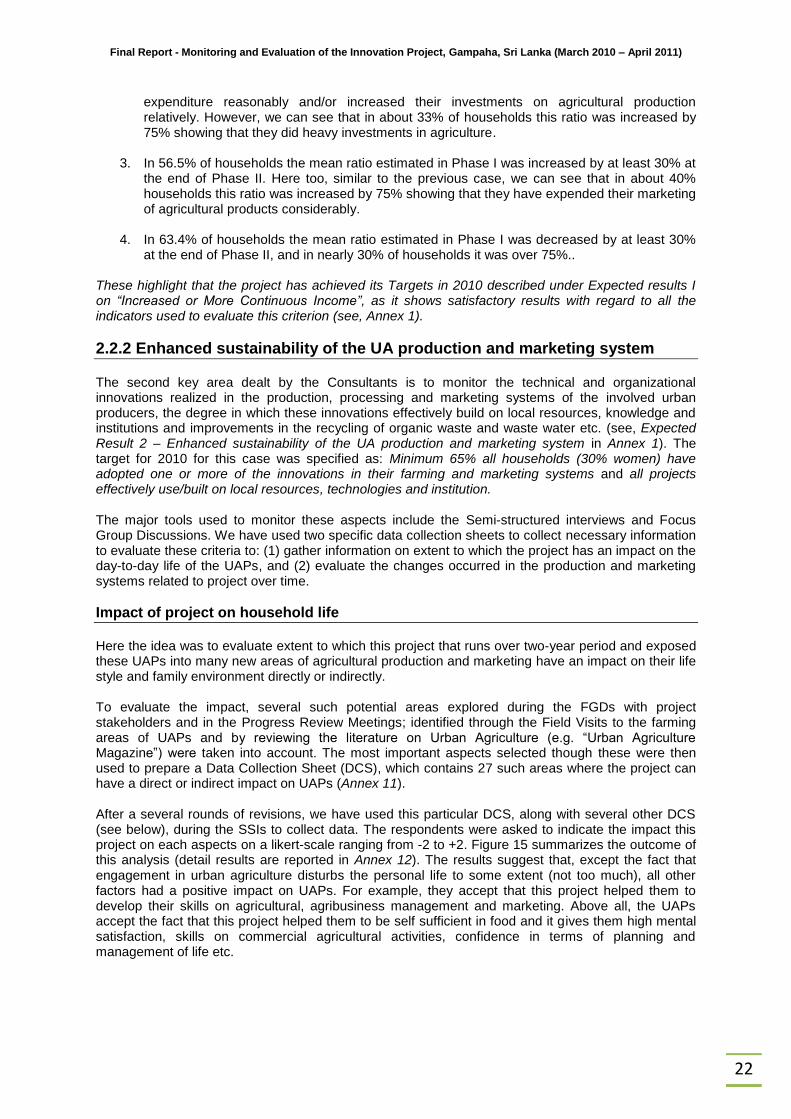
Here the idea was to evaluate extent to which this project that runs over two-year period and exposed these UAPs into many new areas of agricultural production and marketing have an impact on their life style and family environment directly or indirectly. To evaluate the impact, several such potential areas explored during the FGDs with project stakeholders and in the Progress Review Meetings; identified through the Field Visits to the farming areas of UAPs and by reviewing the literature on Urban Agriculture (e.g. “Urban Agriculture Magazine”) were taken into account. The most important aspects selected though these were then used to prepare a Data Collection Sheet (DCS), which contains 27 such areas where the project can have a direct or indirect impact on UAPs (Annex 11). After a several rounds of revisions, we have used this particular DCS, along with several other DCS (see below), during the SSIs to collect data. The respondents were asked to indicate the impact this project on each aspects on a likert-scale ranging from -2 to +2. Figure 15 summarizes the outcome of this analysis (detail results are reported in Annex 12). The results suggest that, except the fact that engagement in urban agriculture disturbs the personal life to some extent (not too much), all other factors had a positive impact on UAPs. For example, they accept that this project helped them to develop their skills on agricultural, agribusiness management and marketing. Above all, the UAPs accept the fact that this project helped them to be self sufficient in food and it gives them high mental satisfaction, skills on commercial agricultural activities, confidence in terms of planning and management of life etc.
Final Report - Monitoring and Evaluation of the Innovation Project, Gampaha, Sri Lanka (March 2010 – April 2011)
23
Figure 15 – Impact of urban agriculture on various aspects of UAPs life
Effect of UA on technical innovations
In addition to the above, another DCS was prepared to gather information on how UAPs have gradually developed their knowledge and skills with rest to use of inputs and infrastructure, new technologies and marketing strategies etc. in urban agriculture, and used in the SSIs along with other documents to record data (Annex 13). Given 33 UAPs have participated to the M&E study, we judged that the project achieved its Expected Results with regard to these, if more than 50% of them fulfilled or engaged in the activity explained in the DCS starting from: (1) Before project; (2) 2
nd crop cycle,
and (3) 3rd
crop cycle. The outcome, as a whole, highlight that the majority of UAPs (i.e. > 50%) has achieved the goals stated in terms of the criteria discussed above as they progress through the project, and the condition is “yes” for most of the aspects as they come to the 3
rd criterion (i.e. 3
rd crop cycle), except some with
respect to water management and utilization of traditional varieties.
These highlight that the project has achieved its Targets in 2010 described under Expected results 2 on “Enhanced Sustainability of the UA Production and Marketing Systems”, as it shows satisfactory results with regard to all the indicators used to evaluate this criterion (see, Annex 1).
Final Report - Monitoring and Evaluation of the Innovation Project, Gampaha, Sri Lanka (March 2010 – April 2011)
24
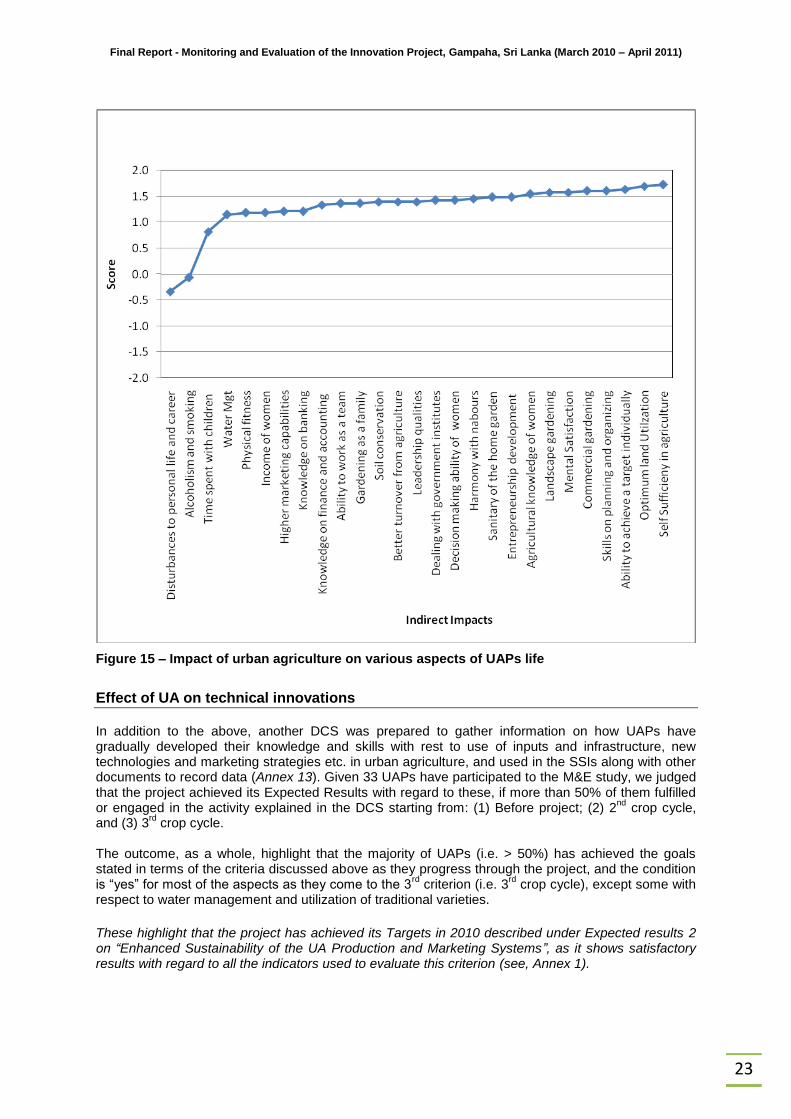
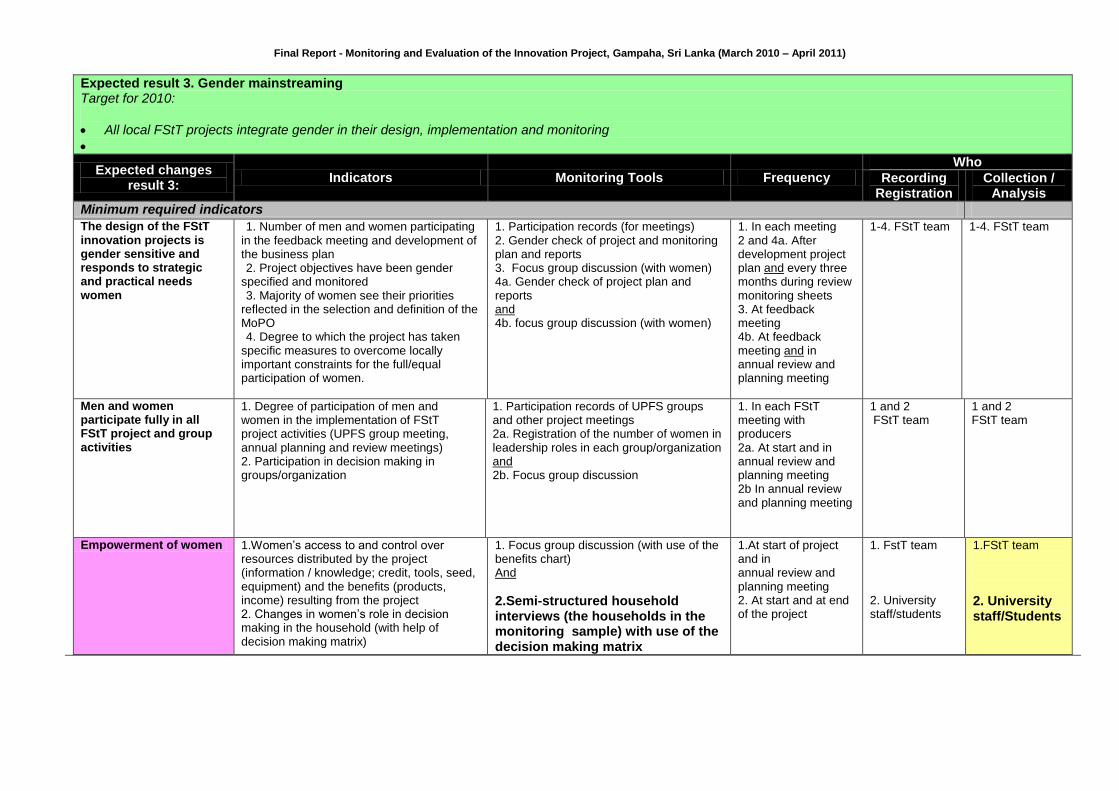
2.2.3 Gender mainstreaming The third key area dealt by the Consultants is whether the project augments the participation of women in activities related to urban agriculture, and in particular, whether they participate in the decision making process (see, Expected Result 3 – Gender mainstreaming of the Annex 1). The target for 2010 for this case was specified as: all local FStT projects integrate gender in their design, implementation and monitoring. Throughout the process we have examined the specific role of women in the project and realized that they have effectively participate in urban agricultural activities, and in most of the families the data recording was carried out the women. The Focus Group Discussions and the Semi-structured Household Interviews held helped us to monitor and evaluate extend to which women in the household were participated in the decision making process. A Decision Making Matrix was created to get a better idea of who takes the decisions on which issues within the household, which lists the different issues on which decisions have to be taken vertically and states the decision makers horizontally (see, Annex 14). The specific issues considered in the matrix include: (1) input use; (2) production; (3) marketing: (4) investments, and (5) family and health (reproduction). We specifically examined who decides on these aspects, i.e.: (a) Male or (b) Female or (c) jointly, and if it is (c), whether Male dominates the decision, Equal influence, or Female dominates the decision. We report the results below (Figure 16)
Figure 16 - Outcome of Decision Making Matrix
The outcome of analysis highlight that most of the households make decisions with respect to these issues as a family (i.e. Family-based decision making), for example over 40% of households decide jointly on: how the available family labour will be used and the types of inputs to buy (i.e. inputs); types of food crops to grow and location of planting (production); what part of the harvest is sold and how (marketing); buying equipments and tools (investments), and almost all family related matters. It shows that the percentage of households where the Female-only based decisions are taken is always
Final Report - Monitoring and Evaluation of the Innovation Project, Gampaha, Sri Lanka (March 2010 – April 2011)
25
higher than that of Male-only decision making, except in the case of schooling issues. Interestingly, of 40% of households, females decide solely on types of cash crops to grow, date of planting and harvesting, storage and value addition and on financial issues such as taking loans. The outcome of analysis, overall, clearly insists that in more than 80% of households the decisions with respect to all these issues are taken with the participation of female (i.e. jointly or female-based) highlighting the significant role of women in urban agricultural practices (Annex 15). Given the facts above, we state that the project achieve the Target for 2010 with regard to Gender Mainstreaming as there is evidence to show that women in the household participate heavily in the decision making with regard to input use, production, marketing, investments, and family and health. These highlight that the project has achieved its Targets in 2010 described under Expected results I on “Gender Mainstreaming”, as it shows satisfactory results with regard to all the indicators used to evaluate this criterion (see, Annex 1).
Final Report - Monitoring and Evaluation of the Innovation Project, Gampaha, Sri Lanka (March 2010 – April 2011)
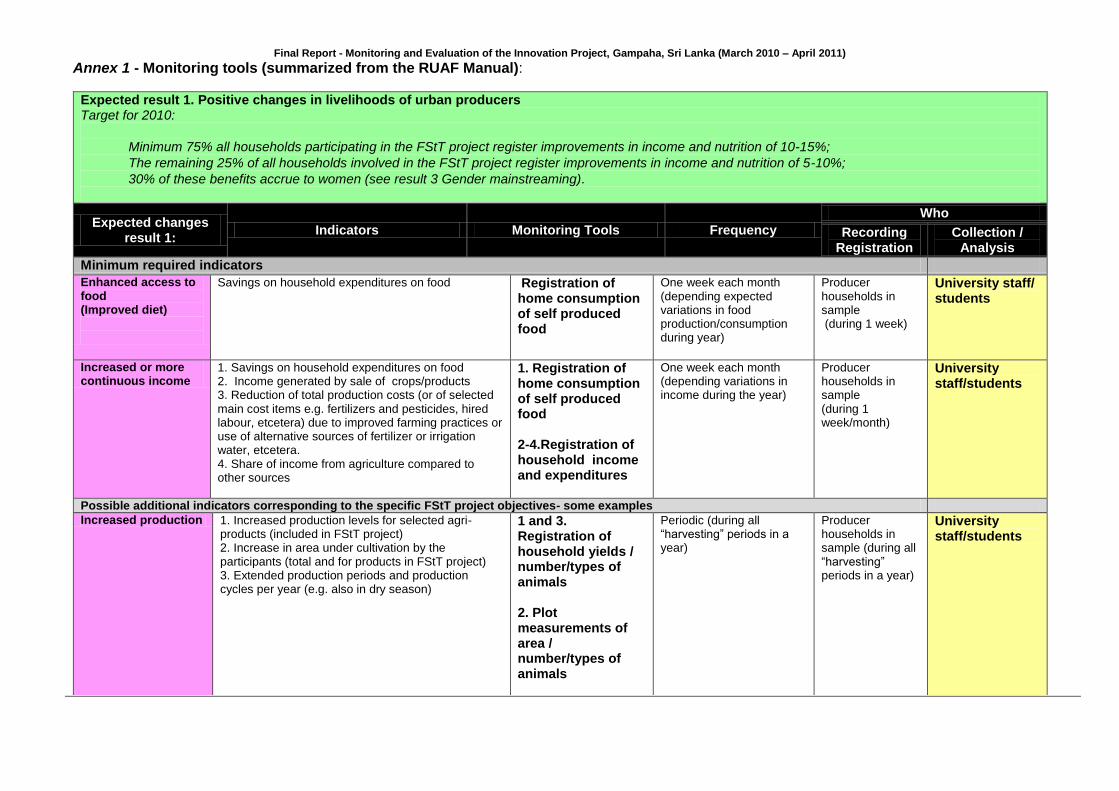
Annex 1 - Monitoring tools (summarized from the RUAF Manual):
Expected result 1. Positive changes in livelihoods of urban producers Target for 2010:
Minimum 75% all households participating in the FStT project register improvements in income and nutrition of 10-15%;
The remaining 25% of all households involved in the FStT project register improvements in income and nutrition of 5-10%;
30% of these benefits accrue to women (see result 3 Gender mainstreaming).
Expected changes result 1:
Indicators Monitoring Tools Frequency
Who
Recording Registration
Collection / Analysis
Minimum required indicators
Enhanced access to food (Improved diet)
Savings on household expenditures on food Registration of home consumption of self produced food
One week each month (depending expected variations in food production/consumption during year)
Producer households in sample (during 1 week)
University staff/ students
Increased or more continuous income
1. Savings on household expenditures on food 2. Income generated by sale of crops/products 3. Reduction of total production costs (or of selected main cost items e.g. fertilizers and pesticides, hired labour, etcetera) due to improved farming practices or use of alternative sources of fertilizer or irrigation water, etcetera. 4. Share of income from agriculture compared to other sources
1. Registration of home consumption of self produced food 2-4.Registration of household income and expenditures
One week each month (depending variations in income during the year)
Producer households in sample (during 1 week/month)
University staff/students
Possible additional indicators corresponding to the specific FStT project objectives- some examples
Increased production 1. Increased production levels for selected agri-products (included in FStT project) 2. Increase in area under cultivation by the participants (total and for products in FStT project) 3. Extended production periods and production cycles per year (e.g. also in dry season)
1 and 3. Registration of household yields / number/types of animals 2. Plot measurements of area / number/types of animals
Periodic (during all “harvesting” periods in a year)
Producer households in sample (during all “harvesting” periods in a year)
University staff/students
Final Report - Monitoring and Evaluation of the Innovation Project, Gampaha, Sri Lanka (March 2010 – April 2011)
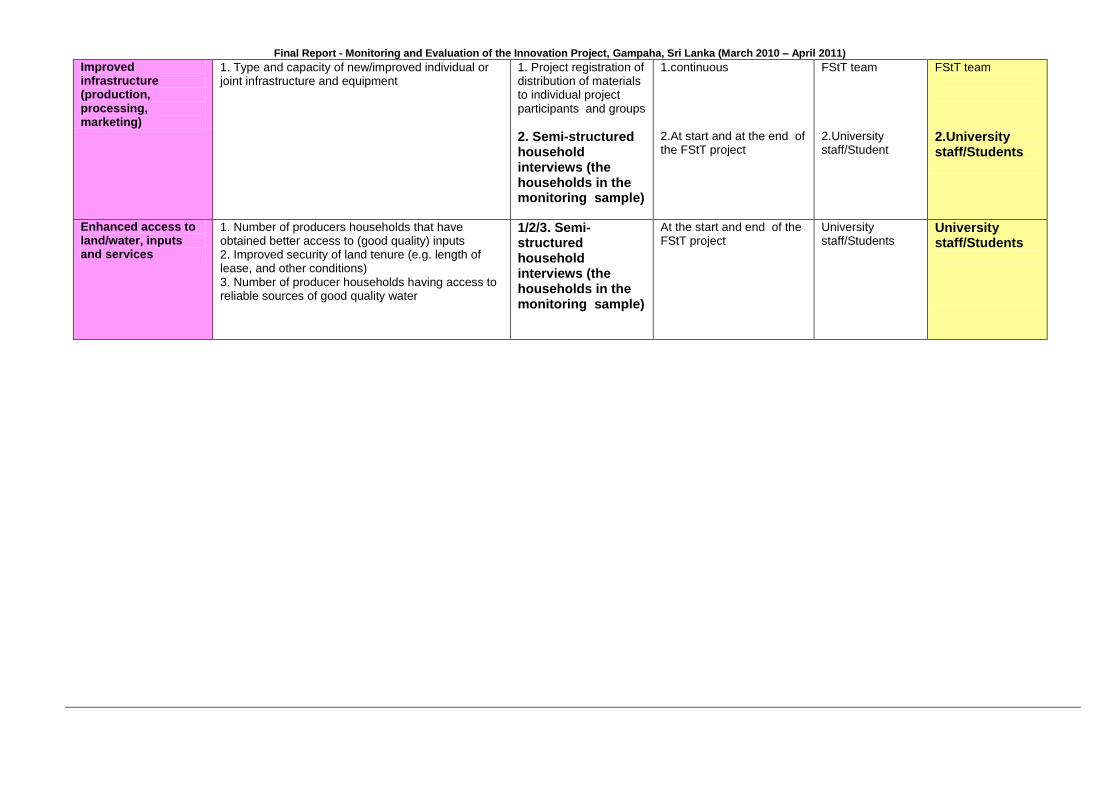
Improved infrastructure (production, processing, marketing)
1. Type and capacity of new/improved individual or joint infrastructure and equipment
1. Project registration of distribution of materials to individual project participants and groups
2. Semi-structured household interviews (the households in the monitoring sample)
1.continuous 2.At start and at the end of the FStT project
FStT team 2.University staff/Student
FStT team
2.University staff/Students
Enhanced access to land/water, inputs and services
1. Number of producers households that have obtained better access to (good quality) inputs 2. Improved security of land tenure (e.g. length of lease, and other conditions) 3. Number of producer households having access to reliable sources of good quality water
1/2/3. Semi-structured household interviews (the households in the monitoring sample)
At the start and end of the FStT project
University staff/Students
University staff/Students
Final Report - Monitoring and Evaluation of the Innovation Project, Gampaha, Sri Lanka (March 2010 – April 2011)
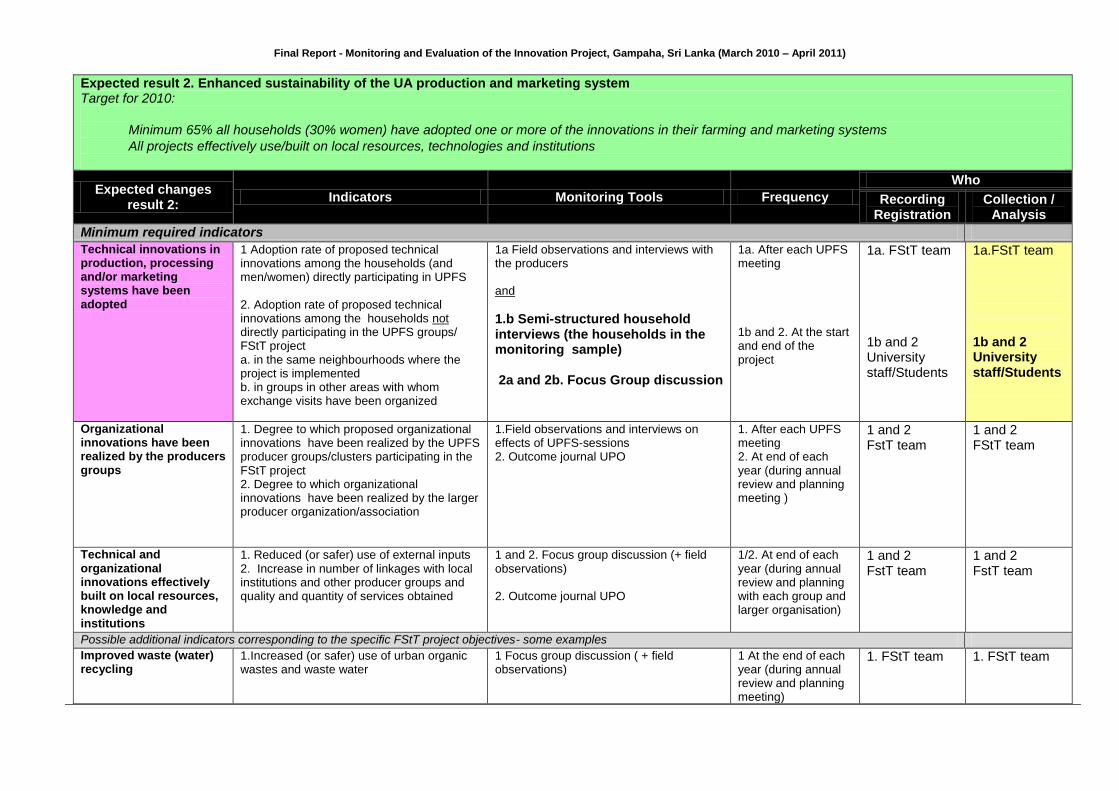
Expected result 2. Enhanced sustainability of the UA production and marketing system Target for 2010:
Minimum 65% all households (30% women) have adopted one or more of the innovations in their farming and marketing systems
All projects effectively use/built on local resources, technologies and institutions
Expected changes result 2:
Indicators Monitoring Tools Frequency
Who
Recording Registration
Collection / Analysis
Minimum required indicators
Technical innovations in production, processing and/or marketing systems have been adopted
1 Adoption rate of proposed technical innovations among the households (and men/women) directly participating in UPFS 2. Adoption rate of proposed technical innovations among the households not directly participating in the UPFS groups/ FStT project a. in the same neighbourhoods where the project is implemented b. in groups in other areas with whom exchange visits have been organized
1a Field observations and interviews with the producers and
1.b Semi-structured household interviews (the households in the monitoring sample) 2a and 2b. Focus Group discussion
1a. After each UPFS meeting 1b and 2. At the start and end of the project
1a. FStT team 1b and 2 University staff/Students
1a.FStT team 1b and 2 University staff/Students
Organizational innovations have been realized by the producers groups
1. Degree to which proposed organizational innovations have been realized by the UPFS producer groups/clusters participating in the FStT project 2. Degree to which organizational innovations have been realized by the larger producer organization/association
1.Field observations and interviews on effects of UPFS-sessions 2. Outcome journal UPO
1. After each UPFS meeting 2. At end of each year (during annual review and planning meeting )
1 and 2 FstT team
1 and 2 FStT team
Technical and organizational innovations effectively built on local resources, knowledge and institutions
1. Reduced (or safer) use of external inputs 2. Increase in number of linkages with local institutions and other producer groups and quality and quantity of services obtained
1 and 2. Focus group discussion (+ field observations) 2. Outcome journal UPO
1/2. At end of each year (during annual review and planning with each group and larger organisation)
1 and 2 FstT team
1 and 2 FstT team
Possible additional indicators corresponding to the specific FStT project objectives- some examples Improved waste (water) recycling
1.Increased (or safer) use of urban organic wastes and waste water
1 Focus group discussion ( + field observations)
1 At the end of each year (during annual review and planning meeting)
1. FStT team 1. FStT team
Final Report - Monitoring and Evaluation of the Innovation Project, Gampaha, Sri Lanka (March 2010 – April 2011)
Expected result 3. Gender mainstreaming Target for 2010:
All local FStT projects integrate gender in their design, implementation and monitoring
Expected changes result 3:
Indicators Monitoring Tools Frequency
Who
Recording Registration
Collection / Analysis
Minimum required indicators
The design of the FStT innovation projects is gender sensitive and responds to strategic and practical needs women
1. Number of men and women participating in the feedback meeting and development of the business plan 2. Project objectives have been gender
specified and monitored 3. Majority of women see their priorities
reflected in the selection and definition of the MoPO 4. Degree to which the project has taken
specific measures to overcome locally important constraints for the full/equal participation of women.
1. Participation records (for meetings) 2. Gender check of project and monitoring plan and reports 3. Focus group discussion (with women) 4a. Gender check of project plan and reports and 4b. focus group discussion (with women)
1. In each meeting 2 and 4a. After development project plan and every three months during review monitoring sheets 3. At feedback meeting 4b. At feedback meeting and in annual review and planning meeting
1-4. FStT team
1-4. FStT team
Men and women participate fully in all FStT project and group activities
1. Degree of participation of men and women in the implementation of FStT project activities (UPFS group meeting, annual planning and review meetings) 2. Participation in decision making in groups/organization
1. Participation records of UPFS groups and other project meetings 2a. Registration of the number of women in leadership roles in each group/organization and 2b. Focus group discussion
1. In each FStT meeting with producers 2a. At start and in annual review and planning meeting 2b In annual review and planning meeting
1 and 2 FStT team
1 and 2 FStT team
Empowerment of women 1.Women’s access to and control over resources distributed by the project (information / knowledge; credit, tools, seed, equipment) and the benefits (products, income) resulting from the project 2. Changes in women’s role in decision making in the household (with help of decision making matrix)
1. Focus group discussion (with use of the benefits chart) And
2.Semi-structured household interviews (the households in the monitoring sample) with use of the decision making matrix
1.At start of project and in annual review and planning meeting 2. At start and at end of the project
1. FstT team 2. University staff/students
1.FStT team
2. University staff/Students
Final Report - Monitoring and Evaluation of the Innovation Project, Gampaha, Sri Lanka (March 2010 – April 2011)
Annex 2a - Income & Expenditure Data Coding Sheet (English Version):
Farmers ID No: Date
No. of Family members: Codes of Family members
Day
Income Rs.
Home Level Supervision
Office Use Only
From Agricultural Products Other Income
Sources Total
Supervision by
Monitoring and
Evaluation Team From the RUAF-FstT Project From Other Agricultural Products
Day
Expenditures Rs.
. Home Level Supervision
Office Use Only
Food Education Travelling Health Agricultural
Activities Water Electricity
Tele
phone Other Total
Supervision by
Monitoring and
Evaluation Team
RUAF – FStT Project-.Gampaha
Impact Monitoring
Format for Recording of Income and Expenditure
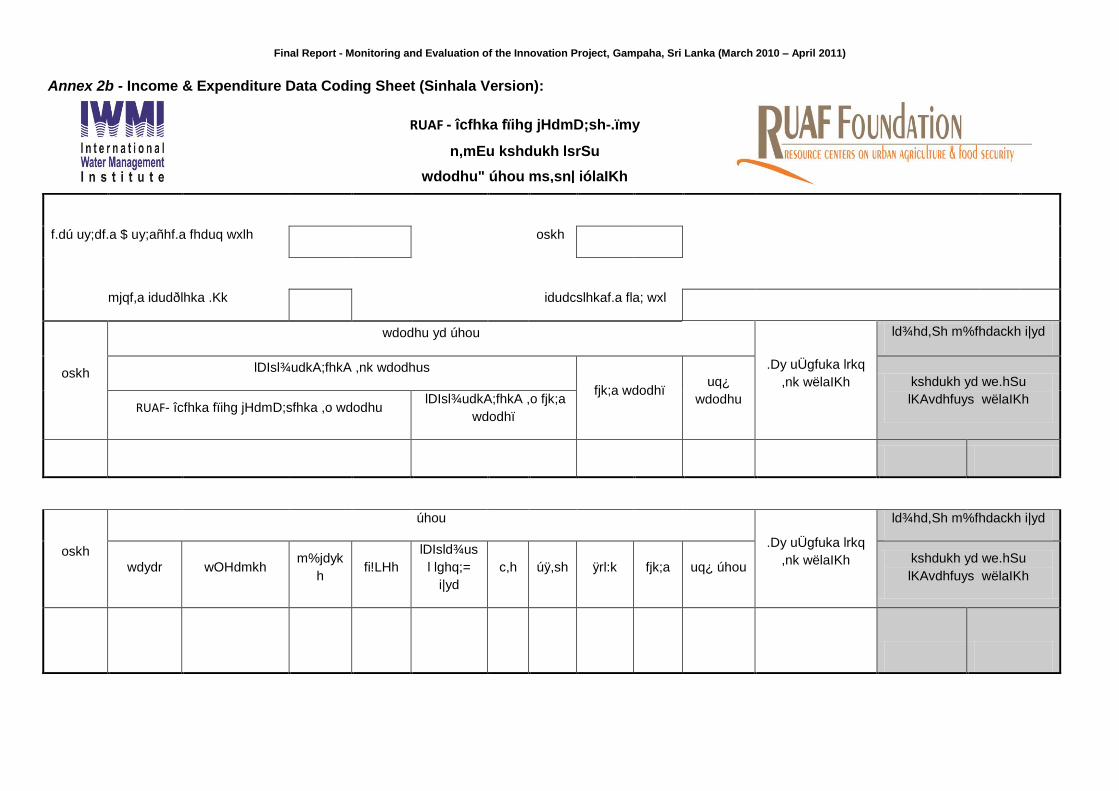
Final Report - Monitoring and Evaluation of the Innovation Project, Gampaha, Sri Lanka (March 2010 – April 2011)
Annex 2b - Income & Expenditure Data Coding Sheet (Sinhala Version):
f.dú uy;df.a $ uy;añhf.a fhduq wxlh oskh
mjqf,a idudðlhka .Kk idudcslhkaf.a fla; wxl
oskh
wdodhu yd úhou
.Dy uÜgfuka lrkq
,nk wëlaIKh
ld¾hd,Sh m%fhdackh i|yd
lDIsl¾udkA;fhkA ,nk wdodhus
fjk;a wdodhï uq¿
wdodhu
kshdukh yd we.hSu
lKAvdhfuys wëlaIKh RUAF- îcfhka fïihg jHdmD;sfhka ,o wdodhu
lDIsl¾udkA;fhkA ,o fjk;a
wdodhï
oskh
úhou
.Dy uÜgfuka lrkq
,nk wëlaIKh
ld¾hd,Sh m%fhdackh i|yd
wdydr wOHdmkh m%jdyk
h fi!LHh
lDIsld¾us
l lghq;=
i|yd
c,h úÿ,sh ÿrl:k fjk;a uq¿ úhou kshdukh yd we.hSu
lKAvdhfuys wëlaIKh
RUAF - îcfhka fïihg jHdmD;sh-.ïmy
n,mEu kshdukh lsrSu
wdodhu" úhou ms,sn| iólaIKh
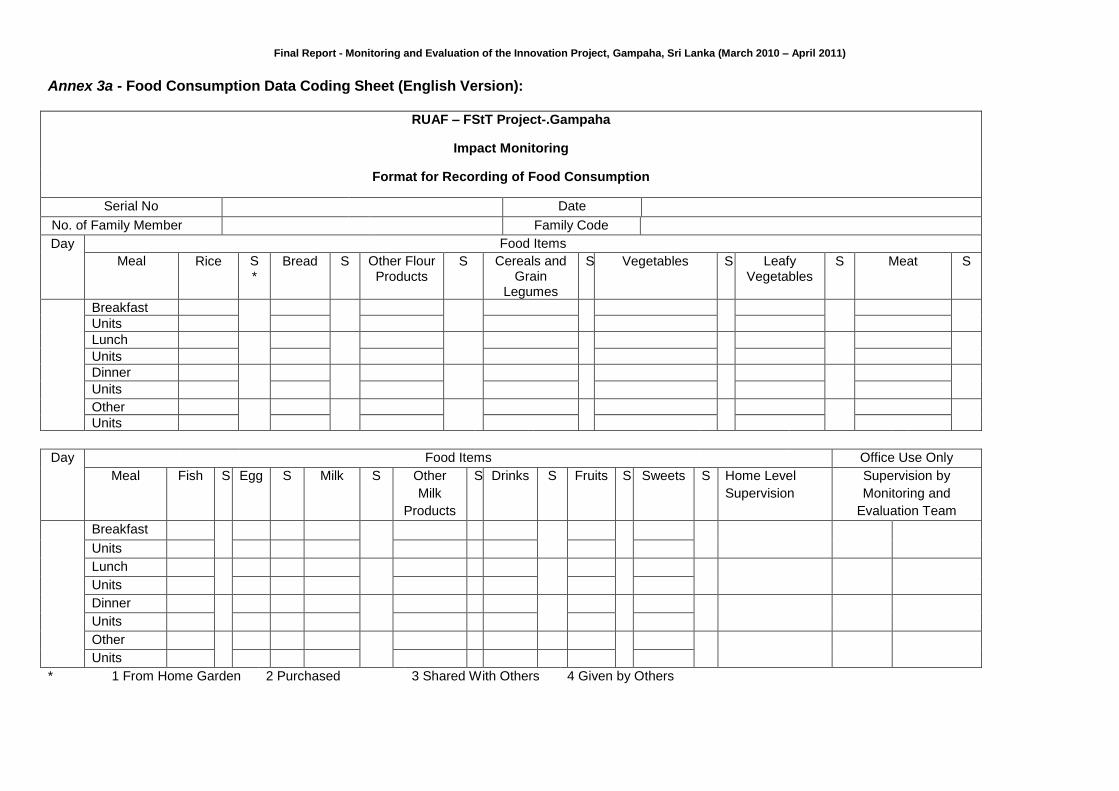
Final Report - Monitoring and Evaluation of the Innovation Project, Gampaha, Sri Lanka (March 2010 – April 2011)
Annex 3a - Food Consumption Data Coding Sheet (English Version):
RUAF – FStT Project-.Gampaha
Impact Monitoring
Format for Recording of Food Consumption
Serial No Date
No. of Family Member Family Code
Day Food Items
Meal Rice S *
Bread S Other Flour Products
S Cereals and Grain
Legumes
S Vegetables S Leafy Vegetables
S Meat S
Breakfast
Units
Lunch
Units
Dinner
Units
Other
Units
Day Food Items Office Use Only
Meal Fish S Egg S Milk S Other
Milk
Products
S Drinks S Fruits S Sweets S Home Level
Supervision
Supervision by
Monitoring and
Evaluation Team
Breakfast
Units
Lunch
Units
Dinner
Units
Other
Units
* 1 From Home Garden 2 Purchased 3 Shared With Others 4 Given by Others
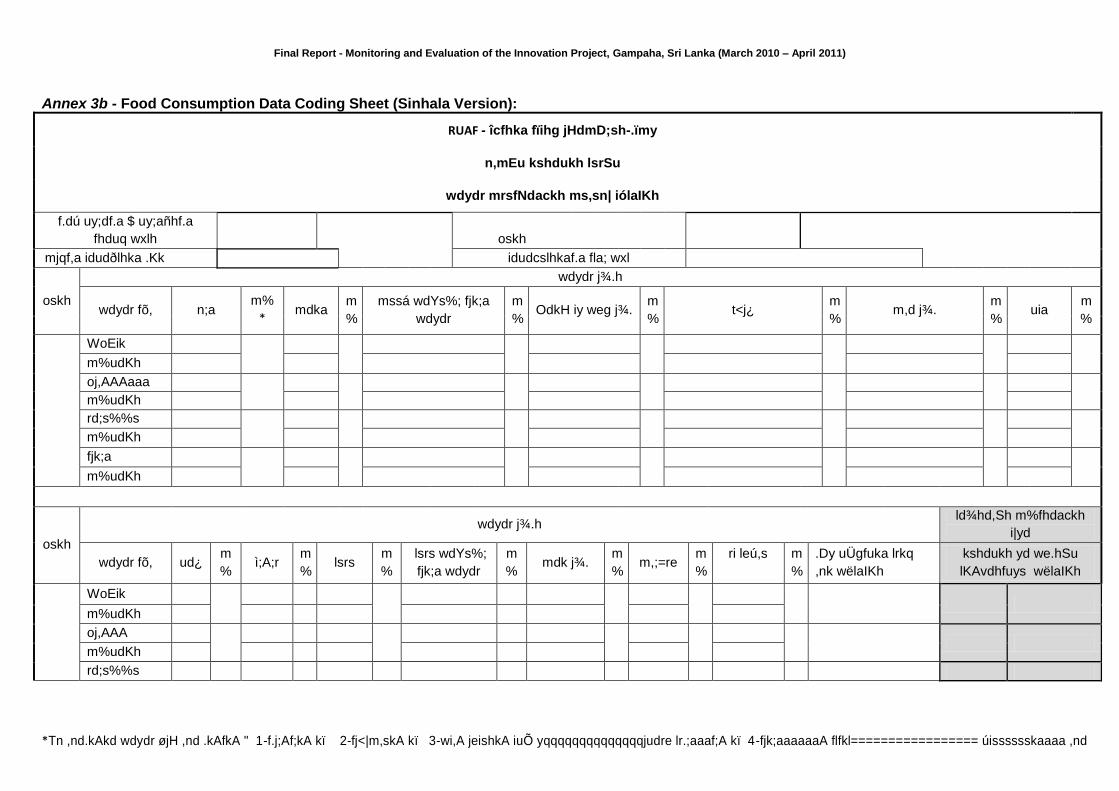
Final Report - Monitoring and Evaluation of the Innovation Project, Gampaha, Sri Lanka (March 2010 – April 2011)
Annex 3b - Food Consumption Data Coding Sheet (Sinhala Version):
RUAF - îcfhka fïihg jHdmD;sh-.ïmy
n,mEu kshdukh lsrSu
wdydr mrsfNdackh ms,sn| iólaIKh
f.dú uy;df.a $ uy;añhf.a
fhduq wxlh oskh
mjqf,a idudðlhka .Kk idudcslhkaf.a fla; wxl
oskh
wdydr j¾.h
wdydr fõ, n;a m%
* mdka
m
%
mssá wdYs%; fjk;a
wdydr
m
% OdkH iy weg j¾.
m
% t<j¿
m
% m,d j¾.
m
% uia
m
%
WoEik
m%udKh
oj,AAAaaa
m%udKh
rd;s%%s
m%udKh
fjk;a
m%udKh
oskh
wdydr j¾.h ld¾hd,Sh m%fhdackh
i|yd
wdydr fõ, ud¿ m
% ì;A;r
m
% lsrs
m
%
lsrs wdYs%;
fjk;a wdydr
m
% mdk j¾.
m
% m,;=re
m
%
ri leú,s
m
%
.Dy uÜgfuka lrkq
,nk wëlaIKh
kshdukh yd we.hSu
lKAvdhfuys wëlaIKh
WoEik
m%udKh
oj,AAA
m%udKh
rd;s%%s
*Tn ,nd.kAkd wdydr øjH ,nd .kAfkA " 1-f.j;Af;kA kï 2-fj<|m,skA kï 3-wi,A jeishkA iuÕ yqqqqqqqqqqqqqqjudre lr.;aaaf;A kï 4-fjk;aaaaaaA flfkl================= úisssssskaaaa ,nd
ÿkAfkA kï hk ixflA; fhdokAk'
* Tn ,nd.kAkd wdydr øjH ,nd .kAfkA " 1- f.j;Af;kA kï 2- fj<|m,skA kï 3 - wi,A jeishkA iuÕ yqqqqqqqqqqqqqqjudre lr.;aaaf;A kï 4 - fjk;aaaaaaA flfkl=================
Final Report - Monitoring and Evaluation of the Innovation Project, Gampaha, Sri Lanka (March 2010 – April 2011)
m%udKh
fjk;a
m%udKh
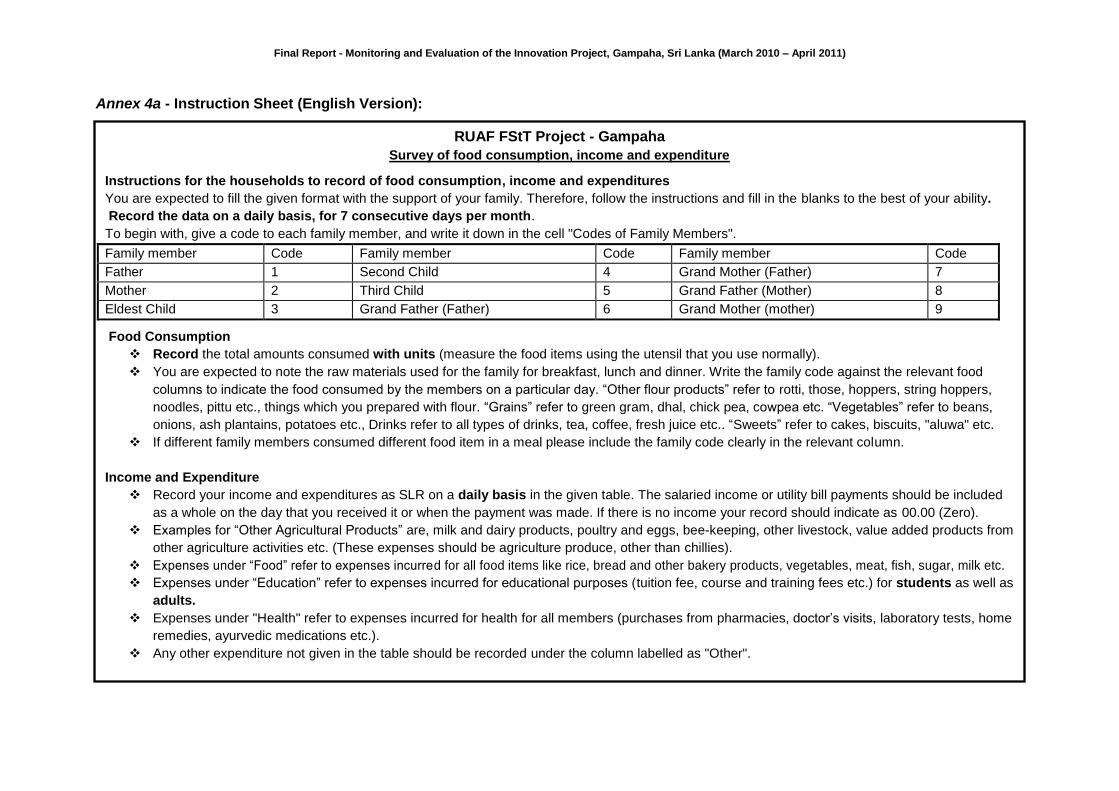
Final Report - Monitoring and Evaluation of the Innovation Project, Gampaha, Sri Lanka (March 2010 – April 2011)
Annex 4a - Instruction Sheet (English Version):
RUAF FStT Project - Gampaha
Survey of food consumption, income and expenditure
Instructions for the households to record of food consumption, income and expenditures
You are expected to fill the given format with the support of your family. Therefore, follow the instructions and fill in the blanks to the best of your ability.
Record the data on a daily basis, for 7 consecutive days per month.
To begin with, give a code to each family member, and write it down in the cell "Codes of Family Members".
Family member Code Family member Code Family member Code
Father 1 Second Child 4 Grand Mother (Father) 7
Mother 2 Third Child 5 Grand Father (Mother) 8
Eldest Child 3 Grand Father (Father) 6 Grand Mother (mother) 9
Food Consumption
Record the total amounts consumed with units (measure the food items using the utensil that you use normally).
You are expected to note the raw materials used for the family for breakfast, lunch and dinner. Write the family code against the relevant food
columns to indicate the food consumed by the members on a particular day. “Other flour products” refer to rotti, those, hoppers, string hoppers,
noodles, pittu etc., things which you prepared with flour. “Grains” refer to green gram, dhal, chick pea, cowpea etc. “Vegetables” refer to beans,
onions, ash plantains, potatoes etc., Drinks refer to all types of drinks, tea, coffee, fresh juice etc.. “Sweets” refer to cakes, biscuits, "aluwa" etc.
If different family members consumed different food item in a meal please include the family code clearly in the relevant column.
Income and Expenditure
Record your income and expenditures as SLR on a daily basis in the given table. The salaried income or utility bill payments should be included
as a whole on the day that you received it or when the payment was made. If there is no income your record should indicate as 00.00 (Zero).
Examples for “Other Agricultural Products” are, milk and dairy products, poultry and eggs, bee-keeping, other livestock, value added products from
other agriculture activities etc. (These expenses should be agriculture produce, other than chillies).
Expenses under “Food” refer to expenses incurred for all food items like rice, bread and other bakery products, vegetables, meat, fish, sugar, milk etc.
Expenses under “Education” refer to expenses incurred for educational purposes (tuition fee, course and training fees etc.) for students as well as
adults.
Expenses under "Health" refer to expenses incurred for health for all members (purchases from pharmacies, doctor’s visits, laboratory tests, home
remedies, ayurvedic medications etc.).
Any other expenditure not given in the table should be recorded under the column labelled as "Other".
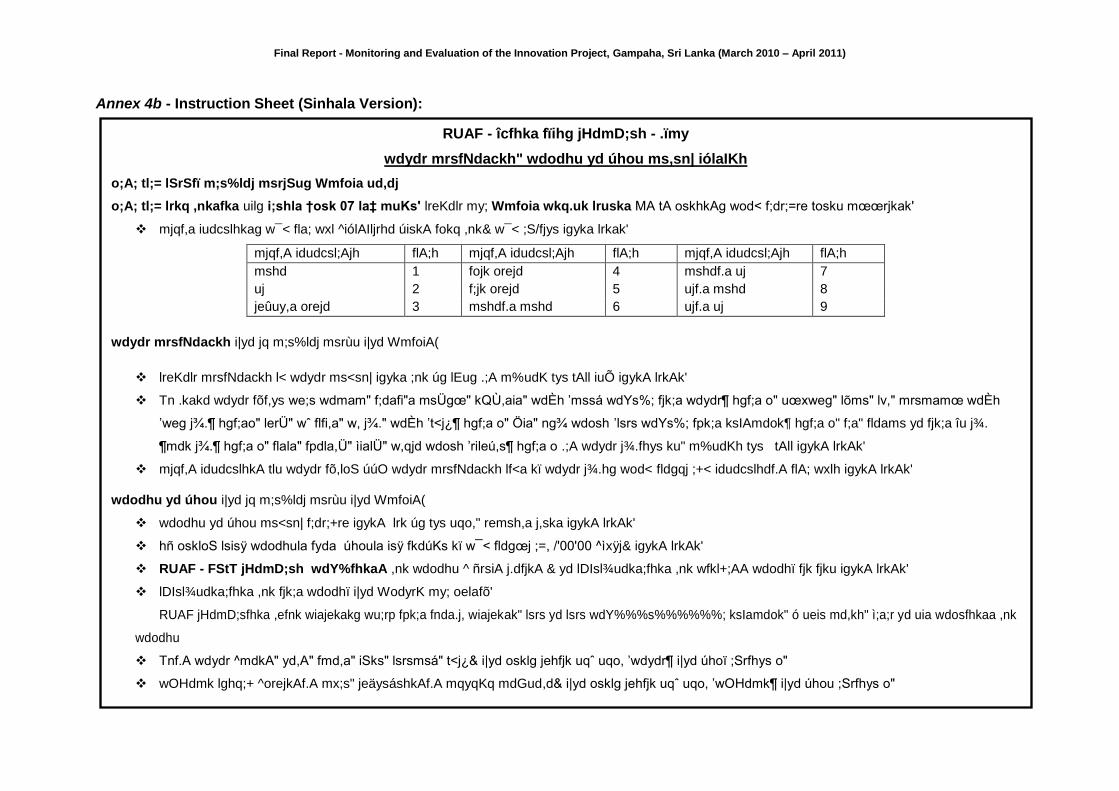
Final Report - Monitoring and Evaluation of the Innovation Project, Gampaha, Sri Lanka (March 2010 – April 2011)
Annex 4b - Instruction Sheet (Sinhala Version):
RUAF - îcfhka fïihg jHdmD;sh - .ïmy
wdydr mrsfNdackh" wdodhu yd úhou ms,sn| iólaIKh
o;A; tl;= lSrSfï m;s%ldj msrjSug Wmfoia ud,dj
o;A; tl;= lrkq ,nkafka uilg i;shla †osk 07 la‡ muKs' lreKdlr my; Wmfoia wkq.uk lruska MA tA oskhkAg wod< f;dr;=re tosku mœœrjkak'
mjqf,a iudcslhkag w¯< fla; wxl ^iólAIljrhd úiskA fokq ,nk& w¯< ;S/fjys igyka lrkak'
mjqf,A idudcsl;Ajh flA;h mjqf,A idudcsl;Ajh flA;h mjqf,A idudcsl;Ajh flA;h
mshd 1 fojk orejd 4 mshdf.a uj 7
uj 2 f;jk orejd 5 ujf.a mshd 8
jeûuy,a orejd 3 mshdf.a mshd 6 ujf.a uj 9
wdydr mrsfNdackh i|yd jq m;s%ldj msrùu i|yd WmfoiA(
lreKdlr mrsfNdackh l< wdydr ms<sn| igyka ;nk úg lEug .;A m%udK tys tAll iuÕ igykA lrkAk'
Tn .kakd wdydr fõf,ys we;s wdmam" f;dafi"a msÜgœ" kQÙ,aia" wdÈh ’mssá wdYs%; fjk;a wdydr¶ hgf;a o" uœxweg" lõms" lv," mrsmamœ wdÈh
’weg j¾.¶ hgf;ao" lerÜ" wˆ flfi,a" w, j¾." wdÈh ’t<j¿¶ hgf;a o" Öia" ng¾ wdosh ’lsrs wdYs%; fpk;a ksIAmdok¶ hgf;a o" f;a" fldams yd fjk;a îu j¾.
¶mdk j¾.¶ hgf;a o" flala" fpdla,Ü" ìialÜ" w,qjd wdosh ’rileú,s¶ hgf;a o .;A wdydr j¾.fhys ku" m%udKh tys tAll igykA lrkAk'
mjqf,A idudcslhkA tlu wdydr fõ,loS úúO wdydr mrsfNdackh lf<a kï wdydr j¾.hg wod< fldgqj ;+< idudcslhdf.A flA; wxlh igykA lrkAk'
wdodhu yd úhou i|yd jq m;s%ldj msrùu i|yd WmfoiA(
wdodhu yd úhou ms<sn| f;dr;+re igykA lrk úg tys uqo," remsh,a j,ska igykA lrkAk'
hñ oskloS lsisÿ wdodhula fyda úhoula isÿ fkdúKs kï w¯< fldgœj ;=, /'00'00 ^ìxÿj& igykA lrkAk'
RUAF - FStT jHdmD;sh wdY%fhkaA ,nk wdodhu ^ ñrsiA j.dfjkA & yd lDIsl¾udka;fhka ,nk wfkl+;AA wdodhï fjk fjku igykA lrkAk'
lDIsl¾udka;fhka ,nk fjk;a wdodhï i|yd WodyrK my; oelafõ'
RUAF jHdmD;sfhka ,efnk wiajekakg wu;rp fpk;a fnda.j, wiajekak" lsrs yd lsrs wdY%%%s%%%%%%; ksIamdok" ó ueis md,kh" ì;a;r yd uia wdosfhkaa ,nk
wdodhu
Tnf.A wdydr ^mdkA" yd,A" fmd,a" iSks" lsrsmsá" t<j¿& i|yd osklg jehfjk uqˆ uqo, ’wdydr¶ i|yd úhoï ;Srfhys o"
wOHdmk lghq;+ ^orejkAf.A mx;s" jeäysáshkAf.A mqyqKq mdGud,d& i|yd osklg jehfjk uqˆ uqo, ’wOHdmk¶ i|yd úhou ;Srfhys o"
fi!LHh lghq;+ ^T!IO yd w;a fnfy;a& i|yd osklg jehfjk uqˆ uqo, ’fi!LHh¶ i|yd úhou ;Srfhys o"
f;dr;+re igykA lrk i;sfhA oskl" Tnf.A ì,A j,skA ^c," úÿ,s" ÿrl:k& l+uk fydA ì,lA f.õfõ kï muKlA th wod< ;Srfhys o"
WlA; úhoï lsisjlg wod< fkdjk hï úhoulA fjf;d;A tAjd ’fjk;A¶ hkqfjkA igykA lr we;s ;Srfhys igykA lrkAk'
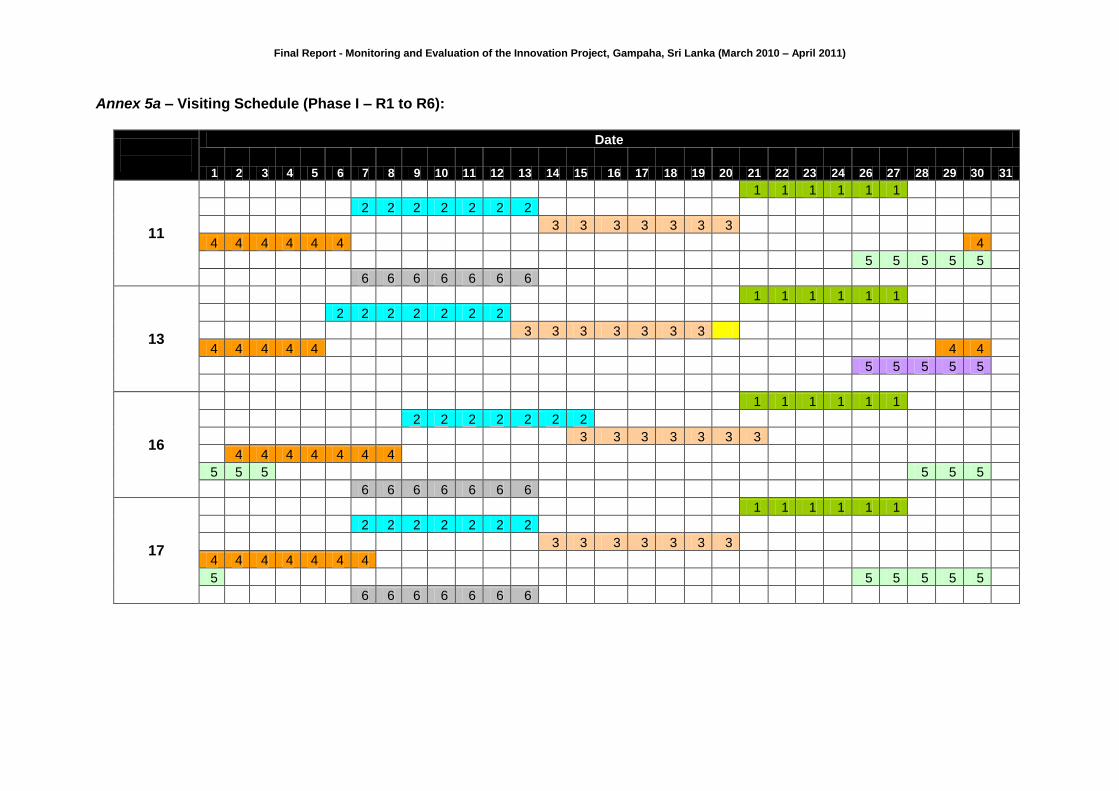
Final Report - Monitoring and Evaluation of the Innovation Project, Gampaha, Sri Lanka (March 2010 – April 2011)
Annex 5a – Visiting Schedule (Phase I – R1 to R6):
M & E Code
Date
1 2 3 4 5 6 7 8 9 10 11 12 13 14 15 16 17 18 19 20 21 22 23 24 26 27 28 29 30 31
11
1 1 1 1 1 1
2 2 2 2 2 2 2
3 3 3 3 3 3 3
4 4 4 4 4 4 4
5 5 5 5 5
6 6 6 6 6 6 6
13
1 1 1 1 1 1
2 2 2 2 2 2 2
3 3 3 3 3 3 3
4 4 4 4 4 4 4
5 5 5 5 5
16
1 1 1 1 1 1
2 2 2 2 2 2 2
3 3 3 3 3 3 3
4 4 4 4 4 4 4
5 5 5 5 5 5
6 6 6 6 6 6 6
17
1 1 1 1 1 1
2 2 2 2 2 2 2
3 3 3 3 3 3 3
4 4 4 4 4 4 4
5 5 5 5 5 5
6 6 6 6 6 6 6
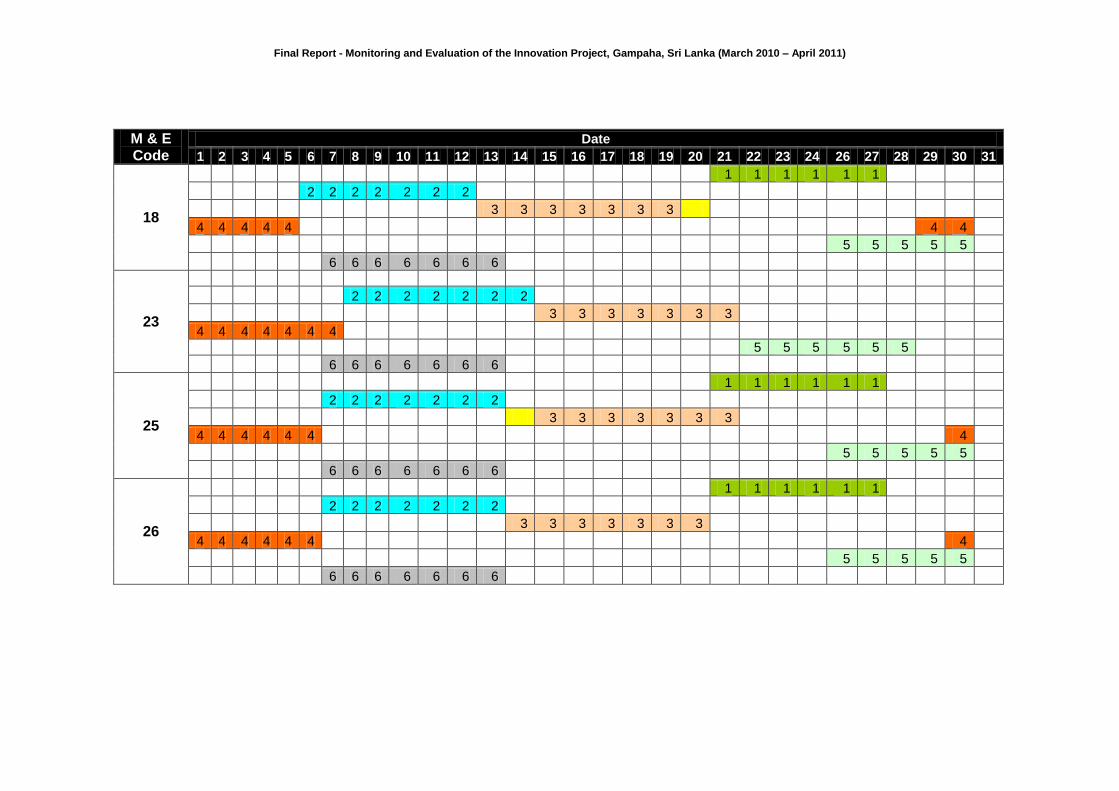
Final Report - Monitoring and Evaluation of the Innovation Project, Gampaha, Sri Lanka (March 2010 – April 2011)
M & E Code
Date
1 2 3 4 5 6 7 8 9 10 11 12 13 14 15 16 17 18 19 20 21 22 23 24 26 27 28 29 30 31
18
1 1 1 1 1 1
2 2 2 2 2 2 2
3 3 3 3 3 3 3
4 4 4 4 4 4 4
5 5 5 5 5
6 6 6 6 6 6 6
23
2 2 2 2 2 2 2
3 3 3 3 3 3 3
4 4 4 4 4 4 4
5 5 5 5 5 5
6 6 6 6 6 6 6
25
1 1 1 1 1 1
2 2 2 2 2 2 2
3 3 3 3 3 3 3
4 4 4 4 4 4 4
5 5 5 5 5
6 6 6 6 6 6 6
26
1 1 1 1 1 1
2 2 2 2 2 2 2
3 3 3 3 3 3 3
4 4 4 4 4 4 4
5 5 5 5 5
6 6 6 6 6 6 6
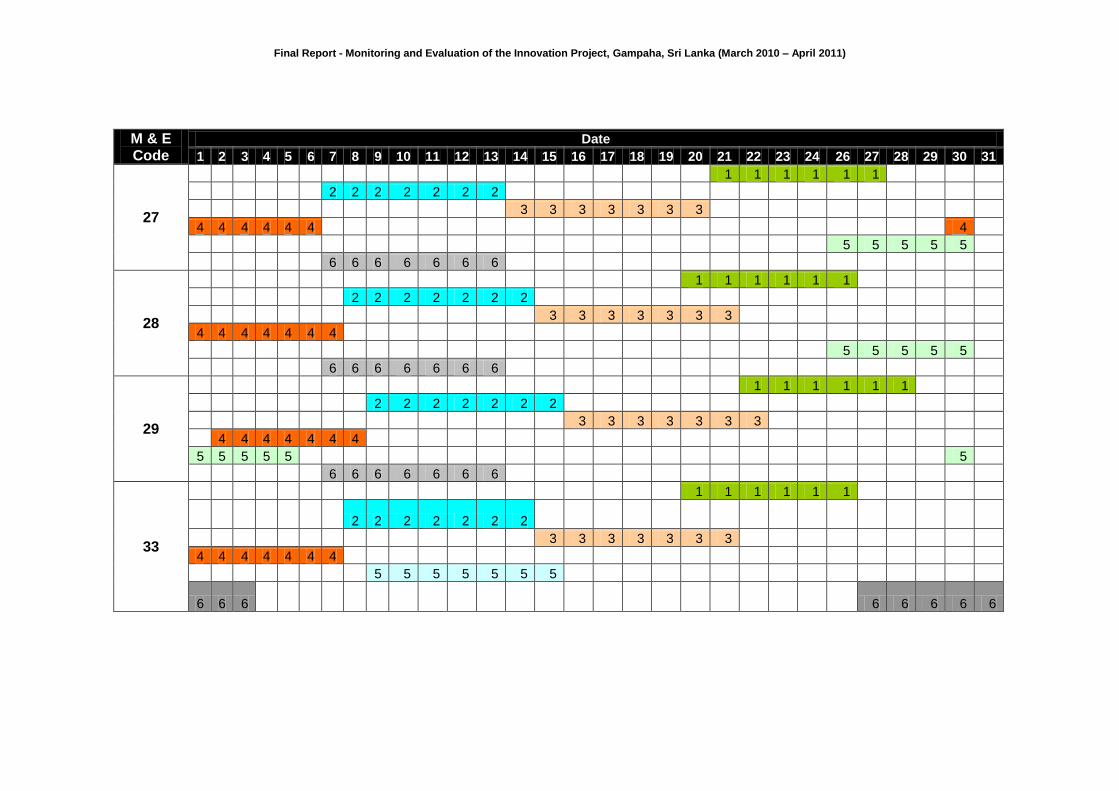
Final Report - Monitoring and Evaluation of the Innovation Project, Gampaha, Sri Lanka (March 2010 – April 2011)
M & E Code
Date
1 2 3 4 5 6 7 8 9 10 11 12 13 14 15 16 17 18 19 20 21 22 23 24 26 27 28 29 30 31
27
1 1 1 1 1 1
2 2 2 2 2 2 2
3 3 3 3 3 3 3
4 4 4 4 4 4 4
5 5 5 5 5
6 6 6 6 6 6 6
28
1 1 1 1 1 1
2 2 2 2 2 2 2
3 3 3 3 3 3 3
4 4 4 4 4 4 4
5 5 5 5 5
6 6 6 6 6 6 6
29
1 1 1 1 1 1
2 2 2 2 2 2 2
3 3 3 3 3 3 3
4 4 4 4 4 4 4
5 5 5 5 5 5
6 6 6 6 6 6 6
33
1 1 1 1 1 1
2 2 2 2 2 2 2
3 3 3 3 3 3 3
4 4 4 4 4 4 4
5 5 5 5 5 5 5
6 6 6 6 6 6 6 6
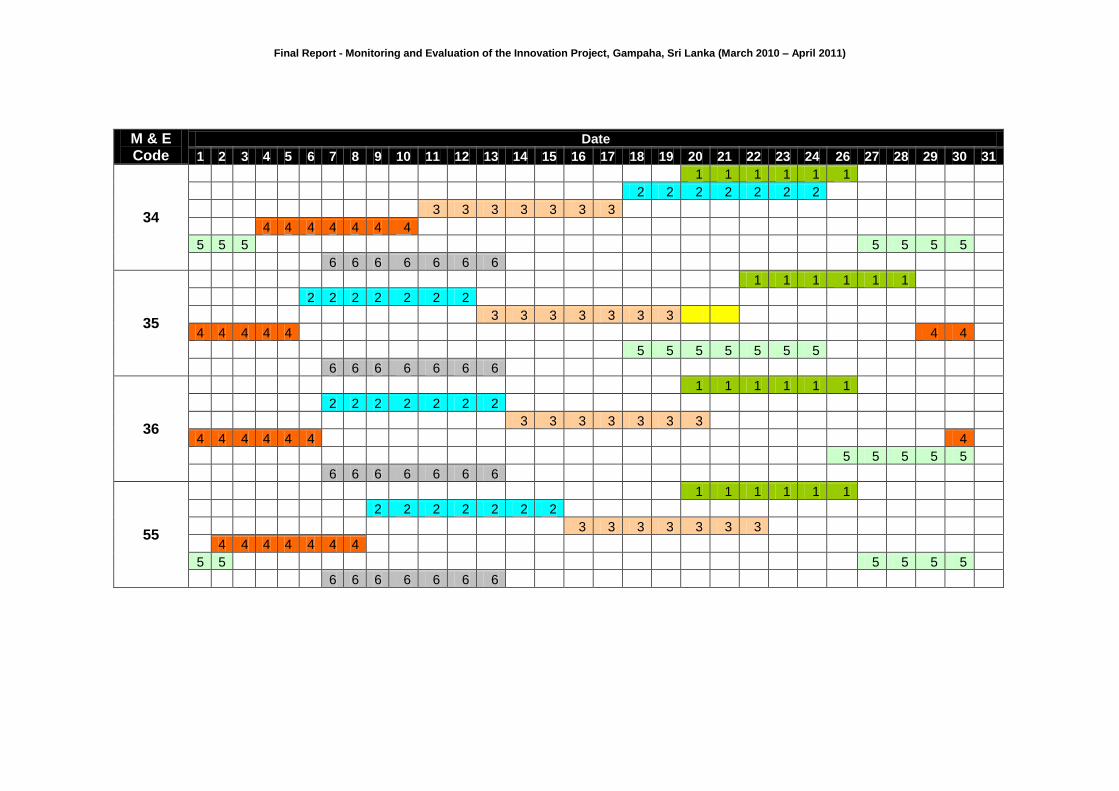
Final Report - Monitoring and Evaluation of the Innovation Project, Gampaha, Sri Lanka (March 2010 – April 2011)
M & E Code
Date
1 2 3 4 5 6 7 8 9 10 11 12 13 14 15 16 17 18 19 20 21 22 23 24 26 27 28 29 30 31
34
1 1 1 1 1 1
2 2 2 2 2 2 2
3 3 3 3 3 3 3
4 4 4 4 4 4 4
5 5 5 5 5 5 5
6 6 6 6 6 6 6
35
1 1 1 1 1 1
2 2 2 2 2 2 2
3 3 3 3 3 3 3
4 4 4 4 4 4 4
5 5 5 5 5 5 5
6 6 6 6 6 6 6
36
1 1 1 1 1 1
2 2 2 2 2 2 2
3 3 3 3 3 3 3
4 4 4 4 4 4 4
5 5 5 5 5
6 6 6 6 6 6 6
55
1 1 1 1 1 1
2 2 2 2 2 2 2
3 3 3 3 3 3 3
4 4 4 4 4 4 4
5 5 5 5 5 5
6 6 6 6 6 6 6
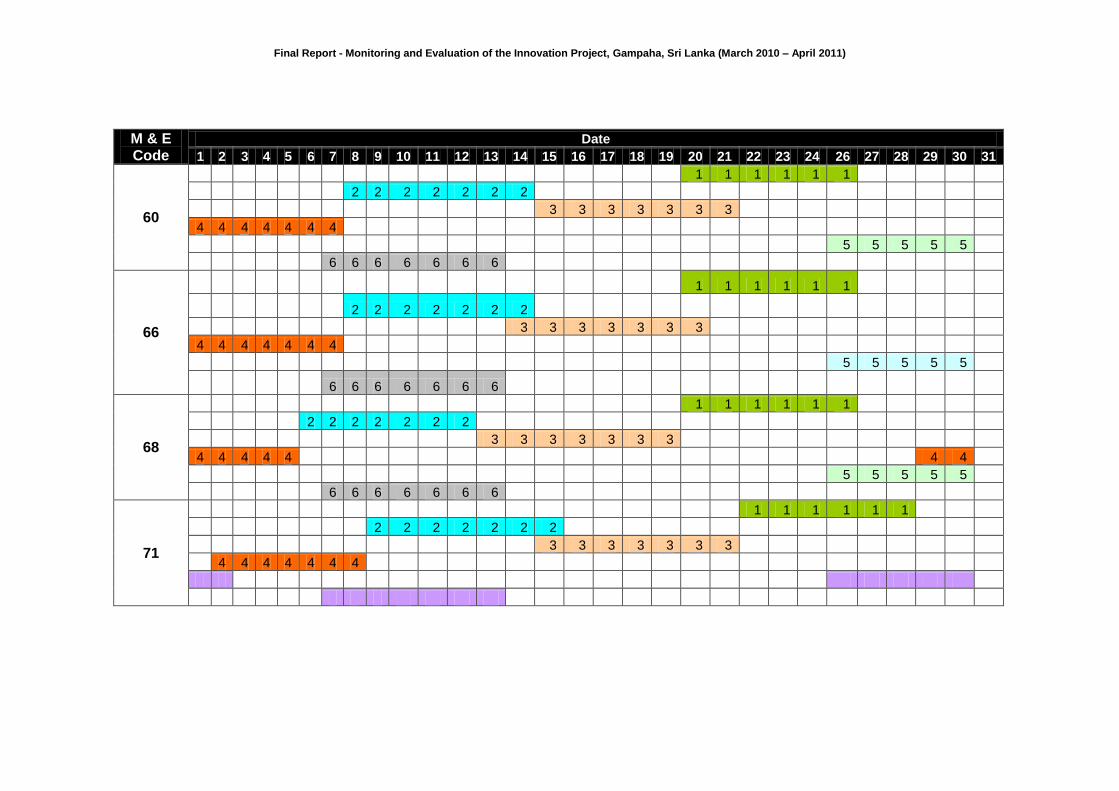
Final Report - Monitoring and Evaluation of the Innovation Project, Gampaha, Sri Lanka (March 2010 – April 2011)
M & E Code
Date
1 2 3 4 5 6 7 8 9 10 11 12 13 14 15 16 17 18 19 20 21 22 23 24 26 27 28 29 30 31
60
1 1 1 1 1 1
2 2 2 2 2 2 2
3 3 3 3 3 3 3
4 4 4 4 4 4 4
5 5 5 5 5
6 6 6 6 6 6 6
66
1 1 1 1 1 1
2 2 2 2 2 2 2
3 3 3 3 3 3 3
4 4 4 4 4 4 4
5 5 5 5 5
6 6 6 6 6 6 6
68
1 1 1 1 1 1
2 2 2 2 2 2 2
3 3 3 3 3 3 3
4 4 4 4 4 4 4
5 5 5 5 5
6 6 6 6 6 6 6
71
1 1 1 1 1 1
2 2 2 2 2 2 2
3 3 3 3 3 3 3
4 4 4 4 4 4 4
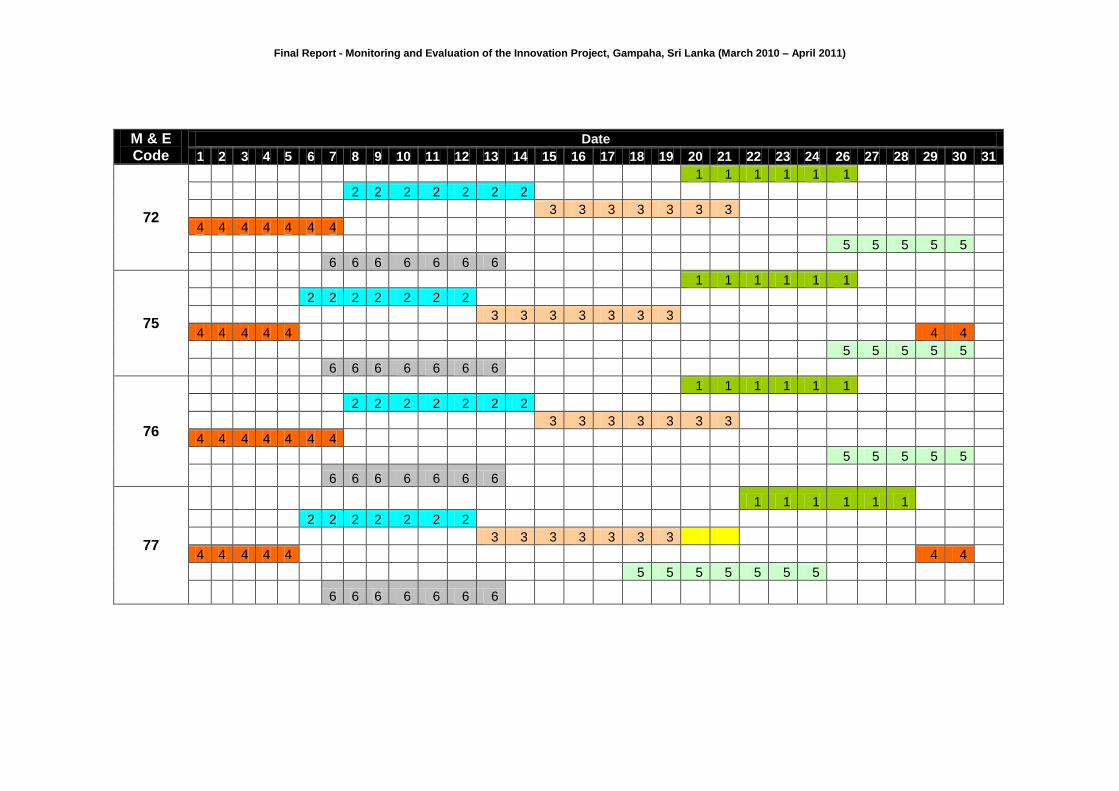
Final Report - Monitoring and Evaluation of the Innovation Project, Gampaha, Sri Lanka (March 2010 – April 2011)
M & E Code
Date
1 2 3 4 5 6 7 8 9 10 11 12 13 14 15 16 17 18 19 20 21 22 23 24 26 27 28 29 30 31
72
1 1 1 1 1 1
2 2 2 2 2 2 2
3 3 3 3 3 3 3
4 4 4 4 4 4 4
5 5 5 5 5
6 6 6 6 6 6 6
75
1 1 1 1 1 1
2 2 2 2 2 2 2
3 3 3 3 3 3 3
4 4 4 4 4 4 4
5 5 5 5 5
6 6 6 6 6 6 6
76
1 1 1 1 1 1
2 2 2 2 2 2 2
3 3 3 3 3 3 3
4 4 4 4 4 4 4
5 5 5 5 5
6 6 6 6 6 6 6
77
1 1 1 1 1 1
2 2 2 2 2 2 2
3 3 3 3 3 3 3
4 4 4 4 4 4 4
5 5 5 5 5 5 5
6 6 6 6 6 6 6
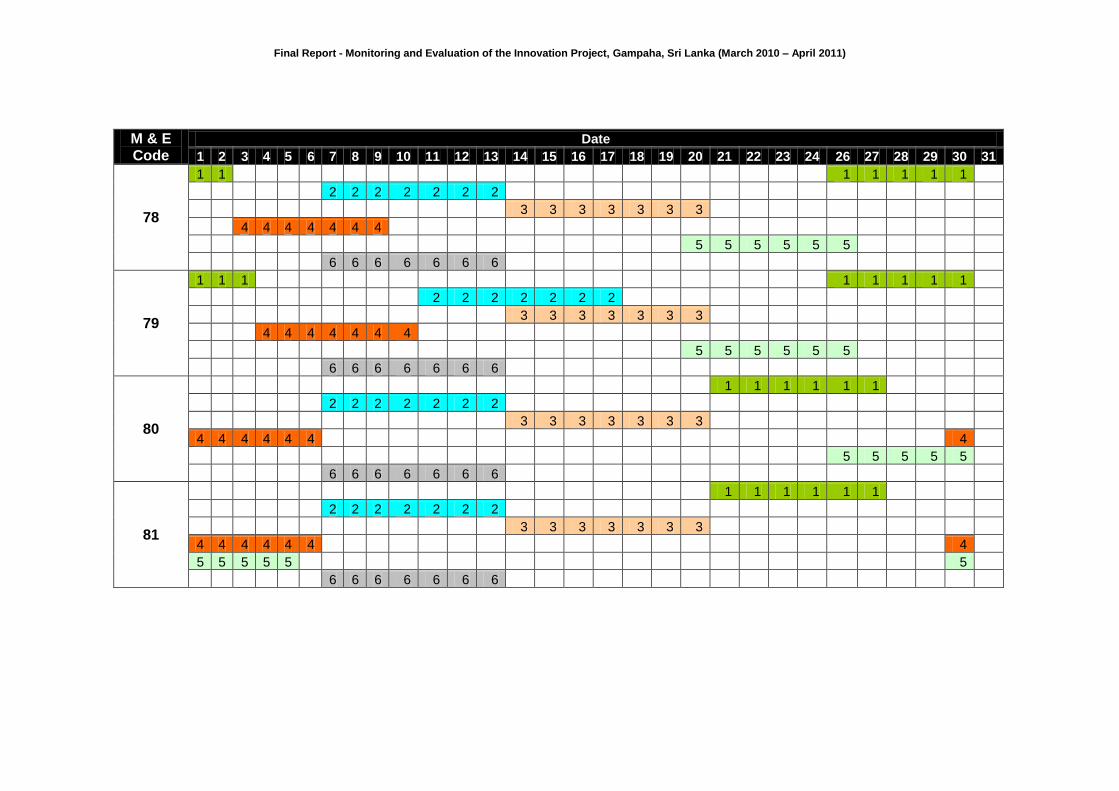
Final Report - Monitoring and Evaluation of the Innovation Project, Gampaha, Sri Lanka (March 2010 – April 2011)
M & E Code
Date
1 2 3 4 5 6 7 8 9 10 11 12 13 14 15 16 17 18 19 20 21 22 23 24 26 27 28 29 30 31
78
1 1 1 1 1 1 1
2 2 2 2 2 2 2
3 3 3 3 3 3 3
4 4 4 4 4 4 4
5 5 5 5 5 5
6 6 6 6 6 6 6
79
1 1 1 1 1 1 1 1
2 2 2 2 2 2 2
3 3 3 3 3 3 3
4 4 4 4 4 4 4
5 5 5 5 5 5
6 6 6 6 6 6 6
80
1 1 1 1 1 1
2 2 2 2 2 2 2
3 3 3 3 3 3 3
4 4 4 4 4 4 4
5 5 5 5 5
6 6 6 6 6 6 6
81
1 1 1 1 1 1
2 2 2 2 2 2 2
3 3 3 3 3 3 3
4 4 4 4 4 4 4
5 5 5 5 5 5
6 6 6 6 6 6 6
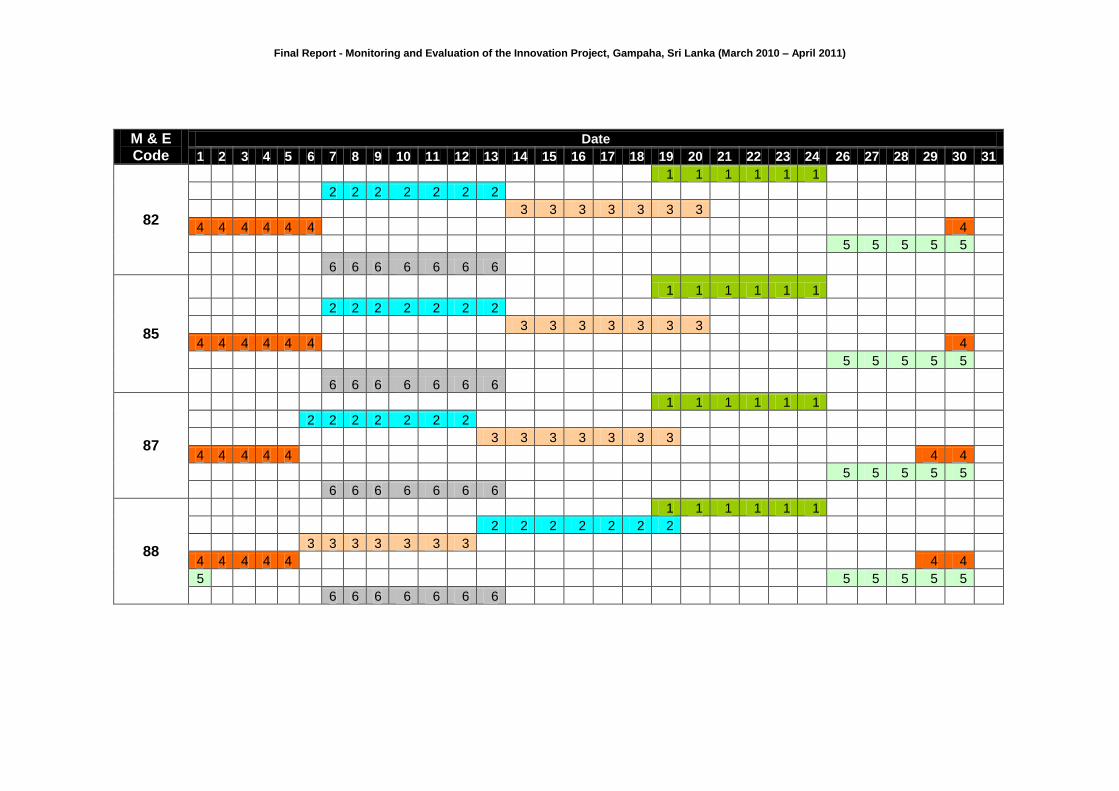
Final Report - Monitoring and Evaluation of the Innovation Project, Gampaha, Sri Lanka (March 2010 – April 2011)
M & E Code
Date
1 2 3 4 5 6 7 8 9 10 11 12 13 14 15 16 17 18 19 20 21 22 23 24 26 27 28 29 30 31
82
1 1 1 1 1 1
2 2 2 2 2 2 2
3 3 3 3 3 3 3
4 4 4 4 4 4 4
5 5 5 5 5
6 6 6 6 6 6 6
85
1 1 1 1 1 1
2 2 2 2 2 2 2
3 3 3 3 3 3 3
4 4 4 4 4 4 4
5 5 5 5 5
6 6 6 6 6 6 6
87
1 1 1 1 1 1
2 2 2 2 2 2 2
3 3 3 3 3 3 3
4 4 4 4 4 4 4
5 5 5 5 5
6 6 6 6 6 6 6
88
1 1 1 1 1 1
2 2 2 2 2 2 2
3 3 3 3 3 3 3
4 4 4 4 4 4 4
5 5 5 5 5 5
6 6 6 6 6 6 6
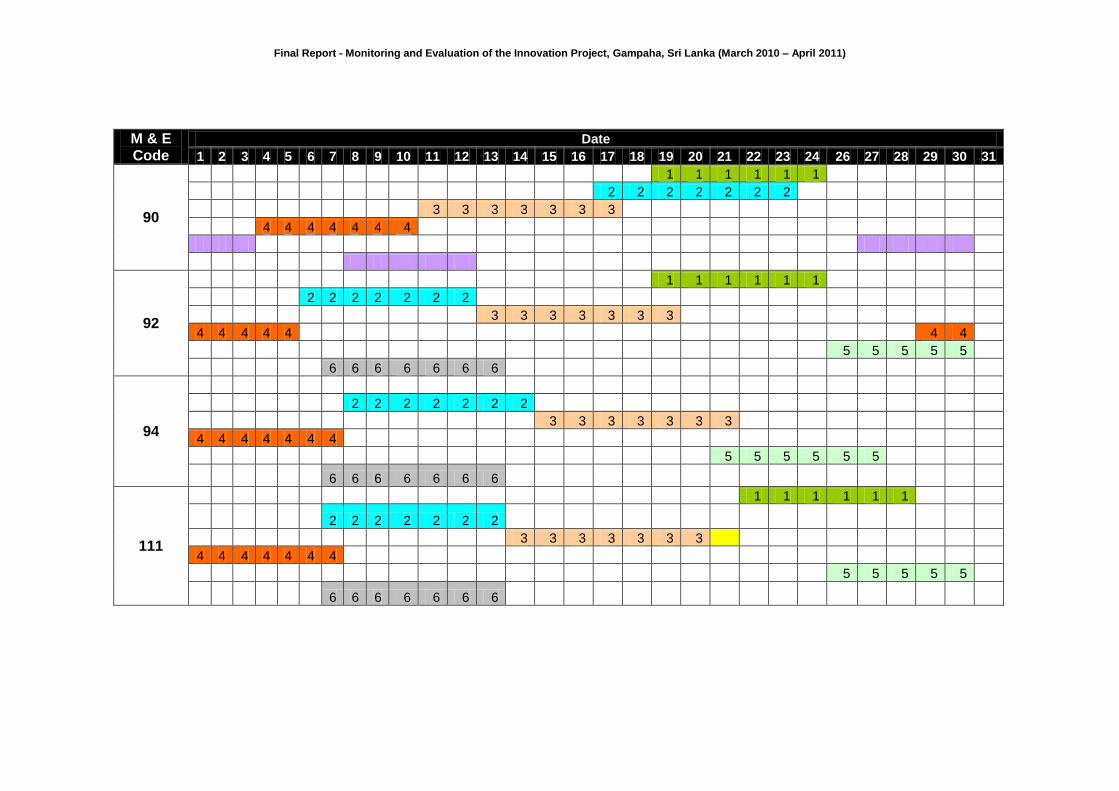
Final Report - Monitoring and Evaluation of the Innovation Project, Gampaha, Sri Lanka (March 2010 – April 2011)
M & E Code
Date
1 2 3 4 5 6 7 8 9 10 11 12 13 14 15 16 17 18 19 20 21 22 23 24 26 27 28 29 30 31
90
1 1 1 1 1 1
2 2 2 2 2 2 2
3 3 3 3 3 3 3
4 4 4 4 4 4 4
92
1 1 1 1 1 1
2 2 2 2 2 2 2
3 3 3 3 3 3 3
4 4 4 4 4 4 4
5 5 5 5 5
6 6 6 6 6 6 6
94
2 2 2 2 2 2 2
3 3 3 3 3 3 3
4 4 4 4 4 4 4
5 5 5 5 5 5
6 6 6 6 6 6 6
111
1 1 1 1 1 1
2 2 2 2 2 2 2
3 3 3 3 3 3 3
4 4 4 4 4 4 4
5 5 5 5 5
6 6 6 6 6 6 6
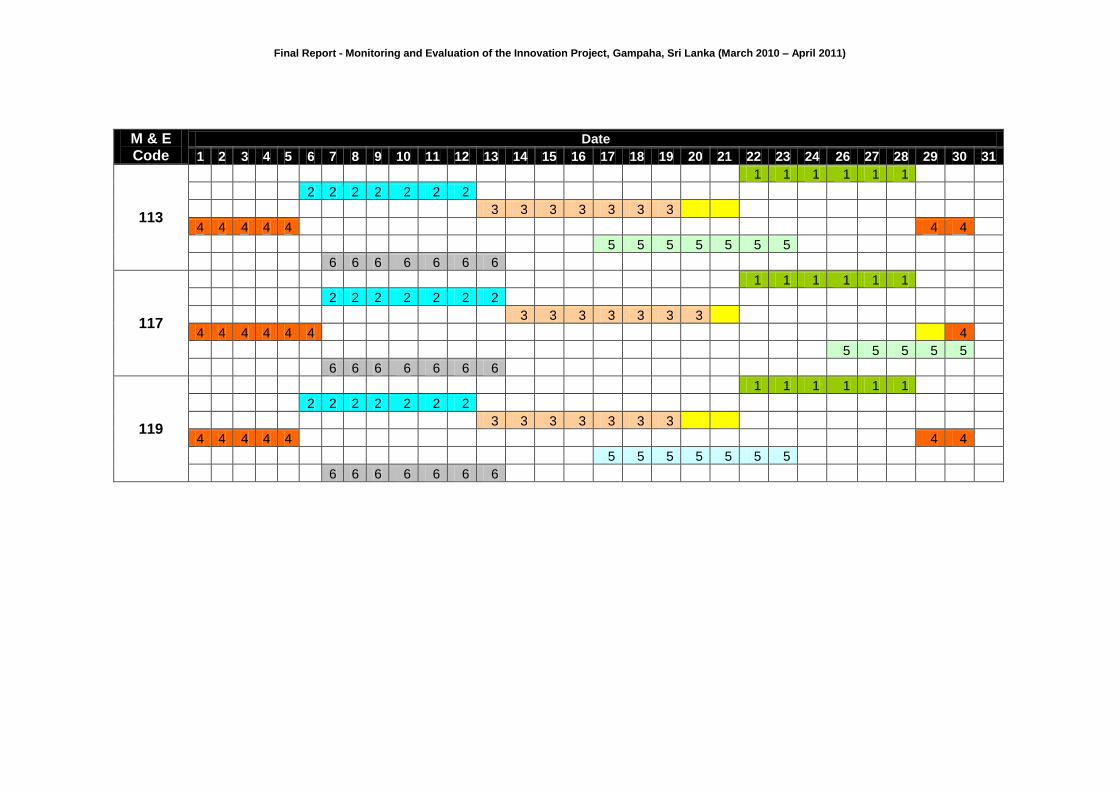
Final Report - Monitoring and Evaluation of the Innovation Project, Gampaha, Sri Lanka (March 2010 – April 2011)
M & E Code
Date
1 2 3 4 5 6 7 8 9 10 11 12 13 14 15 16 17 18 19 20 21 22 23 24 26 27 28 29 30 31
113
1 1 1 1 1 1
2 2 2 2 2 2 2
3 3 3 3 3 3 3
4 4 4 4 4 4 4
5 5 5 5 5 5 5
6 6 6 6 6 6 6
117
1 1 1 1 1 1
2 2 2 2 2 2 2
3 3 3 3 3 3 3
4 4 4 4 4 4 4
5 5 5 5 5
6 6 6 6 6 6 6
119
1 1 1 1 1 1
2 2 2 2 2 2 2
3 3 3 3 3 3 3
4 4 4 4 4 4 4
5 5 5 5 5 5 5
6 6 6 6 6 6 6
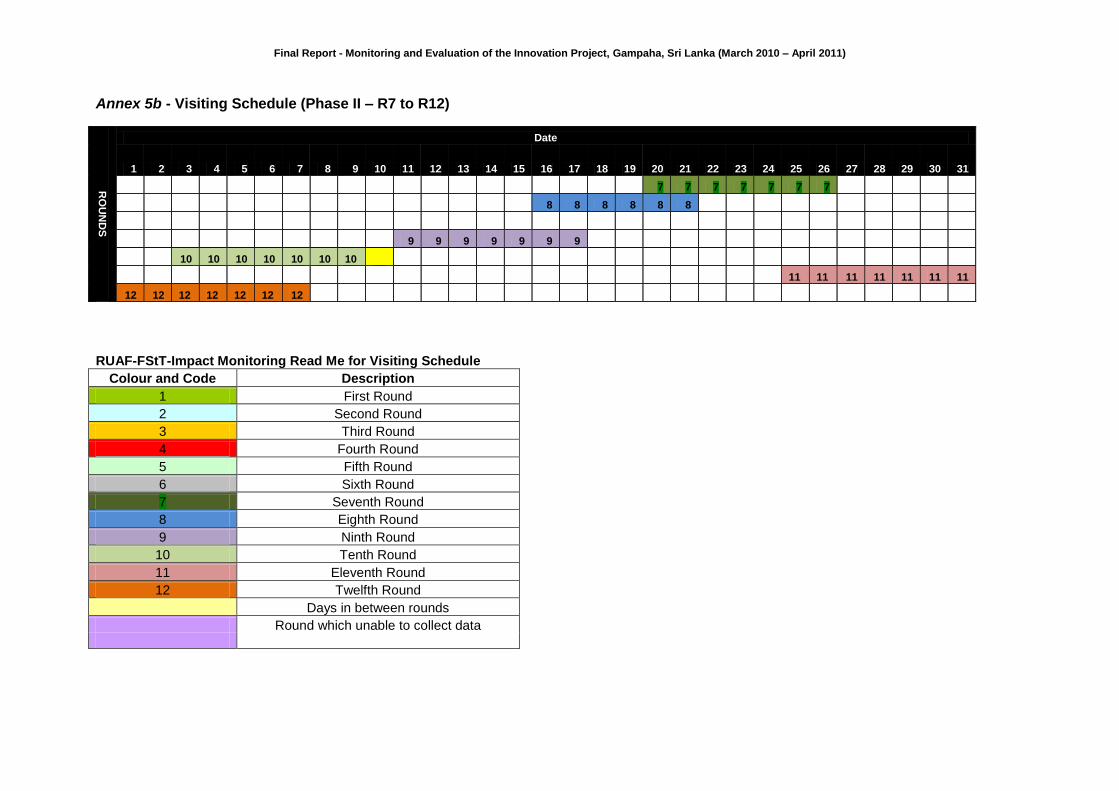
Final Report - Monitoring and Evaluation of the Innovation Project, Gampaha, Sri Lanka (March 2010 – April 2011)
Annex 5b - Visiting Schedule (Phase II – R7 to R12)
RO
UN
DS
Date
1 2 3 4 5 6 7 8 9 10 11 12 13 14 15 16 17 18 19 20 21 22 23 24 25 26 27 28 29 30 31
7 7 7 7 7 7 7
8 8 8 8 8 8
9 9 9 9 9 9 9
10 10 10 10 10 10 10
11 11 11 11 11 11 11
12 12 12 12 12 12 12
RUAF-FStT-Impact Monitoring Read Me for Visiting Schedule
Colour and Code Description
1 First Round
2 Second Round
3 Third Round
4 Fourth Round
5 Fifth Round
6 Sixth Round
7 Seventh Round
8 Eighth Round
9 Ninth Round
10 Tenth Round
11 Eleventh Round
12 Twelfth Round
Days in between rounds
Round which unable to collect data
RO
UN
DS
Date
1 2 3 4 5 6 7 8 9 10 11 12 13 14 15 16 17 18 19 20 21 22 23 24 25 26 27 28 29 30 31
7 7 7 7 7 7 7
8 8 8 8 8 8
9 9 9 9 9 9 9
10 10 10 10 10 10 10
11 11 11 11 11 11 11
12 12 12 12 12 12 12
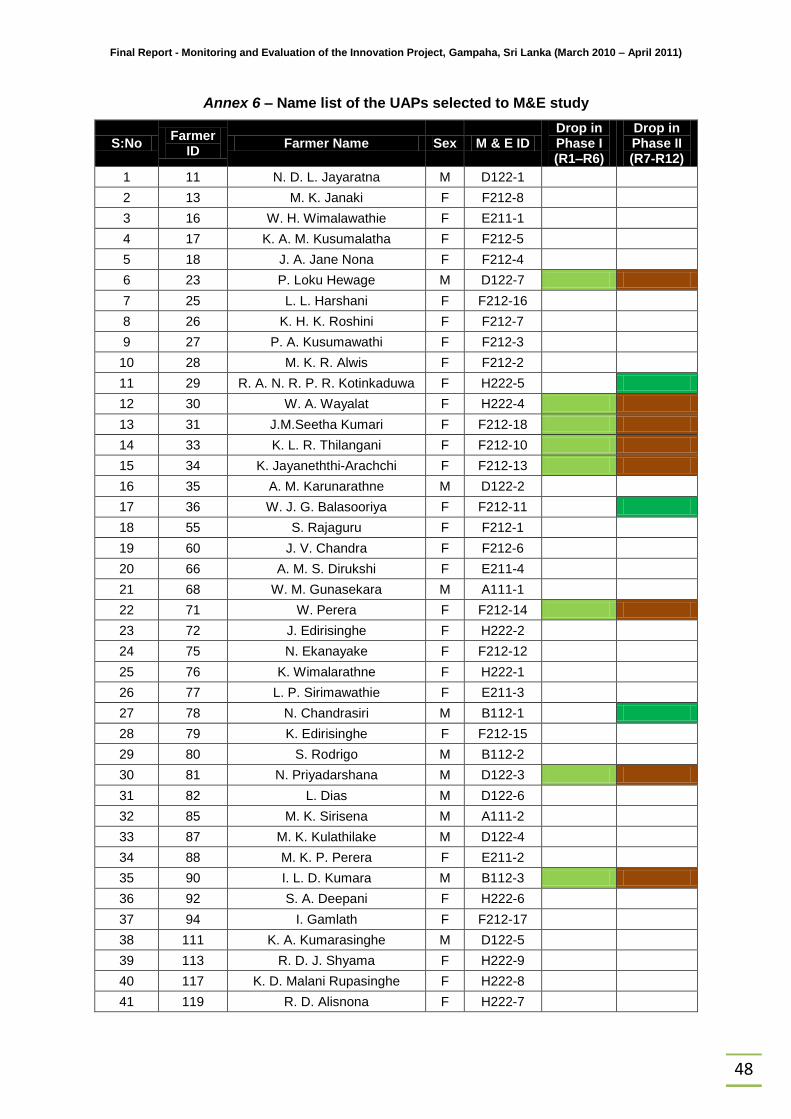
Final Report - Monitoring and Evaluation of the Innovation Project, Gampaha, Sri Lanka (March 2010 – April 2011)
48
Annex 6 – Name list of the UAPs selected to M&E study
S:No Farmer
ID Farmer Name Sex M & E ID
Drop in Phase I (R1–R6)
Drop in Phase II (R7-R12)
1 11 N. D. L. Jayaratna M D122-1
2 13 M. K. Janaki F F212-8
3 16 W. H. Wimalawathie F E211-1
4 17 K. A. M. Kusumalatha F F212-5
5 18 J. A. Jane Nona F F212-4
6 23 P. Loku Hewage M D122-7
7 25 L. L. Harshani F F212-16
8 26 K. H. K. Roshini F F212-7
9 27 P. A. Kusumawathi F F212-3
10 28 M. K. R. Alwis F F212-2
11 29 R. A. N. R. P. R. Kotinkaduwa F H222-5
12 30 W. A. Wayalat F H222-4
13 31 J.M.Seetha Kumari F F212-18
14 33 K. L. R. Thilangani F F212-10
15 34 K. Jayaneththi-Arachchi F F212-13
16 35 A. M. Karunarathne M D122-2
17 36 W. J. G. Balasooriya F F212-11
18 55 S. Rajaguru F F212-1
19 60 J. V. Chandra F F212-6
20 66 A. M. S. Dirukshi F E211-4
21 68 W. M. Gunasekara M A111-1
22 71 W. Perera F F212-14
23 72 J. Edirisinghe F H222-2
24 75 N. Ekanayake F F212-12
25 76 K. Wimalarathne F H222-1
26 77 L. P. Sirimawathie F E211-3
27 78 N. Chandrasiri M B112-1
28 79 K. Edirisinghe F F212-15
29 80 S. Rodrigo M B112-2
30 81 N. Priyadarshana M D122-3
31 82 L. Dias M D122-6
32 85 M. K. Sirisena M A111-2
33 87 M. K. Kulathilake M D122-4
34 88 M. K. P. Perera F E211-2
35 90 I. L. D. Kumara M B112-3
36 92 S. A. Deepani F H222-6
37 94 I. Gamlath F F212-17
38 111 K. A. Kumarasinghe M D122-5
39 113 R. D. J. Shyama F H222-9
40 117 K. D. Malani Rupasinghe F H222-8
41 119 R. D. Alisnona F H222-7
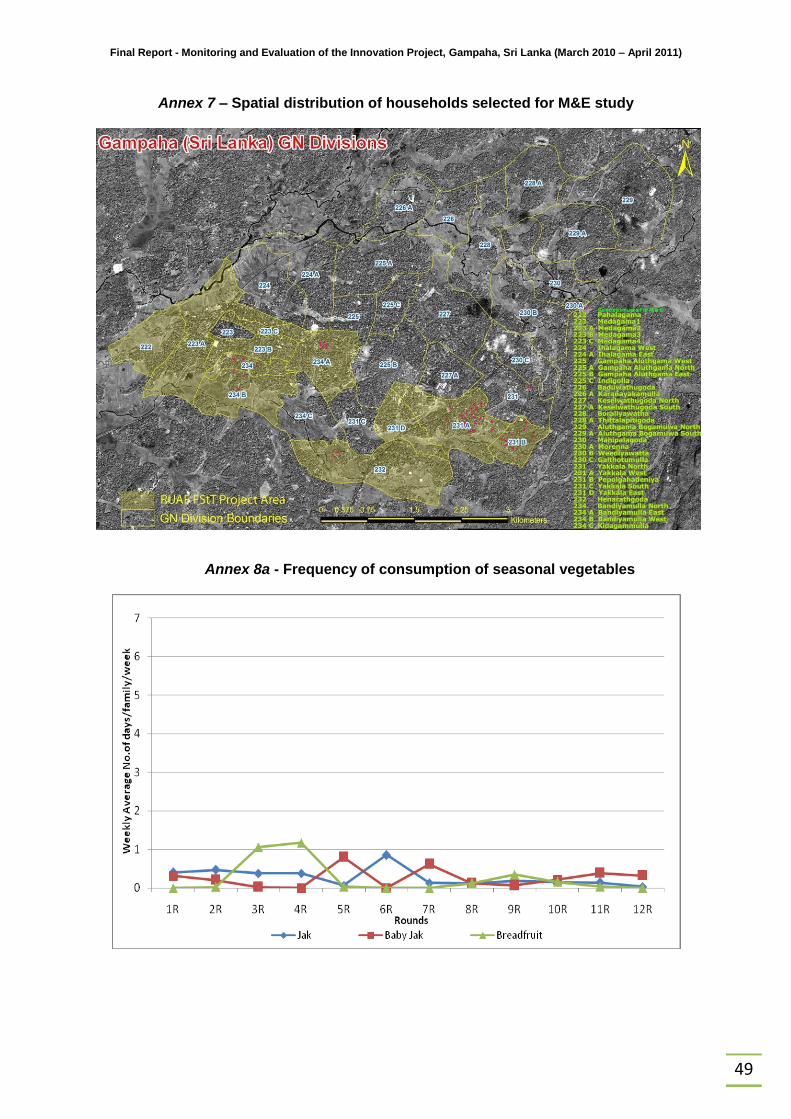
Final Report - Monitoring and Evaluation of the Innovation Project, Gampaha, Sri Lanka (March 2010 – April 2011)
49
Annex 7 – Spatial distribution of households selected for M&E study
Annex 8a - Frequency of consumption of seasonal vegetables
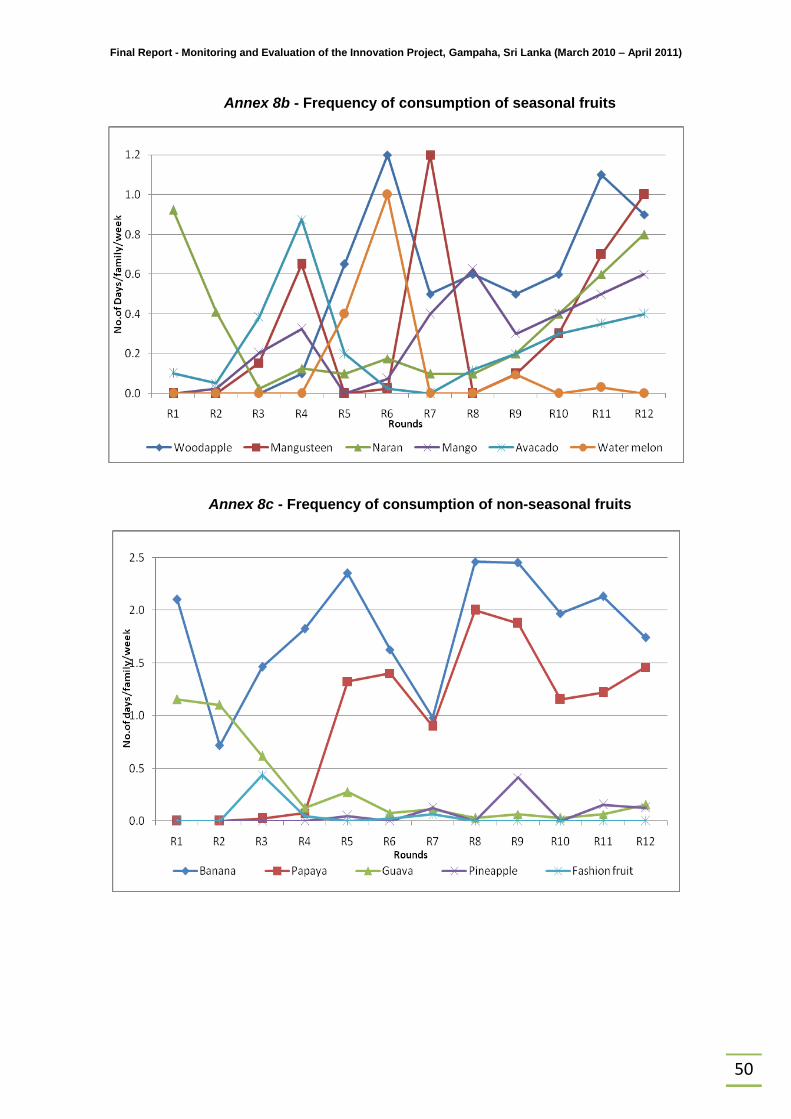
Final Report - Monitoring and Evaluation of the Innovation Project, Gampaha, Sri Lanka (March 2010 – April 2011)
50
Annex 8b - Frequency of consumption of seasonal fruits
Annex 8c - Frequency of consumption of non-seasonal fruits
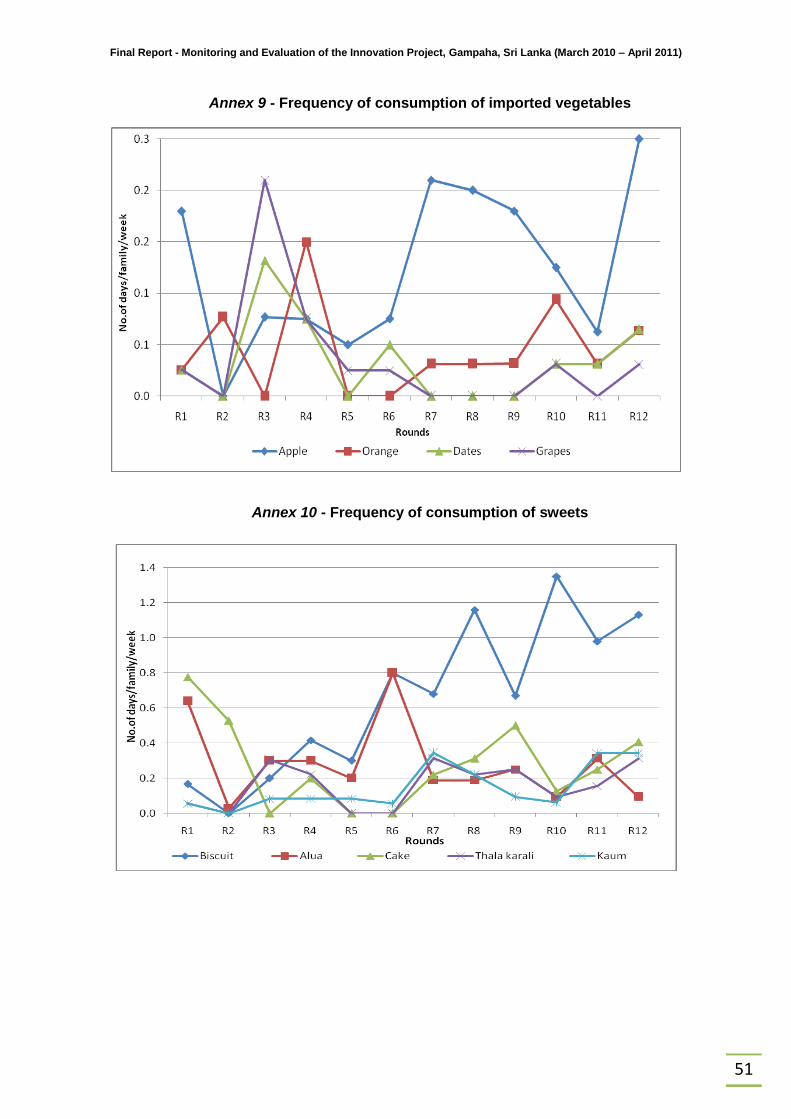
Final Report - Monitoring and Evaluation of the Innovation Project, Gampaha, Sri Lanka (March 2010 – April 2011)
51
Annex 9 - Frequency of consumption of imported vegetables
Annex 10 - Frequency of consumption of sweets
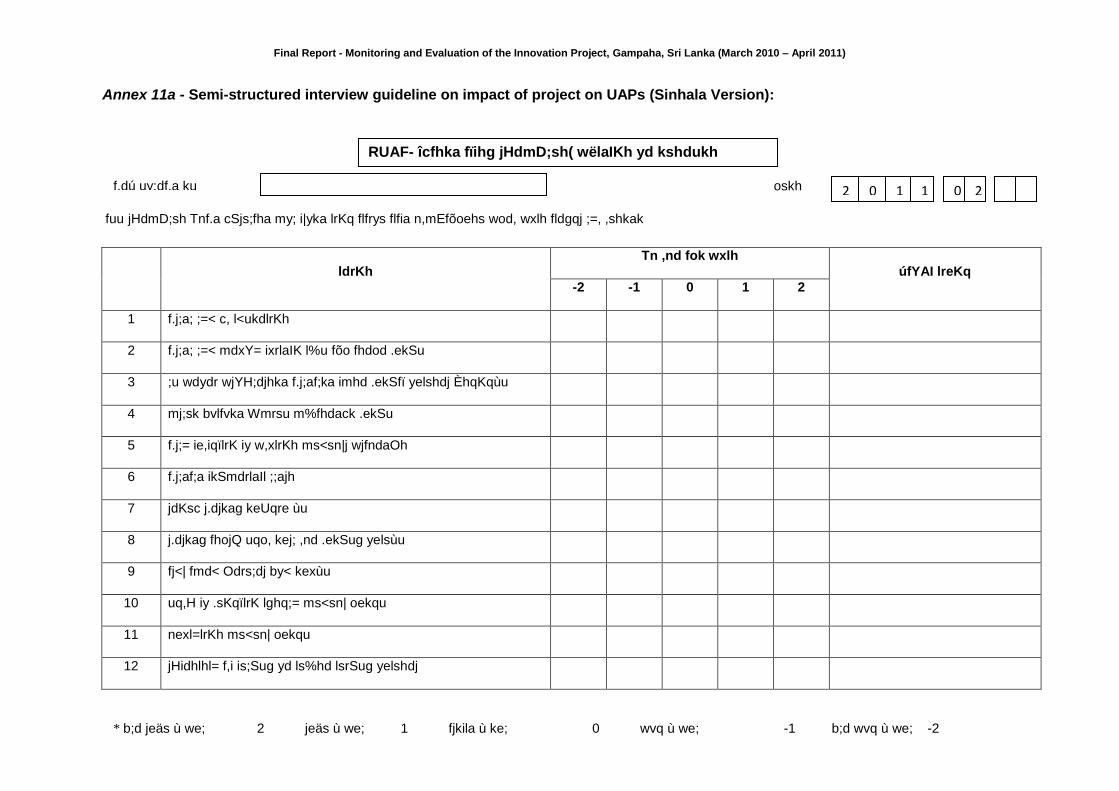
Final Report - Monitoring and Evaluation of the Innovation Project, Gampaha, Sri Lanka (March 2010 – April 2011)
fuu jHdmD;sh Tnf.a cSjs;fha my; i|yka lrKq flfrys flfia n,mEfõoehs wod, wxlh fldgqj ;=, ,shkak
ldrKh
Tn ,nd fok wxlh
úfYAI lreKq
-2 -1 0 1 2
1 f.j;a; ;=< c, l<ukdlrKh
2 f.j;a; ;=< mdxY= ixrlaIK l%u fõo fhdod .ekSu
3 ;u wdydr wjYH;djhka f.j;af;ka imhd .ekSfï yelshdj ÈhqKqùu
4 mj;sk bvlfvka Wmrsu m%fhdack .ekSu
5 f.j;= ie,iqïlrK iy w,xlrKh ms<sn|j wjfndaOh
6 f.j;af;a ikSmdrlaIl ;;ajh
7 jdKsc j.djkag keUqre ùu
8 j.djkag fhojQ uqo, kej; ,nd .ekSug yelsùu
9 fj<| fmd< Odrs;dj by< kexùu
10 uq,H iy .sKqïlrK lghq;= ms<sn| oekqu
11 nexl=lrKh ms<sn| oekqu
12 jHidhlhl= f,i is;Sug yd ls%hd lsrSug yelshdj
oskh 2 0 1 1 0
2
2 f.dú uy;df.a ku
* b;d jeäs ù we; 2 jeäs ù we; 1 fjkila ù ke; 0 wvq ù we; -1 b;d wvq ù we; -2
Annex 11a - Semi-structured interview guideline on impact of project on UAPs (Sinhala Version):
RUAF- îcfhka fïihg jHdmD;sh( wëlaIKh yd kshdukh
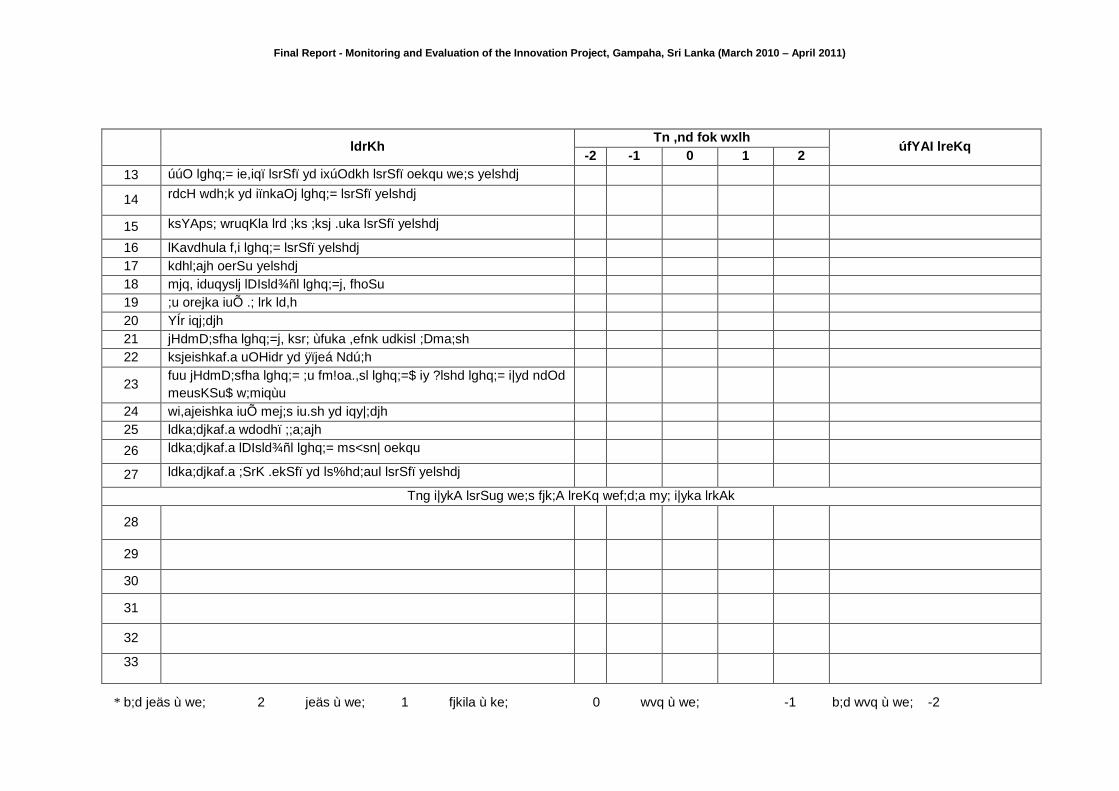
Final Report - Monitoring and Evaluation of the Innovation Project, Gampaha, Sri Lanka (March 2010 – April 2011)
ldrKh Tn ,nd fok wxlh
úfYAI lreKq -2 -1 0 1 2
13 úúO lghq;= ie,iqï lsrSfï yd ixúOdkh lsrSfï oekqu we;s yelshdj
14 rdcH wdh;k yd iïnkaOj lghq;= lsrSfï yelshdj
15 ksYAps; wruqKla lrd ;ks ;ksj .uka lsrSfï yelshdj
16 lKavdhula f,i lghq;= lsrSfï yelshdj
17 kdhl;ajh oerSu yelshdj
18 mjq, iduqyslj lDIsld¾ñl lghq;=j, fhoSu
19 ;u orejka iuÕ .; lrk ld,h
20 YÍr iqj;djh
21 jHdmD;sfha lghq;=j, ksr; ùfuka ,efnk udkisl ;Dma;sh
22 ksjeishkaf.a uOHidr yd ÿïjeá Ndú;h
23 fuu jHdmD;sfha lghq;= ;u fm!oa.,sl lghq;=$ iy ?lshd lghq;= i|yd ndOd
meusKSu$ w;miqùu
24 wi,ajeishka iuÕ mej;s iu.sh yd iqy|;djh
25 ldka;djkaf.a wdodhï ;;a;ajh
26 ldka;djkaf.a lDIsld¾ñl lghq;= ms<sn| oekqu
27 ldka;djkaf.a ;SrK .ekSfï yd ls%hd;aul lsrSfï yelshdj
Tng i|ykA lsrSug we;s fjk;A lreKq wef;d;a my; i|yka lrkAk
28
29
30
31
32
33
* b;d jeäs ù we; 2 jeäs ù we; 1 fjkila ù ke; 0 wvq ù we; -1 b;d wvq ù we; -2
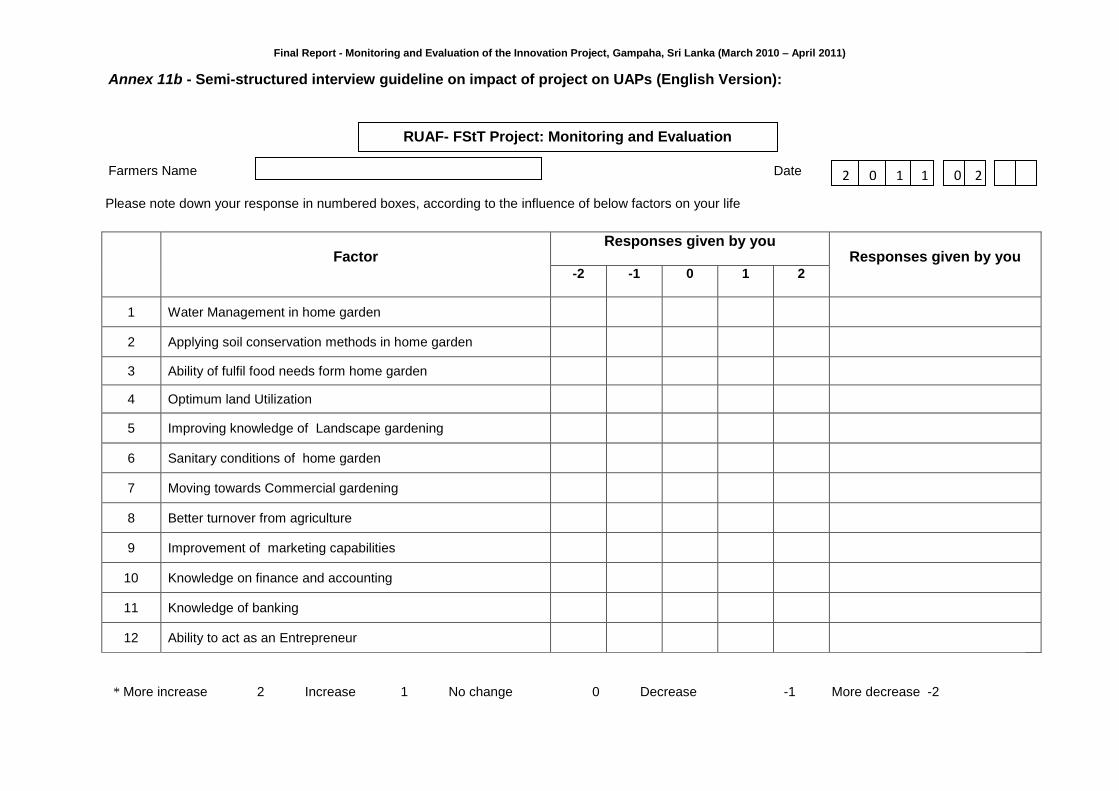
Final Report - Monitoring and Evaluation of the Innovation Project, Gampaha, Sri Lanka (March 2010 – April 2011)
Please note down your response in numbered boxes, according to the influence of below factors on your life
Factor Responses given by you
Responses given by you -2 -1 0 1 2
1 Water Management in home garden
2 Applying soil conservation methods in home garden
3 Ability of fulfil food needs form home garden
4 Optimum land Utilization
5 Improving knowledge of Landscape gardening
6 Sanitary conditions of home garden
7 Moving towards Commercial gardening
8 Better turnover from agriculture
9 Improvement of marketing capabilities
10 Knowledge on finance and accounting
11 Knowledge of banking
12 Ability to act as an Entrepreneur
Date 2 0 1 1 0
2
2 Farmers Name
* More increase 2 Increase 1 No change 0 Decrease -1 More decrease -2
Annex 11b - Semi-structured interview guideline on impact of project on UAPs (English Version):
RUAF- FStT Project: Monitoring and Evaluation
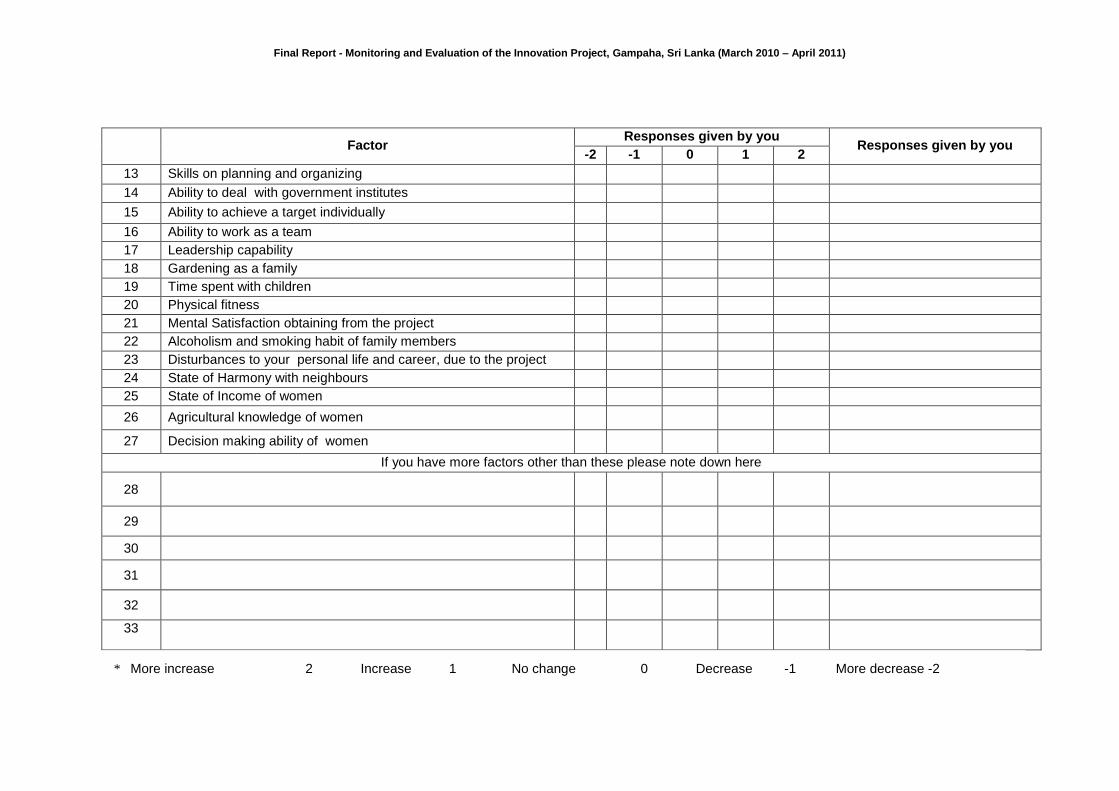
Final Report - Monitoring and Evaluation of the Innovation Project, Gampaha, Sri Lanka (March 2010 – April 2011)
Factor Responses given by you
Responses given by you -2 -1 0 1 2
13 Skills on planning and organizing
14 Ability to deal with government institutes
15 Ability to achieve a target individually
16 Ability to work as a team
17 Leadership capability
18 Gardening as a family
19 Time spent with children
20 Physical fitness
21 Mental Satisfaction obtaining from the project
22 Alcoholism and smoking habit of family members
23 Disturbances to your personal life and career, due to the project
24 State of Harmony with neighbours
25 State of Income of women
26 Agricultural knowledge of women
27 Decision making ability of women
If you have more factors other than these please note down here
28
29
30
31
32
33
* More increase 2 Increase 1 No change 0 Decrease -1 More decrease -2
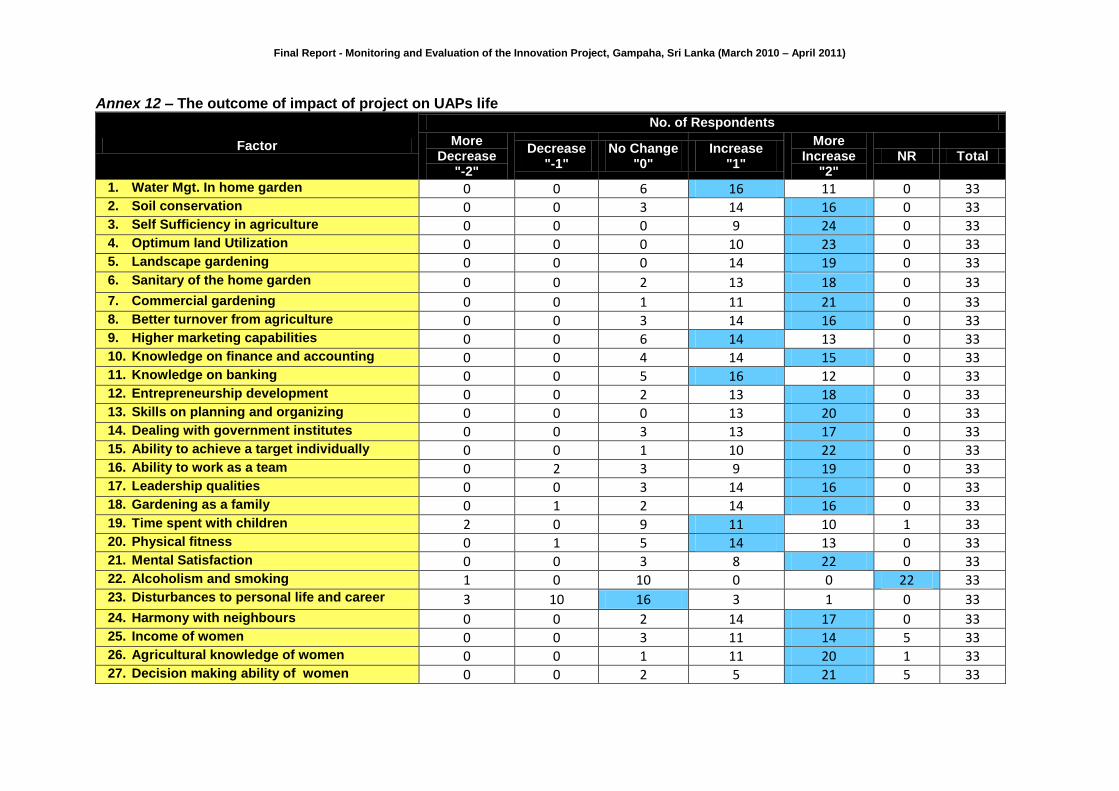
Final Report - Monitoring and Evaluation of the Innovation Project, Gampaha, Sri Lanka (March 2010 – April 2011)
Annex 12 – The outcome of impact of project on UAPs life
Factor
No. of Respondents
More Decrease
"-2"
Decrease "-1"
No Change "0"
Increase "1"
More Increase
"2" NR Total
1. Water Mgt. In home garden 0 0 6 16 11 0 33 2. Soil conservation 0 0 3 14 16 0 33 3. Self Sufficiency in agriculture 0 0 0 9 24 0 33 4. Optimum land Utilization 0 0 0 10 23 0 33 5. Landscape gardening 0 0 0 14 19 0 33 6. Sanitary of the home garden 0 0 2 13 18 0 33 7. Commercial gardening 0 0 1 11 21 0 33 8. Better turnover from agriculture 0 0 3 14 16 0 33 9. Higher marketing capabilities 0 0 6 14 13 0 33 10. Knowledge on finance and accounting 0 0 4 14 15 0 33 11. Knowledge on banking 0 0 5 16 12 0 33 12. Entrepreneurship development 0 0 2 13 18 0 33 13. Skills on planning and organizing 0 0 0 13 20 0 33 14. Dealing with government institutes 0 0 3 13 17 0 33 15. Ability to achieve a target individually 0 0 1 10 22 0 33 16. Ability to work as a team 0 2 3 9 19 0 33 17. Leadership qualities 0 0 3 14 16 0 33 18. Gardening as a family 0 1 2 14 16 0 33 19. Time spent with children 2 0 9 11 10 1 33 20. Physical fitness 0 1 5 14 13 0 33 21. Mental Satisfaction 0 0 3 8 22 0 33 22. Alcoholism and smoking 1 0 10 0 0 22 33 23. Disturbances to personal life and career 3 10 16 3 1 0 33 24. Harmony with neighbours 0 0 2 14 17 0 33 25. Income of women 0 0 3 11 14 5 33 26. Agricultural knowledge of women 0 0 1 11 20 1 33 27. Decision making ability of women 0 0 2 5 21 5 33
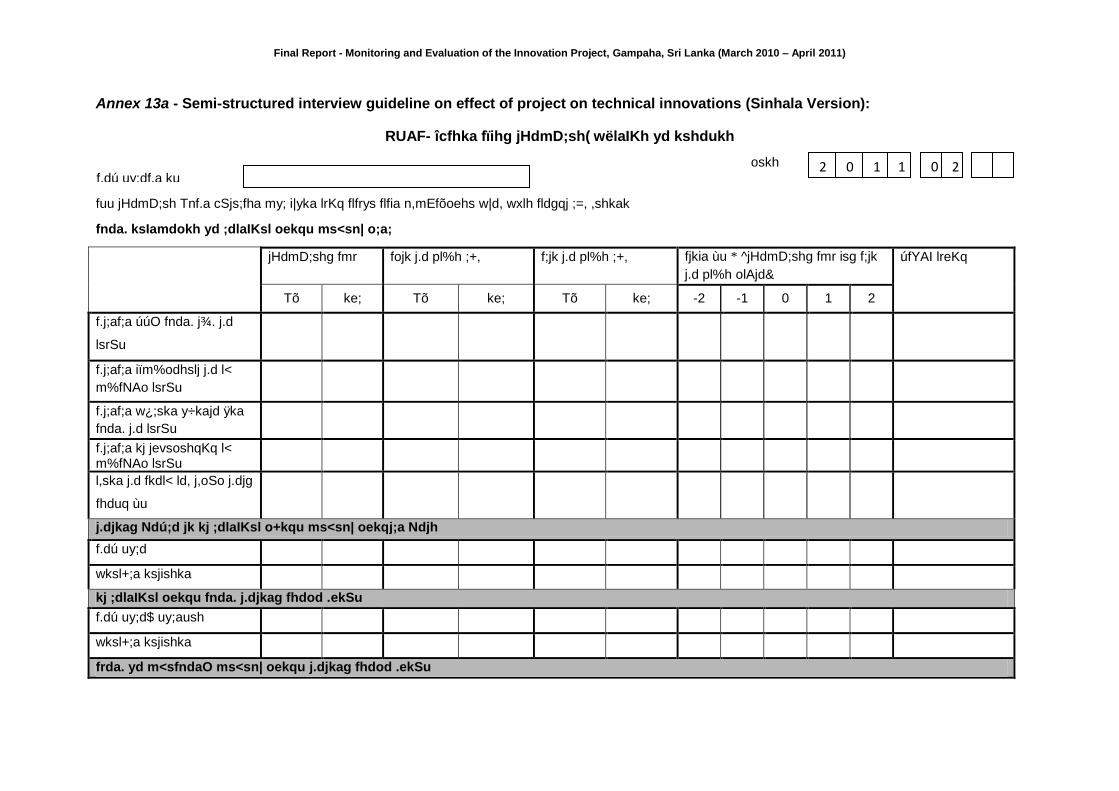
Final Report - Monitoring and Evaluation of the Innovation Project, Gampaha, Sri Lanka (March 2010 – April 2011)
Annex 13a - Semi-structured interview guideline on effect of project on technical innovations (Sinhala Version):
RUAF- îcfhka fïihg jHdmD;sh( wëlaIKh yd kshdukh
fuu jHdmD;sh Tnf.a cSjs;fha my; i|yka lrKq flfrys flfia n,mEfõoehs w|d, wxlh fldgqj ;=, ,shkak
fnda. ksIamdokh yd ;dlaIKsl oekqu ms<sn| o;a;
jHdmD;shg fmr fojk j.d pl%h ;+, f;jk j.d pl%h ;+, fjkia ùu * ^jHdmD;shg fmr isg f;jk
j.d pl%h olAjd&
úfYAI lreKq
Tõ ke; Tõ ke; Tõ ke; -2 -1 0 1 2
f.j;af;a úúO fnda. j¾. j.d
lsrSu
f.j;af;a iïm%odhslj j.d l<
m%fNAo lsrSu
f.j;af;a w¿;ska y÷kajd ÿka
fnda. j.d lsrSu
f.j;af;a kj jevsoshqKq l< m%fNAo lsrSu
l,ska j.d fkdl< ld, j,oSo j.djg
fhduq ùu
j.djkag Ndú;d jk kj ;dlaIKsl o+kqu ms<sn| oekqj;a Ndjh
f.dú uy;d
wksl+;a ksjishka
kj ;dlaIKsl oekqu fnda. j.djkag fhdod .ekSu
f.dú uy;d$ uy;aush
wksl+;a ksjishka
frda. yd m<sfndaO ms<sn| oekqu j.djkag fhdod .ekSu
f.dú uy;df.a ku oskh 2 0 1 1 0
2
2
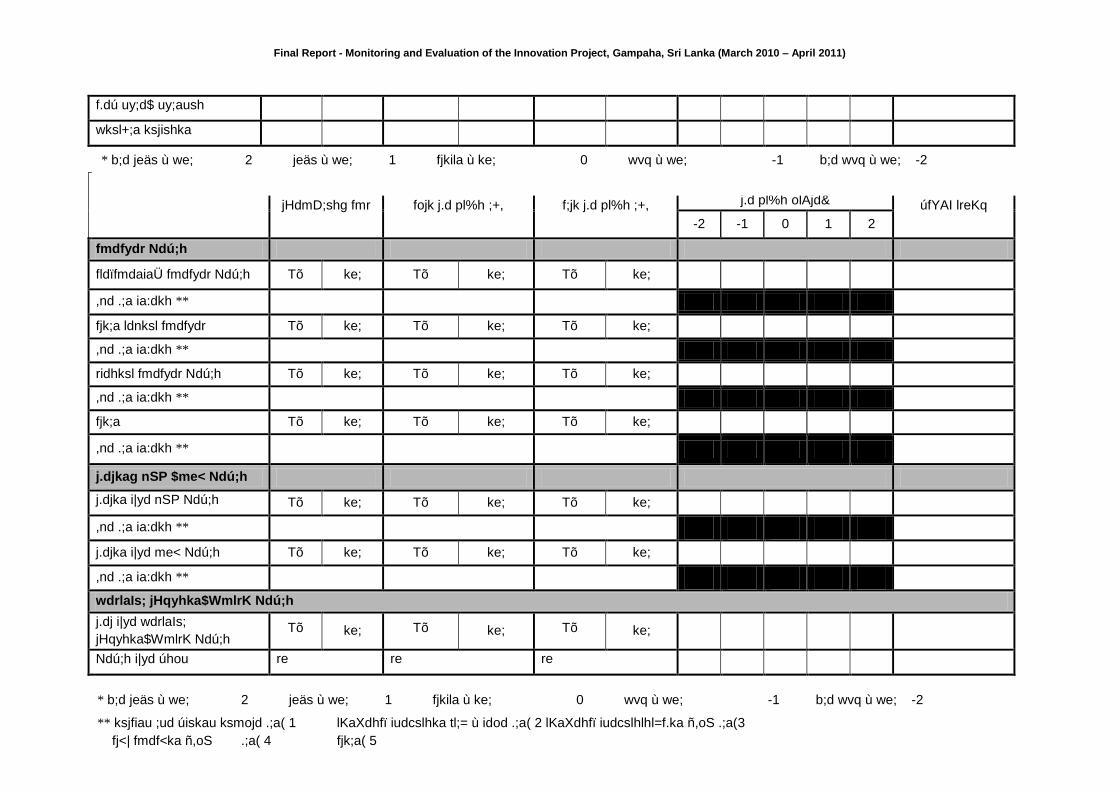
Final Report - Monitoring and Evaluation of the Innovation Project, Gampaha, Sri Lanka (March 2010 – April 2011)
f.dú uy;d$ uy;aush
wksl+;a ksjishka
fhojqï" fj<| fmd< yd fjk;a há;, myiqlï ixj¾Okh
jHdmD;shg fmr fojk j.d pl%h ;+, f;jk j.d pl%h ;+,
fjkia ùu * ^jHdmD;shg fmr isg f;jk
j.d pl%h olAjd& úfYAI lreKq
-2 -1 0 1 2
fmdfydr Ndú;h
fldïfmdaiaÜ fmdfydr Ndú;h Tõ ke; Tõ ke; Tõ ke;
,nd .;a ia:dkh **
fjk;a ldnksl fmdfydr Tõ ke; Tõ ke; Tõ ke;
,nd .;a ia:dkh **
ridhksl fmdfydr Ndú;h Tõ ke; Tõ ke; Tõ ke;
,nd .;a ia:dkh **
fjk;a Tõ ke; Tõ ke; Tõ ke;
,nd .;a ia:dkh **
j.djkag nSP $me< Ndú;h
j.djka i|yd nSP Ndú;h Tõ ke; Tõ ke; Tõ ke;
,nd .;a ia:dkh **
j.djka i|yd me< Ndú;h Tõ ke; Tõ ke; Tõ ke;
,nd .;a ia:dkh **
wdrlaIs; jHqyhka$WmlrK Ndú;h
j.dj i|yd wdrlaIs;
jHqyhka$WmlrK Ndú;h Tõ ke; Tõ ke; Tõ ke;
Ndú;h i|yd úhou re re re
* b;d jeäs ù we; 2 jeäs ù we; 1 fjkila ù ke; 0 wvq ù we; -1 b;d wvq ù we; -2
** ksjfiau ;ud úiskau ksmojd .;a( 1 lKaXdhfï iudcslhka tl;= ù idod .;a( 2 lKaXdhfï iudcslhlhl=f.ka ñ,oS .;a(3
fj<| fmdf<ka ñ,oS .;a( 4 fjk;a( 5
* b;d jeäs ù we; 2 jeäs ù we; 1 fjkila ù ke; 0 wvq ù we; -1 b;d wvq ù we; -2
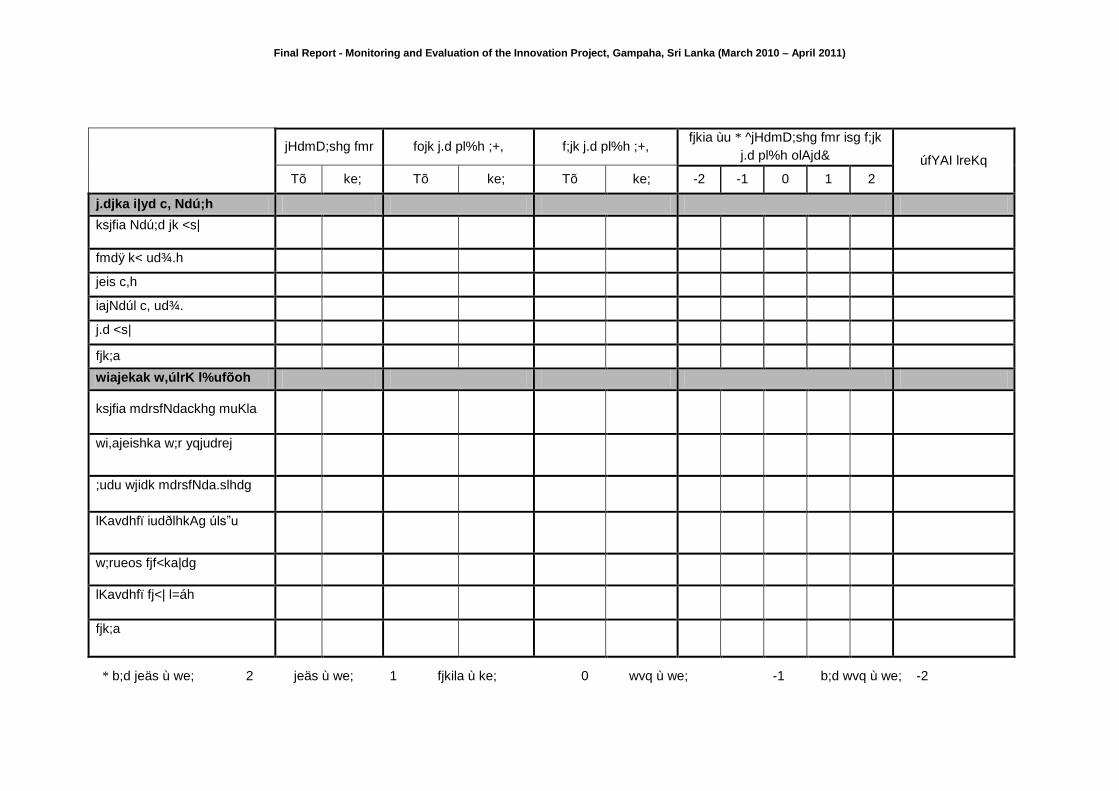
Final Report - Monitoring and Evaluation of the Innovation Project, Gampaha, Sri Lanka (March 2010 – April 2011)
jHdmD;shg fmr fojk j.d pl%h ;+, f;jk j.d pl%h ;+,
fjkia ùu * ^jHdmD;shg fmr isg f;jk
j.d pl%h olAjd& úfYAI lreKq
Tõ ke; Tõ ke; Tõ ke; -2 -1 0 1 2
j.djka i|yd c, Ndú;h
ksjfia Ndú;d jk <s|
fmdÿ k< ud¾.h
jeis c,h
iajNdúl c, ud¾.
j.d <s|
fjk;a
wiajekak w,úlrK l%ufõoh
ksjfia mdrsfNdackhg muKla
wi,ajeishka w;r yqjudrej
;udu wjidk mdrsfNda.slhdg
lKavdhfï iudðlhkAg úls”u
w;rueos fjf<ka|dg
lKavdhfï fj<| l=áh
fjk;a
* b;d jeäs ù we; 2 jeäs ù we; 1 fjkila ù ke; 0 wvq ù we; -1 b;d wvq ù we; -2
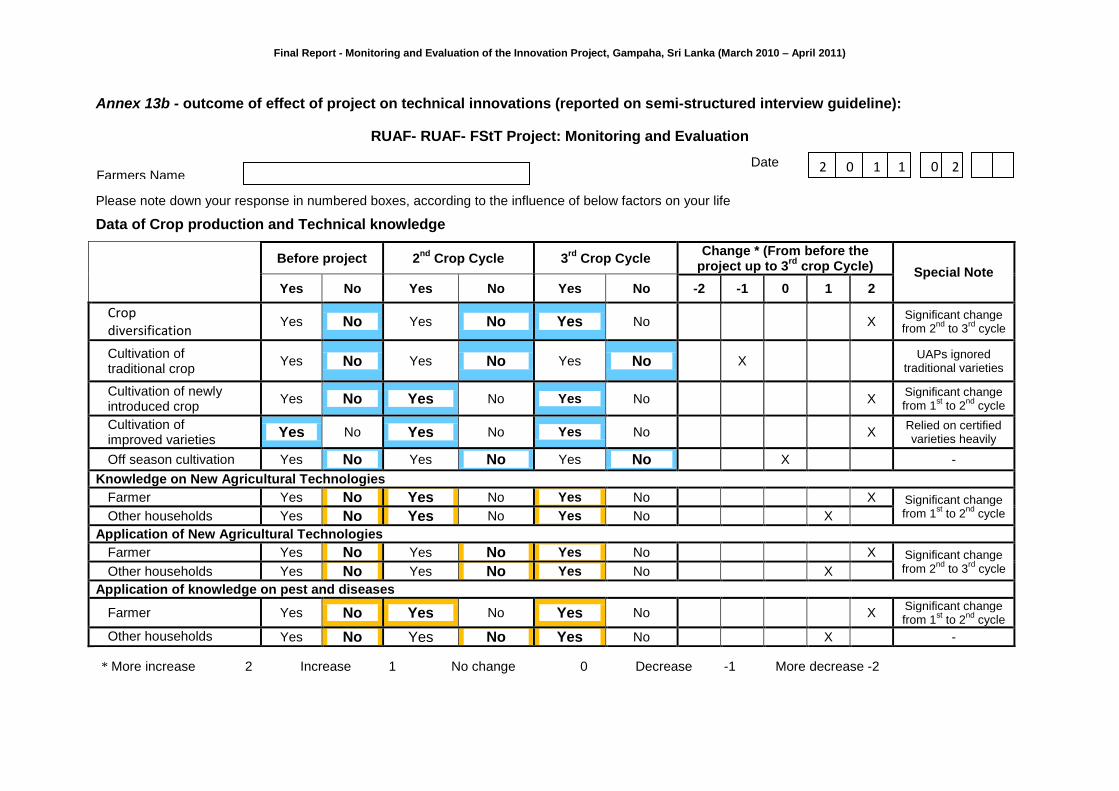
Final Report - Monitoring and Evaluation of the Innovation Project, Gampaha, Sri Lanka (March 2010 – April 2011)
Annex 13b - outcome of effect of project on technical innovations (reported on semi-structured interview guideline):
RUAF- RUAF- FStT Project: Monitoring and Evaluation
Please note down your response in numbered boxes, according to the influence of below factors on your life
Data of Crop production and Technical knowledge
Before project 2
nd Crop Cycle 3
rd Crop Cycle
Change * (From before the project up to 3
rd crop Cycle)
Special Note
Yes No Yes No Yes No -2 -1 0 1 2
Crop diversification
Yes No Yes No Yes No X Significant change from 2
nd to 3
rd cycle
Cultivation of traditional crop
Yes No Yes No Yes No X UAPs ignored
traditional varieties
Cultivation of newly introduced crop
Yes No Yes No Yes No X Significant change from 1
st to 2
nd cycle
Cultivation of improved varieties
Yes No Yes No Yes No X Relied on certified varieties heavily
Off season cultivation Yes No Yes No Yes No X -
Knowledge on New Agricultural Technologies
Farmer Yes No Yes No Yes No X Significant change from 1
st to 2
nd cycle Other households Yes No Yes No Yes No X
Application of New Agricultural Technologies
Farmer Yes No Yes No Yes No X Significant change from 2
nd to 3
rd cycle Other households Yes No Yes No Yes No X
Application of knowledge on pest and diseases
Farmer Yes No Yes No Yes No X Significant change from 1
st to 2
nd cycle
Other households Yes No Yes No Yes No X -
Farmers Name Date 2 0 1 1 0
2
2
* More increase 2 Increase 1 No change 0 Decrease -1 More decrease -2
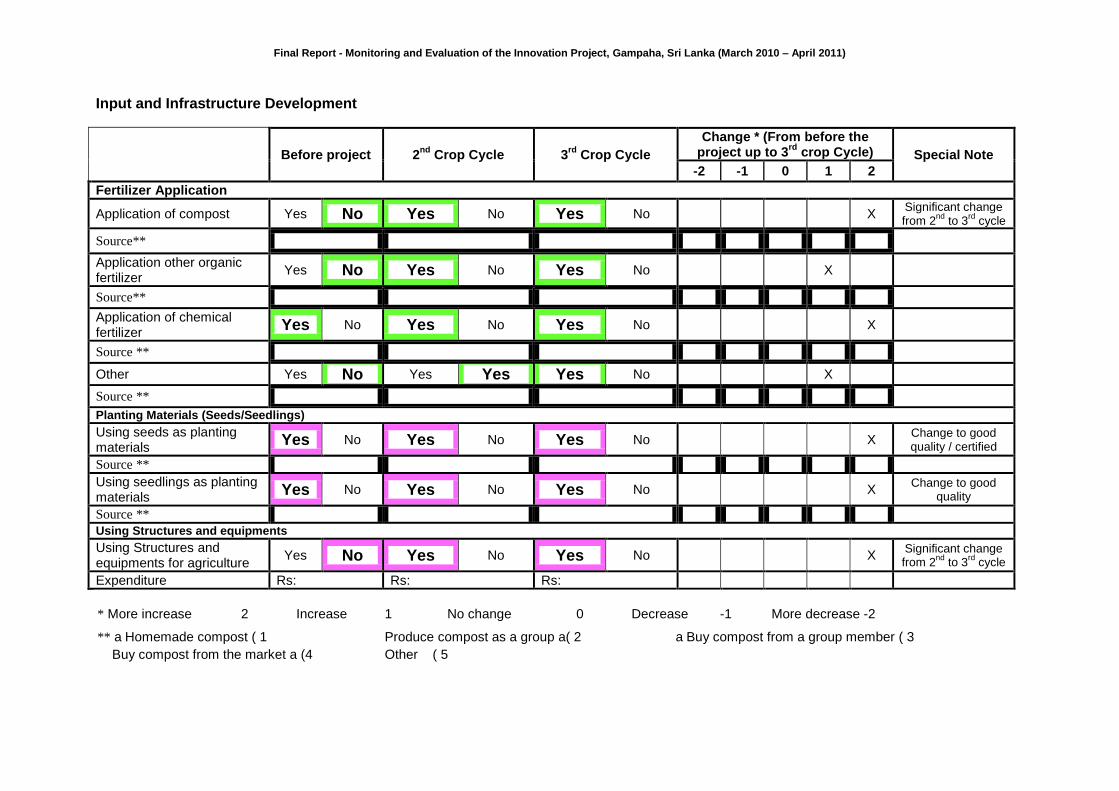
Final Report - Monitoring and Evaluation of the Innovation Project, Gampaha, Sri Lanka (March 2010 – April 2011)
Input and Infrastructure Development
Before project 2nd
Crop Cycle 3rd
Crop Cycle
Change * (From before the project up to 3
rd crop Cycle) Special Note
-2 -1 0 1 2
Fertilizer Application
Application of compost Yes No Yes No Yes No X Significant change from 2
nd to 3
rd cycle
Source**
Application other organic fertilizer
Yes No Yes No Yes No X
Source**
Application of chemical fertilizer
Yes No Yes No Yes No X
Source **
Other Yes No Yes Yes Yes No X
Source **
Planting Materials (Seeds/Seedlings)
Using seeds as planting materials
Yes No Yes No Yes No X Change to good quality / certified
Source **
Using seedlings as planting materials
Yes No Yes No Yes No X Change to good
quality
Source **
Using Structures and equipments
Using Structures and equipments for agriculture
Yes No Yes No Yes No X Significant change from 2
nd to 3
rd cycle
Expenditure Rs: Rs: Rs:
* More increase 2 Increase 1 No change 0 Decrease -1 More decrease -2
** a Homemade compost ( 1 Produce compost as a group a( 2 a Buy compost from a group member ( 3
Buy compost from the market a (4 Other ( 5
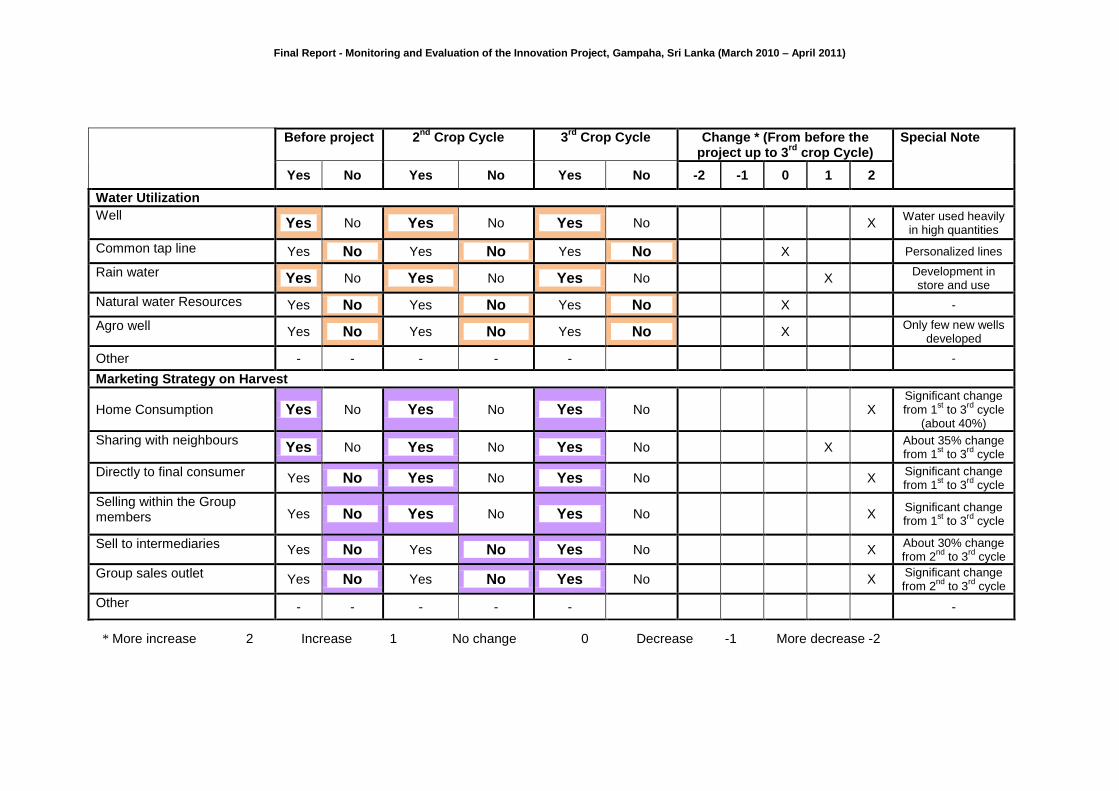
Final Report - Monitoring and Evaluation of the Innovation Project, Gampaha, Sri Lanka (March 2010 – April 2011)
Before project 2nd
Crop Cycle 3rd
Crop Cycle Change * (From before the project up to 3
rd crop Cycle)
Special Note
Yes No Yes No Yes No -2 -1 0 1 2
Water Utilization
Well Yes No Yes No Yes No X
Water used heavily in high quantities
Common tap line Yes No Yes No Yes No X Personalized lines
Rain water Yes No Yes No Yes No X Development in store and use
Natural water Resources Yes No Yes No Yes No X -
Agro well Yes No Yes No Yes No X Only few new wells
developed
Other - - - - - -
Marketing Strategy on Harvest
Home Consumption Yes No Yes No Yes No X Significant change from 1
st to 3
rd cycle
(about 40%)
Sharing with neighbours Yes No Yes No Yes No X
About 35% change from 1
st to 3
rd cycle
Directly to final consumer Yes No Yes No Yes No X
Significant change from 1
st to 3
rd cycle
Selling within the Group members Yes No Yes No Yes No X
Significant change from 1
st to 3
rd cycle
Sell to intermediaries Yes No Yes No Yes No X About 30% change from 2
nd to 3
rd cycle
Group sales outlet Yes No Yes No Yes No X Significant change from 2
nd to 3
rd cycle
Other - - - - - -
* More increase 2 Increase 1 No change 0 Decrease -1 More decrease -2
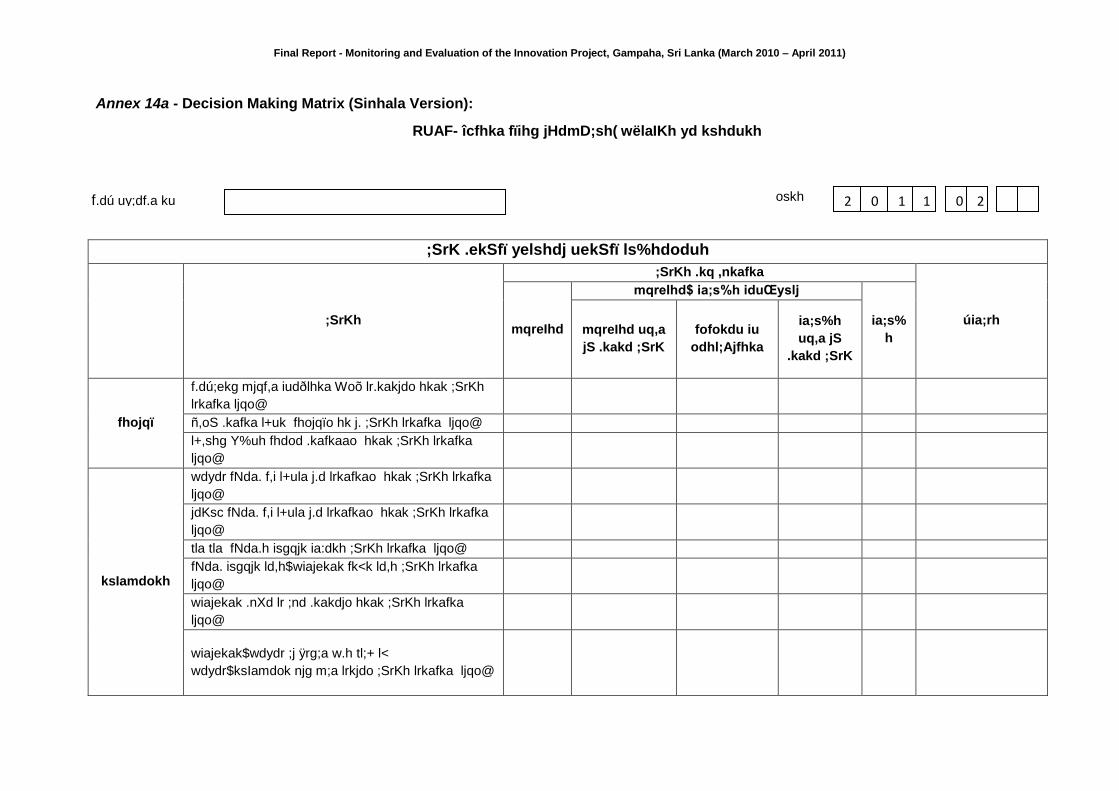
Final Report - Monitoring and Evaluation of the Innovation Project, Gampaha, Sri Lanka (March 2010 – April 2011)
Annex 14a - Decision Making Matrix (Sinhala Version):
;SrK .ekSfï yelshdj uekSfï ls%hdoduh
;SrKh
;SrKh .kq ,nkafka
úia;rh mqreIhd
mqreIhd$ ia;s%h iduŒyslj
ia;s%
h mqreIhd uq,a
jS .kakd ;SrK
fofokdu iu
odhl;Ajfhka
ia;s%h
uq,a jS
.kakd ;SrK
fhojqï
f.dú;ekg mjqf,a iudðlhka Woõ lr.kakjdo hkak ;SrKh
lrkafka ljqo@
ñ,oS .kafka l+uk fhojqïo hk j. ;SrKh lrkafka ljqo@
l+,shg Y%uh fhdod .kafkaao hkak ;SrKh lrkafka
ljqo@
ksIamdokh
wdydr fNda. f,i l+ula j.d lrkafkao hkak ;SrKh lrkafka
ljqo@
jdKsc fNda. f,i l+ula j.d lrkafkao hkak ;SrKh lrkafka
ljqo@
tla tla fNda.h isgqjk ia:dkh ;SrKh lrkafka ljqo@
fNda. isgqjk ld,h$wiajekak fk<k ld,h ;SrKh lrkafka
ljqo@
wiajekak .nXd lr ;nd .kakdjo hkak ;SrKh lrkafka
ljqo@
wiajekak$wdydr ;j ÿrg;a w.h tl;+ l<
wdydr$ksIamdok njg m;a lrkjdo ;SrKh lrkafka ljqo@
oskh 2 0 1 1 0
2
2
RUAF- îcfhka fïihg jHdmD;sh( wëlaIKh yd kshdukh
f.dú uy;df.a ku
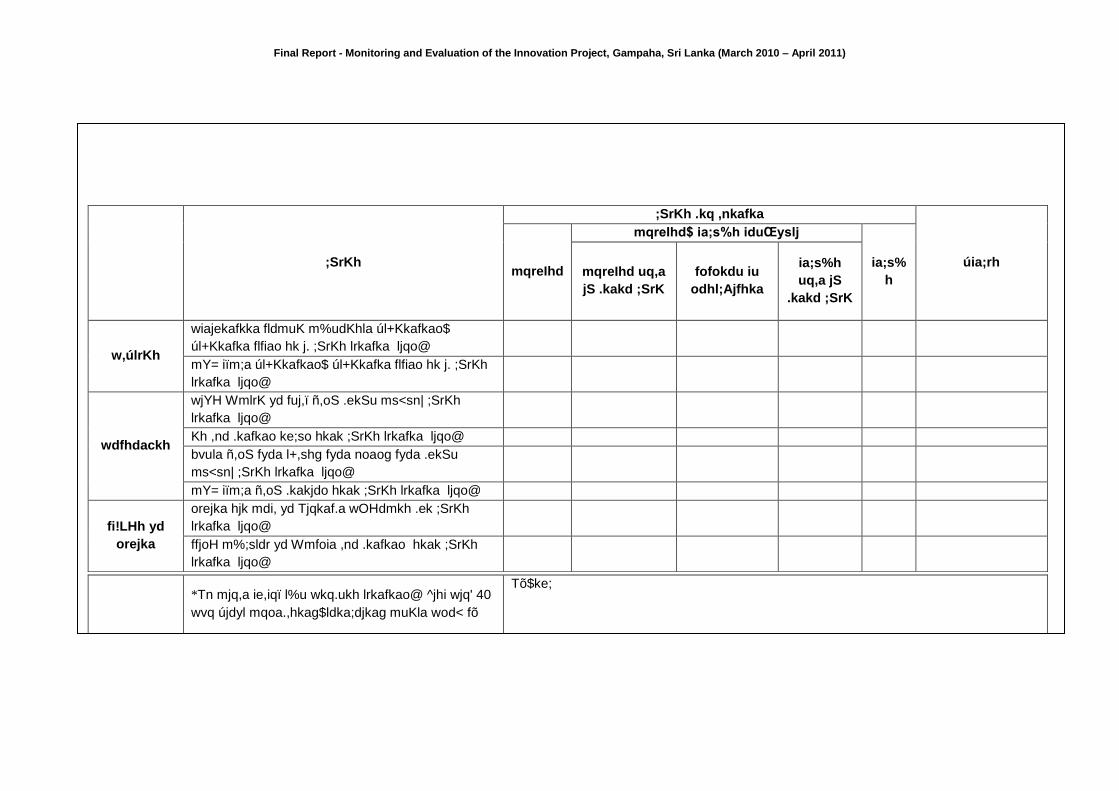
Final Report - Monitoring and Evaluation of the Innovation Project, Gampaha, Sri Lanka (March 2010 – April 2011)
;SrKh
;SrKh .kq ,nkafka
úia;rh mqreIhd
mqreIhd$ ia;s%h iduŒyslj
ia;s%
h mqreIhd uq,a
jS .kakd ;SrK
fofokdu iu
odhl;Ajfhka
ia;s%h
uq,a jS
.kakd ;SrK
w,úlrKh
wiajekafkka fldmuK m%udKhla úl+Kkafkao$
úl+Kkafka flfiao hk j. ;SrKh lrkafka ljqo@
mY= iïm;a úl+Kkafkao$ úl+Kkafka flfiao hk j. ;SrKh
lrkafka ljqo@
wdfhdackh
wjYH WmlrK yd fuj,ï ñ,oS .ekSu ms<sn| ;SrKh
lrkafka ljqo@
Kh ,nd .kafkao ke;so hkak ;SrKh lrkafka ljqo@
bvula ñ,oS fyda l+,shg fyda noaog fyda .ekSu
ms<sn| ;SrKh lrkafka ljqo@
mY= iïm;a ñ,oS .kakjdo hkak ;SrKh lrkafka ljqo@
fi!LHh yd
orejka
orejka hjk mdi, yd Tjqkaf.a wOHdmkh .ek ;SrKh
lrkafka ljqo@
ffjoH m%;sldr yd Wmfoia ,nd .kafkao hkak ;SrKh
lrkafka ljqo@
*Tn mjq,a ie,iqï l%u wkq.ukh lrkafkao@ ^jhi wjq' 40
wvq újdyl mqoa.,hkag$ldka;djkag muKla wod< fõ
Tõ$ke;
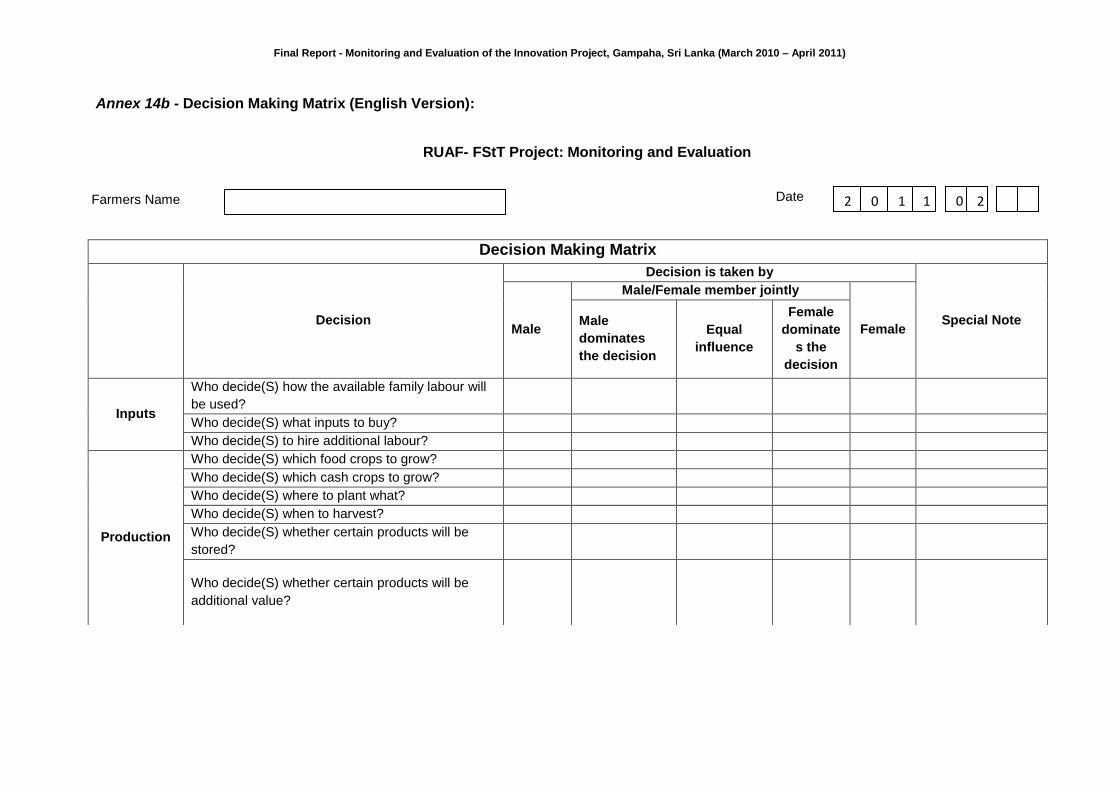
Final Report - Monitoring and Evaluation of the Innovation Project, Gampaha, Sri Lanka (March 2010 – April 2011)
Annex 14b - Decision Making Matrix (English Version):
Decision Making Matrix
Decision
Decision is taken by
Special Note Male
Male/Female member jointly
Female Male
dominates
the decision
Equal
influence
Female
dominate
s the
decision
Inputs
Who decide(S) how the available family labour will
be used?
Who decide(S) what inputs to buy?
Who decide(S) to hire additional labour?
Production
Who decide(S) which food crops to grow?
Who decide(S) which cash crops to grow?
Who decide(S) where to plant what?
Who decide(S) when to harvest?
Who decide(S) whether certain products will be
stored?
Who decide(S) whether certain products will be
additional value?
Date 2 0 1 1 0
2
2
RUAF- FStT Project: Monitoring and Evaluation
Farmers Name
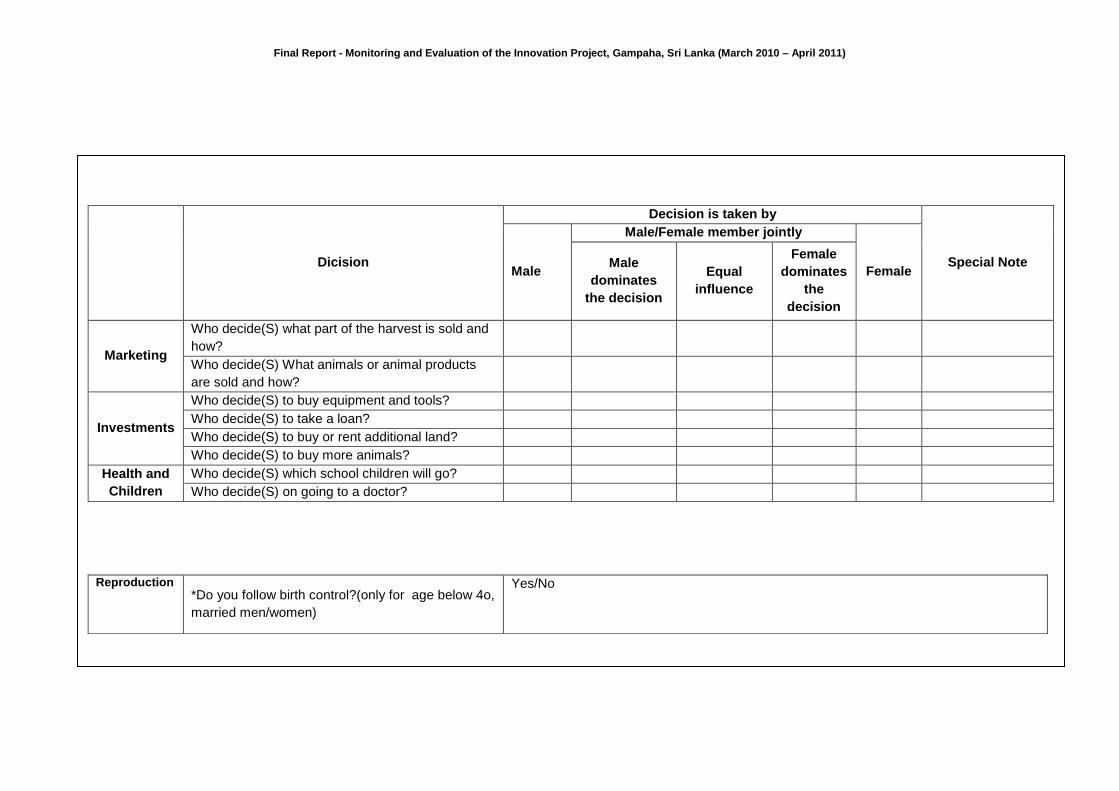
Final Report - Monitoring and Evaluation of the Innovation Project, Gampaha, Sri Lanka (March 2010 – April 2011)
Dicision
Decision is taken by
Special Note Male
Male/Female member jointly
Female Male
dominates
the decision
Equal
influence
Female
dominates
the
decision
Marketing
Who decide(S) what part of the harvest is sold and
how?
Who decide(S) What animals or animal products
are sold and how?
Investments
Who decide(S) to buy equipment and tools?
Who decide(S) to take a loan?
Who decide(S) to buy or rent additional land?
Who decide(S) to buy more animals?
Health and
Children
Who decide(S) which school children will go?
Who decide(S) on going to a doctor?
Reproduction *Do you follow birth control?(only for age below 4o,
married men/women)
Yes/No
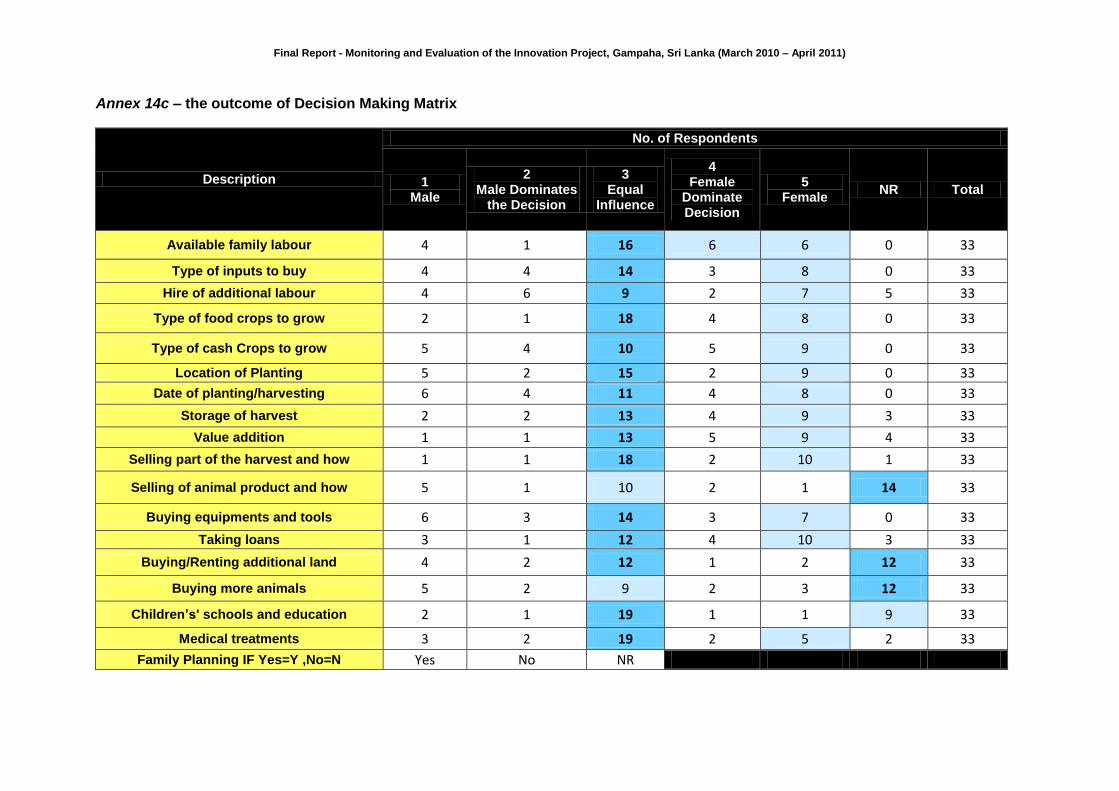
Final Report - Monitoring and Evaluation of the Innovation Project, Gampaha, Sri Lanka (March 2010 – April 2011)
Annex 14c – the outcome of Decision Making Matrix
Description
No. of Respondents
1 Male
2 Male Dominates
the Decision
3 Equal
Influence
4 Female
Dominate Decision
5 Female
NR Total
Available family labour 4 1 16 6 6 0 33
Type of inputs to buy 4 4 14 3 8 0 33
Hire of additional labour 4 6 9 2 7 5 33
Type of food crops to grow 2 1 18 4 8 0 33
Type of cash Crops to grow 5 4 10 5 9 0 33
Location of Planting 5 2 15 2 9 0 33
Date of planting/harvesting 6 4 11 4 8 0 33
Storage of harvest 2 2 13 4 9 3 33
Value addition 1 1 13 5 9 4 33
Selling part of the harvest and how 1 1 18 2 10 1 33
Selling of animal product and how 5 1 10 2 1 14 33
Buying equipments and tools 6 3 14 3 7 0 33
Taking loans 3 1 12 4 10 3 33
Buying/Renting additional land 4 2 12 1 2 12 33
Buying more animals 5 2 9 2 3 12 33
Children’s' schools and education 2 1 19 1 1 9 33
Medical treatments 3 2 19 2 5 2 33
Family Planning IF Yes=Y ,No=N Yes No NR