Embed Size (px)
Citation preview
Final Report of the Interlaboratory Comparison in Anhydrous
Bioethanol
04/July/2011
INTERLABORATORY COMPARISON IN ANHYDROUS BIOETHANOL
FINAL REPORT – Nº 008/11
ORGANIZATION AND COORDINATION
National Institute of Metrology, Standardization and Industrial Quality - Inmetro Scientific and Industrial Metrology Directorate - Dimci Address: Av. Nossa Senhora das Graças, 50 - Xerém - Duque de Caxias RJ - Brasil - CEP: 25250-020 E-mail: [email protected]
ORGANIZATION COMMITTEE
Damares da Silva Santos (Inmetro/Dimci/Dicep)
Paulo Roberto da Fonseca Santos (Inmetro/Dimci/Dicep)
Romeu José Daroda (Inmetro/Dimci/Dquim)
Valnei Smarçaro da Cunha (Inmetro/Dimci/Dquim)
TECHNICAL COMMITTEE
Alex Pablo Ferreira Barbosa (Inmetro/Dimci/Dimec)
Dalni Malta do Espirito Santo Filho (Inmetro/Dimci/Dimec)
Eliane Cristina Pires do Rego (Inmetro/Dimci/Dquim)
Fabiano Barbieri Gonzaga (Inmetro/Dimci/Dquim)
Isabel Cristina Serta Fraga (Inmetro/Dimci/Dquim)
Janaína Marques Rodrigues (Inmetro/Dimci/Dquim)
José Renato Real Siqueira (Inmetro/Dimci/Dimec)
Joyce Costa Andrade (Inmetro/Dimci/Dicep)
Lindomar Augusto dos Reis (Inmetro/Dimci/Dquim)
Marcos Paulo Vicentim (Inmetro/Dimci/Dquim)
Mary Ane Gonçalves (Inmetro/Dimci/Dquim)
Paulo Paschoal Borges (Inmetro/Dimci/Dquim)
Renata Souza e Silva (Inmetro/Dimci/Dquim)
Rodrigo Caciano de Sena (Inmetro/Dimci/Dquim)
Final Report of Interlaboratory Comparison in Anhydrous Bioethanol
Página 1 de 27
SUMMARY
1. Introduction ..................................................................................................................................... 2
2. Objectives ....................................................................................................................................... 3
3. Preparation of the Comparison Item ................................................................................................ 3
4. Characterization, Homogeneity and Stability Tests of the Comparison Item .................................... 3
4.1. Characterization ....................................................................................................................... 3
4.2. Uncertainty of the Characterization ........................................................................................... 5
4.3. Homogeneity ............................................................................................................................ 6
4.4. Uncertainty of the Homogeneity ................................................................................................ 7
4.5. Stability ..................................................................................................................................... 8
4.6. Uncertainty of the Stability ........................................................................................................ 8
4.7. Estimate of Uncertainty of the of the Comparison Item ............................................................. 9
4.8. Metrological Traceability ........................................................................................................ 10
5. Statistical Analysis ......................................................................................................................... 10
5.1. z-score ................................................................................................................................... 10
6. Results and Evaluation of the Performance ................................................................................... 11
6.1. Results of the Laboratories ..................................................................................................... 11
7. Conclusion .................................................................................................................................... 23
8. Participant Laboratories ................................................................................................................. 25
9. References .................................................................................................................................... 26
Final Report of Interlaboratory Comparison in Anhydrous Bioethanol
Página 2 de 27
1. Introduction
Biofuel constitutes a viable alternative in relation to the fuel derived from petrol. It can be considered a
significant model of energy source in the future. The participation of biofuel in the energetic matrix
depends on a complex array of factors involving many production aspects (raw material and
technology) and also the sustainability (social, economical and environmental) of this energy source.
The worldwide demand for renewable fuels is increasing, especially because of the reduction of
noxious emissions and sulfur-containing gases which are blamed for global warming. More recently,
the bioethanol quality played a decisive role on the need of ethanol conversion in commodities to the
international market.
The ability to conquer overseas markets demands that the bioethanol meet the stringent quality
requirements of these markets. Therefore, one of these requirements is the validation of the methods
for bioethanol analysis. The validation is markedly dependent on three basic factors: normalized
specifications; official methods of analysis and certified reference materials. The normalized
specifications are a set of characteristics required to assure that the biofuel has the final destination
as previously defined. The official methods are the necessary tools to construct the right evaluation
for the normalized specification of the fuel. The certified reference materials are tools utilized to
ensure reliability to analytical measurements. They can be used in method validation, calibration or as
control samples.
Confidence in the analytical data requires thorough knowledge of the traceability chain which links
results measured in the biofuel samples to the International System of Units (SI) or to an international
agreed reference. Therefore, the metrology for biofuel focuses on providing traceable results by
means of developing reference methods and suitable reference materials.
Inmetro, the Brazilian Metrology Institute, exerts a key role in the research of biofuels in general.
Thus, Inmetro aims to contribute to fundamental research, development and production of reference
materials to provide metrological traceability for national industrial laboratories by means of certified
reference materials (CRMs), in accordance with international procedures which are necessary to
make biofuels a commodity.
This report aims to present the results of performance evaluation of laboratories which participated in
the interlaboratory comparison in anhydrous bioethanol for a project named Standards for the Ethanol
of Africa and Latin America-PEAAL.
Final Report of Interlaboratory Comparison in Anhydrous Bioethanol
Página 3 de 27
2. Objectives
This Interlaboratory Comparison (IC) has the aim to assist the National Metrology Institutes (NMIs)
and independent quality laboratories indicated and invited by the NMIs with technical qualification to
participate in the Project “Standards for the Ethanol of Africa and Latin America” (PEAAL, in
Portuguese), which are involved with the quality control of biofuels, mainly of anhydrous bioethanol.
Some parameters which were evaluated in this IC define the quality of ethanol used as a fuel with
international acceptance. It is extremely important to carry out the determination of these parameters
with confidence and traceability. Therefore, the IC was carried out with samples of ethanol fuel with
certified values, allowing a more confident evaluation of the laboratories’ performance regarding the
determination of quality parameters for the ethanol.
3. Preparation of the Comparison Item
The Chemical Metrology Division and the Mechanical Metrology Division from Inmetro were
responsible for the preparation, bottling, characterization, homogeneity and stability tests of the
comparison item (based on ISO GUIDE 35).
The comparison item was made up from samples of anhydrous bioethanol. The samples of bioethanol
from sugar cane (approximately 99,6 % ethanol content) were provided by a Brazilian producer in a
container of 200 L. The bioethanol was bottled in about 2500 amber glass ampoules of 20 mL which
had been evacuated with argon and flame-sealed. The number of bioethanol samples needed for the
determination of each parameter was sent by Inmetro to the participating laboratories.
4. Characterization, Homogeneity and Stability Tes ts of the Comparison Item
4.1. Characterization
As previously agreed, the material supplied was also measured for stability purposes.
In all parameters selected for the characterization of bioethanol, the results were available and
they were consistent within their respective uncertainties.
4.1.1. Acid number
Five bottles were analyzed. Each bottle was prepared from eleven ampoules of 20 mL of
bioethanol. It was needed 60 mL for each analysis. The acid number determination was carried out
in triplicate by automatized volumetric titration with potentiometric end-point detection by means of
a combined pH glass electrode with KCl internal filling solution previously checked by Inmetro
CRM of pH 6,86 (MRC 03.2/10.0005) and pH 4,00 (MRC 03.1/09.0002). The bioethanol samples
were titrated with NaOH 0,02 mol L−1 solution standardized with HCl 0,01 mol L−1
(MRC 08.2/10.0003). The result was expressed as quantity of acetic acid, in milligrams of acetic
acid per liter of bioethanol.
Final Report of Interlaboratory Comparison in Anhydrous Bioethanol
Página 4 de 27
4.1.2. Copper content
The result of characterization was based on the mean of results obtained in the homogeneity
study. Each of the fifteen ampoules were analyzed in quintuplicate. The copper content was
determined using an ICP OES coupled to ultrasonic nebulizer and membrane desolvator. The
methodology was optimized and the analytical performance characteristics evaluated. Calibration
curves were prepared in anhydrous ethanol using the SRM 3114 from NIST. The performance of
the methodology was evaluated by recovery test using the CRM from INMETRO
MRC 05.1/08.0001. The sample were diluted gravimetrically in anhydrous ethanol (1:10) and
analyzed directly by the system.
4.1.3. Electrolytic conductivity
Each of the six bottles were analyzed in duplicate. Each bottle was prepared from five ampoules of
20 mL of bioethanol. It was needed 40 mL for each analysis. Electrolytic conductivity was
determined by means of one conductivity meter coupled with a conductivity cell with constant value
of 0,090 cm-1 (previously checked with Inmetro CRM of 5 µS cm−1 (MRC 04.5/10.0002)), a
magnetic stirrer and a resistance thermometer, Pt 100. All the measurements were carried out in
duplicate at 25 °C.
4.1.4. Density
Six ampoules of 20 mL of bioethanol were analyzed. The determination of density was carried out
in two replicates by the use of a digital density meter, traceable to the hydrostatic weight system.
All the measurements were done at 20,0 °C. In each measurement, the internal cell of densimeter
was washed with pure alcohol. The results are expressed as density, in g mL-1.
4.1.5. Sulphate content
Each of the three ampoules were analyzed in quintuplicate. Sulphate content was determined
using a bidimensional ion-exchange chromatography system with pre-concentrantion. All solutions
were diluted gravimetrically using high purity water (tipe I) and anhydrous ethanol (9:1 w/w) at 20
ºC. In order to establish the traceability to the International System (SI) SRM 3181 from NIST was
used.
4.1.6. Water content
The result of characterization was based on the mean of results obtained in the homogeneity
study. Ten ampoules were analyzed. The water content was determined by coulometric Karl
Fischer titration with Hydranal coulomat AG as the reagent, an electrode current generator of
400 mA and a platinum indicator electrode. The range of applied voltage was 50 to 70 mV. The
titration was initiated after stabilization of equipment with a drift of 20 µg/min at 120s and it finished
with the relative value of ± 5 µg/min compared with the initial drift. The titration curve was
Final Report of Interlaboratory Comparison in Anhydrous Bioethanol
Página 5 de 27
performed with a measurement point every 2 s analysis. The samples were transferred to
containers. Aliquots were injected into the equipment and the measurements were made in
triplicate.
4.1.7. Ethanol content
The result of characterization was based on the mean of results obtained in the homogeneity
study. Each of the ten ampoules were analyzed in duplicate. The determination of ethanol content
was performed by using gas chromatography with flame ionization detector (GC-FID) by the on-
column injection technique and propanol was used as internal standard. Samples of bio ethanol
were weighed in glass vials of 5 mL and transferred to containers containing 250 g of water. The
solutions were homogenized for 12 h. An aliquot of each solution was diluted 1:1 with internal
standard solution in a glass container. The ethanol content was determined by the equation of the
calibration curve obtained by the method of least squares, applying the linear model.
4.2.Uncertainty of the Characterization
The uncertainty budget was estimated according to ISO GUM.
4.2.1. Acid number
The uncertainty of the measurement for characterization (uchar) of the acid number was estimated
considering the following components: NaOH standard solution, repeatability, titrator, automatic
burette (NaOH), automatic burette (sample), molar mass (acetic acid) and end-point detection.
The value of the characterization for acid number parameter is 45,2 mg L−1. The contribution of
uncertainty due to characterization is 1,0 mg L−1.
4.2.2. Copper content
The value of the characterization of copper is 1,99 µg kg-1 and its combined standard uncertainty
was assumed as the uncertainty of the homogeneity study (0,165 µg kg-1).
4.2.3. Density
The uncertainty of the measurement for the characterization of the density was estimated
considering the: repeatability and digital density meter certificate sources.
The value of the characterization for the density parameter is 0,79058 g mL-1. The contribution of
uncertainty due to characterization is 0,00004 g mL-1.
4.2.4. Electrolytic conductivity
The uncertainty of the measurement for the characterization of the electrolytic conductivity was
estimated considering the sources: CRM, repeatability, conductometer, temperature, cell constant
and CO2 concentration.
Final Report of Interlaboratory Comparison in Anhydrous Bioethanol
Página 6 de 27
The value of the characterization for the electrolytic conductivity parameter is 0,54 µS cm−1. The
contribution of uncertainty due to characterization is 0,029 µS cm−1.
4.2.5. Sulphate content
The following sources of uncertainty were considered: standard dilution, repeatability, sample
dilution and calibration curve.
The value of the characterization for sulphate content is 0,313 mg kg−1. The contribution of
uncertainty due to characterization is 0,006 mg kg−1.
4.2.6. Water content
The uncertainty of the measurement for characterization (uchar) of the water content was estimated
considering the balance resolution and the repeteability of analysis.
The value of the characterization for water content parameter is 0,378 % (in mass). The
contribution of uncertainty due to characterization is 0,0011 % (in mass).
4.2.7. Ethanol content
The uncertainty of the measurement for characterization (uchar) of the ethanol content was
estimated considering the following components: calibration curve, repeteability of analysis, mass
of internal standard solution, mass of sample solution, repeteability of area ratios and purity of
ethanol used as calibrant.
The value of the characterization for ethanol content parameter is 99,56 % (in mass). The
contribution of uncertainty due to characterization is 0,20 % (in mass).
4.3. Homogeneity
After bottling, the homogeneity study of the batch of samples was carried out with the objective to
determine the within and between-bottle variation. The samples used in this study were chosen
randomly from the batch produced. The measurements were performed under repeatability
conditions. The homogeneity study was performed for all parameters. The analyses of
homogeneity study were performed at Inmetro.
The data evaluation of the between-bottle homogeneity study is based on the approach described
in ISO Guide 35. First, the data was placed in order of measurement and visually inspected for
irregularities. Then, by visual inspection, a check on possible drift was performed.
The data were then grouped by bottle (ampoule). ISO Guide 35 uses the concept “bottle” to
represent one item of the batch. This concept is used here throughout the text. At the level of the
bottles, the data were scrutinised for outliers by means of Grubbs’ outlier test.
Final Report of Interlaboratory Comparison in Anhydrous Bioethanol
Página 7 de 27
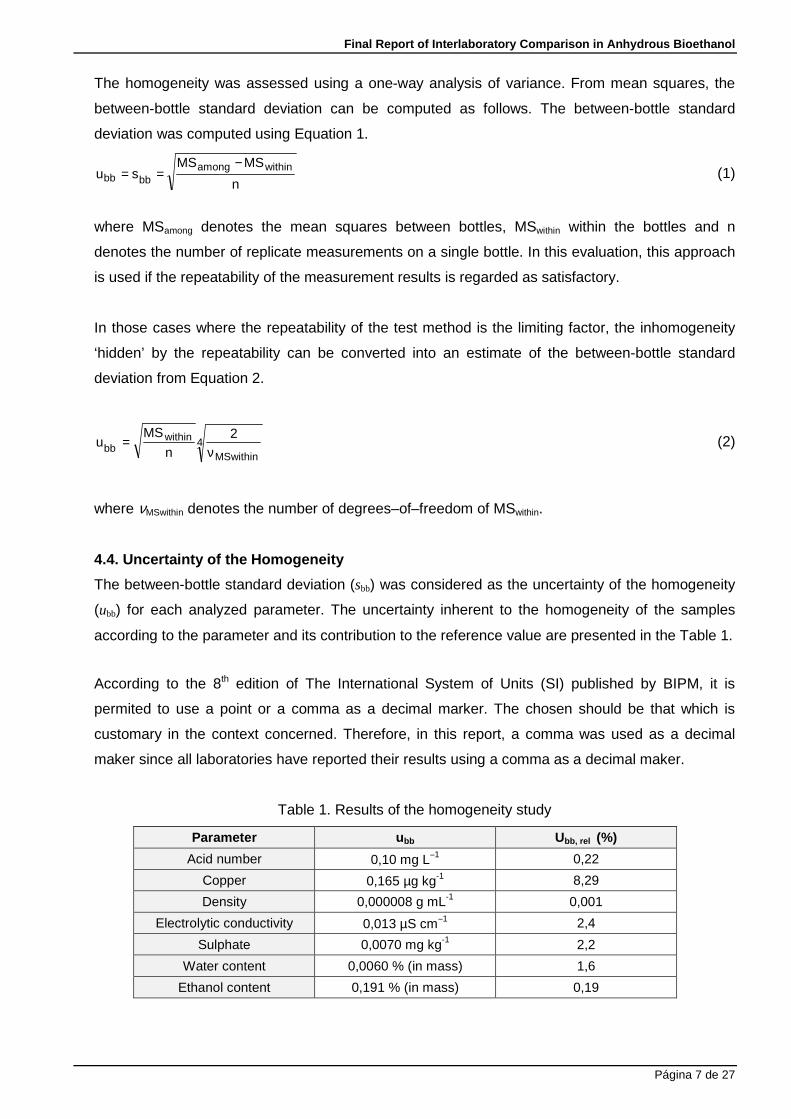
The homogeneity was assessed using a one-way analysis of variance. From mean squares, the
between-bottle standard deviation can be computed as follows. The between-bottle standard
deviation was computed using Equation 1.
n
MSMSsu
withinamongbbbb
−== (1)
where MSamong denotes the mean squares between bottles, MSwithin within the bottles and n
denotes the number of replicate measurements on a single bottle. In this evaluation, this approach
is used if the repeatability of the measurement results is regarded as satisfactory.
In those cases where the repeatability of the test method is the limiting factor, the inhomogeneity
‘hidden’ by the repeatability can be converted into an estimate of the between-bottle standard
deviation from Equation 2.
4MSwithin
withinbb
2n
MSu
ν= (2)
where νMSwithin denotes the number of degrees–of–freedom of MSwithin.
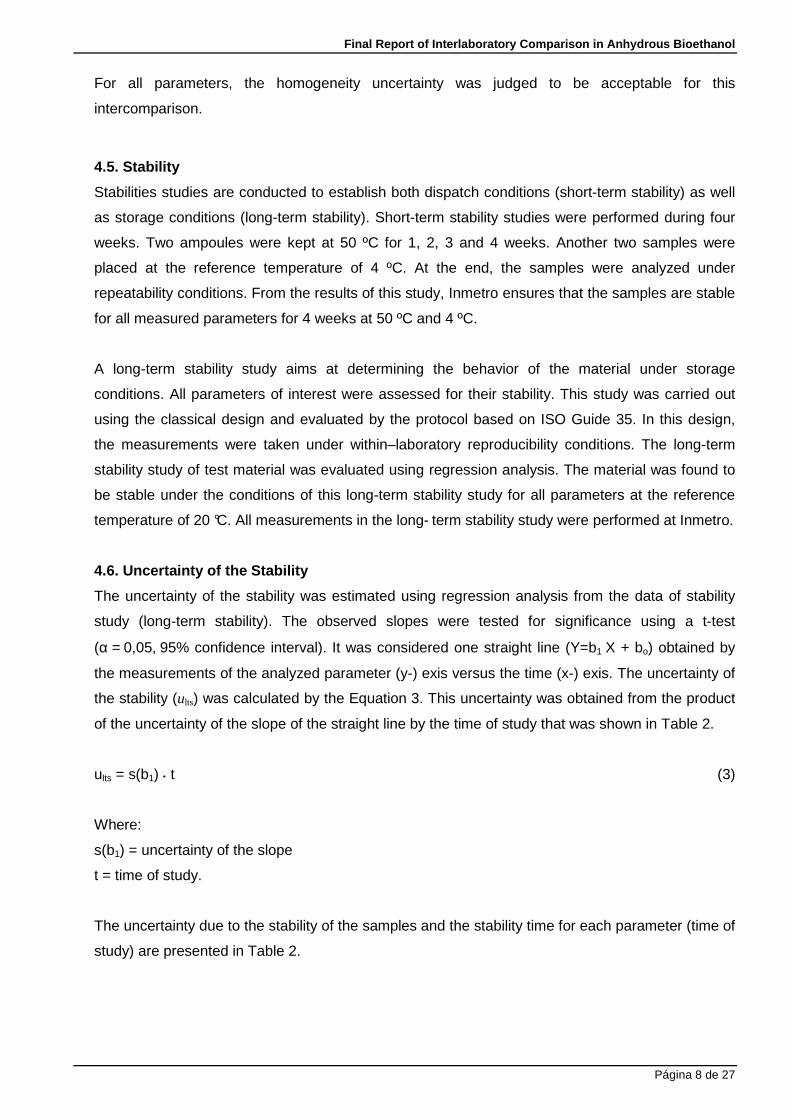
4.4. Uncertainty of the Homogeneity
The between-bottle standard deviation (sbb) was considered as the uncertainty of the homogeneity
(ubb) for each analyzed parameter. The uncertainty inherent to the homogeneity of the samples
according to the parameter and its contribution to the reference value are presented in the Table 1.
According to the 8th edition of The International System of Units (SI) published by BIPM, it is
permited to use a point or a comma as a decimal marker. The chosen should be that which is
customary in the context concerned. Therefore, in this report, a comma was used as a decimal
maker since all laboratories have reported their results using a comma as a decimal maker.
Table 1. Results of the homogeneity study
Parameter ubb Ubb, rel (%)
Acid number 0,10 mg L−1 0,22
Copper 0,165 µg kg-1 8,29
Density 0,000008 g mL-1 0,001
Electrolytic conductivity 0,013 µS cm−1 2,4
Sulphate 0,0070 mg kg-1 2,2
Water content 0,0060 % (in mass) 1,6
Ethanol content 0,191 % (in mass) 0,19
Final Report of Interlaboratory Comparison in Anhydrous Bioethanol
Página 8 de 27
For all parameters, the homogeneity uncertainty was judged to be acceptable for this
intercomparison.
4.5. Stability
Stabilities studies are conducted to establish both dispatch conditions (short-term stability) as well
as storage conditions (long-term stability). Short-term stability studies were performed during four
weeks. Two ampoules were kept at 50 ºC for 1, 2, 3 and 4 weeks. Another two samples were
placed at the reference temperature of 4 ºC. At the end, the samples were analyzed under
repeatability conditions. From the results of this study, Inmetro ensures that the samples are stable
for all measured parameters for 4 weeks at 50 ºC and 4 ºC.
A long-term stability study aims at determining the behavior of the material under storage
conditions. All parameters of interest were assessed for their stability. This study was carried out
using the classical design and evaluated by the protocol based on ISO Guide 35. In this design,
the measurements were taken under within–laboratory reproducibility conditions. The long-term
stability study of test material was evaluated using regression analysis. The material was found to
be stable under the conditions of this long-term stability study for all parameters at the reference
temperature of 20 °C. All measurements in the long- term stability study were performed at Inmetro.
4.6. Uncertainty of the Stability
The uncertainty of the stability was estimated using regression analysis from the data of stability
study (long-term stability). The observed slopes were tested for significance using a t-test
(α = 0,05, 95% confidence interval). It was considered one straight line (Y=b1 X + bo) obtained by
the measurements of the analyzed parameter (y-) exis versus the time (x-) exis. The uncertainty of
the stability (ults) was calculated by the Equation 3. This uncertainty was obtained from the product
of the uncertainty of the slope of the straight line by the time of study that was shown in Table 2.
ults = s(b1) • t (3)
Where:
s(b1) = uncertainty of the slope
t = time of study.
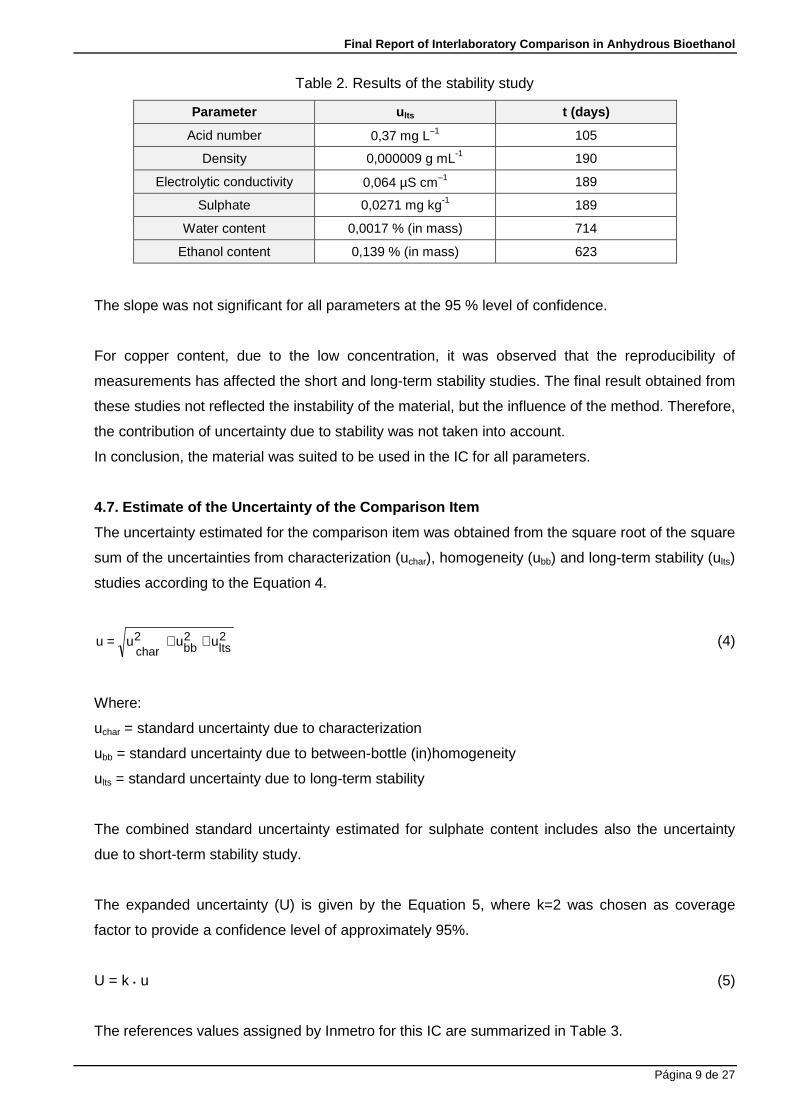
The uncertainty due to the stability of the samples and the stability time for each parameter (time of
study) are presented in Table 2.
Final Report of Interlaboratory Comparison in Anhydrous Bioethanol
Página 9 de 27
Table 2. Results of the stability study
Parameter u lts t (days)
Acid number 0,37 mg L−1 105
Density 0,000009 g mL-1 190
Electrolytic conductivity 0,064 µS cm−1 189
Sulphate 0,0271 mg kg-1 189
Water content 0,0017 % (in mass) 714
Ethanol content 0,139 % (in mass) 623
The slope was not significant for all parameters at the 95 % level of confidence.
For copper content, due to the low concentration, it was observed that the reproducibility of
measurements has affected the short and long-term stability studies. The final result obtained from
these studies not reflected the instability of the material, but the influence of the method. Therefore,
the contribution of uncertainty due to stability was not taken into account.
In conclusion, the material was suited to be used in the IC for all parameters.
4.7. Estimate of the Uncertainty of the Comparison Item
The uncertainty estimated for the comparison item was obtained from the square root of the square
sum of the uncertainties from characterization (uchar), homogeneity (ubb) and long-term stability (ults)
studies according to the Equation 4.
2lts
2bb
2char
uuuu ++= (4)
Where:
uchar = standard uncertainty due to characterization
ubb = standard uncertainty due to between-bottle (in)homogeneity
ults = standard uncertainty due to long-term stability
The combined standard uncertainty estimated for sulphate content includes also the uncertainty
due to short-term stability study.
The expanded uncertainty (U) is given by the Equation 5, where k=2 was chosen as coverage
factor to provide a confidence level of approximately 95%.
U = k • u (5)
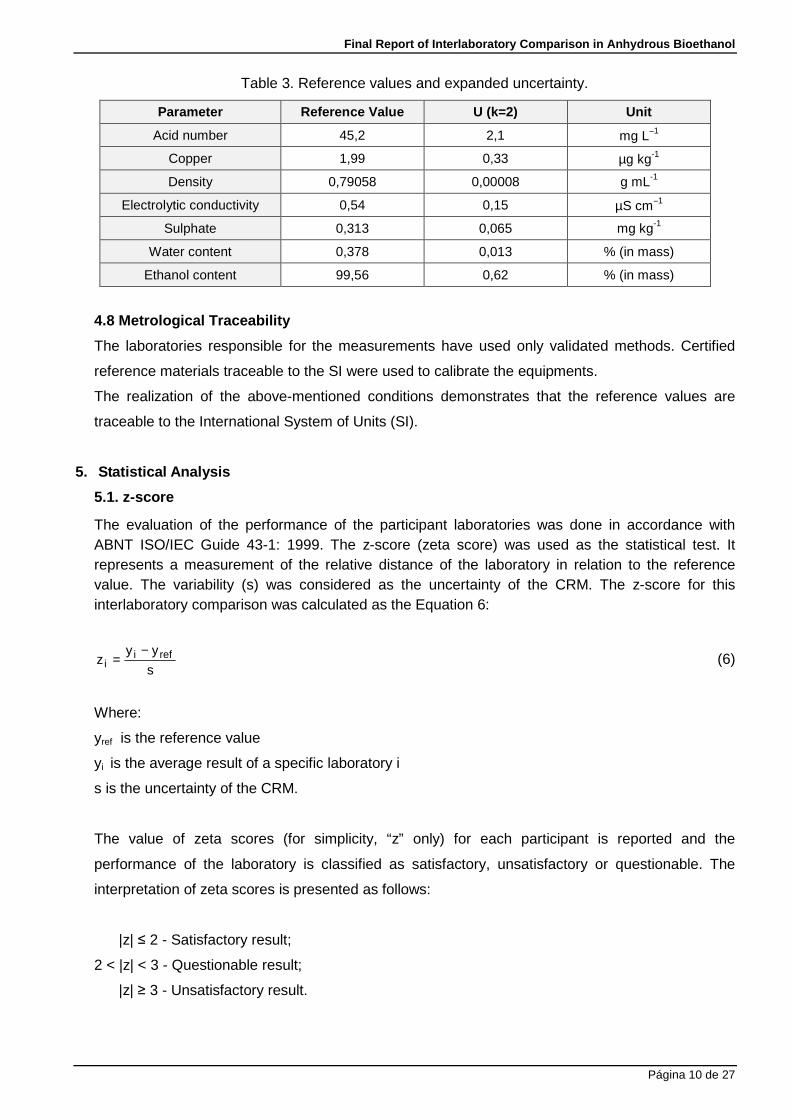
The references values assigned by Inmetro for this IC are summarized in Table 3.
Final Report of Interlaboratory Comparison in Anhydrous Bioethanol
Página 10 de 27
Table 3. Reference values and expanded uncertainty.
Parameter Reference Value U (k=2) Unit
Acid number 45,2 2,1 mg L−1
Copper 1,99 0,33 µg kg-1
Density 0,79058 0,00008 g mL-1
Electrolytic conductivity 0,54 0,15 µS cm−1
Sulphate 0,313 0,065 mg kg-1
Water content 0,378 0,013 % (in mass)
Ethanol content 99,56 0,62 % (in mass)
4.8 Metrological Traceability
The laboratories responsible for the measurements have used only validated methods. Certified
reference materials traceable to the SI were used to calibrate the equipments.
The realization of the above-mentioned conditions demonstrates that the reference values are
traceable to the International System of Units (SI).
5. Statistical Analysis
5.1. z-score
The evaluation of the performance of the participant laboratories was done in accordance with ABNT ISO/IEC Guide 43-1: 1999. The z-score (zeta score) was used as the statistical test. It represents a measurement of the relative distance of the laboratory in relation to the reference value. The variability (s) was considered as the uncertainty of the CRM. The z-score for this interlaboratory comparison was calculated as the Equation 6:
s
yyz refi
i−
= (6)
Where:
yref is the reference value
yi is the average result of a specific laboratory i
s is the uncertainty of the CRM.
The value of zeta scores (for simplicity, “z” only) for each participant is reported and the
performance of the laboratory is classified as satisfactory, unsatisfactory or questionable. The
interpretation of zeta scores is presented as follows:
|z| ≤ 2 - Satisfactory result;
2 < |z| < 3 - Questionable result;
|z| ≥ 3 - Unsatisfactory result.
Final Report of Interlaboratory Comparison in Anhydrous Bioethanol
Página 11 de 27
The z-score is shown in a graphical mode in order to present the performance of the number of the
participating laboratories. The red line represents the unsatisfactory results (|z| ≥ 3); the range from
the blue and red lines represents the questionable results (2 < |z| < 3). The values between the two
blue lines represent the satisfactory results (z| ≤ 2).
6. Results and Evaluation of the Performance
6.1. Results of the Laboratories
The results presented in the Tables for each parameter are in accordance with the measured
values that each laboratory have sent to Inmetro. The mean and standard deviation are presented
with the number of significant figures in accordance with the reference value for each parameter.
The results of z-score were reported only with one decimal number.
In this Report each participant laboratory is only identified by its identification code in
Tables and Figures.
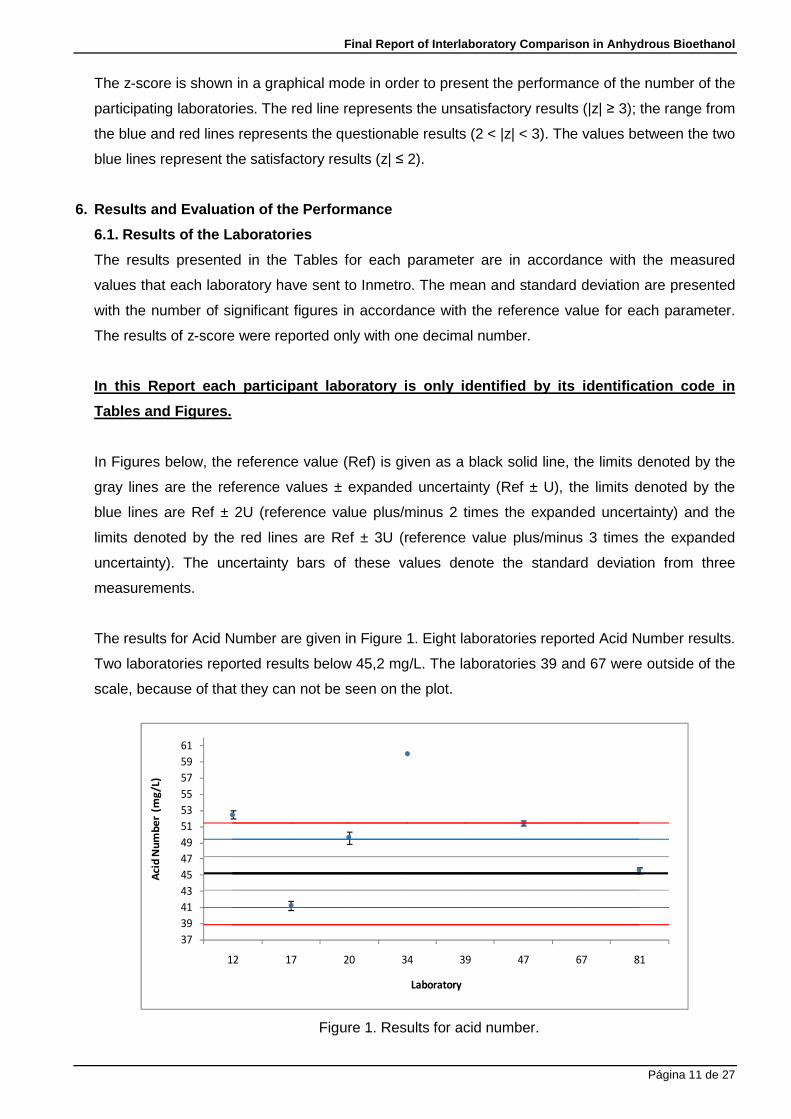
In Figures below, the reference value (Ref) is given as a black solid line, the limits denoted by the
gray lines are the reference values ± expanded uncertainty (Ref ± U), the limits denoted by the
blue lines are Ref ± 2U (reference value plus/minus 2 times the expanded uncertainty) and the
limits denoted by the red lines are Ref ± 3U (reference value plus/minus 3 times the expanded
uncertainty). The uncertainty bars of these values denote the standard deviation from three
measurements.
The results for Acid Number are given in Figure 1. Eight laboratories reported Acid Number results.
Two laboratories reported results below 45,2 mg/L. The laboratories 39 and 67 were outside of the
scale, because of that they can not be seen on the plot.
37
39
41
43
45
47
49
51
53
55
57
59
61
12 17 20 34 39 47 67 81
Aci
d N
um
be
r (m
g/L
)
Laboratory
Figure 1. Results for acid number.
Final Report of Interlaboratory Comparison in Anhydrous Bioethanol
Página 12 de 27
For the Copper, only two of the ten laboratories reported results, of which one reported non-
numeric results (< 0,01), of which the the value is below the limit of quantification/detection and the
laboratory performance could not be evaluated.
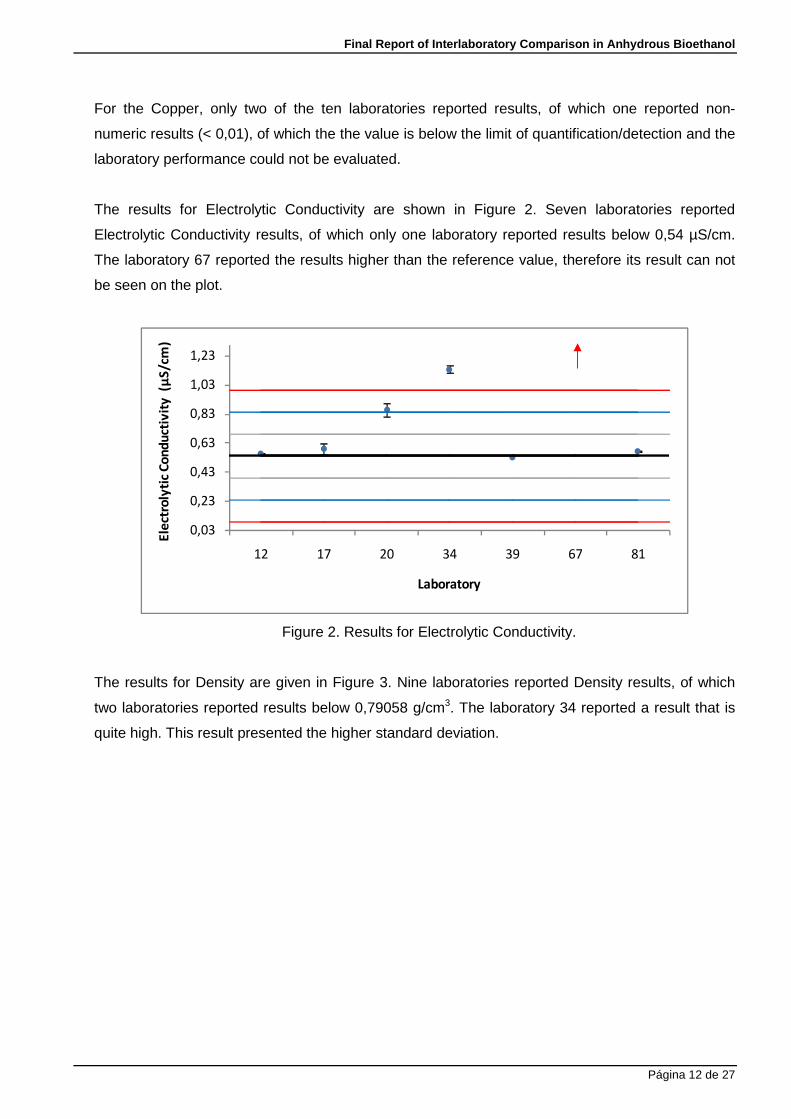
The results for Electrolytic Conductivity are shown in Figure 2. Seven laboratories reported
Electrolytic Conductivity results, of which only one laboratory reported results below 0,54 µS/cm.
The laboratory 67 reported the results higher than the reference value, therefore its result can not
be seen on the plot.
0,03
0,23
0,43
0,63
0,83
1,03
1,23
12 17 20 34 39 67 81
Ele
ctro
lyti
c C
on
du
ctiv
ity
(µ
S/c
m)
Laboratory
Figure 2. Results for Electrolytic Conductivity.
The results for Density are given in Figure 3. Nine laboratories reported Density results, of which
two laboratories reported results below 0,79058 g/cm3. The laboratory 34 reported a result that is
quite high. This result presented the higher standard deviation.

Final Report of Interlaboratory Comparison in Anhydrous Bioethanol
Página 13 de 27
0,7903
0,7904
0,7905
0,7906
0,7907
0,7908
0,7909
0,7910
0,7911
0,7912
0,7913
12 17 20 34 38 39 47 67 81
De
nsit
y (
g/cm
3)
Laboratory
Figure 3. Results for Density.
For the Sulphate parameter, only one of the ten laboratories reported results. The comparability
with the reference value (0,313 mg/kg) was good.
The results for Water Content are given in Figure 4. Seven laboratories reported Water content
results. All of them reported results below 0,378 % (in mass). The laboratory 38 presented results
that are quite different among the participants.
0,310
0,330
0,350
0,370
0,390
0,410
0,430
17 20 26 38 39 47 67
Wa
ter
Co
nte
nt
% (
m/m
)
Laboratory
Figure 4. Results for Water Content.
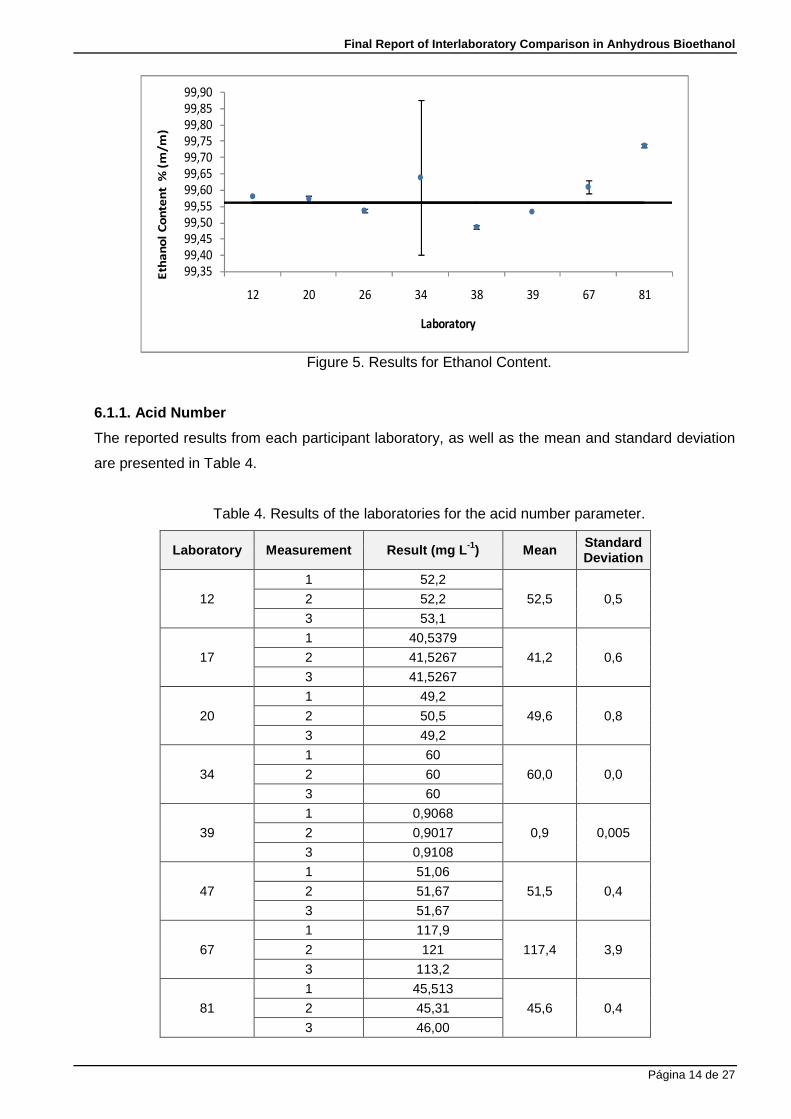
The results for Ethanol Content are given in Figure 5. Eight laboratories reported Ethanol Content
results. Three laboratories reported results below 99,56 % (in mass). There was a good
comparability for them.
Final Report of Interlaboratory Comparison in Anhydrous Bioethanol
Página 14 de 27
99,35
99,40
99,45
99,50
99,55
99,60
99,65
99,70
99,75
99,80
99,85
99,90
12 20 26 34 38 39 67 81
Eth
an
ol
Co
nte
nt
% (
m/m
)
Laboratory
Figure 5. Results for Ethanol Content.
6.1.1. Acid Number
The reported results from each participant laboratory, as well as the mean and standard deviation
are presented in Table 4.
Table 4. Results of the laboratories for the acid number parameter.
Laboratory Measurement Result (mg L -1) Mean Standard Deviation
12
1 52,2
52,5 0,5 2 52,2
3 53,1
17
1 40,5379
41,2 0,6 2 41,5267
3 41,5267
20
1 49,2
49,6 0,8 2 50,5
3 49,2
34
1 60
60,0 0,0 2 60
3 60
39
1 0,9068
0,9 0,005 2 0,9017
3 0,9108
47
1 51,06
51,5 0,4 2 51,67
3 51,67
67
1 117,9
117,4 3,9 2 121
3 113,2
81
1 45,513
45,6 0,4 2 45,31
3 46,00
Final Report of Interlaboratory Comparison in Anhydrous Bioethanol
Página 15 de 27
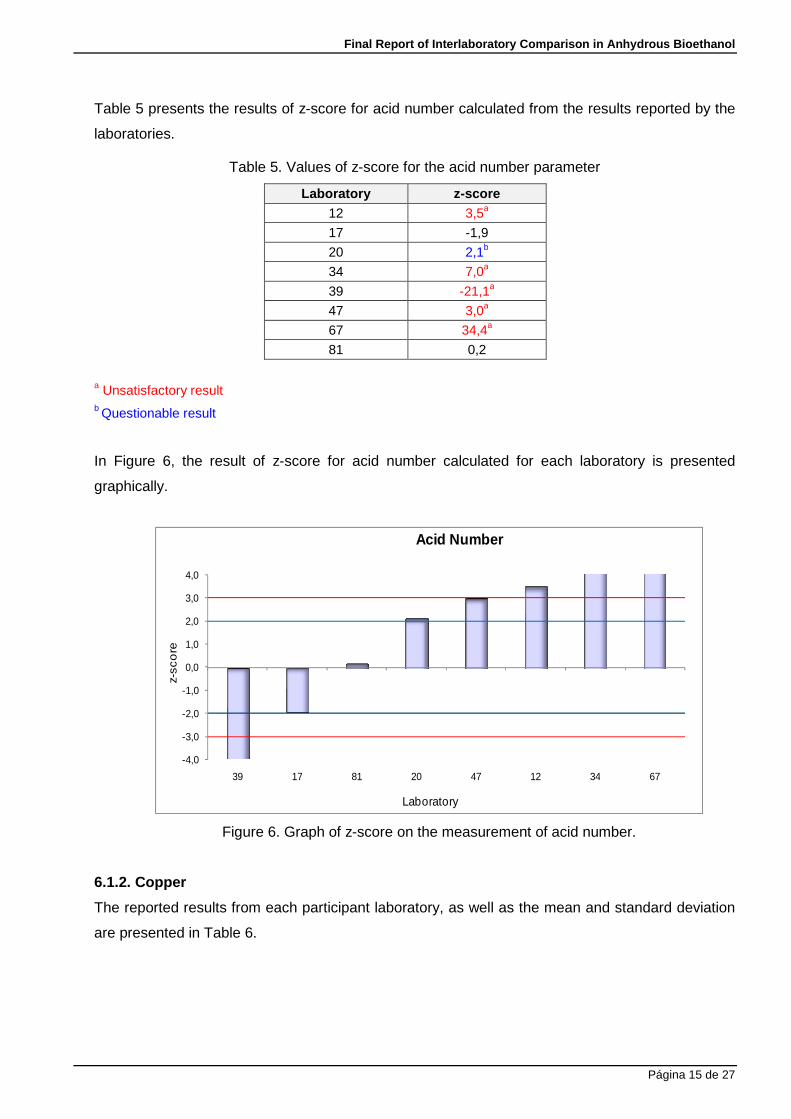
Table 5 presents the results of z-score for acid number calculated from the results reported by the
laboratories.
Table 5. Values of z-score for the acid number parameter
Laboratory z-score 12 3,5a
17 -1,9
20 2,1b
34 7,0a
39 -21,1a
47 3,0a
67 34,4a
81 0,2
a Unsatisfactory result b Questionable result
In Figure 6, the result of z-score for acid number calculated for each laboratory is presented
graphically.
-4,0
-3,0
-2,0
-1,0
0,0
1,0
2,0
3,0
4,0
39 17 81 20 47 12 34 67
z-sc
ore
Laboratory
Acid Number
Figure 6. Graph of z-score on the measurement of acid number.
6.1.2. Copper
The reported results from each participant laboratory, as well as the mean and standard deviation
are presented in Table 6.
Final Report of Interlaboratory Comparison in Anhydrous Bioethanol
Página 16 de 27
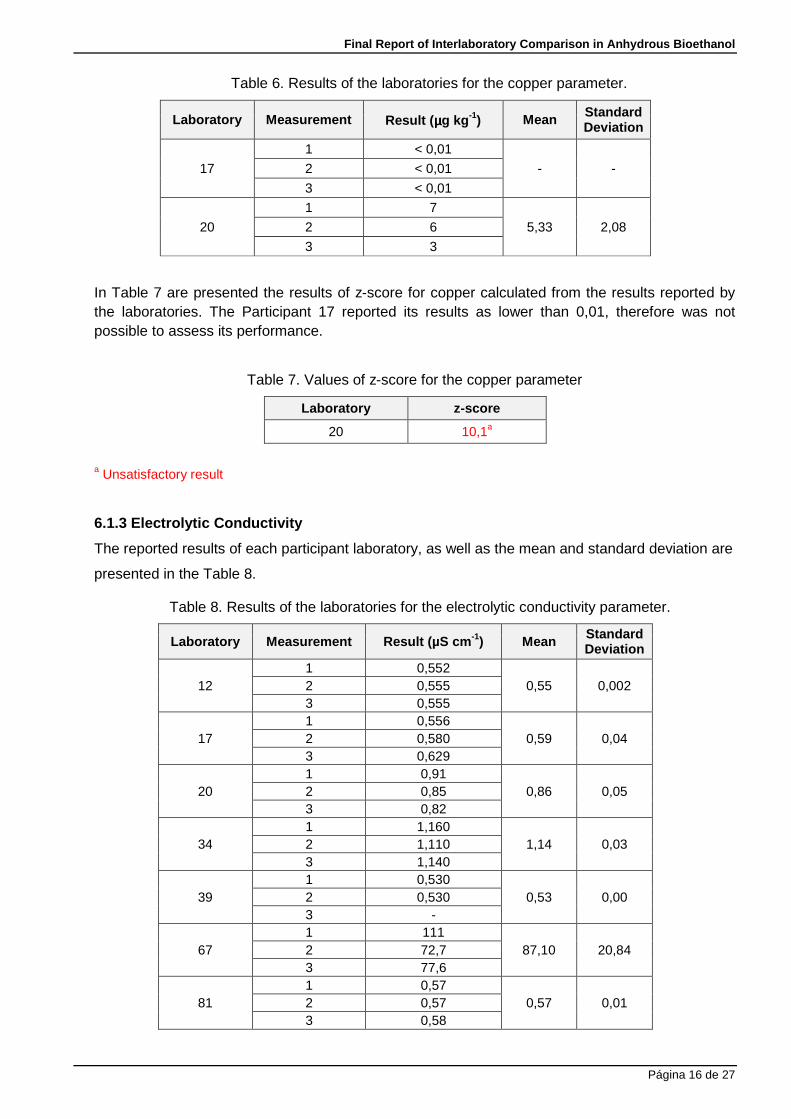
Table 6. Results of the laboratories for the copper parameter.
Laboratory Measurement Result ( µµµµg kg -1) Mean Standard Deviation
17
1 < 0,01
- - 2 < 0,01
3 < 0,01
20
1 7
5,33 2,08 2 6
3 3
In Table 7 are presented the results of z-score for copper calculated from the results reported by the laboratories. The Participant 17 reported its results as lower than 0,01, therefore was not possible to assess its performance.
Table 7. Values of z-score for the copper parameter
Laboratory z-score
20 10,1a
a Unsatisfactory result
6.1.3 Electrolytic Conductivity
The reported results of each participant laboratory, as well as the mean and standard deviation are
presented in the Table 8.
Table 8. Results of the laboratories for the electrolytic conductivity parameter.
Laboratory Measurement Result (µS cm -1) Mean Standard Deviation
12 1 0,552
0,55 0,002 2 0,555 3 0,555
17 1 0,556
0,59 0,04 2 0,580 3 0,629
20 1 0,91
0,86 0,05 2 0,85 3 0,82
34 1 1,160
1,14 0,03 2 1,110 3 1,140
39 1 0,530
0,53 0,00 2 0,530 3 -
67 1 111
87,10 20,84 2 72,7 3 77,6
81 1 0,57
0,57 0,01 2 0,57 3 0,58
Final Report of Interlaboratory Comparison in Anhydrous Bioethanol
Página 17 de 27
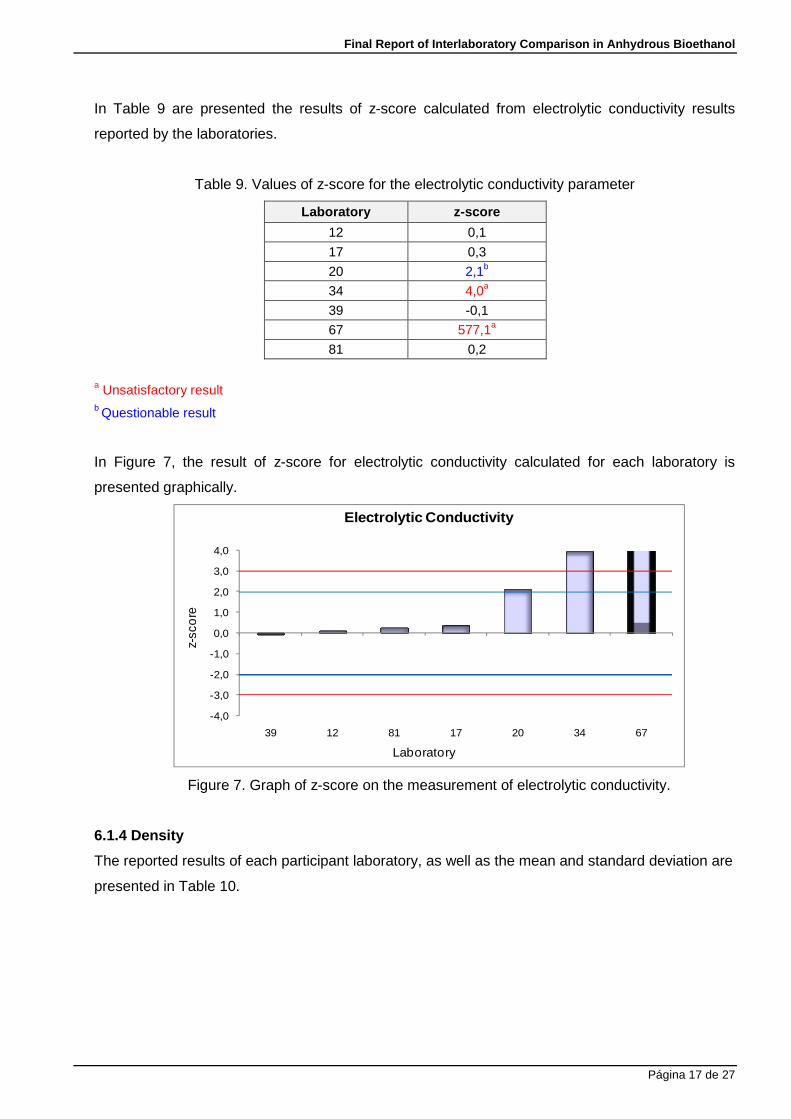
In Table 9 are presented the results of z-score calculated from electrolytic conductivity results
reported by the laboratories.
Table 9. Values of z-score for the electrolytic conductivity parameter
Laboratory z-score
12 0,1
17 0,3
20 2,1b
34 4,0a
39 -0,1
67 577,1a
81 0,2
a Unsatisfactory result b Questionable result
In Figure 7, the result of z-score for electrolytic conductivity calculated for each laboratory is
presented graphically.
-4,0
-3,0
-2,0
-1,0
0,0
1,0
2,0
3,0
4,0
39 12 81 17 20 34 67
z-sc
ore
Laboratory
Electrolytic Conductivity
Figure 7. Graph of z-score on the measurement of electrolytic conductivity.
6.1.4 Density
The reported results of each participant laboratory, as well as the mean and standard deviation are
presented in Table 10.
Final Report of Interlaboratory Comparison in Anhydrous Bioethanol
Página 18 de 27
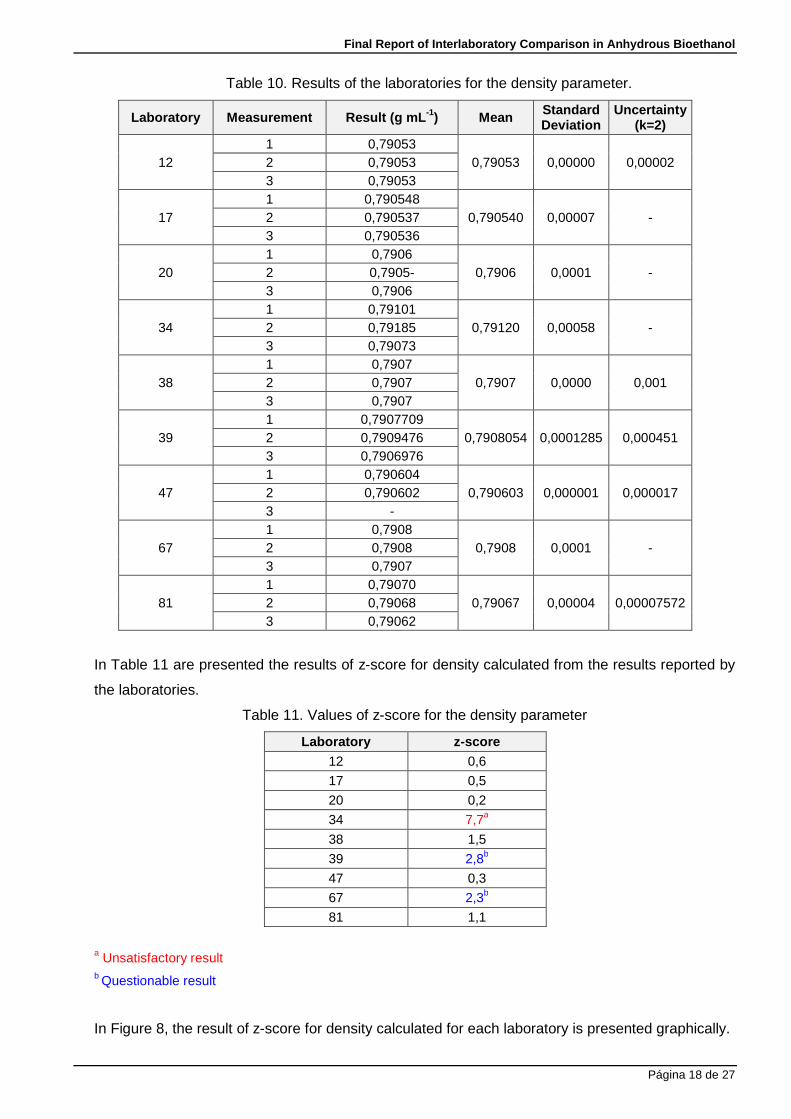
Table 10. Results of the laboratories for the density parameter.
Laboratory Measurement Result (g mL -1) Mean Standard Deviation
Uncertainty (k=2)
12 1 0,79053
0,79053 0,00000 0,00002 2 0,79053 3 0,79053
17 1 0,790548
0,790540 0,00007 - 2 0,790537 3 0,790536
20 1 0,7906
0,7906 0,0001 - 2 0,7905- 3 0,7906
34 1 0,79101
0,79120 0,00058 - 2 0,79185 3 0,79073
38 1 0,7907
0,7907 0,0000 0,001 2 0,7907 3 0,7907
39 1 0,7907709
0,7908054 0,0001285 0,000451 2 0,7909476 3 0,7906976
47 1 0,790604
0,790603 0,000001 0,000017 2 0,790602 3 -
67 1 0,7908
0,7908 0,0001 - 2 0,7908 3 0,7907
81 1 0,79070
0,79067 0,00004 0,00007572 2 0,79068 3 0,79062
In Table 11 are presented the results of z-score for density calculated from the results reported by
the laboratories.
Table 11. Values of z-score for the density parameter
Laboratory z-score 12 0,6
17 0,5
20 0,2
34 7,7a
38 1,5
39 2,8b
47 0,3
67 2,3b
81 1,1
a Unsatisfactory result b Questionable result
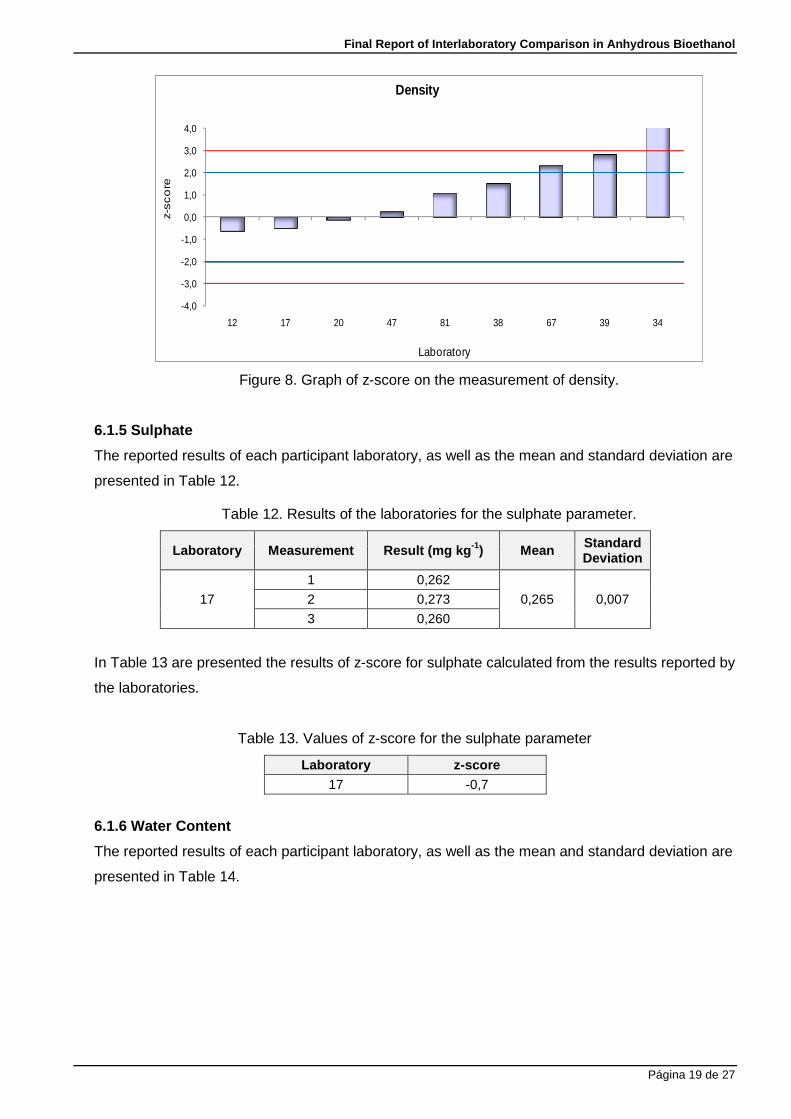
In Figure 8, the result of z-score for density calculated for each laboratory is presented graphically.
Final Report of Interlaboratory Comparison in Anhydrous Bioethanol
Página 19 de 27
-4,0
-3,0
-2,0
-1,0
0,0
1,0
2,0
3,0
4,0
12 17 20 47 81 38 67 39 34
z-sco
re
Laboratory
Density
Figure 8. Graph of z-score on the measurement of density.
6.1.5 Sulphate
The reported results of each participant laboratory, as well as the mean and standard deviation are
presented in Table 12.
Table 12. Results of the laboratories for the sulphate parameter.
Laboratory Measurement Result (mg kg -1) Mean Standard Deviation
17
1 0,262
0,265 0,007 2 0,273
3 0,260
In Table 13 are presented the results of z-score for sulphate calculated from the results reported by
the laboratories.
Table 13. Values of z-score for the sulphate parameter
Laboratory z-score 17 -0,7
6.1.6 Water Content
The reported results of each participant laboratory, as well as the mean and standard deviation are
presented in Table 14.
Final Report of Interlaboratory Comparison in Anhydrous Bioethanol
Página 20 de 27
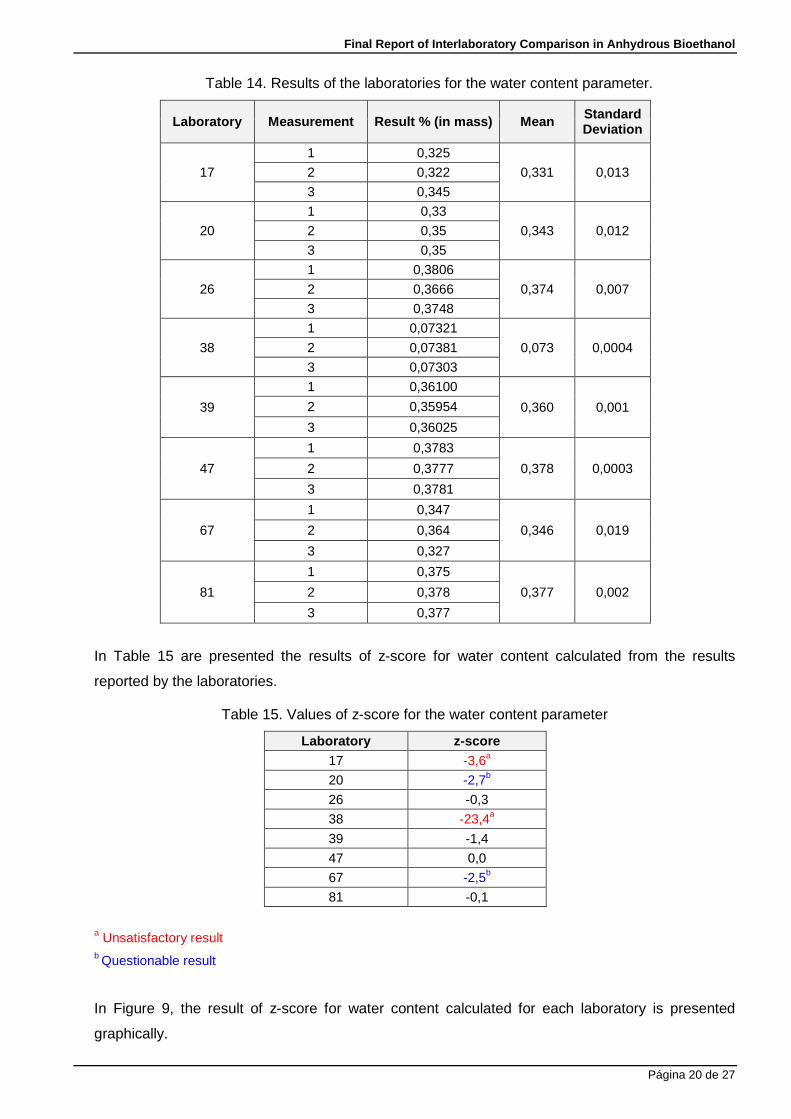
Table 14. Results of the laboratories for the water content parameter.
Laboratory Measurement Result % (in mass) Mean Standard Deviation
17
1 0,325
0,331 0,013 2 0,322
3 0,345
20
1 0,33
0,343 0,012 2 0,35
3 0,35
26
1 0,3806
0,374 0,007 2 0,3666
3 0,3748
38
1 0,07321
0,073 0,0004 2 0,07381
3 0,07303
39
1 0,36100
0,360 0,001 2 0,35954
3 0,36025
47
1 0,3783
0,378 0,0003 2 0,3777
3 0,3781
67
1 0,347
0,346 0,019 2 0,364
3 0,327
81
1 0,375
0,377 0,002 2 0,378
3 0,377
In Table 15 are presented the results of z-score for water content calculated from the results
reported by the laboratories.
Table 15. Values of z-score for the water content parameter
Laboratory z-score 17 -3,6a
20 -2,7b
26 -0,3
38 -23,4a
39 -1,4
47 0,0
67 -2,5b
81 -0,1
a Unsatisfactory result b Questionable result
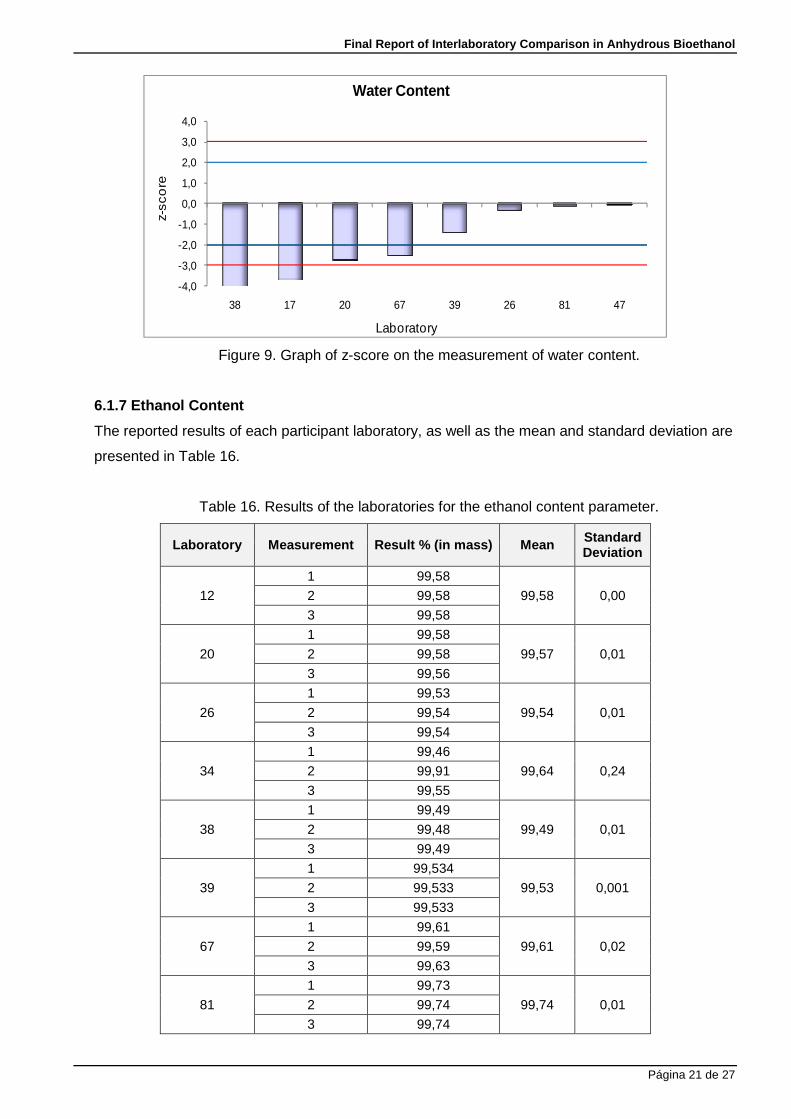
In Figure 9, the result of z-score for water content calculated for each laboratory is presented
graphically.
Final Report of Interlaboratory Comparison in Anhydrous Bioethanol
Página 21 de 27
-4,0
-3,0
-2,0
-1,0
0,0
1,0
2,0
3,0
4,0
38 17 20 67 39 26 81 47
z-sco
re
Laboratory
Water Content
Figure 9. Graph of z-score on the measurement of water content.
6.1.7 Ethanol Content
The reported results of each participant laboratory, as well as the mean and standard deviation are
presented in Table 16.
Table 16. Results of the laboratories for the ethanol content parameter.
Laboratory Measurement Result % (in mass) Mean Standard Deviation
12
1 99,58
99,58 0,00 2 99,58
3 99,58
20
1 99,58
99,57 0,01 2 99,58
3 99,56
26
1 99,53
99,54 0,01 2 99,54
3 99,54
34
1 99,46
99,64 0,24 2 99,91
3 99,55
38
1 99,49
99,49 0,01 2 99,48
3 99,49
39
1 99,534
99,53 0,001 2 99,533
3 99,533
67
1 99,61
99,61 0,02 2 99,59
3 99,63
81
1 99,73
99,74 0,01 2 99,74
3 99,74
Final Report of Interlaboratory Comparison in Anhydrous Bioethanol
Página 22 de 27
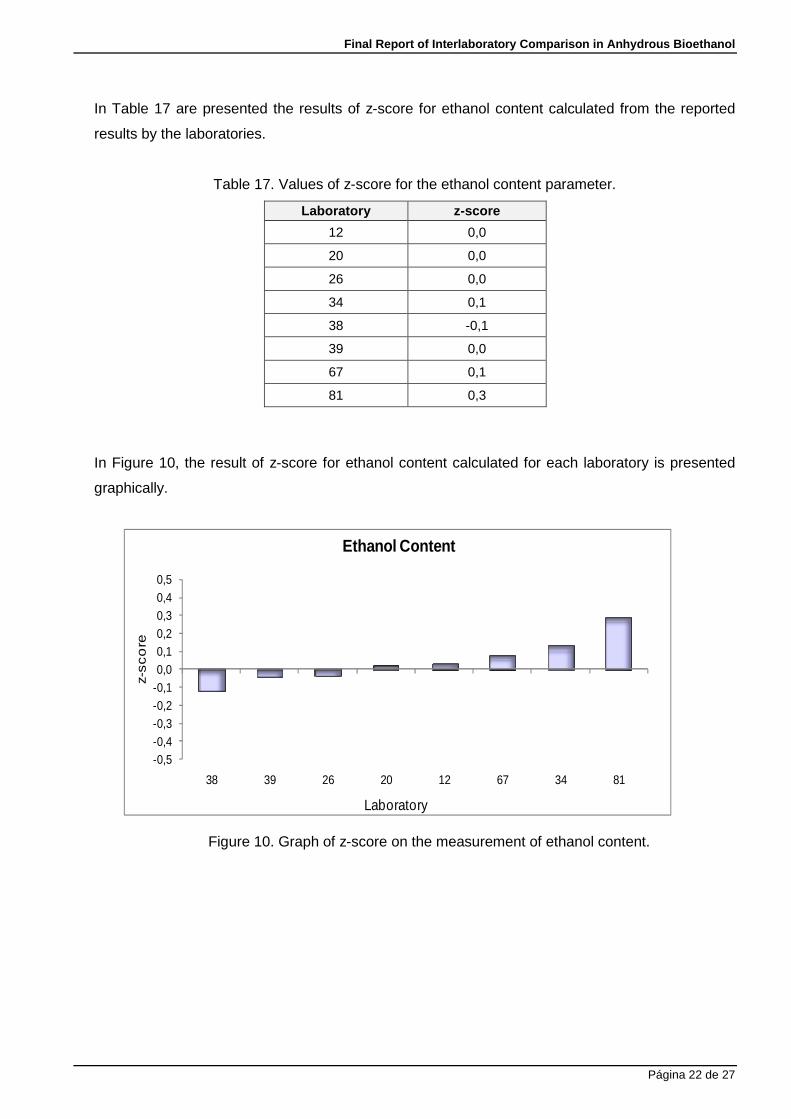
In Table 17 are presented the results of z-score for ethanol content calculated from the reported
results by the laboratories.
Table 17. Values of z-score for the ethanol content parameter.
Laboratory z-score
12 0,0
20 0,0
26 0,0
34 0,1
38 -0,1
39 0,0
67 0,1
81 0,3
In Figure 10, the result of z-score for ethanol content calculated for each laboratory is presented
graphically.
-0,5-0,4-0,3-0,2-0,10,00,10,20,30,40,5
38 39 26 20 12 67 34 81
z-sco
re
Laboratory
Ethanol Content
Figure 10. Graph of z-score on the measurement of ethanol content.
Final Report of Interlaboratory Comparison in Anhydrous Bioethanol
Página 23 de 27
7. Conclusion
Ten laboratories from different countries participated in this exercise of Interlaboratory Comparison in
order to measure quality parameters in anhydrous bioethanol. However, not all laboratories measured
the seven parameters.
Eight laboratories measured the acid number parameter: five laboratories presented unsatisfactory
results; one laboratory presented a questionable result, and two laboratories presented satisfactory
results. The participant laboratories presented different performance due to the use of different kinds
of indicators, such as phenolphthalein (laboratories 20, 39, 47 and 81), bromothymol blue (laboratory
34), alpha- naphtolphthalein (laboratories 17 and 67) and also different standards such as ASTM
D1613 or NBR 9866. Moreover, the laboratory 34 did not mention which standard was followed.
Two laboratories measured the copper content: one laboratory presented unsatisfactory result and
the other presented the result as below of the limit of detection. The laboratory 17 followed the
standard NBR 11331, while the laboratory 20 the NBR 10893. Therefore, the comparability of the
results could not be evaluated.
Nine laboratories participated for the density quantity measurement in this intercomparison. However,
four of these did not evaluate the uncertainty of measurement. From the five laboratories that
evaluated the uncertainty of measurement, two expressed the uncertainty using more than 2
significant figures. This means that some of these laboratories need to acquire the knowledge about
evaluation and expression of uncertainty of measurement according to ISO GUM.
The laboratories’ performance for density measurement, according to the z-score, shows that six
laboratories (12, 17, 20, 38, 47 and 81) reached satisfactory results, and the laboratories 39 and 67
obtained questionable results. The laboratory 34, which had an unsatisfactory result, and the two
laboratories with questionable results (39 and 67) must investigate the reasons behind this
performance. It may be originated from the measurement process or even from the calibration of the
instruments. A recommended practice according to ISO GUIDE 34 is to use a certified reference
material to check the accuracy of the instrument.
From the seven participant laboratories in the measurement of electrolytic conductivity parameter,
four laboratories presented satisfactory results; two laboratories presented unsatisfactory results and
only one laboratory presented questionable result. Two laboratories (34 and 39) did not mention
which standard was followed in the measurements, and three laboratories (12, 20 and 81) carried out
the measurements by using the ASTM D1125 standard. The laboratories 17 and 67 followed the
requirements of the NBR 10547 standard. Most of the participating laboratories used 3 ampoules for
each measurement with a total of 9 measurements.
Final Report of Interlaboratory Comparison in Anhydrous Bioethanol
Página 24 de 27
It is worth to mention that the electrolytic conductivity measurement is strongly influenced by the
temperature of the measurement. Thus, the use of calibrated thermometer inside the sample is
needed to obtain good results, as well as the use of CRM which has its metrological traceability
guaranteed for calibrating the conductivity cell.
For the sulphate parameter, only one participant presented result and its performance was
satisfactory. The participant did not specify the method or the standard which was followed.
Eight laboratories measured the water content parameter. According to the z-score, four laboratories
presented satisfactory results (26, 39, 47 and 81), two laboratories presented unsatisfactory results
(17 and 38) and two laboratories presented questionable results (20 and 67). The laboratories which
had unsatisfactory and questionable results must investigate the reasons behind this performance. It
may be originated from the measurement process. Since these laboratories have experience in
measuring lower values of water content, probably there were losses of mass of bioethanol during the
weighing processes and injection.
Eight laboratories measured the ethanol content parameter. According to the z-score, all laboratories
presented satisfactory results. However, it is important to note that only laboratories 26, 39 and 67
used gas chromatography with flame ionization detector that is a selective technique. The other
laboratories used density meter and laboratory 34 used pycnometer. Although the use of
alcoholimetric tables is a common practice to determine ethanol content, it is not a selective method
to determine this parameter.
Final Report of Interlaboratory Comparison in Anhydrous Bioethanol
Página 25 de 27
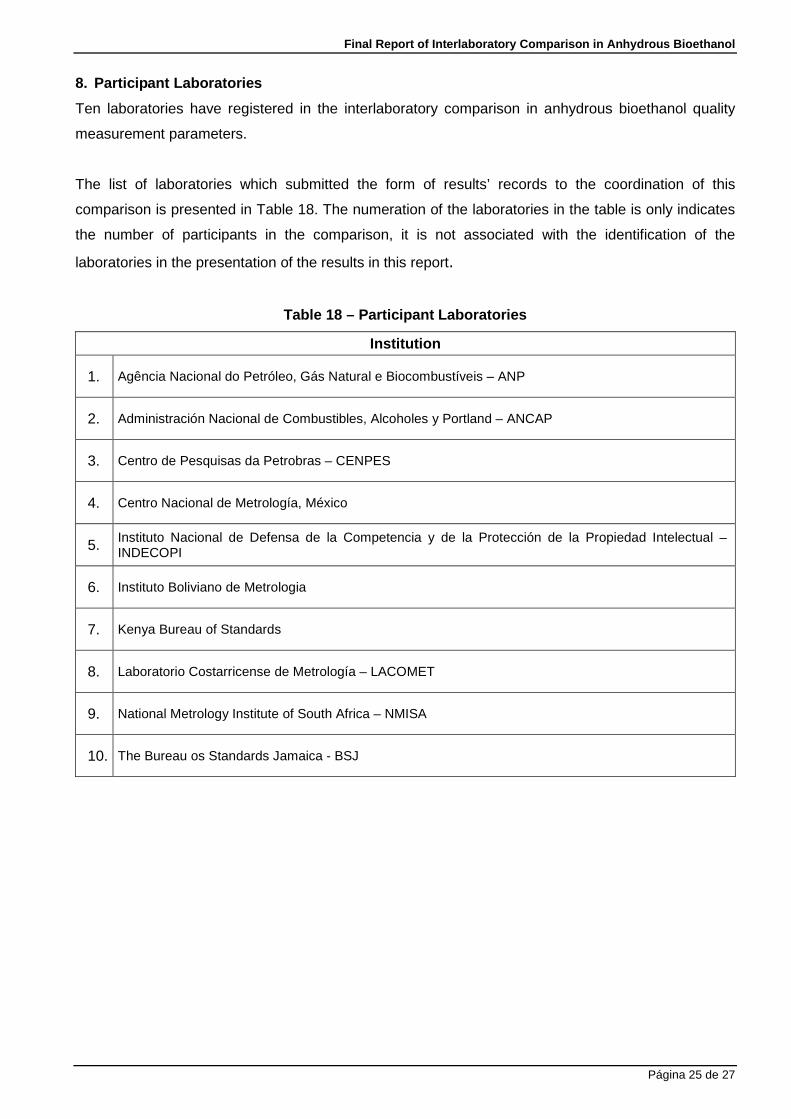
8. Participant Laboratories
Ten laboratories have registered in the interlaboratory comparison in anhydrous bioethanol quality
measurement parameters.
The list of laboratories which submitted the form of results’ records to the coordination of this
comparison is presented in Table 18. The numeration of the laboratories in the table is only indicates
the number of participants in the comparison, it is not associated with the identification of the
laboratories in the presentation of the results in this report.
Table 18 – Participant Laboratories
Institution
1. Agência Nacional do Petróleo, Gás Natural e Biocombustíveis – ANP
2. Administración Nacional de Combustibles, Alcoholes y Portland – ANCAP
3. Centro de Pesquisas da Petrobras – CENPES
4. Centro Nacional de Metrología, México
5. Instituto Nacional de Defensa de la Competencia y de la Protección de la Propiedad Intelectual – INDECOPI
6. Instituto Boliviano de Metrologia
7. Kenya Bureau of Standards
8. Laboratorio Costarricense de Metrología – LACOMET
9. National Metrology Institute of South Africa – NMISA
10. The Bureau os Standards Jamaica - BSJ
Final Report of Interlaboratory Comparison in Anhydrous Bioethanol
Página 26 de 27
9. References
[1] Spitzer, P., Fisicaro, P., Seitz S., Champion, R., “pH and conductivity as parameters to
characterize bioethanol”, Accred Qual Assur, 2009.
[2] INTERNATIONAL ORGANIZATION FOR STANDARDIZATION – ISO/IEC 17043 - Conformity
assessment – General requirement for proficiency testing. Geneva, 2010.
[3] ISO 5725 (E), “Accuracy (trueness and precision) of measurement methods and results”,1994.
[4] NRB ISO GUIDE 43, “Proficiency Testing by Interlaboratory Comparisons – Part 1: Development
and Operation of Programs of Proficiency Testing”, 1999.
[5] Vocabulário Internacional de Metrologia – Conceitos Fundamentais e Termos Associados (VIM
2008), Inmetro, 2009.
[6] Cortez, L.A.B., Sugarcane Bioethanol R & D for Productivity and Sustainability, São Paulo,
Blücher, Fapesp, 2010.
[7] BIPM, IEC, IFCC, ISO, IUPAC, IUPAP, OIML (2008) “Evaluation of measurement data — Guide
to the expression of uncertainty in measurement”, first edition, GUM:1995 with minor corrections.
[8] Eurachem, CITAC, “Quantifying uncertainty in analytical measurement”, 2nd edition, 2000,
http://www.eurachem.ul.pt/.
[9] International Organization for Standardization, “ISO Guide 35 – Reference Materials – General
and statistical principles for certification”, 3rd edition, ISO Geneva, 2006.
[10] International Organization for Standardization, “ISO 5725-2:1994 Accuracy (trueness and
precision) of measurement methods and results - Part 2: Basic method for the determination of
repeatability and reproducibility of a standard measurement method”, Statistical methods for
quality control, Vol. 2 (1994), pp 30-74.
[11] Van der Veen A.M.H., Pauwels J., “Uncertainty calculations in the certification of reference
materials. 1. Principles of analysis of variance”, Accreditation and Quality Assurance 5 (2000),
pp. 464-469.
[12] Van der Veen A.M.H., Linsinger T.P.J, Pauwels J., “Uncertainty calculations in the certification of
reference materials. 2. Homogeneity study”, Accreditation and Quality Assurance 6 (2001), pp.
26-30.
[13] Linsinger T.P.J., Pauwels J., Van der Veen A.M.H., Schimmel H., Lamberty A., “Homogeneity
and Stability of Reference Materials”, Accreditation and Quality Assurance 6 (2001), pp. 20-25
[14] ABNT NBR 10547, “Álcool etílico – Determinação da condutividade elétrica”, 2006,
http://www.abnt.org.br.
[15] ASTM D 1125, “Standard test methods for electrical conductivity and resistivity of water”, 2009.
Final Report of Interlaboratory Comparison in Anhydrous Bioethanol
Página 27 de 27
[16] NBR 9866, “Álcool Etílico – Verificação da Alcalinidade e Determinação da Acidez Total”, Rio de
Janeiro, ABNT, 1987.
[17] ASTM D 1613, “Standard test method for acidity in volatile solvents and chemical intermediates
used in paint, varnish, lacquer, and related products”, 2006.