Embed Size (px)
Citation preview

Final Report
IMPACT OF EDUCATION AND AWARENESS PROGRAMS ON THE
USAGE AND ATTITUDE TOWARDS TEXTING WHILE DRIVING
AMONG YOUNG DRIVERS
Sharad K Maheshwari
Associate Professor
School of Business
Hampton University
Hampton, VA 23668
757-727-5605
And
Kelwyn A. D’Souza
Professor
School of Business
Hampton University
Hampton, VA 23668
757-727-5037
March, 2014
Hampton University
Eastern Seaboard Intermodal Transportation Applications Center
(ESITAC)

1
TABLE OF CONTENTS
Contents
EXECUTIVE SUMMARY ............................................................................................................ 2
1. INTRODUCTION ................................................................................................................... 4
2. LITERATURE REVIEW ....................................................................................................... 5
3. RESEARCH PROCEDURE .................................................................................................... 7
a. Objectives of the Proposed Research ................................................................................... 7
b. Research Design................................................................................................................... 7
c. Data Collection: ................................................................................................................... 8
d. Data Collection, Phase 1 Focus Group ................................................................................ 9
e. Analysis of Focus Group Data ............................................................................................. 9
f. Design of Instruments .......................................................................................................... 9
g. Treatments.......................................................................................................................... 10
h. Data Collection, Phase II ................................................................................................... 10
i. Results and Analysis .......................................................................................................... 10
4. DISCUSSIONS ...................................................................................................................... 21
5. CONCLUSIONS AND RECOMMENDATIONS ................................................................. 22
6. ACKNOWLEDGEMENT ..................................................................................................... 23
7. REFERENCES ....................................................................................................................... 23
8. APPENDICES ....................................................................................................................... 26

2
IMPACT OF EDUCATION AND AWARENESS PROGRAMS ON THE USAGE AND
ATTITUDE TOWARDS TEXTING WHILE DRIVING AMONG YOUNG DRIVERS
EXECUTIVE SUMMARY
Texting-while-driving has become a new menace on the roads. The problem has become a major
cause of highways accidents and injuries especially among young drivers. It well documented in
research literature that this problem is more prevalent among younger drivers largely because
they are the heaviest users of the information technology including texting. Furthermore, the
usage of texting is growing rapidly among millennium generation drivers. As this population
grows old, texting might become even more prevalent on the roads. This has potential of further
increasing accident hazards due to texting-while-driving in the future.
In a very short span of time, texting-while-driving problem became such a large issue that 32 US
states and territories have made some laws against it. However, law is only one part of the
equation. Driver education is the equally important to solve the issues. It is very important to
educate driving public about danger of texting-while-driving. One can draw parallel with seat-
belt laws. Each state has seatbelt law on their books for a longtime. At the same time, both state
and federal governments made strong efforts in the area of public education about advantages of
using seatbelts. Despite aggressive enforcement and creative awareness programs, it took
decades to improve seatbelt usage among drivers. Therefore, it is imperative to start strongly
education programs about danger of texting-while-driving now.
The available literature suggests younger driver have different perceptions of risk that impacts
their behavior related to cell phone use while driving. As mentioned, there are laws being
written to combat the problem. It has also been reported that the decrease in cell phone use after
enactment of law does not hold over the time and that use of cellular phones actually increases
following the initial decrease. Moreover, the enforcement of the laws related to texting-while-
driving is very difficult and challenging. This challenge is evident from reported increases in the
use of cell phone and related electronic device activities while driving. Furthermore, law based
solutions alone can’t change driving behavior. These solutions have to be complimented with
education and awareness programs. Several studies have been completed about reasons on why
young drivers are attracted to texting-while-driving. However, there is a lack of studies in the
area of impact of education and awareness programs about danger of texting-while-driving. In
this two different education and awareness programs were designed based on the input from the
young drivers. 72 randomly selected participants were divided into three groups: control,
awareness treatment and education treatment. A pretest-posttest experiment was conducted on
each group. The results of these experiments measured the effectiveness of the selected
programs.
The major findings of the research are:
Young drivers are generally aware of danger of texting-while-driving.
Majority of young drivers do text while driving.
Young drivers receive different risk level for reading text than either initiating new
conversation or replying to the text message.
After treatments, drivers perceived texting-while-driving as more dangerous activity than
before treatment.

3
After both treatments, there was slight reduction in the texting-while-driving behavior.
The video treatment (PSAs) group showed more reduction than the lecture group.
Participants with higher educational achievements show slight reduction in texting-while-
driving.
Increased awareness of danger of texting-while-driving is a positive sign. It indicates that
repeated consistent messaging about danger of texting-while-driving may help in
reducing the texting-while-driving among young drivers.

4
IMPACT OF EDUCATION AND AWARENESS PROGRAMS ON THE
USAGE AND ATTITUDE TOWARDS TEXTING WHILE DRIVING
AMONG YOUNG DRIVERS
1. INTRODUCTION
One of the main objectives of the Eastern Seaboard Intermodal Transportation Applications Center
(ESITAC) at the Hampton University was to study safety related problems in the region. The
Center’s efforts in this area are being directed towards a new safety concerns; distracted driving.
According to National Highway Transportation Safety Administration (NHTSA) estimates more
than one-half of a million crashes annually occur due to distraction of the driver caused by the
in-vehicle technologies (National Highway Traffic Safety Administration, 2008). Distracted
driving is a very common occurrence in today’s fast paced society. The area of research is more
relevant to younger drivers due to their innate affinity and hyper use for technology.
Approximately, 5,500 people were killed from distracted driving and about 1,000 of those
deaths are attributed to cell-phone related distractions (National Highway Traffic Safety
Administration 1, 2009). It is also estimated by NHTSA that cell phone use while driving has
declined year over year in 2009. This percentage decline includes decline in manipulation of the
cell phone like texting, email access, etc. according to NHTSA’s study conducted in 2009
(NHTSA-1, 2009). However, in the age group 16-24 year old drivers, cell phone use is still
significantly higher (National Highway Traffic Safety Administration 2, 2009). Furthermore,
there are several other reports and papers indicating much higher use of cell phone and other
related devices as well as increasing trend in their usage on the road (Atchley, Atwood, &
Boulton 2011; Vlingo Corp, 2010, AAA, 2009). Vlingo Corp (2010) reported a huge increase in
the texting from 26% to 35% in 2010. This difference in cell phone usage data by NHTSA and
other research reports may be due to the method of data collection: NHTSA reports are based on
the observational data while others reports are based on self reporting data.
It should be noted that any driver faces many other forms of distraction. And all distractions
have potential to interfere with the main task of driving. Other common driver distractions are
eating, reaching to other objects, adjusting controls, smoking, grooming, and tiredness/sleepy.
Recent data shows that cell phone use (without texting) is fast becoming among the worst driver
distraction (Ranney, 2008).
Regardless how the numbers are calculated, distracted driving due to electronic devices is not a
welcome trend. There are number of studies indicating that drivers, ability to control the car and
inability to follow the road signs and instructions is severely impaired when he/she is distracted
due to texting on a cell phone or manipulating an electronic device. Approximately, 20% of all
crashes with injuries are attributed to distracted-driving (NHTSA-1, 2009). A significant portion
of these crashes are due to cell phone distractions. There is no separate statistics available on
cell-phone related crashes by cities or MSAs but one could assume Hampton Roads has similar
percentages of injury crashes due to cell phone use while driving. Furthermore according to one
report, Hampton Roads had the highest crash incidents in the state compared to other regions of the
state on the basis of millions of vehicle-mile traveled (Nichols, 2007).

5
This study was designed to further understand if the cell phone based distraction and to determine
effectiveness of education program among young drivers. The major objectives of the research
project were:
1. To delineate a set of implicit and explicit attitudes of young drivers towards texting-
while-driving in the targeted population. And develop a set of awareness and education
programs based on the delineated attitudes.
2. To determine effectiveness of awareness and education programs on texting-while-
driving. This process of selection and measuring success of awareness and education
programs could be replicated across the region to teach young drivers danger of texting
while driving.
2. LITERATURE REVIEW
The danger of cell phone use in driving has been a part of debate since cell phone became more
prevalent in late 1990s. There is general consensus that the cell phone use reduces drivers’
ability to properly control the vehicle and to maneuver the traffic (Young, Ragan & Hammer,
2003). There is also growing body of literature on danger of texting-while-driving. Hosking,
Young, & Regan (2007) reported that driver while texting spend 400% more time off the road
compared when not texting. This ultimately leads to poor driving performance and increases
chance of crashes. Olson, et al. (2009) reported that risk of accident is 23 times higher in the
commercial vehicles if driver is texting. Lansdown (2009) administered a self-reporting survey
in UK and reported that three most dangerous distractions according to drivers themselves were
writing text messages, reading text messages, and using the hand-held cell-phone. Different
driving impairments due to cell phone use while driving are also reported by different authors
including incorrect lane changing, speed variability, reduce breaking speed, not following road
signs, etc. Almost all younger adults indicate that they use a cellular phone while driving and an
alarmingly high number (as many as 95%) report they text and drive, even though they recognize
it is not safe to do so (Atchley, 2012). Wilson & Stimpson (2010) studied trend in fatality rates
1999-2005 using data from Fatality Analysis Reporting System (FARS) and reported that there is
a 25% increase in fatalities due to distracted driving.
A different studies of driver behavior reported several reasons why driver engage in risky driving
habits. Lee et al. (2008) reported that young drivers are less likely to suspend cell phone use or
texting while involve in difficult driving situation. Nelson, Atchley, & Little (2009) reported
72% use of texting while driving in a survey of college students. And they reported that the use
of cell phone is more dependent on the value driver is placing on the importance of the call than
any other risk factor. The young driver is not deter from texting due to perceived risk of
apprehension or perceived risk of crashing (Walsh et al. 2008). In a study all 16-year-olds in
Connecticut who were involved in nonfatal crashes during the first 8 months of licensure were
interviewed, and police crash reports were examined (Braitman, Kirley, McCartt, & Chaudhary,
2008) to determine reasons of accidents. All crash types and contributing factors were identified.
Three factors contributed about equally to their crashes: failing to detect another vehicle or
traffic control, speeding, and losing control of the vehicle or sliding. Most failures to detect
another vehicle or traffic control involved not looking thoroughly, distraction, or inattention.
The higher likelihood of rear-end collisions was observed for those drivers who were engaged in

6
passenger and cell phone distractions (Neyens &Boyle, 2007). They argue that this type of
evidence provides a strong support for greater education for these distractions in the graduated
driver licensing programs and driver education
Cell phones now integral part of an individual. In a very different type of study, Bayer &
Campbell (2012), found that cell phone use is fast becoming an unconscious decision on the part
of driver. To ascertain this, a survey was conducted utilizing a frequency-independent version of
the experimentally validated Self-Report Habit Index. The findings suggest that texting while
driving behavior may be partially attributable to individuals doing so without awareness, control,
attention, and intention regarding their own actions.
Impact and assessment of cell phone based driver inattention and resulting crash is being studied
by several researchers. Reports show different degree of accidents caused by the cell phone
inattention. Beanland, Fitzharris & Young (2012) studied eleven years of crash reports in
Australia. They reported that 57.6% of cases showed evidence of driver inattention. Boyle, &
Westlake (2012) research shows that the most common subtypes of inattention were restricted
attention, primarily due to intoxication activities while driving to their opinions of what they
actually consider to be distractions. They also reported that approximately 80% teenage driver
considered texting while driving as unsafe still majority of them engaged in texting while driving
at least moderately if not extensively. Redelmeier & Tibshirani (1997) used a case-crossover
design to study cellular phone and crash linkage. Their study indicated that a majority of serious
injury crashes involve driver inattention and found that cell phone users were four times more
likely to be in the crash compared to non-users.
A study conducted by Drews, Yazdani, Godfrey, Cooper, and Strayer (2009) found that analysis
of driving performance revealed that participants in the dual-task condition responded more
slowly to the onset of braking lights and showed impairments in forward and lateral control
compared with a driving-only (without cell phone) condition. Their research shows that a larger
number of drivers who text while driving were involved in crashes as oppose to individuals who
refuse to text while driving. In a laboratory experiment using a gaze tracking system among
professional drivers, Jimenez, Bergasa, Daza & Gonzalez (2012) reported that most accidents
occurred while drivers were using hands-free devices. That shows that any inattention could be
dangerous.
There are many forums promoting awareness of danger of texting-while-driving. Several public
figures are involved in awareness campaigns. Cell phone, insurance and other businesses are
also trying to promote the message. US Department of Transportation Education has mobilized
awareness program through distraction.gov. According to Regan (2006), there is still need of
more “public campaigns to raise awareness of risks, especially for hands-free phone use and text
messaging; highlight factors that increase vulnerability to risks, especially driver inexperience;
promote strategies for minimizing distraction, especially the purchase of the most ergonomic
hands-free phone types; and raise awareness of penalties for using hand-held phones.” Saqer,
Visser, Strohl, & Parasuraman (2012) used video game simulation methods for distracted
driving; they observed a reduction in the cell phone use among graduate students at George
Mason University who participated in simulation experiment. They proposed that this type of
programs can be a practical and cost-effective program for training young drivers.

7
Many states are making laws restricting cell phone use in one or the other way. However,
effectiveness of law still is to be studied over a long period. In a preliminary study conducted by
Foss, Goodwin, McCartt & Hellinga (2009), about the effectiveness of North Carolina law
enacted in 2006, found that “although the proportion of teenagers who reported using phones
while driving declined somewhat following the law, about half admitted they used their phones,
if they had driven, on the day prior to the interview.” They reported that North Carolina's cell
phone restriction had little to no effect on teenage drivers’ use of cell phones shortly after the law
took effect. They reported similar results in more comprehensive study in North Carolina about
the effect of the law two-year after its enactment (Goodwin, O'Brien, & Foss, 2012). McCartt
and Geary (2004) had found that short period after enactment of the new cell phone law in a
state, the positive effect of cell phone law wear away and driver actually started using more cell
phones than before enactment of the law. Law rarely is a major deterrent. Furthermore, laws
intended improve public safety are undercut by the unwillingness of law enforcement to enforce
the laws in the face of negative public sentiment (Lim & Chi, 2013). The epidemic of driving
while distracted by cellular technologies is an important example of a situation where this lack of
uniform laws has contributed to the failed attempts by several states to adequately improve safety
by reducing the problem behavior.
The literature clearly indicating that there is a need to understand and to create more education and
awareness campaign on cell phone use, texting-while-driving and other electronics devices
distractions during the driving. There is also a need to understand why driver engage in such
behavior. Furthermore, what education and awareness programs can help in modifying of risky
behavior? How can impact of such program be measured?
3. RESEARCH PROCEDURE
a. Objectives of the Proposed Research
Research was based on the lack of data in the area of effectiveness educational programs to reduce
the texting while driving among young drivers. As indicated in the previous section, research
shows evidence of the negative impact of any distraction including texting-while-driving. This
research is an attempt to fill this lacuna in literature. The proposed research was focused on the
designing education programs for texting-while-driving and assessing impact of such education
programs on the young drivers’ behavior. The major objectives of the research project are:
To delineate a set of implicit and explicit attitudes of young drivers towards texting-
while-driving in the targeted population. And develop a set of awareness and education
programs based on the delineated attitudes.
To determine effectiveness of awareness and education programs on texting-while-
driving. This process of selection and measuring success of awareness and education
programs could be replicated across the region to teach young drivers danger of texting
while driving.
b. Research Design
This research was focused on young drivers. The research was initiated by attempting to
understand the young drivers’ behavior and attitude toward risky driving. Based on these
attributes, a set of awareness/education programs were created or selected. Research was
conducted in two phases. Phase one was focus group research to understands the attributes and

8
factors which influence young drivers’ driving behavior. Based on the focus group analysis, phase
II was designed. Main objective at the second phase was to determine the effectiveness of the
education and awareness programs. Figure 1 below shows the schematic of the research at phase
II.
Demographical Factor
Environmental Factors Pre-Treat
Driving Behavior Educational Treatment
Post Treat. Driving
Behavior
Personality Factors
Figure 1. Research Schematic Phase II
To determine the impact of education and awareness, two separate programs were selected. The
education program was based on a single one-hour lecture session from a law enforcement officer
and the awareness program was based on one 50-minitute of video and fact presentations to
participants. To measure the impact of these programs two true experiments were planned and
conducted. Experimental framework is presented in Figure 2.
R O1 X O2 (treatment)
R O3 O4 (control)
Effect: (O2-O1)-(O4-O3) Where,
R -Randomness in selection
O1/O3 -Pre-assessment
X -Treatment
O2/O4 -Post-assessment
Figure 2. Experimental Design
c. Data Collection:
Sampling Frame: There are approximately 1000 Freshmen each year at the Hampton University.
Every freshman is required to take the orientation class called UNV101. This class in Fall 2011
was the sampling frame for the experiment. The study was announced in the UNV 101 seminar
(all students in the UNV 101 must attend these seminars) and participants were offered $50.00
compensation for participation. 105 students initially signed up. However, only 80 finally
provided their information. These 80 students were selected as the sample of total sample for the

9
study.
d. Data Collection, Phase 1 Focus Group Two separate focus groups were conducted in November, 2011. Each focus group was an hour
long. Dr. Sharad Maheshwari was the moderator for both focus groups. 16 students participated in
the focus group 1 and 11 participated in the focus group 2. Moderator led the discussion with three
lead-questions. These questions were: “do you text while driving?” “do you consider it safe?” and
“why do you text?”
e. Analysis of Focus Group Data
Major themes of the focus were recorded by the moderator. Summaries of the focus group data is
presented in Appendix (i) and (ii). Both focus groups provided similar information and themes.
As expected students indicated that they do texting-while-driving rather extensively. Most
students did indicate that this was a dangerous activity but they still engage in it. Peer pressure and
role model issues surfaced repeatedly. Almost all students individually believed that they are
better at texting than their peers. They either implied or outright said that since they are better at
texting therefore they are not at any risk of accidents. There are several statements made indicating
inconsistent messages from parents and other adults. Major themes are presented below in the
Table 1.
No. Themes
1 Driver Behavior
2 Driver Perceptions
3 Social Pressure
4 Other Influencers
5 Perceived Risks
6 Technical Skills
Table 1. Major Themes in Focus Group Data
f. Design of Instruments
Based on the literature review and focus group data, four survey instruments were designed. One
instrument was for pre-assessment of the driving behavior. And three other instruments were for
post-assessment of changes in the driving behavior. The pre-assessment instrument had 50
questions. These questions were divided into several major categories (see Table 2). These
categories are based on the focus group analysis. All major elements are included the Appendix
(iii). Complete pre-treatment survey instrument is included in the Appendix (iv).
Post-treatment instruments were small. They asked for 8-13 questions largely repeating questions
from the pre-treatment instrument. All instruments were pre-tested among 10 students. The pre-
testing was carried out to eliminate errors and modify the language of the questions. Basic
validation of the instruments was carried out by group of faculty members. It must be noted that
no test were performed to ascertain the reliability of the instruments. All three post treatment
instruments are included in the Appendices (v), (vi) and (vii).
No Assessment Subsets

10
1 Demographical Assessment
2 Driving Need Assessments
3 Cell Phone Usage
4 Texting-While Driving Assessment
5 Family and Friends Texting Assessment
6 Self Assessment and Other Media
Influencers
7 Risky Behaviors Profile
Table 2. Instrument Survey Major Themes in Focus Group Data
g. Treatments
Two separate treatments were applied. Treatment 1 was focused on awareness and treatment 2
was focused on education. Treatment 1 included a presentation of facts and set of eight videos
from different sources including AAA Foundation for Safety, News video, and other PSA. Videos
were selected based on the contents like instruction, actual accident and aftermath of texting-while-
driving accidents. These topics were selected based on the analysis of focus groups which
indicated lack of knowledge, over confidence and feeling of invincibility. Entire presentation is
included in Appendix (viii). Treatment 2 was an instructive lecture with possibility of Q/A with a
law enforcement officer. Focus group data was shared with the officer to build his talk around the
major themes. Details are included in the Appendix (x).
h. Data Collection, Phase II
All survey data was collected using BlackBoard system. A separate class was created on the
BlackBoard for the experiment and all participants were registered in class. All surveys were set
as the examinations on the BlackBoard to keep track of which survey belongs to which participant.
Participants were divided into three groups: one control group, and two treatment groups.
Treatment groups were randomly set at 30 and control group was set at 20. Out of 80, 78
participants answered pre-survey. However, due to logistics (participants unable to attend due to
some other commitment) and attrition only 72 participants completed both pre and post surveys: 18
in the control group, 22 in treatment 1 (video) and 32 from treatment 2 lecture samples. All the
raw data from the pre-assessment, post assessments and related code books are included in the
Appendices x to xv.
i. Results and Analysis
There were 72 usable responses from the participants. It must be pointed out that participants were
required to fill complete surveys in order to claim $50.00 compensation. Hence, missing data was
not really any issue in this research. There were 45 female and 27 male participants. 96% of the
participants were 18 or 19 years old. That was the target population group for the study. Table 3
shows all the demographical data. About 70% students had high school GPA higher than 3.1.
60% had SAT or equivalent score of 1400 or more. 68% reported that their high school was in
urban area.
Variables Levels Frequency Percentage
Gender Female 45 62.50%
Male 27 37.50%

11
Age 18 42 58.33%
(years) 19 26 36.11%
20 3 4.17%
22 1 1.39%
GPAGroups Less than 2.5 1 1.39%
2.51-2.8 2 2.78%
2.81-3.1 19 26.39%
3.11-3.4 15 20.83%
3.41-3.7 19 26.39%
More than 3.7 16 22.22%
SATRange Less than 1000 2 2.78%
1001-1200 3 4.17%
1201-1400 24 33.33%
1401-1600 27 37.50%
1601-1800 12 16.67%
More than 1801 4 5.56%
UrbanRual Urban 49 68.06%
Non-Urban 23 31.94%
Table 3. Participant Demographical Data
Frequency distribution of by gender, age, GPA ranges, SAT scores and urban/rural locations are
presented in Figures 3 through 7 respectively.
Figure 3. Distribution of participants by gender
0
5
10
15
20
25
30
35
40
45
50
Female Male
Fre
qu
en
cy
Gender

12
Figure 4. Distribution of participants by age
Figure 5. Distribution of participants by GPA
0
5
10
15
20
25
30
35
40
45
18 19 20 22
Fre
qu
en
cy
Age in Years
Age Distribution
0
2
4
6
8
10
12
14
16
18
20
Less than 2.5
2.51-2.8 2.81-3.1 3.11-3.4 3.41-3.7 More than 3.7
Fre
qu
en
cy
GPA Distribution

13
Figure 6. Distribution of participants by SAT Scores
Figure 7. Distribution of participants by Urban/Rural location of high school
Pre-treatment instrument collected data on the participants self perception of safety. Three
separate questions were asked in this category. These were “do you follow the posted speed
limit?”, “do you follow other road safety rules?” and “do you consider yourself a safe driver?”
Based on these three responses, a dichotomous safety variable was created, self perceived safe or
self perceived unsafe driver. Participant was in the self perceived safe category, if participant has
rated himself/herself as safe on two out of three measures. Almost all participants, 70 out of 72
considered themselves safe drivers. (Refer Table 4 and Figure 8 below).
0
5
10
15
20
25
30
Fre
qu
en
cy
SAT
0
10
20
30
40
50
60
Urban Non-Urban
Fre
qu
en
cy
Urban or Rural

14
Variables Levels Frequency Percentage
Self Safe Driver Assessment Self Assessed Safe 70 97.22%
Self Assessed Unsafe 2 2.78%
Influence No Family Texter 57 79.17%
Family Texter 15 20.87%
Exposure Low Exposure to PSAs 60 83.33%
High Exopsure to PSAs 12 16.67%
Risk Traits Low Risk 45 62.50%
High Risk 27 37.50%
Table 4. Participants perception of safe driver, peer/parental influence, exposure to Texting-
While-Driving and risk traits.
Figure 8. Participants self assessment of their driving safety
As reported in the literature that peer and parental influence modifies young driver behavior. Data
on sibling, parents and friends’ texting while driving habit was collected. Most participants
reported that neither their friends, parents or siblings text while they are driving. A composite
dichotomous variable for influence was created: no influence if no one has been reported as texter
while driving, and influence if at least one has been reported as the texter (refer Table 4 and Figure
9.) Only 21% of participants reported any family or peers as texter, indicating very low external
influence.
0
10
20
30
40
50
60
70
80
Self Assessed Safe Self Assessed Unsafe
Fre
qu
en
cy
Self Assessment of Safe Driver

15
Figure 9. Peer/family text while driving.
To ascertain the influence of the education and other programs, it was important to know if
participants have been previously exposed to educational, personal, PSAs or other programs
related to texting while driving. Data on previous exposure to videos, lecture, article reading, PSA
related to texting while driving along with any knowledge of texting while driving accident among
friends or family was collected. A composite dichotomous variable for exposure was created: no
exposure if none of the items were reported or exposure if at least one exposure item was reported
(refer Table 4 and Figure 10.) Only 17% participants recalled any exposure at all to texting while
driving related material.
Figure 10. Exposure to texting while driving education or experience.
0
10
20
30
40
50
60
No Family Texter Family Texter
Fre
qu
en
cy
Family Influence
0
10
20
30
40
50
60
70
Low Exposure to PSAs High Exopsure to PSAs
Fre
qu
en
cy
Exposure to PSAs

16
Data on seven personality related traits was collected. These traits were geared towards other risks
behavior. It included use of tobacco, use of alcohol, tendency to get into physical fights, ability to
make friends, propensity to get angry and feeling of being stressed along with feeling socially
accepted by peers. A composite dichotomous variable for risk was created: low risk if reported
two of less items in the inventory of above traits or high risk if more than two are reported (refer
Table 4 and Figure 11.) Approximately 38% participants are placed in the high risk based on the
data collected.
Figure 11. Risk profile of participants
Consistent with previous research (see section 2), most driver reported texting while driving.
82% reported that they do read text while driving and 59% send text while driving. They
perceive these activities to be safe or very safe. 80% said that reading of text is safe while 70%
said that sending text is safe. This data is presented below in Table 5 as well as in Figures 12
though 15.
Variable Levels Frequency Percentage
Read Text While Driving Yes 59 81.94%
No 13 18.06%
Reply Text While Driving Yes 42 58.33%
No 30 41.67%
Perception of Reading Text Very
Unsafe 4 5.56%
Unsafe 11 15.28%
No Effect 5 6.94%
Safe 31 43.06%
Very Safe 21 29.17%
Perception of Sending Text Very
Unsafe 4 5.56%
0
5
10
15
20
25
30
35
40
45
50
Low Risk High Risk
Fre
qu
en
cy
Personality Risk

17
Unsafe 9 12.50%
No Effect 9 12.50%
Safe 25 34.72%
Very Safe 25 34.72%
Table 5. Texting while driving behavior
Figure 12. Read text messages while driving
Figure 13. Send text messages while driving
0
10
20
30
40
50
60
70
Yes No
Fre
qu
en
cy
Read Text While Driving
0
5
10
15
20
25
30
35
40
45
Yes No
Fre
qu
en
cy
Reply Text While Driving

18
Figure 14. Perception of safety of reading text while driving
Figure 15. Perception of Safety of sending text while driving
To analyze the data, 8 different independent variables and four dependent variables were tested.
The independent variables were Gender, Age, GPA, SAT, Urban/Rural, Family Peer Influence,
Exposure to texting while driving material, and Risk profile. Four dependent variables were
Read Text, Reply Text, Perception of Reading Text and Perception of Sending Text. 32 separate
contingency tables were created and tested. Chi-square test was performed for each contingency
table. All but five tests were insignificant. That is 27 tests had high p-values (between 0.22 -
0
5
10
15
20
25
30
35
Very Unsafe
Unsafe No Effect Safe Very Safe
Fre
qu
en
cy
Perception of Safety of Reading Text While Driving
0
5
10
15
20
25
30
Very Unsafe
Unsafe No Effect Safe Very Safe
Fre
qu
en
cy
Perception of Safety of Sending Text While Driving

19
0.96.) For example, two contingency tables, gender and read text, and gender and reply text, are
discussed here. Among young driver, both male female have similar texting while driving
behavior. Both male and female drivers reported similar numbers for reading and replying text
messages. Results are summarized in Table 6 and presented Figures 16 and 18. Chi-square tests
were performed for contingency tables for gender and “read text” as well as “send text.” Tests
show that texting was independent of gender with p-values of 0.94 and 0.53.
Read Text Reply Text
Yes No Yes No
Female 82.22% 17.78% 55.56% 44.44%
Male 81.48% 18.52% 62.96% 37.04%
Table 6: Gender vs. Read Text and Reply Text
Figure 16: Gender vs. Read Text
Figure 17: Gender vs. Reply Text
Yes No 0
5
10
15
20
25
30
35
40
Female Male Read Text
While Driving
Fre
qu
en
cy
Gender Vs Reading Text While Driving
Yes No 0
5
10
15
20
25
Female Male Reply Text
While Driving
Fre
qu
en
cy
Gender Vs Reply Text While Driving

20
Five contingency table results were significant. These are included in Table 7. Gender and
perceptions of reading as well as gender and perception of sending text were significant. Female
participants reported that they perceive these activities as more unsafe compared to male
participants.
Ind. Variable Dep. Variable p-value Chi-Square Test
Gender Perception of Safety Read Text 0.054
Gender Perception of Safety Send Text 0.003
SAT Read Text 0.084
Exposure Perception of Safety Read Text Less than 0.0001
Exposure Perception of Safety Send Text Less than 0.0001
Table 7. Significant pair of independent and dependent variables
Similarly, higher SAT scores participants were slight less likely to read text, however, there was
no difference for SAT score and reply text variable. Most significant result was the relationship
between previous exposure and perception of danger of texting while driving. Participants,
which have been previously exposed to the texting while driving danger via some means, have
significantly higher perception of danger of texting while driving compared to those who have
not been exposed to such material. It must be noted that there was no significant difference
between exposure and reading or replying text messages. That means, exposure increases
awareness somewhat not necessarily change behavior of texting while driving. However, it is
important to note that only 17% drivers (a sample size of 12) reported any exposure, thus,
precludes researcher to make any broad claims.
Post treatment analysis shows that participants’ perceptions have changed. Increased awareness
has increased understanding of the danger of texting while driving. Table 8 shows how mush
treatment groups perceptions have changed both for reading text and sending text message.
Reduction is value (-1) means that participant think moved from Safe or Very Safe perception to
Unsafe or Very Unsafe perception.
Groups
Average Increase
in Perception on
Reading Text
Average Increase
in Perception on
Sending Text
Control -1.22
Video-Treatment 1 -2.36 -2.50
Lecture-Treatment 2 -2.69 -2.44
Table 8. Increase the Perception of Danger of Reading or Sending Text While Driving
A single factor ANOVA test was performed to test if this increased awareness of danger of
texting while driving is significant. The test showed that improvement was significant with p-
value of 0.024 for perception of reading text and 0.091 for perception of sending text.

21
4. DISCUSSIONS
This study was planned to understand if texting while driving behavior can be modified by
educational efforts. A sample of 72 young drivers was selected for the study. In the phase I of
the research, young drivers revealed several issues in two focus groups. One of the major
aspects which were revealed in the focus groups; is that only young drivers are increasing texting
more while driving and they tend to see nothing wrong with it. Furthermore, peer pressure is so
much that text conversations can’t be stopped. Peers and parents are also not setting good
examples. Almost young participants in the focus groups showed over confidence in their ability
to text while drive. However, admitting that that some of their peers are bad at the art of texting
while driving.
Based on these inputs, two programs are designed: a selection of video for texting while driving
and lecture by law enforcement on texting while driving. Two different survey instruments are
administered on each participant, one prior to treatment of videos or lecture and other after the
treatment.
Demographically sample represented an average age of 18.5 years with 60% females and 40%
male drivers. Sample was 92% African-American hence race as a variable was not considered in
the analysis. All the drivers were college freshmen and 70% reported coming from urban high
schools. 68% of participants were in the GPA range of 3.1 or up. This means that conclusions
could be somewhat restrictive in nature due to sampling frame.
Large number of driver 82% reported that they read text while driving somewhat smaller
percentage, 60% revealed that they reply to texts while driving. More interestingly, they do not
perceive these activities to be unsafe.
Even though, 80% of sample is texting (reading or sending or both), very small number reported
that their friends, parents or sibling text. This seems at odds with finding giving such a high
percentage of texting is reported by young drivers in the sample. It is possible that they are
unwilling to include their friends and family to be counted as texter while driving. Furthermore,
a very few participants reported any exposure to texting while driving PSAs or news items
despite it is being requirement in many high schools for “driver education” training. Almost all
participants (97%) considered themselves as very good driver who follow road rules and observe
speed limits. This also is contrary to all available reports and studies.
Data did not reveal any connection between texting while driving by age or gender. Females and
males are equally likely to text. 19-year olds are no different than 18-year olds. Insurance
companies’ studies show that GPA and safe driving are related; however when it comes to
texting while driving GPA makes no difference. Urban dwellers are as likely to text as non
urban drivers. SAT scores showed a small relationship, but it might be due to smaller numbers
in certain SAT score categories used in the research.
Parental or peer behaviors have no relationship with the texting outcome. Young drivers who
reported that their peers and/or parents text while driving were equally likely to be texting while
driving than those who reported no such influence. Similarly, risk traits showed no connection

22
to texting while driving behavior or perception. Previous exposure did not make any impact on
the act of texting while driving.
Two factors have relationship with perception of danger of texting while driving: gender and
previous exposure. Young female drivers are more likely to say texting (reading or sending) is
more dangerous than their male counter parts. But that has not translated into less texting while
driving by females. Previous exposure to texting while driving material has highest impact on
the perception of danger of texting while driving. However, sample of drivers of previous
experience of watching, reading, listening or witnessing danger of texting while driving was very
small. Only 12 drivers reported such exposure. Furthermore, this exposure made no impact on
behavior of texting while driving.
Post treatment data showed that treatments are important for increasing awareness. As both
video and lecture group reported change in perception of danger of texting while driving.
However, not even time has passed between the treatment and data collection hence longevity of
effect could not be measured. Furthermore, very few drivers reported driving vehicles between
treatment and survey administration. Sample was drawn from college freshmen who are not
allowed to keep vehicle hence very few had chance to drive and to report on actual action of
texting while driving.
5. CONCLUSIONS AND RECOMMENDATIONS
This study was an attempt to understand the effect of educational and awareness programs in
reducing the texting while driving among young drivers. There are well established research
studies indicating that texting while among young driver is on increase and is increasingly
contributing to more accidents and fatalities. Many states are making laws restricting texting
while driving. However, law enforcement alone, if that is even possible, can solve this problem.
We designed and tested two educational/awareness programs. Here are the major
recommendations:
a. Design more target programs for young drivers to make them aware danger of texting-
while-driving.
b. Video exposure and lectures work equally well for increasing the perception of dangerous
nature of the act of texting while driving.
c. Study long-term impact of such programs.
d. Reemphasize the educational programs so that perceptions can be turned into action of
not texting while driving.
e. States should consider more educational and training requirements related to texting
while driving for licensing young drivers.
Despite some significant results, this study had many clear limitations:
a. Study was restricted by the sampling frame. There was no racial diversity in the sample.

23
b. Instruments could be improved as there are inconsistencies in the responses by
participants. For examples, 80% say they do texting while driving but only 21% know
anyone who text while driving.
c. There must be more long-term study to understand how long the effect of the educational
programs lasts.
d. Due to sampling restriction, very few participants cold report on driving behavior after
the treatment due to campus living without automobile.
e. Sample was small to test so many different variables. The percentages in some of the
categories were very low.
f. Larger sample is also needed to carry out more rigorous statistical analysis. That will
establish stronger foundations for the findings.
6. ACKNOWLEDGEMENT
The authors thank the Police Chief, City of Poquoson for making a lecture presentation to the
participants.
7. REFERENCES
AAA Foundation for Traffic Safety. 2009 Traffic Safety Culture Index. Washington, DC:
AAA Foundation forTraffic Safety, 2009.
Atchley, P. (2012). Stuck in the 70s: the role of social norms in distracted driving. Accident
Analysis & Prevention, 48(September), 279 - 284.
Atchley, P., Atwood, S., & Boulton, A. (2011). The choice to text and drive in younger
drivers: Behavior may shape attitude. Accident Analysis & Prevention, 43(1), 134-142.
Bayer, J., & Campbell, S. (2012). Texting while driving on automatic: Considering the
frequency-independent side of habit. Computers in Human Behavior, 28(6), 2083 - 2090.
Retrieved March 26, 2013, from the Science Direct database.
Beanland, V., Fitzharris, M., & Young, K. (2012). Using in-depth data to access the role of
driver inattention and driver distraction in crashes. Injury Prevention, 18(1), 234-325.
Boyle, L., & Westlake, E. (2012). Perceptions of driver distraction among teenage drivers.
Transportation Research Part F: Traffic Psychology and Behaviour, 15(6), 644 -- 653.
Braitman, K., Kirley, B., McCartt, A., & Chaudhary, N. (2008). Crashes of novice teenage

24
drivers: Characteristics and contributing factors. Journal of Saftey Research, 39(1), 47 -- 54.
Drews, F., Yazdani, H., Godfrey, C., Cooper, J., & Strayer, D. (2009). Text messaging
during simulated driving. Human Factors , 51(5), 762 -- 770.
Foss, R., Goodwin, A., McCartt, A., & Hellinga, L. (2009). Short-term effects of a teenage
driver cell phone restriction. Accident Analysis and Prevention, 41(3), 419 -- 424.
Goodwin, A., O'Brien, N., & Foss, R. (2012). Effects of North Carolina's restriction on
teenage driver cell phone use two years after implementation. Accident Analysis and
Prevention, 48, 363 -- 367.
Hosking, S., Young, K., Regan, M., 2007. The effects of text messaging on young novice
driver performance. In: Faulks, I.J., Regan, M., Stevenson, M., Brown, J., Porter, A., Irwin,
J.D. (Eds.), Distracted driving. Australasian College of Road Safety, Sydney, NSW, pp. 155–
187.
Jimenez, P., Bergasa, L., Daza, N., & Gonzalez, I. (2012). Gaze Fixation System for the
Evaluation of Driver Distractions Induced by IVIS. IEEE Transactions on Intelligent
Transportation Systems, 13(3), 1167-1178.
Lansdown T. C. (2010). Frequency and Severity of In-Vehicle Distractions – A Self-Report
Survey. Proceedings of Driver Distraction and Inattention Conference Gothenburg,
Sweden. September 2009.
Lee, S., Klauer, S., Olsen, E., Simons-Morton, B., Dingus, T., Ramsey, D., & Ouimet, M. C.,
2008. Detection of road hazards by novice teen and experienced adult drivers. Transportation
Research Record: Journal of the Transportation Research Board 2078 (1), 26–32
Lim, S., & Chi, J. (2013). Are cell phone laws in the U.S. effective in reducing fatal crashes?
Transport Policy, 27, 158 -- 163.
McCartt, A., Geary, L., 2004. Longer term effects of New York State’s law on drivers’
handheld cell phone use. British Medical Journal 10 (1), 11.
National Highway Traffic Safety Administration, 2008. National Motor Vehicle Crash
Causation Survey (DOT HS 811 059). http://www-nrd.nhtsa.dot.gov/Pubs/811059.PDF.
National Highway Traffic Safety Administration 1, 2009. Distracted Driving.
http://www.distraction.gov/research/PDF-Files/Distracted-Driving-2009.pdf
National Highway Traffic Safety Administration 2, 2009. Driver Electronic Device Use in
2009 National Motor Vehicle Crash Causation Survey (DOT HS 811 059).
http://www.distraction.gov/research/PDF-Files/Driver-Electronic-Device-Use-2009.pdf

25
Nelson, E., Atchley, P., Little, T., 2009. The effects of perception of risk and importance of
answering and initiating a cellular phone call while driving. Accident Analysis and
Prevention 41 (3), 438–444.
Neyens, D., & Boyle, L. (2007). The effect of distractions on the crash types of teenage
drivers. Accident Analysis and Prevention, 39(1), 206 -- 212.
Nichols, K.M. (2007). Hampton Roads Regional Safety Study: General Crash Data and
Trend 2007 Update.
http://www.hrpdc.org/Documents/Transportation/Gen_Crash_Data_Trends_07_Final.pdf
Olson, R. L., Hanowski, R. J., Hickman, S. J. & Bocanegra J. (2009) Driver Distraction in
Commercial Vehicle Operations. The Federal Motor Carrier Safety Administration,
http://www.fmcsa.dot.gov/facts-research/research-technology/report/FMCSA-RRR-09-
042.pdf.
Ranney, T.A., Driver Distraction: A Review of the Current State of Knowledge”. Transportation
Research Center. Inc.: NHTSA. 2008.
Redelmeier, D., & Tibshirani, R. (1997). Association between cellular - telephone calls and
motor vehicle collisions. New England Journal of Medicine, 336(7), 453 -- 458.
Regan, M., 2006. Preventing traffic accidents by mobile phone users. The Medical Journal
of Australia. 185(11/12) 628.
Saqer, H., Visser, E., Strohl, J., & Parasuraman, R. (2012). 4. Distractions N’ Driving:
video game simulation educates young drivers on the dangers of texting while driving. A
Journal of Prevention, Assessment and Rehabilitation, 41(1), 5877-5879.
Vlingo Corporation, 2010. Vlingo’s Third Annual Comprehensive Report: Texting While
Driving in America.
http://www.vlingo.com/sites/default/files/TWDinAmerica.Vlingo.2010.pdf
Walsh, S.P., White, K.M., Young, R.M., 2009. The phone connection: A qualitative
exploration of how belongingness and social identification relate to mobile phone use
amongst Australian youth. Journal of Community and Applied Social Psychology 19 (3),
225–240.
Wilson, F., & Stimpson, J. (2010). Trends in fatalities from distracted driving in the United
States, 1999 to 2008. American Journal of Public Health, 100(11), 2213 -- 2219.
Young, K., Regan, M. & Hammer, M. (2003) Driver distraction: a review of the literature,
Monash University Accident Research Centre, Report No. 206.

26
8. APPENDICES

27
Appendix: i
Summary of First Focus Group on Texting While Driving
Administrative Information
Location: 101 Buckman Hall, Hampton University
Date & Time: Nov 16, 2011@ 2:00 pm- 3:00 pm.
Number of Participants: 16
Moderator: Sharad K. Maheshwari
Lead questions: Do you text while driving?
Do you consider it safe?
Why do you text?
Major themes of Discussions
Driver Behavior
Living in the moment
Over confidence
Integral part of personality
Time healer –accident but went back
Driver perceptions
Can’t happen to me.
Driving is freedom.
Just about everything is dangerous, so is Texting while driving.
I am good but other drivers are bad at Texting.
Mastered texting while driving
Nothing can happen to you/or this can’t happen to me
Don’t think about it as it is every day event.
Social Pressure
Conversation is going on, can’t quit.
Information, I got have it.
Living in the moment.
Importance of conversation is more than the risk posed.
Text must be answered.
Casual conversations, it must continue.
Other Influencers
Inconsistent in parenting.
Peer pressure.
Perceived Risks
Yes it is risky.

28
One must slow down.
Texting not on freeway but OKAY on street.
There are times phone must be put away.
Because it is bad dangerous, not leant how to drive and text.
Technical Skills
Tech in helps in typing by finishing words
Good typing speed
Short words are easy like “LOL”

29
Appendix: ii
Summary of Second Focus Group on Texting While Driving
Administrative Information
Location: 204 Buckman Hall, Hampton University
Date & Time: Nov 18, 2011 @ 2:00 pm- 3:00 pm.
Number of Participants: 11
Moderator: Sharad K. Maheshwari
Lead questions: Do you text while driving?
Do you consider it safe?
Why do you text?
Major themes of Discussions
Driver Behavior
Over rating themselves.
Taking some chance.
Driver perceptions
Over rating their own capabilities.
Screen and other electronics are distraction as well while single texting out.
Accidents are rare.
Accidents happen without texting as well.
Police can’t catch me easily.
Don’t trust others with texting.
Social Pressure
If a girl sends text I have to respond
Conversation is going on, can’t quit.
Information is time.
You can’t quit some conversations.
Other Influencers
Mom does it.
Some texts are important and must be answered.
Perceived Risks
Not texting while raining
Texting only after knowing where you are.
Check Speed limit
Risk is there
No texting in unknown areas
Minimal “texter”

30
Technical Skills
I am good at testing on my new phone
I can answer in a blink on an eye
Law Enforcement
Law is not clear
There is no law education
Police can’t enforce it

31
Appendix iii
TEXTING-WHILE-DRIVING SURVEY DESIGN Pre-Treatment Survey
Demographical Questions
1 Gender
2 Race
3 Age in Years
4 High School GPA (if you don't remember give an approximate number)
5 SAT(if you don't remember give an approximate number)
6 ACT(if you don't remember give an approximate number)
7 Your Home town is (where you attended high school)
Driving Habits Questions
8 Do you drive at home a motor vehicle?
9 What percentage (approximate) of your regular driving is on Freeways?
10 Do you consider yourself a safe driver?
11 Do you follow speed limits while driving most of the time (within 5-10 miles of posted
sign may be considered okay)?
12 Do you generally follow traffic rules other then the speed limit (like stop sign,
signaling, etc)?
13 When in High School, roughly how many miles you drove each day (if you don't
remember give an approximate number)?
Cell Phone Questions
14 Do you own a cell phone? 15 Do you have an unlimited text message plan?
16 Do you text message using cell phone?
17 Approximately how many text message you SEND per day (in case you are not sure, give me a
ballpark figure)
18 Approximately how many text message you RECIEVE per day (in case you are not sure, give
me a ballpark figure)
Texting-While Driving Questions
19 Do you ever Read a text message while driving?
20 How often you Read a text message while driving? (Answer on a scale of 1-5; 1-
Always/Very Often, 2-Often, 3-Sometimes, 4-Rarely, 5-Seldom/Never)

32
21 Do you Reply to a text message while driving?
22 How often you Reply to a text message while driving? (Answer on a scale of 1-5; 1-
Always/Very Often, 2-Often, 3-Sometimes, 4-Rarely, 5-Seldom/Never)
23 Do you INITIATE text message conversation while driving?
24 How often you INITIATE the text message conversation? (Answer on a scale of 1-5; 1-
Always/Very Often, 2-Often, 3-Sometimes, 4-Rarely, 5-Seldom/Never)
25 Do you consider SENDING a text messaging safe while driving? (Answer on a scale of
1-5; 1-very unsafe, 2-unsafe, 3-no effect on safety, 4-safe, 5-very safe)
26 Do you consider READING a text messaging safe while driving? (Answer on a scale of
1-5; 1-very unsafe, 2-unsafe, 3-no effect on safety, 4-safe, 5-very safe)
27 Do you consider SENDING a text message safer than making a call on the cell phone
while driving? (Answer on a scale of 1-5; 1-more unsafe, 2-slightly unsafer, 3-similar,
4-slightly safer, 5-comparatively very safe)
28 Do you consider READING a text message safer than making a call on the cell phone
while driving? (Answer on a scale of 1-5; 1-more unsafe, 2-slightly unsafer, 3-similar,
4-slightly safer, 5-comparatively very safe)
Family and Friends Texting Habits Questions
29 Do you have older sibling/s?
30 If yes, do your sibling/s SEND "Text While Driving"?
31 If yes, do your sibling/s READ "Text While Driving"?
32 Does any of your parent SEND "Text While Driving"?
33 Does any of your parent READ "Text While Driving"?
34 Do your friends SEND "Text While Driving"?
35 Do your friends READ "Text While Driving"?
Self Assessment and Other Media Influencers Questions
36 Do you consider yourself a safe driver?
37 Do you think other drivers on the road are careless driver?
38 Do you know someone close (family member, schoolmate, acquaintance) who got hurt
in a car accident?
39 Do you know someone close (family member, schoolmate, acquaintance) who got hurt
in a car accident due to "TEXTING WHILE DRIVING" by any of the driver/s involved
in the incident?
40 Have you ever seen an public service announcement/advertisement of the danger of
"Texting While Driving"
41 Have you ever seen youtube or other video, TV program or short film on the danger of
"Texting While Driving"?
42 Have you attended a talk/lecture/class on the danger of "Texting While Driving"?
33
43 Have you read an article on the danger of "Texting While Driving"?
Risky Behaviors Profile Questions
44 Have you ever used tobacco products?
45 Have you ever drank alcohol?
46 Have you ever got involved in a physical flight?
47 Do you think you have enough friends?
48 Do you get along with your friends easily?
49 Do you often feel stressed?
50 Do you get angry easily?

34
Appendix iv: Texting While Driving Survey Pre-Treatment
THERE ARE 50 QUESTIONS IN THE SURVEY. PLEASE ANSWER ALL QUESTIONS.
Question Choice1 Choice2 Choice3 Choice4 Choice5 Choice6
1 Gender Male Female
2 Race African-American White Asian Other
3 Age in Years Less_Than_17 17 18 19 20
More_Than
_20
4
High School GPA (if you
don't remember give an
approximate number) GPA
Out of
what
scale
5
SAT (if you don't remember
give an approximate
number) Total_All_3_Sections
6
ACT (if you don't remember
give an approximate
number) Composite
7
Your home town is (where
you attended high school) City State
8
Do you drive a motor
vehicle at home? Yes No
9
What percentage
(approximate) of your
regular driving is on
Freeways? Less_than_25% 26-50% 51-75% more_than_75%
10
Do you consider yourself a
safe driver? Yes No
11
Do you follow speed limits
most of the time while
driving (within 5-10 miles of Yes No

35
posted sign may be
considered okay)?
12
Do you generally follow
traffic rules other than the
speed limit (like stop sign,
traffic sign, traffic signal,
etc)? Yes No
13
When in High School,
roughly how many miles
you drove each day (if you
don't remember give an
approximate number)? Less_than__30 31-60 60-90 over-90
14 Do you own a cell phone? Yes No
15
Do you have an unlimited
text message plan? Yes No
16
Do you text message using
cell phone? Yes No
17
Approximately how many
text message you SEND per
day (in case you are not sure,
give me a ballpark figure) less_than__25 26-50 51-75 76-100 over_100
18
Approximately how many
text message you RECEIVE
per day (in case you are not
sure, give me a ballpark
figure) less_than__25 26-50 51-75 76-100 over_100
19
Do you ever Read a text
message while driving? Yes No
20
How often you READ a text
message while driving?
(Answer on a scale of 1-5; 1-
Always/Very Often, 2-
Often, 3-Sometimes, 4-
Rarely, 5-Seldom/Never) 1 2 3 4 5

36
21
Do you Reply to a text
message while driving? Yes No
22
How often you REPLY to a
text message while driving?
(Answer on a scale of 1-5; 1-
Always/Very Often, 2-
Often, 3-Sometimes, 4-
Rarely, 5-Seldom/Never) 1 2 3 4 5
23
Do you INITIATE text
message conversation while
driving? Yes No
24
How often you INITIATE
the text message
conversation? (Answer on a
scale of 1-5; 1-Always/Very
Often, 2-Often, 3-
Sometimes, 4-Rarely, 5-
Seldom/Never) 1 2 3 4 5
25
Do you consider SENDING
a text messaging safe while
driving? (Answer on a scale
of 1-5; 1-very unsafe, 2-
unsafe, 3-no effect on safety,
4-safe, 5-very safe) 1 2 3 4 5
26
Do you consider READING
a text messaging safe while
driving? (Answer on a scale
of 1-5; 1-very unsafe, 2-
unsafe, 3-no effect on safety,
4-safe, 5-very safe) 1 2 3 4 5

37
27
Do you consider SENDING
a text message safer than
making a call on the cell
phone while driving?
(Answer on a scale of 1-5; 1-
more unsafe, 2-slightly
unsafe, 3-similar, 4-slightly
safer, 5-comparatively very
safe) 1 2 3 4 5
28
Do you consider READING
a text message safer than
making a call on the cell
phone while driving?
(Answer on a scale of 1-5; 1-
more unsafe, 2-slightly
unsafe, 3-similar, 4-slightly
safer, 5-comparatively very
safe) 1 2 3 4 5
29 Do you have older sibling/s? Yes No
30
If yes to the previous
question, does your older
sibling/s SEND "Text While
Driving"? Yes No
31
If yes to previous two
questions, does your older
sibling/s READ "Text While
Driving"? Yes No
32
Does any of your parents
SEND "Text While
Driving"? Yes No
33
Does any of your parents
READ "Text While
Driving"? Yes No
34
Do your most of your friends
SEND "Text While
Driving"? Yes No

38
35
Do your most of your friends
READ "Text While
Driving"? Yes No
36
Do you consider yourself a
safe driver? Yes No
37
Do you think other drivers
on the road are not as safe as
you are? Yes No
38
Do you know someone close
(family member,
schoolmate, acquaintance,
etc.) who got hurt in a car
accident? Yes No
39
Do you know someone close
(family member,
schoolmate, acquaintance,
etc.) who got hurt in a car
accident due to "TEXTING
WHILE DRIVING" by any
of the driver/s involved in
the incident? Yes No
40
Have you ever seen a public
service
announcement/advertisement
of the danger of "Texting
While Driving"? Yes No
41
Have you ever seen a video
(YouTube, TV program,
short film or any other
video) on the danger of
"Texting While Driving"? Yes No
39
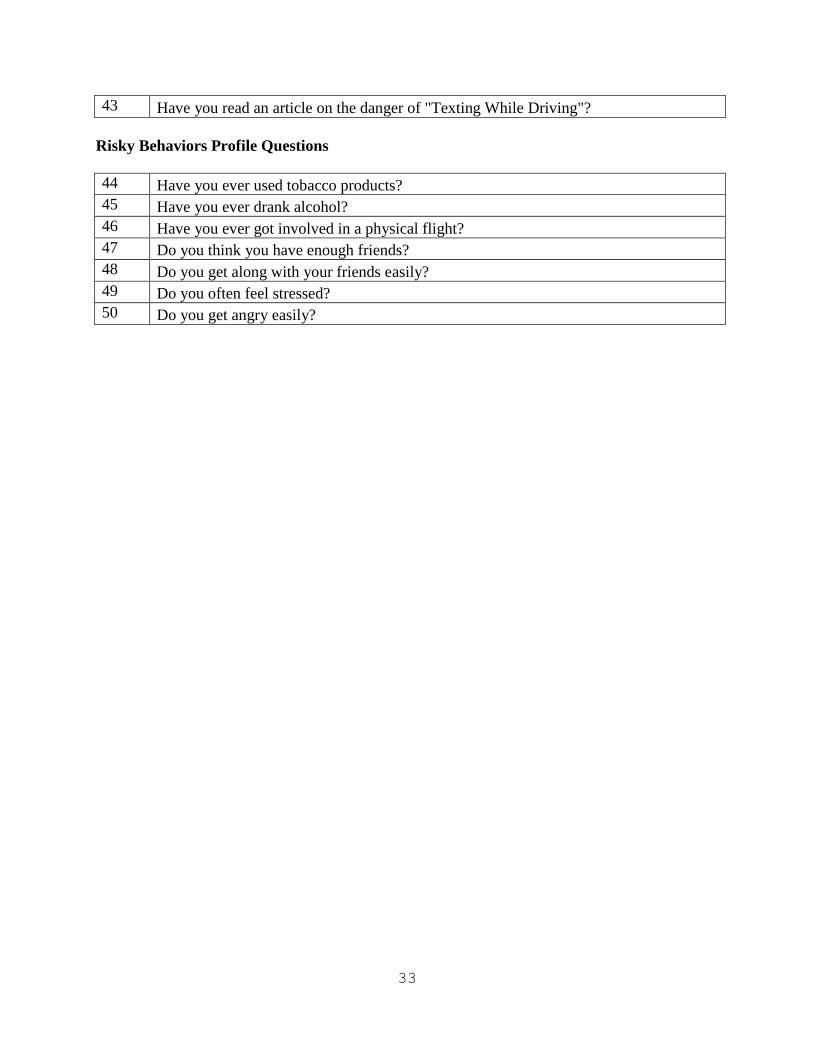
42
Have you attended a talk (in
a class, at the school, at a
community event, at a
church event, or any other
talk) on the danger of
"Texting While Driving"? Yes No
43
Have you ever read an
article (any kind) on the
danger of "Texting While
Driving"? Yes No
44
Have you ever used tobacco
products? Yes No
45
Have you ever drank
alcohol? Yes No
46
Have you ever got involved
in a physical flight? Yes No
47
Do you think you have
enough friends? Yes No
48
Do you get along with your
friends easily? Yes No
49 Do you often feel stressed? Yes No
50 Do you get angry easily? Yes No
40
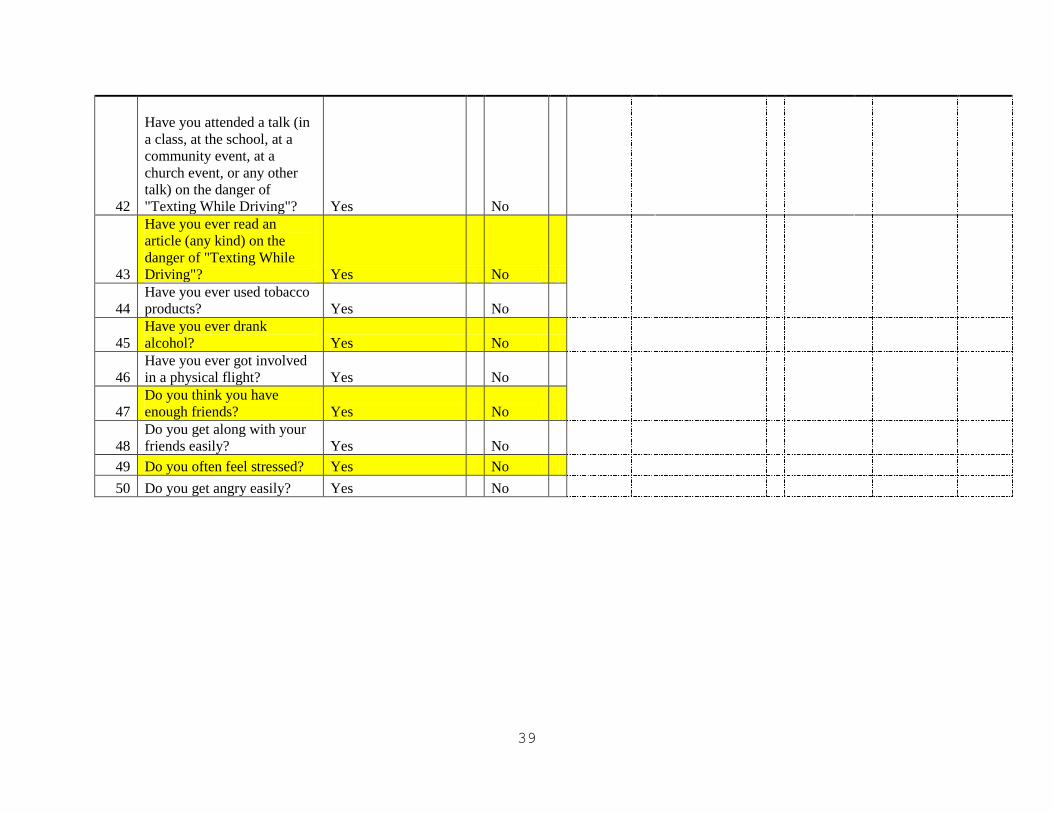
Appendix v
Post Survey Control Group
THERE ARE 13 QUESTIONS IN THE SURVEY.
Question Choices YOUR RESPONSE
1 Have you driven car in the past two months (since Feb 2012?) Yes/No
ONLY ANSWER IF YOU YES TO THE QUESTION 1
2 Did you READ any Text while Driving in the last two months? Yes/No
3 Did you SEND any Text while Driving in the last two months? Yes/No
4 Did you INITIATE any Text while Driving in the last two months? Yes/No
ANSWER FOLLOWING QUESTIONS REGARDLESS OF YOU ANSWER TO THE QUESTION 1
5 Have you seen a public service announcement/advertisement on the danger of "Texting While Driving" in last TWO MONTHS? Yes/No
6 Have you seen a Television Program on the danger of "Texting While Driving" in last TWO MONTHS? Yes/No
7 Have you seen an Internet Video (YouTube, etc.) on the danger of "Texting While Driving" in last TWO MONTHS? Yes/No
8 Have you attended a Lecture on the danger of "Texting While Driving" in last TWO MONTHS? Yes/No
9 Have you read an article on the danger of "Texting While Driving" in last TWO MONTHS? Yes/No
10 Do you consider READING a text messaging safe while driving? (Answer on a scale of 1-5; 1-very unsafe, 2-unsafe, 3-no effect on safety, 4-safe, 5-very safe) 1/2/3/4/5
11 Do you consider SENDING a text message while driving? (Answer on a scale of 1-5; 1-very unsafe, 2-unsafe, 3-no effect of safety, 4-safe, 5-very safe) 1/2/3/4/5

41
12
Do you consider READING a text message safer than making a call on the cell phone while driving? (Answer on a scale of 1-5; 1-more unsafe, 2-slightly unsafe, 3-similar, 4-slightly safer, 5-comparatively very safe) 1/2/3/4/5
13
Do you consider SENDING a text message safer than making a call on the cell phone while driving? (Answer on a scale of 1-5; 1-more unsafe, 2-slightly unsafe, 3-similar, 4-slightly safer, 5-comparatively very safe) 1/2/3/4/5

42
Appendix vi
Post Survey Treatment Group Lecture
THERE ARE 8 QUESTIONS IN THE SURVEY.
Question Choices YOUR RESPONSE
1 Have you driven car since the lecture on the "Texting While Driving" last week? Yes/No
ONLY ANSWER IF YOU YES TO THE QUESTION 1
2 Did you READ any Text while Driving since the lecture on the "Texting While Driving" last week? Yes/No
3 Did you SEND any Text while Driving since the lecture on the "Texting While Driving" last week? Yes/No
4 Did you INITIATE any Text while Driving since the lecture on the "Texting While Driving" last week? Yes/No
ANSWER FOLLOWING QUESTIONS REGARDLESS OF YOU ANSWER TO THE QUESTION 1
5 Do you consider READING a text messaging safe while driving? (Answer on a scale of 1-5; 1-very unsafe, 2-unsafe, 3-no effect on safety, 4-safe, 5-very safe) 1/2/3/4/5
6 Do you consider SENDING a text message while driving? (Answer on a scale of 1-5; 1-very unsafe, 2-unsafe, 3-no effect of safety, 4-safe, 5-very safe) 1/2/3/4/5
7
Do you consider READING a text message safer than making a call on the cell phone while driving? (Answer on a scale of 1-5; 1-more unsafe, 2-slightly unsafe, 3-similar, 4-slightly safer, 5-comparatively very safe) 1/2/3/4/5
8
Do you consider SENDING a text message safer than making a call on the cell phone while driving? (Answer on a scale of 1-5; 1-more unsafe, 2-slightly unsafe, 3-similar, 4-slightly safer, 5-comparatively very safe) 1/2/3/4/5

43
Appendix vii
Post Survey Treatment Group Video
THERE ARE 8 QUESTIONS IN THE SURVEY.
Question Choices YOUR RESPONSE
1 Have you driven car since the lecture on the "Texting While Driving" last week? Yes/No
ONLY ANSWER IF YOU YES TO THE QUESTION 1
2 Did you READ any Text while Driving since the lecture on the "Texting While Driving" last week? Yes/No
3 Did you SEND any Text while Driving since the lecture on the "Texting While Driving" last week? Yes/No
4 Did you INITIATE any Text while Driving since the lecture on the "Texting While Driving" last week? Yes/No
ANSWER FOLLOWING QUESTIONS REGARDLESS OF YOU ANSWER TO THE QUESTION 1
5 Do you consider READING a text messaging safe while driving? (Answer on a scale of 1-5; 1-very unsafe, 2-unsafe, 3-no effect of safety, 4-safe, 5-very safe) 1/2/3/4/5
6 Do you consider SENDING a text message while driving? (Answer on a scale of 1-5; 1-very unsafe, 2-unsafe, 3-no effect on safety, 4-safe, 5-very safe) 1/2/3/4/5
7
Do you consider READING a text message safer than making a call on the cell phone while driving? (Answer on a scale of 1-5; 1-more unsafe, 2-slightly unsafe, 3-similar, 4-slightly safer, 5-comparatively very safe) 1/2/3/4/5
8
Do you consider SENDING a text message safer than making a call on the cell phone while driving? (Answer on a scale of 1-5; 1-more unsafe, 2-slightly unsafe, 3-similar, 4-slightly safer, 5-comparatively very safe) 1/2/3/4/5

44
Appendix viii Treatment 1-Video Education
Listen to the music,Enjoy the ride,
But put your cell—phone on the side.
Ashili McLean
Hampton University
Sigma Beta Delta Chapter
Please click on the image
Approx 2 Min
GET EDUCATED
TEXT MESSAGING BAN
Alaska
Arkansas
California
Colorado
Connecticut
Delaware
District of Columbia
Georgia
Guam
Illinois
Iowa
Kansas
Kentucky
Louisiana
Maryland
Massachusetts
Michigan
Minnesota
Nebraska
New Hampshire
New Jersey
New York
North Carolina
Oregon
Rhode Island
Tennessee
Utah
Vermont
Virginia
Washington
Wisconsin Wyoming

45
USE OF HANDHELD CELL
PHONES BAN
California
Connecticut
Delaware
District of Columbia
Maryland
New York
New Jersey
Oregon
Virgin Islands
Washington
LAW: Primary Law allows an officer
officer to ticket the driver for the
offense related to cell phone use
without any other traffic offense taking place.
ACTION: Law prohibits all or certain types of drivers from
using handheld cell phones while driving.
LAW: Secondary Law allows an officer to give
the driver an additional ticket for cell phone use
as secondary violation if pulled over for another
primary offense.
ACTION: Law bans text messaging for all or certain types
of drivers.
LAWS ON “CELL PHONE USE WHILE DRIVING” VARIES IN
EACH STATE.
VIRGINIA
• Ban on all cell phone use (handheld and hands-free) for
bus drivers (Primary law)
• Ban on all cell phone use (handheld and hands-free) for
novice drivers (Primary law)
• Ban on texting for all drivers (Secondary law; Primary
law for bus drivers)
Note: Virginia defines “novice drivers” as all
drivers under the age of 18.
EVEN IN THE
WORKPLACE
2009 survey of National Safety Council (NSC) member companies:
• 58% had a cell phone policy for employees
• Of those, 40% noted that they COMPLETELY BANNED cell phone use while driving, primarily for reasons of “Employee Safety” and “Public Safety”
• Although most policies are enforced through an honor system,
-43% of companies conduct parking lot
observations
-40% use driver records and traffic
citations
-10% conduct in-vehicle monitoring.

46
EFFECTS & STATE
SAFETY
The AAA Foundation for Traffic Safety found:
• 35% of drivers surveyed felt less safe on the road today then they did five years ago. 31% of those cited distracted driving as the reason.
• Information on distracted driving is a REQUIRED component of Driver Education in 18 states and D.C.,and it is a question on the driver’s license test in 17 states and D.C.
• Motor vehicle crashes are THE LEADING CAUSE OF DEATH for teenagers in the United States. Teen drivers (between 16 and 19) are involved in fatal crashes at 4xthe rate of adult drivers (25 to 69), per mile driven.
Please click on the image
Approx 2 min
INTERESTING FACTS
1. EVERY SECOND you look down to text while
driving at 70MPH, you travel more than 100FT.
That's the height of a 10 story building!
2. Using a cell phone while driving, whether it’s
hand-held or hands-free, delays a driver's
reactions AS MUCH AS having a blood alcohol
concentration at the legal limit of .08%
3. “Distracted Driving” was Webster
Dictionary’s word of the year in 2009.

47
REAL LIFE
EXPERIENCES
Pam Fischer of the New Jersey Division of Highway Traffic Safety says officers already write 10,000 tickets every month for violators of New
Jersey's texting and cell phone bans.
Texting while driving, girl runs into house, police say
A 16-year-old has been charged after police said she drove her car into the attached garage of a house while texting and driving.
There were no injuries in the crash. The girl was charged with:
• Failure to reduce speed to avoid a collision
• Improper use of an electronic communication device
October 26, 2010 Crystal Lake, Illinois
How It Works:
SafeCell uses your phone's GPS function to alert you of applicable cell phone laws, which vary by state, and also notifies you when you're entering a school zone. When it detects that you're driving over 5mph, it will disable the texting and calling functions of your phone, per the laws of the state or jurisdiction you're driving in. For text messages, drivers can elect for the app to auto-respond to messages, saying, "The person you are trying to reach is driving and will receive your message upon reaching their destination." For every 500 miles safely driven, users receive a $5 credit, redeemable at over 500 retail outlets. Rewards are capped at $250 per year.
The app can also track driving patterns, creating a driving log for concerned parents or employers whose children or employees use it.
BE RESPONSIBLE
ON THE ROAD!

48
RESOURCES
• GeekSugar.com
• Department of Transportation
• Creator’s Syndicate
• CTIA The Wireless Association
• Distraction.gov
• University of Utah
• NWHerald.com
Video Presentations
AAA Foundation for Safety
Approx 2 Min
ABC News Distraction Driving
Approx 5 min
AAA Foundation for Traffic Safety
Approx 4 Min
PSA from State of Utah
Approx 10 min

49
PSA University of Kentucky
Approx 8 Min
Today Show Distracted Driving Coverage
Approx 4 Min
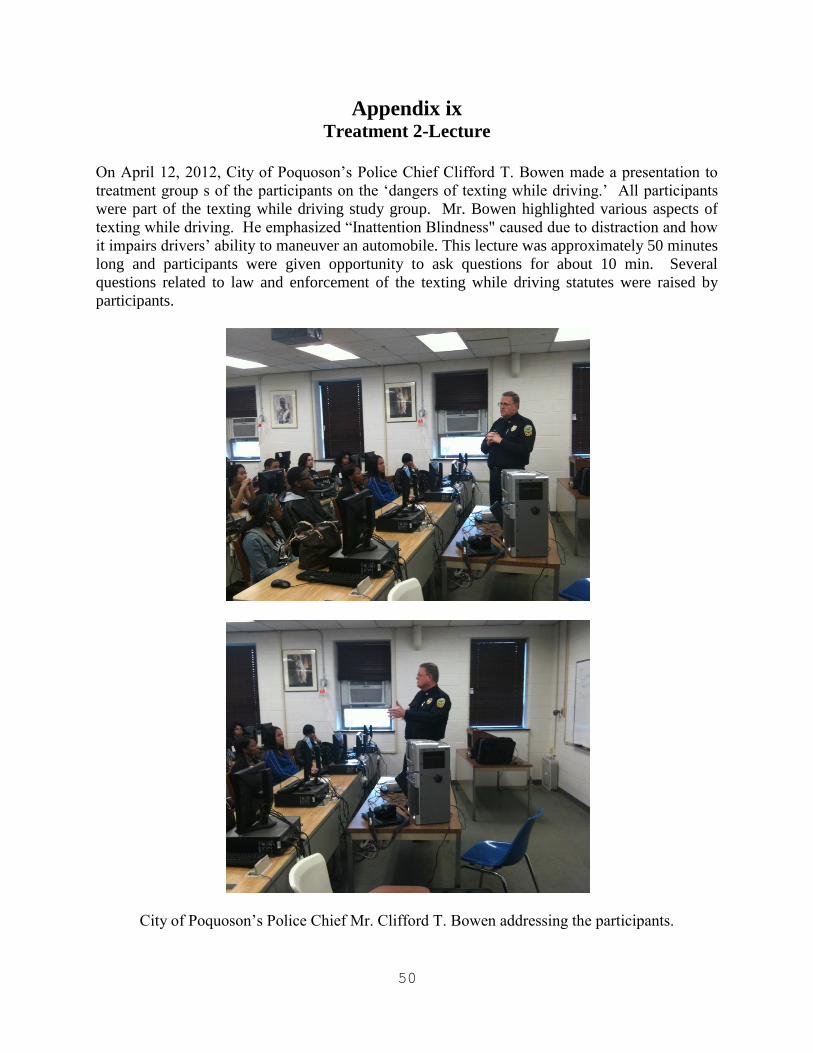
50
Appendix ix Treatment 2-Lecture
On April 12, 2012, City of Poquoson’s Police Chief Clifford T. Bowen made a presentation to
treatment group s of the participants on the ‘dangers of texting while driving.’ All participants
were part of the texting while driving study group. Mr. Bowen highlighted various aspects of
texting while driving. He emphasized “Inattention Blindness" caused due to distraction and how
it impairs drivers’ ability to maneuver an automobile. This lecture was approximately 50 minutes
long and participants were given opportunity to ask questions for about 10 min. Several
questions related to law and enforcement of the texting while driving statutes were raised by
participants.
City of Poquoson’s Police Chief Mr. Clifford T. Bowen addressing the participants.

51
Appendix x Pre Survey Data
Q1 Q2 Q3 Q4 Q5 Q6 Q7 Q8 Q9 Q10 Q11 Q12
No. Gender Race
age_grp GPA SAT ACT State
Drive YesNo
Percentage Freeway
Self Safety
FollowSpeed
FollowRules
1 1 1 19 3.90 1,450 21 TX 1 1 1 1 1
2 2 1 19 3.00 1,450 NJ 1 1 1 1 1
3 2 1 18 3.10 1,580 SC 1 2 1 1 1
4 2 1 19 3.56 1,400 26 FL 1 3 1 2 1
5 1 1 18 3.00 1,460 NY 2 1 2 2 2
6 2 1 18 2.70 19 IL 1 3 1 1 1
7 1 4 19 3.50 1,200 PA 1 2 1 1 1
8 1 1 18 3.30 1,550 24 FL 1 1 1 1 1
9 1 1 18 2.90 900 NC 1 1 2 2 1
10 1 1 18 3.40 1,500 GA 1 2 1 1 1
11 1 1 19 3.50 1,400 28 PA 1 2 1 1 1
12 1 1 19 3.70 20 MI 2 1 1 1 1
13 2 1 18 3.00 1,300 VA 1 1 2 1 1
14 2 1 19 2.90 1,350 NC 2 3 2 1 1
15 1 1 19 2.90 1,200 MD 1 3 1 1 1
16 2 1 20 3.10 1,550 CA 1 3 1 1 1
17 1 1 19 2.70 1,050 18 NY 1 2 1 1 1
18 1 4 19 3.20 1,200 VA 1 2 1 1 1
19 1 1 18 3.80 1,350 21 VA 1 2 1 1 1
20 1 1 18 2.30 1,300 HA 1 2 1 2 1
21 1 1 18 2.80 1,400 17 VA 1 2 1 1 1
22 1 1 19 3.80 1,400 CA 1 3 1 1 1
23 1 1 18 3.75 1,800 MD 1 2 1 1 1
24 1 1 18 3.57 1,390 DE 1 2 1 1 1
25 1 1 18 3.99 1,520 CT 1 3 1 1 1
26 1 1 19 2.90 23 WI 1 1 1 1 1
27 1 1 18 3.64 1,260 16 VA 1 2 1 1 1
28 2 1 18 3.70 24 MI 1 2 1 1 1
29 2 1 18 3.00 1,860 21 CA 1 3 1 1 1
30 1 1 18 3.20 1,380 VA 1 2 1 1 1
31 2 1 19 2.80 1,650 VA 1 2 1 1 1
32 2 2 22 3.50 18 NE 1 2 1 1 1
33 2 1 19 3.20 1,290 DC 1 3 1 1 1
34 1 1 18 3.55 1,900 26 CA 1 1 1 1 1
35 1 1 18 3.32 26 MI 1 2 1 1 1
36 2 1 18 3.30 1,300 19 AZ 1 1 1 1 1
37 1 1 18 3.20 1,400 NJ 2 2 1 1 1
38 2 1 18 3.20 1,145 GA 1 3 1 1 1
39 1 1 19 3.80 1,300 19 IL 1 4 1 1 1
40 2 1 18 3.45 1,490 NJ 2 1 1 1 1

52
Q1 Q2 Q3 Q4 Q5 Q6 Q7 Q8 Q9 Q10 Q11 Q12
No. Gender Race
age_grp GPA SAT ACT State
DriveYesNo
PercentageFreeway
Self Safety
FollowSpeed
FollowRules
41 2 1 19 3.50 1,300 19 NJ 2 1 1 1 1
42 1 1 18 3.60 1,500 WA 1 3 1 1 1
43 1 1 18 4.10 1,600 26 VA 1 2 1 1 1
44 2 1 18 3.00 1,700 GA 1 3 1 2 1
45 1 1 19 3.00 1,680 GA 1 2 1 1 1
46 2 1 18 3.50 19 VA 1 3 1 1 1
47 2 1 19 3.00 1,350 21 CA 1 3 1 1 1
48 1 1 18 3.68 1,600 23 CT 1 2 1 1 1
47 2 1 19 3.00 1,350 21 CA 1 3 1 1 1
48 1 1 18 3.68 1,600 23 CT 1 2 1 1 1
49 2 4 18 3.30 1,500 19 VA 1 1 1 1 1
50 1 1 19 4.10 1,710 MD 1 3 1 1 1
51 1 4 18 3.00 25 TN 1 4 1 1 1
52 1 1 19 3.30 17 TN 1 3 1 1 1
53 1 1 18 3.80 1,500 24 NC 1 3 1 1 1
54 1 1 18 3.90 1,600 21 VA 1 1 1 1 1
55 1 1 18 3.00 1,590 VA 1 2 1 1 1
56 1 1 19 3.30 19 OH 1 2 1 1 1
57 2 1 20 2.94 1,230 VA 1 2 1 1 1
58 1 1 18 3.77 1,600 23 PA 1 2 1 1 1
59 2 1 18 3.40 1,550 21 NY 1 1 1 1 1
60 1 1 18 3.40 1,300 22 OH 1 2 1 1 1
61 1 1 19 3.69 1,440 VA 1 2 1 1 1
62 1 1 19 3.56 1,890 29 VA 1 2 1 1 1
63 2 1 18 3.00 1,190 18 NJ 1 2 1 1 1
64 1 1 18 3.83 1,500 20 PA 1 2 1 1 1
65 1 4 19 3.80 1,680 28 MD 1 2 1 1 1
66 2 1 19 2.80 1,560 24 MD 1 2 1 1 1
67 2 1 19 3.30 20 IL 1 4 1 1 1
68 2 1 18 3.40 1,260 19 NY 1 2 1 1 1
69 1 1 18 3.14 1,600 MD 1 1 1 1 1
70 1 1 18 3.40 1,400 19 GA 1 2 1 1 1
71 2 1 20 2.80 1,470 VA 1 3 1 1 1
72 1 1 18 3.90 1,310 19 NC 1 2 1 1 1

53
Q13 Q14 Q15 Q16 Q17 Q18 Q19 Q20 Q21 Q22 Q23
No. DrivingMiles
Own Cell
Unlimited Mess
Use Text Mess
NoTextSend
NoTextRec
ReadWD
FreqRD
ReplyWD
Freq Rep
Initiate Conver
1 1 1 1 1 3 2 1 2 1 2 2
2 2 1 1 1 4 4 1 3 1 4 2
3 1 1 1 1 2 3 1 3 1 4 2
4 2 1 1 1 2 2 1 4 1 4 1
5 1 1 1 1 3 3 2 4 2 5 2
6 1 1 1 1 2 2 1 1 1 2 2
7 1 1 1 1 5 5 2 4 2 4 2
8 1 1 1 1 5 5 1 4 2 5 2
9 1 1 1 1 2 2 1 5 2 5 2
10 4 1 1 1 5 5 2 4 2 4 2
11 2 1 1 1 2 2 1 3 2 4 2
12 1 1 1 1 2 2 1 3 2 3 2
13 1 1 1 1 3 3 1 1 1 2 2
14 2 1 2 2 1 1 2 2 2
15 3 1 1 1 5 5 2 5 2 5 2
16 2 1 1 1 5 5 1 3 1 2 2
17 1 1 1 1 3 2 2 5 2 5 2
18 2 1 1 1 4 4 1 3 1 3 2
19 1 1 1 1 5 5 1 3 1 4 2
20 1 1 1 1 3 4 1 3 2 5 2
21 1 1 1 1 2 2 1 1 1 1 1
22 1 1 1 1 4 4 1 3 1 3 2
23 1 1 1 1 4 4 2 5 2 5 2
24 1 1 1 1 2 2 1 4 2 5 2
25 2 1 1 1 5 5 1 1 2 5 2
26 2 1 1 1 2 2 1 2 1 4 2
27 1 1 1 1 5 5 1 3 1 3 1
28 1 1 1 1 2 2 1 5 2 5 2
29 1 1 1 1 4 4 1 4 2 5 2
30 2 1 1 1 5 5 1 4 2 5 2
31 2 1 1 1 4 4 1 2 1 2 2
32 4 1 1 1 5 5 1 3 1 3 1
33 2 1 1 1 2 3 1 2 1 2 2
34 1 1 1 1 1 1 2 5 2 5 2
35 1 1 1 1 3 3 1 3 1 4 2
36 1 1 1 1 5 5 1 4 1 2 2
37 1 1 1 1 5 5 1 2 1 2 2
38 1 1 1 1 3 3 2 4 1 4 2
39 2 1 1 1 4 5 1 3 1 3 2
40 1 1 1 1 5 5 1 2 1 2 1

54
Q13 Q14 Q15 Q16 Q17 Q18 Q19 Q20 Q21 Q22 Q23
No. DrivingMiles
Own Cell
Unlimited Mess
Use Text Mess
NoTextSend
NoTextRec
ReadWD
FreqRD
ReplyWD
Freq Rep
Initiate Conver
41 1 1 1 1 2 3 1 5 2 5 2
42 2 1 1 1 3 2 1 3 1 4 2
43 1 1 1 1 5 5 1 3 1 4 2
44 2 1 1 1 3 3 1 5 2 5 2
45 2 1 1 1 5 5 1 3 1 4 2
46 1 1 1 1 2 2 1 1 1 2 2
47 2 1 1 1 2 2 1 3 1 3 2
48 1 1 1 1 2 2 1 4 2 4 2
49 1 1 1 1 5 5 1 1 1 2 2
50 2 1 1 1 5 5 1 1 1 1 1
51 2 1 1 1 3 3 1 3 1 4 2
52 2 1 1 1 3 1 1 4 1 4 2
53 2 1 1 1 4 4 1 1 1 1 2
54 1 1 1 1 3 3 1 2 1 2 2
55 1 1 1 1 5 5 1 3 1 3 2
56 1 1 1 1 4 4 1 3 2 5 2
57 1 1 1 1 3 2 2 5 2 5 2
58 1 1 1 1 2 2 1 3 1 3 2
59 4 1 1 1 2 2 1 4 2 5 2
60 1 1 1 1 4 4 1 5 2 5 2
61 1 1 1 1 5 5 1 4 2 5 2
62 2 1 1 1 4 4 1 3 1 3 2
63 2 1 1 1 1 1 1 3 2 3 2
64 1 1 1 1 5 5 1 1 1 3 1
65 1 1 1 1 5 5 1 3 1 4 2
66 1 1 1 1 3 3 2 5 2 5 2
67 2 1 1 1 3 3 1 3 1 3 1
68 1 1 1 1 3 2 2 5 2 5 2
69 1 1 1 1 2 2 2 2 2
70 2 1 1 1 2 1 1 3 1 2 2
71 3 1 1 1 3 4 1 1 1 3 2
72 2 1 1 1 2 3 1 3 1 4 2

55
Q24 Q25 Q26 Q27 Q28 Q29 Q30 Q31 Q32 Q33 Q34
No.
FreqInitiation
Perception Send Text
Perception Read Text
Compare Send Call
Compare Read Call
SiblingOlder
SiblingSend WD
SiblingRead WD
ParentSend
ParentRead
FriendsText Send
1 3 2 2 4 4 1 2 2 2 2 2
2 5 3 3 4 4 1 2 2 2 2 2
3 4 2 2 2 2 1 1 1 2 1 2
4 4 2 2 5 5 1 1 1 2 2 1
5 4 5 5 5 5 1 2 2 2 2 2
6 3 3 3 3 2 2 2 2 2
7 4 4 4 4 4 2 2 2 2 2 2
8 5 2 2 1 1 2 2 2 2 2 2
9 5 5 5 5 5 1 2 2 2 2 2
10 4 4 4 4 4 1 2 2 2 2 2
11 5 4 4 5 5 2 2 2 2 2 2
12 5 2 5 5 5 1 1 1 2 2 1
13 4 5 5 1 1 1 2 2 2 2 1
14 5 5 2 3 2 2 2 2
15 5 1 1 1 3 2 2 2 2
16 5 3 4 1 1 1 1 1 1 1 1
17 5 1 1 5 1 2 2 2 1 1 1
18 4 4 5 5 1 2 2 2 2 2
19 5 4 4 5 5 1 2 2 2 2 2
20 5 5 5 5 5 2 2 2 2
21 3 4 4 5 5 2 2 2 2
22 5 5 5 3 3 2 2 2 2 2 2
23 3 5 5 5 3 1 2 2 2 2 2
24 5 5 5 5 5 2 2 2 2
25 5 5 5 5 5 1 2 2 2 2 2
26 5 5 4 5 3 1 2 2 2 2 2
27 3 5 5 4 5 1 2 2 2 2 2
28 5 4 4 4 5 2 2 2 2 2 2
29 5 3 4 2 4 1 2 2 2 2 2
30 5 1 1 1 1 1 2 2 1 1 1
31 4 4 4 4 4 1 2 2 2 2 2
32 3 3 3 3 3 1 2 2 2 2 2
33 4 4 4 4 4 1 2 2 2 2 2
34 5 1 1 3 3 1 1 1 1 1 1
35 5 4 4 2 5 1 2 2 2 2 2
36 5 4 4 4 2 2 2 2 2 2
37 2 5 5 5 5 1 2 2 2 2 2
38 5 5 4 5 5 1 2 2 2 2 2
39 4 5 2 5 1 2 2 2 2 2
40 3 2 2 5 3 2 2 2 1 1 1

56
Q24 Q25 Q26 Q27 Q28 Q29 Q30 Q31 Q32 Q33 Q34
No.
FreqInitiation
Perception Send Text
Perception Read Text
Compare Send Call
Compare Read Call
SiblingOlder
SiblingSend WD
SiblingRead WD
ParentSend
ParentRead
FriendsText Send
41 5 5 4 5 5 1 2 2 2 2 2
42 5 4 4 5 5 2 2 2 2 2 2
43 5 5 5 3 5 2 1 2 2 2
44 5 4 2 5 3 2 2 2 2 2
45 5 4 4 5 4 1 2 2 2 2 2
46 3 3 3 3 2 2 1 2 2 2
47 4 2 2 2 2 1 2 2 2 2 2
48 5 5 4 5 4 1 2 2 2 2 2
49 4 4 4 5 5 2 2 2 2 2 2
50 2 4 4 4 4 1 2 2 2 2 2
51 4 5 5 5 4 2 2 2 2 2 2
52 4 5 5 5 5 2 2 2 2 2 2
53 3 4 4 4 1 1 1 1 1 1 1
54 3 4 4 4 4 1 2 2 2 2 2
55 4 4 4 5 5 1 2 2 2 2 2
56 4 4 4 5 5 1 1 1 2 1 2
57 5 5 5 5 5 1 2 2 2 2 2
58 4 2 2 1 1 1 1 2 1 1 2
59 5 5 5 5 5 1 2 2 2 2 2
60 2 5 2 1 5 2 2 2 2 2 2
61 5 4 5 5 5 1 2 2 2 2 2
62 4 4 5 5 1 2 2 2 2 2
63 3 3 4 5 4 2 2 2 2 2 2
64 3 3 4 4 5 1 2 2 2 2 2
65 5 4 3 5 1 2 2 2 2 2 2
66 5 5 5 5 5 2 2 1 2 2 2
67 3 2 2 2 1 2 2 2 2 2
68 5 4 4 4 5 1 2 2 2 2
69 5 5 5 5 1 2 2 2 2 2
70 4 5 4 5 5 2 2 2 2
71 3 3 4 2 2 1 2 2 2 2 2
72 5 4 2 5 2 1 2 2 2 2 2

57
Q35 Q36 Q37 Q38 Q39 Q40 Q41 Q42 Q43 Q44
No.
Friends Text Read
Repeat Self Safety
Perception Safety Others
Close Hurt Car Acc
Close Hurt Car Acc TWD
Expose PubSer Ann TWD
ExposeVid
ExposeTalk
ExposeRead Tobacco
1 2 1 2 2 2 2 2 2 2 2
2 2 1 1 1 2 2 2 2 2 2
3 2 2 2 2 2 2 2 2 2 2
4 1 1 1 1 1 1 1 2 2 1
5 2 1 1 1 2 2 2 2 2 2
6 2 1 1 2 2 2 2 2 2 2
7 2 1 1 1 2 2 2 2 2 2
8 2 1 1 1 2 2 2 2 2 2
9 2 2 1 1 2 2 2 2 2 2
10 2 1 2 1 2 2 2 2 2 2
11 2 1 1 1 2 2 2 2 2 2
12 1 1 1 1 2 1 2 2 1 2
13 1 2 2 1 2 1 1 2 1 1
14 2 2 2 1 2 2 2 2 2 2
15 2 1 2 1 2 1 1 1 1 1
16 1 1 1 1 1 1 1 1 1 2
17 1 1 1 1 2 1 1 1 1 2
18 2 1 1 1 2 2 2 2 2 2
19 2 2 1 1 2 2 2 2 2 2
20 2 1 1 2 2 2 2 2 2 1
21 2 1 1 1 2 2 2 2 2 2
22 2 1 1 2 2 2 2 2 2 2
23 2 1 1 1 2 2 2 2 2 2
24 2 1 1 1 2 2 2 2 2 2
25 2 1 1 2 2 2 2 2 2 2
26 2 1 1 1 2 2 2 2 2 1
27 2 1 1 1 2 2 2 2 2 2
28 2 1 1 1 2 2 2 2 2 2
29 2 1 2 1 2 2 2 2 2 2
30 1 1 1 1 1 1 1 1 1 2
31 2 1 1 1 2 2 2 2 2 1
32 2 1 1 1 2 2 2 2 2 1
33 2 1 1 1 2 2 2 2 2 2
34 1 1 1 2 1 1 1 2 1 1
35 2 1 2 2 2 2 2 2 2 2
36 2 1 1 1 2 2 2 2 2 2
37 2 1 2 1 2 2 2 2 2 2
38 2 1 1 1 2 2 2 2 2 2
39 2 1 1 1 2 2 2 2 2 2
40 1 1 1 1 2 1 2 1 2 1

58
Q35 Q36 Q37 Q38 Q39 Q40 Q41 Q42 Q43 Q44
No.
FriendsText Read
RepeatSelf Safety
Perception Safety Others
Close Hurt CarAcc
Close Hurt Car Acc TWD
Expose PubSer Ann TWD
ExposeVid
ExposeTalk
ExposeRead Tobacco
41 2 1 1 1 2 2 2 2 2 2
42 2 1 2 1 2 2 2 2 2 2
43 2 1 1 1 2 2 2 2 2 2
44 2 1 1 1 2 2 2 2 2 2
45 2 1 1 1 2 2 2 2 2 2
46 2 1 1 2 2 2 2 2 2 2
47 2 1 2 1 2 2 2 2 2 2
48 2 1 1 1 2 2 2 2 2 1
49 2 1 1 1 2 2 2 2 2 2
50 2 1 1 1 2 2 2 2 2 1
51 2 1 1 2 2 2 2 2 2 2
52 2 1 2 1 2 2 2 2 2 2
53 1 1 1 1 2 1 1 2 2 1
54 2 1 1 1 2 2 2 2 2 2
55 2 1 2 1 2 2 2 2 2 1
56 1 1 1 2 2 1 2 1 1 2
57 2 1 1 2 2 2 2 2 2 2
58 1 1 2 1 1 1 2 2 2 2
59 2 1 1 1 2 2 2 2 2 1
60 2 1 1 1 2 2 2 2 2 1
61 2 1 1 1 2 2 2 2 2 2
62 2 1 1 1 2 2 2 2 2 2
63 2 1 1 1 2 2 2 2 2 1
64 2 1 2 1 2 2 2 2 2 2
65 2 1 2 2 2 2 2 2 2 2
66 2 1 2 1 2 2 2 2 2 2
67 2 2 1 1 2 2 2 2 2 2
68 2 1 1 1 2 2 2 2 2 2
69 2 1 1 1 2 2 2 2 2 2
70 2 1 2 1 2 2 2 2 2 2
71 2 1 1 1 2 2 2 2 2 1
72 2 1 1 1 2 2 2 2 2 1

59
Q45 Q46 Q47 Q48 Q49 Q50
No. Alcohol PhysicalFight EnoughFriends FriendsEasily Stress Anger
1 1 2 1 1 1 2
2 1 2 2 1 1 2
3 2 2 2 2 2 2
4 2 1 1 1 1 1
5 1 1 1 1 1 2
6 2 1 1 1 2 1
7 2 2 1 1 2 2
8 1 2 1 1 2 2
9 1 1 1 1 1 1
10 2 2 1 1 2 2
11 2 1 1 1 2 2
12 1 2 1 1 1 1
13 1 1 1 1 1 1
14 1 2 1 1 1 2
15 1 2 1 1 1 2
16 1 1 1 1 1 2
17 1 2 1 1 1 1
18 1 2 1 1 1 1
19 1 1 1 1 1 1
20 1 1 1 1 1 2
21 2 1 1 1 1 1
22 1 2 1 1 1 2
23 1 2 1 1 2 2
24 1 2 1 1 1 2
25 2 2 1 1 1 2
26 1 2 1 1 2 2
27 1 2 2 1 1 2
28 1 2 1 1 2 2
29 2 1 1 1 2 1
30 1 2 1 1 1 2
31 1 1 1 1 2 2
32 1 1 1 1 1 1
33 2 1 1 1 2 2
34 2 2 2 1 2 1
35 1 2 1 1 1 2
36 1 1 1 1 1 1
37 1 2 1 1 1 2
38 1 1 1 1 2 2
39 2 2 1 1 2 2
40 1 1 1 1 2 2

60
Q45 Q46 Q47 Q48 Q49 Q50
No. Alcohol PhysicalFight EnoughFriends FriendsEasily Stress Anger
41 1 2 1 1 1 2
42 1 2 2 1 2 2
43 2 2 1 1 2 2
44 1 1 1 1 2 2
45 1 2 1 1 2 2
46 2 1 1 1 2 1
47 1 1 1 1 2 2
48 1 2 2 2 1 2
49 2 2 1 1 2 2
50 1 2 1 1 1 2
51 2 2 1 1 1 2
52 1 2 1 1 2 1
53 1 1 1 1 1 2
54 1 2 1 1 2 2
55 1 1 1 1 2 2
56 1 2 1 1 2 2
57 2 1 1 1 2 2
58 1 2 1 1 2 1
59 1 2 1 1 2 2
60 2 2 1 1 1 1
61 1 2 1 1 2 2
62 1 2 1 1 1 1
63 1 2 2 1 2 2
64 2 1 1 1 2 2
65 1 1 1 1 2 2
66 1 1 1 1 1 1
67 1 1 1 1 1 2
68 1 1 1 1 1 2
69 1 2 1 1 1 2
70 2 1 1 1 2 2
71 1 1 1 1 2 2
72 1 1 1 1 1 2
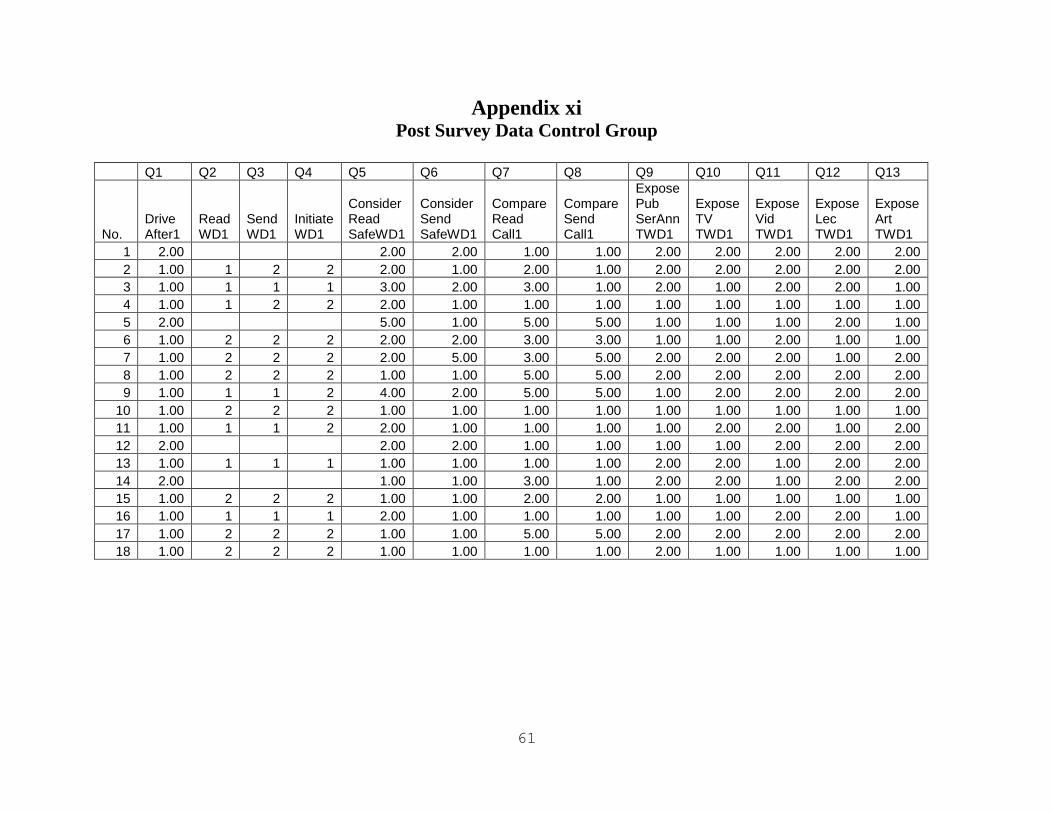
61
Appendix xi Post Survey Data Control Group
Q1 Q2 Q3 Q4 Q5 Q6 Q7 Q8 Q9 Q10 Q11 Q12 Q13
No. DriveAfter1
ReadWD1
SendWD1
InitiateWD1
Consider Read SafeWD1
Consider Send SafeWD1
Compare Read Call1
Compare Send Call1
ExposePub SerAnn TWD1
Expose TV TWD1
Expose Vid TWD1
Expose Lec TWD1
Expose Art TWD1
1 2.00 2.00 2.00 1.00 1.00 2.00 2.00 2.00 2.00 2.00
2 1.00 1 2 2 2.00 1.00 2.00 1.00 2.00 2.00 2.00 2.00 2.00
3 1.00 1 1 1 3.00 2.00 3.00 1.00 2.00 1.00 2.00 2.00 1.00
4 1.00 1 2 2 2.00 1.00 1.00 1.00 1.00 1.00 1.00 1.00 1.00
5 2.00 5.00 1.00 5.00 5.00 1.00 1.00 1.00 2.00 1.00
6 1.00 2 2 2 2.00 2.00 3.00 3.00 1.00 1.00 2.00 1.00 1.00
7 1.00 2 2 2 2.00 5.00 3.00 5.00 2.00 2.00 2.00 1.00 2.00
8 1.00 2 2 2 1.00 1.00 5.00 5.00 2.00 2.00 2.00 2.00 2.00
9 1.00 1 1 2 4.00 2.00 5.00 5.00 1.00 2.00 2.00 2.00 2.00
10 1.00 2 2 2 1.00 1.00 1.00 1.00 1.00 1.00 1.00 1.00 1.00
11 1.00 1 1 2 2.00 1.00 1.00 1.00 1.00 2.00 2.00 1.00 2.00
12 2.00 2.00 2.00 1.00 1.00 1.00 1.00 2.00 2.00 2.00
13 1.00 1 1 1 1.00 1.00 1.00 1.00 2.00 2.00 1.00 2.00 2.00
14 2.00 1.00 1.00 3.00 1.00 2.00 2.00 1.00 2.00 2.00
15 1.00 2 2 2 1.00 1.00 2.00 2.00 1.00 1.00 1.00 1.00 1.00
16 1.00 1 1 1 2.00 1.00 1.00 1.00 1.00 1.00 2.00 2.00 1.00
17 1.00 2 2 2 1.00 1.00 5.00 5.00 2.00 2.00 2.00 2.00 2.00
18 1.00 2 2 2 1.00 1.00 1.00 1.00 2.00 1.00 1.00 1.00 1.00

62
Appendix xii Post Survey Data Treatment 1 Video
Q1 Q2 Q3 Q4 Q5 Q6 Q7 Q8
No. Drive After1
Read WD1
Send WD1
Initiate WD1
Consider ReadSafeWD1
Consider SendSafeWD1
Compare ReadCall1
Compare SendCall1
1 1.00 2 2 2 1.00 1.00 1.00 1.00
2 1.00 2 2 2 1.00 1.00 5.00 5.00
3 1.00 1 1 2 1.00 1.00 5.00 5.00
4 1.00 1 1 2 2.00 2.00 1.00 1.00
5 1.00 2 2 2 2.00 2.00 2.00 2.00
6 2.00 2.00 1.00 2.00 2.00
7 1.00 2 2 2 1.00 1.00 1.00 1.00
8 1.00 1 1 1 2.00 2.00 1.00 1.00
9 1.00 1 1 1 2.00 2.00 2.00 1.00
10 2.00 1.00 1.00 1.00 1.00
11 1.00 1 2 2 2.00 1.00 1.00 1.00
12 1.00 1 2 2 2.00 1.00 2.00 1.00
13 1.00 2 2 2 1.00 1.00 1.00 1.00
14 2.00 3.00 2.00 2.00 2.00
15 1.00 1 1 1 3.00 2.00 2.00 1.00
16 1.00 2 2 2 1.00 1.00 5.00 5.00
17 1.00 2 2 2 1.00 1.00 2.00 1.00
18 1.00 1 1 1 1.00 1.00 1.00 1.00
19 2.00 1.00 1.00 1.00 1.00
20 1.00 2 2 2 1.00 1.00 1.00 1.00
21 1.00 1 1 2 4.00 3.00 2.00 1.00
22 1.00 1 1 1 2.00 2.00 1.00 1.00

63
Appendix xiii Post Survey Data Treatment 2 Lecture
Q1 Q2 Q3 Q4 Q5 Q6 Q7 Q8
No. DriveAfter1
ReadWD1
SendWD1
InitiateWD1
Consider ReadSafeWD1
ConsiderSendSafeWD1
Compare ReadCall1
Compare SendCall1
1 1.00 1 2 2 2.00 2.00 3.00 1.00
2 2.00 1.00 2.00 1.00 1.00
3 2.00 2.00 2.00 1.00 1.00
4 2.00 1.00 1.00 1.00 1.00
5 2.00 1.00 1.00 1.00 1.00
6 1.00 2 2 2 1.00 1.00 1.00 1.00
7 2.00 1.00 1.00 1.00 2.00
8 2.00 1.00 1.00 5.00 5.00
9 2.00 1.00 1.00 1.00 1.00
10 2.00 2.00 1.00 1.00 1.00
11 2.00 1.00 1.00 3.00 3.00
12 2.00 1.00 1.00 1.00 1.00
13 1.00 1 1 1 2.00 2.00 2.00 3.00
14 1.00 1 1 1 2.00 2.00 2.00 2.00
15 2.00 1.00 1.00 2.00 1.00
16 2.00 1.00 1.00 1.00 2.00
17 2.00 1.00 1.00 1.00 1.00
18 2.00 1.00 1.00 1.00 1.00
19 2.00 1.00 1.00 1.00 1.00
20 2.00 1.00 1.00 1.00 1.00
21 1.00 1 2 1 1.00 1.00 1.00 1.00
22 2.00 1.00 1.00 2.00 1.00
23 2.00 1.00 1.00 1.00 1.00
24 2.00 2.00 2.00 1.00 1.00
25 2.00 1.00 1.00 1.00 1.00
26 2.00 1.00 1.00 1.00 1.00
27 2.00 2.00 5.00 4.00 5.00
28 1.00 2 2 2 1.00 1.00 2.00 2.00
29 2.00 1.00 2.00 1.00 3.00
30 2.00 2.00 2.00 1.00 1.00
31 1.00 1 2 2 2.00 1.00 3.00 3.00
32 1.00 2 2 1 2.00 2.00 1.00 1.00

64
Appendix xiv Code Book Pre Survey
Q1 Q2 Q3 Q4 Q5 Q6 Q7
Gender Race Age_grp GPA SAT ACT State
Choice Code Choice Code Choice Code Value Value Value Value
Female 1 African-American 1 Less_Than_17 1
Male 2 White 2 17 2
Asian 3 18 3
Other 4 19 4
20 5
More_Than_20 6
Q8 Q9 Q10 Q11 Q12
DriveYesNo PercentageFeeway SelfSafety FollowSpeed FollowRules
Choice Code Choice Code Choice Code Choice Code Choice Code
Yes 1 Less_than_25% 1 Yes 1 Yes 1 Yes 1
No 2 26-50% 2 No 2 No 2 No 2
51-75% 3
more_than_75% 4

65
Q13 Q14 Q15 Q16 Q17
DrivingMiles OwnCell UnlimitedMess UseTextMess NoTextSend
Choice Code Choice Code Choice Code Choice Code Choice Code
Less_than_30 1 Yes 1 Yes 1 Yes 1 less_than_25 1
31-60 2 No 2 No 2 No 2 26-50 2
60-90 3 51-75 3
over-90 4 76-100 4
over_100 5
Q18 Q19 Q20 Q21 Q22
NoTextRec ReadWD FreqRD ReplyWD FreqRep
Choice Code Choice Code Choice Code Choice Code Choice Code
less_than_25 1 Yes 1 Always/ Very Often 1 Yes 1
Always/ Very Often 1
26-50 2 No 2 Often 2 No 2 Often 2
51-75 3 Sometimes 3 Sometimes 3
76-100 4 Rarely 4 Rarely 4
Seldom/ Never 5 Seldom/ Never 5
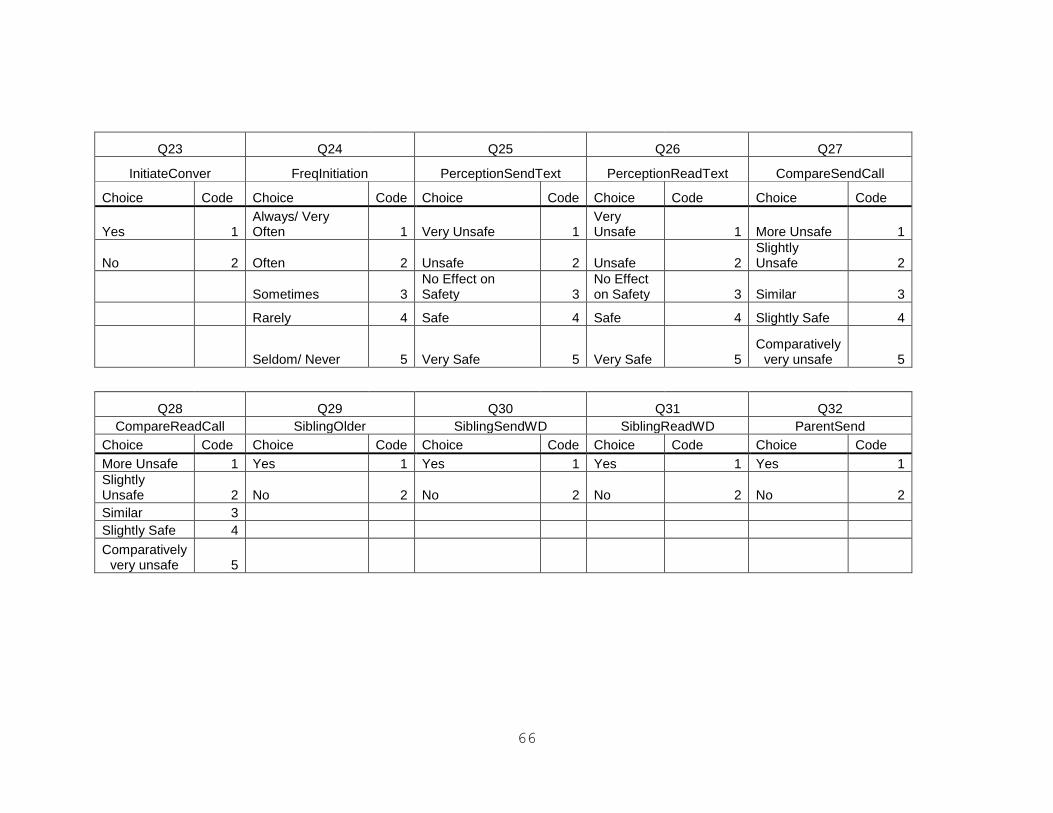
66
Q23 Q24 Q25 Q26 Q27
InitiateConver FreqInitiation PerceptionSendText PerceptionReadText CompareSendCall
Choice Code Choice Code Choice Code Choice Code Choice Code
Yes 1 Always/ Very Often 1 Very Unsafe 1
Very Unsafe 1 More Unsafe 1
No 2 Often 2 Unsafe 2 Unsafe 2 Slightly Unsafe 2
Sometimes 3 No Effect on Safety 3
No Effect on Safety 3 Similar 3
Rarely 4 Safe 4 Safe 4 Slightly Safe 4
Seldom/ Never 5 Very Safe 5 Very Safe 5 Comparatively
very unsafe 5
Q28 Q29 Q30 Q31 Q32
CompareReadCall SiblingOlder SiblingSendWD SiblingReadWD ParentSend
Choice Code Choice Code Choice Code Choice Code Choice Code
More Unsafe 1 Yes 1 Yes 1 Yes 1 Yes 1
Slightly Unsafe 2 No 2 No 2 No 2 No 2
Similar 3
Slightly Safe 4
Comparatively very unsafe 5

67
Q33 Q34 Q35 Q36 Q37
ParentRead FriendsTextSend FriendsTextRead RepeatSelfSafety PerceptionSafetyOthers
Choice Code Choice Code Choice Code Choice Code Choice Code
Yes 1 Yes 1 Yes 1 Yes 1 Yes 1
No 2 No 2 No 2 No 2 No 2
Q38 Q39 Q40 Q41 Q42
CloseHurtCarAcc CloseHurtCarAccTWD ExposePubSerAnnTWD ExposeVid ExposeTalk
Choice Code Choice Code Choice Code Choice Code Choice Code
Yes 1 Yes 1 Yes 1 Yes 1 Yes 1
No 2 No 2 No 2 No 2 No 2
Q43 Q44 Q45 Q46 Q47
ExposeRead Tobacco Alcohol PhysicalFight EnoughFriends
Choice Code Choice Code Choice Code Choice Code Choice Code
Yes 1 Yes 1 Yes 1 Yes 1 Yes 1
No 2 No 2 No 2 No 2 No 2
Q48 Q49 Q50
FriendsEasily Stress Anger
Choice Code Choice Code Choice Code
Yes 1 Yes 1 Yes 1
No 2 No 2 No 2

68
Appendix xv Code Book Post Survey
Control Group Q1 Q2 Q3 Q4 Q5
DriveAfter1 ReadWD1 SendWD1 InitiateWD1 ExposePubSerAnnTWD1
Choice Code Choice Code Choice Code Choice Code Choice Code
Yes 1 Yes 1 Yes 1 Yes 1 Yes 1
No 2 No 2 No 2 No 2 No 2
Q6 Q7 Q8 Q9 Q10
ExposeTVTWD1 ExposeVidTWD1 ExposeLecTWD1 ExposeArtTWD1 Consider ReadSafeWD1
Choice Code Choice Code Choice Code Choice Code Choice Code
Yes 1 Yes 1 Yes 1 Yes 1 Very Unsafe 1
No 2 No 2 No 2 No 2 Unsafe 2
No Effect on
Safety 3
Safe 4
Very Safe 5
Q11 Q12 Q13
ConsiderSendSafeWD1 Compare ReadCall1 Compare SendCall1
Choice Code Choice Code Choice Code
Very Unsafe 1 More Unsafe 1 More Unsafe 1
Unsafe 2 Slightly Unsafe 2 Slightly Unsafe 2
No Effect on
Safety 3 Similar 3 Similar 3
Safe 4 Slightly Safe 4 Slightly Safe 4
Very Safe 5
Comparatively
very unsafe 5
Comparatively
very unsafe 5
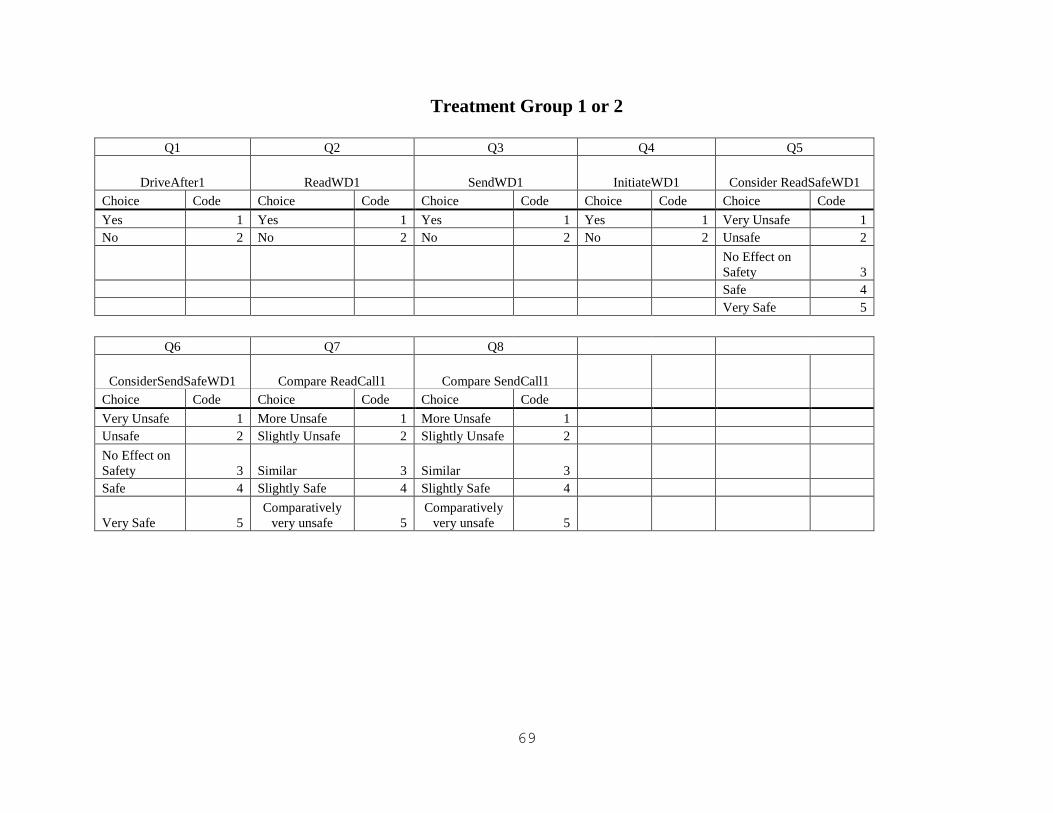
69
Treatment Group 1 or 2
Q1 Q2 Q3 Q4 Q5
DriveAfter1 ReadWD1 SendWD1 InitiateWD1 Consider ReadSafeWD1
Choice Code Choice Code Choice Code Choice Code Choice Code
Yes 1 Yes 1 Yes 1 Yes 1 Very Unsafe 1
No 2 No 2 No 2 No 2 Unsafe 2
No Effect on
Safety 3
Safe 4
Very Safe 5
Q6 Q7 Q8
ConsiderSendSafeWD1 Compare ReadCall1 Compare SendCall1
Choice Code Choice Code Choice Code
Very Unsafe 1 More Unsafe 1 More Unsafe 1
Unsafe 2 Slightly Unsafe 2 Slightly Unsafe 2
No Effect on
Safety 3 Similar 3 Similar 3
Safe 4 Slightly Safe 4 Slightly Safe 4
Very Safe 5
Comparatively
very unsafe 5
Comparatively
very unsafe 5