Embed Size (px)
Citation preview
Fisheries Western Australia
Fisheries Research DivisionWA Marine Research Laboratories
PO Box 20 NORTH BEACHWestern Australia 6020
Final Report, FRDC Project 95/037:The biology and stock assessment of the
tropical sardine, Sardinella lemuru, off themid-west coast of Western Australia
FISHERIES RESEARCH REPORT NO. 119, 2000
Daniel J. Gaughan and Ronald W.D. Mitchell
Fisheries Research ReportTitles in the fisheries research series contain technical and scientificinformation that represents an important contribution to existingknowledge, but which may not be suitable for publication in nationalor international scientific journals.
Fisheries Research Reports may be cited as full publications. Thecorrect citation appears with the abstract for each report.
Numbers 1-80 in this series were issued as Reports. Numbers 81-82were issued as Fisheries Reports, and from number 83 the serieshas been issued under the current title.
EnquiriesFisheries Western Australia3rd floor SGIO Atrium168-170 St George’s TerracePERTH WA 6000Telephone (08) 9482 7333Facsimile (08) 9482 7389Website: http://www.wa.gov.au/westfish/res
Published byFisheries Western AustraliaPerth, Western AustraliaMay 2000ISSN: 1035 - 4549ISBN: 0 7309 8436 2
An electronic copy of this report will be available at the abovewebsite where parts may be shown in colour where this isthought to improve clarity.
Fisheries research in Western AustraliaThe Fisheries Research Division of Fisheries Western Australia isbased at the Western Australian Marine Research Laboratories, P.O.Box 20, North Beach (Perth), Western Australia, 6020. The MarineResearch Laboratories serve as the centre for fisheries research inthe State of Western Australia.
Research programs conducted by the Fisheries Research Divisionand laboratories investigate basic fish biology, stock identity andlevels, population dynamics, environmental factors, and other factorsrelated to commercial fisheries, recreational fisheries andaquaculture. The Fisheries Research Division also maintains the Statedata base of catch and effort fisheries statistics.
The primary function of the Fisheries Research Division is to providescientific advice to government in the formulation of managementpolicies for developing and sustaining Western Australian fisheries.
Contents
Page
Objectives .............................................................................................. 1
Non-technical Summary ..................................................................... 1
1.0 Introduction .......................................................................................... 31.1 Background ..................................................................................... 31.2 Need ............................................................................................... 6
2.0 Methods ................................................................................................. 62.1 Ascertain the correct taxonomic status of this species ........................ 62.2 Describe the biology of Sardinella lemuru, especially their
reproductive cycles (including spawning biology and fecundity); feeding ecology; age and growth..................................................... 72.2.1 Sample collection ................................................................ 72.2.2 Sample treatment ................................................................. 82.2.3 Reproduction ...................................................................... 82.2.4 Diet ..................................................................................... 102.2.4 Age and growth ................................................................... 12
2.3 Stock delineation ............................................................................. 152.4 Monitor the dynamics, locations and catch rates of the fleet............... 152.5 Conduct ichthyoplankton surveys to provide data for the
daily egg production method of estimating spawning biomass ........ 162.5.1 Plankton sampling ............................................................... 162.5.2 The DEPM survey to estimate spawning biomass ................. 17
2.6 The environment in the region of the fishery .................................... 17
3.0 Taxonomy .............................................................................................. 18
4.0 Reproduction ........................................................................................ 194.1 Size at sexual maturity ..................................................................... 194.2 Gonadosomatic indices .................................................................... 194.3 Monthly changes in gonad stage ...................................................... 224.4 Sex ratio .......................................................................................... 234.5 Histology ........................................................................................ 234.6 Oocyte size frequency distributions from the histological sections ..... 254.7 Oocyte size frequency distributions for whole ovaries ....................... 274.8 Fecundity ........................................................................................ 284.9 Discussion ....................................................................................... 28
5.0 Diets ....................................................................................................... 295.1 Weight of stomach contents ............................................................. 295.2 Food groups .................................................................................... 305.3 Phytoplankton ................................................................................. 305.4 Zooplankton ................................................................................... 325.5 Discussion ....................................................................................... 32
i
ii
6.0 Aging ...................................................................................................... 346.1 Sampling for juveniles ...................................................................... 346.2 Scales .............................................................................................. 346.3 Whole otoliths - translucent zones.................................................... 37
6.3.1 Marginal increments (MI) .................................................... 396.3.2 Opaque edges (OE) ............................................................. 416.3.3 Age determination using translucent zones on whole
otoliths .............................................................................. 41
6.4 Sectioned otoliths ............................................................................ 466.5 Otolith micro-increments ................................................................ 526.6 Otolith weight ................................................................................. 556.7 Length frequency analysis ................................................................ 626.8 Discussion of age and growth results with comparisons to
S. lemuru from Bali Strait ................................................................ 676.8.1 Age determination and growth parameters ........................... 676.8.2 Mortality ............................................................................. 696.8.3 Recruitment ........................................................................ 69
6.9 Conclusions ..................................................................................... 70
7.0 Stock delineation .................................................................................. 70
8.0 Monitor the dynamics, locations and catch rates of the fleet ......... 758.1 Vessel dimensions ............................................................................ 75
8.1.1 24 m vessel .......................................................................... 758.1.2 19 m vessel .......................................................................... 75
8.2 Catch and effort ............................................................................... 758.2.1 19 m vessel .......................................................................... 758.2.2 24 m vessel .......................................................................... 77
8.3 Other estimates of catch rate from 1995-1997 .................................. 808.3.1 Fuel used ............................................................................. 808.3.2 Search times ........................................................................ 838.3.3 Number of schools observed ................................................ 85
8.4 Commercial fishing area................................................................... 868.5 Incidence of zero catches.................................................................. 888.6 Days not fished ................................................................................ 898.7 Discussion ....................................................................................... 91
8.7.1 Catch rates .......................................................................... 918.7.2 Development of the Geraldton purse seine fishery ................ 92
9.0 Conduct ichthyoplankton surveys to provide data for the daily egg production method from which estimates of the spawning biomass will be calculated ............................................... 939.1 Plankton sampling ........................................................................... 939.2 Culturing of S. lemuru eggs .............................................................. 989.3 Plankton sampling for the February 1997 DEPM survey ................... 999.4 Discussion ....................................................................................... 100
9.4.1 Application of the daily egg production method to estimate spawning biomass ................................................. 100
9.4.2 Spatial extent of spawning .................................................... 101
10.0 Environmental conditions - influence on the biology of S. lemuru and the developmental fishery ............................................ 10210.1 Wind ............................................................................................. 10210.2 Temperature .................................................................................. 10810.3 Rainfall .......................................................................................... 10810.4 River run-off and nutrient inputs .................................................... 10810.5 Sea conditions ................................................................................ 10810.6 Tides ............................................................................................. 10910.7 Upwelling ..................................................................................... 10910.8 Leeuwin Current ........................................................................... 10910.9 Severe storms and cyclones ............................................................ 11210.10 Influence of environmental factors on spawning strategy and
recruitment .................................................................................. 11210.10.1 Hypothesised effects ......................................................... 11210.10.2 Wind ................................................................................ 11310.10.3 Leeuwin Current .............................................................. 114
10.10.3.1 Potential effect on primary productivity ........... 11410.10.3.2 Transport of eggs and larvae ............................. 115
11.0 Project summary ................................................................................... 11611.1 Benefits ........................................................................................... 11611.2 Further developments ...................................................................... 11611.3 Conclusions ..................................................................................... 11611.4 Recommendations .......................................................................... 118
12.0 Acknowledgments ................................................................................. 118
13.0 References .............................................................................................. 119
14.0 Appendices ............................................................................................ 123Appendix 1 - Sampling for juvenile Sardinella lemuru ................................. 123Appendix 2 - Experimental mid-water pelagic trawling for
Sardinella lemuru ............................................................. 129Appendix 3 - Intellectual property and valuable information ...................... 136Appendix 4 - Staff ..................................................................................... 136
iii
Fish. Res. Rep. Fish. West. Aust.2000, 119, 1-136
1
Final Report, FRDC Project 95/037:The biology and stock assessment of thetropical sardine, Sardinella lemuru, off themid-west coast of Western Australia
Daniel J. Gaughan & Ronald W.D. Mitchell
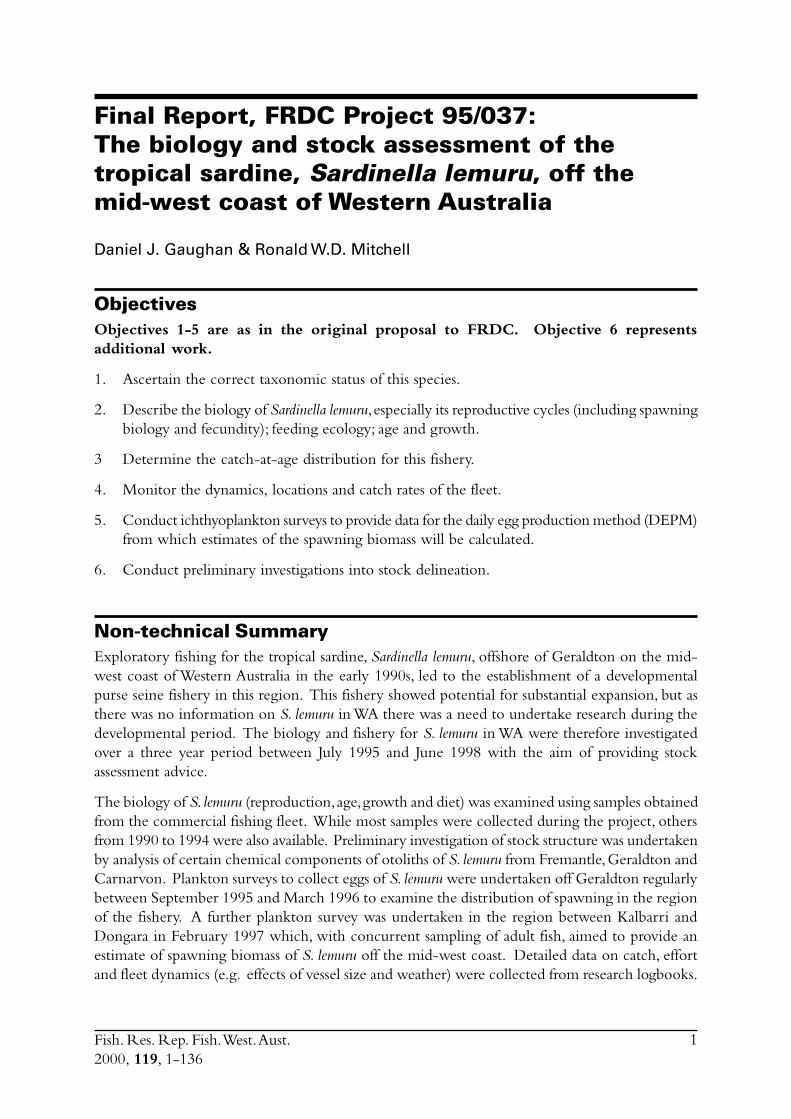
ObjectivesObjectives 1-5 are as in the original proposal to FRDC. Objective 6 representsadditional work.
1. Ascertain the correct taxonomic status of this species.
2. Describe the biology of Sardinella lemuru, especially its reproductive cycles (including spawningbiology and fecundity); feeding ecology; age and growth.
3 Determine the catch-at-age distribution for this fishery.
4. Monitor the dynamics, locations and catch rates of the fleet.
5. Conduct ichthyoplankton surveys to provide data for the daily egg production method (DEPM)from which estimates of the spawning biomass will be calculated.
6. Conduct preliminary investigations into stock delineation.
Non-technical SummaryExploratory fishing for the tropical sardine, Sardinella lemuru, offshore of Geraldton on the mid-west coast of Western Australia in the early 1990s, led to the establishment of a developmentalpurse seine fishery in this region. This fishery showed potential for substantial expansion, but asthere was no information on S. lemuru in WA there was a need to undertake research during thedevelopmental period. The biology and fishery for S. lemuru in WA were therefore investigatedover a three year period between July 1995 and June 1998 with the aim of providing stockassessment advice.
The biology of S. lemuru (reproduction, age, growth and diet) was examined using samples obtainedfrom the commercial fishing fleet. While most samples were collected during the project, othersfrom 1990 to 1994 were also available. Preliminary investigation of stock structure was undertakenby analysis of certain chemical components of otoliths of S. lemuru from Fremantle, Geraldton andCarnarvon. Plankton surveys to collect eggs of S. lemuru were undertaken off Geraldton regularlybetween September 1995 and March 1996 to examine the distribution of spawning in the regionof the fishery. A further plankton survey was undertaken in the region between Kalbarri andDongara in February 1997 which, with concurrent sampling of adult fish, aimed to provide anestimate of spawning biomass of S. lemuru off the mid-west coast. Detailed data on catch, effortand fleet dynamics (e.g. effects of vessel size and weather) were collected from research logbooks.
Fish. Res. Rep. Fish. West. Aust.2000, 119, 1-136
2
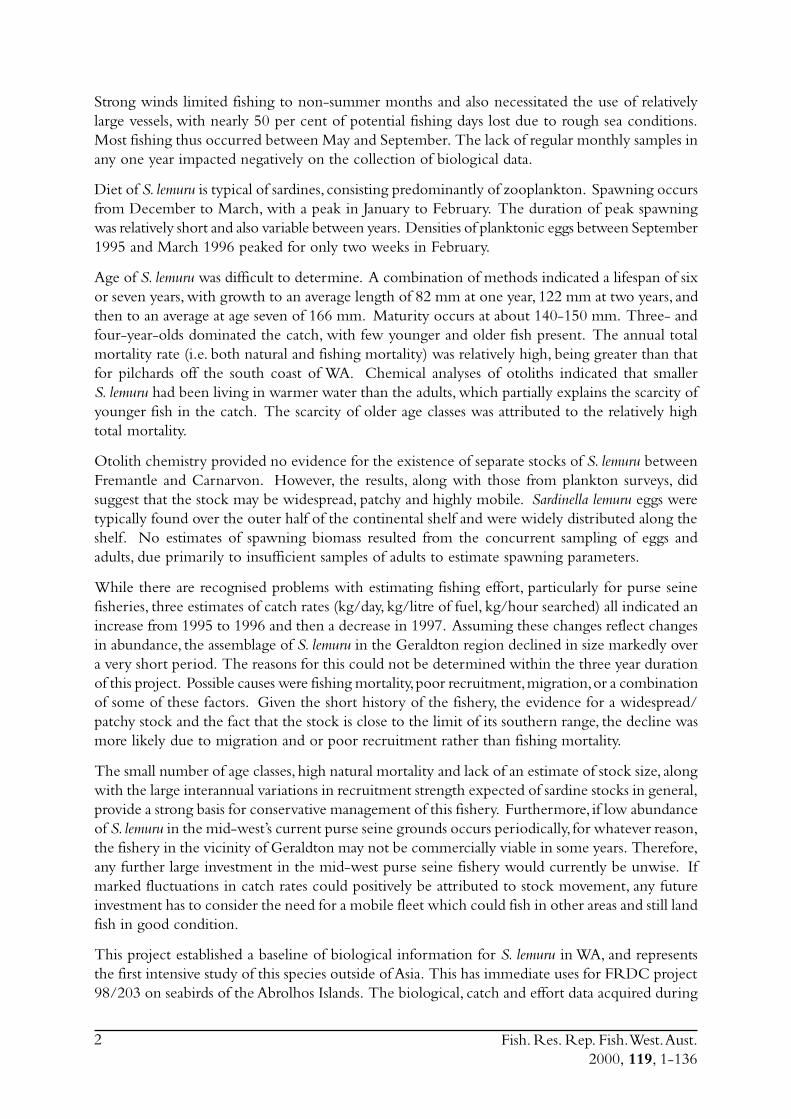
Strong winds limited fishing to non-summer months and also necessitated the use of relativelylarge vessels, with nearly 50 per cent of potential fishing days lost due to rough sea conditions.Most fishing thus occurred between May and September. The lack of regular monthly samples inany one year impacted negatively on the collection of biological data.
Diet of S. lemuru is typical of sardines, consisting predominantly of zooplankton. Spawning occursfrom December to March, with a peak in January to February. The duration of peak spawningwas relatively short and also variable between years. Densities of planktonic eggs between September1995 and March 1996 peaked for only two weeks in February.
Age of S. lemuru was difficult to determine. A combination of methods indicated a lifespan of sixor seven years, with growth to an average length of 82 mm at one year, 122 mm at two years, andthen to an average at age seven of 166 mm. Maturity occurs at about 140-150 mm. Three- andfour-year-olds dominated the catch, with few younger and older fish present. The annual totalmortality rate (i.e. both natural and fishing mortality) was relatively high, being greater than thatfor pilchards off the south coast of WA. Chemical analyses of otoliths indicated that smallerS. lemuru had been living in warmer water than the adults, which partially explains the scarcity ofyounger fish in the catch. The scarcity of older age classes was attributed to the relatively hightotal mortality.
Otolith chemistry provided no evidence for the existence of separate stocks of S. lemuru betweenFremantle and Carnarvon. However, the results, along with those from plankton surveys, didsuggest that the stock may be widespread, patchy and highly mobile. Sardinella lemuru eggs weretypically found over the outer half of the continental shelf and were widely distributed along theshelf. No estimates of spawning biomass resulted from the concurrent sampling of eggs andadults, due primarily to insufficient samples of adults to estimate spawning parameters.
While there are recognised problems with estimating fishing effort, particularly for purse seinefisheries, three estimates of catch rates (kg/day, kg/litre of fuel, kg/hour searched) all indicated anincrease from 1995 to 1996 and then a decrease in 1997. Assuming these changes reflect changesin abundance, the assemblage of S. lemuru in the Geraldton region declined in size markedly overa very short period. The reasons for this could not be determined within the three year durationof this project. Possible causes were fishing mortality, poor recruitment, migration, or a combinationof some of these factors. Given the short history of the fishery, the evidence for a widespread/patchy stock and the fact that the stock is close to the limit of its southern range, the decline wasmore likely due to migration and or poor recruitment rather than fishing mortality.
The small number of age classes, high natural mortality and lack of an estimate of stock size, alongwith the large interannual variations in recruitment strength expected of sardine stocks in general,provide a strong basis for conservative management of this fishery. Furthermore, if low abundanceof S. lemuru in the mid-west’s current purse seine grounds occurs periodically, for whatever reason,the fishery in the vicinity of Geraldton may not be commercially viable in some years. Therefore,any further large investment in the mid-west purse seine fishery would currently be unwise. Ifmarked fluctuations in catch rates could positively be attributed to stock movement, any futureinvestment has to consider the need for a mobile fleet which could fish in other areas and still landfish in good condition.
This project established a baseline of biological information for S. lemuru in WA, and representsthe first intensive study of this species outside of Asia. This has immediate uses for FRDC project98/203 on seabirds of the Abrolhos Islands. The biological, catch and effort data acquired during
Fish. Res. Rep. Fish. West. Aust.2000, 119, 1-136
3
the project provide a basis for management of the fishery. The research indicates that the originalconcept that the fishery could expand greatly was over-optimistic and expansion of the Geraldton-based fleet is therefore unlikely to be economically realistic. Furthermore, the need for specialisedpurse seine vessels in order to viably operate in the mid-west coast sardine fishery has clearly beenshown.
Monitoring of catches should continue so that a longer time series of biological information canbe gathered. In particular, ongoing analysis of relative age composition should provide a costeffective method of assessing the status of the stock. Likewise, vessels will be encouraged tocontinue filling in logbooks so that deviations in catch rates or spatial extent of the fishery can bedetected. This level of monitoring should meet future needs of management.
1.0 Introduction
1.1 BackgroundInterest in the usage and capture of baitfish stocks within Australia has increased substantially sincethe mid 1980s. The development of the market for pet food in the mid 1980s (SCP, 1988)combined with the more recent demand to feed caged southern bluefin tuna at Port Lincoln,South Australia, have expanded the markets for these species from their traditional base of supplyingbait to recreational anglers and commercial pot and line fishermen. Consequently, a number ofnew baitfish fisheries have developed (e.g. Bremer Bay, Esperance, Port Lincoln) with considerableexpansion occurring in fisheries that were already in existence (e.g. Albany, Fremantle). The totalproduction of clupeids in Australia has, therefore, increased from less than 2,000 tonnes in 1980 tobe greater than 10,000 tonnes by 1990 (Fletcher, 1991) with the total catch for 1994 exceeding15,000 tonnes (Fletcher, 1994, Jones pers comm, MacDonald pers comm).
Until recently, nearly all fishing activities occurred in temperate regions with the species compositionrestricted, almost exclusively, to the pilchard Sardinops sagax. In Victoria, occasional catches of theanchovy, Engraulis australis have been made off Lakes Entrance and there is a relatively even mixbetween pilchards and anchovies in the purse seine catch of Port Philip Bay (Hobday, 1988;Fletcher, 1991). Anchovies are, however, largely absent from catches by the purse seine fleet in WAwhere the average annual production of this species is less than 50 tonnes.
The tropical sardine Sardinella lemuru has constituted a variable component of the purse seinecatch in the Fremantle area of WA. The catches have fluctuated greatly, with over 1,000 tonnestaken in each of 1984 and 1985 but less than 20 tonnes was caught in 1993 (Fletcher, 1994). Themarket for S. lemuru has traditionally been as bait for the western rock lobster fishery, receiving apremium price (70-90 c/kg), in comparison with 28-35 c/kg that pilchards have received as rocklobster bait. This difference in price results from S. lemuru having a tougher body constructionwith scales that do not fall off (hence the local name, scaly mackerel).
Sardinella lemuru is a tropical species with Fremantle at the southern limit of its range (Whitehead1985). The centre of distribution lies further north within the Indo-Chinese region where,apparently, annual catches exceed 100,000 tonnes (Whitehead, 1985, but see later). Within Australia,S. lemuru is distributed northwards from Fremantle up to the Pilbara region (Whitehead, 1985)but no information is available on the potential catches in this region. In 1989, a number ofdevelopment purse seine fishing zones were instituted within WA to encourage a rational expansionof fishing outside of the established areas of Fremantle and Albany (Grill, 1987). The development
Fish. Res. Rep. Fish. West. Aust.2000, 119, 1-136
4
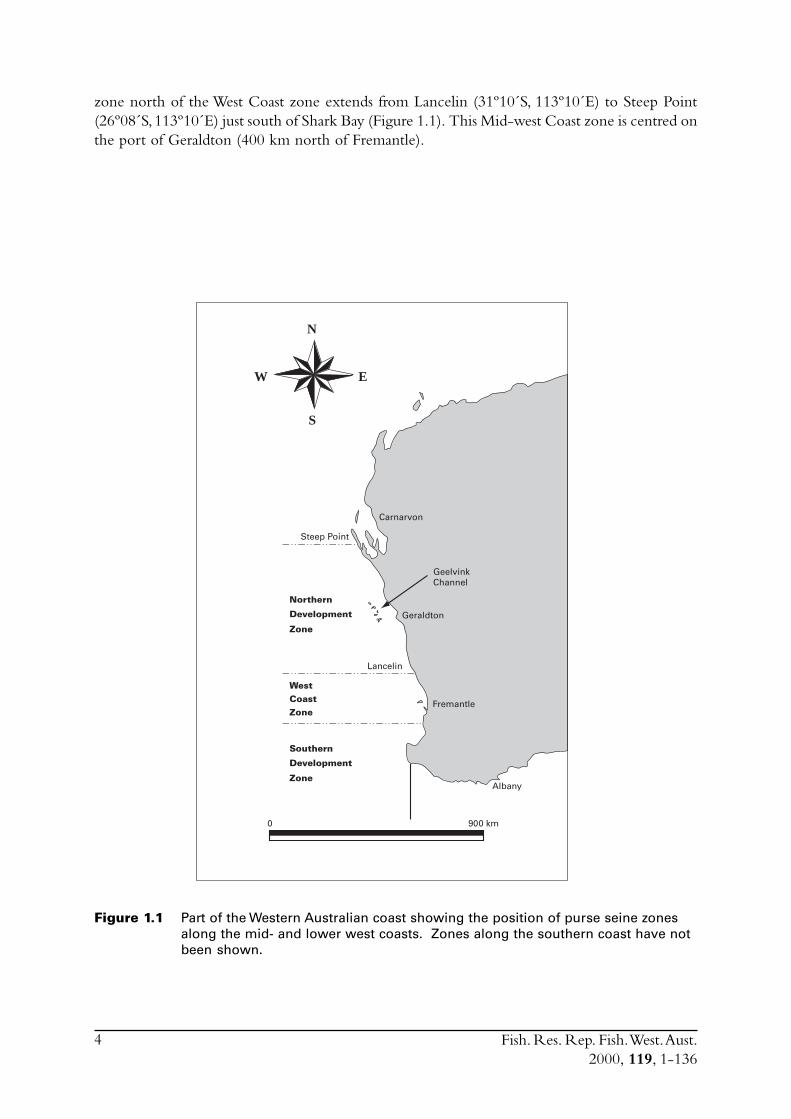
zone north of the West Coast zone extends from Lancelin (31º10´S, 113º10´E) to Steep Point(26º08´S, 113º10´E) just south of Shark Bay (Figure 1.1). This Mid-west Coast zone is centred onthe port of Geraldton (400 km north of Fremantle).
N
E
S
W
Carnarvon
GeelvinkChannel
Steep Point
Lancelin
Geraldton
Fremantle
Zone
Northern
Development
Zone
WestCoast
Zone
Southern
Development
Albany
0 900 km
Figure 1.1 Part of the Western Australian coast showing the position of purse seine zonesalong the mid- and lower west coasts. Zones along the southern coast have notbeen shown.
Fish. Res. Rep. Fish. West. Aust.2000, 119, 1-136
5
The first attempt at purse seine fishing in this zone began at Geraldton in 1989, but whilstconfirming that large numbers of S. lemuru were present in this region, the venture failed becauseof a lack of available onshore processing facilities. Subsequent ventures have also been restrictedwith the result that annual catches for the 1990-1992 period were each less than 200 tonnes. Thissmall production was despite the vessels being comparatively large (20-30 m in length) with holdcapacities between 20 and 80 tonnes, which is significantly larger than boats in the remainder ofthe WA purse seine fleet. There are currently no restrictions on vessel size within this Mid-westCoast zone because the area of fishing is about two hours steaming from port and the prevailingweather conditions in the Geraldton region are poor with consistently strong winds. Consequently,purse seine fishing in small boats would be dangerous. Furthermore, the relatively high water andair temperatures requires the fish rapidly be put into an ice slurry to maintain quality. Thus, allvessels which have fished in this region have used fish pumps and ice/brine tanks to handle thecatch.
A major impediment to the development of this fishery has been the lack of blast-freezer spaceavailable at Geraldton. Whilst there were a large number of freezers in this region, these werealmost constantly in use by either the rock lobster or scallop fisheries which, given the pricedifferential, have first priority. As a consequence, two dedicated blast freezers to process S. lemuruwere constructed during 1993 and 1994, following which, production by the fishery increasedrapidly. The catch in 1993 was 600 tonnes with approximately 2,000 tonnes caught during 1994.In both these years, fishing did not occur in all months, with only one boat having fished in 1993and at no time were all three licences being fished. The potential for effort to increase was,therefore, considered substantial. This combined with the experience gained by skippers during1994 was considered likely to result in further increases in catch if there are no limits imposed.
There are additional considerations that need to be addressed, particularly if there is any possibilityof the stock becoming heavily exploited. The majority of fishing occurs between the coast andthe Abrolhos Islands. These islands are the breeding grounds for a large number of bird species(Hatcher et al., 1988) and this area is also a marine nature reserve (Anon, 1993). Concerns havealready been expressed that any exploitation of the baitfish in this region could have a deleteriousaffect on the breeding success of the birds. This issue is being addressed currently in FRDCproject 98/203. Similar fears have also been expressed in relation to the impact on recreationallyimportant fish species.
Given these problems, management arrangements for this fishery needed to be introduced asquickly as possible. Consequently there was an urgent requirement to determine the stock sizeand population dynamics of S. lemuru so that the appropriate level of exploitation couldbe determined. Interim management, in the form of a total allowable catch (TAC) set at2,700 tonnes was introduced in 1995. Given the size of capital investment required for thisfishery, the TAC was set with the aim of achieving a balance between conservationist fears andallowing sufficient room for the fishery to have a chance to become established. Catches in theearly part of the fishery suggested that there was a potential for annual catches to expand tobetween 6,000 and 7,000 tonnes, equivalent to a production value of at least $4 million annually.
There is no published information available on the biology of S. lemuru within Australia except fordata on the presence of S. lemuru larvae within the Swan River (Gaughan et al., 1990). Somepreliminary information on the reproductive cycle was obtained from opportunistic sampling,which suggested that the spawning season may be relatively short, being restricted to the January-March period.
Fish. Res. Rep. Fish. West. Aust.2000, 119, 1-136
6
Neither is there any published or unpublished information on the potential stock size of S. lemuruwithin Western Australian waters, nor on the level of separation between ‘stocks’ along the coast.Moreover, the relationship between S. lemuru in Australia and elsewhere in the world is alsounclear. Whilst Whitehead (1985) classed this species as the main sardine species caught in Indonesia,many publications from this region identify their major sardine species as Sardinella longiceps. Thus,there has been uncertainty regarding the taxonomic status of this species.
Given the lack of data available and the urgency with which information on stock size is required,it was thought that the most efficient method of stock assessment for this species would be toapply the methods developed for the south coast pilchard stock (e.g. Fletcher, 1991, 1994, 1995;Fletcher et al., 1992, 1994; Fletcher & Tregonning, 1992). This involves sampling the catch fromthe fleet to provide the basic biological parameters for adults of reproduction, feeding and growth.From these, the population dynamics of the stock, including the overall level of mortality, can becalculated. In addition, intensive and extensive ichthyoplankton sampling completed during thepeak spawning period can be used to ascertain the aerial extent of the spawning stock, the intensityof spawning within this area and, combined with simultaneously measured adult reproductiveparameters, allow estimates of stock abundance to be calculated using the daily egg productiontechnique (Lasker, 1985).
1.2 NeedThe Western Australian Purse Seine Management Advisory Committee has clearly identified thatresearch on this stock should have the highest priority. This is a new fishery for a resource aboutwhich no data are available either locally, nationally or, possibly, internationally. The catch of thefishery, whilst having already increased substantially during the two years prior to the start of theproject, was considered to have a high potential for further increases. Furthermore, since thisspecies has been identified as a potentially important prey of nesting seabirds at the nearby Abrolhosislands, substantial declines in abundance of these sardines could have serious consequences forthe breeding success of these unique seabird nesting colonies. It was therefore imperative thatinformation on the biology and stock size of S. lemuru was collected quickly to determine thesustainable level of harvesting.
2.0 MethodsThis part of the report follows the structure in the project proposal. Thus, the methods areseparated into five sections, most of which have been divided into subsections. Descriptions formaterials and methods for research additional to that originally planned, and also the subsequentresults and discussion, are included within the main body of this report as appropriate, or asappendices.
2.1 Ascertain the correct taxonomic status of this speciesThe morphological features of scaly mackerel were closely examined with respect to the descriptionsin Whitehead (1985) of the species Sardinella lemuru in comparison with the closely related speciesSardinella longiceps, S. aurita and Amblygaster sirm. Some specimens from the Bali Strait ‘lemuru’fishery (i.e. from Indonesia) were compared morphologically with the description in Whitehead(1985), but no genetic comparisons were made with fish from WA. Staff from the fish section ofthe WA Museum also provided assistance with the morphological comparisons.
Fish. Res. Rep. Fish. West. Aust.2000, 119, 1-136
7
2.2. Describe the biology of Sardinella lemuru, especiallytheir reproductive cycles (including spawning biologyand fecundity); feeding ecology; age and growth
2.2.1 Sample collectionSamples of S. lemuru were collected from commercial catches between January 1990 and July1997. In some of those months where samples from commercial vessels were not available duringthe project (July 1995 to June 1998) samples were taken by one of two other methods. Mid-water trawling was conducted on board RV Flinders (see Research Trawling section of report[Appendix 1]). This technique proved effective, with between two and seven samples obtainedduring all but one of the surveys conducted, with the other survey seriously hampered by strongwinds.
A gill net (mesh size of 36 mm) deployed from a vessel anchored overnight in the vicinity of thefishing grounds was also used to sample S. lemuru. A 3000 watt surface light was used to attract fishto the net. This method met with limited success, with only a single sample of S. lemuru obtained.Although the technique was good for catching sardines, with many round herring (Etrumeus teres)caught at anchorages near the Abrolhos Islands. However, S. lemuru occur infrequently near theislands. Because of frequent strong winds sampling vessels typically sheltered overnight in the leeof islands, and the single sample of S. lemuru was obtained on one of the three occasions when avessel was able to anchor in the more exposed parts of Geelvink Channel.
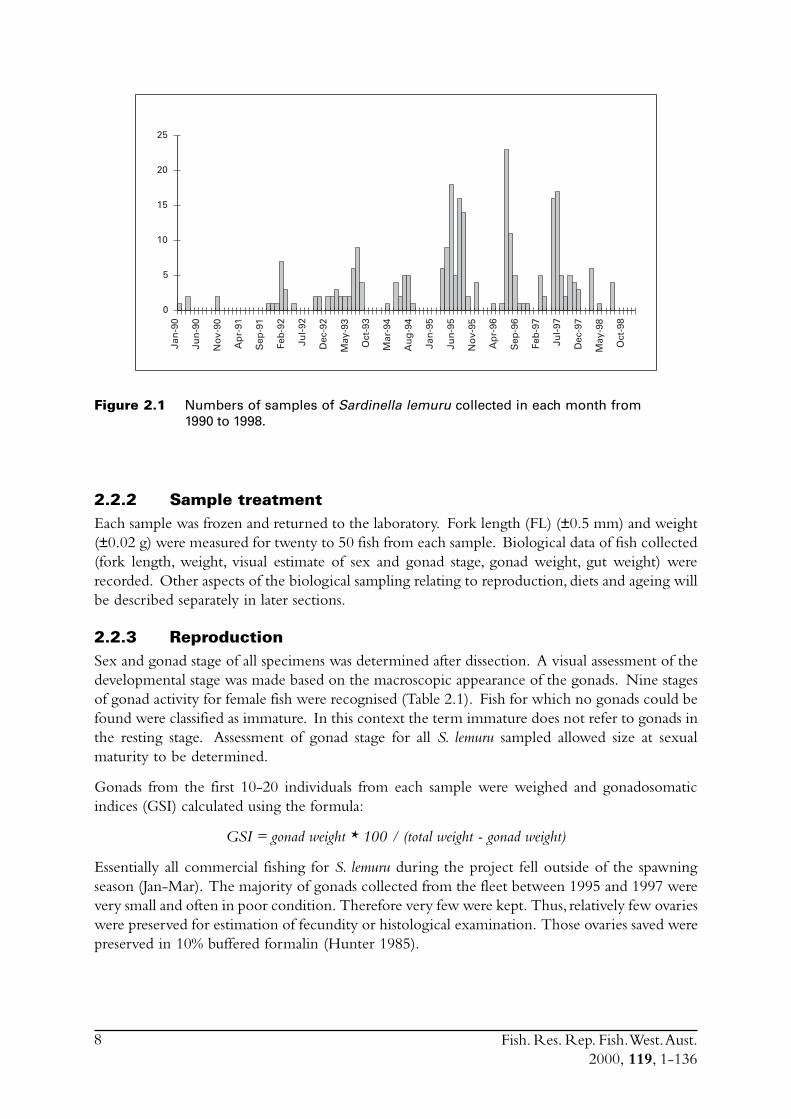
Commercial purse seines were used to capture schools or portions of schools of S. lemuru, typicallyduring the night, with total catches per night for a single vessel usually lying between five and30 tonnes. Three vessels (licences) were permitted to operate in this fishery during the project,but only two did so. Due to various reasons, samples were normally obtained by only one, and lessfrequently two, vessels on any given night. The number samples collected in each month variedfrom zero to 23 (Figure 2.1). Although samples have been obtained from virtually every monththat fishing has occurred since 1990, fishing usually took place for less than eight months of theyear, and in some cases for only three or four months of the year (Figure 2.1).
Smaller catches constituted a single shot of the net, whereas larger catches often contain fish fromup to three different shots. Samples of 25-50 fish were saved from the load of fish brought backby each vessel. An effort was made to obtain samples from each shot but this was only partlysuccessful, largely due to the need for separate shots to be sampled at sea since fish from separateshots on any one night are mixed together in the holds prior to being transported to port. Thelarge quantities of fish landed at any one time necessitated dividing the catch amongst the differentholds of a vessel so that the weight was evenly distributed for the purpose of minimising vesselinstability. Crew on the purse seine vessels were encouraged to take a sample from each shot as itwas landed, but for various reasons often failed to do so.
Fish. Res. Rep. Fish. West. Aust.2000, 119, 1-136
8
Figure 2.1 Numbers of samples of Sardinella lemuru collected in each month from1990 to 1998.
2.2.2 Sample treatmentEach sample was frozen and returned to the laboratory. Fork length (FL) (±0.5 mm) and weight(±0.02 g) were measured for twenty to 50 fish from each sample. Biological data of fish collected(fork length, weight, visual estimate of sex and gonad stage, gonad weight, gut weight) wererecorded. Other aspects of the biological sampling relating to reproduction, diets and ageing willbe described separately in later sections.
2.2.3 ReproductionSex and gonad stage of all specimens was determined after dissection. A visual assessment of thedevelopmental stage was made based on the macroscopic appearance of the gonads. Nine stagesof gonad activity for female fish were recognised (Table 2.1). Fish for which no gonads could befound were classified as immature. In this context the term immature does not refer to gonads inthe resting stage. Assessment of gonad stage for all S. lemuru sampled allowed size at sexualmaturity to be determined.
Gonads from the first 10-20 individuals from each sample were weighed and gonadosomaticindices (GSI) calculated using the formula:
GSI = gonad weight * 100 / (total weight - gonad weight)
Essentially all commercial fishing for S. lemuru during the project fell outside of the spawningseason (Jan-Mar). The majority of gonads collected from the fleet between 1995 and 1997 werevery small and often in poor condition. Therefore very few were kept. Thus, relatively few ovarieswere preserved for estimation of fecundity or histological examination. Those ovaries saved werepreserved in 10% buffered formalin (Hunter 1985).
Jan
-90
Jun
-90
No
v-90
Ap
r-91
Sep
-91
Feb
-92
Jul-
92
Dec
-92
May
-93
Oct
-93
Mar
-94
Au
g-9
4
Jan
-95
Jun
-95
No
v-95
Ap
r-96
Sep
-96
Feb
-97
Jul-
97
Dec
-97
May
-98
Oct
-98
0
5
10
15
20
25
Fish. Res. Rep. Fish. West. Aust.2000, 119, 1-136
9
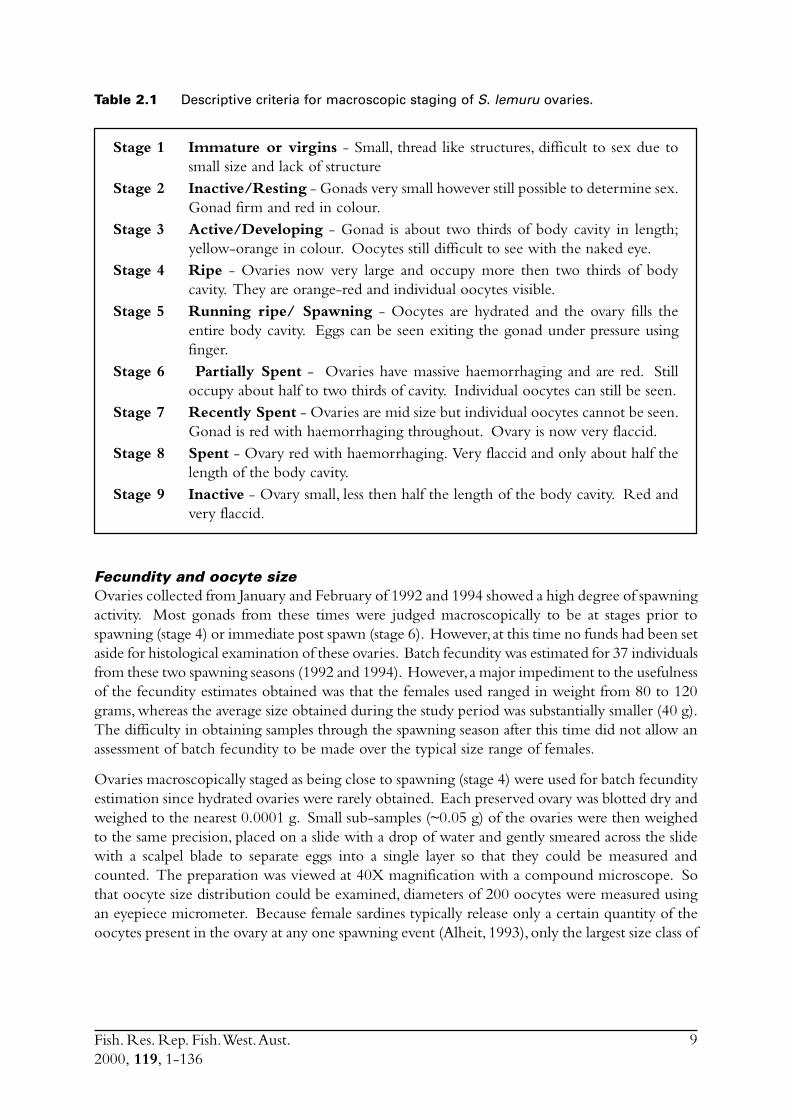
Table 2.1 Descriptive criteria for macroscopic staging of S. lemuru ovaries.
Stage 1 Immature or virgins - Small, thread like structures, difficult to sex due tosmall size and lack of structure
Stage 2 Inactive/Resting - Gonads very small however still possible to determine sex.Gonad firm and red in colour.
Stage 3 Active/Developing - Gonad is about two thirds of body cavity in length;yellow-orange in colour. Oocytes still difficult to see with the naked eye.
Stage 4 Ripe - Ovaries now very large and occupy more then two thirds of bodycavity. They are orange-red and individual oocytes visible.
Stage 5 Running ripe/ Spawning - Oocytes are hydrated and the ovary fills theentire body cavity. Eggs can be seen exiting the gonad under pressure usingfinger.
Stage 6 Partially Spent - Ovaries have massive haemorrhaging and are red. Stilloccupy about half to two thirds of cavity. Individual oocytes can still be seen.
Stage 7 Recently Spent - Ovaries are mid size but individual oocytes cannot be seen.Gonad is red with haemorrhaging throughout. Ovary is now very flaccid.
Stage 8 Spent - Ovary red with haemorrhaging. Very flaccid and only about half thelength of the body cavity.
Stage 9 Inactive - Ovary small, less then half the length of the body cavity. Red andvery flaccid.
Fecundity and oocyte sizeOvaries collected from January and February of 1992 and 1994 showed a high degree of spawningactivity. Most gonads from these times were judged macroscopically to be at stages prior tospawning (stage 4) or immediate post spawn (stage 6). However, at this time no funds had been setaside for histological examination of these ovaries. Batch fecundity was estimated for 37 individualsfrom these two spawning seasons (1992 and 1994). However, a major impediment to the usefulnessof the fecundity estimates obtained was that the females used ranged in weight from 80 to 120grams, whereas the average size obtained during the study period was substantially smaller (40 g).The difficulty in obtaining samples through the spawning season after this time did not allow anassessment of batch fecundity to be made over the typical size range of females.
Ovaries macroscopically staged as being close to spawning (stage 4) were used for batch fecundityestimation since hydrated ovaries were rarely obtained. Each preserved ovary was blotted dry andweighed to the nearest 0.0001 g. Small sub-samples (~0.05 g) of the ovaries were then weighedto the same precision, placed on a slide with a drop of water and gently smeared across the slidewith a scalpel blade to separate eggs into a single layer so that they could be measured andcounted. The preparation was viewed at 40X magnification with a compound microscope. Sothat oocyte size distribution could be examined, diameters of 200 oocytes were measured usingan eyepiece micrometer. Because female sardines typically release only a certain quantity of theoocytes present in the ovary at any one spawning event (Alheit, 1993), only the largest size class of
Fish. Res. Rep. Fish. West. Aust.2000, 119, 1-136
10
oocytes were counted to estimate fecundity. For each subsample of ovary, all oocytes in the largersize class were counted. The counts from each subsample from were then averaged before batchfecundity was estimated using the following formula:
Batch fecundity = average oocyte count per gram in the sub-samples X weight of the ovary.
Relative fecundity (the number of eggs per gram of ovary-free body weight) was also calculated.
Histological studiesOf the samples collected during this project, only in February 1997 were ovaries obtained whichwere at a stage close to spawning. Therefore only these ovaries were subjected to histologicalexamination. Ovaries were prepared for histological analysis using standard techniques, thenstained using haematoxylin and eosin.
After spawning the remnant epithelial tissue which encapsulated each ovum, i.e. post ovulatoryfollicles (pofs), remains visible for a short period of perhaps 1-2 days. For some species of fishthese structures can be aged, for example, as either day 0 (< 24 hours old) or day 1 (24-48 hoursold) (Hunter & Macewicz 1985), which allows identification of the actual day of spawning.Knowledge of what proportion within a sample had spawned on a given day allows the spawningfraction to be estimated, a parameter necessary for the daily egg production method (DEPM) ofestimating spawning biomass. Sections of ovary were thus examined under a compound microscopefor the presence of pofs.
Also, to further assess oocyte size distribution, the diameters of 50 oocytes were measured on eachof one to three ovaries at different developmental stages.
2.2.4 DietThe gut contents samples of S. lemuru used in this study were collected over a four year period.Two different methods of preservation were used on those fish for which guts were examined.Firstly, samples of S. lemuru from the commercial catch were frozen and transported to Perth forbiological processing. The stomachs of a number of these fish were removed and individuallypreserved in a five per cent formalin solution. Secondly, stomach contents samples of S. lemuruwere collected during the various research cruises. Fish, or just their stomachs, were preservedfresh in a 10 per cent formalin solution.
Gut contents from 10 stomachs from each sampling occasion were examined. Both the pyloricand cardiac stomachs were cut open and the main bolus of contents removed and weighed. Thecontents were then placed into a 5 ml vial and any remaining contents were washed in with a fiveper cent formalin solution. The volume in each vial was then made up to 3 ml with the formalinsolution. Once the gut contents were placed in the vials they were agitated to break up the bolusinto an even mixture.
To assess the numbers and types of zooplankton present in the stomach contents of each fish a1 ml subsample of the 3 ml volume in the vial was examined under a dissecting microscope. Thezooplankton present in this portion were identified as far as possible and counted. These countswere multiplied by 3 to estimate the total numbers of each food item present. In some samplesthe numbers of zooplankton were very low or the samples did not readily break up duringagitation. In these cases the whole sample was examined and the zooplankton present identifiedand counted. Additionally, the percentage of detritus in each sample was estimated at this stage.
Fish. Res. Rep. Fish. West. Aust.2000, 119, 1-136
11
To assess the numbers and types of phytoplankton present in the stomach contents of each fish a0.1 ml subsample of the 3 ml volume in the vial was placed onto a slide with a cover slip andexamined under a compound microscope. The phytoplankton present in this portion were identifiedas far as possible and counted. These counts were then multiplied by 30 to get the total numberspresent. In some samples the number of phytoplankton was so large that further subsampling wasrequired.
Additionally, some samples from 1996 were examined by Wasel Hosja of the Waters and RiversCommission. These results were presented as volumes of diatoms, dinoflagellates and blue/greenalgae.
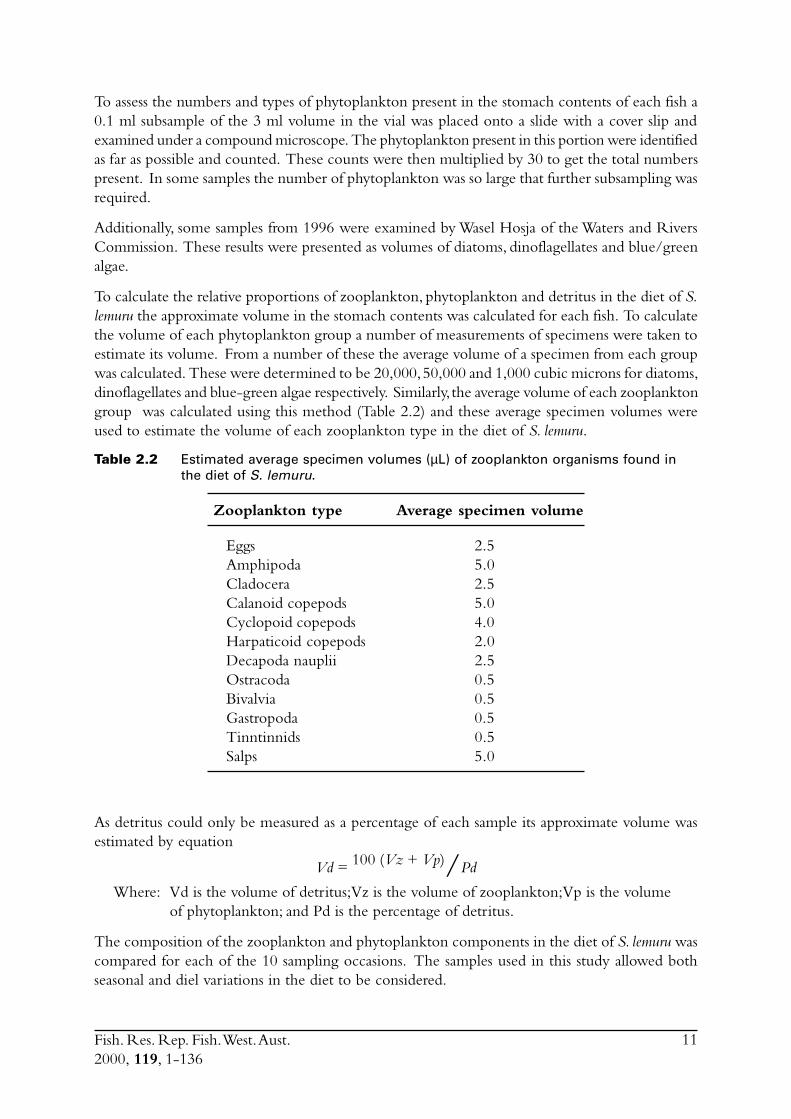
To calculate the relative proportions of zooplankton, phytoplankton and detritus in the diet of S.lemuru the approximate volume in the stomach contents was calculated for each fish. To calculatethe volume of each phytoplankton group a number of measurements of specimens were taken toestimate its volume. From a number of these the average volume of a specimen from each groupwas calculated. These were determined to be 20,000, 50,000 and 1,000 cubic microns for diatoms,dinoflagellates and blue-green algae respectively. Similarly, the average volume of each zooplanktongroup was calculated using this method (Table 2.2) and these average specimen volumes wereused to estimate the volume of each zooplankton type in the diet of S. lemuru.
Table 2.2 Estimated average specimen volumes (µL) of zooplankton organisms found inthe diet of S. lemuru.
Zooplankton type Average specimen volume
Eggs 2.5Amphipoda 5.0Cladocera 2.5Calanoid copepods 5.0Cyclopoid copepods 4.0Harpaticoid copepods 2.0Decapoda nauplii 2.5Ostracoda 0.5Bivalvia 0.5Gastropoda 0.5Tinntinnids 0.5Salps 5.0
As detritus could only be measured as a percentage of each sample its approximate volume wasestimated by equation
Vd = 100 (Vz + Vp)/Pd
Where: Vd is the volume of detritus; Vz is the volume of zooplankton; Vp is the volumeof phytoplankton; and Pd is the percentage of detritus.
The composition of the zooplankton and phytoplankton components in the diet of S. lemuru wascompared for each of the 10 sampling occasions. The samples used in this study allowed bothseasonal and diel variations in the diet to be considered.
Fish. Res. Rep. Fish. West. Aust.2000, 119, 1-136
12
2.2.5 Age and growth2.2.5.1 OverviewThe otoliths and scales of a random selection of each sample collected in 1995 were removed andprepared (approximately 100 individuals per month) according to the methods described in Fletcher(1991). These structures were examined for the presence and location of rings which may representannuli. The validity of using these rings to age fish was investigated using the standard techniqueof marginal increment analysis. These ages estimated using ‘annuli’ were compared with thoseascribed using otolith weight by the method used to age the south coast pilchards (Fletcher, 1991,1995). It was hoped that the most appropriate structure (and the method of examination) forlong term use would be determined during the first two years of the study to reduce the time tocomplete the processing of subsequent samples. The full methodology for estimate ages ofS. lemuru is described below.
Assuming an appropriate estimate of age can be made for individuals, the growth rate and parameterestimates for each sex will be calculated using standard equations (e.g. Francis, 1990).
2.2.5.2 Sample treatmentThe sagittal otoliths were removed from a subsample of 10 to 30 fish from each sample. In mostcases both sagittae were obtained, but occasionally one of the two was not recovered or brokeduring removal. Otoliths were cleaned of all adhering tissue in water, air dried for at least24 hours and weighed (± 0.000 002 grams, 0.002 milligrams) using an electronic balance. Foreach of the fish from which otoliths had been removed during 1995, three scales were removedfrom the dorso-lateral region of the left hand side of the body posterior of the head (‘shoulder’).In some case, particularly for smaller individuals, there were no scales remaining at the time thesamples were examined, due to total loss of scales during capture and handling. Scales werecleaned in water, dried and then mounted between microscope slides.
2.2.5.3 Ageing methodsAge was estimated for individual fish by counting of translucent zones on scales, whole otolithsand sectioned otoliths. In each case the ‘best’ estimates of age were used with fork length toestimate von Bertalanffy (vB) parameters (L
inf, k and t
0). vB parameters were estimated by
minimising the sums of squares for the fitted model. The following constraints were applied:t0 ò -5.0, k ò 0.1, L
inf ò 160.
For each of the assessments of age, data were initially plotted so that extreme outliers could beidentified. Such outliers typically resulted from errors in the databases. If reference to the originaldata did not permit a correction then such outliers were removed from the data.
2.2.5.4 ScalesAll scales collected in 1995 were examined. The best of the three scales from each fish was chosenby the reader and the number of zones interpreted to be annuli were counted. Three readings ofthe scales were performed. The first reading was made by one reader and the second and thirdreadings were made by a second, more experienced reader of scales.
2.2.5.5 Whole otolithsPreliminary analysis indicated that there was a positive relationship between fork length andotolith weight, suggesting that the otolith kept growing as the fish grew. Therefore, early evidencesuggested that otoliths could be used to estimate age.
Fish. Res. Rep. Fish. West. Aust.2000, 119, 1-136
13
Whole otoliths were examined for subsamples of fish from 1995, 1996 and 1997. A single otolithfrom each pair removed from fish was mounted on a black, plastic, microscope slide in castingresin and covered with a coverslip. Otoliths were viewed under a dissecting microscope usingreflected light. The image was transmitted via camera to an desktop computer which employedan interactive program which enabled the reader to record (a) the number(s) of translucent zones,(b) the distance of each of these zones from the otolith core along the posterior axis, (c) the radiusalong the posterior axis and (d) whether the posterior edge of the otolith was opaque or translucent.
Initial examination of several otoliths indicated that translucent zones were going to be difficultto consistently identify. A small percentage of otoliths were read with the date of capture but notthe size of fish known. However, the level of subjectivity needed to count rings observed on theotoliths was considered sufficient to warrant examining otoliths without knowing their details.Thus, the double blind method was employed for the majority of otoliths examined, with nodetails of the origin of each otolith known until after it had been read. To examine the readabilityof whole otoliths, which acts as a measure of the influence of subjectivity when identifyingtranslucent zones, a second reading of the same otoliths was made by the same reader after aninterval of two weeks.
Marginal increments (MI = width of outer ring as a proportion of width of the previous ring),the percentage of otoliths with opaque edges and the percentage of otoliths with new edges(MI < 20%) were each examined to assist with validating the annual periodicity of rings(e.g. Hyndes et al. 1992).
2.2.5.6 Sectioned otolithsSeveral studies have found that otolith sections provide an image for estimating age superior tothat obtained using whole otoliths.
For each month in which samples were obtained during 1995 whole otoliths, representing thoseremaining from the same fish for which otoliths were read whole, were sectioned transverselyusing a Beuhler low speed Isomet circular saw, following embedding in resin. Because sampleswere collected from the fishery in only several months each year during this study, otoliths obtainedin various months from other years between 1990 and 1997 were also used. The sections werethen ground down with a series of finer grades of abrasive paper until about 0.3 mm thick. Thesections, which remained held within the blocking resin were then mounted on microscopeslides. Rings were counted on these sections twice by one reader and then once by a secondreader following the same methods used for whole otoliths, but with a combination of reflectedand transmitted light for viewing under the microscope.
2.2.5.7 Micro-increment analysis
LarvaeSagittal otoliths were removed from larvae collected in a plankton net in March 1995. Theotoliths were mounted whole in clear finger-nail polish on a microscope slide. Micro-incrementswere counted at least twice under a compound microscope at a magnification of X1000. Otolithswere read with the size and time of capture of the fish unknown. Increments were counted fromthe core to the otolith edge, along a single transect if possible.
Juveniles and adultsAn attempt was made to count the micro-increments on the sagittae of fifty fish between 120 and180 mm. For each fish a sagitta was mounted convex side down on a microscope slide with
Fish. Res. Rep. Fish. West. Aust.2000, 119, 1-136
14
thermo-plastic. The concave surface was then ground down using a series of sequentially finerabrasive paper. Micro-increments were counted at least twice under a compound microscope ata magnification of X1000. Otoliths were read with the size and time of capture of the fishunknown. Any otoliths on which increments could not be followed from the core to the posterioredge were not used further in this study. The radius to the posterior edge was also measured.
2.2.5.8 Otolith weight frequenciesSince otolith weight (OW) can be objectively measured and many can be processed in a relativelyshort period of time, this data set contains more measures than those for sectioned otoliths, scalesand micro-increment analysis. To determine if OWs could be used to estimate age, the frequencydistributions of OWs in each year and selected months were subjected to modal analysis withBattacharya’s (1967) method using the module in the FISAT software package (Gayanilo et al.,1996). Otolith-weight ages were also compared with ages obtained for whole and sectionedotolith methods. Modal analysis and the relationships between OW and age estimated using ringcounts were then jointly examined in an effort to determine if it was feasible to assign ages usingotolith weights.
2.2.5.9 Length frequenciesAge and growth were assessed from monthly length frequency data subjected to the ELEFANmodule of the FISAT software package. Length frequency data for all samples collected and forthe period 1995-1997 were analysed separately. The routines in ELEFAN estimated best fits ofvon Bertalanffy parameters and allowed a visual assessment of the associated von Bertalanffygrowth plots.
2.2.5.10 Catch-at-age distribution for the fishery and estimates of totalmortality
The data collected each month on the ages of individuals present in the catch will be combinedwith the relative magnitude of the catch to provide a suitably weighted, yearly catch-at-agedistribution for the fishery. From this distribution, estimates of total mortality will be calculated.It was intended to use any changes in effort during the sampling period to separate total mortalityinto its two components, fishing and natural mortality. However, the changes and inconsistency inthe fishery from year to year nullified this proposal since sufficiently comparable estimates ofeffort between years were not available.
2.2.5.11 Sampling juvenilesOne of the key objectives of estimating age was to determine the age structure of the population.However, monitoring of the commercial catch for Sardinella did not record many individualssmaller than 100 mm FL. Although the mesh selectivity could be a reason for this, it is doubtfulthat the juvenile fish and the adult fish were schooling together to any large extent. For example,the south coast purse seine fisheries in WA regularly catch small numbers of juvenile pilchardsaround 80-90 mm FL, even though this size class is not effectively captured by commercial purseseine nets and avoided by fishers when possible. It was assumed that if juvenile S. lemuru less than100 mm FL co-occurred with the adults, even if only periodically, then some would have beencaught by the fleet, but this was not the case. Likewise, none were caught in the samples obtainedusing mid-water trawling, although the research mid-water trawl net was able to catch reasonablenumbers of small fish less than 100 mm FL (e.g. sandy sprats in Cockburn Sound near Fremantle,slender sprats in Geelvink Channel).
Fish. Res. Rep. Fish. West. Aust.2000, 119, 1-136
15
The lack of juveniles from the commercial catch and the mid-water trawling program suggeststhat small S. lemuru do not occur in any reasonable quantities in the commercial fishing area. Itwas therefore hypothesized that juvenile S. lemuru may use the shallow inshore areas along themainland and or lagoons around the Abrolhos Islands as nursery sites.
Although it was beyond the scope of this project to undertake comprehensive surveys to identifynursery areas of S. lemuru, a brief examination for potential nursery areas in nearshore waters ofthe mainland and at the Abrolhos islands was undertaken since there was a need to catch fish froma small size class so as to obtain some data points for the early part of the growth curve. Thesesurveys are described in Appendix 1.
2.3 Stock delineationIn an effort to determine if there were separate stocks of S. lemuru along the lower and mid-westcoast of WA the isotopic ratios of otolith carbonate were compared for samples of fish obtainedfrom Fremantle, Geraldton and Carnarvon. While direct causes for differences in the isotopicratio for carbon (i.e. d13C)† between samples of otolith carbonate cannot be precisely ascribed,differences in the oxygen ratio (d18O) has been shown to be closely linked to differences in watertemperature in which the specimens lived (Edmonds & Fletcher 1997). Differences in (d18O) canthus be examined with respect to a distinct environmental variable. Note that although d13C isnot so easily linked to a distinct environmental variable, and is likely influenced by biologicalfactors such as diet, significant differences in this ratio still indicate the presence of distinct groupsof fish.
The analyses undertaken on S. lemuru during this study represented only an introductoryexamination of stock structure. The techniques used follow those described in Edmonds andFletcher (1997).
2.4 Monitor the dynamics, locations and catch rates ofthe fleet.
Research logbooks were supplied to the skippers for completion on a shot-by-shot basis for the1995 to 1997 seasons. Both skippers operating in the fishery at the time were consulted during,and thus contributed to, the development of the logbook. Measures of effort recorded in thelogbooks were number of days fished, fuel-used, search-time-per-trip and number-of-blocks-searched. The latter measure of effort was found to be of no use because the areal extent of thepreferred fishing grounds throughout the study period were considerably smaller than the block-size used in the logbook (i.e. 5 n mile X 5 n mile).
The effort information was used to estimate monthly and yearly catch rates in the fishery. Thisinformation will provide one of the baselines for any future assessments of the status of the stock.
In a further effort to assess relative changes in abundance, vessels also recorded the numbers ofschools of S. lemuru detected during each trip.
To assess the spatial extent of the S. lemuru fishery the location of each catch was recorded. Thelogbook provided the option to identify the location as either a GPS co-ordinate (i.e. finescale) orby referring to individually numbered 5 n mile X 5 n mile blocks (i.e. broadscale) provided in thelogbook.
† This is a standard notation for isotopic ratios.
Fish. Res. Rep. Fish. West. Aust.2000, 119, 1-136
16
In order to provide further understanding of the fishery, particularly as it was a developmentalfishery, other ancillary information were recorded. These were incidence of zero-catches, reasonsfor “lost” fishing days, position of S. lemuru schools in the water column and the presence ofpredators in the fishing grounds.
2.5 Conduct ichthyoplankton surveys to provide data for thedaily egg production method of estimating spawningbiomass
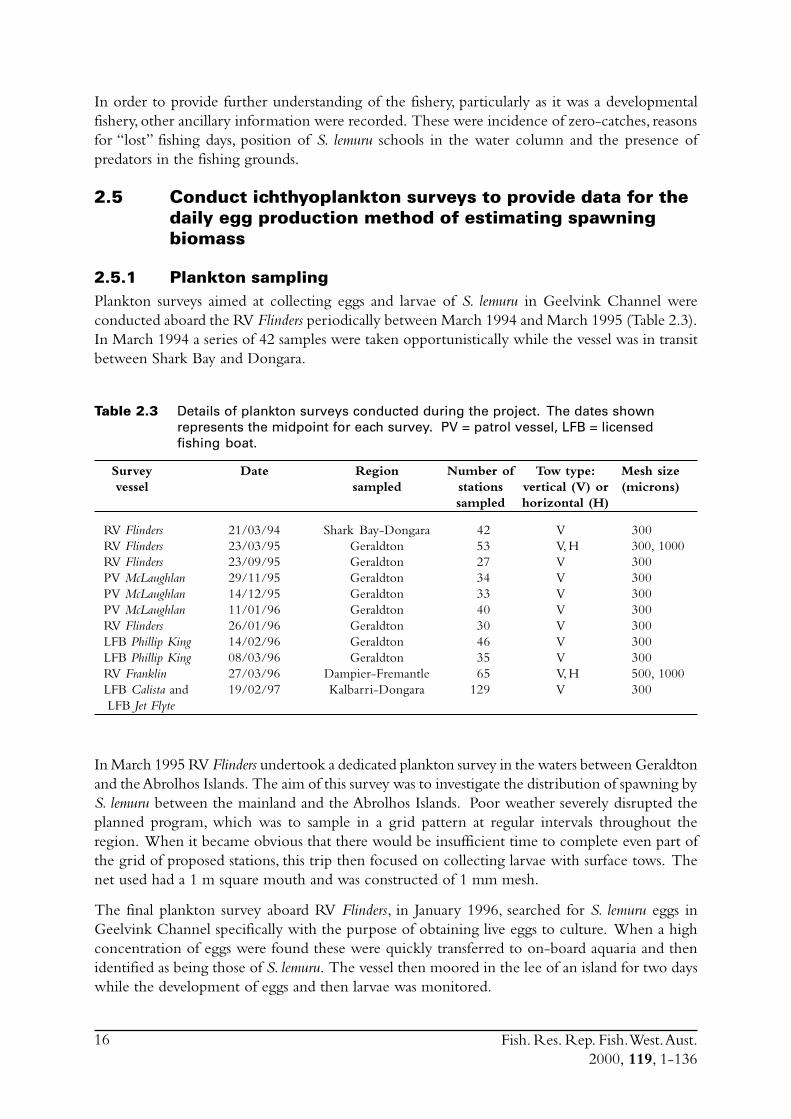
2.5.1 Plankton samplingPlankton surveys aimed at collecting eggs and larvae of S. lemuru in Geelvink Channel wereconducted aboard the RV Flinders periodically between March 1994 and March 1995 (Table 2.3).In March 1994 a series of 42 samples were taken opportunistically while the vessel was in transitbetween Shark Bay and Dongara.
Table 2.3 Details of plankton surveys conducted during the project. The dates shownrepresents the midpoint for each survey. PV = patrol vessel, LFB = licensedfishing boat.
Survey Date Region Number of Tow type: Mesh sizevessel sampled stations vertical (V) or (microns)
sampled horizontal (H)
RV Flinders 21/03/94 Shark Bay-Dongara 42 V 300RV Flinders 23/03/95 Geraldton 53 V, H 300, 1000RV Flinders 23/09/95 Geraldton 27 V 300PV McLaughlan 29/11/95 Geraldton 34 V 300PV McLaughlan 14/12/95 Geraldton 33 V 300PV McLaughlan 11/01/96 Geraldton 40 V 300RV Flinders 26/01/96 Geraldton 30 V 300LFB Phillip King 14/02/96 Geraldton 46 V 300LFB Phillip King 08/03/96 Geraldton 35 V 300RV Franklin 27/03/96 Dampier-Fremantle 65 V, H 500, 1000LFB Calista and 19/02/97 Kalbarri-Dongara 129 V 300 LFB Jet Flyte
In March 1995 RV Flinders undertook a dedicated plankton survey in the waters between Geraldtonand the Abrolhos Islands. The aim of this survey was to investigate the distribution of spawning byS. lemuru between the mainland and the Abrolhos Islands. Poor weather severely disrupted theplanned program, which was to sample in a grid pattern at regular intervals throughout theregion. When it became obvious that there would be insufficient time to complete even part ofthe grid of proposed stations, this trip then focused on collecting larvae with surface tows. Thenet used had a 1 m square mouth and was constructed of 1 mm mesh.
The final plankton survey aboard RV Flinders, in January 1996, searched for S. lemuru eggs inGeelvink Channel specifically with the purpose of obtaining live eggs to culture. When a highconcentration of eggs were found these were quickly transferred to on-board aquaria and thenidentified as being those of S. lemuru. The vessel then moored in the lee of an island for two dayswhile the development of eggs and then larvae was monitored.
Fish. Res. Rep. Fish. West. Aust.2000, 119, 1-136
17
In order to assess the temporal and spatial distribution of spawning within the region of thefishery, a grid of stations in Geelvink Channel was sampled at regular intervals between September1995 and March 1996 (Table 2.3). Initial assessments of reproductive biology had indicated thatthe spawning season was from mid-summer to early autumn so this series of surveys was timed totrack the seasonality of spawning. This program of sampling had an additional role of constitutinga pilot survey for the DEPM survey to be conducted later. All samples were taken using300 micron CALVET nets (set up as paired bongo nets) which were towed vertically from nearthe bottom to the surface. For all plankton surveys the volumes of water filtered by the nets weremeasured with flowmeters.
RVFranklin undertook a cruise from Dampier to Fremantle in late March 1996, with planktonsamples taken at regular intervals across the continental shelf. Vertical tows were taken with a pairof 500 micron-mesh conical nets, and surface tows with the same net used for this purpose aboardRV Flinders (i.e. 1,000 micron-mesh net, 1 m square mouth).
2.5.2 The DEPM survey to estimate spawning biomassThe daily egg production method has been used to estimate the spawning biomass of sardines andanchovies in various regions around the world (Alheit 1993), including off the southern coast ofWA (Fletcher et al., 1996). This technique was attempted for S. lemuru in the Geraldton region.
The DEPM model is as follows:
Spawning Biomass = (A*P*W*k)/(S*F*R)
where: A = spawning area (km2); P = daily egg production (numbers of eggs per0.05 m2 before losses due to mortality); W = average weight of spawningfemales (grams); k = conversion factor to bring the various units to a valuein tonnes (k = 20); S = spawning fraction - the proportion of females thatspawn per day; F = fecundity - number of eggs released by a female ofaverage weight; and R = ratio of females.
This method of estimating biomass requires two distinct sampling surveys which need to beconducted simultaneously; one for the adults (from commercial catches) and another for the eggs(plankton sampling).
Adult sampling was conducted in the area of the fishery as described in Appendix 1. Estimates ofthe above parameters follow standard procedures which have been described elsewhere in thisreport.
During the DEPM survey in February 1997 a grid of plankton stations extended from inshore tothe edge of the continental shelf and from Kalbarri in the north to Dongara in the south. Stationswere sampled with 300 micron-mesh CAVET nets towed vertically from a depth of 70 m or closeto the bottom in shallower water.
2.6 The environment in the region of the fisheryThe environment, particularly wind, had such a dramatic influence on the collection of samplesfor this project, that a thorough description is included in this report. Furthermore, knowledge ofenvironmental factors is necessary when studying the biology of a species.
Fish. Res. Rep. Fish. West. Aust.2000, 119, 1-136
18
The main commercial fishing grounds for S. lemuru extend offshore between the Houtman AbrolhosIslands and Geraldton on the mainland. In order to assess how weather impacts fishing effort, andconsequently total catch, meteorological conditions in the region of the fishery were examined.Meteorological data were obtained from weather stations at North Island and Geraldton, thenearest facilities to the fishing grounds. North Island has an Automatic Weather Station (AWS),which was installed in 1990. This device records hourly air temperature, wind speeds (a.m. andp.m. averages) and wind directions. The weather station located in Geraldton is capable ofrecording more detailed atmospheric data.
The Leeuwin Current in the region of the fishery is also described. Pearce (1997) previouslydescribed environmental conditions in Geelvink Channel close to where the fishery operates.
3.0 TaxonomyThe FAO catalogue of clupeid species (Whitehead 1985) is the primary source of identificationfor sardines. The identity of the species of sardine caught at Geraldton and also at Fremantle, i.e.the scaly mackerel, most closely resembled Sardinella lemuru as described in Whitehead (1985).This identification was also reached by staff at the WA Museum.
The distribution of S. lemuru apparently extends northwards from WA into Indonesia and thenbeyond into coastal waters of southern Japan (Whitehead 1985). There has been some confusionregarding the identification of sardines caught in Indonesia, particularly in the important BaliStrait sardine fishery. For example, some references indicate that the major sardine species caughtin the Bali Strait is S. longiceps (Ritterbush 1975; Pet et al. 1997a, b) while other works indicatethat S. lemuru is the major species (Venema 1996; Merta 1995). The confusion with S. longiceps isnot surprising since both species are taxonomically quite similar, but the FAO identification guidefor clupeids (Whitehead 1985) states that S. longiceps does not occur in the region. Subsequently,some specimens recently collected from the Bali Strait proved to be S. lemuru. Therefore, inaccordance with the FAO guide, the dominant sardine in the Bali Strait fishery is deemed to bethe same species which is addressed in this report, i.e. S. lemuru. Sardinella fimbriata is anothercommon, but far less abundant, component of the Bali Strait sardine catch, but is easily distinguishedfrom S. lemuru.
Although there was a suggestion that the WA catch of scaly mackerel could be Amblygaster sirm,this was not the case. A specimen of A. sirm was examined and found to be easily distinguishedfrom S. lemuru. During this study no A. sirm were recorded caught by the purse seine fleet inGeraldton.
Recent research in other parts of Indonesia has found sardine species which are difficult toidentify using the FAO guide, so there are possibly clupeid species in the Indonesian archipelagowhich have not been formally described (H. van Oostenbrugge, P. Kailola, pers. comm).
Fish. Res. Rep. Fish. West. Aust.2000, 119, 1-136
19
4.0 Reproduction
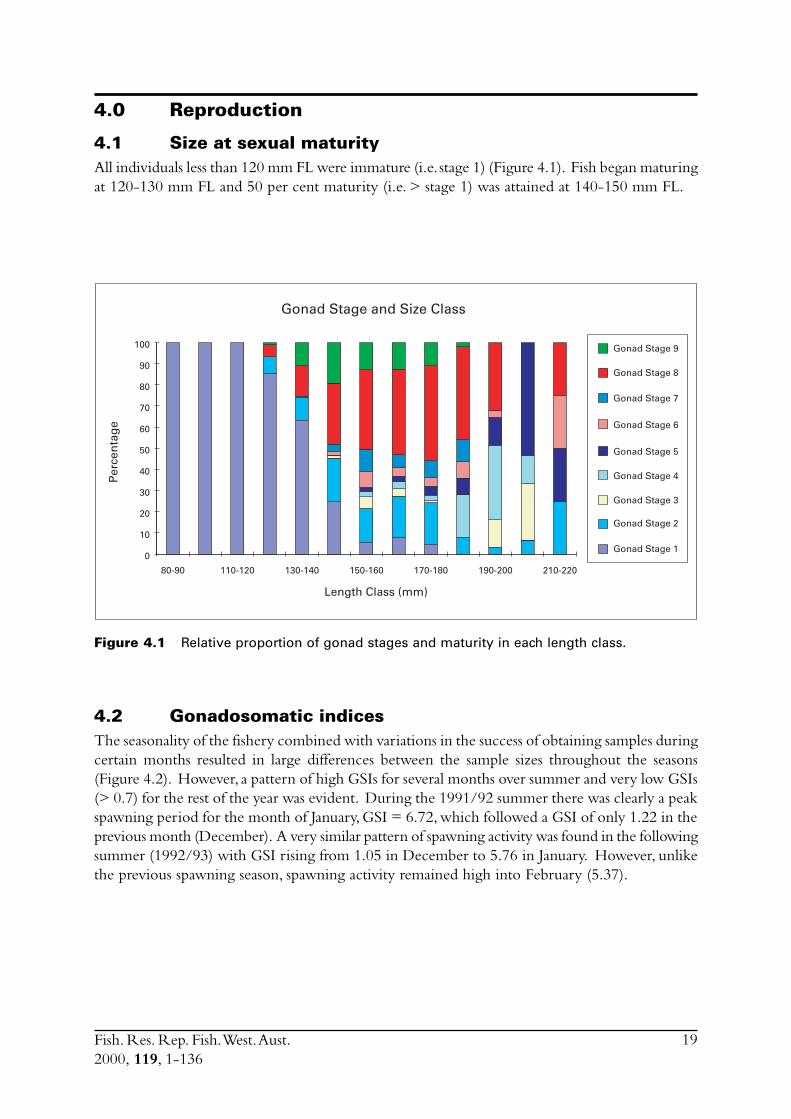
4.1 Size at sexual maturityAll individuals less than 120 mm FL were immature (i.e. stage 1) (Figure 4.1). Fish began maturingat 120-130 mm FL and 50 per cent maturity (i.e. > stage 1) was attained at 140-150 mm FL.
Figure 4.1 Relative proportion of gonad stages and maturity in each length class.
Gonad Stage 9
Gonad Stage 2
Gonad Stage 1
Gonad Stage 3
Gonad Stage 4
Gonad Stage 5
Gonad Stage 6
Gonad Stage 7
Gonad Stage 8
80-90 110-120 130-140 150-160 170-180 190-200 210-220
Length Class (mm)
Per
cen
tag
e
0
10
20
30
40
50
60
70
80
90
100
Gonad Stage and Size Class
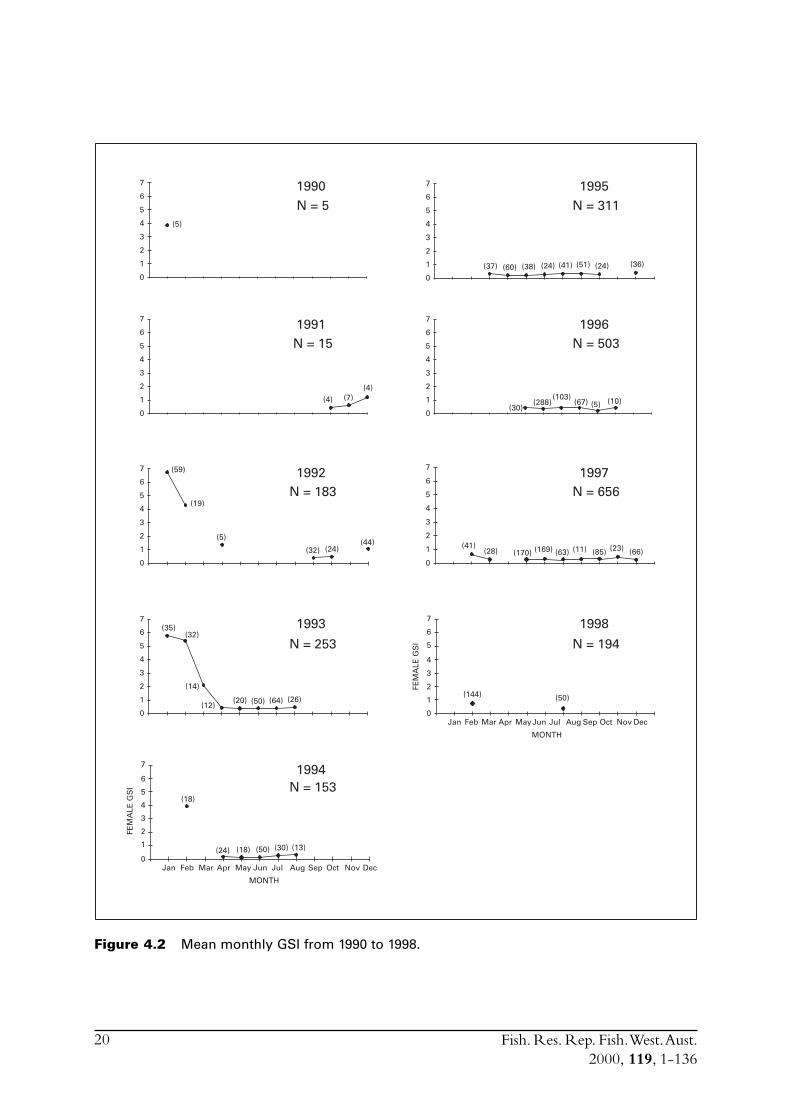
4.2 Gonadosomatic indicesThe seasonality of the fishery combined with variations in the success of obtaining samples duringcertain months resulted in large differences between the sample sizes throughout the seasons(Figure 4.2). However, a pattern of high GSIs for several months over summer and very low GSIs(> 0.7) for the rest of the year was evident. During the 1991/92 summer there was clearly a peakspawning period for the month of January, GSI = 6.72, which followed a GSI of only 1.22 in theprevious month (December). A very similar pattern of spawning activity was found in the followingsummer (1992/93) with GSI rising from 1.05 in December to 5.76 in January. However, unlikethe previous spawning season, spawning activity remained high into February (5.37).
Fish. Res. Rep. Fish. West. Aust.2000, 119, 1-136
20
0
1
2
3
4
5
6
7
(5)
1990 N = 5
0
1
2
3
4
5
6
7
(37) (60) (38) (24) (41) (51) (24) (36)
1995 N = 311
0
1
2
3
4
5
6
7
(4)(7)(4)
1991 N = 15
0
1
2
3
4
5
6
7
(30)(288)
(103)(67) (5) (10)
1996 N = 503
(44)(24)(32)
(5)
(19)
(59)
0
1
2
3
4
5
6
7 1992 N = 183
0
1
2
3
4
5
6
7
(41)(28) (170) (169) (63) (11) (85) (23) (66)
1997 N = 656
0
1
2
3
4
5
6
7(35)
(32)
(14)
(12)(20) (50) (64) (26)
1993
N = 253
1998
N = 194
MONTH
FEM
ALE
GS
I
(144) (50)
Jan Feb Mar Apr MayJun Jul Aug Sep Oct Nov Dec0
1
2
3
4
5
6
7
1994 N = 153
MONTH
FEM
ALE
GS
I
Jan Feb Mar Apr May Jun Jul Aug Sep Oct Nov Dec0
1
2
3
4
5
6
7
(18)
(24) (18) (50) (30) (13)
Figure 4.2 Mean monthly GSI from 1990 to 1998.
Fish. Res. Rep. Fish. West. Aust.2000, 119, 1-136
21
Following this two-year period (91/92-92/93) very few S. lemuru were obtained during summer,with the result that the last sample which contained a reasonable number of fish with highlydeveloped gonads, was in February 1994. The collection of samples of S. lemuru prior to theformal start of this project was thus very fortuitous since only a brief description of the reproductivebiology would otherwise have been possible.
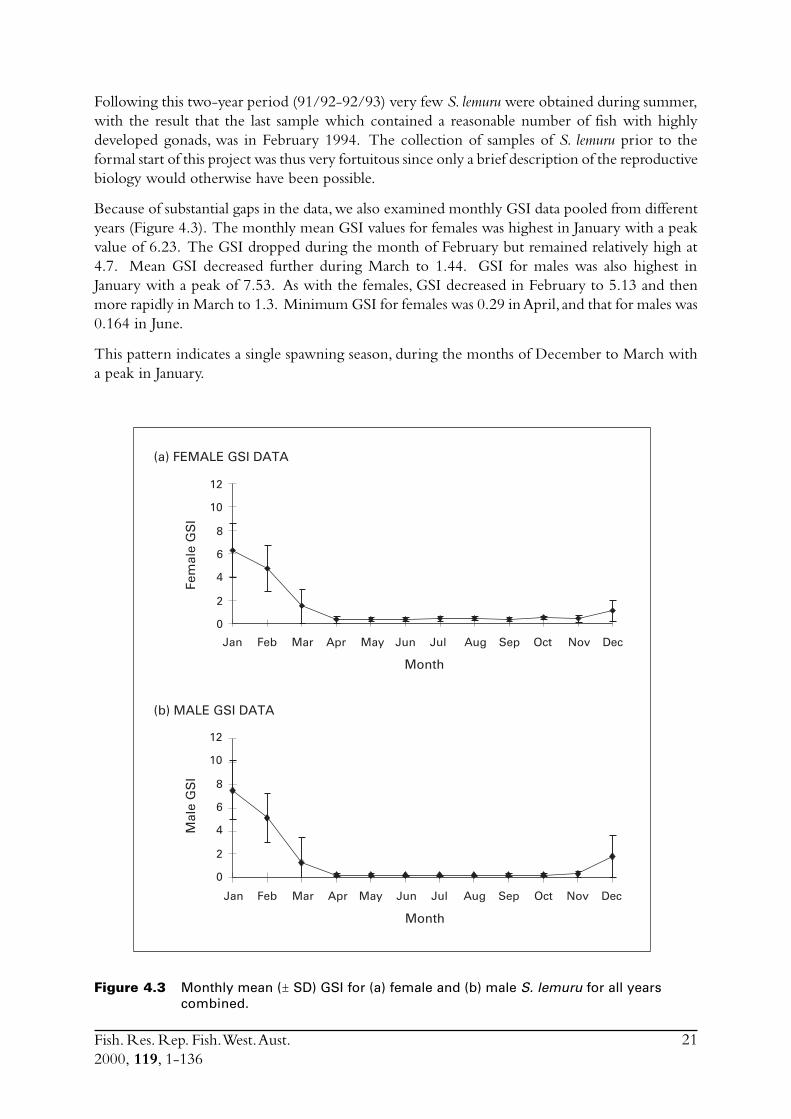
Because of substantial gaps in the data, we also examined monthly GSI data pooled from differentyears (Figure 4.3). The monthly mean GSI values for females was highest in January with a peakvalue of 6.23. The GSI dropped during the month of February but remained relatively high at4.7. Mean GSI decreased further during March to 1.44. GSI for males was also highest inJanuary with a peak of 7.53. As with the females, GSI decreased in February to 5.13 and thenmore rapidly in March to 1.3. Minimum GSI for females was 0.29 in April, and that for males was0.164 in June.
This pattern indicates a single spawning season, during the months of December to March witha peak in January.
Figure 4.3 Monthly mean (ñ SD) GSI for (a) female and (b) male S. lemuru for all yearscombined.
Jan Feb Mar Apr May Jun Jul Aug Sep Oct Nov Dec
0
2
4
6
8
10
12
Jan Feb Mar Apr May Jun Jul Aug Sep Oct Nov Dec
0
2
4
6
8
10
12
Mal
e G
SI
Month
(b) MALE GSI DATA
Month
(a) FEMALE GSI DATA
Fem
ale
GS
I
Fish. Res. Rep. Fish. West. Aust.2000, 119, 1-136
22
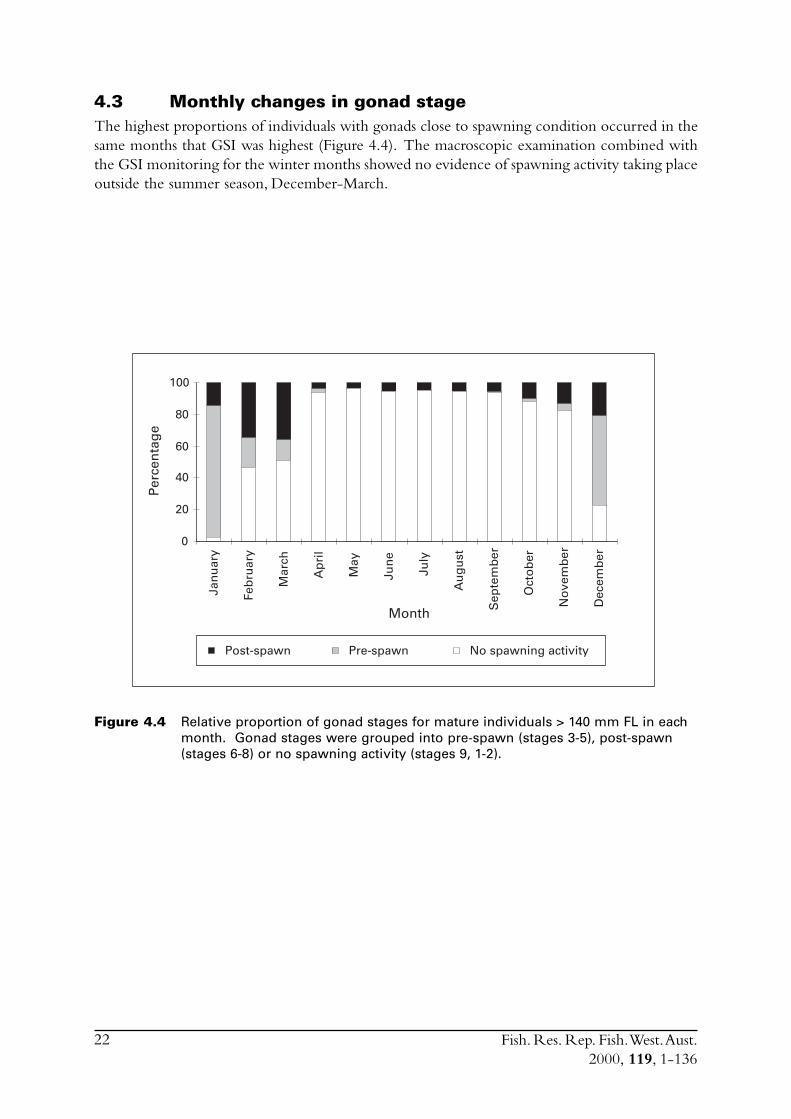
4.3 Monthly changes in gonad stageThe highest proportions of individuals with gonads close to spawning condition occurred in thesame months that GSI was highest (Figure 4.4). The macroscopic examination combined withthe GSI monitoring for the winter months showed no evidence of spawning activity taking placeoutside the summer season, December-March.
Figure 4.4 Relative proportion of gonad stages for mature individuals > 140 mm FL in eachmonth. Gonad stages were grouped into pre-spawn (stages 3-5), post-spawn(stages 6-8) or no spawning activity (stages 9, 1-2).
Post-spawn Pre-spawn No spawning activity
0
20
40
60
80
100
Jan
uar
y
Feb
ruar
y
Mar
ch
Ap
ril
May
Jun
e
July
Au
gu
st
Sep
tem
ber
Oct
ob
er
No
vem
ber
Dec
emb
erMonth
Per
cen
tag
e
Fish. Res. Rep. Fish. West. Aust.2000, 119, 1-136
23
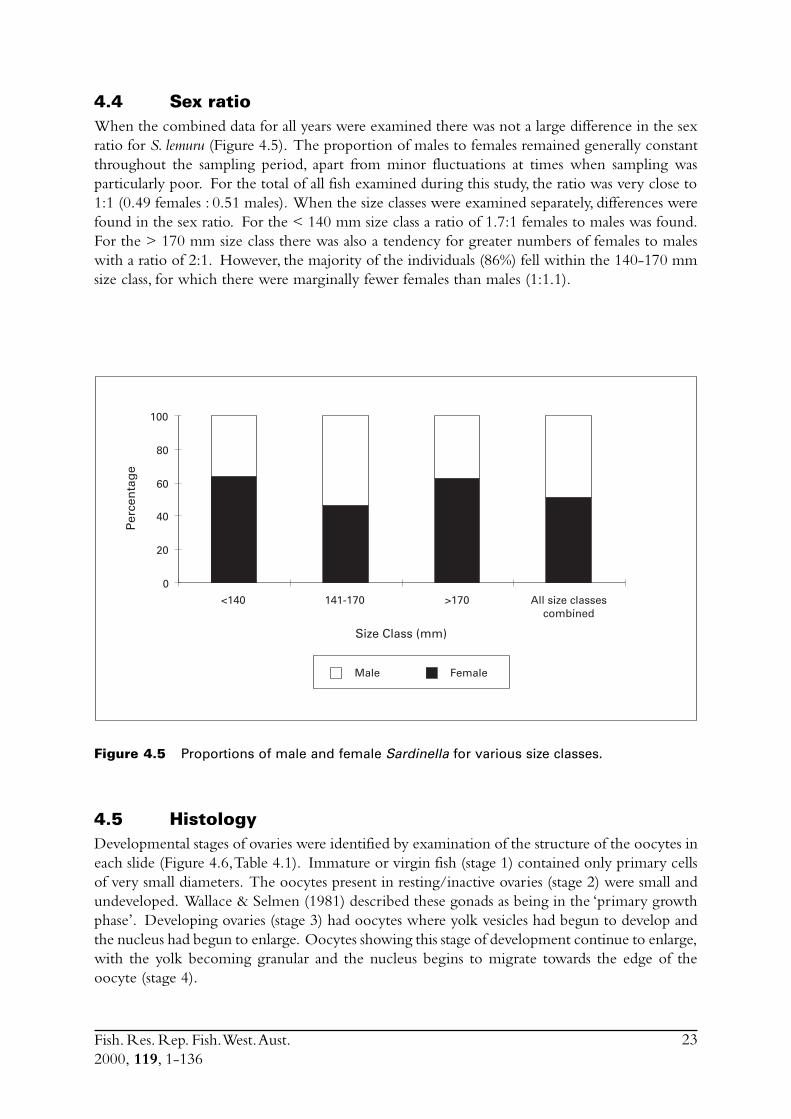
Figure 4.5 Proportions of male and female Sardinella for various size classes.
Size Class (mm)
Per
cen
tag
e
<140 141-170 >170 All size classescombined
0
20
40
60
80
100
Male Female
4.4 Sex ratioWhen the combined data for all years were examined there was not a large difference in the sexratio for S. lemuru (Figure 4.5). The proportion of males to females remained generally constantthroughout the sampling period, apart from minor fluctuations at times when sampling wasparticularly poor. For the total of all fish examined during this study, the ratio was very close to1:1 (0.49 females : 0.51 males). When the size classes were examined separately, differences werefound in the sex ratio. For the < 140 mm size class a ratio of 1.7:1 females to males was found.For the > 170 mm size class there was also a tendency for greater numbers of females to maleswith a ratio of 2:1. However, the majority of the individuals (86%) fell within the 140-170 mmsize class, for which there were marginally fewer females than males (1:1.1).
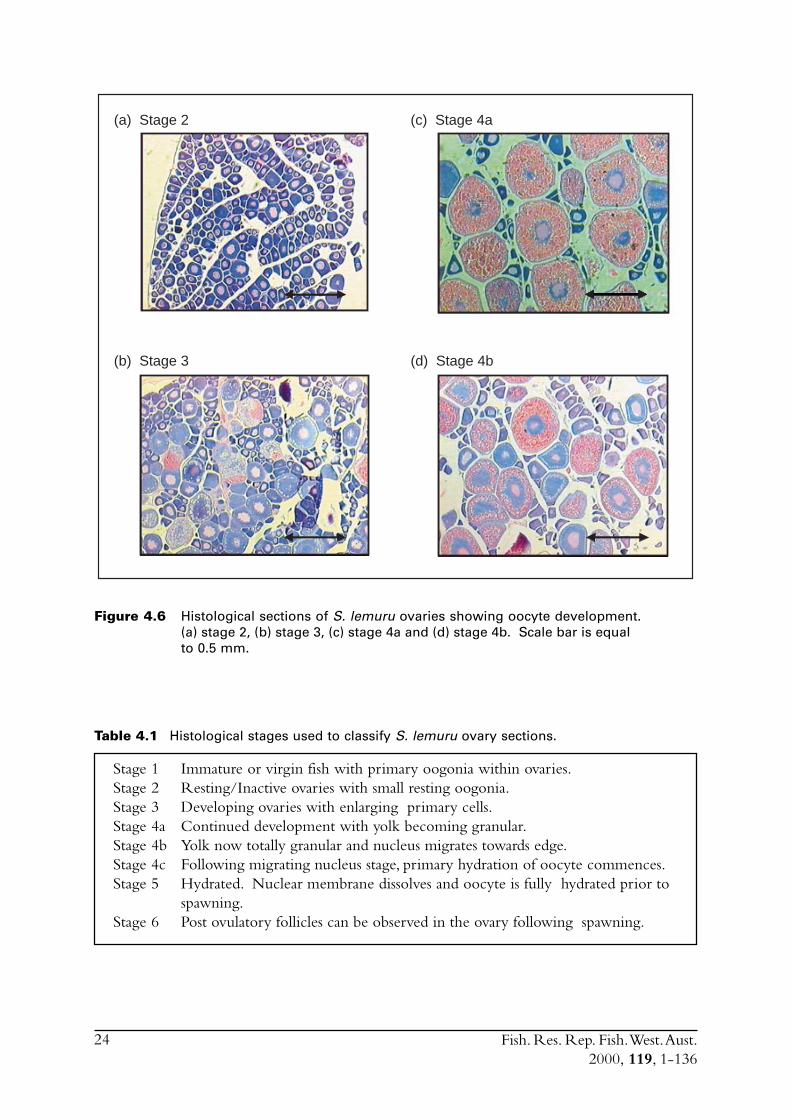
4.5 HistologyDevelopmental stages of ovaries were identified by examination of the structure of the oocytes ineach slide (Figure 4.6, Table 4.1). Immature or virgin fish (stage 1) contained only primary cellsof very small diameters. The oocytes present in resting/inactive ovaries (stage 2) were small andundeveloped. Wallace & Selmen (1981) described these gonads as being in the ‘primary growthphase’. Developing ovaries (stage 3) had oocytes where yolk vesicles had begun to develop andthe nucleus had begun to enlarge. Oocytes showing this stage of development continue to enlarge,with the yolk becoming granular and the nucleus begins to migrate towards the edge of theoocyte (stage 4).
Fish. Res. Rep. Fish. West. Aust.2000, 119, 1-136
24
Figure 4.6 Histological sections of S. lemuru ovaries showing oocyte development.(a) stage 2, (b) stage 3, (c) stage 4a and (d) stage 4b. Scale bar is equalto 0.5 mm.
Table 4.1 Histological stages used to classify S. lemuru ovary sections.
Stage 1 Immature or virgin fish with primary oogonia within ovaries.Stage 2 Resting/Inactive ovaries with small resting oogonia.Stage 3 Developing ovaries with enlarging primary cells.Stage 4a Continued development with yolk becoming granular.Stage 4b Yolk now totally granular and nucleus migrates towards edge.Stage 4c Following migrating nucleus stage, primary hydration of oocyte commences.Stage 5 Hydrated. Nuclear membrane dissolves and oocyte is fully hydrated prior to
spawning.Stage 6 Post ovulatory follicles can be observed in the ovary following spawning.
(a) Stage 2
(d) Stage 4b(b) Stage 3
(c) Stage 4a
Fish. Res. Rep. Fish. West. Aust.2000, 119, 1-136
25
Successive development during stage 4 can be further divided into stages 4a, 4b and 4c. The finalphase before spawning is hydration of the oocyte during which the nuclear membrane breaksdown and the oocyte enlarges (stage 5).
To measure spawning fraction effectively from post ovulatory follicles (pofs), one must be able toestimate the age of the pofs on the basis of the rate of degeneration. The most accurate way todevelop criteria for estimating the age of pofs is to spawn fish in the laboratory and sample atknown times after spawning (Hunter & Macewicz 1985) so that degeneration of pofs can then bemonitored in time series. However, it is possible to monitor the age of pofs by sampling fish at seathrough the day and night (Alheit 1993). This was not accomplished for S. lemuru due to severalfactors. Firstly, S. lemuru predominantly school in tight aggregations at night and were verydifficult to capture during the day. Consequently the commercial operators typically appliedeffort into catching them during the latter part of the afternoon and at night. Secondly, thelimited fishing season made it very difficult to obtain samples during the spawning months. Lastly,the research vessel, which operates with a single crew, is not permitted to work a continuous24-hour shift.
Post ovulatory follicles analysed from histology sections from the February 1997 biomass surveyshowed that only a few fish had recently spawned. Of the 172 ovaries analysed only seven hadpofs, so the estimated spawning fraction was relatively low (4.1%). These results were consistentwith the plankton survey which found that the peak spawning did not occur at the time of thesurvey, with few eggs being found (see Figure 9.2).
In comparison with the low spawning fraction obtained for S. lemuru in February 1997, the rangefor pilchards in WA is nine to 13 per cent at time of peak spawning (Fletcher et al., 1996).Likewise, the low value for S. lemuru in this study is less than typical estimates of spawning fractionfor various other clupeoids (Alheit 1993). Thus, the low value for S. lemuru off Geraldton wasindicative of missing the peak spawning period. Furthermore, the estimate was suspect because itwas based on only a small number of samples collected from a limited area.
For the purpose of organising DEPM surveys, prediction of the peak spawning month a year inadvance, when we were required to reserve cruise time aboard the Fisheries research vessel, wasproblematical. Lack of commercial purse seining during the summer spawning season compoundedthe problem. Due to this paucity of samples, it was not possible to track GSIs in the months/weeks leading up to peak spawning, and, consequently, the peak spawning period was missed.
4.6 Oocyte size frequency distributions from the histologicalsections
The oocyte size frequency distributions for histological sections from different ovary stages generallysupported the macroscopic staging. Thus, ovaries staged as two or three had single modes ofoocytes with diameters of 0.03-0.11 mm (Figure 4.7). Stages from three to five had an increasinglylarge component of oocytes of greater diameter. By stage 4c, just prior to hydration, a secondmode occurred at around 0.33-0.35 mm, and possibly a third mode at 0.43-0.45 mm. A similartrend was observed for fish staged as 4c/5.
The presence of these modes indicate that S. lemuru is likely a synchronous batch spawner and thatenumeration of the largest size class of oocytes would provide a basis for estimating batch fecundity.
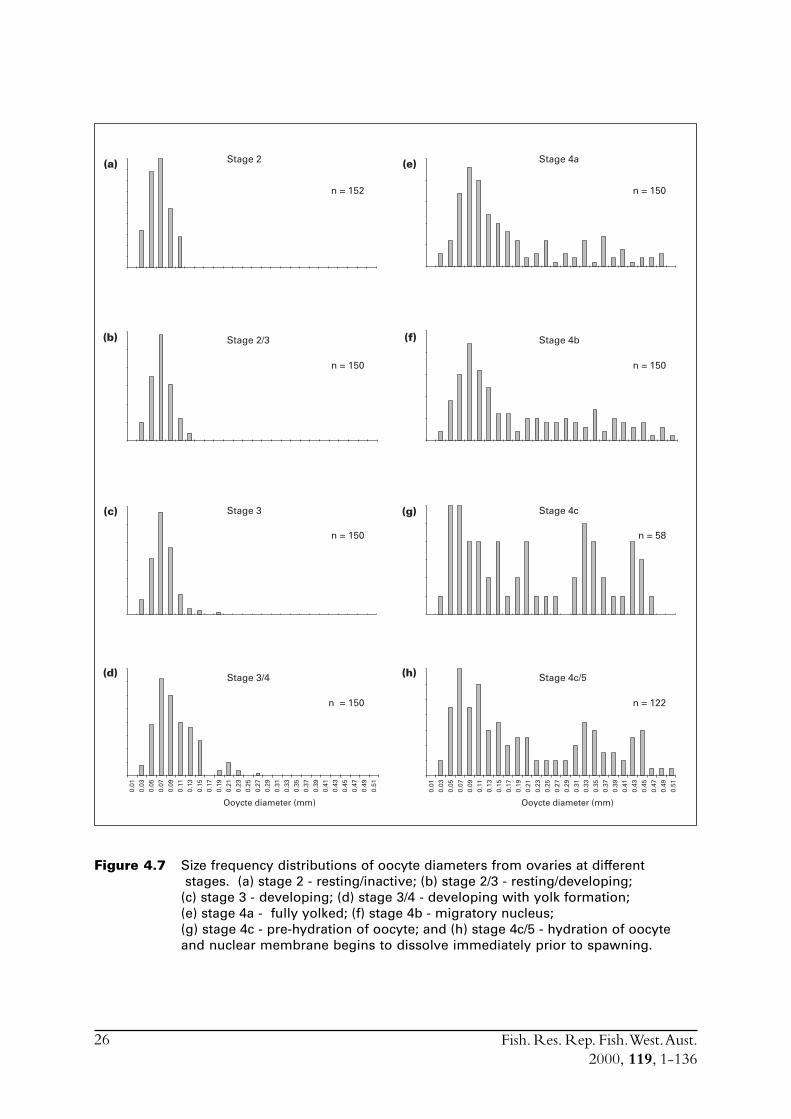
Fish. Res. Rep. Fish. West. Aust.2000, 119, 1-136
26
Figure 4.7 Size frequency distributions of oocyte diameters from ovaries at different stages. (a) stage 2 - resting/inactive; (b) stage 2/3 - resting/developing;(c) stage 3 - developing; (d) stage 3/4 - developing with yolk formation;(e) stage 4a - fully yolked; (f) stage 4b - migratory nucleus;(g) stage 4c - pre-hydration of oocyte; and (h) stage 4c/5 - hydration of oocyteand nuclear membrane begins to dissolve immediately prior to spawning.
Stage 2
n = 152
Stage 4a
n = 150
Stage 2/3
n = 150
Stage 4b
n = 150
Stage 3
n = 150
Stage 4c
n = 58
Stage 3/4
n = 150
Ooycte diameter (mm)
0.01
0.03
0.05
0.07
0.09
0.11
0.13
0.15
0.17
0.19
0.21
0.23
0.25
0.27
0.29
0.31
0.33
0.35
0.37
0.39
0.41
0.43
0.45
0.47
0.49
0.51
Stage 4c/5
n = 122
Ooycte diameter (mm)
0.01
0.03
0.05
0.07
0.09
0.11
0.13
0.15
0.17
0.19
0.21
0.23
0.25
0.27
0.29
0.31
0.33
0.35
0.37
0.39
0.41
0.43
0.45
0.47
0.49
0.51
(b)
(h)
(g)
(f)
(e)
(d)
(c)
(a)
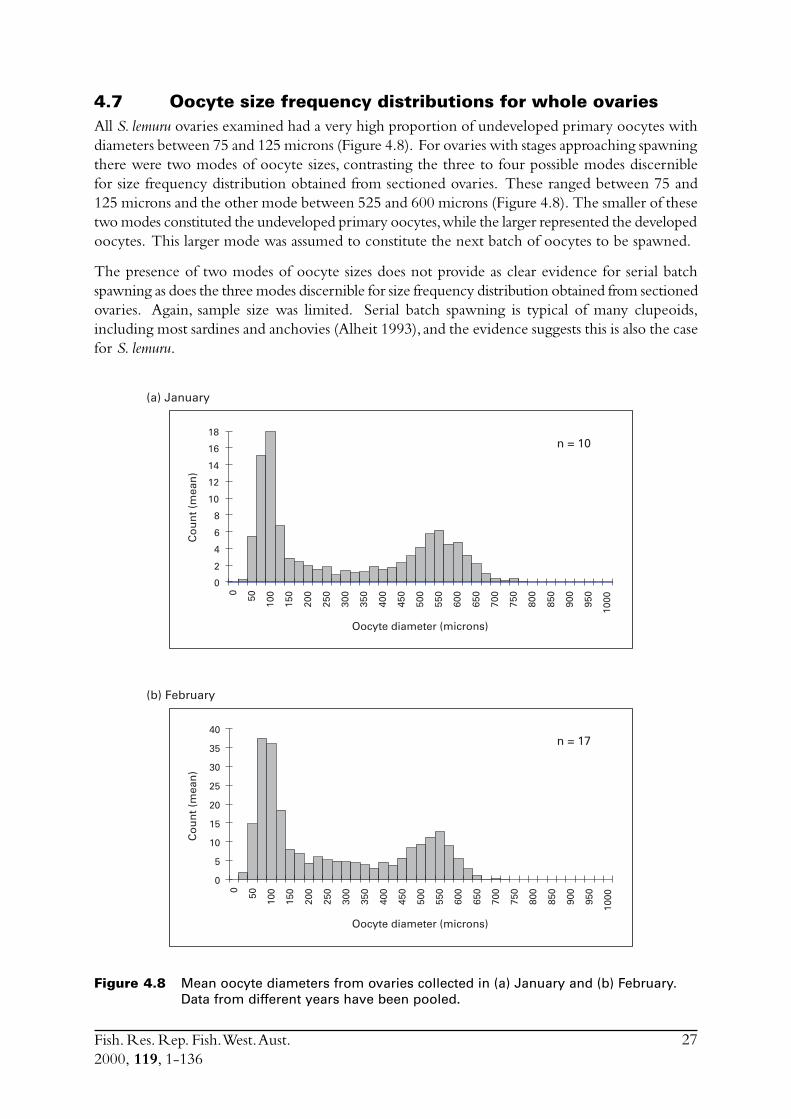
Fish. Res. Rep. Fish. West. Aust.2000, 119, 1-136
27
4.7 Oocyte size frequency distributions for whole ovariesAll S. lemuru ovaries examined had a very high proportion of undeveloped primary oocytes withdiameters between 75 and 125 microns (Figure 4.8). For ovaries with stages approaching spawningthere were two modes of oocyte sizes, contrasting the three to four possible modes discerniblefor size frequency distribution obtained from sectioned ovaries. These ranged between 75 and125 microns and the other mode between 525 and 600 microns (Figure 4.8). The smaller of thesetwo modes constituted the undeveloped primary oocytes, while the larger represented the developedoocytes. This larger mode was assumed to constitute the next batch of oocytes to be spawned.
The presence of two modes of oocyte sizes does not provide as clear evidence for serial batchspawning as does the three modes discernible for size frequency distribution obtained from sectionedovaries. Again, sample size was limited. Serial batch spawning is typical of many clupeoids,including most sardines and anchovies (Alheit 1993), and the evidence suggests this is also the casefor S. lemuru.
(a) January
Oocyte diameter (microns)
n = 10
Co
un
t (m
ean
)
0
2
4
6
8
10
12
14
16
18
0
50
100
150
200
250
300
350
400
450
500
550
600
650
700
750
800
850
900
950
1000
(b) February
Oocyte diameter (microns)
n = 17
Co
un
t (m
ean
)
0
5
10
15
20
25
30
35
40
0
50
100
150
200
250
300
350
400
450
500
550
600
650
700
750
800
850
900
950
1000
Figure 4.8 Mean oocyte diameters from ovaries collected in (a) January and (b) February.Data from different years have been pooled.
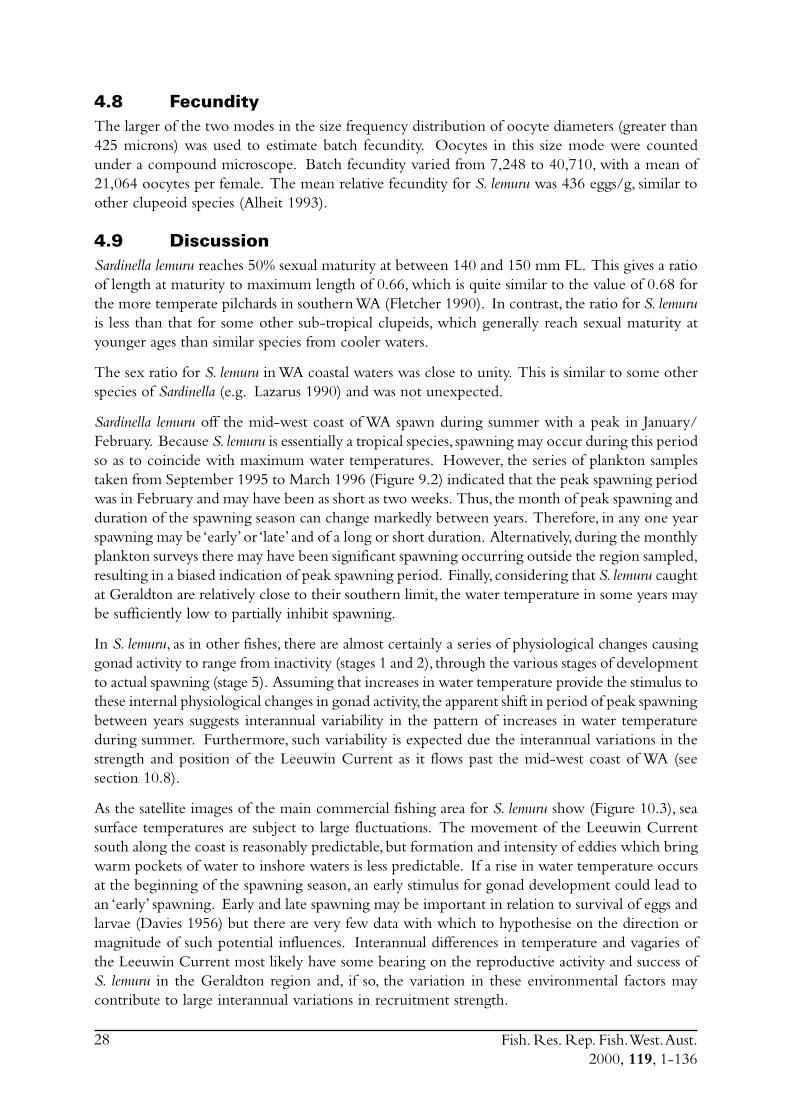
Fish. Res. Rep. Fish. West. Aust.2000, 119, 1-136
28
4.8 FecundityThe larger of the two modes in the size frequency distribution of oocyte diameters (greater than425 microns) was used to estimate batch fecundity. Oocytes in this size mode were countedunder a compound microscope. Batch fecundity varied from 7,248 to 40,710, with a mean of21,064 oocytes per female. The mean relative fecundity for S. lemuru was 436 eggs/g, similar toother clupeoid species (Alheit 1993).
4.9 DiscussionSardinella lemuru reaches 50% sexual maturity at between 140 and 150 mm FL. This gives a ratioof length at maturity to maximum length of 0.66, which is quite similar to the value of 0.68 forthe more temperate pilchards in southern WA (Fletcher 1990). In contrast, the ratio for S. lemuruis less than that for some other sub-tropical clupeids, which generally reach sexual maturity atyounger ages than similar species from cooler waters.
The sex ratio for S. lemuru in WA coastal waters was close to unity. This is similar to some otherspecies of Sardinella (e.g. Lazarus 1990) and was not unexpected.
Sardinella lemuru off the mid-west coast of WA spawn during summer with a peak in January/February. Because S. lemuru is essentially a tropical species, spawning may occur during this periodso as to coincide with maximum water temperatures. However, the series of plankton samplestaken from September 1995 to March 1996 (Figure 9.2) indicated that the peak spawning periodwas in February and may have been as short as two weeks. Thus, the month of peak spawning andduration of the spawning season can change markedly between years. Therefore, in any one yearspawning may be ‘early’ or ‘late’ and of a long or short duration. Alternatively, during the monthlyplankton surveys there may have been significant spawning occurring outside the region sampled,resulting in a biased indication of peak spawning period. Finally, considering that S. lemuru caughtat Geraldton are relatively close to their southern limit, the water temperature in some years maybe sufficiently low to partially inhibit spawning.
In S. lemuru, as in other fishes, there are almost certainly a series of physiological changes causinggonad activity to range from inactivity (stages 1 and 2), through the various stages of developmentto actual spawning (stage 5). Assuming that increases in water temperature provide the stimulus tothese internal physiological changes in gonad activity, the apparent shift in period of peak spawningbetween years suggests interannual variability in the pattern of increases in water temperatureduring summer. Furthermore, such variability is expected due the interannual variations in thestrength and position of the Leeuwin Current as it flows past the mid-west coast of WA (seesection 10.8).
As the satellite images of the main commercial fishing area for S. lemuru show (Figure 10.3), seasurface temperatures are subject to large fluctuations. The movement of the Leeuwin Currentsouth along the coast is reasonably predictable, but formation and intensity of eddies which bringwarm pockets of water to inshore waters is less predictable. If a rise in water temperature occursat the beginning of the spawning season, an early stimulus for gonad development could lead toan ‘early’ spawning. Early and late spawning may be important in relation to survival of eggs andlarvae (Davies 1956) but there are very few data with which to hypothesise on the direction ormagnitude of such potential influences. Interannual differences in temperature and vagaries ofthe Leeuwin Current most likely have some bearing on the reproductive activity and success ofS. lemuru in the Geraldton region and, if so, the variation in these environmental factors maycontribute to large interannual variations in recruitment strength.
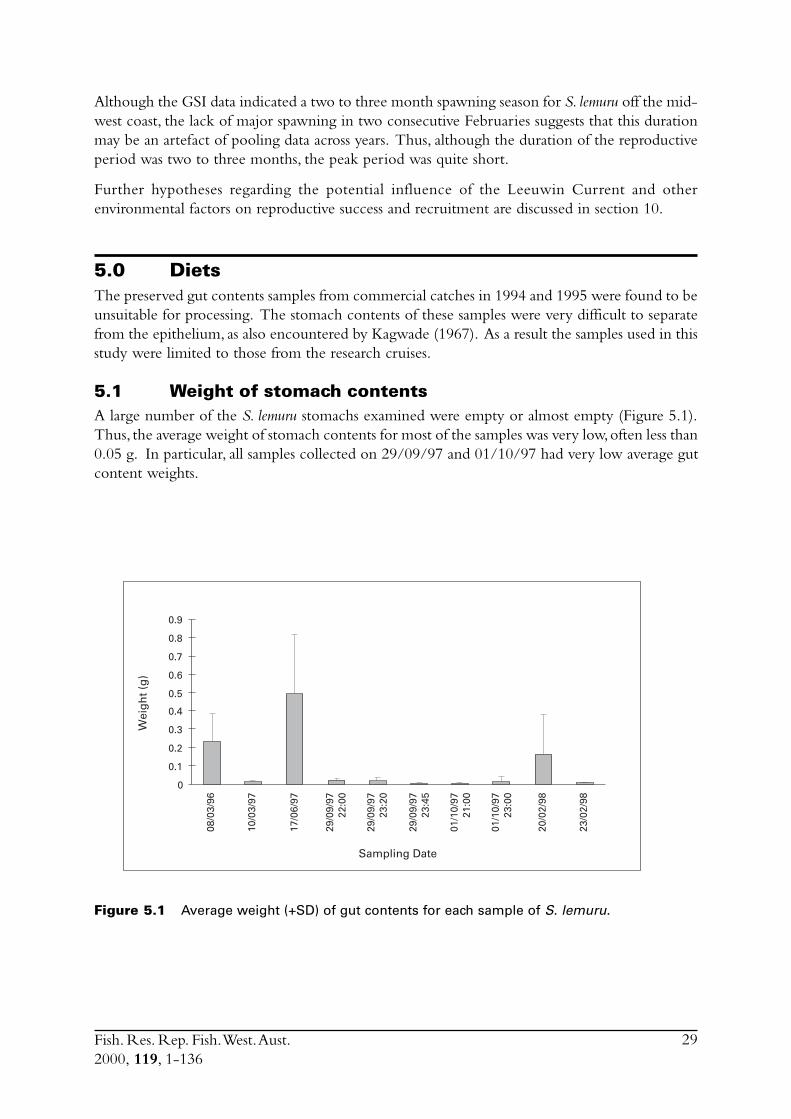
Fish. Res. Rep. Fish. West. Aust.2000, 119, 1-136
29
Although the GSI data indicated a two to three month spawning season for S. lemuru off the mid-west coast, the lack of major spawning in two consecutive Februaries suggests that this durationmay be an artefact of pooling data across years. Thus, although the duration of the reproductiveperiod was two to three months, the peak period was quite short.
Further hypotheses regarding the potential influence of the Leeuwin Current and otherenvironmental factors on reproductive success and recruitment are discussed in section 10.
5.0 DietsThe preserved gut contents samples from commercial catches in 1994 and 1995 were found to beunsuitable for processing. The stomach contents of these samples were very difficult to separatefrom the epithelium, as also encountered by Kagwade (1967). As a result the samples used in thisstudy were limited to those from the research cruises.
5.1 Weight of stomach contentsA large number of the S. lemuru stomachs examined were empty or almost empty (Figure 5.1).Thus, the average weight of stomach contents for most of the samples was very low, often less than0.05 g. In particular, all samples collected on 29/09/97 and 01/10/97 had very low average gutcontent weights.
Figure 5.1 Average weight (+SD) of gut contents for each sample of S. lemuru.
Sampling Date
Wei
gh
t (g
)
0
0.1
0.2
0.3
0.4
0.5
0.6
0.7
0.8
0.9
08/0
3/96
10/0
3/97
17/0
6/97
29/0
9/97
22:0
0
29/0
9/97
23:2
0
29/0
9/97
23:4
5
01/1
0/97
21:0
0
01/1
0/97
23:0
0
20/0
2/98
23/0
2/98
Fish. Res. Rep. Fish. West. Aust.2000, 119, 1-136
30
5.2 Food groupsDue to the large differences in the average weight of stomach contents between samples, theresults are described in terms of relative occurrence of different prey categories. On all but one ofthe sampling occasions, the diet of S. lemuru consisted predominantly of zooplankton and detritus(unidentifiable material) with relatively small quantities of phytoplankton (Figure 5.2).
Figure 5.2 Relative occurrence of the major food categories for S. lemuru.
5.3 PhytoplanktonA large number of genera is consumed by S. lemuru. Each sample had both diatom and dinoflagellategenera present, while blue-green algae was found in the stomach contents on only a few of thesampling occasions, but occurred in all of the fish collected on the 08/03/96. Diatoms of theChaetoceros, Bacteriastrum, Coscinodiscus, Nitzschia, and Thalassiothrix genera were consistently presentin the diet while the dinoflagellate Ceratium lineatum was also usually represented by a few individualsin each stomach.
The stomach contents of the fish collected on the 08/03/96 had a noticeably higher proportionof phytoplankton than those of the other sampling occasions (Figure 5.2). In most cases the dietsof these fish were dominated by diatoms, but in three of the fish the blue-green algae, Trichodesmium,was dominant (Figure 5.3). These differences were not found to be associated with the size of thefish.
Zooplankton
Per
cen
tag
e
0%
20%
40%
60%
80%
100%
08/0
3/96
10/0
3/97
17/0
6/97
29/0
9/97
22:0
0
29/0
9/97
23:2
0
29/0
9/97
23:4
5
01/1
0/97
21:0
0
20/0
2/98
23/0
2/98
Sample date
Detritus Phytoplankton
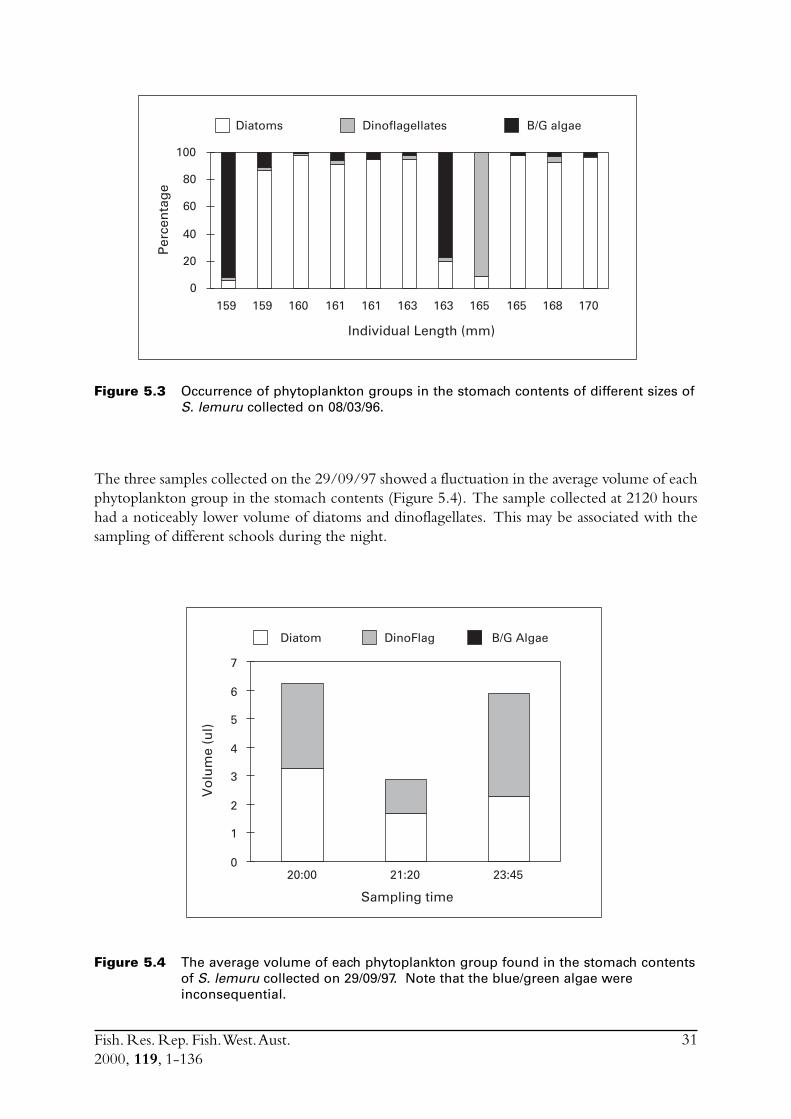
Fish. Res. Rep. Fish. West. Aust.2000, 119, 1-136
31
Figure 5.3 Occurrence of phytoplankton groups in the stomach contents of different sizes ofS. lemuru collected on 08/03/96.
The three samples collected on the 29/09/97 showed a fluctuation in the average volume of eachphytoplankton group in the stomach contents (Figure 5.4). The sample collected at 2120 hourshad a noticeably lower volume of diatoms and dinoflagellates. This may be associated with thesampling of different schools during the night.
159 159 160 161 161 163 163 165 165 168 170
Diatoms Dinoflagellates B/G algae
Per
cen
tag
e
Individual Length (mm)
0
20
40
60
80
100
Figure 5.4 The average volume of each phytoplankton group found in the stomach contentsof S. lemuru collected on 29/09/97. Note that the blue/green algae wereinconsequential.
Sampling time
Vo
lum
e (u
l)
20:00 21:20 23:45
Diatom DinoFlag B/G Algae
0
1
2
3
4
5
6
7
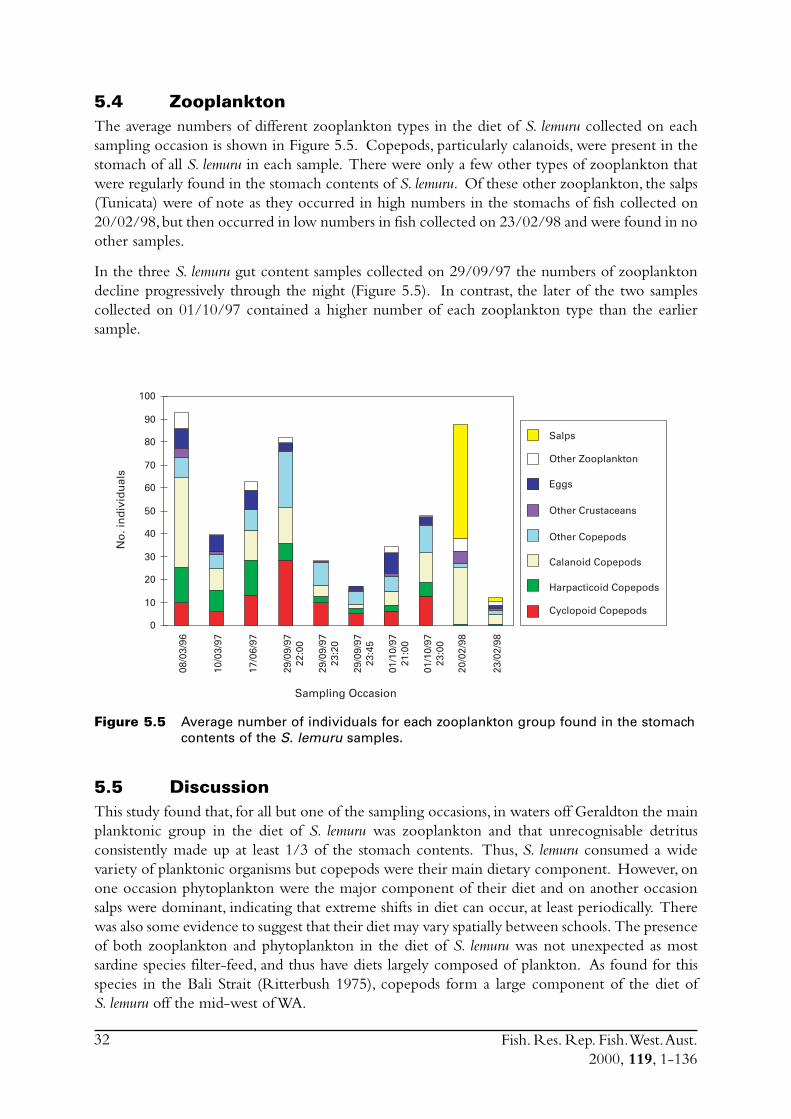
Fish. Res. Rep. Fish. West. Aust.2000, 119, 1-136
32
5.4 ZooplanktonThe average numbers of different zooplankton types in the diet of S. lemuru collected on eachsampling occasion is shown in Figure 5.5. Copepods, particularly calanoids, were present in thestomach of all S. lemuru in each sample. There were only a few other types of zooplankton thatwere regularly found in the stomach contents of S. lemuru. Of these other zooplankton, the salps(Tunicata) were of note as they occurred in high numbers in the stomachs of fish collected on20/02/98, but then occurred in low numbers in fish collected on 23/02/98 and were found in noother samples.
In the three S. lemuru gut content samples collected on 29/09/97 the numbers of zooplanktondecline progressively through the night (Figure 5.5). In contrast, the later of the two samplescollected on 01/10/97 contained a higher number of each zooplankton type than the earliersample.
Figure 5.5 Average number of individuals for each zooplankton group found in the stomachcontents of the S. lemuru samples.
5.5 DiscussionThis study found that, for all but one of the sampling occasions, in waters off Geraldton the mainplanktonic group in the diet of S. lemuru was zooplankton and that unrecognisable detritusconsistently made up at least 1/3 of the stomach contents. Thus, S. lemuru consumed a widevariety of planktonic organisms but copepods were their main dietary component. However, onone occasion phytoplankton were the major component of their diet and on another occasionsalps were dominant, indicating that extreme shifts in diet can occur, at least periodically. Therewas also some evidence to suggest that their diet may vary spatially between schools. The presenceof both zooplankton and phytoplankton in the diet of S. lemuru was not unexpected as mostsardine species filter-feed, and thus have diets largely composed of plankton. As found for thisspecies in the Bali Strait (Ritterbush 1975), copepods form a large component of the diet ofS. lemuru off the mid-west of WA.
0
10
20
30
40
50
60
70
80
90
100
No
. in
div
idu
als
Sampling Occasion
08/0
3/96
10/0
3/97
17/0
6/97
29/0
9/97
22:0
0
29/0
9/97
23:2
0
29/0
9/97
23:4
5
01/1
0/97
21:0
0
01/1
0/97
23:0
0
20/0
2/98
23/0
2/98
Salps
Other Zooplankton
Eggs
Other Crustaceans
Other Copepods
Calanoid Copepods
Harpacticoid Copepods
Cyclopoid Copepods
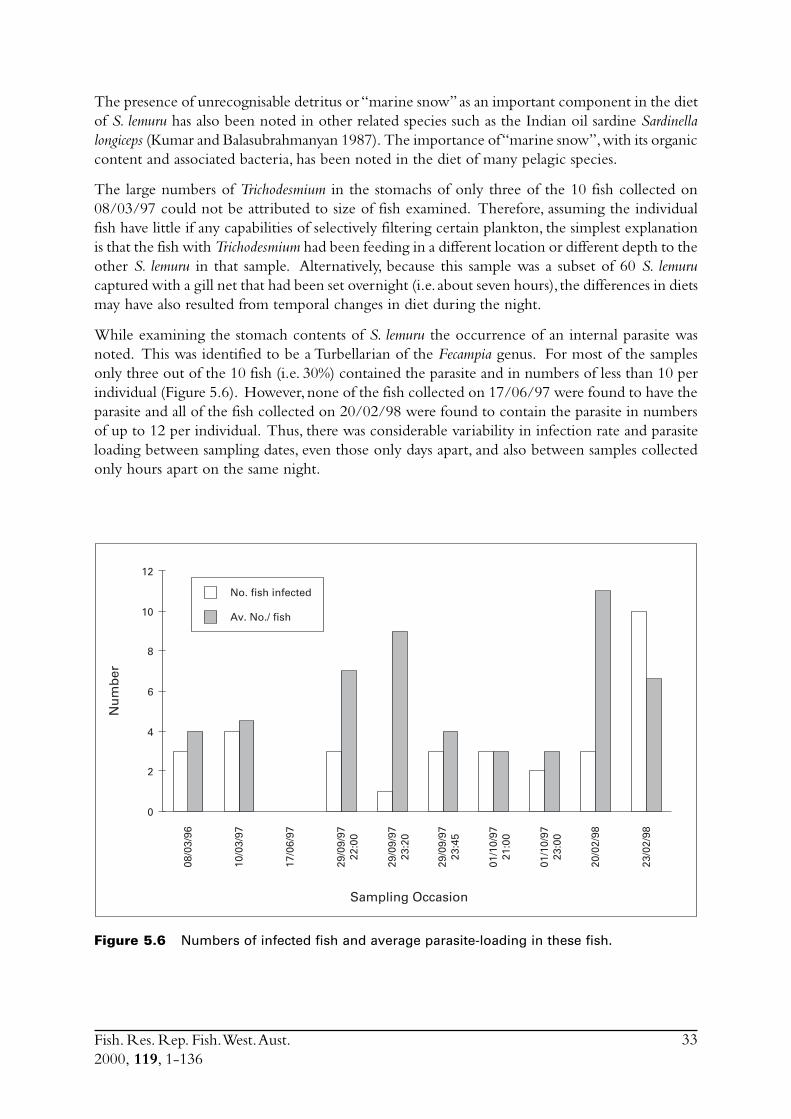
Fish. Res. Rep. Fish. West. Aust.2000, 119, 1-136
33
The presence of unrecognisable detritus or “marine snow” as an important component in the dietof S. lemuru has also been noted in other related species such as the Indian oil sardine Sardinellalongiceps (Kumar and Balasubrahmanyan 1987). The importance of “marine snow”, with its organiccontent and associated bacteria, has been noted in the diet of many pelagic species.
The large numbers of Trichodesmium in the stomachs of only three of the 10 fish collected on08/03/97 could not be attributed to size of fish examined. Therefore, assuming the individualfish have little if any capabilities of selectively filtering certain plankton, the simplest explanationis that the fish with Trichodesmium had been feeding in a different location or different depth to theother S. lemuru in that sample. Alternatively, because this sample was a subset of 60 S. lemurucaptured with a gill net that had been set overnight (i.e. about seven hours), the differences in dietsmay have also resulted from temporal changes in diet during the night.
While examining the stomach contents of S. lemuru the occurrence of an internal parasite wasnoted. This was identified to be a Turbellarian of the Fecampia genus. For most of the samplesonly three out of the 10 fish (i.e. 30%) contained the parasite and in numbers of less than 10 perindividual (Figure 5.6). However, none of the fish collected on 17/06/97 were found to have theparasite and all of the fish collected on 20/02/98 were found to contain the parasite in numbersof up to 12 per individual. Thus, there was considerable variability in infection rate and parasiteloading between sampling dates, even those only days apart, and also between samples collectedonly hours apart on the same night.
Figure 5.6 Numbers of infected fish and average parasite-loading in these fish.
Sampling Occasion
Nu
mb
er
08/0
3/96
10/0
3/97
17/0
6/97
29/0
9/97
22:0
0
29/0
9/97
23:2
0
29/0
9/97
23:4
5
01/1
0/97
21:0
0
01/1
0/97
23:0
0
20/0
2/98
23/0
2/98
0
2
4
6
8
10
12
No. fish infected
Av. No./ fish
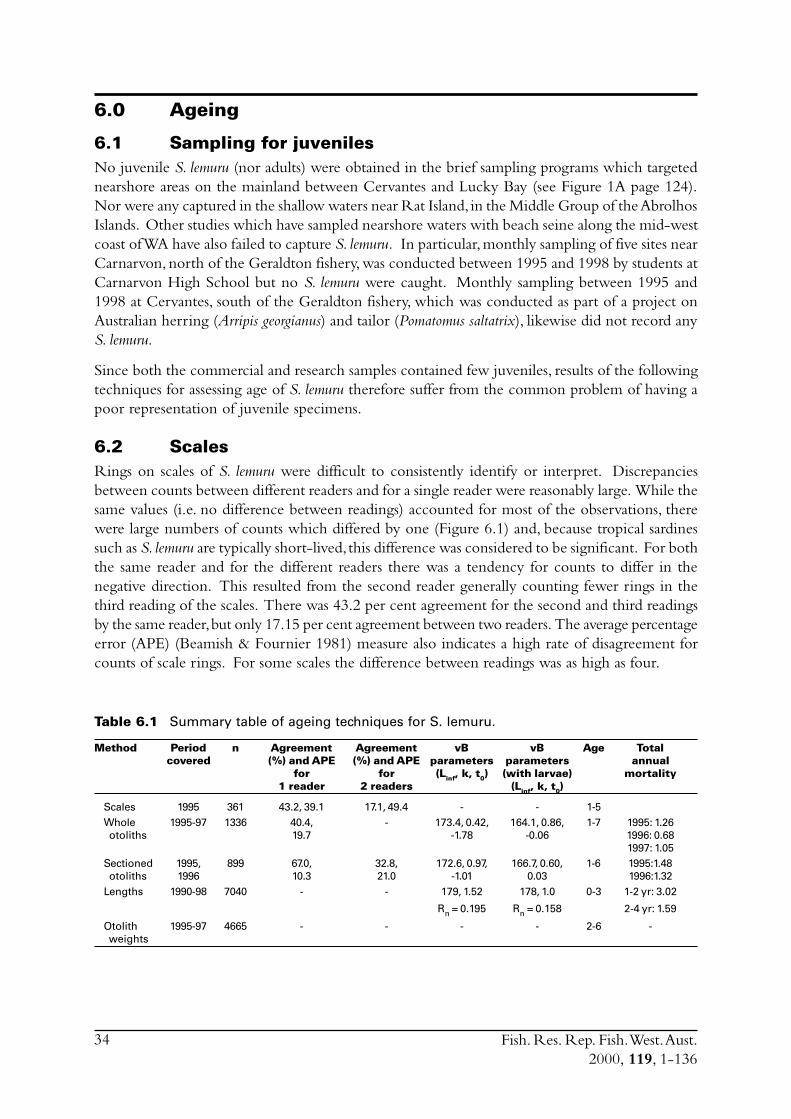
Fish. Res. Rep. Fish. West. Aust.2000, 119, 1-136
34
6.0 Ageing
6.1 Sampling for juvenilesNo juvenile S. lemuru (nor adults) were obtained in the brief sampling programs which targetednearshore areas on the mainland between Cervantes and Lucky Bay (see Figure 1A page 124).Nor were any captured in the shallow waters near Rat Island, in the Middle Group of the AbrolhosIslands. Other studies which have sampled nearshore waters with beach seine along the mid-westcoast of WA have also failed to capture S. lemuru. In particular, monthly sampling of five sites nearCarnarvon, north of the Geraldton fishery, was conducted between 1995 and 1998 by students atCarnarvon High School but no S. lemuru were caught. Monthly sampling between 1995 and1998 at Cervantes, south of the Geraldton fishery, which was conducted as part of a project onAustralian herring (Arripis georgianus) and tailor (Pomatomus saltatrix), likewise did not record anyS. lemuru.
Since both the commercial and research samples contained few juveniles, results of the followingtechniques for assessing age of S. lemuru therefore suffer from the common problem of having apoor representation of juvenile specimens.
6.2 ScalesRings on scales of S. lemuru were difficult to consistently identify or interpret. Discrepanciesbetween counts between different readers and for a single reader were reasonably large. While thesame values (i.e. no difference between readings) accounted for most of the observations, therewere large numbers of counts which differed by one (Figure 6.1) and, because tropical sardinessuch as S. lemuru are typically short-lived, this difference was considered to be significant. For boththe same reader and for the different readers there was a tendency for counts to differ in thenegative direction. This resulted from the second reader generally counting fewer rings in thethird reading of the scales. There was 43.2 per cent agreement for the second and third readingsby the same reader, but only 17.15 per cent agreement between two readers. The average percentageerror (APE) (Beamish & Fournier 1981) measure also indicates a high rate of disagreement forcounts of scale rings. For some scales the difference between readings was as high as four.
Table 6.1 Summary table of ageing techniques for S. lemuru.
Method Period n Agreement Agreement vB vB Age Totalcovered (%) and APE (%) and APE parameters parameters annual
for for (Linf, k, t0) (with larvae) mortality1 reader 2 readers (Linf, k, t0)
Scales 1995 361 43.2, 39.1 17.1, 49.4 - - 1-5Whole 1995-97 1336 40.4, - 173.4, 0.42, 164.1, 0.86, 1-7 1995: 1.26 otoliths 19.7 -1.78 -0.06 1996: 0.68
1997: 1.05Sectioned 1995, 899 67.0, 32.8, 172.6, 0.97, 166.7, 0.60, 1-6 1995:1.48 otoliths 1996 10.3 21.0 -1.01 0.03 1996:1.32Lengths 1990-98 7040 - - 179, 1.52 178, 1.0 0-3 1-2 yr: 3.02
Rn = 0.195 Rn = 0.158 2-4 yr: 1.59
Otolith 1995-97 4665 - - - - 2-6 - weights
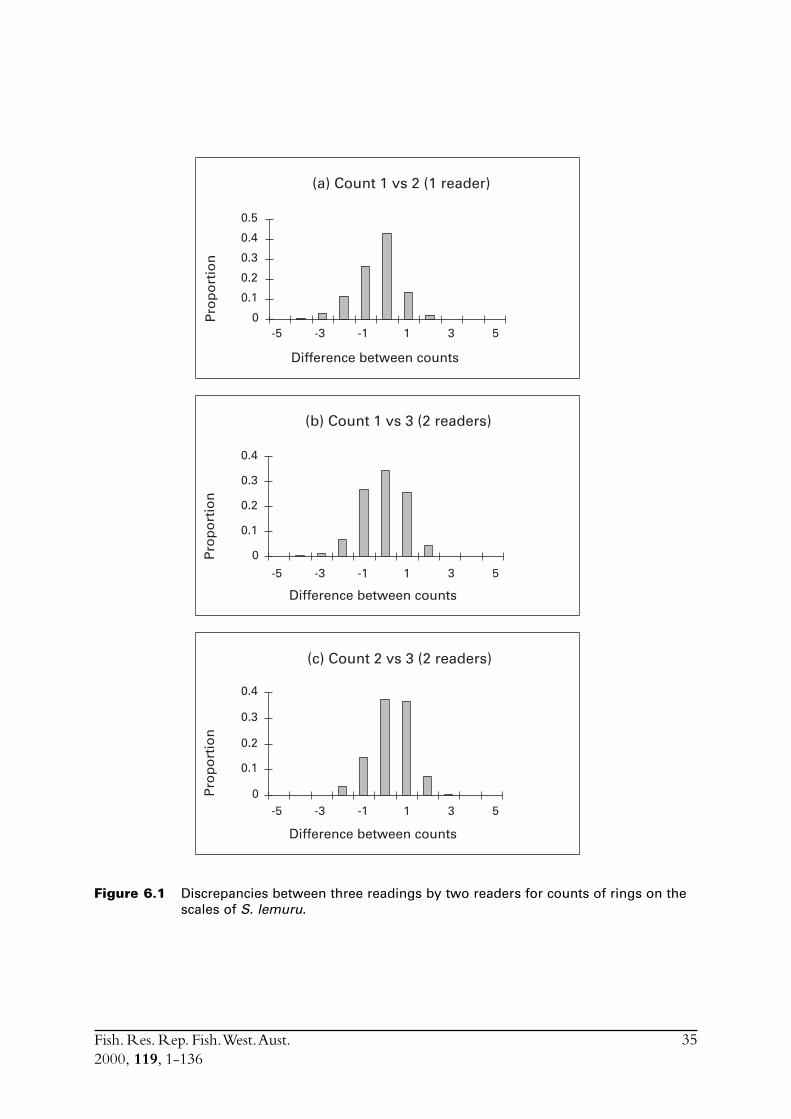
Fish. Res. Rep. Fish. West. Aust.2000, 119, 1-136
35
Figure 6.1 Discrepancies between three readings by two readers for counts of rings on thescales of S. lemuru.
Difference between counts
Pro
po
rtio
n
Difference between counts
Pro
po
rtio
n
Difference between counts
Pro
po
rtio
n
(a) Count 1 vs 2 (1 reader)
(b) Count 1 vs 3 (2 readers)
(c) Count 2 vs 3 (2 readers)
0
0.1
0.2
0.3
0.4
0.5
0
0.1
0.2
0.3
0.4
0
0.1
0.2
0.3
0.4
-5 -3 -1 1 3 5
-5 -3 -1 1 3 5
-5 -3 -1 1 3 5
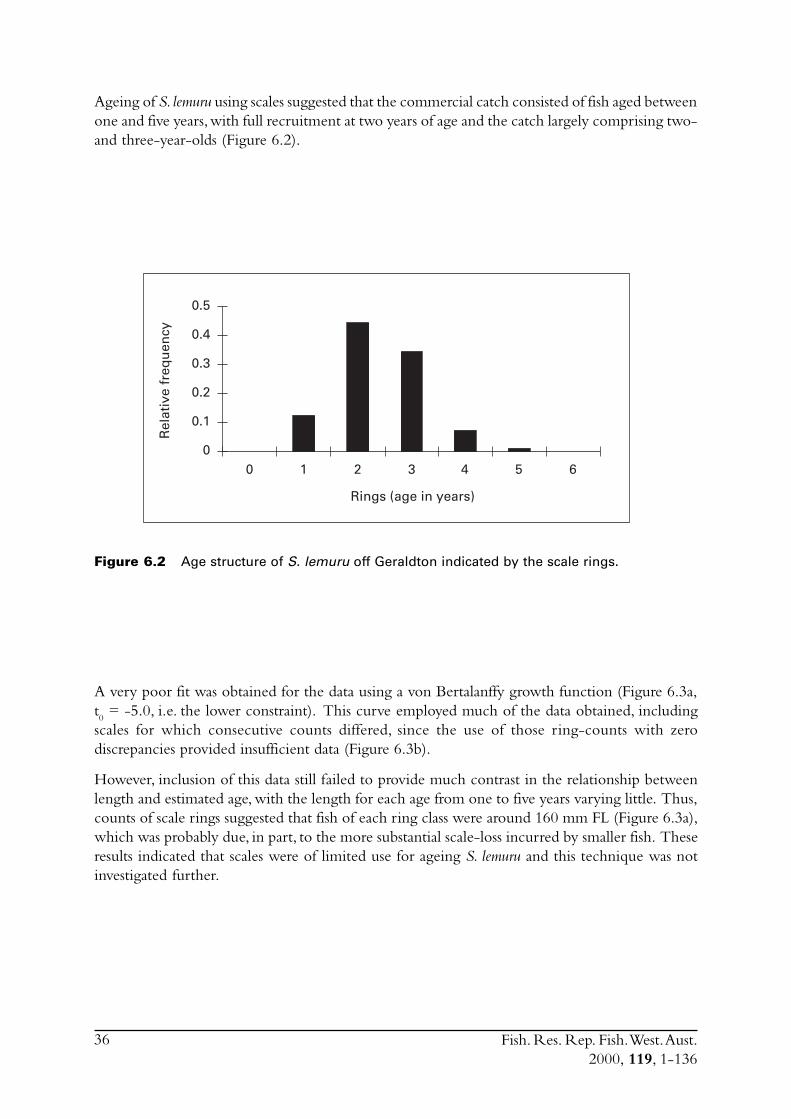
Fish. Res. Rep. Fish. West. Aust.2000, 119, 1-136
36
Ageing of S. lemuru using scales suggested that the commercial catch consisted of fish aged betweenone and five years, with full recruitment at two years of age and the catch largely comprising two-and three-year-olds (Figure 6.2).
Figure 6.2 Age structure of S. lemuru off Geraldton indicated by the scale rings.
Rings (age in years)
Rel
ativ
e fr
equ
ency
0 1 2 3 4 5 60
0.1
0.2
0.3
0.4
0.5
A very poor fit was obtained for the data using a von Bertalanffy growth function (Figure 6.3a,t0 = -5.0, i.e. the lower constraint). This curve employed much of the data obtained, including
scales for which consecutive counts differed, since the use of those ring-counts with zerodiscrepancies provided insufficient data (Figure 6.3b).
However, inclusion of this data still failed to provide much contrast in the relationship betweenlength and estimated age, with the length for each age from one to five years varying little. Thus,counts of scale rings suggested that fish of each ring class were around 160 mm FL (Figure 6.3a),which was probably due, in part, to the more substantial scale-loss incurred by smaller fish. Theseresults indicated that scales were of limited use for ageing S. lemuru and this technique was notinvestigated further.
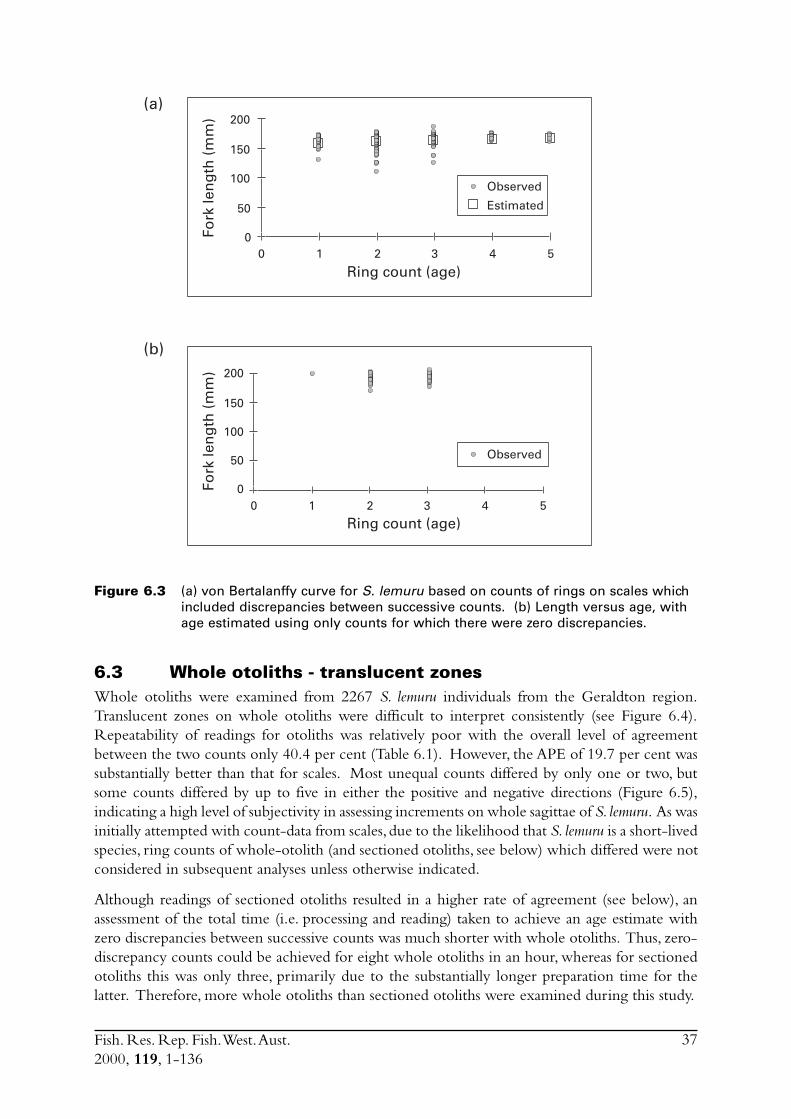
Fish. Res. Rep. Fish. West. Aust.2000, 119, 1-136
37
Figure 6.3 (a) von Bertalanffy curve for S. lemuru based on counts of rings on scales whichincluded discrepancies between successive counts. (b) Length versus age, withage estimated using only counts for which there were zero discrepancies.
6.3 Whole otoliths - translucent zonesWhole otoliths were examined from 2267 S. lemuru individuals from the Geraldton region.Translucent zones on whole otoliths were difficult to interpret consistently (see Figure 6.4).Repeatability of readings for otoliths was relatively poor with the overall level of agreementbetween the two counts only 40.4 per cent (Table 6.1). However, the APE of 19.7 per cent wassubstantially better than that for scales. Most unequal counts differed by only one or two, butsome counts differed by up to five in either the positive and negative directions (Figure 6.5),indicating a high level of subjectivity in assessing increments on whole sagittae of S. lemuru. As wasinitially attempted with count-data from scales, due to the likelihood that S. lemuru is a short-livedspecies, ring counts of whole-otolith (and sectioned otoliths, see below) which differed were notconsidered in subsequent analyses unless otherwise indicated.
Although readings of sectioned otoliths resulted in a higher rate of agreement (see below), anassessment of the total time (i.e. processing and reading) taken to achieve an age estimate withzero discrepancies between successive counts was much shorter with whole otoliths. Thus, zero-discrepancy counts could be achieved for eight whole otoliths in an hour, whereas for sectionedotoliths this was only three, primarily due to the substantially longer preparation time for thelatter. Therefore, more whole otoliths than sectioned otoliths were examined during this study.
Fork
len
gth
(m
m)
Fork
len
gth
(m
m)
Observed
Estimated
Observed
Ring count (age)
Ring count (age)
0
50
100
150
200
0
50
100
150
200
0 1 2 3 4 5
(a)
(b)
0 1 2 3 4 5
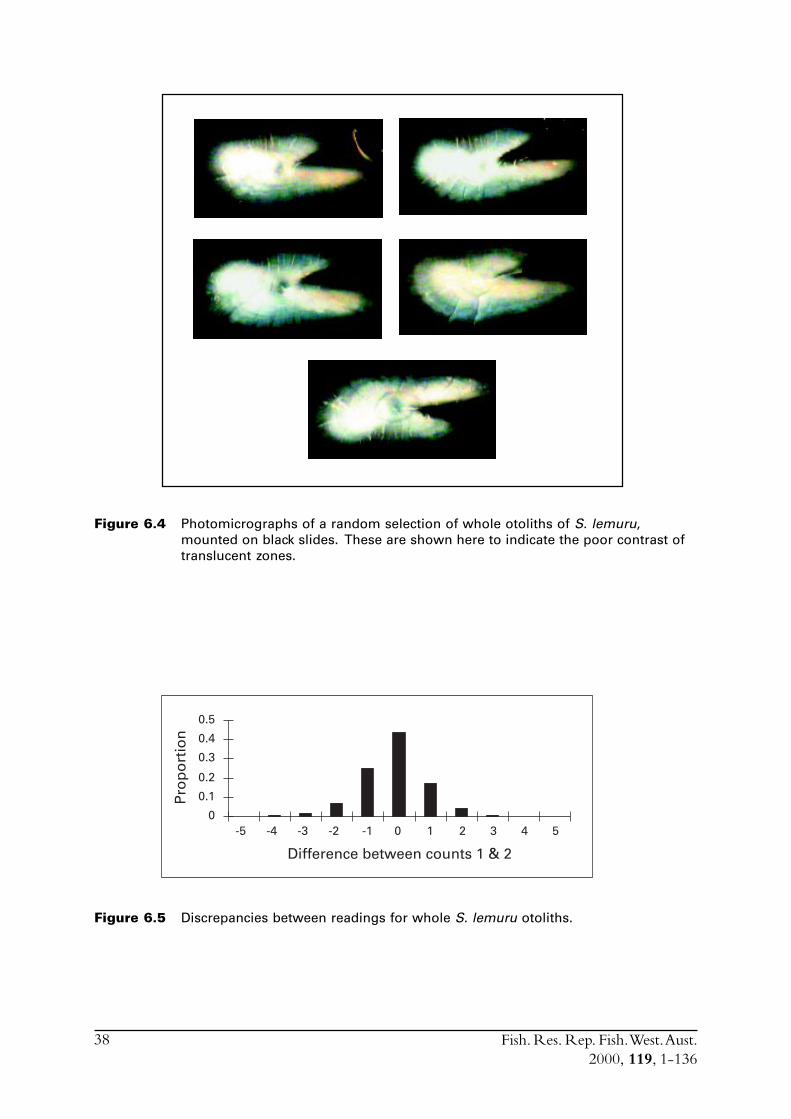
Fish. Res. Rep. Fish. West. Aust.2000, 119, 1-136
38
Figure 6.4 Photomicrographs of a random selection of whole otoliths of S. lemuru,mounted on black slides. These are shown here to indicate the poor contrast oftranslucent zones.
Figure 6.5 Discrepancies between readings for whole S. lemuru otoliths.
Difference between counts 1 & 2
Pro
po
rtio
n
-5 -4 -3 -2 -1 0 1 2 3 4 50
0.1
0.2
0.3
0.4
0.5
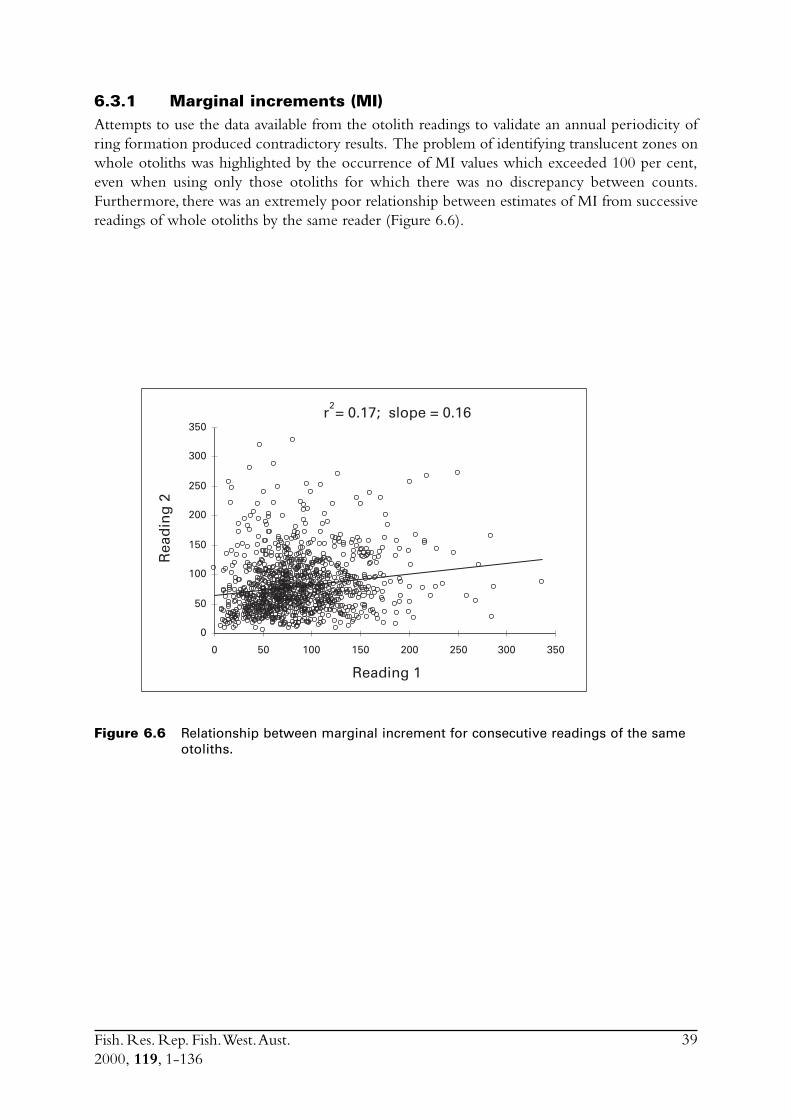
Fish. Res. Rep. Fish. West. Aust.2000, 119, 1-136
39
6.3.1 Marginal increments (MI)Attempts to use the data available from the otolith readings to validate an annual periodicity ofring formation produced contradictory results. The problem of identifying translucent zones onwhole otoliths was highlighted by the occurrence of MI values which exceeded 100 per cent,even when using only those otoliths for which there was no discrepancy between counts.Furthermore, there was an extremely poor relationship between estimates of MI from successivereadings of whole otoliths by the same reader (Figure 6.6).
Figure 6.6 Relationship between marginal increment for consecutive readings of the sameotoliths.
Reading 1
Rea
din
g 2
r2= 0.17; slope = 0.16
0 50 100 150 200 250 300 350
0
50
100
150
200
250
300
350
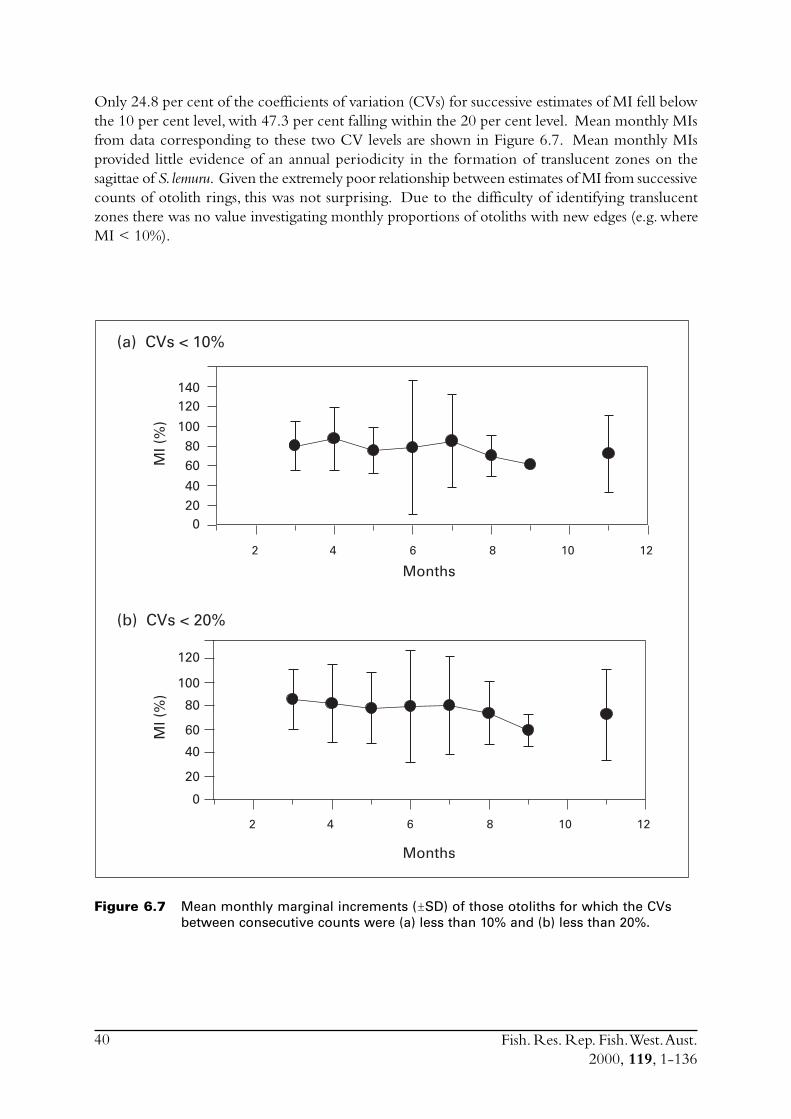
Fish. Res. Rep. Fish. West. Aust.2000, 119, 1-136
40
Only 24.8 per cent of the coefficients of variation (CVs) for successive estimates of MI fell belowthe 10 per cent level, with 47.3 per cent falling within the 20 per cent level. Mean monthly MIsfrom data corresponding to these two CV levels are shown in Figure 6.7. Mean monthly MIsprovided little evidence of an annual periodicity in the formation of translucent zones on thesagittae of S. lemuru. Given the extremely poor relationship between estimates of MI from successivecounts of otolith rings, this was not surprising. Due to the difficulty of identifying translucentzones there was no value investigating monthly proportions of otoliths with new edges (e.g. whereMI < 10%).
2 4 6 8 10 12
140120
1008060
40200
2 4 6 8 10 12
120
100
80
60
40
20
0
MI (
%)
MI (
%)
Months
Months
(a) CVs < 10%
(b) CVs < 20%
Figure 6.7 Mean monthly marginal increments (ñSD) of those otoliths for which the CVsbetween consecutive counts were (a) less than 10% and (b) less than 20%.
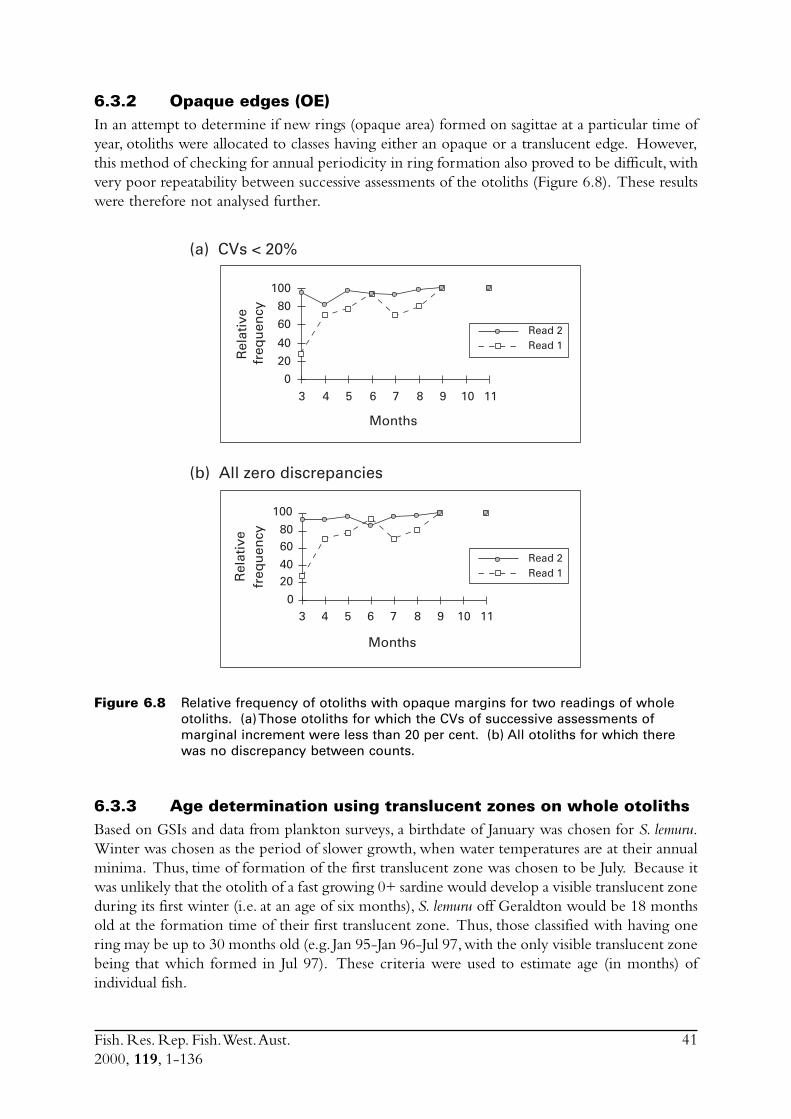
Fish. Res. Rep. Fish. West. Aust.2000, 119, 1-136
41
6.3.2 Opaque edges (OE)In an attempt to determine if new rings (opaque area) formed on sagittae at a particular time ofyear, otoliths were allocated to classes having either an opaque or a translucent edge. However,this method of checking for annual periodicity in ring formation also proved to be difficult, withvery poor repeatability between successive assessments of the otoliths (Figure 6.8). These resultswere therefore not analysed further.
Rel
ativ
e fr
equ
ency
Rel
ativ
e fr
equ
ency
Months
Months
(a) CVs < 20%
(b) All zero discrepancies
0
20
40
60
80
100
3 4 5 6 7 8 9 10 11
0
2040
6080
100
3 4 5 6 7 8 9 10 11
Read 2Read 1
Read 2Read 1
Figure 6.8 Relative frequency of otoliths with opaque margins for two readings of wholeotoliths. (a) Those otoliths for which the CVs of successive assessments ofmarginal increment were less than 20 per cent. (b) All otoliths for which therewas no discrepancy between counts.
6.3.3 Age determination using translucent zones on whole otolithsBased on GSIs and data from plankton surveys, a birthdate of January was chosen for S. lemuru.Winter was chosen as the period of slower growth, when water temperatures are at their annualminima. Thus, time of formation of the first translucent zone was chosen to be July. Because itwas unlikely that the otolith of a fast growing 0+ sardine would develop a visible translucent zoneduring its first winter (i.e. at an age of six months), S. lemuru off Geraldton would be 18 monthsold at the formation time of their first translucent zone. Thus, those classified with having onering may be up to 30 months old (e.g. Jan 95-Jan 96-Jul 97, with the only visible translucent zonebeing that which formed in Jul 97). These criteria were used to estimate age (in months) ofindividual fish.
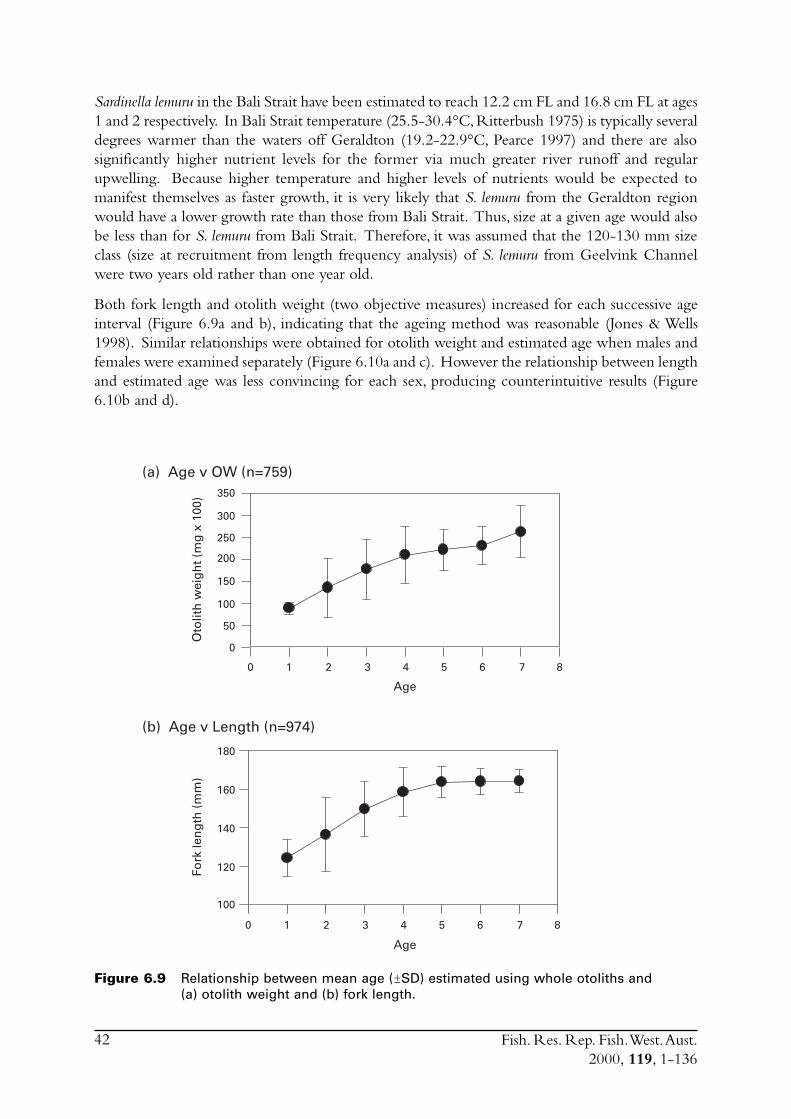
Fish. Res. Rep. Fish. West. Aust.2000, 119, 1-136
42
Sardinella lemuru in the Bali Strait have been estimated to reach 12.2 cm FL and 16.8 cm FL at ages1 and 2 respectively. In Bali Strait temperature (25.5-30.4°C, Ritterbush 1975) is typically severaldegrees warmer than the waters off Geraldton (19.2-22.9°C, Pearce 1997) and there are alsosignificantly higher nutrient levels for the former via much greater river runoff and regularupwelling. Because higher temperature and higher levels of nutrients would be expected tomanifest themselves as faster growth, it is very likely that S. lemuru from the Geraldton regionwould have a lower growth rate than those from Bali Strait. Thus, size at a given age would alsobe less than for S. lemuru from Bali Strait. Therefore, it was assumed that the 120-130 mm sizeclass (size at recruitment from length frequency analysis) of S. lemuru from Geelvink Channelwere two years old rather than one year old.
Both fork length and otolith weight (two objective measures) increased for each successive ageinterval (Figure 6.9a and b), indicating that the ageing method was reasonable (Jones & Wells1998). Similar relationships were obtained for otolith weight and estimated age when males andfemales were examined separately (Figure 6.10a and c). However the relationship between lengthand estimated age was less convincing for each sex, producing counterintuitive results (Figure6.10b and d).
Figure 6.9 Relationship between mean age (ñSD) estimated using whole otoliths and(a) otolith weight and (b) fork length.
Oto
lith
wei
gh
t (m
g x
100
) 350
300
250
200
150
100
50
0
10 2 3 4 5 6 7 8
Age
Fork
len
gth
(m
m)
180
160
140
120
100
10 2 3 4 5 6 7 8
Age
(a) Age v OW (n=759)
(b) Age v Length (n=974)
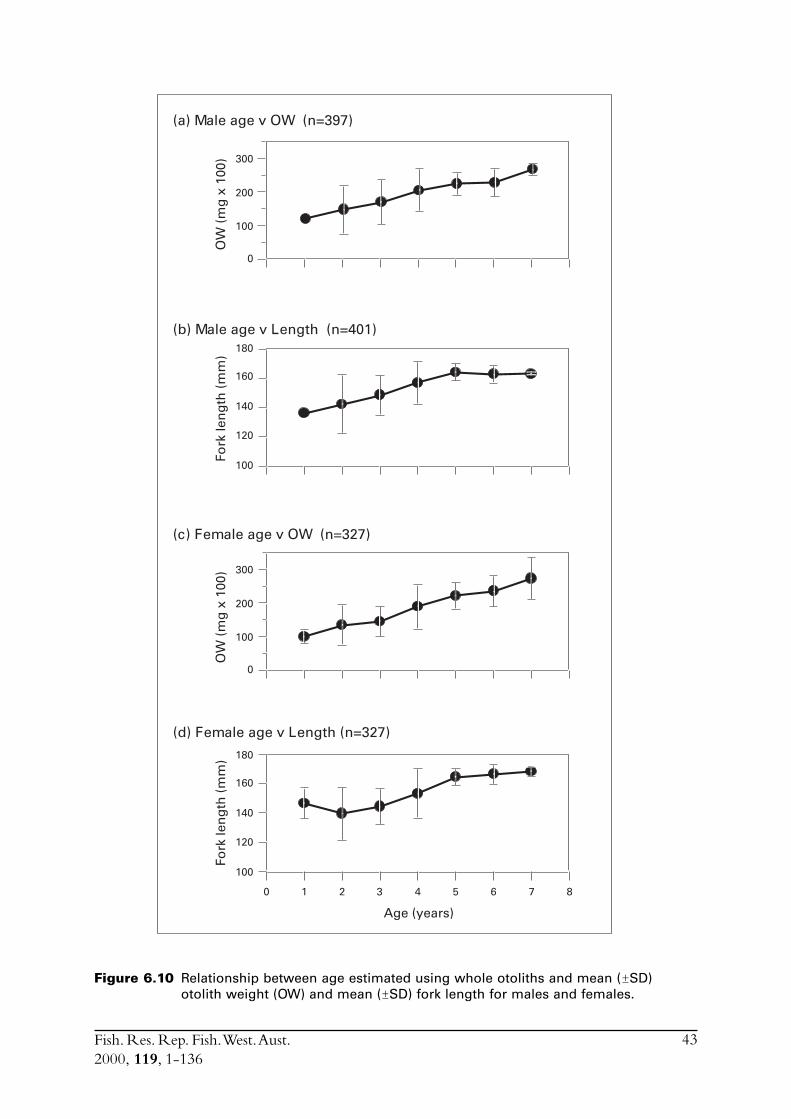
Fish. Res. Rep. Fish. West. Aust.2000, 119, 1-136
43
Figure 6.10 Relationship between age estimated using whole otoliths and mean (ñSD)otolith weight (OW) and mean (ñSD) fork length for males and females.
(d) Female age v Length (n=327)
(c) Female age v OW (n=327)
(b) Male age v Length (n=401)
(a) Male age v OW (n=397)
OW
(m
g x
100
)O
W (
mg
x 1
00)
Fork
len
gth
(m
m)
Fork
len
gth
(m
m)
Age (years)
0 1 2 3 4 5 6 7 8
180
160
140
120
100
180
160
140
120
100
300
200
100
0
300
200
100
0
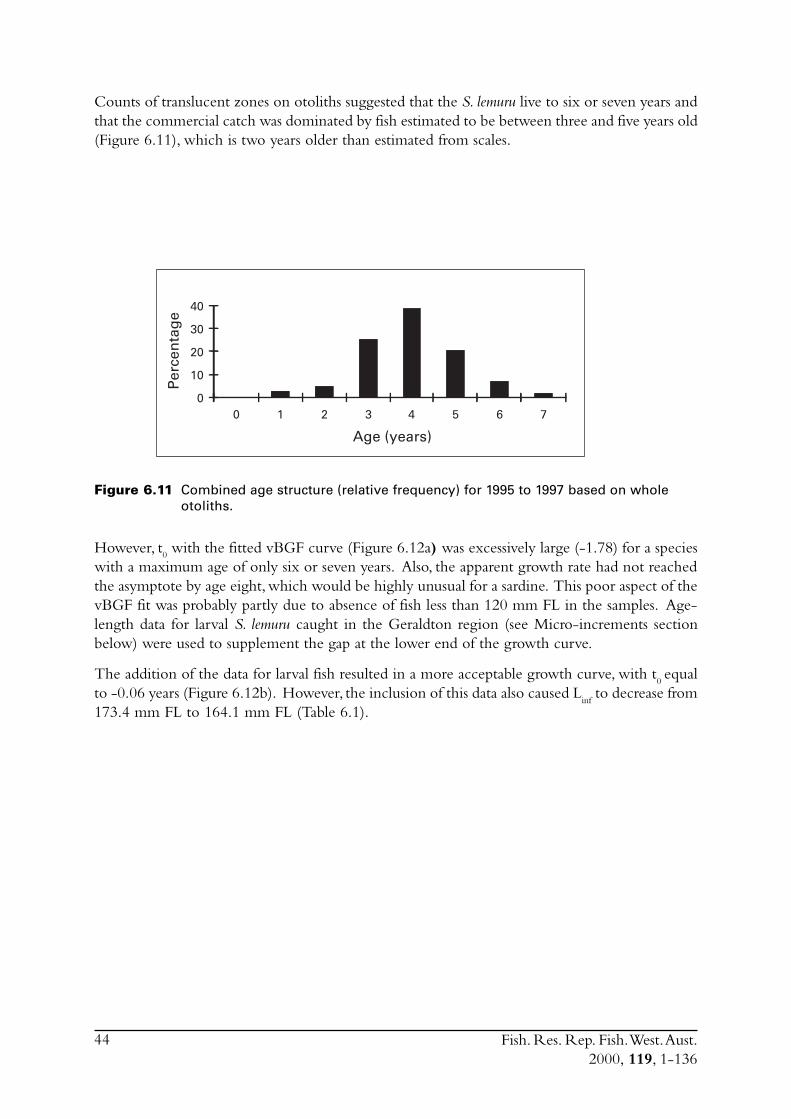
Fish. Res. Rep. Fish. West. Aust.2000, 119, 1-136
44
Counts of translucent zones on otoliths suggested that the S. lemuru live to six or seven years andthat the commercial catch was dominated by fish estimated to be between three and five years old(Figure 6.11), which is two years older than estimated from scales.
Figure 6.11 Combined age structure (relative frequency) for 1995 to 1997 based on wholeotoliths.
However, t0 with the fitted vBGF curve (Figure 6.12a) was excessively large (-1.78) for a species
with a maximum age of only six or seven years. Also, the apparent growth rate had not reachedthe asymptote by age eight, which would be highly unusual for a sardine. This poor aspect of thevBGF fit was probably partly due to absence of fish less than 120 mm FL in the samples. Age-length data for larval S. lemuru caught in the Geraldton region (see Micro-increments sectionbelow) were used to supplement the gap at the lower end of the growth curve.
The addition of the data for larval fish resulted in a more acceptable growth curve, with t0 equal
to -0.06 years (Figure 6.12b). However, the inclusion of this data also caused Linf
to decrease from173.4 mm FL to 164.1 mm FL (Table 6.1).
Age (years)
Per
cen
tag
e
0 1 2 3 4 5 6 70
10
20
30
40
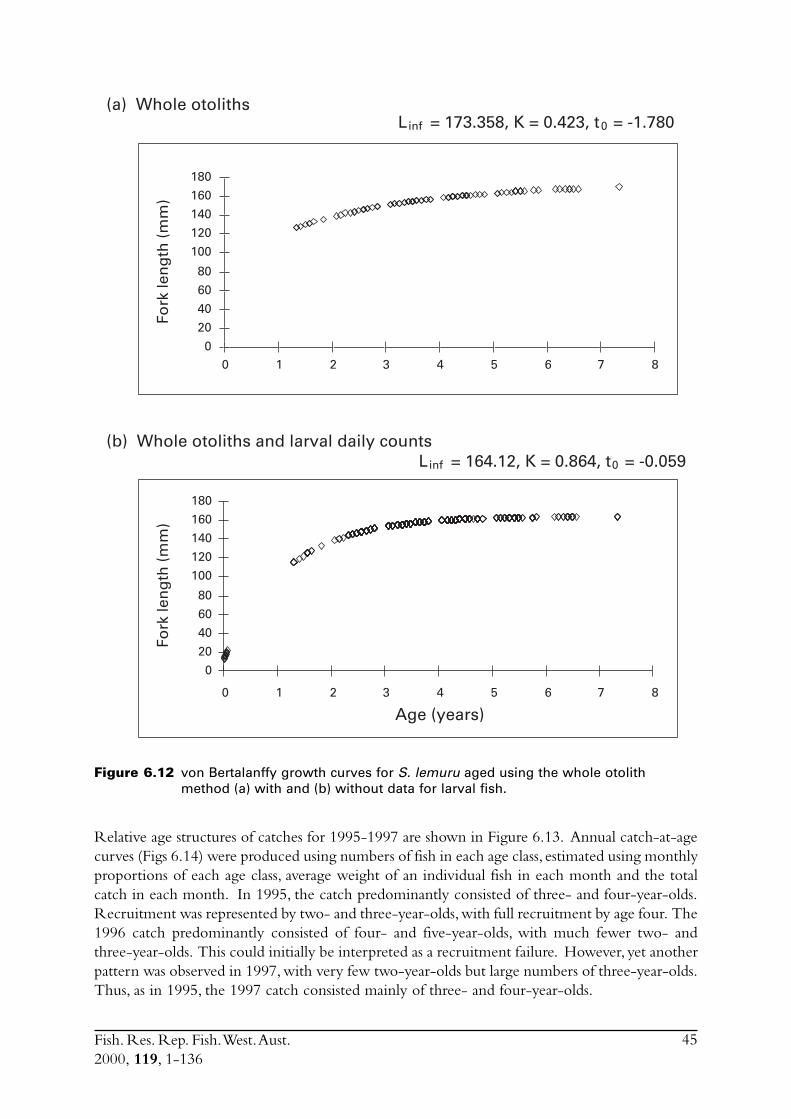
Fish. Res. Rep. Fish. West. Aust.2000, 119, 1-136
45
Figure 6.12 von Bertalanffy growth curves for S. lemuru aged using the whole otolithmethod (a) with and (b) without data for larval fish.
Relative age structures of catches for 1995-1997 are shown in Figure 6.13. Annual catch-at-agecurves (Figs 6.14) were produced using numbers of fish in each age class, estimated using monthlyproportions of each age class, average weight of an individual fish in each month and the totalcatch in each month. In 1995, the catch predominantly consisted of three- and four-year-olds.Recruitment was represented by two- and three-year-olds, with full recruitment by age four. The1996 catch predominantly consisted of four- and five-year-olds, with much fewer two- andthree-year-olds. This could initially be interpreted as a recruitment failure. However, yet anotherpattern was observed in 1997, with very few two-year-olds but large numbers of three-year-olds.Thus, as in 1995, the 1997 catch consisted mainly of three- and four-year-olds.
Fork
len
gth
(m
m)
Fork
len
gth
(m
m)
0
20
40
60
80
100
120
140
160
180
0
20
40
60
80
100
120
140
160
180
0 1 2 3 4 5 6 7 8
0 1 2 3 4 5 6 7 8
Linf = 173.358, K = 0.423, t0 = -1.780
Linf = 164.12, K = 0.864, t = -0.059 0
Age (years)
(b) Whole otoliths and larval daily counts
(a) Whole otoliths
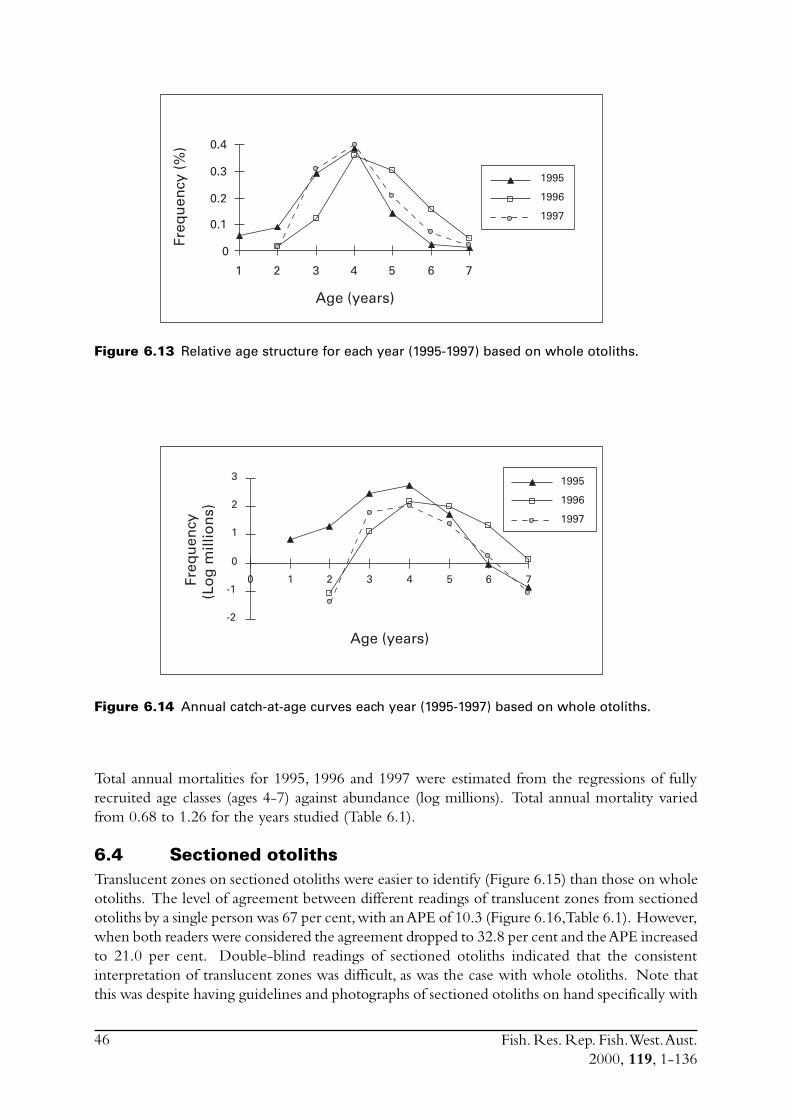
Fish. Res. Rep. Fish. West. Aust.2000, 119, 1-136
46
Figure 6.13 Relative age structure for each year (1995-1997) based on whole otoliths.
Figure 6.14 Annual catch-at-age curves each year (1995-1997) based on whole otoliths.
Total annual mortalities for 1995, 1996 and 1997 were estimated from the regressions of fullyrecruited age classes (ages 4-7) against abundance (log millions). Total annual mortality variedfrom 0.68 to 1.26 for the years studied (Table 6.1).
6.4 Sectioned otolithsTranslucent zones on sectioned otoliths were easier to identify (Figure 6.15) than those on wholeotoliths. The level of agreement between different readings of translucent zones from sectionedotoliths by a single person was 67 per cent, with an APE of 10.3 (Figure 6.16, Table 6.1). However,when both readers were considered the agreement dropped to 32.8 per cent and the APE increasedto 21.0 per cent. Double-blind readings of sectioned otoliths indicated that the consistentinterpretation of translucent zones was difficult, as was the case with whole otoliths. Note thatthis was despite having guidelines and photographs of sectioned otoliths on hand specifically with
Age (years)
Freq
uen
cy (
%)
1995
1996
1997
1 2 3 4 5 6 7
0
0.1
0.2
0.3
0.4
Age (years)
Freq
uen
cy(L
og
mill
ion
s)
-2
-1
0
1
2
3 1995
1996
1997
0 1 2 3 4 5 6 7
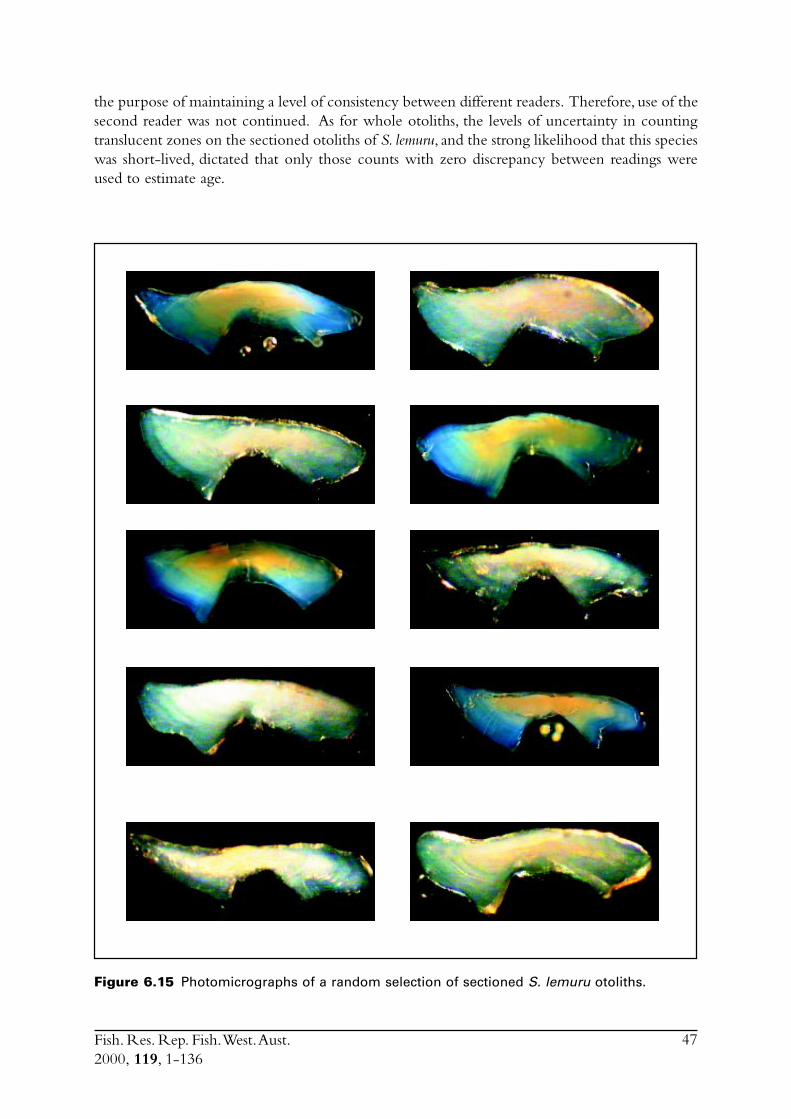
Fish. Res. Rep. Fish. West. Aust.2000, 119, 1-136
47
the purpose of maintaining a level of consistency between different readers. Therefore, use of thesecond reader was not continued. As for whole otoliths, the levels of uncertainty in countingtranslucent zones on the sectioned otoliths of S. lemuru, and the strong likelihood that this specieswas short-lived, dictated that only those counts with zero discrepancy between readings wereused to estimate age.
Figure 6.15 Photomicrographs of a random selection of sectioned S. lemuru otoliths.
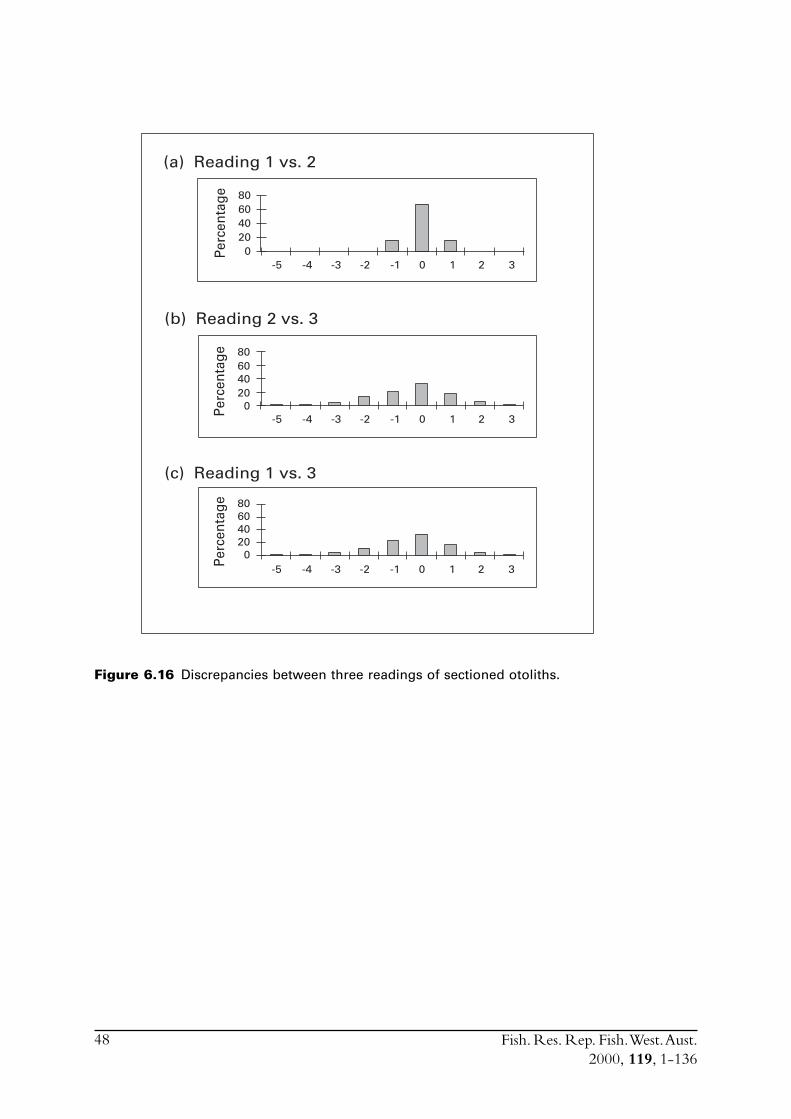
Fish. Res. Rep. Fish. West. Aust.2000, 119, 1-136
48
Figure 6.16 Discrepancies between three readings of sectioned otoliths.
(a) Reading 1 vs. 2
(b) Reading 2 vs. 3
(c) Reading 1 vs. 3
020406080
020406080
020406080
-5 -4 -3 -2 -1 0 1 2 3Perc
enta
gePe
rcen
tage
Perc
enta
ge
-5 -4 -3 -2 -1 0 1 2 3
-5 -4 -3 -2 -1 0 1 2 3
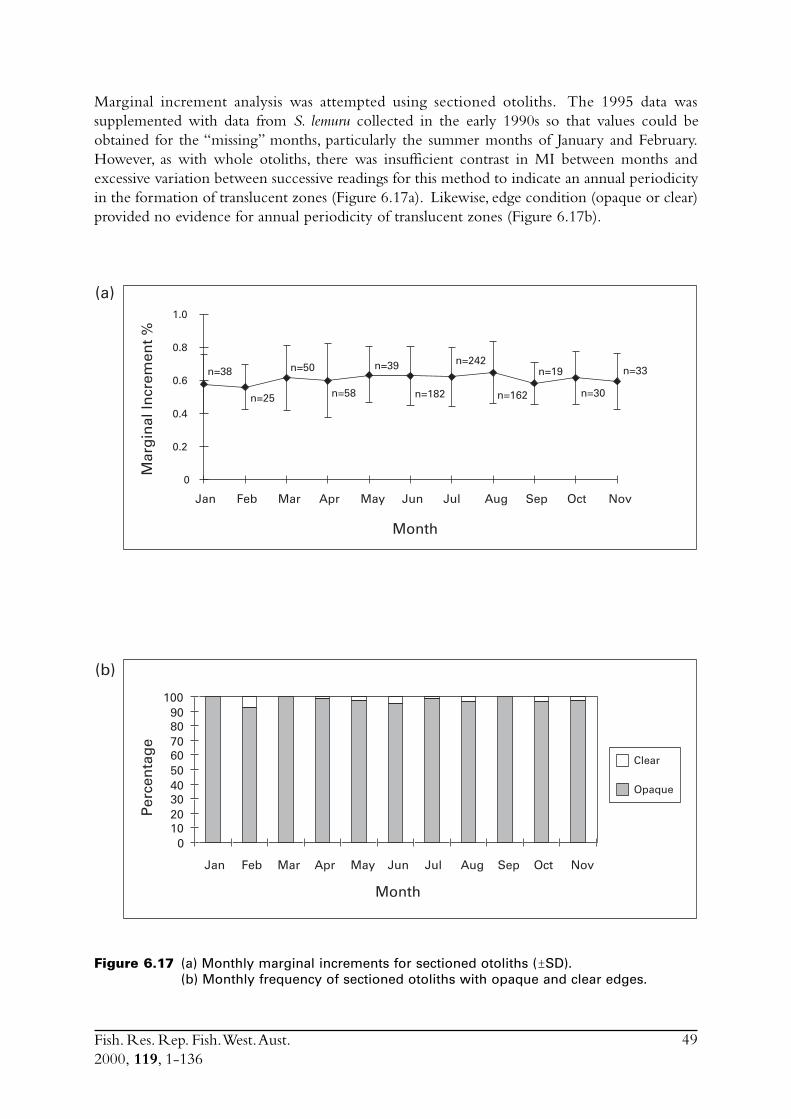
Fish. Res. Rep. Fish. West. Aust.2000, 119, 1-136
49
Marginal increment analysis was attempted using sectioned otoliths. The 1995 data wassupplemented with data from S. lemuru collected in the early 1990s so that values could beobtained for the “missing” months, particularly the summer months of January and February.However, as with whole otoliths, there was insufficient contrast in MI between months andexcessive variation between successive readings for this method to indicate an annual periodicityin the formation of translucent zones (Figure 6.17a). Likewise, edge condition (opaque or clear)provided no evidence for annual periodicity of translucent zones (Figure 6.17b).
(b)
Jan Feb Mar Apr May Jun Jul Aug Sep Oct Nov
Month
Mar
gin
al In
crem
ent
%
(a)
0
0.2
0.4
0.6
0.8
1.0
n=38
n=25
n=50
n=58
n=39
n=182
n=242
n=162
n=19
n=30
n=33
Month
Per
cen
tag
e
Jan Feb Mar Apr May Jun Jul Aug Sep Oct Nov
0102030405060708090
100
Opaque
Clear
Figure 6.17 (a) Monthly marginal increments for sectioned otoliths (ñSD).(b) Monthly frequency of sectioned otoliths with opaque and clear edges.
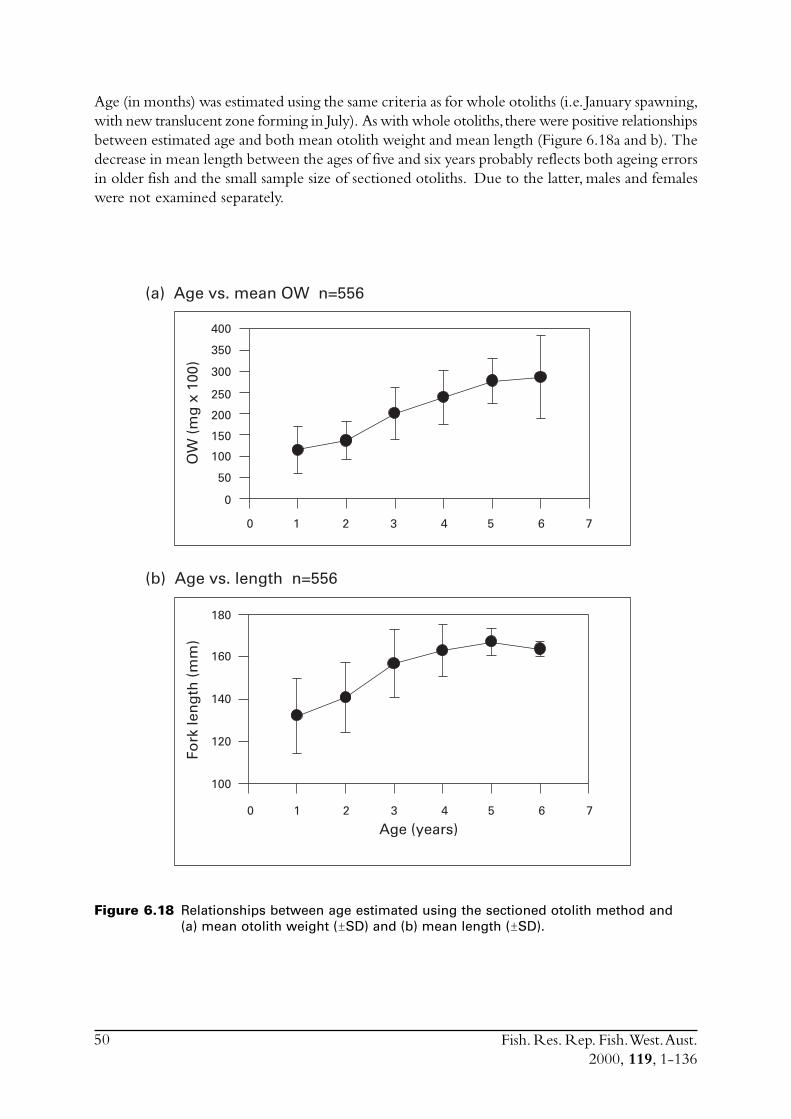
Fish. Res. Rep. Fish. West. Aust.2000, 119, 1-136
50
Age (in months) was estimated using the same criteria as for whole otoliths (i.e. January spawning,with new translucent zone forming in July). As with whole otoliths, there were positive relationshipsbetween estimated age and both mean otolith weight and mean length (Figure 6.18a and b). Thedecrease in mean length between the ages of five and six years probably reflects both ageing errorsin older fish and the small sample size of sectioned otoliths. Due to the latter, males and femaleswere not examined separately.
Figure 6.18 Relationships between age estimated using the sectioned otolith method and(a) mean otolith weight (ñSD) and (b) mean length (ñSD).
Age (years)
(b) Age vs. length n=556
(a) Age vs. mean OW n=556
1 2 3 4 5 6 70
1 2 3 4 5 6 70
180
160
140
120
100
400
350
300
250
200
150
100
50
0
OW
(m
g x
100
)Fo
rk le
ng
th (
mm
)
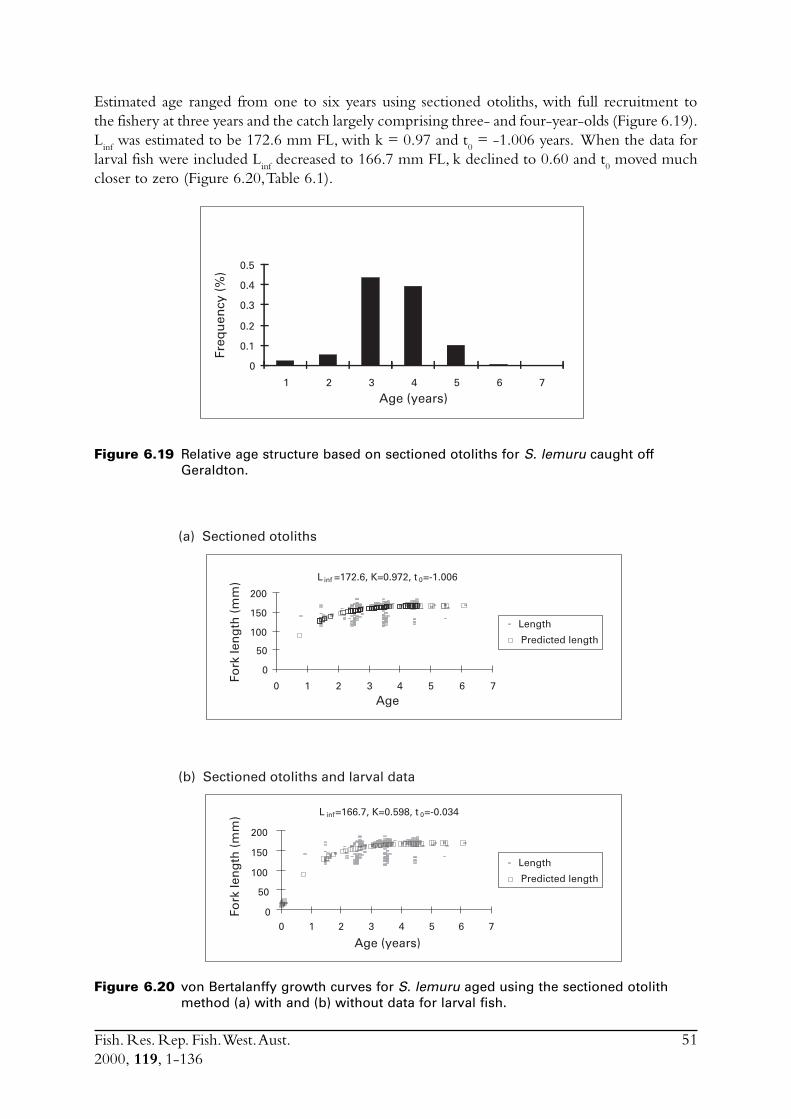
Fish. Res. Rep. Fish. West. Aust.2000, 119, 1-136
51
Estimated age ranged from one to six years using sectioned otoliths, with full recruitment tothe fishery at three years and the catch largely comprising three- and four-year-olds (Figure 6.19).L
inf was estimated to be 172.6 mm FL, with k = 0.97 and t
0 = -1.006 years. When the data for
larval fish were included Linf
decreased to 166.7 mm FL, k declined to 0.60 and t0 moved much
closer to zero (Figure 6.20, Table 6.1).
Figure 6.19 Relative age structure based on sectioned otoliths for S. lemuru caught offGeraldton.
Figure 6.20 von Bertalanffy growth curves for S. lemuru aged using the sectioned otolithmethod (a) with and (b) without data for larval fish.
Age (years)
Freq
uen
cy (
%)
0
0.1
0.2
0.3
0.4
0.5
1 2 3 4 5 6 7
Age
Fork
len
gth
(m
m)
Age (years)
Fork
len
gth
(m
m)
(a) Sectioned otoliths
(b) Sectioned otoliths and larval data
0
50
100
150
200
0 1 2 3 4 5 6 7
0
50
100
150
200
0 1 2 3 4 5 6 7
Length
Predicted length
Length
Predicted length
L inf =172.6, K=0.972, t 0=-1.006
L inf=166.7, K=0.598, t 0=-0.034
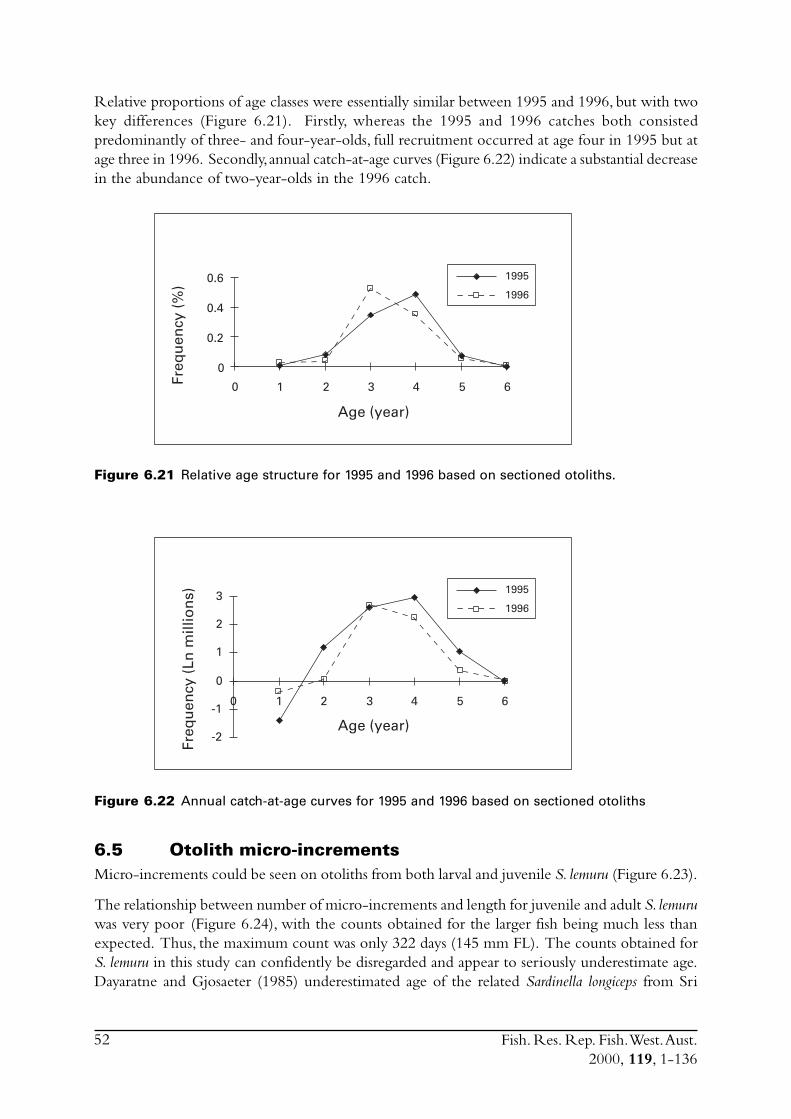
Fish. Res. Rep. Fish. West. Aust.2000, 119, 1-136
52
Relative proportions of age classes were essentially similar between 1995 and 1996, but with twokey differences (Figure 6.21). Firstly, whereas the 1995 and 1996 catches both consistedpredominantly of three- and four-year-olds, full recruitment occurred at age four in 1995 but atage three in 1996. Secondly, annual catch-at-age curves (Figure 6.22) indicate a substantial decreasein the abundance of two-year-olds in the 1996 catch.
Figure 6.21 Relative age structure for 1995 and 1996 based on sectioned otoliths.
Figure 6.22 Annual catch-at-age curves for 1995 and 1996 based on sectioned otoliths
6.5 Otolith micro-incrementsMicro-increments could be seen on otoliths from both larval and juvenile S. lemuru (Figure 6.23).
The relationship between number of micro-increments and length for juvenile and adult S. lemuruwas very poor (Figure 6.24), with the counts obtained for the larger fish being much less thanexpected. Thus, the maximum count was only 322 days (145 mm FL). The counts obtained forS. lemuru in this study can confidently be disregarded and appear to seriously underestimate age.Dayaratne and Gjosaeter (1985) underestimated age of the related Sardinella longiceps from Sri
Age (year)
Freq
uen
cy (
%)
1995
1996
0
0.2
0.4
0.6
0 1 2 3 4 5 6
Age (year)
1995
1996
Freq
uen
cy (
Ln m
illio
ns)
-2
-1
0
1
2
3
0 1 2 3 4 5 6
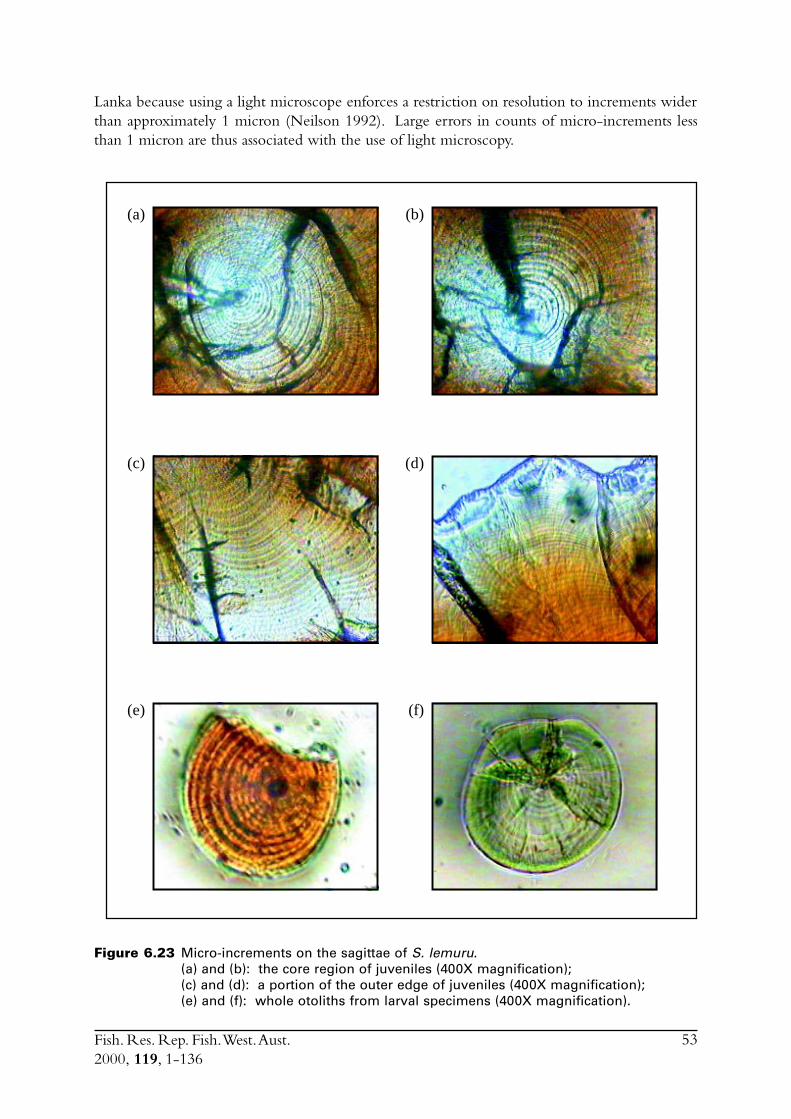
Fish. Res. Rep. Fish. West. Aust.2000, 119, 1-136
53
Lanka because using a light microscope enforces a restriction on resolution to increments widerthan approximately 1 micron (Neilson 1992). Large errors in counts of micro-increments lessthan 1 micron are thus associated with the use of light microscopy.
Figure 6.23 Micro-increments on the sagittae of S. lemuru.(a) and (b): the core region of juveniles (400X magnification);(c) and (d): a portion of the outer edge of juveniles (400X magnification);(e) and (f): whole otoliths from larval specimens (400X magnification).
(f)(e)
(d)(c)
(b)(a)
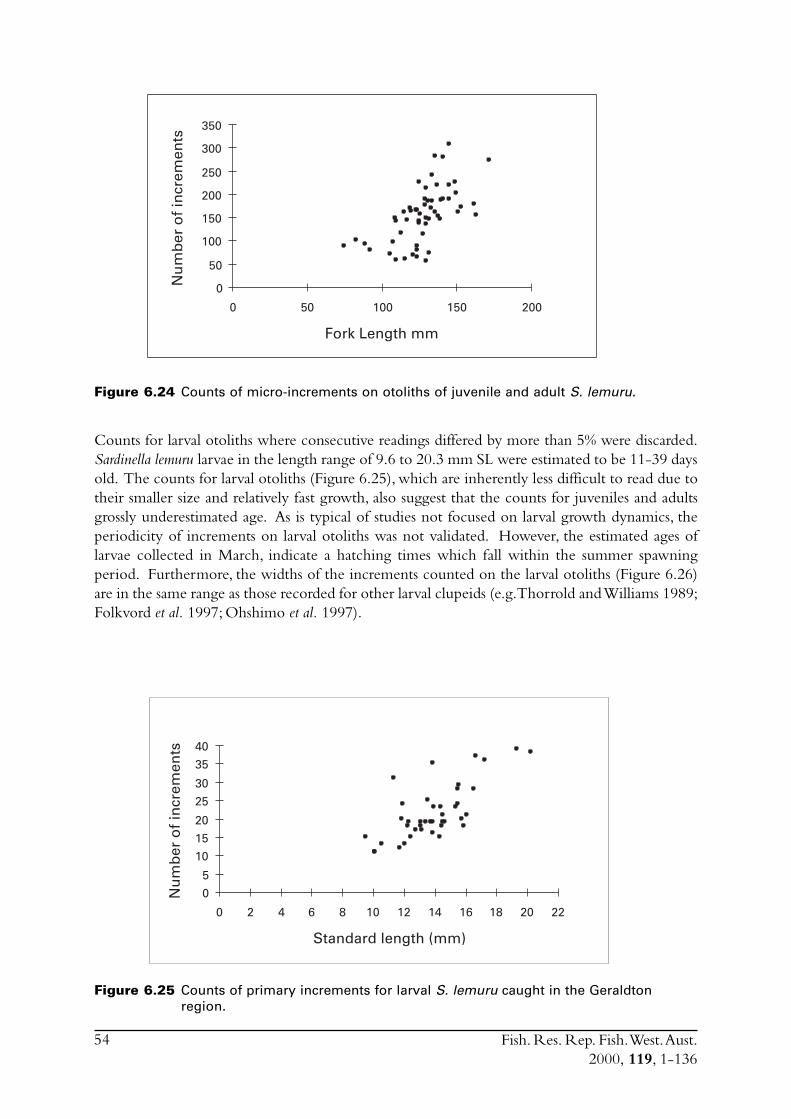
Fish. Res. Rep. Fish. West. Aust.2000, 119, 1-136
54
Figure 6.24 Counts of micro-increments on otoliths of juvenile and adult S. lemuru.
Counts for larval otoliths where consecutive readings differed by more than 5% were discarded.Sardinella lemuru larvae in the length range of 9.6 to 20.3 mm SL were estimated to be 11-39 daysold. The counts for larval otoliths (Figure 6.25), which are inherently less difficult to read due totheir smaller size and relatively fast growth, also suggest that the counts for juveniles and adultsgrossly underestimated age. As is typical of studies not focused on larval growth dynamics, theperiodicity of increments on larval otoliths was not validated. However, the estimated ages oflarvae collected in March, indicate a hatching times which fall within the summer spawningperiod. Furthermore, the widths of the increments counted on the larval otoliths (Figure 6.26)are in the same range as those recorded for other larval clupeids (e.g. Thorrold and Williams 1989;Folkvord et al. 1997; Ohshimo et al. 1997).
Fork Length mm
Nu
mb
er o
f in
crem
ents
0
50
100
150
200
250
300
350
0 50 100 150 200
Figure 6.25 Counts of primary increments for larval S. lemuru caught in the Geraldtonregion.
Standard length (mm)
Nu
mb
er o
f in
crem
ents
0
5
10
15
20
25
30
35
40
0 2 4 6 8 10 12 14 16 18 20 22
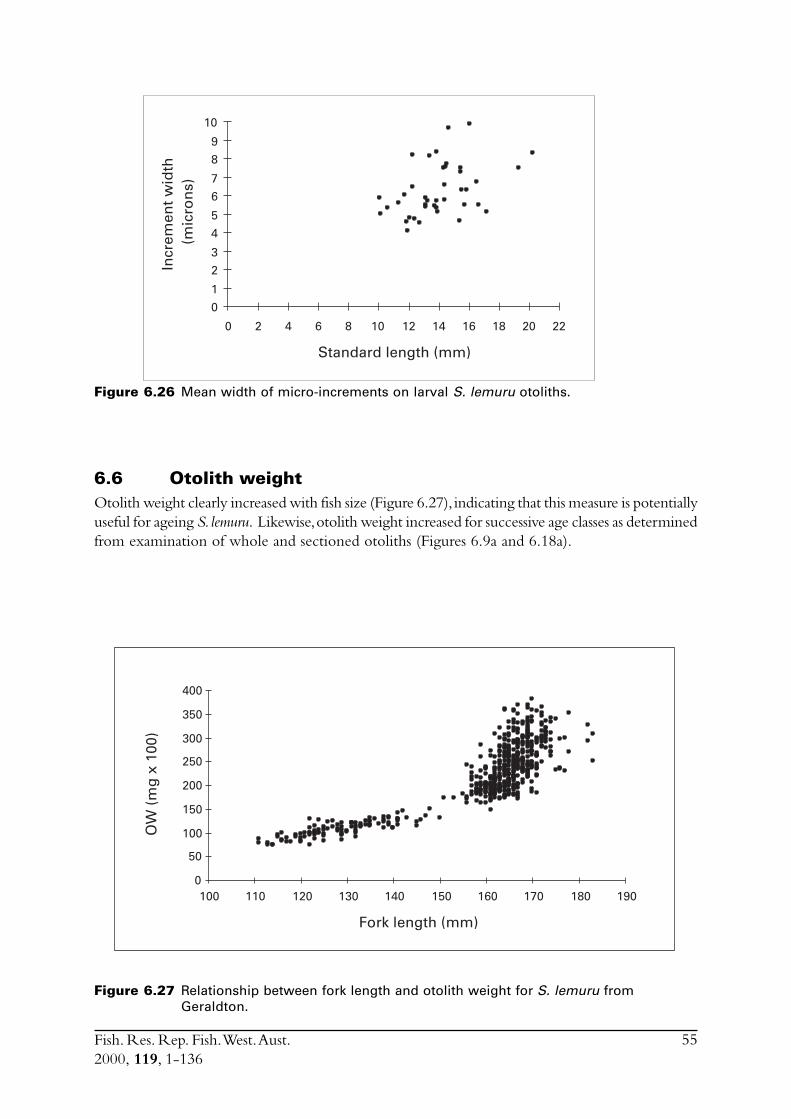
Fish. Res. Rep. Fish. West. Aust.2000, 119, 1-136
55
Figure 6.26 Mean width of micro-increments on larval S. lemuru otoliths.
6.6 Otolith weightOtolith weight clearly increased with fish size (Figure 6.27), indicating that this measure is potentiallyuseful for ageing S. lemuru. Likewise, otolith weight increased for successive age classes as determinedfrom examination of whole and sectioned otoliths (Figures 6.9a and 6.18a).
Figure 6.27 Relationship between fork length and otolith weight for S. lemuru fromGeraldton.
Standard length (mm)
Incr
emen
t w
idth
(m
icro
ns)
0
1
2
3
4
5
6
7
8
9
10
0 2 4 6 8 10 12 14 16 18 20 22
Fork length (mm)
OW
(m
g x
100
)
0
50
100
150
200
250
300
350
400
100 110 120 130 140 150 160 170 180 190
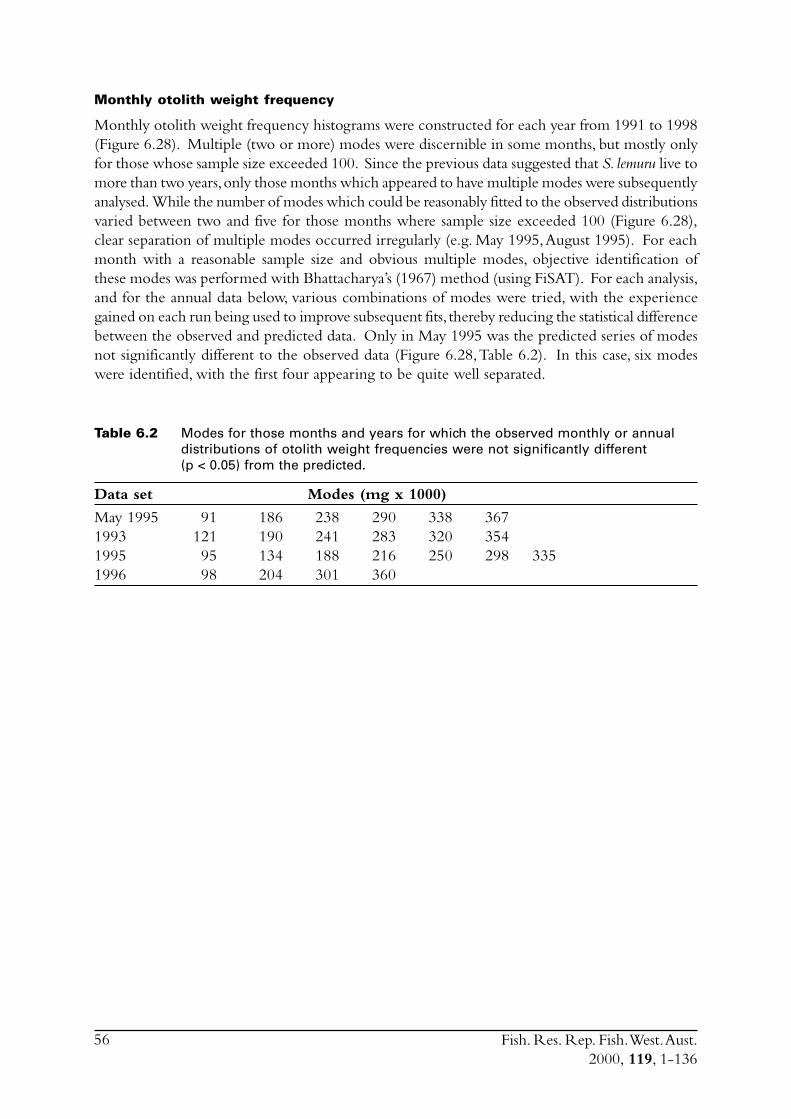
Fish. Res. Rep. Fish. West. Aust.2000, 119, 1-136
56
Monthly otolith weight frequency
Monthly otolith weight frequency histograms were constructed for each year from 1991 to 1998(Figure 6.28). Multiple (two or more) modes were discernible in some months, but mostly onlyfor those whose sample size exceeded 100. Since the previous data suggested that S. lemuru live tomore than two years, only those months which appeared to have multiple modes were subsequentlyanalysed. While the number of modes which could be reasonably fitted to the observed distributionsvaried between two and five for those months where sample size exceeded 100 (Figure 6.28),clear separation of multiple modes occurred irregularly (e.g. May 1995, August 1995). For eachmonth with a reasonable sample size and obvious multiple modes, objective identification ofthese modes was performed with Bhattacharya’s (1967) method (using FiSAT). For each analysis,and for the annual data below, various combinations of modes were tried, with the experiencegained on each run being used to improve subsequent fits, thereby reducing the statistical differencebetween the observed and predicted data. Only in May 1995 was the predicted series of modesnot significantly different to the observed data (Figure 6.28, Table 6.2). In this case, six modeswere identified, with the first four appearing to be quite well separated.
Table 6.2 Modes for those months and years for which the observed monthly or annualdistributions of otolith weight frequencies were not significantly different(p < 0.05) from the predicted.
Data set Modes (mg x 1000)
May 1995 91 186 238 290 338 3671993 121 190 241 283 320 3541995 95 134 188 216 250 298 3351996 98 204 301 360
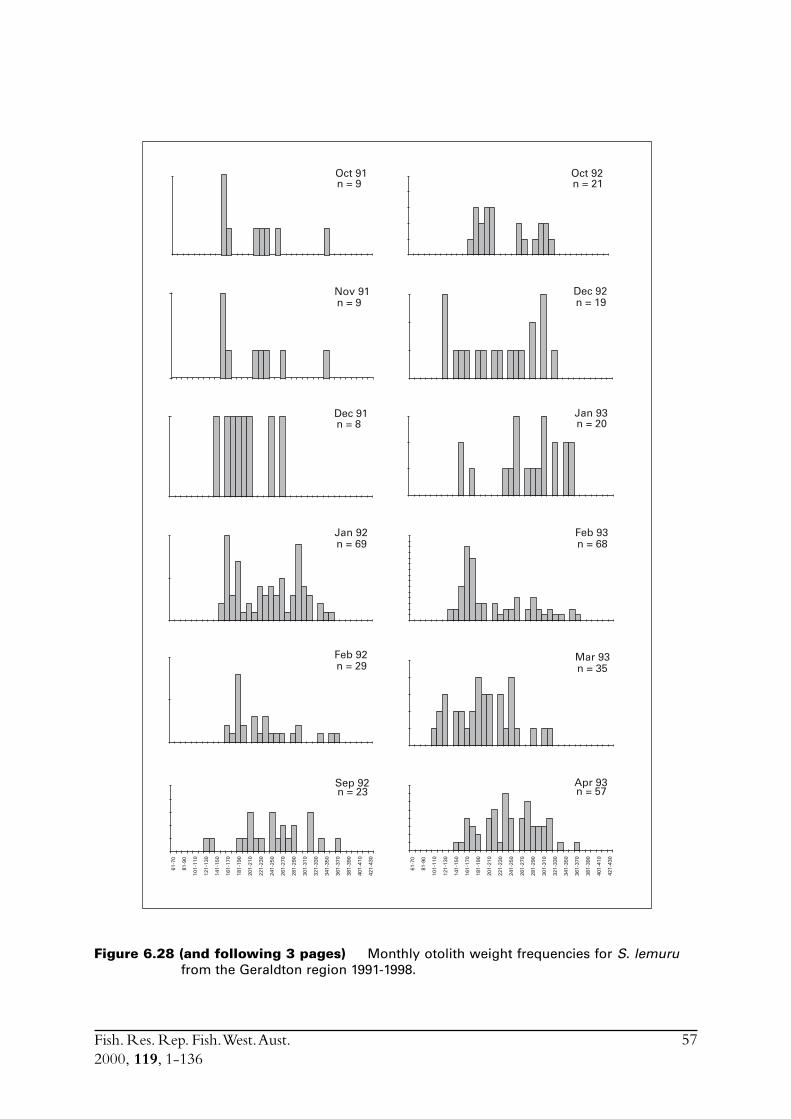
Fish. Res. Rep. Fish. West. Aust.2000, 119, 1-136
57
Figure 6.28 (and following 3 pages) Monthly otolith weight frequencies for S. lemurufrom the Geraldton region 1991-1998.
Oct 91n = 9
Oct 92n = 21
Nov 91n = 9
Dec 92n = 19
Dec 91n = 8
Jan 93n = 20
Jan 92n = 69
Feb 93n = 68
Feb 92n = 29
Mar 93n = 35
Sep 92n = 23
Apr 93n = 57
61-7
0
81-9
0
101-
110
121-
130
141-
150
161-
170
181-
190
201-
210
221-
230
241-
250
261-
270
281-
290
301-
310
321-
330
341-
350
361-
370
381-
390
401-
410
421-
430
61-7
0
81-9
0
101-
110
121-
130
141-
150
161-
170
181-
190
201-
210
221-
230
241-
250
261-
270
281-
290
301-
310
321-
330
341-
350
361-
370
381-
390
401-
410
421-
430
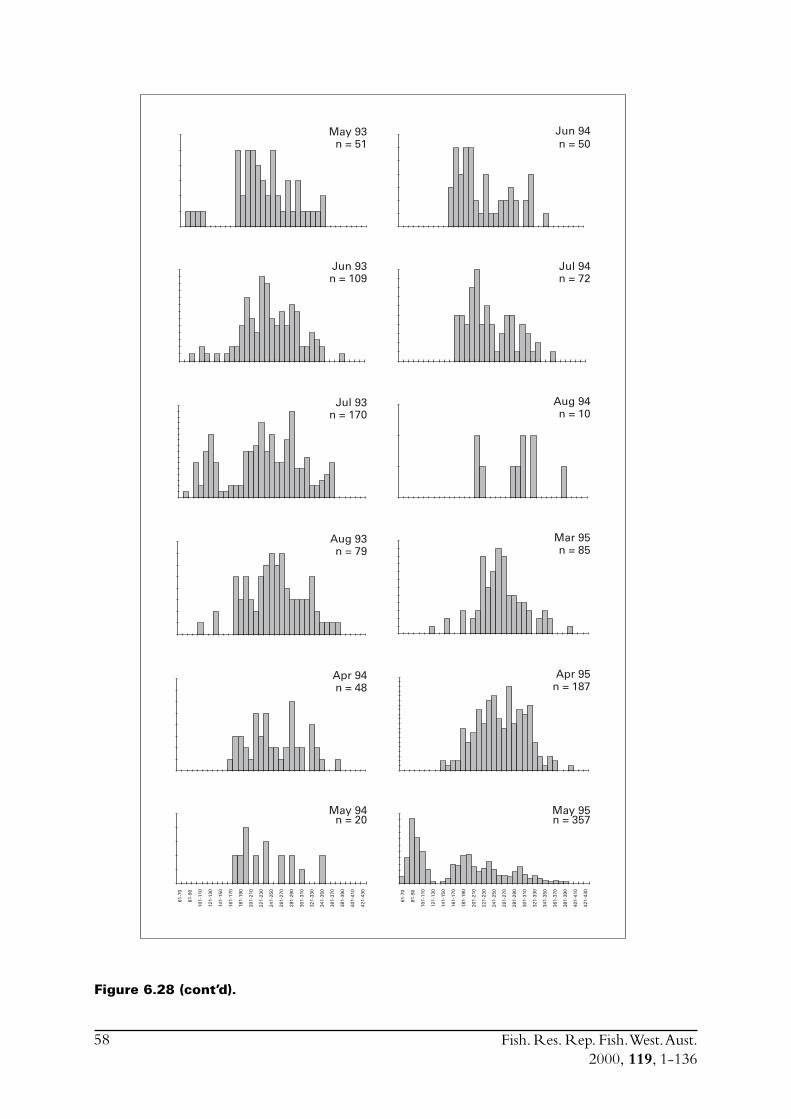
Fish. Res. Rep. Fish. West. Aust.2000, 119, 1-136
58
Figure 6.28 (cont’d).
May 93n = 51 n = 50
Jun 93n = 109
Jul 94n = 72
Jul 93n = 170
Aug 94n = 10
Aug 93n = 79
Mar 95n = 85
Apr 94n = 48
Apr 95n = 187
May 94n = 20
May 95n = 357
Jun 94
61-7
0
81-9
0
101-
110
121-
130
141-
150
161-
170
181-
190
201-
210
221-
230
241-
250
261-
270
281-
290
301-
310
321-
330
341-
350
361-
370
381-
390
401-
410
421-
430
61-7
0
81-9
0
101-
110
121-
130
141-
150
161-
170
181-
190
201-
210
221-
230
241-
250
261-
270
281-
290
301-
310
321-
330
341-
350
361-
370
381-
390
401-
410
421-
430
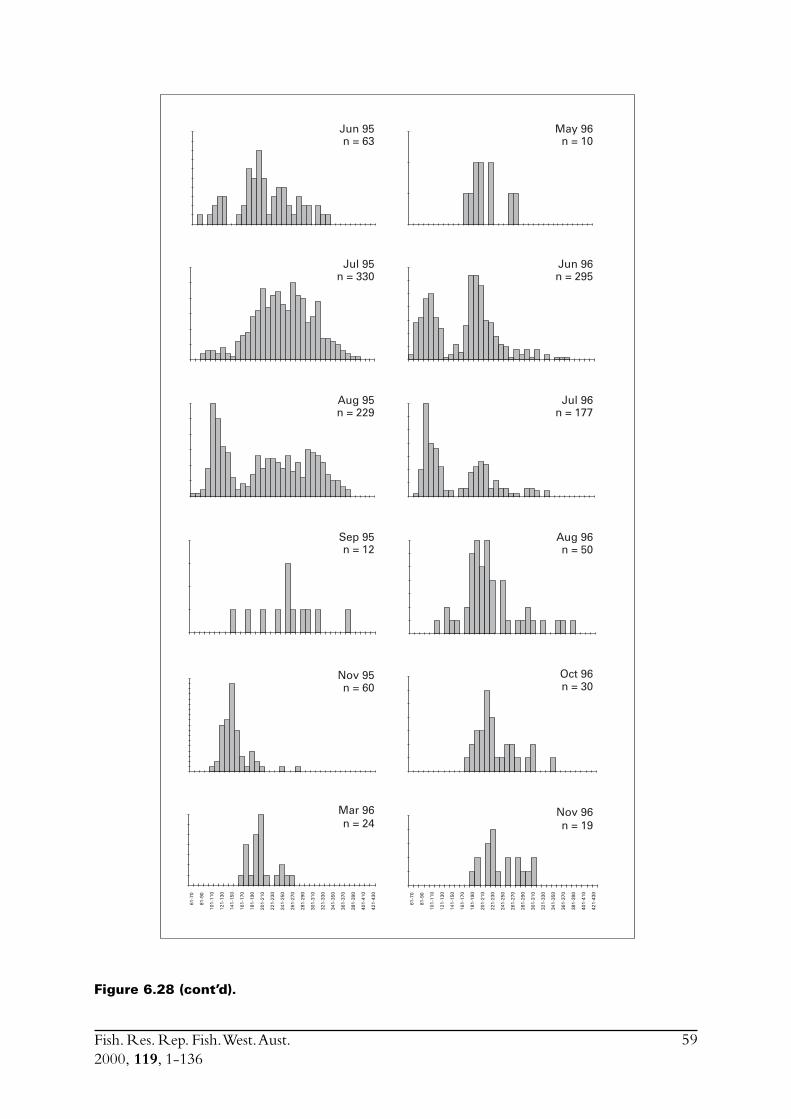
Fish. Res. Rep. Fish. West. Aust.2000, 119, 1-136
59
Figure 6.28 (cont’d).
May 96n = 10
Jun 96n = 295
Jul 96n = 177
Aug 96n = 50
Oct 96n = 30
Nov 96n = 19
Jun 95n = 63
Jul 95n = 330
Aug 95n = 229
Sep 95n = 12
Nov 95n = 60
Mar 96n = 24
61-7
0
81-9
0
101-
110
121-
130
141-
150
161-
170
181-
190
201-
210
221-
230
241-
250
261-
270
281-
290
301-
310
321-
330
341-
350
361-
370
381-
390
401-
410
421-
430
61-7
0
81-9
0
101-
110
121-
130
141-
150
161-
170
181-
190
201-
210
221-
230
241-
250
261-
270
281-
290
301-
310
321-
330
341-
350
361-
370
381-
390
401-
410
421-
430
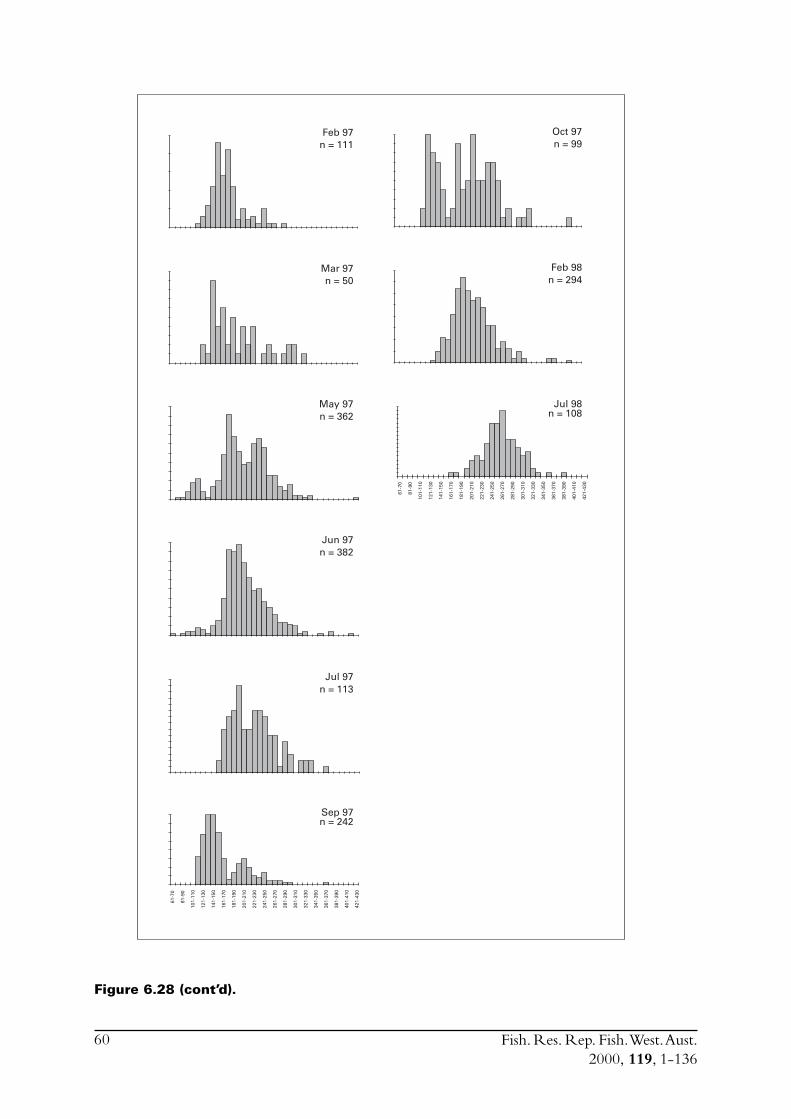
Fish. Res. Rep. Fish. West. Aust.2000, 119, 1-136
60
Figure 6.28 (cont’d).
61-7
0
81-9
0
101-
110
121-
130
141-
150
161-
170
181-
190
201-
210
221-
230
241-
250
261-
270
281-
290
301-
310
321-
330
341-
350
361-
370
381-
390
401-
410
421-
430
61-7
0
81-9
0
101-
110
121-
130
141-
150
161-
170
181-
190
201-
210
221-
230
241-
250
261-
270
281-
290
301-
310
321-
330
341-
350
361-
370
381-
390
401-
410
421-
430
Feb 97n = 111
Mar 97n = 50
May 97n = 362
Jun 97n = 382
Jul 97n = 113
Sep 97n = 242
Oct 97n = 99
Feb 98n = 294
Jul 98n = 108
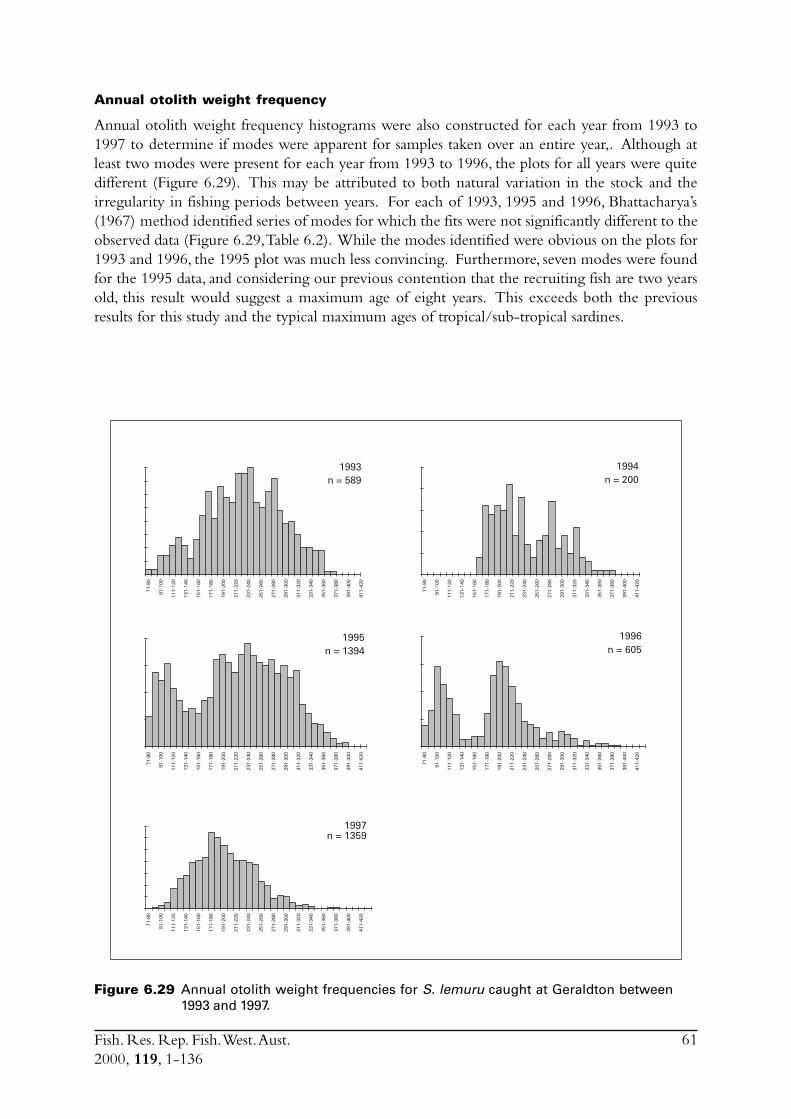
Fish. Res. Rep. Fish. West. Aust.2000, 119, 1-136
61
Annual otolith weight frequency
Annual otolith weight frequency histograms were also constructed for each year from 1993 to1997 to determine if modes were apparent for samples taken over an entire year,. Although atleast two modes were present for each year from 1993 to 1996, the plots for all years were quitedifferent (Figure 6.29). This may be attributed to both natural variation in the stock and theirregularity in fishing periods between years. For each of 1993, 1995 and 1996, Bhattacharya’s(1967) method identified series of modes for which the fits were not significantly different to theobserved data (Figure 6.29, Table 6.2). While the modes identified were obvious on the plots for1993 and 1996, the 1995 plot was much less convincing. Furthermore, seven modes were foundfor the 1995 data, and considering our previous contention that the recruiting fish are two yearsold, this result would suggest a maximum age of eight years. This exceeds both the previousresults for this study and the typical maximum ages of tropical/sub-tropical sardines.
Figure 6.29 Annual otolith weight frequencies for S. lemuru caught at Geraldton between1993 and 1997.
71-8
0
91-1
00
111-
120
131-
140
151-
160
171-
180
191-
200
211-
220
231-
240
251-
260
271-
280
291-
300
311-
320
331-
340
351-
360
371-
380
391-
400
411-
420
1997n = 1359
1996n = 605
71-8
0
91-1
00
111-
120
131-
140
151-
160
171-
180
191-
200
211-
220
231-
240
251-
260
271-
280
291-
300
311-
320
331-
340
351-
360
371-
380
391-
400
411-
420
1995n = 1394
71-8
0
91-1
00
111-
120
131-
140
151-
160
171-
180
191-
200
211-
220
231-
240
251-
260
271-
280
291-
300
311-
320
331-
340
351-
360
371-
380
391-
400
411-
420
1993n = 589
71-8
0
91-1
00
111-
120
131-
140
151-
160
171-
180
191-
200
211-
220
231-
240
251-
260
271-
280
291-
300
311-
320
331-
340
351-
360
371-
380
391-
400
411-
420
1994n = 200
71-8
0
91-1
00
111-
120
131-
140
151-
160
171-
180
191-
200
211-
220
231-
240
251-
260
271-
280
291-
300
311-
320
331-
340
351-
360
371-
380
391-
400
411-
420
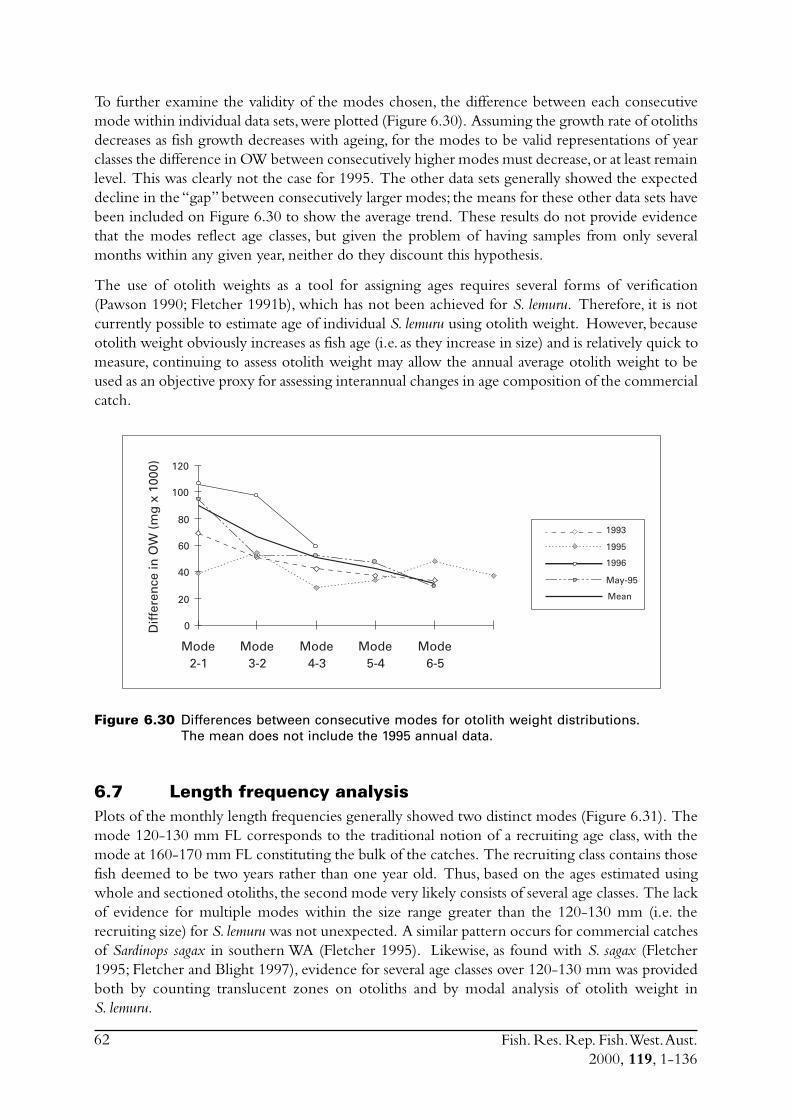
Fish. Res. Rep. Fish. West. Aust.2000, 119, 1-136
62
To further examine the validity of the modes chosen, the difference between each consecutivemode within individual data sets, were plotted (Figure 6.30). Assuming the growth rate of otolithsdecreases as fish growth decreases with ageing, for the modes to be valid representations of yearclasses the difference in OW between consecutively higher modes must decrease, or at least remainlevel. This was clearly not the case for 1995. The other data sets generally showed the expecteddecline in the “gap” between consecutively larger modes; the means for these other data sets havebeen included on Figure 6.30 to show the average trend. These results do not provide evidencethat the modes reflect age classes, but given the problem of having samples from only severalmonths within any given year, neither do they discount this hypothesis.
The use of otolith weights as a tool for assigning ages requires several forms of verification(Pawson 1990; Fletcher 1991b), which has not been achieved for S. lemuru. Therefore, it is notcurrently possible to estimate age of individual S. lemuru using otolith weight. However, becauseotolith weight obviously increases as fish age (i.e. as they increase in size) and is relatively quick tomeasure, continuing to assess otolith weight may allow the annual average otolith weight to beused as an objective proxy for assessing interannual changes in age composition of the commercialcatch.
Figure 6.30 Differences between consecutive modes for otolith weight distributions.The mean does not include the 1995 annual data.
6.7 Length frequency analysisPlots of the monthly length frequencies generally showed two distinct modes (Figure 6.31). Themode 120-130 mm FL corresponds to the traditional notion of a recruiting age class, with themode at 160-170 mm FL constituting the bulk of the catches. The recruiting class contains thosefish deemed to be two years rather than one year old. Thus, based on the ages estimated usingwhole and sectioned otoliths, the second mode very likely consists of several age classes. The lackof evidence for multiple modes within the size range greater than the 120-130 mm (i.e. therecruiting size) for S. lemuru was not unexpected. A similar pattern occurs for commercial catchesof Sardinops sagax in southern WA (Fletcher 1995). Likewise, as found with S. sagax (Fletcher1995; Fletcher and Blight 1997), evidence for several age classes over 120-130 mm was providedboth by counting translucent zones on otoliths and by modal analysis of otolith weight inS. lemuru.
Mode2-1
Mode3-2
Mode4-3
Mode5-4
Mode6-5
Dif
fere
nce
in O
W (
mg
x 1
000)
0
20
40
60
80
100
120
1996
1993
1995
May-95
Mean
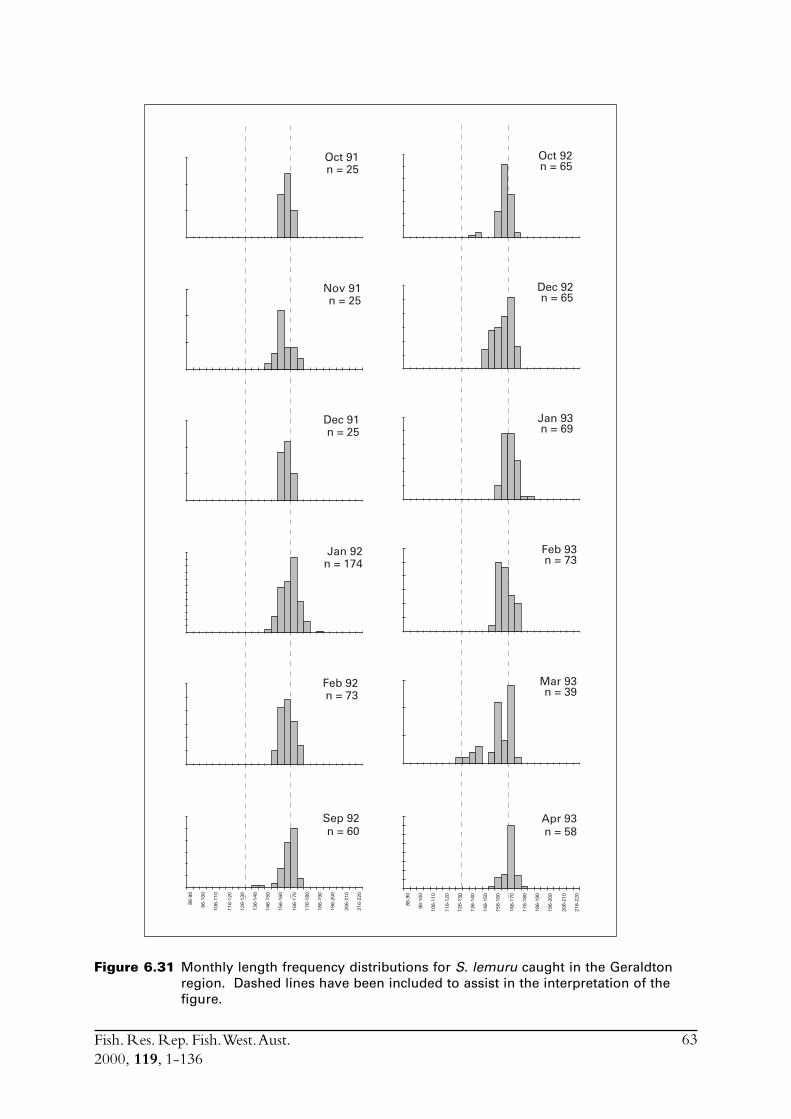
Fish. Res. Rep. Fish. West. Aust.2000, 119, 1-136
63
Figure 6.31 Monthly length frequency distributions for S. lemuru caught in the Geraldtonregion. Dashed lines have been included to assist in the interpretation of thefigure.
86-9
0
96-1
00
106-
110
116-
120
126-
130
136-
140
146-
150
156-
160
166-
170
176-
180
186-
190
196-
200
206-
210
216-
220
Jan 93n = 69
Dec 92n = 65
Oct 92n = 65
Feb 93n = 73
Mar 93n = 39
Apr 93n = 58
Oct 91n = 25
Nov 91n = 25
Dec 91n = 25
Feb 92n = 73
Jan 92n = 174
Sep 92n = 60
86-9
0
96-1
00
106-
110
116-
120
126-
130
136-
140
146-
150
156-
160
166-
170
176-
180
186-
190
196-
200
206-
210
216-
220
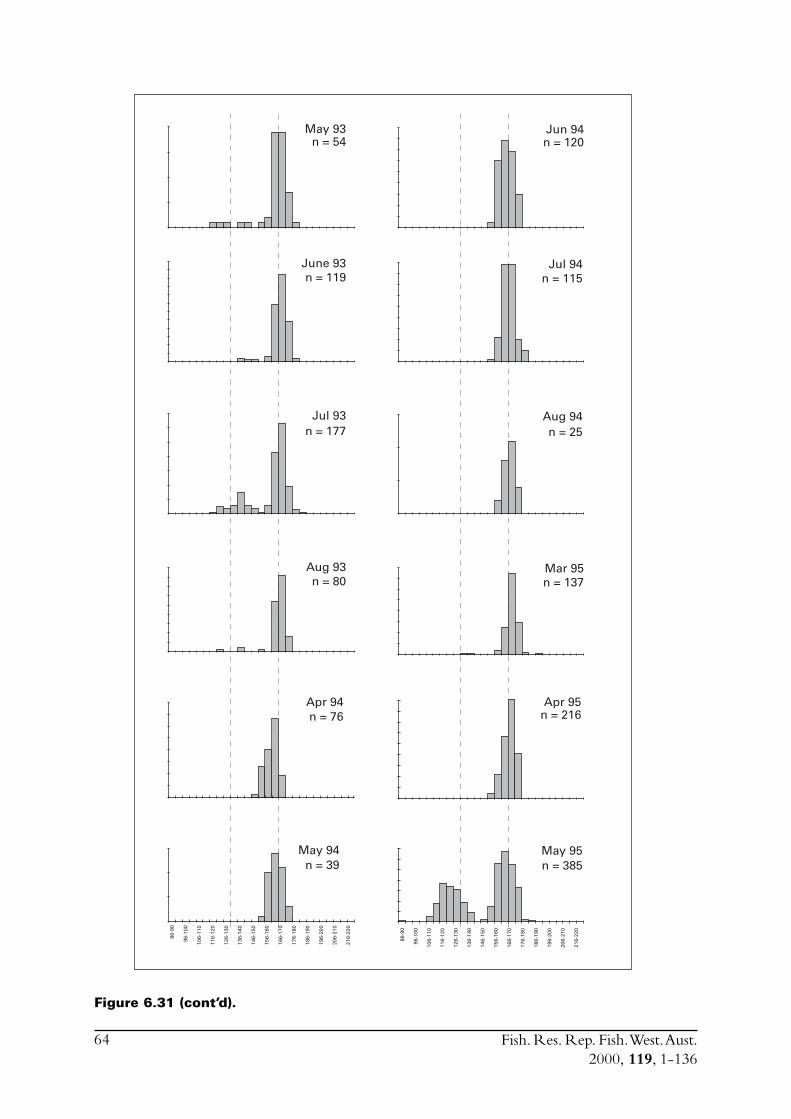
Fish. Res. Rep. Fish. West. Aust.2000, 119, 1-136
64
Figure 6.31 (cont’d).
May 93n = 54
Jun 94n = 120
June 93n = 119
Jul 94n = 115
Aug 94n = 25
Jul 93n = 177
Mar 95n = 137
Apr 95n = 216
May 95n = 385
May 94n = 39
86-9
0
96-1
00
106-
110
116-
120
126-
130
136-
140
146-
150
156-
160
166-
170
176-
180
186-
190
196-
200
206-
210
216-
220
Apr 94n = 76
Aug 93n = 80
86-9
0
96-1
00
106-
110
116-
120
126-
130
136-
140
146-
150
156-
160
166-
170
176-
180
186-
190
196-
200
206-
210
216-
220
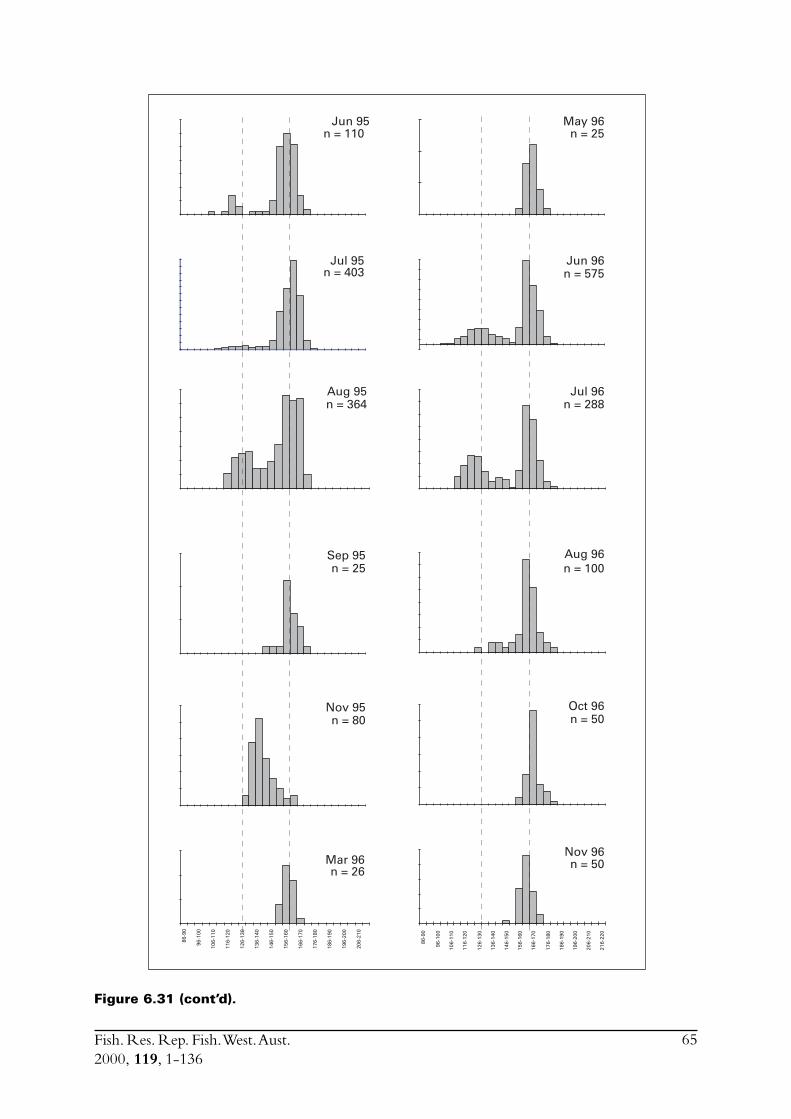
Fish. Res. Rep. Fish. West. Aust.2000, 119, 1-136
65
Figure 6.31 (cont’d).
May 96n = 25
Jun 96n = 575
Jul 96n = 288
Aug 96n = 100
Oct 96n = 50
Nov 96n = 50
Jun 95n = 110
Jul 95n = 403
Aug 95n = 364
Sep 95n = 25
Nov 95n = 80
86-9
0
96-1
00
106-
110
116-
120
126-
130
136-
140
146-
150
156-
160
166-
170
176-
180
186-
190
196-
200
206-
210
216-
220
Mar 96
86-9
0
96-1
00
106-
110
116-
120
126-
130
136-
140
146-
150
156-
160
166-
170
176-
180
186-
190
196-
200
206-
210
n = 26
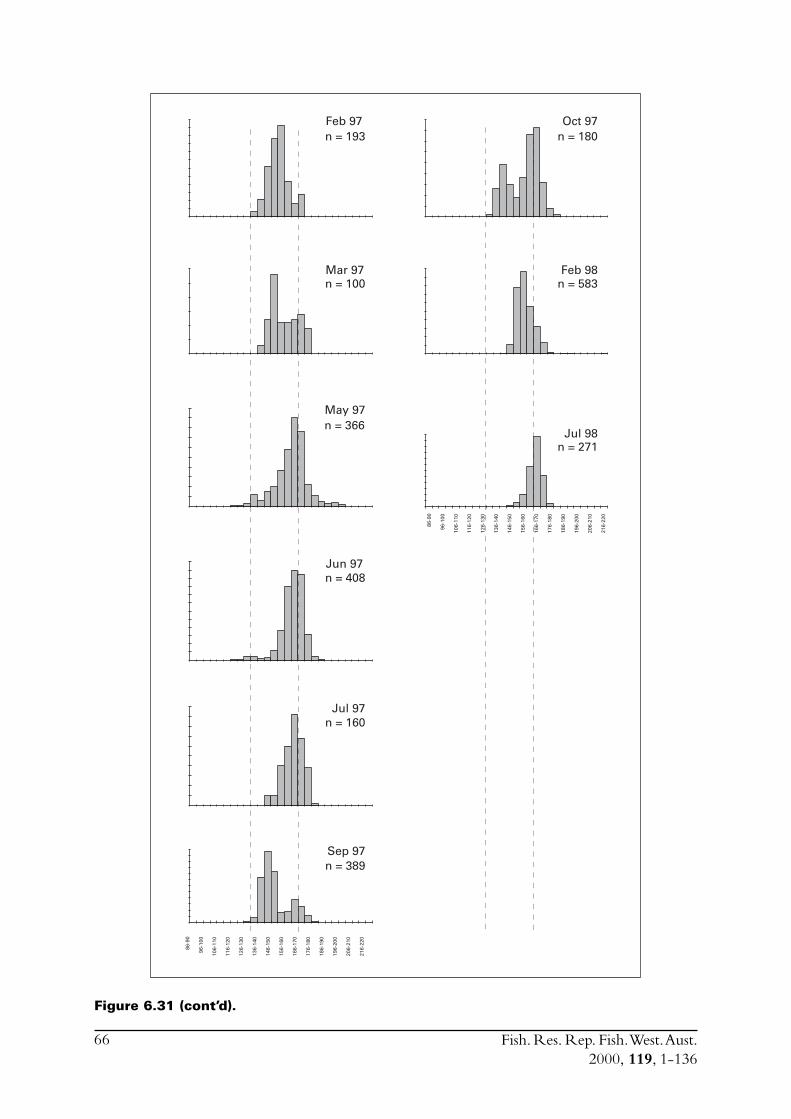
Fish. Res. Rep. Fish. West. Aust.2000, 119, 1-136
66
Figure 6.31 (cont’d).
Oct 97n = 180
Feb 98n = 583
Jul 98n = 271
Feb 97n = 193
Mar 97n = 100
May 97n = 366
Jun 97n = 408
Jul 97n = 160
Sep 97n = 389
86-9
0
96-1
00
106-
110
116-
120
126-
130
136-
140
146-
150
156-
160
166-
170
176-
180
186-
190
196-
200
206-
210
216-
220
86-9
0
96-1
00
106-
110
116-
120
126-
130
136-
140
146-
150
156-
160
166-
170
176-
180
186-
190
196-
200
206-
210
216-
220
Fish. Res. Rep. Fish. West. Aust.2000, 119, 1-136
67
Analysis of the monthly length frequency data with the ELEFAN module of the FiSAT programdid not provide a good fit (R
n = 0.195) to the von Bertalanffy model (Table 6.1). Estimated L
inf
was 179 mm FL, which is considerably larger than estimates obtained using otolith methods.Likewise, the k of 1.52 was much higher than those obtained using otoliths. Total mortality (Z)was estimated to be 3.02. The high k and Z indicate faster growth and shorter life span thansuggested by the otolith methods. ELEFAN essentially recognised only two age classes, with fullrecruitment apparently at less than two years of age and a maximum age of less than three years.Comparative growth data for S. lemuru in the much more productive Bali Strait clearly indicatethat lengths of 130 mm in the first year and 160 mm in the second year for S. lemuru in WA watersare extremely unlikely (Table 6.3).
Employing knowledge of the spawning season of S. lemuru off Geraldton, a count of 50 for the 25 mmsize was added to each February (i.e. pseudo-information) and the analysis performed again, withthe constraint that the curve must originate at the larval size class. The fit for this data was alsopoor (R
n= 0.158). While L
inf was similar to that obtained with the original length frequency data,
both k and Z decreased to levels closer to those obtained using the otoliths (Table 6.1).
6.8 Discussion of age and growth results with comparisonsto S. lemuru from Bali Strait
6.8.1 Age determination and growth parametersThe estimates of age for S. lemuru should be regarded only as approximates, due to lack of validationof an annual periodicity in ring formation on the sagittal otoliths. Further monitoring ofcommercial catches may allow some of the “gaps” in the data, used both to validate age anddetermine number of year classes, to be addressed.
For the data sets both with and without larval lengths and ages, Linf
for whole and sectionedotoliths did not differ greatly (Table 6.1). However, there were considerable differences in k,which ranged from 0.42 to 0.97. As estimates of t
0 were substantially better when larval data were
included in the vB models, the results for vB parameters Linf
and k obtained from data sets whichincluded the data for larval S. lemuru were used in the comparisons with age and growth data forS. lemuru from Indonesia (Bali Strait and Madura Strait).
Estimates of age, and thus growth and mortality, derived from examination of whole and sectionedotoliths for S. lemuru from Geraldton, were conditioned on the assumption that this species growsat a slower rate in WA waters than in the more productive, and warmer, Bali Strait. Length-at-ageestimates for S. lemuru from Geraldton, calculated using vB parameters derived from the otolithand length frequency methods which included information on larvae, are thus less than thosederived for this species in the Bali Strait (Table 6.3).
Although the age and growth estimates for S. lemuru that originated from the whole- and sectioned-otolith methods of estimating ages were similar, they contrasted those derived from length frequencydata. Thus, for Geraldton fish aged using length frequency data, length-at-age, L
inf and k values
were higher. The estimates for Geraldton S. lemuru derived using length frequency data weremore similar to those obtained for S. lemuru in Bali Strait using the same type of data.
Tied in with the above argument for slower growth is the general premise that faster growthwithin teleosts equates to a shorter life-span. Thus, the otolith methods estimated maximum ageof S. lemuru from Geelvink Channel as six or seven years, whereas that for Bali Strait is only three
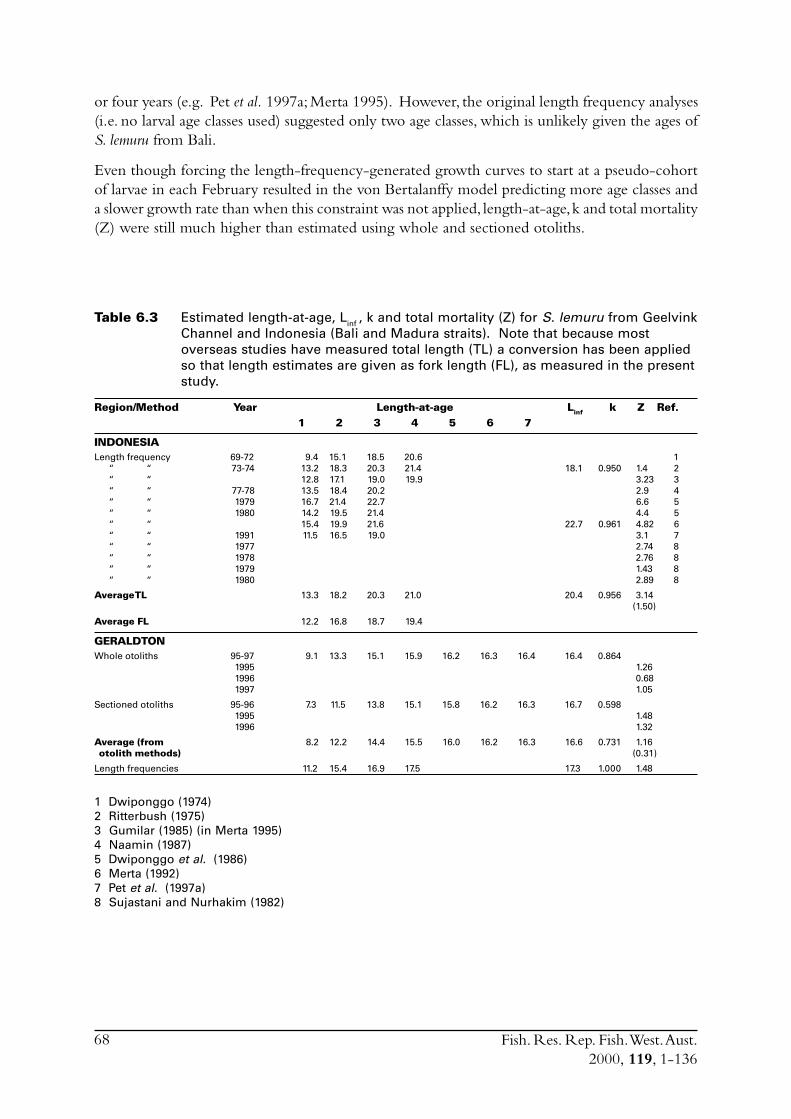
Fish. Res. Rep. Fish. West. Aust.2000, 119, 1-136
68
or four years (e.g. Pet et al. 1997a; Merta 1995). However, the original length frequency analyses(i.e. no larval age classes used) suggested only two age classes, which is unlikely given the ages ofS. lemuru from Bali.
Even though forcing the length-frequency-generated growth curves to start at a pseudo-cohortof larvae in each February resulted in the von Bertalanffy model predicting more age classes anda slower growth rate than when this constraint was not applied, length-at-age, k and total mortality(Z) were still much higher than estimated using whole and sectioned otoliths.
Table 6.3 Estimated length-at-age, Linf , k and total mortality (Z) for S. lemuru from Geelvink
Channel and Indonesia (Bali and Madura straits). Note that because mostoverseas studies have measured total length (TL) a conversion has been appliedso that length estimates are given as fork length (FL), as measured in the presentstudy.
Region/Method Year Length-at-age Linf k Z Ref.1 2 3 4 5 6 7
INDONESIALength frequency 69-72 9.4 15.1 18.5 20.6 1 “ “ 73-74 13.2 18.3 20.3 21.4 18.1 0.950 1.4 2 “ “ 12.8 17.1 19.0 19.9 3.23 3 “ “ 77-78 13.5 18.4 20.2 2.9 4 “ “ 1979 16.7 21.4 22.7 6.6 5 “ “ 1980 14.2 19.5 21.4 4.4 5 “ “ 15.4 19.9 21.6 22.7 0.961 4.82 6 “ “ 1991 11.5 16.5 19.0 3.1 7 “ “ 1977 2.74 8 “ “ 1978 2.76 8 “ “ 1979 1.43 8 “ “ 1980 2.89 8
Average TL 13.3 18.2 20.3 21.0 20.4 0.956 3.14(1.50)
Average FL 12.2 16.8 18.7 19.4
GERALDTONWhole otoliths 95-97 9.1 13.3 15.1 15.9 16.2 16.3 16.4 16.4 0.864
1995 1.261996 0.681997 1.05
Sectioned otoliths 95-96 7.3 11.5 13.8 15.1 15.8 16.2 16.3 16.7 0.5981995 1.481996 1.32
Average (from 8.2 12.2 14.4 15.5 16.0 16.2 16.3 16.6 0.731 1.16 otolith methods) (0.31)
Length frequencies 11.2 15.4 16.9 17.5 17.3 1.000 1.48
1 Dwiponggo (1974)2 Ritterbush (1975)3 Gumilar (1985) (in Merta 1995)4 Naamin (1987)5 Dwiponggo et al. (1986)6 Merta (1992)7 Pet et al. (1997a)8 Sujastani and Nurhakim (1982)
Fish. Res. Rep. Fish. West. Aust.2000, 119, 1-136
69
6.8.2 MortalityEstimates of total annual mortality derived from the whole and sectioned otolith methods weresimilar in 1995, but differed by a factor of two in 1996, indicating that further work is needed onthe ageing of S. lemuru.
The mean of all otolith based estimates of Z was 1.16 (SD = 0.31). This is less than the range ofZ values (1.4-6.6, n = 10, average = 3.14) estimated for S. lemuru in Indonesia (Table 6.3). Highertotal mortality for S. lemuru in Indonesia would be expected due to the apparent shorter life-span,faster growth and, in particular, the longer history of exploitation1. The taxonomically similarS. longiceps, which lives in warmer and more productive conditions than found off Geraldton, hasbeen studied extensively in India and has estimated Zs of 1.3-4.2 (Biradar & Gjísaeter 1989).The estimates for Bali Strait S. lemuru and also for S. longiceps from India were based on lengthfrequency analyses and direct assessments of ages were not performed. Interestingly, estimates ofZ based on length frequency analysis for S. lemuru in WA (i.e. Z = 1.48) were also higher thanthose for age estimates based on otoliths.
In contrast to the above tropical sardines, Sardinops sagax in southern WA live for 8-9 years andtotal annual mortality is typically < 1 (Fletcher 1995). Since S. sagax and S. lemuru are very similarin appearance and size, it follows that lower natural mortality will be expected in regions withlower water temperatures but similar levels of primary productivity, and this is likely to be drivingthe substantial differences in Z in the above examples. Thus, S. lemuru in WA probably have ahigher natural mortality rate than S. sagax from southern WA, but less than S. lemuru from Indonesia.As estimates of natural mortality (M) for S. lemuru from Bali Strait have ranged from 0.8 to 2.17(Merta 1995) and that for S. sagax is 0.43 (Fletcher 1995), M for S. lemuru off Geraldton mostlikely lies between 0.43 and the average total annual mortality estimated in this study as 1.16. Theestimated M derived from Pauly’s (1980) empirical relationship, along with the correction factorof 0.6 for clupeoids (Pauly 1982), was 0.93, which falls within the expected range. Assuming thisis a reasonable representation of M (noting that there is no direct evidence for this), fishingmortality, F (i.e. F = Z – M), thus equals 0.23. Patterson (1992) suggested that sustainability ofclupeoid stocks was more likely if F/M was kept below 2/3 (i.e. 0.67). In the case of S. lemuru atGeraldton, F/M = 0.25, which suggests that current catch levels (i.e. 500-2000 tonnes per annum)are sustainable. However, because the causes for the decrease in catch rates in 1997 (section 8.0)are not clear, work on the age and growth of S. lemuru in WA will need to continue as furthermonitoring of commercial catches takes place. Another possibility to be addressed is the potentialexistence of size-dependent spatial separation within the mid-west assemblage, which could haveresulted in an under-representation of older S. lemuru in the samples, thereby overestimating totalmortality.
6.8.3 RecruitmentThe catch-at-age curves generated using both otolith methods indicate that the catch largelyconsists of two to three age classes, similar to the Bali Strait S. lemuru fishery (Merta 1995).Recruitment to the fishery occurs at two to three years of age, with full recruitment at three tofour years. Length-at-age for three-year-olds, based on otoliths, equates to size at recruitment of12-14 cm which encompasses the recruiting size class evident in the length frequency plots. Suchrecruitment events typically occurred in only one or two months of any given year, always withinthe period from March to August, and most frequently in the three-month period from Mayto July.
1 Annual catch of S. lemuru in Bali Strait has reached 50 000 tonnes.
Fish. Res. Rep. Fish. West. Aust.2000, 119, 1-136
70
Within the S. lemuru stock there is most likely a strong relationship between abundance ofconsecutive age classes in consecutive years even though it does not manifest within consecutiveannual catch curves. This may indicate that the presence of one- and two-year-old, and to a lesserextent, three-year-old S. lemuru in the commercial fishing grounds is sporadic or their vulnerabilityto capture varies widely between years. In either case, it indicates that the abundance of these agegroups in the commercial catch is of little use as an indicator of recruitment strength. Three-year-olds may be used to estimate relative rates of annual recruitment, but because this age group formsa substantial portion of the catch in some years, it will not be possible to use such rates to predictcatch levels for the subsequent year(s).
6.9 ConclusionsSardines typically experience large interannual fluctuations in recruitment strength and are alsorelatively short-lived. These factors, along with associated biological and environmental factors,can lead to large changes in stock size over short periods. While there is uncertainty over the agestructure, and thus mortality estimates, of the commercial catch of S. lemuru off Geraldton, theevidence strongly suggests that this species is short-lived. Along with the likelihood of substantialinterannual recruitment variability, the purse seine fishery at Geraldton needs to be managedconservatively.
7.0 Stock delineationRatios of stable isotopes for oxygen (d18O ) and carbon (d13C) were determined for 58 samples,most of which came from Geraldton (Figure 7.1a). Plots of the d13C against d18O for each sampleindicated considerable overlap between regions, except for those samples from Fremantle in 1992and 1994. These latter samples had both the highest d18O and d13C.
The groupings for the more substantial numbers of samples from Geraldton shifted up and downthe d18O axis from year to year, with those from Fremantle in 1996 and 1997 overlapping theGeraldton groups (Figure 7.1b). The Carnarvon sample (August 1997 only) separated off fromthe main body of Geraldton and Fremantle samples along the d13C axis.
The 1996 Geraldton and Carnarvon groups both included otoliths from small (< 145 mm FL)S. lemuru, which were analysed separately. For each group the points for the smaller otoliths arethose with the lower d13C and d18O values. The two larger size classes from the single sample fromCarnarvon had much higher d18O, a trend also obvious when the Geraldton samples from themonths of June and July of 1996 were plotted separately (Figure 7.2). The otoliths in the Fremantle1992 and 1994 samples were also large and this was probably a major influence on the magnitudeof the d18O and d13C values recorded. This level of difference between size classes indicated thatsize had to be considered as a factor in subsequent analyses.
Because there are differences in the mean water temperature at each of the locations, if there wereseparate stocks of S. lemuru, then a difference in d18O would be expected. A plot of mean seasurface temperature (SST) (Reynold’s data) against mean d18O for each region shows the expectedrelationship of lower d18O with the northward increases in SST (Figure 7.3a). The same trend wasobvious with data for similar sized otoliths from S. lemuru caught within a four-month period in1997 (Figure 7.3b). In the latter case, the difference in d18O between the two most distantlocations was 0.43, whereas for the overall location-means this difference was only 0.29. Thus, forsimilar sized fish in a substantially narrower time period the difference was greater. The smaller
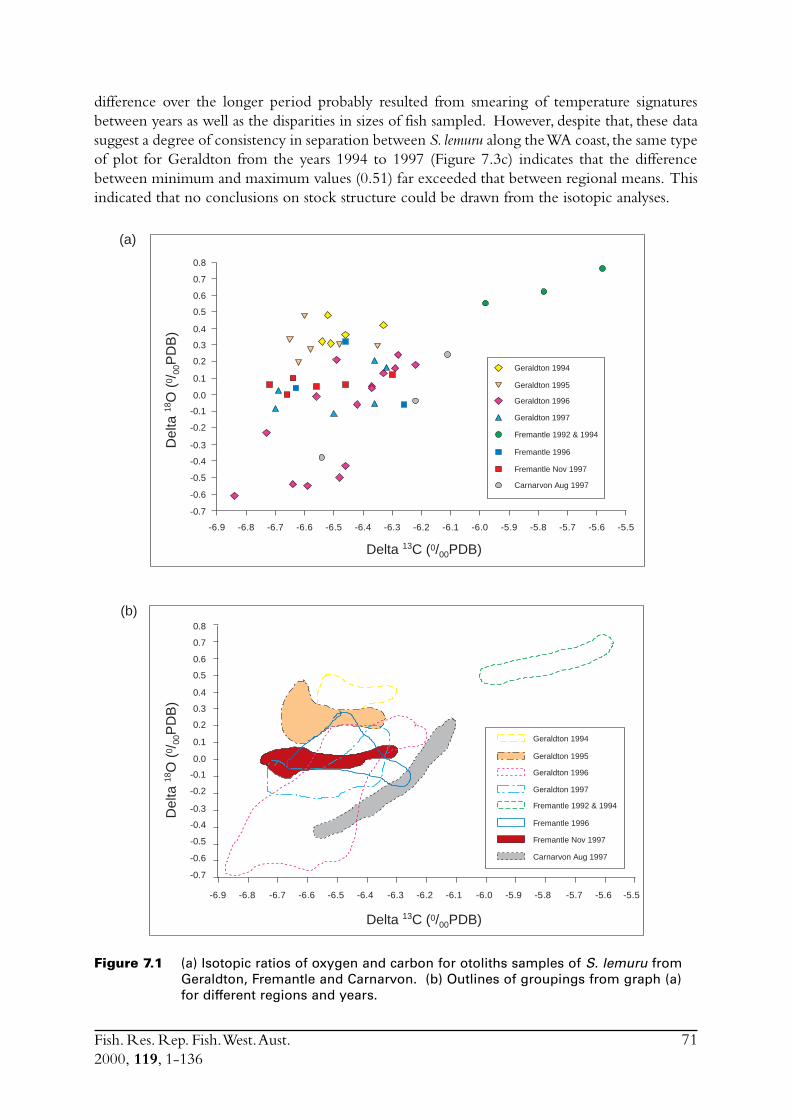
Fish. Res. Rep. Fish. West. Aust.2000, 119, 1-136
71
difference over the longer period probably resulted from smearing of temperature signaturesbetween years as well as the disparities in sizes of fish sampled. However, despite that, these datasuggest a degree of consistency in separation between S. lemuru along the WA coast, the same typeof plot for Geraldton from the years 1994 to 1997 (Figure 7.3c) indicates that the differencebetween minimum and maximum values (0.51) far exceeded that between regional means. Thisindicated that no conclusions on stock structure could be drawn from the isotopic analyses.
Figure 7.1 (a) Isotopic ratios of oxygen and carbon for otoliths samples of S. lemuru fromGeraldton, Fremantle and Carnarvon. (b) Outlines of groupings from graph (a)for different regions and years.
Delta 13C (0/00PDB)
Del
ta 18
O (
0 /00
PD
B)
Geraldton 1994
Geraldton 1995
Fremantle 1992 & 1994
Carnarvon Aug 1997
Fremantle 1996
Fremantle Nov 1997
Geraldton 1997
Geraldton 1996
0.8
0.7
0.6
0.5
0.4
0.3
0.2
0.1
0.0
-0.1
-0.2
-0.3
-0.4
-0.5
-0.6
-0.7
-6.9 -6.8 -6.7 -6.6 -6.5 -6.4 -6.3 -6.2 -6.1 -6.0 -5.9 -5.8 -5.7 -5.6 -5.5
(a)
(b)
Geraldton 1994
Geraldton 1995
Fremantle 1992 & 1994
Carnarvon Aug 1997
Fremantle 1996
Fremantle Nov 1997
Geraldton 1997
Geraldton 1996
-6.9 -6.8 -6.7 -6.6 -6.5 -6.4 -6.3 -6.2 -6.1 -6.0 -5.9 -5.8 -5.7 -5.6 -5.5
Del
ta 18
O (
0 /00
PD
B)
Delta 13C (0/00PDB)
0.8
0.7
0.6
0.5
0.4
0.3
0.2
0.1
0.0
-0.1
-0.2
-0.3
-0.4
-0.5
-0.6
-0.7
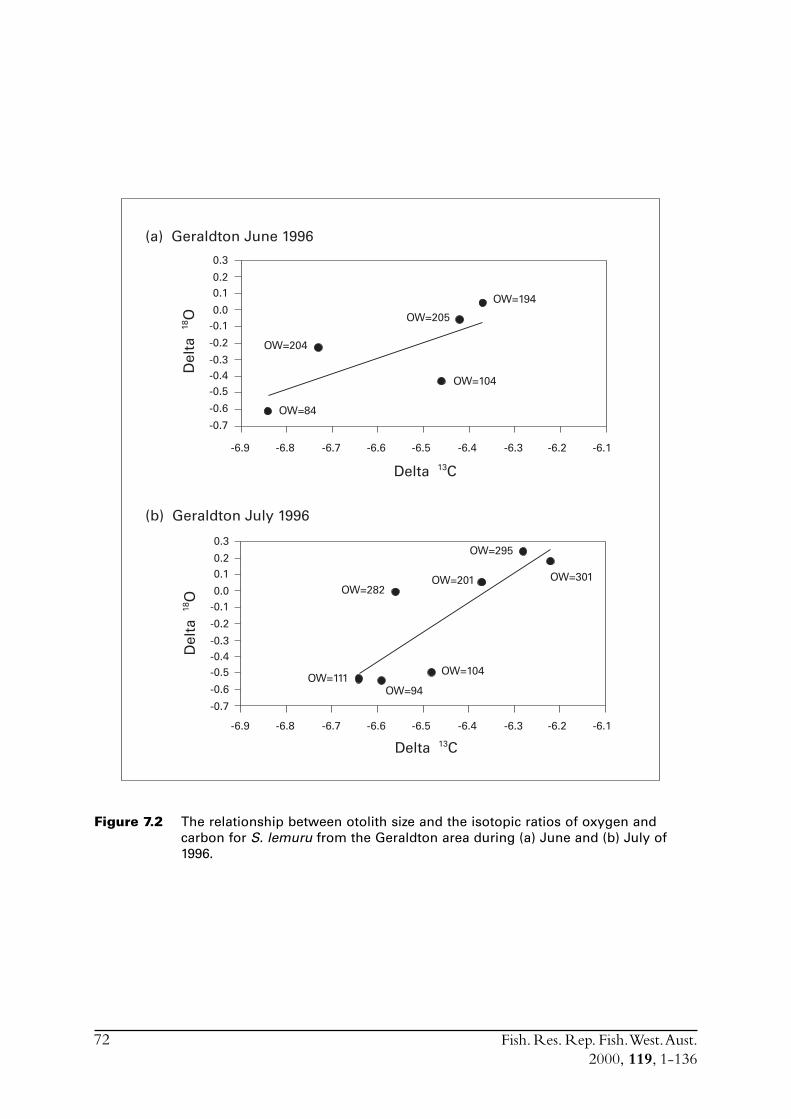
Fish. Res. Rep. Fish. West. Aust.2000, 119, 1-136
72
Figure 7.2 The relationship between otolith size and the isotopic ratios of oxygen andcarbon for S. lemuru from the Geraldton area during (a) June and (b) July of1996.
-6.9 -6.8 -6.7 -6.6 -6.5 -6.4 -6.3 -6.2 -6.1
OW=301OW=282
OW=201
OW=295
OW=111OW=94
OW=104
0.3
0.20.1
0.0-0.1
-0.2
-0.3-0.4-0.5
-0.6
-0.7
Delta 13C
Del
ta 18
O
OW=194
OW=84
OW=204
OW=104
OW=205
-6.9 -6.8 -6.7 -6.6 -6.5 -6.4 -6.3 -6.2 -6.1
0.3
0.20.1
0.0-0.1
-0.2
-0.3-0.4-0.5
-0.6
-0.7
Delta 13C
Del
ta 18
O
(a) Geraldton June 1996
(b) Geraldton July 1996
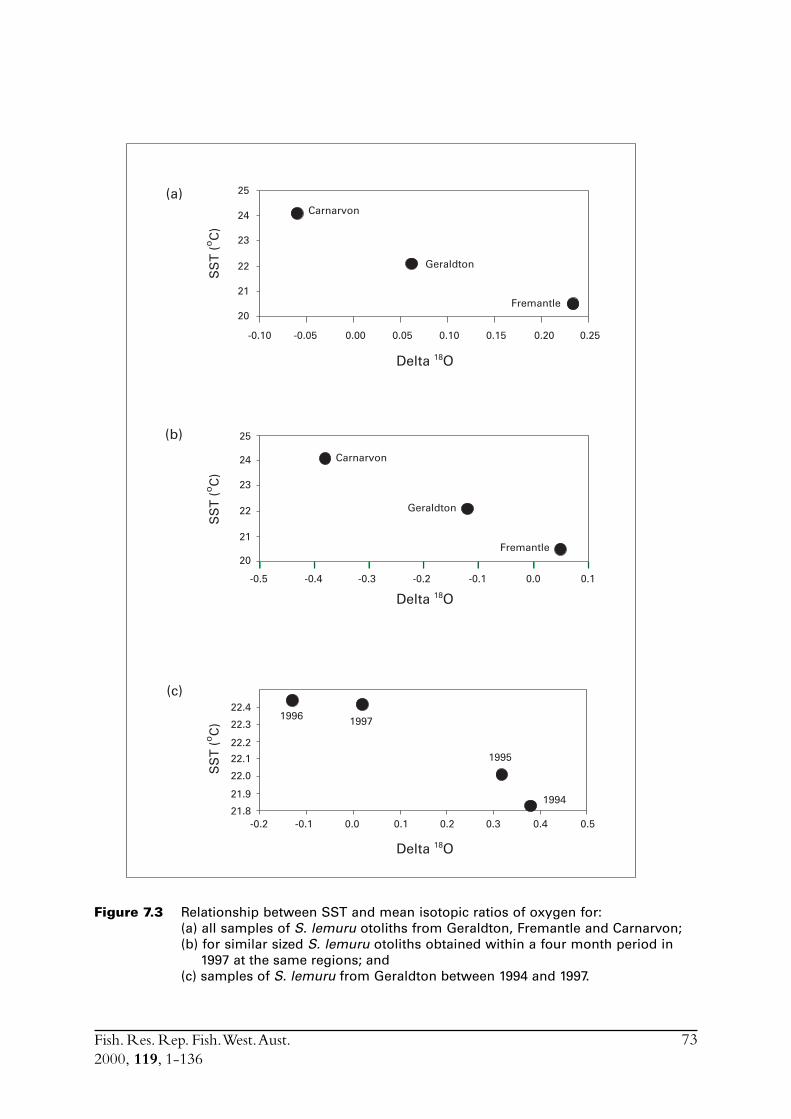
Fish. Res. Rep. Fish. West. Aust.2000, 119, 1-136
73
Figure 7.3 Relationship between SST and mean isotopic ratios of oxygen for:(a) all samples of S. lemuru otoliths from Geraldton, Fremantle and Carnarvon;(b) for similar sized S. lemuru otoliths obtained within a four month period in 1997 at the same regions; and(c) samples of S. lemuru from Geraldton between 1994 and 1997.
(a)
(b)
(c)
-0.2 -0.1 0.0 0.1 0.2 0.3 0.4 0.521.8
21.9
22.0
22.1
22.2
22.3
22.4
SS
T (
oC
)
-0.10 -0.05 0.00 0.05 0.10 0.15 0.20 0.25
20
21
22
23
24
25
-0.5 -0.4 -0.3 -0.2 -0.1 0.0 0.1
20
21
22
23
24
25
Carnarvon
Geraldton
Fremantle
Carnarvon
Geraldton
Fremantle
Delta 18O
1996 1997
1995
1994
SS
T (
oC
)S
ST
(oC
)
Delta 18O
Delta 18O
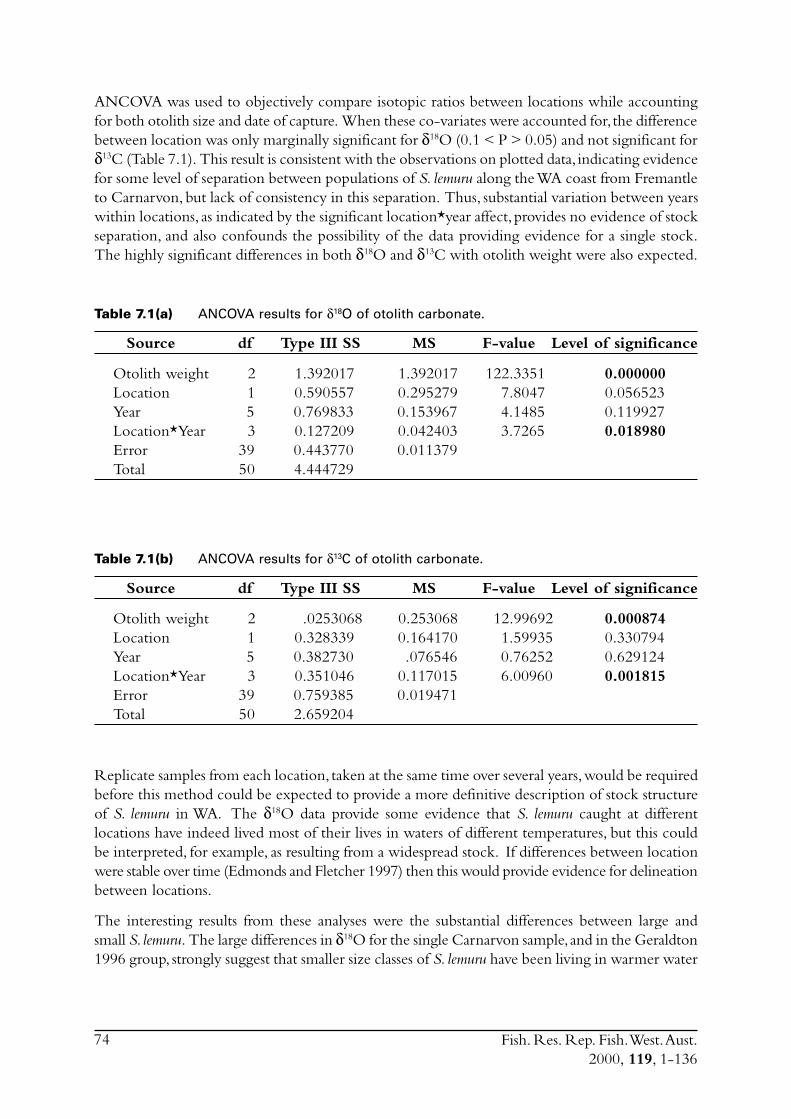
Fish. Res. Rep. Fish. West. Aust.2000, 119, 1-136
74
ANCOVA was used to objectively compare isotopic ratios between locations while accountingfor both otolith size and date of capture. When these co-variates were accounted for, the differencebetween location was only marginally significant for d18O (0.1 < P > 0.05) and not significant ford13C (Table 7.1). This result is consistent with the observations on plotted data, indicating evidencefor some level of separation between populations of S. lemuru along the WA coast from Fremantleto Carnarvon, but lack of consistency in this separation. Thus, substantial variation between yearswithin locations, as indicated by the significant location*year affect, provides no evidence of stockseparation, and also confounds the possibility of the data providing evidence for a single stock.The highly significant differences in both d18O and d13C with otolith weight were also expected.
Table 7.1(a) ANCOVA results for d18O of otolith carbonate.
Source df Type III SS MS F-value Level of significance
Otolith weight 2 1.392017 1.392017 122.3351 0.000000Location 1 0.590557 0.295279 7.8047 0.056523Year 5 0.769833 0.153967 4.1485 0.119927Location*Year 3 0.127209 0.042403 3.7265 0.018980Error 39 0.443770 0.011379Total 50 4.444729
Table 7.1(b) ANCOVA results for d13C of otolith carbonate.
Source df Type III SS MS F-value Level of significance
Otolith weight 2 .0253068 0.253068 12.99692 0.000874Location 1 0.328339 0.164170 1.59935 0.330794Year 5 0.382730 .076546 0.76252 0.629124Location*Year 3 0.351046 0.117015 6.00960 0.001815Error 39 0.759385 0.019471Total 50 2.659204
Replicate samples from each location, taken at the same time over several years, would be requiredbefore this method could be expected to provide a more definitive description of stock structureof S. lemuru in WA. The d18O data provide some evidence that S. lemuru caught at differentlocations have indeed lived most of their lives in waters of different temperatures, but this couldbe interpreted, for example, as resulting from a widespread stock. If differences between locationwere stable over time (Edmonds and Fletcher 1997) then this would provide evidence for delineationbetween locations.
The interesting results from these analyses were the substantial differences between large andsmall S. lemuru. The large differences in d18O for the single Carnarvon sample, and in the Geraldton1996 group, strongly suggest that smaller size classes of S. lemuru have been living in warmer water
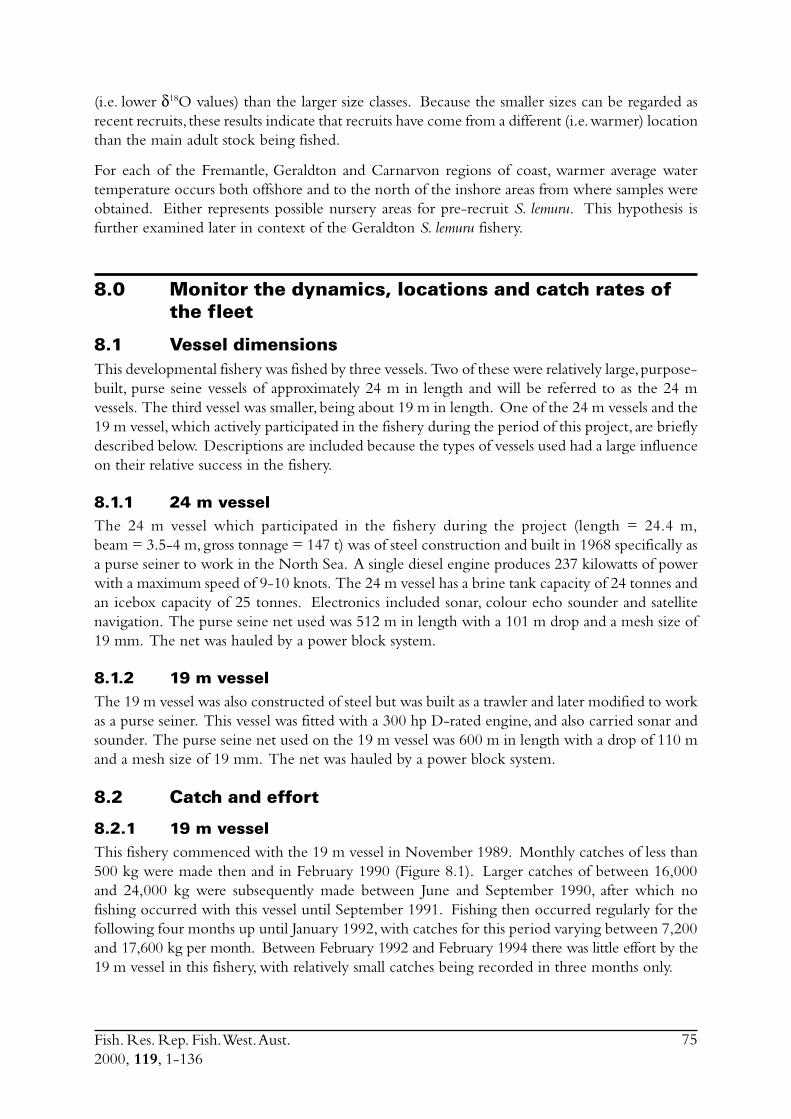
Fish. Res. Rep. Fish. West. Aust.2000, 119, 1-136
75
(i.e. lower d18O values) than the larger size classes. Because the smaller sizes can be regarded asrecent recruits, these results indicate that recruits have come from a different (i.e. warmer) locationthan the main adult stock being fished.
For each of the Fremantle, Geraldton and Carnarvon regions of coast, warmer average watertemperature occurs both offshore and to the north of the inshore areas from where samples wereobtained. Either represents possible nursery areas for pre-recruit S. lemuru. This hypothesis isfurther examined later in context of the Geraldton S. lemuru fishery.
8.0 Monitor the dynamics, locations and catch rates ofthe fleet
8.1 Vessel dimensionsThis developmental fishery was fished by three vessels. Two of these were relatively large, purpose-built, purse seine vessels of approximately 24 m in length and will be referred to as the 24 mvessels. The third vessel was smaller, being about 19 m in length. One of the 24 m vessels and the19 m vessel, which actively participated in the fishery during the period of this project, are brieflydescribed below. Descriptions are included because the types of vessels used had a large influenceon their relative success in the fishery.
8.1.1 24 m vesselThe 24 m vessel which participated in the fishery during the project (length = 24.4 m,beam = 3.5-4 m, gross tonnage = 147 t) was of steel construction and built in 1968 specifically asa purse seiner to work in the North Sea. A single diesel engine produces 237 kilowatts of powerwith a maximum speed of 9-10 knots. The 24 m vessel has a brine tank capacity of 24 tonnes andan icebox capacity of 25 tonnes. Electronics included sonar, colour echo sounder and satellitenavigation. The purse seine net used was 512 m in length with a 101 m drop and a mesh size of19 mm. The net was hauled by a power block system.
8.1.2 19 m vesselThe 19 m vessel was also constructed of steel but was built as a trawler and later modified to workas a purse seiner. This vessel was fitted with a 300 hp D-rated engine, and also carried sonar andsounder. The purse seine net used on the 19 m vessel was 600 m in length with a drop of 110 mand a mesh size of 19 mm. The net was hauled by a power block system.
8.2 Catch and effort
8.2.1 19 m vesselThis fishery commenced with the 19 m vessel in November 1989. Monthly catches of less than500 kg were made then and in February 1990 (Figure 8.1). Larger catches of between 16,000and 24,000 kg were subsequently made between June and September 1990, after which nofishing occurred with this vessel until September 1991. Fishing then occurred regularly for thefollowing four months up until January 1992, with catches for this period varying between 7,200and 17,600 kg per month. Between February 1992 and February 1994 there was little effort by the19 m vessel in this fishery, with relatively small catches being recorded in three months only.
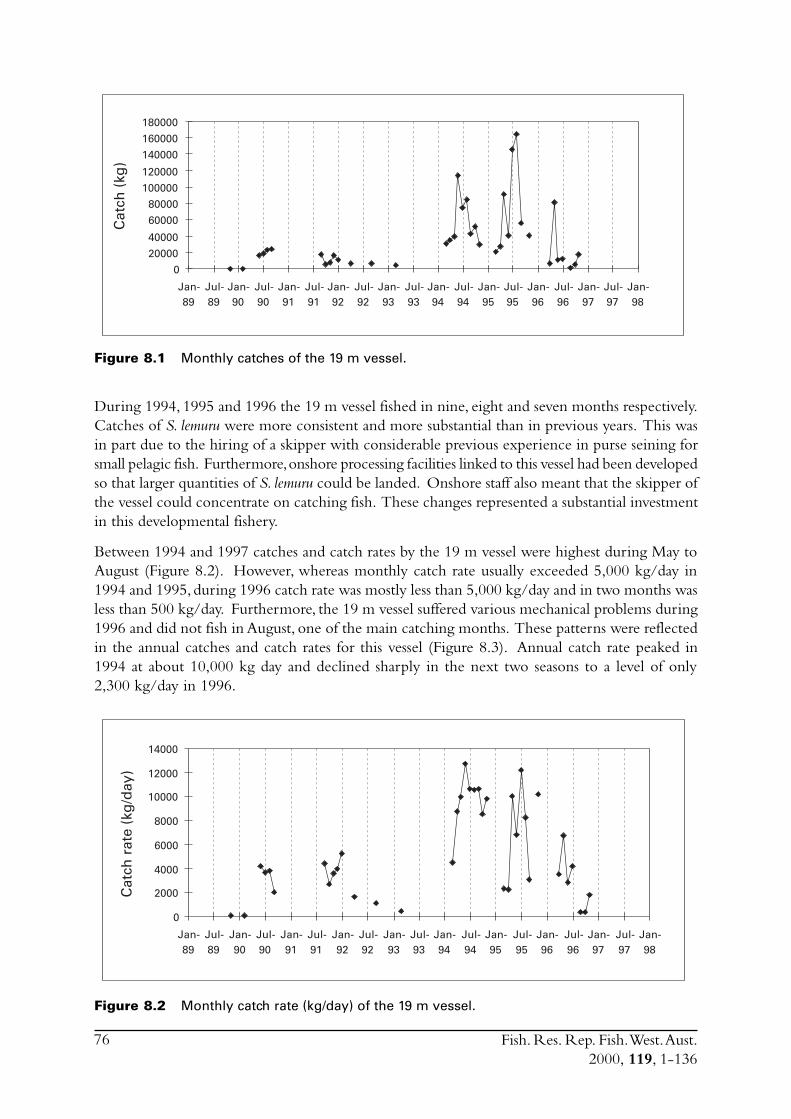
Fish. Res. Rep. Fish. West. Aust.2000, 119, 1-136
76
Figure 8.1 Monthly catches of the 19 m vessel.
During 1994, 1995 and 1996 the 19 m vessel fished in nine, eight and seven months respectively.Catches of S. lemuru were more consistent and more substantial than in previous years. This wasin part due to the hiring of a skipper with considerable previous experience in purse seining forsmall pelagic fish. Furthermore, onshore processing facilities linked to this vessel had been developedso that larger quantities of S. lemuru could be landed. Onshore staff also meant that the skipper ofthe vessel could concentrate on catching fish. These changes represented a substantial investmentin this developmental fishery.
Between 1994 and 1997 catches and catch rates by the 19 m vessel were highest during May toAugust (Figure 8.2). However, whereas monthly catch rate usually exceeded 5,000 kg/day in1994 and 1995, during 1996 catch rate was mostly less than 5,000 kg/day and in two months wasless than 500 kg/day. Furthermore, the 19 m vessel suffered various mechanical problems during1996 and did not fish in August, one of the main catching months. These patterns were reflectedin the annual catches and catch rates for this vessel (Figure 8.3). Annual catch rate peaked in1994 at about 10,000 kg day and declined sharply in the next two seasons to a level of only2,300 kg/day in 1996.
Cat
ch (
kg)
0
20000
40000
60000
80000
100000
120000
140000
160000
180000
Jan-89
Jul-89
Jan-90
Jul-90
Jan-91
Jul-91
Jan-92
Jul-92
Jan-93
Jul-93
Jan-94
Jul-94
Jan-95
Jul-95
Jan-96
Jul-96
Jan-97
Jul-97
Jan-98
Figure 8.2 Monthly catch rate (kg/day) of the 19 m vessel.
Jan-89
Jul-89
Jan-90
Jul-90
Jan-91
Jul-91
Jan-92
Jul-92
Jan-93
Jul-93
Jan-94
Jul-94
Jan-95
Jul-95
Jan-96
Jul-96
Jan-97
Jul-97
Jan-98
Cat
ch r
ate
(kg
/day
)
0
2000
4000
6000
8000
10000
12000
14000
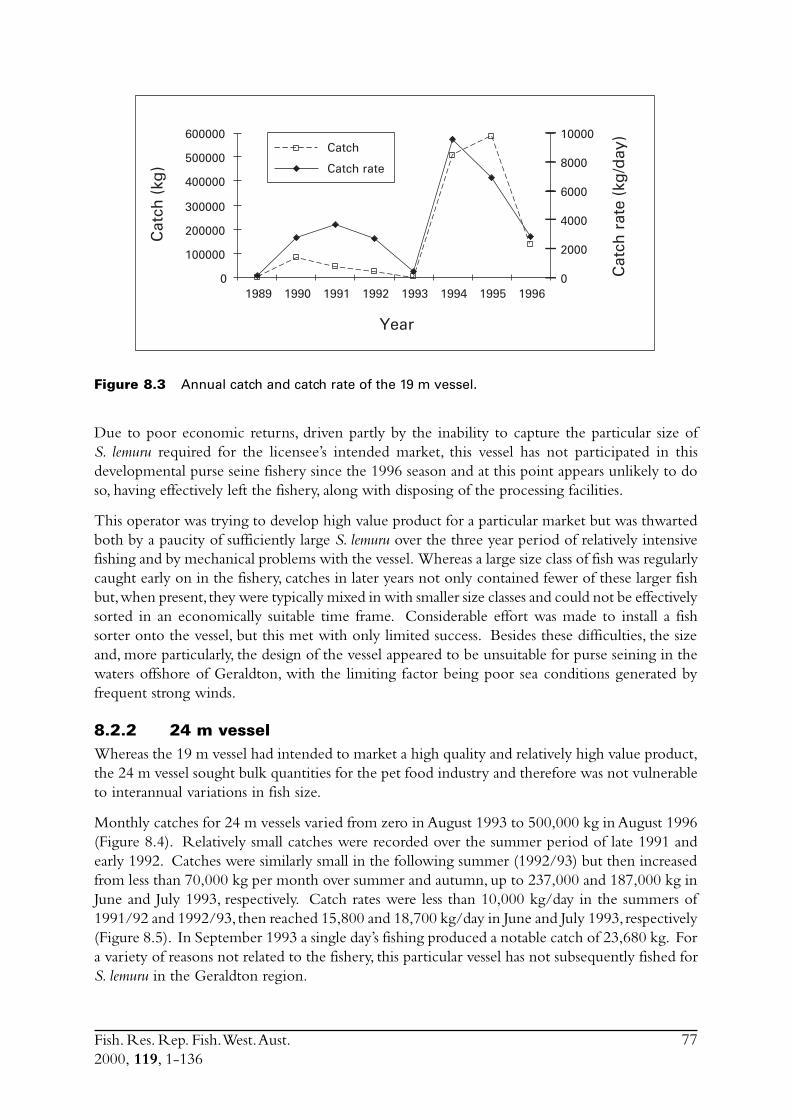
Fish. Res. Rep. Fish. West. Aust.2000, 119, 1-136
77
Figure 8.3 Annual catch and catch rate of the 19 m vessel.
Due to poor economic returns, driven partly by the inability to capture the particular size ofS. lemuru required for the licensee’s intended market, this vessel has not participated in thisdevelopmental purse seine fishery since the 1996 season and at this point appears unlikely to doso, having effectively left the fishery, along with disposing of the processing facilities.
This operator was trying to develop high value product for a particular market but was thwartedboth by a paucity of sufficiently large S. lemuru over the three year period of relatively intensivefishing and by mechanical problems with the vessel. Whereas a large size class of fish was regularlycaught early on in the fishery, catches in later years not only contained fewer of these larger fishbut, when present, they were typically mixed in with smaller size classes and could not be effectivelysorted in an economically suitable time frame. Considerable effort was made to install a fishsorter onto the vessel, but this met with only limited success. Besides these difficulties, the sizeand, more particularly, the design of the vessel appeared to be unsuitable for purse seining in thewaters offshore of Geraldton, with the limiting factor being poor sea conditions generated byfrequent strong winds.
8.2.2 24 m vesselWhereas the 19 m vessel had intended to market a high quality and relatively high value product,the 24 m vessel sought bulk quantities for the pet food industry and therefore was not vulnerableto interannual variations in fish size.
Monthly catches for 24 m vessels varied from zero in August 1993 to 500,000 kg in August 1996(Figure 8.4). Relatively small catches were recorded over the summer period of late 1991 andearly 1992. Catches were similarly small in the following summer (1992/93) but then increasedfrom less than 70,000 kg per month over summer and autumn, up to 237,000 and 187,000 kg inJune and July 1993, respectively. Catch rates were less than 10,000 kg/day in the summers of1991/92 and 1992/93, then reached 15,800 and 18,700 kg/day in June and July 1993, respectively(Figure 8.5). In September 1993 a single day’s fishing produced a notable catch of 23,680 kg. Fora variety of reasons not related to the fishery, this particular vessel has not subsequently fished forS. lemuru in the Geraldton region.
Year
Cat
ch (
kg)
Cat
ch r
ate
(kg
/day
)
1989 1990 1991 1992 1993 1994 1995 19960
100000
200000
300000
400000
500000
600000
0
2000
4000
6000
8000
10000Catch
Catch rate
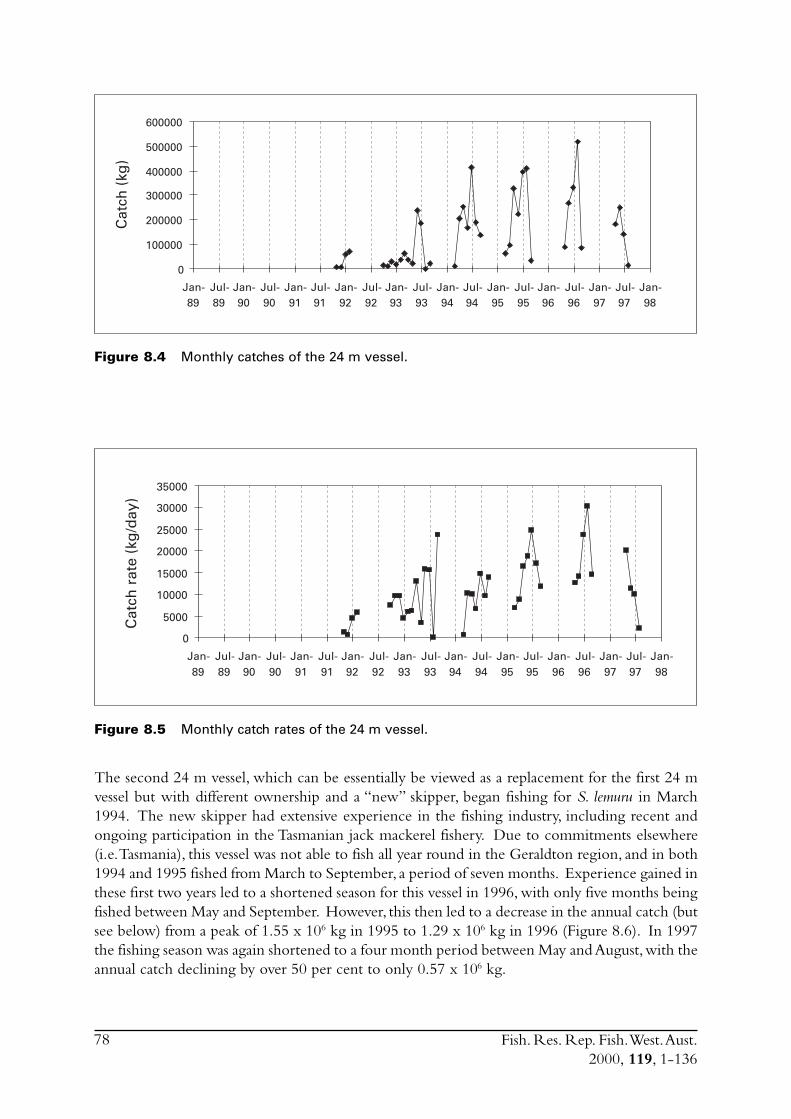
Fish. Res. Rep. Fish. West. Aust.2000, 119, 1-136
78
Figure 8.4 Monthly catches of the 24 m vessel.
Figure 8.5 Monthly catch rates of the 24 m vessel.
The second 24 m vessel, which can be essentially be viewed as a replacement for the first 24 mvessel but with different ownership and a “new” skipper, began fishing for S. lemuru in March1994. The new skipper had extensive experience in the fishing industry, including recent andongoing participation in the Tasmanian jack mackerel fishery. Due to commitments elsewhere(i.e. Tasmania), this vessel was not able to fish all year round in the Geraldton region, and in both1994 and 1995 fished from March to September, a period of seven months. Experience gained inthese first two years led to a shortened season for this vessel in 1996, with only five months beingfished between May and September. However, this then led to a decrease in the annual catch (butsee below) from a peak of 1.55 x 10⁶ kg in 1995 to 1.29 x 10⁶ kg in 1996 (Figure 8.6). In 1997the fishing season was again shortened to a four month period between May and August, with theannual catch declining by over 50 per cent to only 0.57 x 10⁶ kg.
Cat
ch (
kg)
0
100000
200000
300000
400000
500000
600000
Jan-89
Jul-89
Jan-90
Jul-90
Jan-91
Jul-91
Jan-92
Jul-92
Jan-93
Jul-93
Jan-94
Jul-94
Jan-95
Jul-95
Jan-96
Jul-96
Jan-97
Jul-97
Jan-98
Cat
ch r
ate
(kg
/day
)
0
5000
10000
15000
20000
25000
30000
35000
Jan-89
Jul-89
Jan-90
Jul-90
Jan-91
Jul-91
Jan-92
Jul-92
Jan-93
Jul-93
Jan-94
Jul-94
Jan-95
Jul-95
Jan-96
Jul-96
Jan-97
Jul-97
Jan-98
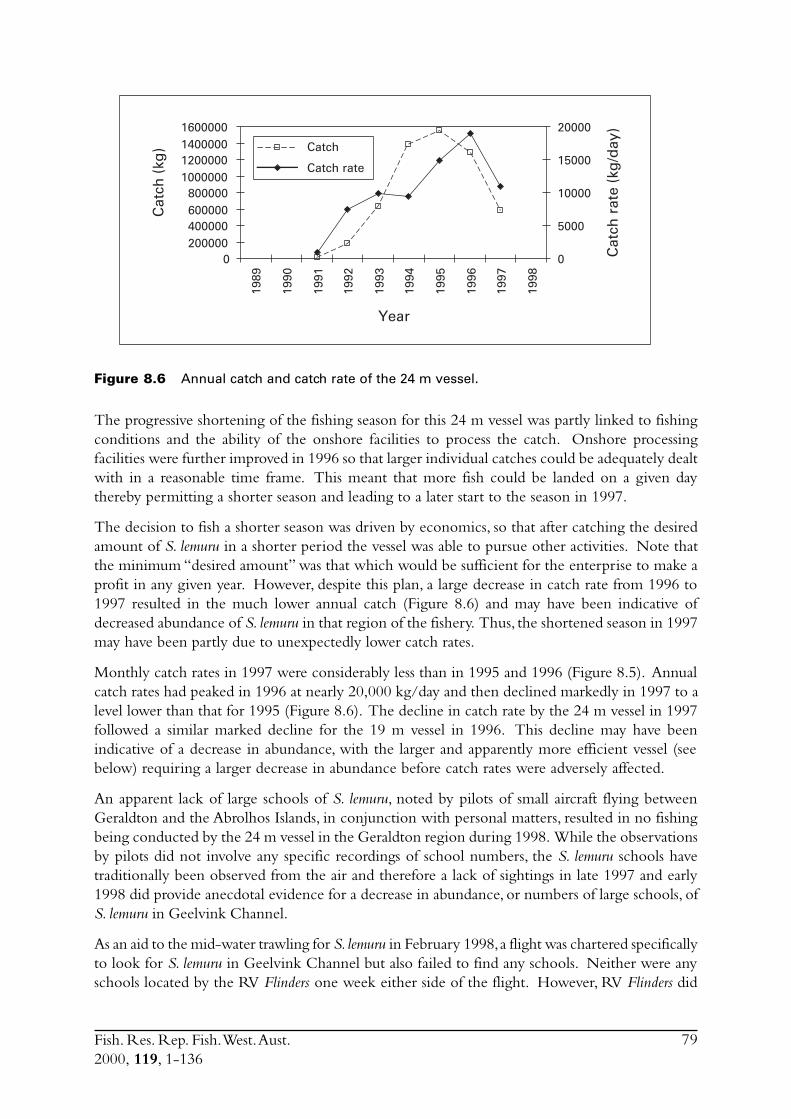
Fish. Res. Rep. Fish. West. Aust.2000, 119, 1-136
79
Figure 8.6 Annual catch and catch rate of the 24 m vessel.
The progressive shortening of the fishing season for this 24 m vessel was partly linked to fishingconditions and the ability of the onshore facilities to process the catch. Onshore processingfacilities were further improved in 1996 so that larger individual catches could be adequately dealtwith in a reasonable time frame. This meant that more fish could be landed on a given daythereby permitting a shorter season and leading to a later start to the season in 1997.
The decision to fish a shorter season was driven by economics, so that after catching the desiredamount of S. lemuru in a shorter period the vessel was able to pursue other activities. Note thatthe minimum “desired amount” was that which would be sufficient for the enterprise to make aprofit in any given year. However, despite this plan, a large decrease in catch rate from 1996 to1997 resulted in the much lower annual catch (Figure 8.6) and may have been indicative ofdecreased abundance of S. lemuru in that region of the fishery. Thus, the shortened season in 1997may have been partly due to unexpectedly lower catch rates.
Monthly catch rates in 1997 were considerably less than in 1995 and 1996 (Figure 8.5). Annualcatch rates had peaked in 1996 at nearly 20,000 kg/day and then declined markedly in 1997 to alevel lower than that for 1995 (Figure 8.6). The decline in catch rate by the 24 m vessel in 1997followed a similar marked decline for the 19 m vessel in 1996. This decline may have beenindicative of a decrease in abundance, with the larger and apparently more efficient vessel (seebelow) requiring a larger decrease in abundance before catch rates were adversely affected.
An apparent lack of large schools of S. lemuru, noted by pilots of small aircraft flying betweenGeraldton and the Abrolhos Islands, in conjunction with personal matters, resulted in no fishingbeing conducted by the 24 m vessel in the Geraldton region during 1998. While the observationsby pilots did not involve any specific recordings of school numbers, the S. lemuru schools havetraditionally been observed from the air and therefore a lack of sightings in late 1997 and early1998 did provide anecdotal evidence for a decrease in abundance, or numbers of large schools, ofS. lemuru in Geelvink Channel.
As an aid to the mid-water trawling for S. lemuru in February 1998, a flight was chartered specificallyto look for S. lemuru in Geelvink Channel but also failed to find any schools. Neither were anyschools located by the RV Flinders one week either side of the flight. However, RV Flinders did
0200000400000600000800000
1000000120000014000001600000
0
5000
10000
15000
20000
Year
Cat
ch (
kg)
Cat
ch r
ate
(kg
/day
)
1989
1990
1991
1992
1993
1994
1995
1996
1997
1998
Catch
Catch rate
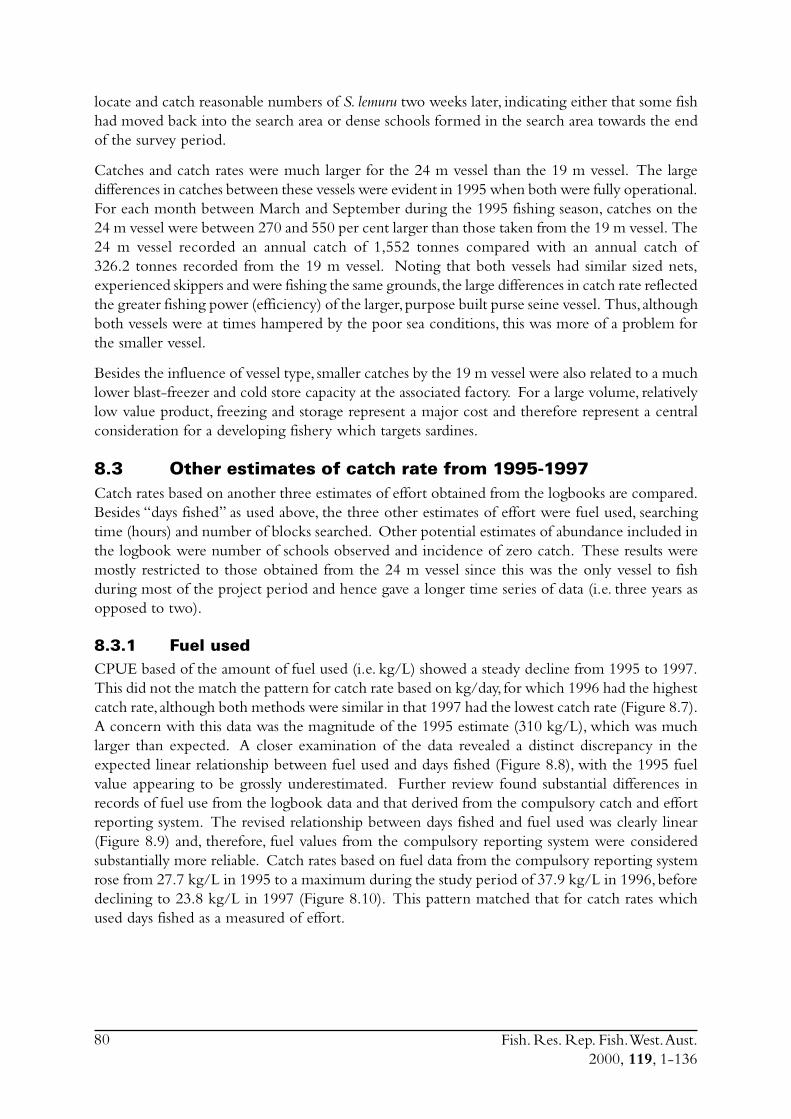
Fish. Res. Rep. Fish. West. Aust.2000, 119, 1-136
80
locate and catch reasonable numbers of S. lemuru two weeks later, indicating either that some fishhad moved back into the search area or dense schools formed in the search area towards the endof the survey period.
Catches and catch rates were much larger for the 24 m vessel than the 19 m vessel. The largedifferences in catches between these vessels were evident in 1995 when both were fully operational.For each month between March and September during the 1995 fishing season, catches on the24 m vessel were between 270 and 550 per cent larger than those taken from the 19 m vessel. The24 m vessel recorded an annual catch of 1,552 tonnes compared with an annual catch of326.2 tonnes recorded from the 19 m vessel. Noting that both vessels had similar sized nets,experienced skippers and were fishing the same grounds, the large differences in catch rate reflectedthe greater fishing power (efficiency) of the larger, purpose built purse seine vessel. Thus, althoughboth vessels were at times hampered by the poor sea conditions, this was more of a problem forthe smaller vessel.
Besides the influence of vessel type, smaller catches by the 19 m vessel were also related to a muchlower blast-freezer and cold store capacity at the associated factory. For a large volume, relativelylow value product, freezing and storage represent a major cost and therefore represent a centralconsideration for a developing fishery which targets sardines.
8.3 Other estimates of catch rate from 1995-1997Catch rates based on another three estimates of effort obtained from the logbooks are compared.Besides “days fished” as used above, the three other estimates of effort were fuel used, searchingtime (hours) and number of blocks searched. Other potential estimates of abundance included inthe logbook were number of schools observed and incidence of zero catch. These results weremostly restricted to those obtained from the 24 m vessel since this was the only vessel to fishduring most of the project period and hence gave a longer time series of data (i.e. three years asopposed to two).
8.3.1 Fuel usedCPUE based of the amount of fuel used (i.e. kg/L) showed a steady decline from 1995 to 1997.This did not the match the pattern for catch rate based on kg/day, for which 1996 had the highestcatch rate, although both methods were similar in that 1997 had the lowest catch rate (Figure 8.7).A concern with this data was the magnitude of the 1995 estimate (310 kg/L), which was muchlarger than expected. A closer examination of the data revealed a distinct discrepancy in theexpected linear relationship between fuel used and days fished (Figure 8.8), with the 1995 fuelvalue appearing to be grossly underestimated. Further review found substantial differences inrecords of fuel use from the logbook data and that derived from the compulsory catch and effortreporting system. The revised relationship between days fished and fuel used was clearly linear(Figure 8.9) and, therefore, fuel values from the compulsory reporting system were consideredsubstantially more reliable. Catch rates based on fuel data from the compulsory reporting systemrose from 27.7 kg/L in 1995 to a maximum during the study period of 37.9 kg/L in 1996, beforedeclining to 23.8 kg/L in 1997 (Figure 8.10). This pattern matched that for catch rates whichused days fished as a measured of effort.
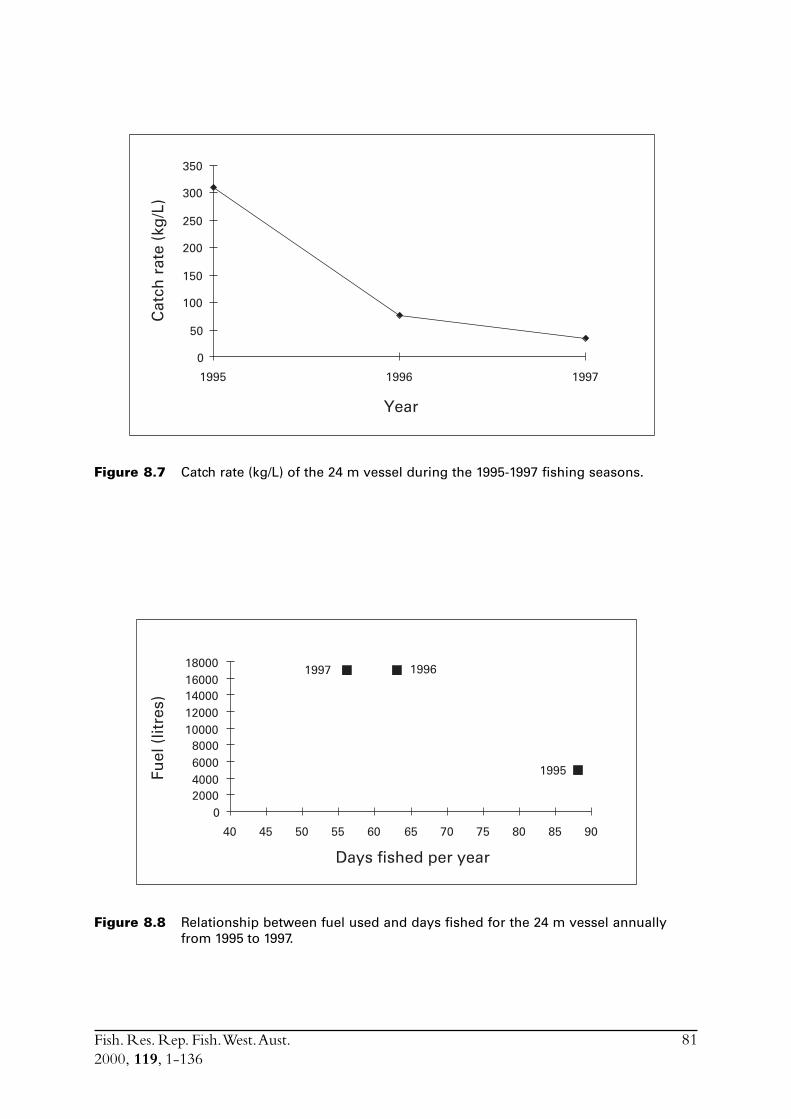
Fish. Res. Rep. Fish. West. Aust.2000, 119, 1-136
81
Figure 8.7 Catch rate (kg/L) of the 24 m vessel during the 1995-1997 fishing seasons.
Figure 8.8 Relationship between fuel used and days fished for the 24 m vessel annuallyfrom 1995 to 1997.
Year
Cat
ch r
ate
(kg
/L)
0
50
100
150
200
250
300
350
1995 1996 1997
Days fished per year
Fuel
(lit
res)
02000400060008000
1000012000140001600018000
40 45 50 55 60 65 70 75 80 85 90
1996
1995
1997
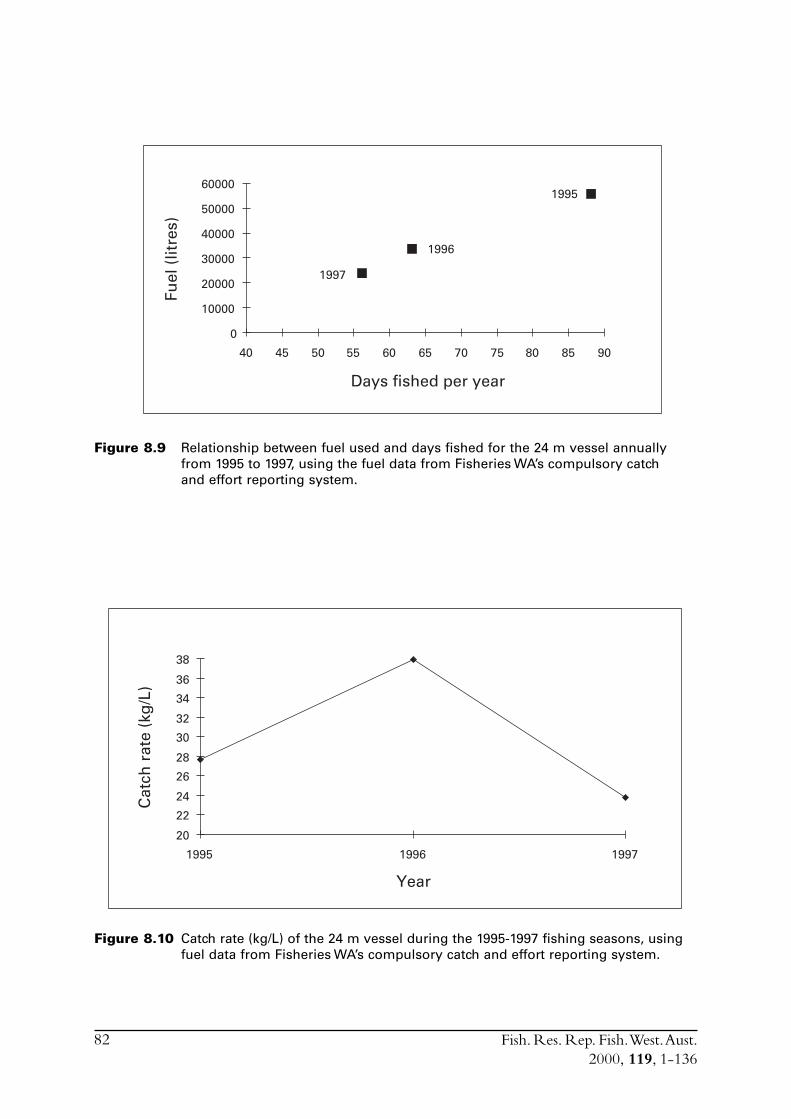
Fish. Res. Rep. Fish. West. Aust.2000, 119, 1-136
82
Figure 8.9 Relationship between fuel used and days fished for the 24 m vessel annuallyfrom 1995 to 1997, using the fuel data from Fisheries WA’s compulsory catchand effort reporting system.
Figure 8.10 Catch rate (kg/L) of the 24 m vessel during the 1995-1997 fishing seasons, usingfuel data from Fisheries WA’s compulsory catch and effort reporting system.
Days fished per year
Fuel
(lit
res)
0
10000
20000
30000
40000
50000
60000
40 45 50 55 60 65 70 75 80 85 90
1996
1995
1997
Year
Cat
ch r
ate
(kg
/L)
20
22
24
26
28
30
32
34
36
38
1995 1996 1997
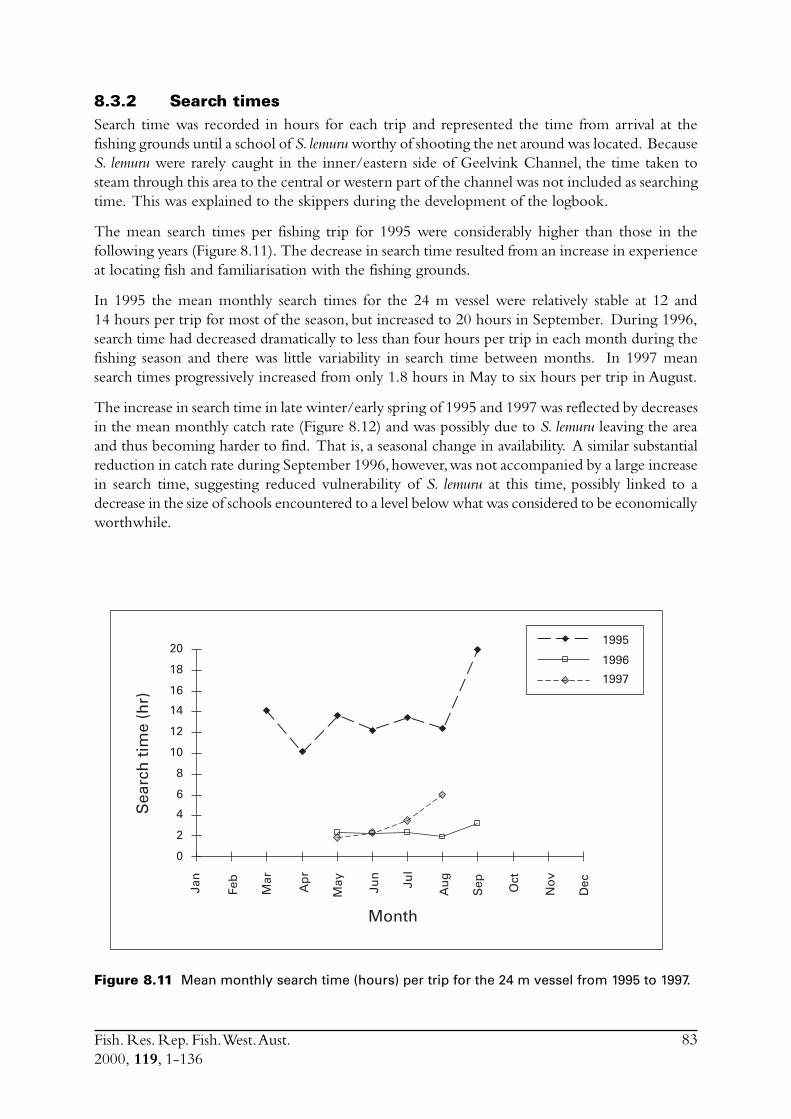
Fish. Res. Rep. Fish. West. Aust.2000, 119, 1-136
83
8.3.2 Search timesSearch time was recorded in hours for each trip and represented the time from arrival at thefishing grounds until a school of S. lemuru worthy of shooting the net around was located. BecauseS. lemuru were rarely caught in the inner/eastern side of Geelvink Channel, the time taken tosteam through this area to the central or western part of the channel was not included as searchingtime. This was explained to the skippers during the development of the logbook.
The mean search times per fishing trip for 1995 were considerably higher than those in thefollowing years (Figure 8.11). The decrease in search time resulted from an increase in experienceat locating fish and familiarisation with the fishing grounds.
In 1995 the mean monthly search times for the 24 m vessel were relatively stable at 12 and14 hours per trip for most of the season, but increased to 20 hours in September. During 1996,search time had decreased dramatically to less than four hours per trip in each month during thefishing season and there was little variability in search time between months. In 1997 meansearch times progressively increased from only 1.8 hours in May to six hours per trip in August.
The increase in search time in late winter/early spring of 1995 and 1997 was reflected by decreasesin the mean monthly catch rate (Figure 8.12) and was possibly due to S. lemuru leaving the areaand thus becoming harder to find. That is, a seasonal change in availability. A similar substantialreduction in catch rate during September 1996, however, was not accompanied by a large increasein search time, suggesting reduced vulnerability of S. lemuru at this time, possibly linked to adecrease in the size of schools encountered to a level below what was considered to be economicallyworthwhile.
Figure 8.11 Mean monthly search time (hours) per trip for the 24 m vessel from 1995 to 1997.
Month
Sea
rch
tim
e (h
r)
Jan
Feb
Mar
Ap
r
May Ju
n
Jul
Au
g
Sep Oct
No
v
Dec
0
2
4
6
8
10
12
14
16
18
201995
1996
1997
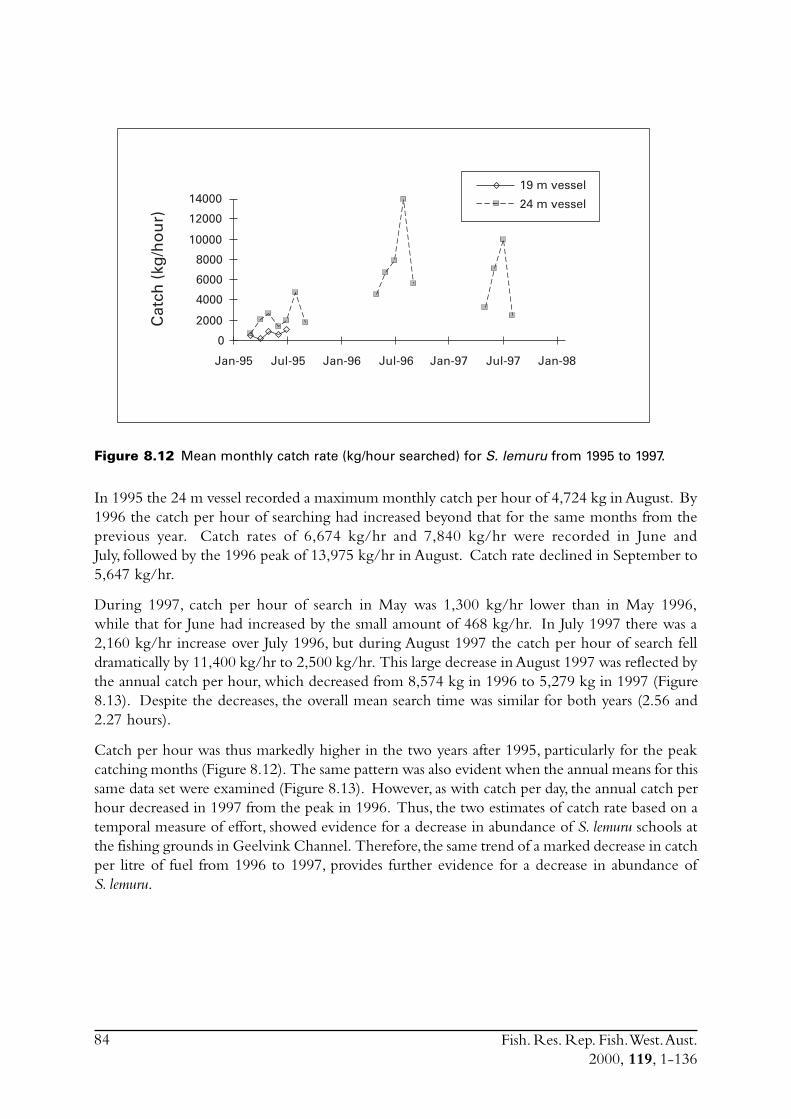
Fish. Res. Rep. Fish. West. Aust.2000, 119, 1-136
84
Figure 8.12 Mean monthly catch rate (kg/hour searched) for S. lemuru from 1995 to 1997.
In 1995 the 24 m vessel recorded a maximum monthly catch per hour of 4,724 kg in August. By1996 the catch per hour of searching had increased beyond that for the same months from theprevious year. Catch rates of 6,674 kg/hr and 7,840 kg/hr were recorded in June andJuly, followed by the 1996 peak of 13,975 kg/hr in August. Catch rate declined in September to5,647 kg/hr.
During 1997, catch per hour of search in May was 1,300 kg/hr lower than in May 1996,while that for June had increased by the small amount of 468 kg/hr. In July 1997 there was a2,160 kg/hr increase over July 1996, but during August 1997 the catch per hour of search felldramatically by 11,400 kg/hr to 2,500 kg/hr. This large decrease in August 1997 was reflected bythe annual catch per hour, which decreased from 8,574 kg in 1996 to 5,279 kg in 1997 (Figure8.13). Despite the decreases, the overall mean search time was similar for both years (2.56 and2.27 hours).
Catch per hour was thus markedly higher in the two years after 1995, particularly for the peakcatching months (Figure 8.12). The same pattern was also evident when the annual means for thissame data set were examined (Figure 8.13). However, as with catch per day, the annual catch perhour decreased in 1997 from the peak in 1996. Thus, the two estimates of catch rate based on atemporal measure of effort, showed evidence for a decrease in abundance of S. lemuru schools atthe fishing grounds in Geelvink Channel. Therefore, the same trend of a marked decrease in catchper litre of fuel from 1996 to 1997, provides further evidence for a decrease in abundance ofS. lemuru.
Cat
ch (
kg/h
ou
r)
0
2000
4000
6000
8000
10000
12000
14000
Jan-95 Jul-95 Jan-96 Jul-96 Jan-97 Jul-97 Jan-98
19 m vessel
24 m vessel
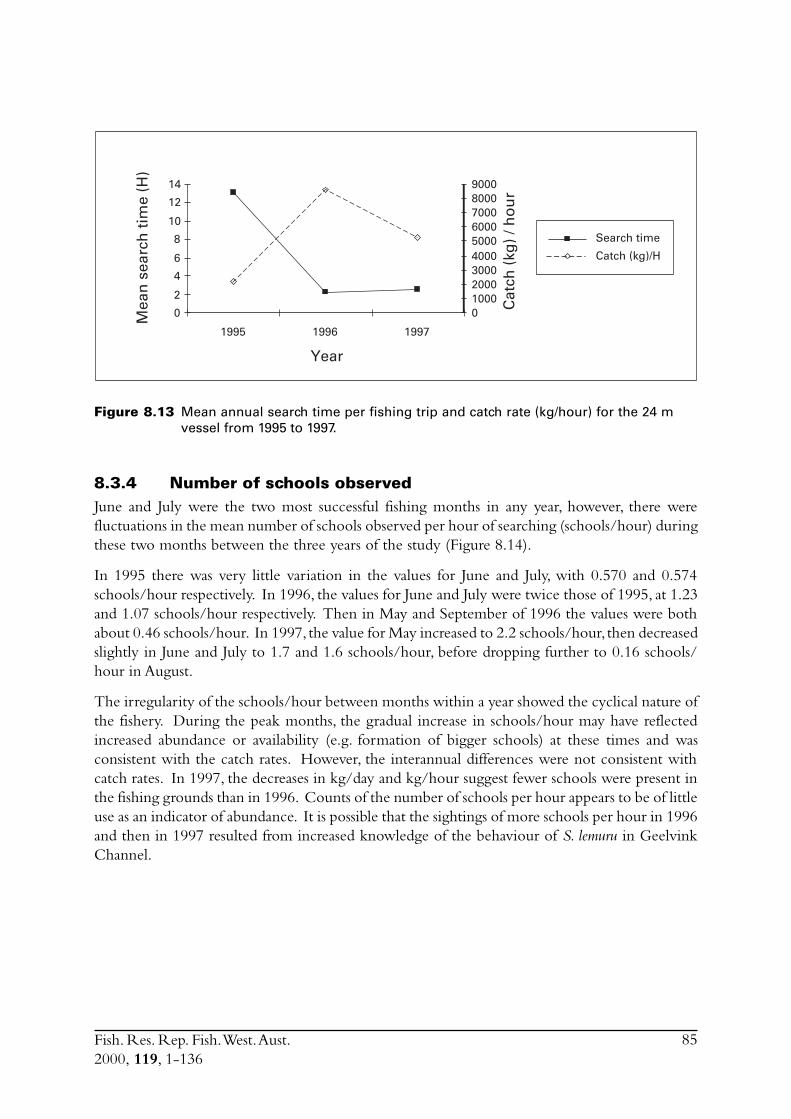
Fish. Res. Rep. Fish. West. Aust.2000, 119, 1-136
85
Figure 8.13 Mean annual search time per fishing trip and catch rate (kg/hour) for the 24 mvessel from 1995 to 1997.
8.3.4 Number of schools observedJune and July were the two most successful fishing months in any year, however, there werefluctuations in the mean number of schools observed per hour of searching (schools/hour) duringthese two months between the three years of the study (Figure 8.14).
In 1995 there was very little variation in the values for June and July, with 0.570 and 0.574schools/hour respectively. In 1996, the values for June and July were twice those of 1995, at 1.23and 1.07 schools/hour respectively. Then in May and September of 1996 the values were bothabout 0.46 schools/hour. In 1997, the value for May increased to 2.2 schools/hour, then decreasedslightly in June and July to 1.7 and 1.6 schools/hour, before dropping further to 0.16 schools/hour in August.
The irregularity of the schools/hour between months within a year showed the cyclical nature ofthe fishery. During the peak months, the gradual increase in schools/hour may have reflectedincreased abundance or availability (e.g. formation of bigger schools) at these times and wasconsistent with the catch rates. However, the interannual differences were not consistent withcatch rates. In 1997, the decreases in kg/day and kg/hour suggest fewer schools were present inthe fishing grounds than in 1996. Counts of the number of schools per hour appears to be of littleuse as an indicator of abundance. It is possible that the sightings of more schools per hour in 1996and then in 1997 resulted from increased knowledge of the behaviour of S. lemuru in GeelvinkChannel.
Year
Mea
n s
earc
h t
ime
(H)
Cat
ch (
kg)
/ ho
ur
1995 1996 1997
0
2
4
6
8
10
12
14
0100020003000400050006000700080009000
Search time
Catch (kg)/H
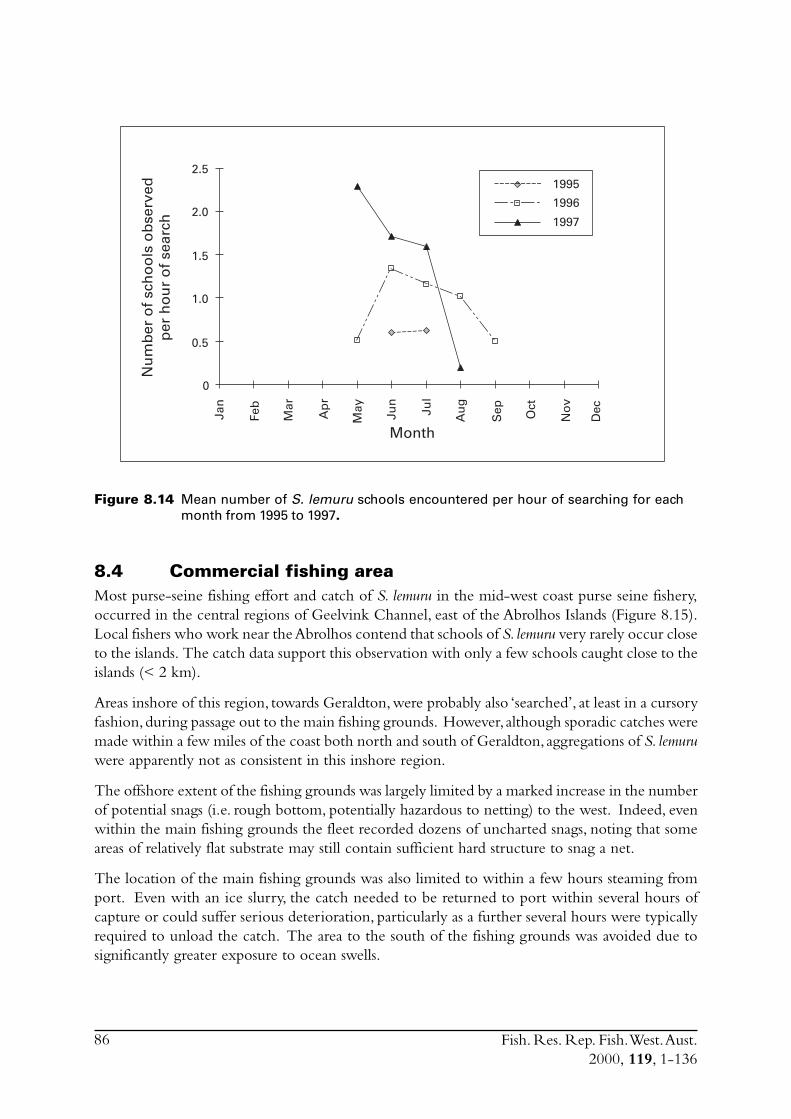
Fish. Res. Rep. Fish. West. Aust.2000, 119, 1-136
86
Figure 8.14 Mean number of S. lemuru schools encountered per hour of searching for eachmonth from 1995 to 1997.
8.4 Commercial fishing areaMost purse-seine fishing effort and catch of S. lemuru in the mid-west coast purse seine fishery,occurred in the central regions of Geelvink Channel, east of the Abrolhos Islands (Figure 8.15).Local fishers who work near the Abrolhos contend that schools of S. lemuru very rarely occur closeto the islands. The catch data support this observation with only a few schools caught close to theislands (< 2 km).
Areas inshore of this region, towards Geraldton, were probably also ‘searched’, at least in a cursoryfashion, during passage out to the main fishing grounds. However, although sporadic catches weremade within a few miles of the coast both north and south of Geraldton, aggregations of S. lemuruwere apparently not as consistent in this inshore region.
The offshore extent of the fishing grounds was largely limited by a marked increase in the numberof potential snags (i.e. rough bottom, potentially hazardous to netting) to the west. Indeed, evenwithin the main fishing grounds the fleet recorded dozens of uncharted snags, noting that someareas of relatively flat substrate may still contain sufficient hard structure to snag a net.
The location of the main fishing grounds was also limited to within a few hours steaming fromport. Even with an ice slurry, the catch needed to be returned to port within several hours ofcapture or could suffer serious deterioration, particularly as a further several hours were typicallyrequired to unload the catch. The area to the south of the fishing grounds was avoided due tosignificantly greater exposure to ocean swells.
Month
Nu
mb
er o
f sc
ho
ols
ob
serv
edp
er h
ou
r o
f se
arch
0
0.5
1.0
1.5
2.0
2.5
Jan
Feb
Mar
Ap
r
May
Jun
Jul
Au
g
Sep Oct
No
v
Dec
1997
1996
1995
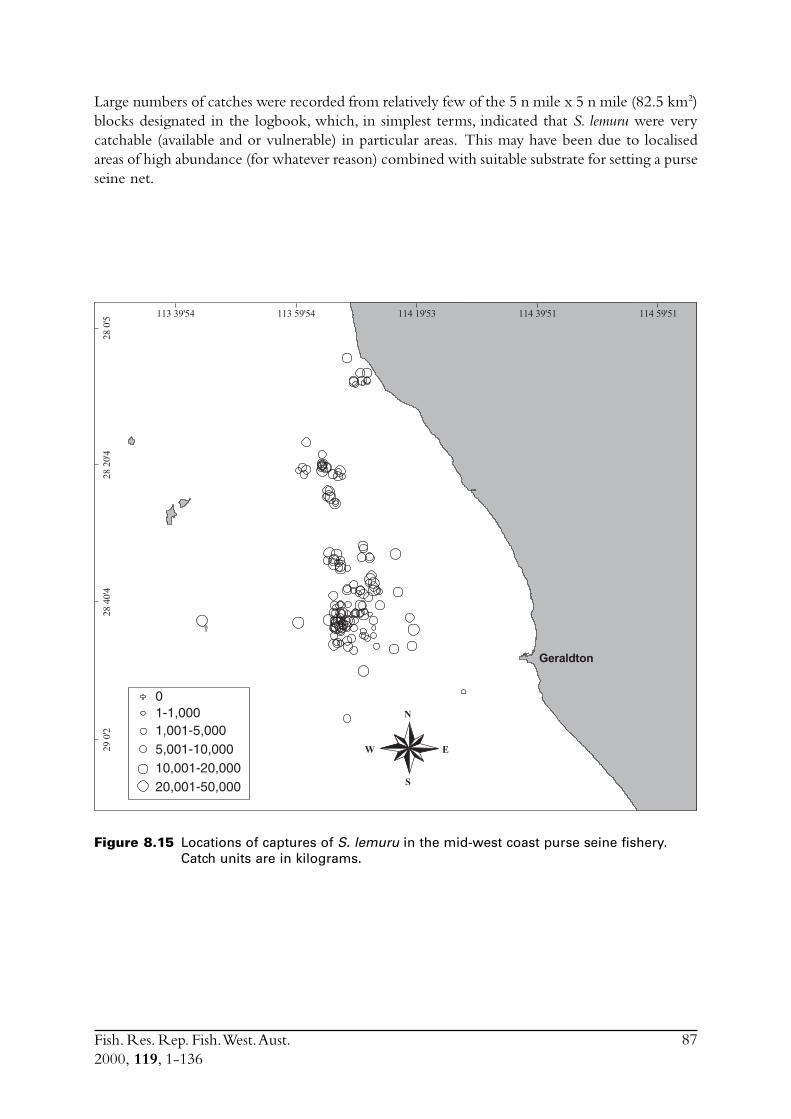
Fish. Res. Rep. Fish. West. Aust.2000, 119, 1-136
87
Large numbers of catches were recorded from relatively few of the 5 n mile x 5 n mile (82.5 km2)blocks designated in the logbook, which, in simplest terms, indicated that S. lemuru were verycatchable (available and or vulnerable) in particular areas. This may have been due to localisedareas of high abundance (for whatever reason) combined with suitable substrate for setting a purseseine net.
Figure 8.15 Locations of captures of S. lemuru in the mid-west coast purse seine fishery.Catch units are in kilograms.
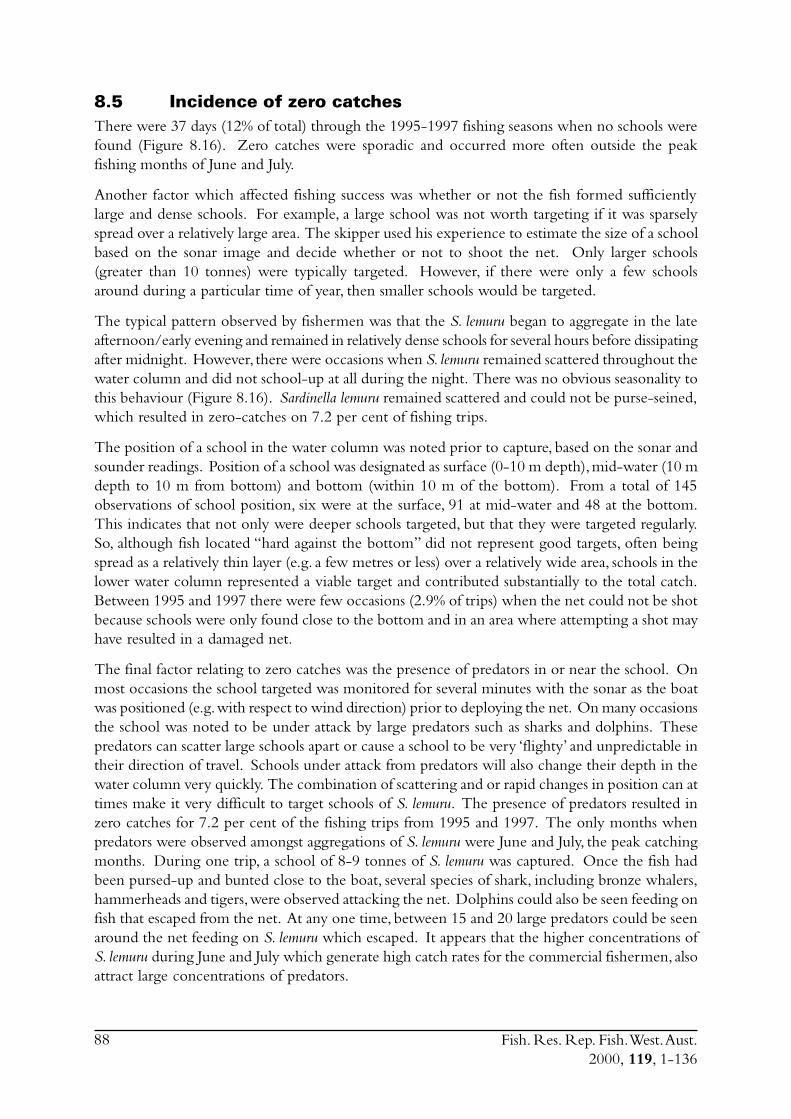
Fish. Res. Rep. Fish. West. Aust.2000, 119, 1-136
88
8.5 Incidence of zero catchesThere were 37 days (12% of total) through the 1995-1997 fishing seasons when no schools werefound (Figure 8.16). Zero catches were sporadic and occurred more often outside the peakfishing months of June and July.
Another factor which affected fishing success was whether or not the fish formed sufficientlylarge and dense schools. For example, a large school was not worth targeting if it was sparselyspread over a relatively large area. The skipper used his experience to estimate the size of a schoolbased on the sonar image and decide whether or not to shoot the net. Only larger schools(greater than 10 tonnes) were typically targeted. However, if there were only a few schoolsaround during a particular time of year, then smaller schools would be targeted.
The typical pattern observed by fishermen was that the S. lemuru began to aggregate in the lateafternoon/early evening and remained in relatively dense schools for several hours before dissipatingafter midnight. However, there were occasions when S. lemuru remained scattered throughout thewater column and did not school-up at all during the night. There was no obvious seasonality tothis behaviour (Figure 8.16). Sardinella lemuru remained scattered and could not be purse-seined,which resulted in zero-catches on 7.2 per cent of fishing trips.
The position of a school in the water column was noted prior to capture, based on the sonar andsounder readings. Position of a school was designated as surface (0-10 m depth), mid-water (10 mdepth to 10 m from bottom) and bottom (within 10 m of the bottom). From a total of 145observations of school position, six were at the surface, 91 at mid-water and 48 at the bottom.This indicates that not only were deeper schools targeted, but that they were targeted regularly.So, although fish located “hard against the bottom” did not represent good targets, often beingspread as a relatively thin layer (e.g. a few metres or less) over a relatively wide area, schools in thelower water column represented a viable target and contributed substantially to the total catch.Between 1995 and 1997 there were few occasions (2.9% of trips) when the net could not be shotbecause schools were only found close to the bottom and in an area where attempting a shot mayhave resulted in a damaged net.
The final factor relating to zero catches was the presence of predators in or near the school. Onmost occasions the school targeted was monitored for several minutes with the sonar as the boatwas positioned (e.g. with respect to wind direction) prior to deploying the net. On many occasionsthe school was noted to be under attack by large predators such as sharks and dolphins. Thesepredators can scatter large schools apart or cause a school to be very ‘flighty’ and unpredictable intheir direction of travel. Schools under attack from predators will also change their depth in thewater column very quickly. The combination of scattering and or rapid changes in position can attimes make it very difficult to target schools of S. lemuru. The presence of predators resulted inzero catches for 7.2 per cent of the fishing trips from 1995 and 1997. The only months whenpredators were observed amongst aggregations of S. lemuru were June and July, the peak catchingmonths. During one trip, a school of 8-9 tonnes of S. lemuru was captured. Once the fish hadbeen pursed-up and bunted close to the boat, several species of shark, including bronze whalers,hammerheads and tigers, were observed attacking the net. Dolphins could also be seen feeding onfish that escaped from the net. At any one time, between 15 and 20 large predators could be seenaround the net feeding on S. lemuru which escaped. It appears that the higher concentrations ofS. lemuru during June and July which generate high catch rates for the commercial fishermen, alsoattract large concentrations of predators.
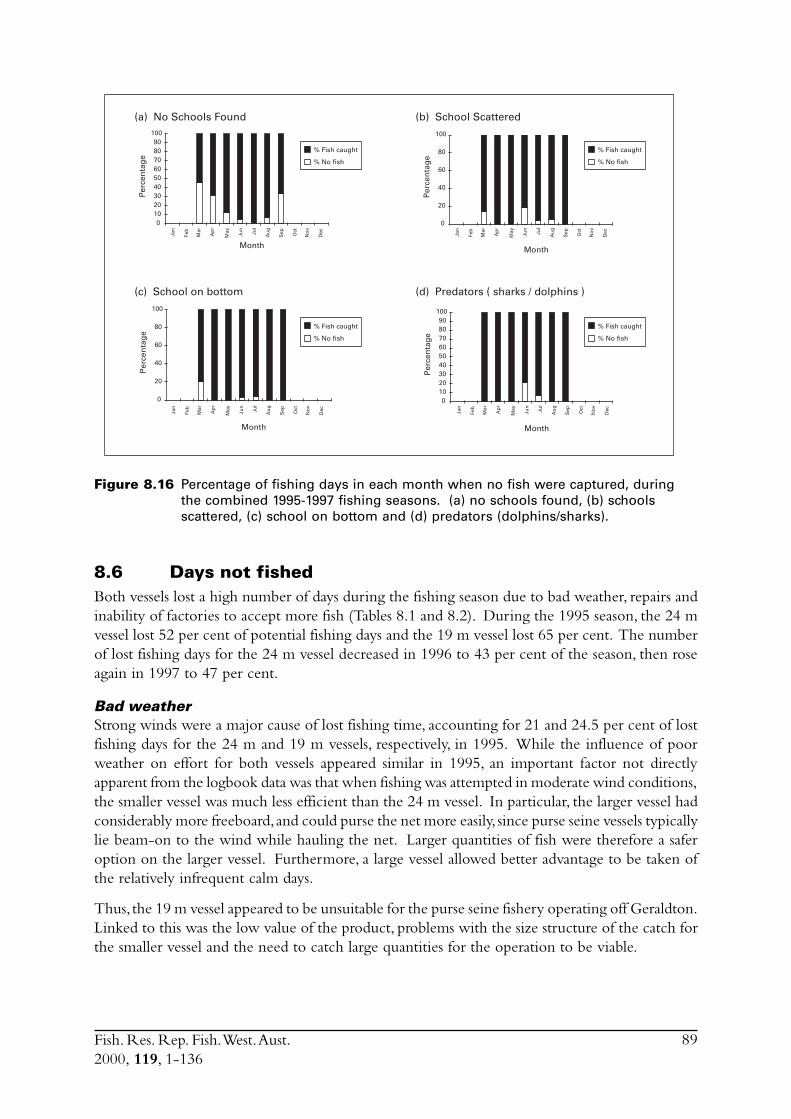
Fish. Res. Rep. Fish. West. Aust.2000, 119, 1-136
89
Figure 8.16 Percentage of fishing days in each month when no fish were captured, duringthe combined 1995-1997 fishing seasons. (a) no schools found, (b) schoolsscattered, (c) school on bottom and (d) predators (dolphins/sharks).
8.6 Days not fishedBoth vessels lost a high number of days during the fishing season due to bad weather, repairs andinability of factories to accept more fish (Tables 8.1 and 8.2). During the 1995 season, the 24 mvessel lost 52 per cent of potential fishing days and the 19 m vessel lost 65 per cent. The numberof lost fishing days for the 24 m vessel decreased in 1996 to 43 per cent of the season, then roseagain in 1997 to 47 per cent.
Bad weatherStrong winds were a major cause of lost fishing time, accounting for 21 and 24.5 per cent of lostfishing days for the 24 m and 19 m vessels, respectively, in 1995. While the influence of poorweather on effort for both vessels appeared similar in 1995, an important factor not directlyapparent from the logbook data was that when fishing was attempted in moderate wind conditions,the smaller vessel was much less efficient than the 24 m vessel. In particular, the larger vessel hadconsiderably more freeboard, and could purse the net more easily, since purse seine vessels typicallylie beam-on to the wind while hauling the net. Larger quantities of fish were therefore a saferoption on the larger vessel. Furthermore, a large vessel allowed better advantage to be taken ofthe relatively infrequent calm days.
Thus, the 19 m vessel appeared to be unsuitable for the purse seine fishery operating off Geraldton.Linked to this was the low value of the product, problems with the size structure of the catch forthe smaller vessel and the need to catch large quantities for the operation to be viable.
Month Month
Month Month
Per
cen
tag
e
Per
cen
tag
e
Per
cen
tag
e
Per
cen
tag
e
0102030405060708090
100
0
20
40
60
80
100
0
20
40
60
80
100
0102030405060708090
100
(b) School Scattered(a) No Schools Found
(d) Predators ( sharks / dolphins )(c) School on bottom
Jan
Feb
Mar
Ap
r
May
Jun
Jul
Au
g
Sep Oct
No
v
Dec
Jan
Feb
Mar
Ap
r
May
Jun
Jul
Au
g
Sep Oct
No
v
DecJan
Feb
Mar
Ap
r
May
Jun
Jul
Au
g
Sep Oct
No
v
Dec
Jan
Feb
Mar
Ap
r
May
Jun
Jul
Au
g
Sep Oct
No
v
Dec
% Fish caught
% No fish
% Fish caught
% No fish
% Fish caught
% No fish
% Fish caught
% No fish
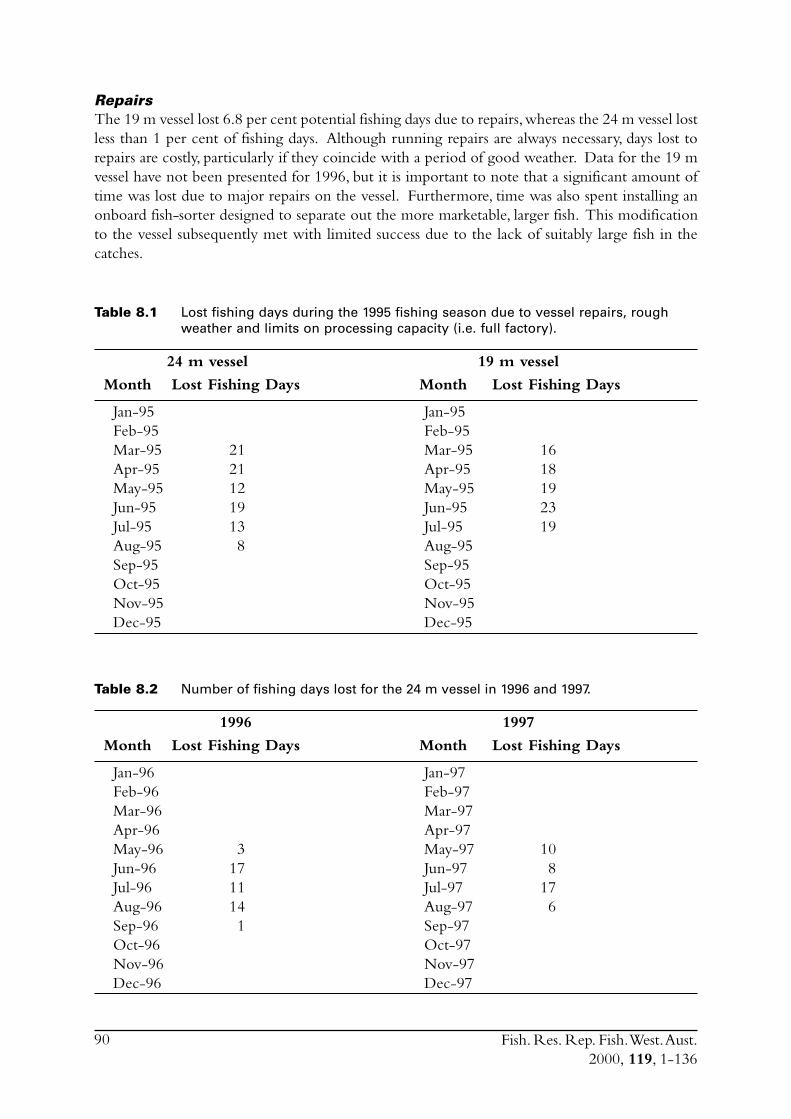
Fish. Res. Rep. Fish. West. Aust.2000, 119, 1-136
90
RepairsThe 19 m vessel lost 6.8 per cent potential fishing days due to repairs, whereas the 24 m vessel lostless than 1 per cent of fishing days. Although running repairs are always necessary, days lost torepairs are costly, particularly if they coincide with a period of good weather. Data for the 19 mvessel have not been presented for 1996, but it is important to note that a significant amount oftime was lost due to major repairs on the vessel. Furthermore, time was also spent installing anonboard fish-sorter designed to separate out the more marketable, larger fish. This modificationto the vessel subsequently met with limited success due to the lack of suitably large fish in thecatches.
Table 8.1 Lost fishing days during the 1995 fishing season due to vessel repairs, roughweather and limits on processing capacity (i.e. full factory).
24 m vessel 19 m vessel
Month Lost Fishing Days Month Lost Fishing Days
Jan-95 Jan-95Feb-95 Feb-95Mar-95 21 Mar-95 16Apr-95 21 Apr-95 18May-95 12 May-95 19Jun-95 19 Jun-95 23Jul-95 13 Jul-95 19Aug-95 8 Aug-95Sep-95 Sep-95Oct-95 Oct-95Nov-95 Nov-95Dec-95 Dec-95
Table 8.2 Number of fishing days lost for the 24 m vessel in 1996 and 1997.
1996 1997
Month Lost Fishing Days Month Lost Fishing Days
Jan-96 Jan-97Feb-96 Feb-97Mar-96 Mar-97Apr-96 Apr-97May-96 3 May-97 10Jun-96 17 Jun-97 8Jul-96 11 Jul-97 17Aug-96 14 Aug-97 6Sep-96 1 Sep-97Oct-96 Oct-97Nov-96 Nov-97Dec-96 Dec-97
Fish. Res. Rep. Fish. West. Aust.2000, 119, 1-136
91
Factory capacityThe standard practice employed by the Geraldton purse seine fleet for maintaining product quality,was to transport the product in an ice slurry, incorporating a chemical preservative, to onshorefacilities which would then freeze the fish as quickly as possible. The processing abilities of thefactories associated with each vessel were markedly different. This resulted in almost three timesmore days lost to “full” factories for the 19 m vessel over the 24 m vessel (20 days compared with7). Although storage freezer space was fairly compatible, the limit in blast freezer space accountedfor the higher number of lost days for the 19 m vessel. The fact that this occured at times whencatches were best, indicated that peak monthly catches for this fishery could have been substantiallyhigher.
Due to the limited fishing season, this probably impacted seriously on profit during 1995 andindicates the establishment of suitably large processing facilities is an important consideration fora developing fishery which targets high volume species. This is particularly crucial in warmerclimates where product deterioration can occur quickly. However, establishment of high-volumefreezer facilities is costly and represents a substantial investment. The establishment of large freezerscan be economically risky in a developmental fishery because catches may not be as high asexpected or a potential market(s) may not eventuate. Alternatively, lack of investment in processingfacilities may result in the “sustainable” yield never being realised.
8.7 Discussion
8.7.1 Catch ratesThe apparent decline in abundance of S. lemuru in Geelvink Channel, as indicated by threemethods of estimating catch rate, is difficult to interpret due to the extremely short time series ofdata. Large decreases in stock size of clupeoids are typically attributed to environmental variations,heavy fishing pressure, or a combination of these (e.g. Sharp and Csirke 1983). These possibilitieswill be examined as more monitoring takes place. For example, although the history of exploitationof S. lemuru in the Geraldton region has been short (i.e. only a few years), the possibility oflocalised depletion having already occurred cannot be ignored. Alternatively, some members ofthe Sardinella genus are known to undertake seasonal migrations in response to environmentaland biological conditions, with associated seasonal changes in catch rates (Mendelssohn and Cury1989).
The decline in catch rates in the Geraldton region happened in the same extended period thatS. lemuru became prevalent in the Fremantle region. Furthermore, S. lemuru, albeit an individual,was recorded in a catch of pilchards off Cape Naturaliste, 160 km south of Fremantle, for the firsttime in this same period. There is thus some evidence that a southward migration over anextended period (i.e. a shift or extension in distribution), rather than a strictly seasonal migration,occurred. This apparent shift occurs when water temperatures are relatively high in the Fremantleregion, close to the southern extent of S. lemuru’s range.
Interestingly, in contrast to the Geraldton fishery, commercial quantities of S. lemuru frequentlyoccur close inshore at Fremantle (i.e. within a few kilometres of port). The protected embaymentof Cockburn Sound may provide particularly good feeding conditions for S. lemuru, with annualcatches having reached 900-1100 tonnes in 1984-1986. Interannual variability in the magnitudeand duration of ‘high’ water temperatures along the lower west coast of WA, may thus be responsible
Fish. Res. Rep. Fish. West. Aust.2000, 119, 1-136
92
for the sporadic occurrence and varying persistence of relatively large quantities of S. lemuru in theFremantle region. Assuming these fish do in fact move into this southern area from further north,these events should accompany decreased abundance of S. lemuru in the Geraldton region.
While the causes for the decrease in catch rates in 1997 may not be fully understood, the importantpoint for the fishery is whether or not catch rates will improve when fishing continues. Thisawaits further monitoring of the fishery, particularly with respect to the timing and duration ofany improvements in future catch rates.
8.7.2 Development of the Geraldton purse seine fisheryThe relatively few calm days necessitate that large catches be made whenever possible, therefore,purse seining in the Geraldton region, which aims at supplying a high volume market, requires arelatively large vessel. However, associated with the limited history of the fishery was uncertaintyover whether or not large catches would continue. This dictated that it would be unwise to investtowards further substantial and rapid expansion of processing facilities, including freezing capacity,to levels that could accommodate substantially larger catches over even shorter periods.
The more successful operation in the mid-west coast developmental fishery was able to utiliseexisting freezer space and contracted, rather than purchased, a vessel. This practice meant thatinvestments were more or less on a year-to-year basis rather than for the long term. For a fisherywhich targets sardines, which typically undergo large fluctuations in stock size over relativelyshort periods, this was a safer business option. In 1998 when, for various reasons, little or no profitwas made from the target species, the business was able to continue essentially because it did nothave an overly large capital investment, and hence repayment commitments, relying on the purseseine fishery. Given the apparent decline in catch rate from 1996 to 1997, and the lack of anyfishing activity in 1998, this decision has been justified.
In at least the short term, factory capacity will likely continue to limit the catching ability of alarge vessel in those calm periods at the peak of the catching season.
As strong wind is the primary cause of lost fishing days and as further large investments in freezersare unlikely for this fishery, it is likely that around 50 per cent of potential fishing days in a typicalseason can be expected to be lost. Furthermore, the obvious impact on effort-levels for even arelatively large, purpose-built purse seiner, suggests a higher proportion of days would by lost bysmaller purse seine vessels working in Geelvink Channel.
Both licensees who participated in the developmental fishery had other business interests andhence were not totally financially reliant upon the S. lemuru resource. Although both investedheavily in the fishery, being a developmental fishery there has not been a problem with over-capitalization forcing unsustainable management, a problem seen in many of the world’s largefisheries. The instigation of a three-year developmental period for this fishery and the limitationduring this period to three licenses has, in retrospect, assisted in keeping investment at a reasonablelevel.
Fish. Res. Rep. Fish. West. Aust.2000, 119, 1-136
93
9.0 Conduct ichthyoplankton surveys to provide data forthe daily egg production method from whichestimates of the spawning biomass will be calculated
9.1 Plankton samplingIn the March 1994 survey (Shark Bay to Dongara) S. lemuru eggs were caught only in GeelvinkChannel (Figure 9.1), indicating that spawning adults were located in this region of the mid-westcoast at that time.
The series of monthly surveys between September 1995 and March 1996 confirmed that stocksof S. lemuru in the Geraldton region have a short spawning season which occurs in mid- to latesummer. No S. lemuru eggs or larvae were obtained in Geelvink Channel between Septemberand December 1995 (Figures 9.2a and b; 9.3a). Both were first recorded in early January 1996,with concentrations peaking in mid-February, at which time the spawning area (indicated by thenumber of positive stations) had increased (Figures 9.3b and c). By early March concentrationswere again low and in late March 1996 only a single egg was found in the samples collectedaboard RVFranklin (Figure 9.4).
While the monthly series of samples clearly indicated that spawning peaked in mid-February, thestations sampled were inadequate to cover the spawning area of S. lemuru. Thus, in the peakspawning month of February the largest concentrations of eggs occurred in an extensive “patch”at the northern limit of sampling, with smaller concentrations extending to the southern limit ofsampling (Figure 9.2c).
In early March, when numbers of eggs were less, the highest concentrations occurred at thesouthern limit of sampling (Figure 9.2d), indicating the possibility of more extensive spawningsouth of the sampling area. If so, this confounds the concept of a very short period of peakspawning. That is, spawning may be more temporally extensive than suggested but this is possiblybeing masked by spatial shifts in the areas of peak spawning beyond the areas sampled. Not onlydo areas of spawning shift over relatively short periods, but may do so regularly and in anunpredictable manner.
As the 1994 survey from Shark Bay to Dongara only found S. lemuru eggs in the region betweenthe Abrolhos Islands and the mainland (Figure 9.3), it was considered possible that spawning maynot have extended too far beyond the sampling area covered between September 1995 andMarch 1996. Thus, it was not clear whether or not the apparent shifts in area of peak spawningwere largely confined to the mid-west coast region, north and south of Geraldton, or whetherthey extended further along the coast. Unfortunately, the samples collected during the cruiseaboard RVFranklin between Exmouth and Fremantle could not support either hypothesis sincethis cruise missed the spawning period.
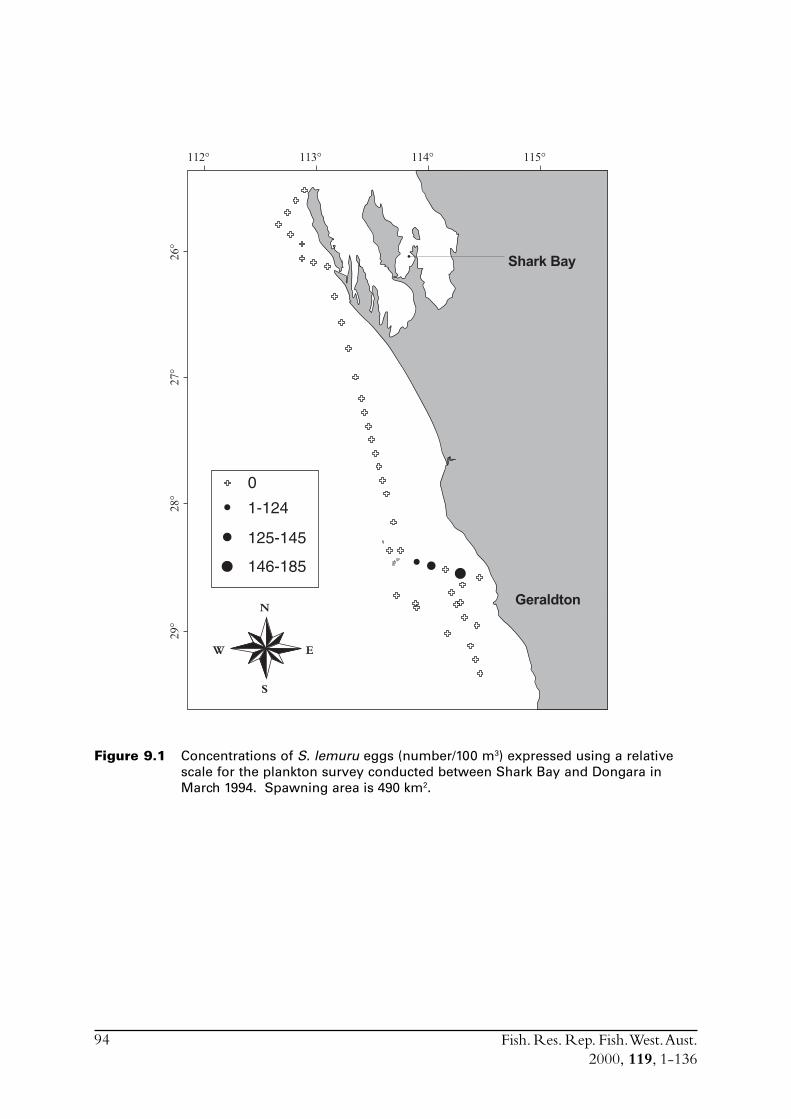
Fish. Res. Rep. Fish. West. Aust.2000, 119, 1-136
94
Figure 9.1 Concentrations of S. lemuru eggs (number/100 m3) expressed using a relativescale for the plankton survey conducted between Shark Bay and Dongara inMarch 1994. Spawning area is 490 km2.
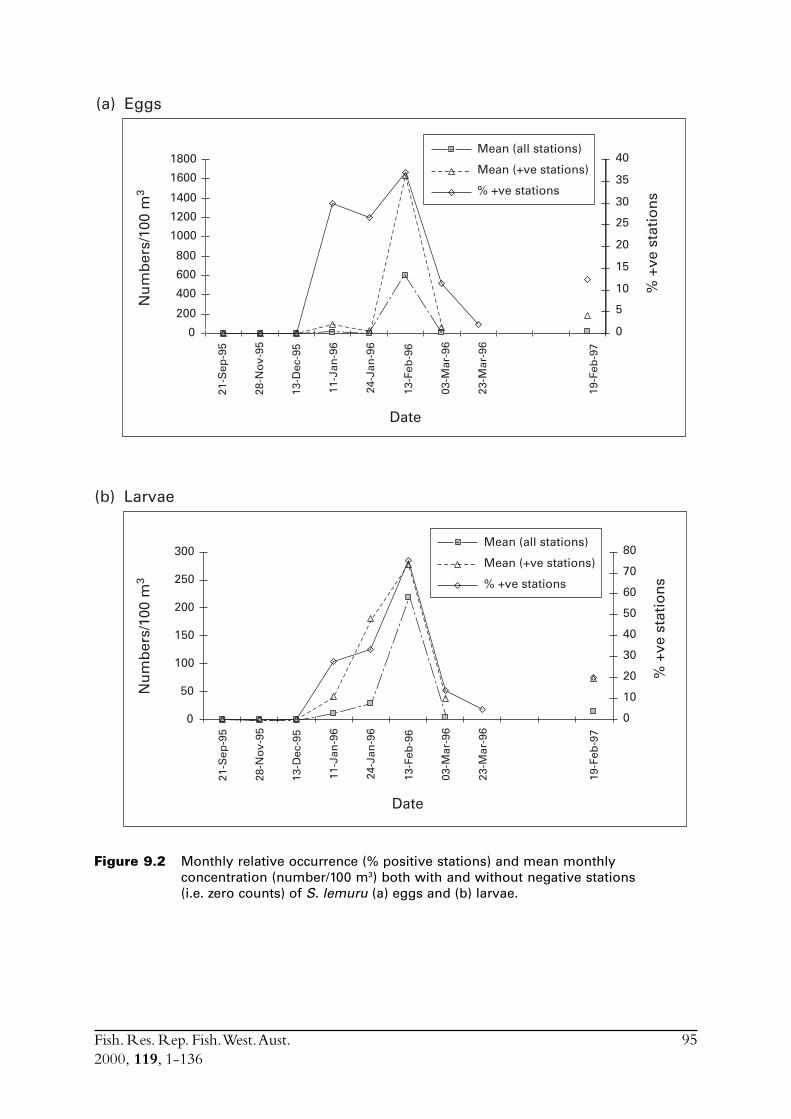
Fish. Res. Rep. Fish. West. Aust.2000, 119, 1-136
95
Figure 9.2 Monthly relative occurrence (% positive stations) and mean monthlyconcentration (number/100 m3) both with and without negative stations(i.e. zero counts) of S. lemuru (a) eggs and (b) larvae.
21-S
ep-9
5
28-N
ov-
95
13-D
ec-9
5
11-J
an-9
6
24-J
an-9
6
13-F
eb-9
6
03-M
ar-9
6
23-M
ar-9
6
19-F
eb-9
7
Nu
mb
ers/
100
m3
% +
ve s
tati
on
s
(a) Eggs
Mean (all stations)
Mean (+ve stations)
% +ve stations
0
5
10
15
20
25
30
35
40
0
200
400
600
800
1000
1200
1400
1600
1800
21-S
ep-9
5
28-N
ov-
95
13-D
ec-9
5
11-J
an-9
6
24-J
an-9
6
13-F
eb-9
6
03-M
ar-9
6
23-M
ar-9
6
19-F
eb-9
7
Date
Nu
mb
ers/
100
m3
% +
ve s
tati
on
s
(b) Larvae
0
10
20
30
40
50
60
70
80
0
50
100
150
200
250
300Mean (all stations)
Mean (+ve stations)
% +ve stations
Date
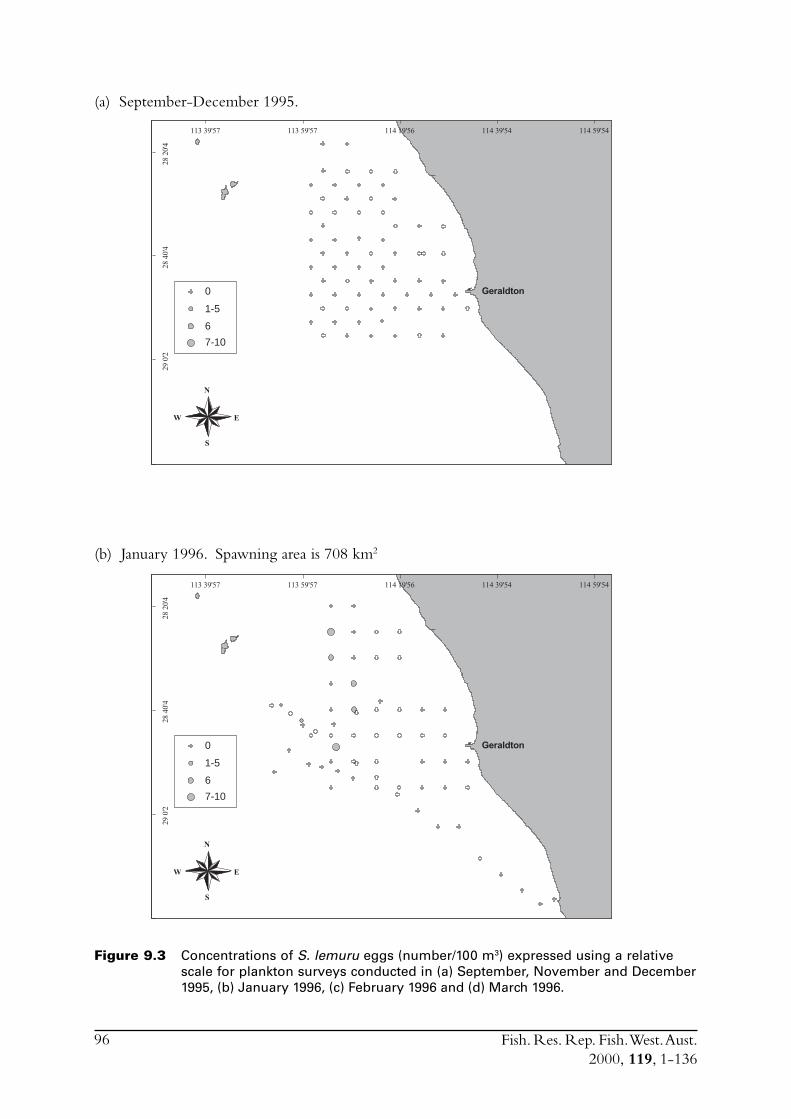
Fish. Res. Rep. Fish. West. Aust.2000, 119, 1-136
96
(a) September-December 1995.
N
E
S
W
0
1-5
6
7-10
(b) January 1996. Spawning area is 708 km2
Figure 9.3 Concentrations of S. lemuru eggs (number/100 m3) expressed using a relativescale for plankton surveys conducted in (a) September, November and December1995, (b) January 1996, (c) February 1996 and (d) March 1996.
N
E
S
W
0
1-5
6
7-10
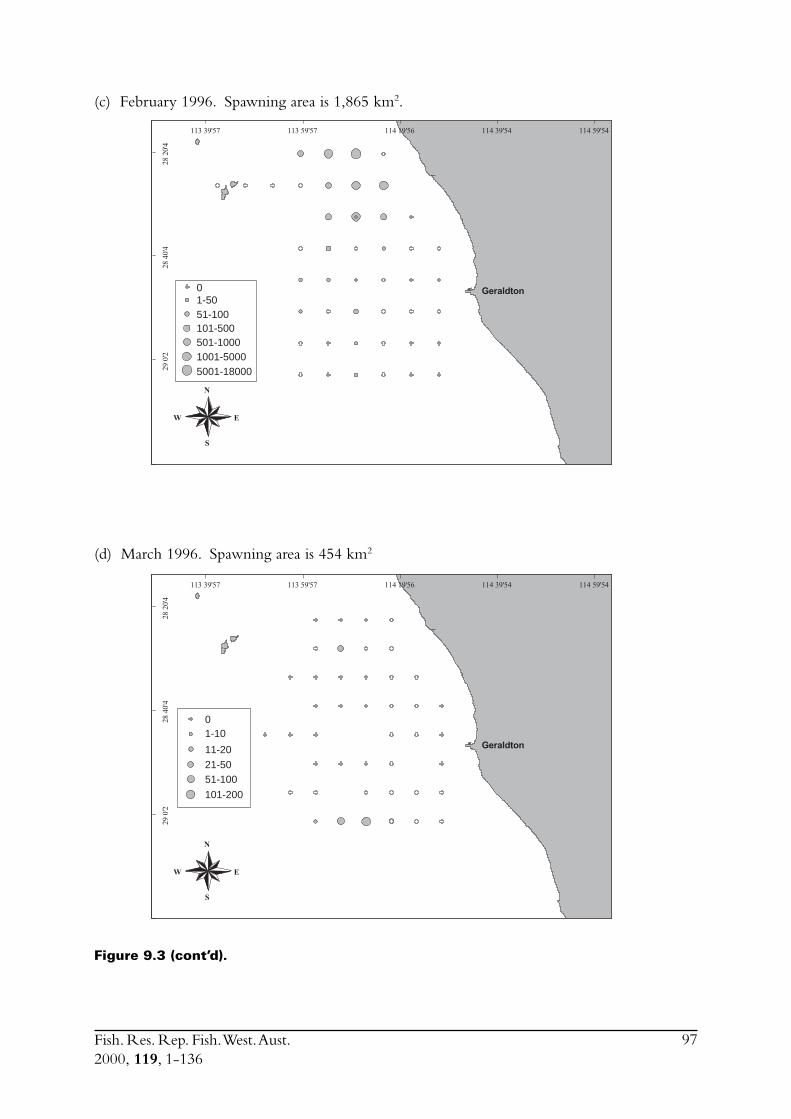
Fish. Res. Rep. Fish. West. Aust.2000, 119, 1-136
97
(c) February 1996. Spawning area is 1,865 km2.
(d) March 1996. Spawning area is 454 km2
Figure 9.3 (cont’d).
N
E
S
W
01-50
501-10001001-5000
51-100101-500
5001-18000
N
E
S
W
01-10
51-100
101-200
11-2021-50
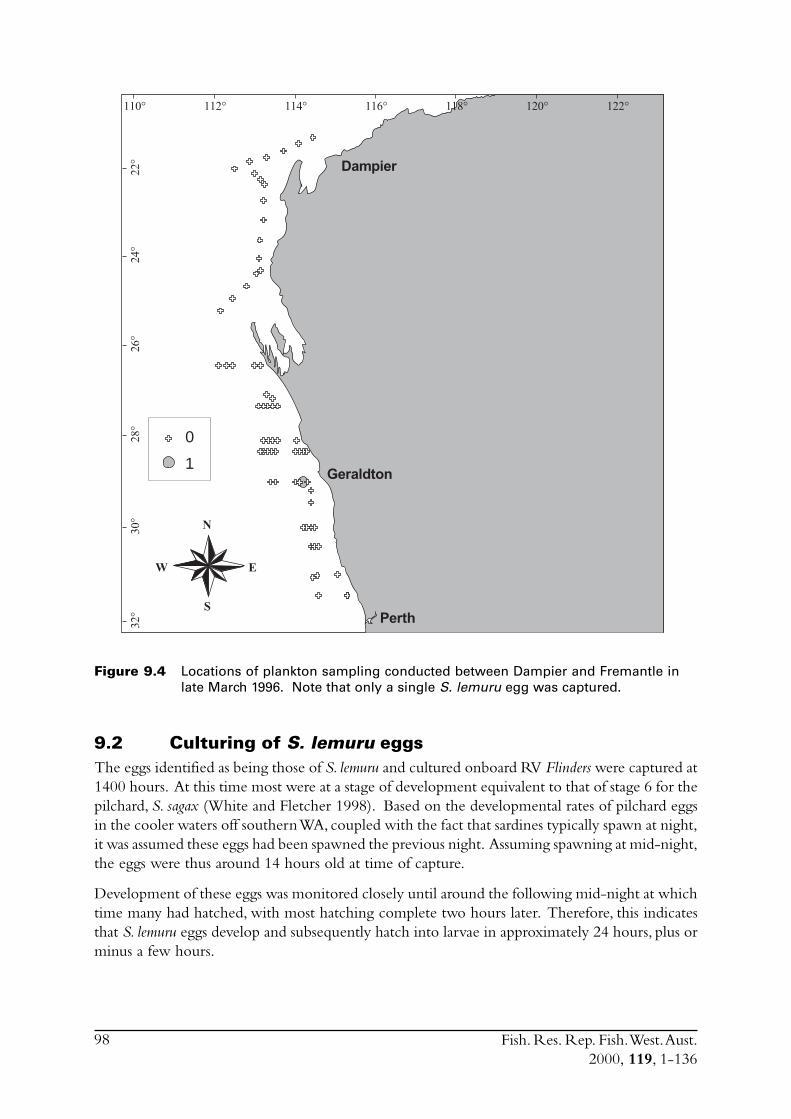
Fish. Res. Rep. Fish. West. Aust.2000, 119, 1-136
98
Figure 9.4 Locations of plankton sampling conducted between Dampier and Fremantle inlate March 1996. Note that only a single S. lemuru egg was captured.
9.2 Culturing of S. lemuru eggsThe eggs identified as being those of S. lemuru and cultured onboard RV Flinders were captured at1400 hours. At this time most were at a stage of development equivalent to that of stage 6 for thepilchard, S. sagax (White and Fletcher 1998). Based on the developmental rates of pilchard eggsin the cooler waters off southern WA, coupled with the fact that sardines typically spawn at night,it was assumed these eggs had been spawned the previous night. Assuming spawning at mid-night,the eggs were thus around 14 hours old at time of capture.
Development of these eggs was monitored closely until around the following mid-night at whichtime many had hatched, with most hatching complete two hours later. Therefore, this indicatesthat S. lemuru eggs develop and subsequently hatch into larvae in approximately 24 hours, plus orminus a few hours.
N
E
S
W
0
1
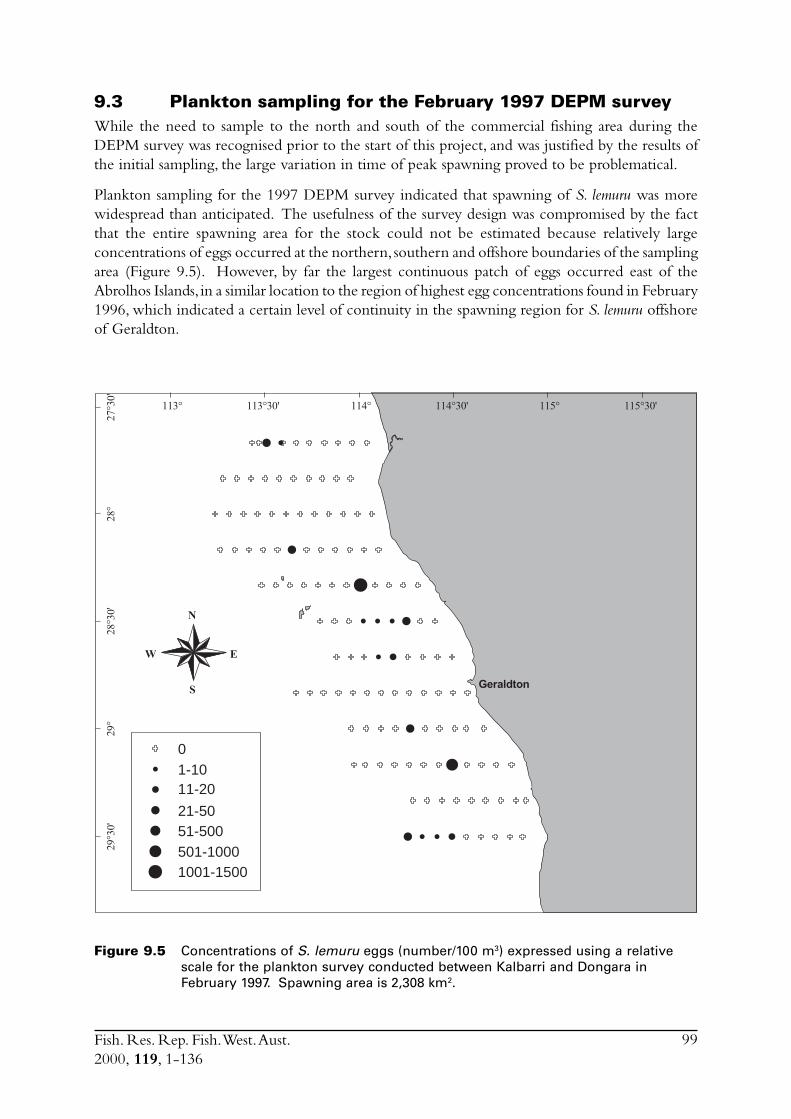
Fish. Res. Rep. Fish. West. Aust.2000, 119, 1-136
99
9.3 Plankton sampling for the February 1997 DEPM surveyWhile the need to sample to the north and south of the commercial fishing area during theDEPM survey was recognised prior to the start of this project, and was justified by the results ofthe initial sampling, the large variation in time of peak spawning proved to be problematical.
Plankton sampling for the 1997 DEPM survey indicated that spawning of S. lemuru was morewidespread than anticipated. The usefulness of the survey design was compromised by the factthat the entire spawning area for the stock could not be estimated because relatively largeconcentrations of eggs occurred at the northern, southern and offshore boundaries of the samplingarea (Figure 9.5). However, by far the largest continuous patch of eggs occurred east of theAbrolhos Islands, in a similar location to the region of highest egg concentrations found in February1996, which indicated a certain level of continuity in the spawning region for S. lemuru offshoreof Geraldton.
Figure 9.5 Concentrations of S. lemuru eggs (number/100 m3) expressed using a relativescale for the plankton survey conducted between Kalbarri and Dongara inFebruary 1997. Spawning area is 2,308 km2.
01-1011-20
21-5051-500501-10001001-1500
N
E
S
W
Fish. Res. Rep. Fish. West. Aust.2000, 119, 1-136
100
The distribution of S. lemuru eggs suggested that the stock is widespread along the mid-west coastof WA, predominantly across the outer half of the continental shelf, with a large aggregationperhaps located in Geelvink Channel. While there had been anecdotal evidence for large schoolsof small pelagic fish to the north of the Abrolhos Islands, further discussions with licensees subsequentto the survey, indicated that large concentrations also occurred to the south. However, it was alsopointed out that it was not known if these baitfish were S. lemuru.
Although there was a reasonable spatial distribution of S. lemuru eggs in the February 1997 survey,the numbers collected were not large. Furthermore, due to the relatively short development time,the range of developmental stages obtained was also small, with most eggs being more advancedthan stage 6. This, in turn, resulted in insufficient data to estimate egg production with any degreeof accuracy. Thus, whereas a CV for an estimate of egg production would hopefully be less than0.4 (e.g. Fletcher et al. 1996), that obtained for the February 1997 egg data was 2.6, which wasunacceptably high.
As the CVs associated with the DEPM parameters of egg production and spawning fraction aretypically greater than those for the other parameters, large confidence intervals around either (orboth) will result in a large range around the best estimate of spawning biomass.
9.4 Discussion
9.4.1 Application of the daily egg production method to estimatespawning biomass
The two significant problems with sampling adult S. lemuru during the 1997 and 1998 DEPMsurveys were (1) the small number of samples obtained and (2) the samples obtained indicatedthat the peak spawning period had been missed.
A pre-requisite for any DEPM survey is that it must be conducted close to the time of peakspawning. The main problem encountered with predicting spawning times for the DEPM surveywas the difficulty in obtaining samples of S. lemuru prior to the spawning months, which wouldhave allowed changes in GSI to be closely monitored. Commercial vessels were not operating atthese times and the availability of Fisheries WA’s RV Flinders was limited. As the RV Flinders hadto be booked up to a year in advance and was not available to sample S. lemuru in the monthsleading up to peak spawning, historical GSI values had to be used to predict the time of peakspawning. However, during the DEPM survey in February 1997, the mean GSI for females was0.72 and in February 1998 was only 0.75. These low GSI values, estimated in February of 1997and 1998, represented a huge reduction in mean GSI compared with GSI values for Februaries ofearlier years, when it was considerably higher ( ~ 4.7). These low GSI values also indicated thatthere was comparatively little spawning activity when the surveys were attempted. This confirmedthe general lack of spawning activity observed in freshly caught S. lemuru aboard RV Flinders, andjustified not conducting the plankton survey in 1998. Thus, for two consecutive years the peakspawning period was not identified.
The purpose of the mid-water trawling aboard RV Flinders was to catch S. lemuru so that the adultparameters could be estimated. However, the number of samples obtained in February 1997(n = 7) and 1998 (n = 6) was insufficient in each case to obtain reliable estimates of adultparameters, with the recognised minimum number of samples for this type of survey being35 (Alheit 1993). Note that besides the limited numbers of samples obtained, the area sampled ineach year was also limited and thus it is possible that the peak spawning area was missed, althoughthere is no evidence for this.
Fish. Res. Rep. Fish. West. Aust.2000, 119, 1-136
101
Finally, estimates of fecundity were only available for S. lemuru collected prior to the project(1990-1994) and these were for fish which weighed between 85 and 128 g, considerably higherthan the average weight of females collected during the study period (i.e. ~40 g). Because of thislarge size difference and since fecundity of sardines can vary between years, no estimate of fecunditywas available for the DEPM method.
This lack of success with the adult sampling essentially nullified any possibility of obtaining evenan approximation of the spawning biomass. Thus, while a reasonable estimation of average weightcould be obtained from the adults caught during the survey, and sex ratio could be determinedfrom the longer term data for this species, the imprecision expected with an estimate of spawningfraction from a sample of only seven and the lack of fecundity data meant that the estimate ofspawning biomass would have very large confidence intervals.
In summary, a combination of the very small sample size of adults, the fact that the peak spawningperiod (or area) was missed, and insufficient egg data from which to obtain an estimate of eggproduction, meant that it was not worth pursuing an estimate of spawning biomass using theDEPM technique.
9.4.2 Spatial extent of spawningThe spawning area for various surveys was estimated from the distribution of positive stations (i.e.ò 1 egg). Polygons were drawn around groups of positive stations, or isolated positive stations,with the extent of each polygon being defined by the distance between transects and betweenstations along transects. In those cases where a negative station was embedded, or partially embedded,within a group of positive station then this was also considered to represent part of the spawningarea.
Spawning area at those times when spawning was not at its seasonal peak was generally around400-700 km2 (Figures 9.1, 9.2b and d) In February 1996 when spawning activity was moresubstantial, the spawning area was 1,865 km2 (Figure 9.2c), representing 2-3 times the area recordedin the previous and following months.
During the more extensive survey of February 1997 the spawning area was 2308 km2 (Figure9.5). While this represents the best estimate of spawning area for S. lemuru along the mid-westcoast, it is obvious that the 1,865 km2 estimated for February 1996 resulted from a considerablysmaller sampling area. Thus, the February 1997 estimate may under-represent spawning areasince the peak spawning period was missed.
The estimates of spawning area and the patterns of egg distribution, do not provide evidence of alarge and extensive stock, but rather of a dispersed stock with relatively large distances betweenwhat are possibly quite small aggregations.
Fish. Res. Rep. Fish. West. Aust.2000, 119, 1-136
102
10.0 Environmental conditions - influence on the biologyof S. lemuru and the developmental fishery
Note that much of the material on environmental conditions presented in this sectionhas been taken from the comprehensive review paper “The Leeuwin Current and theHoutman Abrolhos Islands” (Pearce 1997).
10.1 WindSeasonal variation in the climate of the Abrolhos Islands is largely a result of the meridional shiftin the axis of the subtropical high-pressure belt (Scott 1983). During summer, the high-pressureridge lies well to the south and the local winds are dominantly southerly. During autumn andwinter, the ridge migrates northwards and as a result of the shifting high pressure cells the windsare highly variable (Pearce 1997). The ridge returns southwards during spring and the southerlywinds return.
The mean annual 1500 hours wind speed is 23.61 km/hr (6.6 m/s) at Geraldton, very similar tothe 24.44 km/hr recorded at North Island. However the mean 09:00 wind speed for the year atGeraldton is 18.4 km/hr (5.1 m/s) compared with 24.49 km/hr (6.8 m/s) at North Island. Thisindicates the winds at the islands are more persistent than on the mainland. Although there wassome variation in wind speed and direction at Geraldton, the winds at the islands blowpredominantly from the south with little variation in strength or direction. It is also evident thatthere is much greater variability in wind direction on the mainland coast than at the islands(Figure 10.1). The greatest variability in wind direction at the islands occurs during the wintermonths.
On the mainland, the morning wind direction during the hotter summer months is predominantlyeasterly (NE, E or SE). However, by 1500 hours the wind is nearly always from the south, withdiurnal heating and cooling of the land resulting in a distinctive sea breeze pattern on the mainlandcoast.
The winds at the islands also show a diurnal pattern, however it is not as pronounced as that onthe mainland coast. The data also show that the afternoon winds at the islands during the summermonths are strong (often > 30 km/hr) and from the south.
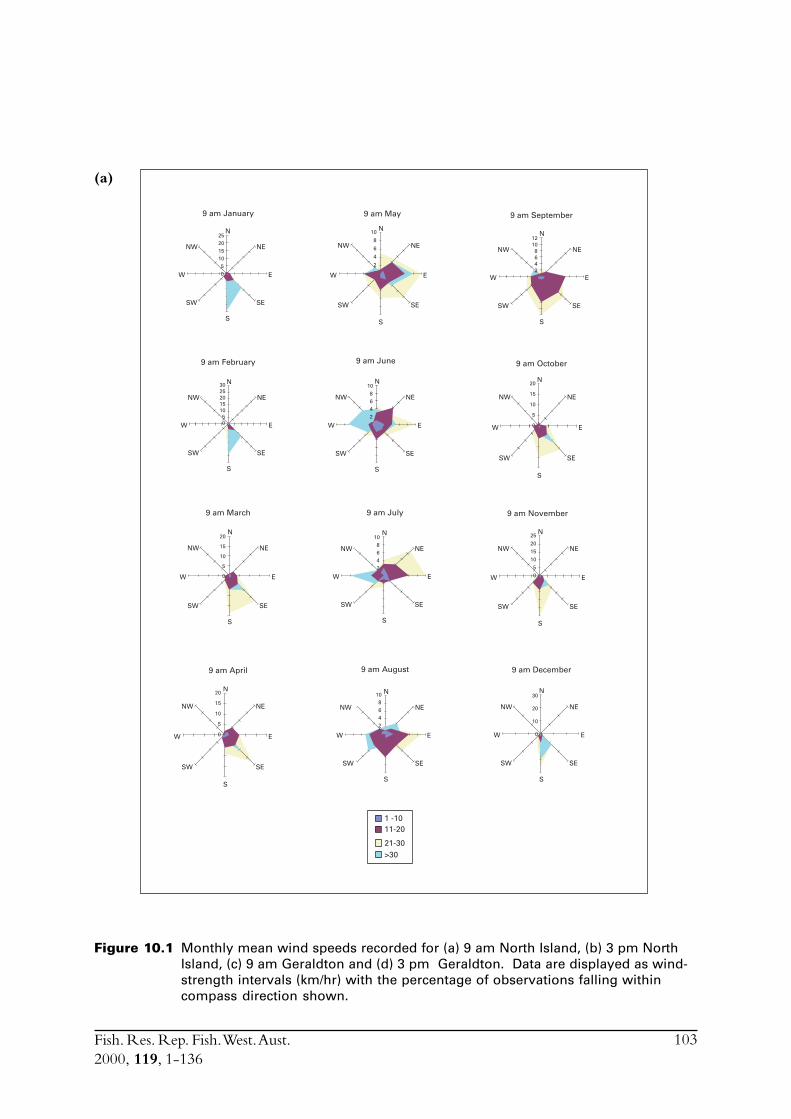
Fish. Res. Rep. Fish. West. Aust.2000, 119, 1-136
103
(a)
Figure 10.1 Monthly mean wind speeds recorded for (a) 9 am North Island, (b) 3 pm NorthIsland, (c) 9 am Geraldton and (d) 3 pm Geraldton. Data are displayed as wind-strength intervals (km/hr) with the percentage of observations falling withincompass direction shown.
9 am July
9 am August
9 am September
9 am November
9 am December
9 am October
9 am January
9 am February
9 am March
9 am April
9 am May
9 am June
1 -1011-20
21-30>30
N
NE
E
SE
S
SW
W
NW
N
NE
E
SE
S
SW
W
NW
N
NE
E
SE
S
SW
W
NW
N
NE
E
SE
S
SW
W
NW
N
NE
E
SE
S
SW
W
NW
N
NE
E
SE
S
SW
W
NW
N
NE
E
SE
S
SW
W
NW
N
NE
E
SE
S
SW
W
NW
N
NE
E
SE
S
SW
W
NW
N
NE
E
SE
S
SW
W
NW
N
NE
E
SE
S
SW
W
NW
N
NE
E
SE
S
SW
W
NW
02468
10
02468
10
02468
1012
0
5
10
15
20
05
1015
20
25
05
10152025
05
1015202530
0
5
10
15
20
0
5
10
15
20
0
2
4
6
8
10
02468
10
0
10
20
30
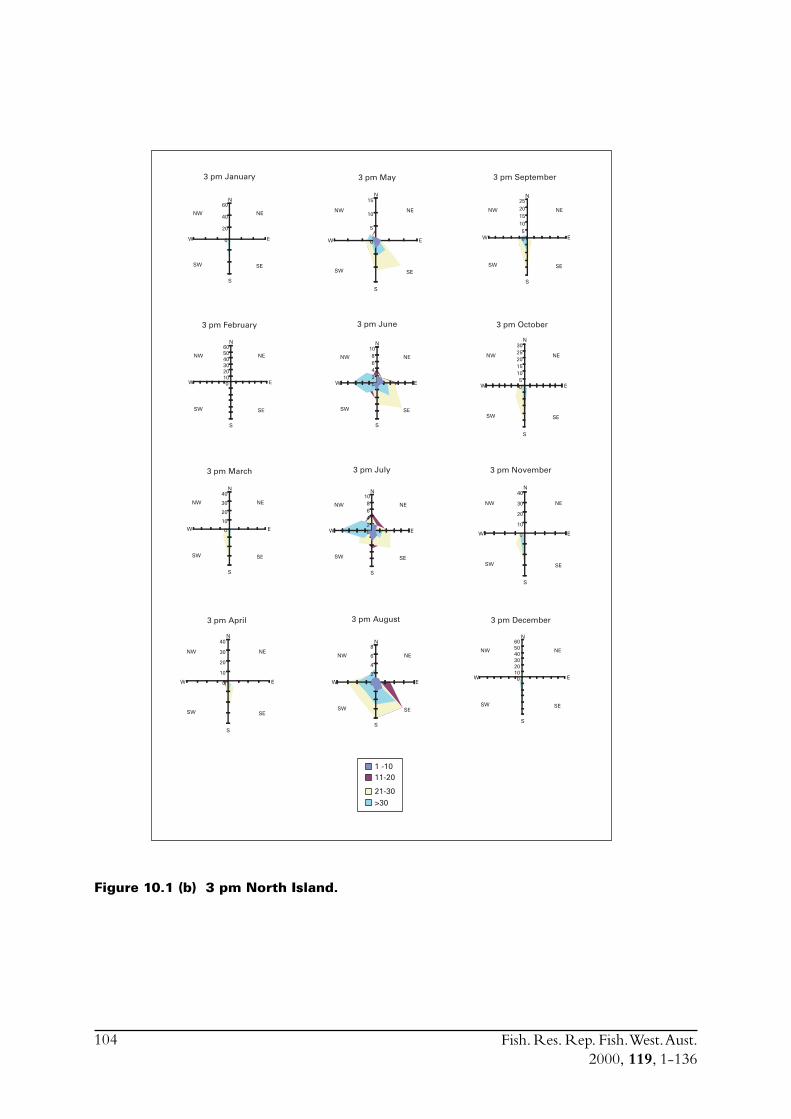
Fish. Res. Rep. Fish. West. Aust.2000, 119, 1-136
104
Figure 10.1 (b) 3 pm North Island.
0
2
4
6
8
02468
10
0
20
40
60
0102030405060
0
10
20
30
40
05
10152025
05
1015202530
0
10
20
30
40
0
5
10
15
0
10
20
30
40
0102030405060
02468
10
3 pm July
3 pm August
3 pm September
3 pm October
3 pm November
3 pm December
3 pm January
3 pm February
3 pm March
3 pm April
3 pm May
3 pm June
N
NE
E
SE
S
SW
W
NW
N
NE
E
SE
S
SW
W
NW
N
NE
E
SE
S
SW
W
NW
N
NE
E
SE
S
SW
W
NW
N
NE
E
SE
S
SW
W
NW
N
NE
E
SE
S
SW
W
NW
N
NE
E
SE
S
SW
W
NW
N
NE
E
SE
S
SW
W
NW
N
NE
E
SE
S
SW
W
NW
N
NE
E
SE
S
SW
W
NW
N
NE
E
SE
S
SW
W
NW
N
NE
E
SE
S
SW
W
NW
1 -1011-20
21-30>30
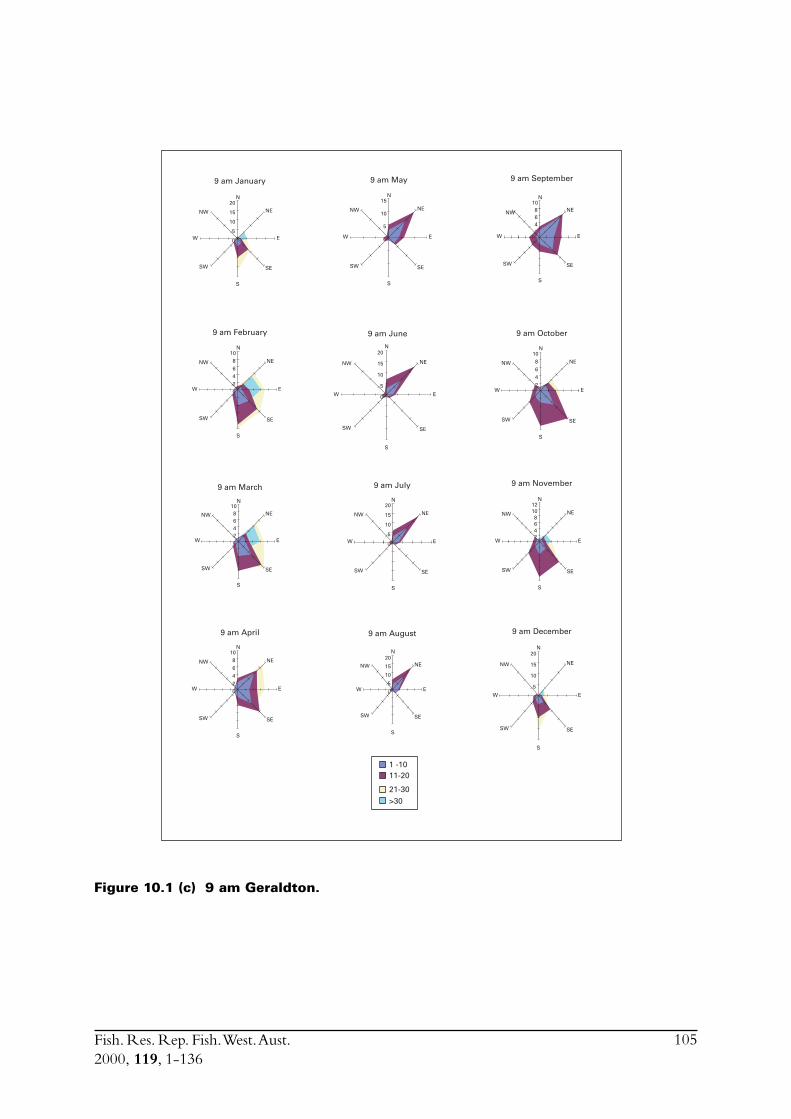
Fish. Res. Rep. Fish. West. Aust.2000, 119, 1-136
105
Figure 10.1 (c) 9 am Geraldton.
0
5
10
15
20
0
5
10
15
20
0
5
10
15
02468
1012
02468
10
02468
10
02468
10
02468
10
0
5
10
15
20
02468
10
0
5
10
15
20
0
5
10
15
20
N
NE
E
SE
S
SW
W
NW
N
NE
E
SE
S
SW
W
NW
N
NE
E
SE
S
SW
W
NW
N
NE
E
SE
S
SW
W
NW
N
NE
E
SE
S
SW
W
NW
N
NE
E
SE
S
SW
W
NW
N
NE
E
SE
S
SW
W
NW
N
NE
E
SE
S
SW
W
NW
N
NE
E
SE
S
SW
W
NW
N
NE
E
SE
S
SW
W
NW
N
NE
E
SE
S
SW
W
NW
N
NE
E
SE
S
SW
W
NW
9 am January
9 am February
9 am March
9 am April
9 am May
9 am June
9 am July
9 am August
9 am September
9 am October
9 am November
9 am December
1 -1011-20
21-30>30
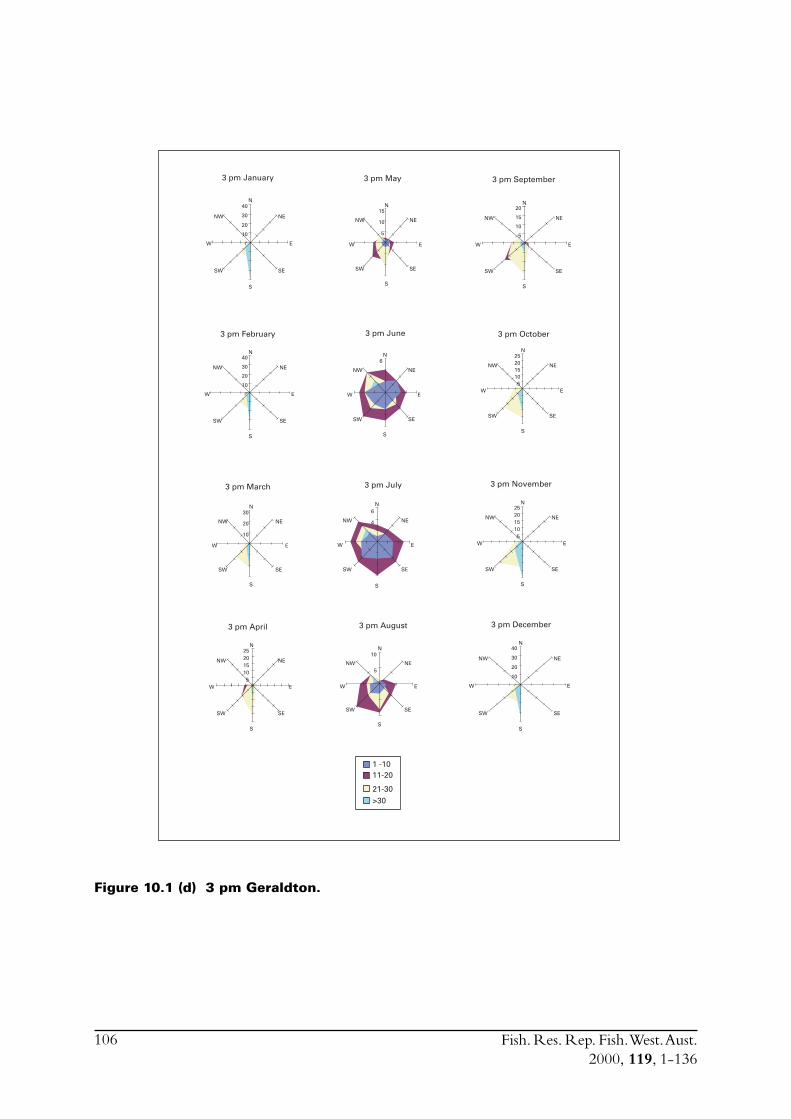
Fish. Res. Rep. Fish. West. Aust.2000, 119, 1-136
106
Figure 10.1 (d) 3 pm Geraldton.
0
10
20
30
40
0
2
4
6
0
5
10
0
10
20
30
40
0
10
20
30
0
5
10
15
20
05
10152025
05
10152025
05
10152025
0
10
20
30
40
0
5
10
15
0
2
4
6
N
NE
E
SE
S
SW
W
NW
N
NE
E
SE
S
SW
W
NW
N
NE
E
SE
S
SW
W
NW
N
NE
E
SE
S
SW
W
NW
N
NE
E
SE
S
SW
W
NW
N
NE
E
SE
S
SW
W
NW
N
NE
E
SE
S
SW
W
NW
N
NE
E
SE
S
SW
W
NW
N
NE
E
SE
S
SW
W
NW
N
NE
E
SE
S
SW
W
NW
N
NE
E
SE
S
SW
W
NW
N
NE
E
SE
S
SW
W
NW
3 pm January
3 pm February
3 pm March
3 pm April
3 pm May
3 pm June
3 pm July
3 pm September
3 pm October
3 pm November
3 pm December3 pm August
1 -1011-20
21-30>30
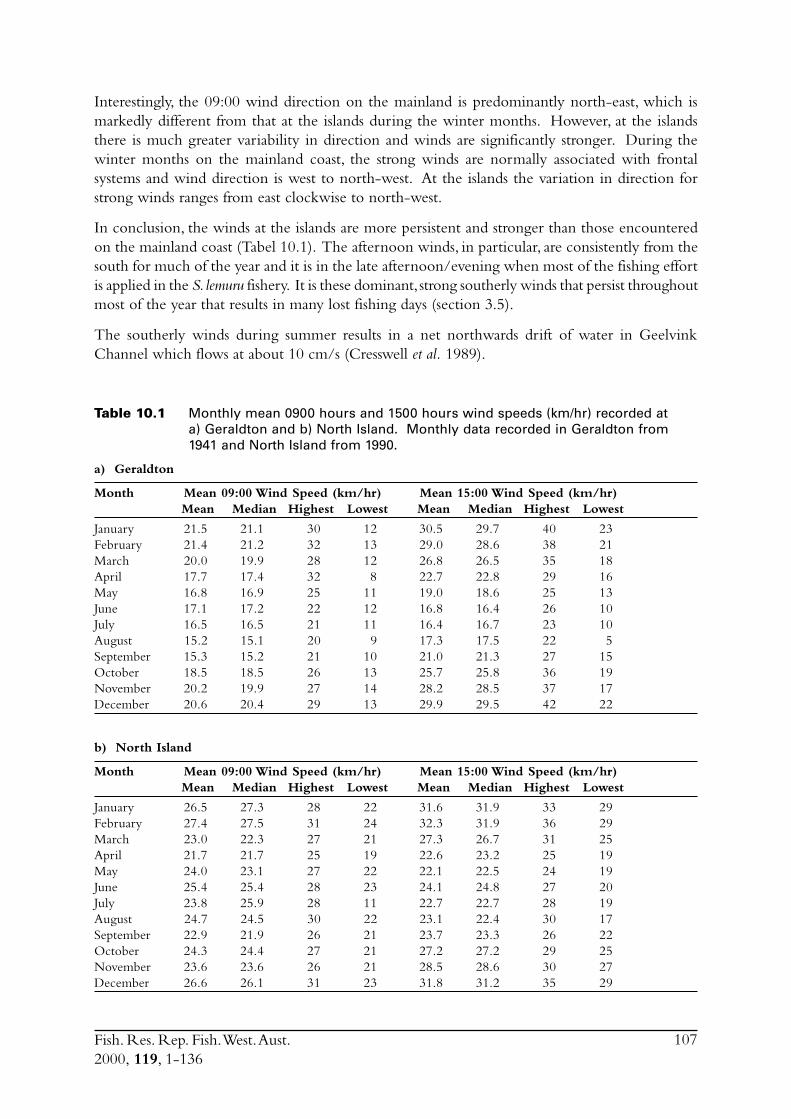
Fish. Res. Rep. Fish. West. Aust.2000, 119, 1-136
107
Interestingly, the 09:00 wind direction on the mainland is predominantly north-east, which ismarkedly different from that at the islands during the winter months. However, at the islandsthere is much greater variability in direction and winds are significantly stronger. During thewinter months on the mainland coast, the strong winds are normally associated with frontalsystems and wind direction is west to north-west. At the islands the variation in direction forstrong winds ranges from east clockwise to north-west.
In conclusion, the winds at the islands are more persistent and stronger than those encounteredon the mainland coast (Tabel 10.1). The afternoon winds, in particular, are consistently from thesouth for much of the year and it is in the late afternoon/evening when most of the fishing effortis applied in the S. lemuru fishery. It is these dominant, strong southerly winds that persist throughoutmost of the year that results in many lost fishing days (section 3.5).
The southerly winds during summer results in a net northwards drift of water in GeelvinkChannel which flows at about 10 cm/s (Cresswell et al. 1989).
Table 10.1 Monthly mean 0900 hours and 1500 hours wind speeds (km/hr) recorded ata) Geraldton and b) North Island. Monthly data recorded in Geraldton from1941 and North Island from 1990.
a) Geraldton
Month Mean 09:00 Wind Speed (km/hr) Mean 15:00 Wind Speed (km/hr)Mean Median Highest Lowest Mean Median Highest Lowest
January 21.5 21.1 30 12 30.5 29.7 40 23February 21.4 21.2 32 13 29.0 28.6 38 21March 20.0 19.9 28 12 26.8 26.5 35 18April 17.7 17.4 32 8 22.7 22.8 29 16May 16.8 16.9 25 11 19.0 18.6 25 13June 17.1 17.2 22 12 16.8 16.4 26 10July 16.5 16.5 21 11 16.4 16.7 23 10August 15.2 15.1 20 9 17.3 17.5 22 5September 15.3 15.2 21 10 21.0 21.3 27 15October 18.5 18.5 26 13 25.7 25.8 36 19November 20.2 19.9 27 14 28.2 28.5 37 17December 20.6 20.4 29 13 29.9 29.5 42 22
b) North Island
Month Mean 09:00 Wind Speed (km/hr) Mean 15:00 Wind Speed (km/hr)Mean Median Highest Lowest Mean Median Highest Lowest
January 26.5 27.3 28 22 31.6 31.9 33 29February 27.4 27.5 31 24 32.3 31.9 36 29March 23.0 22.3 27 21 27.3 26.7 31 25April 21.7 21.7 25 19 22.6 23.2 25 19May 24.0 23.1 27 22 22.1 22.5 24 19June 25.4 25.4 28 23 24.1 24.8 27 20July 23.8 25.9 28 11 22.7 22.7 28 19August 24.7 24.5 30 22 23.1 22.4 30 17September 22.9 21.9 26 21 23.7 23.3 26 22October 24.3 24.4 27 21 27.2 27.2 29 25November 23.6 23.6 26 21 28.5 28.6 30 27December 26.6 26.1 31 23 31.8 31.2 35 29
Fish. Res. Rep. Fish. West. Aust.2000, 119, 1-136
108
10.2 TemperatureWater temperatures in Geelvink Channel, several kilometres off Geraldton, typically range from19°C in late winter (August/September) up to about 23°C in summer (Pearce 1997). A largerannual range, with lower minima and higher maxima, occurs in the nearshore waters, while at theAbrolhos Islands the annual range is less (Pearce 1997).
10.3 RainfallThe rainfall patterns in the Geraldton region follow those of a typical Mediterranean climate.Most rain falls in winter and the summer months are usually dry with infrequent rain resultingfrom tropical low pressure systems (Table 10.2). June is the wettest month with an average of108.1 mm and December the driest with an average of only 5 mm.
Table 10.2 Mean monthly rainfall statistics for Geraldton (recorded from 1941).
Rainfall Averages - Geraldton MonthJan Feb March April May June July Aug Sept Oct Nov Dec
Mean rainfall (mm) 6.4 12.7 14.4 25 70.5 108.1 93.7 66.7 31.4 19.7 10.4 5Median (decile 5) rainfall (mm) 0.8 2.8 6.1 17.4 60.5 91.5 93.7 62.4 31.7 16.6 5.5 2Decile 9 rainfall (mm) 22.1 41.5 37.8 60.8 142.4 215.2 155 109.5 53.1 38 37.2 22Decile 1 rainfall (mm) 0 0 0.2 3.1 16.6 43.7 36.2 30.8 10.6 4.6 0.4 0Mean number of rain days 1.8 2.3 2.9 6.1 10 14 14.7 12.6 9.6 7 4.1 2Highest monthly rainfall (mm) 63.6 131.4 88.7 100.3 282.2 286.4 243.3 155.4 80.8 109.1 47.4 58Lowest monthly rainfall (mm) 0 0 0 0.5 2.8 24.8 24 10.8 6 0.3 0 0Highest recorded daily rain (mm) 36.3 79.6 88.4 47.8 62.2 109.2 71.9 59 38.6 71.1 25.8 51
10.4 River run-off and nutrient inputsThe majority of nutrients and sediments washed from the land into coastal waters worldwide aretransported by rivers. On a more localised scale, submarine discharges of groundwater into amarine system may also be significant.
The Geraldton region has four main rivers that flow into the Indian Ocean; the Greenough,Irwin, Chapman and Bowes. The large amount of rainfall during the winter months may alsoresult in the discharge of terrestrial sediment material into the ocean. It is during the wintermonths that flood events are associated with intense frontal systems. Flow rates during the rest ofthe year are comparatively low, however, infrequent tropical depressions during summer mayresult in localised flooding.
Concentrations of suspended sediments and dissolved materials in river waters vary greatly inresponse to varying flow rates. Flood events may increase primary production in coastal areas,however, the degree to which this occurs is not known. The main commercial fishing grounds forS. lemuru are situated well offshore so it is unlikely that any discharge of material during the wintermonths would impact directly on the species. There is no evidence to suggest that S. lemurumigrate inshore during the winter months to take advantage of any possible increase in nutrientlevels.
10.5 Sea conditionsAlthough there is no published wave data for the islands, the mean wave height in the open oceanto the west of the islands is over 2 m for most of the year. However, inside the islands nearer to themainland coast wave height decreases to a mean of 1.2 m (Pearce 1997). The mean wave periodin the Geelvink Channel was nine seconds. Analysis of expected maximum individual wave
Fish. Res. Rep. Fish. West. Aust.2000, 119, 1-136
109
heights showed that 50 per cent are likely to exceed 3 m and 10 per cent more than 4 m (Pearce1997). The calmest times during the year occur in the months of March/April and October/November. The islands do offer some protection from the swell when fishing in the GeelvinkChannel but strong southerly winds also generate quite large seas (> 2 m) which can make fishingand research operations difficult.
10.6 TidesAlthough the tidal range at Geraldton (typically < 0.6 m) is not as pronounced as further north,tidal currents most likely still play an important role in biological processes occurring in the maincommercial fishing grounds. Tidally induced mixing can be a major contributor to the nutrientdynamics of shallow, marine ecosystems. In these systems, bottom friction acts in a manneranalogous to wind stress on the surface to mix the water column and inhibit stratification (Furnas1995). This mixing ensures that nutrients are regularly resuspended from the benthos and rapidlydistributed through the euphotic zone (i.e. the entire water column in Geelvink Channel), andthus has the capability to influence primary productivity of plankton communities.
Although not mentioned in the review by Pearce (1997), strong tidal fronts are apparently acommon feature of some parts of Geelvink Channel and were targeted by commercial purseseiners while searching for S. lemuru. Such tidal fronts would be expected to occur regularly andprobably represent areas of increased plankton concentrations, which attract schools of S. lemuru.Indeed, tidal fronts are also favoured search areas for south coast pilchard fishermen, who identify“tide-lines” by the associated accumulations of debris near the surface. In Geelvink Channel,where purse seining most often occurred at night, tide lines could be detected by the sonar andecho sounder.
10.7 UpwellingA clear difference between the mid-west coast of WA and overseas locations, where sardinessupport commercial fisheries, is the very low nutrient levels of the former. Thus, whereas largesardine fisheries usually occur in areas of significant upwelling and or large inputs of nutrient fromrivers, the mid-west of WA is extremely arid and the adjacent seas have no regular or consistentupwelling of colder, nutrient-rich water (Pearce 1997). In general terms, Australian marine watersare nutrient poor. The generally poor nutrient levels result in stock sizes of clupeoids, which arestrongly linked to productivity, to be very low by world standards and particularly low whencompared with stock sizes inhabiting eastern boundary upwelling systems.
However, “cold events” have occasionally been recorded at the CSIRO tide-gauge site near RatIsland, suggesting that localised up-welling may occur sporadically along the outer continentalshelf (Pearce 1997). There may also be upwelling onto the continental slope of ‘mid-depth’ water,which is not detected as changes in sea surface temperature (SST) by satellite imagery because ofinsufficient thermal contrast.
10.8 Leeuwin CurrentThe Leeuwin Current is the dominant current off Western Australia (Caputi et al. 1996). It hasbeen responsible for the distribution of tropical marine life further south than would otherwisebe expected. This large current can best be described as a band of warm, tropical, low salinitywater about 50 km wide and 200 m deep that flows south, generally along the shelf break, fromNorth West Cape to Cape Leeuwin (Figure 10.2). From here it travels eastwards and flows intothe Great Australian Bight.
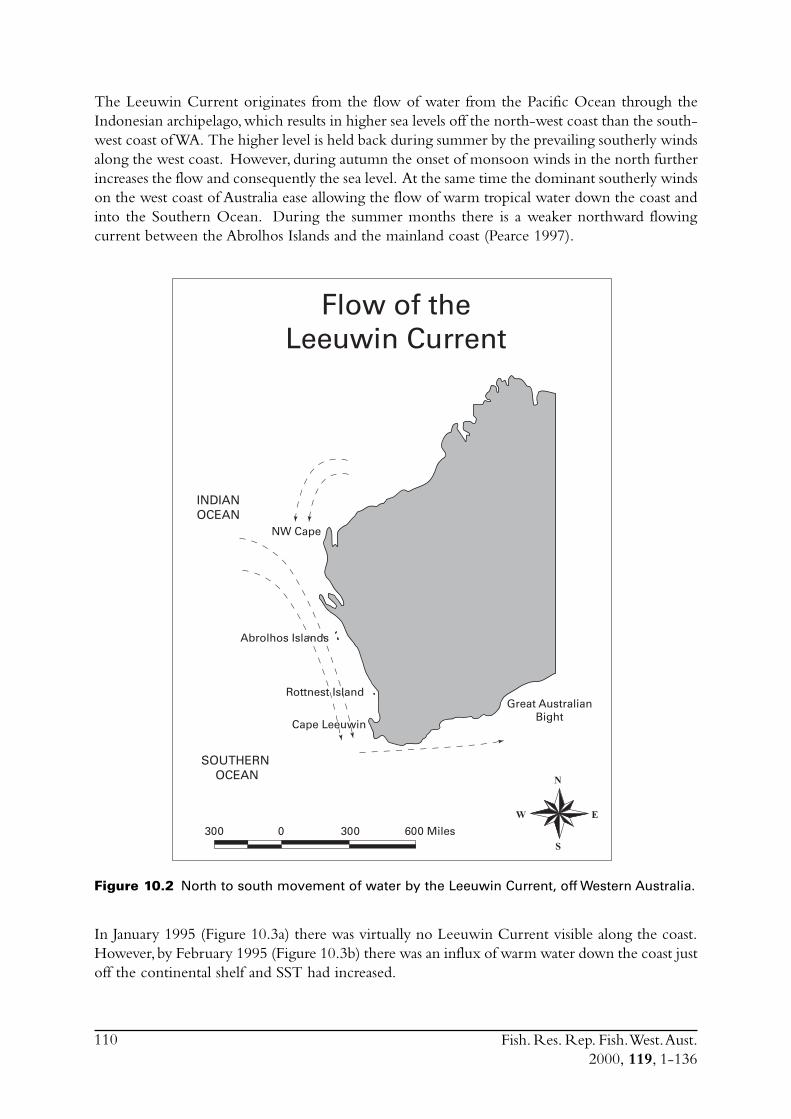
Fish. Res. Rep. Fish. West. Aust.2000, 119, 1-136
110
The Leeuwin Current originates from the flow of water from the Pacific Ocean through theIndonesian archipelago, which results in higher sea levels off the north-west coast than the south-west coast of WA. The higher level is held back during summer by the prevailing southerly windsalong the west coast. However, during autumn the onset of monsoon winds in the north furtherincreases the flow and consequently the sea level. At the same time the dominant southerly windson the west coast of Australia ease allowing the flow of warm tropical water down the coast andinto the Southern Ocean. During the summer months there is a weaker northward flowingcurrent between the Abrolhos Islands and the mainland coast (Pearce 1997).
Figure 10.2 North to south movement of water by the Leeuwin Current, off Western Australia.
In January 1995 (Figure 10.3a) there was virtually no Leeuwin Current visible along the coast.However, by February 1995 (Figure 10.3b) there was an influx of warm water down the coast justoff the continental shelf and SST had increased.
N
E
S
W
300 0 300 600 Miles
INDIANOCEAN
SOUTHERN OCEAN
NW Cape
Abrolhos Islands
Rottnest IslandGreat Australian
BightCape Leeuwin
Flow of theLeeuwin Current
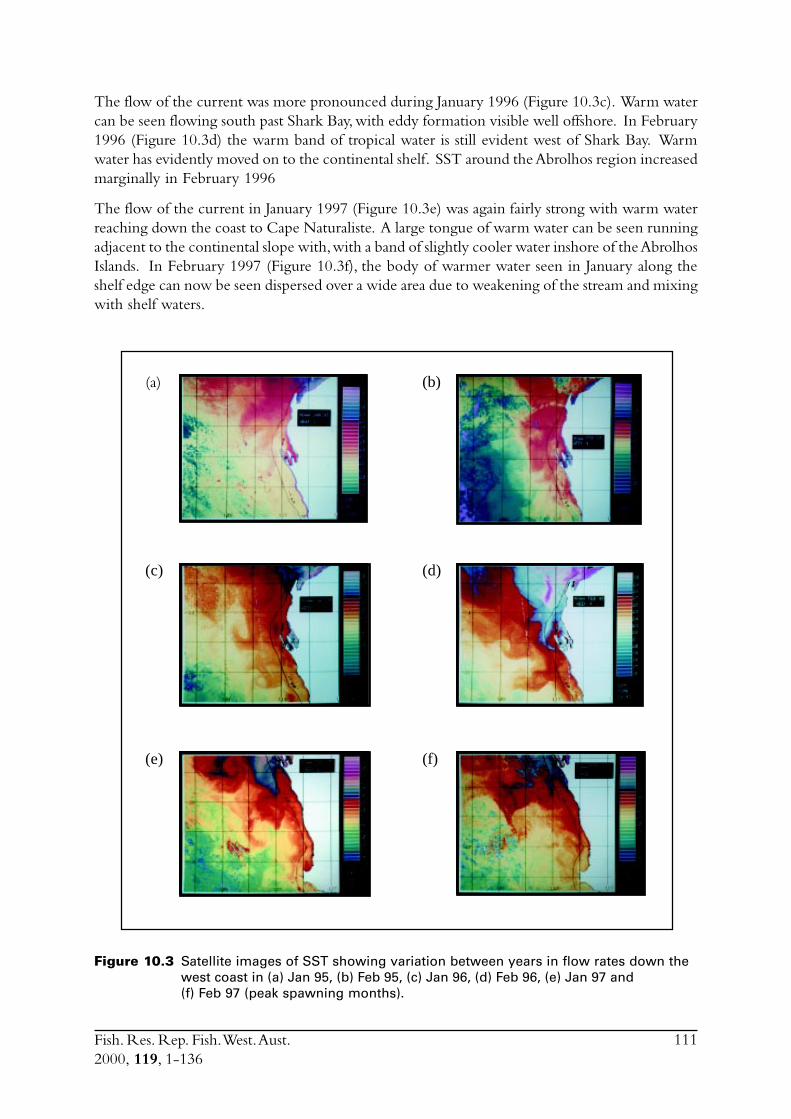
Fish. Res. Rep. Fish. West. Aust.2000, 119, 1-136
111
The flow of the current was more pronounced during January 1996 (Figure 10.3c). Warm watercan be seen flowing south past Shark Bay, with eddy formation visible well offshore. In February1996 (Figure 10.3d) the warm band of tropical water is still evident west of Shark Bay. Warmwater has evidently moved on to the continental shelf. SST around the Abrolhos region increasedmarginally in February 1996
The flow of the current in January 1997 (Figure 10.3e) was again fairly strong with warm waterreaching down the coast to Cape Naturaliste. A large tongue of warm water can be seen runningadjacent to the continental slope with, with a band of slightly cooler water inshore of the AbrolhosIslands. In February 1997 (Figure 10.3f), the body of warmer water seen in January along theshelf edge can now be seen dispersed over a wide area due to weakening of the stream and mixingwith shelf waters.
Figure 10.3 Satellite images of SST showing variation between years in flow rates down thewest coast in (a) Jan 95, (b) Feb 95, (c) Jan 96, (d) Feb 96, (e) Jan 97 and(f) Feb 97 (peak spawning months).
(b)(a)
(c) (d)
(e) (f)
Fish. Res. Rep. Fish. West. Aust.2000, 119, 1-136
112
10.9 Severe storms and cyclonesIntense low pressure systems, whether they be cyclones or gales, are irregular seasonal events offthe mid-west coast of WA. Severe tropical storms which occasionally move down the west coastcan have pronounced effects on continental shelf and coastal marine systems. The high winds andassociated waves generated in these events result in intense mixing of surface waters with thelower layers of the water column. This mixing often brings nutrient enriched water to the surfacealong the storm track (Furnas 1995). As tropical storms move onto the continental shelf, mixingreaches the bottom and is sufficiently powerful to re-suspend sediments over wide areas. Dissolvedand particulate nutrients are re-suspended into the water column which can result in localizedphytoplankton blooms. In conjunction with nutrients in floodwater near the coast, regionalprimary productivity can increase 5 to 10 fold within a matter of days following a major storm(Furnas 1989). Although S. lemuru would presumably take advantage of such sporadic increases inplankton biomass, such storm events are irregular and are unlikely to influence spawning strategy.
There are no data relating to chlorophyll-a abundance within the fishing area for S. lemuru.Pearce (1997) found that nitrates, silicates and phosphates in the surface layers were generally lowacross the shelf and down to about 200 m, which confirms the low nutrient status of WesternAustralian shelf waters and the lack of nutrient input via upwelling.
10.10 Influence of environmental factors on spawning strategyand recruitment
10.10.1 Hypothesised effectsSardinella lemuru, like other sardine species, most likely undergoes large interannual variations inrecruitment abundance. Variations in relative recruitment success for many pelagic species havebeen linked to changes in the prevailing environmental conditions (e.g. Cury and Roy 1989).The dominant environmental factors for S. lemuru in Geelvink Channel are probably wind,temperature and the Leeuwin Current. As seasonal changes in temperature and wind patterns arevery consistent, these factors are likely to be linked to spawning strategy. In contrast, the LeeuwinCurrent and the extent that it both impinges onto the continental shelf off the mid-west coast ofWA and forms eddies offshore of the same region, can vary substantially between years. Thisvariable environmental factor is discussed as a possible mechanism affecting interannual recruitmentvariability. Potential influences of wind and Leeuwin Current are discussed following the hypothesesoutlined in Table 10.4.
Fish. Res. Rep. Fish. West. Aust.2000, 119, 1-136
113
Table 10.4 Hypotheses on the influence of wind and the Leeuwin Current during thesummer spawning season on S. lemuru recruitment.
Environmental Direct effect Hypothesised result Effect onfactor recruitment
Wind Increased mixing Increased productivity +
Increased turbulence Increased encounter rate with food + or - or no stable aggregations of food
Net northward current Larvae moved north and remain + or - in warm water
Offshore (NE) drift of Larvae placed in offshore frontal + or - surface, shelf waters; offshore boundary systems or larvae “lost” transport of eggs & larvae
Leeuwin Flow into Geelvink Channel Increased productivity via (1) mixing + Current in Geelvink Channel, (2) development
of frontal boundary systems
Transport of larvae south Nursery grounds to the south ?
10.10.2 WindClupeoids associated with upwelling regions spawn in areas and at times where turbulence andoffshore transport are low, but winds are sufficiently strong to generate upwelling (Bakun 1996).Successful spawning (in terms of subsequent recruitment) by some tropical and temperate clupeoidsin upwelling regions has been linked to winds blowing within an optimum range of speeds(i.e. the “Lasker window”, Bakun 1996). Winds below the optimum will be reflected by low levelsof upwelling and hence low nutrient levels, whereas winds above the optimum cause increasedturbulence which can disrupt plankton aggregations. In both cases, the negative effects of wind-strength outside of the optimum range of 5-6 m/s (Cury and Roy 1989) can be on either or boththe adults and their offspring. Thus, it is believed that these conditions aid in the survival rates ofthe larval fish and by increasing reproductive output, via improved feeding conditions, for adults.
However Freon et al. (1997) found that for Sardinella aurita off Venezuela, spawning predominantlyoccurred not only in areas of low turbulence but also in areas that were exposed to trade windsand offshore transport. Thus, sardine populations in non-upwelling regions may develop spawningstrategies to take best advantage of local conditions. Because of the variability in oceanographicconditions between such non-upwelling regions, different aspects of the environmental andbiological conditions may be more important for successful spawning than others.
This may explain the apparent divergence of S. lemuru off Geraldton from previously describedspawning strategies for sardines. The reproductive strategy exhibited by S. lemuru is different fromthat of sardines in upwelling regions. Sardinella lemuru spawn off Geraldton during the summermonths (December-February). At that time the winds are at their strongest (mean wind speed of8 m/s) and are also extremely predictable with very little interannual variation in strength ordirection. Sardinella lemuru may use the predicability of these winds (prevailing southerly) to aidthe survival of their larvae, although this is not likely to be linked to the retention of larvae in thespawning area since the southerly winds probably generate a north-west (i.e. offshore) movementof surface waters (A. Pearce, pers. comm.).
Fish. Res. Rep. Fish. West. Aust.2000, 119, 1-136
114
If increased survival of larvae during the spawning season is not linked to retention, then thealternative theory is that offshore transport places larvae in areas suitable for early growth andsurvival. Freon et al. (1997) found that S. aurita off Venezuela also spawn at a time when offshoretransport of larvae is most likely. They proposed that, within the context of this other sardine’sspawning strategy, optimising food availability for juveniles had precedence over larval retention.Such a possibility for S. lemuru off the mid-west coast of WA led to the hypothesis that localisedregions of high productivity associated with frontal systems generated by the Leeuwin Currentmay be important in the survival of larval S. lemuru (see below).
Potential effects of the net northward movement of water in Geelvink Channel during summerare discussed below.
10.10.3 Leeuwin Current10.10.3.1 Potential effects on primary productivityThe meeting of water masses with different hydrographic characteristics results in marked gradientsin physical, chemical and biological variables across frontal boundary zones. These boundariestend to be spatially complex and are characterised by eddies (swirling flows of water), streamers(extended, river like flows) and intrusions (tongues of water), all of which can be seen usingsatellite imagery (Figure 10.3).
The waters of the Leeuwin Current move much faster than the adjacent “slope water” massnearer to the mainland coast. Frontal eddies develop at the interface in response to the frictionaltorque of the differential velocities of the adjacent water masses (e.g. Bakun 1996).
Although the main body of the Leeuwin Current is typically located offshore of the AbrolhosIslands, eddies or intrusions can break away from the main current, moving large amounts ofwarm water eastward up onto the continental shelf, around the islands and toward the mainlandcoast. These onshore intrusions can change over short time scales, which may lead to increasedlevels of mixing throughout the water column in the relatively shallow (50 m) waters inshore ofthe Abrolhos Islands. This may then result in localized increases in nutrients within the watercolumn, despite that the warm pockets of tropical water coming onto the shelf are generallyoligotrophic. If this process does occur, fluctuations in the Leeuwin Current and its offshoots mayresult in highly variable spatial patterns of nutrient and plankton densities between years.
More persistent intrusions may also result in distinct frontal boundaries. Frontal boundariesassociated with well defined intrusions of Leeuwin Current water moving onto the shelf arelikely to result in the formation of areas of higher productivity (e.g. Bakun 1996). These areasmay provide sufficiently concentrated food for larval S. lemuru.
Frontal boundaries are also associated with the large scale eddies (Figure 10.3) which may detachfrom the Leeuwin Current off the mid-west coast of WA. Theory indicates that the dynamics ofeddies will result in areas where particles (i.e. in this case plankton) accumulate (Bakun 1996). Asa result of these eddy formations, high concentrations of plankton can develop at frontal zones,thereby giving rise to areas of intensified trophic activity. Furthermore, where meanders ofcoastal currents detach from the coast, localized zones of upwelling can form in the pocket of theloop (Tranter et al. 1986). Eddies off the mid-west coast of WA tend to persist for weeks (Pearce1997), so areas of high productivity within eddy pockets would likewise be expected to persist forsuch periods. Such conditions may provide suitable feeding conditions for larval or juvenileS. lemuru offshore of the Abrolhos Islands.
Fish. Res. Rep. Fish. West. Aust.2000, 119, 1-136
115
Assuming that summer spawning in Geelvink Channel does indeed result in substantial offshoretransport of S. lemuru eggs and early larvae, eddies produced by the Leeuwin Current may providesuitably enriched environments to assist in early feeding success. In which case, the offshoreadvection does not necessarily result in terminal loss of spawning products from the stock.
The most intense frontal boundaries observed in Figure 10.3 occur far offshore of the shelf edge,however, boundaries may occur closer to shore. These closer to shore bourndaries are moredifficult to detect using satellite imagery since local inshore waters are warmer than oceanicwaters at this time of year and so produce less thermal contrast. Thus, the Leeuwin Current maygenerate more extensive frontal boundaries close to the region of the fishery than indicated, andthese may also result in localised areas of high productivity.
While the general form of the Leeuwin Current is reasonably consistent in the longer term, thestrength and position of the current, with respect to the continental shelf, typically varies betweenyears and is linked to El Niño/La Niña events. Thus, if reproductive success of S. lemuru in theGeraldton region has particular, although indirect, reliance on flow of the Leeuwin Current ontothe shelf, then both recruitment and stock size can be expected to undergo regular large fluctuationsover relatively short periods. Likewise, this hypothesised effect is further exacerbated if offshoreeddies also influence survival of advected larvae and the resultant juveniles.
10.10.3.2 Transport of eggs and larvaeIn recent years there has been an increasing interest in the Leeuwin Current and its role inbiological/fisheries processes. The current may provide a transport system for pelagic larvae ofseveral finfish and crustacean species. Hutchins (1991) hypothesised that the seasonal recruitmentof juvenile tropical fish at Rottnest Island, off Fremantle, is a result of the south-ward transport inthe Leeuwin Current from breeding populations to the north.
Along the south coast of WA, the Leeuwin Current is responsible for the eastward advection ofpilchard eggs and larvae from offshore areas near Albany further east towards Bremer Bay, withtransported distance of spawning products positively correlated to current strength (Fletcher et al.1994). However, this is much less likely to occur with S. lemuru since the Leeuwin Current istypically weakest at the time of peak spawning (i.e. mid-summer). Indeed, spawning in GeelvinkChannel places eggs and early larvae in a region which has a net northwards movement of waterduring summer and therefore the long term average transport of spawning products, if any, ismore likely to be to the north. This hypothesis is supported by the oxygen-isotope data whichindicated that juveniles had lived in warmer water than adults (section 7), which in turn suggestsa southward flow of eggs and larvae is unlikely.
Because the net northward movement of water in Geelvink Channel during summer results fromthe very predictable and consistent southerly winds during this time of the year, it is most likely amore persistent feature than intrusions of Leeuwin Current water. Ignoring for the moment thepossibility that relatively low (i.e. sub-tropical cf. tropical) temperatures may limit reproductiveactivity (section 4.9), spawning in summer may be a strategy to aid northward transport of eggsand larvae. Furthermore, shoreward movement of water induced by intrusions of Leeuwin Currentwater, which could be seen as a mechanism to aid in retention of larvae, is also weakest duringsummer, and thus retention of larvae in the region of the fishery does not appear to be part of thespawning strategy.
Fish. Res. Rep. Fish. West. Aust.2000, 119, 1-136
116
11.0 Project summary
11.1 BenefitsThis project established an understanding of the biology of S. lemuru in WA and of the mid-westcoast purse seine fishery. This information has, and will, be used in management decisions aimedat ensuring sustainability of the S. lemuru stock off the mid-west coast of WA. This in turn hasflow-on benefits to recreational fishing and conservationist groups which may be concernedabout effects of overfishing on predators of sardines in the Geraldton region. The data also haveimmediate uses for FRDC project 98/203 on birds of the Abrolhos Islands.
Knowledge of some of the difficulties encountered during the developmental period (e.g. influenceof weather, vessel suitability, processing capacity, marked decline in catch rate) will benefit currentand future industry members in the mid-west purse seine fishery and in other new fisherieswhich target high-volume, relatively low-value, species.
The anticipated benefits to the rock lobster and aquaculture (i.e. tuna farms) industries did noteventuate and these industries will therefore continue to have a heavy reliance on importedbaitfish.
11.2 Further developmentsFurther research on the biology of S. lemuru and the mid-west coast purse seine industry will beundertaken through continued sampling of catches. In particular, further verification of age iswarranted. Also, as samples of the commercial catch are obtained, investigations will continue intowhether or not otolith weight can be used as a basis for analysing relative age composition.Likewise, vessels will be encouraged to continue filling in logbooks so that deviations in catchrates or spatial extent of the fishery can be detected. Given the current magnitude and value ofthe catch, this level of monitoring should meet future needs of management. If a perceptiondeveloped that a substantial increase in annual catch is warranted, a further DEPM survey shouldbe undertaken, but only if adult samples can be guaranteed to be available, and indeed obtained(i.e. from industry), prior to and during the period of peak spawning.
11.3 ConclusionsGiven the current understanding of sardine taxonomy, the species studied in this project wasconfirmed to be Sardinella lemuru, a tropical species which, along the lower west coast of WA, is atthe southern limit of its range.
The limited fishing season, typically from May to September, hampered efforts to describe thebiology of S. lemuru and to estimate spawning biomass using the daily egg production method.The description of reproductive biology relied heavily upon samples collected between 1990 and1995. Spawning season is from December to March with a peak in January to February. Noadequate assessment of fecundity was possible during the project, although preliminary estimatesindicate that fecundity may be approximated by that from similar species. Hypotheses concerningpossible links between spawning strategy of S. lemuru off the mid-west coast and the dominantenvironmental factors (Leeuwin Current, wind) were discussed in the context of the potentialinfluences on recruitment strength.
Sardinella lemuru are filter feeders, with diets composed predominantly of zooplankton.
Fish. Res. Rep. Fish. West. Aust.2000, 119, 1-136
117
Insufficient samples from all months of the year also affected the ability to validate the age ofS. lemuru using otoliths. However, this was less critical than the difficulty in identifying suspectedannuli, which subsequently resulted in a poor level of confidence in our ability to estimate age.Therefore, analyses of growth and age were conditioned on the assumption that S. lemuru in WAgrow slower than in the warmer and more productive waters of Bali Strait. Maximum age was sixor seven years, with an L
inf of 166 mm.
Notwithstanding the uncertainty in estimating age, the annual catch-at-age distributions indicatedthat the commercial catch predominantly consisted of only two or three age classes. Three- andfour-year-olds dominated the catch, with few younger and older fish present. This observationmay indicate that the stock could be characterised by occasional periods of strong recruitment,typical of small pelagic fish. Alternatively, an age-dependent spatial separation may have contributedto the low numbers of older fish by making them less vulnerable to fishing, although there is noevidence for this. Analysis of the annual catch-at-age distributions indicated a high rate of totalannual mortality (Z = 1.16), which may include a component of lower vulnerability of older fish.
Data from research logbooks and compulsory monthly returns allowed a detailed description ofdynamics, locations and catch rates of the fleet. Although the cause(s) for the decrease in catchrate in 1997, i.e. an apparent decline in abundance of S. lemuru in the vicinity of the fishinggrounds, was not determined, the possibility of marked changes in catch rate from one season tothe next have been demonstrated for this fishery. The research indicates that the original conceptthat the fishery could expand greatly was overoptimistic and expansion of the fleet is thereforenot warranted. Furthermore, the need for specialised, rather than modified, purse seine vessels inorder to operate viably in the mid-west coast sardine fishery has clearly been shown.
Sardinella lemuru eggs were typically found over the outer half of the continental shelf and werewidely distributed along the shelf. The estimates of spawning area, along with the closely associatedpatterns of egg distribution, do not provide evidence of a large and extensive stock, but rather ofa dispersed stock with relatively large distances between what are possibly quite small aggregations.A combination of the very small sample size of adults, the fact that the peak spawning period (orarea) could not be identified in advance, and insufficient egg data from which to obtain an estimateof egg production, negated attempts to provide worthwhile estimates of spawning biomass usingthe daily egg production method.
Analysis of isotopic ratios of oxygen and carbon from otoliths did not provide any clear evidencefor the presence of distinct stocks of S. lemuru between Fremantle and Carnarvon. The d18O datadid, however, indicate that S. lemuru caught at different locations had lived most of their lives inwaters of different temperatures. The otolith-isotope and plankton data together suggest that thestock may be widespread, patchy and highly mobile. This data is compatible with the hypothesisof a stock shifting and or dispersing along the coast in response to environmental changes.
Fish. Res. Rep. Fish. West. Aust.2000, 119, 1-136
118
11.4 Recommendations1. The small number of age classes, high natural mortality and lack of an estimate of stock size,
along with the large interannual variations in recruitment strength expected of sardine stocksin general, and the associated large changes in stock size over relatively short periods, providea strong basis for conservative management of this fishery.
2. Due to lack of any evidence for a large stock in the current fishing area, there is currently nobasis for expecting the TAC to increase above the current level of 2,700 tonnes in the future.Furthermore, because there is no estimate of stock size, catch levels in the short term shouldnot be permitted to exceed those of the previous highest annual catches (2,000 t).
3. Monitoring of the commercial catch, to obtain data on age structure, catch and effort, shouldcontinue. A longer time series of data will assist in determining if and when exploitationlevels need to be revised.
4. The apparent low abundance of S. lemuru in the mid-west’s current purse seine groundsobserved in 1997 may continue to occur periodically, and thus the fishery may not becommercially viable in some years. Therefore, any further large investment in the mid-westpurse seine fishery should not be encouraged.
These recommendations have already been presented to industry and managers at a meeting ofthe WA Purse Seine Management Advisory Committee.
12.0 AcknowledgmentsThis project was developed by Rick Fletcher who, along with Stuart Blight, was largely responsiblefor the collection of samples in the period prior to 1995. These ‘early’ samples and the backgroundknowledge of the Geraldton purse seine fishery gained during this period proved invaluable.Likewise, Rob Tregonning, employed on this project at its commencement, was instrumental insetting up a schedule of regular sample collection. Our thanks also to several staff at the WesternAustralian Marine Research Laboratories (WAMRL) who edited this report and provided usefulsuggestions, particularly Mike Moran for his frequent involvement. Alan Pearce also provideduseful discussion on oceanography of the Abrolhos area. Paul Lewis is thanked for undertakingthe diet analysis.
Justin Chidlow, Richard Mijat, Rob Tregonning and Ken White undertook much of the planktonsampling, along with Stuart Blight, Ian Dunk, Dave Harris and Julie Murdoch. The permission toborrow staff from other research groups at WAMRL is much appreciated.
The mid-water trawling program was a particularly successful part of this project. This method offishing had not previously been used on the RV Flinders. The crew of the RV Flinders is thankedfor their ability to rig, trial and fine-tune deployment of the mid-water trawl net, and thensuccessfully catch scaly mackerel.
Fish. Res. Rep. Fish. West. Aust.2000, 119, 1-136
119
13.0 ReferencesAlheit, J. (1993). Use of the daily egg production method for estimating biomass of clupeoid
fishes: a review and evaluation. Bulletin Marine Science 53: 750-67.
Anon. (1993). Abrolhos Islands aquatic reserve. Final Report Abrolhos Islands AquaticReserve Consultative Council.
Bakun, A. ( 1996). Patterns in the ocean. Ocean processes and marine population dynamics.California Sea Grant/CIB, 323 pp.
Beamish, R. and Fournier, D.A. (1981). A method for comparing the precision of a set of agedeterminations. Canadian Journal of Fisheries and Aquatic Sciences 38: 982-983.
Bhattacharya, C.G. (1967). A simple method of resolution of a distribution into Gaussiancomponents. Biometrics 23: 115-135.
Biradar, R.S. and Gjísaeter, J. (1989). Population dynamics of Indian oil sardine, Sardinellalongiceps, off the southwest coast of India. Journal of Applied Ichthyology 5: 185-193.
Caputi, N., Fletcher, W.J., Pearce, A., and Chubb, C. (1996). Effect of the Leeuwin Current onthe recruitment of fish and invertebrates along the Western Australian coast. Marine andFreshwater Research 47: 147-155.
Cresswell, G.R., Bolond, F.M., Peterson, J.L. and Wells, G.S. (1989). Continental shelf currentsnear the Abrolhos Islands, Western Australia. Australian Journal of Marine and FreshwaterResearch. 40: 113-128.
Cury, P. and Roy, C. (1989). Optimal environmental window and pelagic fish recruitmentsuccess in upwelling areas. Canadian Journal of Fisheries and Aquatic Sciences 46: 670-680.
Davies, D.H. (1956). The South African pilchard (Sardinops ocellata). Sexual maturity andreproduction, 1950-1954. Div. Fish. Invest. Rep. 22: 1-55.
Dayaratne, P. and Gjosaeter, J. (1985). Age and growth of four Sardinella species. FisheriesResearch 4: 1-33.
Dwiponggo, A. (1974). The fishery for and preliminary study of ‘Lemuru’ (oil sardine) atMuntjar, Bali Strait. IPFC Procs. 15: 221-240.
Dwiponggo, A., Hariati, T., Banon, S., Palomares, M.L. and Pauly, D. (1986). Growth, mortalityand recruitment of commercially important fishes and penaeid shrimps in Indonesianwaters. Technical Report 17, ICLARM, Manila, 91 pp.
Edmonds, J.S. and Fletcher, W.J. (1997). Stock discrimination of pilchards, Sardinops sagax, bystable isotope ratio analysis of otolith carbonate. Marine Ecology. Progress Series 152:241-247.
Fletcher, W.J. (1990). A synopsis of the biology and the exploitation of the Australasianpilchard, Sardinops neopilchardus, Part 1. Biology. Fisheries Research Report. FisheriesDepartment, Western Australia 88: 1-45.
Fletcher, W.J. (1991a). A synopsis of the biology and exploitation of the Australian pilchard,Sardinops neopilchardus, Part II: History of stock assessment and exploitation. FisheriesResearch Report, Fisheries Department, Western Australia 91: 1-55.
Fletcher, W.J. (1991b). A test of the relationship between otolith weight and age for thepilchard Sardinops neopilchardus. Canadian Journal of Fisheries and Aquatic Sciences 48: 35-38.
Fletcher, W.J. (1994a). Western Fisheries Research Committee Report (unpublished, August1994).
Fish. Res. Rep. Fish. West. Aust.2000, 119, 1-136
120
Fletcher, W.J. (1994b). Modelling, a method for setting research priorities not just the tool forfinal analysis of Western Australian pilchards. Population dynamics for fisheries management.Australian Society for Fish Biology Conference Proceedings, Aug. 24-25, pp. 29-38.
Fletcher, W.J. (1995). Application of the otolith weight-age relationship for the pilchardSardinops sagax neopilchardus. Canadian Journal of Fisheries and Aquatic Sciences 52: 657-664.
Fletcher, W.J. and Blight, S.J. (1997). Validity of using translucent zones of otoliths to age thepilchard Sardinops sagax neopilchardus from Albany, Western Australia. Marine and FreshwaterResearch 47: 617-624.
Fletcher, W.J., Lo, N.C-H., Hayes, E.A., Tregonning, R.J. and Blight, S.J. (1996). Use of thedaily egg production method to estimate the stock size of Western Australian sardines(Sardinops sagax). Marine and Freshwater Research 47: 819-25.
Fletcher, W.J. and Tregonning, R.J. (1992). The distribution and timing of spawning by theAustralian pilchard (Sardinops sagax neopilchardus) off Albany, Western Australia. AustralianJournal of Marine and Freshwater Research 46: 1437-1449.
Fletcher, W.J., Tregonning, R.J. and Sant, G.J. (1994). Inter-seasonal variation in the transportof pilchard eggs and larvae off southern Western Australia. Marine Ecology Progress Series 111:209-224.
Fletcher, W.J., Tregonning, R.J., Sant, G.J., Blight, S.J. and Rossbach, M.H. (1992). Investigationof the abundance and distribution of pilchard eggs and larvae off southern Western Australia.FRDC Final Report, Project 91/24. 74 pp.
Fletcher W.J., White K.V., Gaughan D.J. and Sumner N.R. (1996). Analysis of the distributionof pilchard eggs off Western Australia to determine stock identity and monitor stock size.FRDC Final Report, Project 92/95. 109 pp.
Folkvord, A., Rukan, K., Johannessen, A. and Moksness, E. (1997). Early life history of herringlarvae in contrasting feeding environments determined by otolith microstructure analysis.Journal of Fisheries Biology 51(Supplement A): 250-263.
Francis, R.I.C.C. (1990). Back-calculation of fish length: a critical review. Journal of FisheriesBiology 36: 883-902.
Freon, P., El Khattabi, M., Mendoza, J. and Guzman, R. (1997). Unexpected reproductivestrategy of Sardinella aurita off the coast of Venezuela. Marine Biology 128: 363-372.
Furnas, M.J. (1989). Cyclonic disturbance and a phytoplankton bloom in a tropical shelfecosystem. Red tides: Biology, Environmental Science and Toxicology. p. 271-274.
Furnas, M.J. (1995). Land-sea interactions and oceanographic processes affecting the nutrientdynamics and productivity of Australian marine ecosystems. Australian Institute of MarineScience 61-71.
Gaughan, D.J., Neira, F.J., Beckley, L.E. and Potter, I.C. (1990). Composition, seasonality anddistribution of the ichthyoplankton in the lower Swan Estuary, south-western Australia.Australian Journal of Marine and Freshwater Research 41: 529-543.
Gayanilo, F.C., Sparre, P., and Pauly, P. (1996). FAO-ICLARM stock assessment tools - User’smanual. FAO Computerised Information Series (Fisheries).
Hatcher, A.I., Hatcher, B. G. and Wright, G.D. (1988). A preliminary report on theinteraction between the major human activities and the marine environments at theHoutman Abrolhos islands of Western Australia. Final Report to Abrolhos Islands Task Force,February 1988.
Fish. Res. Rep. Fish. West. Aust.2000, 119, 1-136
121
Hobday, D. (1988). Phillip Island penguin prey population study. Little penguin researchprogram, Department of Conservation and Lands Victoria.
Hunter, J.R. and Macewicz, B.J. (1985). Measurement of spawning frequency in multiplespawning fishes. NOAA Technical Report, NMFS 36: 79-94.
Hunter, J. R. (1985). Preservation of Northern Anchovy in Formaldehyde Solution. NOAATechnical Report, NMFS 36: 63-65.
Hutchins, J. B. (1991). Dispersal of tropical fishes to temperate seas in the southernhemisphere. Journal of the Royal Society of Western Australia 74: 79-94.
Hyndes, G.A., Loneragan, N.R. and Potter, I.C, (1992). Influence of sectioning otoliths onmarginal trends and age and growth estimates for the flathead Platycephalus speculator.Fisheries Bulletin 90: 276-284.
Jones, C.M. and Wells, B. (1998). Age, growth and mortality of black drum, Pogonias cromis, inthe Chesapeake Bay region. Fisheries Bulletin 96: 451-461.
Kagwade, P.V. (1967). The food and feeding of the Indian oil sardine. Indian Journal of Fisheries11: 345-370.
Kumar, K. and Balasubrahmanyan, K. (1989). Fishery and biology of oil sardine, Sardinellalongiceps, from coastal water of India. Central Marine Fisheries Research Insitute 44: 42-45.
Lasker, R. (editor) (1985). An egg production method for estimating spawning biomass ofpelagic fish: application to the northern anchovy, Engraulis mordax. NOAA Technical ReportNMFS 36.
Lazarus, S. (1990). Studies on the spawning biology of the trenched sardine, Sardinella sirm(Walbaum), from Vizhinjam, south-west coast of India. Indian Journal of Fisheries 37:335-346.
Mendellsohn, R. and Cury, P. (1989). Temporal and spatial dynamics of a coastal pelagicspecies, Sardinella maderensis off the Ivory Coast. Canadian Journal of Fisheries and AquaticSciences 46: 1686-1697.
Merta, G.S. (1992). Beberapa parameter biologi ikan lemuru, Sardinella lemuru Bleeker 1853dari Perairan Selat Bali. Journal of Marine Research. Fisheries Institute 67: 1-10.
Merta, G.S. (1995). Review of the Lemuru fishery in the Bali Strait. In: Biodynex: Biology,dynamics, exploitation of the small pelagic fishes in the Java Sea, edited by Nurhakim, S. andPotier, M. Pelfish.
Naamin, N. (1987). Consequences of excessive fishing effort on fishery resources in Indonesia.In: IPFC papers presented at the symposium on the exploitation and management of marine fisheryresources in South-east Asia, 16-19 February 1987, Darwin, Australia, RAPA Report, 10:291-305.
Neilson, J.D. (1992). Sources of error in otolith microstructure examination. Canadian Journalof Fisheries and Aquatic Sciences, Special Publication 117: 115-125.
Ohshimo, S., Nagatani, H., and Ichimaru, T. (1997). Growth of 0-age Japanese sardine,Sardinops melanostictus, in the waters off the western coast of Kyushu. Fisheries Science 63:659-663.
Patterson, K. (1992). Fisheries for small pelagic species: An empirical approach to managementtargets. Reviews in Fish Biology and Fisheries 2: 321-338.
Pauly, D. (1980). On the interrelationship between natural mortality, growth parameters andmean environmental temperature in 175 fish stocks. Journal du Conseil pour InternationalExploration de la Mer 39: 175-192.
Fish. Res. Rep. Fish. West. Aust.2000, 119, 1-136
122
Pauly, D. (1982). Studying single species dynamics in a tropical multispecies context. In: Pauly,D. and G. J. Murphy (eds.) Theory and management of tropical fisheries. ICLARM conferenceproceedings 9. 360 pp. ICLARM, Manila, Philippines and Division of Fisheries Research,CSIRO, Cronulla, Australia. pp. 33-70.
Pawson, M.G. (1990). Using otolith weight to age fish. Journal of Fish Biology 36: 521-531.
Pearce, A. (1997). The Leeuwin Current and the Houtman Abrolhos Islands. In: Wells, F.E.(ed.), The marine flora and fauna of the Houtman Abrolhos Islands, Western Australia. WesternAustralian Museum, pp. 11-46.
Pet, J.S., van Densen, W.L.T., Machiels, M.A.M., Sukkel, M., Setyohadi, D. and Tumulijadi, A.(1997a). Length-based analysis of population dynamics and stock identification in thesardine fisheries around East Java, Indonesia. Fisheries Research 31: 107-120.
Pet, J.S., van Densen, W.L.T., Machiels, M.A.M., Sukkel, M., Setyohadi, D. and Tumuljadi, A.(1997b). Catch, effort and sampling strategies in the highly variable sardine fisheries aroundEast Java, Indonesia. Fisheries Research 31: 121-137.
Ritterbush, S.W. (1975). An assessment of the population biology of the Bali Strait lemurufishery. Laporan Penelitian Perikanan Laut. (Marine Fisheries Research Report) No. 1: 1-38.
Scott, A. (1983). Meterology of the Abrolhos Islands. Proceedings of a workshop on theHoutman Abrolhos. Western Australian Branch of the Australian Marine Sciences Association.
Sharp, G.D. and Csirke, J. (editors) (1983). Proceedings of the expert consultation to examinechanges in abundance and species composition of neritic fish resources. Fisheries Report,FAO, Rome, 291: 1224.
Sujastani, T. and Nurhakim, S. (1982). Potensi sumberdaya perikanan lemuru (S. longiceps) diselat Bali. Pros. Sem. Perik. Lemuru. Banyuwangi, 18-21 Jan. Buku II. Puslitbangkan,Jakarta, pp. 1-11.
Thorrold, S.R. & Williams, D. McB. (1989). Analysis of otolith microstructure to determinegrowth histories in larval cohorts of a tropical herring (Herklotsichthys castelnaui). CanadianJournal of Fisheries and Aquatic Sciences 46: 1615-1624.
Tranter, D.J., Carpenter, D.J., and Leech, G.S. (1986). The coastal enrichment effect of the EastAustralian Current eddy field. Deep-sea Research 33: 1705-1728.
Venema, S.C. (1996). Results of surveys for pelagic resources in Indonesian waters with theR/V Lemuru, December 1972 to May 1976. In: D. Pauly and P. Martosubroto (eds),Baseline studies of biodiversity: the fish resources of Western Indonesia. Director General ofFisheries Indonesia, German Agency for Technical Cooperation, ICLARM. pp. 102-122.
Wallace, R.A. and Selman, K. (1981). Cellular and dynamic aspects of oocyte growth inteleosts. Am. Zoo. 21(2): 325-343.
White, K.V. and Fletcher, W.J. (1998). Identifying the developmental stages for eggs of theAustralian pilchard, Sardinops sagax. Fisheries Research Report, Fisheries WA, 103: 1-21.
Whitehead, P.J.P. (1985). FAO Species Catalogue Vol 7. Clupeoid fishes of the world. Part I.FAO Fisheries Synopsis Rome. 125(7).
Fish. Res. Rep. Fish. West. Aust.2000, 119, 1-136
123
14.0 Appendices
Appendix 1: Sampling for juvenile Sardinella lemuruThe background to this appendix is provided in section 2.2.5.11.
Materials and methods
MainlandIn July 1997 beach seine nets were used to sample several beaches between Cervantes and LuckyBay (Figure 1A, Table 1A). At each site, three shots were made using a 67 m beach seine net.A 120 m beach seine was also shot once if there was no reef present close to the beach. Thecomposition of the catch was recorded.
Abrolhos IslandsThe Houtman Abrolhos Islands are a network of limestone and coral islands located about60 miles from the mainland coast (Figure 1A). The islands constitute an area of high productivitywithin the relatively nutrient poor marine waters which surround.
The occurrence of coral and limestone in the shallows made it impractical to attempt beachseining in this region. Thus, attempts were made to catch small S. lemuru using other methods.Sampling was carried out in the months of September and November 1997 and June 1998 onRat Island in the middle group of the Abrolhos Islands. This site was chosen for several reasons,including accessibility by boat and aircraft, and the existence of jetties to use as sampling platforms.
Sardinella lemuru are known to congregate towards light during the night, and have been successfullytargeted with light-fishing in the Bali Strait (Ritterbush 1975; Venema 1996). The samplingtechnique aimed at congregating any light-respondent baitfish in the area to a point near a jettywhere they could be netted. A 3000 watt lamp powered by a 240 volt generator was mountedonto a jetty and angled at 60 degrees to the water’s surface. Two locations were sampled on RatIsland and the choice of which was used at any one time depended on the prevailing winddirection. Calm conditions were preferred so that surface ripples would not decrease lightpenetration into the water. Depth profiles were recorded at each site (Figure 1B). Both sites werecleared of any obstructions (e.g. steel pipes, tyres) on the bottom before sampling commenced.Pollard (crushed wheat) was mixed with sea water and vegetable oil and was used as an additionalattractant at the sampling sites.
A conical lift net, with a 1.3 m mouth-diameter and 5 mm mesh was used to capture fish attractedto the lights. It had a drop of 2.5 m and was hauled by rope running through a pulley attached toa 3 m steel rod extended out from a jetty. The major advantage of using this technique is that itrequired little time and effort to set and retrieve the net. The light was concentrated above the liftnet and when fish were aggregated in reasonable numbers the net was hauled vertically out of thewater. The fish were then removed from the net and identified.
In conjunction with the lift net method, a 55 m gill net with a mesh size of 4 cm was used totarget predatory fish which may have been feeding on baitfish. One end of the net was tied to thejetty a few metres from the deck lamp and the rest of the net was extended away from the jettyusing a dingy. The gill net was left in the water for approximately five hours before it was checked.Captured fish were identified and their stomachs kept for subsequent examination of contents.
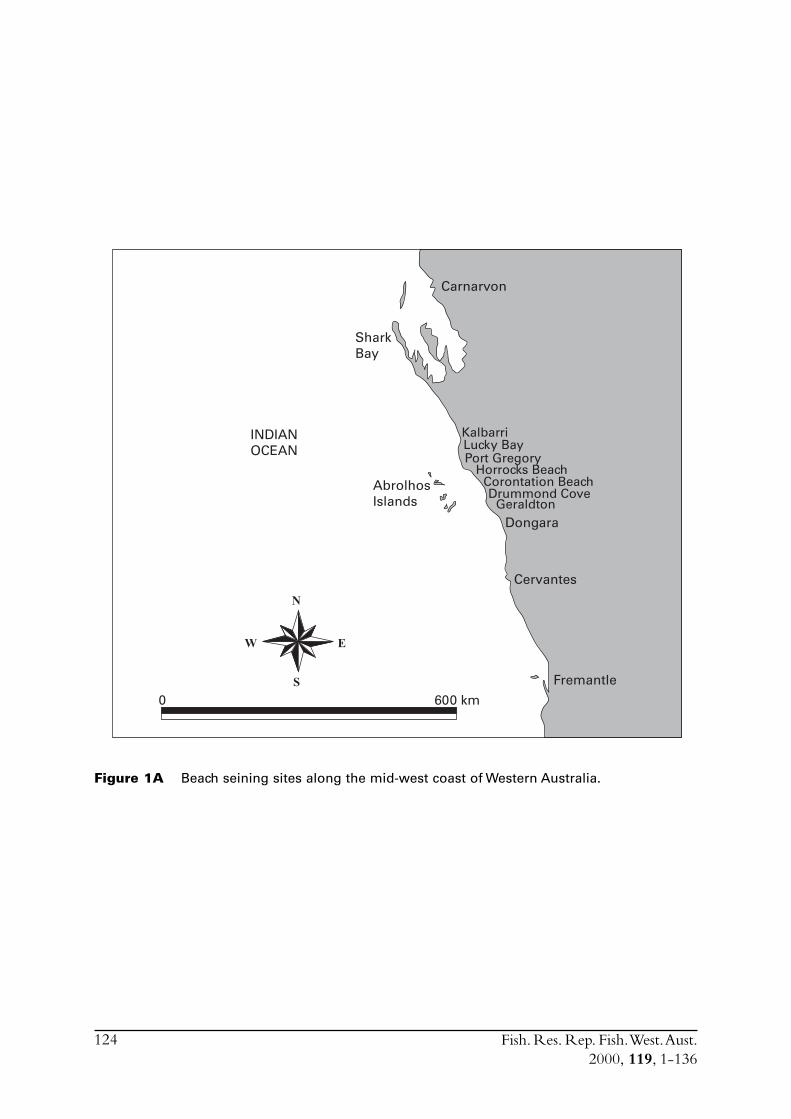
Fish. Res. Rep. Fish. West. Aust.2000, 119, 1-136
124
Figure 1A Beach seining sites along the mid-west coast of Western Australia.
0 600 km
N
E
S
W
INDIANOCEAN
Carnarvon
SharkBay
KalbarriLucky BayPort Gregory
Horrocks BeachCorontation BeachDrummond Cove
GeraldtonDongara
Cervantes
Fremantle
AbrolhosIslands

Fish. Res. Rep. Fish. West. Aust.2000, 119, 1-136
125
Figure 1B Depth profiles for (i) Site 1 and (ii) Site 2 on Rat Island.
(ii)
(i)Distance from jetty (m)
Dep
th (
m)
0
2
4
6
8
10
12
14
0 2 4 6 8 10 12 14 16 18 20 22 24 26 28 30 32 34
Distance from jetty (m)
Dep
th (
m)
0 2 4 6 8 10 12 14 16 18 20 22 24 26 28 30 32 340
1
2
3
4
Reef table
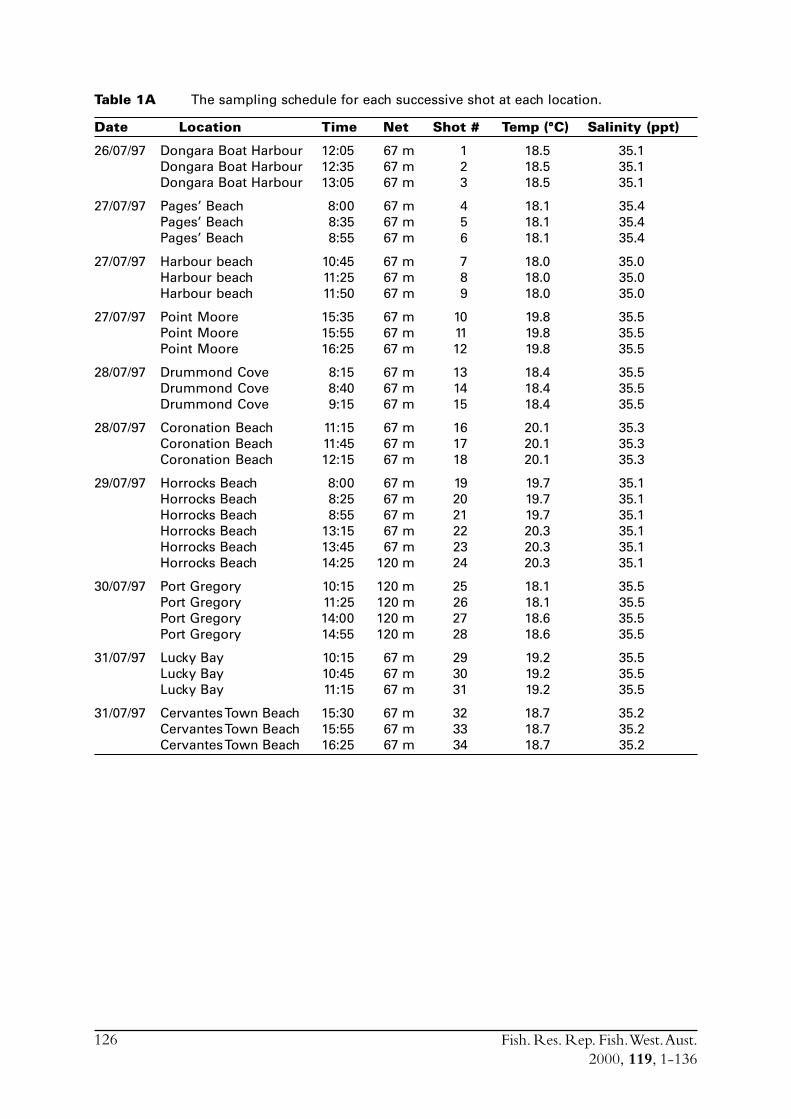
Fish. Res. Rep. Fish. West. Aust.2000, 119, 1-136
126
Table 1A The sampling schedule for each successive shot at each location.
Date Location Time Net Shot # Temp (°°°°°C) Salinity (ppt)
26/07/97 Dongara Boat Harbour 12:05 67 m 1 18.5 35.1Dongara Boat Harbour 12:35 67 m 2 18.5 35.1Dongara Boat Harbour 13:05 67 m 3 18.5 35.1
27/07/97 Pages’ Beach 8:00 67 m 4 18.1 35.4Pages’ Beach 8:35 67 m 5 18.1 35.4Pages’ Beach 8:55 67 m 6 18.1 35.4
27/07/97 Harbour beach 10:45 67 m 7 18.0 35.0Harbour beach 11:25 67 m 8 18.0 35.0Harbour beach 11:50 67 m 9 18.0 35.0
27/07/97 Point Moore 15:35 67 m 10 19.8 35.5Point Moore 15:55 67 m 11 19.8 35.5Point Moore 16:25 67 m 12 19.8 35.5
28/07/97 Drummond Cove 8:15 67 m 13 18.4 35.5Drummond Cove 8:40 67 m 14 18.4 35.5Drummond Cove 9:15 67 m 15 18.4 35.5
28/07/97 Coronation Beach 11:15 67 m 16 20.1 35.3Coronation Beach 11:45 67 m 17 20.1 35.3Coronation Beach 12:15 67 m 18 20.1 35.3
29/07/97 Horrocks Beach 8:00 67 m 19 19.7 35.1Horrocks Beach 8:25 67 m 20 19.7 35.1Horrocks Beach 8:55 67 m 21 19.7 35.1Horrocks Beach 13:15 67 m 22 20.3 35.1Horrocks Beach 13:45 67 m 23 20.3 35.1Horrocks Beach 14:25 120 m 24 20.3 35.1
30/07/97 Port Gregory 10:15 120 m 25 18.1 35.5Port Gregory 11:25 120 m 26 18.1 35.5Port Gregory 14:00 120 m 27 18.6 35.5Port Gregory 14:55 120 m 28 18.6 35.5
31/07/97 Lucky Bay 10:15 67 m 29 19.2 35.5Lucky Bay 10:45 67 m 30 19.2 35.5Lucky Bay 11:15 67 m 31 19.2 35.5
31/07/97 Cervantes Town Beach 15:30 67 m 32 18.7 35.2Cervantes Town Beach 15:55 67 m 33 18.7 35.2Cervantes Town Beach 16:25 67 m 34 18.7 35.2
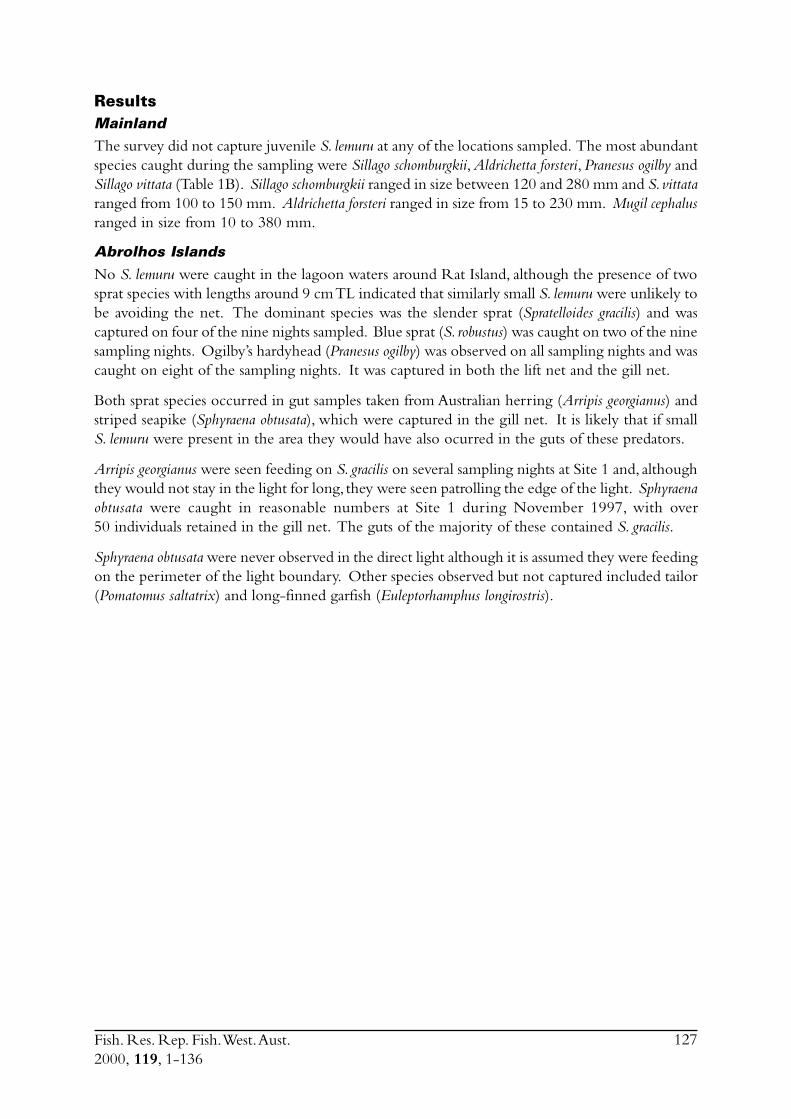
Fish. Res. Rep. Fish. West. Aust.2000, 119, 1-136
127
ResultsMainlandThe survey did not capture juvenile S. lemuru at any of the locations sampled. The most abundantspecies caught during the sampling were Sillago schomburgkii, Aldrichetta forsteri, Pranesus ogilby andSillago vittata (Table 1B). Sillago schomburgkii ranged in size between 120 and 280 mm and S. vittataranged from 100 to 150 mm. Aldrichetta forsteri ranged in size from 15 to 230 mm. Mugil cephalusranged in size from 10 to 380 mm.
Abrolhos IslandsNo S. lemuru were caught in the lagoon waters around Rat Island, although the presence of twosprat species with lengths around 9 cm TL indicated that similarly small S. lemuru were unlikely tobe avoiding the net. The dominant species was the slender sprat (Spratelloides gracilis) and wascaptured on four of the nine nights sampled. Blue sprat (S. robustus) was caught on two of the ninesampling nights. Ogilby’s hardyhead (Pranesus ogilby) was observed on all sampling nights and wascaught on eight of the sampling nights. It was captured in both the lift net and the gill net.
Both sprat species occurred in gut samples taken from Australian herring (Arripis georgianus) andstriped seapike (Sphyraena obtusata), which were captured in the gill net. It is likely that if smallS. lemuru were present in the area they would have also ocurred in the guts of these predators.
Arripis georgianus were seen feeding on S. gracilis on several sampling nights at Site 1 and, althoughthey would not stay in the light for long, they were seen patrolling the edge of the light. Sphyraenaobtusata were caught in reasonable numbers at Site 1 during November 1997, with over50 individuals retained in the gill net. The guts of the majority of these contained S. gracilis.
Sphyraena obtusata were never observed in the direct light although it is assumed they were feedingon the perimeter of the light boundary. Other species observed but not captured included tailor(Pomatomus saltatrix) and long-finned garfish (Euleptorhamphus longirostris).
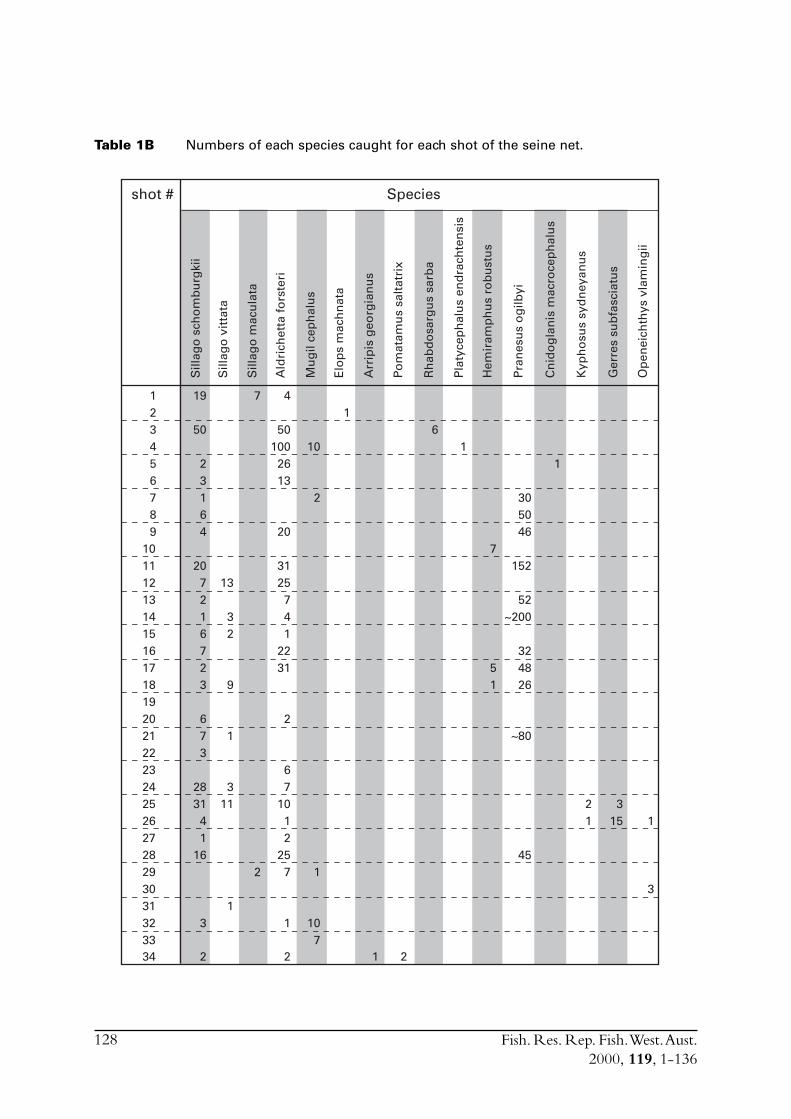
Fish. Res. Rep. Fish. West. Aust.2000, 119, 1-136
128
Table 1B Numbers of each species caught for each shot of the seine net.
Sill
ago
sch
om
bu
rgki
i
Sill
ago
vit
tata
Sill
ago
mac
ula
ta
Ald
rich
etta
fo
rste
ri
Mu
gil
cep
hal
us
Elo
ps
mac
hn
ata
Arr
ipis
geo
rgia
nu
s
Po
mat
amu
s sa
ltat
rix
Rh
abd
osa
rgu
s sa
rba
Pla
tyce
ph
alu
s en
dra
chte
nsi
s
Hem
iram
ph
us
rob
ust
us
Pra
nes
us
og
ilbyi
Cn
ido
gla
nis
mac
roce
ph
alu
s
Kyp
ho
sus
syd
ney
anu
s
Ger
res
sub
fasc
iatu
s
Op
enei
chth
ys v
lam
ing
ii
123456789
10111213141516171819202122232425262728293031323334
shot #
19
50
23164
207216723
673
283141
16
3
2
13
32
9
1
311
1
7
2
4
501002613
20
3125741
2231
2
67
1012
257
1
2
10
2
1
107
1
1 2
61
7
51
305046
152
52~200
324826
~80
45
1
21
315 1
3
Species
Fish. Res. Rep. Fish. West. Aust.2000, 119, 1-136
129
Appendix 2: Experimental mid-water pelagic trawling forSardinella lemuru
IntroductionThe main aim of the mid-water trawling was to obtain samples of adults during the summerbreeding period (e.g. February 1996) when commercial vessels were not operating, to provideestimates of parameters to be used in the daily egg production method (DEPM) of estimatingspawning biomass. Additional surveys were also undertaken to fill large gaps in the periodicity ofsample collection (e.g. late September 1997).
Survey equipmentVessel dimensionsThe RV Flinders is a 20.5 m trawler which was modified to perform mid-water trawling. It isconstructed of steel and powered by a 235 hp Gardner engine.
Searching equipmentA Furuno colour video sounder was used during the surveys and this instrument was interfacedwith an acoustic sonar and was designed to monitor bottom topography and to gauge schooldensity and size.
A dualscan sonar, with two transducer scanpods, was also used during most surveys and thisparticular model has a function which allows the echo sounder to be displayed simultaneously onthe same screen with the sonar image. This conveniently allowed the skipper to monitor onescreen instead of having to observe two independent screens. This model of sonar also has asidescope and octoscope function. These modes allow the user to accurately determine thevertical height, position and density of fish school targets on both sides of the vessel.
The tracking functions of the digital sonar allowed targets ahead of the vessel to be monitoredbefore the net was lowered to the correct depth. It was also noticed that changes in schoolformation, in response for instance to predatory attacks, could be observed on the sonar’s monitor,which allowed further adjustments to net depth.
Net descriptionThe pelagic trawl net was relatively small, 47.9 m in length, so that it could be towed as quickly aspossible and had a cod-end with a maximum catch rating of 1-2 tonnes. Schools of S. lemuru inthe Geraldton region often exceed 10 tonnes in size. Therefore it was important that the sonarwas used effectively to avoid chances of accidentally towing the net through the middle of a denseschool, an event which would probably damage the net, result in lost sea time, and kill unnecessarynumbers of fish.
The net was a standard mid-water trawl design with 3.2 m meshes in the opening (herdingpanels), tapering down from 162 cm to 20 cm mesh in the middle panels with a rear mesh size of5 cm. The cod end was constructed from 12 mm mesh and was 2.5 m long. While fishing at atowing speed of 3 knots, the horizontal mouth opening of the trawl was 24.3 m.
The double foil pelagic trawl doors were 1.4 m2 each and weighed 161 kg (Figure 2A). The doorswere based on the cambered German Suberkrub design, that provides a hydrodynamically efficientdoor, with a high aspect ratio of 2:1, which greatly improves the lift to drag ratio. These doors aresuitable only for mid-water trawling and are extremely sensitive to adjustments of backstrops ortowing points.
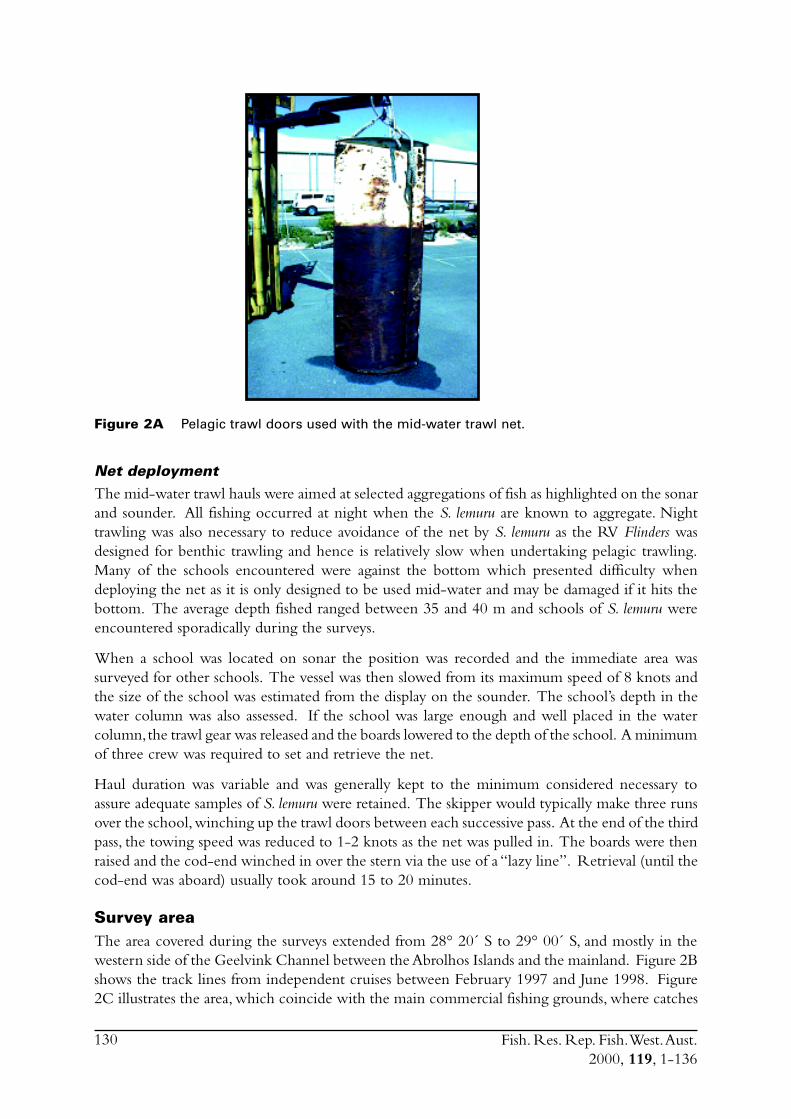
Fish. Res. Rep. Fish. West. Aust.2000, 119, 1-136
130
Figure 2A Pelagic trawl doors used with the mid-water trawl net.
Net deploymentThe mid-water trawl hauls were aimed at selected aggregations of fish as highlighted on the sonarand sounder. All fishing occurred at night when the S. lemuru are known to aggregate. Nighttrawling was also necessary to reduce avoidance of the net by S. lemuru as the RV Flinders wasdesigned for benthic trawling and hence is relatively slow when undertaking pelagic trawling.Many of the schools encountered were against the bottom which presented difficulty whendeploying the net as it is only designed to be used mid-water and may be damaged if it hits thebottom. The average depth fished ranged between 35 and 40 m and schools of S. lemuru wereencountered sporadically during the surveys.
When a school was located on sonar the position was recorded and the immediate area wassurveyed for other schools. The vessel was then slowed from its maximum speed of 8 knots andthe size of the school was estimated from the display on the sounder. The school’s depth in thewater column was also assessed. If the school was large enough and well placed in the watercolumn, the trawl gear was released and the boards lowered to the depth of the school. A minimumof three crew was required to set and retrieve the net.
Haul duration was variable and was generally kept to the minimum considered necessary toassure adequate samples of S. lemuru were retained. The skipper would typically make three runsover the school, winching up the trawl doors between each successive pass. At the end of the thirdpass, the towing speed was reduced to 1-2 knots as the net was pulled in. The boards were thenraised and the cod-end winched in over the stern via the use of a “lazy line”. Retrieval (until thecod-end was aboard) usually took around 15 to 20 minutes.
Survey areaThe area covered during the surveys extended from 28° 20´ S to 29° 00´ S, and mostly in thewestern side of the Geelvink Channel between the Abrolhos Islands and the mainland. Figure 2Bshows the track lines from independent cruises between February 1997 and June 1998. Figure2C illustrates the area, which coincide with the main commercial fishing grounds, where catches
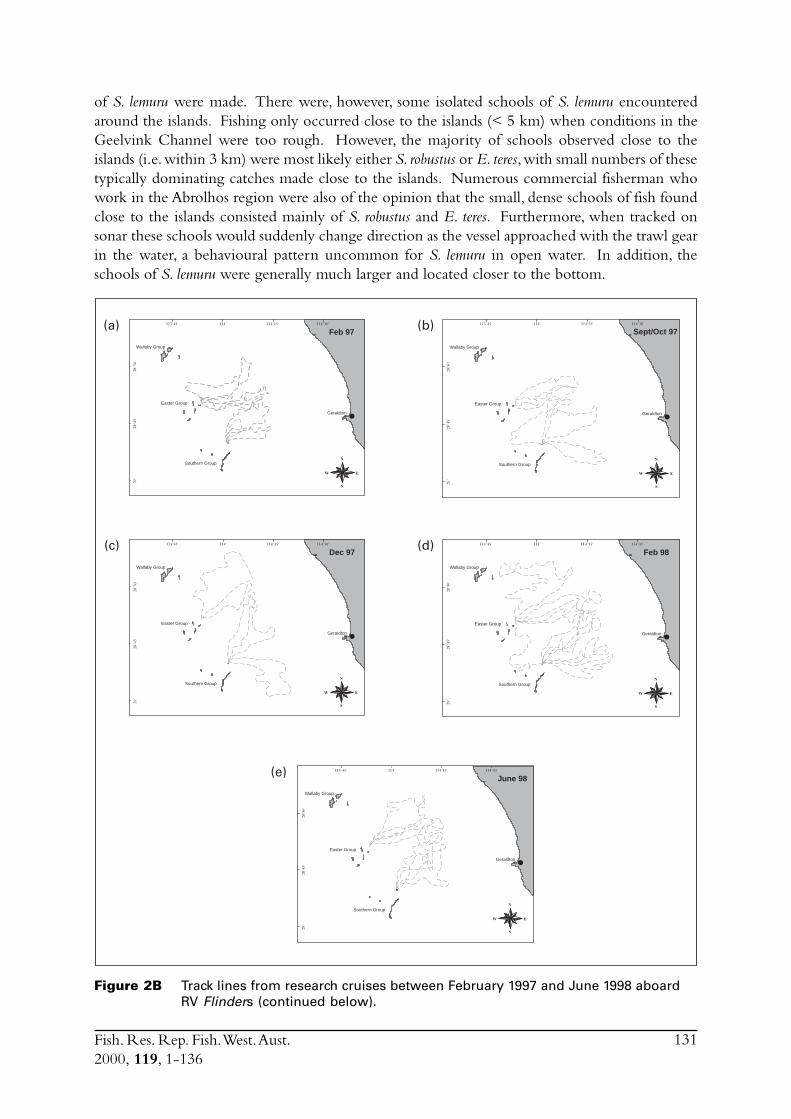
Fish. Res. Rep. Fish. West. Aust.2000, 119, 1-136
131
of S. lemuru were made. There were, however, some isolated schools of S. lemuru encounteredaround the islands. Fishing only occurred close to the islands (< 5 km) when conditions in theGeelvink Channel were too rough. However, the majority of schools observed close to theislands (i.e. within 3 km) were most likely either S. robustus or E. teres, with small numbers of thesetypically dominating catches made close to the islands. Numerous commercial fisherman whowork in the Abrolhos region were also of the opinion that the small, dense schools of fish foundclose to the islands consisted mainly of S. robustus and E. teres. Furthermore, when tracked onsonar these schools would suddenly change direction as the vessel approached with the trawl gearin the water, a behavioural pattern uncommon for S. lemuru in open water. In addition, theschools of S. lemuru were generally much larger and located closer to the bottom.
Figure 2B Track lines from research cruises between February 1997 and June 1998 aboardRV Flinders (continued below).
Southern Group
Easter Group
Wallaby Group
Geraldton
Feb 97
N
E
S
W
Southern Group
Easter Group
Wallaby Group
Geraldton
Sept/Oct 97
N
E
S
W
Southern Group
Easter Group
Wallaby Group
Geraldton
Dec 97
N
E
S
W
Southern Group
Easter Group
Wallaby Group
Geraldton
Feb 98
N
E
S
W
Southern Group
Easter Group
Wallaby Group
Geraldton
June 98
N
E
S
W
(a)
(e)
(d)(c)
(b)
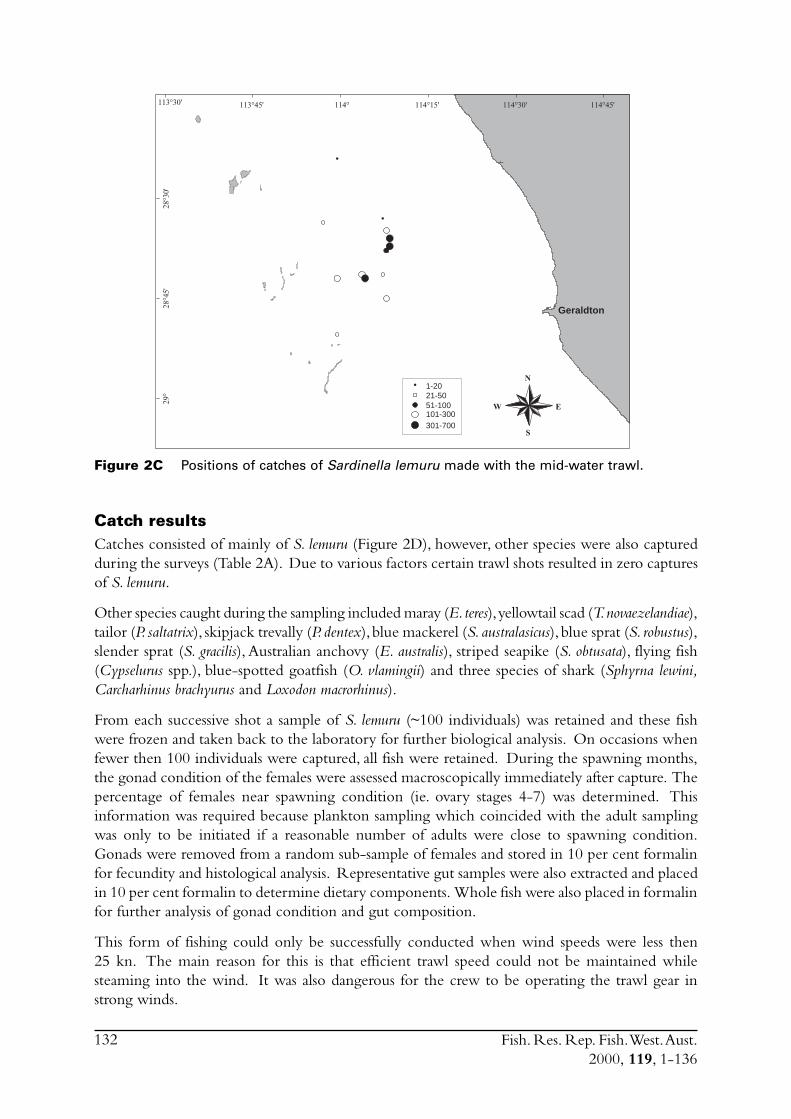
Fish. Res. Rep. Fish. West. Aust.2000, 119, 1-136
132
Figure 2C Positions of catches of Sardinella lemuru made with the mid-water trawl.
Catch resultsCatches consisted of mainly of S. lemuru (Figure 2D), however, other species were also capturedduring the surveys (Table 2A). Due to various factors certain trawl shots resulted in zero capturesof S. lemuru.
Other species caught during the sampling included maray (E. teres), yellowtail scad (T. novaezelandiae),tailor (P. saltatrix), skipjack trevally (P. dentex), blue mackerel (S. australasicus), blue sprat (S. robustus),slender sprat (S. gracilis), Australian anchovy (E. australis), striped seapike (S. obtusata), flying fish(Cypselurus spp.), blue-spotted goatfish (O. vlamingii) and three species of shark (Sphyrna lewini,Carcharhinus brachyurus and Loxodon macrorhinus).
From each successive shot a sample of S. lemuru (~100 individuals) was retained and these fishwere frozen and taken back to the laboratory for further biological analysis. On occasions whenfewer then 100 individuals were captured, all fish were retained. During the spawning months,the gonad condition of the females were assessed macroscopically immediately after capture. Thepercentage of females near spawning condition (ie. ovary stages 4-7) was determined. Thisinformation was required because plankton sampling which coincided with the adult samplingwas only to be initiated if a reasonable number of adults were close to spawning condition.Gonads were removed from a random sub-sample of females and stored in 10 per cent formalinfor fecundity and histological analysis. Representative gut samples were also extracted and placedin 10 per cent formalin to determine dietary components. Whole fish were also placed in formalinfor further analysis of gonad condition and gut composition.
This form of fishing could only be successfully conducted when wind speeds were less then25 kn. The main reason for this is that efficient trawl speed could not be maintained whilesteaming into the wind. It was also dangerous for the crew to be operating the trawl gear instrong winds.
Geraldton
1-2021-5051-100101-300301-700
N
E
S
W
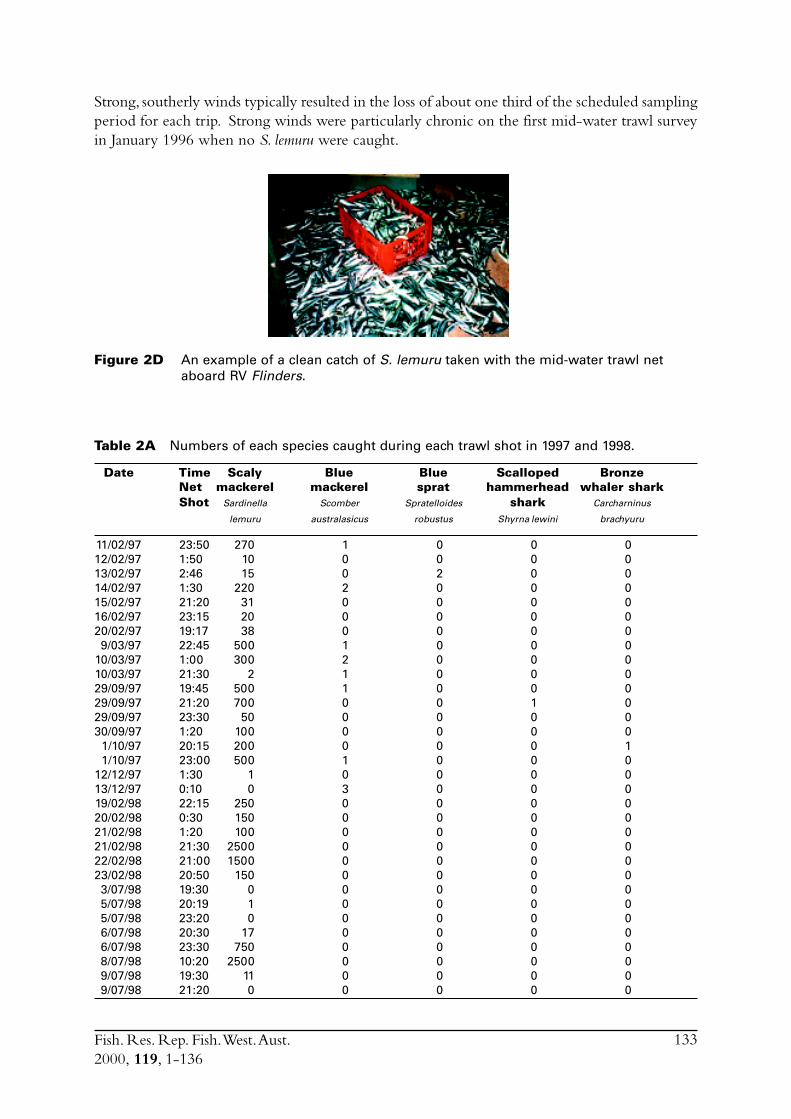
Fish. Res. Rep. Fish. West. Aust.2000, 119, 1-136
133
Strong, southerly winds typically resulted in the loss of about one third of the scheduled samplingperiod for each trip. Strong winds were particularly chronic on the first mid-water trawl surveyin January 1996 when no S. lemuru were caught.
Figure 2D An example of a clean catch of S. lemuru taken with the mid-water trawl netaboard RV Flinders.
Table 2A Numbers of each species caught during each trawl shot in 1997 and 1998.
Date Time Scaly Blue Blue Scalloped BronzeNet mackerel mackerel sprat hammerhead whaler sharkShot Sardinella Scomber Spratelloides shark Carcharninus
lemuru australasicus robustus Shyrna lewini brachyuru
11/02/97 23:50 270 1 0 0 012/02/97 1:50 10 0 0 0 013/02/97 2:46 15 0 2 0 014/02/97 1:30 220 2 0 0 015/02/97 21:20 31 0 0 0 016/02/97 23:15 20 0 0 0 020/02/97 19:17 38 0 0 0 09/03/97 22:45 500 1 0 0 0
10/03/97 1:00 300 2 0 0 010/03/97 21:30 2 1 0 0 029/09/97 19:45 500 1 0 0 029/09/97 21:20 700 0 0 1 029/09/97 23:30 50 0 0 0 030/09/97 1:20 100 0 0 0 0
1/10/97 20:15 200 0 0 0 11/10/97 23:00 500 1 0 0 0
12/12/97 1:30 1 0 0 0 013/12/97 0:10 0 3 0 0 019/02/98 22:15 250 0 0 0 020/02/98 0:30 150 0 0 0 021/02/98 1:20 100 0 0 0 021/02/98 21:30 2500 0 0 0 022/02/98 21:00 1500 0 0 0 023/02/98 20:50 150 0 0 0 03/07/98 19:30 0 0 0 0 05/07/98 20:19 1 0 0 0 05/07/98 23:20 0 0 0 0 06/07/98 20:30 17 0 0 0 06/07/98 23:30 750 0 0 0 08/07/98 10:20 2500 0 0 0 09/07/98 19:30 11 0 0 0 09/07/98 21:20 0 0 0 0 0
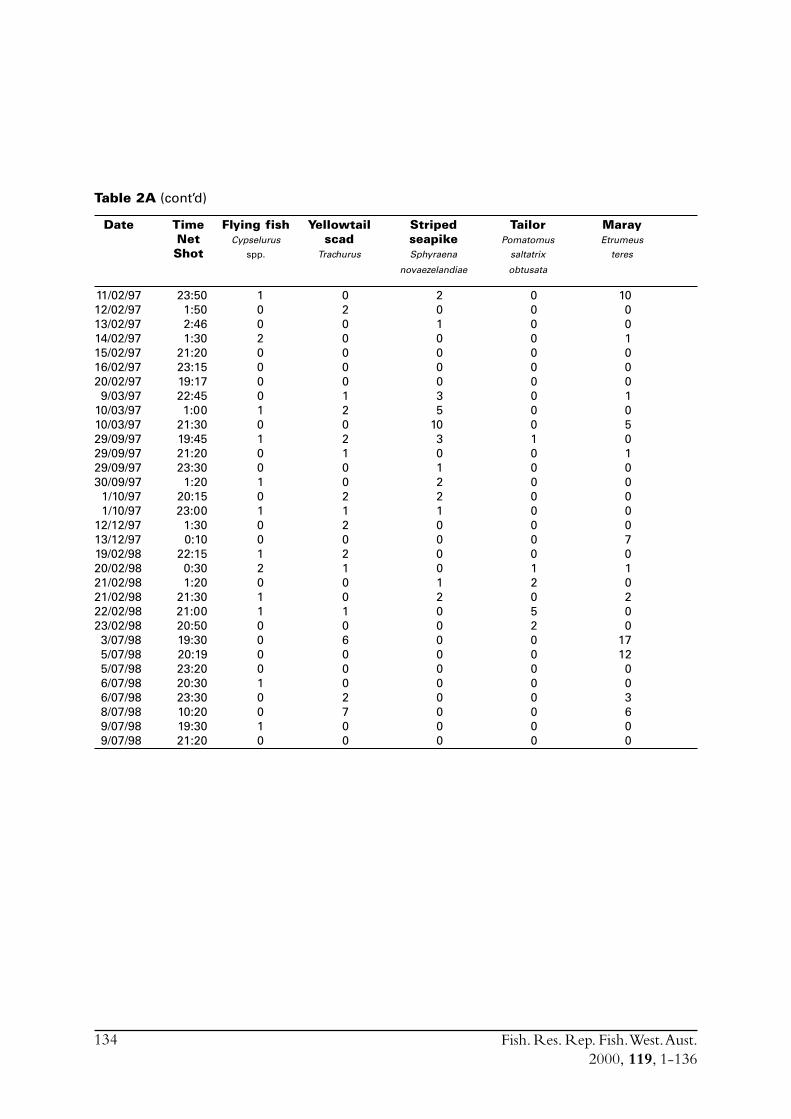
Fish. Res. Rep. Fish. West. Aust.2000, 119, 1-136
134
Table 2A (cont’d)
Date Time Flying fish Yellowtail Striped Tailor MarayNet Cypselurus scad seapike Pomatomus Etrumeus
Shot spp. Trachurus Sphyraena saltatrix teres
novaezelandiae obtusata
11/02/97 23:50 1 0 2 0 1012/02/97 1:50 0 2 0 0 013/02/97 2:46 0 0 1 0 014/02/97 1:30 2 0 0 0 115/02/97 21:20 0 0 0 0 016/02/97 23:15 0 0 0 0 020/02/97 19:17 0 0 0 0 09/03/97 22:45 0 1 3 0 1
10/03/97 1:00 1 2 5 0 010/03/97 21:30 0 0 10 0 529/09/97 19:45 1 2 3 1 029/09/97 21:20 0 1 0 0 129/09/97 23:30 0 0 1 0 030/09/97 1:20 1 0 2 0 0
1/10/97 20:15 0 2 2 0 01/10/97 23:00 1 1 1 0 0
12/12/97 1:30 0 2 0 0 013/12/97 0:10 0 0 0 0 719/02/98 22:15 1 2 0 0 020/02/98 0:30 2 1 0 1 121/02/98 1:20 0 0 1 2 021/02/98 21:30 1 0 2 0 222/02/98 21:00 1 1 0 5 023/02/98 20:50 0 0 0 2 03/07/98 19:30 0 6 0 0 175/07/98 20:19 0 0 0 0 125/07/98 23:20 0 0 0 0 06/07/98 20:30 1 0 0 0 06/07/98 23:30 0 2 0 0 38/07/98 10:20 0 7 0 0 69/07/98 19:30 1 0 0 0 09/07/98 21:20 0 0 0 0 0
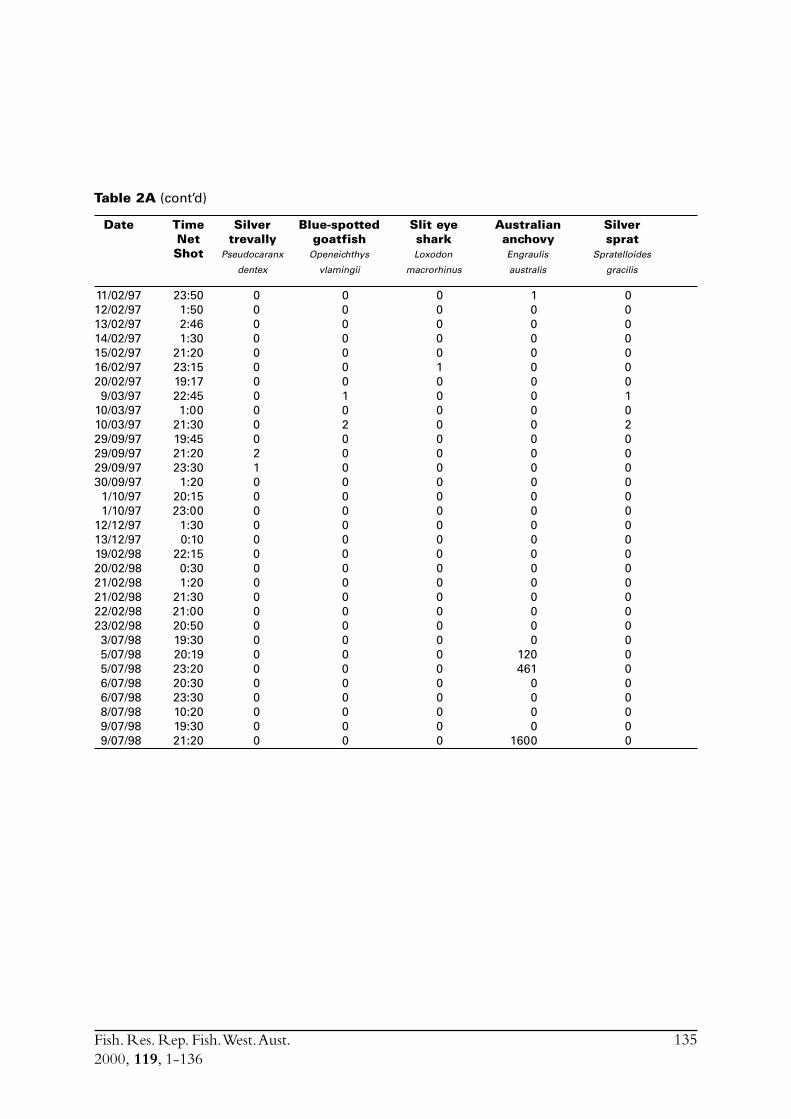
Fish. Res. Rep. Fish. West. Aust.2000, 119, 1-136
135
Table 2A (cont’d)
Date Time Silver Blue-spotted Slit eye Australian SilverNet trevally goatfish shark anchovy spratShot Pseudocaranx Openeichthys Loxodon Engraulis Spratelloides
dentex vlamingii macrorhinus australis gracilis
11/02/97 23:50 0 0 0 1 012/02/97 1:50 0 0 0 0 013/02/97 2:46 0 0 0 0 014/02/97 1:30 0 0 0 0 015/02/97 21:20 0 0 0 0 016/02/97 23:15 0 0 1 0 020/02/97 19:17 0 0 0 0 09/03/97 22:45 0 1 0 0 1
10/03/97 1:00 0 0 0 0 010/03/97 21:30 0 2 0 0 229/09/97 19:45 0 0 0 0 029/09/97 21:20 2 0 0 0 029/09/97 23:30 1 0 0 0 030/09/97 1:20 0 0 0 0 0
1/10/97 20:15 0 0 0 0 01/10/97 23:00 0 0 0 0 0
12/12/97 1:30 0 0 0 0 013/12/97 0:10 0 0 0 0 019/02/98 22:15 0 0 0 0 020/02/98 0:30 0 0 0 0 021/02/98 1:20 0 0 0 0 021/02/98 21:30 0 0 0 0 022/02/98 21:00 0 0 0 0 023/02/98 20:50 0 0 0 0 03/07/98 19:30 0 0 0 0 05/07/98 20:19 0 0 0 120 05/07/98 23:20 0 0 0 461 06/07/98 20:30 0 0 0 0 06/07/98 23:30 0 0 0 0 08/07/98 10:20 0 0 0 0 09/07/98 19:30 0 0 0 0 09/07/98 21:20 0 0 0 1600 0

Fish. Res. Rep. Fish. West. Aust.2000, 119, 1-136
136
Appendix 3: Intellectual property and valuable informationNo saleable items were developed during this project.
Appendix 4: StaffStaff that were employed on the project using FRDC funds were:Mr J. Chidlow, Dr D. Gaughan, Mr R. Mitchell, Mr. R. Tregonning.
Staff who assisted on the project using non-FRDC funds were:Mr G. Baudains, Mr T. Berden, Mr S. Blight, Mr I. Dunk, Dr W. Fletcher, Mr K. Gosden,Mr D. Harris, Mr K. Hillier, Mr A. Longstaff, Mr R. Mijat, Ms J. Murdoch, Mr W. Shaw,Mr T. Sheperd, Mr B. Webber, Mr K. White.