Embed Size (px)
Citation preview
1
Final report
New heat pump and solar heating

2
1. Project details
Project title New heat pump and solar heating
Project identification (pro-
gram abbrev. and file)
64011-0072
Name of the programme
which has funded the project
EUDP-11-I
Project managing compa-
ny/institution (name and ad-
dress)
PlanEnergi
Jyllandsgade 1
9520 Skørping
Project partners
PlanEnergi
Jyllandsgade 1
9520 Skørping, CVR 74038212
Contact: Per Alex Sørensen, [email protected]
Rye Kraftvarmeværk
Hjarsbækvej 7, Gl. Rye
8680 Ry, CVR 18807483
Contact: Søren Frandsen, [email protected]
Johnson Controls
Sortevej 30
8543 Hornslet, CVR 19056171
Contact: Søren Korsbæk, [email protected]
Technological Institute
Gregersensvej
2630 Taastrup, CVR 56976116
Contact: Nis Peter Reinholdt, [email protected]
CVR (central business register) 74038212
Date for submission February 2015
3
Table of contents
1. Project details 2
2. Short description of project objective and results 4
3. Executive summary 4
4. Project objectives 6
4.1 Project objectives 6
4.2 Implementation of the project 7
4.2.1 Design and implementation of the plant 7
4.2.2 Budget and actual cost 10
5. Project results and dissemination of results 10
5.1 Monitoring results 10
5.1.1 Total heat production of CHP-plant 11
5.1.2 Total heat production compared to theoretical calculations 12
5.1.3 Heat pump 14
5.1.4 Solar heat plant 15
5.1.5 Heat delivery from plant 18
5.1.6 Combustion engines 18
5.1.7 Boiler 18
5.1.8 Start-up and shutdown time of the heat pump 18
5.2 Dissemination of results 19
6. Utilization of project results 19
7. Project conclusion and perspective 20
8. Appendix 21
8.1 Monitoring results 21
8.2 Functional description of control system 23
4
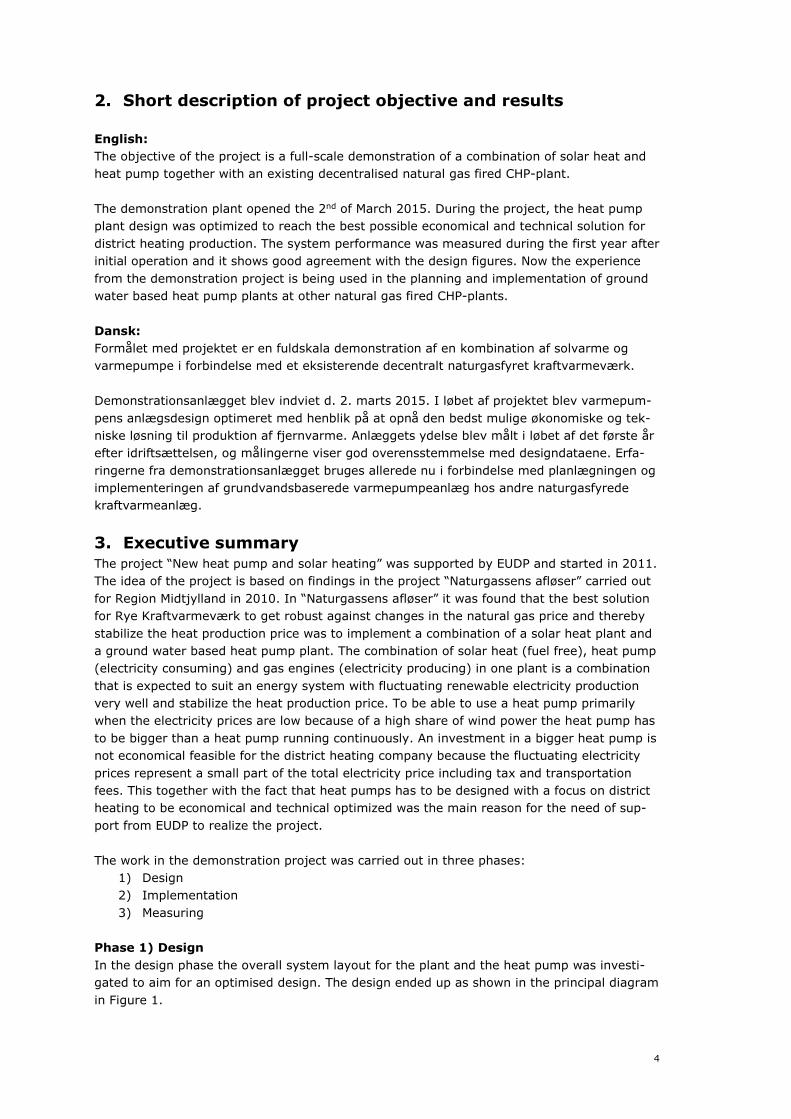
2. Short description of project objective and results
English:
The objective of the project is a full-scale demonstration of a combination of solar heat and heat pump together with an existing decentralised natural gas fired CHP-plant.
The demonstration plant opened the 2nd of March 2015. During the project, the heat pump plant design was optimized to reach the best possible economical and technical solution for
district heating production. The system performance was measured during the first year after initial operation and it shows good agreement with the design figures. Now the experience
from the demonstration project is being used in the planning and implementation of ground water based heat pump plants at other natural gas fired CHP-plants.
Dansk:
Formålet med projektet er en fuldskala demonstration af en kombination af solvarme og varmepumpe i forbindelse med et eksisterende decentralt naturgasfyret kraftvarmeværk.
Demonstrationsanlægget blev indviet d. 2. marts 2015. I løbet af projektet blev varmepum-
pens anlægsdesign optimeret med henblik på at opnå den bedst mulige økonomiske og tek-niske løsning til produktion af fjernvarme. Anlæggets ydelse blev målt i løbet af det første år efter idriftsættelsen, og målingerne viser god overensstemmelse med designdataene. Erfa-
ringerne fra demonstrationsanlægget bruges allerede nu i forbindelse med planlægningen og implementeringen af grundvandsbaserede varmepumpeanlæg hos andre naturgasfyrede kraftvarmeanlæg.
3. Executive summary
The project “New heat pump and solar heating” was supported by EUDP and started in 2011. The idea of the project is based on findings in the project “Naturgassens afløser” carried out
for Region Midtjylland in 2010. In “Naturgassens afløser” it was found that the best solution for Rye Kraftvarmeværk to get robust against changes in the natural gas price and thereby
stabilize the heat production price was to implement a combination of a solar heat plant and a ground water based heat pump plant. The combination of solar heat (fuel free), heat pump (electricity consuming) and gas engines (electricity producing) in one plant is a combination
that is expected to suit an energy system with fluctuating renewable electricity production very well and stabilize the heat production price. To be able to use a heat pump primarily when the electricity prices are low because of a high share of wind power the heat pump has
to be bigger than a heat pump running continuously. An investment in a bigger heat pump is not economical feasible for the district heating company because the fluctuating electricity
prices represent a small part of the total electricity price including tax and transportation fees. This together with the fact that heat pumps has to be designed with a focus on district heating to be economical and technical optimized was the main reason for the need of sup-
port from EUDP to realize the project.
The work in the demonstration project was carried out in three phases: 1) Design 2) Implementation
3) Measuring Phase 1) Design
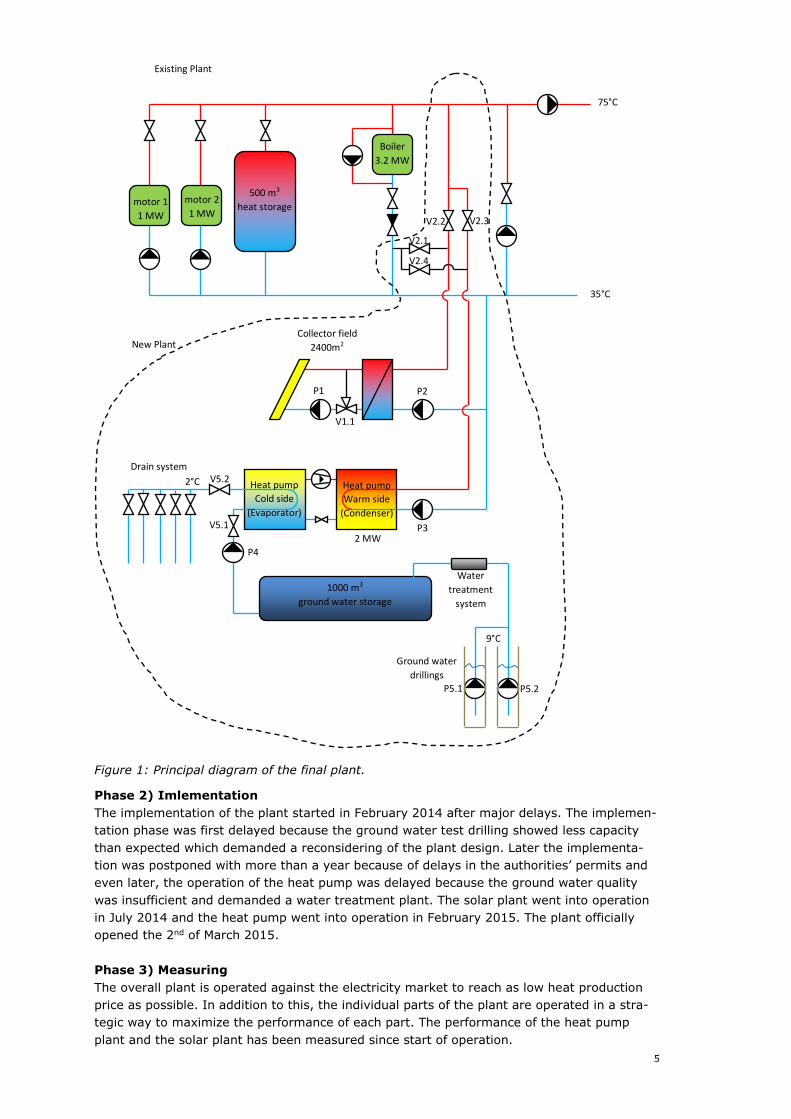
In the design phase the overall system layout for the plant and the heat pump was investi-gated to aim for an optimised design. The design ended up as shown in the principal diagram
in Figure 1.
5
75°C
35°C
500 m3
heat storage
Heat pump
Cold side
(Evaporator)
Heat pump
Warm side
(Condenser)
2.4 MW
motor 1
1 MW
Boiler
3.2 MW
Collector field
2400m2
Ground water
drillings
motor 2
1 MW
2 MW
1000 m3
ground water storage
Drain system
Water
treatment
system
V2.1
V2.4
V2.3 V2.2
New Plant
Existing Plant
P1 P2
V1.1
P3
P4
P5.1 P5.2
V5.1
V5.2
9°C
2°C
Figure 1: Principal diagram of the final plant.
Phase 2) Imlementation
The implementation of the plant started in February 2014 after major delays. The implemen-tation phase was first delayed because the ground water test drilling showed less capacity
than expected which demanded a reconsidering of the plant design. Later the implementa-tion was postponed with more than a year because of delays in the authorities’ permits and even later, the operation of the heat pump was delayed because the ground water quality
was insufficient and demanded a water treatment plant. The solar plant went into operation in July 2014 and the heat pump went into operation in February 2015. The plant officially opened the 2nd of March 2015.
Phase 3) Measuring
The overall plant is operated against the electricity market to reach as low heat production price as possible. In addition to this, the individual parts of the plant are operated in a stra-tegic way to maximize the performance of each part. The performance of the heat pump
plant and the solar plant has been measured since start of operation.
6
4. Project objectives
The aim of the project is a full scale demonstration of a combination of solar heat and heat
pump together with an existing decentralised natural gas fired plant. The demonstration plant at Rye Kraftvarmeværk is implemented and demonstrates that a
combination of solar heat and heat pump together with an existing decentralised natural gas fired plant is technical feasible regarding design, implementation and operation.
4.1 Project objectives
The results of the project are:
• Design of an economical and technical optimised heat pump for district heating pro-duction replacing boiler produced heat in a “traditional CHP-system”. The heat pump uses ammonium as refrigerant and ground water as heat source.
An ammonium based heat pump with ground water as heat source is designed with
the aim to produce district heating at as low price as possible.
• Demonstration of the concept solar, heat pump(s) using ground water, accumulation tank and natural gas fired CHP in full scale where the heat pump(s) run in the 2000 hours with lowest electricity prices and most wind electricity.
The concept is demonstrated using not only hot water accumulation tank but also
ground water accumulation tank to optimise the investment and operation of the
plant against the electricity market.
• Measured results from the heat pump performance and the system performance. Measured results are reported for the first year of operation (see section 5.1).
• Experiences with economical optimisation of the concept in the electricity market. The experiences from the operation have continuously been used to improve the
production planning system from NEAS who is balance responsible for the electricity
production/consumption for Rye Kraftvarmeværk. The heat pump production is
planned on a daily basis according to the spot electricity market meaning that the
heat pump operates in the hours with lowest electricity prices.
• Experiences with velocity and capacity of electricity regulation. The experiences so far is that the heat pump is able to participate in the spot market
and in down regulation (it can stop within a few minutes). The heat pump is not fast
enough to participate in frequency regulation. The time consumption for typical start
up and shut down processes are reported in section 5.1.7. The electrical capacity of
the heat pump is relatively small (app. 500 kW) and has to be pooled with other heat
pumps or electric boilers by the balance responsible company.
• Development of a future concept that can be replicated on natural gas fired (also the
smallest) CHP-plants. The concept is easily replicable. A number of other CHP-plants are now in the plan-
ning process of ground water based heat pumps alone or in combination with solar
plants.
• Future production of the heat pump in Denmark.
Johnson Controls will be able to use the design and experience from the heat pump
in the demonstration project directly for other plants.
7
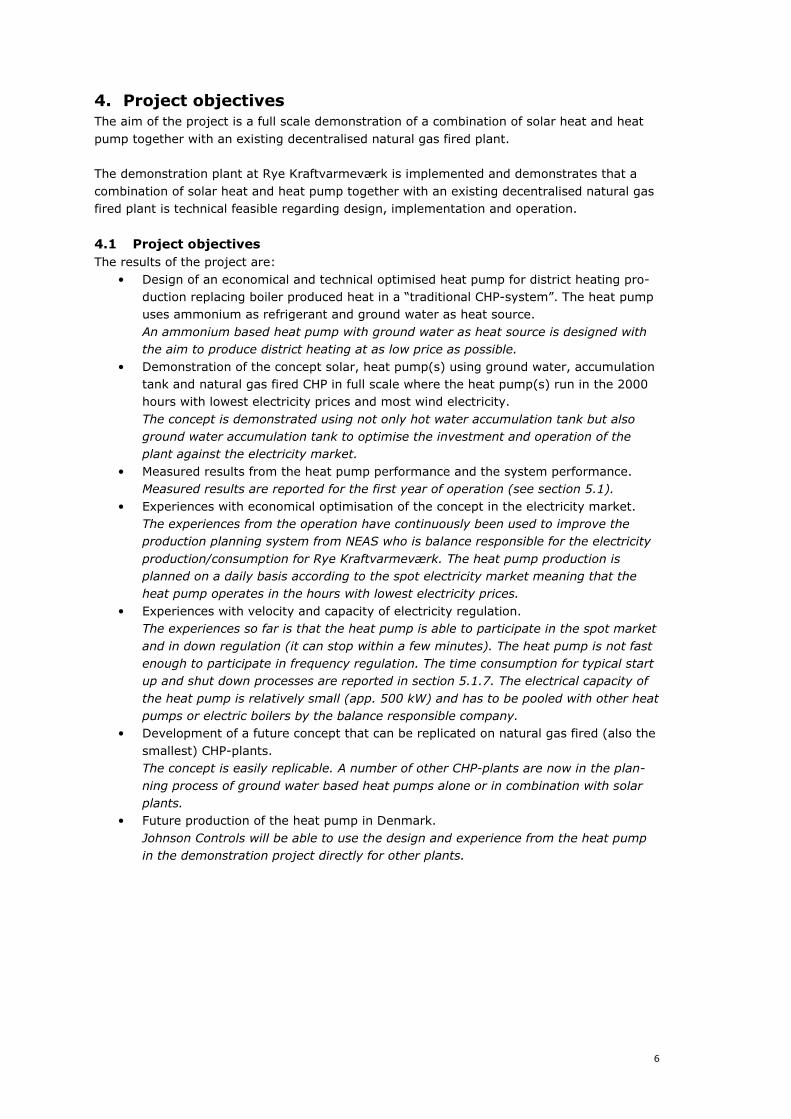
4.2 Implementation of the project
In the following the implementation of the project will be briefly described. A layout of the overall plant is seen in Figure 2.
Figure 2: Layout of the plant.
4.2.1 Design and implementation of the plant
Heat pump
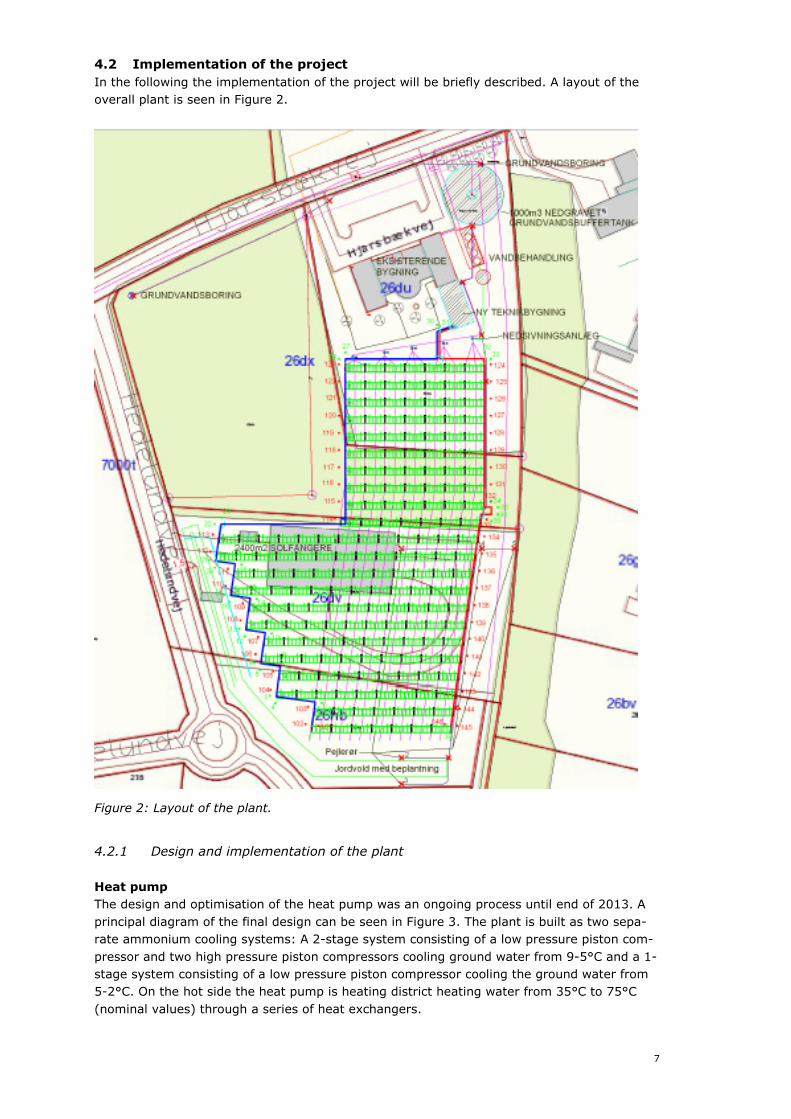
The design and optimisation of the heat pump was an ongoing process until end of 2013. A
principal diagram of the final design can be seen in Figure 3. The plant is built as two sepa-rate ammonium cooling systems: A 2-stage system consisting of a low pressure piston com-
pressor and two high pressure piston compressors cooling ground water from 9-5°C and a 1-stage system consisting of a low pressure piston compressor cooling the ground water from 5-2°C. On the hot side the heat pump is heating district heating water from 35°C to 75°C
(nominal values) through a series of heat exchangers.
8
The heat pump can deliver a heat output of 2048 kW and a COP of 4,02 at nominal values. By reducing the forward temperature to 65°C the COP can be increased to 4,33.
The heat pump is placed in a new building of 82 m2 together with the heat exchanger station for the solar plant.
The possibility to use the heat pump to produce cold water for the gas engines and the solar panels to improve efficiency was investigated but found economical unfeasible. When using
the heat pump to cool the return water to the solar panels and heat up the supply water from the solar panels the mean temperature in the panels will decrease. This lead to an in-creased efficiency of the solar panels. As an example at a solar radiation of 800 W/m2 a tem-
perature set of 75/35°C can be decreased to 48/15°C by the heat pump which gives an effi-ciency increase of the solar panels of 10% corresponding to 150 kW from the entire solar
plant. The heat pump will require app. 330 kW electricity to cool the return water from 35°C to 15°C and heat up the supply water from 48°C to 75°C which means that the added heat to the system will be 150+330 = 480 kW. Thus the system COP in this example will be
480/330 = 1,45. Therefore it is more economical feasible to use the capacity of the heat pump to cool groundwater where the COP is around 4. For the gas engines, the results are quite similar. Cooling return water for the gas engines is not feasible compared to cooling
ground water.
The implementation phase was delayed as mentioned earlier but after the project was ready to order the heat pump the installation of the heat pump took place as scheduled. The initial operation of the heatpump was delayed because of issues with the ground water quality de-
scribed in the following section.
Figure 3: Principal diagram of the heat pump plant. The figures for the electricity consump-
tion on the diagram are based on IE2 motors. In the final design IE3 motors are
chosen which increases the COP from 3,98 to 4,02 at nominal values.
9
Ground water system
The ground water system consist of two ground water drillings, a water treatment system, a ground water storage and a drain system as seen in the principal diagram Figure 1. The in-
tention was to design the system with ground water production drillings and injection drill-ings with full capacity for the heat pump (app. 200 m3/h). Information from the first test drilling indicated that this would be economically unfeasible because the capacity was less
than expected and a high number of drillings (at least 8) would be necessary. To be able to make the project feasible it was necessary to reconsider the design of the ground water sys-
tem. The possibility to return the water by a drain system instead of injection drillings was investigated. It was a cheaper alternative to injection but it was unclear whether the authori-ties could permit it. Skanderborg Kommune investigated the permission issues, and conclud-
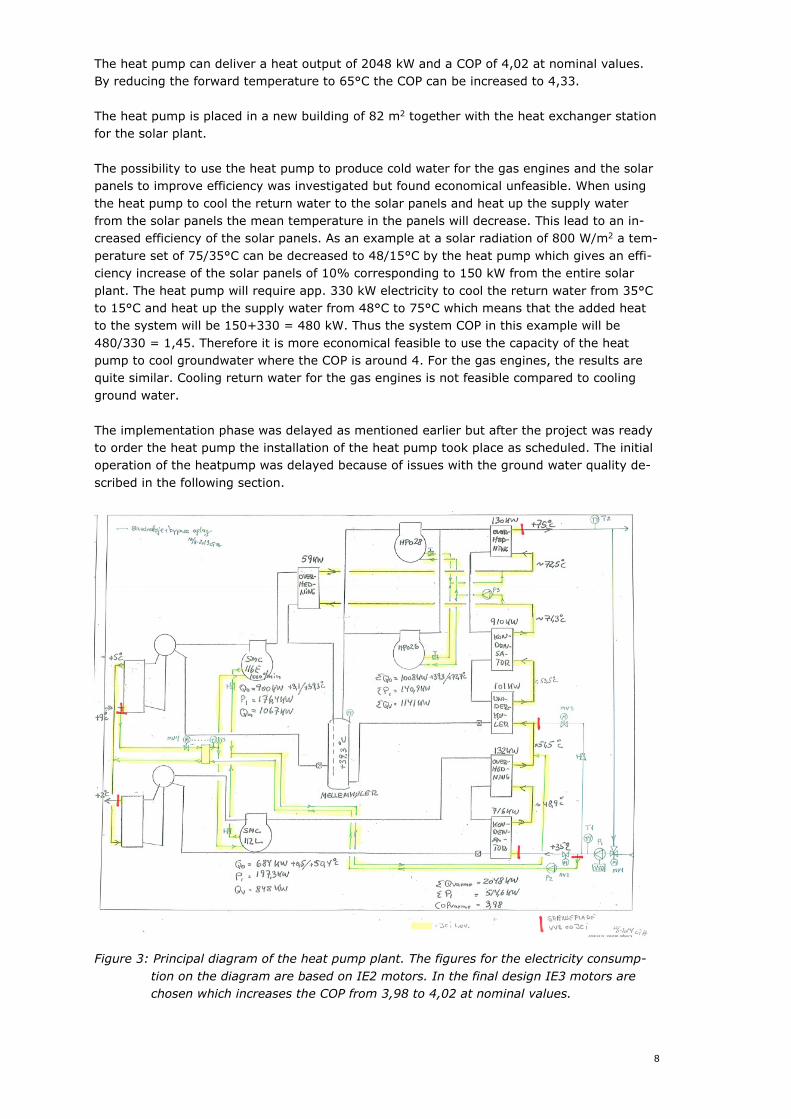
ed that they could give the necessary authority permits. The drain system was established as 15 strings of in total 1830 m drain pipe under the solar collectors and is illustrated in Figure
4.
Figure 4: Section view through drain system for returning of cooled groundwater.
The ground water accumulation tank made it possible to reduce the number of production drillings to two with a capacity of 50 m3/h each. The size of the ground water accumulation
tank was found to 1000 m3 from a simulation and optimisation of the plant. The tank can be filled with water from the drillings in app. 10 hours and when full it allows continuous opera-tion of the heat pump for 10 hours.
The ground water accumulation tank was also intended to be used as a simple water clean-ing tank where iron particles could settle on the bottom after aeration of the water. This wa-
ter cleaning was measured to be insufficient, and therefore a water treatment system was necessary. The water treatment system was designed as a pressurized sandfilter known from
cleaning ground water for drinking water. Solar plant
The solar plant was designed from the size of the existing accumulation tank. With a size of 2444 m2 the solar plant will not need any cooling during an average summer and it covers approximately 12% of the yearly heat demand. After ordering, the installation of the solar
plant took place as scheduled.
Control system
The heat pump and solar plant is integrated in the overall control system of the district heat-ing plant. The heat pump has its own control system for internal processes, but it communi-
cates with the overall control system. The control system operates the plant fully automatic under normal conditions and it calculates through formulas the most efficient operation. This
means that the heat pump and the solar plant operates at as low temperatures as possible taking into account if there are other units producing heat or stored heat in the accumulation tank that can be mixed with lower temperature from the heat pump or solar collector. The
functional description of the control system is attached (in Danish) as appendix 8.2.
10
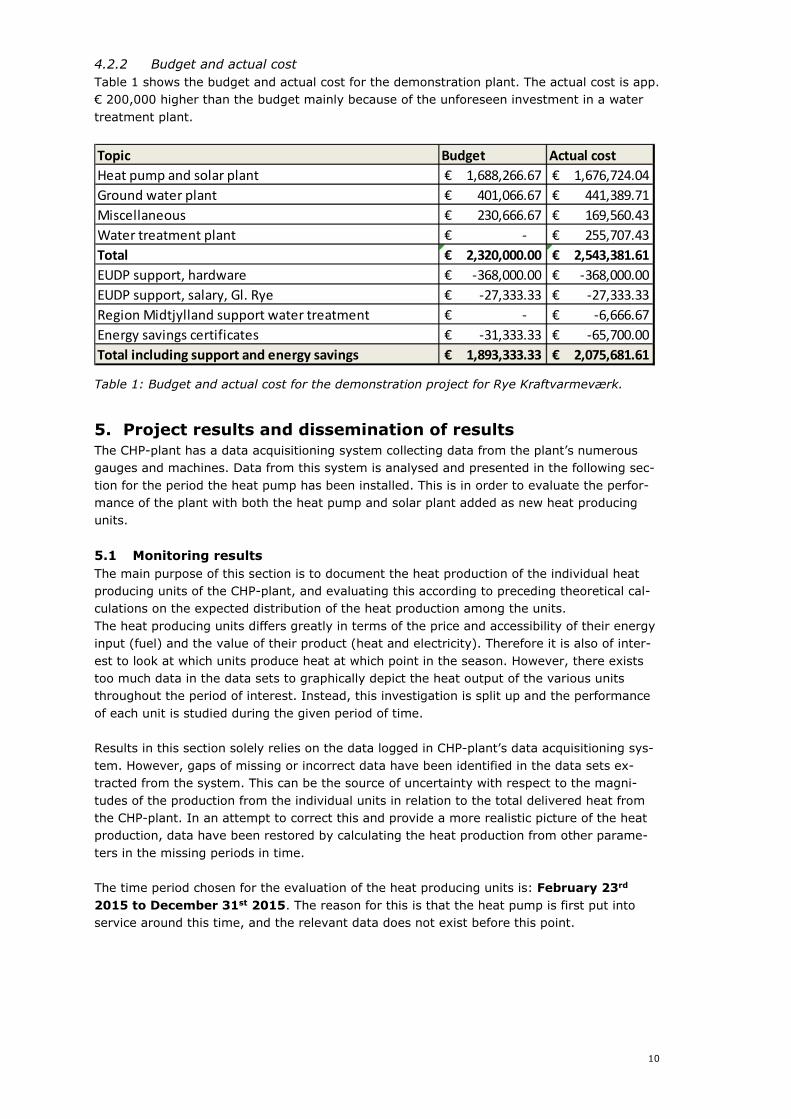
4.2.2 Budget and actual cost
Table 1 shows the budget and actual cost for the demonstration plant. The actual cost is app. € 200,000 higher than the budget mainly because of the unforeseen investment in a water
treatment plant.
Topic Budget Actual cost
1,688,266.67€ 1,676,724.04€
401,066.67€ 441,389.71€
230,666.67€ 169,560.43€
Water treatment plant -€ 255,707.43€
Total 2,320,000.00€ 2,543,381.61€
EUDP support, hardware -368,000.00€ -368,000.00€
EUDP support, salary, Gl. Rye -27,333.33€ -27,333.33€
Region Midtjylland support water treatment -€ -6,666.67€
Energy savings certificates -31,333.33€ -65,700.00€
Total including support and energy savings 1,893,333.33€ 2,075,681.61€
Heat pump and solar plant
Ground water plant
Miscellaneous
Table 1: Budget and actual cost for the demonstration project for Rye Kraftvarmeværk.
5. Project results and dissemination of results
The CHP-plant has a data acquisitioning system collecting data from the plant’s numerous gauges and machines. Data from this system is analysed and presented in the following sec-
tion for the period the heat pump has been installed. This is in order to evaluate the perfor-mance of the plant with both the heat pump and solar plant added as new heat producing units.
5.1 Monitoring results
The main purpose of this section is to document the heat production of the individual heat producing units of the CHP-plant, and evaluating this according to preceding theoretical cal-culations on the expected distribution of the heat production among the units.
The heat producing units differs greatly in terms of the price and accessibility of their energy input (fuel) and the value of their product (heat and electricity). Therefore it is also of inter-
est to look at which units produce heat at which point in the season. However, there exists too much data in the data sets to graphically depict the heat output of the various units throughout the period of interest. Instead, this investigation is split up and the performance
of each unit is studied during the given period of time. Results in this section solely relies on the data logged in CHP-plant’s data acquisitioning sys-
tem. However, gaps of missing or incorrect data have been identified in the data sets ex-tracted from the system. This can be the source of uncertainty with respect to the magni-
tudes of the production from the individual units in relation to the total delivered heat from the CHP-plant. In an attempt to correct this and provide a more realistic picture of the heat production, data have been restored by calculating the heat production from other parame-
ters in the missing periods in time. The time period chosen for the evaluation of the heat producing units is: February 23rd
2015 to December 31st 2015. The reason for this is that the heat pump is first put into service around this time, and the relevant data does not exist before this point.
11
5.1.1 Total heat production of CHP-plant
The heat productions of the individual units are presented in table 2 and graphically in figure 5.
The values presented in table 2 have been calculated from measured data from the CHP-
plant where the gaps of missing data have been filled with data calculated from other system parameters such as flow and temperatures in and out of a unit. The heat produced is converted into MWh by calculating an average value for the output heat
of a heat producing unit in the given period of time, which is then related to the total number of hours included in the period. Missing data are replaced by the number “0” so the average is not artificially increased.
This approach is chosen because exact data regarding the number of operation hours for all the individual units is not present. If this had been the case, this number could instead be
related to the output power of the heat producing unit to yield the actual amount of energy produced during the hours of operation. This would otherwise have been a more precise ap-proach.
Table 2 is constructed by converting the following measurement data into energy:
• Heat pump: Value from energy gauge placed on the plant side of the heat pump (NDB640CQ001). Missing data are replaced by multiplying the power consumption of
the heat pump by the average COPh-value. • Solar heat plant: Value from energy gauge placed on the plant side of the heat ex-
changer connected to the solar heat plant (WTA650CQ001). Missing data are re-
placed by using the water flow gauge and temperatures difference across the heat exchanger (WTA650CF001, WTA650CT002, WTB650CT001). Properties of water are
evaluated at 60 °C for converting the volume flow into a mass flow. • Combustion engines: Total heat production from both engines is used (Ak-
tuel_varme_prod). The split in individual production is the ratio of the electrical pow-
er production from their generators (Aktuel_El_effekt_motor_1, Ak-tuel_El_effekt_motor_2).
• Boiler: A calculated parameter for the given output power is used (Bereg-
net_kedeleff). Missing data are replaced by using the district heating return water flow gauge and temperature differences across the boiler. The flow gauge
(Flow_kedel_1) is placed before a branching of the flow to the boiler and to the heat pump and solar plant. Therefore calculations are cross referenced according to the opening position of the valve placed prior to the boiler (Ventil_kedel_POS). The inlet
temperature is the water temperature as it returns to the CHP-plant from the grid (Returtemperatur_fra_by). Outlet temperature is given as the outlet temperature from the boiler (Temp_fra_kedel).
• Heat delivery from plant: A calculated parameter for this is used (Ak-tuel_varme_til_by).
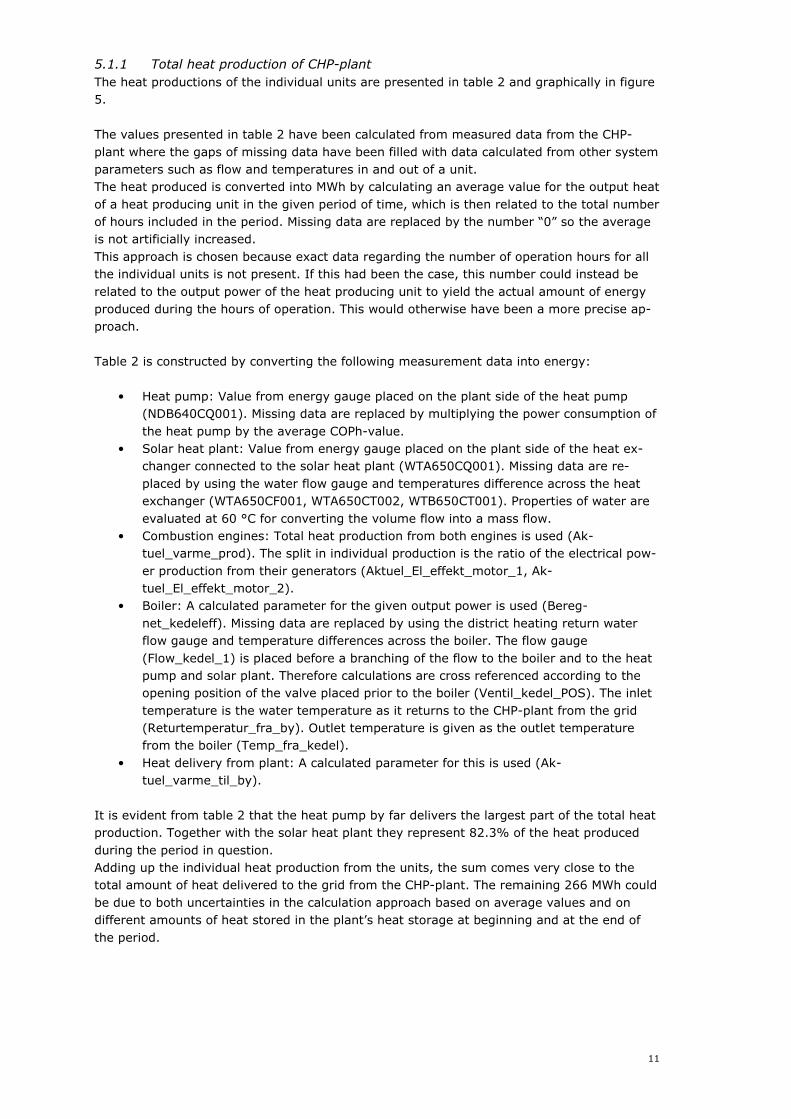
It is evident from table 2 that the heat pump by far delivers the largest part of the total heat production. Together with the solar heat plant they represent 82.3% of the heat produced
during the period in question. Adding up the individual heat production from the units, the sum comes very close to the total amount of heat delivered to the grid from the CHP-plant. The remaining 266 MWh could
be due to both uncertainties in the calculation approach based on average values and on different amounts of heat stored in the plant’s heat storage at beginning and at the end of
the period.
12
Measured and restored data
Unit MWh %
Heat pump 4,168 59.4%
Solar heat plant 1,063 15.2%
Combustion engine 1 90 1.3%
Combustion engine 2 88 1.2%
Boiler 1,602 22.9%
SumSumSumSum 7,012 7,012 7,012 7,012 100%100%100%100%
Heat delivery from plant 7,278
Table 2: Individual and total heat production of the CHP-plant based on logged data with
restored data replacing gaps of missing data. Period of interest: February 23rd
2015 to December 31st 2015.
Figure 5: Graphical representation of the data presented in table 2.
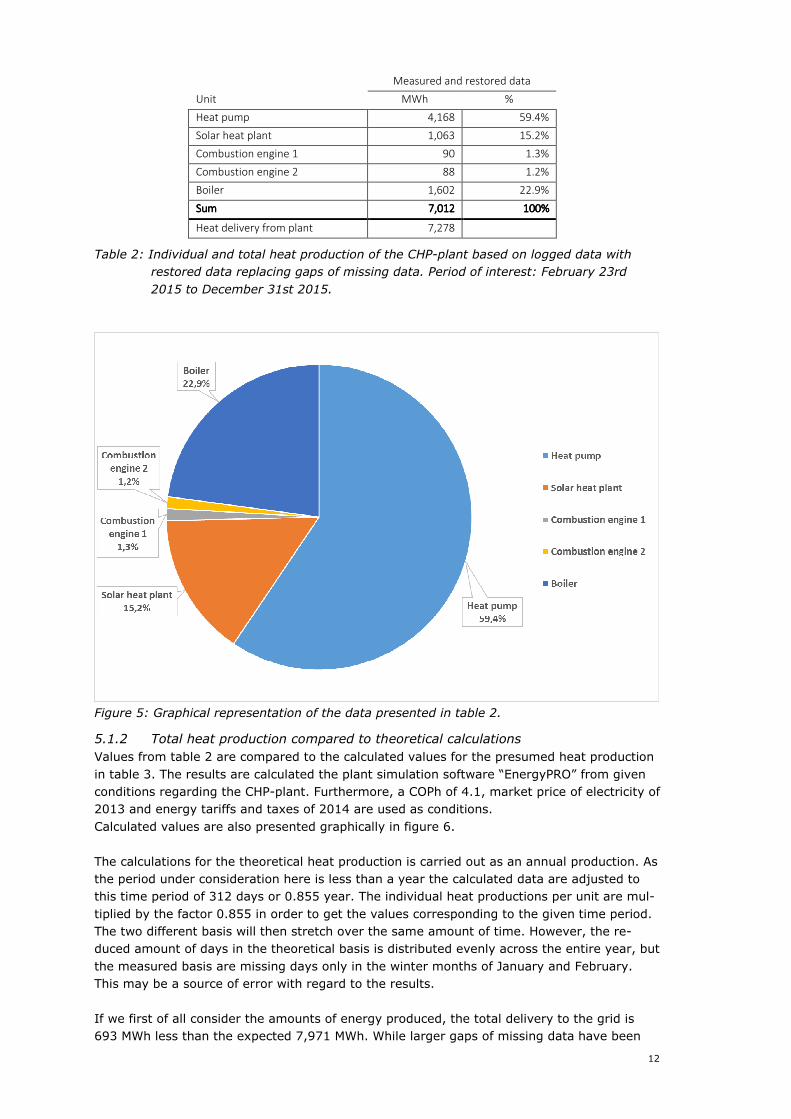
5.1.2 Total heat production compared to theoretical calculations
Values from table 2 are compared to the calculated values for the presumed heat production
in table 3. The results are calculated the plant simulation software “EnergyPRO” from given conditions regarding the CHP-plant. Furthermore, a COPh of 4.1, market price of electricity of 2013 and energy tariffs and taxes of 2014 are used as conditions.
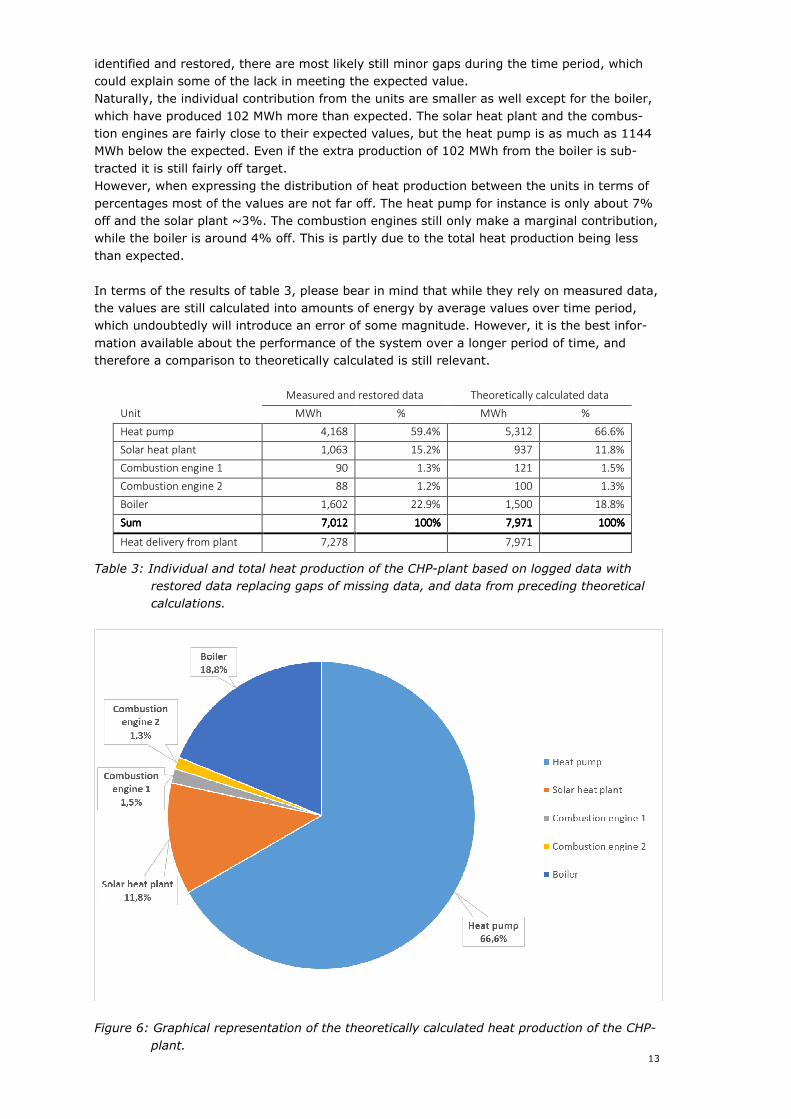
Calculated values are also presented graphically in figure 6.
The calculations for the theoretical heat production is carried out as an annual production. As the period under consideration here is less than a year the calculated data are adjusted to this time period of 312 days or 0.855 year. The individual heat productions per unit are mul-
tiplied by the factor 0.855 in order to get the values corresponding to the given time period. The two different basis will then stretch over the same amount of time. However, the re-duced amount of days in the theoretical basis is distributed evenly across the entire year, but
the measured basis are missing days only in the winter months of January and February. This may be a source of error with regard to the results.
If we first of all consider the amounts of energy produced, the total delivery to the grid is 693 MWh less than the expected 7,971 MWh. While larger gaps of missing data have been
13
identified and restored, there are most likely still minor gaps during the time period, which could explain some of the lack in meeting the expected value. Naturally, the individual contribution from the units are smaller as well except for the boiler,
which have produced 102 MWh more than expected. The solar heat plant and the combus-tion engines are fairly close to their expected values, but the heat pump is as much as 1144 MWh below the expected. Even if the extra production of 102 MWh from the boiler is sub-
tracted it is still fairly off target. However, when expressing the distribution of heat production between the units in terms of
percentages most of the values are not far off. The heat pump for instance is only about 7% off and the solar plant ~3%. The combustion engines still only make a marginal contribution, while the boiler is around 4% off. This is partly due to the total heat production being less
than expected.
In terms of the results of table 3, please bear in mind that while they rely on measured data, the values are still calculated into amounts of energy by average values over time period, which undoubtedly will introduce an error of some magnitude. However, it is the best infor-
mation available about the performance of the system over a longer period of time, and therefore a comparison to theoretically calculated is still relevant.
Measured and restored data Theoretically calculated data
Unit MWh % MWh %
Heat pump 4,168 59.4% 5,312 66.6%
Solar heat plant 1,063 15.2% 937 11.8%
Combustion engine 1 90 1.3% 121 1.5%
Combustion engine 2 88 1.2% 100 1.3%
Boiler 1,602 22.9% 1,500 18.8%
SumSumSumSum 7,012 7,012 7,012 7,012 100%100%100%100% 7,971 7,971 7,971 7,971 100%100%100%100%
Heat delivery from plant 7,278 7,971
Table 3: Individual and total heat production of the CHP-plant based on logged data with
restored data replacing gaps of missing data, and data from preceding theoretical
calculations.
Figure 6: Graphical representation of the theoretically calculated heat production of the CHP-
plant.
14
5.1.3 Heat pump
The heat pump is evaluated in terms of the hot side or heat pump COP (COPh) and in- and output power. COPh is calculated from the electric power consumption of the compressors
(VP_effektforbrug) and the output power in terms of heat (NDB640CQ001).
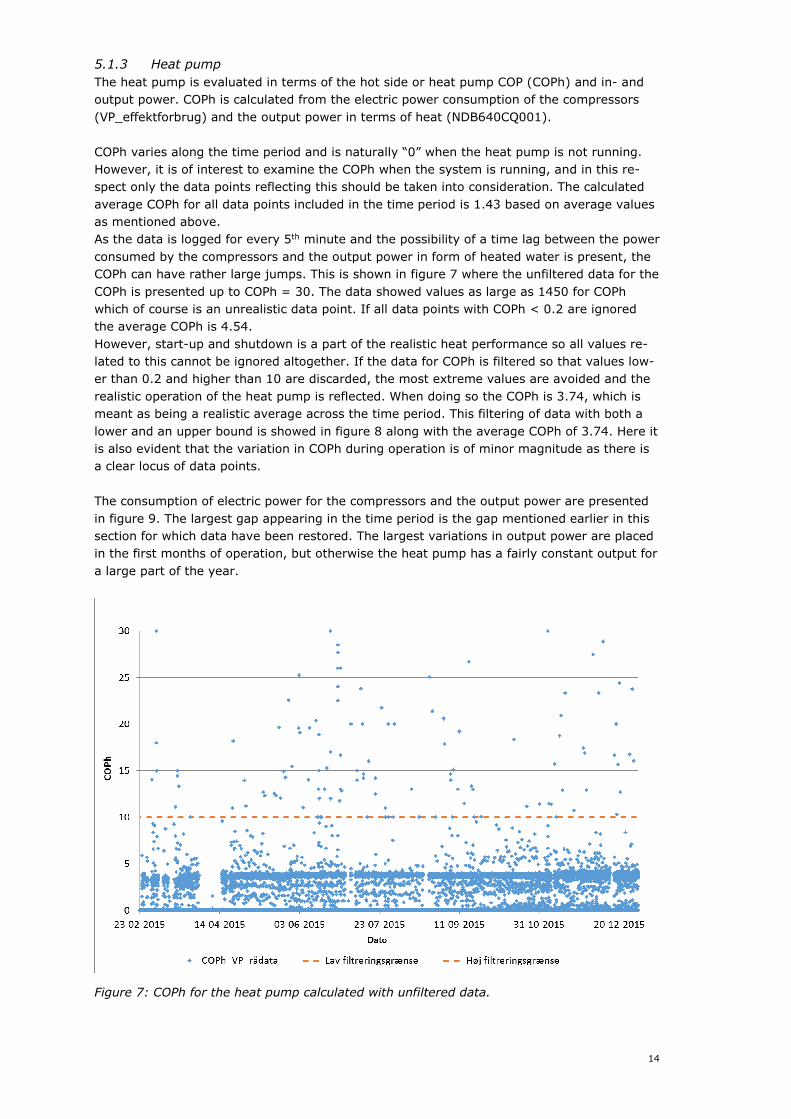
COPh varies along the time period and is naturally “0” when the heat pump is not running. However, it is of interest to examine the COPh when the system is running, and in this re-spect only the data points reflecting this should be taken into consideration. The calculated
average COPh for all data points included in the time period is 1.43 based on average values as mentioned above. As the data is logged for every 5th minute and the possibility of a time lag between the power
consumed by the compressors and the output power in form of heated water is present, the COPh can have rather large jumps. This is shown in figure 7 where the unfiltered data for the
COPh is presented up to COPh = 30. The data showed values as large as 1450 for COPh which of course is an unrealistic data point. If all data points with COPh < 0.2 are ignored the average COPh is 4.54.
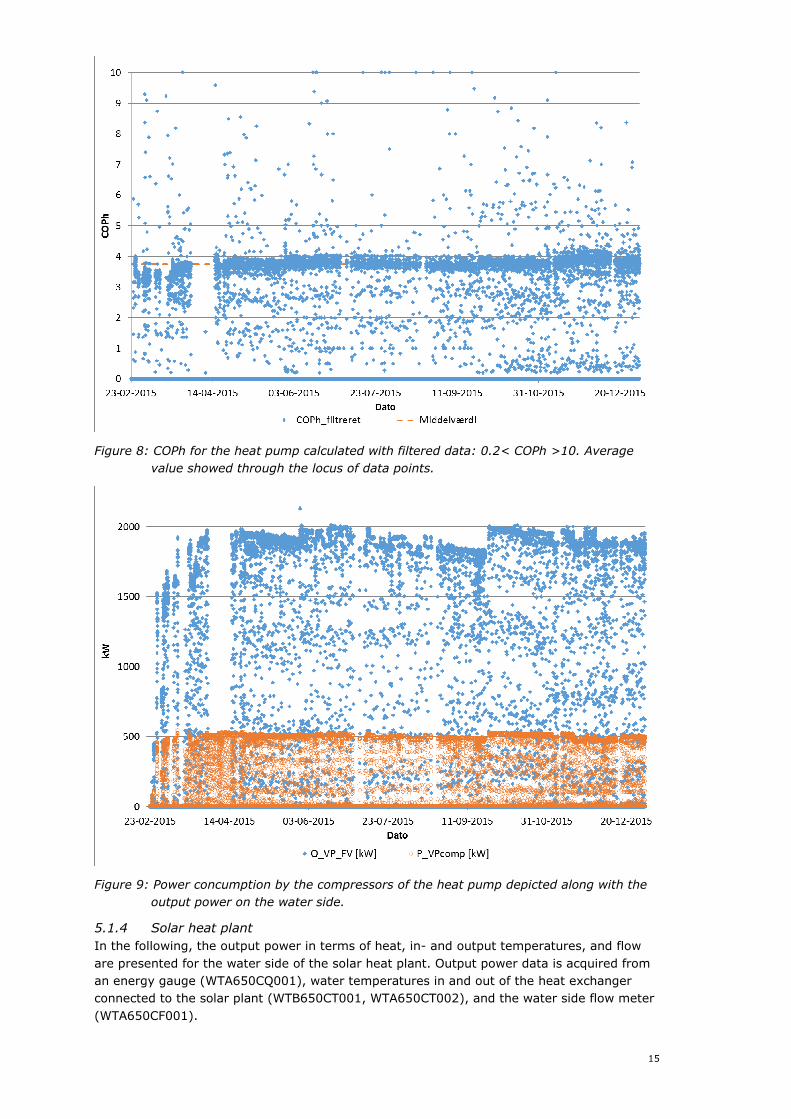
However, start-up and shutdown is a part of the realistic heat performance so all values re-lated to this cannot be ignored altogether. If the data for COPh is filtered so that values low-er than 0.2 and higher than 10 are discarded, the most extreme values are avoided and the
realistic operation of the heat pump is reflected. When doing so the COPh is 3.74, which is meant as being a realistic average across the time period. This filtering of data with both a
lower and an upper bound is showed in figure 8 along with the average COPh of 3.74. Here it is also evident that the variation in COPh during operation is of minor magnitude as there is a clear locus of data points.
The consumption of electric power for the compressors and the output power are presented
in figure 9. The largest gap appearing in the time period is the gap mentioned earlier in this section for which data have been restored. The largest variations in output power are placed in the first months of operation, but otherwise the heat pump has a fairly constant output for
a large part of the year.
Figure 7: COPh for the heat pump calculated with unfiltered data.
15
Figure 8: COPh for the heat pump calculated with filtered data: 0.2< COPh >10. Average
value showed through the locus of data points.
Figure 9: Power concumption by the compressors of the heat pump depicted along with the
output power on the water side.
5.1.4 Solar heat plant
In the following, the output power in terms of heat, in- and output temperatures, and flow
are presented for the water side of the solar heat plant. Output power data is acquired from an energy gauge (WTA650CQ001), water temperatures in and out of the heat exchanger connected to the solar plant (WTB650CT001, WTA650CT002), and the water side flow meter
(WTA650CF001).
16
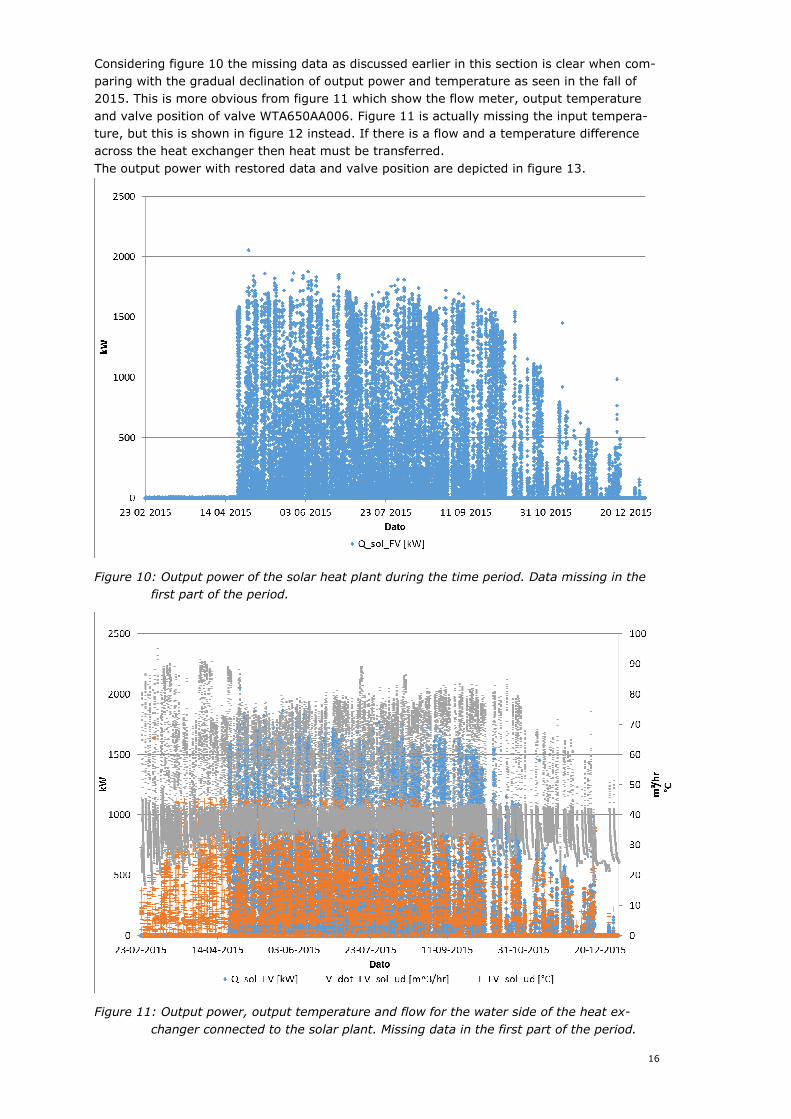
Considering figure 10 the missing data as discussed earlier in this section is clear when com-paring with the gradual declination of output power and temperature as seen in the fall of 2015. This is more obvious from figure 11 which show the flow meter, output temperature
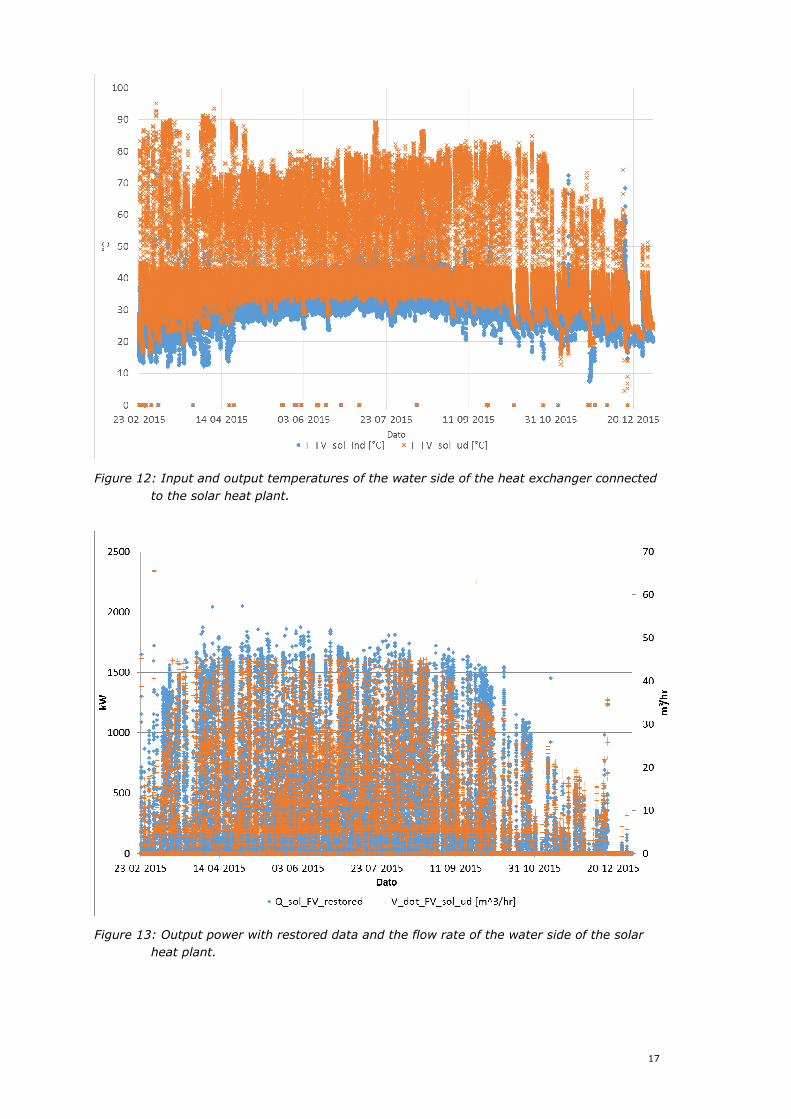
and valve position of valve WTA650AA006. Figure 11 is actually missing the input tempera-ture, but this is shown in figure 12 instead. If there is a flow and a temperature difference across the heat exchanger then heat must be transferred.
The output power with restored data and valve position are depicted in figure 13.
Figure 10: Output power of the solar heat plant during the time period. Data missing in the
first part of the period.
Figure 11: Output power, output temperature and flow for the water side of the heat ex-
changer connected to the solar plant. Missing data in the first part of the period.
17
Figure 12: Input and output temperatures of the water side of the heat exchanger connected
to the solar heat plant.
Figure 13: Output power with restored data and the flow rate of the water side of the solar
heat plant.
18
5.1.5 Heat delivery from plant
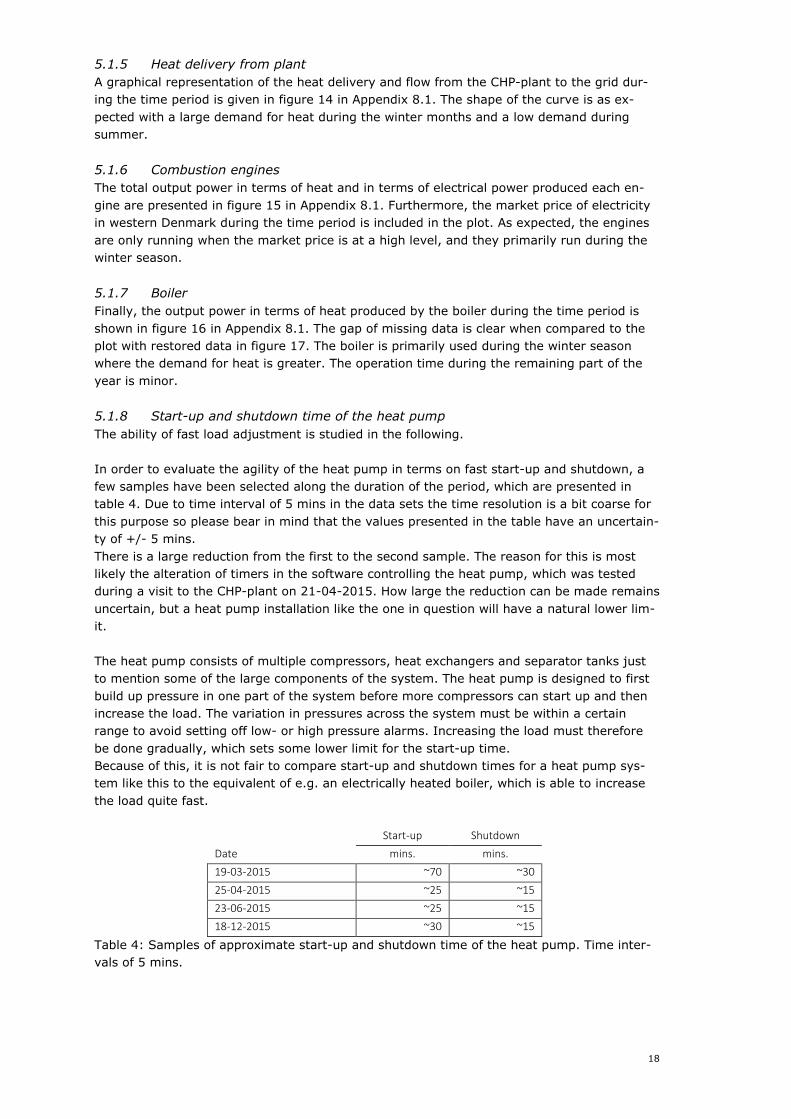
A graphical representation of the heat delivery and flow from the CHP-plant to the grid dur-ing the time period is given in figure 14 in Appendix 8.1. The shape of the curve is as ex-
pected with a large demand for heat during the winter months and a low demand during summer.
5.1.6 Combustion engines
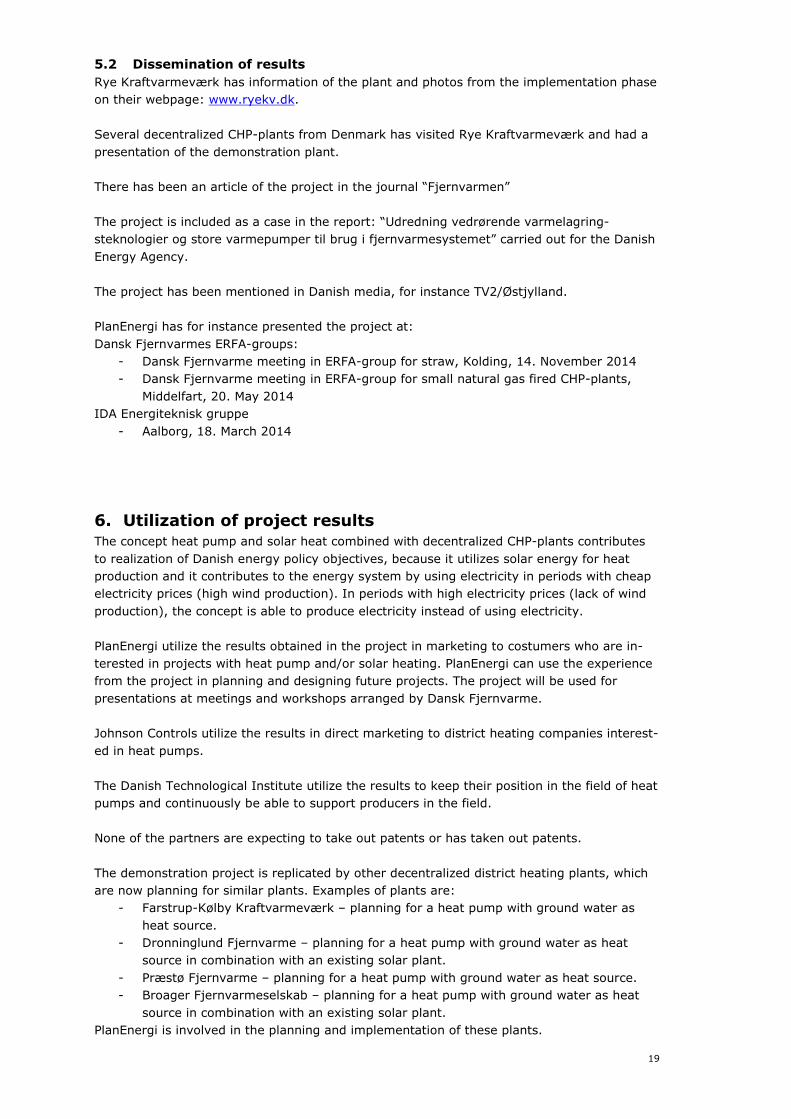
The total output power in terms of heat and in terms of electrical power produced each en-
gine are presented in figure 15 in Appendix 8.1. Furthermore, the market price of electricity in western Denmark during the time period is included in the plot. As expected, the engines
are only running when the market price is at a high level, and they primarily run during the winter season.
5.1.7 Boiler
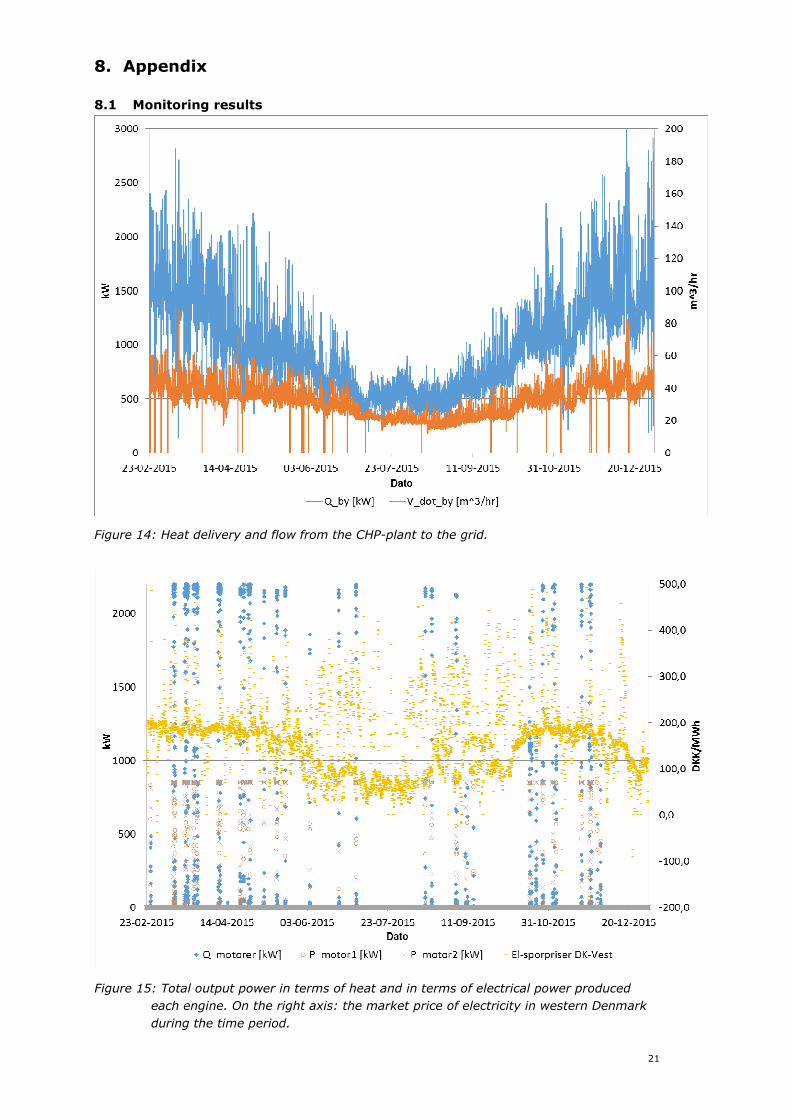
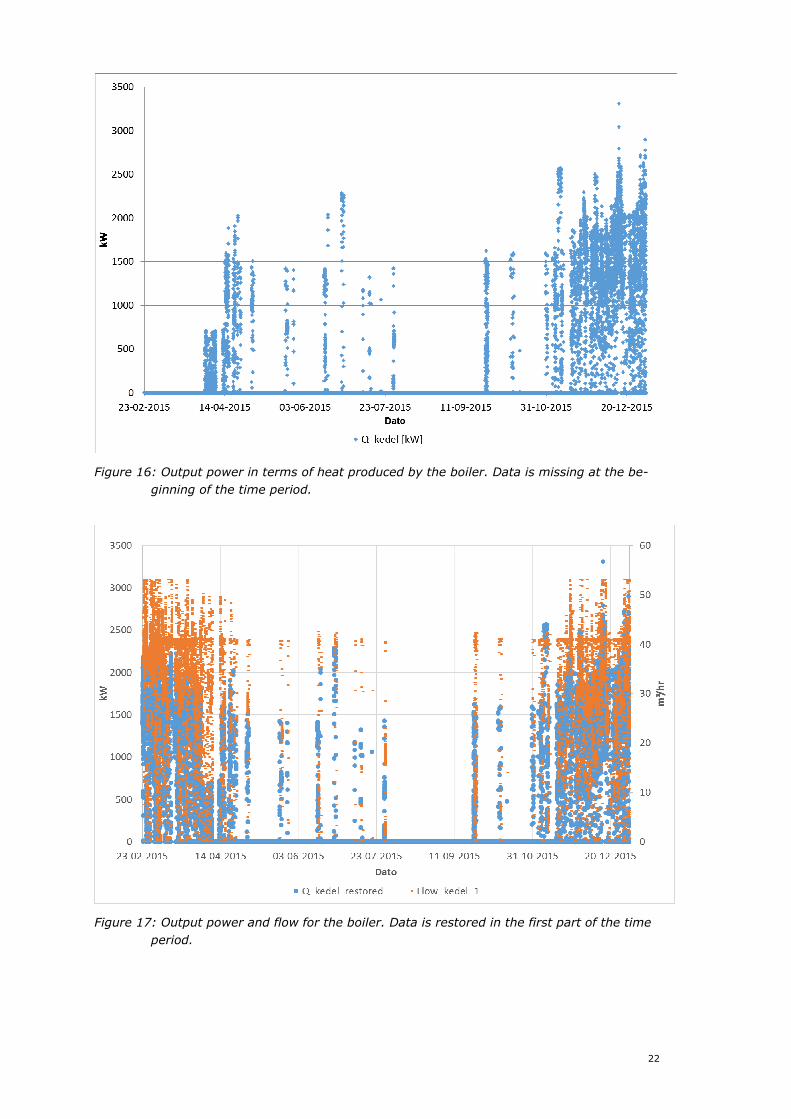
Finally, the output power in terms of heat produced by the boiler during the time period is
shown in figure 16 in Appendix 8.1. The gap of missing data is clear when compared to the plot with restored data in figure 17. The boiler is primarily used during the winter season where the demand for heat is greater. The operation time during the remaining part of the
year is minor.
5.1.8 Start-up and shutdown time of the heat pump
The ability of fast load adjustment is studied in the following.
In order to evaluate the agility of the heat pump in terms on fast start-up and shutdown, a few samples have been selected along the duration of the period, which are presented in table 4. Due to time interval of 5 mins in the data sets the time resolution is a bit coarse for
this purpose so please bear in mind that the values presented in the table have an uncertain-ty of +/- 5 mins.
There is a large reduction from the first to the second sample. The reason for this is most likely the alteration of timers in the software controlling the heat pump, which was tested during a visit to the CHP-plant on 21-04-2015. How large the reduction can be made remains
uncertain, but a heat pump installation like the one in question will have a natural lower lim-it.
The heat pump consists of multiple compressors, heat exchangers and separator tanks just to mention some of the large components of the system. The heat pump is designed to first
build up pressure in one part of the system before more compressors can start up and then increase the load. The variation in pressures across the system must be within a certain range to avoid setting off low- or high pressure alarms. Increasing the load must therefore
be done gradually, which sets some lower limit for the start-up time. Because of this, it is not fair to compare start-up and shutdown times for a heat pump sys-tem like this to the equivalent of e.g. an electrically heated boiler, which is able to increase
the load quite fast.
Start-up Shutdown
Date mins. mins.
19-03-2015 ~70 ~30
25-04-2015 ~25 ~15
23-06-2015 ~25 ~15
18-12-2015 ~30 ~15
Table 4: Samples of approximate start-up and shutdown time of the heat pump. Time inter-vals of 5 mins.
19
5.2 Dissemination of results
Rye Kraftvarmeværk has information of the plant and photos from the implementation phase on their webpage: www.ryekv.dk.
Several decentralized CHP-plants from Denmark has visited Rye Kraftvarmeværk and had a
presentation of the demonstration plant. There has been an article of the project in the journal “Fjernvarmen”
The project is included as a case in the report: “Udredning vedrørende varmelagring-steknologier og store varmepumper til brug i fjernvarmesystemet” carried out for the Danish
Energy Agency.
The project has been mentioned in Danish media, for instance TV2/Østjylland. PlanEnergi has for instance presented the project at:
Dansk Fjernvarmes ERFA-groups: - Dansk Fjernvarme meeting in ERFA-group for straw, Kolding, 14. November 2014 - Dansk Fjernvarme meeting in ERFA-group for small natural gas fired CHP-plants,
Middelfart, 20. May 2014 IDA Energiteknisk gruppe
- Aalborg, 18. March 2014
6. Utilization of project results
The concept heat pump and solar heat combined with decentralized CHP-plants contributes
to realization of Danish energy policy objectives, because it utilizes solar energy for heat production and it contributes to the energy system by using electricity in periods with cheap electricity prices (high wind production). In periods with high electricity prices (lack of wind
production), the concept is able to produce electricity instead of using electricity.
PlanEnergi utilize the results obtained in the project in marketing to costumers who are in-terested in projects with heat pump and/or solar heating. PlanEnergi can use the experience from the project in planning and designing future projects. The project will be used for
presentations at meetings and workshops arranged by Dansk Fjernvarme. Johnson Controls utilize the results in direct marketing to district heating companies interest-
ed in heat pumps.
The Danish Technological Institute utilize the results to keep their position in the field of heat pumps and continuously be able to support producers in the field.
None of the partners are expecting to take out patents or has taken out patents.
The demonstration project is replicated by other decentralized district heating plants, which are now planning for similar plants. Examples of plants are:
- Farstrup-Kølby Kraftvarmeværk – planning for a heat pump with ground water as
heat source. - Dronninglund Fjernvarme – planning for a heat pump with ground water as heat
source in combination with an existing solar plant.
- Præstø Fjernvarme – planning for a heat pump with ground water as heat source. - Broager Fjernvarmeselskab – planning for a heat pump with ground water as heat
source in combination with an existing solar plant. PlanEnergi is involved in the planning and implementation of these plants.

20
7. Project conclusion and perspective
The demonstration project has shown that the concept heat pump and solar heating in com-bination with decentralised CHP-plants is technical feasible. It also shows that it is possible to
obtain a good COP from a heat pump even though the heat source is at a relatively low tem-perature and the heat supply is at a relatively high temperature, which is very important for the economic feasibility of heat pump projects for district heating.
The project is expected to influence future development in the following ways: - Help the energy system by using electricity when prices are low (power to heat) and
produce electricity when prices are high.
- Stabilize and minimize the heat production cost for natural gas fired CHP-plants. - Facilitate further development in heat pump plants for district heating making the
feasibility better.
21
8. Appendix
8.1 Monitoring results
Figure 14: Heat delivery and flow from the CHP-plant to the grid.
Figure 15: Total output power in terms of heat and in terms of electrical power produced
each engine. On the right axis: the market price of electricity in western Denmark
during the time period.
22
Figure 16: Output power in terms of heat produced by the boiler. Data is missing at the be-
ginning of the time period.
Figure 17: Output power and flow for the boiler. Data is restored in the first part of the time
period.

23
8.2 Functional description of control system
Morten Vang Jensen
Nordjylland
Tel. +45 9682 0408
Mobil +45 5180 8842
Rye Kraftvarmeværk
-
Grundvands- og solvarmeanlæg
-
funktionsbeskrivelse
ver. 6
11. juni 2015
NORDJYLLAND
Jyllandsgade 1
DK–9520 Skørping
Tel. +45 9682 0400
Fax +45 9839 2498
MIDTJYLLAND
Vestergade 48 H, 2. sal
DK–8000 Aarhus C
Tel. +45 9682 0408
Fax +45 8613 6306
SJÆLLAND
Postadresse:
A.C. Meyers Vænge 15
2450 København SV
Besøgsadresse:
Frederikskaj 10 A 1. sal
2450 København SV
Tel.: +45 9682 0400
www.planenergi.dk
Indholdsfortegnelse
Indholdsfortegnelse ................................................................. 2
1 Indledning ........................................................................ 3
2 De overordnede principper .............................................. 4
2.1 Driftsscenarier ................................................................. 4
2.2 Beregning af netto varmeproduktionsomkostning ......... 6
3 Integrationer .................................................................... 6
3.1 Integration af motorstyring ............................................. 6
3.2 Integration af kedelstyring .............................................. 7
3.3 Integration af varmepumpestyring ................................. 7
3.4 Integration af PBAS .......................................................... 7
3.5 Integration af kontrolsystem fra AURA Energi ................ 7
3.6 Integration af Solvarmedata.dk ....................................... 7
3.7 Integration af ARCON-kommunikation ........................... 8
4 Fjernvarmekredsen .......................................................... 8
4.1 Retur-shunten.................................................................. 8
4.2 Akkumuleringstank .......................................................... 8
5 Valg af driftsscenarie ........................................................ 8
6 Styring af produktionsenhederne ..................................... 9
6.1 Motoranlæg ..................................................................... 9
6.2 Kedel ................................................................................ 9
6.3 Varmepumpe ................................................................. 11
6.4 Solvarmeanlæg .............................................................. 13
7 Beregning af relevante driftsdata for rapportudtræk ...... 19
8 Ændringslog ................................................................... 20
Bilag A I/O-liste for varmepumpe
Bilag B I/O-liste for PBAS
Bilag C I/O-liste for Galten Elværk
Bilag D Lastmatrix for varmepumpe
Side 3 af 24
1 Indledning
I projektet Rye Kraftvarmeværk – Grundvands- og solvarmeanlæg er følgende energianlæg etable-
ret:
• Et solvarmeanlæg på 2.444 m2 effektivt areal.
• En el-drevet varmepumpe på nominelt 2,05 MWvarme som udnytter energien i grundvan-
det ved hjælp af:
o To grundvandsboringer med en samlet nominel ydelse på 100 m3/h
o En grundvandsbuffertank på 1000 m3
o Et nedsivningsanlæg bestående af 1.800 m dræn fordelt på et areal på 5.000 m2
Det nye anlæg er idriftsat i 2014.
Det nye anlæg er integreret i og kører i samdrift med det eksisterende anlæg bestående af to na-
turgasmotorer på hver 1 MW og en naturgaskedel på 3,2 MW.
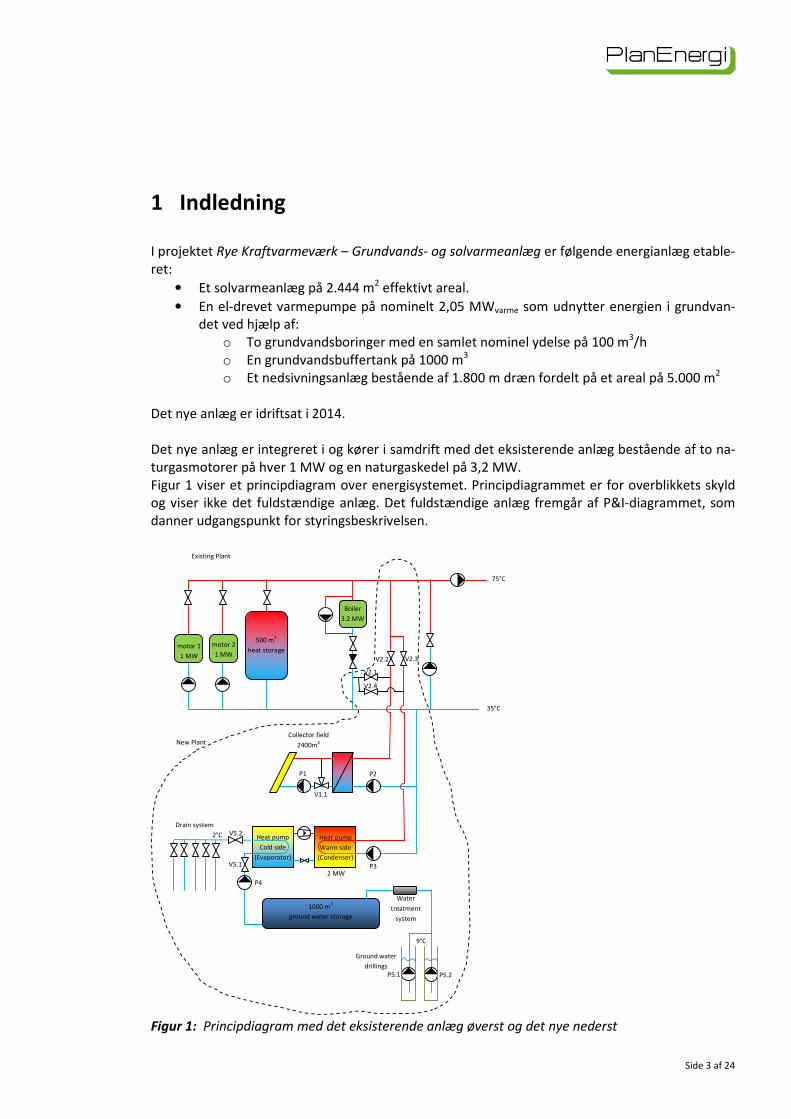
Figur 1 viser et principdiagram over energisystemet. Principdiagrammet er for overblikkets skyld
og viser ikke det fuldstændige anlæg. Det fuldstændige anlæg fremgår af P&I-diagrammet, som
danner udgangspunkt for styringsbeskrivelsen.
Figur 1: Principdiagram med det eksisterende anlæg øverst og det nye nederst
75°C
35°C
500 m
3
heat storage
Heat pump
Cold side
(Evaporator)
Heat pump
Warm side
(Condenser)
motor 1
1 MW
Boiler
3.2 MW
Collector field
2400m2
Ground water
drillings
motor 2
1 MW
2 MW
1000 m3
ground water storage
Drain system
Water
treatment
system
V2.1
V2.4
V2.3 V2.2
New Plant
Existing Plant
P1 P2
V1.1
P3
P4
P5.1 P5.2
V5.1
V5.2
9°C
2°C
Side 4 af 24
2 De overordnede principper
Styringen skal først og fremmest tilstræbe at minimere produktionsomkostningerne, således at
den leverede varme bliver så billig som muligt. Det betyder, at solvarmeanlægget og varmepum-
pen skal levere varme ved så lave temperaturer som muligt for at sikre størst mulig virkningsgrad
og størst mulig varmeeffekt. Dette opnås ved:
1) En behovsstyring af værkets fremløbstemperatur, som tilstræber at fremløbs- og retur-
temperaturen til enhver tid ikke er højere end nødvendigt
2) At der shuntes med motorvarme fra akkumuleringstanken eller efteropvarmes med ked-
len når varmepumpens (og solvarmens) effekt er for lav til at dække varmebehovet alene.
3) At varmeproduktionen fra motorer og varmepumpe planlægges i forhold til el-markedet
og akkumuleringstankene.
Dernæst skal det tilstræbes, at styringen bliver så simpel som muligt, således styringen bliver nem
at bruge i dagligdagen, samt at eventuel fejlfinding og optimering bliver så simpel som muligt.
2.1 Driftsscenarier Der er i alt 6 relevante driftsscenarier for kombinationen, varmepumpe, motorer og kedel:
0) Stilstand
1) Ren varmepumpedrift
2) Ren motordrift
3) Ren kedeldrift (nøddrift)
4) Varmepumpe + kedeldrift
5) Varmepumpe + motordrift
6) Motor + kedeldrift
For hvert scenarie er der 3 muligheder for solvarmeproduktion:
a) der er ingen solvarmeproduktion (Psol=0)
b) solvarmeproduktionen er større end nul, men mindre end varmebehovet (0<Psol < Q)
c) solvarmeproduktion er større end varmebehovet (Psol > Q)
Når solvarmeproduktionen er mindre end varmebehovet og i samdrift med motor- og/eller kedel-
anlæg skal solvarmeanlægget producere med lavest mulig temperatur under hensyntagen til at
fremløbstemperaturen til byen kan holdes ved blanding eller efteropvarmning med de andre pro-
duktionsenheder.
Når solvarmeproduktionen er mindre end varmebehovet og i samdrift med varmepumpen skal
solvarmeanlægget og varmepumpen producere varme med den beregnede fremløbstemperatur
til byen.
Når solvarmeproduktionen er større end varmebehovet skal solvarmeanlægget producere delvist
til lager, og derfor producere ved den fastsatte lagringstemperatur (sætpunkt). Når der lades med
højere temperatur end den nødvendige fremløbstemperatur sørger returshunten for at reducere
temperaturen til fremløbet.
Det optimale driftsscenarie til et givent tidspunkt afhænger af el-spotprisen og varmebehovet, og
driftsstrategien kan visualiseres ved at afbilde nettoproduktionsomkostningerne i forhold til el-
Side 5 af 24
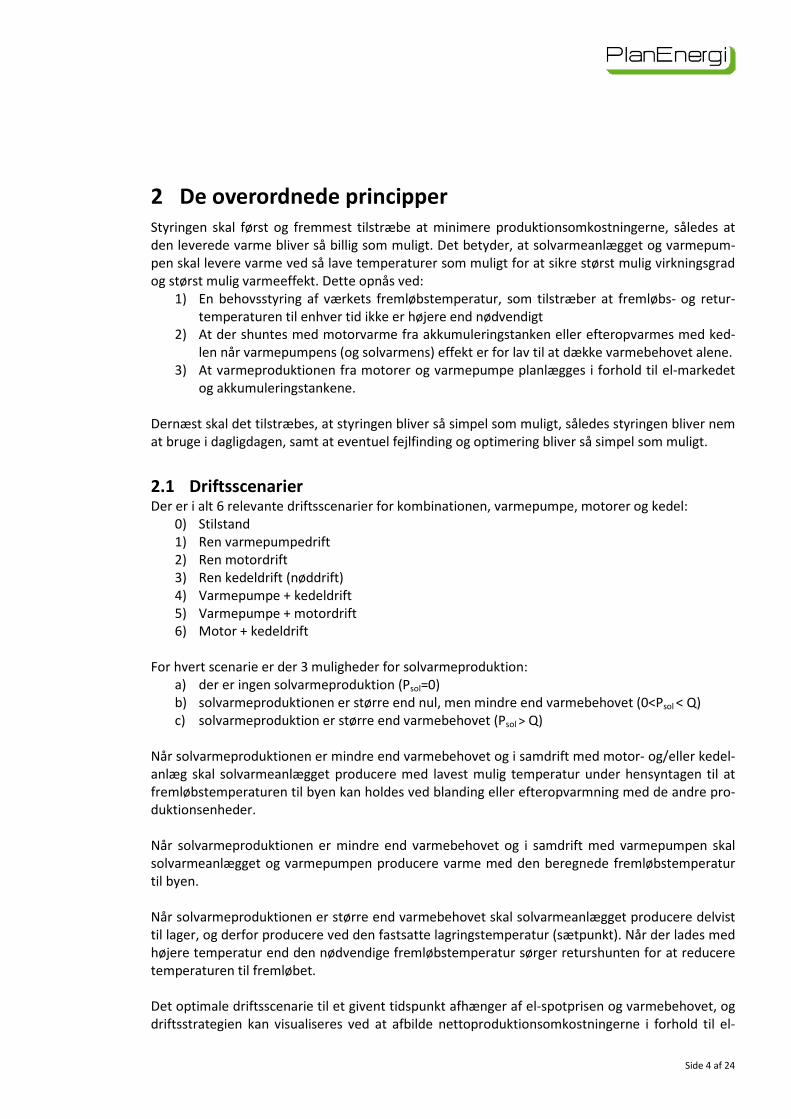
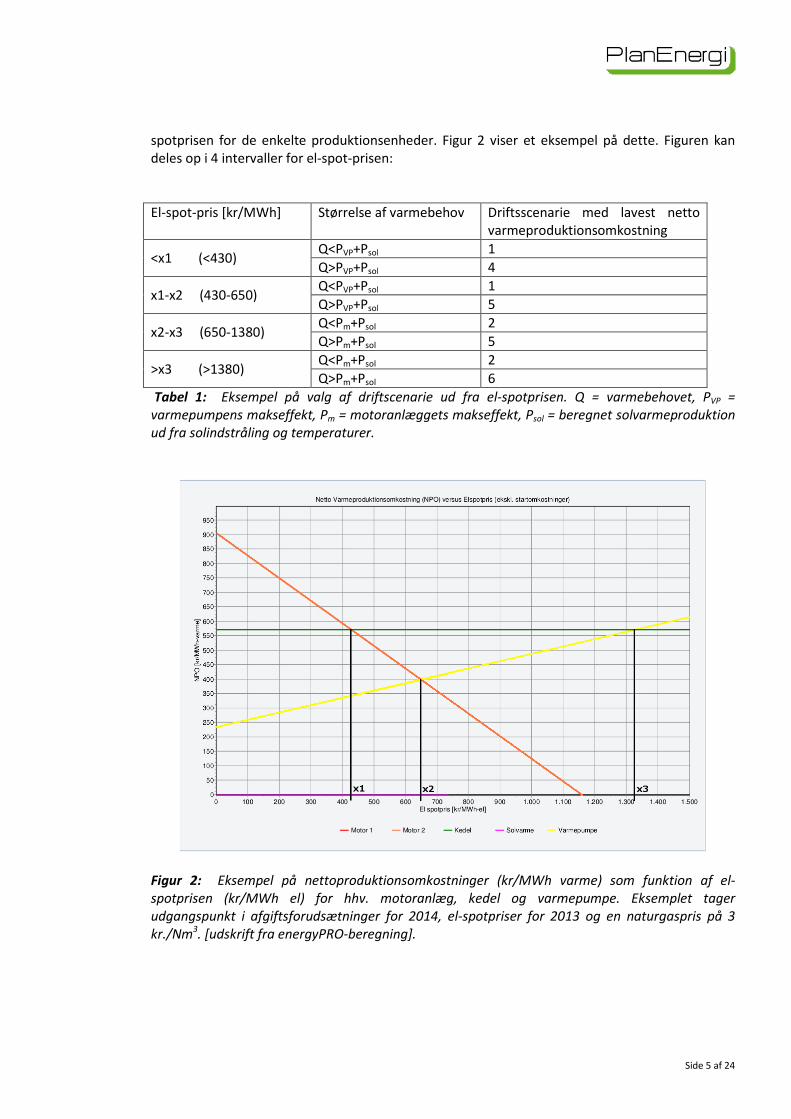
spotprisen for de enkelte produktionsenheder. Figur 2 viser et eksempel på dette. Figuren kan
deles op i 4 intervaller for el-spot-prisen:
El-spot-pris [kr/MWh] Størrelse af varmebehov Driftsscenarie med lavest netto
varmeproduktionsomkostning
<x1 (<430) Q<PVP+Psol 1
Q>PVP+Psol 4
x1-x2 (430-650) Q<PVP+Psol 1
Q>PVP+Psol 5
x2-x3 (650-1380) Q<Pm+Psol 2
Q>Pm+Psol 5
>x3 (>1380) Q<Pm+Psol 2
Q>Pm+Psol 6
Tabel 1: Eksempel på valg af driftscenarie ud fra el-spotprisen. Q = varmebehovet, PVP =
varmepumpens makseffekt, Pm = motoranlæggets makseffekt, Psol = beregnet solvarmeproduktion
ud fra solindstråling og temperaturer.
Figur 2: Eksempel på nettoproduktionsomkostninger (kr/MWh varme) som funktion af el-
spotprisen (kr/MWh el) for hhv. motoranlæg, kedel og varmepumpe. Eksemplet tager
udgangspunkt i afgiftsforudsætninger for 2014, el-spotpriser for 2013 og en naturgaspris på 3
kr./Nm3. [udskrift fra energyPRO-beregning].
Side 6 af 24
2.2 Beregning af netto varmeproduktionsomkostning Beregningen af netto varmeproduktionsomkostningen (NPO) for de enkelte driftsscenarier bereg-
nes i produktionsplanlægningssystemet (aktuelt PBAS fra Neas Energy). NPO er udover de traditi-
onelle parametre som gaspris, el-spotpris, afgifter mv. afhængig af varmepumpens COP, som pri-
mært er afhængig af varmepumpens fremløbstemperatur. Den nødvendige fremløbstemperatur
fra varmepumpen afhænger igen af fremløbstemperaturen fra værket, samt fordelingen mellem
varmepumpens varmeproduktion og varmeproduktionen fra evt. andre enheder den kører i sam-
drift med. For at kunne planlægge den optimale produktion er det derfor nødvendigt at beregne
eller estimere disse parametre på forhånd i PBAS.
For at simplificere produktionsplanlægningen bruges der for varmepumpen en konstant COP på
4,0 i beregningen af NPO samt en konstant varmeeffekt på 2,05 MW. COP-værdien og effekten
indtastes i PBAS af driftspersonalet, og kan således ændres efter behov og årstid så den stemmer
nogenlunde overens med den faktiske COP. På sigt kan der indføres en mere automatiseret forud-
sigelse af COP-værdien i PBAS, men dette er fravalgt i første omgang for at mindske kompleksite-
ten. Den målte COP for varmepumpeanlægget overføres fra den overordnede styring til PBAS så
de historiske varmepriser vises korrekt og kan sammenlignes med forudsigelsen.
I praksis vil varmepumpen stort set altid være den billigste produktionsenhed, da balanceprisen
mellem varmepumpen og motoren (jf. figur 2) ligger relativt højt og balanceprisen mellem varme-
pumpe og kedel ligger endnu højere. Med afgiftsforudsætninger for 2014, el-spotpriser for 2013
og en naturgaspris på 3 kr/Nm3 vil varmepumpen beregningsmæssigt altid være billigst bortset fra
19 timer i året, hvor el-spotprisen var højere end 650 kr./MWh. Det betyder at produktionsplan-
lægningen i praksis går ud på at estimere hvor meget varme der mangler i planlægningsperioden
når varmepumpen og solvarmen har dækket så stor en del af varmebehovet som muligt. Varme-
pumpens driftstimer skal lægges i de billigste el-spot-timer og eventuel suppleringsvarme fra mo-
torerne i de dyreste el-spot-timer. Eventuel suppleringsvarme fra kedlen lægges så kedlen så vidt
muligt kører i samdrift med varmepumpen. Derved udnyttes det faktum at varmepumpens COP
reelt er højere når den kører i samdrift med kedlen fordi varmepumpens fremløbstemperatur kan
reduceres. I PBAS sættes kedlens effekt beregningsmæssigt til 675 kW når den kører i samdrift
med varmepumpen, hvilket betyder at afgangstemperaturen fra varmepumpen kan hæves fra
65°C til 75°C. Den nødvendige kedeleffekt bestemmes mere præcist i den overordnede styring
under hensyntagen til den aktuelle nødvendige fremløbstemperatur.
3 Integrationer
Den overordnede styring integrerer de enkelte produktionsenheders selvstændige styring (moto-
rer, kedel, og varmepumpe). Solvarmeanlægget har ikke nogen selvstændig styring, og styres di-
rekte af den overordnede styring. Ud over produktionsenhederne har den overordnede styring
snitflade med produktionsplanlægningssystemet (PBAS fra NEAS) samt et kontrolsystem fra AURA
Energi. I det følgende gives en oversigt over integrationen af de enkelte enheder.
3.1 Integration af motorstyring Der ændres ikke i integrationen af den eksisterende motorstyring. Den eksisterende integration
med den oprindelige styring overføres til den nye overordnede styring.
Side 7 af 24
3.2 Integration af kedelstyring Kedelstyringen overføres fra den eksisterende styring og eksisterende signaler for driftmelding,
fejlmelding mv. bibeholdes. Derudover skal kedelstyringen integreres således lasttrinet (0-100%)
samt afgangstemperaturen fra kedlen kan styres via den overordnede styring.
3.3 Integration af varmepumpestyring Varmepumpens styring integreres i den overordnede styring ved at sende signal for ønsket
driftsmode (høj/lavtemperaturdrift), ønsket last (0-100%) samt ønsket afgangstemperatur. Af-
gangstemperaturen ved hhv. høj- og lavtemperaturdrift kan sættes mellem 65-75°C og 43-51,5°C.
De præcise grænser for afgangstemperaturen skal dog eftervises eksperimentelt. Ud over de tre
primære sætpunkter for varmepumpens drift udveksles der en række informationer i form af
måledata mv. over kommunikationsprotokollen. Den komplette I/O-liste for kommunikationspro-
tokollen fremgår af Bilag A.
Ud over kommunikationsprotokollen er der 3 hårdtfortrådede signaler til varmepumpestyringen:
hhv. nødstop til varmepumpen, normalt start/stop til varmepumpen og driftskvittering fra varme-
pumpen.
3.4 Integration af PBAS Den overordnede styring modtager start/stop kommandoer mv. til motorer, varmepumpe og
kedel fra PBAS og sender de nødvendige informationer til PBAS for at PBAS kan optimere produk-
tionsplanen. I/O-liste for kommunikationen mellem PBAS og den overordnede styring i relation til
kedel og varmepumpedrift fremgår af bilag B. Kommunikationen i relation til motordrift er uæn-
dret i forhold til den eksisterende styring.
3.5 Integration af kontrolsystem fra AURA Energi Da varmepumpen er tilsluttet med begrænset netadgang har AURA Energi mulighed for at over-
våge og begrænse varmepumpens drift. Dette foregår ved at den overordnede styring sender
signaler for varmepumpens drift til styringen fra AURA Energi, samt modtager signaler for evt.
stop eller reduceret tilladelig drift. I/O-liste for kommunikationen med AURA Energis styreboks
fremgår af Bilag C.
3.6 Integration af Solvarmedata.dk Data til Solvarmedata lægges op som en tekstfil til en FTP-server hos Solvarmedata. Der lægges en
tekstfil op med aktuelle værdier hvert 5. minut.
FTP-login:
Host: solvarmedata.dk
Brugernavn: ftpry
Kodeord: wrhg23f
Filen navngives data.txt. og indeholder:
- aktuel solvarmeproduktion i MW
- aktuel solindstråling i W/m2
med 2 decimaler og ',' som decimalseparator. De to værdier er semikolonsepareret.
Filen indeholder således en linie med ovenstående data. F.eks.
2,05;650,00
hvis den aktuelle solvarmeproduktion er 2,05 MW og den aktuelle solindstråling er 650,00 W/m2
Side 8 af 24
3.7 Integration af ARCON-kommunikation ARCON har leveret solvarmepaneler og solvarmeunit til anlægget. For at ARCON har mulighed for
at følge solvarmeanlæggets drift og evt. bidrage med optimeringsmuligheder etableres der en
VPN-adgang for ARCON. Der opsættes en OPC-server i SCADA-systemet (IGSS), som ARCON kan
bruge til at hente live data fra. Dermed har ARCON adgang til alle TAG-numre for anlægget og kan
løbende hente udvalgte data ned til deres egen server.
4 Fjernvarmekredsen
Som en del af projektet er der installeret en behovsstyring af fremløbstemperaturen. Den bereg-
nede varmeeffekt og fremløbstemperatur anvendes som kriterier og beregningsinput for styrin-
gen af solvarmeanlægget, varmepumpen og retur-shunten. Flowet i fjernvarmekredsen styres af
differenstrykket i byen. Trykholdeventiler styres som på det eksisterende anlæg efter at holde det
nødvendige tryk i fjernvarmekredsen.
4.1 Retur-shunten Retur-shunten skal sikre, at fremløbstemperaturen ikke overstiger den ønskede fremløbstempera-
tur. Retur-shunten styres efter den beregnede fremløbstemperatur.
4.2 Akkumuleringstank Akkumuleringstanken bruges som varmelager, for solvarme, motoranlæg og varmepumpe samt til
dels kedelvarme. Tanken indgår i produktionsplanlægningen så produktionsenhederne kan udnyt-
tes så optimalt som muligt i forhold til spotpriser og solindstråling. Akkumuleringstanken fyldes
automatisk når varmeproduktionen er større end byens forbrug og tømmes når varmeproduktio-
nen er mindre end byens forbrug. Akkumuleringstanken kan afspærres med en motorventil. Den-
ne skal være åben når der er behov for op- eller afladning af akkumuleringstanken.
Der skal gives en alarm når temperaturen i bunden af tanken > 45°C. (sætpunkt)
5 Valg af driftsscenarie
Det aktuelle driftsscenarie vælges primært af PBAS, som sender start/stop-signaler for de enkelte
produktionsenheder ud fra den planlagte produktion. Derudover skal det være muligt at vælge
driftsscenarie manuelt. På skærmbilledet skal det fremgå hvilket driftsscenarie der er aktivt.
Der er 4 ventiler (jf. PI-diagrammet), som bestemmer hvilket driftsscenarie der er aktivt:
NDA651AA001 (V2.1 på figur 1) – solvarmefremløb til kedelretur.
NDA650AA001 (V2.2 på figur 1) – solvarmefremløb til fjernvarme frem.
NDA640AA005 (V2.3 på figur 1) – varmepumpe fremløb til fjernvarme frem.
NDA643AA001 (V2.4 på figur 1) – varmepumpe fremløb til kedelretur.
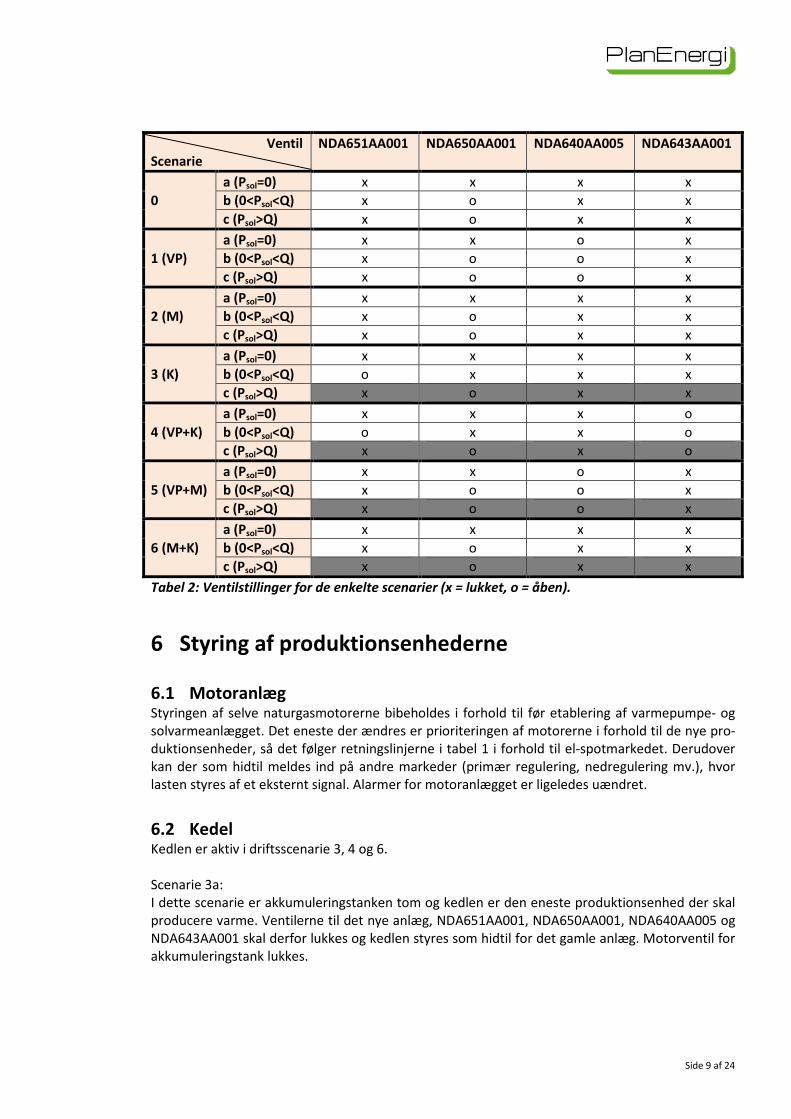
Nedenstående tabel viser ventilstillingerne for de enkelte scenarier:
Side 9 af 24
Ventil
Scenarie
NDA651AA001 NDA650AA001 NDA640AA005 NDA643AA001
0
a (Psol=0) x x x x
b (0<Psol<Q) x o x x
c (Psol>Q) x o x x
1 (VP)
a (Psol=0) x x o x
b (0<Psol<Q) x o o x
c (Psol>Q) x o o x
2 (M)
a (Psol=0) x x x x
b (0<Psol<Q) x o x x
c (Psol>Q) x o x x
3 (K)
a (Psol=0) x x x x
b (0<Psol<Q) o x x x
c (Psol>Q) x o x x
4 (VP+K)
a (Psol=0) x x x o
b (0<Psol<Q) o x x o
c (Psol>Q) x o x o
5 (VP+M)
a (Psol=0) x x o x
b (0<Psol<Q) x o o x
c (Psol>Q) x o o x
6 (M+K)
a (Psol=0) x x x x
b (0<Psol<Q) x o x x
c (Psol>Q) x o x x
Tabel 2: Ventilstillinger for de enkelte scenarier (x = lukket, o = åben).
6 Styring af produktionsenhederne
6.1 Motoranlæg Styringen af selve naturgasmotorerne bibeholdes i forhold til før etablering af varmepumpe- og
solvarmeanlægget. Det eneste der ændres er prioriteringen af motorerne i forhold til de nye pro-
duktionsenheder, så det følger retningslinjerne i tabel 1 i forhold til el-spotmarkedet. Derudover
kan der som hidtil meldes ind på andre markeder (primær regulering, nedregulering mv.), hvor
lasten styres af et eksternt signal. Alarmer for motoranlægget er ligeledes uændret.
6.2 Kedel Kedlen er aktiv i driftsscenarie 3, 4 og 6.
Scenarie 3a:
I dette scenarie er akkumuleringstanken tom og kedlen er den eneste produktionsenhed der skal
producere varme. Ventilerne til det nye anlæg, NDA651AA001, NDA650AA001, NDA640AA005 og
NDA643AA001 skal derfor lukkes og kedlen styres som hidtil for det gamle anlæg. Motorventil for
akkumuleringstank lukkes.
Side 10 af 24
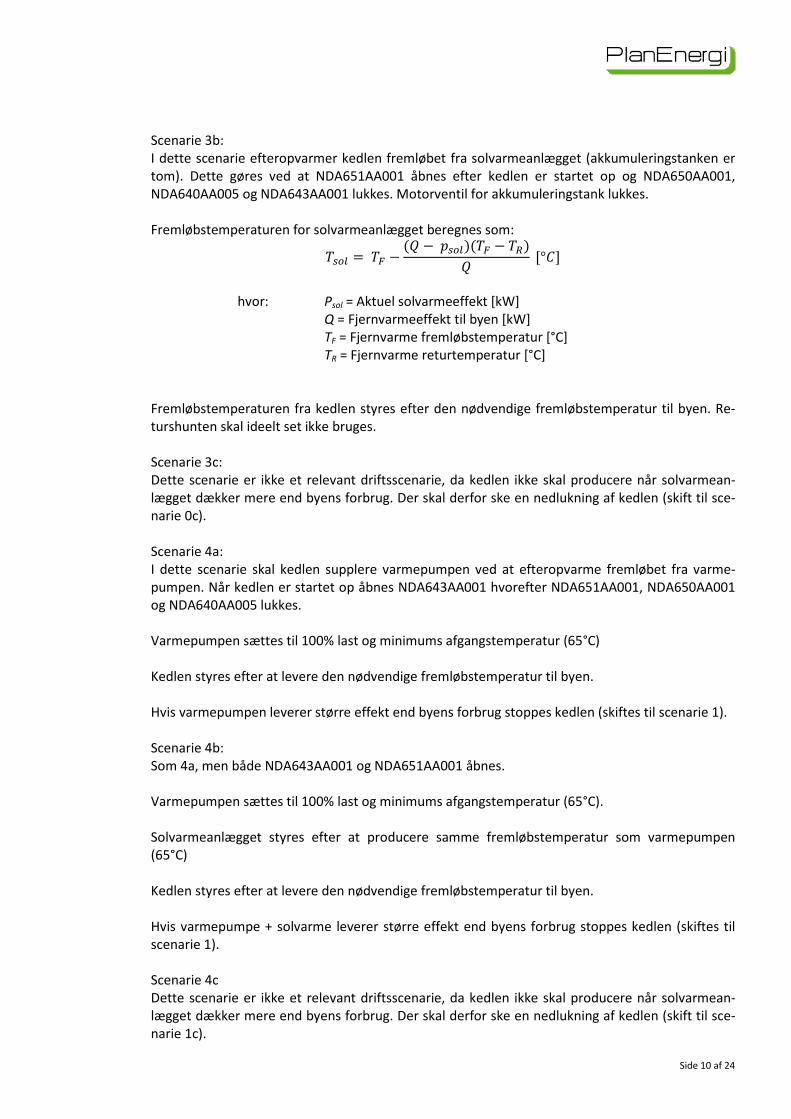
Scenarie 3b:
I dette scenarie efteropvarmer kedlen fremløbet fra solvarmeanlægget (akkumuleringstanken er
tom). Dette gøres ved at NDA651AA001 åbnes efter kedlen er startet op og NDA650AA001,
NDA640AA005 og NDA643AA001 lukkes. Motorventil for akkumuleringstank lukkes.
Fremløbstemperaturen for solvarmeanlægget beregnes som:
���� =�� −( − ����)(�� − � )
[°�]
hvor: Psol = Aktuel solvarmeeffekt [kW]
Q = Fjernvarmeeffekt til byen [kW]
TF = Fjernvarme fremløbstemperatur [°C]
TR = Fjernvarme returtemperatur [°C]
Fremløbstemperaturen fra kedlen styres efter den nødvendige fremløbstemperatur til byen. Re-
turshunten skal ideelt set ikke bruges.
Scenarie 3c:
Dette scenarie er ikke et relevant driftsscenarie, da kedlen ikke skal producere når solvarmean-
lægget dækker mere end byens forbrug. Der skal derfor ske en nedlukning af kedlen (skift til sce-
narie 0c).
Scenarie 4a:
I dette scenarie skal kedlen supplere varmepumpen ved at efteropvarme fremløbet fra varme-
pumpen. Når kedlen er startet op åbnes NDA643AA001 hvorefter NDA651AA001, NDA650AA001
og NDA640AA005 lukkes.
Varmepumpen sættes til 100% last og minimums afgangstemperatur (65°C)
Kedlen styres efter at levere den nødvendige fremløbstemperatur til byen.
Hvis varmepumpen leverer større effekt end byens forbrug stoppes kedlen (skiftes til scenarie 1).
Scenarie 4b:
Som 4a, men både NDA643AA001 og NDA651AA001 åbnes.
Varmepumpen sættes til 100% last og minimums afgangstemperatur (65°C).
Solvarmeanlægget styres efter at producere samme fremløbstemperatur som varmepumpen
(65°C)
Kedlen styres efter at levere den nødvendige fremløbstemperatur til byen.
Hvis varmepumpe + solvarme leverer større effekt end byens forbrug stoppes kedlen (skiftes til
scenarie 1).
Scenarie 4c
Dette scenarie er ikke et relevant driftsscenarie, da kedlen ikke skal producere når solvarmean-
lægget dækker mere end byens forbrug. Der skal derfor ske en nedlukning af kedlen (skift til sce-
narie 1c).
Side 11 af 24
Scenarie 6a
NDA651AA001, NDA650AA001, NDA640AA005 og NDA643AA001 lukkes. Kedlen supplerer moto-
rerne ved at shunte i fremløbet som ved det gamle anlæg.
Scenarie 6b
NDA650AA001 åbnes. NDA640AA005, NDA651AA001 og NDA643AA001 lukkes. Kedlen og solvar-
meanlægget leverer ind på fremløbet. Solvarmeanlæggets fremløbstemperatur skal styres efter
ønsket sætpunkt for lagringstemperatur eller den beregnede fremløbstemperatur til byen + offset
(sætpunkt).
Scenarie 6c
Dette scenarie er ikke et relevant driftsscenarie, da kedlen ikke skal producere når solvarmean-
lægget dækker mere end byens forbrug. Der skal derfor ske en nedlukning af kedlen (skift til sce-
narie 2c).
6.3 Varmepumpe Varmepumpen er aktiv i scenarie 1, 4 og 5. Af Bilag D fremgår estimerede fuldlast og dellast-data
for varmepumpen.
I produktionsplanen tages der højde for begrænsningerne i forsyning af grundvand samt buffer-
tank for grundvand. Opstår det alligevel at grundvandstanken er ved at løbe tør (alarm for lavt-
lavt nivau) skal varmepumpen standses.
Pumpen på varmepumpens kolde side, GAC010AP001, startes når der sendes startkommando til
varmepumpen. Pumpen styres efter et flow på 195 m3/h (sætpunkt). Pumpen stoppes efter var-
mepumpen er stoppet.
Scenarie 1a:
Varmepumpen leverer alene varme til byen og/eller akkumuleringstanken
Ventilen NDA640AA005 åbnes. NDA651AA001, NDA650AA001 og NDA643AA001 lukkes.
Varmepumpen producerer efter sætpunkt for last (0-100%) og fremløbstemperatur (65-75°C) –
normalt fuldlast og den beregnede fremløbstemperatur til byen. Det skal kunne vælges om var-
mepumpen kører efter setpunkt for afgangstemperatur eller den beregnede fremløbstemperatur
til byen + et offset (sætpunkt).
Scenarie 1b:
NDA650AA001 og NDA640AA005 åbnes. NDA643AA001 og NDA651AA001 lukkes.
Solvarmanlægget styres efter at levere den beregnede fremløbstemperatur til byen + et offset
(sætpunkt) eller et sætpunkt for fremløbstemperaturen.
Varmepumpen producerer efter sætpunkt for last (0-100%) og fremløbstemperatur (65-75°C) –
normalt fuldlast og den beregnede fremløbstemperatur til byen. Det skal kunne vælges om var-
mepumpen kører efter setpunkt for afgangstemperatur eller den beregnede fremløbstemperatur
til byen + et offset (sætpunkt).
Scenarie 1c:
Som 1b.
Scenarie 4:
Beskrevet under kedlen.
Side 12 af 24
Scenarie 5a:
NDA640AA005 åbnes. NDA651AA001, NDA650AA001 og NDA643AA001 lukkes.
Varmepumpen producerer efter sætpunkt for last (0-100%) og fremløbstemperatur (65-75°C) –
normalt fuldlast og den beregnede fremløbstemperatur til byen. Varmepumpens fremløb blandes
med motorvarmen.
Scenarie 5b:
solvarmen blandes med i fremløbet sammen med motorerne og varmepumpen ved at
NDA650AA001 og NDA640AA005 åbnes. NDA651AA001 og NDA643AA001 lukkes. Fremløbstem-
peratur for varmepumpe og solvarme sættes til den beregnede fremløbstemperatur til byen +
offset (sætpunkter).
Scenarie 5c:
Som scenarie 5b. Der produceres til lager med den beregnede fremløbstemperatur for byen +
offset (sætpunkt) eller den valgte lagringstemperatur.
Grundvandspumper og grundvandstank
Grundvandspumperne, GAF010AP001 og GAF020AP001 kører konstant indtil niveauet i grund-
vandstanken målt med niveautransmitter GAD010CL001 når sætpunktet ”grundvandstank fuld”.
Når niveauet falder til sætpunktet ”start grundvandspumper” skal pumperne starte igen. For hver
pumpe defineres et sætpunkt for ønsket flow, som pumperne reguleres efter. Flow måles med
GAF010CF001 og GAF020CF001. Der defineres alarmgrænser for lavt niveau i grundvandsborin-
gerne samt lavt lavt niveau som automatisk stopper grundvandspumpen. Der defineres alarm-
grænse for lavt niveau, lavt-lavt niveau og højt niveau i grundvandstanken. Målt flow for grund-
vandspumperne samt aktuelt niveau i grundvandstanken kommunikeres til PBAS-systemet.
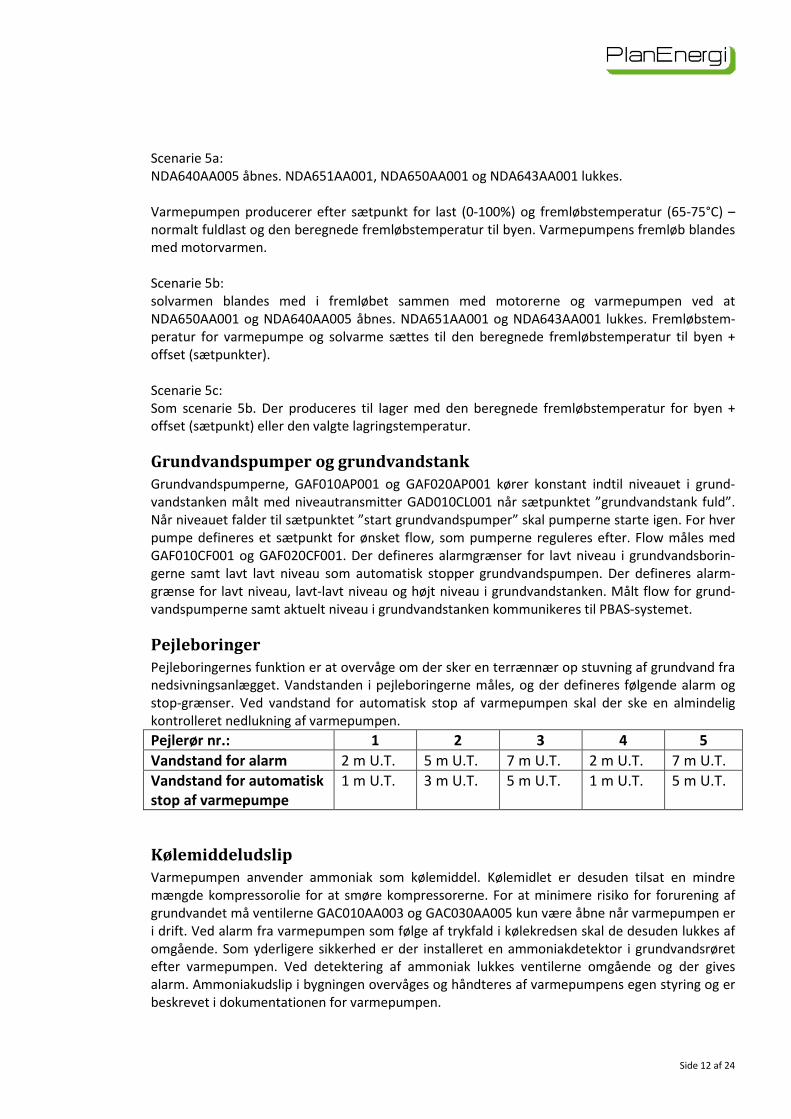
Pejleboringer
Pejleboringernes funktion er at overvåge om der sker en terrænnær op stuvning af grundvand fra
nedsivningsanlægget. Vandstanden i pejleboringerne måles, og der defineres følgende alarm og
stop-grænser. Ved vandstand for automatisk stop af varmepumpen skal der ske en almindelig
kontrolleret nedlukning af varmepumpen.
Pejlerør nr.: 1 2 3 4 5
Vandstand for alarm 2 m U.T. 5 m U.T. 7 m U.T. 2 m U.T. 7 m U.T.
Vandstand for automatisk
stop af varmepumpe
1 m U.T. 3 m U.T. 5 m U.T. 1 m U.T. 5 m U.T.
Kølemiddeludslip
Varmepumpen anvender ammoniak som kølemiddel. Kølemidlet er desuden tilsat en mindre
mængde kompressorolie for at smøre kompressorerne. For at minimere risiko for forurening af
grundvandet må ventilerne GAC010AA003 og GAC030AA005 kun være åbne når varmepumpen er
i drift. Ved alarm fra varmepumpen som følge af trykfald i kølekredsen skal de desuden lukkes af
omgående. Som yderligere sikkerhed er der installeret en ammoniakdetektor i grundvandsrøret
efter varmepumpen. Ved detektering af ammoniak lukkes ventilerne omgående og der gives
alarm. Ammoniakudslip i bygningen overvåges og håndteres af varmepumpens egen styring og er
beskrevet i dokumentationen for varmepumpen.
Side 13 af 24
6.4 Solvarmeanlæg Solvarmeanlægget kan som det fremgår ovenstående være aktivt i samtlige driftsscenarier med
de andre produktionsenheder. Derudover kan det være aktivt i scenarie 0, hvor det kun er sol-
varmeanlægget der kan producere varme.
Scenarie 0b:
Fremløbet fra solvarmeanlægget blandes med fremløbet fra akkumuleringstanken. NDA650AA001
åbnes. NDA640AA005, NDA651AA001 og NDA643AA001 lukkes. Det beregnes hvor stor fremløbs-
temperaturen skal være fra solfangeranlægget for at levere den nødvendige fremløbstemperatur
til byen. Dette beregnes som:
���� =����(�� − � )(� − �����)
( − ����)(�� − �����) + ����(� − �����)+ � [°�]
hvor: Psol = Aktuel solvarmeeffekt [kW]
Takku = Temperaturen i toppen af akkumuleringstanken [°C]
Q = Fjernvarmeeffekt til byen [kW]
TF = Fjernvarme fremløbstemperatur [°C]
TR = Fjernvarme returtemperatur [°C]
Fremløbstemperaturen skal være mellem fjernvarme returtemperaturen og den maksimalt tilla-
delige fremløbstemperatur Tmax (sætpunkt). Ellers sættes fremløbstemperaturen til den maksimalt
tilladelige fremløbstemperatur:
Tsol=Tmax hvis Tsol(beregnet) >Tmax eller Tsol(beregnet) <TR
Scenarie 0c:
Solvarmeanlæggets fremløbstemperatur skal styres efter den ønskede lagringstemperatur for
solvarme i akkumuleringstanken (den beregnede fremløbstemperatur til byen eller et valgfrit
sætpunkt). NDA650AA001 åbnes. NDA640AA005, NDA651AA001 og NDA643AA001 lukkes.
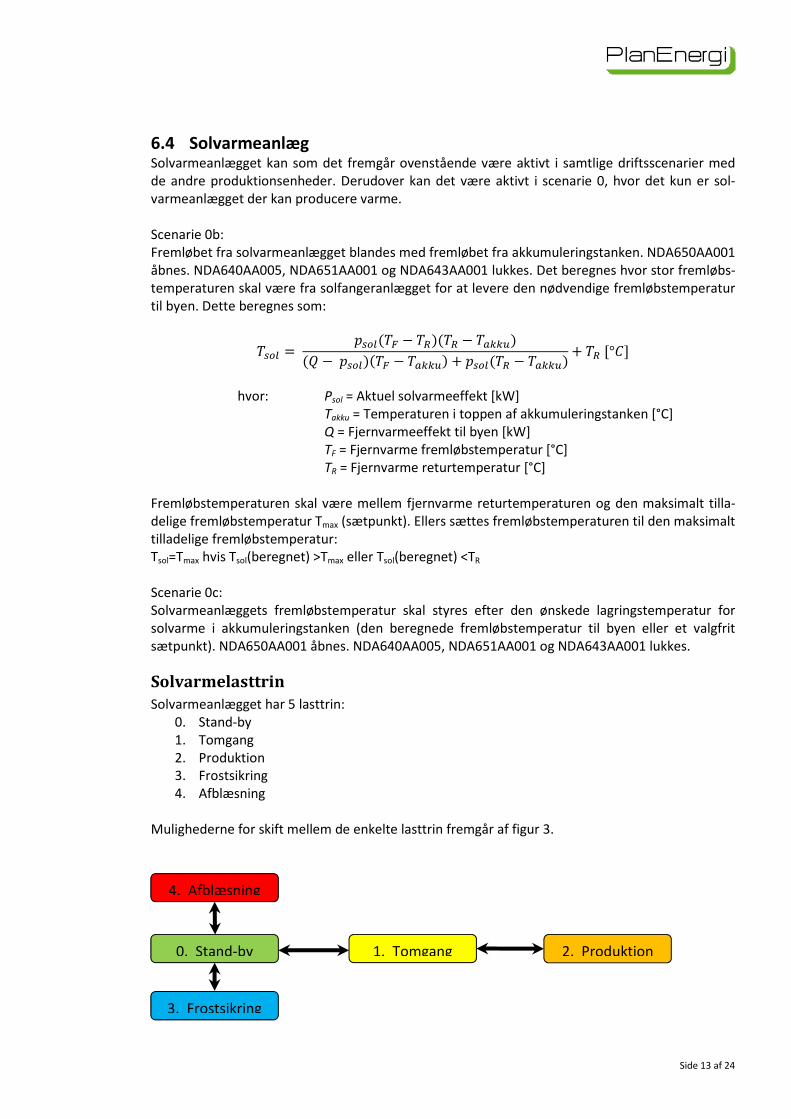
Solvarmelasttrin
Solvarmeanlægget har 5 lasttrin:
0. Stand-by
1. Tomgang
2. Produktion
3. Frostsikring
4. Afblæsning
Mulighederne for skift mellem de enkelte lasttrin fremgår af figur 3.
4. Afblæsning
3. Frostsikring
2. Produktion 1. Tomgang 0. Stand-by
Side 14 af 24
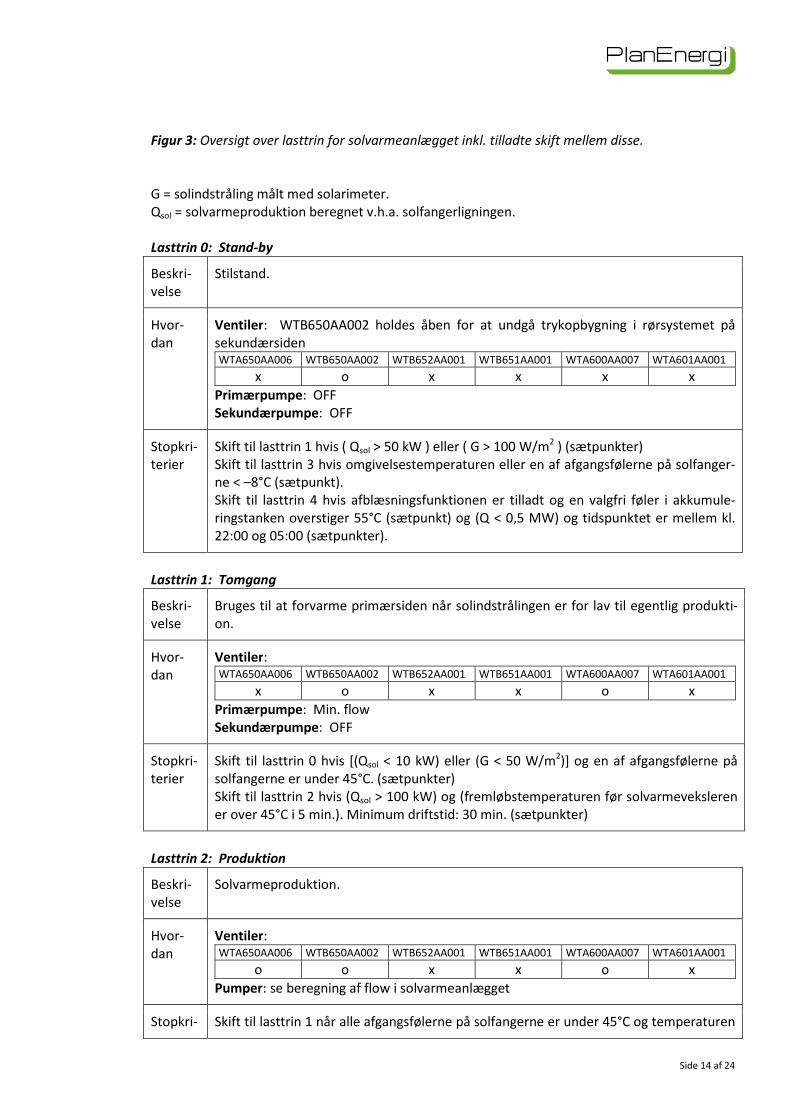
Figur 3: Oversigt over lasttrin for solvarmeanlægget inkl. tilladte skift mellem disse.
G = solindstråling målt med solarimeter.
Qsol = solvarmeproduktion beregnet v.h.a. solfangerligningen.
Lasttrin 0: Stand-by
Beskri-
velse
Stilstand.
Hvor-
dan
Ventiler: WTB650AA002 holdes åben for at undgå trykopbygning i rørsystemet på
sekundærsiden WTA650AA006 WTB650AA002 WTB652AA001 WTB651AA001 WTA600AA007 WTA601AA001
x o x x x x
Primærpumpe: OFF
Sekundærpumpe: OFF
Stopkri-
terier
Skift til lasttrin 1 hvis ( Qsol > 50 kW ) eller ( G > 100 W/m2 ) (sætpunkter)
Skift til lasttrin 3 hvis omgivelsestemperaturen eller en af afgangsfølerne på solfanger-
ne < –8°C (sætpunkt).
Skift til lasttrin 4 hvis afblæsningsfunktionen er tilladt og en valgfri føler i akkumule-
ringstanken overstiger 55°C (sætpunkt) og (Q < 0,5 MW) og tidspunktet er mellem kl.
22:00 og 05:00 (sætpunkter).
Lasttrin 1: Tomgang
Beskri-
velse
Bruges til at forvarme primærsiden når solindstrålingen er for lav til egentlig produkti-
on.
Hvor-
dan
Ventiler: WTA650AA006 WTB650AA002 WTB652AA001 WTB651AA001 WTA600AA007 WTA601AA001
x o x x o x
Primærpumpe: Min. flow
Sekundærpumpe: OFF
Stopkri-
terier
Skift til lasttrin 0 hvis [(Qsol < 10 kW) eller (G < 50 W/m2)] og en af afgangsfølerne på
solfangerne er under 45°C. (sætpunkter)
Skift til lasttrin 2 hvis (Qsol > 100 kW) og (fremløbstemperaturen før solvarmeveksleren
er over 45°C i 5 min.). Minimum driftstid: 30 min. (sætpunkter)
Lasttrin 2: Produktion
Beskri-
velse
Solvarmeproduktion.
Hvor-
dan
Ventiler: WTA650AA006 WTB650AA002 WTB652AA001 WTB651AA001 WTA600AA007 WTA601AA001
o o x x o x
Pumper: se beregning af flow i solvarmeanlægget
Stopkri- Skift til lasttrin 1 når alle afgangsfølerne på solfangerne er under 45°C og temperaturen
Side 15 af 24
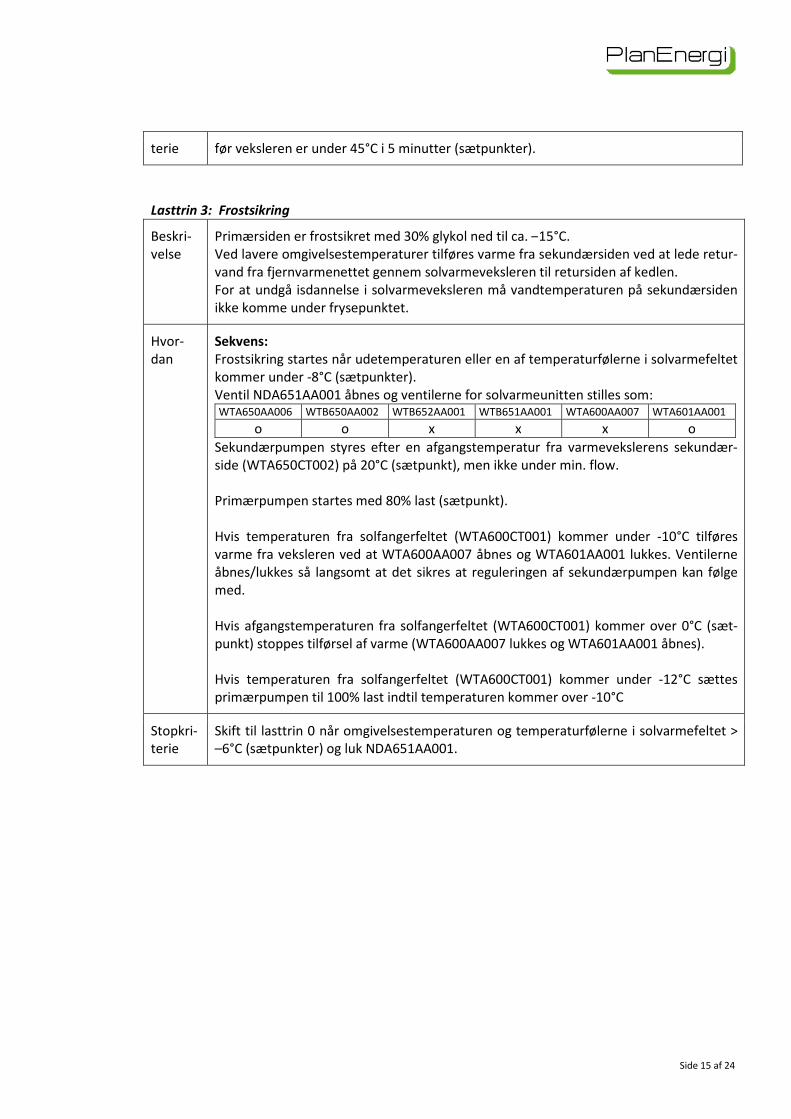
terie før veksleren er under 45°C i 5 minutter (sætpunkter).
Lasttrin 3: Frostsikring
Beskri-
velse
Primærsiden er frostsikret med 30% glykol ned til ca. –15°C.
Ved lavere omgivelsestemperaturer tilføres varme fra sekundærsiden ved at lede retur-
vand fra fjernvarmenettet gennem solvarmeveksleren til retursiden af kedlen.
For at undgå isdannelse i solvarmeveksleren må vandtemperaturen på sekundærsiden
ikke komme under frysepunktet.
Hvor-
dan
Sekvens:
Frostsikring startes når udetemperaturen eller en af temperaturfølerne i solvarmefeltet
kommer under -8°C (sætpunkter).
Ventil NDA651AA001 åbnes og ventilerne for solvarmeunitten stilles som: WTA650AA006 WTB650AA002 WTB652AA001 WTB651AA001 WTA600AA007 WTA601AA001
o o x x x o
Sekundærpumpen styres efter en afgangstemperatur fra varmevekslerens sekundær-
side (WTA650CT002) på 20°C (sætpunkt), men ikke under min. flow.
Primærpumpen startes med 80% last (sætpunkt).
Hvis temperaturen fra solfangerfeltet (WTA600CT001) kommer under -10°C tilføres
varme fra veksleren ved at WTA600AA007 åbnes og WTA601AA001 lukkes. Ventilerne
åbnes/lukkes så langsomt at det sikres at reguleringen af sekundærpumpen kan følge
med.
Hvis afgangstemperaturen fra solfangerfeltet (WTA600CT001) kommer over 0°C (sæt-
punkt) stoppes tilførsel af varme (WTA600AA007 lukkes og WTA601AA001 åbnes).
Hvis temperaturen fra solfangerfeltet (WTA600CT001) kommer under -12°C sættes
primærpumpen til 100% last indtil temperaturen kommer over -10°C
Stopkri-
terie
Skift til lasttrin 0 når omgivelsestemperaturen og temperaturfølerne i solvarmefeltet >
–6°C (sætpunkter) og luk NDA651AA001.
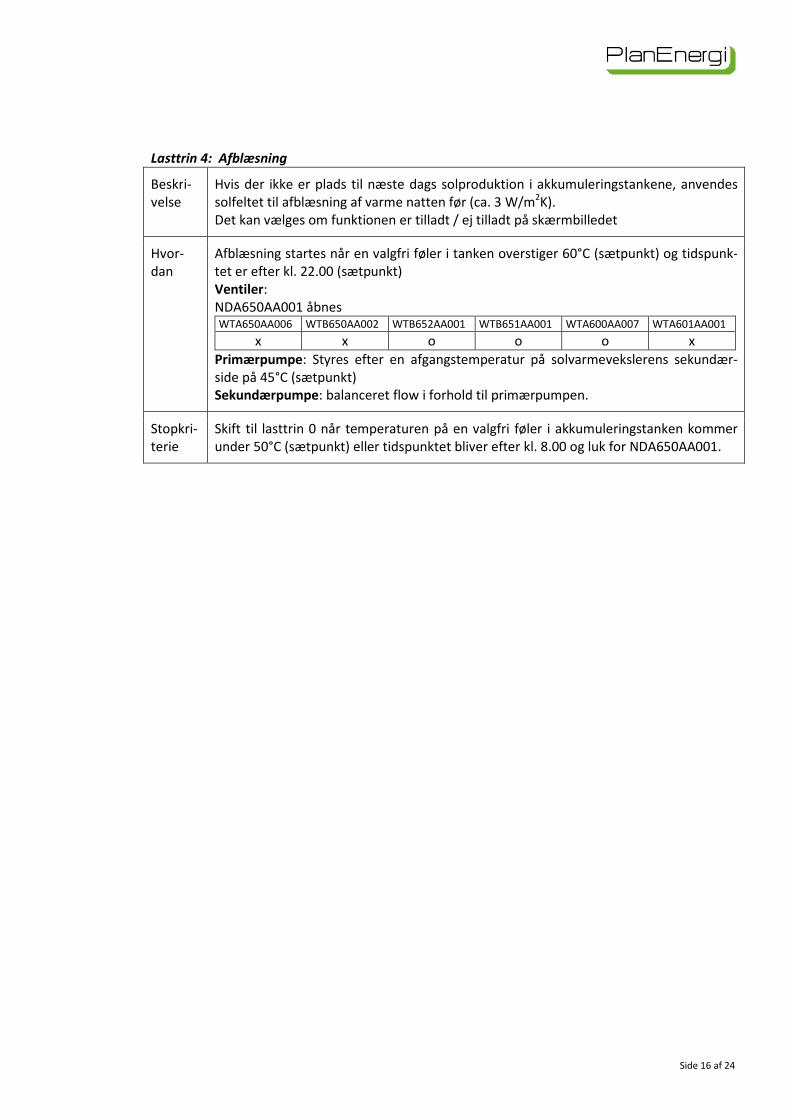
Side 16 af 24
Lasttrin 4: Afblæsning
Beskri-
velse
Hvis der ikke er plads til næste dags solproduktion i akkumuleringstankene, anvendes
solfeltet til afblæsning af varme natten før (ca. 3 W/m2K).
Det kan vælges om funktionen er tilladt / ej tilladt på skærmbilledet
Hvor-
dan
Afblæsning startes når en valgfri føler i tanken overstiger 60°C (sætpunkt) og tidspunk-
tet er efter kl. 22.00 (sætpunkt)
Ventiler:
NDA650AA001 åbnes WTA650AA006 WTB650AA002 WTB652AA001 WTB651AA001 WTA600AA007 WTA601AA001
x x o o o x
Primærpumpe: Styres efter en afgangstemperatur på solvarmevekslerens sekundær-
side på 45°C (sætpunkt)
Sekundærpumpe: balanceret flow i forhold til primærpumpen.
Stopkri-
terie
Skift til lasttrin 0 når temperaturen på en valgfri føler i akkumuleringstanken kommer
under 50°C (sætpunkt) eller tidspunktet bliver efter kl. 8.00 og luk for NDA650AA001.
Side 17 af 24
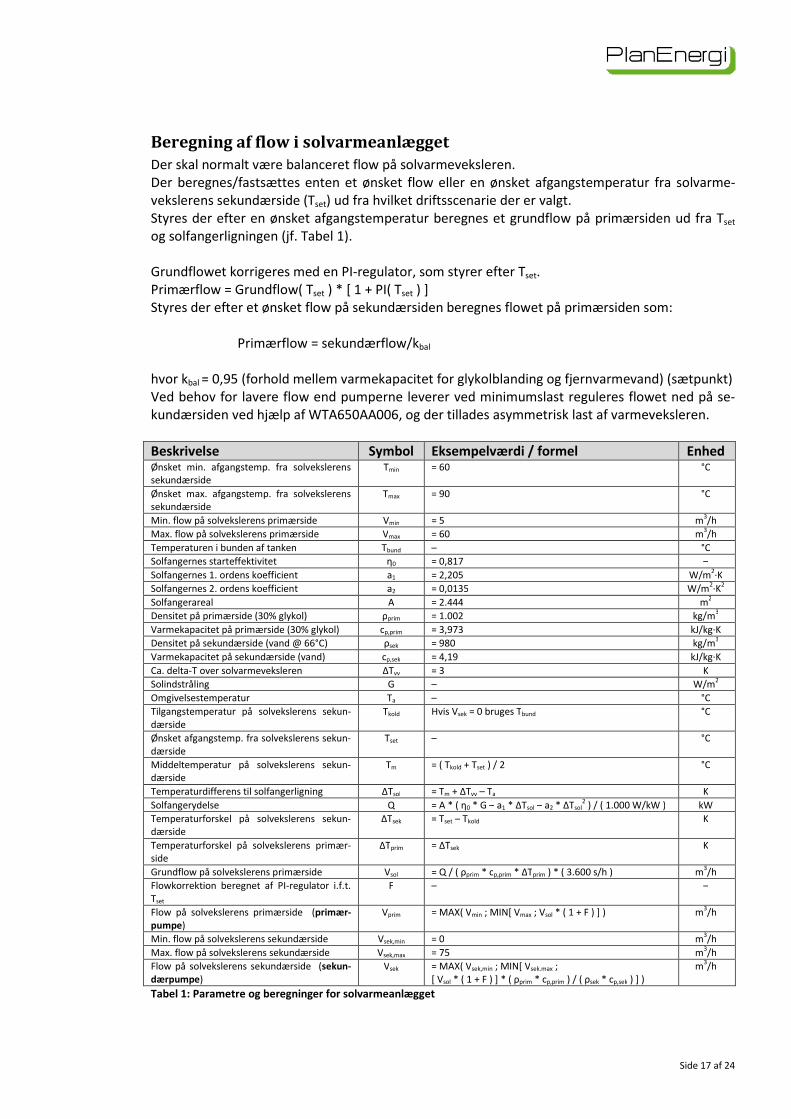
Beregning af flow i solvarmeanlægget
Der skal normalt være balanceret flow på solvarmeveksleren.
Der beregnes/fastsættes enten et ønsket flow eller en ønsket afgangstemperatur fra solvarme-
vekslerens sekundærside (Tset) ud fra hvilket driftsscenarie der er valgt.
Styres der efter en ønsket afgangstemperatur beregnes et grundflow på primærsiden ud fra Tset
og solfangerligningen (jf. Tabel 1).
Grundflowet korrigeres med en PI-regulator, som styrer efter Tset.
Primærflow = Grundflow( Tset ) * [ 1 + PI( Tset ) ]
Styres der efter et ønsket flow på sekundærsiden beregnes flowet på primærsiden som:
Primærflow = sekundærflow/kbal
hvor kbal = 0,95 (forhold mellem varmekapacitet for glykolblanding og fjernvarmevand) (sætpunkt)
Ved behov for lavere flow end pumperne leverer ved minimumslast reguleres flowet ned på se-
kundærsiden ved hjælp af WTA650AA006, og der tillades asymmetrisk last af varmeveksleren.
Beskrivelse Symbol Eksempelværdi / formel Enhed Ønsket min. afgangstemp. fra solvekslerens
sekundærside
Tmin = 60 °C
Ønsket max. afgangstemp. fra solvekslerens
sekundærside
Tmax = 90 °C
Min. flow på solvekslerens primærside Vmin = 5 m3/h
Max. flow på solvekslerens primærside Vmax = 60 m3/h
Temperaturen i bunden af tanken Tbund – °C
Solfangernes starteffektivitet η0 = 0,817 –
Solfangernes 1. ordens koefficient a1 = 2,205 W/m2∙K
Solfangernes 2. ordens koefficient a2 = 0,0135 W/m2∙K
2
Solfangerareal A = 2.444 m2
Densitet på primærside (30% glykol) ρprim = 1.002 kg/m3
Varmekapacitet på primærside (30% glykol) cp,prim = 3,973 kJ/kg∙K
Densitet på sekundærside (vand @ 66°C) ρsek = 980 kg/m3
Varmekapacitet på sekundærside (vand) cp,sek = 4,19 kJ/kg∙K
Ca. delta-T over solvarmeveksleren ΔTvv = 3 K
Solindstråling G – W/m2
Omgivelsestemperatur Ta – °C
Tilgangstemperatur på solvekslerens sekun-
dærside
Tkold Hvis Vsek = 0 bruges Tbund °C
Ønsket afgangstemp. fra solvekslerens sekun-
dærside
Tset – °C
Middeltemperatur på solvekslerens sekun-
dærside
Tm = ( Tkold + Tset ) / 2 °C
Temperaturdifferens til solfangerligning ΔTsol = Tm + ΔTvv – Ta K
Solfangerydelse Q = A * ( η0 * G – a1 * ΔTsol – a2 * ΔTsol2 ) / ( 1.000 W/kW ) kW
Temperaturforskel på solvekslerens sekun-
dærside
ΔTsek = Tset – Tkold K
Temperaturforskel på solvekslerens primær-
side
ΔTprim = ΔTsek K
Grundflow på solvekslerens primærside Vsol = Q / ( ρprim * cp,prim * ΔTprim ) * ( 3.600 s/h ) m3/h
Flowkorrektion beregnet af PI-regulator i.f.t.
Tset
F – –
Flow på solvekslerens primærside (primær-
pumpe)
Vprim = MAX( Vmin ; MIN[ Vmax ; Vsol * ( 1 + F ) ] ) m3/h
Min. flow på solvekslerens sekundærside Vsek,min = 0 m3/h
Max. flow på solvekslerens sekundærside Vsek,max = 75 m3/h
Flow på solvekslerens sekundærside (sekun-
dærpumpe)
Vsek = MAX( Vsek,min ; MIN[ Vsek.max ;
[ Vsol * ( 1 + F ) ] * ( ρprim * cp,prim ) / ( ρsek * cp,sek ) ] )
m3/h
Tabel 1: Parametre og beregninger for solvarmeanlægget
Side 18 af 24
Blow-off-tank
Blow-off-tanken er udstyret med en niveau-føler (GDL010CP001). Der defineres en alarm-grænse
for lavt niveau i tanken.
Overvågning af max. temperatur på solfangerne
Det skal af levetidsmæssige årsager så vidt muligt undgås at solvarmeanlægget koger (stagnerer).
Dette gøres ved at køre pumperne op hvis afgangstemperaturerne i solfeltet bliver for høje. Hvis
en af afgangstemperaturerne fra solfangerne overstiger 105°C, gives der en alarm og primær-
pumpen sættes til 100% last.
Hvis solvarmeanlægget alligevel kommer i kog, skal dampslag begrænses mest muligt.
Dette gøres ved at stoppe pumperne indtil kogningen er ophørt af sig selv.
1 time efter solnedgang startes følgende procedure:
1. Primærpumpen startes på min. flow og kører ½ time (sekundærpumpen startes ikke).
2. Glykol fra blow-off-tanken påfyldes primærkredsen ved manuel drift af fyldepumpen un-
der overvågning af trykket i primærkredsen.
3. Herefter kører primærpumpen en ½ time med max. flow.
4. Trykket i primærkredsen kontrolleres og glykol påfyldes til det korrekte tryk.
5. Solvarmeanlægget lukkes ned.
6. Glykolniveauet i blow off-tanken kontrolleres.
Sikkerhed mod høje tryk og temperaturer i solfeltet
Af sikkerhedsmæssige årsager skal det sikres at tryk og temperatur holdes under henholdsvis 10
bar og 110°C. Dette sikres på følgende måde:
Hvis trykket i primærkredsen stiger til 10 bar åbner sikkerhedsventilen GDL010AA003 og leder
glykol til blow-off-tanken. Stiger temperaturen til 110°C lukkes for ventilen WTA600AA002 og
sikkerhedstermostaten WTA600DT001 stopper primærpumpen. Ventilen WTA600AA002 lukkes
desuden automatisk ved strømsvigt.
Sikkerhed mod udslip af glykol
1. Der er installeret alarmtråde i alle nedgravede rør i primærkredsen.
I tilfælde af lækage i disse rør gives der alarm.
2. Trykket i primærkredsen (WTA600CP002, WTB600CP001 og WTB600CP003) overvåges.
Hvis et af trykkene i primærkredsen falder til under 1,8 bar (setpunkt), gives der alarm for
lavt tryk.
Hvis mindst to af trykkene falder til under 1,3 bar (setpunkt), gives der alarm for lavt-lavt
tryk.
Hvis mindst to af trykkene falder til under 0,2 bar (setpunkt) standses primærpumpen.
Side 19 af 24
7 Beregning af relevante driftsdata for rapportudtræk
Der skal kunne laves rapportudtræk for alle målte værdier på døgn-, uge-, måneds,- og årsbasis.
Derudover skal der beregnes følgende driftsdata, som ikke måles direkte for at inkludere disse i
rapportudtrækkene:
-Byens akkumulerede effekt.
-Kedlens akkumulerede effekt.
-Motorernes akkumulerede effekt.
-Solvarmens akkumulerede effekt.
-Varmepumpens akkumulerede effekt.
-Varmepumpens COP.
-Akkumuleret grundvandsflow fra boring 1
-Akkumuleret grundvandsflow fra boring 2
-Akkumuleret grundvandsflow fra grundvandstank
Side 20 af 24
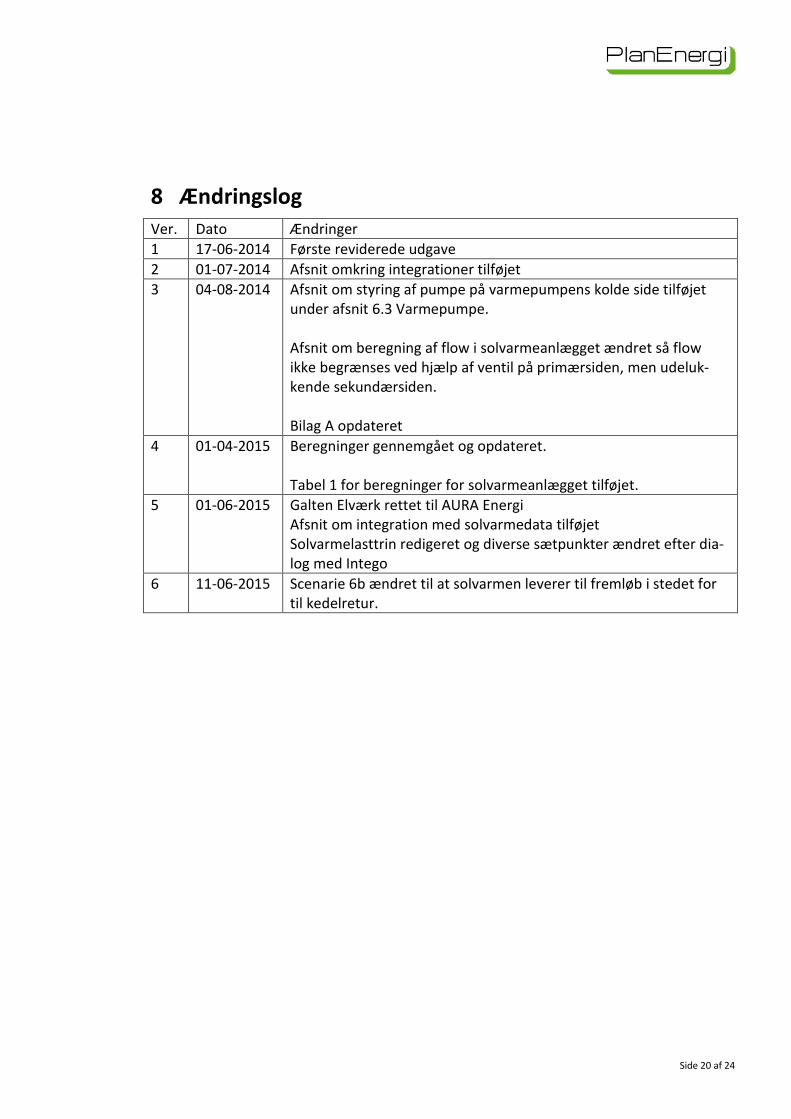
8 Ændringslog
Ver. Dato Ændringer
1 17-06-2014 Første reviderede udgave
2 01-07-2014 Afsnit omkring integrationer tilføjet
3 04-08-2014 Afsnit om styring af pumpe på varmepumpens kolde side tilføjet
under afsnit 6.3 Varmepumpe.
Afsnit om beregning af flow i solvarmeanlægget ændret så flow
ikke begrænses ved hjælp af ventil på primærsiden, men udeluk-
kende sekundærsiden.
Bilag A opdateret
4 01-04-2015 Beregninger gennemgået og opdateret.
Tabel 1 for beregninger for solvarmeanlægget tilføjet.
5 01-06-2015 Galten Elværk rettet til AURA Energi
Afsnit om integration med solvarmedata tilføjet
Solvarmelasttrin redigeret og diverse sætpunkter ændret efter dia-
log med Intego
6 11-06-2015 Scenarie 6b ændret til at solvarmen leverer til fremløb i stedet for
til kedelretur.
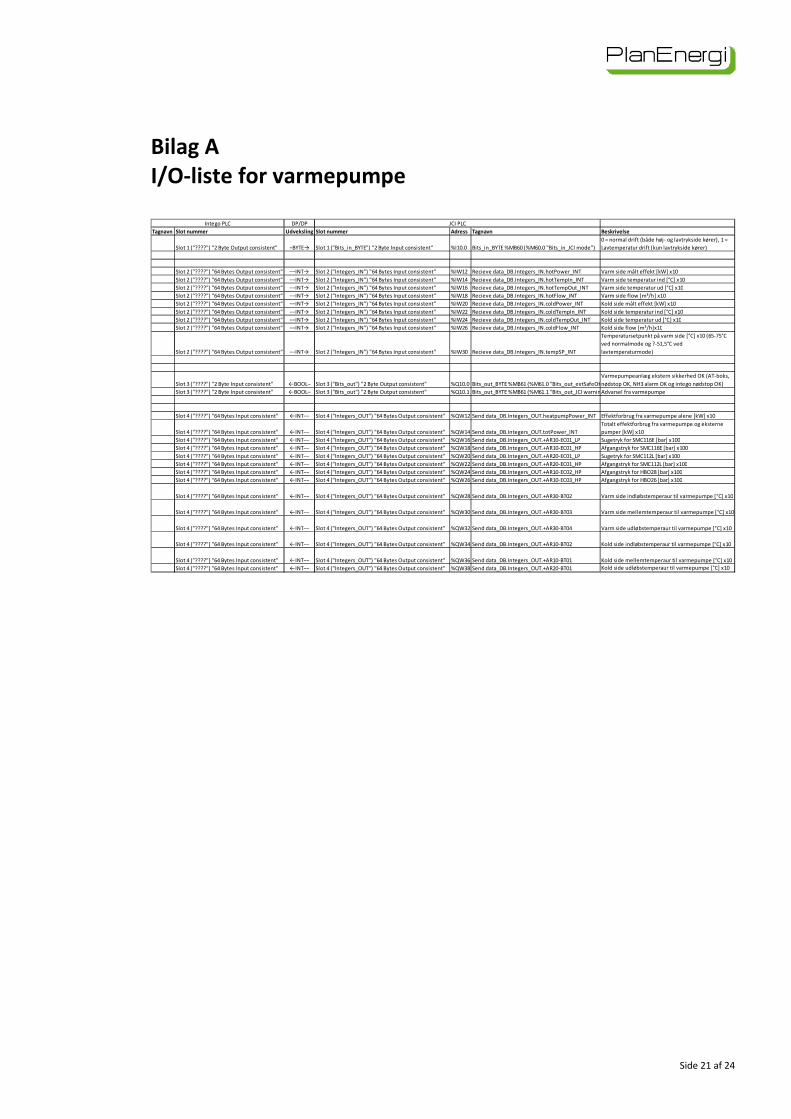
Side 21 af 24
Bilag A
I/O-liste for varmepumpe
DP/DP
Tagnavn Slot nummer Udveksling Slot nummer Adress Tagnavn Beskrivelse
Slot 1 ("????") "2 Byte Output consistent" −BYTE→ Slot 1 ("Bits_in_BYTE") "2 Byte Input consistent" %I10.0 Bits_in_BYTE %MB60 (%M60.0 "Bits_in_JCI mode")
0 = normal drift (både høj- og lavtrykside kører), 1 =
Lavtemperatur drift (kun lavtrykside kører)
Slot 2 ("????") "64 Bytes Output consistent" −−INT→ Slot 2 ("Integers_IN") "64 Bytes Input consistent" %IW12 Recieve data_DB.Integers_IN.hotPower_INT Varm side målt effekt [kW] x10
Slot 2 ("????") "64 Bytes Output consistent" −−INT→ Slot 2 ("Integers_IN") "64 Bytes Input consistent" %IW14 Recieve data_DB.Integers_IN.hotTempIn_INT Varm side temperatur ind [°C] x10
Slot 2 ("????") "64 Bytes Output consistent" −−INT→ Slot 2 ("Integers_IN") "64 Bytes Input consistent" %IW16 Recieve data_DB.Integers_IN.hotTempOut_INT Varm side temperatur ud [°C] x10
Slot 2 ("????") "64 Bytes Output consistent" −−INT→ Slot 2 ("Integers_IN") "64 Bytes Input consistent" %IW18 Recieve data_DB.Integers_IN.hotFlow_INT Varm side flow [m³/h] x10
Slot 2 ("????") "64 Bytes Output consistent" −−INT→ Slot 2 ("Integers_IN") "64 Bytes Input consistent" %IW20 Recieve data_DB.Integers_IN.coldPower_INT Kold side målt effekt [kW] x10
Slot 2 ("????") "64 Bytes Output consistent" −−INT→ Slot 2 ("Integers_IN") "64 Bytes Input consistent" %IW22 Recieve data_DB.Integers_IN.coldTempIn_INT Kold side temperatur ind [°C] x10
Slot 2 ("????") "64 Bytes Output consistent" −−INT→ Slot 2 ("Integers_IN") "64 Bytes Input consistent" %IW24 Recieve data_DB.Integers_IN.coldTempOut_INT Kold side temperatur ud [°C] x10
Slot 2 ("????") "64 Bytes Output consistent" −−INT→ Slot 2 ("Integers_IN") "64 Bytes Input consistent" %IW26 Recieve data_DB.Integers_IN.coldFlow_INT Kold side flow [m³/h]x10
Slot 2 ("????") "64 Bytes Output consistent" −−INT→ Slot 2 ("Integers_IN") "64 Bytes Input consistent" %IW30 Recieve data_DB.Integers_IN.tempSP_INT
Temperatursetpunkt på varm side [°C] x10 (65-75°C
ved normalmode og ?-51,5°C ved
lavtemperaturmode)
Slot 3 ("????") "2 Byte Input consistent" ←BOOL− Slot 3 ("Bits_out") "2 Byte Output consistent" %Q10.0 Bits_out_BYTE %MB61 (%M61.0 "Bits_out_extSafeOK")
Varmepumpeanlæg ekstern sikkerhed OK (AT-boks,
nødstop OK, NH3 alarm OK og intego nødstop OK)
Slot 3 ("????") "2 Byte Input consistent" ←BOOL− Slot 3 ("Bits_out") "2 Byte Output consistent" %Q10.1 Bits_out_BYTE %MB61 (%M61.1 "Bits_out_JCI warning")Advarsel fra varmepumpe
Slot 4 ("????") "64 Bytes Input consistent" ←INT−− Slot 4 ("Integers_OUT") "64 Bytes Output consistent" %QW12 Send data_DB.Integers_OUT.heatpumpPower_INT Effektforbrug fra varmepumpe alene [kW] x10
Slot 4 ("????") "64 Bytes Input consistent" ←INT−− Slot 4 ("Integers_OUT") "64 Bytes Output consistent" %QW14 Send data_DB.Integers_OUT.totPower_INT
Totalt effektforbrug fra varmepumpe og eksterne
pumper [kW] x10
Slot 4 ("????") "64 Bytes Input consistent" ←INT−− Slot 4 ("Integers_OUT") "64 Bytes Output consistent" %QW16 Send data_DB.Integers_OUT.+AR10-EC01_LP Sugetryk for SMC116E [bar] x100
Slot 4 ("????") "64 Bytes Input consistent" ←INT−− Slot 4 ("Integers_OUT") "64 Bytes Output consistent" %QW18 Send data_DB.Integers_OUT.+AR10-EC01_HP Afgangstryk for SMC116E [bar] x100
Slot 4 ("????") "64 Bytes Input consistent" ←INT−− Slot 4 ("Integers_OUT") "64 Bytes Output consistent" %QW20 Send data_DB.Integers_OUT.+AR20-EC01_LP Sugetryk for SMC112L [bar] x100
Slot 4 ("????") "64 Bytes Input consistent" ←INT−− Slot 4 ("Integers_OUT") "64 Bytes Output consistent" %QW22 Send data_DB.Integers_OUT.+AR20-EC01_HP Afgangstryk for SMC112L [bar] x100
Slot 4 ("????") "64 Bytes Input consistent" ←INT−− Slot 4 ("Integers_OUT") "64 Bytes Output consistent" %QW24 Send data_DB.Integers_OUT.+AR10-EC02_HP Afgangstryk for HBO28 [bar] x100
Slot 4 ("????") "64 Bytes Input consistent" ←INT−− Slot 4 ("Integers_OUT") "64 Bytes Output consistent" %QW26 Send data_DB.Integers_OUT.+AR10-EC03_HP Afgangstryk for HBO26 [bar] x100
Slot 4 ("????") "64 Bytes Input consistent" ←INT−− Slot 4 ("Integers_OUT") "64 Bytes Output consistent" %QW28 Send data_DB.Integers_OUT.+AR30-BT02 Varm side indløbstemperaur til varmepumpe [°C] x10
Slot 4 ("????") "64 Bytes Input consistent" ←INT−− Slot 4 ("Integers_OUT") "64 Bytes Output consistent" %QW30 Send data_DB.Integers_OUT.+AR30-BT03 Varm side mellemtemperaur til varmepumpe [°C] x10
Slot 4 ("????") "64 Bytes Input consistent" ←INT−− Slot 4 ("Integers_OUT") "64 Bytes Output consistent" %QW32 Send data_DB.Integers_OUT.+AR30-BT04 Varm side udløbstemperaur til varmepumpe [°C] x10
Slot 4 ("????") "64 Bytes Input consistent" ←INT−− Slot 4 ("Integers_OUT") "64 Bytes Output consistent" %QW34 Send data_DB.Integers_OUT.+AR10-BT02 Kold side indløbstemperaur til varmepumpe [°C] x10
Slot 4 ("????") "64 Bytes Input consistent" ←INT−− Slot 4 ("Integers_OUT") "64 Bytes Output consistent" %QW36 Send data_DB.Integers_OUT.+AR10-BT01 Kold side mellemtemperaur til varmepumpe [°C] x10
Slot 4 ("????") "64 Bytes Input consistent" ←INT−− Slot 4 ("Integers_OUT") "64 Bytes Output consistent" %QW38 Send data_DB.Integers_OUT.+AR20-BT01 Kold side udløbstemperaur til varmepumpe [°C] x10
JCI PLCIntego PLC
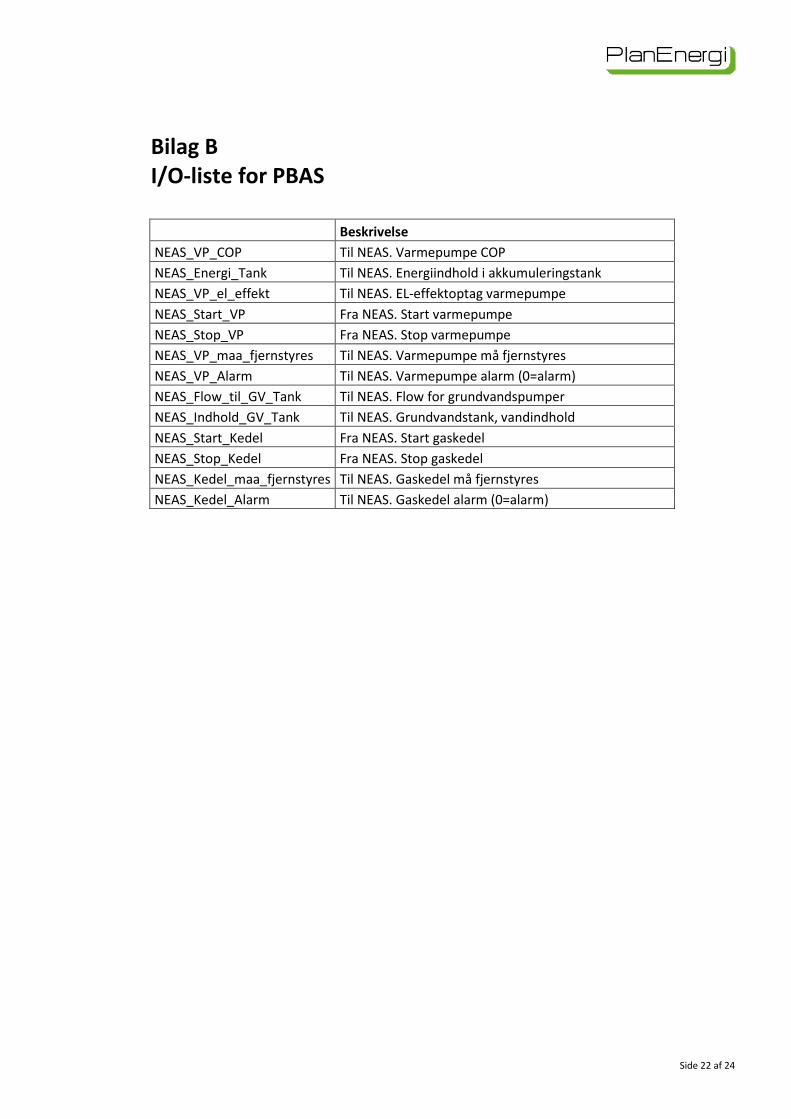
Side 22 af 24
Bilag B
I/O-liste for PBAS
Beskrivelse
NEAS_VP_COP Til NEAS. Varmepumpe COP
NEAS_Energi_Tank Til NEAS. Energiindhold i akkumuleringstank
NEAS_VP_el_effekt Til NEAS. EL-effektoptag varmepumpe
NEAS_Start_VP Fra NEAS. Start varmepumpe
NEAS_Stop_VP Fra NEAS. Stop varmepumpe
NEAS_VP_maa_fjernstyres Til NEAS. Varmepumpe må fjernstyres
NEAS_VP_Alarm Til NEAS. Varmepumpe alarm (0=alarm)
NEAS_Flow_til_GV_Tank Til NEAS. Flow for grundvandspumper
NEAS_Indhold_GV_Tank Til NEAS. Grundvandstank, vandindhold
NEAS_Start_Kedel Fra NEAS. Start gaskedel
NEAS_Stop_Kedel Fra NEAS. Stop gaskedel
NEAS_Kedel_maa_fjernstyres Til NEAS. Gaskedel må fjernstyres
NEAS_Kedel_Alarm Til NEAS. Gaskedel alarm (0=alarm)
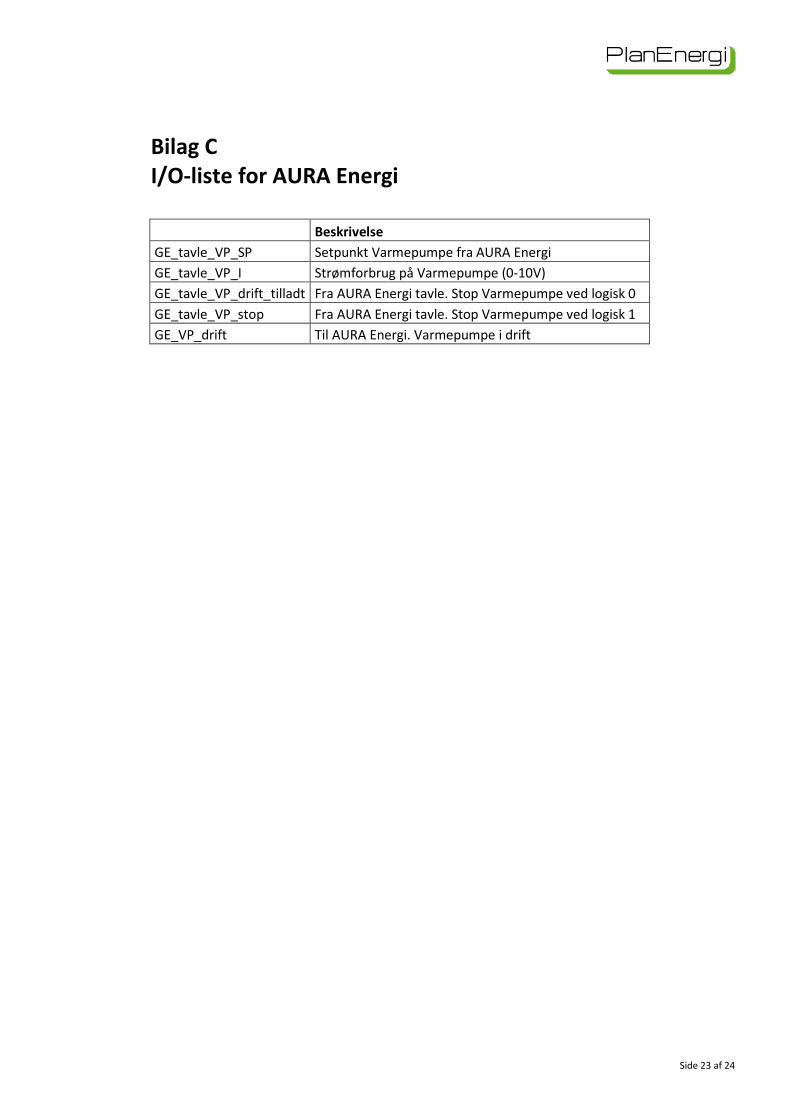
Side 23 af 24
Bilag C
I/O-liste for AURA Energi
Beskrivelse
GE_tavle_VP_SP Setpunkt Varmepumpe fra AURA Energi
GE_tavle_VP_I Strømforbrug på Varmepumpe (0-10V)
GE_tavle_VP_drift_tilladt Fra AURA Energi tavle. Stop Varmepumpe ved logisk 0
GE_tavle_VP_stop Fra AURA Energi tavle. Stop Varmepumpe ved logisk 1
GE_VP_drift Til AURA Energi. Varmepumpe i drift
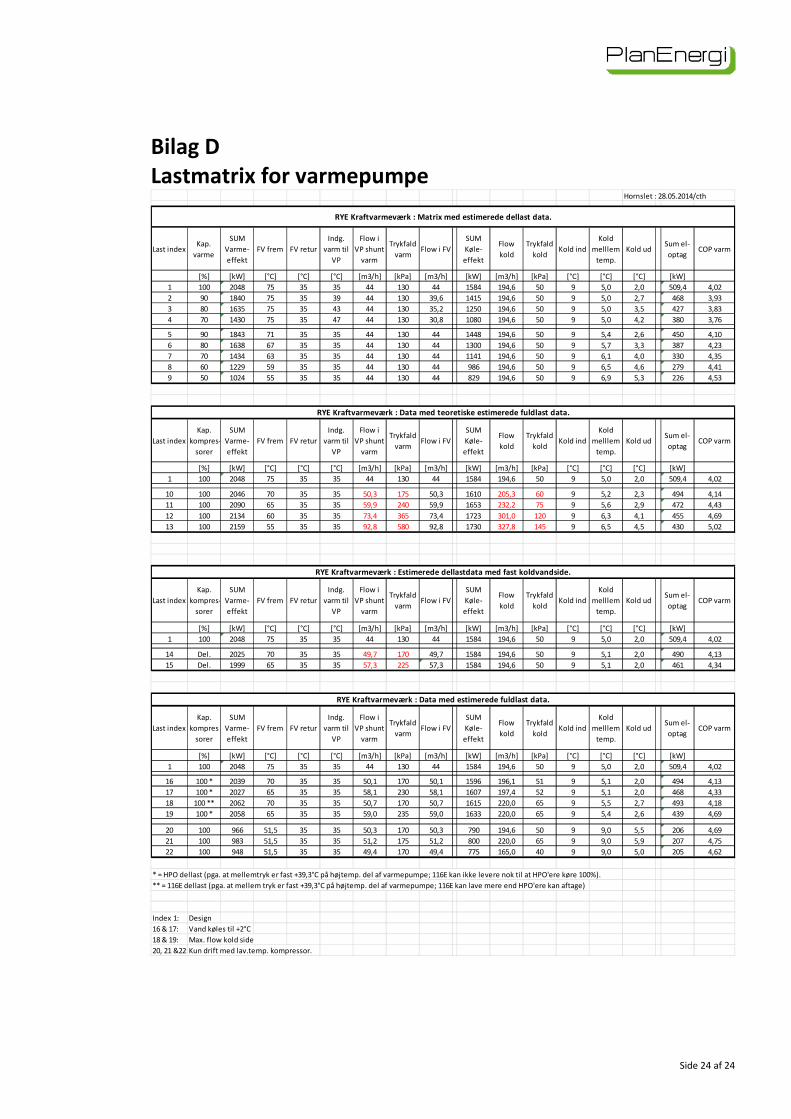
Side 24 af 24
Bilag D
Lastmatrix for varmepumpe
Hornslet : 28.05.2014/cth
Last indexKap.
varme
SUM
Varme-
effekt
FV frem FV retur
Indg.
varm til
VP
Flow i
VP shunt
varm
Trykfald
varmFlow i FV
SUM
Køle-
effekt
Flow
kold
Trykfald
koldKold ind
Kold
melllem
temp.
Kold udSum el-
optagCOP varm
[%] [kW] [°C] [°C] [°C] [m3/h] [kPa] [m3/h] [kW] [m3/h] [kPa] [°C] [°C] [°C] [kW]
1 100 2048 75 35 35 44 130 44 1584 194,6 50 9 5,0 2,0 509,4 4,02
2 90 1840 75 35 39 44 130 39,6 1415 194,6 50 9 5,0 2,7 468 3,93
3 80 1635 75 35 43 44 130 35,2 1250 194,6 50 9 5,0 3,5 427 3,83
4 70 1430 75 35 47 44 130 30,8 1080 194,6 50 9 5,0 4,2 380 3,76
5 90 1843 71 35 35 44 130 44 1448 194,6 50 9 5,4 2,6 450 4,10
6 80 1638 67 35 35 44 130 44 1300 194,6 50 9 5,7 3,3 387 4,23
7 70 1434 63 35 35 44 130 44 1141 194,6 50 9 6,1 4,0 330 4,35
8 60 1229 59 35 35 44 130 44 986 194,6 50 9 6,5 4,6 279 4,41
9 50 1024 55 35 35 44 130 44 829 194,6 50 9 6,9 5,3 226 4,53
Last index
Kap.
kompres-
sorer
SUM
Varme-
effekt
FV frem FV retur
Indg.
varm til
VP
Flow i
VP shunt
varm
Trykfald
varmFlow i FV
SUM
Køle-
effekt
Flow
kold
Trykfald
koldKold ind
Kold
melllem
temp.
Kold udSum el-
optagCOP varm
[%] [kW] [°C] [°C] [°C] [m3/h] [kPa] [m3/h] [kW] [m3/h] [kPa] [°C] [°C] [°C] [kW]
1 100 2048 75 35 35 44 130 44 1584 194,6 50 9 5,0 2,0 509,4 4,02
10 100 2046 70 35 35 50,3 175 50,3 1610 205,3 60 9 5,2 2,3 494 4,14
11 100 2090 65 35 35 59,9 240 59,9 1653 232,2 75 9 5,6 2,9 472 4,43
12 100 2134 60 35 35 73,4 365 73,4 1723 301,0 120 9 6,3 4,1 455 4,69
13 100 2159 55 35 35 92,8 580 92,8 1730 327,8 145 9 6,5 4,5 430 5,02
Last index
Kap.
kompres-
sorer
SUM
Varme-
effekt
FV frem FV retur
Indg.
varm til
VP
Flow i
VP shunt
varm
Trykfald
varmFlow i FV
SUM
Køle-
effekt
Flow
kold
Trykfald
koldKold ind
Kold
melllem
temp.
Kold udSum el-
optagCOP varm
[%] [kW] [°C] [°C] [°C] [m3/h] [kPa] [m3/h] [kW] [m3/h] [kPa] [°C] [°C] [°C] [kW]
1 100 2048 75 35 35 44 130 44 1584 194,6 50 9 5,0 2,0 509,4 4,02
14 Del. 2025 70 35 35 49,7 170 49,7 1584 194,6 50 9 5,1 2,0 490 4,13
15 Del. 1999 65 35 35 57,3 225 57,3 1584 194,6 50 9 5,1 2,0 461 4,34
Last index
Kap.
kompres
sorer
SUM
Varme-
effekt
FV frem FV retur
Indg.
varm til
VP
Flow i
VP shunt
varm
Trykfald
varmFlow i FV
SUM
Køle-
effekt
Flow
kold
Trykfald
koldKold ind
Kold
melllem
temp.
Kold udSum el-
optagCOP varm
[%] [kW] [°C] [°C] [°C] [m3/h] [kPa] [m3/h] [kW] [m3/h] [kPa] [°C] [°C] [°C] [kW]
1 100 2048 75 35 35 44 130 44 1584 194,6 50 9 5,0 2,0 509,4 4,02
16 100 * 2039 70 35 35 50,1 170 50,1 1596 196,1 51 9 5,1 2,0 494 4,13
17 100 * 2027 65 35 35 58,1 230 58,1 1607 197,4 52 9 5,1 2,0 468 4,33
18 100 ** 2062 70 35 35 50,7 170 50,7 1615 220,0 65 9 5,5 2,7 493 4,18
19 100 * 2058 65 35 35 59,0 235 59,0 1633 220,0 65 9 5,4 2,6 439 4,69
20 100 966 51,5 35 35 50,3 170 50,3 790 194,6 50 9 9,0 5,5 206 4,69
21 100 983 51,5 35 35 51,2 175 51,2 800 220,0 65 9 9,0 5,9 207 4,75
22 100 948 51,5 35 35 49,4 170 49,4 775 165,0 40 9 9,0 5,0 205 4,62
* = HPO dellast (pga. at mellemtryk er fast +39,3°C på højtemp. del af varmepumpe; 116E kan ikke levere nok til at HPO'ere køre 100%).
** = 116E dellast (pga. at mellem tryk er fast +39,3°C på højtemp. del af varmepumpe; 116E kan lave mere end HPO'ere kan aftage)
Index 1: Design
16 & 17: Vand køles til +2°C
18 & 19: Max. flow kold side
20, 21 &22:Kun drift med lav.temp. kompressor.
RYE Kraftvarmeværk : Matrix med estimerede dellast data.
RYE Kraftvarmeværk : Data med teoretiske estimerede fuldlast data.
RYE Kraftvarmeværk : Estimerede dellastdata med fast koldvandside.
RYE Kraftvarmeværk : Data med estimerede fuldlast data.