Embed Size (px)
Citation preview
FINAL REPORT FOR PUBLICATION
FULMEN
Contract n°AI-95-SC.204
Project co-ordinator :
AEROSPATIALE MATRA CCR
Partners :
AEA TECHNOLOGY
BRITISH AEROSPACE
CEAT
DAIMLERCHRYSLER DORNIER
ERICSSON SAAB AVIONICS
EUROCOPTER
ONERA
Project duration : 01/01/96 to 30/09/99
Date : 03/12/02
PROJECT FUNDED BY THE EUROPEAN COMMISSION UNDER THE TRANSPORT RTD PROGRAMME OF THE 4TH FRAMEWORK PROGRAMME
2
Table of contents I. PARTNERSHIP .............................................................................................................................. 3
II. EXECUTIVE SUMMARY................................................................................................................ 4
III. OBJECTIVES OF THE PROJECT............................................................................................... 12
IV. MEANS USED TO ACHIEVED THE OBJECTIVES................................................................ 14
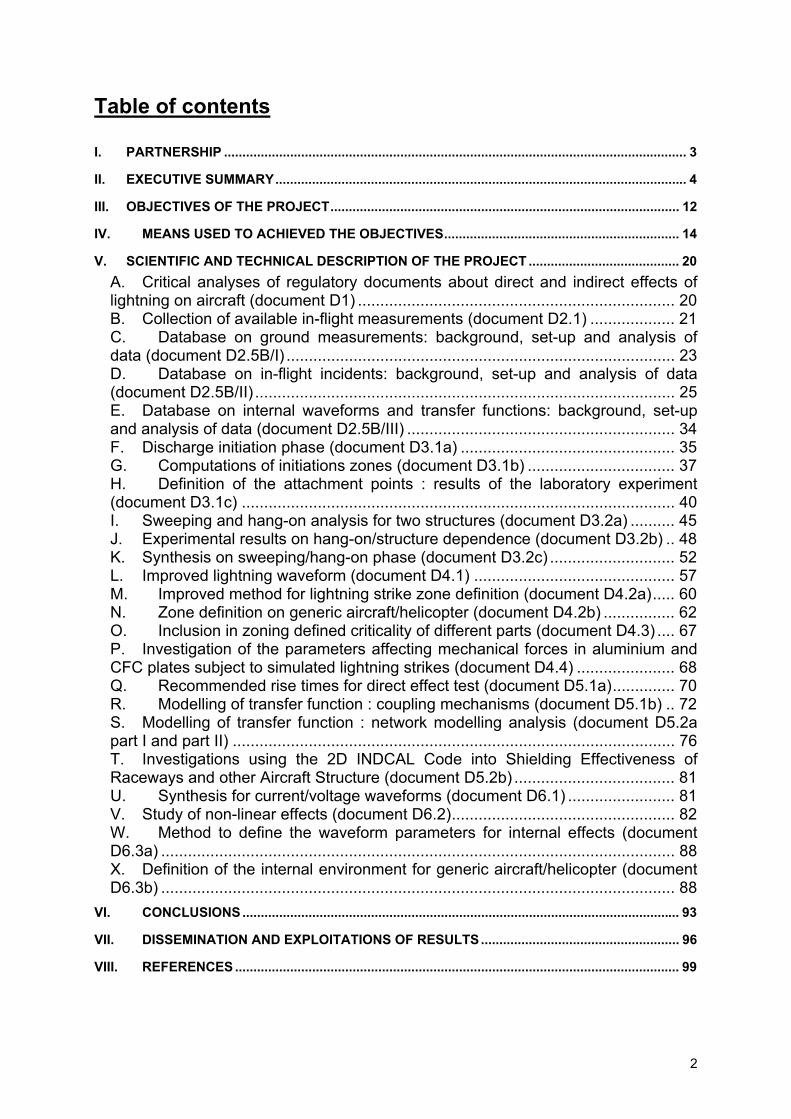
V. SCIENTIFIC AND TECHNICAL DESCRIPTION OF THE PROJECT ......................................... 20 A. Critical analyses of regulatory documents about direct and indirect effects of lightning on aircraft (document D1) ....................................................................... 20 B. Collection of available in-flight measurements (document D2.1) ................... 21 C. Database on ground measurements: background, set-up and analysis of data (document D2.5B/I) ....................................................................................... 23 D. Database on in-flight incidents: background, set-up and analysis of data (document D2.5B/II) .............................................................................................. 25 E. Database on internal waveforms and transfer functions: background, set-up and analysis of data (document D2.5B/III) ............................................................ 34 F. Discharge initiation phase (document D3.1a) ................................................ 35 G. Computations of initiations zones (document D3.1b) ................................. 37 H. Definition of the attachment points : results of the laboratory experiment (document D3.1c) ................................................................................................. 40 I. Sweeping and hang-on analysis for two structures (document D3.2a) .......... 45 J. Experimental results on hang-on/structure dependence (document D3.2b) .. 48 K. Synthesis on sweeping/hang-on phase (document D3.2c) ............................ 52 L. Improved lightning waveform (document D4.1) ............................................. 57 M. Improved method for lightning strike zone definition (document D4.2a)..... 60 N. Zone definition on generic aircraft/helicopter (document D4.2b) ................ 62 O. Inclusion in zoning defined criticality of different parts (document D4.3) .... 67 P. Investigation of the parameters affecting mechanical forces in aluminium and CFC plates subject to simulated lightning strikes (document D4.4) ...................... 68 Q. Recommended rise times for direct effect test (document D5.1a).............. 70 R. Modelling of transfer function : coupling mechanisms (document D5.1b) .. 72 S. Modelling of transfer function : network modelling analysis (document D5.2a part I and part II) ................................................................................................... 76 T. Investigations using the 2D INDCAL Code into Shielding Effectiveness of Raceways and other Aircraft Structure (document D5.2b) .................................... 81 U. Synthesis for current/voltage waveforms (document D6.1) ........................ 81 V. Study of non-linear effects (document D6.2).................................................. 82 W. Method to define the waveform parameters for internal effects (document D6.3a) ................................................................................................................... 88 X. Definition of the internal environment for generic aircraft/helicopter (document D6.3b) ................................................................................................................... 88
VI. CONCLUSIONS....................................................................................................................... 93
VII. DISSEMINATION AND EXPLOITATIONS OF RESULTS...................................................... 96
VIII. REFERENCES ......................................................................................................................... 99
3
I. Partnership
FULMEN PARTNERS ADDRESS Mr. Pascal GONDOT Project Director
AEROSPATIALE MATRA Corporate Research Center DCR / BC 12, rue Pasteur B.P. 76 F-92152 Suresnes Cedex - France
Mr. Franck UHLIG Project Technical Director
Mr. Marc VIRET Project Financial Officer
Mr. John HARDWICK AEA Technology Lightning Test & Technology D1 Culham Abingdon, Oxfordshire, 0X14 3DB - United Kingdom
Mr. Alan POUT BRITISH AEROSPACE Airbus Engineering Dept B82, D3 Technical Center – Filton Bristol BS99 7AR - United Kingdom
Mr. Chris JONES BRITISH AEROSPACE MAD EW 8 Stealth Facilities Dept (W7G) Warton - Preston, LANCS PR4 1AX - United Kingdom
Mr. Alain ULMANN CEAT 23, Avenue H. Guillaumet F-31056 Toulouse cedex, France
Mr. Helmut ZAGLAUER DORNIER GmbH Abteilung FT4 / TS D-88039 Friedrichshafen, Germany
Mr. Bernard TAGLIANA EUROCOPTER E / T.EA F-13725 Marignane, France
Mr. Pierre LAROCHE ONERA Department DMPH 29, Avenue de la Division Leclerc BP 72 F-92322 Châtillon, France
Mr. Ulf THIBBLIN Ericsson Saab Avionics AB (ESB) EM Technology Div. (EMT) S-58188 Linköping, Sweden
4
II. Executive summary Lightning may damage the structure of an aircraft at the different phases of its development: initiation, sweeping, hang-on to certain discontinuities (fasteners, joints etc.). The external threat is not the same for the various parts of an aircraft. This is expressed by defining several surface zones which have a different degree of exposure to the external lightning threat. The location and dimensioning of these zones, or "zoning", depend on the physical mechanisms whereby a leader develops and then progresses at the surface of the structure. These parameters include the geometry of the aircraft, the nature of the materials as well as operational conditions like speed, altitude, orientation, etc. The lightning aircraft interaction will depend on the type of lightning strike: release of an inter-cloud discharge, interception of a cloud-to-ground discharge, etc. Yet, current regulations do not fully take into account these different possibilities. A thorough understanding of all recent data and a modelling of the physics behind these phenomena is essential to develop satisfactory zoning methods. The AC 20-53A is based on the assumption that the lightning strike initial mechanism for an aircraft is the encounter of the airframe with a natural cloud-to-ground discharge. The recent data on the phenomenology of lightning and its interaction with aircraft have shown that reality may be very different, in the sense that the lightning is triggered by the aircraft. This may explain why AC 20-53A does not provide, in a sufficiently precise way, for all impact scenarios and their consequences. It may be feared that more recent recommendations to delimit aircraft lightning zones are, for similar reasons, just as unrealistic as regards the physical phenomena involved and do not help to describe, as much as would be desirable, the vulnerability of aircraft to the direct effects of lightning. Starting indeed from the same initial hypothesis, it thereafter introduces the notion of leader sweeping in order to determine the enlargement of zone 1A. To do this, it uses a simplifying assumption which consists in equating the leader sweeping speed along the structure with the speed of the aircraft. The duration of this sweeping action at the leader stage is equal to the time required to obtain the first high current pulse returning from the ground (return stroke corresponding to component A of lightning flash). This means a considerable enlargement of zone 1A, where the return stroke (200 kA) may damage the structure. In addition, zone 2A corresponds to the sweeping of the lightning channel at the arc phase . Such a simplistic scenario does not always agree with in-flight lightning strike data or with information on the phenomenology of lightning/aircraft interactions. The reason for this is that sweeping is in fact a complex phenomenon which is liable to combine with hang-on phenomena and which results from the speed (relative to the structure) of neutral and ionised particles of the lightning channel and the speed developed as a result of the other involved forces. It is also noted (by the European technical experts) that there are deficiencies in other aspects of AC20-53 A relating to the fuels ignition hazards and to the testing techniques for them, which are liable to penalise European manufacturers using composite structures. These deficiencies will also be noted in this review but no work on optimising testing techniques will be made during the Fulmen project; they may be
5
addressed in a different programme. The partners are well aware of them and will keep an eye on developments in this area. For internal threat too, present regulations rely on inadequate scientific basis. The current sharing in various paths through the airframe structure produces, inside the structure, induced electromagnetic effects on the various equipment and cables. These internal effects depend on such parameters as airframe structure and openings, equipment or cable position, geometry and materials ... and of course of the characteristics of the external threat. Manufacturers use "transfer functions" to define the relation between the external lightning current and the induced current at the equipment level. These transfer functions are fixed by each company on semi-empirical considerations which would benefit from a more comprehensive analysis. External and internal threats models, which must be validated against real data, have to be developed to represent the global effect on the different sub-units (3D modelling) and the more detailed effect on the individual conductors within each cable (network modelling). Such models, built on scientific considerations, and statistical analysis, give a mean to put figures on limit parameters to be proposed for a given safety level. The AC20-136 defines both external and internal threat waveforms for simulated lightning tests. The AC took account of results from the US and French in-flight programmes and therefore, unlike AC20-53A, takes account of some aspects of the threat posed by aircraft triggered lightning, as well as the threat posed by large return stroke currents which have been defined from observations of cloud-to-ground strikes. Nevertheless there are still many insufficiently well defined aspects of the threat corresponding to internal environments. These are listed as follows: • During the initial phase of a lightning attachment, the triggering processes can
initiate bursts of current pulses. Although these are at a relatively low level, the fact that the pulses are very rapidly repeated means that they are more likely to disrupt computer systems (Multiple Burst effect). While the external Multiple Burst waveform is defined, the test levels appropriate to the internal environment are not, this has lead to quite arbitrary test levels being defined for different manufacturers.
• The component A and D waveforms representing first and subsequent return strokes are defined as double exponentials, consequently their second derivative is infinite, leading to difficulties in extrapolation between measurement and threat when d²I/dt² coupling is important (circuits with capacitance).
• During the attachment phase, in-flight measurements have shown that there are large excursions in (changes to) the surface electric field of the aircraft; the dE/dt associated with these changes can couple to internal wiring through apertures, and could be important for high impedance circuits. Present standards totally neglect this effect.
• The waveforms and levels for the internal environment noted in ED14 Section 22 (June 1992) are a considerable improvement on previous standards but still have some shortcomings. The source impedance, levels and waveshapes are not sufficiently representative of what will happen in flight. In particular pin tests source impedances could adversely affect protection requirements, and the lack of definition of the long waveform (Waveform 5) leads to quite different test results depending on the detail of the generator.
• The test levels for damped sinewave testing and their importance is an open field. The relative importance of forced response of wiring due to airframe resonance
6
and resonant response of wiring is not clear and there has been much controversy on the need or otherwise of testing at multiple frequencies.
So the Fulmen project is divided into 6 workpackages in order to answer to the different points developed upward :
WP1 : Critical Analysis of regulatory documents
External environment • to review past and current zoning rules, their implementation and the resulting
zone definition. • to give a summary of the inaccuracies of, and deficiencies in, current documents
(AC 20-53A, AC 20-53B, etc.) covering not only the thinking behind the definition of lightning strike zones but also the phenomenology of lightning/aircraft interaction on which such thinking is based.
• to bring out the relation between the occurrence of some observed incidents and the used zone definition. It will also show which type of limitation present regulation brings with new composite materials.
Internal environment • to identify with the help of most recent knowledge, the limits of current documents
(AC20-136, ED14, EUROCAE environment documents, etc.) in addressing the external and consequent internal threats presented by all the real phenomena of a lightning attachment to aircraft avionics/electrical systems. The environment resulting from the latest understanding of attachment phenomena should be considered as well as the resulting internal environment in airframes which consist largely of composite material. In particular, the following points should be considered: − representativity of the different classes of aircraft ("highly conductive structure",
"poorly conductive structure") and of the different injected levels − conformity of the different waveforms proposed with manufacturers experience
and scientific knowledge. • to consider from collecting data on recent measurements or incidents, how the
limitations of these documents could affect the deduced susceptibility of modern avionics systems to the internal threat.
WP2 : Collection and analysis of available data on in-flight and ground measurements, of in-flight incidents and on manufacturer transfer functions
• In-flight measurement: Analysis of the data available from in-flight and rocket measurements. This analysis should provide in-sight on the characteristics of the lightning threat and the possible scenarios of lightning / aircraft interaction.
• Ground measurement: to collect selected data observed since Berger ground measurements and scattered in world data banks. In addition. there have been several rocket triggered lightning experiments performed over the past few years. Data have been gathered which could be used for the present study.
7
• In-flight incidents − Collection of available data on lightning strikes observed on the fleet currently
used from the most comprehensive data basis as possible: AIRBUS, ATR, EUROCOPTER, DGAC, FAA, ICAO, etc.
− Analysis of these pieces of information (circumstances of lightning strikes, damage zones, etc.) to set up a composite image presenting the major features from them. including statistical evaluation.
• Manufacturer transfer functions − To collect transfer functions known or used by the consortium manufacturers. − To identify the relevant structural and installation parameters which affect
them. To try to define classes of transfer functions, corresponding to different sets of significant parameters.
• Available data synthesis − To generate a database containing the most relevant data collected in the
three previous sub-tasks. This database should include: significant parameters of the in-flight measurements, noteworthy in-flight incidents, which induced significant damages,
The database will be implemented on a computer and made available on a standard numerical media (data + accessing software) like CD.
− To obtain a coherent view from the different data collective tasks, in particular: are the in-flight incidents (location, level of damages,...) consistent with in-flight and ground measurements ?
WP3 : Analysis of lightning/aircraft interaction to get a better representation of the way lightning interacts with the aircraft
• Discharge initiation phase: − Choice of a typical atmospheric configuration − Published data on E-field measurement will be analysed
to eliminate some unrealistic field configurations to choose a few number of typical configurations to be used in the
modelling.
• Determination of airframe polarisability − Definition of geometric models of aircraft (typically, high capacity aircraft of the
AIRBUS type) and helicopters. − Conversion of these geometric models into appropriate mesh files. − Computation of the initial electric field distribution with Integral Equation
Method and Charge Simulation Technique. Work performed in parallel by 2 partners. One partner using the boundary finite element method and the other one the integral equation method.
8
− Comparison of the results to assess the variability of the initial conditions and their influence on the discharge development.
Investigation made on :
• reliability • dependence of precision on the discretisation of the structure; this point is
crucial, especially for the large curvature zones, which are major contributors to the E-field, and have to be very finely meshed.
• Computer resources (speed and memory are required).
• Simulation of a discharge development Favourable conditions for Corona effect appearance, then a streamer formation and from it a leader propagation, are only reached on certain airframe points which have to be identified. This will be achieved by simulating the development of a precursor in the E-fields environment computed on generic aircraft, from the selected configuration. significant set of a few parameters, governing the initiation, to be found. Parameters to be linked together, at the onset of initiation, by some relationship of this kind: F(PI, P9, ...) = 0 This function, which represents the macroscopic criterion for propagation, is one of the output of this task, together with the description of the discharge development. An analytical approximation will be given.
WP4 : Definition of external environment To set up a general comprehension of lightning strike mechanism which is consistent with recent observations and present state of physics in view to support possible improvement of current standards
• Improved lightning wave forms − Parameter refining of the well-known current wave form with its four
components A, B, C and D (peak amplitude, rate of rise, time duration, etc.) with the help of most recent data
− To establish the actual intensity thresholds at the level of the aircraft in a more rigorous way, on the basis of its operational conditions of use by including the effects of dissipation (filtering, attenuation) of the current along the lightning channels,.
• Definition of lightning strike zones − To propose a method to define zones on an aircraft or helicopter. − To define these zones for generic aircraft and helicopter using the developed
method.
• Evaluation of lightning strike risk General description of the weighting of the zoning with the criticality analysis.
9
• Specification of rise-time − A pilot study has already developed techniques for measuring stress using
both electrical transducers and optical means. This is among the techniques used in the following programme:
− to determine the relative contributions made by acoustic shock, magnetic shock and stress waves to the mechanical damage sustained by panels.
− To use a fast framing camera to observe stress waves in a polymethylmethacrylate (PMMA) block mounted on the rear of the panel under test. The block will also be fitted with embedded stress gauges.
− To study the effect on the stress waves and on the mechanical damage to materials by varying the shape of the applied current waveform
WP5 : Modelling of transfer function To define transfer function coherent with observations and useable for WP6
• Coupling mechanisms − To use of 3 D modelling to carry out parametric studies of representative
aircraft and helicopters. Parameters to be considered should be: lightning entry and exit points. structural characteristics: size. materials (metal/composite), openings, system characteristics: position of equipment, routing of cables, shielded /
non shielded cables, ... use of 2D analysis as a complement to the more rigorous 3D analysis for
some of the installations. − For each configuration, transfer functions will be computed and the important
parameters which modify the transfer functions will be identified. − To determine through both modelling and measurement appropriate transfer
functions for coupling to wiring through dE/dt and d²I/dt² effects and including the effect of resonances.
• Network modelling analysis − To use of network modelling to carry out parametric studies of representative
aircraft and helicopter systems. Parameters to be considered should be: the position and impedance of terminal equipment, the natures of cables: coaxial, pairs, twisted/not twisted, shielded/non
shielded, ... For each configuration, transfer functions will be computed.
− To study the effect of cable bundle self-shielding and of the terminating impedances, on screened and unscreened wires.
− From the result of the transfer functions: To identify the important parameters which modify the transfer functions,
10
To compute internal waveforms for the different waveforms used for the external threat, including start pulses (multiple bursts).
WP6 : Definition of the internal environment To determine the maximal values of the waveform that are to be considered for indirect effects protection.
• Generic transfer functions − To synthesise current/voltage waveforms to be used in regulatory documents: − To compare the experimental results with the modelling results in order to
mutually validate computations and experiments, − To identify, for a given set of structural and equipment parameters, generic
transfer functions which can be considered as a majoring of what would be obtained in reality.
• Evaluation of non-linear effects − Test of representative objects with increasing values of currents and voltages
in order to identify possible deviation from linear behaviour. − Critical analysis, supported by experimental results, of the above transfer
functions in view to bring out non linear-effects influence and improve the models. Experiments indicate indeed, that, for high levels of injected currents, over voltage between different elements of the structure may induce sparking and non linear effects, the importance of which has to be assessed and verified.
• Internal lightning waveforms − By applying the improved transfer functions to the improved lightning
waveform, to deduce the maximal values of the waveform that are to be considered for indirect effects protection.
11
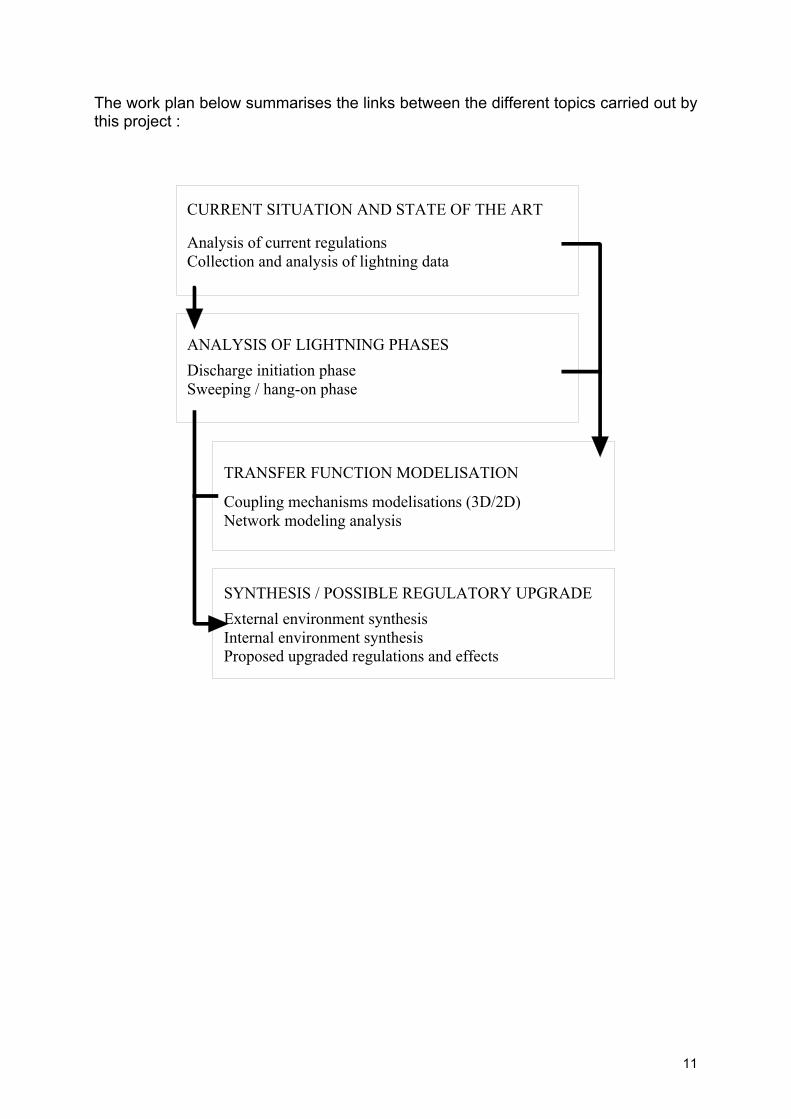
The work plan below summarises the links between the different topics carried out by this project :
CURRENT SITUATION AND STATE OF THE ART
ANALYSIS OF LIGHTNING PHASES
TRANSFER FUNCTION MODELISATION
Analysis of current regulationsCollection and analysis of lightning data
Discharge initiation phaseSweeping / hang-on phase
Coupling mechanisms modelisations (3D/2D)Network modeling analysis
SYNTHESIS / POSSIBLE REGULATORY UPGRADEExternal environment synthesisInternal environment synthesisProposed upgraded regulations and effects
12
III. Objectives of the project Lightning is one of the natural threats that have to be considered for safety reasons in the design and the certification of an aircraft. It is a frequent phenomenon: each aircraft is struck on the average once a year. The threat is even more serious for helicopters which have to fly with all-weather conditions and at low altitude where the lightning threat is highest. Lightning strikes can lead to incidents, sometimes to accidents. For instance, the French Civil Aircraft Authorities (DGAC) reported 484 incidents between 1978 and 1991. Lightning can induce two kinds of effects:
− direct effects (thermo-mechanical effects), which cause damage to the materials of the airframe and may lead to catastrophic effects like explosions of fuel tanks,
− indirect effects (electromagnetic effects), which induce interferences on on-board electronic systems, leading to disruption of computer control systems or even damage to electronic components.
These problems will become more and more important in the future: − the probability for an airliner to be struck by lightning increases and will continue
to increase in the future as, due to a constant growing of the air traffic, airliners are to stay for longer periods (for instance waiting for landing) at low altitudes where lightning strike probability is higher; in addition, the use of aircraft in adverse weather conditions is promoted by instrumentation developments,
− the new composite materials (carbon fibre, etc....) used for recent and future generations of airframes are damaged much more easily than usual aluminium alloys; fuel tanks are more sensitive to the explosion risk; in addition, these materials poorly protect on-board electronics against indirect effects,
− the new electronically controlled technologies and equipment, which are more and more used on board to perform functions critical for safety (fly-by-wire, engine control, ...), are potentially more susceptible to lightning.
Present regulatory framework for lightning-strike certification of aircraft tends to originate from the United States and have been established from observations and considerations which are up to 20 years old (AC 20 53A). They rely on a crude knowledge of lightning phenomena. They give a sufficient protection for aircraft metallic structures but a number of incidents are calling into question the validity of the models which were used to establish them. This suggests that an unresolved risk to flight safety still exists. To face this undetermined risk, companies are then obliged to employ significant safety margins which prevent them from taking full advantage of less expensive and lighter solutions offered by new composite materials and on board electronic control technologies. It is a matter of unanimity among aeronautical administrations that the regulations in force need to be updated. Expert groups are currently actively working on improvements of the regulations. A few years ago, a draft AC 20 53B which was supposed to remedy the deficiencies of version A was circulated among US and European experts groups. This draft was not accepted by several European and US aircraft manufacturers and EUROCAE undertook the work of proposing a new draft. A first version has been completed at the end of 1994, and it has been very recently sent for discussion to SAE-AE4L. During the elaboration of this document, it was
13
realised that there were still deep deficiencies in the knowledge of lightning/aircraft interaction and that research would be necessary to improve the scientific basis of the document. In addition, European administrations have a distinctive and specific motivation as their industries have. in fact. the lead on these new materials and on electronic flight control systems: their position. during the discussions with the US groups, will be considerably strengthened by the results of FULMEN. So, the project FULMEN aims to provide the European aeronautical administration, in particular the Joint Aviation authorities (J.A.A.) with
• New methods for defining the lightning threat for each specific new aircraft or helicopter programmes,
• A more realistic and quantitative evaluation of the threat levels to be sustained by structure or equipment.
These elements will help Europe in taking initiative in the regulation design work rather than following rules initiated and established by the USA. Four main steps which correspond to four specific objectives are planned :
• Critical analysis of present regulations
• Collection of field lightning data available in Europe (or elsewhere) relating to in-flight measurements, civil and military flight incidents, general lightning strike observations and manufacturer experiments
• Analysis and physical study of lightning/aircraft interaction to get a better representation of lightning (more representative lightning waveforms) and of the way it interacts with the aircraft : At the airframe level (“external threat”) : deepened knowledge of the different
phases of the strike (discharge initiation, sweeping phase and hang-on phases) and of their dependence on structural parameters, geometry, speed, orientation, etc…, redefinition of lightning strike zones and associated probabilities of occurrence, At the equipment level (“internal threat”) on representative systems,
− 3D modelling (general coupling mechanisms, influence of entry and exit points, of the structural characteristics, etc…)
− formulation of transfer functions between external and internal threats, − network modelling analysis (influence of installation factors like position, shielding
of cables, distribution of induced currents on individual wires,…).
• Global synthesis that will be proposed to the European organisations on the basis of an improved representation of lightning, including new definitions of the external threat, zoning and test waveforms, and corresponding upgraded regulation requirements, supported by a good statistical correlation with observed measurements or incidents
14
IV. Means used to achieved the objectives The Consortium of Fulmen project is composed of 8 partners, each of them being well recognised by the international scientific and aeronautical community in regards with the fields of lightning and other associated electromagnetic effects. The different paragraphs of this section, below, will describe rapidly each partner of this consortium.
Aeropatiale Matra CCR The GIE AEROSPATIALE MATRA CCR is a “Groupement d’Intérêt Economique (G.I.E.1)”, formed between AEROSPATIALE MATRA and its main subsidiaries: AEROSPATIALE MATRA AIRBUS, AEROSPATIALE MATRA MISSILES and AEROSPATIALE MATRA LANCEURS (Launchers). The objective assigned to the GIE AEROSPATIALE MATRA CCR is to carry out, to the benefit of its members, research activities which require a concentration of skills or equipment, or which correspond to a generic interest for the AEROSPATIALE MATRA Group. In this objective, the main activities of the GIE AEROSPATIALE MATRA CCR are technological research, evaluation and development of processes, methodologies, design and simulation tools in the following technical fields:
• Materials • Structures • Manufacturing processes • Non Destructive Investigations • Surface treatment processes • Environment • Computer Integrated Manufacturing • Information Technologies • Documentation Engineering • Lightning protection • Electromagnetic compatibility • Electronics and opto-electronics • Optics and lasers • High Performance Scientific Calculations
The GIE AEROSPATIALE MATRA CCR has a permanent staff of 250 people, 60% of which are senior scientists. Thanks to its rich and high technology equipment and expert personnel the GIE AEROSPATIALE MATRA CCR can study every problem arising at the design,
1 A G.I.E. is a legal entity governed by the decision n° 67-821, dated on September 23rd, 1967, modified by the French laws n° 84-148, dated on March 1st, 1984, n° 85-698, dated on July 11th, 1985, n° 88-15, dated on January 5th, 1988, and n° 89-377, dated on June 13th, 1989. According to its statutes, the members of the GIE AEROSPATIALE CCR have access to the results, and are given a right of free exploitation of, the research carried out in the framework of its Research Mid Term Plan.
15
manufacturing or use phases of the life cycle of AEROSPATIALE products (aircraft, helicopters, space launchers, missiles, electronic equipment, …). The EMC and Lightning group have extensive experience in EMC and especially in electromagnetic modelling in applications such as indirect effects of lightning, EMC, EMI for AIRBUS, EUROCOPTER, ARIANE products. This team currently uses a wide range of electromagnetic software like BEM (Boundary Element), FDTD (Finite difference in time domain), asymptotic methods (UTD/GTD), electrical network codes, etc. The EMC and lightning group is also involved in the development and constant improvement of electromagnetic software in co-operation with the Scientific Calculation group inside the GIE. Facilities, in Suresnes, include a various range of test facilities (lightning and EMC).
AEA Technology AEA Technology is a science and engineering services business which solves technical, safety and environment problems for industries and governments around the world. AEA Technology’s Lightning Test and Technology has over 20 years experience in lightning consultancy and testing; this has been mainly in the Aerospace market sector. It has also been active in research into the effect of lightning on structures and systems. AEA Technology provides consultancy and testing to meet its clients needs for design and certification. The Lightning Test and Technology (LTT) centre specialises in assessing and testing structures, systems and components for the direct and indirect effects of lightning. LTT has a wide variety of High Current generators that can achieve lightning test waveforms and levels complying with existing standards for tests to structures and systems. For High Voltage testing it hires facility time at the associated Doulton Laboratory in Tamworth. It may also make use of the High Voltage facility at the University of Federal Armed Forces in Neubiberg, Germany, for some of the High Voltage tests. High speed cameras for some of the test work would involve Cranfield University as a subcontractor. It has INDCAL™ and ELECTRA software which models structures and predicts the indirect effects of lightning on electrical circuitry and these codes have been extensively validated.
British Aerospace British Aerospace (BAe) is one of the World’s leading manufacturers of aerospace products, with a long history in the design and production of military, regional and large fixed wing commercial aircraft. As World leader in Wing engineering, which requires the integration of several technical disciplines, and incorporates systems such as fuel and landing gear, BAe is able to contribute a broad range of technical expertise to any project, in conjunction with sound systems engineering practices to help achieve optimum whole aircraft solutions and standards. As well as being able to provide extensive technical competence, BAe has through participation in many UK and European collaborative research projects established a highly effective research management capability. BAe is able to contribute this experience, and support the application of proven project organisation and management methods, either as project leader or partner. Additionally, by having
16
such a prominent market position and well established network of partners and suppliers, BAe is well placed to facilitate the dissemination of project information and see that all possible steps are taken to ensure the successful commercial exploitation of results.
CEAT CEAT is one of the testing centres of the Délégation Générale pour l’Armement, the organisation of the French Ministry of Defence responsible for the development of armament. CEAT comes under “the systems evaluation and test directorate”. CEAT tasks are devoted to ground testing of aeronautical equipment (civil or military). Among these tasks, one should especially mention:
• The verification of the compliance of materials and equipment with contractual or statutory specifications.
• The expert status participation in the appreciation of airworthiness. In the field of electromagnetic airworthiness, CEAT’s support to the French aeronautical official agencies involves the following activities:
• appreciation of the lightning and electromagnetic protection of aircraft,
• participation to development and evaluation of regulation tests,
• performance of regulation tests. CEAT also supports research of the aeronautical industry on lightning and electromagnetic protection of aircraft. CEAT Electromagnetic Laboratory has a lot of facilities in the field of electromagnetic and atmospheric electricity:
• simulation of lightning – direct and indirect effect,
• simulation of electrostatic electricity,
• high intensity radiated field,
• electromagnetic compatibility.
DaimlerChrysler Aerospace Dornier GmbH Dornier GmbH – founded in 1914 by the German aviation pioneer Claude Dornier – today is a high-tech company with its core business activity in the fields of telecommunications, space technology, consulting services as well as defence systems and civilian markets. Since 1989 Dornier GmbH is largely controlled by DaimlerChrysler Aerospace – DASA, that is part of the DaimlerChrysler Corporation. As the premium provider of transportation and mobility systems, DaimlerChrysler is at the forefront of innovation in the automotive (passenger cars, buses, trucks), aerospace (passenger aircraft, helicopters, aero engines, military aircraft, satellites and space infrastructure) and railroad sector. DaimlerChrysler Aerospace Dornier contributed to the Fulmen project through the work of the department FT4/TS “Simulation Technology/Theory” that is part of the
17
Applied Research Division and is fully integrated into the DaimlerChrysler corporate Research and Technology Division. As such FT4/TS is engaged in the modelling and simulation of physical systems for a broad variety of applications within the DaimlerChrysler Corporation and has broad experience in the simulation of electromagnetic phenomena. The models, techniques and methodologies developed and validated within the framework of the Fulmen programme shall see their direct application in the support of DASA Airbus in the design and certification process for new aircraft models, but shall also be utilised within the various other product lines of DaimlerChrysler in the automotive and railroad sector to assure EM compatible performance.
Ericsson Saab Avionics Ericsson Saab Avionics was established by joining two units from Saab and two units from Ericsson to form an Avionics company. One of the units contributed by Saab was the Electromagnetic technology division, EMT. Within the Saab Group, EMT is the Centre of Competence for Electromagnetic Technology, with responsibility for Electromagnetic Environmental Effects. Available within EMT are substantial electromagnetic test and measurement facilities, including a unique high power Microwave Test Facility, a so called Mode Stirred Chamber and a Lightning Test Generator for whole aircraft testing. For advanced electromagnetic computer analysis the division uses CRAY-supercomputers, available at Saab, in addition to high performance workstations. The Saab Group is specialised in aerospace technology with the capability to carry out long-term projects involving spearhead technology. The product range includes civil and military aircraft, missiles, space products and avionics.
Eurocopter France EUROCOPTER S.A. (ECF) is a Franco-German company, owned by Aerospatiale Matra and Daimler-Chrysler Aerospace, specialised in the development, manufacturing, sale and maintenance of helicopters, for civil and military applications. EUROCOPTER S.A. is the largest helicopter manufacturer in the world and is competing with the major North American manufacturers (Sikorsky, Bell, ...). The major research goals to be developed in the medium-long term strategy are the following:
• Safety/Reliability
• Reduction of costs
• Passenger comfort
• Noise reduction
• Performance improvement
• All weather capability It is therefore of strategic importance for EUROCOPTER to develop a good control of electromagnetic and lightning direct effect protections designs methods and means.
18
Onera Onera is a French aerospace research agency, acting as a natural gateway between research and industry. The Office has been involved in nearly all major European aerospace projects from Airbus jetliners and Dauphin helicopters to Ariane launchers. Onera carries out both fundamental and applied research in aerodynamic, propulsion, material and physic for space and aircraft applications. Eighteen Departments of Research, each focusing an a specific scientific discipline, are associated within four distinct Scientific branches: Fluid Mechanics and Energetics, Materials and Structures, Information Technology and Systems, Physics. Onera contributed to the Fulmen project through two Departments of the Physics Branch:
• The Physics, Instrumentation and Sensing Department (PISD).
• The Electromagnetic and radar Department (ERD).
The Atmospheric Environment Research Unit This activities of this Unit, which belong to the PISD, are devoted to the evaluation of the interaction between atmosphere and aircraft. Concerning the impact of aircraft, the Unit is working on the modelling of upper troposphere and lower stratosphere, in order to assess the effect of jet species emission on the behaviour of tropospheric and stratospheric ozone, as well as the impact on the global radiative budget of atmosphere. Concerning the atmospheric effects on aircraft, the Unit is active in the field of the physics of lightning and icing. Since the early eighties, the group has been conducting experimental and theoretical work on lightning strikes on aircraft. It gets international recognition for its work on natural lightning observations, triggered lightning experiments and discharge modelling. Physical models have been set up to accurately describe the flashes triggered by aircraft and launcher. Engineers of this Research Unit took an active part in the campaign on in-flight experiments in France and in US (C160 and CV580 aircraft).
The Electromagnetic Compatibility Research Unit This Research Unit, which belong to ERD, is mainly involved in computer modelling of 3D electromagnetic interactions with structures and coupling to networks of cables and harnesses. Various sources, such as lightning, plane wave or electrostatic discharges acting on aircraft, launchers or satellites, can be taken into account. Computational codes are home-developed codes working in time or frequency domain according FDFD or MoM schemes to solve Maxwell differential equations or the Electric Field Integral Equation (EFIE). The effects of some structural details, such as composite materials, gaskets and openings, are taken into account in these codes. These have been applied, for example, to define the protection of the Ariane 4 and 5 launchers or the shuttle Hermes and to analyse the electromagnetic behaviour of the Transall aircraft during in-flight experiments on lightning, in 1988. The electromagnetic part of this experiment has been designed by engineers and technicians of the division.
19
In parallel, a large effort has been made to achieve the modelling of coupling mechanism on cables and complex network of cables. This led to the implementation, in a computer model, of the efficient concept of Electromagnetic Topology adapted to the Multiconductor Transmission Line model. This approach was successfully validated and applied on some industrial problems and to analyse some experiments on the EMP test aircraft of the USAF. This work is widely recognised in Europe and USA, as an important contribution to a better understanding of the response of cables to an electromagnetic aggression.
20
V. Scientific and technical description of the project In this section, the different scientific and technical documents delivered during the project will be described. The main objectives will be reminded and some results will be highlighted.
A. Critical analyses of regulatory documents about direct and indirect effects of lightning on aircraft (document D1)
This document D1 [1] gives an overview by Fulmen partners of regulations on both direct effects and indirect effects of lightning. It is a critical analysis synthesis of current regulations as well as EUROCAE/SAE-AE2 documents being elaborated. This reporting is based solely on the opinions expressed by the lightning specialists involved in Fulmen. It is a single report D1 which includes topics to be covered by both the tasks T1.1 and T1.2. This critical analysis deals mainly with the scientific knowledge of the lightning phenomenon and its interaction with an aircraft. The industrial and safety aspects are not fully considered. The lightning environment for a typical aircraft, and the method and steps proposed in current documents to derive lightning strike levels are evaluated. In doing so, this document sometimes goes deeply into the physics of lightning and incorporates some of the latest data and theories still under discussion within the international lightning community. It is therefore logical that current regulations and drafts all elaborated by consensus do not include such recent data and theories. For example, the definition of lightning resulted from an historical compromise between USA and Europe in the mid seventies. USA had originally a threat based on negative ground strikes only, some European specifications give bigger weight to the larger magnitude of positives lightning strikes. Moreover, there is still no clear consensus on the definition of a number of parameters used to define lightning: intensity, waveform shape, d2i/dt2, rise-time, action integral, charge transfer, restroke number, and / or some other relevant parameters (voltage)... The pulse shape is criticised, and so is the current waveform physical significance of MS/CG (Multi Stroke / Cloud-Ground) versus MS/IC (Inter-Cloud) in particular.
21
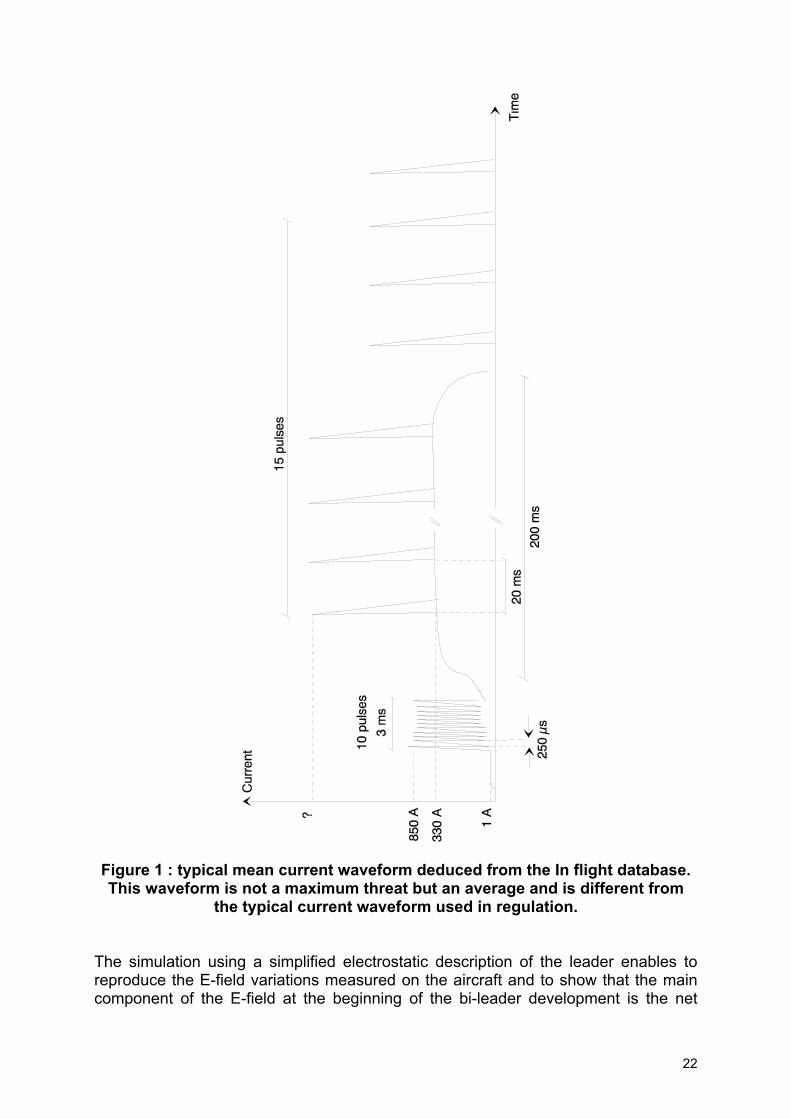
B. Collection of available in-flight measurements (document D2.1) In order to investigate the interaction between lightning and aircraft, joint programs were performed during the 80's where instrumented aircraft were flown into thunderstorms. Three types of planes were used for these experiments : F106 for NASA program, CV580 for FAA program and C160 for DGA program. The purpose of report D2.1 [2] is to investigate the in-flight available data associated with the 1985 (CV580) and 1988 (C160) campaigns in order to extract the main parameters of the lightning strike to aircraft. These data have shown that there are two phenomenologies of a lightning strike to an aircraft. The former is the lightning triggered by the aircraft when it flies in region where the ambient field is intense. The latter may be due to the interception by the aircraft of a natural lightning branch. For both phenomenologies, the E-field and current measurements are used to determine the chronological sequence of events occurring during the strike. The first part of this report describes the experiments and the measuring systems. The second part presents the different subsequent processes occurring during an aircraft strike. In a third part, the current and the E-field recordings are used to characterise the different phases of the process (statistical analysis of characteristic times, frequencies and amplitude are given for the different phases). Finally, numerical codes are used to simulate the initial phase of a lightning strike to an aircraft (leaders inception) and the results are compared with the experimental data. From the physical analysis, we have deduced the reduced ambient field to reach for the lightning onset. This parameter could be used to evaluate for each altitude the ambient field threshold for the discharge inception. The statistical analysis has shown that the aircraft charging process is related to the ambient field. the higher ambient field is, the larger negative net charge is. It is worth to note that the leader phase duration decreases when the ambient field increases. Finally, a typical current wave form has been deduced from the database (see the figure 1 below).
22
Figure 1 : typical mean current waveform deduced from the In flight database. This waveform is not a maximum threat but an average and is different from
the typical current waveform used in regulation. The simulation using a simplified electrostatic description of the leader enables to reproduce the E-field variations measured on the aircraft and to show that the main component of the E-field at the beginning of the bi-leader development is the net

23
charge while few milliseconds later, the ambient field component becomes dominant. The simulation has also shown that the negative leader inception leads to an acceleration of the positive leader.
C. Database on ground measurements: background, set-up and analysis of data (document D2.5B/I)
The objective of the database creation is twofold, namely ; 1. Create a source of reference within which as much information as is feasible is
held. 2. The data held within the databases will be used as part of the validation of the
results of other work packages within the FULMEN programme. The main input from this activity will be to work packages WP3 and WP4.
This document reviews the collection of data about ground measurements of lightning strike current characteristics, the construction of the database, its analysis and the conclusions. It covers in fact the work produced into the documents D2.2 [3] and D2.5B/I [4]. After a presentation of the background (link between ground measurements and in-flight incidents) and of the source documents at our disposal, the structure of the database is described (number and nature of the fields). A study of each source paper also allowed to complete some entry values. The data itself had to be obtained from published papers (apart from the NASA data). This imposes limitations in terms of the quantity of data. There is a severe data shortfall in the areas of Action Integral, Charge Content, Subsequent Stroke Rise-time etc. especially. In order to address this it would be necessary to approach the original sources of the data, and in some cases fund work by the organisations involved, in order to obtain greater and more meaningful data. New source papers should also be gathered in the future to increase the quantity of information, because the quantity of data is low especially for some fields. The table below summarised the sources of data (scientific papers) and the associated number of data available.
Table 1 : List of sources of data and associated data quantity Source Data quantity
ENEL 3 FAF University 2 NASA JFK Space Centre 52 Novel Observations on Lightning Discharges 24 Tohoku University 57 Toronto University 1 Toronto University et al. 4
Lightning ground strike data has been collected as a part of this programme for three reasons:
24
• because the existing threats for aircraft protection are based on data for lightning strikes to ground - this was because there was no airborne data when the threats were established in the early 1970s.
• because aircraft do get struck by cloud to ground discharges even though
these may be of the order of 1% to 10% of strikes received in service. • because all the evidence suggest that lightning strikes to ground are more
severe than cloud-to-cloud or intra-cloud strikes, and since they do form a proportion of recorded strikes to aircraft they must, not only be considered, but to a significant degree drive the aircraft protection threat levels.
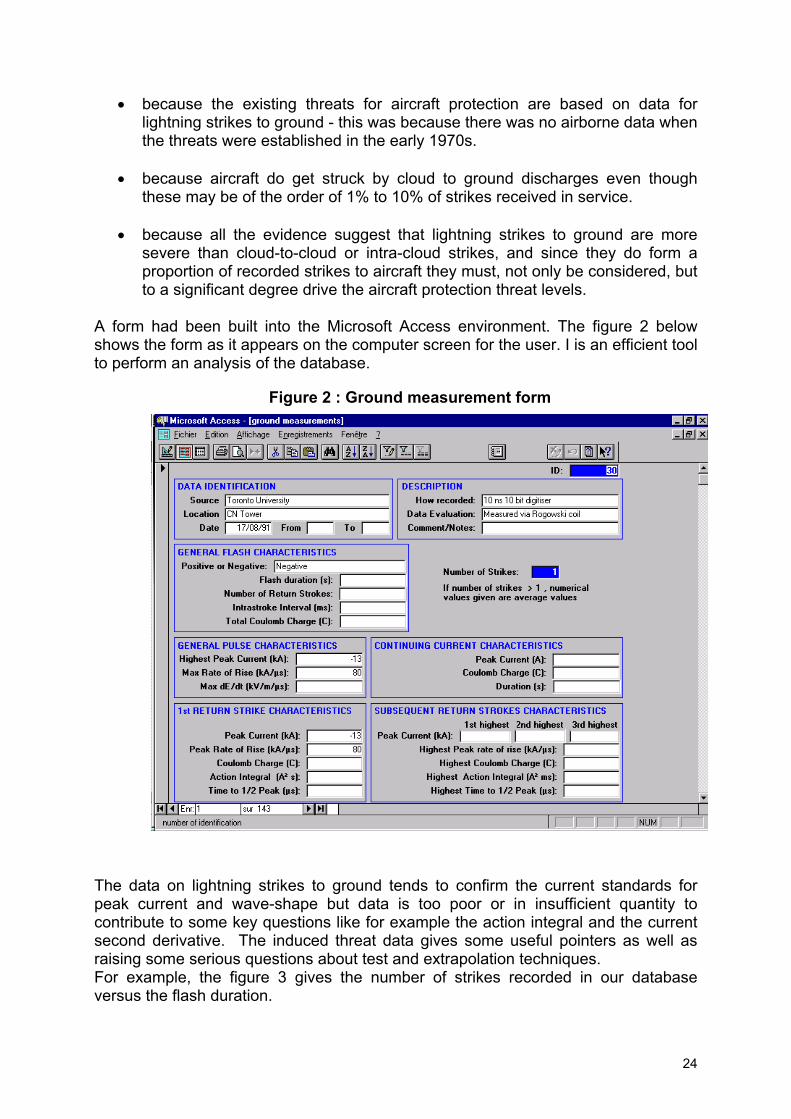
A form had been built into the Microsoft Access environment. The figure 2 below shows the form as it appears on the computer screen for the user. I is an efficient tool to perform an analysis of the database.
Figure 2 : Ground measurement form
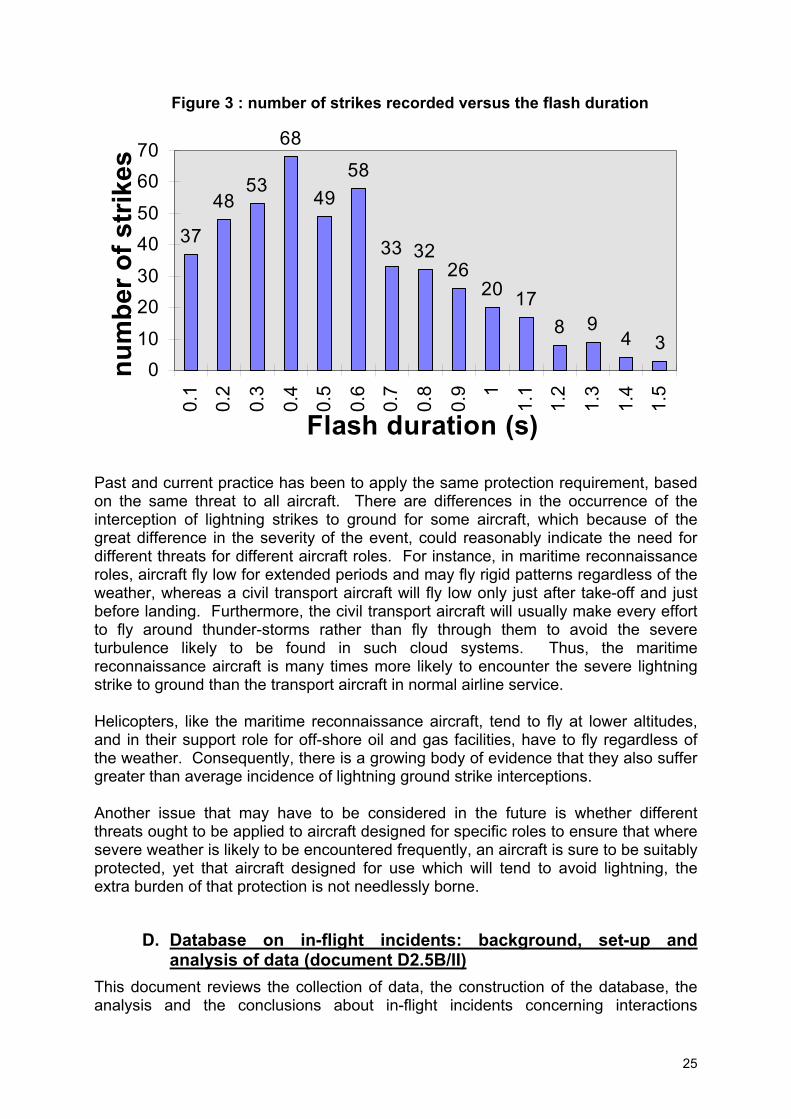
The data on lightning strikes to ground tends to confirm the current standards for peak current and wave-shape but data is too poor or in insufficient quantity to contribute to some key questions like for example the action integral and the current second derivative. The induced threat data gives some useful pointers as well as raising some serious questions about test and extrapolation techniques. For example, the figure 3 gives the number of strikes recorded in our database versus the flash duration.
25
Figure 3 : number of strikes recorded versus the flash duration
37
4853
68
4958
33 3226
20 178 9
4 30
10203040506070
0.1
0.2
0.3
0.4
0.5
0.6
0.7
0.8
0.9 1
1.1
1.2
1.3
1.4
1.5
Flash duration (s)
num
ber o
f str
ikes
Past and current practice has been to apply the same protection requirement, based on the same threat to all aircraft. There are differences in the occurrence of the interception of lightning strikes to ground for some aircraft, which because of the great difference in the severity of the event, could reasonably indicate the need for different threats for different aircraft roles. For instance, in maritime reconnaissance roles, aircraft fly low for extended periods and may fly rigid patterns regardless of the weather, whereas a civil transport aircraft will fly low only just after take-off and just before landing. Furthermore, the civil transport aircraft will usually make every effort to fly around thunder-storms rather than fly through them to avoid the severe turbulence likely to be found in such cloud systems. Thus, the maritime reconnaissance aircraft is many times more likely to encounter the severe lightning strike to ground than the transport aircraft in normal airline service. Helicopters, like the maritime reconnaissance aircraft, tend to fly at lower altitudes, and in their support role for off-shore oil and gas facilities, have to fly regardless of the weather. Consequently, there is a growing body of evidence that they also suffer greater than average incidence of lightning ground strike interceptions. Another issue that may have to be considered in the future is whether different threats ought to be applied to aircraft designed for specific roles to ensure that where severe weather is likely to be encountered frequently, an aircraft is sure to be suitably protected, yet that aircraft designed for use which will tend to avoid lightning, the extra burden of that protection is not needlessly borne.
D. Database on in-flight incidents: background, set-up and analysis of data (document D2.5B/II)
This document reviews the collection of data, the construction of the database, the analysis and the conclusions about in-flight incidents concerning interactions
26
between lightning and an aircraft. It covers in fact the work produced into the documents D2.2 [3] and D2.5B/II [5]. Clearly, the best data on where lightning strikes on an aircraft surface, the geographical locations where strikes are most likely, the conditions and circumstances in which strikes are most likely, and the results of strikes, is from actual experience. Hence, the compilation of the in-flight incident database is very interested.
First, the sources of data (bibliographic reference, contact name,...) are identified and so, data had been collected.. Application has been made to aircraft companies, to military and civil agencies and to aircraft operators for information. The kind of information, the interpretative slant inherent in the information recorded, and the inclusiveness of the data are all subject to the needs of the organisation maintaining the data. Thus, aircraft manufacturer data records include only lightning strike incidents involving damage that caused an operator to communicate the fact and details of the incident. Airline operator records contain only the fact of a lightning strike having occurred unless there was damage needful of repair, and it is unlikely that even then the records are complete as it is believed that strikes from which no damage has resulted (or has been found) are not reported. Rarely do the record contain details of the location, meteorological conditions, state of the aircraft, or the exact locations of attachment points on the aircraft surface. UK military data is amongst the most complete, including all of the above information to some extent and more. The weakest component of the data being the attachment locations which is generally descriptive rather than graphical, though in certain cases, where the DERA (formerly RAE, the Royal Aircraft Establishment) representative carried out a detailed inspection, the information is even more complete. The other strong source of data is from the CAA mandatory lightning strike recording programme of the early 1970s. This includes many types of commercial transport aircraft in UK airline service to Europe and trans-continental. Neither the UK military data nor the CAA data have yet been completely absorbed into the database as this has proved to be a more massive task than anticipated. However, BAe will continue to add this data and any other data received from other sources to maintain the database into the foreseeable future. UK military in-service data will be added through the course of 1997 and the first block of records on Nimrod and Tornado aircraft has been received. Work is also current in setting up a graphical representation of attachment data for which the first results will be available by the end of 1997. It is important to remember that the data collected is from certain specific aircraft types, geometry and flight regimes. The results are not necessarily capable of extrapolation to other aircraft with different roles. Great care is needed in the drawing of generic conclusions. Data has been received from CEAT, Dornier and Eurocopter, which because of the differences in fields and data presentation has not yet been integrated into the overall
27
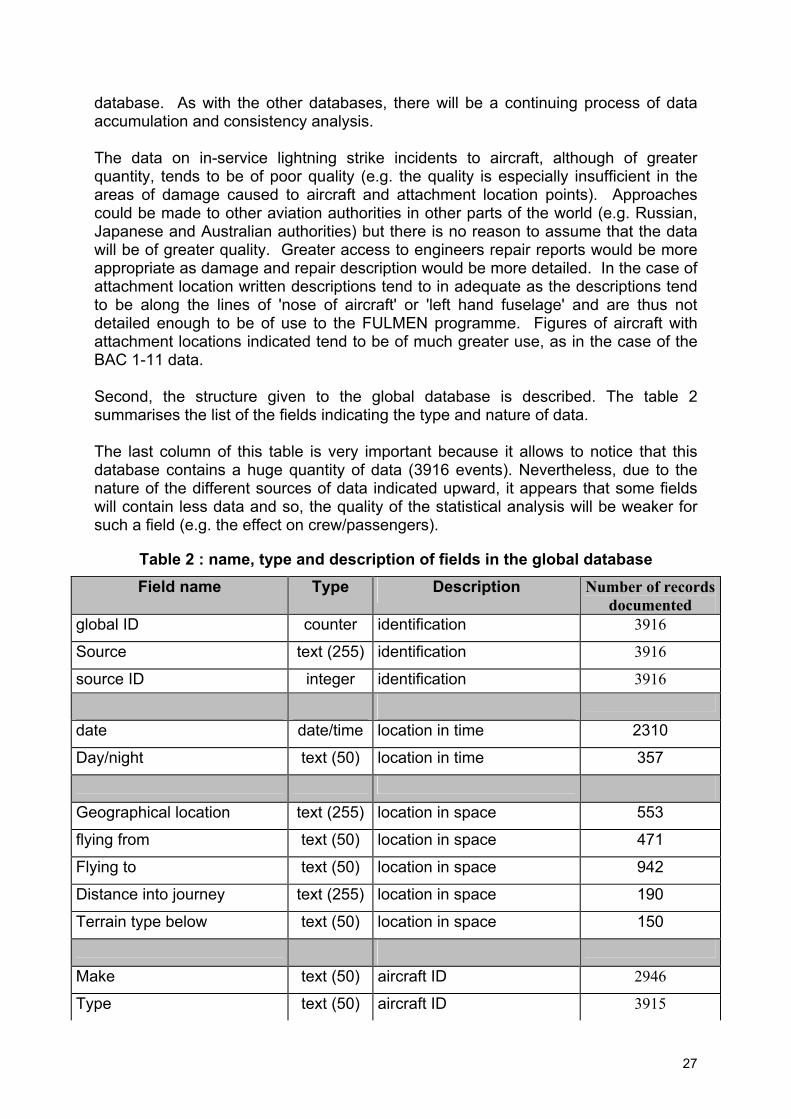
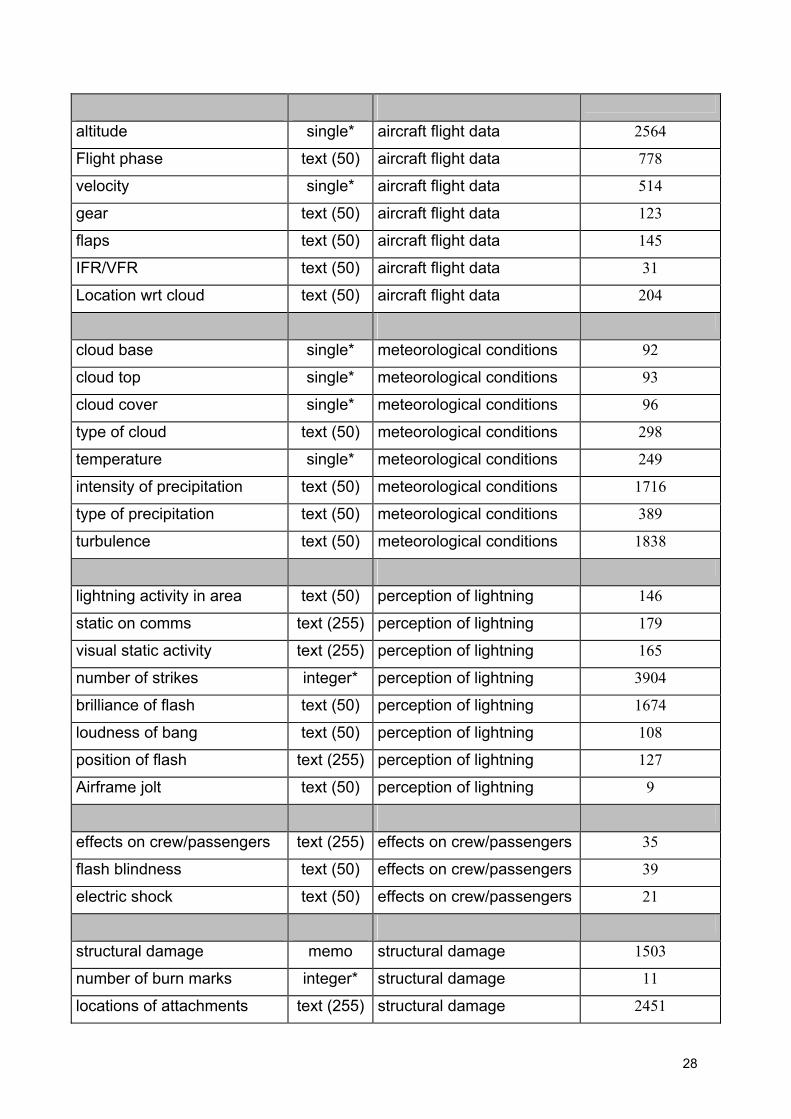
database. As with the other databases, there will be a continuing process of data accumulation and consistency analysis. The data on in-service lightning strike incidents to aircraft, although of greater quantity, tends to be of poor quality (e.g. the quality is especially insufficient in the areas of damage caused to aircraft and attachment location points). Approaches could be made to other aviation authorities in other parts of the world (e.g. Russian, Japanese and Australian authorities) but there is no reason to assume that the data will be of greater quality. Greater access to engineers repair reports would be more appropriate as damage and repair description would be more detailed. In the case of attachment location written descriptions tend to in adequate as the descriptions tend to be along the lines of 'nose of aircraft' or 'left hand fuselage' and are thus not detailed enough to be of use to the FULMEN programme. Figures of aircraft with attachment locations indicated tend to be of much greater use, as in the case of the BAC 1-11 data. Second, the structure given to the global database is described. The table 2 summarises the list of the fields indicating the type and nature of data. The last column of this table is very important because it allows to notice that this database contains a huge quantity of data (3916 events). Nevertheless, due to the nature of the different sources of data indicated upward, it appears that some fields will contain less data and so, the quality of the statistical analysis will be weaker for such a field (e.g. the effect on crew/passengers).
Table 2 : name, type and description of fields in the global database Field name Type Description Number of records
documented global ID counter identification 3916
Source text (255) identification 3916
source ID integer identification 3916
date date/time location in time 2310
Day/night text (50) location in time 357
Geographical location text (255) location in space 553
flying from text (50) location in space 471
Flying to text (50) location in space 942
Distance into journey text (255) location in space 190
Terrain type below text (50) location in space 150
Make text (50) aircraft ID 2946
Type text (50) aircraft ID 3915
28
altitude single* aircraft flight data 2564
Flight phase text (50) aircraft flight data 778
velocity single* aircraft flight data 514
gear text (50) aircraft flight data 123
flaps text (50) aircraft flight data 145
IFR/VFR text (50) aircraft flight data 31
Location wrt cloud text (50) aircraft flight data 204
cloud base single* meteorological conditions 92
cloud top single* meteorological conditions 93
cloud cover single* meteorological conditions 96
type of cloud text (50) meteorological conditions 298
temperature single* meteorological conditions 249
intensity of precipitation text (50) meteorological conditions 1716
type of precipitation text (50) meteorological conditions 389
turbulence text (50) meteorological conditions 1838
lightning activity in area text (50) perception of lightning 146
static on comms text (255) perception of lightning 179
visual static activity text (255) perception of lightning 165
number of strikes integer* perception of lightning 3904
brilliance of flash text (50) perception of lightning 1674
loudness of bang text (50) perception of lightning 108
position of flash text (255) perception of lightning 127
Airframe jolt text (50) perception of lightning 9
effects on crew/passengers text (255) effects on crew/passengers 35
flash blindness text (50) effects on crew/passengers 39
electric shock text (50) effects on crew/passengers 21
structural damage memo structural damage 1503
number of burn marks integer* structural damage 11
locations of attachments text (255) structural damage 2451
29
1A attachments text (50) structural damage 82
1B attachments text (50) structural damage 64
1C attachments text (50) structural damage 23
2A attachments text (50) structural damage 49
2B attachments text (50) structural damage 19
system damage text (255) system damage or upset 428
system upset text (255) system damage or upset 247
consequence on flight text (50) consequence on flight 221
delay single* consequence on flight 182
additional information memo additional information 3371
* "single" : single precision real "text" is followed by size in bytes within parenthesis
Third, the modifications made on the records are listed for each source of data : application of the new structure and then values added/reallocated/deleted in some fields. Redundancy for each source of data (internal redundancy) is also checked. Then, individual databases are concatenated into the global database. After that, the redundancy between records for the global database (inter-bases redundancy) is checked. Indeed, each source of data being independent, it appears that some events could appear in several sources. A list of suspicious redundant records is established across the whole database.
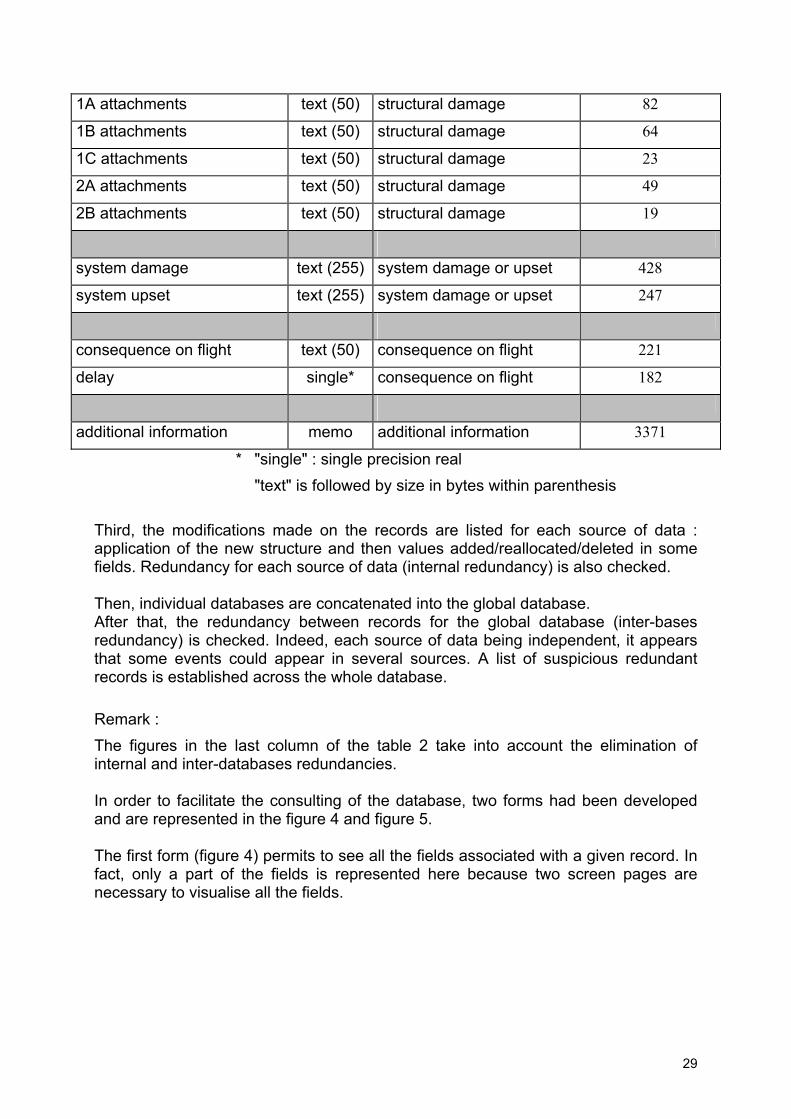
Remark : The figures in the last column of the table 2 take into account the elimination of internal and inter-databases redundancies. In order to facilitate the consulting of the database, two forms had been developed and are represented in the figure 4 and figure 5. The first form (figure 4) permits to see all the fields associated with a given record. In fact, only a part of the fields is represented here because two screen pages are necessary to visualise all the fields.
30
Figure 4 : "In-flight incident details" form
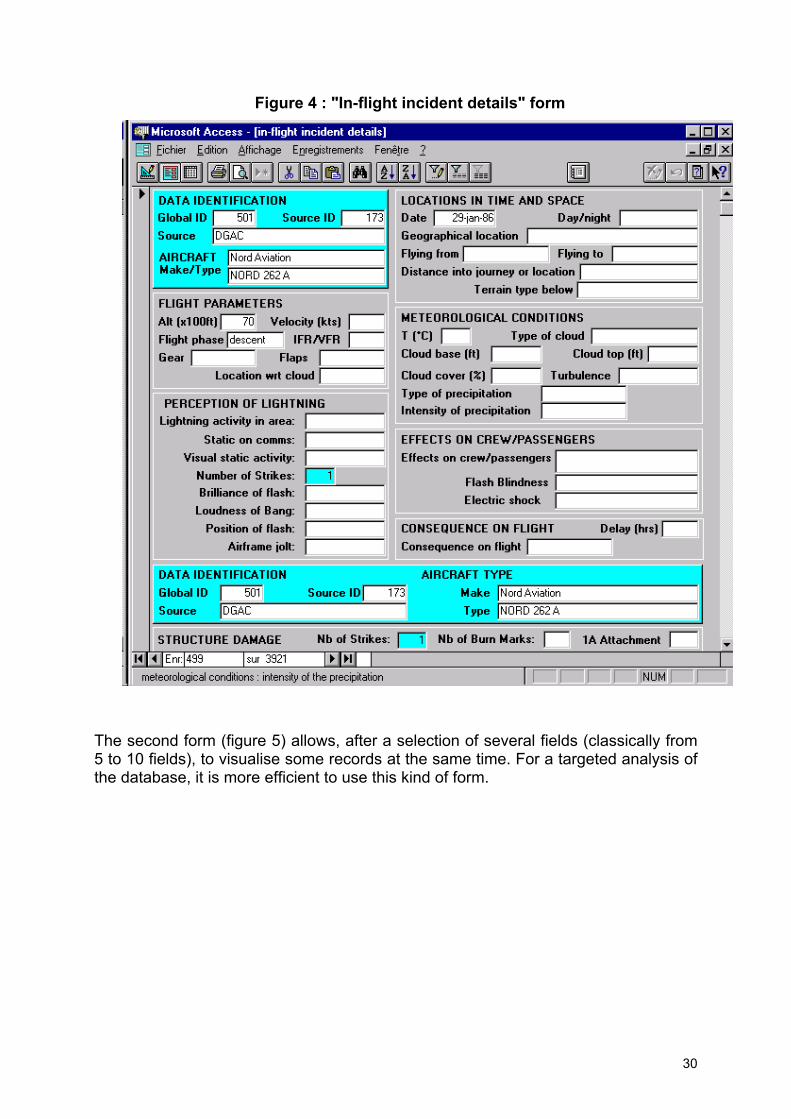
The second form (figure 5) allows, after a selection of several fields (classically from 5 to 10 fields), to visualise some records at the same time. For a targeted analysis of the database, it is more efficient to use this kind of form.
31
Figure 5 : "In-flight incidents list" form
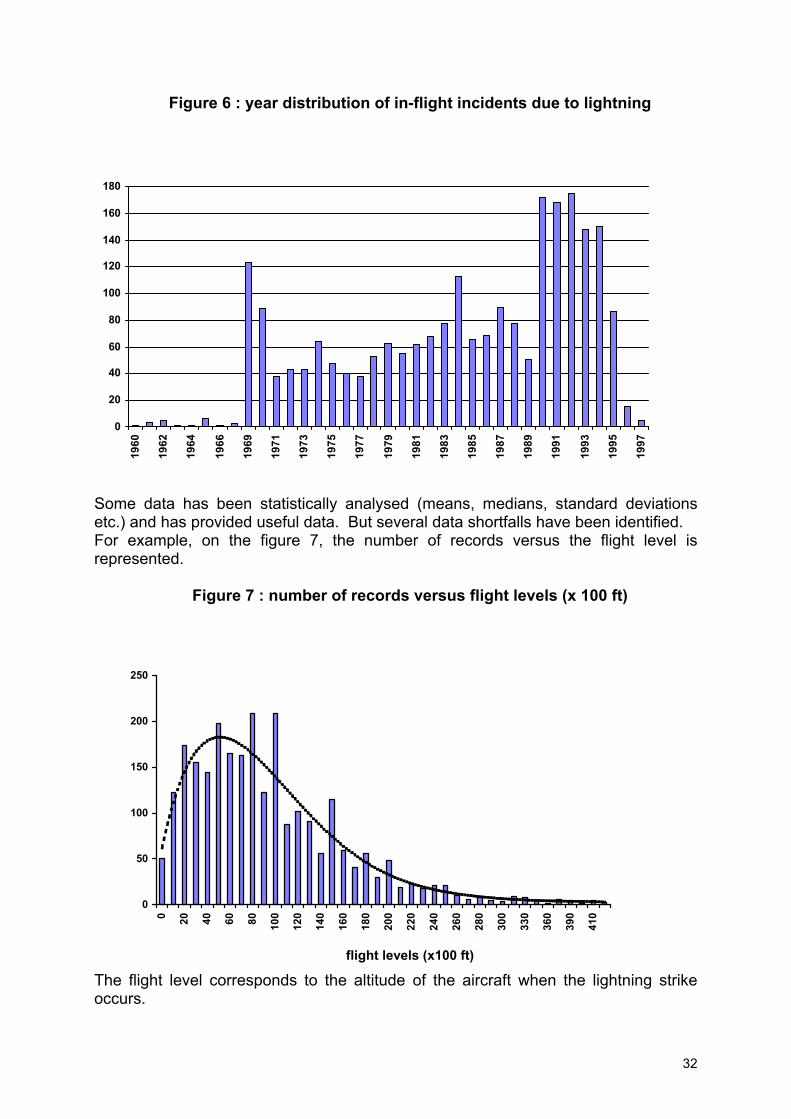
Finally, a analysis of the data is made. It allows to extract information for some fields and between them. Results are represented under the form of a graph corresponding to the distribution of the number of records versus one parameter (for some graphs, the data are grouped into determined intervals) or of a table corresponding to a statistical treatment of data. On figure 6, the number of records versus the year of the event is represented. It permits to show the time distribution of records depending on the sources of data (information available among our contacts) but without link with a possible evolution of the storm activity.
32
Figure 6 : year distribution of in-flight incidents due to lightning
0
20
40
60
80
100
120
140
160
180
1960
1962
1964
1966
1969
1971
1973
1975
1977
1979
1981
1983
1985
1987
1989
1991
1993
1995
1997
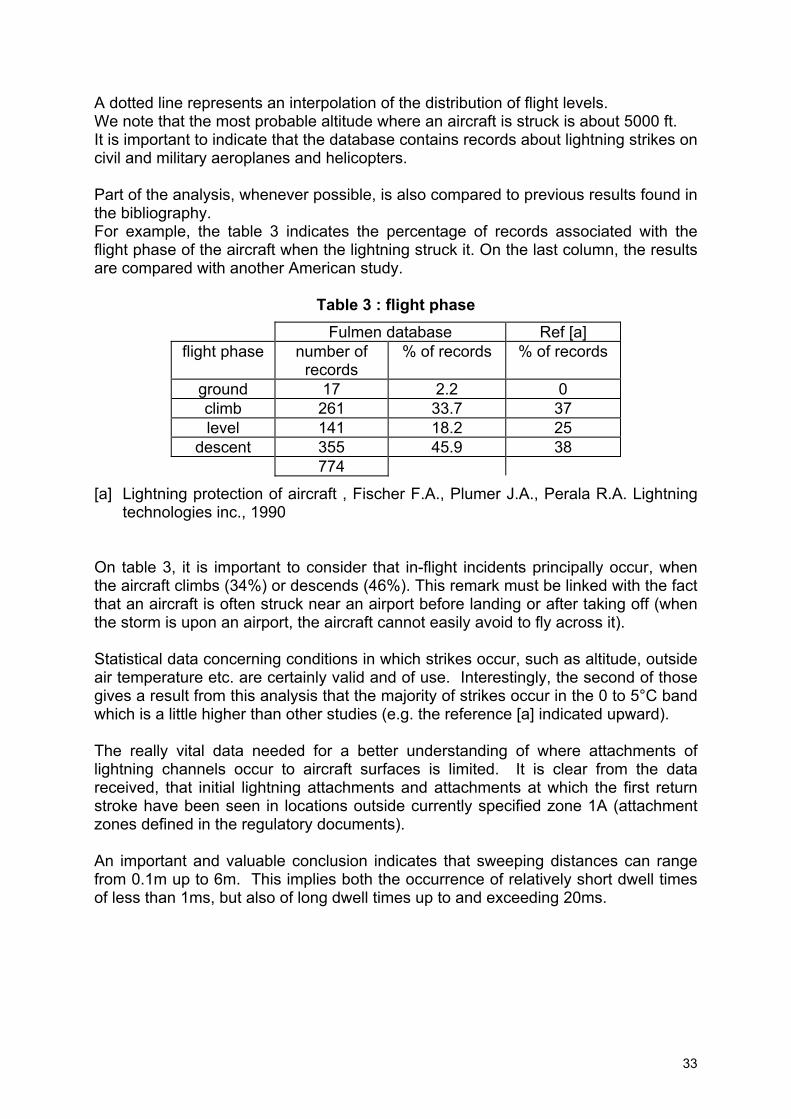
Some data has been statistically analysed (means, medians, standard deviations etc.) and has provided useful data. But several data shortfalls have been identified. For example, on the figure 7, the number of records versus the flight level is represented.
Figure 7 : number of records versus flight levels (x 100 ft)
0
50
100
150
200
250
0 20 40 60 80 100
120
140
160
180
200
220
240
260
280
300
330
360
390
410
flight levels (x100 ft) The flight level corresponds to the altitude of the aircraft when the lightning strike occurs.
33
A dotted line represents an interpolation of the distribution of flight levels. We note that the most probable altitude where an aircraft is struck is about 5000 ft. It is important to indicate that the database contains records about lightning strikes on civil and military aeroplanes and helicopters. Part of the analysis, whenever possible, is also compared to previous results found in the bibliography. For example, the table 3 indicates the percentage of records associated with the flight phase of the aircraft when the lightning struck it. On the last column, the results are compared with another American study.
Table 3 : flight phase Fulmen database Ref [a]
flight phase number of records
% of records % of records
ground 17 2.2 0 climb 261 33.7 37 level 141 18.2 25
descent 355 45.9 38 774
[a] Lightning protection of aircraft , Fischer F.A., Plumer J.A., Perala R.A. Lightning technologies inc., 1990
On table 3, it is important to consider that in-flight incidents principally occur, when the aircraft climbs (34%) or descends (46%). This remark must be linked with the fact that an aircraft is often struck near an airport before landing or after taking off (when the storm is upon an airport, the aircraft cannot easily avoid to fly across it). Statistical data concerning conditions in which strikes occur, such as altitude, outside air temperature etc. are certainly valid and of use. Interestingly, the second of those gives a result from this analysis that the majority of strikes occur in the 0 to 5°C band which is a little higher than other studies (e.g. the reference [a] indicated upward). The really vital data needed for a better understanding of where attachments of lightning channels occur to aircraft surfaces is limited. It is clear from the data received, that initial lightning attachments and attachments at which the first return stroke have been seen in locations outside currently specified zone 1A (attachment zones defined in the regulatory documents). An important and valuable conclusion indicates that sweeping distances can range from 0.1m up to 6m. This implies both the occurrence of relatively short dwell times of less than 1ms, but also of long dwell times up to and exceeding 20ms.
34
E. Database on internal waveforms and transfer functions: background, set-up and analysis of data (document D2.5B/III)
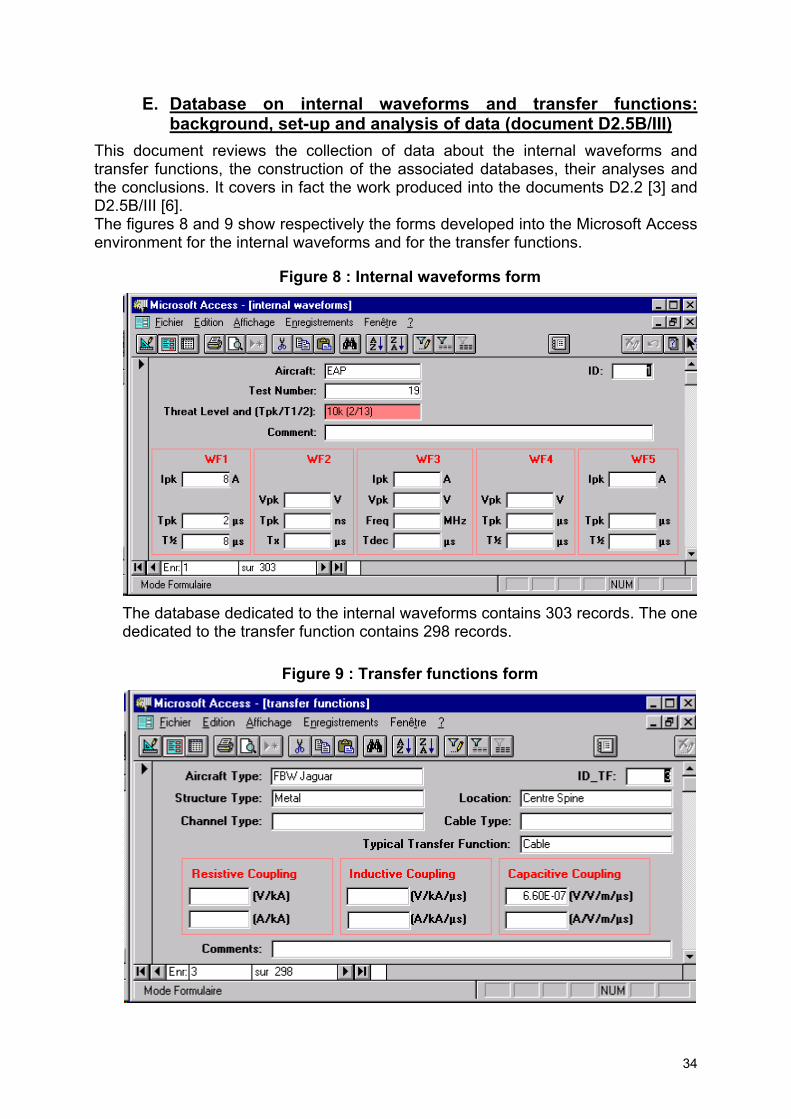
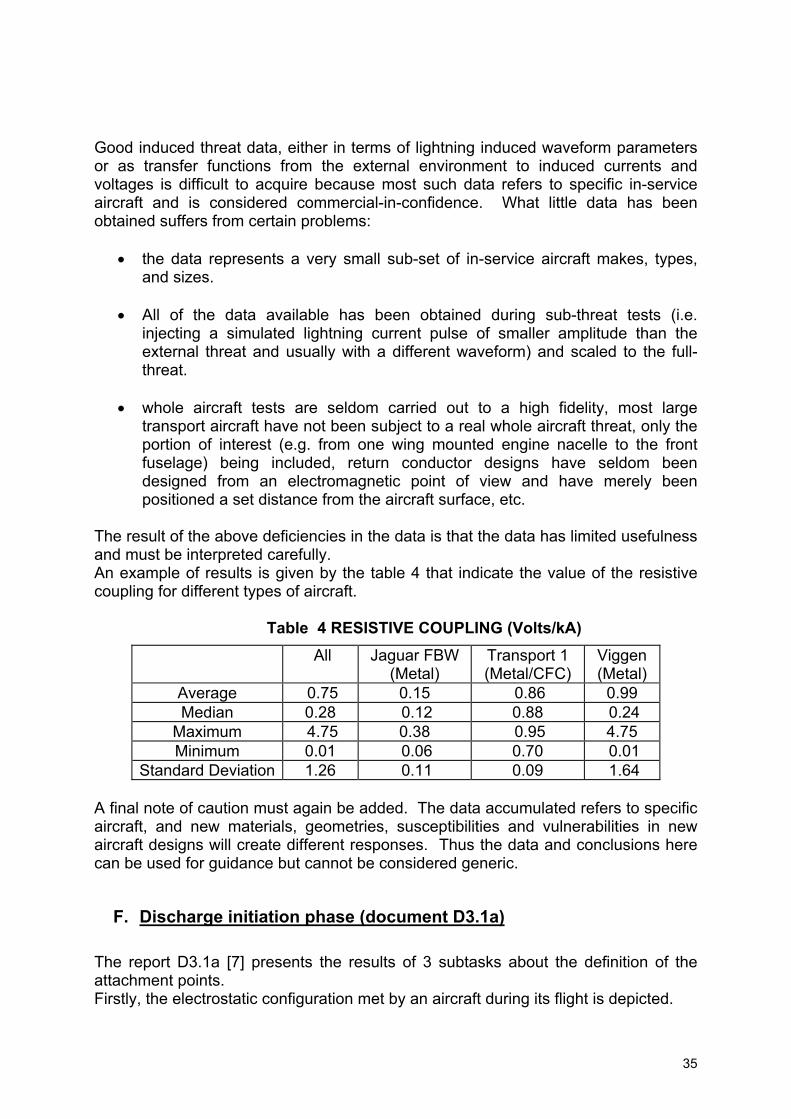
This document reviews the collection of data about the internal waveforms and transfer functions, the construction of the associated databases, their analyses and the conclusions. It covers in fact the work produced into the documents D2.2 [3] and D2.5B/III [6]. The figures 8 and 9 show respectively the forms developed into the Microsoft Access environment for the internal waveforms and for the transfer functions.
Figure 8 : Internal waveforms form
The database dedicated to the internal waveforms contains 303 records. The one dedicated to the transfer function contains 298 records.
Figure 9 : Transfer functions form
35
Good induced threat data, either in terms of lightning induced waveform parameters or as transfer functions from the external environment to induced currents and voltages is difficult to acquire because most such data refers to specific in-service aircraft and is considered commercial-in-confidence. What little data has been obtained suffers from certain problems:
• the data represents a very small sub-set of in-service aircraft makes, types, and sizes.
• All of the data available has been obtained during sub-threat tests (i.e.
injecting a simulated lightning current pulse of smaller amplitude than the external threat and usually with a different waveform) and scaled to the full-threat.
• whole aircraft tests are seldom carried out to a high fidelity, most large
transport aircraft have not been subject to a real whole aircraft threat, only the portion of interest (e.g. from one wing mounted engine nacelle to the front fuselage) being included, return conductor designs have seldom been designed from an electromagnetic point of view and have merely been positioned a set distance from the aircraft surface, etc.
The result of the above deficiencies in the data is that the data has limited usefulness and must be interpreted carefully. An example of results is given by the table 4 that indicate the value of the resistive coupling for different types of aircraft.
Table 4 RESISTIVE COUPLING (Volts/kA)
All Jaguar FBW (Metal)
Transport 1 (Metal/CFC)
Viggen (Metal)
Average 0.75 0.15 0.86 0.99 Median 0.28 0.12 0.88 0.24
Maximum 4.75 0.38 0.95 4.75 Minimum 0.01 0.06 0.70 0.01
Standard Deviation 1.26 0.11 0.09 1.64 A final note of caution must again be added. The data accumulated refers to specific aircraft, and new materials, geometries, susceptibilities and vulnerabilities in new aircraft designs will create different responses. Thus the data and conclusions here can be used for guidance but cannot be considered generic.
F. Discharge initiation phase (document D3.1a) The report D3.1a [7] presents the results of 3 subtasks about the definition of the attachment points. Firstly, the electrostatic configuration met by an aircraft during its flight is depicted.
36
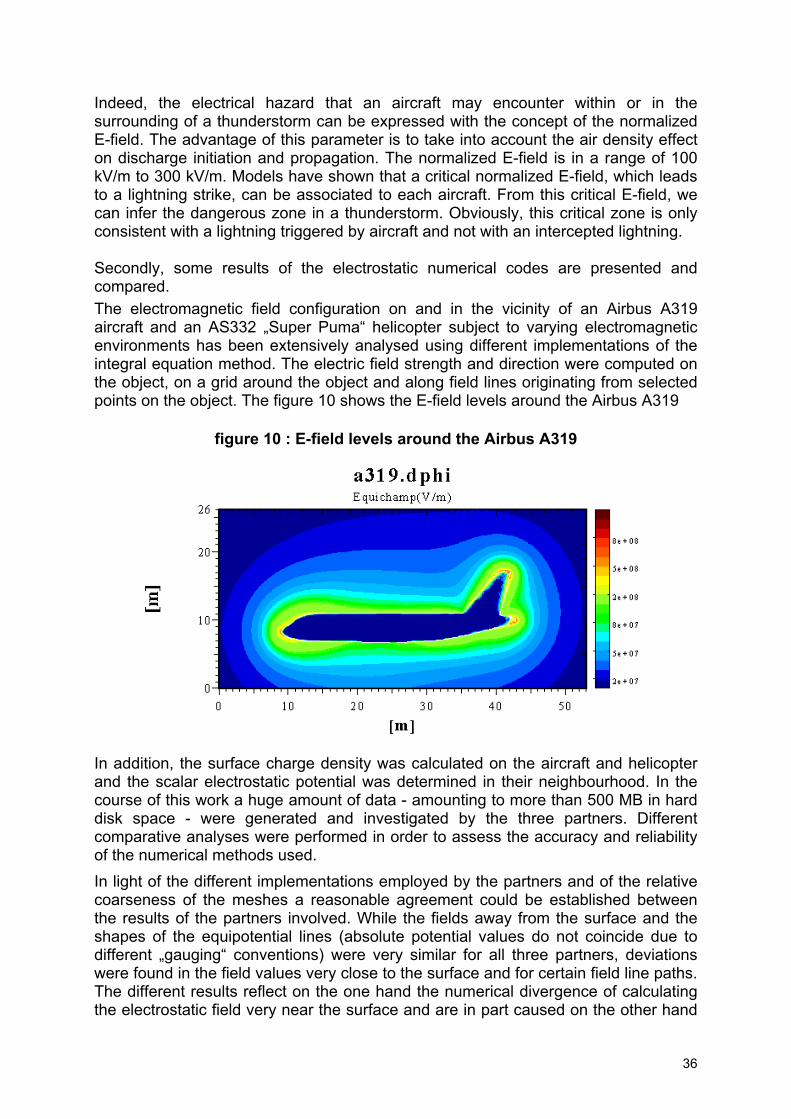
Indeed, the electrical hazard that an aircraft may encounter within or in the surrounding of a thunderstorm can be expressed with the concept of the normalized E-field. The advantage of this parameter is to take into account the air density effect on discharge initiation and propagation. The normalized E-field is in a range of 100 kV/m to 300 kV/m. Models have shown that a critical normalized E-field, which leads to a lightning strike, can be associated to each aircraft. From this critical E-field, we can infer the dangerous zone in a thunderstorm. Obviously, this critical zone is only consistent with a lightning triggered by aircraft and not with an intercepted lightning. Secondly, some results of the electrostatic numerical codes are presented and compared. The electromagnetic field configuration on and in the vicinity of an Airbus A319 aircraft and an AS332 „Super Puma“ helicopter subject to varying electromagnetic environments has been extensively analysed using different implementations of the integral equation method. The electric field strength and direction were computed on the object, on a grid around the object and along field lines originating from selected points on the object. The figure 10 shows the E-field levels around the Airbus A319
figure 10 : E-field levels around the Airbus A319
In addition, the surface charge density was calculated on the aircraft and helicopter and the scalar electrostatic potential was determined in their neighbourhood. In the course of this work a huge amount of data - amounting to more than 500 MB in hard disk space - were generated and investigated by the three partners. Different comparative analyses were performed in order to assess the accuracy and reliability of the numerical methods used. In light of the different implementations employed by the partners and of the relative coarseness of the meshes a reasonable agreement could be established between the results of the partners involved. While the fields away from the surface and the shapes of the equipotential lines (absolute potential values do not coincide due to different „gauging“ conventions) were very similar for all three partners, deviations were found in the field values very close to the surface and for certain field line paths. The different results reflect on the one hand the numerical divergence of calculating the electrostatic field very near the surface and are in part caused on the other hand
37
by the different implementations of the algorithm and in particular of the shape functions. These deviations can of course be reduced by increasing the number of elements used in the numerical approximation of the object geometry, however, limited computational resources currently do not allow meshes with more than 10000 elements. Therefore, in order to approximate the electric field distribution on the surface of the objects the fineness of the mesh should be proportional to the local curvature of the structure. Based on these field calculations further investigations shall be performed to determine the sensitivity of the subsequent discharge initiation model calculation to the variation in the field configuration obtained from the different algorithms of the partners on the same mesh. With deviations of up to 4 % in the capacity of the objects and in light of the rapid decay of the electrostatic field away from the surface, rather similar results are to be expected for the determination of the initial attachment zones regardless of the field configuration used. At last, the results of the preliminary experiment to determine the attachment points are presented and commented. In fact, the preliminary experiment enables to validate the two test set-up usually performed to simulate in laboratory the beginning of the development of the bi-directional discharge which leads to a lightning strike to aircraft. Because the discharge generated in laboratory is smaller (several meters) than an atmospheric one (several kilometres) and because of the scale factor (≈1/10) of the mock-up, the results inferred from laboratory experiments cannot be directly applied to a real aircraft. Numerical models have to be used to extend the laboratory results to a real aircraft. The laboratory experiment has shown that the effect of positive leader on the initiation points of the negative is a scattering effect. This effect should be likely enhanced during a natural bi-directional leader development from an aircraft flying into a thunderstorm. The numerical simulations used are quite in good agreement with the laboratory measurements and could be applied to the definition of attachment points on a real aircraft. More results about the experimental and numerical aspects will be developed into the document D3.1c (section H of this document).
G. Computations of initiations zones (document D3.1b) The report D3.1b [8] follows directly the previous one regarding with the type of work and associated results it contains. In this report, a second level of validation has been presented on a real aircraft. Indeed, it is shown that the critical ambient field leading to a lightning strike to an aircraft and computed by this model is quite consistent with the ambient field measured during in flight experiment. Moreover, the difference of times of inception between the positive and the negative discharge (dTab see the report D2.1 [2] discussed earlier) inferred from the model of ONERA are in good agreement with the in flight measurements. Because of the validation with laboratory and in flight experiments, the results on the attachment zone for a real aircraft deduced from these models should be consistent with the real phenomena. Then, this model can be considered as representative of
38
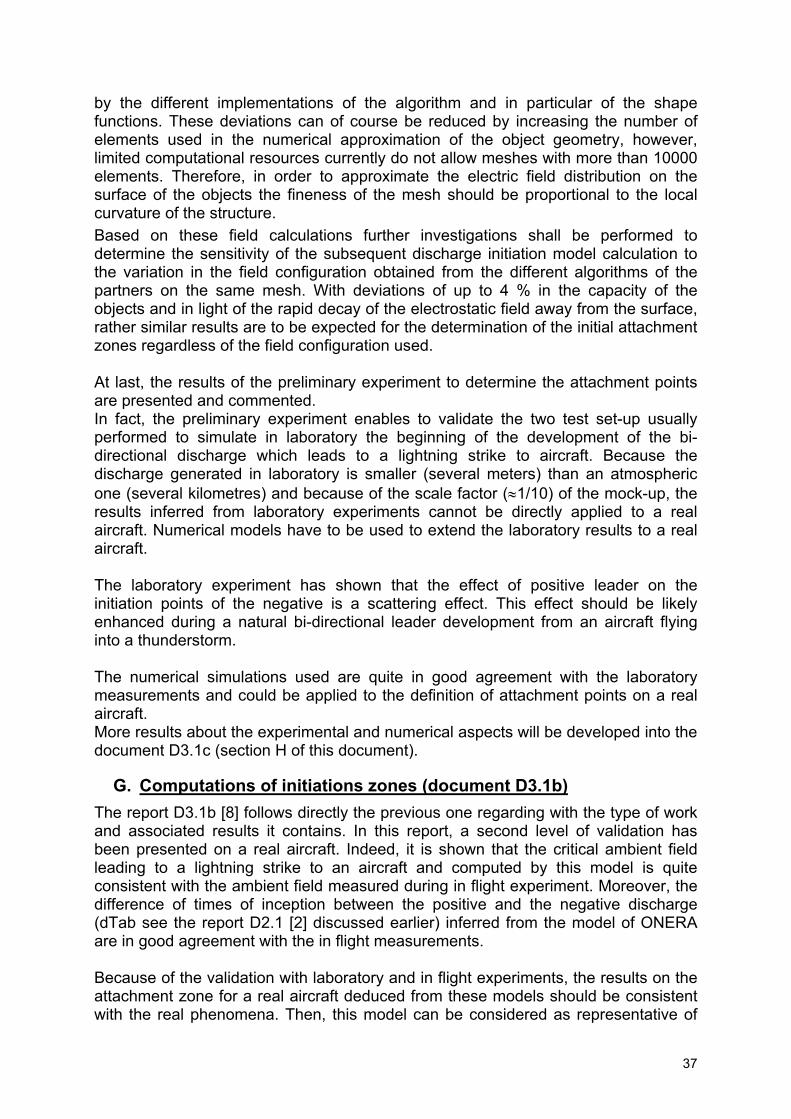
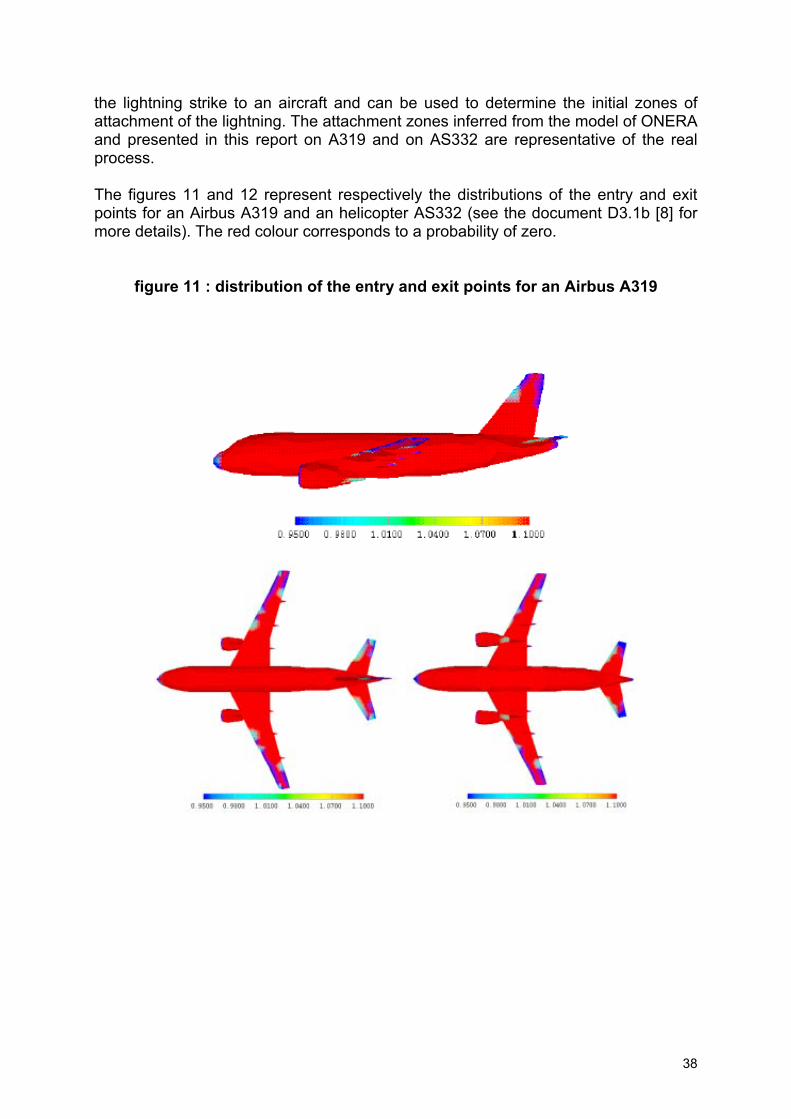
the lightning strike to an aircraft and can be used to determine the initial zones of attachment of the lightning. The attachment zones inferred from the model of ONERA and presented in this report on A319 and on AS332 are representative of the real process. The figures 11 and 12 represent respectively the distributions of the entry and exit points for an Airbus A319 and an helicopter AS332 (see the document D3.1b [8] for more details). The red colour corresponds to a probability of zero.
figure 11 : distribution of the entry and exit points for an Airbus A319
39
figure 12 : distribution of the entry and exit points for an helicopter AS332
The results of the model of ONERA can be used as reference because of the above validation based on laboratory and in flight experiments. In particular, the model of ONERA is the only one which enables the determination of the entry and exit points. Laboratory experiments have shown that the electrostatic configuration strongly varies between the time of positive discharge inception and the time of negative discharge ignition. Then, the entry and exit points are not equivalent and a specific method has to be used to compute them. Some models, such as the models of BAe (Rolling sphere) and Dornier (positive leader inception model), only compute the entry points. In the following part, we propose what kind of input parameters must be chosen so that their results agree with those obtained with the model of ONERA. The general tendency of the rolling sphere method is to determine zones of attachment larger than the reality. The results on A319 performed with a sphere radius of 25 m show that this model enables to find the point of highest probability to be struck such as the extremities of the nose, the wing, the fin, the tail and the engine but it also includes zones which are likely reached during the sweeping phase (under the engine, under and above the fuselage). The electric field computations (see the report D3.1a [7]) show that in these zones the electric field enhancement is not enough to lead to an ignition of a discharge. Then, the rolling sphere method defines a zone where attachment and some parts of sweeping zones are mixed. In the case of A319, the zone which contains 95% of the attachment points is too large because
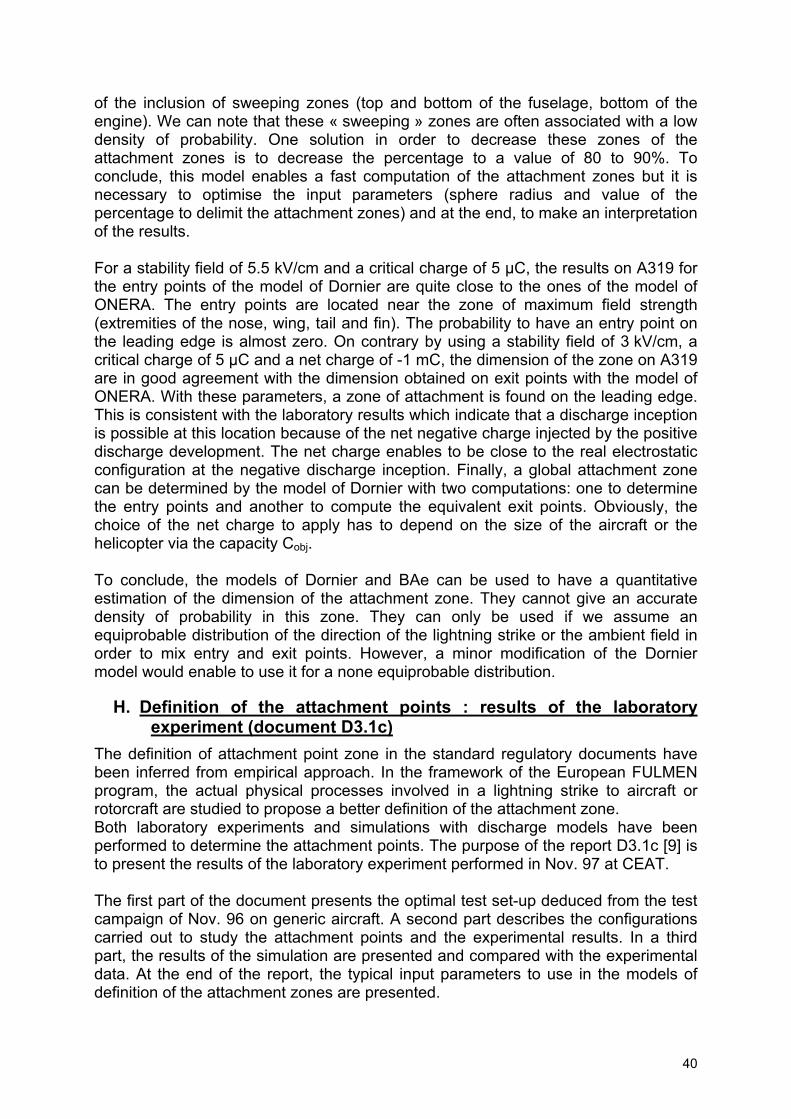
40
of the inclusion of sweeping zones (top and bottom of the fuselage, bottom of the engine). We can note that these « sweeping » zones are often associated with a low density of probability. One solution in order to decrease these zones of the attachment zones is to decrease the percentage to a value of 80 to 90%. To conclude, this model enables a fast computation of the attachment zones but it is necessary to optimise the input parameters (sphere radius and value of the percentage to delimit the attachment zones) and at the end, to make an interpretation of the results. For a stability field of 5.5 kV/cm and a critical charge of 5 µC, the results on A319 for the entry points of the model of Dornier are quite close to the ones of the model of ONERA. The entry points are located near the zone of maximum field strength (extremities of the nose, wing, tail and fin). The probability to have an entry point on the leading edge is almost zero. On contrary by using a stability field of 3 kV/cm, a critical charge of 5 µC and a net charge of -1 mC, the dimension of the zone on A319 are in good agreement with the dimension obtained on exit points with the model of ONERA. With these parameters, a zone of attachment is found on the leading edge. This is consistent with the laboratory results which indicate that a discharge inception is possible at this location because of the net negative charge injected by the positive discharge development. The net charge enables to be close to the real electrostatic configuration at the negative discharge inception. Finally, a global attachment zone can be determined by the model of Dornier with two computations: one to determine the entry points and another to compute the equivalent exit points. Obviously, the choice of the net charge to apply has to depend on the size of the aircraft or the helicopter via the capacity Cobj. To conclude, the models of Dornier and BAe can be used to have a quantitative estimation of the dimension of the attachment zone. They cannot give an accurate density of probability in this zone. They can only be used if we assume an equiprobable distribution of the direction of the lightning strike or the ambient field in order to mix entry and exit points. However, a minor modification of the Dornier model would enable to use it for a none equiprobable distribution.
H. Definition of the attachment points : results of the laboratory experiment (document D3.1c)
The definition of attachment point zone in the standard regulatory documents have been inferred from empirical approach. In the framework of the European FULMEN program, the actual physical processes involved in a lightning strike to aircraft or rotorcraft are studied to propose a better definition of the attachment zone. Both laboratory experiments and simulations with discharge models have been performed to determine the attachment points. The purpose of the report D3.1c [9] is to present the results of the laboratory experiment performed in Nov. 97 at CEAT. The first part of the document presents the optimal test set-up deduced from the test campaign of Nov. 96 on generic aircraft. A second part describes the configurations carried out to study the attachment points and the experimental results. In a third part, the results of the simulation are presented and compared with the experimental data. At the end of the report, the typical input parameters to use in the models of definition of the attachment zones are presented.
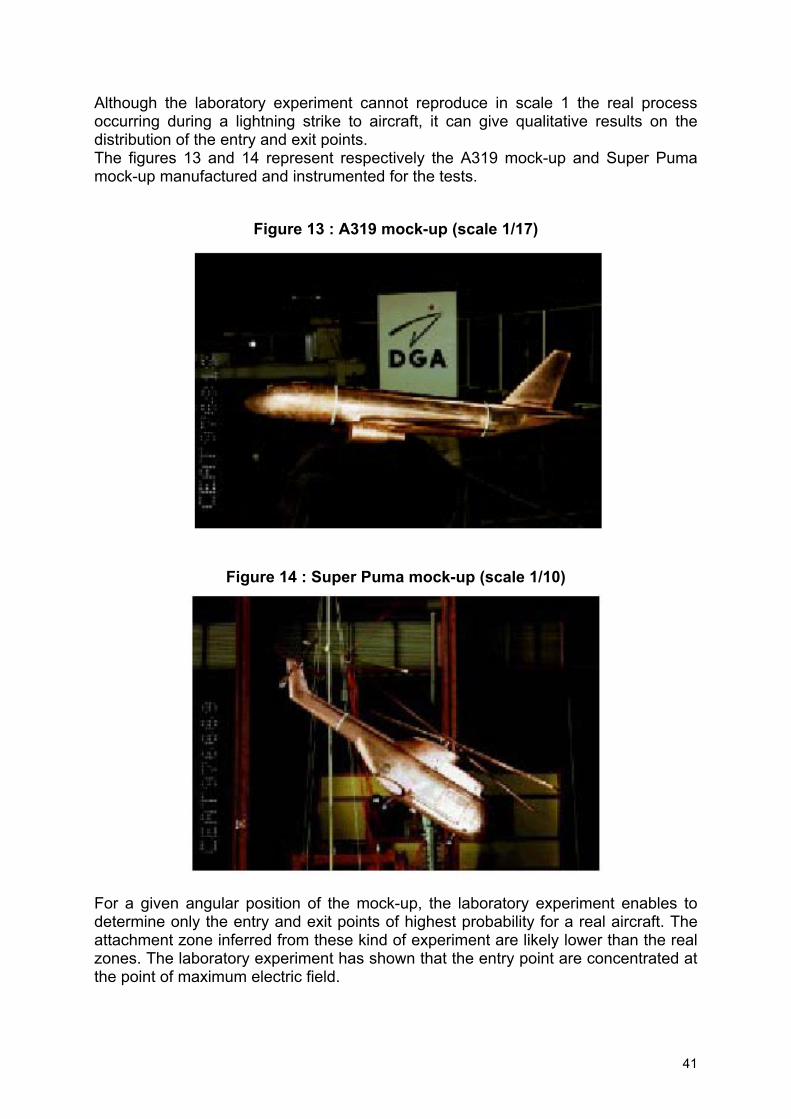
41
Although the laboratory experiment cannot reproduce in scale 1 the real process occurring during a lightning strike to aircraft, it can give qualitative results on the distribution of the entry and exit points. The figures 13 and 14 represent respectively the A319 mock-up and Super Puma mock-up manufactured and instrumented for the tests.
Figure 13 : A319 mock-up (scale 1/17)
Figure 14 : Super Puma mock-up (scale 1/10)
For a given angular position of the mock-up, the laboratory experiment enables to determine only the entry and exit points of highest probability for a real aircraft. The attachment zone inferred from these kind of experiment are likely lower than the real zones. The laboratory experiment has shown that the entry point are concentrated at the point of maximum electric field.
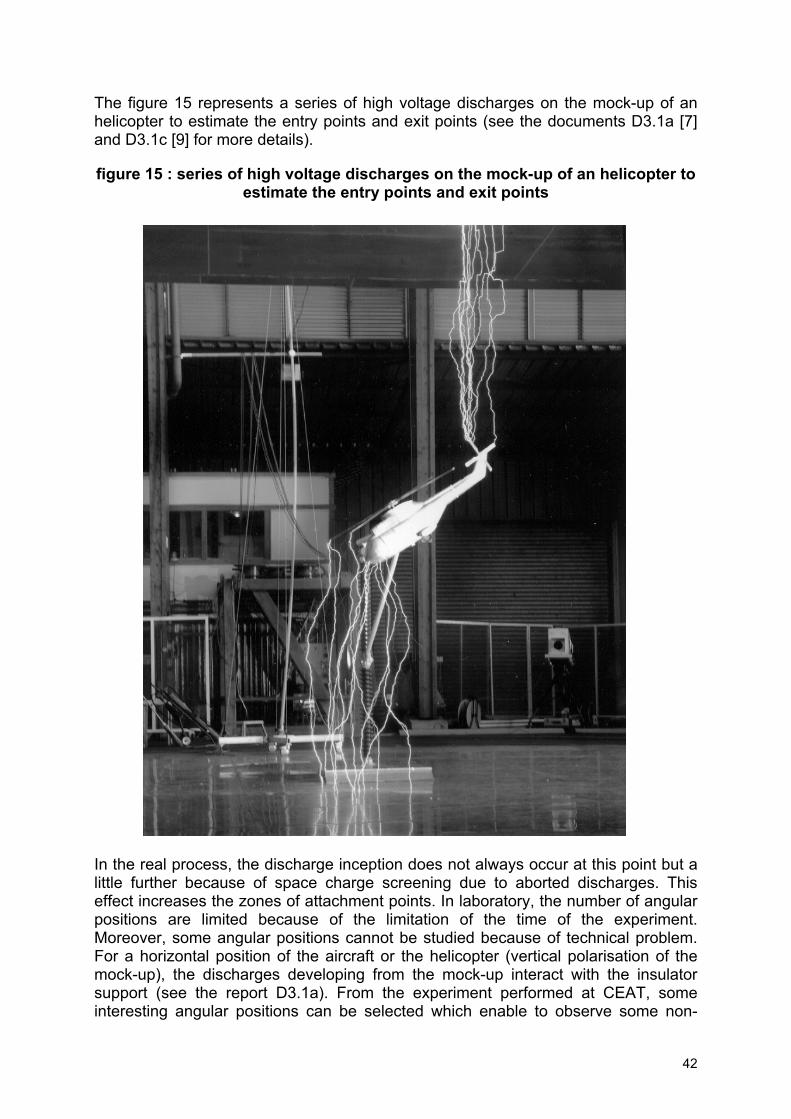
42
The figure 15 represents a series of high voltage discharges on the mock-up of an helicopter to estimate the entry points and exit points (see the documents D3.1a [7] and D3.1c [9] for more details).
figure 15 : series of high voltage discharges on the mock-up of an helicopter to estimate the entry points and exit points
In the real process, the discharge inception does not always occur at this point but a little further because of space charge screening due to aborted discharges. This effect increases the zones of attachment points. In laboratory, the number of angular positions are limited because of the limitation of the time of the experiment. Moreover, some angular positions cannot be studied because of technical problem. For a horizontal position of the aircraft or the helicopter (vertical polarisation of the mock-up), the discharges developing from the mock-up interact with the insulator support (see the report D3.1a). From the experiment performed at CEAT, some interesting angular positions can be selected which enable to observe some non-
43
obvious attachment points. From the configuration 7 (triggered configuration, see the report 3.1c [9] for more details), the zone of extension of the inception point of the discharge on the leading edge can be determined. The experiments on the triggered configurations have shown that the zone of inception of the negative discharge is always larger than the one of the positive discharge. The positive discharge initiates at the points of maximum field strength of the aircraft (extremities of the wings, the tail and the nose). No inception of positive discharge has been detected on engine or on leading edge. On contrary, negative discharge can also develop from the engine and the leading edge because of the electric field distribution at the aircraft surface produced by the net charge injected by the positive discharge development. The « intercepted » configurations have shown the main difference as a function of the polarity of the approaching discharge. When the discharge propagating in the vicinity of the aircraft is negative, a positive discharge can initiate from the aircraft and intercept the negative discharge. On the contrary, when the approaching discharge is positive, measurements have shown no process of interception. The connection occurs when the positive discharge reaches the mock-up. The distribution of the attachment points is only driven by the geometries of the positive discharge and the aircraft. The experiments have shown that the notion of striking distance cannot be accurately determined in laboratory because this parameter is strongly dependant of the stochastic direction of propagation of the approaching discharge. The laboratory experiment also shows the possible scenario involved during an interception. For instance, results of the experiment completed by numerical simulations have shown that for a same lightning strike, the entry and the exit points can be almost confounded. The positive and negative discharges can be initiated at approximately the same point. All the numerical simulations performed from the model of ONERA on all configurations have shown a good agreement with the experimental measurements and have enabled to give a good interpretation of the laboratory experimental results. Then, this constitutes a first level of validation of the model of ONERA. Moreover, the comparison between experiment and the numerical simulations has shown that the charge of corona can be used to determine the location of the strongest discharge which is likely to lead to the lightning. A further improvement of the ONERA and Dornier models will consist in using this criteria in order to infer the relative probability function from one point to an other that the discharge which develops from this point leads to the lightning. In the report D3.1b a second level of validation has been presented on a real aircraft. Indeed in the report D3.1b, it is shown that the critical ambient field leading to a lightning strike to an aircraft and computed by this model is quite consistent with the ambient field measured during in flight experiment. Moreover, the difference of times of inception between the positive and the negative discharge (dTab see report D2.1 [2]) inferred from the model of ONERA are in good agreement with the in flight measurement. Because of the validation with laboratory and in flight experiments, the results on the
44
attachment zone for a real aircraft deduced from these models should be consistent with the real phenomena. Then, this model can be considered as representative of the lightning strike to an aircraft and can be used to determine the initial zones of attachment of the lightning. The attachment zones inferred from the model of ONERA and presented in the report D3.1b [8] on A319 and on AS332 are representative of the real process. The results of the model of ONERA can be used as reference because of the above validation based on laboratory and in flight experiments. In particular, the model of ONERA is the only one which enables the determination of the entry and exit points. Laboratory experiments have shown that the electrostatic configuration strongly varies between the time of positive discharge inception and the time of negative discharge ignition. Then, the entry and exit points are not equivalent and a specific method has to be used to compute them. Some models, such as the models of BAe (Rolling sphere) and Dornier (positive leader inception model), only compute the entry points. In the following part, we propose what kind of input parameters must be chosen so that their results agree with those obtained with the model of ONERA. The general tendency of the rolling sphere method is to determine zones of attachment larger than the reality. The results on A319 performed with a sphere radius of 25 m show that this model enables to find the point of highest probability to be struck such as the extremities of the nose, the wing, the fin, the tail and the engine but it also includes zones which are likely reached during the sweeping phase (under the engine, under and above the fuselage). The electric field computations (Report D3.1a [7]) show that in these zones the electric field enhancement is not enough to lead to an ignition of a discharge. Then, the rolling sphere method defines a zone where attachment and some parts of sweeping zones are mixed. In the case of A319, the zone which contains 95% of the attachment points is too large because of the inclusion of sweeping zones (top and bottom of the fuselage, bottom of the engine). We can note that these « sweeping » zones are often associated with a low density of probability. One solution in order to decrease these zones of the attachment zones is to decrease the percentage to a value of 80 to 90%. To conclude, this model enables a fast computation of the attachment zones but it is necessary to optimise the input parameters (sphere radius and value of the percentage to delimit the attachment zones) and at the end, to make an interpretation of the results. The results on A319 for the entry points of the model of Dornier are quite close to the ones of the model of ONERA (see the document D3.1b). The entry points are located near the zone of maximum field strength. The probability to have an entry point on the leading edge is almost zero. The dimension of the zone on A319 are in good agreement with the dimension obtained on exit points with the model of ONERA. Finally, a global attachment zone can be determined by the model of Dornier with two computations: one to determine the entry points (Estab=5.5 kV/cm; Qnet=0 C; Qcrit=5 µC) and another one to compute the equivalent exit points (Estab=3 kV/cm; Qnet=-1 mC; Qcrit=5 µC). Obviously, the choice of the net charge to apply has to depend on the size of the aircraft or the helicopter via the capacity Cobj. To conclude, the models of Dornier and BAe can be used to give a quantitative
45
estimation of the dimensions of the attachment zone by employing a suitable choice of parameters.
I. Sweeping and hang-on analysis for two structures (document D3.2a)
A numerical model has been developed to investigate the dynamical effects which occur during the sweeping phase of lightning attachment. The deformation of the lightning channel occurs due to the subtle interaction of electromagnetic and hydrodynamic forces, leading ultimately to a re-connection event. The full-field solution of Maxwell’s equations has been coupled with fluid-dynamic advection to investigate the sweeping of the channel across a planar metallic plate. So, in the document D3.2a [10], the model is described, and results of the investigation presented. The physical modelling of the boundary layer region, the arc root conditions and the near-field effects in the vicinity of the structure are considered critical from the results obtained. So, the first step of this work consisted in a literature search that revealed that very little published material exists regarding the computational modelling of the swept phase of a lightning event. An approach had previously been made to model the event taking only the air flow over the wing into account. It was decided to approach this model using a combined electromagnetic and fluid dynamics approach. As such a number of decisions were taken as to the form of this modelling approach at the beginning of this work. The following decisions were made at that time, based on both the experience and the computational models available. The problem size and complexity was reduced from a full airframe to a rectangular section of the fuselage which was assumed to perfectly electrically conducting and flat. For example, the figure 16 shows the channel deformation during 5 ms (see the figure 20 of the document D3.2a for more details).
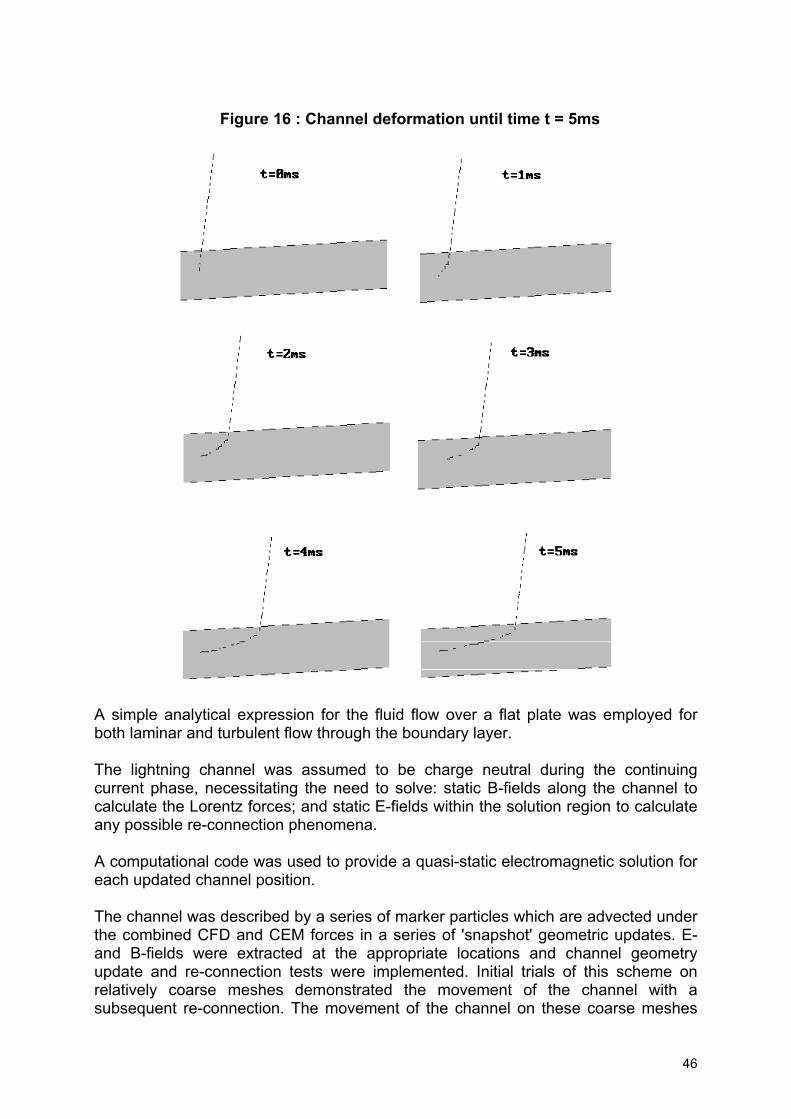
46
Figure 16 : Channel deformation until time t = 5ms
A simple analytical expression for the fluid flow over a flat plate was employed for both laminar and turbulent flow through the boundary layer. The lightning channel was assumed to be charge neutral during the continuing current phase, necessitating the need to solve: static B-fields along the channel to calculate the Lorentz forces; and static E-fields within the solution region to calculate any possible re-connection phenomena. A computational code was used to provide a quasi-static electromagnetic solution for each updated channel position. The channel was described by a series of marker particles which are advected under the combined CFD and CEM forces in a series of 'snapshot' geometric updates. E- and B-fields were extracted at the appropriate locations and channel geometry update and re-connection tests were implemented. Initial trials of this scheme on relatively coarse meshes demonstrated the movement of the channel with a subsequent re-connection. The movement of the channel on these coarse meshes
47
was dominated by the fluid dynamics however. The coarse nature of the mesh led to inaccuracies in channel geometry update because: The initial marker particles above the plate were constrained by the size of the first few mesh elements. Therefore the channel deformation was artificially held off the plate by mesh geometric considerations. The smaller movements of the marker particles in the region of the arc root were being discarded. If the forces acting on the particles were insufficient to move the particle more than half a cell then the particle remained where it was. Collectively these factors necessitated the need to refine the mesh within the boundary layer, particularly in those regions around the arc root and in the first few centimetres above the plate surface. It was during this phase of the work that some limitations of this modelling scheme came to light. The following list details these limitations.
1. The dynamic code used produces a solution on a hexahedral structured mesh. The flat plate was orthogonally aligned within such a mesh and the wire representation of the lightning channel was constrained to lie orthogonally within the mesh. The code has an oblique wire transform which removes the angular nature of this orthogonal constraint. However, this transform was not applicable to the quasi-static cases representing the lightning waveform and consequently the wire representation became stair-cased as it was deformed through the mesh.
2. The code used is a dynamic CEM code. To operate this quasi-statically a low
excitation frequency was chosen and the current in the channel ramped up for a wavecycle to a peak of 800A. The time taken to reach this state depends upon the frequency of operation and the size of the smallest cell within the mesh. Therefore, to keep solution run times within reasonable bounds it was necessary to choose a frequency that was not so low that the run time became unmanageable but not so high that the system began to exhibit dynamic behaviour. For frequencies satisfying this criterion it became evident that the size of the smallest cell would have a limiting effect on the solution times.
3. In order to capture the channel movement at the arc root due to the CEM as
well as the CFD forces a discretisation scheme requiring cell sizes in the order of mms or tenths of mms was required. The lightning channel is modelled by a wire within the FDTD scheme. One wire is used to model the lightning channel at the point of attachment, another at the exit point and a third return wire to connect the two. This return loop is a requirement of the FDTD scheme for a wire carrying a current source. A previous investigation was carried out into the separation of the channel wire from the return conductors to ensure that there was no coupling between them. This had revealed the need to place the return conductors a number of meters (approximately 6m) apart to ensure sufficiently low coupling. This requirement forced the problem space to be at least 6m3 whereas the region of interest with regard to CEM was of the order of a few cm3.
48
4. A graded mesh was generated to examine the arc root region and provide more cells within the first few cms above the plate. Solutions on this mesh took in the order of 7 hours to run on the CRAY C90 machine. The analysis blew up after only two snapshot updates. It was felt this was due to two major reasons: firstly that the mesh grade had been too severe; and secondly that there were insufficient cells between the plate and the deformed channel to accurately model the rapid E-field variation in the intervening space. A mesh grade of 1:10 may be supported by an FDTD scheme, however the mesh grade employed was much greater than this producing very long, thin cells within the meshed volume and causing instabilities through impedance mismatches at cell boundaries. The meshing scheme had been chosen to be this severe in an attempt to keep the run-time within viable limits. The first marker particle was just cells above the plate. As this was advected along the rapid change in E-field between the plate, where it was zero, and the parallel channel section, where it was of the order of 106 V/m, could not be captured and instabilities arose again. It is felt that approximately 10 cells should lie between the first marker particle and the plate for these fields to be accurately modelled.
5. The limiting factor to obtain a useful graded mesh is the need to stay within a
1:10 ratio. The small cell size in comparison to the entire problem domain means that a solution of such a mesh would take hundreds of hours to solve for just one snapshot. The method of current simulation within the FDTD scheme necessitates a large problem domain. A different method of achieving a steady current of 800A would need to be assessed. This could be achieved by removing the wavecycle ramp and instead excite the wire by turning the current on instantly to 800A and waiting for the subsequent ringing current to settle. This may produce a quicker solution time. Another solution would be to remove the long wire return path by encasing the plate with a box representative of an absorbent material. This would produce a reduction in the problem domain size and enable a more gentle mesh grade to be produced. A more desirable approach would be to remove the geometric limitations from the CEM mesh by using an interpolation scheme whereby a body-conforming representation of the wires could be placed within a mesh designed with only CEM considerations in mind.
The resultant effect of the noise introduced from the extraction of the field variables in close proximity to the plate was that although distension and deformation of the lightning channel was observed, the re-connection event was not confidently predicted to occur. This is believed to be attributable to issues of numerical conditioning, rather than any fundamental limitation of the simulation. Further work is required to progress alternative methods of determining the near-field effects.
J. Experimental results on hang-on/structure dependence (document D3.2b)
The document D3.2b [11] reviews the results of experiment on lightning sweeping conducted at the Moscow Power Engineering Institute.
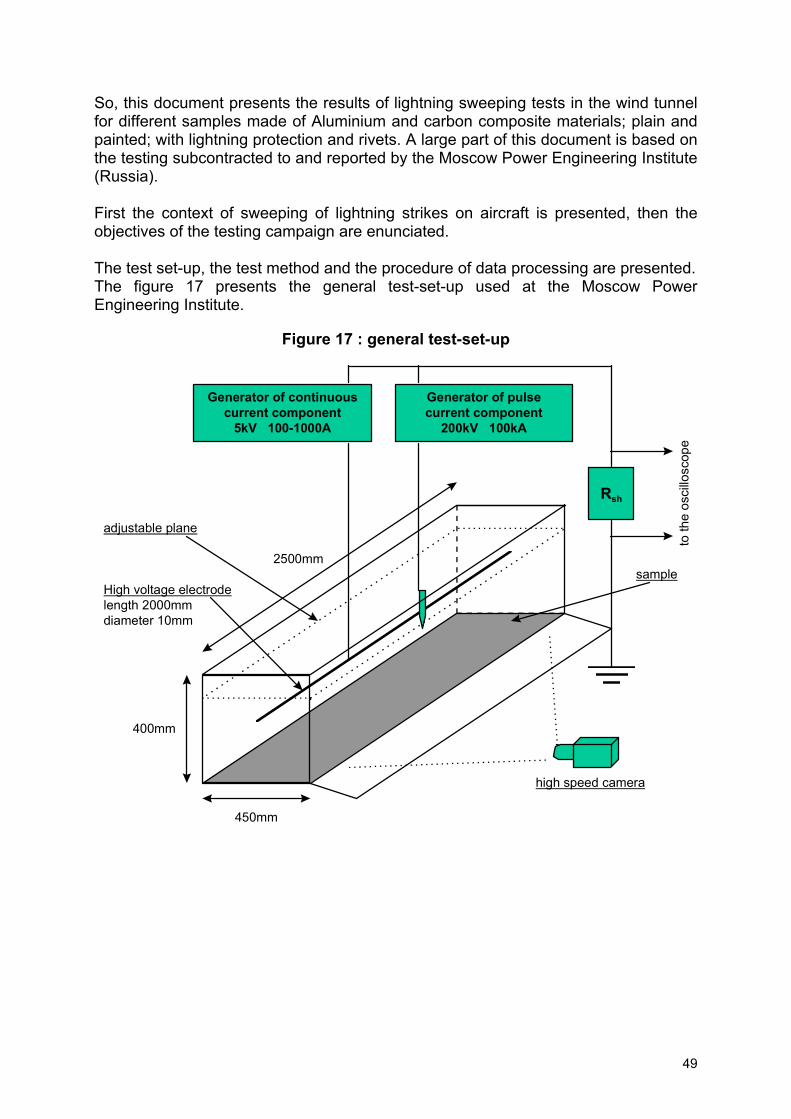
49
So, this document presents the results of lightning sweeping tests in the wind tunnel for different samples made of Aluminium and carbon composite materials; plain and painted; with lightning protection and rivets. A large part of this document is based on the testing subcontracted to and reported by the Moscow Power Engineering Institute (Russia). First the context of sweeping of lightning strikes on aircraft is presented, then the objectives of the testing campaign are enunciated. The test set-up, the test method and the procedure of data processing are presented. The figure 17 presents the general test-set-up used at the Moscow Power Engineering Institute.
Figure 17 : general test-set-up
Generator of continuouscurrent component
5kV 100-1000A
Generator of pulsecurrent component
200kV 100kA
450mm
400mm
2500mm
High voltage electrodelength 2000mmdiameter 10mm
adjustable plane
high speed camera
Rsh
to th
e os
cillo
scop
e
sample
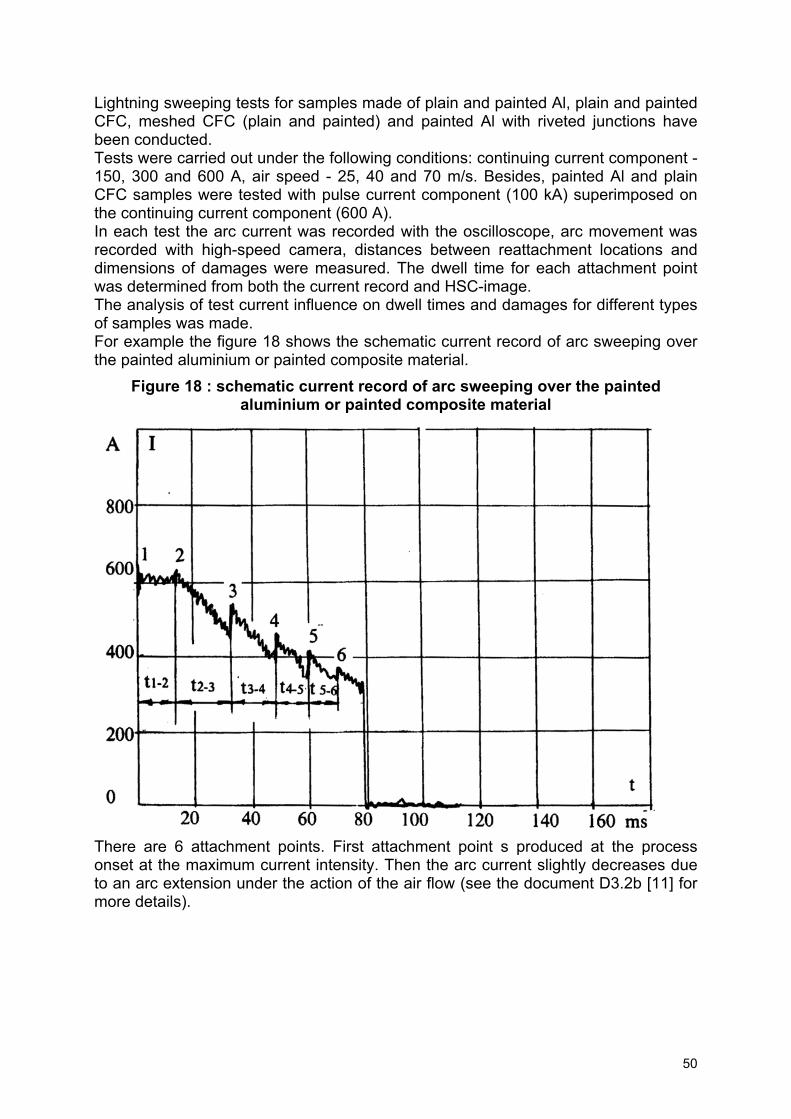
50
Lightning sweeping tests for samples made of plain and painted Al, plain and painted CFC, meshed CFC (plain and painted) and painted Al with riveted junctions have been conducted. Tests were carried out under the following conditions: continuing current component - 150, 300 and 600 A, air speed - 25, 40 and 70 m/s. Besides, painted Al and plain CFC samples were tested with pulse current component (100 kA) superimposed on the continuing current component (600 A). In each test the arc current was recorded with the oscilloscope, arc movement was recorded with high-speed camera, distances between reattachment locations and dimensions of damages were measured. The dwell time for each attachment point was determined from both the current record and HSC-image. The analysis of test current influence on dwell times and damages for different types of samples was made. For example the figure 18 shows the schematic current record of arc sweeping over the painted aluminium or painted composite material.
Figure 18 : schematic current record of arc sweeping over the painted aluminium or painted composite material
There are 6 attachment points. First attachment point s produced at the process onset at the maximum current intensity. Then the arc current slightly decreases due to an arc extension under the action of the air flow (see the document D3.2b [11] for more details).
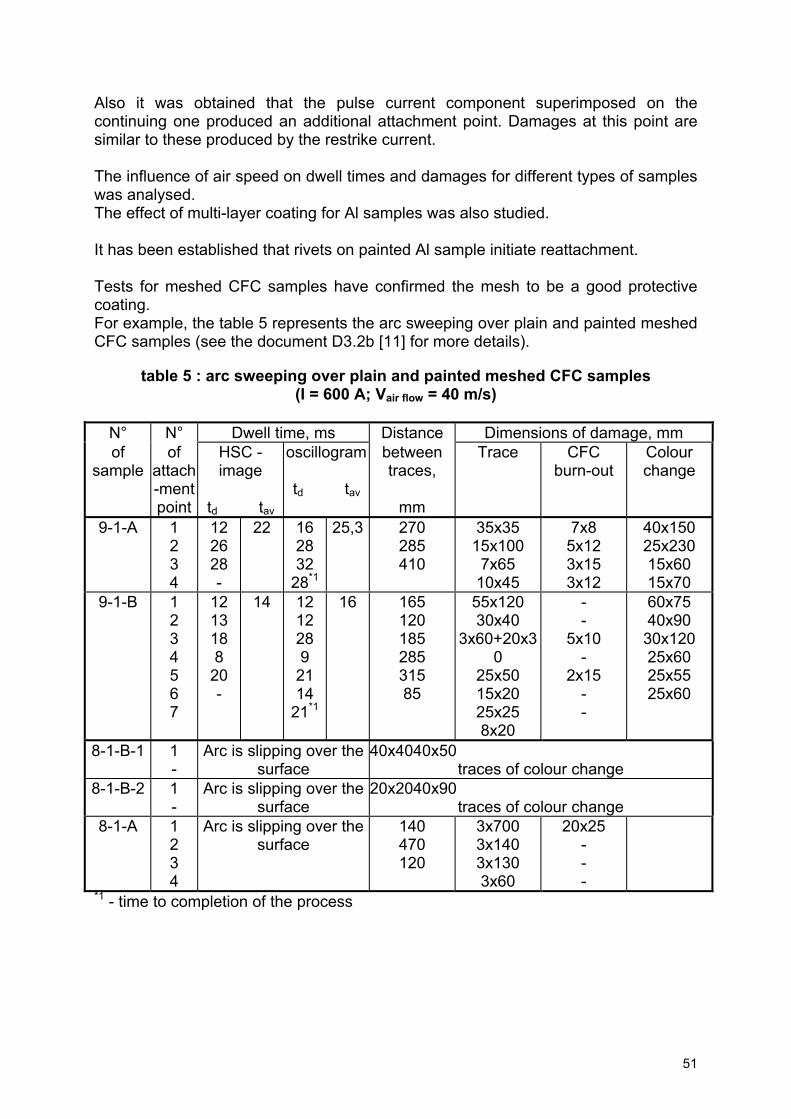
51
Also it was obtained that the pulse current component superimposed on the continuing one produced an additional attachment point. Damages at this point are similar to these produced by the restrike current. The influence of air speed on dwell times and damages for different types of samples was analysed. The effect of multi-layer coating for Al samples was also studied. It has been established that rivets on painted Al sample initiate reattachment. Tests for meshed CFC samples have confirmed the mesh to be a good protective coating. For example, the table 5 represents the arc sweeping over plain and painted meshed CFC samples (see the document D3.2b [11] for more details).
table 5 : arc sweeping over plain and painted meshed CFC samples (I = 600 A; Vair flow = 40 m/s)
N° N° Dwell time, ms Distance Dimensions of damage, mm of
sample of
attach-ment point
HSC - image
td tav
oscillogram td tav
between traces,
mm
Trace CFC burn-out
Colour change
9-1-A
1 2 3 4
12 26 28 -
22 16 28 32
28*1
25,3 270 285 410
35x35 15x100 7x65
10x45
7x8 5x12 3x15 3x12
40x150 25x230 15x60 15x70
9-1-B
1 2 3 4 5 6 7
12 13 18 8
20 -
14 12 12 28 9
21 14
21*1
16 165 120 185 285 315 85
55x120 30x40
3x60+20x30
25x50 15x20 25x25 8x20
- -
5x10 -
2x15 - -
60x75 40x90 30x120 25x60 25x55 25x60
8-1-B-1 1 -
Arc is slipping over the surface
40x4040x50 traces of colour change
8-1-B-2 1 -
Arc is slipping over the surface
20x2040x90 traces of colour change
8-1-A
1 2 3 4
Arc is slipping over the surface
140 470 120
3x700 3x140 3x130 3x60
20x25 - - -
*1 - time to completion of the process
52
Charge transferred through the attachment point was calculated for a number of reattachment points. Maximal value of the charge is 10-12 Coulombs. The average charge is lower by a 2-3 fold than the standard value adopted for lightning strike tests in Zone 2A. A closer analysis of these and future results of lightning sweeping tests should be made to evaluate more precisely this charge and its statistical distribution. The test parameter (duration of continuing current component) used in lightning strike tests for Zone 2A could then be refined. The test results for every type of samples are analysed in view of effects of the constant current component, air speed, material and surface conditions. Results of lightning sweeping tests enable to give some recommendations.
1. A small number of samples of the same type did not enable to make a reasonable statistical data processing. As known from previous experience at MEI, and as the arc sweeping has a random pattern, it would be necessary to test about 10 or more samples the same type to obtain more reliable data.
2. Results of tests for painted samples have shown a rather low quality of
painting that caused an additional spread in test data. In order to use the results of lightning sweeping tests for the aircraft design, tests should be conducted for samples with standard coatings.
3. In spite of the limited number of tested samples of the same type, test
results were in a good agreement with previous results obtained at the MPEI laboratory.
In conclusion some recommendations for applying the tested materials in the aircraft design are given.
K. Synthesis on sweeping/hang-on phase (document D3.2c) The document D3.2c [12] reviews the results concerning the sweeping phase of lightning at the aircraft surface. Experimental and theoretical approaches are commented and criticized. Results from experimental test campaign at MPEI are summarized and commented (see deliverable 3.2b [11]). BAe theoretical approach is also summarized (see the deliverable 3.2a [10]) and moreover, a physical model developed by MPEI and its first use are developed. At last, an assessment of arc sweeping taken into account and its perspectives for protection strategies of aircraft manufacturers are carried out. So, the document D3.2c [12] is a synthesis of work performed on the sweeping aspects of a lightning arc at the surface of the aircraft structure. First a bibliographical review and the study of some videos allow to present some results obtained these last years by the scientific community about sweeping arc aspects.
53
Secondly, a further analysis of the experimental tests performed at the Moscow Power Engineering Institute (see the deliverable 3.2b [11] of Fulmen project) permits to obtain additional results and conclusions on this work. Thirdly, 2 theoretical approaches are developed, one based on the development of a computational code taking into account both electromagnetic and aerodynamic aspects (BAe approach described into the deliverable 3.2a [10] of Fulmen project) and a more simple model based on a physical approach developed by the MPEI with associated first results. A global conclusion allows to make an assessment of both theoretical and experimental approaches and to identify what are the lack and the perspectives to improve the protection strategies of aircraft manufacturers concerning the arc sweeping on aircraft. Some review about the work and main results of MPEI experimental test campaign allows to list the following outputs:
1. Lightning sweeping tests for samples made of plain and painted Al, plain and painted CFC, meshed CFC (plain and painted) and painted Al with riveted junctions have been conducted.
2. Tests were carried out under the following conditions : continuing
current component - 150, 300 and 600 A, air speed - 25, 40 and 70 m/s. 3. Painted Al and plain CFC samples were tested with pulse current
component (100kA) superimposed on the continuing current component (600A). The experiments confirmed that damages at the attachment point by a pulse current component during lightning sweeping are similar to those produced by the restrike current under stationary conditions.
4. It has been established that rivets on painted Al sample contribute to
initiate reattachment points. 5. Charge transferred through the attachment point was calculated for a
number of reattachment points. Maximal value of the charge is 10-12 Coulombs. The average charge is lower by a 2-3 fold than the standard value adopted for lightning strike tests in Zone 2A. The results of lightning sweeping tests could be used to argue a possible decrease of test parameters (duration of continuing current component) in lightning strike tests for Zone 2B.
The table 6 presents a summary of average dwell time results obtained during the test campaign (see the document D3.2c [12] for more information).
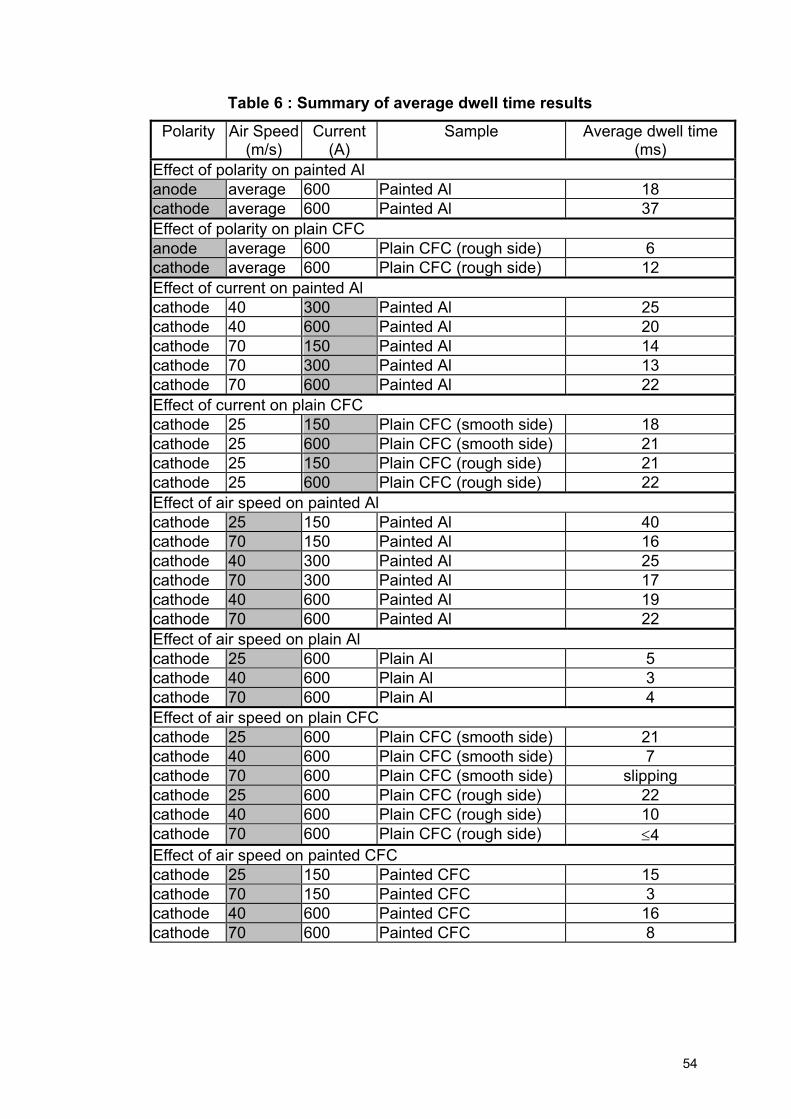
54
Table 6 : Summary of average dwell time results Polarity Air Speed
(m/s) Current
(A) Sample Average dwell time
(ms) Effect of polarity on painted Al anode average 600 Painted Al 18 cathode average 600 Painted Al 37 Effect of polarity on plain CFC anode average 600 Plain CFC (rough side) 6 cathode average 600 Plain CFC (rough side) 12 Effect of current on painted Al cathode 40 300 Painted Al 25 cathode 40 600 Painted Al 20 cathode 70 150 Painted Al 14 cathode 70 300 Painted Al 13 cathode 70 600 Painted Al 22 Effect of current on plain CFC cathode 25 150 Plain CFC (smooth side) 18 cathode 25 600 Plain CFC (smooth side) 21 cathode 25 150 Plain CFC (rough side) 21 cathode 25 600 Plain CFC (rough side) 22 Effect of air speed on painted Al cathode 25 150 Painted Al 40 cathode 70 150 Painted Al 16 cathode 40 300 Painted Al 25 cathode 70 300 Painted Al 17 cathode 40 600 Painted Al 19 cathode 70 600 Painted Al 22 Effect of air speed on plain Al cathode 25 600 Plain Al 5 cathode 40 600 Plain Al 3 cathode 70 600 Plain Al 4 Effect of air speed on plain CFC cathode 25 600 Plain CFC (smooth side) 21 cathode 40 600 Plain CFC (smooth side) 7 cathode 70 600 Plain CFC (smooth side) slipping cathode 25 600 Plain CFC (rough side) 22 cathode 40 600 Plain CFC (rough side) 10 cathode 70 600 Plain CFC (rough side) ≤4 Effect of air speed on painted CFC cathode 25 150 Painted CFC 15 cathode 70 150 Painted CFC 3 cathode 40 600 Painted CFC 16 cathode 70 600 Painted CFC 8
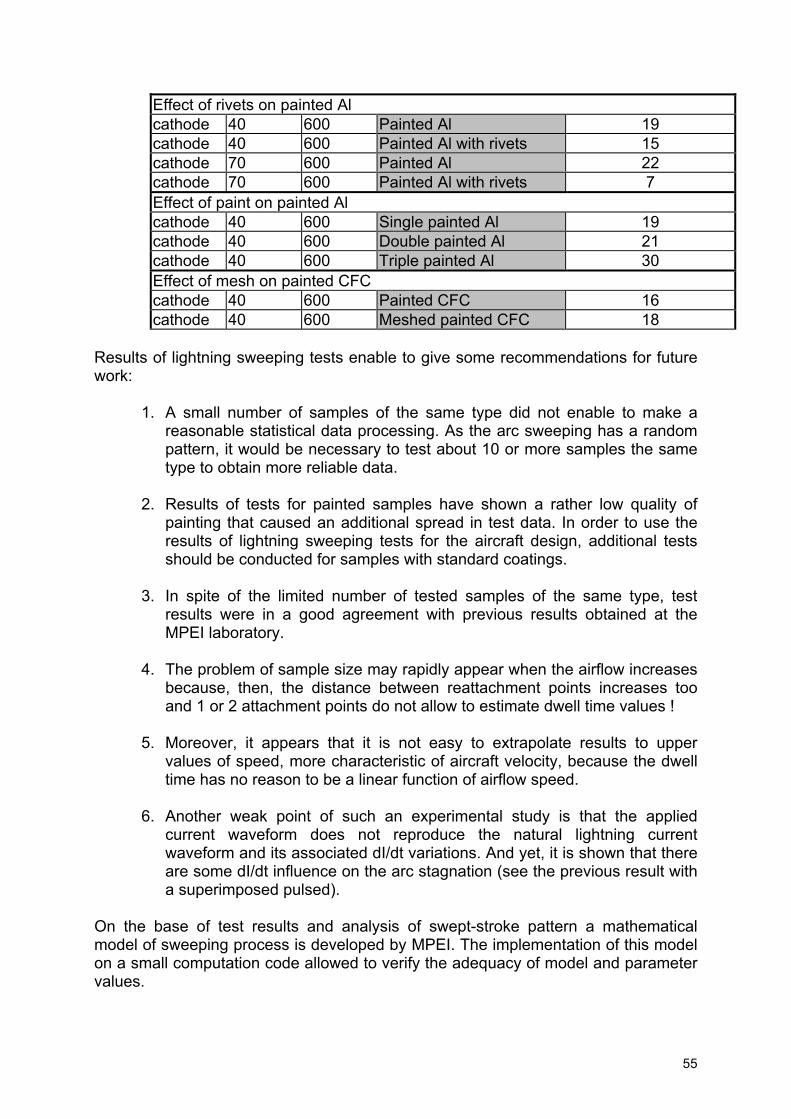
55
Effect of rivets on painted Al cathode 40 600 Painted Al 19 cathode 40 600 Painted Al with rivets 15 cathode 70 600 Painted Al 22 cathode 70 600 Painted Al with rivets 7 Effect of paint on painted Al cathode 40 600 Single painted Al 19 cathode 40 600 Double painted Al 21 cathode 40 600 Triple painted Al 30 Effect of mesh on painted CFC cathode 40 600 Painted CFC 16 cathode 40 600 Meshed painted CFC 18
Results of lightning sweeping tests enable to give some recommendations for future work:
1. A small number of samples of the same type did not enable to make a reasonable statistical data processing. As the arc sweeping has a random pattern, it would be necessary to test about 10 or more samples the same type to obtain more reliable data.
2. Results of tests for painted samples have shown a rather low quality of
painting that caused an additional spread in test data. In order to use the results of lightning sweeping tests for the aircraft design, additional tests should be conducted for samples with standard coatings.
3. In spite of the limited number of tested samples of the same type, test
results were in a good agreement with previous results obtained at the MPEI laboratory.
4. The problem of sample size may rapidly appear when the airflow increases
because, then, the distance between reattachment points increases too and 1 or 2 attachment points do not allow to estimate dwell time values !
5. Moreover, it appears that it is not easy to extrapolate results to upper
values of speed, more characteristic of aircraft velocity, because the dwell time has no reason to be a linear function of airflow speed.
6. Another weak point of such an experimental study is that the applied
current waveform does not reproduce the natural lightning current waveform and its associated dI/dt variations. And yet, it is shown that there are some dI/dt influence on the arc stagnation (see the previous result with a superimposed pulsed).
On the base of test results and analysis of swept-stroke pattern a mathematical model of sweeping process is developed by MPEI. The implementation of this model on a small computation code allowed to verify the adequacy of model and parameter values.
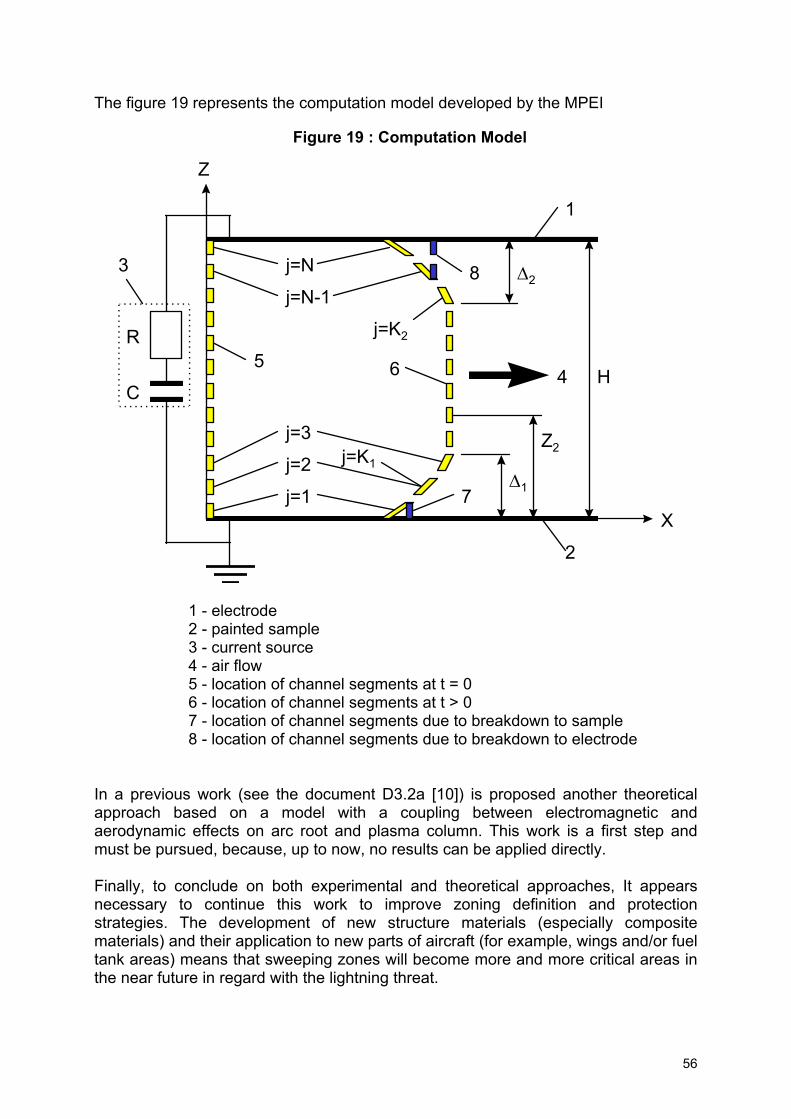
56
The figure 19 represents the computation model developed by the MPEI
Figure 19 : Computation Model
H
R
C
X
Z
7
8 ∆2
j=K1
4
1
2
j=N
5
∆1
j=K2
j=N-1
j=1
j=2
j=3 Z2
3
6
1 - electrode 2 - painted sample 3 - current source 4 - air flow 5 - location of channel segments at t = 0 6 - location of channel segments at t > 0 7 - location of channel segments due to breakdown to sample 8 - location of channel segments due to breakdown to electrode
In a previous work (see the document D3.2a [10]) is proposed another theoretical approach based on a model with a coupling between electromagnetic and aerodynamic effects on arc root and plasma column. This work is a first step and must be pursued, because, up to now, no results can be applied directly. Finally, to conclude on both experimental and theoretical approaches, It appears necessary to continue this work to improve zoning definition and protection strategies. The development of new structure materials (especially composite materials) and their application to new parts of aircraft (for example, wings and/or fuel tank areas) means that sweeping zones will become more and more critical areas in the near future in regard with the lightning threat.
57
L. Improved lightning waveform (document D4.1) The document D4.1 [13] reviews the results concerning the definition of the external threat and especially about the improving of waveforms. A new lightning environment is proposed; it will constitute a basis for discussion into regulation committees like the EUROCAE lightning group (WG31) for the regulatory document improvement. The Fulmen project deals with a better understanding of the lightning threat. In particular, the knowledge of the lightning current waveform is fundamental for the aircraft manufacturers , flight operators and regulation committees because of its consequences on the protection strategies. So it consisted, here, firstly, to make an assessment of the knowledge concerning the lightning waveform characteristics. A synthesis and analysis of available data (ground and in-flight measurements) are carried out. Secondly, a proposal for a new applicable environment is made. Finally, some recommendations about the definition of the threat, its applicability and regulation perspectives are made. This document is essentially based on the results of the following tasks of the Fulmen project :
• Analysis of data from in-flight measurements. (document D2.1 [2])
• Collection of data from ground measurements. (document D2.5B/I [4])
• Collection and analysis of data from reported in-flight incidents.(document D2.5B/II [5])
• Experimental investigation of the lightning sweeping phase.(document D3.2b [11])
There still remains open questions for future improvement of the regulation. The needs with the aeronautical community involved in the lightning protection aspects and the weak points due to an insufficient knowledge of lightning / aircraft interaction of this same community are dealt with. Firstly, it appears that, despite of a real need of data, there exists an insufficient quantity of records of inter/intra cloud(s) strikes and of their related characteristics. Secondly, another weak point is that there does not exist a still no clear consensus on the definition of a number of parameters used to define lightning :intensity, waveform shape, d²i/dt², rise-time, action integral, charge transfer, restrike number, voltage parameters, … Thirdly, there is a clear lack of data for E and dE/dt values. E and dE/dt characterisation is missing, in spite of the fact that it is important for attachment tests and induced voltage studies. No documents adequately describe and quantify E and dE/dt although most documents specify voltage test waveforms for dielectric attachment tests.
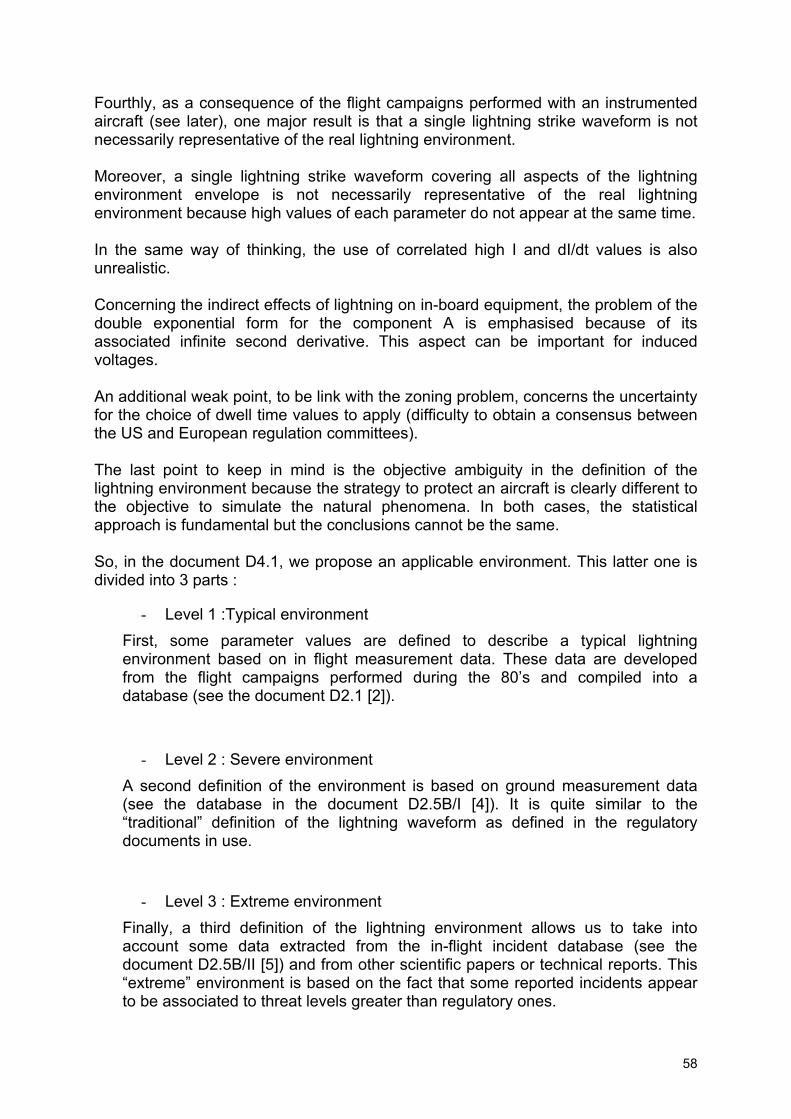
58
Fourthly, as a consequence of the flight campaigns performed with an instrumented aircraft (see later), one major result is that a single lightning strike waveform is not necessarily representative of the real lightning environment. Moreover, a single lightning strike waveform covering all aspects of the lightning environment envelope is not necessarily representative of the real lightning environment because high values of each parameter do not appear at the same time. In the same way of thinking, the use of correlated high I and dI/dt values is also unrealistic. Concerning the indirect effects of lightning on in-board equipment, the problem of the double exponential form for the component A is emphasised because of its associated infinite second derivative. This aspect can be important for induced voltages. An additional weak point, to be link with the zoning problem, concerns the uncertainty for the choice of dwell time values to apply (difficulty to obtain a consensus between the US and European regulation committees). The last point to keep in mind is the objective ambiguity in the definition of the lightning environment because the strategy to protect an aircraft is clearly different to the objective to simulate the natural phenomena. In both cases, the statistical approach is fundamental but the conclusions cannot be the same. So, in the document D4.1, we propose an applicable environment. This latter one is divided into 3 parts :
- Level 1 :Typical environment First, some parameter values are defined to describe a typical lightning environment based on in flight measurement data. These data are developed from the flight campaigns performed during the 80’s and compiled into a database (see the document D2.1 [2]).
- Level 2 : Severe environment A second definition of the environment is based on ground measurement data (see the database in the document D2.5B/I [4]). It is quite similar to the “traditional” definition of the lightning waveform as defined in the regulatory documents in use.
- Level 3 : Extreme environment Finally, a third definition of the lightning environment allows us to take into account some data extracted from the in-flight incident database (see the document D2.5B/II [5]) and from other scientific papers or technical reports. This “extreme” environment is based on the fact that some reported incidents appear to be associated to threat levels greater than regulatory ones.
59
The figure 20 below describes the links between the 3 parts of the applicable environment. The level 2 entirely contains the level 1 and the level 3 entirely contains levels 1 and 2.
Figure 20 : the applicable environment
Typical In flight measurements
level 1
Severe Ground data
level 2
Extreme In flight incident/special meteorological conditions
level 3
Firstly, a customisation of the threat appears appropriate, especially for cases included into the level 3 of threat (extreme environment). Indeed, past and current practice has been to apply the same protection requirement, based on the same threat to all aircraft. As noted in above, there are differences in the occurrence of the interception of lightning strikes to ground for some aircraft, which because of the great difference in the severity of the event, could reasonably indicate the need for different threats for different aircraft roles. For instance, in maritime reconnaissance roles, aircraft fly low for extended periods and may fly rigid patterns regardless of the weather, whereas a civil transport aircraft will fly low only just after take-off and just before landing. Furthermore, the civil transport aircraft will usually make every effort to fly around thunder-storms rather than fly through them to avoid the severe turbulence likely to be found in such cloud systems. Thus, the maritime reconnaissance aircraft is many times more likely to encounter the severe lightning strike to ground than the transport aircraft in normal airline service. In the same way, helicopters, like the maritime reconnaissance aircraft, tend to fly at lower altitudes, and in their support role for off-shore oil and gas facilities, have to fly regardless of the weather. Consequently, there is a growing body of evidence that
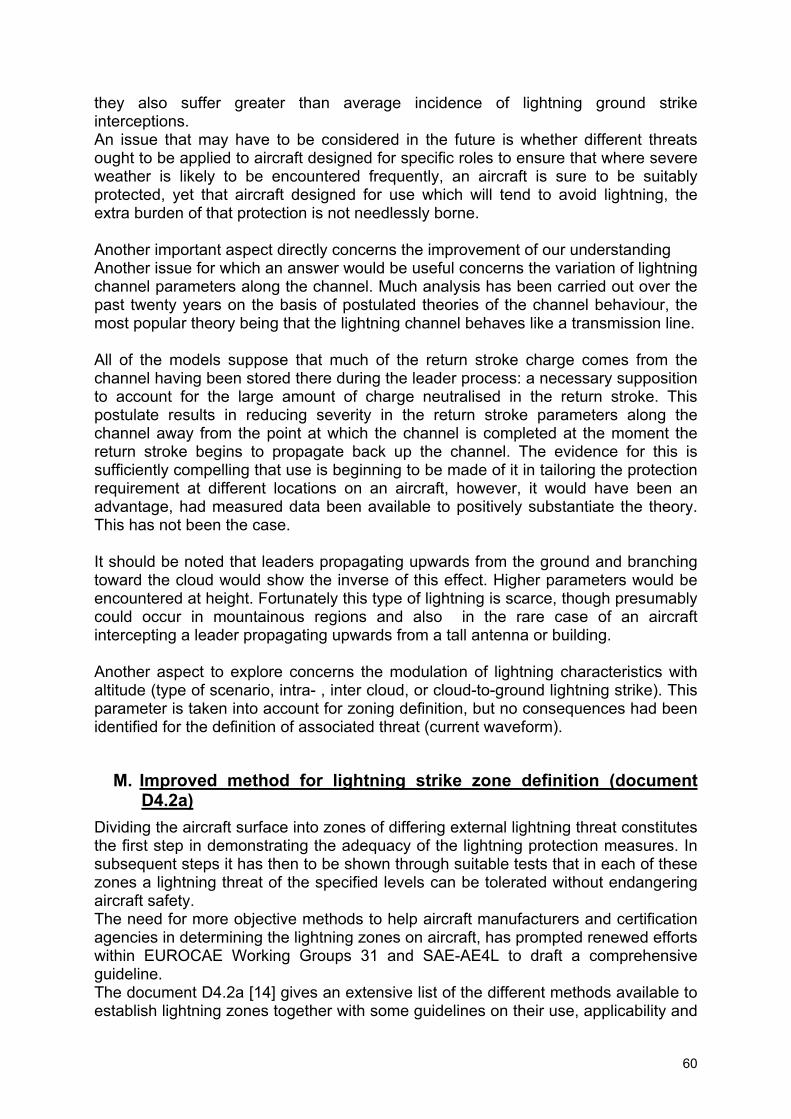
60
they also suffer greater than average incidence of lightning ground strike interceptions. An issue that may have to be considered in the future is whether different threats ought to be applied to aircraft designed for specific roles to ensure that where severe weather is likely to be encountered frequently, an aircraft is sure to be suitably protected, yet that aircraft designed for use which will tend to avoid lightning, the extra burden of that protection is not needlessly borne. Another important aspect directly concerns the improvement of our understanding Another issue for which an answer would be useful concerns the variation of lightning channel parameters along the channel. Much analysis has been carried out over the past twenty years on the basis of postulated theories of the channel behaviour, the most popular theory being that the lightning channel behaves like a transmission line. All of the models suppose that much of the return stroke charge comes from the channel having been stored there during the leader process: a necessary supposition to account for the large amount of charge neutralised in the return stroke. This postulate results in reducing severity in the return stroke parameters along the channel away from the point at which the channel is completed at the moment the return stroke begins to propagate back up the channel. The evidence for this is sufficiently compelling that use is beginning to be made of it in tailoring the protection requirement at different locations on an aircraft, however, it would have been an advantage, had measured data been available to positively substantiate the theory. This has not been the case. It should be noted that leaders propagating upwards from the ground and branching toward the cloud would show the inverse of this effect. Higher parameters would be encountered at height. Fortunately this type of lightning is scarce, though presumably could occur in mountainous regions and also in the rare case of an aircraft intercepting a leader propagating upwards from a tall antenna or building. Another aspect to explore concerns the modulation of lightning characteristics with altitude (type of scenario, intra- , inter cloud, or cloud-to-ground lightning strike). This parameter is taken into account for zoning definition, but no consequences had been identified for the definition of associated threat (current waveform).
M. Improved method for lightning strike zone definition (document D4.2a)
Dividing the aircraft surface into zones of differing external lightning threat constitutes the first step in demonstrating the adequacy of the lightning protection measures. In subsequent steps it has then to be shown through suitable tests that in each of these zones a lightning threat of the specified levels can be tolerated without endangering aircraft safety. The need for more objective methods to help aircraft manufacturers and certification agencies in determining the lightning zones on aircraft, has prompted renewed efforts within EUROCAE Working Groups 31 and SAE-AE4L to draft a comprehensive guideline. The document D4.2a [14] gives an extensive list of the different methods available to establish lightning zones together with some guidelines on their use, applicability and
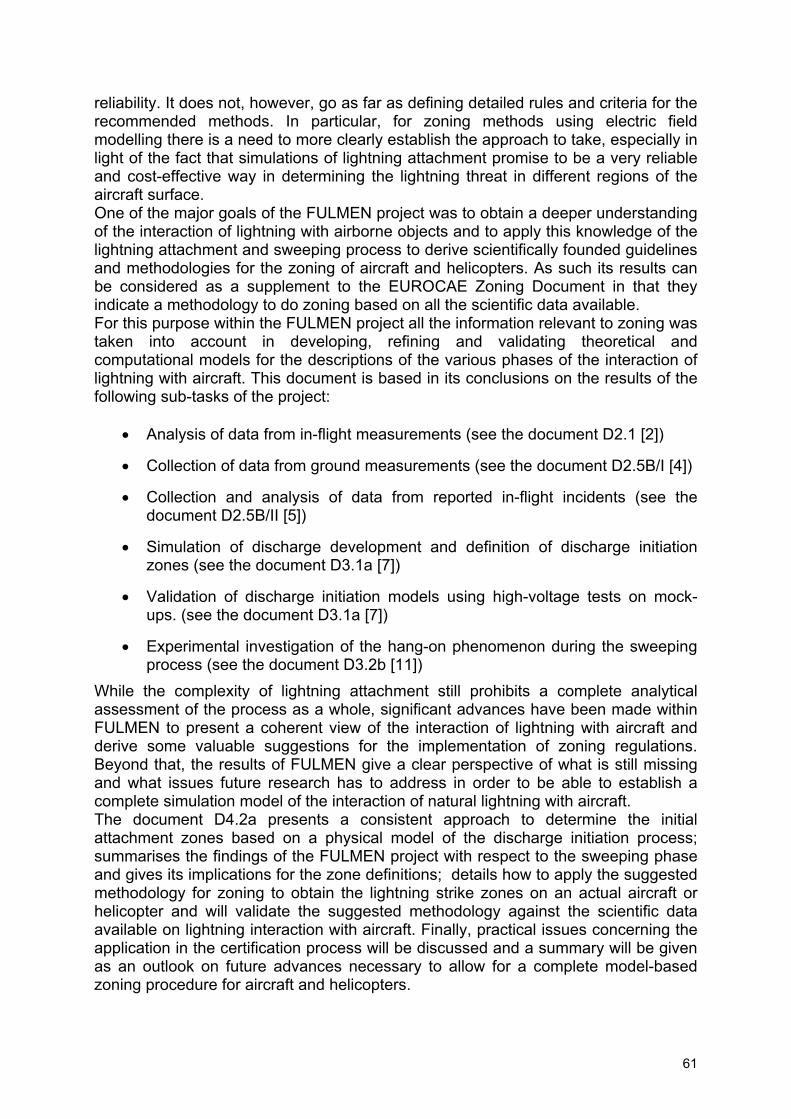
61
reliability. It does not, however, go as far as defining detailed rules and criteria for the recommended methods. In particular, for zoning methods using electric field modelling there is a need to more clearly establish the approach to take, especially in light of the fact that simulations of lightning attachment promise to be a very reliable and cost-effective way in determining the lightning threat in different regions of the aircraft surface. One of the major goals of the FULMEN project was to obtain a deeper understanding of the interaction of lightning with airborne objects and to apply this knowledge of the lightning attachment and sweeping process to derive scientifically founded guidelines and methodologies for the zoning of aircraft and helicopters. As such its results can be considered as a supplement to the EUROCAE Zoning Document in that they indicate a methodology to do zoning based on all the scientific data available. For this purpose within the FULMEN project all the information relevant to zoning was taken into account in developing, refining and validating theoretical and computational models for the descriptions of the various phases of the interaction of lightning with aircraft. This document is based in its conclusions on the results of the following sub-tasks of the project:
• Analysis of data from in-flight measurements (see the document D2.1 [2])
• Collection of data from ground measurements (see the document D2.5B/I [4])
• Collection and analysis of data from reported in-flight incidents (see the document D2.5B/II [5])
• Simulation of discharge development and definition of discharge initiation zones (see the document D3.1a [7])
• Validation of discharge initiation models using high-voltage tests on mock-ups. (see the document D3.1a [7])
• Experimental investigation of the hang-on phenomenon during the sweeping process (see the document D3.2b [11])
While the complexity of lightning attachment still prohibits a complete analytical assessment of the process as a whole, significant advances have been made within FULMEN to present a coherent view of the interaction of lightning with aircraft and derive some valuable suggestions for the implementation of zoning regulations. Beyond that, the results of FULMEN give a clear perspective of what is still missing and what issues future research has to address in order to be able to establish a complete simulation model of the interaction of natural lightning with aircraft. The document D4.2a presents a consistent approach to determine the initial attachment zones based on a physical model of the discharge initiation process; summarises the findings of the FULMEN project with respect to the sweeping phase and gives its implications for the zone definitions; details how to apply the suggested methodology for zoning to obtain the lightning strike zones on an actual aircraft or helicopter and will validate the suggested methodology against the scientific data available on lightning interaction with aircraft. Finally, practical issues concerning the application in the certification process will be discussed and a summary will be given as an outlook on future advances necessary to allow for a complete model-based zoning procedure for aircraft and helicopters.
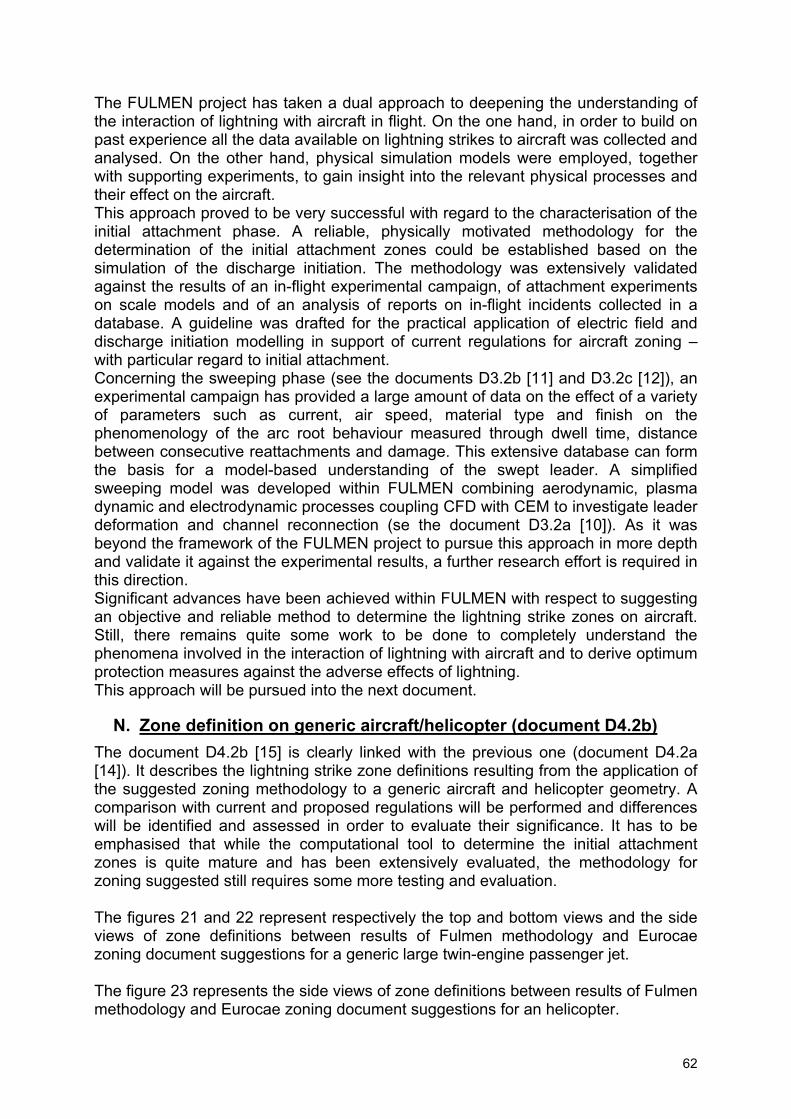
62
The FULMEN project has taken a dual approach to deepening the understanding of the interaction of lightning with aircraft in flight. On the one hand, in order to build on past experience all the data available on lightning strikes to aircraft was collected and analysed. On the other hand, physical simulation models were employed, together with supporting experiments, to gain insight into the relevant physical processes and their effect on the aircraft. This approach proved to be very successful with regard to the characterisation of the initial attachment phase. A reliable, physically motivated methodology for the determination of the initial attachment zones could be established based on the simulation of the discharge initiation. The methodology was extensively validated against the results of an in-flight experimental campaign, of attachment experiments on scale models and of an analysis of reports on in-flight incidents collected in a database. A guideline was drafted for the practical application of electric field and discharge initiation modelling in support of current regulations for aircraft zoning – with particular regard to initial attachment. Concerning the sweeping phase (see the documents D3.2b [11] and D3.2c [12]), an experimental campaign has provided a large amount of data on the effect of a variety of parameters such as current, air speed, material type and finish on the phenomenology of the arc root behaviour measured through dwell time, distance between consecutive reattachments and damage. This extensive database can form the basis for a model-based understanding of the swept leader. A simplified sweeping model was developed within FULMEN combining aerodynamic, plasma dynamic and electrodynamic processes coupling CFD with CEM to investigate leader deformation and channel reconnection (se the document D3.2a [10]). As it was beyond the framework of the FULMEN project to pursue this approach in more depth and validate it against the experimental results, a further research effort is required in this direction. Significant advances have been achieved within FULMEN with respect to suggesting an objective and reliable method to determine the lightning strike zones on aircraft. Still, there remains quite some work to be done to completely understand the phenomena involved in the interaction of lightning with aircraft and to derive optimum protection measures against the adverse effects of lightning. This approach will be pursued into the next document.
N. Zone definition on generic aircraft/helicopter (document D4.2b) The document D4.2b [15] is clearly linked with the previous one (document D4.2a [14]). It describes the lightning strike zone definitions resulting from the application of the suggested zoning methodology to a generic aircraft and helicopter geometry. A comparison with current and proposed regulations will be performed and differences will be identified and assessed in order to evaluate their significance. It has to be emphasised that while the computational tool to determine the initial attachment zones is quite mature and has been extensively evaluated, the methodology for zoning suggested still requires some more testing and evaluation. The figures 21 and 22 represent respectively the top and bottom views and the side views of zone definitions between results of Fulmen methodology and Eurocae zoning document suggestions for a generic large twin-engine passenger jet. The figure 23 represents the side views of zone definitions between results of Fulmen methodology and Eurocae zoning document suggestions for an helicopter.
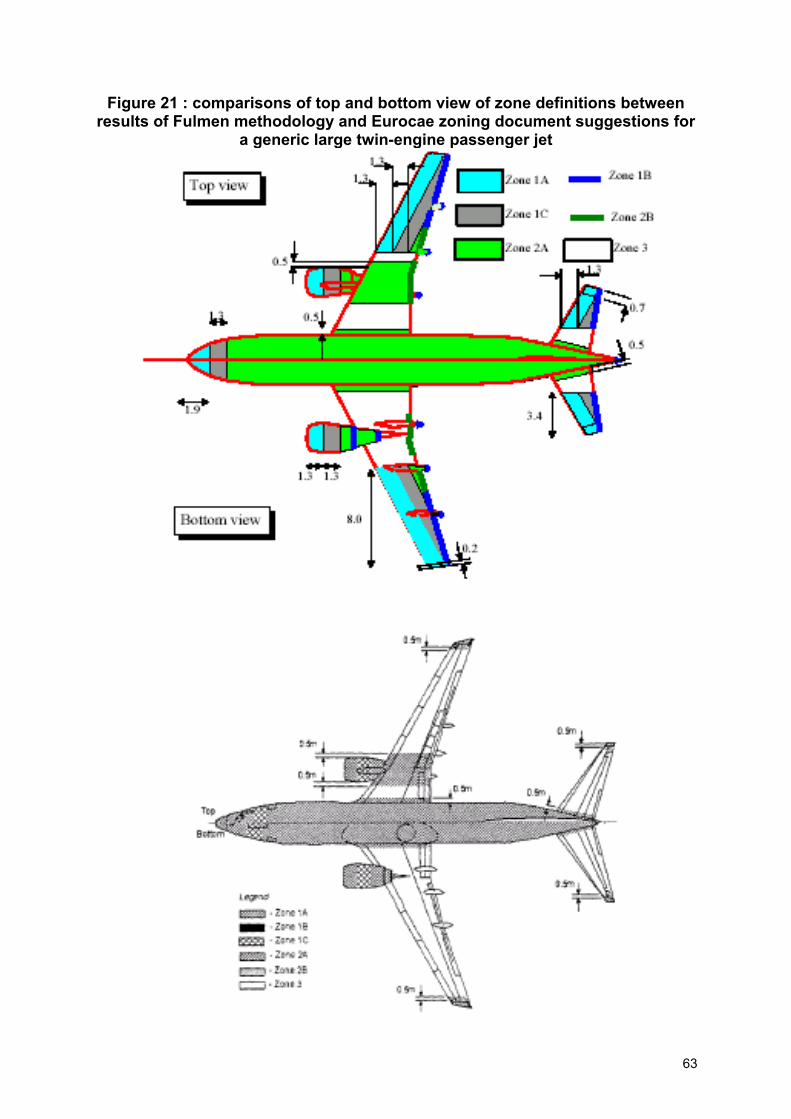
63
Figure 21 : comparisons of top and bottom view of zone definitions between results of Fulmen methodology and Eurocae zoning document suggestions for
a generic large twin-engine passenger jet
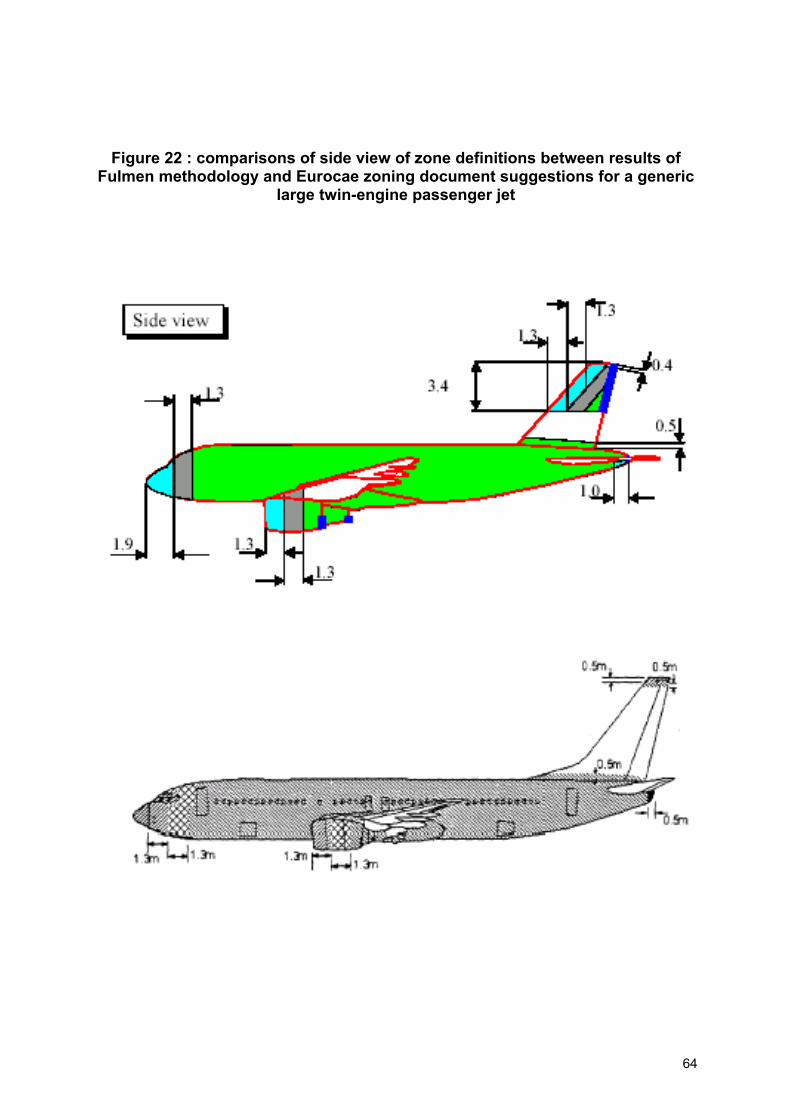
64
Figure 22 : comparisons of side view of zone definitions between results of Fulmen methodology and Eurocae zoning document suggestions for a generic
large twin-engine passenger jet
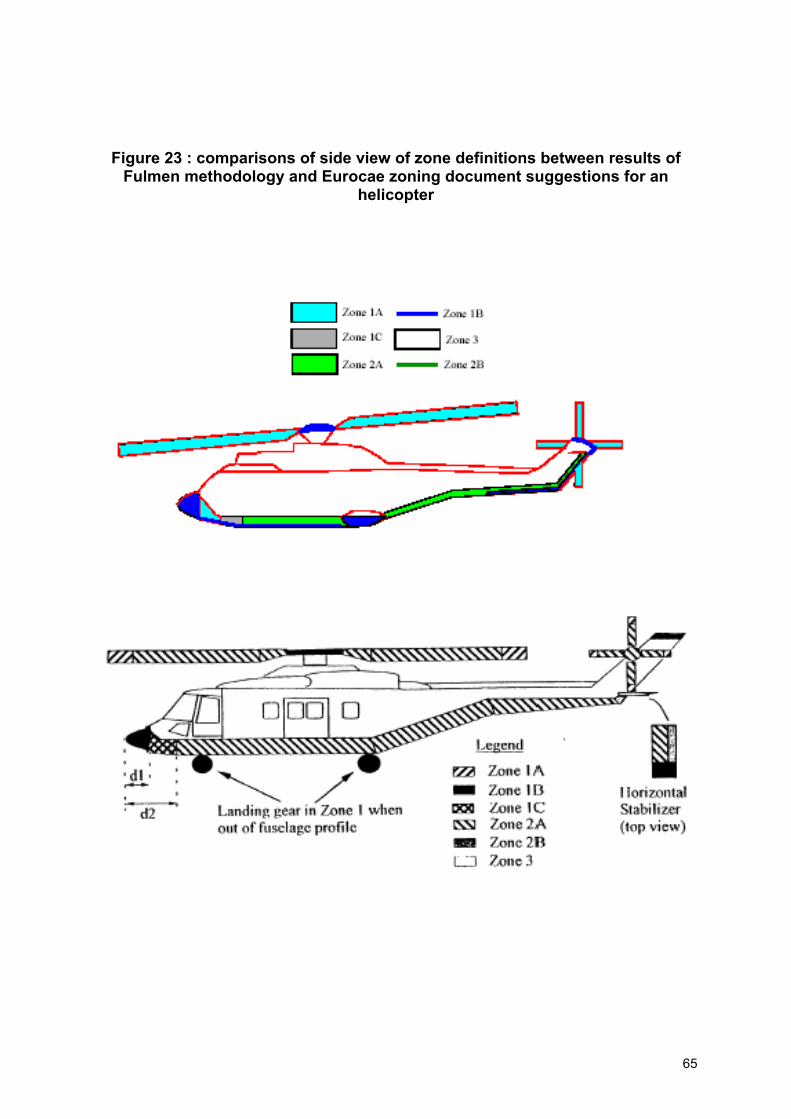
65
Figure 23 : comparisons of side view of zone definitions between results of Fulmen methodology and Eurocae zoning document suggestions for an
helicopter
66
On the figures 21, 22 and 23, there is a very good agreement for most part of the aircraft between the Fulmen results and the EUROCAE zoning document. For the twin-engine passenger jet, some differences are clearly visible on the leading edges on wings and fins with the initial attachment zones. The zone definitions obtained from the Fulmen methodology are currently based on a worst case approach in which all attachment regions are treated the same regardless of the likelihood of an attachment incident occurring. Another aspect that may have contributed to an exaggeration of the initial attachment zone extensions at leading and trailing edges of wings and fins is the relative coarseness of the mesh at these locations. For the helicopter on the figure 23, some differences are visible at the nose, the main and tail rotors as well as on the bottom of the helicopter cell and tail. Therefore the zone definitions presented for the generic aircraft and helicopter have to be taken with caution. The models used within the Fulmen project – an A319 aircraft and an AS332 “SuperPuma” helicopter – served as the representatives for these two categories. The computations for the determination of the initial attachment zones were performed on a given set of meshes without the possibility of studying the influence of the discretisation. Also, the issue of the relative probability of lightning attachment could not be investigated in depth and time as well as resource constraints prohibited a detailed theoretical analysis of the sweeping phase that mainly determines the distribution of different zones on an aircraft. These reservations are explained in more detail in the relevant section of the report D4.2b [15]. Still, despite these reservations the results for the zone definitions obtained through the suggested methodology show promise for the establishment of an objective guideline for zoning an aircraft. It is important to reconcile the suggested methodology and the resulting zone definitions with current zoning practice in order for it to become widely acceptable. In general two aspects of the refined zoning approach seem to be responsible for the differences observed :
• In the absence of a validated probability approach, areas with initial attachment probability so low that lightning attachments to them have not been observed in nature, are also included in the initial attachment zone.
• The coarseness of the meshes used for the computations has enlarged the local field amplification and with it the initial attachment zone as obtained in the computations performed within Fulmen.
Significant advances have been achieved with respect to suggesting an objective and reliable method to determine the lightning strike zones on aircraft. Still there remains quite some work to be done to completely understand the phenomena involved in the interaction of lightning with aircraft and to derive optimum protection measures against the adverse effects of lightning. Currently, safety considerations mandate a worst case approach. However, as not all adverse conditions occur simultaneously in a single lightning strike, this approach leads to an overprotection of the aircraft structure in most instances. What is needed here is a detailed, reliable and consistent assessment of the actual direct threat posed by lightning to different parts of the aircraft structure. Such an ambitious goal, however, requires the detailed simulation of the whole interaction process between the lightning leader and the aircraft, starting with the discharge initiation, via the arrival of the first and subsequent return strokes during
67
the sweeping phase to the hang-on processes up to the end of the lightning flash. The simulation model will have to account for the motion of the aircraft with respect to its electromagnetic environment, describe the processes of channel deformation and reconnection during the sweeping phase and simulate the charge flow across the aircraft during the arrival of the first and subsequent return strokes as well as of restrikes and recoil streamers. It will correctly model lightning strikes of both polarities and be valid for cloud-to-ground, cloud-to-cloud and intra-cloud flashes. De tails on the aircraft such as non-conducting or dielectric surfaces or protruding parts should be resolved precisely with respect to their influence on discharge initiation and swept stroke propagation as well as with regard to their susceptibility to damage.. Such a complete model will not only be able to accurately determine the local threat posed by a lightning strike, it will also allow to optimise the local protection accordingly – leading to significant savings with respect to cost, weight and effort. Beyond that a complete understanding of the interaction processes may actually make it feasible to devise measures to divert the lightning arc and current from a large part of the aircraft surface to a few adequately protected areas and paths significantly enhancing aircraft safety.
O. Inclusion in zoning defined criticality of different parts (document D4.3)
There has long been debate on how accurate lightning attachment zoning assessment needs to be. There are widely held views in aerospace companies that, if they encompass 50% or 75% of lightning strikes in the zones they define, that will be good enough. Often these views accompany an unwillingness or inability to do better. In France, Germany and UK, it has been recognised that we need to predict these attachment zones to a better accuracy, and computational methods have been devised to do so, but no one has really known just how accurate they do need to be. BAe have for a long time proposed that a figure of 99% or 99.9% may be realistic targets. The purpose of the report D4.3 [16] is to present an initial attempt to found a case for the required degree of accuracy on probability grounds. To do this, the author has started with the statutory requirement on aircraft manufacturers to design to an ultimate probability of catastrophic loss of an aircraft. This statutory requirement is not defined specifically for loss from lightning strike, but is defined for unspecified causes as two orders of magnitude less likely than the probability of loss from all causes cumulatively. An argument is then built from the probabilities of threat levels, their likelihood of attaching to an aircraft, and the probability of the aircraft being vulnerable to them. Only the probability of threat levels occurring can be based on any solid foundation of experiment or measurement. A figure for the probability of attaching to an aircraft can only be based on circumstantial evidence of actual lightning strikes. The probability of vulnerability can only be guessed at here in a very generic sense since this will depend upon particularities of an aircraft design. In particular, the guessed values used here represent the view of the author for a conventional aluminium aircraft construction; they are not based on any specific data. Such values will be very different for an aircraft with composite integral fuel tanks, glass fibre panels, external fuel tanks, etc. New possibilities for aircraft lightning attachment zoning have emerged with computational techniques. These possibilities include a concept of probability of
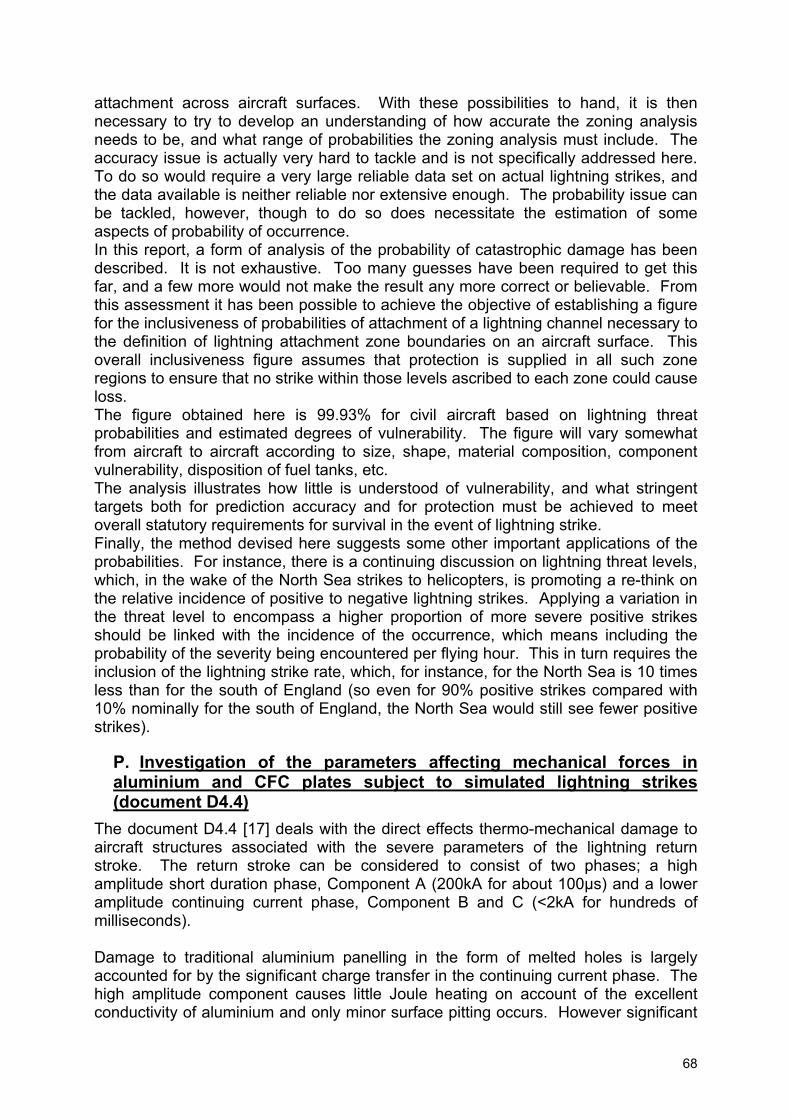
68
attachment across aircraft surfaces. With these possibilities to hand, it is then necessary to try to develop an understanding of how accurate the zoning analysis needs to be, and what range of probabilities the zoning analysis must include. The accuracy issue is actually very hard to tackle and is not specifically addressed here. To do so would require a very large reliable data set on actual lightning strikes, and the data available is neither reliable nor extensive enough. The probability issue can be tackled, however, though to do so does necessitate the estimation of some aspects of probability of occurrence. In this report, a form of analysis of the probability of catastrophic damage has been described. It is not exhaustive. Too many guesses have been required to get this far, and a few more would not make the result any more correct or believable. From this assessment it has been possible to achieve the objective of establishing a figure for the inclusiveness of probabilities of attachment of a lightning channel necessary to the definition of lightning attachment zone boundaries on an aircraft surface. This overall inclusiveness figure assumes that protection is supplied in all such zone regions to ensure that no strike within those levels ascribed to each zone could cause loss. The figure obtained here is 99.93% for civil aircraft based on lightning threat probabilities and estimated degrees of vulnerability. The figure will vary somewhat from aircraft to aircraft according to size, shape, material composition, component vulnerability, disposition of fuel tanks, etc. The analysis illustrates how little is understood of vulnerability, and what stringent targets both for prediction accuracy and for protection must be achieved to meet overall statutory requirements for survival in the event of lightning strike. Finally, the method devised here suggests some other important applications of the probabilities. For instance, there is a continuing discussion on lightning threat levels, which, in the wake of the North Sea strikes to helicopters, is promoting a re-think on the relative incidence of positive to negative lightning strikes. Applying a variation in the threat level to encompass a higher proportion of more severe positive strikes should be linked with the incidence of the occurrence, which means including the probability of the severity being encountered per flying hour. This in turn requires the inclusion of the lightning strike rate, which, for instance, for the North Sea is 10 times less than for the south of England (so even for 90% positive strikes compared with 10% nominally for the south of England, the North Sea would still see fewer positive strikes).
P. Investigation of the parameters affecting mechanical forces in aluminium and CFC plates subject to simulated lightning strikes (document D4.4)
The document D4.4 [17] deals with the direct effects thermo-mechanical damage to aircraft structures associated with the severe parameters of the lightning return stroke. The return stroke can be considered to consist of two phases; a high amplitude short duration phase, Component A (200kA for about 100µs) and a lower amplitude continuing current phase, Component B and C (<2kA for hundreds of milliseconds). Damage to traditional aluminium panelling in the form of melted holes is largely accounted for by the significant charge transfer in the continuing current phase. The high amplitude component causes little Joule heating on account of the excellent conductivity of aluminium and only minor surface pitting occurs. However significant
69
mechanical effects can occur in this phase; the magnetic interaction between current flow in the arc and in the structure surface exerts an impulsive force on the surface. This force is proportional to the square of the current amplitude and is thus by far the largest in the Component A phase. During this phase there will also be radial pressure waves from the expanding arc channel (thunder), this may have a significant longitudinal component due to the tortuosity of the arc channel. The net mechanical effect is also a function of the mechanical response time of the structure . In addition to elastic displacement, thin aluminium panels have sometimes been dented allegedly by the mechanical forces imparted by the arc. The figure 24 describes this mechanical interaction between the arc and the material.
FIGURE 24 : geometry of a strike attachment to a panel
Acoustic shock wave, 10MPa
Local explosions
Magnetic Pressure, 100MPa near arc
Fracture due to bend or release wave interactions
Shock Waves
As well as significant damage imparted by the continuing current phase, carbon fibre composite (CFC) structures, on account of their significant resistance are also damaged by Joule heating deposited by Component A. Damage consists of surface ply delamination, tufting of fibres and epoxy resin vaporisation at the attachment site . This type of damage can be minimised by coating the CFC with surface metallisation. However delamination diametrically opposite the strike point has sometimes been observed even when the CFC has had some surface protection and has suffered little surface damage. This type of debonding has also been observed on the reverse side of honeycomb panels and the effect has been attributed to “acoustic shock” and/or stress wave interactions. Moreover rise time requirements to cover such effects have been suggested for Component A simulation in recent draft STANAGS. An analysis of this effect was earlier presented by Robb et al and is also the topic of the document D4.4 [17]. The section 2 reviews possible mechanical damage mechanisms, Section 3 describes the experimental arrangement, Section 4 the results and discussion. Both thermal and mechanical damage can be imparted to structures by the attachment of lightning current arcs. In addition to the mechanical impulse imparted by the magnetic interaction, lightning specialists have been concerned by so called acoustic shock effects. Measurements of stress on panels using both electrical transducers and optical means have been employed to study the phenomenon.
70
The work continues an earlier pilot study. It appears that the strongest stress waves are induced in either aluminium or CFC panels by local confinement of the exploding fuse wire used to initiate the arc. If the fuse wire effect is removed, no sharp initial stress waves were observed with aluminium panels but some sharp fronts were seen with CFC panels and in this case probably occur throughout the current pulse. These are possibly due to local explosive vaporisation of fibres within the panel at the initial arc attachment point. Supplementary tests have also been made on CFC and aluminium panels by confining vaporisation initiated by lightning attachment to a sacrificial aluminium foil at the panel surface. This results in much stronger forces and they can result in drastic deformation of aluminium on very fast time scales (µs). Finally, some tests were made measuring the axial shocks from exploding fuse wires. The effect of the air shock has been measured and there does seem to be a dependence on dI/dt so the parameter is important when forces due to exploding structures or air shocks are present. Forces due to the magnetic interaction will not be expected to have an effect dependent on dI/dt.
Q. Recommended rise times for direct effect test (document D5.1a) It has been appreciated for many years that the rapidly changing electric fields (dE/dt) occurring at the inception of lightning leader development could induce transients on high impedance wiring. However there has remained a gap in understanding and the phenomenon is not covered in the international specifications. Similarly, whilst the mechanisms of dB/dt coupling are well known, there are processes by which d2B/dt2 effects will couple with wiring. At present there is no specification for d2B/dt2 levels, or consideration of d2B/dt2 effects. The report D5.1a [18] describes a series of measurements designed to increase understanding of dE/dt and d2B/dt2 coupling mechanism, and to help identify appropriate equipment test levels for such coupling effects. In addition modelling using the AEA Technology code INDCAL, a 2D code, is used to try to understand the mechanisms involved. dE/dt coupling is significant when dE/dt is large, which generally is when the change in electric field around the aircraft occurs very rapidly, for example during leader attachment. Hence it is a high frequency phenomenon and for rigorous solutions the problem should solve E and H fields together. It is part of the purpose of the experiment to see how dE/dt and d2B/dt2 effects can be considered as separate threats as far as coupling to aircraft wiring is concerned. Therefore in what follows we assume that the effects can be decoupled (i.e., no radiation). The measurements were carried out on the Hawker Hunter fuselage test rig. A brief description of the general Hunter test set up is given.
71
Current measurements were carried out on pipes within these apertures and field measurements (dB/dt and dD/dt) at points on the fuselage skin near to the apertures. Some tests were also carried out in which long overbraids running the length of the fuselage were installed. Most of the measurements on coupling were carried out in or around the aft aperture nearest the capacitor bank. The capacitor bank was only used for a few of the tests; for many of the investigative tests it was either disconnected or shorted out. External dB/dt fields were as expected in form, and generally correlated reasonably well between measurements and modelling, and a 10MHz frequency was dominant in both as well as the derivative signal of the driving waveform (~170kHz). As expected the measured dB/dt at 10MHz is much higher at the short circuit end of the transmission line than at the open circuit end. External dD/dt fields are again as expected in form, being higher at the open circuit end of the fuselage than at the short circuit end (opposite to the trend with dB/dt). However the surface, free-field and modelled values shows some discrepancies on the size of this difference. The difference between free field dD/dt measurements and the values on the skin of the fuselage are reasonable, as the fuselage measurements are carried out near to the aperture edge where field enhancement is expected. INDCAL analysis suggests that there should be a factor of 2 between the free-field dD/dt and surface dD/dt for this geometry. In tests carried out on a Hawker Hunter fuselage with concentric return conductors, coupling of dE/dt and d2B/dt2 to long and short cable bundles was studied. It was found that both effects appeared to be coupling to wiring. Separate tests were carried out in which each effect could be individually assessed, and then threat quantified. Some simple theoretical models of coupling mechanisms are proposed. • d2B/dt2 Coupling For slow changes in the open circuit voltage Voc stressing a wire (compared to the cables natural frequency) the induced current at the LRU is Ip - CsdVoc/dt. Whilst for relatively fast changes Ip = ωcsVoc. Cs is an important factor, the stray capacitance to ground at the sensor end, and ω is the cables natural frequency. In general these currents are much less than those induced in short circuited cable bundles, and should also be adequately covered by existing Waveform 3 test levels. Correctly performed Waveform 1 equipment tests should also address this threat.
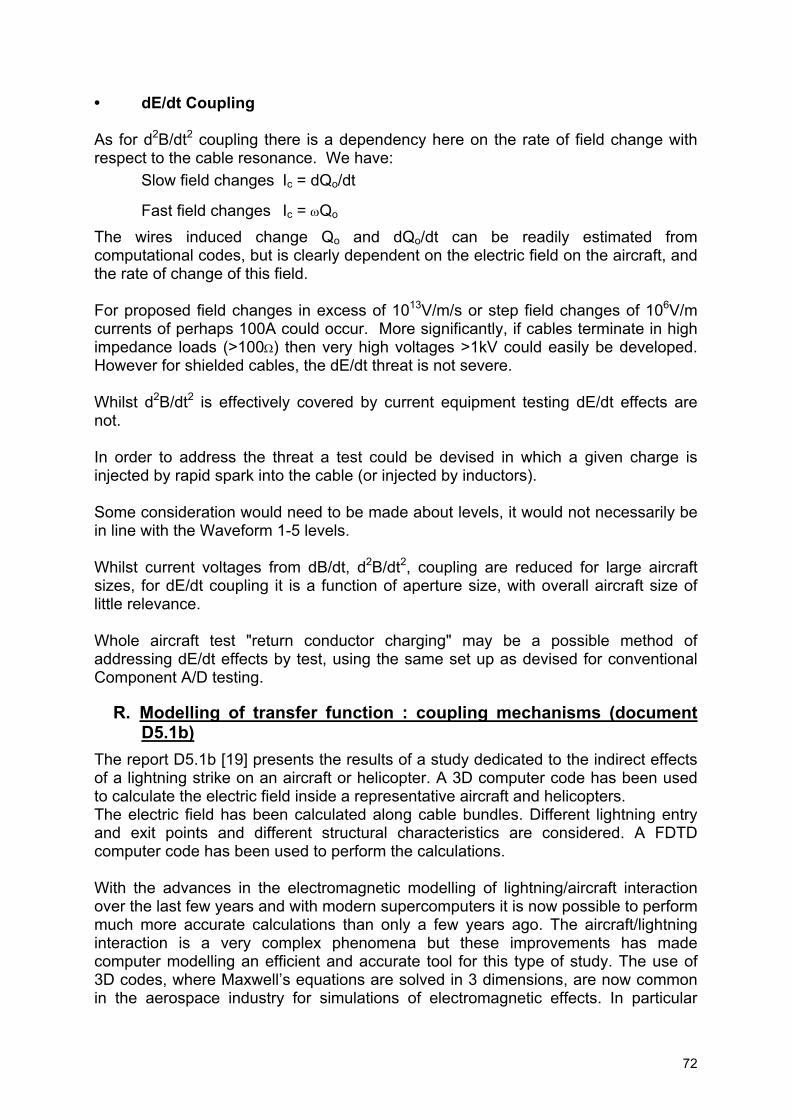
72
• dE/dt Coupling As for d2B/dt2 coupling there is a dependency here on the rate of field change with respect to the cable resonance. We have: Slow field changes Ic = dQo/dt
Fast field changes Ic = ωQo The wires induced change Qo and dQo/dt can be readily estimated from computational codes, but is clearly dependent on the electric field on the aircraft, and the rate of change of this field. For proposed field changes in excess of 1013V/m/s or step field changes of 106V/m currents of perhaps 100A could occur. More significantly, if cables terminate in high impedance loads (>100Ω) then very high voltages >1kV could easily be developed. However for shielded cables, the dE/dt threat is not severe. Whilst d2B/dt2 is effectively covered by current equipment testing dE/dt effects are not. In order to address the threat a test could be devised in which a given charge is injected by rapid spark into the cable (or injected by inductors). Some consideration would need to be made about levels, it would not necessarily be in line with the Waveform 1-5 levels. Whilst current voltages from dB/dt, d2B/dt2, coupling are reduced for large aircraft sizes, for dE/dt coupling it is a function of aperture size, with overall aircraft size of little relevance. Whole aircraft test "return conductor charging" may be a possible method of addressing dE/dt effects by test, using the same set up as devised for conventional Component A/D testing.
R. Modelling of transfer function : coupling mechanisms (document D5.1b)
The report D5.1b [19] presents the results of a study dedicated to the indirect effects of a lightning strike on an aircraft or helicopter. A 3D computer code has been used to calculate the electric field inside a representative aircraft and helicopters. The electric field has been calculated along cable bundles. Different lightning entry and exit points and different structural characteristics are considered. A FDTD computer code has been used to perform the calculations. With the advances in the electromagnetic modelling of lightning/aircraft interaction over the last few years and with modern supercomputers it is now possible to perform much more accurate calculations than only a few years ago. The aircraft/lightning interaction is a very complex phenomena but these improvements has made computer modelling an efficient and accurate tool for this type of study. The use of 3D codes, where Maxwell’s equations are solved in 3 dimensions, are now common in the aerospace industry for simulations of electromagnetic effects. In particular
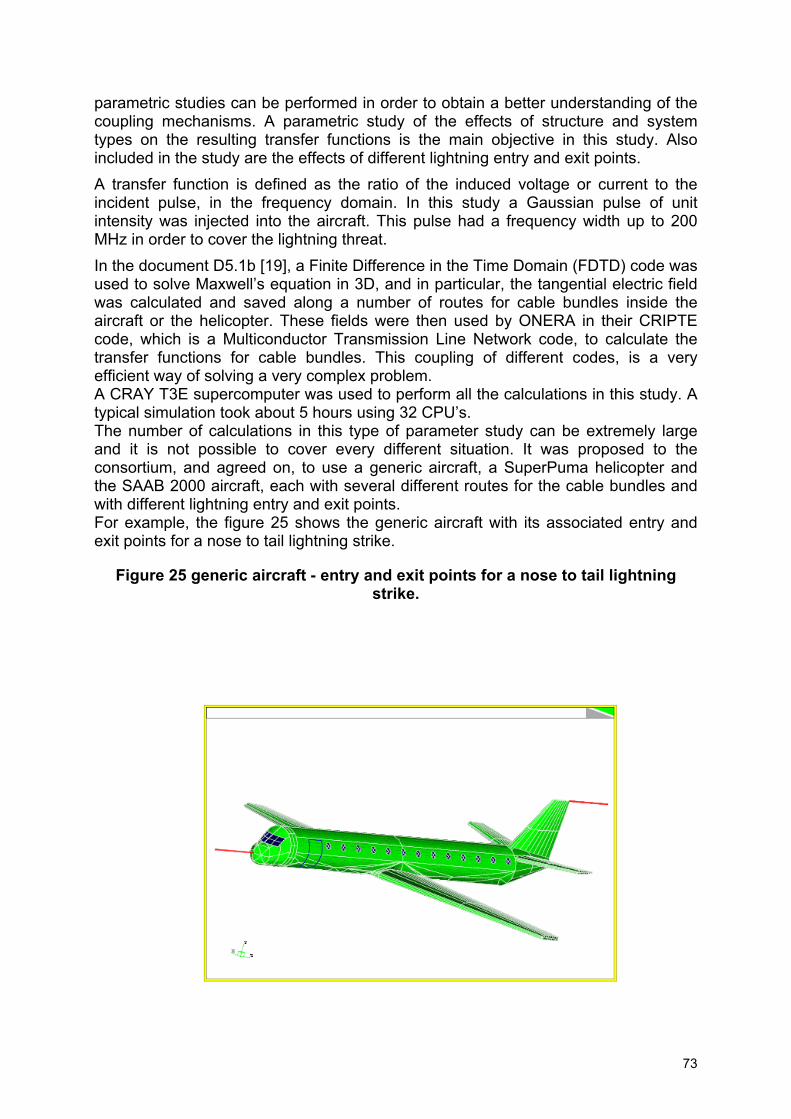
73
parametric studies can be performed in order to obtain a better understanding of the coupling mechanisms. A parametric study of the effects of structure and system types on the resulting transfer functions is the main objective in this study. Also included in the study are the effects of different lightning entry and exit points. A transfer function is defined as the ratio of the induced voltage or current to the incident pulse, in the frequency domain. In this study a Gaussian pulse of unit intensity was injected into the aircraft. This pulse had a frequency width up to 200 MHz in order to cover the lightning threat. In the document D5.1b [19], a Finite Difference in the Time Domain (FDTD) code was used to solve Maxwell’s equation in 3D, and in particular, the tangential electric field was calculated and saved along a number of routes for cable bundles inside the aircraft or the helicopter. These fields were then used by ONERA in their CRIPTE code, which is a Multiconductor Transmission Line Network code, to calculate the transfer functions for cable bundles. This coupling of different codes, is a very efficient way of solving a very complex problem. A CRAY T3E supercomputer was used to perform all the calculations in this study. A typical simulation took about 5 hours using 32 CPU’s. The number of calculations in this type of parameter study can be extremely large and it is not possible to cover every different situation. It was proposed to the consortium, and agreed on, to use a generic aircraft, a SuperPuma helicopter and the SAAB 2000 aircraft, each with several different routes for the cable bundles and with different lightning entry and exit points. For example, the figure 25 shows the generic aircraft with its associated entry and exit points for a nose to tail lightning strike.
Figure 25 generic aircraft - entry and exit points for a nose to tail lightning strike.
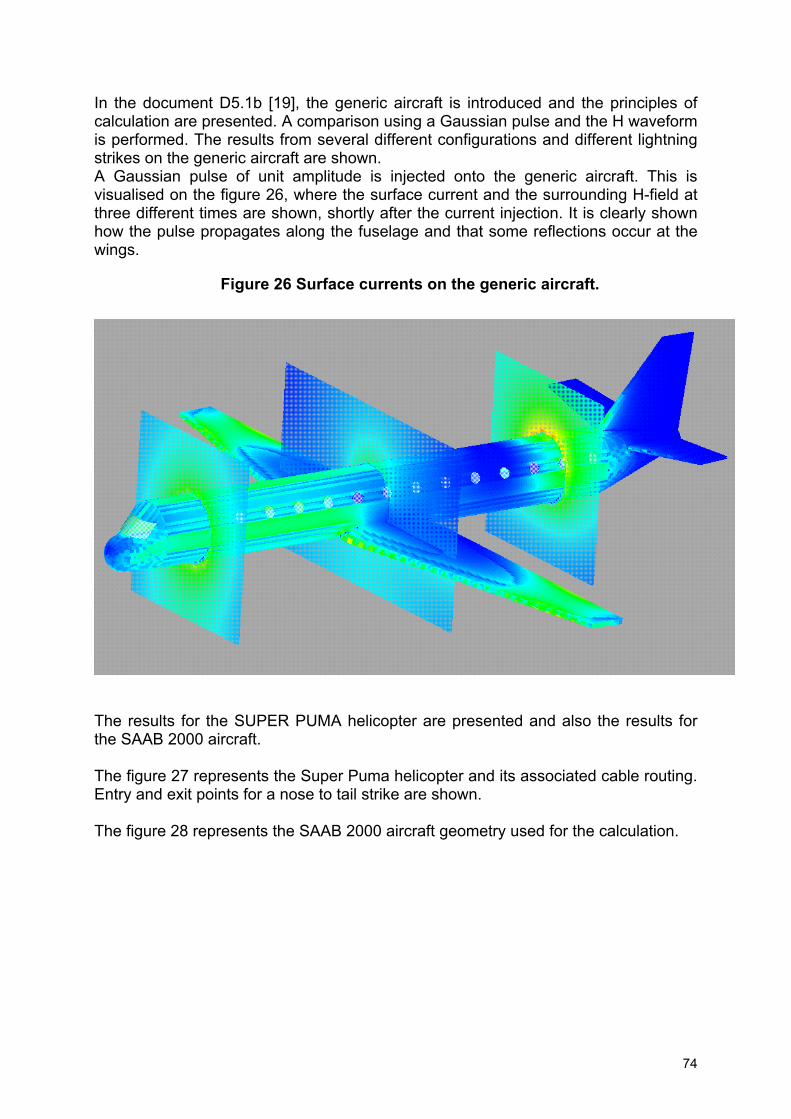
74
In the document D5.1b [19], the generic aircraft is introduced and the principles of calculation are presented. A comparison using a Gaussian pulse and the H waveform is performed. The results from several different configurations and different lightning strikes on the generic aircraft are shown. A Gaussian pulse of unit amplitude is injected onto the generic aircraft. This is visualised on the figure 26, where the surface current and the surrounding H-field at three different times are shown, shortly after the current injection. It is clearly shown how the pulse propagates along the fuselage and that some reflections occur at the wings.
Figure 26 Surface currents on the generic aircraft.
The results for the SUPER PUMA helicopter are presented and also the results for the SAAB 2000 aircraft. The figure 27 represents the Super Puma helicopter and its associated cable routing. Entry and exit points for a nose to tail strike are shown. The figure 28 represents the SAAB 2000 aircraft geometry used for the calculation.
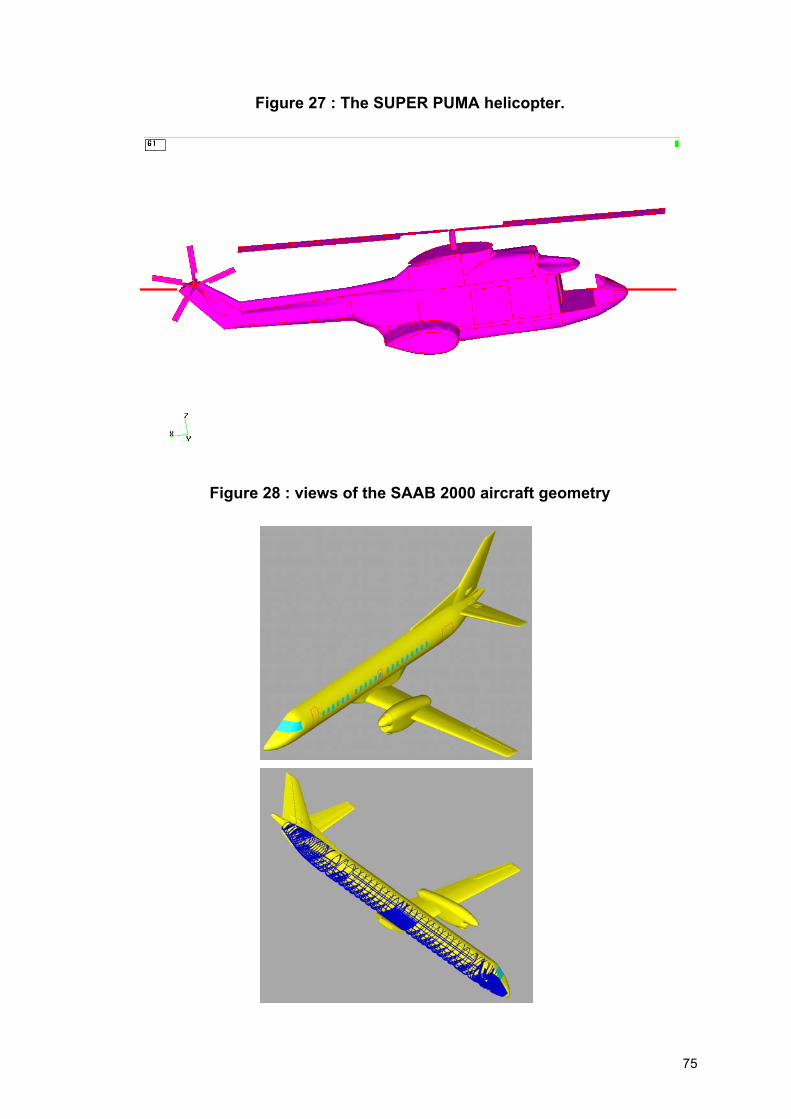
75
Figure 27 : The SUPER PUMA helicopter.
Figure 28 : views of the SAAB 2000 aircraft geometry
76
A parametric study has been performed. Its objective was to calculate transfer functions, defined as the relationship between the current source and the response waveform, for a number of different configurations. The parameters included in the study were:
• Lightning entry and exit points
• Structural characteristics
• System characteristics
For each configuration, the electric field was calculated for three different objects, a generic aircraft, a SuperPuma helicopter and the SAAB 2000 aircraft. This study has been performed in close co-operation between Ericsson Saab Avionics and ONERA. The electric fields along the cable bundle was calculated by Ericsson Saab Avionics and the results were transferred to ONERA who has used CRIPTE, a network code, to perform calculations of the actual networks including several cables in each bundle. The major part of the study was for the generic aircraft for which the external and internal structure easily could be changed. The study started with an aircraft with no internal structure and all windows closed and was completed with all structure included and all windows open. By systematically increasing the complexity of the aircraft and performing calculations for different lightning strike entry and exit points the influence on the transfer function could be identified. Major results was found to depend on
• Coupling through cockpit windows as compared to cabin windows
• Lightning strike in the nose compared to a wing strike
• The amount of internal structure A large amount of calculations has been performed using a supercomputer, resolving many details of the aircraft and helicopters. However, there are still many more details that needs finer resolution, as an example, having a cable routing at the trailing edge of a wing a mesh resolution of about one centimetre is need. Also noted in this study are the efficient use of two codes coupled together, a 3D FDTD code and the network code CRIPTE. Used in this way it is possible to solve large and very complex problems.
S. Modelling of transfer function : network modelling analysis (document D5.2a part I and part II)
The report D5.2a part I [20] and part II [21] are dedicated to the "Network Modelling Analysis" and are closely related to the document D5.1b [19] about "Coupling mechanisms ", devoted to the external environment (see the section upward). Indeed, one of the outputs of this document, the component of the electric field along the network routing, is the perturbing source acting on the cables of the networks. Downside, this report will provide computed current or voltage transfer functions to the task T6, which objectives are to determine the maximum values of the wave
77
forms that are to be considered for indirect effect protection. The consequences on the level and the wave form of the current pulses flowing through the A/C and the induced electromagnetic perturbations observed at the equipment level may be of some importance. The development of numerical techniques and ready to use computer codes allow the technical community to treat now this electromagnetic problem at a level of complexity which is equivalent to the modelling of lightning leader evolution. As it is obvious that the wave propagating along a cable or a bundle will not influence the source, the computation of the electromagnetic environment can be separated from the computation of the voltage or current pulses induced on cables by these fields. The first computation is called, the external problem, and the second one, the internal problem. They applied in two different topological volumes which are coupled by the component of the tangential field on their separating surface. In our case this surface is the set of the surfaces of all the conductors of the networks. 3D codes are now of a rather common use and allow to deal with complex aircraft structures to compute the external problem. Structural effects on the current or voltage pulses at the equipment ports are directly deduced from their effects on the electric field distribution convoluted by the transfer function of the wire. This transfer function is the object of this part of the study. The transfer function is defined in the frequency domain, for each wire, as the ratio of the current or voltage pulse level at the input port of a given equipment to the input current intensity on the aircraft. In our case, a Gaussian pulse with a 200 MHz bandwidth is used as input current to be certain to cover the spectrum which may result of a new definition of the threat. The transfer function is calculated by solving the Multiconductor Transmission Line Network equation, also called the BLT equation. Everything is known on the coupling mechanism inside a bundle and the solution given by the code is exact (in the limit of the numerical precision) as long as the hypothesis used to establish the BLT equation is respected. This transfer function depends on
• the network geometry
• the bundle composition
• the terminal load impedance. For example, the figure 29 shows 3 types of arrangement for the bundle NRWT (Nose - Right Wing – Tail, see the document D5.2a [20] for more details)
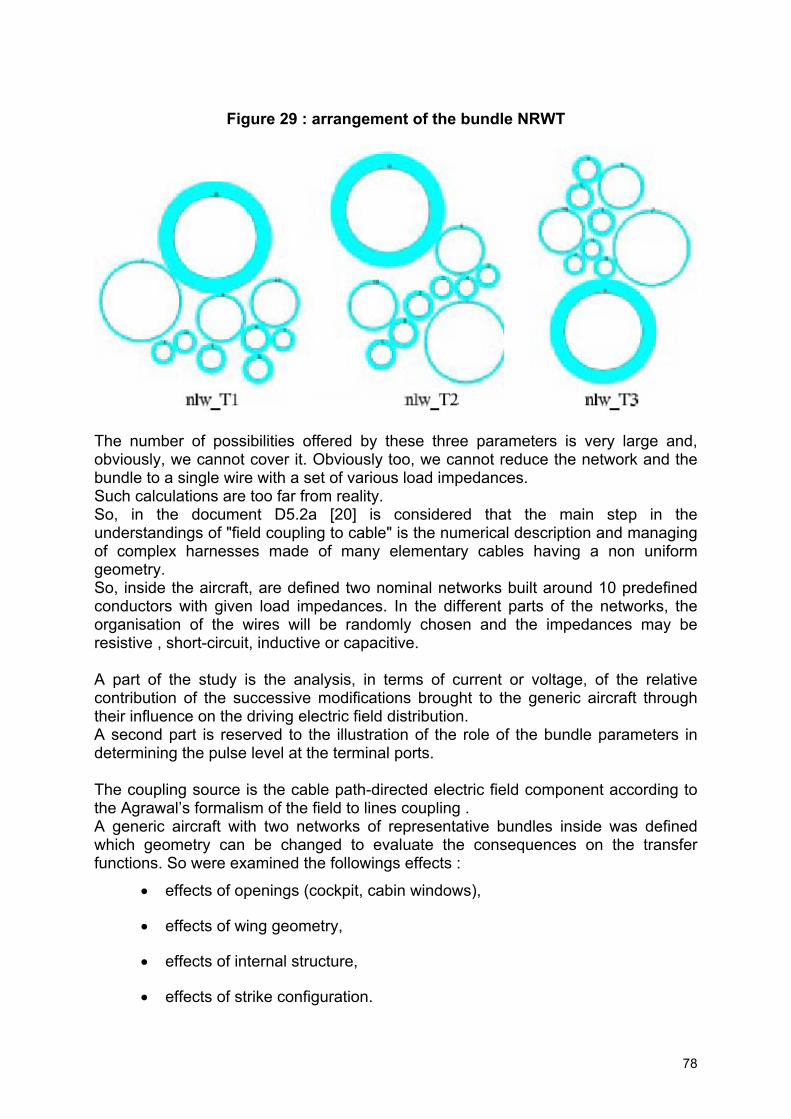
78
Figure 29 : arrangement of the bundle NRWT
The number of possibilities offered by these three parameters is very large and, obviously, we cannot cover it. Obviously too, we cannot reduce the network and the bundle to a single wire with a set of various load impedances. Such calculations are too far from reality. So, in the document D5.2a [20] is considered that the main step in the understandings of "field coupling to cable" is the numerical description and managing of complex harnesses made of many elementary cables having a non uniform geometry. So, inside the aircraft, are defined two nominal networks built around 10 predefined conductors with given load impedances. In the different parts of the networks, the organisation of the wires will be randomly chosen and the impedances may be resistive , short-circuit, inductive or capacitive. A part of the study is the analysis, in terms of current or voltage, of the relative contribution of the successive modifications brought to the generic aircraft through their influence on the driving electric field distribution. A second part is reserved to the illustration of the role of the bundle parameters in determining the pulse level at the terminal ports. The coupling source is the cable path-directed electric field component according to the Agrawal’s formalism of the field to lines coupling . A generic aircraft with two networks of representative bundles inside was defined which geometry can be changed to evaluate the consequences on the transfer functions. So were examined the followings effects :
• effects of openings (cockpit, cabin windows),
• effects of wing geometry,
• effects of internal structure,
• effects of strike configuration.
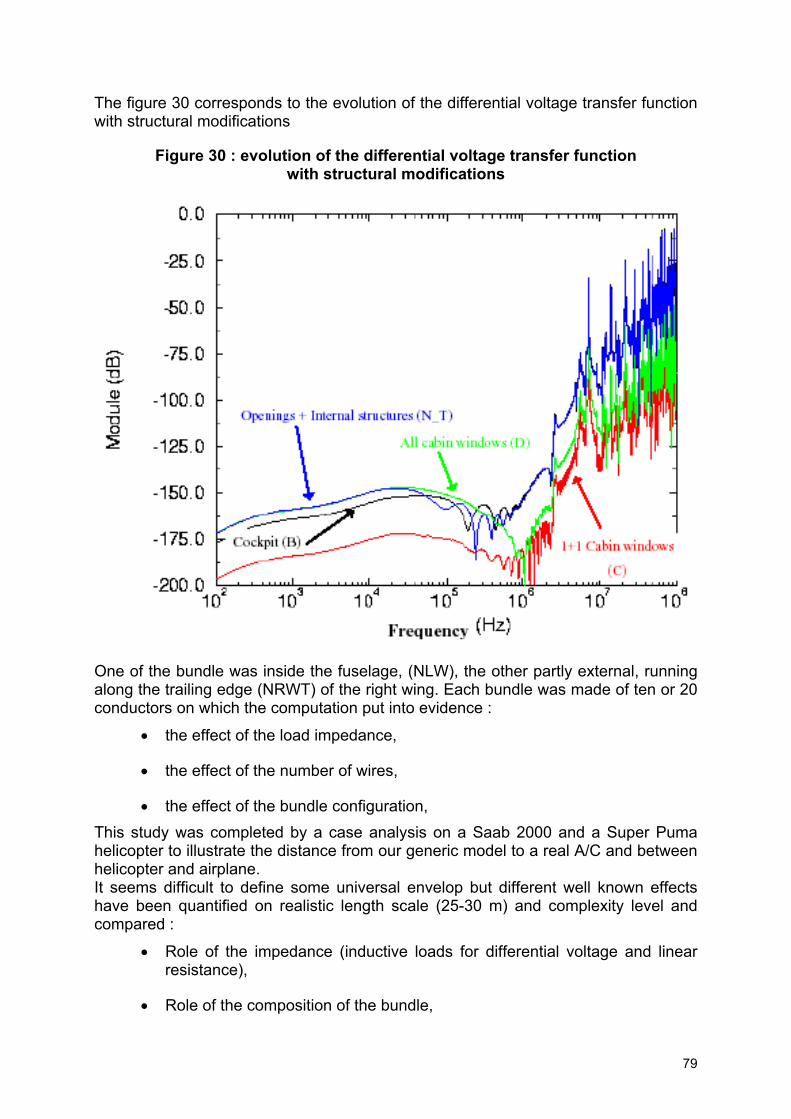
79
The figure 30 corresponds to the evolution of the differential voltage transfer function with structural modifications
Figure 30 : evolution of the differential voltage transfer function with structural modifications
One of the bundle was inside the fuselage, (NLW), the other partly external, running along the trailing edge (NRWT) of the right wing. Each bundle was made of ten or 20 conductors on which the computation put into evidence :
• the effect of the load impedance,
• the effect of the number of wires,
• the effect of the bundle configuration, This study was completed by a case analysis on a Saab 2000 and a Super Puma helicopter to illustrate the distance from our generic model to a real A/C and between helicopter and airplane. It seems difficult to define some universal envelop but different well known effects have been quantified on realistic length scale (25-30 m) and complexity level and compared :
• Role of the impedance (inductive loads for differential voltage and linear resistance),
• Role of the composition of the bundle,
80
• Well separated behaviour of the wires in the low-lid frequency part of the spectrum,
• Wire independent high frequency response,
• Relative exposure in cockpit and fuselage, Finally, a large library of results has been obtained which constitutes an interesting data base for comparison with existing experimental data , past or future numerical results. The results have to be analysed further from a lightning point of view in time domain, on a restricted bandwidth. This point is the objective of another topic of the project : Definition of the Internal Environment (see the following documents D6.1 [23], D6.2 [24], D6.3a [25] and D6.3b [26]). All network can be used on Saab 2000 as an illustration of the influence of the final gap between our complete model (which could not be pushed further for this study) and the actual one. Refinement of the model leads to a lower and lower transfer function amplitude. With some improvement in its definition, may be the generic aircraft could be considered as an electromagnetic ‘gabarit’ for the Saab 2000 , and what has been done for this aircraft can be done for others. The four bundles of Super Puma can be used to give examples of the strength of lightning induced excitation in different locations of an helicopter. Beyond the present project and its immediate results, we must notice the efficiency of the methodology we used. Using in a coupled manner a 3D EM code and a network code on a large aircraft can be now considered as a usual engineering tool to appreciate the global electromagnetic behaviour of an aircraft. It is not limited by the configuration we used. The aircraft can be larger and its geometry more complex . The network does not need to be restricted to 3 tubes of 10 cables bundles. Once a 3D field calculation is completed and the network is implemented, it becomes easy to
• to increase or decrease the field on few meshes to analyse a local effect ,
• to change a load impedance or a cable definition,
• to introduce a cable shield,
• to manage real lengths and configurations, and as a result it is possible to follow the EM response of a structure which definition is in progress. As an issue of this study, a generic configuration (Aircraft + bundles ) has been defined which could now be used as a test configuration for other codes and further development, beside computing performances, may concern the definition of a simple high frequency law of bundle behaviour and the influence of composite materials not taken into account in this phase of the study.
81
T. Investigations using the 2D INDCAL Code into Shielding Effectiveness of Raceways and other Aircraft Structure (document D5.2b)
The report D5.2b [22] presents some results of 2D analysis carried out on the FULMEN generic airframe geometry using the AEA Technology code INDCAL. The report discusses:
(1) Attenuations provided by routing wires in metallic raceways, which are found to be typically a factor of 20 (or 26dB).
(2) Attenuations of wiring running along the wing trailing edge due to the proximity of a well bonded metallic flap; these are typically a factor of up to 10 (or 20dB).
(3) Presentation of some results from a time domain analysis of a carbon wing structure, giving the results in the form of contour plots.
A structural item such as a flap will provide a high degree of shielding for wiring which it screens, such as along the trailing edge of a wing. If current can flow freely along the flap (i.e., if the inductance presented by its length is not unduly affected by its end connections to structure) then attenuations are up to a factor of 10. A raceway with three channels installed in both a metallic fuselage and a carbon wing gives an attenuation on unscreened wires of 25–30 at the 2/3 fill level. This attenuation is expected to be fairly independent of installations, but can be improved if there are several other screened cables also routed in the same raceway. The analysis here assumes that there are not any other such cables installed. For a single screened cable installed on the carbon wing, the presence of the raceway installation reduces the current in the screen from 8kA (30µs) to 530A (18µs). In this case the presence of the raceway introduces an important additional structure to this region of the wing, and its high conductivity modifies the local current distribution. This is why there is a significant difference in waveform time to peak.
U. Synthesis for current/voltage waveforms (document D6.1) The main objective of Work Package 6 was to define a new internal environment inside an aircraft. In principle this was to use the analysis of transfer function data from the database (WP2). In addition the computational transfer function data from WP5 together with the modified external threat definition of WP4 was to produce generic time domain waveforms for the internal environment. This introduction reviews the present consensus on the internal environment. The report D6.1 [23] goes on to study the internal environment arising from inductive coupling. The analysis described in this report has attempted to review the transfer function data produced from the Ericsson Saab computations of electric field on generic aircraft and the subsequent injection of these fields into cable harnesses modelled by ONERA’s CRIPTE model. The data are compared to simple analytical models that have been developed to describe the transfer function due to inductive coupling with shielded and unshielded cables. The calculated transfer function results appear not
82
to agree with the simple model. Possible reasons of the disagreement are discussed. One possible reason for the observed behaviour concerns the way that the original simulation of the transfer function was performed. The transfer function was derived by calculating the fields associated with a given lightning transient (simulated by a Gaussian of short duration) using a time domain analysis and then transforming these fields into the frequency domain. The frequency domain fields were then normalised and used to calculate the frequency domain transfer functions. However, if the time domain calculation is only performed for a restricted time interval the interval between data points in the frequency domain will be similarly constrained. Thus, if the time domain calculation of the fields is performed to a maximum duration of 6 ms, for example, then the interval between points in the frequency domain will be about 83 kHz and consequently the first frequency point will be at 83 kHz. One can see that below about 50 kHz the transfer function rises linearly with frequency because it is mainly dependent on the rate of change of injected current (and hence the rate of change of field of the injected current). If the first data point lies at 83 kHz there is a danger that this low frequency behaviour (which is crucial to the lightning phenomenon) will be misrepresented and erroneous results will be produced. The observed current maximum at longer than expected times is consistent with an over-estimate of the spectral density of the lightning current rate of change of magnetic field at low frequencies. Clearly this issue requires further analysis that has not been performed during the project life.
V. Study of non-linear effects (document D6.2) The document D6.2 [24] presents the results of a non linear effect analysis. The work consists to see if they have to be taken into account in the definition of generic transfer functions. This work is based on:
• An experimental phase
• Analysis of other reports where this aspect has already been analysed or at least recorded .
In this study 4 cases of non linearity have been identified as follow :
• Arcing, sparking When an aircraft is struck by lightning (or during testing), arcing and sparking can appear between different parts of the structure or wiring, because of high common mode voltages due to high currents. During testing, high voltages due to the test set up (pseudo coaxial line) can although generate effects on the structure surface. Both appear at efficient levels of current/voltage and may not be seen at low level. When extrapolating transfer functions (from low level injection to standard 200 kA threat), wrong levels may be estimated because of the non linear behaviour of these effects. The main part of this report focuses on the consequences of voltage sparking on transient levels (current and voltages). One of the objectives is to see whether the extrapolation may underestimate or overestimate the threat at
83
200kA. The investigation is carried out by testing composite and metallic structures. • Response of protection device
The response of non linear protections may influence more or less waveform extrapolation. The behaviour of non linear devices is generally taking into account after transient analysis and those kind of protection are removed during testing or simulation. The determination of ATL (Actual Transient Levels) enables to check if protection has been designed efficiently. They do not have to be taken into account in the transient analysis. • Linearity of material
The resistivity of some materials may change with current density value. That can be evaluated by making comparisons of induced transients, on specific structures. Two composite structures are tested, one with a copper mesh protection and the other one without protection. As the geometries of the two structures are identical, the influence of material can be inferred. • Extrapolation method
The extrapolation method may give unrealistic results especially if the frequency content of the drive current is not comparable with the standard threat. This has to be kept in mind, but no further investigation will be done here, as the process refers to testing and measurement methodology and is not really the subject here.
The experiment focuses on the analysis of the consequence of sparking and arcing on some wires installed into a structure. Three types of structure are tested (an unprotected carbon composite structure, a carbon composite structure protected by a copper mesh, a metallic structure on which sparks are artificially created). The results are compared to previous analysis on full vehicle testing. Junctions between composite panels or between a composite panel and a metallic interface are possible locations for arcing and sparking. The experiments on the two carbon composite structures (protected and unprotected) show that sparks can be created at very low level of driving current (25kA). Regarding full vehicle tests, arcing are seldom seen at 25 kA because generally current distribution minimises current densities.
It has been noticed that the use of copper mesh protection increases non linearities. Two different phenomena may influence the coupling :
• an increase in the structure resistivity by destruction of meshes.
• a decrease in the structure resistivity due to contact resistance improvement. In the case of sparks uniformly distributed along the structure, as it was noticed in the composite structures testing, the global current distribution is not much influenced. As a consequence, there are no noticeable changes in the waveshape of induced
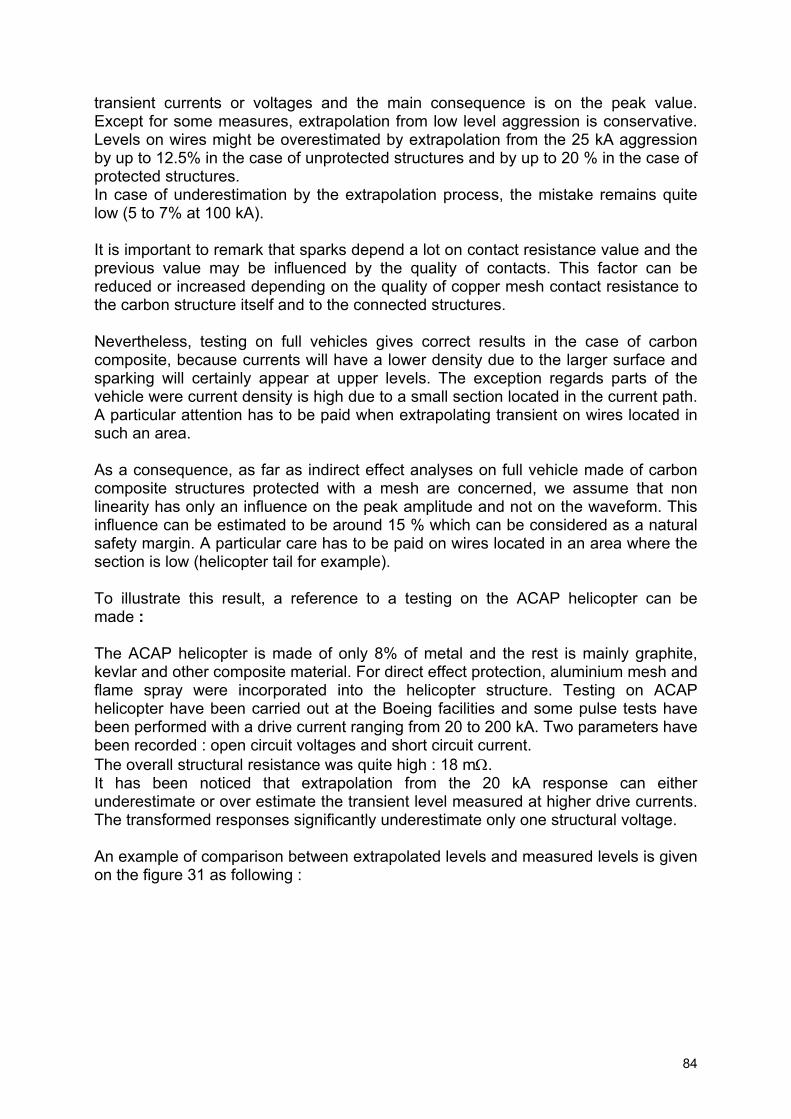
84
transient currents or voltages and the main consequence is on the peak value. Except for some measures, extrapolation from low level aggression is conservative. Levels on wires might be overestimated by extrapolation from the 25 kA aggression by up to 12.5% in the case of unprotected structures and by up to 20 % in the case of protected structures. In case of underestimation by the extrapolation process, the mistake remains quite low (5 to 7% at 100 kA).
It is important to remark that sparks depend a lot on contact resistance value and the previous value may be influenced by the quality of contacts. This factor can be reduced or increased depending on the quality of copper mesh contact resistance to the carbon structure itself and to the connected structures.
Nevertheless, testing on full vehicles gives correct results in the case of carbon composite, because currents will have a lower density due to the larger surface and sparking will certainly appear at upper levels. The exception regards parts of the vehicle were current density is high due to a small section located in the current path. A particular attention has to be paid when extrapolating transient on wires located in such an area. As a consequence, as far as indirect effect analyses on full vehicle made of carbon composite structures protected with a mesh are concerned, we assume that non linearity has only an influence on the peak amplitude and not on the waveform. This influence can be estimated to be around 15 % which can be considered as a natural safety margin. A particular care has to be paid on wires located in an area where the section is low (helicopter tail for example). To illustrate this result, a reference to a testing on the ACAP helicopter can be made : The ACAP helicopter is made of only 8% of metal and the rest is mainly graphite, kevlar and other composite material. For direct effect protection, aluminium mesh and flame spray were incorporated into the helicopter structure. Testing on ACAP helicopter have been carried out at the Boeing facilities and some pulse tests have been performed with a drive current ranging from 20 to 200 kA. Two parameters have been recorded : open circuit voltages and short circuit current. The overall structural resistance was quite high : 18 mΩ. It has been noticed that extrapolation from the 20 kA response can either underestimate or over estimate the transient level measured at higher drive currents. The transformed responses significantly underestimate only one structural voltage.
An example of comparison between extrapolated levels and measured levels is given on the figure 31 as following :
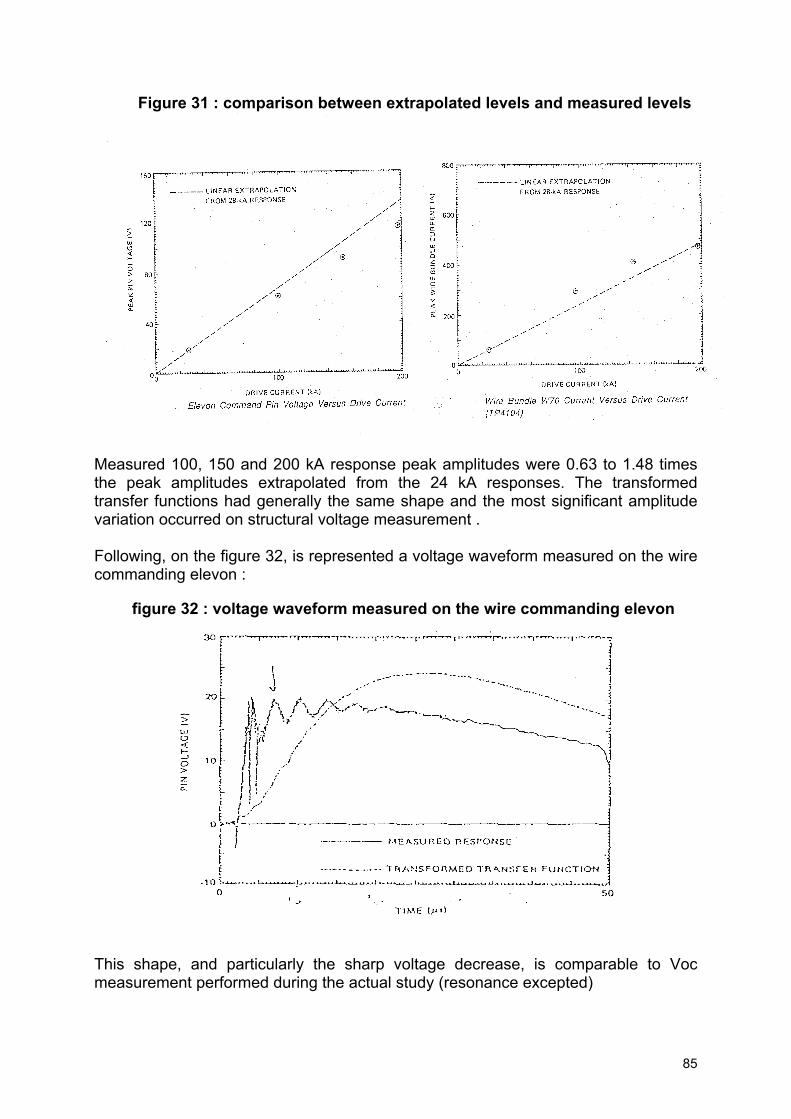
85
Figure 31 : comparison between extrapolated levels and measured levels
Measured 100, 150 and 200 kA response peak amplitudes were 0.63 to 1.48 times the peak amplitudes extrapolated from the 24 kA responses. The transformed transfer functions had generally the same shape and the most significant amplitude variation occurred on structural voltage measurement .
Following, on the figure 32, is represented a voltage waveform measured on the wire commanding elevon :
figure 32 : voltage waveform measured on the wire commanding elevon
This shape, and particularly the sharp voltage decrease, is comparable to Voc measurement performed during the actual study (resonance excepted)
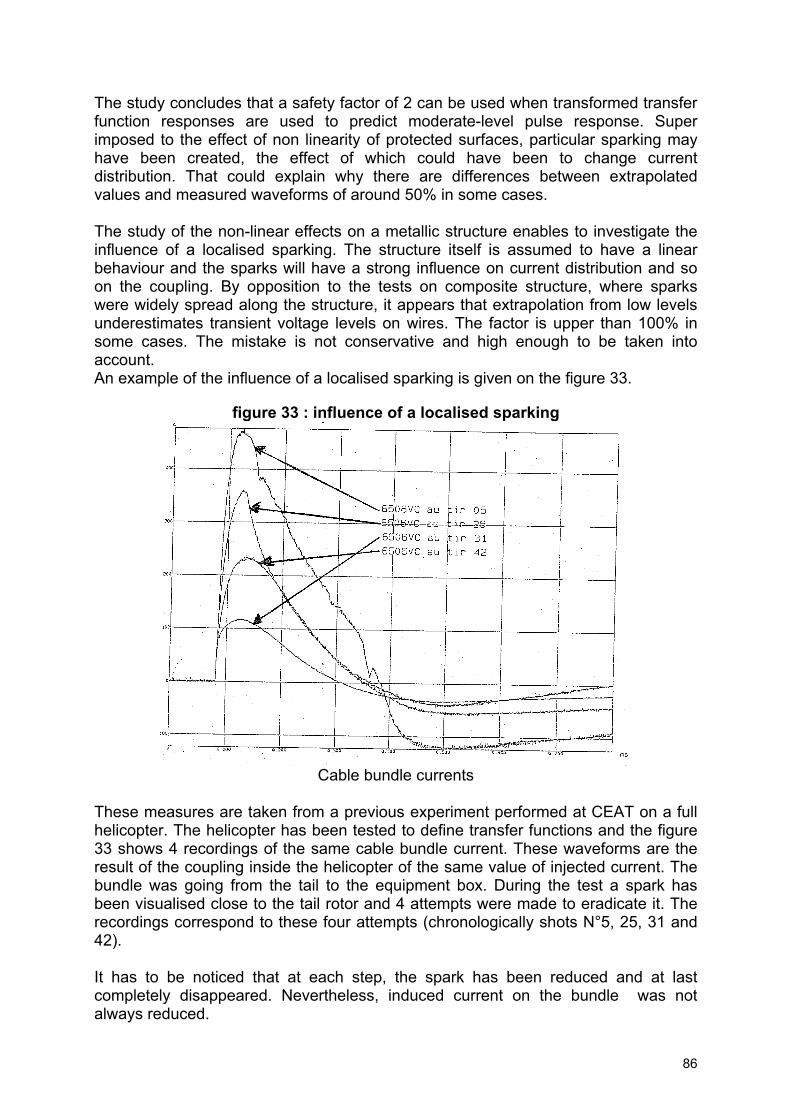
86
The study concludes that a safety factor of 2 can be used when transformed transfer function responses are used to predict moderate-level pulse response. Super imposed to the effect of non linearity of protected surfaces, particular sparking may have been created, the effect of which could have been to change current distribution. That could explain why there are differences between extrapolated values and measured waveforms of around 50% in some cases. The study of the non-linear effects on a metallic structure enables to investigate the influence of a localised sparking. The structure itself is assumed to have a linear behaviour and the sparks will have a strong influence on current distribution and so on the coupling. By opposition to the tests on composite structure, where sparks were widely spread along the structure, it appears that extrapolation from low levels underestimates transient voltage levels on wires. The factor is upper than 100% in some cases. The mistake is not conservative and high enough to be taken into account. An example of the influence of a localised sparking is given on the figure 33.
figure 33 : influence of a localised sparking
Cable bundle currents
These measures are taken from a previous experiment performed at CEAT on a full helicopter. The helicopter has been tested to define transfer functions and the figure 33 shows 4 recordings of the same cable bundle current. These waveforms are the result of the coupling inside the helicopter of the same value of injected current. The bundle was going from the tail to the equipment box. During the test a spark has been visualised close to the tail rotor and 4 attempts were made to eradicate it. The recordings correspond to these four attempts (chronologically shots N°5, 25, 31 and 42). It has to be noticed that at each step, the spark has been reduced and at last completely disappeared. Nevertheless, induced current on the bundle was not always reduced.
87
Spark influence is visible on the waveshapes on the figure 33 :
• Shot 5 : The waveshape is very irregular and spark is noticed between two parts of the tail.
• Shot 25 : The connection was improved with a conductive tape. Spark effect is visible after peak current.
• Shot 31 : The conductive tape position was improved, peak is reduced by a 3 factor from the previous test and spark influence is still visible at the very beginning of the waveshape.
• Shot 42 : Spark was eradicated (optimisation of metallic tape position) and the value without spark is about 250 A.
Peak currents are included between a little bit more than 100 A and up to a little bit less than 500 A. The value without spark is about 250 A and spark can change the level either by increasing or decreasing it by a factor 2. We are precisely in the case of a structure where current density is very high because tail section is small and tail is connected to the output of the coaxial arrangement. In case of indirect effect analysis on full vehicle, it seems that non linearity can be taken into account by the following process :
• Check during testing if spark appear.
• If sparks are noticed. Look carefully to the waveshapes. In the case of ‘classical’ waveforms without noticeable sharp variation of current or voltage presumably due to non linear effects, it can be assumed that even if they have an influence, it should be conservative and the safety factor associated not to high.
• If spark effect are noticeable on the waveforms, a higher current injection is necessary to evaluate more accurately the induced levels (3). That could be the case, for example of grounding that is not correctly connected. Without spark there will be a current distribution and when the spark appears the distribution would be completely different. Those specific points need to be identified when performing the tests on full vehicle to evaluate their influence.
It does not seem possible to accurately and systematically define a typical influence of non linearities in the definition of generic transient waveforms. The report enables to see that there are two kinds of non linearities : The ones that do not affect so much current distribution and the ones that have a major influence on current distribution. In reality, both may appear and the current distribution is often influenced. It seems that a simulation would be necessary to investigate the type of sparking but it is presumably capacitive. In a real structure, sparks are although due to the same causes and the effects can be equivalent. We can assume that values are maximum in the test an that the
88
mistakes made are lower in reality excepted in the case of wires located in a region were section is small. Nevertheless, in the determination of transfer functions through a full vehicle testing, low level injections (some kA) can usually (if the extrapolation is performed correctly), give acceptable results. But there is still a risk to under or over estimate the levels by a factor close to 2, and that is the reason why an evaluation of non linearity effects is crucial, especially in the case of composite structures protected with a metallic mesh.
W. Method to define the waveform parameters for internal effects (document D6.3a)
The report D6.3a [25] describes a methodology for assessing the induced current and voltage waveforms on cable bundles inside an aircraft subject to an external lightning threat. The methodology is based on computational tools that have emerged over the past two decades. In principle, this approach allows an accurate prediction of the internal threat at specified position on specific cables. While the underlying computational tools have been extensively tested and validated, the methodology as a whole has not been extensively validated, yet. In the computation models within the Fulmen project some discrepancies have occurred that still have to be resolved. Therefore, the suggested methodology shows great promise as a reliable and objective tool for evaluating the internal threat levels and waveforms in all stages of the aircraft lifecycle – during design and construction, certification and modification throughout its service life. In order to live up to this promise, some more work is needed on validation and to provide guidelines for the efficient application of this technique on real full-scale aircraft and helicopters. Many of the topics quoted in this paragraph will be also developed in the next section dedicated to the document D6.3b [26].
X. Definition of the internal environment for generic aircraft/helicopter (document D6.3b)
The report D6.3b [26] gives an exemplary overview of internal lightning waveforms. It is based on transfer functions obtained through a numerical analysis that combines electromagnetic field modelling using Finite Difference Time Domain techniques with network analysis. Since lightning represents a potential safety hazard for aircraft, adequate lightning protection has to assure the prevention of catastrophic accidents. With the widespread use of advanced electronic, equipment with safety critical functionalities in modern aircraft, mandates to pay more and more attention to the indirect effects of lightning. With a significant current – both with respect to peak amplitude and to action integral – flowing across the aircraft skin during a lightning strike, electromagnetic fields may couple into the aircraft interior and there onto cables threatening aircraft equipment. Current and proposed regulations and guidelines give on the one hand a set of waveforms that are typical for the current components observed on an aircraft during the different phases of its interaction with lightning:
89
• Component A: First return stroke current.
• Component Ah: Transition zone first return stroke current.
• Component B: Intermediate current.
• Component C: Continuing current.
• Component D: Subsequent stroke or re-strike current.
• Component H: Multiple Burst waveform. In addition, a synthesised multiple stroke waveform is defined as a combination of one component followed by 23 component D re-strikes. These waveforms are used to assess the direct threat due to lightning and to design appropriate protective measures for the aircraft skin. Regulations on test procedures and test methods on the other hand provide a set of idealised internal waveforms together with associated threat levels to verify the capability of equipment to withstand the effects of lightning induced electrical transients. In principle, the waveforms of the internal environment are connected to the external lightning environment through the respective transfer functions based on the coupling mechanisms. Due to the multitude of different aircraft configurations and the difficulties of accurately determining these transfer functions for a given aircraft design or an actual aircraft, the regulations give five standardised wave shapes with five associated threat levels together with rules of thumb on when to employ which waveform at what level:
Waveform 1: Double exponential current waveform that shows a time function similar to that of external component A. Transients of this shape will generally be induced in low impedance/resistive cable loops where conductive coupling or H-field aperture coupling plays a major role.
Waveform 2: Double exponential derivative voltage waveform whose time function is the first derivative of waveform 1. Transients of this shape will generally be induced in high impedance/resistive unshielded loops/circuits where magnetic field coupling is the dominating contributor.
Waveform 3: Damped sinusoidal voltage or current waveform that reflects the resonant effects caused by fast rise time lightning currents on the aircraft structure mainly from external components A, Ah and H. Transients of this type may appear in all types of electric circuits.
Waveform 4: Double exponential voltage waveform with a time function similar to that that of external component A. Transients of this shape will predominantly appear in circuits that use the aircraft structure as a return as well as in shielded conductors due to the product of shield current and transfer impedance.
90
Waveform 5: Long duration current waveform with a double exponential time function with significantly enhanced time scales. Transients of this shape typically occur where lightning currents can penetrate through conductive structures, for instance made of CFC, due to current redistribution processes.
The certification process based on this procedure has been well established and can rely on a large knowledge basis based on past experience. Nevertheless, this process is unsatisfactory as in particular in connection with new advanced material systems or novel electronic equipment an imprecise knowledge of the internal threat will often lead to significant overprotection on both the system and equipment level with the associated weight and cost penalties. In rare cases, if radically new approaches are tried for which there exists insufficient experience, even under-protection may result. It would therefore be advantageous for aircraft and equipment manufacturers as well as for certification agencies to have at their disposal means to reliably predict and assess the internal lightning – or more general electromagnetic – environment for a given aircraft configuration. The main objectives of the FULMEN project were to
• establish new methods to be available for defining the lightning threat for each specific new aircraft and helicopter programme,
• obtain a more realistic, quantitative and scientifically founded evaluation of the threat levels to be sustained by the structure or the equipment installed therein.
With respect to the indirect effects of lightning strikes to aircraft, this implied to obtain a deeper understanding of the coupling mechanisms and the so-called transfer functions, i.e. the relationship between external lightning components and the internal lightning waveforms using both experimental and theoretical means. In addition, a methodology was implemented and tested to assess the transfer functions for a given aircraft design using numerical techniques. While the details of the methodology have been presented in the document D6.3a [25], the scope of this document D6.3b [26] is to give of the resulting response waveforms (in the time domain) for selected transfer functions that were in part determined via this method. Originally, the present deliverable was to provide a definition of the lightning internal environment for generic aircraft and helicopters based on a majoring of the transfer functions obtained in the model calculations of WP 5. However, in a comparison of the transfer functions obtained in this way with simple analytical models some ambiguities surfaced that could not be resolved within the time frame of the FULMEN project. Therefore, it was not possible to define the lightning internal environment for generic aircraft and helicopters unambiguously. The content of this document D6.3b was consequently altered to investigate the principal effects of the shape of a transfer function on the waveform through parameter studies, in addition to providing the resulting response waveforms for a selected set of transfer functions determined in WP5.
91
This document D6.3b [26] is therefore organised as follows:
• After some technical remarks on the computational tools and procedures employed, response waveforms for generic transfer functions are presented in order to assess the principle influence of different transfer function shapes on the response.
• In the subsequent section, response functions for selected transfer
functions obtained from modelling a generic aircraft model as well as a Saab 2000 aircraft and a Super Puma helicopter are compared with each other.
• Finally, some conclusions are drawn from the results presented here.
As the results of this analysis appeared to be somewhat ambiguous, some artificial transfer functions were investigated in addition. The report can therefore provide examples
• on how different features of the transfer functions affect the resulting internal lightning waveforms, and
• in which way different aircraft configurations will lead to different internal threat levels and wave shapes.
As only a selected number of configurations could be investigated in the available time it cannot give a complete treatment of the subject. It can also not define generic internal waveforms or a generic internal lightning environment. This is due in part to the ambiguities of the results on the transfer functions. There is, however, also a conceptual difficulty associated with establishing a generic internal lightning environment as the large number of different configurations and influence factors does allow only almost trivial general statements on the internal environment and requires relatively detailed information on the specific configuration for a precise assessment of the actual wave shapes. The present study has shown the influences of
• the aircraft geometry,
• the cable routing,
• the wire configuration and
• the lightning strike configuration on the internal lightning environment. The findings on the actual aircraft and helicopter geometries employed agree – with respect to the maximum threat levels – well with present regulatory data of DO-160D ranging for the cable current from a few Amperes up to about 2000 A for an external waveform A excitation. Only for the unrealistic case of the network nrwt in the generic aircraft, where the cable bundle at the trailing edge of the wing is routed completely on the outside of the aircraft structure, are peak current levels of up to 107 A encountered. The most puzzling results of the analysis on the generic aircraft, the Saab 2000 aircraft and the Super Puma helicopter, are the time constants of the response waveforms. For typical cable
92
bundles routed inside the fuselage time to peak and time to half peak of about 180 µs and 500 µs respectively were observed – about three to four times larger than stated for the long duration current waveform 5 – with 40 µs and 180 µs respectively – in DO-160D (Waveform 5 is especially used in connection with CFC aircraft structures, the results, however, were obtained on all-metallic aircraft). This discrepancy needs to be resolved before more detailed conclusions can be drawn from the results presented here. Still, the methodology presented here promises to become an efficient means to determine the internal environment of an aircraft or helicopter in the design and development stage as well as for certification purposes. What remains to be done – besides resolving above mentioned discrepancies – is to establish guidelines or best practice procedures on how to efficiently employ these modelling techniques. This implies rules on
• what amount of detail to include in the model,
• how to estimate the dielectric properties and their variability – from one production batch to the next and over the aircraft’s service life – of the large variety of materials used in an aircraft,
• how to include manufacturing tolerances in the computations, and
• how to sample the large number of possible configurations and interpret and process the potentially huge amount of results to obtain an accurate and useful assessment of the internal electromagnetic environment.
These objectives go far beyond the scope of FULMEN, they have to be treated in a follow-up project.
93
VI. Conclusions So, through the Fulmen project, a lot of work and associated results had been produced. The paragraphs below will give an overview of all the technical and scientific documents produced with indication of their main content. A first document D1 [1] gives an overview of regulations on both direct effects and indirect effects of lightning. It is a critical analysis synthesis of current regulatory documents. The purpose of report D2.1 [2] is to investigate the in-flight available data associated with the flight campaigns in order to extract the main parameters of the lightning strike to aircraft. The documents D2.5B/I [4], D2.5B/II [5] and D2.5B/III [6] review the collection of data, the construction of the databases, their analysis and the associated conclusions about respectively the ground measurements of lightning strike current characteristics, about the in-flight incidents concerning interactions between lightning and an aircraft and about the internal waveforms and transfer functions. The report D3.1a [7] presents some results about the definition of the attachment points; the electrostatic configuration met by an aircraft during its flight; some results of the electrostatic numerical codes and the results of the preliminary experiment to determine the attachment points are presented and commented and the preliminary experiment to validate the two test set-up usually performed to simulate in laboratory the beginning of the development of the bi-directional discharge which leads to a lightning strike to aircraft. The report D3.1b [8] follows directly the previous one and shows that the critical ambient field leading to a lightning strike to an aircraft and computed by this model is quite consistent with the ambient field measured during in flight experiment. The report D3.1c [9] presents the results of the laboratory experiment to determine only the entry and exit points of highest probability for a real aircraft and defines the typical input parameters to use in the models of definition of the attachment zones In the document D3.2a [10], a numerical model had been developed to investigate the dynamical effects (interaction of electromagnetic and hydrodynamic forces) which occur during the sweeping phase of lightning attachment. The document D3.2b [11] reviews the results of experiment on lightning sweeping conducted in a wind tunnel at the Moscow Power Engineering Institute. The report D3.2c [12], as a synthesis document, reviews the results concerning the sweeping phase of lightning at the aircraft surface. Experimental and theoretical approaches carried out into the documents D3.2a [10] and D3.2b [11] are commented and criticised. and moreover, a physical model developed by MPEI is presented. At last, an assessment of arc sweeping taken into account and its perspectives for protection strategies of aircraft manufacturers are carried out.
94
The document D4.1 [13] reviews the results concerning the definition of the external threat and especially about the improving of waveforms. A new lightning environment is proposed. It will constitute a basis for discussion into regulation committees like the EUROCAE lightning group (WG31) for the improvement of future regulatory documents. The document D4.2a [14] gives an extensive list of the different methods available to establish lightning zones together with some guidelines on their use, applicability and reliability. The document D4.2b [15] is clearly linked with the previous one. It describes the lightning strike zone definitions resulting from the application of the suggested zoning methodology to a generic aircraft and helicopter geometry. A comparison with current and proposed regulations had been performed and differences had been identified and assessed in order to evaluate their significance. It has to be emphasised that while the computational tool to determine the initial attachment zones is quite mature and has been extensively evaluated, the methodology for zoning suggested still requires some more testing and evaluation. The purpose of the report D4.3 [16] is to present an initial attempt to found a case for the required degree of accuracy on probability grounds. An argument is then built from the probabilities of threat levels, their likelihood of attaching to an aircraft, and the probability of the aircraft being vulnerable to them. The report D4.4 [17] is an investigation of the parameters affecting mechanical forces in aluminium and CFC plates subject to simulated lightning strikes. The report D5.1a [18] describes a series of measurements designed to increase understanding of dE/dt and d2B/dt2 coupling mechanism, and to help identify appropriate equipment test levels for such coupling effects. In addition modelling using a 2D code, is used to try to understand the mechanisms involved. The report D5.1b [19] presents the results of a study dedicated to the indirect effects of a lightning strike on an aircraft or helicopter. A 3D computer code has been used to calculate the electric field inside a representative aircraft and helicopters. The electric field has been calculated along cable bundles. Different lightning entry and exit points and different structural characteristics are considered. A FDTD computer code has been used to perform the calculations. The report D5.2a [20] and [21] is dedicated to the "Network Modelling Analysis" and is closely related to the document D5.1b [19] about "Coupling mechanisms ", devoted to the external environment. Indeed, one of the outputs of this document, the component of the electric field along the network routing, is the perturbing source acting on the cables of the networks. So, it is considered that the main step in the understandings of "field coupling to cable" is the numerical description and managing of complex harnesses made of many elementary cables having a non uniform geometry. A part of the study is the analysis, in terms of current or voltage, of the relative contribution of the successive modifications brought to the generic aircraft through
95
their influence on the driving electric field distribution. A second part is reserved to the illustration of the role of the bundle parameters in determining the pulse level at the terminal ports. The report D5.2b [22] presents some results of 2D analysis carried out on the FULMEN generic airframe geometry using a 2D computation code. about the shielding effectiveness of raceways and other aircraft structure. The report D6.1 [23] goes on to study the internal environment arising from inductive coupling. The data issued from the computations of electric field on generic aircraft and the subsequent injection of these fields into cable harnesses described into the document D5.1b [19] and D5.2a [20] are compared to simple analytical models that have been developed to describe the transfer function due to inductive coupling with shielded and unshielded cables. The calculated transfer function results appear not to agree with the simple model. Possible reasons of the disagreement are discussed. The document D6.2 [24] presents the results of a non linear effect analysis. In the determination of transfer functions through a full vehicle testing, low level injections (some kA) can usually give acceptable results. But there is still a risk to under or over estimate the levels by a factor close to 2, and that is the reason why an evaluation of non linearity effects is crucial, especially in the case of composite structures protected with a metallic mesh. The report D6.3a [25] describes a methodology for assessing the induced current and voltage waveforms on cable bundles inside an aircraft subject to an external lightning threat. The methodology is based on computational tools that have emerged over the past two decades. It shows great promise as a reliable and objective tool for evaluating the internal threat levels and waveforms in all stages of the aircraft lifecycle – during design and construction, certification and modification throughout its service life. In order to live up to this promise, some more work is needed on validation and to provide guidelines for the efficient application of this technique on real full-scale aircraft and helicopters. While the details of the methodology have been presented in the document D6.3a[25], the scope of this document D6.3b [26] was to give of the resulting response waveforms (in the time domain) for selected transfer functions that were in part determined via this method. Originally, the present deliverable was to provide a definition of the lightning internal environment for generic aircraft and helicopters based on a majoring of the transfer functions obtained in the model calculations of documents D5.1b [19] and D5.2a [20]. However, in a comparison of the transfer functions obtained in this way with simple analytical models some ambiguities surfaced that could not be resolved within the time frame of the FULMEN project. Therefore, it was not possible to define the lightning internal environment for generic aircraft and helicopters unambiguously. The content of this document D6.3b [26] was consequently altered to investigate the principal effects of the shape of a transfer function on the waveform through parameter studies, in addition to providing the resulting response waveforms for a selected set of transfer functions. The present study has shown the influences of the aircraft geometry, the cable routing, the wire configuration and the lightning strike configuration on the internal lightning environment.
96
VII. Dissemination and exploitations of results This section of this document is dedicated to the actions of dissemination and exploitation of results performed during the project life. The most direct exploitation of the results obtained in the project Fulmen is their transmission to the European Joint Aviation Authorities (J.A.A.) and the EUROCAE working group 31 and indirectly the associated American SAE-AE4L committee. Indeed, a main part of the results consists in an improvement of the lightning environment definition and its associated effects on aircraft. So, this kind of outputs can directly “feed” the discussion during the writing of new documents inside the working groups of advisory or regulatory committees. As a consequence, several members of the Fulmen consortium participated to Eurocae WG31 meetings and presented results issued from the project. In order to contribute by another way to the same objective than the one previously described, it was decided, given that the main results of Fulmen work was classified with a status “public”, that the distribution list of the different technical and scientific documents could be enlarged to people external to the consortium. So, the following people received the technical reports of the Fulmen project :
• Chairman of the Eurocae working group 31 : J.-P. Moreau
• Chairman of the SAE-AE4L committee : A. PLUMER
• J.A.A. / UK CAA : J. Howell and then D. Tudor
• UK lightning club members
• UK DRA : N. Carter
• GAO Consultancy : G. Oddam
• German LBA : M. Kleine-Beek and H. Beens
• German WTD81 M. Ruffing
• German BMVg : M. Straehle Moreover, given the type of results of such a project (see upward) and in order to help scientifically the European Commission to follow the progress of the work and the quality of the outputs, one expert from the JAA had been associated to the project, systematically invited to the progress meetings and in the distribution list of all the documents produced during the project life (see the list upward). These 3 examples of dissemination of results are linked together with the global objective to facilitate the possible implementation of the results produced by the project Fulmen into the future regulatory documents in order to improve the aircraft safety regarding with the qualification/certification processes and the exploitation
97
rules through a better taking into account of the current technical and scientific knowledge of the lightning environment and associated effects on aircraft. During the project life, the different partners of the consortium disseminated the results inside their own company (e.g. Airbus) through some internal presentations or the distributions of the technical documents. A mid-term workshop had been organised at Suresnes, France on the 7-9 of January 1998. It grouped 30 participants and had been a good opportunity to get more people aware of the work produced inside this project. Another opportunity to disseminate information was given in 1999 (17-18 June 1999, during the Paris Air Show) at Paris. Indeed, a symposium was organised by the co-ordinator of the European project CATE (other project from the 4th Framework programme dedicated to some electromagnetic aspect in the aeronautical field, very close from the Fulmen topics) and they asked people from the Fulmen consortium to perform several presentations. Finally, 3 partners of Fulmen participated to this 2-day symposium (25 participants). The project Fulmen had been represented by his co-ordinator into the thematic network EXT-HAZ that grouped 9 European projects from the 4th framework programme. This participation was a good opportunity to exchange information with people from other fields of research activities linked with the aircraft safety. The International Conference On Lightning and Static Electricity took place at Toulouse on the 22-24 of June 1999. More than 100 participants attended this major event dedicated to Lightning every 2 years. It was decided inside the Fulmen consortium to take the opportunity of this event to show our work to the aeronautical scientific community. As a consequence, a majority of the partners attended the conference and 10 oral presentations concerning Fulmen results allowed to disseminate a large amount of information about the results of our project during this conference. 9 papers had been published in the proceedings of the conference and a communication about the Fulmen general objectives, contents and achievements had been performed in the plenary session at the opening of the conference. The published papers are listed in the section VIII of this document through the references [27] to [35]. Thanks to the large interest from many participants of this conference to our work, a lot of contacts took place and some people ask for some Fulmen results or propose to collaborate like for example (non exhaustive list) :
• Vladimir. A. RAKOV from the University of Florida
• E. Philip KRIDER from the University of Tucson, Arizona
• Wolfgang J. ZISCHANK from the University of armed forces, Münich
• Gerhard Baüml from the University of Armed Forces, Münich
98
• Maria Sabrina SARTO from the University “La Sapienza” of Roma
• J. VERPOORTE from the National Aerospace laboratory (NLR)
• … Since March 2000, all the partners of the Fulmen consortium are included into the consortium EM-Haz, an European project of the 5th framework programme that includes 10 partners and is dedicated to electromagnetic hazards (Methods and technologies for aircraft safety and protection against electromagnetic hazards). It allows to continue to exchange information, especially the results previously obtained but also it gives the opportunity to continue to work on some subjects treated into the Fulmen project but not always achieved during the project life. After the end of the project, some people from the consortium Fulmen continue to participate at Eurocae meetings (working group 31 dedicated to lightning) to contribute to improve the regulatory documents.
99
VIII. References
[1] Douay, A.; Hardwick, J.; Bayle, A.; Zaglauer, H.; Tagliana, B.; Bondiou-Clergerie, A. and Persson, S., “WP1 synthesis report : critical analysis of regulatory documents”, Deliverable D1, Fulmen project, 1996
[2] Lalande, P. and Bondiou-Clergerie, A., “collection and analysis of available in-flight measurement of lightning strikes to aircraft”, Deliverable D2.1, Fulmen project,
[3] Vile, M.R. and Jones, C.C.R., “lightning ground strikes, in-service strikes to aircraft and induced pulse threats databases”, Deliverable D2.2, Fulmen project, 1997
[4] Vile, M.R.; Jones, C.C.R.; Douay, A. and Uhlig, F., “database on ground measurements: background, set-up and analysis of data”, Deliverable D2.5B/I, Fulmen project, 1998
[5] Douay, A.; Uhlig, F.; Vile, M.R. and Jones, C.C.R., “database on in-flight incidents: background, set-up and analysis”, Deliverable D2.5B/II, Fulmen project, 1998
[6] Douay, A.; Uhlig, F.; Vile, M.R. and Jones, C.C.R., “database on internal waveforms and transfer functions: background, set-up and analysis”, Deliverable D2.5B/III, Fulmen project, 1998
[7] Lalande, P.; Bondiou-Clergerie, A. and Zaglauer, H., “discharge initiation phase: definition of a typical atmospheric configuration, determination of airframe polarisability, experimental determination of the attachment points”, Deliverable D3.1a, Fulmen project,
[8] Lalande, P.; Bondiou-Clergerie, A.; Zaglauer, H. and Jones, C.C.R., “computations of initiation zones”, Deliverable D3.1b, Fulmen project,
[9] Lalande, P.; Bondiou-Clergerie, A. and Ulmann, A., “definition of the attachment points: results of the laboratory experiment”, Deliverable D3.1c, Fulmen project,
[10] Clibbon, K.L.; Jones, C.C.R. and Rowse, D.P., “investigation into the sweeping phase model of lightning attachment”, Deliverable D3.2a, Fulmen project,
[11] Douay, A.; Bizyaev, S.; Bourmistrov, M. and Levitova, L., “experimental investigation of the lightning sweeping phase”, Deliverable D3.2b, Fulmen project, 1998
[12] Uhlig, F., “synthesis on sweeping/hang-on phase”, Deliverable D3.2c, Fulmen project, 1999
[13] Uhlig, F. and Gondot, P., “definition of the external threat : improved waveforms”, Deliverable D4.1, Fulmen project, 1999
100
[14] Zaglauer, H., “improved method for lightning strike zone definitions”, Deliverable D4.2a, Fulmen project, 1999
[15] Zaglauer, H., “zone definitions on a generic aircraft and helicopter”, Deliverable D4.2b, Fulmen project, 1999
[16] Jones, C.C.R., “probabilistic approach to in-flight lightning strike attachment”, Deliverable D4.3, Fulmen project, 1999
[17] Hardwick, C.J.; Hawkins, K.C.; Paintin, P.D.; Bourne, N.; Proud, B. and Mebar, Y., “investigation of the parameters affecting mechanical forces in aluminium and CFC plates subject to simulated lightning strikes”, Deliverable D4.4, Fulmen project, 1997
[18] Haigh, S.J. and Hardwick, C.J., “dE/dt and d²B/dt² effects – measurements on the Hawker Hunter fuselage”, Deliverable D5.1a, Fulmen project, 1997
[19] Persson, S., “modelling of transfer function : coupling mechanisms”, Deliverable D5.1b, Fulmen project, 1999
[20] Marque, J.-P.; Bertuol, S. and Parmantier, J.-P., “modelling of transfer function : network modelling analysis (part I)”, Deliverable D5.2a/I, Fulmen project, 1998
[21] Marque, J.-P.; Bertuol, S. and Parmantier, J.-P., “modelling of transfer function : network modelling analysis (part II)”, Deliverable D5.2a/II, Fulmen project, 1998
[22] Haigh, S.J., “Investigations using the 2D INDCAL Code into Shielding Effectiveness of Raceways and other Aircraft Structure”, Deliverable D5.2b, Fulmen project, 1999
[23] Bond, R. and Hardwick, C.J., “review of WP2 and WP5 transfer function data; Fourier transform analysis of transfer functions”, Deliverable D6.1, Fulmen project, 1999
[24] Ulmann, A. and Enjalbert, V., “analysis of non linear effects”, Deliverable D6.2, Fulmen project, 1999
[25] Zaglauer, H., “method for the definition of waveform parameters for indirect effects in a given airframe”, Deliverable D6.3a, Fulmen project, 1999
[26] Zaglauer, H., “definition of the lightning internal environment for generic aircraft and helicopters”, Deliverable D6.3b, Fulmen project, 1999
[27] Hardwick, J. and Hawkins, K, “Study of induced voltages and current on core wires within screened cables”, ICOLSE, Toulouse, 1999
[28] Haigh, S.; Hardwick, J. and Hawkins, K., “some investigations into coupling of E-fields into Airframe wiring”, ICOLSE, Toulouse, 1999
[29] Parmantier,J.-P.; Marque, J.-P. ; Bertuol, S. ; Thibblin, U. and Persson, S., “modelling and analysis of the electromagnetic environment on aircraft and
101
helicopter Part.2 : coupling to complex cable networks”, ICOLSE, Toulouse, 1999
[30] Lalande, P.; Bondiou-Clergerie, A. and Laroche, P., “computations of the initial discharge initiation zones on aircraft or helicopter”, ICOLSE, Toulouse, 1999
[31] Lalande, P.; Bondiou-Clergerie, A.; Laroche, P.; Ulmann, A. ; Dimnet, P. ; Bourrillon, J.-F. ; Tamin, L. ; Douay, A. ; Uhlig, F. and Gondot, P., “determination in laboratory of zone of initial lightning attachment on aircraft and helicopter”, ICOLSE, Toulouse, 1999
[32] Zaglauer, H.W. and Wulbrand, W., “a simplified model for the determination of initial attachment zones via electric field modelling – Parameter studies and comparisons”, ICOLSE, Toulouse, 1999
[33] Zaglauer, H.W. ; Wulbrand, W.; Douay, A.; Uhlig, F.; Jones, C.; Clibbon, K.; Ulmann, A.; Lalande, P.; Bondiou-Clergerie, A. and Laroche, P., “definition of lightning strike zones on aircraft and helicopters – results of the Fulmen program”, ICOLSE, Toulouse, 1999
[34] Lalande, P.; Bondiou-Clergerie, A. and Laroche, P., “analysis of available in-flight measurements of lightning strikes to aircraft”, ICOLSE, Toulouse, 1999
[35] Ulmann, A. and Enjalbert, V., “influence of non-linear effects in the determination of transfer functions” , ICOLSE, Toulouse, 1999