Embed Size (px)
Citation preview
Final Report for Illinois Department of Natural Resources, Special Wildlife Funds Grant – Illinois WildlifePreservation Fund.
Grant Agreement: #12-L11W
Grantee: Midewin Tallgrass Prairie AllianceRepresented by: Gerald Heinrich
P.O. Box 2026Joliet, Illinois 60434
Telephone: (815) 476-6171
Timeframe of Project: September 5, 2011 to June 30, 2013
Grantee representative completing report:Dr. Amy Chabot
2395 Harlowe RoadArden, Ontario K0H 1B0

Project Objectives:
Funding was received from the Illinois Department of Natural Resource’s Wildlife Preservation Fund toaddress the following objectives:
1. Locate Loggerhead Shrike during the breeding season in the Midewin National Tallgrass Prairie.2. Assess site re-use/fidelity rates.
3. Assess band status of adult shrikes.
4. Trap and band adult shrikes.5. Recapture previously banded adult shrikes.6. Determine age ratio of shrike population.7. Quantify number of breeding pairs and single birds.8. Quantify reproductive effort and nesting success.
Completed Project Description:
During the tenure of the Grant to which this report corresponds (Grant Agreement #12-L11W), theMidewin National Tallgrass Prairie has been surveyed for breeding Loggerhead Shrike, an endangeredspecies in Illinois. Survey effort has been focused on historic breeding sites, due to the species tendencytoward site re-use, but also areas of suitable habitat. Reproductive success has been quantified bybehavioural monitoring and nest checks. Adult shrikes were trapped and banded with a stainless steel USGeological Survey (USGS) bird band, thereby facilitating assessment of immigration rates and over-wintersurvival of this small, isolated, but significant breeding population. Age ratios of returning breeders wasquantified using trapping efforts and behavioural observation, allowing more detailed assessment of over-winter survival by age cohort and sex. The results from this project will assist in delineating limiting factorsand facilitate conservation efforts for the species both in Illinois, and more broadly.
Summary of Project Accomplishments: Introduction
The Loggerhead Shrike (Lanius ludovicianus) is one of two species of shrike that occur in North America.The species includes from 7 to 13 subspecies (reviewed in Yosef 1996), with 11 subspecies generallyrecognized (Millers 1931, Figure 1). The Loggerhead Shrike is the only species of shrike that has anexclusively North American range.
The species utilizes a variety of shrubland and grassland habitats that vary from shrub-steppe in westernUnited States to unimproved pastureland associated with limestone plains in the eastern Canadianprovince of Ontario (Pruitt 2000). The range of the Loggerhead Shrike in North America prior to Europeancolonization is unknown. It is believed that in the late 1800s, the species expanded into northeast NorthAmerica with the clearing of land for agricultural purposes (Cadman 1985). By the mid-1900s, the shrikewas considered to be common throughout its continental North America range. But, by the 1950s,Loggerhead Shrike populations were noted to be in decline, in particular in northeastern North America(Pruitt 2000).
Shrikes breeding in northern portions of their range, including the Midewin National Tallgrass Prairie, arebelieved to migrate to areas in which there is less than 10 days of snow cover each winter (Yosef 1996,Figure 2). Those areas that support breeding populations of Loggerhead Shrikes in the southern UnitedStates and Mexico are also areas where the species is known to over-winter – i.e. resident and migrantpopulations mix on the wintering grounds.
The Loggerhead Shrike epitomizes the dire conservation status of many grassland birds in North America.

Populations have been declining range-wide for the last 50 years (Cade and Woods 1996, Figure 3) and thespecies is now largely extirpated in northeastern North America, even where apparently suitable habitatstill exists (Pruitt 2000, Figure 4). The Loggerhead Shrike has experienced the 6th largest decline of any ofthe 341 species of Neoptropical migratory birds since the inception of the Breeding Bird Survey(79%; Berlanga et al. 2010). The United States Fish and Wildlife Service considers the Loggerhead Shrike tobe a bird of Conservation Concern and it is listed as an Endangered, Threatened, Species of Concern or aWatch List species in 26 states (Pruitt 2000). The species is listed as “Endangered” in Illinois and is nowrare in the northern half of the state (Figures 3 and 4).
The Midewin National Tallgrass Prairie supports a small, apparently isolated population of shrike that hasranged up to 13 breeding pairs and up to five single birds annually since 2005. This population representsone of the few remaining migratory populations of LOSH in eastern North America (Figure 4) and thus isan important stronghold for the species.
Many reasons have been cited as potentially contributing to the decline of the Loggerhead Shrike,including loss of habitat on the breeding and wintering grounds, pesticides, mortality associated withroads, adverse weather conditions and inter-specific competition. It is likely that a combination of factorsis affecting the species, possibly at different times throughout their life cycle. For example, adverseclimatic trends on the breeding grounds may reduce nesting success, while road mortality may decreasethe survival rate during migration. Further research is required to better understand the cause(s) of thedecline and seasonal interactions.
Materials and Methods
Fieldwork activities were carried out under appropriate permits, including an Illinois Department ofNatural Resources Scientific Permit, Illinois Department of Natural Resources Permit for Possession ofEndangered or Threatened Species, and Federal bird banding permit 21072-R.
Shrikes were located by Dr. Chabot, and by volunteers and staff of the Midewin National Tallgrass Prairieparticipating in the Loggerhead Shrike and Upland Sandpiper Survey and/or the Grassland Bird Survey.Breeding pairs and single birds were monitored throughout the season by Dr. Chabot but the outcome ofsome (re)nesting attempts are unknown. Two nests checks were undertaken at each nest to determinethe number of eggs laid and number of nestlings hatched. Fledging success was determined by thepresence of young birds.
Adult shrikes were trapped using a walk-in live trap similar to a combination Potter and Chardonnerettrap. Traps were baited with a small, live pet-store mouse protected in a hardware cloth cage and placedon roads or in pastures near routinely used perches.
Adult shrikes were banded with a stainless steel band on their right leg from 2005 to 2012. From 2005 to2007, nestling shrikes were also banded with a stainless steel band, but on their left leg. In 2013, adultshrikes received the stainless steel band on their left leg, to help in determining return rates and agestructure more accurately in the population (i.e. shrikes will be banded on the left leg in odd years and onthe right leg in even years as of 2013).
The band status of returning birds was determined by visual observation of individuals, with the aid of abirding spotting scope.
Adults were sexed based on the presence (female) or absence (male) of a brood patch and aged based onthe retention of juvenile (Hatch Year) plumage as Second Year (SY – first breeding season) or After SecondYear (ASY – second or subsequent breeding season) (Pyle 1997).
Morphological measurements (e.g. wing chord length, tail length, bill width, bill depth, etc.) were taken

from all adult birds before they were released at the location of their capture. Two tail feathers (theouter right rectrice – R6 and/or the inner right rectrice – R1) were obtained from each adult for use ingenetic assays as per Chabot (2011).
Shrikes were released at their point of capture. Handling time was less than 15 minutes per bird.
Results
Objective 1: Locate nesting territories of Loggerhead Shrike in the Midewin National Tallgrass Prairie.
A list of occupied territories (2005 – 2013) is provided in Table 1. A total 27 sites have had breeding pairs. Afurther 5 sites have had a single adult bird, but no breeding activity. Figure 5 depicts the location of theterritories used between 2005 and 2013. Universal Transverse Mercator system coordinates have beenprovided to William Glass, Midewin National Tallgrass Prairie, US Forest Service (USFS).
Objective 2: Assess site re-use/fidelity rates.
Site re-use by Loggerhead Shrike at Midewin National Tallgrass Prairie from 2006 to 2013 is presented inTable 1.
Ten of the total 27 (37%) sites used by breeding pairs of shrikes have been used only once in the 9 yearwindow of study (Table 1). A breakdown of the number sites re-used is as follows: 1 site has been used for 8of the 9 total years, including 5 consecutive years (“South” site along West Patrol Road); 1 site has been usedfor 7 consecutive years (Bunkers Northwest of Gate 10 on the west side of Midewin); 1 site has been used for 6out of 9 years, including 4 consecutive years; 1 site has been used for 5 of 9 years; 5 sites (19%) have beenused for 4 out of the 9 years; 6 sites (22%) have been used for 3 years, 4 of which were used consecutively overthe 3-year period; 2 sites (7%) have been used for 2 of the total 9 years during which monitoring has occurred(Figure 5).
Site fidelity, versus site re-use, has been difficult to determine due to low retrapping rates – two shrikesbanded as adults, both male, returned as breeders in the subsequent year, one to the same site(MacArthur Road) an one to a different site (South Patrol Road to Bunkers Northwest of Gate 10). Twonestlings – both females – returned as breeders in the year after hatch – one returned to breed at anearby adjacent site (MacArthur Road to Baseline Road South) and the other to a more distant site(Powerline to Railway and Bike Path). Additionally, one bird banded as an independent Hatch Year birdwas retrapped – this bird, a female, nested within a short distance of her natal site (Crap Pile Road West toBike Path West End).
Objective 3: Assess band status of adult shrikes.
Banding has been undertaken annually in Midewin since 2005 with varying success (i.e. total number ofadults in the population that could be trapped and banded) (Table 2). In total, 68 adult and 2 independentHatch Year shrikes were trapped and banded between 2005 and 2013. The percentage of the total knownbreeding age population (i.e. not including independent Hatch Year birds) that has carried bands at theend of the season (i.e. both returning banded birds and birds banded in the year) has ranged from 44% to96% (Table 2). However, only 17% to 59% of the adults have been found to be banded at the start of anyseason (Table 2). Of the 40 returning banded birds, 16 (40%) were female and 24 (60%) were male.
An annual breakdown of return banded birds is as follows:
2013: 6 (38%) shrikes were confirmed as returning banded birds, including 3 males and 3 females, all ofwhich were banded as adults, presumably in Midewin.

2012: 5 (59%) shrikes were confirmed as returning birds, including 2 males and 3 females. One returningfemale was banded in 2011 as an independent Hatch Year bird.
2011: 8 (31%) shrikes were confirmed as returning breeders to Midewin, including 6 males and 2 females,all of which were banded as adults.
2010: 5 (31%) shrikes were confirmed as returning breeders to Midewin, including 4 males and 1 female.
2009: 3 (19%) shrikes were confirmed as returning breeders to Midewin, including 2 males (one of whichwas banded as a SY bird in Midewin in 2008) and 1 female. All were banded as adults.
2008: 4 (24%) shrikes were confirmed as returning breeders to Midewin including 2 males (one of whichwas banded as a SY bird in Midewin in 2007) and 2 females. One (7%) of 15 nestling banded in 2007returned in 2008 – a female – but was not found again in subsequent years.
2007: 4 (17%) shrikes were confirmed as returning adult birds, including 2 males and 2 females.Additionally, 1 (6%) of 18 nestlings banded in 2006 returned to breed in Midewin – again female and alsonot found in subsequent years.
2006: 5 (21%) adults were confirmed as returning birds including 3 males and 2 females. None of the 7nestlings banded in 2005 returned in 2006, or thereafter.
Objective 4: Trap and band adult shrikes using a stainless steel USGS bird band.
A total of 70 shrikes have been trapped in Midewin between 2005 and 2013 (Tables 2 and 3). Of these, 35(50%) were female and 35 (50%) were male.
A breakdown of banding effort by year is as follows:
2013: 4 shrikes (1 female, 2 male and 1 Hatch Year) were banded. A total of 38% of the adult populationwas banded at the start of the season and 63% of the known adult population was banded at the end ofthe season.
2012: 3 adult shrikes (2 female and 1 male) were banded. A total of 59% of the adult population wasbanded at the start of the season and 96% of the known adult population was banded at the end of theseason.
2011: A total of 10 shrikes were banded: 9 adult shrikes (6 female and 3 male), as well as one independentHatch Year (later determined to be female). A total of 31% of the adult population was banded at the startof the season and 65% of the known adult population was banded at the end of the season.
2010: 8 adult shrikes (5 female and 3 male) were banded. A total of 31% of the adult population wasbanded at the start of the season and 72% of the known adult population was banded at the end of theseason.
2009: 10 adult shrikes (7 female and 3 male) were banded. A total of 19% of the adult population wasbanded at the start of the season and 81% of the known adult population was banded at the end of theseason.
2008: 6 adult shrikes (2 female and 4 male) were banded. A total of 24% of the adult population wasbanded at the start of the season and 59% of the known adult population was banded at the end of theseason.

2007: 13 adult shrikes (5 female and 8 male) were banded. A total of 17% of the adult population wasbanded at the start of the season and 71% of the known adult population was banded at the end of theseason. Fifteen nestlings were banded from 5 nests. 2007 was the last year in which nestlings werebanded.
2006: 7 adult shrikes (2 female and 5 male) were banded. A total of 21% of the adult population wasbanded at the start of the season and 44% of the known adult population was banded at the end of theseason. Eighteen nestlings were banded from 4 nests.
2005: 9 adult shrikes (3 female and 6 male) were banded. None of the adult population was banded atthe start of the season and 56% of the known adult population was banded at the end of the season.Seven nestlings were banded from 2 nests.
Objective 5: Recapture previously banded adult shrikes.
Forty (61%) of the 66 shrikes banded between 2005 and 2012 in Midewin have been resighted insubsequent years (2006 to 2013) (Table 4). However, the actual return rate is likely lower than 61% as it ispossible that birds have returned in more than 1 year and thus are being ‘double counted’. Of thereturning birds, only 2 (3%), both banded as SY males, were retrapped. Two (5%) of 40 shrikes banded asnestlings have returned, both of which were retrapped. One (100%) bird first banded as independentHatch Year birds was retrapped.
Objective 6: Determine age ratio of breeding shrikes.
The proportion of SY shrikes (i.e. first year breeders) in Midewin has ranged from 6% to 44% of the totalknown population between 2005 and 2013 (Table 4). The ratio of SY male to SY female shrikes hasvaried – in general more SY birds were males (62%) (Table 4). Overall, of those birds that were aged as SYor ASY, 13% to 50% of the population has been first time breeders (Second Year birds). The overalllower percentage of SY birds in 2005 and 2006 is likely due to observer skill. Excluding these years, SY birdshave comprised 35% to 50% of the total population of SY and ASY birds.
Objective 7: Quantify number of breeding pairs and single birds.
During the period of 2005 to 2013, the population of Loggerhead Shrike in the Midewin National TallgrassPrairie ranged from 4 to 13 breeding pairs and 0 to 5 single birds annually for a total of 77 breeding pairsand 14 single breeding-age adult shrikes (Table 5).
Objective 8: Quantify reproductive effort and nesting success of breeding population.
Reproductive effort has been quantified through a combination of nest checks (to count eggs duringincubation and nestlings after hatch and prior to fledge) and behavioural observations (to determinefledging success). A summary of overall reproductive success by pair is presented in Table 1 – success (i.e.a nest that has made it to nestling or fledging stage, which may be a slight over-estimate of overallsuccess as not all nests with nestlings may have fledged young) has varied annually from a low of 55%(2007) to a high of 100% (2005 and 2012).
Objective 9: Obtain feather samples for genetic and stable isotope analysis .
Two tail feathers (the outer right rectrice – R6 and/or the inner right rectrice – R1) were obtained fromeach adult trapped. DNA has been extracted from the proximal tip of one feather and has been used ingenetic assays of 10 nuclear genetic markers (i.e. microsatellite loci). Remaining feather tissue has beenarchived in the laboratory of Dr. Stephen Lougheed, Associate Professor, Queen’s University, Kingston,Ontario, Canada, who is a collaborator with Dr. Chabot on genetic research on Loggerhead Shrike.

Objective 10: Prepare peer-reviewed publication .
Information obtained from this project and prior research on Loggerhead Shrike has been compiled into adraft manuscript for publication. Completion of this draft will be undertaken upon review and approval byIDNR, USFS and other project partners. Results of research on the Loggerhead Shrike in Midewin,including that funded by the Wildlife Preservation Fund, was conveyed to Midewin staff and volunteers onApril 11, 2013 as part of the organization’s lecture series.
Discussion and Summary
Population Size
The population of Loggerhead Shrike has varied more than three-fold from 2005 to 2013, with no steadyincreasing or decreasing trend (Figure 6). Further, the number of singles and pairs do not appear to beexperiencing similar trends. As single birds cannot be reliably sexed, it is not possible to determine if sex-biased mortality, leading to a bias in singles of a particular sex, may be impacting population size.Although, it would seem unlikely that single birds of opposite sex would not eventually pair.
Generally, when the population of After Second Year birds increases, overall population size also increases(Figure 7). The overall number of SY birds has remained relatively steady across years, despite fluctuationsin population size and reproductive success. Results suggest that differences in over-wintering successbetween age cohorts, in particular of ASY birds, may be important to the long-term viability of thispopulation. However, reproductive also appears to have an impact on population size in the subsequentyear – population size tends to decrease following years in which reproductive success is lower (Figure 8),suggesting that the species is limited based on factors throughout the annual cycle.
Site Fidelity and Re-Use
A pattern of high site re-use has been noted in Midewin, which appears to be common in the species(Pruitt 2000, Chabot, unpublished data). Low retrapping success and the current banding scheme, inwhich individuals are not uniquely identified, has made it difficult to compare site fidelity and re-userates. Historically, authors reported the Loggerhead Shrike to be site-faithful (Atkinson 1901, Bent 1950,Porter et al. 1975, Kridelbaugh 1983). However, most of the earlier evidence for site fidelity in the speciesresulted from observations of the reuse of nests or nest sites by unmarked birds, with observers assumingthat if a site was occupied in two consecutive years, the adults previously occupying the site had returned.More recently Haas (1989) reported low return rates in a North Dakota population of Loggerhead Shrike,which was attributed to low site fidelity, rather than over-wintering mortality. Similarly, in Ontario datafrom colour-banding studies, in which individuals can be uniquely identified, indicates that site fidelity islower than site reuse rates (Chabot, unpublished data). Haas (1989) concluded that there was a need tore-evaluate site fidelity in Loggerhead Shrikes, in particular in light of the decline of the species. Inparticular, when evaluating the cause of decline, low site fidelity and return rates should not necessarilybe taken as evidence of high winter mortality in this species.
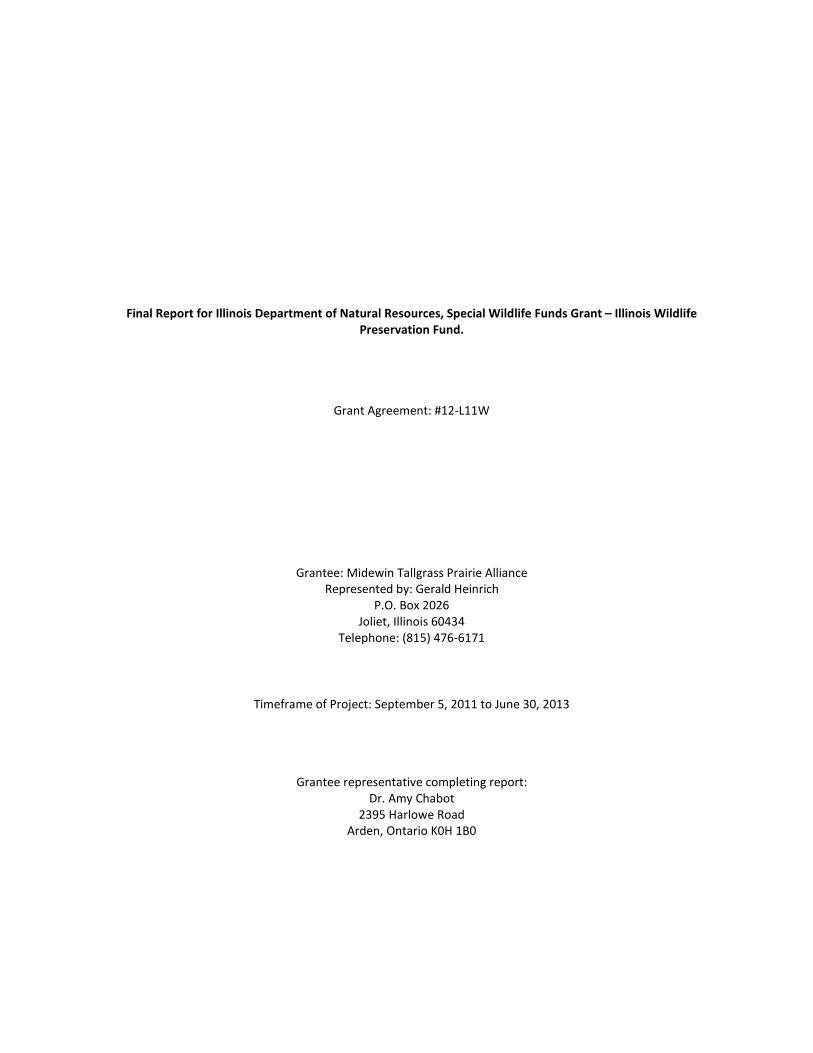
Site re-use in Midewin appears to be related to nesting success, with sites at which reproduction wassuccessful being reused more often than those at which it was not (Figure 9). Research by Etterson (2003)indicated that social factors were partly responsible for the spatial distribution of shrikes – breeding siteswere shown to be spaced more close together than expected if nest site choice were random. Theapparent non-random re-use of sites by shrikes may indicate that social factors are also important in sitereuse. Specifically, individuals may be taking social cues based on the presence of successfully fledgedyoung as a proxy measure for territory quality.
Returns and Recaptures of Adult Shrikes

To date, only two shrikes banded as adults have been re-trapped – once trapped as adults, shrikesbecome ‘trap-shy’. Nonetheless, resighting of banded birds is not difficult, allowing for estimation ofreturn rates in the population. Estimates of this nature depend upon many factors, including search effort,the detectability of the species, the ease in which a returning bird can be identified by reading a markerand the permanence of the marker.
The return rate of adult shrikes to Midewin (61%) is similar, but somewhat higher (although as notedabove, the rate may be somewhat elevated due to ‘double counting’ among years), to that notedelsewhere: 27.3% in 2000, 27.6% in 2001, 13% in 2002, 11% in 2003 in Ontario (Okines and McCracken2003); 14% in North Dakota (Haas 1989), 16% in Manitoba (Collister and DeSmet 1997), 32% in Alberta(Collister and DeSmet 1997), 41% in Indiana (Burton and Whitehead 1990) and 47% in Missouri(Kridelbaugh 1983). The larger proportion of unbanded shrikes at the start of each breeding season, inparticular when compared to the proportion of the total population banded at the end of the prior year(Table 2, Figure 10), suggests either a significant level of recruitment into the population or that a largenumber of shrikes are not located in (or around) Midewin annually. The results of breeding dispersaldistance for the species, the large number of unbanded birds that are ASY (and thus less likely to dispersevery far from the previous year’s breeding site), and the isolated nature of the population of LoggerheadShrike in the Midewin National Tallgrass Prairie suggests that most of these birds were either born, orbred in the vicinity the previous year
The higher return rate of male versus female shrikes in Midewin (60:40 male:female) (Table 2) is notunexpected. In general, the higher return rate of male birds is to be expected in birds where males gain agreater advantage by re-occupying sites that are familiar to them (Greenberg 1980). Whereas for femalebirds, the advantage is gained in mating with the most fit male and/or male with the best territory(Greenberg 1980).
Nestling Return Rates
To date, 2 (5%) of the 40 shrikes banded as nestlings have been found to return to breed at Midewin,both of which were female. In addition, one bird banded as an independent Hatch Year bird returned thesubsequent year to breed in Midewin, which was also female. The natal return rate for shrikes in Midweinis similar, but somewhat higher, to that noted elsewhere: 3.1% to 12% in Ontario (Okines and McCracken2003); 3.6% and 1.7% in Virginia (Luukkonen 1987 and Blumton 1989), 2.4% in Indiana (Burton andWhitehead 1990), 1.2% in Alberta (Collister and DeSmet 1997), 1.1% in Missouri (Kridelbaugh 1982), 0.8%in Manitoba (Collister and DeSmet 1997), 0.8% in North Dakota (Haas 1995) and 0.0% in Minnesota(Brooks and Temple 1990). However, the bias in returns toward females is unexpected since males tendto be the more philopatric sex in birds (Greenberg 1980). Further, studies to date have reported a malebias in site fidelity and female bias in dispersal in shrikes (Kridelbaugh 1983, Haas 1989, Collister andWicklum 1996, Okines and McCracken 2003), with as much as a five-fold difference between the sexes insome areas (Kridelbaugh 1983, Haas 1989). It is possible that our results suggest a bias in over-winteringsurvival in which young males have higher mortality rates than females. Alternatively, it is possible thatskewed sex ratios of nestlings is leading to a higher proportion of females, and thus higher return rate.However, this does not appear to be the case (Chabot, unpublished data).
Dispersal
Although data are limited, the natal and breeding dispersal distances of shrikes in Midewin is similar tothat noted in other portions of the species range. In Ontario, adult birds returned to within 0 – 47 km(mean of 2.2 km in 2000, 3.8 km in 2001, 8.5 km in 2002 and 18.6 km in 2003) of the breeding site atwhich they were banded and young returned to within 0 – 145 km (mean of 9.9 km in 2000, 10.6 km in2001, 47.0 km in 2002 and 15 km in 2003) of their natal site (Okines and McCracken 2003). In westernCanada, Collister and DeSmet (1997) found that returning adults dispersed an average of 2.7 km, with95% of adult shrikes returning to within 4.7 km of their previous year’s nest site, and young birds moved

an average of 14.7 km from their natal site.
Age Ratios
The proportion of SY to ASY shrikes (in Midewin has ranged greatly over the 9-year study period (Table 4,Figure 11). Overall, the number of SY birds has remained more constant than that of ASY birds, whichmay be driving overall population trends. Since 2007, when the majority of the population could be agedas SY or ASY, an equal or greater number of the SY birds have been female (with the exception of 2008)(Table 4, Figure 11). The result is unusual based on dispersal patterns of birds in general (Greenberg 1980)and data from shrike in other populations (Kridelbaugh 1983, Haas 1989, Collister and Wicklum 1996,Okines and McCracken 2003) and may suggest lower over-wintering survival of young males in thispopulation. It is unknown if the lower return of SY males has driven the overall small population size(versus population fluctuations).
The ratio of Second Year to After Second Year individuals can be a valuable metric for estimating avianproductivity because it does not require monitoring individual breeding sites and can often be estimatedacross large geographic and temporal scales (Peery et al. 2007). Ratios of juveniles to adults have beenused to estimate productivity for a range of animal taxa for both theoretical and applied purposes(Ricklefs 1997, Miller 2000, Rodway et al. 2003, Flanders-Wanner et al. 2004, Peery et al. 2004, Rohwer2004). The degree to which the age structure of the shrikes in Midewin matches that elsewhere isunknown. Data exists for shrike populations sampled in Ontario from 1999-2003 and 2008 to 2013,elsewhere in the United States between 2004 and 2007 on both the wintering and breeding grounds(Chabot, unpublished data), from Colorado over consecutive breeding seasons from ~1980 to date andfrom Florida and Texas over multiple winter seasons (S. Craig, pers. comm.). Comparison among data setswould help to determine if the decreasing population trend in shrikes across their range is beingexperienced in synchrony within age and sex cohorts, suggesting broad-scale limiting factors versus localfactors. Further, data on age ratio could be used in conjunction with Breeding Bird Survey data to assess ifpopulation trend can be correlated to age ratios, validating the interpretation of age-ratio data as apredictor of population trend for shrikes.
Reproductive Success
The population of Loggerhead Shrike at Midewin has experienced a high degree of nest loss in severalyears. Despite this, due to the species persistence at nesting, at least 50% of the breeding pairs haveproduced young that have reached the nestling phase (Table 1, Figure 12).
Clutch size ranged from 4 to 6 eggs, which similar to that noted elsewhere (Yosef 1996). Whilereproductive effort is average, overall reproductive success appears to be low due to egg and nestlingpredation. This factor, rather than fledgling survival (which appears high based on behaviouralobservations) is likely contributing to the low population size, at least in recent years. Predation of eggsappears to be more common than that of nestlings, and predation of first nests appears more commonthan predation of nests later in the season. This could be due to experience gained by breeders over thebreeding season, better nest concealment later in the breeding season after trees have leafed out, orincreased nest height noted in renesting attempts.
Nest loss due to predation has been identified as a cause for concern elsewhere in the species’ range.Predation rates can be determined by various factors, including density of predators, the occurrence ofnovel predators, biophysical aspects of the habitat (e.g. grass height which may provide more or lesscover to potential predators) and landscape effects (e.g. increased edge effect in smaller patches ofsuitable habitat can lead to increased predation). These and other potential questions related topredation and its impact on Loggerhead Shrike and other grassland bird warrants further study.

Acknowledgements
This project benefitted from the assistance of Fran Harty, The Nature Conservancy, Jim Herkert, IllinoisDepartment of Natural Resources, and William Glass and Renee Thakali, Midewin National TallgrassPriaire, U.S. Forest Service, as well as staff and volunteers of Midewin.
Literature Cited
Atkinson, W.L. 1901. Nesting habits of the California shrike Lanius ludovicianus gambeli Ridgw. Condor 3:9-11.
Bent, A.C. 1950. Life histories of North American wagtails, shrikes, vireos, and their allies. U.S. NationalMuseum Bulletin 197.
Berlanga, H., J.A. Kennedy, T.D. Rich, M.C. Arizmendi, C.J. Beardmore, P.J. Blancher, G.S. Butcher, A.R.Couturier, A.A. Dayer, D.W. Demarest, W.E. Eason, M. Gustafson, E. Iñigo-Elias, E.A. Krebs, A.O.Panjabi, V. Rodriguez Contreras, K.V. Rosenberg, J.M. Ruth, E. Santana Castellón, R. Ma. Vidal,and T. Will. 2010. Saving Our Shared Birds: Partners in Flight Tri-National Vision for LandbirdConservation. Cornell Lab of Ornithology, Ithaca, NY.
Blumton, A.K. 1989. Factors affecting loggerhead shrike mortality in Virginia. MSc. Thesis, VirginiaPolytechnic Institute and State University, Blacksburg, Virginia. 85 pp.
Brooks, B.L. and S.A. Temple. 1990. Habitat availability and suitability for Loggerhead Shrikes in the upperMidwest. American Midland Naturalist 123: 75-83.
Burton, K.M. and D.R. Whitehead. 1990. An investigation of population status and breeding biology of theloggerhead shrike in Indiana. Unpublished report to the Indiana Department of NaturalResources, Nongame and Endangered Wildlife Program. 136 pp.
Cadman, M. 1985. Status report on the Loggerhead Shrike (Lanius ludovicianus) in Canada. Committeeon the Status of Endangered Wildlife in Canada, Environment Canada, Ottawa, Canada.
Cade, T.J. and C.P. Woods. 1996. Changes in distribution and abundance of the Loggerhead Shrike.Conservation Biology 11:21-31.
Chabot, A.A. 2011. The impact of migration on the evolution and conservation of an endemic NorthAmerican passerine: Loggerhead Shrike (Lanius ludovicianus). PhD Thesis, Department ofBiology, Queen’s University, Ontario.
Collister, D. and K. DeSmet. 1997. Breeding and natal dispersal in the Loggerhead Shrike. Journal of FieldOrnithology 68(2): 273-282.
Etterson, M. A. 2003. Conspecific attraction in loggerhead shrikes: implications for habitat conservationand reintroduction. Biological Conservation 114: 195-205
Flanders-Wanner, B.L., G.C. White and L.l. McDaniel. 2004. Validity of prairie grouse harvest-age ratios asproduction indices. Journal of Wildlife Management 68: 1088-1094.
Greenberg, P.J. 1980. Mating systems, philopatry and dispersal in birds and mammals. Animal Behaviour28: 1140-1162.

Haas, C.A. 1989. Low return rates of migratory Loggerhead Shrikes: winter mortality or low site fidelity?The Wilson Bulletin 101(3): 458-460.
Haas, C.A. 1995. Dispersal and use of corridors by birds in wooded patches on an agricultural landscape.Conservation Biology 9:845-854.
Kridelbaugh, A.L. 1982. An ecological study of loggerhead shrike in central Missouri. MSc. Thesis, University ofMissouri, Columbia. 114 pp.
Kridelbaugh, A.L. 1983. Nesting ecology of the loggerhead shrike in central Missouri. The Wilson Bulletin 95(2):303-309.
Luukkonen, F.L. 1987. Status and breeding ecology of the loggerhead shrike in Virginia. MSc. Thesis. VirginiaPolytechnic Institute and State University, Blacksburg, Virginia. 78 pp.
Miller, A.H. 1931. Systematic revision and natural history of the American shrikes (Lanius). University ofCalifornia Publications in Zoology 38:11-242.
Miller, M.W. 2000. Modeling annual Mallard production in the prairie-parkland region. Journal of WildlifeManagement 64: 561-575.
Okines, D. and J. McCracken. 2003. Loggerhead Shrike Banding in Ontario: Report on the 2003 FieldSeason. Unpublished report prepared for the Canadian Wildlife Service – Ontario Region. 56 pp.
Peery, M.Z, B.H. Becker and S.R. Beissinger. 2007. Age ratios as estimators of productivity: testingassumptions on a threatened seabird, the Marbled Murrelet (Brachyramphus marmoratus ). The Auk124(1): 224-240.
Porter, D.K., M.A. Strong, J.B. Giezentanner and R.A. Ryder. 1975. Nest ecology, productivity and growth
of the Loggerhead Shrike on the shortgrass prairie. Southwestern Naturalist 19: 429-436.
Pruitt, L. 2000. Loggerhead Shrike status assessment. U.S. Fish & Wildlife Service.
Pyle, P. 1997. Identification Guide to North American Birds: Part 1. Columbidae to Ploceidae. Slate Creek Press,Bolinas, CA. 732 pp.
Ricklefs, R.E. 1997. Comparative demography of New World populations of thrushes (Turdus spp.). EcologicalMonographs 67: 23-43.
Rodway, M.S., H. M. Regehr and F. Cooke. 2003. Sex and age differences in distribution, abundance and habitatpreferences of wintering Harlequin Ducks: Implications for conservation and estimating recruitment rates.Canadian Journal of Zoology 81: 492-503.
Rohwer, S. 2004. Using age ratios to infer survival and despotic breeding dispersal in hybridizing warblers.Ecology 85: 423-431.
Yosef, R. 1996. Loggerhead Shrike (Lanius ludovicianus). In the Birds of North America, No. 231. (A. Poole andF. Gill, eds). The Academy of Natural Sciences, Philadelphia, and The American Ornithologists’Union, Washington, D.C.

Table 1. Breeding sites occupied and reproductive success for Loggerhead Shrike in the Midewin National Tallgrass Prairie: 2005-2013. Fail = nesting attemptnot successful. Nest = nest building observed, outcome unknown. Incubation = survived to incubation, outcome unknown. Nestling = survived to hatch,outcome unknown. Fledge = young successfully fledged from nest. Blank indicates site not active in that year.
1
23
4
5678
9
1
111
111111
2
22
2
2222P
S
Baseline Road North Nestling Nestling Fledge(Gate 10)
Baseline Road South Nestling Nestling Fail NestlingBike Path E and FledgeRoad Two West
Bike Path West
Bunker 63-20Bunkers NW of Gate 10 Fail Fledge FledgeCentral Road West Fledge Nestling IncubationCentral Road andRoad Two West
East Bike Path Fail
0 East Bunkers Nestling
1 Jordan Creek Nestling2 Landfill North Nestling Nestling Fledge3 Landfill South
4 MacArthur Rd Fledge Fail1
Unknown Nestling5 NE Bunkers Nestling Nestling Fail6 Crap Pile Rd East7 Crap Pile Rd West Fledge8 Powerline Nestling Fledge9 Railway and Nestling Fledge
Road Two West
0 S Patrol Rd Nestling Fail Fail
1 SE Bunkers Nestling2 W Corner NE Bunkers Fail
3 W Patrol Rd – Army
4 W Patrol Rd Central Nestling Fledge Fail5 W Patrol Rd North Fail6 W Patrol Rd – Remediation Nestling7 W Patrol Road South Fledge Unknown Nestling Fledgeercent Successful Pairs 100% 77% 55% 50% 86%
ite # Site Name 2005 2006 2007 2008 2009
FailUnknown Nestling
Fledge
FledgeFledge Fledge FleIncubationNest Fledge F le
FledgeFail
FailFledgeFledge
Fail Fledge F le
Fledge Fledge
Fledge Fledge Fle56% 75% 10
2010 2011 201
3
53
1
1dge Fail 7
4d ge F led ge 4
1
1
141
44
Fledge 2Fail 3
2d ge F led ge 6
3
11
Fail 1
331
d ge Fled ge 80% 57%
2 2013 Total Years Used

Table 2. Annual banding status of Loggerhead Shrike population at start and end of breeding season in the Midewin National Tallgrass Prairie: 2005 - 2013.
Year Banded Adult Population Adults Nestlings
Returned banded(M:F)
(% of total adults)
Banded in year Total adults with bands(% of total adults)
Pairs Singles Total Banded in year
2005 0 9 9 8 0 16 7(56%)
2006 5 7 12 13 1 27 18(3:2) (44%)(21%)
2007 4 13 17 11 2 24 15(2:2) (71%)(17%)
2008 4 6 10 6 5 17 0(2:2) (59%)(24%)
2009 3 10 13 7 2 16 0(2:1) (81%)(19%)
2010 5 8 13 9 0 18 0(4:1) (72%)(31%)
2011 8 9 17 12 2 26 0(6:2) (65%)(31%)
2012 5 3 8 4 1 9 0(2:3) (96%)(59%)
2013 6 4 10 7 2 16 0(3:3) (63%)
(38%)

Table 3. Adult and independent hatch year Loggerhead Shrike banded annually in the Midewin National Tallgrass Prairie: 2005 - 2013.
Age 2005 2006 2007 2008 2009 2010 2011 2012 2013 Total
Adult/Independent hatch year 9 7 13 6 10 8 101
3 41
70
Nestlings 7 18 15 0 0 0 0 0 0 40
Total 16 25 28 6 10 8 10 3 4 110
1Totals include one independent hatch year bird.

Table 4. Age ratio of all adult (singles and breeding birds) Loggerhead Shrike population in the Midewin National Tallgrass Prairie: 2005 -2013.
Site Name 2005 2006 2007 2008 2009 2010 2011 2012 2013
Second Year (F:M) 1 (0:1) 2 (1:1) 8 (4:4) 5 (1:4) 6 (3:3) 8 (5:3) 8 (6:2) 2 (2:0) 5 (3:2)After Second Year (F:M) 7 (2:5) 10 (3:7) 10 (4:6) 5 (3:2) 10 (5:5) 8 (3:5) 15 (6:9) 6 (2:4) 7 (3:4)After Hatch Year (F:M:Unk) 8 (6:2:0) 15 (9:5:1) 5 (3:1:2) 7 (2:4:1) 0 (0:0:0) 0 (0:0:2) 3 (0:1:2) 2 (0:0:2) 4 (0:1:3)Total SY:ASY:AHY 1:7:8 2:10:15 8:10:6 5:5:7 6:10:0 8:8:2 8:15:3 4:4:2 6:7:3Percentage SY 6% 7% 33% 29% 38% 44% 31% 40% 37%Percentage ASY 44% 37% 42% 29% 62% 44% 58% 40% 44%
Percentage AHY 50% 56% 25% 42% 0% 12% 11% 20% 19%

Table 5. Number of breeding pairs and single Loggerhead Shrike located annually in the Midewin NationalTallgrass Prairie: 2005 - 2013.
Age 2005 2006 2007 2008 2009 2010 2011 2012 2013 Total
Pairs 8 13 11 6 7 9 12 4 7 77
Singles 0 1 2 5 2 0 2 2 2 14

Figure 1. Subspecies designation for Loggerhead Shrike in North America as depicted by Miller 1931.

Figure 2. Breeding and wintering range for the Loggerhead Shrike in North America. Reproduced based onYosef 1996.

Figure 3. Population trend map of the Loggerhead Shrike in the United States and southern Canada, basedon Breeding Bird Survey data, 1966-2011. Map from Sauer, J. R., J. E. Hines, J. E. Fallon, K. L. Pardieck, D. J.Ziolkowski, Jr., and W. A. Link. 2012. The North American Breeding Bird Survey, Results and Analysis 1966 -2011. Version 07.03.2013.

Figure 4. Breeding distribution of the Loggerhead Shrike in the United States and southern Canada, basedon Breeding Bird Survey data, 2006-2011. Scale represents average number of individuals detected perroute per year. Map from Sauer, J. R., J. E. Hines, J. E. Fallon, K. L. Pardieck, D. J. Ziolkowski, Jr., and W. A.Link. 2012. The North American Breeding Bird Survey, Results and Analysis 1966 - 2011. Version07.03.2013.

Figure 5. Nest sites used by Loggerhead Shrike in the Midewin National Tallgrass Prairie: 2005 – 2013.Note, locations are not exact but rather intended to show site re-use patters. Exact UTM coordinates forall nest sites have been provided to William Glass, Midewin National Tallgrass Prairie, USFS.

Figure 6. Population trend for Loggerhead Shrike in the Midewin National Tallgrass Prairie: 2005 – 2013

Figure 7. Age ratios of Loggerhead Shrike in the Midewin National Tallgrass Prairie: 2007 – 2013.

Figure 8. Population size and trend in comparison to reproductive success for Loggerhead Shrike in theMidewin National Tallgrass Prairie: 2005 – 2013.
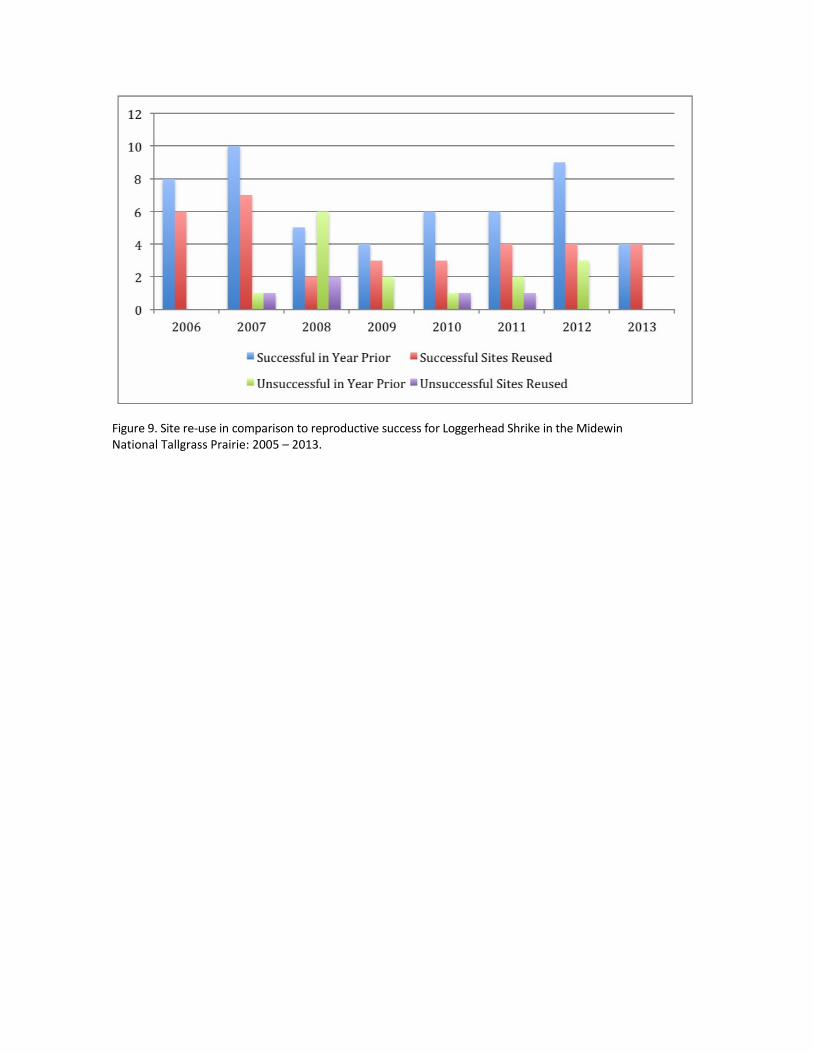
Figure 9. Site re-use in comparison to reproductive success for Loggerhead Shrike in the MidewinNational Tallgrass Prairie: 2005 – 2013.

Figure 10. Adult banding status at start (banded prior and unbanded/unknown) and end (banded in year)of breeding season for Loggerhead Shrike in the Midewin National Tallgrass Prairie: 2005 – 2013.
Figure 11. Age ratio of male and female Loggerhead Shrike in the Midewin National Tallgrass Prairie: 2005– 2013.

Figure 12. Reproductive success for Loggerhead Shrike in the Midewin National Tallgrass Prairie: 2005 –2013.

Appendix 1: Digital Images depicting study species, project site, activities and other aspects of the project.
T
L
SC
ypical shrike nesting habitat in the Midewin National Tallgrass Prairie. (Photo credit: A. Chabot).
oggerhead Shrike (Photo credit: A. Chabot).
econd Year Loggerhead Shrike, showing retained juvenile plumage on wing (brown feathers) (Photo credit: A.habot).

Loggerhead Shrike leg with stainless steel USGS band applied to right leg (Photo credit: A. Chabot).
Morphometric measurements (bill depth) of Loggerhead Shrike (Photo credit: A. Chabot).
Loggerhead Shrike eggs (Photo credit: A. Chabot).

Loggerhead Shrike young ready to fledge from nest in Midewin National Tallgrass Prairie (Photo credit: A. Chabot).
Midewin National Tallgrass Prairie, Historic Loggerhead Shrike nesting sites (Image courtesy of William Glass,Midewin National Tallgrass Prairie, USFS).

Appendix 2. Wildlife resources that benefitted from the project.
This project was directed specifically at the Loggerhead Shrike, with the overall goal of filling informationgaps on the species population demographics in the Midewin National Tallgrass Prairie, a stronghold forthis endangered species in the state of Illinois. The information gained will benefit the species byproviding information on nesting site location within the Prairie, which can help guide managementactivities (e.g. shrub clearing) to ensure that the species is not negatively affected. The information canalso be used to help guide visitors to sites where they can observe the species, and providingopportunities for education of the general public on the plight and needs of this, and other grassland birdspecies. The species shares habitat with many grassland bird species that have experienced drasticpopulation declines in Illinois and North America, including, but not necessarily limited to: EasternMeadowlark (Sturnella magna), Field Sparrow (Spizella pusilla), Dickcissel (Spiza americana), SavannahSparrow (Passerculus sandwichensis), Grasshopper Sparrow (Ammodramus savannarum), Brown Thrasher(Toxostoma rufum), Northern Mockingbird (Mimus polyglottos), Upland Sandpiper (Bartramialongicauda). Therefore, while directed specifically at the Loggerhead Shrike, management for this specieswill likely benefit a broader range of grassland birds. Products resulting from this research include:compilation of demographic data (age ratios, population turnover, over-wintering survival, reproductivesuccess) over a 9-year window for the species in Midewin, which will be conveyed to interested partners(e.g. Illinois DNR, Midewin staff); coordinates of nest site locations, including renesting and doublebrooding attempts; presentation of results to staff and volunteers of Midewin National Tallgrass Prairie(April 11, 2013); production of an article summarizing the project in local news media; training anddemonstration of methodology to Midewin seasonal staff; and education of the general public asopportunity presented during field work activities. A publication in a peer-reviewed journal (to bedetermined) will be completed after review of this report and incorporation of suggestions and revisionsprovided by IDNR and USFS personnel.

Appendix 3: Financial Summary for Project
Category Rates AmendedBudget
ActualExpense
WPF Funds Cost-share
Totals
September 5, 2011 toJune 30, 2013
Personnel 25,000
Dr. A. Chabot(based on 7 trips)
$500/day (35days)
17,500 17,500 9,000 8,500
Dr. A. Chabot (lab work) $500/day (10days)
5,000 5,000 5,000
Dr. A. Chabot(analysis/write-up)
$500/day (5 days) 2,500 2,500 2,500
Travel(based on 7 trips)
6,776 5,511 4,840 671 5,511
* Rental car
Gas
Tolls
Lodging
Food
2,100
1,400
56
2,240
980
2,634
1,000
66
1,392
419
Contractual services 0 0 0
Stable isotope (deuterium) lab assay consumables(3 feathers/bird x 10 birds @ $25/feather)
0 0
Materials/supplies 3,028DNA (microsatellite) lab assay consumables(1 sample/bird for 15 loci x 10 birds @ $50/sample)(amended cost is the actual cost of chemicals)
2,750 3,028 1,000 2,028
Subtotal 14,840 18,699 33,539
Match 18,699
WPF Total 14,840
* Used personal car on one of 7 trips. The Illinois CMS Travel Reimbursement Schedule, effective January 2013,was used to compute the use of personal car which includes fuel costs.
Notes:Expenditure itemization details, including name of vendor and dates of purchase are provided as Appendix 4.Receipts available upon request.For expenses incurred in Canadian dollars, an exchange rate of $0.95, the official rate on June 30, 2013, was used.
Financial Summary:
Funding source Personnel Travel Contractual Materials Total % Cost
Other Cost-Sharing 16,000 671 0 2,028 18,699 55.8
WPF 9,000 4,840 0 1,000 14,840 44.2
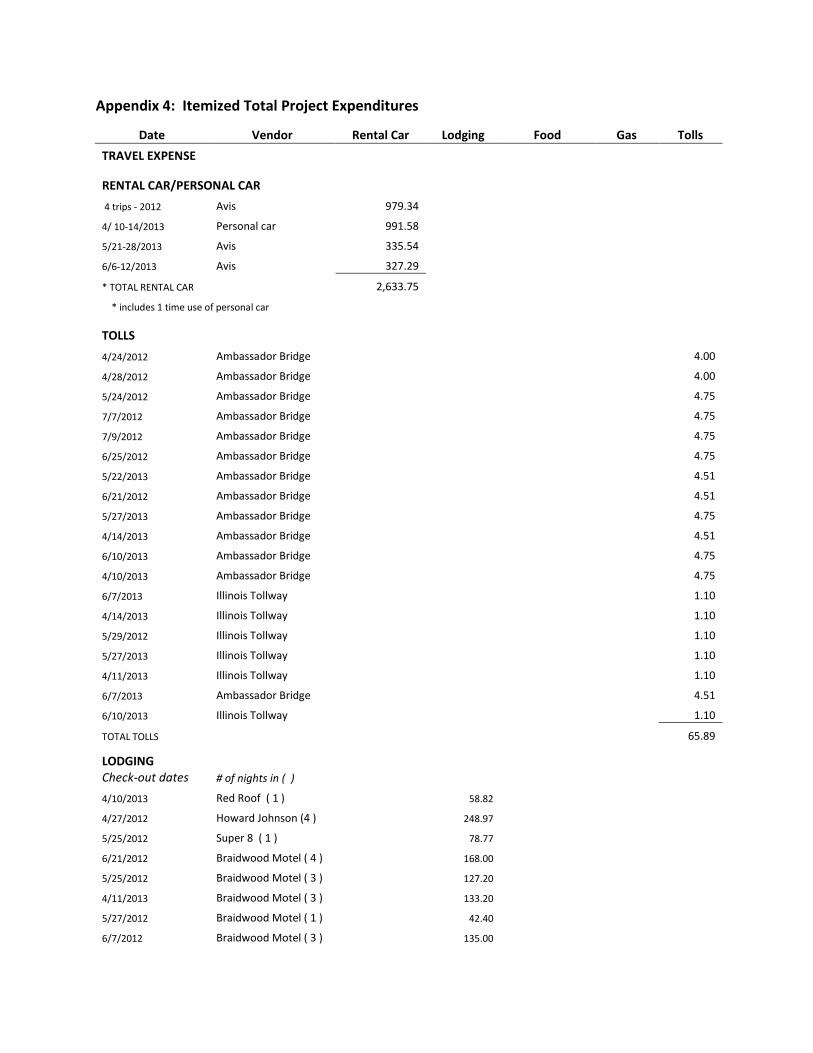
Appendix 4: Itemized Total Project Expenditures
Date Vendor Rental Car Lodging Food Gas Tolls
TRAVEL EXPENSE
RENTAL CAR/PERSONAL CAR
4 trips - 2012 Avis 979.34
4/ 10-14/2013 Personal car 991.58
5/21-28/2013 Avis 335.54
6/6-12/2013 Avis 327.29
* TOTAL RENTAL CAR 2,633.75
* includes 1 time use of personal car
TOLLS
4/24/2012 Ambassador Bridge 4.00
4/28/2012 Ambassador Bridge 4.00
5/24/2012 Ambassador Bridge 4.75
7/7/2012 Ambassador Bridge 4.75
7/9/2012 Ambassador Bridge 4.75
6/25/2012 Ambassador Bridge 4.75
5/22/2013 Ambassador Bridge 4.51
6/21/2012 Ambassador Bridge 4.51
5/27/2013 Ambassador Bridge 4.75
4/14/2013 Ambassador Bridge 4.51
6/10/2013 Ambassador Bridge 4.75
4/10/2013 Ambassador Bridge 4.75
6/7/2013 Illinois Tollway 1.10
4/14/2013 Illinois Tollway 1.10
5/29/2012 Illinois Tollway 1.10
5/27/2013 Illinois Tollway 1.10
4/11/2013 Illinois Tollway 1.10
6/7/2013 Ambassador Bridge 4.51
6/10/2013 Illinois Tollway 1.10
TOTAL TOLLS 65.89
LODGINGCheck-out dates # of nights in ( )
4/10/2013 Red Roof ( 1 ) 58.82
4/27/2012 Howard Johnson (4 ) 248.97
5/25/2012 Super 8 ( 1 ) 78.77
6/21/2012 Braidwood Motel ( 4 ) 168.00
5/25/2012 Braidwood Motel ( 3 ) 127.20
4/11/2013 Braidwood Motel ( 3 ) 133.20
5/27/2012 Braidwood Motel ( 1 ) 42.40
6/7/2012 Braidwood Motel ( 3 ) 135.00

5/22/2013 Braidwood Motel ( 5 ) 222.00
6/7/2013 Braidwood Motel ( 4 ) 177.60
TOTAL LODGING 1,391.96
GAS
4/24/2012 Value Market 30.13
4/26/2012 Fast N Fresh 40.65
4/28/2012 CTC Fuelco 49.32
6/25/2012 CTC Fuelco 33.23
4/24/2012 Esso 49.55
4/28/2012 Shell 29.84
5/25/2012 Speedway 29.43
5/24/2012 Esso 36.86
5/27/2012 Mobil (Dipti Gas) 34.77
5/25/2012 Chelsea Mobil 39.68
6/21/2012 Esso 39.09
6/24/2012 Casey General 37.23
6/25/2012 Petro Canada 23.75
6/21/2012 Value Market 40.00
7/7/2012 Casey General 33.08
7/7/2012 CTC Fuelco 36.24
7/9/2012 TR Travel Center 32.15
7/9/2012 Ultramar Ltd. 38.87
Kingston 38.49
4/14/2013 Petro Canada *31.26
4/10/2013 Speedway *49.35
4/14/2013 Mobil (Dipti Gas) *33.89
5/25/2013 Mobil (Dipti Gas) 35.98
5/22/2013 Esso 40.66
5/22/2013 Speedway 34.13
5/27/2013 CTC Fuelco 35.12
6/10/2013 TD Petes 29.87
6/7/2013 Pilot 40.84
6/7/2013 Esso 37.84
6/10/2013 CTC Fuelco 53.42
TOTAL GAS 1,000.22
* FOR REFERENCE ONLY - NOT INCLUDED IN GAS TOTAL - INCLUDED IN FORMULA FOR PERSONAL CAR
( PERSONAL CAR CMS ALLOTMENT OF .565/ PER MILE INCLUDES GAS )
FOOD
4/25/2012 Carry Out 9.54
4/24/2012 Fast N Fresh 14.32
4/24/2012 Monical's Pizza 11.00
4/24/2012 Wendy's 8.58

4/27/2012 Dunkin Donuts 2.88
4/27/2012 Howard Johnson 22.70
4/26/2012 Taco Bell 3.91
4/26/2012 Fast N Fresh 8.69
5/25/2012 McDonald's 3.95
5/25/2012 Burger King 6.28
4/25/2012 Monical's Pizza 9.54
4/28/2012 Taco Bell 5.45
5/26/2012 McDonald's 9.60
5/27/2012 Café China 11.45
5/25/2012 Café China 6.90
5/26/2012 Café China 6.90
5/28/2012 McDonald's 8.74
5/26/2012 McDonald's 5.76
5/27/2012 McDonald's 7.90
5/29/2012 McDonald's 6.82
5/29/2012 Wendy's 9.62
5/27/2012 Café China 11.45
7/9/2012 McDonald's 2.66
7/?/2012 Fresh Subs 4.69
7/6/2012 McDonald's 2.66
6/29/202 McDonald's 3.73
6/22/2012 McDonald's 3.73
7/9/2012 Pilot 5.71
5/24/2012 Pizza Hut 15.04
6/21/2012 Wendy's 8.68
5/24/2012 A & W 14.46
6/25/2012 TA 4.64
6/24/2012 Berkot's 7.61
4/10/2013 Taco Bell 3.37
4/10/2013 A & W 9.93
4/17/2013 HMS Host 9.85
4/12/2013 Chick-a-Dee 7.39
4/12/2013 McDonald's 3.21
4/11/2013 Burger King 3.38
4/13/2013 McDonald's 2.14
4/11/2013 Berkot's 19.18
4/14/2013 Subway 6.36
4/14/2013 McDonald's 2.14
4/13/2013 Chick-a-Dee 14.75
4/24/2013 McDonald's 3.09
5/23/2013 McDonald's 5.54
5/23/2013 McDonald's 2.14

5/25/2013 McDonald's 4.91
?/?/2013 Pizza Delivery 14.75
5/24/2013 Burger King 3.84
6/9/2013 McDonald's 3.63
5/26/2013 McDonald's 6.30
5/26/2013 McDonald's 2.14
6/8/2013 Chick-a-Dee 15.99
6/9/2013 McDonald's 3.49
6/10/2013 McDonald's 6.09
TOTAL FOOD 419.20
Date Vendor Address CostMATERIALS / SUPPLIES(Lab Assay Consumables)
11/5/2012 UltiDent Scientific ultident.com/scientific 294.14
11/5/2012 Qiagen Inc. 181 Bay St., Toronto, Ontario 887.36
3/26/2013 Invitrogen / SCMS invitrogen.com 624.78
4/2/2013 Sigma Aldrich sigmaaldrich.com 1,221.99TOTAL MATERIALS /SUPPLIES 3,028.27
PERSONNEL
Work performed by Amy Chabot during the grant period of September 5, 2011 to June 30, 2013.
See following page for invoice from Amy Chabot to Midewin Tallgrass Prairie Alliance. Also included is proof ofpayment from the Midewin Alliance in the form of a $9,000 cashier’s check from Charter One Bank.


Appendix 5: Promotion