Embed Size (px)
Citation preview
PROJECT FINAL REPORT
Grant Agreement number: 217207
Project acronym: POINT
Project title: Policy Influence of Indicators
Funding Scheme: Social Science and Humanities
Period covered: from April 1st 2008 to June 30th 2011
Name of the scientific representative of the project's co-ordinator1, Title and Organisation:
Pia Frederiksen, Senior researcher and Head of Section, National Environmental Research institute, Aarhus University
Tel: + 45 81 55 85 39
Fax: +45 81 55 50 21
E-mail: [email protected]
Project website address: www.point-eufp7.info
1 Usually the contact person of the coordinator as specified in Art. 8.1. of the Grant Agreement.
2
P INT
POLICY INFLUENCE OF INDICATORS Scientific Summary Report
Participants:
Pia Frederiksen National Environmental Research Institute, NERI-AULars Kjerulff Petersen National Environmental Research Institute, NERI-AULars Ege Larsen National Environmental Research Institute, NERI-AUPetrus Kautto Finnish Environment Institute (SYKE)Jari Lyytimaki Finnish Environment Institute (SYKE)Janne Rinne Finnish Environment Institute (SYKE)Timo Assmuth Finnish Environment Institute (SYKE)Henrik Gudmundsson Technical University of Denmark, DTU-TransportClaus Hedegaard Technical University of Denmark, DTU-TransportTom Bauler Université Libre de Bruxelles (ULB)Lea Sebastién Université Libre de Bruxelles (ULB)Stephen Morse University of Reading (UREAD)Simon Bell Bayswater Institute (BI)Ken Eason Bayswater Institute (BI)Markku Lehtonen University of Sussex, (SPRU_UoS)Louis F. Cassar University of Malta (UoM)Elisabeth Conrad University of Malta (UoM)Zita Izacovicová Inst of Landscape Ecology of SAS (ILE-SAS)Zuzana Bárancová Inst of Landscape Ecology of SAS (ILE-SAS)

3
Contents

4
1 Final publishable summary report
1.1 Executive summary The POINT project undertook a variety of studies of the use and influence of indicators in policies dealing with aspects of sustainable development and their role in policy making processes. We focussed on sustainability indicators as well as sector related indicators (agriculture, transport, energy). Departing from a common analytical framework, including core concepts and associated typologies, the studies used a range of methods to gather and interpret data. A direct comparison of all results was not foreseen or possible, and this scientific summary thus describes the results of a collective process by which the consortium undertook to synthesise the findings, while it does not give credit to all the varied findings in each of the case studies. These are to some extent reported in the second period report, but can also be found as individual deliverables on the project web-site www.point-eufp7.info. The synthesis presents the degree and forms of use and influence of indicators that were found across the studies and examines a number of possible explanations for the direct and indirect forms of influence that were identified. It concludes that the initial categories of explanatory variables all have explanatory power, but that the complexity of ways that indicators interact with the policy processes imply that no factor can alone be singled out for producing influence, while the interaction of several factors may produce situations more or less conducive to indicator influence. It then addresses the question of the demand and the supply of indicators and explores the different relationships between suppliers and users, as well as the impact of these relationships on the use and influence of indicators. Critical is here the ability of the indicators to transgress the inner circle of overlapping producers and closest users – the “indicator industry”. Eventually, the synthesis explores the methodological challenges faced in this research and the implications for similar studies in the future, presenting in particular a group discussion approach designed to elicit information about and to better understand the relationships amongst the users and producers of indicators. The recommendations for further research arising from the findings of POINT are presented in the section 2.2 on ‘exploitable foreground and plans for exploitation, while the recommendations to the wider society based on the POINT findings are reported in the deliverable 16: ‘Awareness and wider societal implications’, also found at the project web-site.
5
1.2 Introduction The POINT project included twelve separate studies of the use and influence of indicators. In order to provide the most informed synthesis of the results of the case studies, the members of the consortium embarked upon a collective results synthesis process, which lasted 9 months, involved 3 project meetings together with a meeting with the Advisory Panel. This summary is the result of this process, and it presents the overall conclusions of the project and the recommendations that we find justified by our research.
POINT has looked at indicators of sustainability and sectorial indicators relating to sustainability – such as agri-environmental indicators, energy security indicators and transport indicators. Whilst not wanting to generalise our results to include other sectors partly because we know that other sectors, such as education and health, use indicators to an even greater extent than we have found in the case of sustainability indicators, we believe that the approaches, results and recommendations coming from the POINT project could inspire research on indicator use and influence in other sectors. This is because the multitude of roles that we have found that sustainability indicators play in different policy processes should also be relevant to other sectors, even if pathways of access and patterns of use and influence may be different in each sector.
The twelve separate studies of the use and influence of indicators were as follows. Four studies in Work Package 3 examined sectorial indicators for: energy policy in UK, transport policy in Sweden, and the agri-environment sector in Slovakia and Denmark (with specific emphasis on biodiversity in Slovakia and the aquatic environment in Denmark). Moreover, for the transport study, it also included a study of indicators used for the evaluation of European transport policy. Four studies in Work Package 4 examined sustainable development indicators at the level of the European Union and in three of its member states, namely Finland, Slovakia and Malta. In Work Package 5 three studies were undertaken of composite indicators in use for policy purposes in the European Union and in the media. In Work Package 6 a workshop-based method was used to gather data from across the sectors and the countries involved in the project.
All of these studies examined the use and influence of indicators applying the broad concepts and outlines developed in work package 2. This work package provided an extensive literature review, as well providing a broad overall framework to guide the analysis within the individual indicator studies (Gudmundsson et al., 2009).
The case studies used a variety of methods to collect data: documentary analysis, interviews, questionnaires and group discussions, and as a result a great deal of data was produced of many different types. The strong point of the resulting database was that it allowed both exploration and triangulation to take place. It provided a number of different lenses through which the use and influence of indicators could be viewed e.g. by country, sector, type of indicator and type of data. However, when carrying out such exercises it was not easy to compare the results coming from the different studies.
The collective synthesis process that the consortium undertook to arrive at an agreed, evidence-based statement of overall findings was as follows. The results of each study were summarised and discussed by the consortium, common themes were identified, conclusions about themes were checked against the original data and more refined themes were identified and also checked until there was substantive agreement about the major conclusions to be drawn.
Further information about individual projects is available in the POINT project deliverables published on the POINT web-site: www.point-eufp7.info.
6
1.3 The motivation, objectives and approach of the POINT research project
1.3.1 Motivation Recent years have seen a significant increase of the use of indicators in most areas of public policy. Indicators are employed to monitor policy performance and foster accountability within the frameworks such as evidence-based policy and New Public Management on the one hand, and to promote policy learning on the other. The interest of researchers and practitioners has so far primarily been on the technical details of indicator design, while the role of indicators in policymaking is a topic has been a relatively under researched. Direct, instrumental use of indicators by policymakers seems, however, to be rather the exception than the rule, thus confirming findings concerning the role of research and expert knowledge in policymaking more generally. Scientific assessments, evaluations, scenarios and the like often influence policies indirectly and through largely unforeseen pathways, e.g. by gradually shaping frameworks of thought. Likewise, knowledge provides stakeholders “ammunition” they can use in their daily political battles.
1.3.2 Objectives The POINT research seeks to fill the gaps in our knowledge about the role of indicators in policymaking. When the research project was formulated it was proposed to do this by examining whether, how and under what circumstances indicators influence policymaking, by whom they are used and for what purposes. More specifically, the project objectives as formulated in the project proposal were: ! To design a coherent framework of analysis and to generate hypotheses on the use and influence
of indicators, and ! to test the framework in concrete cases (sectorial policies; sustainability strategies and ex ante
appraisal; composite indices) in order to • identify the ways in which indicators influence policy, including the unintended impacts and
‘non-use’ • identify the factors that condition indicator use (indicator design and characteristics,
indicator type, stakeholder expectations, role of the organisations preparing and disseminating the indicators, socio-cultural and political background factors), and
• recommend ways to enhance the role of indicators in supporting policies
1.3.3 Approach Based on decades of research on knowledge use for policy making, POINT aimed to make a basic distinction between ‘use’ and ‘influence’ of indicators in policy making; ‘use’ denoting some kind of handling of the indicators in a policy context (reception, internal and external application, decision support), whereas ‘influence’ means that the indicators appear to have some effects on one or more aspects of the policy making (e.g. policy debates, agendas, frameworks, objectives, processes, or specific decisions). This distinction implies that use can be studied through document analysis and interviews, while the study of influence is much more delicate and needs to complement such analyses with observation and participatory research among others depending on which forms of influence are being investigated.

7
The factors which explain use and influence are not the same. Use, for example, can result from a mere formal requirement, while influence may depend on factors like trust in an indicator or shared belief systems. Influence is the more interesting but also more challenging outcome to explain.
Based on the literature review carried out during the first phase, it was assumed that researching the role indicators might play in policy processes and the subsequent influence they might exert, would need to include other than instrumental roles, e.g. conceptual and political roles, which might be as influential, or even more influential, than the intended direct, instrumental roles:
• Instrumental role, whereby indicators are used by policymakers directly to improve the policy outcomes in the given policy area; the instrumental role implies an idea of a linear process from production of indicators, through use, to influence on policy processes and outcomes;
• Conceptual role; entailing influence from indicators on policy through processes of dialogue, debate, and argumentation, which shape the way in which policy problems are formulated and framed; ultimately, this conceptual role may influence ideas and worldviews;
• Political role; implying that indicators help to legitimise existing policies or policy actors; this role therefore includes both outright legitimisation for tactical purposes or “symbolic” use of indicators by policy actors, but also the enhancement or erosion of the legitimacy of an actor or a policy.
From the outset of POINT it was considered unlikely that potentially diverse patterns of use and influence across a variety of sectors and policy types could be explained easily with a simple model. It was assumed that the pathways through which indicators could feed into policy processes and the roles that indicators might play in influencing policy making, policy processes and policy outcomes would be affected by a multitude of factors. These were broadly divided into
• ‘Indicator factors’ referring to the qualities of indicators as appropriate tools for measurement and communication to support various policy functions;
• ‘User factors’ concerning the perceptions, capacities, ‘repertoires’, and positions of individuals and groups involved in indicator and policy application processes;
• ‘Policy factors’ which have to do with the policy context of the use of indicators, such as the type of policy sector in question, the purpose of the indicators, and the institutional framework.
As mentioned in the introduction, the project studies the use and influence of indicators within three main categories:
1) The first category (WP3) is studies of specific policy processes (mainly at national level, but including an EU level transport case), where indicators are expected to be applied for relatively specific purposes (such as evaluations of policy objectives or programmes).
2) The second category (WP4) is studies of the broad national and EU sustainable development strategies, and the indicator sets developed mainly for monitoring progress towards sustainable development in the context of such strategies.
3) The third category (WP5) is studies of composite indicators of sustainability, which are produced by different institutions, but normally without specific requirements from or connections to specific strategies or policies.
8
1.4 Overall Project Conclusions A wide range of patterns of use and influence were found across the POINT case studies. In the sections below we begin in 4.1 by describing the different kinds of use and influence that were identified and then in 4.2 present some explanatory concepts. Section 4.3 explores the relationships between the demand for and supply of indicators and 4.4 presents some methodological conclusions coming from the project. Each subsection is headed up by a proposition that represents a major conclusion that we believe holds true for the use and influence of indicators
1.4.1 Use and Influence Indicators play different roles in different policy contexts
Previous studies have suggested that indicators may play different roles in policy making, and that the rational-positivist function of indicators as an instrumental tool for transferring evidence to policy processes with possible influence on policy modification or change, is only one of the ways in which indicators relate to policy. Disconnection of policy actors’ worldviews as well as communication misfit may interact with the evidence and create pathways of influence which are less easily researched and understood. In such situations information – in this case in the form of indicators - may function as mechanisms to frame problems, identify shared values and build a common discourse, rather than as mere representations facts. A third role would be when indicators are agents for strategic manipulation in contexts of political opposition and conflicting interests (Boulanger 2007). Taking into account previous research, pointing towards such additional functions as conceptual uses of indicators, and the influence of knowledge governed by power structures, POINT has sought to identify instances of the different roles played by indicators.
Generally this confirms the observations in existing research that seeing the role of indicators in purely ‘instrumental’ terms as an input to rational policy making, is insufficient. Indicators are not necessarily influential just because they are available, technically plausible, required and used in some sense. Indicators cannot, in the words of Rydin (2002), be seen as “… exogenous factors parachuted in, which act like a magic bullet causing decision-making to become instantly objective and scientific.” One of the factors that seems to be of importance to the unfolding of the various roles indicators may play is the policy context, including the policy types, the administrative culture, the consensus among policy actors on the policy problem, and the institutionalisation of the indicator use, among others (see also Gudmundsson et al. 2009).
Examples of the instrumental roles played by indicators have been found in several of the POINT studies (annex 1 and annex 3). One factor which stands out when trying to explain the use and to some extent influence of indicators in these cases is the existence and political weight of a policy plan with binding goals or objectives that are monitored and/or evaluated, such as in studies of the policy on the aquatic environment in Denmark and transport policy in Sweden and EU (annex 3). This explains some of the differences between the cases from different sectors, which have studied indicator applications in concrete policy performance evaluations, contrary to indicators applied in “softer” policies such as the sustainable development strategies where the policy objectives may be more diffuse, contested or not embedded in the actual decision making. In the majority of the sectorial case studies, the use of indicators results from planned evaluations, which are conducted either routinely to monitor policy implementation, or as a specific planned event such as mid-term or final evaluations. This guarantees at least some degree of use of the indicators, although not necessarily their influence (see section 4.1.2). Revisions of policy measures or targets following such indicator-based evaluations have been identified. Some case studies showed how reporting on the lack of fulfilment of goals can also become routine and trigger little interest, especially if

9
different indicators show mutually conflicting results. In some policy contexts however (exemplified in the UK energy and the Malta sustainable development policy studies – annex 2 WP3 and WP4 respectively), it seems that an ‘indicator culture’ is virtually absent to the extent that the dominance of economic rationality and a perception of indicators are seen as being ‘second-best’ information, as compared to the ‘hard data’ provided by statistics, cost-benefit analysis and the like. In the UK, the apparent absence of an ‘indicator culture’ may stem partly from the rapid and continuous changes in the country’s energy policy, which quickly render indicators obsolete and inappropriate for measuring the success of the policy. In the study of sustainable development indicators in Malta, a lack of a monitoring culture in general was found, partly due to shortage of resources.
In spite of this indicator use through linkages of indictors to systems of policy objectives and measures (e.g. through management-by-objectives systems) is reported – mainly in the sectorial studies. Specifically, policies linked to EU-policies and Directives such as the Rural Development Programme where monitoring and evaluations are mandatory, trigger the set-up and even institutionalisation of indicator systems. Such systems may however not be directly influential at a national level, if they are detached from the (national) policy processes, e.g. by lack of timeliness, non correspondence to relevant geographical levels or levels of disaggregation.
Institutionalisation of the indicator production system and/or system through which indicators are received and used for policy assessment, may take place when a policy framework is relatively stable over time. This seems to be of vital importance for the direct use and sometimes influence of indicators. Institutionalisation can be followed by improvements in the relevance and quality of indicators, but provision of sufficient economic means for indicator production and dissemination/ out-reach is also a crucial issue. Recent access of a country to the EU seems to bind resources for mandatory evaluation and indicator based reporting, which may sometimes be perceived to be of little immediate relevance for national purposes (as e.g. the Slovakian and Maltese case studies – annex WP3 and WP4 respectively).
It has been suggested in the literature that the complexity of a policy area and the degree to which a policy problem is structured may have a bearing on likely types of policy processes taking place (such as rule based regulation, learning processes or negotiations), as well as in the knowledge forms which are likely to be developed and used in the processes taking place. Turnhout et al (2007) characterise the degree of ‘structuredness’ through two aspects: the degree of consensus on policy objectives, and the degree of agreement over appropriate types of policy measures. Knowledge in the form of data or indicators is only likely to have an instrumental role in situations where well structured policies are in place – an observation which echoes Weiss (1979, p.428), who argued that such a role is mostly found for “….relatively low-level, narrow-gauge decisions“. Hence, a stabilisation of the policy agenda may also imply that the potential of indicators to influence policy making is limited to ‘first order learning’, i.e. minor readjustments of programmes that are already on track. Indicators can contribute to such stabilising or structuring of the policy agenda, which may, on the other hand imply certain conservatism, preventing potentially ‘disruptive’ knowledge being taken into account. Such a fear was voiced among Danish interviewees expressing that a long lasting relatively stable policy agenda on the aquatic environment could prevent openness towards new knowledge or best practise – exemplified by changes to the approach being brought through the EU Water Framework Directive and not through national political processes.
Conceptual influences of indicators are difficult to identify and the methodology applied in the case studies was only able to reveal this sort of influence to a minor degree. Some examples were however found where a conceptual role of indicators has been seen, typically in situations with
10
openings for policy change. One example was in the UK energy policy programme where indicators had a certain degree of influence on the policy framing and agenda. Conceptual use was, however, also found among policy-makers in fragmented institutional frameworks, where indicator systems served to structure the communication on policy targets and measures. One example given was in the Danish Ministry of Environment where implementation of the Nitrate Directive and the Water Framework Directive were located in different agencies, giving rise to a communication misfit, which could partly be resolved using the indicator framework as a framework for communication. Contrary to the other indicator studies, the composite indicators of sustainability were seen to function mainly in conceptual roles, helping policy actors to adhere to the specific world visions these different composite indicators were built upon (annex 1 WP5). In this sense, composite indicators developed a conceptual role by helping to diffuse such visions and ideas and to support alternative thinking and new concepts rather than leading to political action.
Indicators may also play more political roles, such as when decision-makers or stakeholders need ammunition to legitimise a particular political or societal agenda or to paint a positive picture of the current situation to avoid negative repercussions, or vice versa. This pertains especially to issues that are sufficiently high on the policy agenda to warrant policy makers’ attention in cases of non-compliance. This political use of indicators can also serve to legitimise or reinforce existing positions, as found in several studies (for example, as shown in the Swedish transport policy study (annex 2 WP3), where indicators in one instance were used as ammunition in the debate over the split of investments between road and rail projects in the Swedish Strategy plan). Most studies revealed that indicators were to some extent used in such a political role. Broadly, the political role includes situations in which indicators influence the legitimacy of a policy or a policy actor. Such influence on the legitimacy can result from the various forms of use of indicators, but also from the processes of indicator preparation, where an actor’s behaviour may be perceived as more or less legitimate by the other participants in the process.
Based on the UK energy policy study (annex 2 WP3) it was suggested that in an adversarial policy context, in which the legitimacy of policy arguments depends on the ability of policy actors to present persuasive analytic evidence, indicators and statistics are probably more prone to be used strategically and politically than in less adversarial or less analytic contexts.
Looking across the different case studies we believe that we see a change in the role of indicators, which follows the different phases of policy-making – the conceptual role being more prominent in the policy preparation phase where indicators are proposed and selected, while instrumental and political roles dominate the policy implementation phases. The phase of indicator selection may also get a political touch if all dimensions of a framework are not populated with indicators. Such a situation has been identified in the study of sustainable development indicators in Malta, as only a partial picture of sustainability was found to be reflected in the indicator set (annex 2 WP4). Use of indicators does not guarantee their influence on policy
In the POINT studies the following distinction between use and influence of indicators has been made: use denotes the handling of the indicators (e.g. receiving, processing, communicating, reporting) in a variety of policy contexts, whereas influence refers to some effect on policy processes by the indicators or indicator sets themselves, or the processes through which they are designed or applied. The influence can occur at an individual level or in interpersonal relations among policy makers, but mostly POINT has aimed to uncover influence at a collective, or policy, level. This influence may concern functional policy components such as objectives, measures or specific decisions, or it may imply influence in the softer aspects of policy making such as debates, agendas, processes, or dominant frameworks of thought. Influence can mean modification, but also
11
reinforcement or weakening of existing frameworks of thought, perspectives and hierarchies of priorities. Thus the effects do not have to be direct and transformative to constitute influence. A political role can for example entail a process whereby indicators help to get a certain policy accepted, as it seems to have been the case of Slovakia adapting to EU agricultural policy frameworks. In this section we do not focus on the issue of non-use as such, but on non-influence. In POINT case studies, however, it was often difficult to clearly distinguish use and influence from each other. Many examples of use and some cases of influence were reported in the POINT studies. However, in many cases use did not seem to lead to much influence on policy. The interpretation of this result would be somewhat different between the use of general informative indicators and the use of indicators as part of more specific objective-led policy evaluations. In the former case indicators are not necessarily intended for direct use in decision making, but are produced to inform the public, to stir up interest, debate and concern, or to make available key information for monitoring, reporting, illustration, or explanations of policies. It is not to be expected that such indicators are directly influential at the level of political or administrative decisions. Some of the indicators studied are of this kind, especially indicators of sustainable development. The studies demonstrate some use of such indicators in the sense that they are referred to in policy plans or underlying reports and documents, while several civil servants, politicians and stakeholders interviewed also reported that they had at least observed, read or heard of the indicators, and occasionally used some of them in a discussion, speech or document. However, interviewees who mentioned such use rarely point to a particular kind of influence the use of the indicators has or could have had. Some referred to indicators being mixed with other information sources to generally stimulate interest in a particular issue, while others suggested that particular indicators are most likely to have no influence at all or that it would be limited to only the narrow community involved in indicator production and use. Analysis of policy documents has also not been able to identify influence of this type by indicators outside this ‘indicator industry’. The explanations for limited use include factors such as limited or discontinued resources to produce and update the indicators, low relevance of EU indicators to national level policy, a low degree of institutionalisation, and the connections being too weak between indicator producers and users. In the case of SDIs it is concluded that the influence that has occurred has been mostly limited to monitoring and reporting systems, whereas they have been used less as communication tools to engage a wider audience in policy making for sustainability (Lyytimäki et al., 2010, Deliverable 8 p 2). In the area of composite sustainable development indicators some indirect policy influence was expected in the form of adjustments to the governance frameworks in order to accommodate the worldviews embodied in these indicator sets. However, no such influence could be confirmed, as the indicators seem to have been absorbed into existing frameworks. While these observations do not of course prove that the use of general informative indicators has no influence on policy, use does not necessarily seem to produce much verifiable influence on policy or policy making in these cases, in accordance with what could be expected. The expectations would be somewhat different for the second type, i.e. indicators produced for specific policy evaluations or monitoring programmes. Those indicators are usually established with a clear type of use in mind, and also with expected influence on a very specific policy. These can include, for example, efforts to align sectorial trends or strategies with objectives, or to make decisions about continuing or revising certain programmes. This was the case for some of the sets of indicators used in the transport sector, aquatic environment policy, energy sector, and agri-

12
environmental policy. However, even here it is not always evident that use leads to influence. The following are examples of some apparent disconnects between use and influence. In the case of the Swedish national transport policy (annex 1 WP3), it was not possible to verify direct policy influence that could be attributed to the indicator-based reporting, even though both the interviews and document analysis revealed that the reports were widely known and used: for example, policy documents referred to specific indicator variables, values and evaluations of indicators. First of all the reporting was perceived by some politicians as providing a not sufficiently clear and unambiguous basis for policy decisions. The parliamentary minority made selective use of the indicators, but had obviously more limited ability than the government to directly influence policy. Swedish civil servants noted that the reports were taken into account when policies were prepared, but that there was a need to develop more specific indictors to make them useful. Some influence at a conceptual level probably occurred from the repeated reporting of gaps between political objectives and achievements particularly in two areas, CO2-emissions and traffic safety; but this effect could also be ascribed to the high awareness among different policy actors of the objectives themselves. In Slovakia (annex 1 WP3) influence of some environmental indicators was limited because they were not available at a sufficiently detailed level of disaggregation to support decisions. Factors such as the short time for implementing the agri-environmental policy, a mandatory (rather than policy-needs driven) application of indicators and insufficient economic resources to supply data all contributed to explaining the limited connection between use and influence. In the UK energy sector study no direct influence was found from the use of the specific set of national energy sector indicators, notably because little use appears to have taken place at all. The limited use is explained by a range of indicator, user and policy factors, including a low degree of acceptance of the indicators within the professional community. A significant proportion of the indirect influence in the UK case occurred not through use but, for example, through the process of indicator production. In this respect, the activities within the so-called Joint Energy and Security of Supply Working Group were significant in framing the issues, defining the concept of energy security, and to some extent influencing the energy policy agenda. In both the UK energy and Swedish transport policy, the policy objectives themselves were very influential in policy debates but the indicators introduced for the follow up of such policy objectives were less influential. Summing up, even when clear goals and objectives have been established for policies, and indicators are used for reporting and monitoring performance, there is still no guarantee of direct policy influence from the indicators. Such influence can be limited by factors such as indicators of low quality, low acceptance among users, limited resources, poor institutional frameworks, and not least disconnects between those who define indicators and those who can influence policy. Assumptions that sustainable development indicators or composites might be influential by provoking discussion and debate on development agendas or worldviews were only confirmed to a small extent. It should however be noted that other research methods might have uncovered more subtle influences of this type. Conflict and consensus: synergies and trade-offs between indicator roles?
In section 4.1.1 we concluded that the role of indicators in policymaking cannot be reduced to one type of use or one form of influence. A distinction can be made between the instrumental role of the indicators as direct inputs into policy (re)formulation, and two roles characterised by indirect influence of indicators, i.e. the conceptual and political roles. Given this multiplicity of indicator roles – the instrumental use being only one among many – we should not simply assume that different types of influence are synergistic and mutually reinforcing, but must address the possibility of trade-offs between the roles and functions of the indicators.
13
One of the clearest areas of conflict is between instrumental and conceptual roles. Sustainable development indicators especially, but also the sectorial ‘headline’ indicators (e.g. the UK energy policy case, annex 2 WP3), are used mainly for providing information needed in general level strategy (re) formulation rather than being aimed at use by policymakers in their day-to-day policy decisions. In practice this means communication with broader publics and monitoring of over-arching Sustainable Development strategies. Indeed, the SDIs and headline indicators were often considered too simplistic and too aggregated, for such direct use. The trade-off between conceptual and instrumental roles in this case translates into choices concerning indicator design: conceptual use by broader publics is seen to require simplification and aggregation, whereas more disaggregated information would be needed for the indicators to fulfil an instrumental role with the possibility for a narrower and sometimes conservative effect on the policy. A perhaps even more evident case of tension between the conceptual and instrumental role concerns the delicate balance between conflict and consensus. Findings from the POINT case studies suggest, on the one hand, that consensus over the definitions and interpretation of specific indicators as well as problem definitions and desirable policy solutions tends to enhance the likelihood of indicators being used instrumentally (this was found in e.g. the Danish study of aquatic environmental policy). Once technical details have been agreed upon, discussion can then focus on policy targets and instruments rather than on the validity of data. While indicators indeed seem to be more likely to play an instrumental role in such situations of consensus when participants are accustomed to ‘rational’ and ‘deliberative’ action, the situation is more complex from the perspective of conceptual and political roles. Firstly, while government officials, for instance, may make great efforts to ensure that the data is incontestable and of high quality, this by no means prevents the quality of the data – let alone interpretations concerning that data – from being challenged by policy actors with more political objectives. Second, and most importantly, the disagreements, arguments and discussion on the quality and interpretation of data are precisely the types of processes within which indicators can have conceptual and political impacts. The evidence from the POINT case studies suggest that the trade-offs between the instrumental, strategic and conceptual roles of indicators may reflect a “paradox of conservatism”: the greater the instrumental role of indicators, the lesser the likelihood of fundamental policy changes. Some of our informants, for example, feared that long-standing consensus on goals, measures, and indicator sets for policy evaluation could constitute a barrier to the adoption of new “best practice”, new evidence, and new paradigms. Likewise, indicators, whose quality was repeatedly called into question, were sometimes used nevertheless for political purposes (e.g. UK fuel poverty indicator, annex 2 WP3). In a parallel manner, times of paradigm change may open up space for a more political role for indicators – this is a reverse-direction operation compared to the above, demonstrating that stable paradigms may mean an enhanced instrumental role for indicators but at the cost of reduced conceptual learning. An example of this was found in the Danish study of the aquatic environment policy. Here, the paradigm change resulting from the Water Framework Directive required that targets be set for aquatic quality for individual water bodies; i.e. it set about a change in both type of target and spatial detail. This created an opening for new evidence on water quality criteria to enter the policy process, but also for stakeholders to embrace or reject this evidence and present alternatives. In Denmark this was illustrated by a recent argument between the different stakeholders over the validity of eel grass as indicator. Further evidence for the possible productive role of conflict was highlighted in the sectorial case studies (annex 1 WP3), as a “shared economic framework of thought” was deemed conducive to
14
indicator influence in the EU transport case study, but operated rather as a barrier in energy policy cases. In the transport study, “a shared conceptual framework among the producers and users of the indicators (‘mainstream economics’) helped to form consensus about which kinds of indicators would be feasible to look at. In the UK Energy case study, by contrast, a similar kind of economics framework may have contributed to a general feeling that more indicators were not needed, as the all-important economic calculations would in any case be based on specific ‘hard’ data and forward-looking information, rather than on backward-looking indicators. While this finding remains mainly a hypothesis, it was clear that disagreements concerning the appropriate energy security and fuel poverty indicators, in turn, triggered discussions and debate in which the role of indicators was in fostering conceptual learning. The importance of conflict, debate and argumentation in generating social learning also appeared in the context of the discussion on the role of targets in enhancing – or indeed compromising – the influence of indicators. We found evidence that indicators linked to clear (quantitative) targets become more influential, but may on the other hand reduce the influence of indicators for which such targets have not been defined. However, once more, the evidence was ambiguous, since in some cases the indicators for which no quantitative targets existed (such as gender mainstreaming and regional development in Sweden) were still able to stimulate debate on the needs to improve policies. A number of examples of trade-offs between instrumental and political roles of indicators can be evoked. One such example is when indicators lose their credibility among certain actors, simply because they are used strategically by another group of actors. This can involve situations in which the government is accused, for example, of using indicators selectively to merely legitimise its decisions and policies (e.g. UK energy case study, annex 2 WP3) or, alternatively, governmental policymakers criticise stakeholders for ‘misusing’ and ‘misinterpreting’ the official indicators or creating their own, allegedly poor-quality indicators. To the extent that the indicators thereby become discredited as “political”, they may also lose their usability and credibility as tools of direct policy influence – a point also evident in the Maltese case study (annex 2 WP4). The political role of indicators seemed to be quite dominant in the POINT case studies. This took the form, for instance, of policymakers using indicators to “rationalise” and legitimise the decisions that had already been taken. However, political use – sometimes dubbed “policy-based evidence making” – was also despised by several interviewees, especially within the government (e.g. UK energy case study). Sometimes political use was directly portrayed as ‘abuse’ or ‘misuse’, while at other times interviewees made considerable efforts to assure the interviewer that indicators were maximally objective and independent – which was presumably seen as preventing any strategic ‘abuse’. There may indeed be conflicts between the objectives of different actors: for instance some civil servants wishing to ensure the independence and quality of indicators so as to avoid political use, while the politicians and other more politically-oriented actors often primarily seek information that is useful in political battles. While ensuring the high quality and independence of indicator data may well be conducive to more ‘credible’ political use, it can also act as a hindrance, especially when the indicator data is out of date, for instance because the latest data has not yet gone through the required quality control procedures. The efforts made by the indicator designers to minimise what they see as 'abusive' political use may thereby actually compromise the possibility of the indicators being influential. The varying roles of the indicators can be associated with the different types of indicator users, each with their distinctive expectations concerning indicators, some of whom are more prone than others

15
to use indicators instrumentally, while others operate in a more political and strategic register. An obvious example is the distinction between some civil servants, whose mandate and even professional ethics requires a more analytical approach to indicator use (hence implying an instrumental role for indicators), and the NGOs, politicians and interest groups who have greater strategic interests. Another manifestation of the trade-offs between different roles of indicators consists of the rather obvious observation that different indicators are suitable for different purposes. The UK energy sector competitiveness index, for instance, was clearly aimed at, and usable for, political purposes both within the UK and in the EU, while its instrumental role in policymaking was very limited. More generally, the composite indices, headline indicators, monitoring indicators, etc. each have their specific area of utilisation, and increasing one type of use would often tend to limit the potential of another. For example, our research confirmed that the composite indicators are of only limited value as guidance to policy action. However, it is precisely the ample room for interpretation – together with the easy-to-grasp presentation – that enhance the potential of indices being used politically.
1.4.2 Explaining influence In this section we explore the factors that help to explain how and why indicators both do or do not influence policy processes. Section 4.2.1 offers an overall proposition about causal factors and is followed by two sections offering propositions about particular settings which foster or hinder specific types of influence. Interactions between factors may amplify or attenuate the indicator use and/or influence
The POINT project started out with the general hypothesis that different types of factors condition the ways in which indicators influence policy processes together with the extent of such influence. For analytical purposes these were divided into indicator, user and policy factors (Gudmundsson et al., 2009). The heterogeneity of the studies in POINT prevents us from drawing easily generalisable conclusions on all the factors that condition indicator influence, particularly in a simple way. Often the more interesting explanations are found in how various factors combine to generate influence. In situations where the instrumental role of indicators prevails, such as was seen in policy performance evaluations (annex 2 WP3 and WP4), the institutional conditions seem to be important for determining what kind of influence this use may lead to. If, for example policies are backed up by monitoring, reporting and dissemination systems, paradigms and procedures, this may enhance, although not guarantee, the instrumental influence of the indicators in policy processes (annex 3). Trust in the indicators is vital for them to play and instrumental role. Trust is enhanced by data availability and indicator relevance and timeliness (annex 2 WP3), and a longer duration of policy agendas, which may provide the needed time for gaps in knowledge to be filled, models behind indicator production to be developed and validated, and for policy to be structured into agreed frameworks. By contrast, interaction between factors creating an unproductive environment for indicator influence and leading to a diminished use and influence has also been identified. This concerns for instance the interrelated factors affecting the use of indicators across geographical and temporal scales. While an indicator culture to a considerable extent seems to be imposed by the EU system in

16
policy areas in which EU plays a strong (economic) role (such as the Common Agricultural Policy) a lack of national relevance of EU mandated indicators, for example, may create a vicious circle. Harmonisation of indicator systems and technical norms, intended for comparison across member states or for provision of transparency in policy performance assessment, may require the investment of considerable national resources. National priorities may not correspond to such resource use, partly because they are not sufficiently relevant from a national or regional point-of-view. This may result in a lack of data resulting in poor quality of the indicators – again reducing the national and regional relevance (annex 2 WP4). Moreover, the timing of indicator release is crucial for supply of indicators to meet the demand. It was for instance acknowledged that the SDIs of the EU would be more useful if the Eurostat monitoring report was published before the Secretariat-General prepared its progress report. This was not the case in 2009 (annex 2 WP4), when only the preliminary data of SDIs was available for the evaluation. The distance between the supra-national and the national level is one instance of the reinforcing circles of proximate vs. distant users (for details on this subject see section 4.3.1 and annex 2 WP5), where users can be geographically proximate or distant, but equally proximate/distant in terms of distance to the ‘indicator industry’, or in terms of the conceptual basis of the indicators. Proximate users are exponents of a reinforcing circle in building an indicator culture of transparency of indicators and stakeholder engagement and participation in the indicator conception and selection. Inclusive processes where stakeholders engage in the policy preparation process may create common conceptual understandings of the policy areas, on which common indicator frameworks may be created. To some extent the development of an indicator culture seems to be a function of the engagement of the stakeholder in the origination, development, use and interpretation of indicators, i.e. taking part in the ‘indicator industry’ (see section 4.2.3 below). Such a case was found in a policy revision phase of the policy on the aquatic environment in Denmark (annex 2 WP3). Thus, we find that there are interactions between indicator factors, user factors, and policy factors, which affect the use and influence of indicators. For example there may be linkages between ‘hard’ (e.g. binding) and ‘soft’ (e.g. mutual trust) objectives; substantive (e.g. relevant) indicators and procedural (e.g. user inclusive) processes; technical (e.g. accurate) data and cultural capacity (e.g. to respond to negotiated evidence). Such factors can combine to create an indicator culture where indicator conception is debated, interpretations of policy assessments shared and transparent, and - together with other components in policy deliberation and assessment – where indicators have various kinds of influence on policy processes and outcomes. On the other hand, the factors can combine to create situations of mandatory reporting, opaque policy processes, low stakeholder engagement, lack of resources and large data gaps, which are less conducive to indicator influence. Attaching indicators to forward-looking policy analyses/assessments/tools can enhance their instrumental influence
The timeliness of indicators – or rather the lack of it – was identified as among the main criticisms against the indicators looked at in the various POINT case studies. Most of the indicators studied in POINT seek to represent and describe a current situation, or a trend up to the present. Usually they in fact describe the past, since the data for the actual values populating the indicators have to be collected, processed, quality assured, etc, which takes time. To be instrumentally used in policy making indicators must adequately represent the situation that the policy will intervene in; otherwise the action may be misdirected. It can be expected that the usefulness and credibility to, and acceptance of, indicators to diverse stakeholders is lower if indicator values are perceived to describe a situation that has changed since reporting or could be different than what the indicator
17
reports. These issues are connected to the problem of timeliness of indicators. One of the ways to address the problem of lack of timeliness was to use models or other methods to forecast or ‘now-cast’ values of selected indicators whether or not policy interventions were implemented. In the EU transport policy a set of indicators was defined in order to help undertake a mid-term review of the common transport policy document (‘Time to decide’). During the preparations the European Commission realised that data would not be available to actually evaluate the trends since the start of the policy. It was therefore decided to develop a European level transport model that could be used to forecast values for the selected indicators connected to policy objectives and other critical variables. Assumptions were made about the future level of adoption of existing and proposed new policies in order to forecast the policy outcomes. In this way the indicators could be used to directly compare policy alternatives and objectives. This allowed recommendations to be made not only about future policies, but also with regard to revising the objectives and the indicators of relevance for assessing the policy alternatives (Gudmundsson et al., Deliverable 12, p 30 ff). This approach was attractive to the indicator users because it allowed direct policy conclusions to be drawn in accordance with the purpose of the assessment. In this way the indicators played an instrumental role and have probably had some influence in the process. Important factors that fostered such effects were the credibility and legitimacy of the indicators to the intended users, and not least the model’s ability to produce trusted outcomes for them. Such conditions were facilitated by the substantial resources invested in the analysis and the very limited circle of indicator producers and indicator users (in this case: policy makers) involved in the process. In the case of the aquatic environment policy in Denmark (annex 2 WP3) a broad consensus on cause-effect relationships had been building up over a long period with subsequent aquatic action plans and associated monitoring programmes. Over this period gaps in knowledge were filled and models to predict outcomes of potential interventions were gradually improved. Cost efficiency calculations were introduced for the various measures suggested, and these greatly influenced the selection of measures in subsequent policy agreements. The instrumental role of indicators on the aquatic environment seems to have increased over time. This has resulted from the maturation of policy agendas, allowing the development and refinement of supporting models to predict and forecast indicators values associated with policy objectives, as well as choice of measures and regulations. In the study of the UK Energy Sector Indicators (annex 2 WP3) very limited use and associated influence of indicators was found, and in general the notion of ‘indicators’ was not part of the vocabulary of most interviewees. Many interviewees contrasted the very minor role that indicators that measure past performance play as part of the evidence-base for energy sector policymaking, with the major role played by forward-looking information such as cost-benefit analyses, and scenarios. In response to the perceived lack of influence from backward-looking indicators, a set of ‘forward looking indicators’ were suggested in the recent report by the UK Climate Change Committee. In conclusion it may be that indicators in some cases, especially where there is a mandate to evaluate a policy, can become influential in an instrumental sense by being connected to predictive models and used to assess future policy alternatives. The process of designing indicators can be an important source of influence on policy
18
The POINT studies suggest that the process of designing indicators can be an important source of influence regardless of whether the indicators resulting from such processes are actually used or influence decision-making. The influences deriving from the indicator design process can easily go unnoticed because of its indirect nature. They may occur gradually and long after the actual process of designing indicators has been completed. The influence arising from the indicator design process can take various forms. Indicator design processes may act as a starting point for debate or the indicator itself can be seen as a boundary object tying different perspectives or issues together. One of the benefits of indicators is their ability to provide focus and to enhance shared understanding (annex 1 WP5). This is particularly true in policy areas, which are not well structured. For example, sustainable development indicators play an important role in the continuous process of redefining sustainable development, by providing a means of concretely representing different dimensions of sustainability, both nationally and at the EU-level (annex 1 WP4). The process of indicator development may act as an arena for learning and cross-sectorial communication, especially when the process brings together people from different backgrounds and institutions. One recognized indirect influence of sustainable development indicators in the EU is that civil servants from different sectors come together to talk about things that had been dealt separately before. The indicator development, which takes place in different working groups, may leave its mark on later policies and practices. In the UK, the work on energy security indicators within the JESS (Joint Energy Security of Supply) Working Group has indirectly influenced policy, through its framing, consensus-building and networking functions (annex 2 WP3). The involvement of stakeholders is a crucial factor for the use and influence of indicators. The possibility to participate in the development of an indicator framework or an index helps to enhance its relevance and legitimacy. The process of designing indicators may serve as a platform on which to build trust between different stakeholders. A broad based participatory approach can ensure that an indicator or an indicator set is widely known, but it cannot guarantee its use or influence. Furthermore, a consensus-seeking indicator development process may lead to a consensus around the lowest common denominator, i.e. "safe" indicators that are acceptable by a wide variety of stakeholders, but which do not provide critical assessment or open up novel perspectives. A more limited involvement of stakeholders may make it easier to reach operational policy conclusions as seen in the EU transport case, but could also compromise full inclusion of the various dimensions of policy issues. This may lead to the development of indicators that are not considered as relevant or legitimate by those parties who are not directly involved in the development process (annex 1 WP4). We observed that the producers and the users of indicators may in some cases be the same individuals, or represent the same institution (annexes 1 WP4, 2 WP4 and 3 theme 2). The individuals or organisations closely involved in designing, producing and using the indicators can be referred to as an 'indicator industry' or 'indicator circuit'. The practices of the indicator industry can provide a streamlined and efficient production cycle of indicators but they can also serve to forestall the inclusion of participation by outside actors. At worst, the narrow group may be detached from the actual policy making or from other policy domains or sectors. The ability of indicators to transcend this 'indicator circuit' may increase indicator influence (annex 3 theme 3). We observed that indicator experts who participate in the indicator working groups often provide information about indicators to their colleagues working in their own agencies. For example, some members of the ESTAT Working Group on Sustainable Development Indicators informed their
19
colleagues in their own Commission Directorates General about indicators. A similar flow of information about SD indicators was observed in the Finnish case (annex 2 WP4). It appears that the role of intermediating indicator experts – the civil servants familiar with both indicators and policy processes – is not fully recognised. Interestingly politicians and other decision makers – the key groups in many ways – seem to be distant from the indicator design process (annex 3 theme 2). Based on our observations, the instrumental or direct use of indicators by these groups is rare. If actual policy actors and decision-makers were better involved in defining the indicators they need, and the indicator producers were involved in retranslating the policy objectives so as to ensure that they are operational in technical indicator terms, this could increase the relevance of the indicators to these groups. The production of indicators is typically based on the ideal of one-way delivery of information from producers to consumers of information instead of a participatory approach aiming at two-way interaction. As a result, the 'indicator factors' – such as relevance, robustness and reliability – receive the major attention in the indicator development. And hence, the value of the process of indicator design is easily underestimated whilst the value of the end-product overestimated. Also legal and other obligations to produce indicators tend to emphasize the end-product. Recognizing the various types of influence arising from the process of indicator design could lead to practices which enhance both direct and indirect influences of indicators.
1.4.3 Demand and supply of indicators The use and influence of indicators is dependent on the attitudes and actions of the many different actors or stakeholders in the process of creating and using indicators. Stakeholders can be broadly classified into those concerned with supplying indicators and those on the demand side who will potentially make use of them. In this section we frame the debate in terms of the demand and supply of indicators and first, in section 4.3.1 examine where the main driving forces lie in this process and secondly, in section 4.3.2 we explore the relation between supply and demand and the many kinds of mismatches that occur between them. The role of “middle” actors is significant in indicator development and diffusion
POINT results show that in the diverse actor community existing around indicators, some actors appear as proximate and others as distant from the indicator issues (annex 3 theme 2). By proximate we mean those close to the indicator industry; they may be indicator developers or diffusers. By distant we mean actors who can not be considered to be part of what was called elsewhere the indicator industry (i.e. conception, production and primary use of indicators). In a linear, general understanding of how indicators are developed, used and how they influence decision-making, the proximate actors are developing, disseminating, advocating… indicators for/towards the distant actors. The distant actors are hence often identified as the target audience. Following this line of reasoning, the final decision makers (e.g. in the EU-institutions these might be high-level civil servants or political actors), as well as on the other hand citizens, typically seem to have more distant roles in relation to indicators whereas indicator developers, academic or NGO-based experts or even specific think tanks appear in more proximate positions on the indicator landscape. From our analyses, it appears that indicator influence is greater when connections between targeted users (i.e. distant actors) and indicator developers (i.e. proximate actors) are deliberatively strengthened (annex 2 WP4).
20
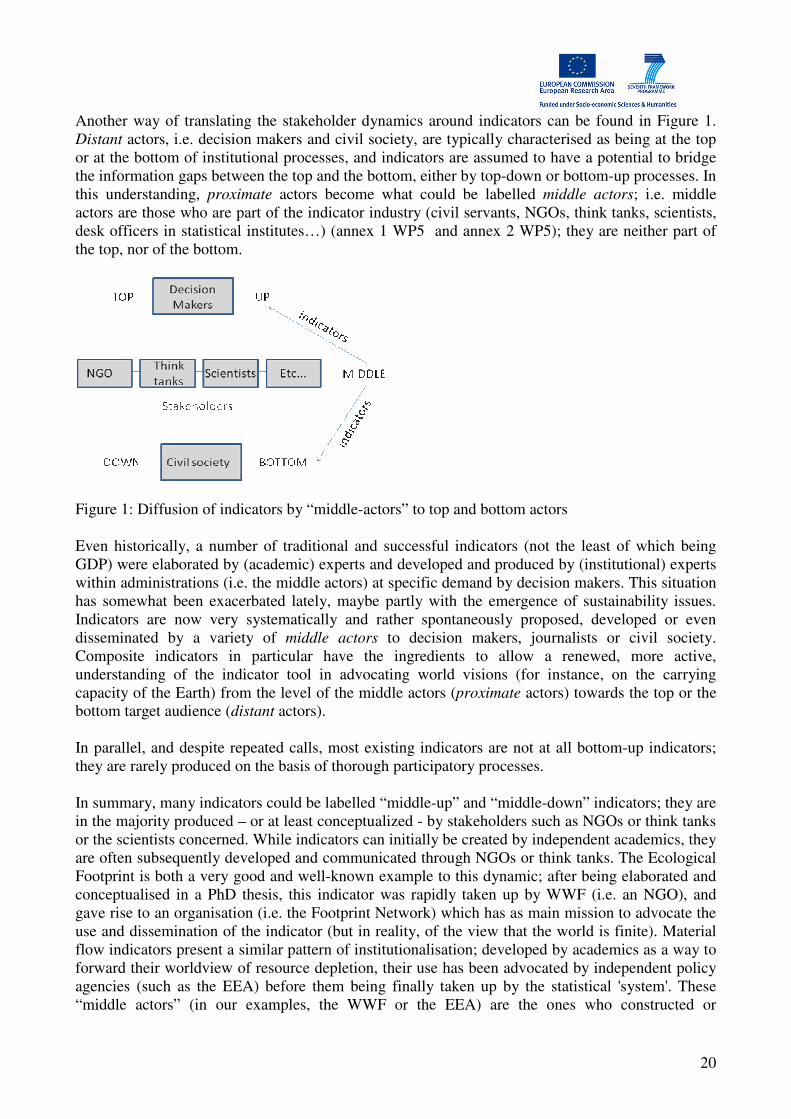
Another way of translating the stakeholder dynamics around indicators can be found in Figure 1. Distant actors, i.e. decision makers and civil society, are typically characterised as being at the top or at the bottom of institutional processes, and indicators are assumed to have a potential to bridge the information gaps between the top and the bottom, either by top-down or bottom-up processes. In this understanding, proximate actors become what could be labelled middle actors; i.e. middle actors are those who are part of the indicator industry (civil servants, NGOs, think tanks, scientists, desk officers in statistical institutes…) (annex 1 WP5 and annex 2 WP5); they are neither part of the top, nor of the bottom.
Figure 1: Diffusion of indicators by “middle-actors” to top and bottom actors Even historically, a number of traditional and successful indicators (not the least of which being GDP) were elaborated by (academic) experts and developed and produced by (institutional) experts within administrations (i.e. the middle actors) at specific demand by decision makers. This situation has somewhat been exacerbated lately, maybe partly with the emergence of sustainability issues. Indicators are now very systematically and rather spontaneously proposed, developed or even disseminated by a variety of middle actors to decision makers, journalists or civil society. Composite indicators in particular have the ingredients to allow a renewed, more active, understanding of the indicator tool in advocating world visions (for instance, on the carrying capacity of the Earth) from the level of the middle actors (proximate actors) towards the top or the bottom target audience (distant actors). In parallel, and despite repeated calls, most existing indicators are not at all bottom-up indicators; they are rarely produced on the basis of thorough participatory processes. In summary, many indicators could be labelled “middle-up” and “middle-down” indicators; they are in the majority produced – or at least conceptualized - by stakeholders such as NGOs or think tanks or the scientists concerned. While indicators can initially be created by independent academics, they are often subsequently developed and communicated through NGOs or think tanks. The Ecological Footprint is both a very good and well-known example to this dynamic; after being elaborated and conceptualised in a PhD thesis, this indicator was rapidly taken up by WWF (i.e. an NGO), and gave rise to an organisation (i.e. the Footprint Network) which has as main mission to advocate the use and dissemination of the indicator (but in reality, of the view that the world is finite). Material flow indicators present a similar pattern of institutionalisation; developed by academics as a way to forward their worldview of resource depletion, their use has been advocated by independent policy agencies (such as the EEA) before them being finally taken up by the statistical 'system'. These “middle actors” (in our examples, the WWF or the EEA) are the ones who constructed or

21
disseminated the indicators in order to support their various visions for society, e.g. who tried to communicate their visions towards both ‘top’ and ‘bottom’. Our analyses of the composite indicators appear to highlight the fact that recently the role of these middle actors has been strengthened. These middle level actors appear to have often been ignored in existing indicator analyses, or have not been characterised as a specific actor group. A wide and diverse community navigates around the indicator industry, with new roles emerging for middle level actors, such as NGO and think tanks. This modification of the stakeholder dynamics around indicators could lead to new forms of governance regarding indicator choice, use and dissemination. Specifically at the EU-level, we identified a gap within the policy actors’ discourses which repetitively call for bottom-up indicators (e.g. indicators sitting on a wider acceptance of what the civil society values), and the apparent absence of initiatives to develop such bottom-up indicators in practice. The implications of this debate on top-down and bottom-up indicators are not to be underestimated; in the case of composite indicators, it reveals the question of who should elaborate visions for the future of our societies. Dislocations and mismatches exist between types of demands for and the supplies of indicators
The handling of information has often been described – even represented graphically – in terms of supply and demand. The relative ignorance we have when it comes to understanding the complexities of how humans - or collectives – react to information, may be grounded in as much lack of knowledge as the laws of supply and demand which are assumed to operate in market situations. Undeniably the metaphor of supply and demand is supported by the existence of an indicator industry, which produces – i.e. supplies – indicators as a reaction to calls – i.e. demands - for more, different or better indicators. Contemporary discourses on the cost-effectiveness of administrations and institutions strongly support the drive towards providing effectively and efficiently what is needed to govern, i.e. the ideal situation is assumed to be one of equilibrium between demand and supply of the means of governance, and this is equally true in the particular case of information provision via indicators. Following this line of reasoning, if indicators do not meet “their” demand, indicators are supposedly not effective in fulfilling their mission of providing the expected information and should therefore be reconfigured, redirected or eventually abandoned. In this section we adopt the metaphor of the supply of and the demand for indicators, and re-visit the set of results obtained in POINT accordingly. The idea is to investigate the case studies in order to detect where demand was not in line with supply, and vice-versa, and reflect on the reasons for, and consequences of, such a mismatch. However, the dislocation(s) of the sought-for equilibrium between demand and supply is not assumed here to be counter-productive in nature; demand being met by supply is thus not taken as a fundamental prerequisite for the eventual use and influence of indicators in policy-making situations. On the contrary in fact disequilibrium in information provision and handling might well be a source of major inspiration and energy for institutional and political actors to investigate more seriously the solution of a policy problem. In the POINT case studies we have identified five reasons for dislocation between demand for and supply of indicators a. Misunderstanding the nature(s) of the demand and supply

22
When investigating indicators in policy-making, it rapidly becomes apparent that there are several types of demand and supply, as there might well be different types of indicator industries and indicator markets, as well as different types of expectations concerning indicators emanating from different actors in the policy process. Supply is therefore diverse in nature; there are different ways to conceive indicators and different assumptions as to their links to policy-making. In parallel, we observe also a series of different demands, e.g. demands grounded in the monitoring and reporting obligations of administrations, demands emanating from civil society to evaluate policy achievements, demands from policy makers to extrapolate future evolutions of policy sectors. A first dislocation, which was observed in POINT, is grounded in the fact that the nature of a particular demand was not mirrored by a given supply; i.e. indicator production is not corresponding to what has been asked for, implicitly or explicitly. This mechanic was most obvious in cases where the demand called for framework indicators (e.g. to frame a wider policy vision), but the suppliers saw their mission as that of providing direct evidence for policy-making. In the case study on composite indicators (CIS) at EU-level (annex 1 WP5), a quite extensive confusion appeared around the core role such composite indicators could play in policy-making processes. When confronted directly, the European decision makers interviewed affirmed that CIS could be both evidence for policy making, and conveying a world vision. There is thus a demand in terms of CIS emerging from high-level decision makers both for evidence and for visions. From our analysis of their discourses – as well as through the qualitative analysis of the role CIS play in media – it occurred that such composite indicators are advocated as reflecting the future visions of society much more than as evidence for policy making. The provision of CIS by the above mentioned middle actors might be grounded in their motivation to provide framework indicators in order to stimulate vision framing. Confusion emerges because the language and the justification used by CIS-developers (i.e. the middle actors) are enshrined in the more contemporary and presumably attractive language of providing evidence-for-policy-making, i.e. aiming at the more instrumental uses of the indicators. A mismatch between the nature of supply and demand was furthermore observed in the case study on energy indicators in the UK (annex 2 WP3), and occurred in the analysis of national sustainable development indicator sets. In the UK case study, the indicator demand – while grounded deeply in wording which refers to evidence-based-policy-making - was implicitly also a call to structurally insert the four themes of the UK White paper into policy processes and discourses. In the SD-indicator processes at national and EU-level, a similar thematic solidification of the SD-agendas was implicitly searched for. The streamlining effect on the general SD-discourses - implied by repeating identical indicator-related processes at different institutional levels – generated in this latter context a well-identified indicator tradition at the different institutional levels involved. As “country level analyses conducted demonstrate that there is always a need to tailor indicator sets to fit the local need and circumstances”, these specific national “needs” (i.e. demands) were found to be not well-covered by the process of supply chosen and which drifted towards a unified “European” list of SD-indicators. The streamlining effect of the supply of SD-indicators was found to be potentially counter-productive, as different national analyses show that the national SD-agendas are not identical in the different countries. Thus in some national contexts, SD-indicators seemed to have played a role in generating vision framing on the signification of SD, whereas the initial EU-process of producing SD indicators was configured to provide evidence for decision-making and for monitoring of the SD strategy. b. Confusing suppliers and demanders

23
Dislocation between supply and demand might also originate at the actor level. The development of the national SD indicators in Finland (annex 2 WP4), which is acknowledged to be among the best-practice countries in this domain, shows that there can be some confusion between suppliers and demanders, i.e. as to whom the developers are and who the users of indicators are in institutional processes. It is not possible to clearly distinguish institutions which are producing the indicators from those that are assumed to be using the indicators for policy assessment. For instance in the Finnish case, the main demand for the SD indicators emerged from parallel institutional processes of monitoring and reporting. The production of indicators in the case of the Finish SD indicators was foremost motivated by the desire to nourish intra-institutional processes. The blurred frontiers between suppliers and demanders led in the Finnish case to quite a strong interaction between the needs for and the possibilities of producing the indicators. The proximity between needs and production in this case helped to attribute importance to questions of usability of indicators; in the end, the SD-indicators had an impact on policy via a series of iterative reconfigurations of the indicator framework, which in turn influenced the SD-policy framework. The analysis of the Slovak SD indicator case study (annex 2 WP4) showed an identical confluence of roles; the Slovak environmental agency being the producer and provider of data and indicators, as well as the main receiver of the indicators. c. Under-specifying the demand
A third reason for dislocation might occur when the demand for indicators is not clearly identified and specified prior to the production of indicators. This includes situations where there is simply no demand at all, but suppliers seemed to assume there should “naturally” be a demand. A general assumption prevailing among many suppliers is that up to a certain extent supply is creating demand. It was observed that this is partially linked, in the case of composite indicators at least, to the fact that “outside” suppliers (e.g. NGOs, international institutions, academia) are using the creation of indicators as a way to promote their world vision in policy arenas. The importance of investigating the nature of the demand – and calibrating indicators according to that investigation - was tentatively confirmed by the stakeholder processes in WP6 (Morse and Bell, deliverable 9, 2010). This finding is in line with the message that demands are prone to change over time; as soon as indicator demands migrates towards another object of public (or institutional, or political) interest, the indicator supply needs to be re-specified and adapted. In line with the recurrent absence of an identified target user, our investigations observed another phenomenon: the same indicator process can be consciously targeted towards fundamentally different users. Identical indicators are supposed to be able to cover very divergent demands for information. This ambivalence occurred specifically in the case of composite indicators, which appeared to be assumed to be useful for high-level policy actors as well as for the wider public. The busy politician and the 'ignorant' public were therefore assumed to have the same capacity and depth of analysis. In the case of SD indicators, the indicator set is often expected to serve many different purposes simultaneously: monitoring of SD strategies, supporting day-to-day policy making and delivering a comprehensive picture of sustainability to the wider public. As the monitoring function is considered to be the priority, it is not surprising that the use and usefulness for other functions receives less attention in the indicator development process. d. Coping with institutional processes
Another conclusion is that supply-demand coupling can be configured by a number of institutional pressures, perhaps most notably in the area of the highly structured institutional processes of the

24
EU-level SD indicators issued by ESTAT to help the monitoring of the EU-SD strategy. It occurred that the configuration of the indicator set developed by ESTAT – i.e. the supply - was extensively influenced by the availability and quality of the statistical offices' data. Indicators that would potentially be better in line with redundantly formulated demands from stakeholders (notably for indicators which helped to grasp an overall image of the sustainability of Europe) were discarded by ESTAT due to lack of data, or non-robustness of the potential indicators. Specifically, the recurrent demand to include in the monitoring scheme of the EU-SDS some aggregated indexes, such as the Ecological Footprint or the Water- and Carbon-footprints, was not met by the indicator process, nor supported by the EU-SDS Indicator Working Group, because of an almost ideological opposition to composite indicators. In this processes, the (institutional) pressure emanating from the statistical offices' preference and tradition of favouring certain statistical, technical criteria over others, when deciding on the configuration of the indicator set, took precedence over the more political and societal criteria advocated by stakeholders. b An identical phenomenon was identified in the case study on energy indicators in the UK (annex 2 WP3), where the supply of indicators was determined by the institutional obligation to produce indicators in the context of the policy process. The obligation itself was supported by the prevailing (national) policy style which seeks to back policy action by evidence, notably to assure an adequate level of accountability to policy makers. Hence there seemed to be no clear prior demand for the indicators on the part of the potential users. The missing identification of the precise demand – even in very quantitative policy domains – was reflected in the fact that many policy actors were not aware of the existence of the indicator set, and were clearly unfamiliar with the indicator terminology. Disinterest in the indicators also prevailed outside of administrations, as invitations by the administration to stakeholders to comment on the indicators and suggest improvements were met with no response. At the other extreme, the Swedish and European Transport policy domains (annex 2 WP3) are a good case to show that it is possible to reach a satisfying level of adequacy between an institutionally motivated process of indicator development which over time pairs well with the political and administrative demand at the level of the policy evaluation. In both transport cases, but as a result of different mechanisms, the relative impossibility of providing the indicators initially demanded for the policy processes, led to a partial redefinition not of the indicators, but of the policy targets; the impossibility to satisfy the procedural demand for indicators led to a further refinement of the policy goals and targets. It could be speculated whether this adaptation of demand has to do with the specific nature of the policy exercises which were analyzed, and which were related to the assessment of strategic policy targets. In any case, the transport policy arenas show well that in relatively mature policy environments, it is possible to observe some form of dynamic between supply of and demand for indicators. An identical iterative process between indicator supply and the redefinition of strategic policy targets occurred within the realm of the SD-indicators at EU-level, where interviewees emphasized that the discussion over ESTAT’s indicator framework fed into the reformulation of the conceptual underpinnings of the 2nd EU SD-strategy. e. Ignoring the timeframes
At a complementary level to the non-identification - or vague identification - of the demand for indicators, case studies in POINT repeatedly found that timeliness of the demand-supply coupling was a major parameter in defining use and impact of indicators. Alignment of the two processes, the indicator development and communication processes and the policy formulation processes, was often mentioned to be vital to an effective uptake of indicators. But timing was also an issue at a different level. In some of the case studies (most notably in the UK energy indicators case study –

25
annex 2 WP3), the inherent backward looking – i.e. evaluative – function of indicators was questioned as to its relevance to the policy process, which were more of a strategic than an evaluative nature. In these cases, indicators might just not be the adequate policy tool to deploy, and investment into more forward-looking tools (e.g. scenarios, modelling…) could have been of potentially more benefit to the policy arenas' need for information.
1.4.4 On methodology In POINT a mixture of methods was used to capture the use and influence of indicators. Many of them, for example, documentary analysis, questionnaires and structured interviews were effective in eliciting information on forms and degrees of direct use and influence. However, the more unstructured and qualitative methods used, including semi-structured interviews and group discussion methods were necessary to capture the many indirect ways in which indicators seem to have influence. It is our belief that a major methodological task is to create methods that can be used to deliberately capture the many and various indirect ways in which indicators may have their influence. In POINT we developed a group discussion approach – the Triple Task Methodology- described in section 4.4.1 below, that enabled unstructured debate between stakeholders and revealed many of the more subtle ways by which indicators could have influence and the barriers to indicator usage. Indicator groups can be better understood and their use of indicators planned more reliably using the Triple Task Methodology.
In POINT a methodology for assessing group thinking in terms of a specific task (e.g. indicator use) and how the group reaches its understanding has been developed. The methodology is called Triple Task and the underlying methodology behind the findings is explained in Morse & Bell (deliverable 9, 2010) and annex 2, WP6. Triple Task (TT) is a unique form of systemic participatory action research. It is:
• Systemic in that it applies focus to relationships between and within groups • Participatory in the sense that not only does it attempt to arrive at answers to research
questions but also tries to understand what stakeholder held factors may have been at play in arriving at those answers.
• Action Research (AR; a research process that catalyses action) by involving work with and
within groups of stakeholders. The synergistic combination of these three attributes makes TT an advance on many other participatory techniques. Participatory research takes many forms but the underlying philosophy is that all those present - be they 'researcher' or 'researched' - are involved in the design of a research process as well as the interpretation of findings. In this vision power is shared rather than being concentrated in the hands of a researcher, and participants can learn from each others’ experiences and use that to derive a shared understanding. As a result the very process of doing the research can provide many insights and help bring about positive change. But many participatory action research methods stop at the point where outputs have been achieved, with no structured attempt to appreciate the dynamics that may have been at play within the group to arrive at those outputs. This could be seen as being a waste as understanding group process as well as group outcomes can be key to also understanding ‘replicability’ of results, resilience of outcomes and rational for change (among other things). Therefore, while it is likely that within each group there will be some variation in perspective, as well as the meaning of terms such as ‘effectiveness’, participatory

26
techniques have a tendency to hide this and provide (an often incorrect) appearance of apparent consensus. Unlike many other approaches to action research, TT begins with an assumption that it is not only what groups achieve while working together that matters but also the factors at play which have allowed them to get to where they have arrived at. The latter may be multi-faceted, of course, and include the context within which members of the group work and their profession. In addition to these factors is the group dynamic; the way in which the group functioned. TT assumes that an understanding of this maelstrom of influence can help with an understanding as to why insights were arrived at and thus help with an appreciation of variation that may be seen between groups. Until now this association has often emerged only in an anecdotal form. Experienced workshop facilitators can often ‘tell’ when a workshop has worked “well”, whether some groups have been more insightful than others, whether the dynamics within some groups or the background of the individuals within those groups have hindered or helped their process of discovery and so on, and instinctively they draw an association between outputs and process. TT starts from that point and attempts to formally elucidate what the learning opportunities and associations may be. Eventually, and in a generalised sense, it may be possible for such research to provide a typography of groups with ‘outputs’ and ‘process’ as axes and this may perhaps allow the identification of clusters which link these two variables (taking into account changes over time and group makeup). In the POINT project, for example, we have addressed the following questions: Do purposeful groups always produce the most insightful outcomes?
Not necessarily so. Groups on fixed purpose often produce results which are dependable but pedestrian. They find what they expect to find and report the same.
Do conflictual groups produce incoherent results?
No. Conflicted groups have a very good chance of producing insight and step change vision … so long as their internal conflict can be harnessed.
What makes a ‘good’ group?
Contained conflict/ dis-function dissymmetry and distributed leadership. These qualities will tend to produce conflict and at the same time, insight.
Thus some of the most interesting and ‘rich’ insights came from groups where there was conflict, but why should this be so? After all, it does appear at first glance to be counter-factual. Surely the best insights should come from groups where there is little if any conflict? It is likely that much of this perceived ‘conflict’ was a reflection of experience, with all the positives and frustrations that are a part of that experience. Hence for example in Finland and Denmark where groups tended to regard themselves as more conflictual these are also the countries with long and established experience with indicators. Thus group members had something to say – they had a story to tell based upon what they had witnessed – and were willing to share that knowledge. Understandably this experience can result in different perspectives as to what may help and hinder indicator use and as to the strength of position from which to make that case. TT provides a powerful means by which to begin to chart some of the factors that influence the outputs arrived at by a group. It also excitingly offers the potential for group dynamic diagnosis and

27
prediction. To our knowledge this is the first time that anyone has tried to do this within a participatory method.
1.4.5 References Barbier J-C. (1999) Inter-governmental Evaluation: Balancing Stakeholders’ Expectations with
Enlightenment Objectives? Evaluation 5, 4 pp 373-386.
Boulanger (2007). Political uses of social indicators: overview and application to sustainable development indicators. Int. J. Sustainable Development, Vol. 10, Nos. 1-2 pp 14-32.
Innes. J.E. (1998). Information in communicative planning. Journal of the American Planning Association, Chicago; Winter 1998; Vol. 64, Iss. 1
Mickwitz P. and Melanen M. (2009). The Role of Co-operation between Academia and Policymakers for the Development and Use of Sustainability Indicators – A Case from the Finnish Kymenlaakso Region, Journal of Cleaner Production 17(12): 1086–1100.
Owens S. (2005). Making a difference? Some perspectives on environmental research and policy. Transactions of the Institute of British Geographers, 30(3), 287-292.
Rydin Y. (2002). Indicators Into Action: Local Sustainability Indicator Sets in Their Context. The Pastille Consortium, London School of Economics, London.
Rosenström U. (2009). Sustainable development indicators: Much wanted, less used? Monographs of the Boreal Environment Research no. 33, p. 74.
Swartling Å.,G., Nilsson M., Engström R. and Hagberg L. (2007). Theory and methodology for EPI analysis. Chapter 3 in: Nilsson M. & Eckerberg K. (eds). Environmental Policy Intergration in Practise. Shaping Institutions for Learning. Earthscan. London.
Turnhout E. et al. (2007) Ecological indicators: between the two fires of science and policy. Ecological indicators 7, 215-228.
Weiss, C.H. (1979). The Many Meanings of Research Utilization. Public Administration Review, Vol. 39, No. 5., pp. 426-431.
Weiss, C. H. (1999). The interface between Evaluation and Public Policy. Evaluation, 5, 468-486.
28
1.5. Potential impact While all POINT partners have been into contact with politicians and policy-makers, the POINT results had the most direct avenue into society in Finland, due to the close relations between the POINT partner SYKE, and the work in the Ministry of the Environment on sustainability and well-being indicators. This was realised in following texts:
o Revision of Finnish sustainable development indicators. Viewpoints and suggestions from national indicator network. [In Finnish] Available from: http://www.ymparisto.fi/download.asp?contentid=124784&lan=fi
o Lyytimäki, Jari (2011). Frameworks for the ex-ante impact assessment of sustainable development. Suggestion for the assessment tool. Reports of the Ministry of the Environment, Helsinki. [In print]
o Expert group on new dimensions for the measurement of well-being (HYMY-working group). Prime Minister's Office, 2010-2011. (Jari Lyytimäki).
POINT results have also been introduced to the ‘indicator industry’ at European level through participation and presentations at the OECD workshop, titled ‘Agri-environmental indicators: Lessons learned and future directions’ (Switzerland 2010), The Eurostat workshop on New techniques and Technologies for Statisticians (NTTS 2011, Brussels, February 2011) and the Eurostat conference ‘Statistics for Policy-makers’ (Brussels, March 2011)
The European Commission and policy-makers call for evidence based policies (EC, 2008). In support of such a policy-making approach, the European Environmental Agency, EUROSTAT, OECD as well as many other organisations are producing increasing numbers of indicators, notably in the areas of the environment and sustainable development. Moreover, calls for indicators are voiced across several recent EC initiatives.
This implies that it is also increasingly important to recognise the broad variety of aims and uses that can be attributed to indicators, and the need to ensure that these aims correspond to the policy situation in question. Generally spoken, it is important that indicator producers better collaborate with indicators users – even the more ‘distant’ users. Moreover, it is also crucial to know what makes indicators influential in different contexts and processes – and not least to clarify what influence implies in a given context – for example in spreading knowledge, in producing ideas, in framing or advancing dialogue or in measuring policy performance. These are some of the issues explored in the POINT project, and a final synthesis process resulted in a list of recommendations, for the ‘indicator industry’ as well as for the wider society.
Research agendas aiming to support the Europe 2020 strategy are emerging, which also deals directly or in minor part with indicator issues. We have looked into a few reports from the EU in order to get an idea of the extent to which the issues that have been central in POINT are reflected in these discussions.
Reviewing emergent policy and research agendas (CEC 2009a, EC 2009b, Eurostat 2011), it is obvious that new indicators are and will be required, not least in the environmental and resource-efficiency area, aiming to support the Europe 2020 strategy, and that there is a considerable focus on gaps in indicator sets and missing indicators for purposes of policy monitoring and evaluation. While not downplaying these requirements, we also find it important to keep drawing attention to the many other roles that indicators may play in policy processes, including how they can foster dialogue and conceptualisation of complex issues.

29
These aspects also exist to some extent in the reports addressed, where issues that relate to the POINT research questions surface here and there. At the conference “Statistics for policy-making” organised by Eurostat in March 2011, one of the questions to the conference was: ‘How can the statisticians ensure that statistics influence policy-making rather than being contaminated by it? (Eurostat 2011). The question of influence is at the heart of the POINT project, and the relationship between data, statistics and indicators as evidence in policy-making and as knowledge agents between ‘uncontaminated’ statistics and policy-makers’ questions and requirements might be one of the future research avenues.
As an input to the upcoming research agendas on indicators, POINT partners have suggested some research topics, which could supplement, broaden and deepen the insights produced in the project. These are listed in section 2.2.
The recommendations resulting from POINT as well as more extensive discussions underpinning the issues raised here, are available in the synthesis deliverable (nb 15) and the deliverable on awareness and wider societal implications (nb 16) to be found at the POINT website.
References
Commission of the European Community (2009a). Sustainable Development Indicators. Overview of relevant FP-funded research and identification of further needs. Bruxelles.
European Communities (2009b). Beyond GDP. Measuring progress, true wealth, and the well-being of nations. Conference Proceedings, 19-20 November 2007.
Eurostat (2011). Statistics for Policy-making: Europe 2020. Proceedings from a workshop, 10-11 March 2011. Brussels.
2. Use and dissemination of foreground
2.1 Dissemination measures relating to foreground (Section A, public) POINT activities and results have been disseminated in a variety of ways, both traditional, scientific such as publication in international journals and presentations at relevant conferences, but also in more untraditional such as thorugh the production of a podcast and during interactive stakeholder workshops. During the final half year, the POINT project was invited to participate in the Eurostat workshop on New Techniques and Technologies for Statistics, February 2011, where a project session was organised with four presentations from the POINT project. Moreover, the POINT synthesis was available at the Eurostat conference: Statistics for Policy Making: Europe 2020, March 2011. Following is a summary of main dissemination activities:
• Designing, maintaining and monitoring a project website, which was also improved during the was set up, to make it more accessible, informative and “professional-looking” http://www.point-eufp7.info/. The responsibility for setting up and running the website was transferred from UoS to BI, and a corresponding shift of resources from UoS to BI was made
• three policy briefings were produced; the first describing the results from the first three stakeholder workshops, the second describing the first results from a media analysis of

30
the use of aggregated indicators under WP5, and the third reporting experiences from the OECD World Forum and the POINT transport indicator workshop in Denmark.
• POINT members gave presentations at numerous academic conferences, seminars and training courses
• Articles based on POINT were published in newspapers • A Podcast was produced and published at iTunes. It can be downloaded from the POINT
website. The introducing text is as follows: We live with a paradox. We need to measure our world to make sense of it, but important things are really hard to measure. And, when we do measure important things, how do we tell people what we have found out? Dr Simon Bell from the Open University and the Bayswater Institute investigates the world of indicators (or measurements). Who decides what we measure � from ash cloud particles, to calories consumed, to GDP � how do we measure things and do these indicators have an influence on the policies within the EU that affect us all?

31
tem
pla
te A
1: li
st o
f sc
ien
tifi
c (p
eer
revi
ewed
) p
ub
licat
ion
s, s
tart
ing
wit
h t
he
mo
st im
po
rtan
t o
nes
Per
man
ent
iden
tifie
rs[
1]
NO
. Ti
tle
Mai
n au
thor
Ti
tle o
f the
per
iodi
cal
or th
e se
ries
Num
ber,
date
or
frequ
ency
Pu
blis
her
Plac
e of
pu
blic
atio
n
Year
of
publ
icat
ion
Rel
evan
t pag
es
(if
avai
labl
e)
Is/W
ill
open
ac
cess
[2]
pr
ovid
ed
to th
is
publ
icat
ion
?
1 An
ana
lytic
al fr
amew
ork
to
disc
uss
the
usab
ility
of
(env
ironm
enta
l) in
dica
tors
fo
r pol
icy
Baul
er, T
om
Ecol
ogic
al In
dica
tors
20
11 (i
n pr
ess)
el
sevi
er
(in
pre
ss)
(in p
ress
)
no
2 H
arne
ssin
g th
e po
wer
of
the
pres
s w
ith in
dice
s M
orse
S
Ecol
ogic
al In
dica
tors
else
vier
in p
ress
(in
pre
ss)
no
3 O
ut o
f sig
ht, o
ut o
f min
d.
Rep
ortin
g of
thre
e in
dice
s in
the
UK
natio
nal p
ress
be
twee
n 19
90 a
nd 2
009
Mor
se S
Su
stai
nabl
e D
evel
opm
ent
W
iley
in
pre
ss
(in p
ress
)
no
4 D
iagr
ams:
a m
eans
to
expl
ore
the
‘Sus
tain
able
M
ind’
?
Bell
S an
d M
orse
S
Sust
aina
ble
Dev
elop
men
t
Wile
y
in p
ress
(in
pre
ss)
no
5 Be
ing,
Eng
agin
g,
Con
text
ualis
ing
and
Man
agin
g: B
ECM
Mat
rix –
a
mea
ns fo
r non
-spe
cial
ists
to
ass
ess
grou
p dy
nam
ics?
Bell
S an
d M
orse
S
Jour
nal o
f Sys
tem
s R
esea
rch
and
Beha
vior
al S
cien
ce
W
iley
in
pre
ss
(in p
ress
)
no
6 An
ana
lysi
s of
fact
ors
influ
enci
ng u
se o
f In
dica
tors
in th
e Eu
rope
an
Uni
on
Bell
S an
d M
orse
S
Loca
l Env
ironm
ent:
The
Inte
rnat
iona
l Jou
rnal
of
Just
ice
and
Sust
aina
bilit
y
Volu
me
16 is
sue
3 Ta
ylor
&
Fran
cis
20
11
281
to
302
no
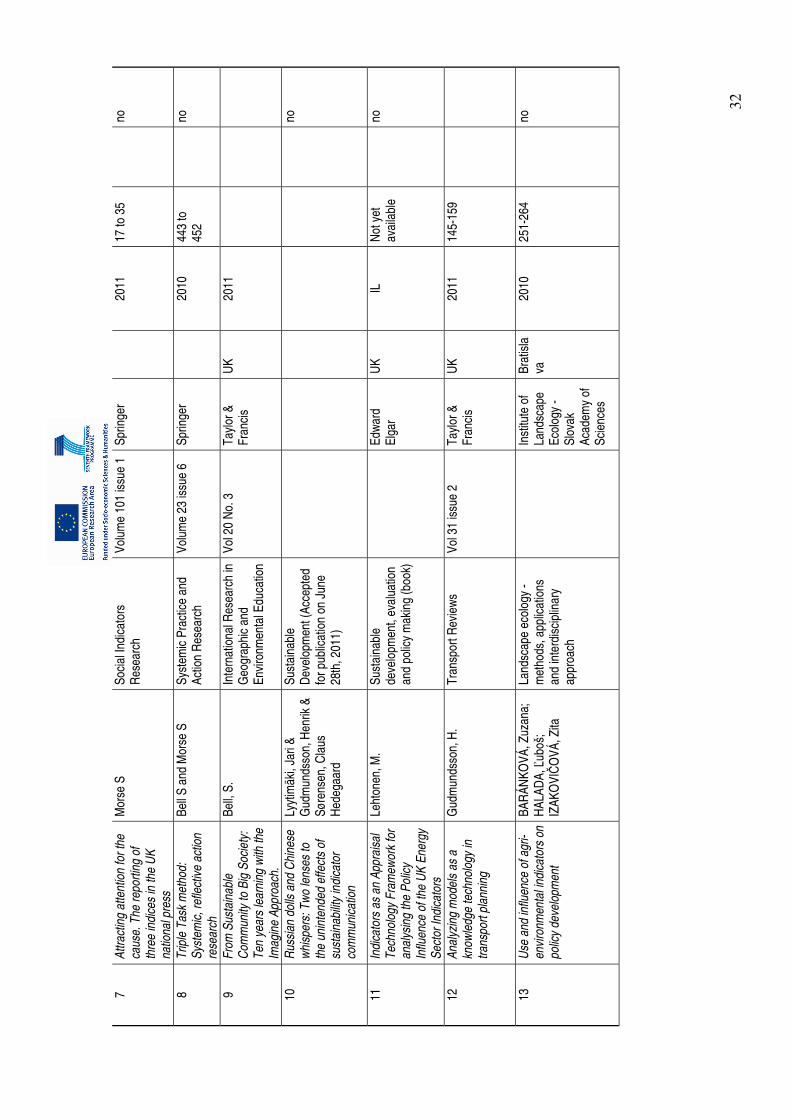
32
7 At
tract
ing
atte
ntio
n fo
r the
ca
use.
The
repo
rting
of
thre
e in
dice
s in
the
UK
natio
nal p
ress
Mor
se S
So
cial
Indi
cato
rs
Res
earc
h
Volu
me
101
issu
e 1
Sprin
ger
20
11
17 to
35
no
8 Tr
iple
Tas
k m
etho
d:
Syst
emic
, ref
lect
ive
actio
n re
sear
ch
Bell
S an
d M
orse
S
Syst
emic
Pra
ctic
e an
d Ac
tion
Res
earc
h
Volu
me
23 is
sue
6 Sp
ringe
r
2010
44
3 to
45
2
no
9 Fr
om S
usta
inab
le
Com
mun
ity to
Big
Soc
iety
: Te
n ye
ars
lear
ning
with
the
Imag
ine
Appr
oach
.
Bell,
S.
Inte
rnat
iona
l Res
earc
h in
G
eogr
aphi
c an
d En
viro
nmen
tal E
duca
tion
Vol 2
0 N
o. 3
Ta
ylor
&
Fran
cis
UK
2011
10
Rus
sian
dol
ls a
nd C
hine
se
whi
sper
s: T
wo
lens
es to
th
e un
inte
nded
effe
cts
of
sust
aina
bilit
y in
dica
tor
com
mun
icat
ion
Lyyt
imäk
i, Ja
ri &
Gud
mun
dsso
n, H
enrik
&
Søre
nsen
, Cla
us
Hed
egaa
rd
Sust
aina
ble
Dev
elop
men
t (Ac
cept
ed
for p
ublic
atio
n on
Jun
e 28
th, 2
011)
no
11
Indi
cato
rs a
s an
App
rais
al
Tech
nolo
gy F
ram
ewor
k fo
r an
alys
ing
the
Polic
y In
fluen
ce o
f the
UK
Ener
gy
Sect
or In
dica
tors
Leht
onen
, M.
Sust
aina
ble
deve
lopm
ent,
eval
uatio
n an
d po
licy
mak
ing
(boo
k)
Ed
war
d El
gar
UK
IL
Not
yet
av
aila
ble
no
12
Anal
yzin
g m
odel
s as
a
know
ledg
e te
chno
logy
in
trans
port
plan
ning
Gud
mun
dsso
n, H
. Tr
ansp
ort R
evie
ws
Vol 3
1 is
sue
2 Ta
ylor
&
Fran
cis
UK
2011
14
5-15
9
13
Use
and
influ
ence
of a
gri-
envi
ronm
enta
l ind
icat
ors
on
polic
y de
velo
pmen
t
BAR
ÁNKO
VÁ, Z
uzan
a;
HAL
ADA,
Ľubo
š;
IZAK
OVI
ČOVÁ
, Zita
Land
scap
e ec
olog
y -
met
hods
, app
licat
ions
an
d in
terd
isci
plin
ary
appr
oach
In
stitu
te o
f La
ndsc
ape
Ecol
ogy
- Sl
ovak
Ac
adem
y of
Sc
ienc
es
Brat
isla
va
2010
25
1-26
4
no

33
14
Stak
ehol
der,s
per
cept
ion
of
the
use
of a
gro-
envi
ronm
enta
l ind
icat
ors
in
Slov
akia
VÁLK
OVC
OVÁ
, Zuz
ana;
IZ
AKO
VIČO
VÁ, Z
ita
In L
ands
cape
- th
eory
an
d pr
actic
e: a
bstra
ct o
f th
e 15
th In
tern
atio
nal
Sym
posi
um o
n Pr
oble
ms
of L
ands
cape
Eco
logi
cal
Res
earc
h
In
stitu
te o
f La
ndsc
ape
Ecol
ogy
- Sl
ovak
Ac
adem
y of
Sc
ienc
es
Brat
isla
va
2009
11
1-11
2
no
15
Sust
aina
ble
Dev
elop
men
t In
dica
tors
: The
Tyr
anny
of
Met
hodo
logy
Rev
isite
d
Bell
S an
d M
orse
S
Con
silie
nce:
The
Jou
rnal
of
Sus
tain
able
D
evel
opm
ent
C
olum
bia
Uni
vers
ity
USA
in
pre
ss
yes
16
Usi
ng in
dica
tors
to a
sses
s su
stai
nabl
e de
velo
pmen
t in
the
Euro
pean
Uni
on,
Finl
and,
Mal
ta a
nd
Slov
akia
.
Lyyt
imäk
i, Ja
ri &
Rin
ne,
Jann
e &
Kaut
to, P
etru
s &
Assm
uth,
Tim
o (e
ds.)
The
Finn
ish
Envi
ronm
ent
4 Fi
nnis
h En
viro
nmen
t In
stitu
te
Hel
sink
i20
11
w
ww
.env
iron
men
t.fi
> Publ
icat
ions
> T
he
Finn
ish
Envi
ronm
ent
yes
17
Intro
duct
ion.
In [1
5]
Lyyt
imäk
i, Ja
ri &
Kaut
to
Petru
s Th
e Fi
nnis
h En
viro
nmen
t4
Finn
ish
Envi
ronm
ent
Inst
itute
Hel
sink
i20
11
7-10
w
ww
.env
iron
men
t.fi
> Publ
icat
ions
> T
he
Finn
ish
Envi
ronm
ent
yes
18
Indi
cato
rs a
nd s
usta
inab
le
deve
lopm
ent s
trate
gies
: A
cros
s-na
tiona
l ove
rvie
w. I
n [1
5]
Lyyt
imäk
i Jar
i Th
e Fi
nnis
h En
viro
nmen
t4
Finn
ish
Envi
ronm
ent
Inst
itute
Hel
sink
i20
11
11-1
3 w
ww
.env
iron
men
t.fi
> Publ
icat
ions
> T
he
Finn
ish
Envi
ronm
ent
yes

34
19
Sust
aina
ble
deve
lopm
ent
stra
tegi
es a
nd in
dica
tors
in
the
Euro
pean
Uni
on. I
n [1
5]
Rin
ne, J
anne
&
Lyyt
imäk
i, Ja
ri &
Kaut
to,
Petru
s
The
Finn
ish
Envi
ronm
ent
4 Fi
nnis
h En
viro
nmen
t In
stitu
te
Hel
sink
i20
11
14-2
7 w
ww
.env
iron
men
t.fi
> Publ
icat
ions
> T
he
Finn
ish
Envi
ronm
ent
yes
20
Sust
aina
ble
deve
lopm
ent
stra
tegi
es a
nd in
dica
tors
in
Finl
and.
In [1
5]
Lyyt
imäk
i, Ja
ri &
Rin
ne,
Jann
e &
Tiai
nen,
Arto
&
Kaut
to, P
etru
s
The
Finn
ish
Envi
ronm
ent
4 Fi
nnis
h En
viro
nmen
t In
stitu
te
Hel
sink
i20
11
28-4
1 w
ww
.env
iron
men
t.fi
> Publ
icat
ions
> T
he
Finn
ish
Envi
ronm
ent
yes
21
Barri
ers
and
poss
ibilit
ies
of
indi
cato
r use
and
influ
ence
. In
[15]
Lyyt
imäk
i, Ja
ri &
Kaut
to,
Petru
s &
Rin
ne, J
anne
Th
e Fi
nnis
h En
viro
nmen
t4
Finn
ish
Envi
ronm
ent
Inst
itute
Hel
sink
i20
11
65-6
9 w
ww
.env
iron
men
t.fi
> Publ
icat
ions
> T
he
Finn
ish
Envi
ronm
ent
yes
22
Tiet
o ja
tiet
oisu
us
ympä
ristö
asio
ista
[In
Finn
ish:
Kno
wle
dge
and
awar
enes
s on
en
viro
nmen
tal i
ssue
s]
Lyyt
imäk
i Jar
i & B
erg,
An
nukk
a In
: Nie
mel
ä, J
., Fu
rman
, E.
, et a
l. (e
ds.).
Ihm
inen
ja
ym
päris
tö.
G
aude
amus
H
elsi
nki
2011
[In
pres
s]
no
23
Využ
itie
agro
-en
viro
nmen
táln
ych
ukaz
ovat
eľov
v p
oliti
ckom
pr
oces
e / U
tiliz
atio
n of
agr
i-en
viro
nmen
tal i
ndic
ator
s in
th
e po
litic
al p
roce
ss
VÁLK
OVC
OVÁ
-BA
RÁN
KOVÁ
, Zuz
ana
Pr
ocee
ding
from
co
nfer
ence
: Ven
kovs
ká
kraj
ina
2010
/ R
ural
la
ndsc
ape
2010
Če
ská
spol
ečno
st
pro
kraj
inno
u ek
ológ
ii
Brno
20
10
232-
237
no

35
24
Thin
k Pi
ece:
Dra
win
g on
–
‘Sav
ing
the
hum
an p
roje
ct:
Res
ilient
Par
ticip
atio
n’. A
ne
w b
ook
forth
com
ing
from
Si
mon
Bel
l and
Ste
phen
M
orse
: Ear
thsc
an S
prin
g 20
12
Bell,
S. a
nd M
orse
S.
ISD
RC
New
slet
ter
July
201
1 C
olum
bia
Uni
vers
ity
USA
20
11
100s
yes
25
Eval
uatio
n of
sus
tain
able
de
velo
pmen
t stra
tegi
es: A
ne
ed fo
r mor
e tim
ely
indi
cato
rs
Lyyt
imäk
i, Ja
ri En
viro
nmen
tal P
olic
y an
d G
over
nanc
e (S
ubm
itted
for r
evie
w)
W
iley
no
26
Beyo
nd in
dica
tor i
ndus
try:
Use
and
pot
entia
l in
fluen
ces
of s
usta
inab
le
deve
lopm
ent i
ndic
ator
s in
na
tiona
l and
EU
leve
l
Rin
ne, J
anne
&
Lyyt
imäk
i, Ja
ri &
Kaut
to,
Petru
s
Subm
issi
on to
Pro
gres
s in
Indu
stria
l Eco
logy
Inde
rsci
ence
27
Indi
cato
rs in
EU
-leve
l Im
pact
ass
essm
ents
[te
ntat
ive]
Assm
uth,
Tim
o &
Baul
er,
Tom
& F
rede
rikse
n, P
ia
& Ka
utto
, Pet
rus
& La
rsen
, Lar
s Eg
e &
Lyyt
imäk
i, Ja
ri
Man
uscr
ipt t
o be
su
bmitt
ed.
no
Sp
ecia
l iss
ue ti
tles
28
Polic
y us
e an
d in
fluen
ce o
f in
dica
tors
Fr
eder
ikse
n et
al.
(edi
toria
l) M
anus
crip
t to
be
subm
itted
to E
colo
gica
l In
dica
tors
.
El
sevi
er
no
29
From
sus
tain
abilit
y to
wel
l-be
ing:
Les
sons
lear
ned
from
the
use
of s
usta
inab
le
deve
lopm
ent i
ndic
ator
s in
na
tiona
l and
EU
leve
l
Rin
ne, J
anne
&
Lyyt
imäk
i, Ja
ri &
Kaut
to,
Petru
s
Man
uscr
ipt t
o be
su
bmitt
ed to
Eco
logi
cal
Indi
cato
rs.
El
sevi
er
no
30
Som
e us
e - l
ittle
influ
ence
. O
n us
e an
d in
fluen
ce o
f in
dica
tors
in E
urop
ean
sust
aina
ble
trans
port
Polic
y’
Gud
mun
dsso
n og
Sø
rens
en
Man
uscr
ipt t
o be
su
bmitt
ed to
Eco
logi
cal
Indi
cato
rs.
El
sevi
er
no
36
31
Expl
orin
g th
e ro
le o
f in
dica
tors
in D
anis
h po
licy
on th
e aq
uatic
env
ironm
ent
Fred
erik
sen,
P.
Man
uscr
ipt t
o be
su
bmitt
ed to
Eco
logi
cal
Indi
cato
rs.
El
sevi
er
no
32
Envi
ronm
enta
l ind
icat
ors
in
agro
envi
ronm
enta
l pol
icy
in
Slov
akia
.
Izak
ovic
ova,
Bar
anko
va
Man
uscr
ipt t
o be
su
bmitt
ed to
Eco
logi
cal
Indi
cato
rs.
El
sevi
er
no
33
The
gove
rnan
ce o
f in
dica
tors
: the
sig
nific
ance
of
com
posi
te in
dica
tors
for
polic
y m
akin
g at
the
EU-
leve
l
Baul
er &
Séb
astie
n M
anus
crip
t to
be
subm
itted
to E
colo
gica
l In
dica
tors
.
El
sevi
er
no
34
Gro
up T
hink
: hel
ping
pol
icy
mak
ers
get t
he m
ost o
ut o
f in
dica
tors
Bell
& M
orse
M
anus
crip
t to
be
subm
itted
to E
colo
gica
l In
dica
tors
.
El
sevi
er
no
35
UK
Ener
gy S
ecto
r In
dica
tors
- a
tool
for
evid
ence
-bas
ed p
olic
y in
th
e se
rvic
e of
sus
tain
able
de
velo
pmen
t?
Leht
onen
, Mar
kku
Man
uscr
ipt t
o be
su
bmitt
ed to
Eco
logi
cal
Indi
cato
rs.
El
sevi
er
no
36
Asse
ssin
g th
e us
e &
influ
ence
of s
usta
inab
ility
indi
cato
rs a
t the
Eur
opea
n pe
riphe
ry
Sim
on B
ell,
Loui
s F
Cas
sar,
Elis
abet
h C
onra
d, S
teph
en M
orse
Man
uscr
ipt t
o be
su
bmitt
ed to
Eco
logi
cal
Indi
cato
rs.
El
sevi
er
no
Sc
ient
ific
deliv
erab
les
from
PO
INT
(EU
FP7
Cont
ract
nb
2171
07)
37
Proc
ess
and
resu
lts o
f an
alyt
ical
fram
ewor
k an
d ty
polo
gy d
evel
opm
ent f
or
POIN
T. D
eliv
erab
le D
5.
Hen
rik G
udm
unds
son,
M
arkk
u Le
hton
en, L
éa
Seba
stié
n, T
om B
aule
r, St
ephe
n M
orse
D
eliv
erab
le 5
ww
w.p
oint
-eu
fp7.
inf
o
2009
ww
w.p
oint
- eufp
7.in
fo
yes
37
38
Rep
ort o
n th
e us
e an
d in
fluen
ce o
f SD
Is in
Fi
nlan
d, M
alta
, Slo
vaki
a an
d th
e Eu
rope
an U
nion
su
stai
nabl
e de
velo
pmen
t st
rate
gy. D
eliv
erab
le D
8.
Jari
Lyyt
imäk
i (ed
), D
anie
la B
abic
ová,
Zu
zana
Bar
ánko
vá,
Rob
ert C
arua
na, L
ouis
C
assa
r, El
isab
eth
Con
rad,
Zita
Iz
akov
icov
a, M
ilena
M
oyze
ová,
Pet
rus
Kaut
to, J
anne
Rin
ne,
Arto
Tia
inen
D
eliv
erab
le 8
ww
w.p
oint
-eu
fp7.
inf
o
2010
ww
w.p
oint
- eufp
7.in
fo
yes
39
Rep
ort c
over
ing
the
findi
ngs
of th
e w
orks
hops
T6
.1 to
T6.
7
Step
hen
Mor
sen
and
Sim
on B
ell
D
eliv
erab
le 9
ww
w.p
oint
-eu
fp7.
inf
o
2010
ww
w.p
oint
- eufp
7.in
fo
yes
40
Influ
ence
of i
ndic
ator
s fo
r po
licy
deve
lopm
ent i
n Ag
rienv
ironm
enta
l Pr
ogra
mm
es in
the
Slov
ak
Rep
ublic
Zuza
na B
arán
ková
, !L
'ubo
š H
alad
a, Z
ita
Izak
ovic
"ová
and
Ba
rbor
a Ša
talo
vá
D
eliv
erab
le 1
0a
w
ww
.poi
nt-
eufp
7.i
nfo
2011
ww
w.p
oint
- eufp
7.in
fo
yes
41
Use
and
influ
ence
of
indi
cato
rs fo
r agr
i-en
viro
nmen
tal p
olic
ies
in
Den
mar
k
Pia
Fred
erik
sen
and
Lars
Eg
e La
rsen
Del
iver
able
10b
ww
w.p
oint
-eu
fp7.
inf
o
2011
ww
w.p
oint
- eufp
7.in
fo
yes
42
The
role
of i
ndic
ator
s in
UK
ener
gy p
olic
y M
arkk
u Le
hton
en
D
eliv
erab
le 1
1
ww
w.p
oint
-eu
fp7.
inf
o
2011
ww
w.p
oint
- eufp
7.in
fo
yes
43
The
role
of i
ndic
ator
s in
Eu
rope
an s
usta
inab
le
trans
port
polic
y
Hen
rik G
udm
unds
son
and
Cla
us H
edeg
aard
Sø
rens
en
D
eliv
erab
le 1
2
ww
w.p
oint
-eu
fp7.
inf
o
2011
ww
w.p
oint
- eufp
7.in
fo
yes
44
A sy
nthe
sis
of th
e fin
ding
s of
the
POIN
T pr
ojec
t Si
mon
Bel
l, Ke
n Ea
son
and
Pia
Fred
erik
sen
(eds
) et a
l.
D
eliv
erab
le 1
5
ww
w.p
oint
-eu
fp7.
inf
o
2011
ww
w.p
oint
- eufp
7.in
fo
yes
38
te
mpl
ate
A2: l
ist o
f dis
sem
inat
ion
activ
ities
N
O.
Type
of
activ
ities
[1]
Mai
n le
ader
Ti
tle
Dat
e
Plac
e
Type
of
audi
ence
[2]
Size
of
audi
enc
e
Cou
ntrie
s ad
dres
sed
1 Po
ster
Fr
eder
ikse
n, P
. In
tern
atio
nal E
nviro
nmen
tal
Con
fere
nce:
Sci
ence
for t
he
Envi
ronm
ent
Acce
pted
for
pres
enta
tion
Oct
ober
6t
h 20
11
Aarh
us
Scie
ntifi
c co
mm
unity
, po
licy
mak
ers
?
Inte
rnat
iona
l
2
Con
fere
nce
Baul
er, T
om &
Sé
bast
ien,
Léa
Eu
rope
an s
ocie
ty fo
r ec
olog
ical
eco
nom
ics,
201
120
11
Ista
nbul
, Bos
phor
us u
nive
rsity
Sc
ient
ific
com
mun
ity
40
inte
rnat
iona
l3
Con
fere
nce
Leht
onen
, M.
IPA
2011
, 6th
Inte
rpre
tive
Polic
y An
alys
is C
onfe
renc
e 24
-jun-
11
Car
diff,
UK
Scie
ntifi
c co
mm
unity
15
4 C
onfe
renc
e Le
hton
en, M
. Eu
rope
an S
ocie
ty fo
r Ec
olog
ical
Eco
nom
ics
(ESE
E) c
onfe
renc
e
17-ju
n-11
Is
tanb
ul
Scie
ntifi
c co
mm
unity
15
In
tern
atio
nal
5
Pres
enta
tion
Fred
erik
sen,
P.
Nor
dic
Envi
ronm
enta
l So
cial
Sci
ence
Con
fere
nce
June
14
– 16
, 201
1 St
ockh
olm
Sc
ient
ific
com
mun
ity
17
Inte
rnat
iona
l
6 C
onfe
renc
e Sø
rens
en, C
. H
. &
Gud
mun
dsso
n,
H.
Nor
dic
Envi
ronm
enta
l So
cial
Sci
ence
Con
fere
nce
June
14
– 16
, 201
1 St
ockh
olm
Sc
ient
ific
com
mun
ity
17
Inte
rnat
iona
l
7 C
onfe
renc
e R
inne
J.,
Lyyt
imäk
i J.,
Kaut
to P
. (2
011)
.
Tren
ds a
nd F
utur
e of
Su
stai
nabl
e D
evel
opm
ent
9 Ju
ne 2
011
Tam
pere
, Fin
land
Sc
ient
ific
com
mun
ity
Inte
rnat
iona
l
8 C
onfe
renc
e Le
hton
en, M
. Tr
ends
and
Fut
ure
of
Sust
aina
ble
Dev
elop
men
t 08
-jun-
11
Tam
pere
, Fin
land
Sc
ient
ific
com
mun
ity
15
Inte
rnat
iona
l

39
9 C
onfe
renc
e Be
ll, S
. &
Mor
se S
. In
tern
atio
nal S
usta
inab
le
Dev
elop
men
t Res
earc
h C
onfe
renc
e
8th
to 1
0th
May
201
1 C
olum
bia
Uni
vers
ity, N
ew Y
ork,
USA
hi
gher
ed
ucat
ion,
R
esea
rch)
, In
dust
ry, C
ivil
Soci
ety,
Po
licy
mak
ers,
350
to 4
00
Inte
rnat
iona
l
10
Post
er,
Fred
erik
sen,
P.
ESTA
T: C
onfe
renc
e on
"S
tatis
tics
for p
olic
ymak
ing:
Eu
rope
202
0"
10-1
1-03
-201
1 Br
uxel
les
polic
y-m
aker
s 20
0
Inte
rnat
iona
l
11
Dra
ft sy
nthe
sis
Bell,
Eas
on
and
Fred
erik
sen
ESTA
T: C
onfe
renc
e on
"S
tatis
tics
for p
olic
ymak
ing:
Eu
rope
202
0"
10-1
1-03
-201
1 Br
uxel
les
polic
y m
aker
s 20
0
Inte
rnat
iona
l
12
Con
fere
nce,
pu
blic
atio
n Fr
eder
ikse
n, P
. EU
RO
STAT
EPR
OS
Wor
king
Gro
up m
eetin
g
24 F
ebru
ary
2011
Br
uxel
les
Stat
istic
ians
50
In
tern
atio
nal
13
Con
fere
nce
Séba
stie
n, L
. &
Baul
er T
. N
TTS,
201
1
24 F
ebru
ary
2011
Brus
sels
, Cha
rlem
agne
bui
ldin
g
Scei
ntifi
c co
mm
unity
, po
licy
mak
ers
50
euro
pean
14
C
onfe
renc
e R
inne
J.
New
Tec
hniq
ues
and
Tech
nolo
gies
for S
tatis
tics,
N
TTS
2011
con
fere
nce
24 F
ebru
ary
2011
Br
usse
ls, C
harle
mag
ne b
uild
ing
Scie
ntifi
c co
mm
unity
, Po
licy
mak
ers
50
Inte
rnat
iona
l
15
Pres
enta
tion
Søre
nsen
, C.
H. &
G
udm
unds
son,
H
.
Tran
spor
tforu
m
12. J
anua
ry 2
011
Link
öpin
g, S
wed
en
Scie
ntifi
c co
mm
unity
an
d po
licy
mak
ers
16
Con
fere
nce
Leht
onen
, M.
Col
loqu
e In
tern
atio
nal:
"Les
In
stru
men
ts d
'Act
ion
Publ
ique
- m
ise
en
disc
ussi
on T
heor
ique
"
07-ja
n-11
Pa
ris
Scie
ntifi
c co
mm
unity
25
Inte
rnat
iona
l
17
Con
fere
nce
Baul
er, T
om
Berli
n fo
rum
on
inno
vatio
n in
gov
erna
nce
2010
Be
rlin,
Hum
bold
t Uni
vers
ität
Scie
ntifi
c co
mm
unity
45
In
tern
atio
nal

40
18
Con
fere
nce
Baul
er, T
om &
Sé
bast
ien,
Léa
In
tern
atio
nal s
ocie
ty fo
r ec
olog
ical
eco
nom
ics,
201
020
10
Old
enbu
rg, G
erm
any
Scie
ntifi
c co
mm
unity
45
in
tern
atio
nal
19
Con
fere
nce
Baul
er, T
om
Berli
n co
nfer
ence
on
Hum
an d
imen
sion
s of
gl
obal
env
ironm
enta
l ch
ange
20
10
Berli
n, F
reie
Uni
vers
ität
Scie
ntifi
c co
mm
unity
65
in
tern
atio
nal
20
Artic
le
publ
ishe
d in
po
pula
r pr
ess
Lyyt
imäk
i Jar
i &
Mat
tila
Tuom
as
Suom
i vai
Isla
nti?
Ym
päris
tön
mal
limaa
. 20
10
Ympä
ristö
24(
4): 8
-9
Civ
il so
ciet
y
Finl
and
21
Pres
enta
tion
Gud
mun
dsso
n H
. IS
A W
orld
Con
gres
s of
So
ciol
ogy
11-1
7 Ju
ly, 2
010
Got
henb
urg
Scie
ntifi
c co
mm
unity
Inte
rnat
iona
l
22
Pres
enta
tion
Izak
ovičo
vá
Wor
ksho
p. T
ypys
atio
n of
th
e Sl
ovak
land
scap
e,
4. –
5. o
ctob
er 2
010
Smol
enic
e, S
lova
kia
Scie
ntifi
c co
mm
unity
83
23
Wor
ksho
p G
udm
unds
son,
H
. 1s
t Ext
erna
l Sta
keho
lder
W
orks
hop,
UIC
Dec
lara
tion
and
Rep
ortin
g
14. –
15.
Oct
ober
20
10
Pot
sdam
Sc
ient
ific
com
mun
ity
Inte
rnat
iona
l
24
Pres
enta
tion
Bará
nkov
á;
Šata
lová
VI
II. n
árod
ná k
onfe
renc
ia o
bi
osfé
rický
ch re
zerv
áciá
ch
Slov
ensk
a / V
III. N
atio
nal
Con
fere
nce
on B
iosp
here
re
serv
es o
f Slo
vaki
a
19.1
0.20
10
Zvol
en, S
lova
kia
Scie
ntifi
c co
mm
unity
45
25
Lect
ures
Se
bast
ien,
L.
Uni
vers
ity o
f Tou
lous
e II
Oct
ober
201
0 To
ulou
se, F
ranc
e M
aste
r st
uden
ts
50
Fran
ce
26
Con
fere
nce
Bell,
S. &
M
orse
S.
Ope
ratio
nal R
esea
rch
Soci
ety
conf
eren
ce (O
R52
) 7t
h to
9th
Sep
tem
ber
2010
R
oyal
Hol
low
ay, U
nive
rsity
of L
ondo
n (E
gham
UK)
hi
gher
ed
ucat
ion,
R
esea
rch)
, In
dust
ry, C
ivil
Soci
ety,
Po
licy
500
Inte
rnat
iona
l

41
mak
ers,
27
Con
fere
nce
Seba
stie
n, L
. In
tern
atio
nal S
ocie
ty fo
r Ec
olog
ical
Eco
nom
ics
(ISEE
) Au
gust
201
0 O
lden
burg
, Ger
man
y Sc
ient
ific
com
mun
ity
100
Inte
rnat
iona
l
28
Con
fere
nce
Bell,
S. &
M
orse
S.
Inte
rnat
iona
l Sys
tem
s Sc
ienc
e So
ciet
y co
nfer
ence
18th
to 2
3rd
July
201
0W
ilfrid
Lau
rier U
nive
rsity
, Wat
erlo
o. C
anad
a hi
gher
ed
cuat
ion,
re
sear
ch, c
ivil
soci
ety
500
Inte
rnat
iona
l
29
Podc
ast
Bell,
S.
Mea
surin
g th
e Im
mea
sura
ble
Ju
ly 2
010
I Tun
es
high
er
educ
atio
n,
Res
earc
h),
Indu
stry
, Civ
il So
ciet
y,
Polic
y m
aker
s,
1000
s
Inte
rnat
iona
l
30
Con
fere
nce
Bell,
S. &
M
orse
S.
Inte
rnat
iona
l Sus
tain
able
D
evel
opm
ent R
esea
rch
Con
fere
nce
30th
May
to 1
st J
une
2010
H
ong
Kong
hi
gher
ed
ucat
ion,
R
esea
rch)
, In
dust
ry, C
ivil
Soci
ety,
Po
licy
mak
ers,
350
to 4
00
Inte
rnat
iona
l
31
Pres
enta
tion
Bará
nkov
á C
onfe
renc
e Ve
nkov
ská
kraj
ina
2010
/ R
ural
la
ndsc
ape
2010
20.-2
3.5.
2010
H
ostě
tín (Č
eská
repu
blik
a) /C
zech
Rep
ublic
Sc
ient
ific
com
mun
ity
65
32
Pres
enta
tion
Fred
erik
sen,
P.
Adm
inis
trativ
e in
-ser
vice
tra
inin
g fo
r uni
vers
ity
empl
oyee
s
26-0
4-20
10
Den
mar
k Ad
min
istra
tors
of
EU
pro
ject
s20
D
enm
ark
33
Pres
enta
tion
Bará
nkov
á O
ECD
Wor
ksho
p: A
gri-
envi
ronm
enta
l ind
icat
ors:
le
sson
s le
arne
d an
d fu
ture
di
rect
ions
23.-2
6.3.
2010
Le
ysin
, Šva
jčiar
sko
Scie
ntifi
c co
mm
unity
5 0
Inte
rnat
iona
l
42
34
Artic
le
publ
ishe
d in
po
pula
r pr
ess
Fred
erik
sen,
P.
SCO
OP
New
slet
ter
sprin
g 20
10
UK
polic
y m
aker
s,
med
ia
?
Inte
rnat
iona
l
35
Lect
ures
Se
bast
ien,
L.
Uni
vers
ity o
f Bru
ssel
s Fe
brur
ay 2
010
Brus
sels
, Bel
gium
M
aste
r st
uden
ts
50
Belg
ium
36
Artic
le
publ
ishe
d in
po
pula
r pr
ess
Tiai
nen
Arto
(2
009)
. Va
ikut
tava
tko
indi
kaat
torit
pä
ätök
siin
? 20
09
Ympä
ristö
23(
6)
Civ
il so
ciet
y
Finl
and
37
Pres
enta
tion
Izak
ovičo
vá
Com
unal
wor
ksho
p 06
-11-
2009
Zv
ončín
, Slo
vaki
a Sc
ient
ific
com
mun
ity
and
polic
y m
aker
s
70
Slov
akia
38
Pres
enta
tion
Borg
en
Søre
nsen
, Kje
r an
d Fr
eder
ikse
n
PEER
dire
ctor
s m
eetin
g 01
-11-
2009
PEER
di
rect
ors
10
Inte
rnat
iona
l
39
Pres
enta
tion
Gud
mun
dsso
n H
. 9t
h N
ordi
c En
viro
nmen
tal
Soci
al S
cien
ces
conf
eren
ce
(NES
S)
10-1
2 Ju
ne, 2
009
Lond
on
Scie
ntifi
c co
mm
unity
2o
Inte
rnat
iona
l
40
Pres
enta
tion
Gud
mun
dsso
n H
. “T
rans
port
Know
ledg
e an
d Pl
anni
ng P
ract
ice:
Lin
king
Ac
adem
ia a
nd P
ract
ice”
, se
min
ar
14-1
6 O
ctob
er 2
009
Amst
erda
m
Scie
ntifi
c co
mm
unity
an
d po
licy
mak
ers
Inte
rnat
iona
l
41
Pres
enta
tion
Válk
ovco
vá,
Izak
ovičo
vá
15th
inte
rnat
iona
l Sy
mpo
sium
on
Prob
lem
s of
La
ndsc
ape
Ecol
ogic
al
Res
earc
h
29. 9
. – 2
. 10.
200
9 Br
atis
lava
, Slo
vaki
a Sc
ient
ific
com
mun
ity
125
Inte
rnat
iona
l
42
Con
fere
nce
Bell,
S. &
M
orse
S.
Inte
rnat
iona
l Sus
tain
able
D
evel
opm
ent R
esea
rch
Con
fere
nce
5th
to 8
th J
uly
2009
U
trech
t hi
gher
ed
ucat
ion,
R
esea
rch)
, In
dust
ry, C
ivil
Soci
ety,
Po
licy
mak
ers,
350
to 4
00
Inte
rnat
iona
l
43
43
Publ
icat
ion
Tiai
nen,
Arto
In
dika
atto
rit k
estä
vän
kehi
tyks
en s
trate
gian
ar
vioi
nnin
väl
inee
nä. [
In
Finn
ish]
Wor
king
repo
rt.
2009
Finn
ish
Envi
ronm
ent I
nstit
ute,
Hel
sink
i. ht
tp://
ww
w.y
mpa
risto
.fi/d
ownl
oad.
asp?
cont
ent
id=1
1085
2&la
n=fi
Scie
ntifi
c co
mm
unity
, Po
licy
mak
ers
Finl
and
44
Pres
enta
tion
Fred
erik
sen,
P.
EUR
OST
AT E
PRO
S W
orki
ng G
roup
mee
ting
04
-06-
2008
Lu
xem
bour
g St
atis
ticia
ns
100
Inte
rnat
iona
l
45
New
slet
ter
Fred
erik
sen,
P.
FØN
IX, N
ovem
ber 2
008
DM
U n
ewsl
ette
r 13
-11-
2008
D
enm
ark
Scie
ntifi
c an
d ad
min
istra
tive
staf
f
400
Den
mar
k
44
2.2 Exploitable Foreground and plans for exploitation (Section B) Part B1: Not relevant Part B2: Not relevant • Purpose of further exploitation of foreground
o The purpose is foremost to disseminate the project results, and by doing this, seeking ways to improve research and practise in indicator use.
• How the foreground might be exploited, when and by whom o The ESTATS have continuously shown interest in the project and results will be
presented for indicator users and policy makers when feasible • IPR exploitable measures taken or intended
• Contact was taken to a number of journals for publication of a special issue based on POINT research. An agreement was made with ‘Ecological Indicators’ and a time schedule to finalise the review process by the end of 2011 was agreed. 9 titles have been proposed by partners, listed in the table A1 above.
• A number of papers that have been submitted are awaiting publication, as illustrated in tables.
• The project coordinator have been invited to present POINT results at a planned Seminar on 'Evidence and decision-making for policy purposes', arranged by EIPA-Eurostat, January 2012.
• It is intended to seek ways to continue collaboration within the consortium. Activities suggested have concerned educational activities at a European level (such as through Marie Curie), as well as issue development, maybe through COST or ESF opportunities.
• Further research necessary, if any We wish to highlight some topics for further research beyond POINT that we find particularly pertinent to pursue. The topics are listed below in a short form, but are based on the insights and discussions reported in the project deliverables:
1. Many indicator programs are designed as if policy governance always proceeds along a predictable, rational sequence with a clear role for structured information. The role of indicators in different types of governance processes would deserve much more attention. Relevant research questions include the following: what roles do indicators play in a multi-actor governance context, and how do inclusive processes of indicator selection and interpretation affect policy processes? How are indicators used by different actors at different levels of governance and which roles do indicators and indicator frameworks play in multi-level governance?
2. Policy assessments often seek to provide unitary and prescriptive policy advice, aiming to justify a clear, authoritative, and prescriptive recommendation to inform decisions. In such an approach, only one or a small sub-set of possible courses of action or technology choices is highlighted – options which appear as preferable under the prevailing framing conditions – and the underlying assumptions and sensitivities are often not explored in any detail. Indicators are typically expected to help ‘close down’ policy situations by providing incontestable evidence and thereby facilitate decision-making. An alternative approach to assessment is to ‘open up’ existing policy discourses to alternative knowledge claims and discursive constructions of policy problems and solutions. Such ‘opening up’ could involve,

45
for example, the use of indicators to illustrate and describe diverging scenarios of future policies and societal pathways, thereby generating social learning through the confrontation of diverse equally justifiable perspectives.
3. The influence of indicators seems to depend much on what kind of policy need they are expected to serve, and which other tools and mechanisms they are combined with. It seems particularly pertinent to ask to what extent the influence of indicators is enhanced by their use in forward-looking processes of evaluation and foresight (e.g. ex ante evaluations and impact assessments, scenario-building exercises), as compared to backward-looking reporting. It will also be useful to seek further verify observations from some POINT case studies, that indicators may become more influential when being used to compare the outcomes of alternative policy options, rather than merely for illustrating overall trends. Opportunities to foster social learning and understanding through collaborative analysis by various groups of actors involved in indicator use/influence should be further explored. This would allow multiple perspectives to be included in the analysis of indicator use and would bring to discussion, for example, the trade-offs between technical rigour and organisational applicability. Participatory methods provide an essential complement to other, less interactive, methods of collecting insights such as the use of questionnaire-based surveys and interviews. However, the nature of the analytical outputs of any participatory-based analysis will be influenced by a wide range of factors including the mix of those engaged, their technical expertise, access to arenas of decision-making, experience, national/sectorial context as well as the group dynamics. These factors need particular attention when participatory processes are designed.
4. In order to better understand the causes for limited use and influence of indicators and to advance the possibilities to transfer indicator-use lessons form one context to another, case studies with more similarities than the ones used in POINT should be conducted: for example if and how exiting common sets of indicators are applied differently across different countries; (e.g. EU cases where then ’open method of coordination’ is applied); or how different sets of indicators used are across sectors or organisations within one country with a more uniform institutional system, as compared to looking across national boundaries.
5. In addition to the attempt to increase the comparability of indicator use and influence across different contexts through a “harmonisation” of the case study settings as proposed above in point 5, a complementary avenue would be to conduct more in-depth analysis of the actual processes through which indicators are being used and exert their influence in the various organisational setting in which the indicators are being used. This type of research could involve more intensive use than was possible within the POINT project of approaches involving various forms of participant observation and ethnographic research. Apart from helping to better understand the particular mechanisms through which indicators exert their influence in day-to-day practices of policymakers and stakeholders, this type of analysis would also be more suitable for exploring the various unintended and indirect effects of indicators.
6. The production of indicators for EU programmes is not always prioritised in national settings, which can be caused by a lack of understanding of the conceptual underpinnings of the indicator production (such as lack of clarity on what is understood by sustainable development) or indicators not making sense at local or regional levels. It should be investigated how indicators can be developed which are more adapted to the user needs at various geographical levels, from local to global. A related question concerns the conceptualisation of such indicators in integrated frameworks, which would embrace the

46
social, economic and environmental and development dimensions, while also being understood and relevant to national and local policy actors.
• Potential/expected impact (quantify where possible) Bringing the research agenda on the use of evidence in policy making one step further. Increased concern for the use of indicators in various contexts and phases of policy making among policy makers and stakeholders with which interactions have been carried out in the project period.

47
3. Report on societal implications Replies to the following questions will assist the Commission to obtain statistics and indicators on societal and socio-economic issues addressed by projects. The questions are arranged in a number of key themes. As well as producing certain statistics, the replies will also help identify those projects that have shown a real engagement with wider societal issues, and thereby identify interesting approaches to these issues and best practices. The replies for individual projects will not be made public.
A General Information (completed automatically when Grant Agreement number is entered.
Grant Agreement Number: 217207
Title of Project: Policy Influence of Indicators (POINT)
Name and Title of Coordinator: Pia Frederiksen
B Ethics
1. Did your project undergo an Ethics Review (and/or Screening)?
• If Yes: have you described the progress of compliance with the relevant Ethics
Review/Screening Requirements in the frame of the periodic/final project reports? Special Reminder: the progress of compliance with the Ethics Review/Screening Requirements should be described in the Period/Final Project Reports under the Section 3.2.2 'Work Progress and Achievements'
NO
2. Please indicate whether your project involved any of the following issues (tick box) :
NO
RESEARCH ON HUMANS • Did the project involve children? • Did the project involve patients? • Did the project involve persons not able to give consent? • Did the project involve adult healthy volunteers? • Did the project involve Human genetic material? • Did the project involve Human biological samples? • Did the project involve Human data collection?
RESEARCH ON HUMAN EMBRYO/FOETUS • Did the project involve Human Embryos? • Did the project involve Human Foetal Tissue / Cells? • Did the project involve Human Embryonic Stem Cells (hESCs)? • Did the project on human Embryonic Stem Cells involve cells in culture? • Did the project on human Embryonic Stem Cells involve the derivation of cells from Embryos?
PRIVACY • Did the project involve processing of genetic information or personal data (eg. health, sexual
lifestyle, ethnicity, political opinion, religious or philosophical conviction)?
• Did the project involve tracking the location or observation of people? RESEARCH ON ANIMALS
• Did the project involve research on animals?

48
• Were those animals transgenic small laboratory animals? • Were those animals transgenic farm animals? • Were those animals cloned farm animals? • Were those animals non-human primates?
RESEARCH INVOLVING DEVELOPING COUNTRIES • Did the project involve the use of local resources (genetic, animal, plant etc)? • Was the project of benefit to local community (capacity building, access to healthcare, education
etc)?
DUAL USE • Research having direct military use No
• Research having the potential for terrorist abuse No
C Workforce Statistics
3. Workforce statistics for the project: Please indicate in the table below the number of people who worked on the project (on a headcount basis).
Type of Position Number of Women Number of Men
Scientific Coordinator 1
Work package leaders 2 5 Experienced researchers (i.e. PhD holders) 7 12 PhD Students 0 0 Other 2 4
4. How many additional researchers (in companies and universities) were recruited specifically for this project?
0
Of which, indicate the number of men:

49
D Gender Aspects 5. Did you carry out specific Gender Equality Actions under the project?
" x
Yes No
6. Which of the following actions did you carry out and how effective were they? Not at all
effective Very
effective
# Design and implement an equal opportunity policy " " " " " # Set targets to achieve a gender balance in the workforce " " " " " # Organise conferences and workshops on gender " " " " " # Actions to improve work-life balance " " " " " " Other:
7. Was there a gender dimension associated with the research content – i.e. wherever people were the focus of the research as, for example, consumers, users, patients or in trials, was the issue of gender considered and addressed?
" Yes- please specify
x No
E Synergies with Science Education
8. Did your project involve working with students and/or school pupils (e.g. open days, participation in science festivals and events, prizes/competitions or joint projects)?
x Yes- please specify
" No
9. Did the project generate any science education material (e.g. kits, websites, explanatory booklets, DVDs)?
x Yes- please specify
" No
F Interdisciplinarity
10. Which disciplines (see list below) are involved in your project? x Main discipline2: 5.4
x Associated discipline2: 1.4 x Associated discipline2: 5.3
G Engaging with Civil society and policy makers
11a Did your project engage with societal actors beyond the research community? (if 'No', go to Question 14)
X Yes No
11b If yes, did you engage with citizens (citizens' panels / juries) or organised civil society (NGOs, patients' groups etc.)?
" No
2 Insert number from list below (Frascati Manual).
Pod-cast
Using point material in lectures

50
" Yes- in determining what research should be performed x Yes - in implementing the research " Yes, in communicating /disseminating / using the results of the project
11c In doing so, did your project involve actors whose role is mainly to organise the dialogue with citizens and organised civil society (e.g. professional mediator; communication company, science museums)?
" x
Yes No
12. Did you engage with government / public bodies or policy makers (including international organisations)
" No x Yes- in framing the research agenda: EEA, ESTAT and Finnish Environmental Councillor to the
Environmental Minister participated in advisory panel
x Yes - in implementing the research agenda, during interviews and stakeholder conferences, as well as during WP6 workshops
x Yes, in communicating /disseminating / using the results of the project – e.g Podcast, and SCOOP article
13a Will the project generate outputs (expertise or scientific advice) which could be used by policy makers?
" Yes – as a primary objective (please indicate areas below- multiple answers possible) x Yes – as a secondary objective (please indicate areas below - multiple answer possible)
" No
13b If Yes, in which fields? In all fields as many policy areas are monitored and evaluated using indicators
Agriculture Audiovisual and Media Budget Competition Consumers Culture Customs Development Economic and Monetary Affairs Education, Training, Youth Employment and Social Affairs
Energy Enlargement Enterprise Environment External Relations External Trade Fisheries and Maritime Affairs Food Safety Foreign and Security Policy Fraud Humanitarian aid
Human rights Information Society Institutional affairs Internal Market Justice, freedom and security Public Health Regional Policy Research and Innovation Space Taxation Transport

51
13c If Yes, at which level? X Local / regional levels
X National level
X European level
X International level
H Use and dissemination
14. How many Articles were published/accepted for publication in peer-reviewed journals?
15
To how many of these is open access3 provided? 1
How many of these are published in open access journals? 0
How many of these are published in open repositories? 1
To how many of these is open access not provided? 12
Please check all applicable reasons for not providing open access:
x publisher's licensing agreement would not permit publishing in a repository # no suitable repository available # no suitable open access journal available # no funds available to publish in an open access journal x lack of time and resources # lack of information on open access # other4: ……………
15. How many new patent applications (‘priority filings’) have been made? ("Technologically unique": multiple applications for the same invention in different jurisdictions should be counted as just one application of grant).
Not relevant
Trademark Not relevant
Registered design Not relevant
16. Indicate how many of the following Intellectual Property Rights were applied for (give number in each box).
Other Not relevant
17. How many spin-off companies were created / are planned as a direct result of the project?
None
Indicate the approximate number of additional jobs in these companies:
18. Please indicate whether your project has a potential impact on employment, in comparison with the situation before your project:
# Increase in employment, or # In small & medium-sized enterprises # Safeguard employment, or # In large companies
3 Open Access is defined as free of charge access for anyone via Internet. 4 For instance: classification for security project.

52
# Decrease in employment, X None of the above / not relevant to the project # Difficult to estimate / not possible to quantify
19. For your project partnership please estimate the employment effect resulting directly from your participation in Full Time Equivalent (FTE = one person working fulltime for a year) jobs:
Difficult to estimate / not possible to quantify
Indicate figure: #
I Media and Communication to the general public
20. As part of the project, were any of the beneficiaries professionals in communication or media relations?
X Yes, one " No
21. As part of the project, have any beneficiaries received professional media / communication training / advice to improve communication with the general public?
" Yes X No
22 Which of the following have been used to communicate information about your project to the general public, or have resulted from your project?
# Press Release x Coverage in specialist press # Media briefing # Coverage in general (non-specialist) press # TV coverage / report # Coverage in national press # Radio coverage / report # Coverage in international press x Brochures /posters / flyers # Website for the general public / internet x DVD /Film /Multimedia podcast # Event targeting general public (festival, conference,
exhibition, science café)
23 In which languages are the information products for the general public produced?
# Language of the coordinator X English # Other language(s)
Question F-10: Classification of Scientific Disciplines according to the Frascati Manual 2002 (Proposed Standard Practice for Surveys on Research and Experimental Development, OECD 2002): FIELDS OF SCIENCE AND TECHNOLOGY 1. NATURAL SCIENCES 1.1 Mathematics and computer sciences [mathematics and other allied fields: computer sciences and other
allied subjects (software development only; hardware development should be classified in the engineering fields)]
1.2 Physical sciences (astronomy and space sciences, physics and other allied subjects) 1.3 Chemical sciences (chemistry, other allied subjects) 1.4 Earth and related environmental sciences (geology, geophysics, mineralogy, physical geography and
other geosciences, meteorology and other atmospheric sciences including climatic research, oceanography, vulcanology, palaeoecology, other allied sciences)
1.5 Biological sciences (biology, botany, bacteriology, microbiology, zoology, entomology, genetics, biochemistry, biophysics, other allied sciences, excluding clinical and veterinary sciences)

53
2 ENGINEERING AND TECHNOLOGY 2.1 Civil engineering (architecture engineering, building science and engineering, construction engineering,
municipal and structural engineering and other allied subjects) 2.2 Electrical engineering, electronics [electrical engineering, electronics, communication engineering and
systems, computer engineering (hardware only) and other allied subjects] 2.3. Other engineering sciences (such as chemical, aeronautical and space, mechanical, metallurgical and
materials engineering, and their specialised subdivisions; forest products; applied sciences such as geodesy, industrial chemistry, etc.; the science and technology of food production; specialised technologies of interdisciplinary fields, e.g. systems analysis, metallurgy, mining, textile technology and other applied subjects)
3. MEDICAL SCIENCES 3.1 Basic medicine (anatomy, cytology, physiology, genetics, pharmacy, pharmacology, toxicology,
immunology and immunohaematology, clinical chemistry, clinical microbiology, pathology) 3.2 Clinical medicine (anaesthesiology, paediatrics, obstetrics and gynaecology, internal medicine, surgery,
dentistry, neurology, psychiatry, radiology, therapeutics, otorhinolaryngology, ophthalmology) 3.3 Health sciences (public health services, social medicine, hygiene, nursing, epidemiology) 4. AGRICULTURAL SCIENCES 4.1 Agriculture, forestry, fisheries and allied sciences (agronomy, animal husbandry, fisheries, forestry,
horticulture, other allied subjects) 4.2 Veterinary medicine 5. SOCIAL SCIENCES 5.1 Psychology 5.2 Economics 5.3 Educational sciences (education and training and other allied subjects) 5.4 Other social sciences [anthropology (social and cultural) and ethnology, demography, geography
(human, economic and social), town and country planning, management, law, linguistics, political sciences, sociology, organisation and methods, miscellaneous social sciences and interdisciplinary , methodological and historical S1T activities relating to subjects in this group. Physical anthropology, physical geography and psychophysiology should normally be classified with the natural sciences].
6. HUMANITIES 6.1 History (history, prehistory and history, together with auxiliary historical disciplines such as
archaeology, numismatics, palaeography, genealogy, etc.) 6.2 Languages and literature (ancient and modern) 6.3 Other humanities [philosophy (including the history of science and technology) arts, history of art, art
criticism, painting, sculpture, musicology, dramatic art excluding artistic "research" of any kind, religion, theology, other fields and subjects pertaining to the humanities, methodological, historical and other S1T activities relating to the subjects in this group]