Embed Size (px)
Citation preview

Deutsches Zentrum für Luft- und Raumfahrt e.V. (DLR) Institute of Space Systems | Robert-Hooke-Str. 7 | 28359 Bremen | Germany
Conrad Zeidler Telephone +49 421 24420-1196 | Telefax +49 421 24420-1150 [email protected] | www.DLR.de
Final Report
Vertical Farm 2.0
Designing an Economically Feasible Vertical Farm – A combined European
Endeavor for Sustainable Urban Agriculture
Date: 18.11. -20.11.2015

Vertical Farming 2.0 - Designing an Economically Feasible Vertical Farm – A combined European Endeavor for Sustainable Urban Agriculture
Page: 2
0
HAS hogeschool
Heliospectra
Architecture & Food
Participating companies and institutions:
Deutsches Zentrum für Luft- und Raumfahrt
Association for Vertical Farming
Certhon
Rijk Zwaan
Blue Planet Environmental
Dreyfus Farms
Vertical Farming 2.0 - Designing an Economically Feasible Vertical Farm – A combined European Endeavor for Sustainable Urban Agriculture
Page: 3
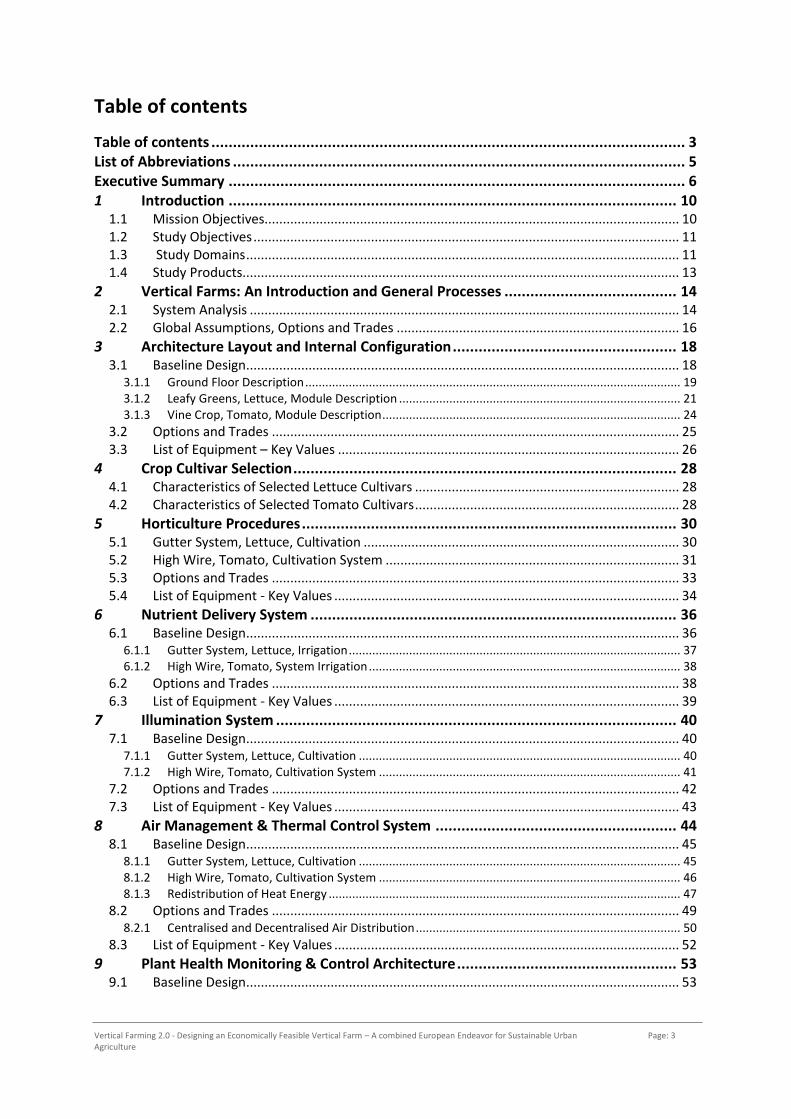
Table of contents
Table of contents .............................................................................................................. 3
List of Abbreviations ......................................................................................................... 5
Executive Summary .......................................................................................................... 6
1 Introduction ........................................................................................................ 10 1.1 Mission Objectives................................................................................................................. 10 1.2 Study Objectives .................................................................................................................... 11 1.3 Study Domains ...................................................................................................................... 11 1.4 Study Products....................................................................................................................... 13
2 Vertical Farms: An Introduction and General Processes ........................................ 14 2.1 System Analysis ..................................................................................................................... 14 2.2 Global Assumptions, Options and Trades ............................................................................. 16
3 Architecture Layout and Internal Configuration .................................................... 18 3.1 Baseline Design ...................................................................................................................... 18
3.1.1 Ground Floor Description ................................................................................................................ 19 3.1.2 Leafy Greens, Lettuce, Module Description .................................................................................... 21 3.1.3 Vine Crop, Tomato, Module Description ......................................................................................... 24
3.2 Options and Trades ............................................................................................................... 25 3.3 List of Equipment – Key Values ............................................................................................. 26
4 Crop Cultivar Selection ......................................................................................... 28 4.1 Characteristics of Selected Lettuce Cultivars ........................................................................ 28 4.2 Characteristics of Selected Tomato Cultivars ........................................................................ 28
5 Horticulture Procedures ....................................................................................... 30 5.1 Gutter System, Lettuce, Cultivation ...................................................................................... 30 5.2 High Wire, Tomato, Cultivation System ................................................................................ 31 5.3 Options and Trades ............................................................................................................... 33 5.4 List of Equipment - Key Values .............................................................................................. 34
6 Nutrient Delivery System ..................................................................................... 36 6.1 Baseline Design ...................................................................................................................... 36
6.1.1 Gutter System, Lettuce, Irrigation ................................................................................................... 37 6.1.2 High Wire, Tomato, System Irrigation ............................................................................................. 38
6.2 Options and Trades ............................................................................................................... 38 6.3 List of Equipment - Key Values .............................................................................................. 39
7 Illumination System ............................................................................................. 40 7.1 Baseline Design ...................................................................................................................... 40
7.1.1 Gutter System, Lettuce, Cultivation ................................................................................................ 40 7.1.2 High Wire, Tomato, Cultivation System .......................................................................................... 41
7.2 Options and Trades ............................................................................................................... 42 7.3 List of Equipment - Key Values .............................................................................................. 43
8 Air Management & Thermal Control System ........................................................ 44 8.1 Baseline Design ...................................................................................................................... 45
8.1.1 Gutter System, Lettuce, Cultivation ................................................................................................ 45 8.1.2 High Wire, Tomato, Cultivation System .......................................................................................... 46 8.1.3 Redistribution of Heat Energy ......................................................................................................... 47
8.2 Options and Trades ............................................................................................................... 49 8.2.1 Centralised and Decentralised Air Distribution ............................................................................... 50
8.3 List of Equipment - Key Values .............................................................................................. 52
9 Plant Health Monitoring & Control Architecture ................................................... 53 9.1 Baseline Design ...................................................................................................................... 53

Vertical Farming 2.0 - Designing an Economically Feasible Vertical Farm – A combined European Endeavor for Sustainable Urban Agriculture
Page: 4
9.2 List of Equipment - Key Values .............................................................................................. 54
10 Labor Analysis & Schedule ................................................................................... 55 10.3 Baseline Design ...................................................................................................................... 55 10.4 Schedule ................................................................................................................................ 56 10.5 List of personnel - Key Values ................................................................................................ 57
11 Power and Energy Consumption .......................................................................... 58 11.1 Baseline Design ...................................................................................................................... 58
11.1.1 Illumination System ........................................................................................................................ 58 11.1.2 Air Management and Thermal System ........................................................................................... 59 11.1.3 Nutrient Delivery System ............................................................................................................... 60 11.1.4 Plant Monitoring and Control Architecture System ....................................................................... 60 11.1.5 Horticulture Procedures System .................................................................................................... 61 11.1.6 Core and Ground Floor Area .......................................................................................................... 61
11.2 Options and Trades ............................................................................................................... 63
12 Cost Analyses: ...................................................................................................... 66 12.1 Cost Analyses assumptions ................................................................................................... 66 12.2 Leafy Greens Module Cost Summary .................................................................................... 67 12.3 High Wire Module Cost Summary ......................................................................................... 67 12.4 Baseline Scenario and Break-Even Analyses ......................................................................... 68 12.5 VF 2.0 Variations from Baseline ............................................................................................ 70
13 Report Discussion and Review .............................................................................. 72 13.1 Identified Needs .................................................................................................................... 72 13.2 Aim to meet Objective .......................................................................................................... 73
13.2.1 DO-01: VF design shall be based on a new design and shall therefore be optimized for all processes of advanced crop cultivation processes. ....................................................................... 73
13.2.2 DO-02: VF height shall demonstrate the key principle of stacking of several cultivation floors (incl. several cultivation modules) in order to demonstrate the VF principle. ....................................... 74
13.2.3 DO-03: The VF maximum footprint shall not exceed 50m x 50m. ................................................. 75 13.2.4 DO-04: The VF shall demonstrate the full spectrum of Controlled Environment Agriculture (CEA)
technologies, - the implementation of closed-loop principles. ...................................................... 75 13.2.5 DO-05: The VF shall strive for reduced power consumption. ........................................................ 76 13.2.6 DO-06: The VF shall be combined with regenerative power conversion system(s) in order to
minimize or eliminate power demand from the grid. .................................................................... 77 13.2.7 DO-07: The VF design shall allow for an adequate solution for waste processing (solid/ liquid)
under the restriction of economic considerations. ........................................................................ 77 13.2.8 DO-08: The VF operation scenario shall be optimized with respect to minimal labor work
deployment. ................................................................................................................................... 77 13.2.9 DO-09: The VF shall strive for reduced cost (Capex and Opex). ..................................................... 79
13.3 Benefits .................................................................................................................................. 79 13.4 Shortcomings ......................................................................................................................... 79 13.5 Take home message .............................................................................................................. 80
14 References ........................................................................................................... 81

Vertical Farming 2.0 - Designing an Economically Feasible Vertical Farm – A combined European Endeavor for Sustainable Urban Agriculture
Page: 5
List of Abbreviations
Acronym Explanation
AMS Air Management System
AVF Association for Vertical Farming
BGF Brutto Grundfläche (gross floor space)
BKI Baukosteninformationzentrum (construction information center)
CE Concurrent Engineering
CEA Controlled Environment Agriculture
COP Coefficient of Performance
DLR Deutsches Zentrum für Luft – und Raumfahrt (German Aerospace Center)
EC Electrical Conductivity
EDEN Evolution & Design of Environmentally closed Nutrition-sources
FIR Far Infrared Radiation
HI Harvest Index
HVAC Heat Ventilation and Air-Conditioning
KKW Kostenkennwerte (costs variables)
LED Light Emitting Diode
NASA National Aeronautics and Space Administration
NDS Nutrient Delivery System
NFT Nutrient Film Technique
PAR Photosynthetically Active Radiation
PFAL Plant Factory with Artificial Lighting
PKW Plannungskennwerte (planning characteristics)
Pl Plants
RH Relative Humidity
USA United States of America
VF Vertical Farm
YR Year

Vertical Farming 2.0 - Designing an Economically Feasible Vertical Farm – A combined European Endeavor for Sustainable Urban Agriculture
Page: 6
Executive Summary
This report proposes a vertical farm design concept based on objectives to demonstrate optimization in advanced controlled environment cultivation, energy- and waste stream improvements, system automation as well as modular system applications. The Vertical Farm 2.0 (VF 2.0) report is the result of a Concurrent Engineering (CE) workshop held at the German Aerospace Center (DLR) in Bremen in conjunction with the Association for Vertical Farming (AVF). This workshop brought together experts from throughout the world to lend their experience and knowledge in a collaborative manner. The baseline scenario developed for VF 2.0 involves modular levels specialized for either leafy greens production or vine crop production. The final synopsis discussed is a facility which consists of five modules in total; two of those modules are dedicated to leafy greens and two modules to vine crop production. The ground floor is a dedicated processing level which deals with harvested products and transport of goods out of the facility (see Figure 1).
The structure has a modular design so that more production modules can be added vertically without changing the design and support features. The leafy greens module aims to house crops like lettuce, basil, and kale while the vine plant module is for crops which require trellising such as tomato, pep-per or cucumber. Initial design parameters for each of the modules are based on lettuce and tomato respectively. An airlock separates access to the production (growth) and decontamination areas thus the production areas are proposed as clean room zones. The production system area is at optimal climatic conditions for the plants. The overall building footprint is 75 m by 35 m which equate to a total area of 2.625 m2.
The administrative/operation core area in each module measures 10,25 m by 35 m, separated into two 3 meter floors. The base is designed to support heavier loads such as vertical transport systems, nutrient delivery system tanks and air management equipment amongst others. The production
Figure 1: Exterior rendering of VF 2.0 showing the 4 production levels, 2 for leafy greens and 2 for vine crop production. The ground floor shows the processing centre of the facility. An optional rooftop greenhouse is
shown on the roof.

Vertical Farming 2.0 - Designing an Economically Feasible Vertical Farm – A combined European Endeavor for Sustainable Urban Agriculture
Page: 7
areas will support only the weight of the nursery racks, cultivation racks and the crop itself. Each production area is 63,5 m by 35 m giving a total floor area of 2.222,5 m2. The floor to floor height in the production areas is 6 m.
The cultivation zone, within the production area of the leafy greens module, contains five growing racks each 50 m by 5 m by 5 m. Each of the 5 m high growing stands are divided along their length into four growing levels each one meter in height and is equipped with a conveyer belt system, where the plant cultivation gutters will travel. Irrigation pipes and drippers allow for the nutrient solution to flow in on one side of the channel and a run off drain on the other end of the gutter to collect the water run-off. Irrigation is suspended above the ends of the gutters to allow for mobility of the gutters. On the top of each growth level compartment are Light Emitting Diode (LED). The maximum distance between the plants and the LED panels is 0,25 m. The total growing area within the production zone of the leafy greens module totals 5.000 m2.
The lettuce cultivar selected as a crop model for this study is the Salanova® salad from Rijk Zwaan. Salanova® has an average 48-day seed to harvest life cycle. A total of 8.076 heads (each 200 grams) will be harvested every day resulting in a total marketable weight of 1.615,2 kg/day.
Within the production area, the cultivation zone of the vine crop cultivation module measures 50 m by 34 m and contains a conventional indoor high wire system. The system comprises 18 cultivation rows with trellising wires reaching up to a maximum height of 5 m. The distribution of the LED lights includes intra-canopy lighting on two levels and one level of top lights. The maximum distance be-tween the plants and the top LED lights is 1 meter.
The selected tomato cultivar to perform the scenario calculations was the Lyterno® and the Brioso® from Rijk Zwaan. The total growing area is 1.700 m2. There are 4.250 plants in the cultivation zone, and the total harvested weight is 63,5 kg/m2 per year and 50,8 kg/m2 per year respectively.
Shown below, Table 1, is the calculated total power consumption for each of the subsystems. The plant lighting system and the air management system make up close to 98% of the energy demand.
Table 1: Total energy consumption per subsystem of the baseline scenario
Subsystem/relevant area Yearly Energy Demand
[kWh] Distribution of Energy Use
[%] Chapter Refer-
ence
illumination System 12.152.463 69,9 7
Air Management System 4.853.038 27,9 8
Nutrient Delivery System 69.379 0,4 6
Plant Health Monitoring Sys-tem
106.872 0,6 9
Horticulture Operations 36.500 0,2 5
Growth Floors Core Area 24.094 0,1 11
Ground Floor Core 15.067 0,1 11
Ground Floor Working Area 125.008 0,7 11
TOTAL 17.382.422
Table 2 shows condensed yearly cost analyses for the baseline scenario VF 2.0. Total investments in the building and equipment amounted to 36.697.003 €. A margin of 10% was utilized to reflect a certain level of risk due to unforeseen costs, the unpredictability of the implementation of new tech-nology, and volatilities in cost estimates. The investment costs for the construction and subsystem components will be amortized over a period of 30 years, with no residual value at an interest rate of 3%.

Vertical Farming 2.0 - Designing an Economically Feasible Vertical Farm – A combined European Endeavor for Sustainable Urban Agriculture
Page: 8
Table 2: Yearly costs for the baseline scenario
Baseline Total Cost [K€/year]
Investments 1.818
Water Costs 65
Energy Cost 2.781
CO2 costs 48
Plant Costs 961.1
Labor Cost 856
Total 6.549
Margin 10%
Total with margin 7.204
Yearly cost distribution is shown in Figure 2. Energy costs are the highest followed by initial invest-ment costs. The total variable cost are 4.745.946 € per year.
Figure 2: Yearly cost distribution with 10 % margin for the baseline scenario in K€/year
VF 2.0 determined economic feasibility by finding the break-even point, or, price per kg (€/kg) that the total yearly produce would need to achieve to cover the estimated annual production costs. For VF 2.0 to break even it would have to sell its head of lettuce for 5,81 €/kg and tomatoes for 9,94 €/kg.
These values represent a starting point and need to be reviewed and discussed in further studies. Reducing energy costs is the primary goal of decreasing production costs. To this end, the illumination system, the air man-agement and thermal systems [Chapters 7 and 8 respectively] will come under the most scrutiny.
In recent years there has been a significant improvement in the efficiency of LED lighting systems. Over the years to come, the energy demand and the thermal properties of the
Figure 3: Arial view of the VF 2.0

Vertical Farming 2.0 - Designing an Economically Feasible Vertical Farm – A combined European Endeavor for Sustainable Urban Agriculture
Page: 9
lights will improve further lowering the production costs and render them more thermally efficient. Thermal regulation (climate) cost within the building can also be reduced by tailoring the thermal management system to the specific life cycle of the distinct cultivars as they transpire less during their growth phases.
As the vertical farming industry matures, more efficient solutions will become available to growers, from efficient illumination systems to climate managements system and with improved business plans, these factors will drive down the cost of production in the future.

Vertical Farming 2.0 - Designing an Economically Feasible Vertical Farm – A combined European Endeavor for Sustainable Urban Agriculture
Page: 10
1 Introduction
With 2016 set to become the hottest year ever recorded by NASA, coupled with the dramatic rise in world population and the urbanization of that population many are questioning the world’s food security. Consistently producing fresh produce for people in new mega-cities is a growing problem which has led to the advent of many new agricultural technologies and approaches. Vertical Farming is positioned to offer a solution for this problem. Vertically stacking growing space with artificial lights allows optimizing the available land space thus producing more crops on a smaller area with highly efficient system.
Development programs for long-term human space flight by the EDEN team at the DLR in Bremen, Germany have led to technologies for earthbound Vertical Farms. This information will help to re-duce the costs and ultimately make new vertical farms a sustainable, economically feasible and envi-ronmentally friendly way to produce significant amounts of food for people in the major cities.
With this in mind, the DLR and the AVF teamed up to bring together experts in the Vertical Farming industry to design the optimized Vertical Farm and publish these plans to raise awareness and help promote this new industry. In November 2015 the DLR in Bremen hosted the Vertical Farm 2.0 Con-current Engineering workshop. During this workshop various objectives and design guidelines and goals were set. See Tables 1-1 and 1-2.
1.1 Mission Objectives The design objectives for the VF 2.0 are listed in Table 1-1.
Table 1-1: Mission objectives for the Vertical Farm 2.0 Workshop
Objective-No.
Objective Description Comment
DO-01 VF design shall be based on a new design and shall therefore be optimized for all processes of advanced crop cultivation processes.
No refurbishment of abandoned/ old build-ings
DO-02 VF height shall demonstrate the key principle of stacking of several cultivation floors (incl. several cultivation modules) in order to demonstrate the VF principle.
VF concept shall later be used to apply for funding resources; 5 cultivation floors and 1-2 support floors as a first target
DO-03 The VF maximum footprint shall not exceed 50m x 50m. Determination of footprint will be first priority during the initial study phase
DO-04 The VF shall demonstrate the full spectrum of Controlled Environment Agriculture (CEA) technologies, - the im-plementation of closed-loop principles.
Water recovery from the air; usage of ion-selective sensors; hydroponic / aeroponic; pure LED illumination; etc.
DO-05 The VF shall strive for reduced power consumption.
DO-06 The VF shall be combined with regenerative power conversion system(s) in order to minimize or eliminate power demand from the grid.
This design objective shall be optional. Main focus is on the VF design itself.
DO-07 The VF design shall allow for an adequate solution for waste processing (solid/ liquid) under the restriction of economic considerations.
Data from Zeidler et al 2013 determined that onsite waste processing reduced the economic feasibility.
DO-08 The VF operation scenario shall be optimized with re-spect to minimal labor work deployment.
Economic feasibility of the degree of au-tomation needs to be kept in mind.
DO-09 The VF shall strive for reduced cost (Capex and Opex).

Vertical Farming 2.0 - Designing an Economically Feasible Vertical Farm – A combined European Endeavor for Sustainable Urban Agriculture
Page: 11
1.2 Study Objectives The objectives for the workshop are listed in Table 1-2 with their respective numbers.
Table 1-2: Global study objectives for the Vertical Farm 2.0 Workshop
Objective-No. Study Objective Description
SO-1 Structure and design of VF layout (e.g. primary & secondary structure, engineering, subsystem accommodation, piping, cabling) incl. statement of redundant systems/ technologies
SO-2 Determination of optimal plant accommodation strategies with respect to handling, food safety and optimized growth for seven selected crop types
SO-3 Budgets on subsystem detail, mainly power, mass, thermal, dimensions and equipment lists (incl. spare) for each domain
SO-4 Evaluation of power consumptions for optimized operation of the VF incl. a preliminary analy-sis on implementing regenerative power conversion systems
SO-5 Detailed calculation of biomass (edible & inedible) output for the selected crops
SO-6 Detailed cost analysis based on Capex and Opex costs, concluding in a cost per kg price for each selected crop.
SO-7 Layout synergy of the potential between the domains as well as indication on how to integrate a VF into an inner city infrastructure
SO-8 Assessment of time spent on particular tasks and operations in a VF as well as numbers of workers per m² in the farm.
1.3 Study Domains Because the domains for the VF 2.0 workshop differ from the typical satellite design studies conduct-ed within the CE Facility, different areas where assigned. The areas and their location in the CE facili-ty are in Figure 1-1.
Figure 1-1: A figure showing the different domains and their location in the CE facility during the VF 2.0 Work Shop

Vertical Farming 2.0 - Designing an Economically Feasible Vertical Farm – A combined European Endeavor for Sustainable Urban Agriculture
Page: 12
Table 1-3: CE study team
DOMAIN Responsible Organisation Email
Team Leader Daniel Schubert DLR [email protected]
Co-Team Leader Conrad Zeidler DLR [email protected]
Cost Analysis Gilles Dreyfus Dreyfus Farms [email protected]
Plant Health Monitoring & Control Architecture Zjef van Acker AVF [email protected]
Architecture Layout Oscar Rodriguez Architecture & Food [email protected]
Illumination System Anthony Gilley Heliospectra [email protected]
Nutrient Delivery System & Plant Compartment Design
Andrew Carter Blue Planet Environmen-tal
Horticulture Procedures Jasper den Besten HAS [email protected]
Labour Analysis & Schedule Henry Gordon-Smith Blue Planet Environmen-tal
Internal Configuration Vincent Vrakking DLR [email protected]
Systems Engineering Max Lössl AVF [email protected]
Air Management System & Thermal Martin Veenstra Certhon [email protected]
Crop Cultivar Selection Michael Hoffmann Rijk Zwaan [email protected]
Power Consumption Elisabet Wejmo DLR [email protected]
Off line People
Person Organisation Email
Nico Domurath Itegar [email protected]
Prof. Schröder HTWD [email protected]
Gus van der Feltz Philips [email protected]
Roel Janssen Philips [email protected]
Christine Rösch ITAS KIT [email protected]
Jan Westra Priva [email protected]
Grazyna Bochenek Heliospectra [email protected]
Figure 1-2: Team photo at the end of the Vertical Farm 2.0 CE study

Vertical Farming 2.0 - Designing an Economically Feasible Vertical Farm – A combined European Endeavor for Sustainable Urban Agriculture
Page: 13
1.4 Study Products During the workshop, there were introductory presentations, final presentation documenting e.g. trade-offs and design decisions by the study team.
After the workshop, a final report will be written (by all workshop members). The report will include a description of the design of the Vertical Farm, the allocation of sections and subsystems, the sys-tem budgets (e.g. mass, power) and CAD drawings.
The final report shall later be used to initiate an important discussion on the deployment of Vertical Farming and its economic and environmental impact on society.
All objectives and requirements shall follow this goal.

Vertical Farming 2.0 - Designing an Economically Feasible Vertical Farm – A combined European Endeavor for Sustainable Urban Agriculture
Page: 14
2 Vertical Farms: An Introduction and General Processes
Described in this section are a general overview and system analysis with the interfaces are defined. Furthermore, some options and trades involving the location and internal configuration of the build-ing are mentioned. Finally, the global assumptions of the design concept are stated.
2.1 System Analysis The basic concept of a VF is a multilevel modular building that uses state of the art climate control technologies and advanced agricultural systems to grow crops. This notion is closely related to the Plant Factory with Artificial Lighting (PFAL) described in Kozai 2015, which defines the PFAL as an indoor plant production system that uses artificial illumination. Other similarities between PFALs and VF concepts arise in their modular components, which include but are not limited to; airtight, well-insulated facilities, multi-layered crop systems and water reclamation systems among others.
These concepts were developed to allow for the upscaling of urban agriculture, enabling the con-sumer access to local produce, improved product traceability, and the availability of quality fresh vegetables year around. Other benefits of these growing systems include the high water efficiency and high production yield as well as reduced waste.
The key challenges to overcome included the high initial investment and production cost, high land price, high electricity consumption, high labor costs and limited choices for crop production. Despite these challenges, some examples of operational VF facilities and PFALs can be found today, such as Green Sense Farms in the United States and Spread Co., Ltd. in Kyoto Japan. These companies man-age to produce quality, safe products and distribute them to their local market.
According to Kozai 2015, as of March 2013, there were 165 PFAL in Japan and 45 in Taiwan designat-ed for commercial production. In many countries, such as Japan, Taiwan, Korea, USA and China the number of facilities have been increasing year by year. These businesses have recently started grow-ing in some European countries.
All things considered, a VF production system could take place close to city centers to provide fresh, quality and locally produced vegetables in a sustainable and profitable manner. In the analysis of the VF system, the definition of its subsystems proposes to study in detail, the practical and working principles of each part of the design. All the subsystems are intertwined; elements of one subsystem affects the components of the other. In the Figure 2-1, below, the system flow is represented with the details involving each subsystem.

Vertical Farming 2.0 - Designing an Economically Feasible Vertical Farm – A combined European Endeavor for Sustainable Urban Agriculture
Page: 15
Figure 2-1 System and subsystem elements in the general VF process flow design
The general design flow includes: the plant production process, the climate management compo-nents, nutrition delivery system (NDS) elements and, the structure itself. Inputs into the system in-clude: seeds, energy (light & heat/cooling), carbon dioxide and irrigation water with nutrients. The returned intermediate outputs, are the water coming from the runoff or the reclaimed water vapor and the heat surplus in the air management system (AMS). The final outputs obtained through the harvest are inedible matter (waste) and edible matter (product).
The separate subsystem chapters include the detailed analysis of the lighting requirements, climatic requirements, horticulture processes, and power consumption analysis among others. Each of the subsystems is related to a part of the general process flow. Each subsystem needs to be comple-mented by the others. An example can be found in the vegetative and generative stage element where most of the systems connect, either through associated elements or the element itself.
As the final goal of this study is to determine the overall cost of a VF, the information flow should head towards that direction. A well laid out roadmap of the information needed to achieve this goal regarding the important aspects in each subsystem is required to avoid “knowledge bottlenecks” that slow down the designing process. The pursuit of the VF concept should be to maximize profitable yields in production, food quality standards, and safety rather than pursuing maximum yields at any cost. Figure 2-2 shows an information flow diagram.
Optimal conditions are taken into account for the VF design and will provide critical estimations such as the yield expected from the crops and, some resources needed to maintain them. Based on this knowledge and a set production target, the size of the building can be projected, giving room to cost

Vertical Farming 2.0 - Designing an Economically Feasible Vertical Farm – A combined European Endeavor for Sustainable Urban Agriculture
Page: 16
calculations for the structure. Furthermore, it can help calculate the labor needed to handle such a production and its Opex costs.
OPTIMAL CLIMATIC CONDITIONS
RESOURCES TO MAINTAIN OPTIMAL
CONDITIONS
HEAT, VAPOUR, AND CO2 BALANCE
ENERGY LOADS
EQUPMENT SELECTION
NUMBER OF PLANTS
RESOURCES TO GROW THE CROPS
STRUCTURE/PARTS
LIST OF MATERIALS
EQUIPMENT AND RUNNING COSTS
WATER/NUTRIENTSENERGY RESOURCES
COST (LABOR)
YIELD EXPECTED
PRICE OF FRESH WEIGHT NEEDED
SIZE OF THE BUILDING
COST OF THE STRUCTURE
PRODUCTION OBJECTIVE
EXTERNAL CLIMATIC CONDITIONS
Figure 2-2: Information flow of the vertical farm design process
The input resources required to grow the crops is then taken into account and estimated. Knowing the resource base for production and the resources necessary to maintain the optimal conditions, fixed and variable Opex cost of the facility can be calculated. Finally, the optimal sales price can be measured from the expected yield and the total cost analysis.
2.2 Global Assumptions, Options and Trades The general concept of VF 2.0 involves a modular facility divided into a logistics/postharvest area and two dedicated production modules. Leafy greens and vine crop high wire module that stack on top of each other, within each module an administrative/operation core is located (see Figure 2-3). More production modules can be added vertically. Based on the previous study (Zeidler et al., 2013), VF 2.0 is more likely to achieve economic feasibility when not combined with animal production. The leafy greens module is designed to house crops like lettuce, basil, and kale while the vine plant mod-ule is designed for tomato, pepper or cucumber.
Vertical Farming 2.0 - Designing an Economically Feasible Vertical Farm – A combined European Endeavor for Sustainable Urban Agriculture
Page: 17
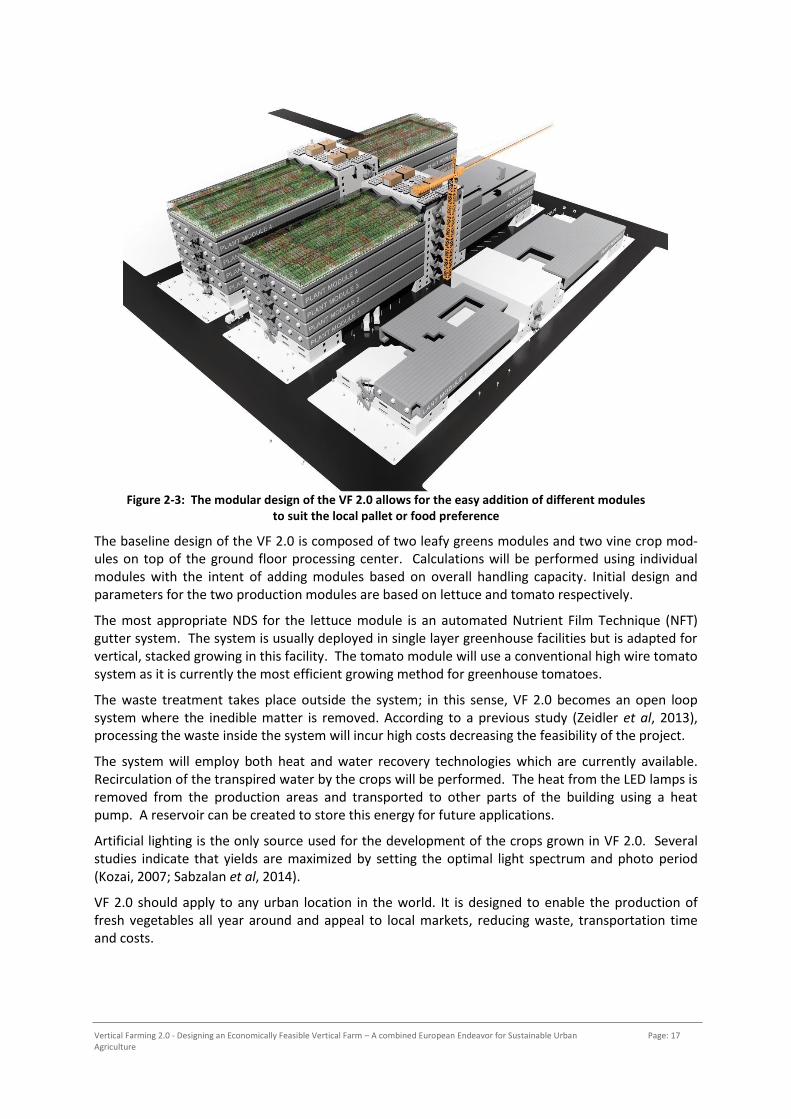
The baseline design of the VF 2.0 is composed of two leafy greens modules and two vine crop mod-ules on top of the ground floor processing center. Calculations will be performed using individual modules with the intent of adding modules based on overall handling capacity. Initial design and parameters for the two production modules are based on lettuce and tomato respectively.
The most appropriate NDS for the lettuce module is an automated Nutrient Film Technique (NFT) gutter system. The system is usually deployed in single layer greenhouse facilities but is adapted for vertical, stacked growing in this facility. The tomato module will use a conventional high wire tomato system as it is currently the most efficient growing method for greenhouse tomatoes.
The waste treatment takes place outside the system; in this sense, VF 2.0 becomes an open loop system where the inedible matter is removed. According to a previous study (Zeidler et al, 2013), processing the waste inside the system will incur high costs decreasing the feasibility of the project.
The system will employ both heat and water recovery technologies which are currently available. Recirculation of the transpired water by the crops will be performed. The heat from the LED lamps is removed from the production areas and transported to other parts of the building using a heat pump. A reservoir can be created to store this energy for future applications.
Artificial lighting is the only source used for the development of the crops grown in VF 2.0. Several studies indicate that yields are maximized by setting the optimal light spectrum and photo period (Kozai, 2007; Sabzalan et al, 2014).
VF 2.0 should apply to any urban location in the world. It is designed to enable the production of fresh vegetables all year around and appeal to local markets, reducing waste, transportation time and costs.
Figure 2-3: The modular design of the VF 2.0 allows for the easy addition of different modules to suit the local pallet or food preference

Vertical Farming 2.0 - Designing an Economically Feasible Vertical Farm – A combined European Endeavor for Sustainable Urban Agriculture
Page: 18
3 Architecture Layout and Internal Configuration
Based on the objectives previously described, VF 2.0 is a building that can produce multiple varieties of crops on a relatively small footprint at the same time. In this section is the design concept for the structure of the building and the configuration and function of the internal spaces.
3.1 Baseline Design The baseline design of VF 2.0, as described in this report, will contain a processing center, based on the ground floor, and four cultivation modules, of which two will be dedicated to lettuce crop cultiva-tion, while the remaining two modules will be used to produce tomatoes.
During the design workshop, it was decided by the study team to develop a modular design (see Fig-ure 3-1) which could be adjusted to include modules growing various crops. These plants would change depending on the final location of the building and the dietary preferences of the local popu-lation. Each cultivation module is designed, to the greatest extent possible, as a self-sustaining unit, independent of the other modules. Theoretically, it would be possible to expand VF 2.0, by adding additional modules on top.
The baseline design resulted in a building that measures 75 m by 35 m overall. Each module, includ-ing the processing center on the ground floor, is divided into two general areas: the core and the production area separated by decontamination airlock. The ground module is a dedicated processing center for the crops grown on the upper cultivation modules. It consists of cold storage rooms which provide space for harvested products awaiting transport to the local supermarkets, restaurants and other retail point of sales. All remaining modules above are dedicated cultivation modular levels for either lettuce or tomato production. A more detailed description of each module is given below see chapters 3.1.1 for ground floor, 3.1.2 for leafy greens and 3.1.3 for the vine high wire module
Figure 3-1: Model showing the modular stacking ability of the growing floors on top of the ground floor processing centre, here, only 1 vine crop high wire module and 1 leafy greens module

Vertical Farming 2.0 - Designing an Economically Feasible Vertical Farm – A combined European Endeavor for Sustainable Urban Agriculture
Page: 19
Each of the modules measures 6 m floor-to-floor resulting in a total building height of 30 m. The overall footprint of the building is 2,625 m², however, for the estimation of the building costs, it is assumed that the total area of the site is 95 by 55 m, for a land site area of 5225 m².
3.1.1 Ground Floor Description The ground floor core area has two floors, each being three meters in height, floor-to-floor. This area measures 10,25 m by 35 m for each of the floors. The remaining work area has a footprint area of 63,5 by 35 m.
The ground floor core area comprises of the main entrance, a room for staff, the fresh water unit and storage tank, the main control room for all the modules and the main decontamination airlock. The main airlock also contains the changing and decontamination rooms for employees which provides the first level of separation between the cultivation area and any contaminants from the outside or core areas (see Figures 3-2 & 3-3).
The ground floor core area is furthermore designed to accommodate the vertical transport systems (elevators, waste chutes, and staircases) and all the utility lines for the distribution of water, electrici-ty and CO2 to the upper floors.
Figure 3-2: Lower level of the ground floor core area

Vertical Farming 2.0 - Designing an Economically Feasible Vertical Farm – A combined European Endeavor for Sustainable Urban Agriculture
Page: 20
The ground floor houses: storage rooms for the ready to ship products, raw materials, waste dispos-al, a thermal storage buffer system, a CO2 buffer, and the logistics center (see Figure 3-4). The logis-tics center is also where the packaging material and consumables are stored. At the far end of the ground floor area, opposite the core, a large open space is available for additional use.
There are 10 cold storage rooms, each one 5 m by 4 m, located in the middle of the ground floor, five on each side of the central area. Each can store a full harvest from a single day, seventeen pallets (1.632 kg) of lettuce and three pallets (435 kg) of tomatoes per room, with the current configuration. The pallets of harvested produce are moved from the elevator to the storage rooms by forklift. The rooms have to maintain a minimum temperature of 2°C and a relative humidity between 90 - 95 %. A second exit allows product to be transported from the cold storage to transport trucks. A small vestibule of three meters is between the cold storage rooms and the truck gate. The vestibule cre-ates an air buffer between the outside and the refrigerated area, which will minimize the inflow of warm air into the cold storage area.
Outside the core area are large water buffer tanks and CO2 tanks which serve the various cultivation floors. The ground floor water is supplied directly by the local fresh water. The buffer tanks would be used to reduce the maximum stress on the city’s water supply by spreading out the amount over time.
Figure 3-3: Figure showing the floor plan and all the main facilities in the of the ground floor core area

Vertical Farming 2.0 - Designing an Economically Feasible Vertical Farm – A combined European Endeavor for Sustainable Urban Agriculture
Page: 21
From the buffer tank, water is pumped up to the cultivation modules, passing through a UV-filter, to the nutrient solution tanks, where the water is mixed with nutrients to obtain the desired solution. On each cultivation module, condensate water is recovered in the air cooling system and, after pass-ing through a UV-filter, is returned to the NDS. The baseline design can transport water up one floor. Each cultivation module will have a small pump which provides sufficient head pressure to pump the water up an additional module.
3.1.2 Leafy Greens, Lettuce, Module Description The core of this module contains the bulk nutrient solution storage (NDS) tank and mixing unit, a germination room, the module airlock and a packaging room as well as the utility lines connected to the ground floor (see Figure 3-5). Each module has an elevator to transport the harvested produce and a chute to dispose of the waste to the ground floor.
Figure 3-4: Figure showing the floor plan of the ground floor with the main facilities labelled with all the important facilities
Figure 3-5: Lower level of the lettuce level core together with the nurseries in the working area

Vertical Farming 2.0 - Designing an Economically Feasible Vertical Farm – A combined European Endeavor for Sustainable Urban Agriculture
Page: 22
On top of the germination room, airlock and NDS room the air management, thermal, power control and distribution system components are housed (see Figure 3-6). Detailed descriptions of each of the subsystems and their respective components are in the dedicated subsystem chapters in this report.
The production area is divided into the working area, containing the nurseries, and the cultivation area, where the growth racks are placed (see Figure 3-6). The working space measures four meters in length. Here, the workers have space to harvest, clean and plant gutters which will then be trans-ported to their appropriate areas for the start of the growth cycle. This area will additionally provide space for the workers to package the incoming produce to be shipped away. The two nurseries are located near the core and measure 3 m wide by 13 m long and are stacked four layers high. The total nursery area per module is therefore 312 m2.
The cultivation area contains five gutter growth racks, with each rack being 50 m long and 5 m wide (see Figure 3-7). The maximum height of the growth rack is 5 m, which is the entire floor-to-ceiling height in the cultivation area. Each rack is divided into four, 1 m high growing compartments. The compartments are each equipped with a drain, an irrigation pipe with individual drippers, and at the top of each compartment, LED panels are placed. For a more detailed description see Chapters 6 & 7.
Figure 3-6: Top view of a lettuce production level

Vertical Farming 2.0 - Designing an Economically Feasible Vertical Farm – A combined European Endeavor for Sustainable Urban Agriculture
Page: 23
The lettuce heads will be in 5 m long gutters, moving on the growth track. (See Figure 3-7 & 3-8). The germination room, located in the core of the lettuce module, will be the starting point for seeding. Following successful germination, the young seedlings move to the nurseries in the work area of the lettuce module. The lettuce is transplanted from the nursery into the gutters upon maturity. Lettuce plants are planted 15 cm apart, allowing 33 plants per gutter. For a more detailed description of the horticultural procedures see Chapter 5.
Figure 3-8: Gutter crop cultivation for the leafy green module
Figure 3-7: One of the five growth racks in the cultivation area in the leafy greens level. Gutters will grow lettuce on four levels within each rack

Vertical Farming 2.0 - Designing an Economically Feasible Vertical Farm – A combined European Endeavor for Sustainable Urban Agriculture
Page: 24
3.1.3 Vine Crop, Tomato, Module Description The core, airlock area, nursery and work area are set up similar to the leafy greens module (see Fig-ure 3-5). The cultivation area contains one conventional indoor high wire system within the 50 m by 34 m area. The maximum height of the structure is five meters (see figure 3-9 & 3-10). The system comprises 18 cultivation rows suspended by wires. LED lights illuminate 18 double rows of intra-canopy lighting and one row of top lights. The total growth area footprint is 1700 m2. The tomato crop also starts out in the germination rooms located in the core of the tomato module. Once the seedlings are mature enough, they are moved to the nurseries in the work are of the tomato module until they are ready to be transplanted. Due to the long life-cycle of the tomato crop, only one transplant is performed per year. During this time plants from the nurseries are transplanted into their final positions in the high wire system. For a detailed description of the horticultural proce-dures please see Chapter 5.
Figure 3-9: High wire system of a Vine Crop module

Vertical Farming 2.0 - Designing an Economically Feasible Vertical Farm – A combined European Endeavor for Sustainable Urban Agriculture
Page: 25
Figure 3-10: An example of a high wire cultivation system
3.2 Options and Trades Some aspects of the design remain open. Specifically, the area opposite the ground floor core (see Figure 3-11), has approximately 735 m2 of empty space, which had not been assigned a purpose dur-ing the design study. During post-processing a concept was developed in which is visitor’s entrance, laboratory, small-scale testing facility and/or showcase area. There could also be a small area dedi-cated to a reception area where the crops can be sampled and purchased.
Figure 3-11: Proposed distribution of visitors and laboratory area in unused empty space

Vertical Farming 2.0 - Designing an Economically Feasible Vertical Farm – A combined European Endeavor for Sustainable Urban Agriculture
Page: 26
3.3 List of Equipment – Key Values The values involving the architectural layout and the internal configuration of each subsystem is pre-sented in Table 3-1 (next page). The cost estimation of the buildings construction is based on the Baukosteninformationzentrum (BKI) database, following the procedure explained in Zeidler et al, 2013.
The required data is derived from actual costs and are related to reference units like floor or excava-tion area. The cost estimation is done by breaking down the overall structure into smaller compo-nents and matching them to cost parameter tables in the BKI. The first level of the facility cost breakdown is divided into groups, see Table 3-1 (next-page).
A simplified model of the VF building is used, such that parametric cost estimation can be performed. A real construction cost estimation should be created with this simplistic model as only an example. The cost estimate is divided into the building shell and one nominal floor. The structure costs for the ground floor and both cultivation modules are taken to be equal. Then the module cost simulation can be multiplied by the number of modules in the baseline design. All areas have been obtained from the computer assisted model design.

Vertical Farming 2.0 - Designing an Economically Feasible Vertical Farm – A combined European Endeavor for Sustainable Urban Agriculture
Page: 27
Table 3-1: Key values of Architectural layout and internal configuration subsystem
Shell BGF PKW/BGF KKW [€] Costs [K€]
100 Site m² 5225 - 229,00 1.196
100 Site Total 1.196
200 Opening up m² 5225 - 16,00 83
200 Opening up Total 83
310 Excavation m² 2.992,50 1,14 34,00 101
320 Foundation m² 1.800,00 0,70 326,00 586
330 Outer wall m² 1.188,00 0,48 301,00 357
360 Roof m² 1.863,75 0,71 255,00 475
310, 320, 330, 360 Building - Construction Total 1.521
Total costs industrial production building, mainly skeleton struc-ture "Shell" for 5 stories
2.801
Nominal Floor BGF PKW/BGF KKW € Costs [K€]
340 Inner wall m² 2.582,00 0,41 295,00 761
350 Ceiling m² 2.582,00 0,25 372,00 960
370 Constructional installations
m² 2.582,00 1,00 25,00 64
390 Construction area m² 2.582,00 1,00 28,00 72
340, 350, 370, 390 Building - Construction Total 1.859
410 Sewage, water, gas plants
m² 2.582,00 1,00 33,00 85
420 Heat-supply sys-tems
m² 2.582,00 1,00 49,00 126
430 Air conditioning systems
m² 2.582,00 1,00 30,00 77
440 High voltage plants
m² 2.582,00 1,00 108,00 278
450 Com. and info. tech.
m² 2.582,00 1,00 13,00 33
460 Conveyor systems m² 2.582,00 1,00 127,00 327
470 Plants for specific usage
m² 2.582,00 1,00 297,00 766
480 Building automa-tion
m² 2.582,00 1,00 7,00 18
490 Construction area m² 2.582,00 1,00 0,00 0,00
400 Building - Technical plants Total 1.714
Sum 300+400 (without 310, 320, 330, 360) 3.573
600 Building infrastruc-ture equipment
m² 2.582,00 1,00 0,00 0,00
600 Building infrastructure equipment Total 0,00
700 Additional building costs
m² 2.582,00 1,00 211,00 544
700 Additional building costs 544
Total costs industrial production building, mainly skeleton struc-ture "1x Floor"
4.118
Number of Floors 5
Total Costs Σall: 23.392
Vertical Farming 2.0 - Designing an Economically Feasible Vertical Farm – A combined European Endeavor for Sustainable Urban Agriculture
Page: 28
4 Crop Cultivar Selection
Crop selection for production modules is discussed using a modular approach. The baseline design of VF 2.0 involves production modules for lettuce and tomato. This baseline model will provide insights for initial estimates of the total edible and inedible biomass, revenue and costs of production.
4.1 Characteristics of Selected Lettuce Cultivars The general characteristics of the selected cultivars were used to calculate values for the other sub-systems such as: ventilation and cooling capacity, irrigation, logistics needs and overall spatial and temporal requirements.
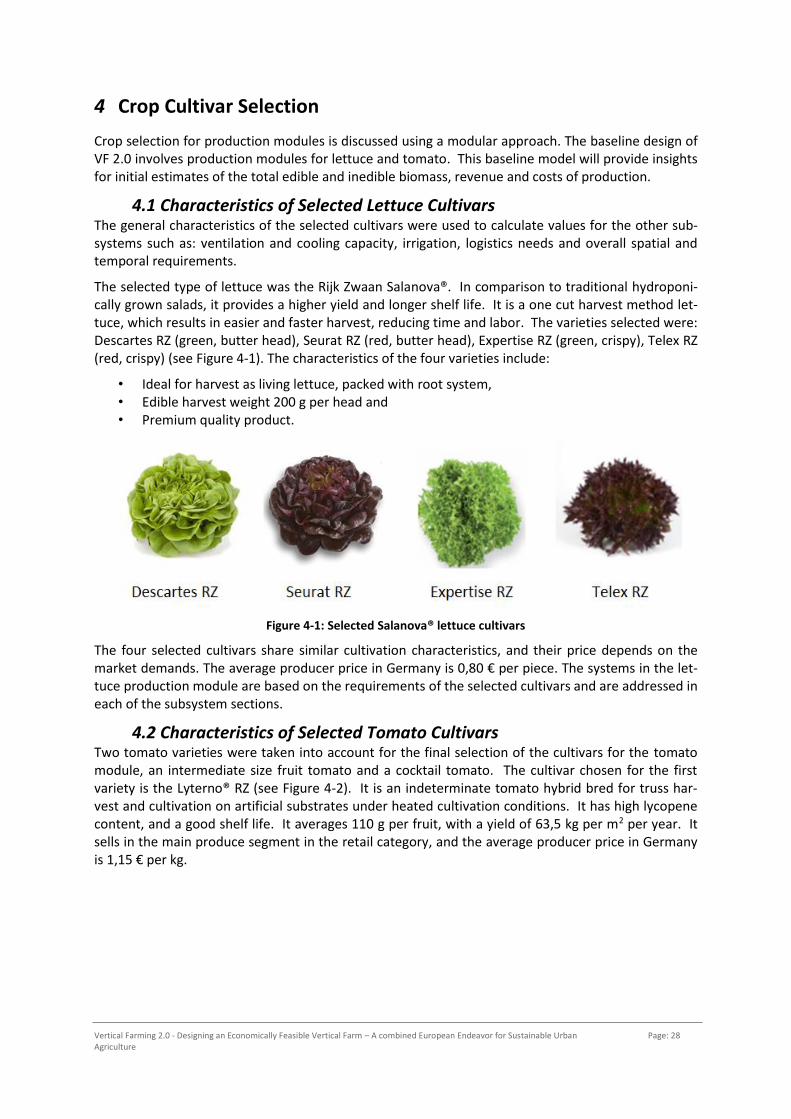
The selected type of lettuce was the Rijk Zwaan Salanova®. In comparison to traditional hydroponi-cally grown salads, it provides a higher yield and longer shelf life. It is a one cut harvest method let-tuce, which results in easier and faster harvest, reducing time and labor. The varieties selected were: Descartes RZ (green, butter head), Seurat RZ (red, butter head), Expertise RZ (green, crispy), Telex RZ (red, crispy) (see Figure 4-1). The characteristics of the four varieties include:
• Ideal for harvest as living lettuce, packed with root system, • Edible harvest weight 200 g per head and • Premium quality product.
Figure 4-1: Selected Salanova® lettuce cultivars
The four selected cultivars share similar cultivation characteristics, and their price depends on the market demands. The average producer price in Germany is 0,80 € per piece. The systems in the let-tuce production module are based on the requirements of the selected cultivars and are addressed in each of the subsystem sections.
4.2 Characteristics of Selected Tomato Cultivars Two tomato varieties were taken into account for the final selection of the cultivars for the tomato module, an intermediate size fruit tomato and a cocktail tomato. The cultivar chosen for the first variety is the Lyterno® RZ (see Figure 4-2). It is an indeterminate tomato hybrid bred for truss har-vest and cultivation on artificial substrates under heated cultivation conditions. It has high lycopene content, and a good shelf life. It averages 110 g per fruit, with a yield of 63,5 kg per m2 per year. It sells in the main produce segment in the retail category, and the average producer price in Germany is 1,15 € per kg.

Vertical Farming 2.0 - Designing an Economically Feasible Vertical Farm – A combined European Endeavor for Sustainable Urban Agriculture
Page: 29
Figure 4-2: Selected tomato cultivars
The cultivar selected for the cocktail tomato variety is the Brioso® RZ (see Figure 4-2). It is character-ized by a deep red color and high Brix values (high sugar content). It belongs to the premium seg-ment in the retail category and has a long shelf life. The average weight per fruit is 40 g and the av-erage producer price in Germany is 2,20 € per kg.
Vertical Farming 2.0 - Designing an Economically Feasible Vertical Farm – A combined European Endeavor for Sustainable Urban Agriculture
Page: 30
5 Horticulture Procedures
This chapter offers a description of the horticulture procedures, as well as the packaging and transport of produce for the two modules of VF 2.0. The plants optimal growing requirements are the base points for the design of the systems. Duration of the growth cycle and the processes in-volved in each growth stage are taken into account.
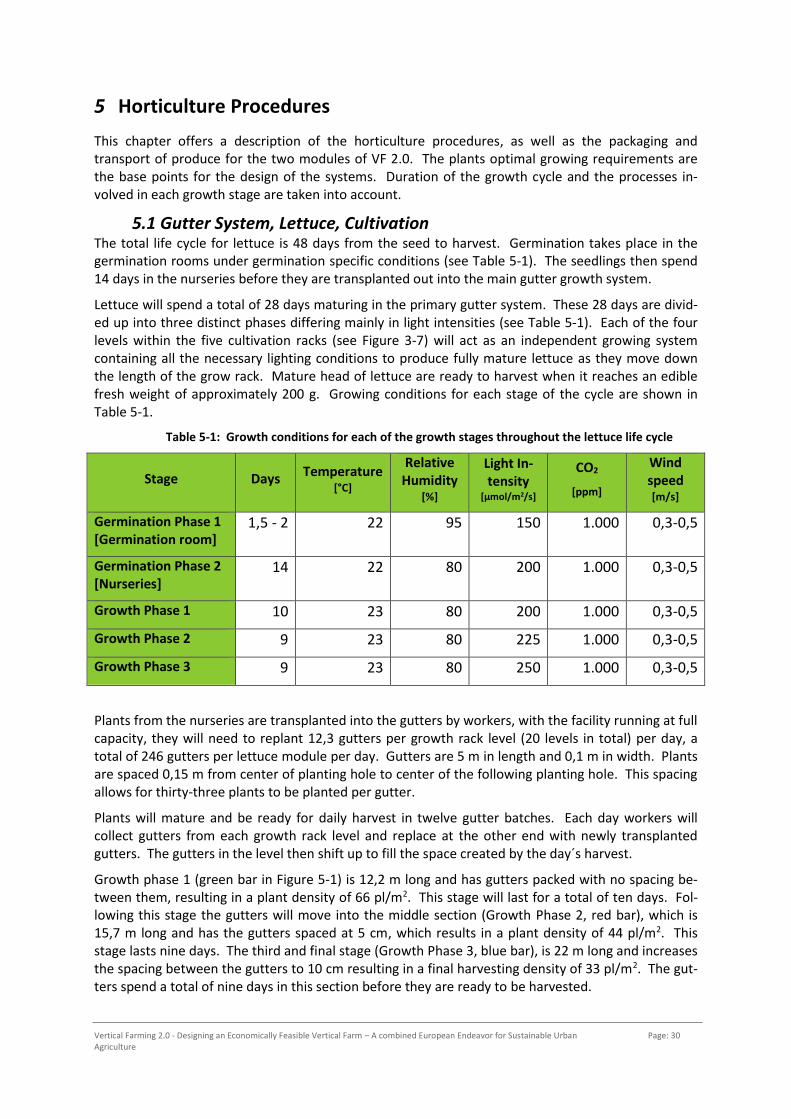
5.1 Gutter System, Lettuce, Cultivation The total life cycle for lettuce is 48 days from the seed to harvest. Germination takes place in the germination rooms under germination specific conditions (see Table 5-1). The seedlings then spend 14 days in the nurseries before they are transplanted out into the main gutter growth system.
Lettuce will spend a total of 28 days maturing in the primary gutter system. These 28 days are divid-ed up into three distinct phases differing mainly in light intensities (see Table 5-1). Each of the four levels within the five cultivation racks (see Figure 3-7) will act as an independent growing system containing all the necessary lighting conditions to produce fully mature lettuce as they move down the length of the grow rack. Mature head of lettuce are ready to harvest when it reaches an edible fresh weight of approximately 200 g. Growing conditions for each stage of the cycle are shown in Table 5-1.
Table 5-1: Growth conditions for each of the growth stages throughout the lettuce life cycle
Stage Days Temperature [°C]
Relative Humidity
[%]
Light In-tensity
[μmol/m2/s]
CO2
[ppm]
Wind speed [m/s]
Germination Phase 1 [Germination room]
1,5 - 2 22 95 150 1.000 0,3-0,5
Germination Phase 2 [Nurseries]
14 22 80 200 1.000 0,3-0,5
Growth Phase 1 10 23 80 200 1.000 0,3-0,5
Growth Phase 2 9 23 80 225 1.000 0,3-0,5
Growth Phase 3 9 23 80 250 1.000 0,3-0,5
Plants from the nurseries are transplanted into the gutters by workers, with the facility running at full capacity, they will need to replant 12,3 gutters per growth rack level (20 levels in total) per day, a total of 246 gutters per lettuce module per day. Gutters are 5 m in length and 0,1 m in width. Plants are spaced 0,15 m from center of planting hole to center of the following planting hole. This spacing allows for thirty-three plants to be planted per gutter.
Plants will mature and be ready for daily harvest in twelve gutter batches. Each day workers will collect gutters from each growth rack level and replace at the other end with newly transplanted gutters. The gutters in the level then shift up to fill the space created by the day´s harvest.
Growth phase 1 (green bar in Figure 5-1) is 12,2 m long and has gutters packed with no spacing be-tween them, resulting in a plant density of 66 pl/m2. This stage will last for a total of ten days. Fol-lowing this stage the gutters will move into the middle section (Growth Phase 2, red bar), which is 15,7 m long and has the gutters spaced at 5 cm, which results in a plant density of 44 pl/m2. This stage lasts nine days. The third and final stage (Growth Phase 3, blue bar), is 22 m long and increases the spacing between the gutters to 10 cm resulting in a final harvesting density of 33 pl/m2. The gut-ters spend a total of nine days in this section before they are ready to be harvested.

Vertical Farming 2.0 - Designing an Economically Feasible Vertical Farm – A combined European Endeavor for Sustainable Urban Agriculture
Page: 31
Figure 5-1: Figure showing a cross section through one of the growth racks illustrating the different lighting placements. The return conveyer transports the gutters back towards the core where they are harvested
This level of production will produce a maximum of eight heads of lettuce per day, per lettuce mod-ule. This equates to 1.615,2 kg of edible mass per day. This level of production will allow each square meter of growing area to produce 117 kg of edible produce per year. Calculating the Harvest Index (HI) of a crop looks at the ratio of edible mass to the inedible mass. For lettuce the HI is 0,85, assuming a uniform distribution of cellular water, this will result in the production of 242 kg of inedi-ble mass per day.
The lettuce is packed in boxes of 0,24 m2 (dimensions 40 x 60 x 20 cm), each box contains twelve heads of lettuce. There will be four boxes arranged in a standard EPAL pallet (80 cm x 120 cm). Each box will weigh approximately 2,4 kg, and will be stacked twelve boxes high. This results in a total of forty boxes per pallet, with a total pallet weight of 96 kg. The total production will be approximately seventeen pallets per day. Inedible matter is sent to the ground floor through a chute to be pro-cessed outside the building.
Gutters are washed following each use using a mobile gutter washing system to keep them free from any buildup of algae or other biological waste/growth that could promote plant pathogens from en-tering the facility.
5.2 High Wire, Tomato, Cultivation System The total life cycle for tomato is 335 days from seed to harvest, with the remaining 30 days of the year allocated to production area cleaning. The cleaning procedure of the production area involves replacing the plastic covering on the floor (see Figure 5-2), removing the plants from the previous harvest, and replacing the growing slabs. The entire area is cleaned, and the waste is transported via waste chute to the ground floor for disposal.

Vertical Farming 2.0 - Designing an Economically Feasible Vertical Farm – A combined European Endeavor for Sustainable Urban Agriculture
Page: 32
Seed germination takes place in the germination rooms located in the core of the tomato module. This period lasts approximately two days. The sprouted seedlings move to the nurseries where they spend 42 days (see Table 5-2). During the first nursery phase (10 days) Rockwool Plugs are used as the substrate, then plants are transplanted into Rockwool cubes for the second 32 day period. The plant moves into the cultivation system, where the main growing stages begin in Rockwool slabs (Grodan ®) using a one stem high-wire cultivation method (see Figure 5-2), with a plant density of 2,5 plants/m2.
Figure 5-2: Example of a high wire cultivation system
The main growing stage is 302 days, divided into two phases; the first phase lasts 54 days from trans-plant to the first harvest, and the second stage is until cleaning. Each of the phases has its particular lighting conditions outlined in Table 5-2. Harvest occurs when the fruit truss is approximately 1 kg in fresh weight. Harvesting is done by hand to ensure consistency and quality.
Table 5-2: Optimal conditions for the vine crop production
Stage Days Temperature [°C]
Relative Humidity
[%]
Light [μmol/m2/s]
CO2
[ppm]
Wind speed [m/s]
Germination 2 23 95 200 1.000 0,3-0,5
Nursery Phase 1 10 23 80 200 1.000 0,3-0,5
Nursery Phase 2 32 23 80 200 1.000 0,3-0,5
Growth Phase 1 54 23 75 250 1.000 0,3-0,5
Growth Phase 2 248 23 75 350 1.000 0,3-0,5
Tomatoes are harvested and are immediately packed in boxes and sent, via lift, to the logistics floor for storage.
With a production area of 1.700 m2 containing 18 rows and a plant density at harvest of 2,5 pl/m2, there is a total of 4.250 plants in the cultivation zone. The yield of the Lyterno® RZ variety is 63,5 kg/m2 per year and for the Brioso® variety 50,8 kg/m2 per year; calculations for maximum process

Vertical Farming 2.0 - Designing an Economically Feasible Vertical Farm – A combined European Endeavor for Sustainable Urban Agriculture
Page: 33
time and capacities are done using the variety with the biggest yield. The total numbers of harvest days are 248; this results in approximately 435 kg of fruit per harvest day per tomato module. The total accumulated weight is 107.950 kg per year for each tomato module.
The harvested fruit is packed in a box of 0,12 m2 (dimensions 40 x 30 x 14) with three kilograms of tomatoes. There will be eight boxes arrange in a standard EPAL pallet (800 mm x 1.200 mm). The boxes are stacked seven boxes high. This results in a total of 56 boxes per pallet, with a total pallet weight of 168 kg. The total number of boxes needed per day is 145. The total production will be approximately 2,6 pallets per day. Harvesting is done in approximately five hours a day. The total amount of boxes to be processed by each worker per day is approximately 49. The Harvest Index (HI) is set at 0,60, which results in 719.67 kg of inedible matter (taking into account 107.950 kg is 60%) per year or 290 kg per day per tomato module.
5.3 Options and Trades During the planning phase of this study, much discussion revolved around the optimum method of plant growth for the lettuce module. The four levels of the racks allow for a few different methods of plant cultivation, each with their own positive and negative attributes. Above, the baseline design was described; here a second option is presented, together with reasons for the selection of the baseline design.
The mobility of the gutter system allows for the design of dynamic systems where the gutters are in constant motion, traveling through the different lighting conditions to produce the harvest ready lettuce. It was proposed that the levels be divided up into the 3 growth zones, with the top level housing the freshly transplanted lettuce, the second level housing the second growth phase and the third and fourth levels housing the final growth phase.
In the above diagram (see Figure 5-3) freshly planted gutters are placed on a conveyer belt on the upper right-hand corner, with a cycle time of ten days. Upon reaching the end of the level, and the end of the first growth phase, the gutter is automatically lowered to the next level through a trap door system. Once the gutter reaches the second level, it travels in the opposite direction for 9 days until reaching the end, where it is lowered to the next level. Once the gutter arrives at the third lev-el, it begins the last growth phase which is split over two levels to accommodate the ever increasing spacing between the gutters. After nine days traveling through the bottom two layers of the growth rack, the gutter reaches the end 28 days later, ready to be harvested.
This system has both advantages and disadvantages over the baseline system. Space considerations play a significant role when trying to optimize the output per square meter of the production area;
Figure 5-3: Cross section diagram showing the different growth phases on each level and the movement of the gutters through the levels

Vertical Farming 2.0 - Designing an Economically Feasible Vertical Farm – A combined European Endeavor for Sustainable Urban Agriculture
Page: 34
this system is very space efficient because harvesting and planting take place on the same side of the growth rack. This allows the rack to be placed closer to the wall as well as reducing the transport distances of harvested crops to the core module.
The main disadvantage of this system is the fact that it would need to be continuously moving. In this situation, the limiting factor to how many gutters one can harvest each day is the speed at which the last conveyer belt delivers the gutters to the end of the rack. Due to that challenges of continuous harvesting and the speed at which the conveyer belt delivers the gutters to the harvesting point the baseline design was chosen.
5.4 List of Equipment - Key Values The key values involving the horticultural procedure subsystems are presented in Tables 5-3 & 5-4. They comprise the elements used in the operation and logistics of processes concerning the crop cycle from seed to post harvest in each module.
Table 5-3: Key values of the Horticulture procedures subsystem: Lettuce Module
Operational Elements Units Peak power
[W/unit] Total peak power [W]
Price [€ /unit] Total Cost [K€]
Nurseries 2
1.000,00 2
Gutter Rack Structure** 257.259
0 2,50 643
Gutter Rack Controller and Motors
18 400 7200 600,00 10
Washing Machine 1
0 10.000,00 10
Germination Racks 1
30.000,00 30
Production Elements
Rockwool Cubes and Cups 353.400
0,20 70
Waste Transport* 5.000
0,40 2
Gutters 10.000
5,00 50
Pallets for Transport 2.000
15,00 30
Trolleys 3
100,00 0,3
Packing Tables 3
500,00 1
Plastic Wrappers* 5.000
1,15 5
Spares, Consumables, Tools
-
Total Lettuce Module
7.200,00
856
Margin [%] 20,00
Total Cost Lettuce Module 1.027
*values per m2 ** calculated by the amount of material (kg)
Vertical Farming 2.0 - Designing an Economically Feasible Vertical Farm – A combined European Endeavor for Sustainable Urban Agriculture
Page: 35
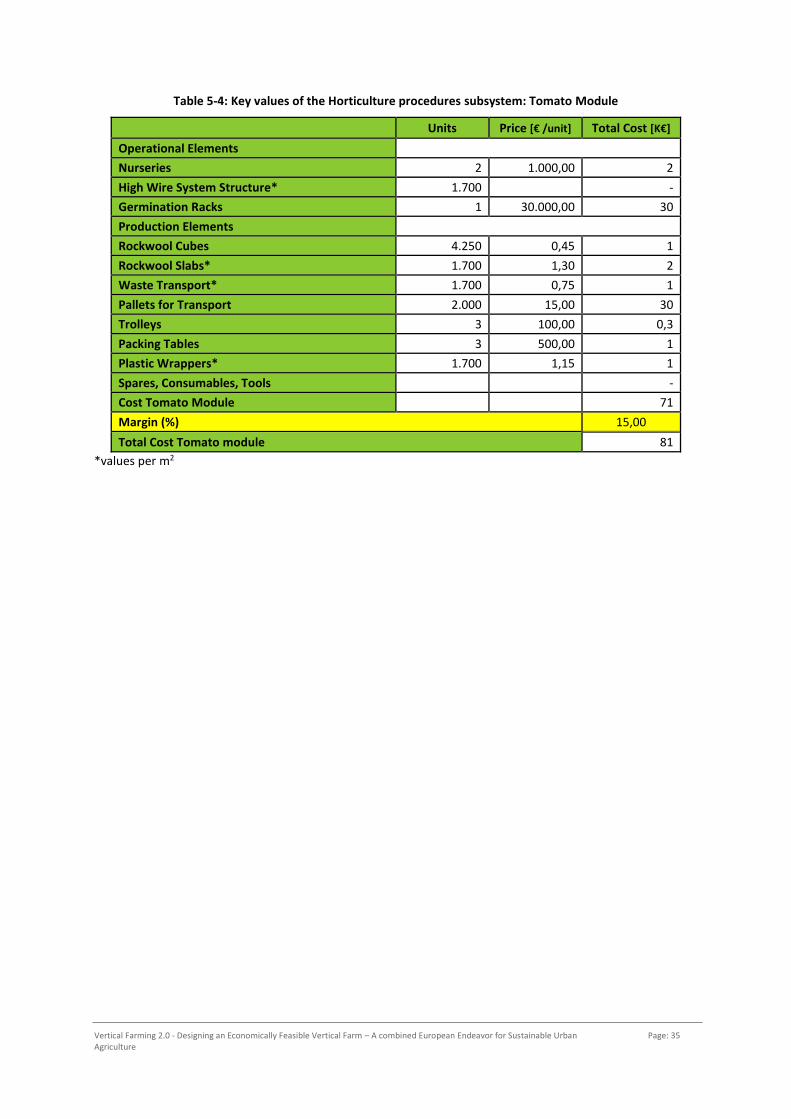
Table 5-4: Key values of the Horticulture procedures subsystem: Tomato Module
Units Price [€ /unit] Total Cost [K€]
Operational Elements
Nurseries 2 1.000,00 2
High Wire System Structure* 1.700
-
Germination Racks 1 30.000,00 30
Production Elements
Rockwool Cubes 4.250 0,45 1
Rockwool Slabs* 1.700 1,30 2
Waste Transport* 1.700 0,75 1
Pallets for Transport 2.000 15,00 30
Trolleys 3 100,00 0,3
Packing Tables 3 500,00 1
Plastic Wrappers* 1.700 1,15 1
Spares, Consumables, Tools
-
Cost Tomato Module
71
Margin (%) 15,00
Total Cost Tomato module 81
*values per m2

Vertical Farming 2.0 - Designing an Economically Feasible Vertical Farm – A combined European Endeavor for Sustainable Urban Agriculture
Page: 36
6 Nutrient Delivery System
This section describes the Nutrient Delivery System (NDS)>. The nutrient distribution from the fresh water source to the cultivation system is similar in both cultivation modules designs, varying mainly in component sizing. The irrigation method used is a Nutrient Film Technique (NFT) system. A de-tailed description of the nutrient flow in the cultivation system is given for each of the modules. All calculations and requirements are based on the capturing of water produced during crop transpira-tion; all transpired water is reclaimed through dehumidification in the air management system (see Chapter 8) and sent back into the system.
6.1 Baseline Design The system was developed to be a closed loop design (see Figure 6.1). Located in the core of each module is the subsystem. Water from the fresh water tank with the addition of the water reclaimed from plant transpiration is pumped into the stock solution tanks (Solution A Tank and Solution B Tank). A Priva Nutrijet system (see Figure 6-2) is utilized to control the flow of water from the fresh water tank, the addition of solutions from both tank A and B and the acid and base control to ensure an optimal nutrient solution in the Mixing Tank. By using two stock solutions (A and B) the nutrient balance can be maintained for a longer period of time. Electric Conductivity (EC) and pH sensors are placed at the junction of the incoming fresh water and the mixing tank of the injection system to assess fresh water quality. These sensors are also placed in a separate loop coming from the mixing tank before the nutrients are distributed to the cultivation system to ensure the proper dosage. Sand and fine filters are placed before the distribution and a flow meter is used to make sure the system is working correctly.
Figure 6-1: Diagram of the nutrient delivery system of the modules

Vertical Farming 2.0 - Designing an Economically Feasible Vertical Farm – A combined European Endeavor for Sustainable Urban Agriculture
Page: 37
Figure 6-2: Priva Nutrijet system
After irrigating the plants, the nutrient solution is pumped through UV sterilization treatment and into distributed nutrient solution buffer tanks. The incoming fresh water only tops off distributed nutrient solution buffer tanks which empty slowly through plant activity and any leaks or grower activities. The bulk solution tanks and mixing computer system are placed in the NDS room located in the core of the module, clean access (from inside the plant growth area) is provided to this room. The two fresh water tanks are set to be 150 m3 to allow for expansion of modular production of the Vertical Farm without new investment, which supplies enough fresh water needed for all the initial modules.
The baseline nutrient solution is designed following comprehensive analyses of the supply water to factor in native minerals and pH levels. Over time, the nutrient solution inside the system will be-come unbalanced. The rate of nutrient absorption by the plants may change for different ions, and the lack of individual ions cannot be restored using a dual stock solution system. This can be solved by analyzing the time it takes for an important imbalance in the nutrient solution to occur and flush-ing the system completely. The nutrient solution is restored approximately every six months.
6.1.1 Gutter System, Lettuce, Irrigation The initial calculations for the irrigation needs of the system were based on the transpiration rate of the mature crop. For a fully grown lettuce, the transpiration rate is 3 liter per m2 per day, and a wa-ter buffer of 27 liter per m2 per day was assumed. For a 5.000 m2 cultivation area, this amounts to 150 m3 per day or 30 liter per m2 per day for each lettuce module. The distributed nutrient solution tanks are 75m3 (75.000 liter) per module.
Each growth rack is divided into four growth levels of one meter each, each equipped with a drain and an irrigation pipe with individual drippers (see Figure 6-3). Irrigation is suspended above each channel to allow for mobility of the gutters. Drainage channels leading to the reservoirs are present underneath both irrigation side and drain side to capture any leaks. Each grow unit has a dedicated 845 W pump for irrigation, with an irrigation cycle of 5 minutes on, 10 minutes off, throughout the day. By staggering irrigation cycles between racks, it allows for a smaller distributed nutrient solu-tion tank size.
Each of the dripper manifolds was assumed to work with 2 bars of pressure at the inlet and was sized at 16/13,6 mm (outer/inner diameter). Pressure losses due to elbows and tee flows are taken into account. The maximum velocity inside the pipes was 2,2 m/s and a design pressure of 1,72 bar was used. The calculation resulted in a 2 meter distribution inlet line per rack of 69,5 mm Ø (2 ½ inch)

Vertical Farming 2.0 - Designing an Economically Feasible Vertical Farm – A combined European Endeavor for Sustainable Urban Agriculture
Page: 38
and 1 meter sections of 84,6 mm Ø (3 inch) and 108 mm Ø (4 inch) each. The main distribution line pressure and velocity allows for the use of only 108 mm Ø (4 inch) pipes, approximately 50 meters long. The return pipe length was estimated in 60 meters.
Figure 6-3: Cultivation rack irrigation and drain
6.1.2 High Wire, Tomato, System Irrigation Irrigation is provided via one pump, irrigating each of the 18 rail growth slabs. Collected water re-turns to the distributed nutrient solution tank which is pumped back through filtration and into the mixing tank for irrigation (as explained in Chapter 6.1). The transpiration rate is 4 liter per m2 per day, and a water buffer of 2 liter per m2 per day was assumed. For a 1.700 m2 cultivation area, this amounts to 10,2 m3 per day or 6 liter per m2 per day for each tomato module, the distributed nutri-ent solution tanks are 10 m3 (10.000 liter), staggered irrigation allows for smaller tank sizes.
6.2 Options and Trades Irrigation calculations were performed with the maximum plant transpiration rate to build in a mar-gin over the likely scenario. It can be envisaged that the irrigation system can be customised to pro-vide only the required amount of nutrient solution based on a changing transpiration rate. Transpi-ration rates and water uptake demands for maturing plants would need to be calculated to allow for this development dependent irrigation system. This would mean an overall drop of water used and a reduction in the energy consumption of the pumps.
Drainage Chanel
Drainage Chanel with floating inlet irrigation dripper
Growth Gutter
Nutrient Solution Flow

Vertical Farming 2.0 - Designing an Economically Feasible Vertical Farm – A combined European Endeavor for Sustainable Urban Agriculture
Page: 39
6.3 List of Equipment - Key Values The key values involving the NDS are presented on the Tables below (Table 6-1). They comprise the elements of the hydroponic system and water transportation of each module.
Table 6-1 Key values of the water distribution system and nutrient delivery subsystem: Lettuce Module
Units
Mass [kg/unit]
Total Mass [kg]
Peak Power [W/unit]
Total Peak Power [W]
Price [€ /Unit]
Total Cost [K€]
Nutrient Solu-tion
3.019 474 1.431.006
0 44,5 134
Water Tanks* 5.000
0
0 13,5 67
Priva Nutrijet System
1 450 450 900 900 30.000 50
Pumps 2
0 4.500 9.000 3.000 6
Emitters* 5.000
0
0 1,4 7
Spares, Con-sumables, Tools
0 n.a. n.a. 9.000 9
Total lettuce Module
1.431.456
9.900
273
Margin [%] 20,00
Total Cost Lettuce Module 301
*price per area
Table 6-2: Key values of the Nutrient delivery subsystem: Tomato Module
Units Mass
[kg/unit] Total Mass
[kg] Peak Power
[W/unit] Total Peak Power [W]
Price [€ /Unit]
Total Cost [K€]
Nutrient Solu-tion
1.369 474 44,5
60
Bulk Solution Tanks*
1.700* 13,5
22
Priva Nutrijet System
1 450 450 900 30.000
50
Emitters* 1.700* 1,4
2
Spares, Con-sumables, Tools
n.a. n.a. 9.000
9
Total Tomato Module
450,00 -
145
Margin [%] 10,00
Total Cost Tomato Module 153
*price per area

Vertical Farming 2.0 - Designing an Economically Feasible Vertical Farm – A combined European Endeavor for Sustainable Urban Agriculture
Page: 40
7 Illumination System
The analysis of the lighting system is of great importance for VF 2.0 design. It significantly affects the energy consumption of the building, both due to the quantity of lights and duration of the photoper-iod, and due to its effects on the thermal load within the building. Lighting design influences the photosynthesis rate of the crop, which impacts the final marketable yield. This section addresses the types of lighting systems required for the illumination of the crops in the two different cultivation modules and the resulting energy loads on the building. The assumed photoperiod for the calcula-tions is 18 hours for both modules. The lights named in this section serve as an approximation of the type of light, power consumption and cost involved. Features and properties of lights described be-low are loosely based on mentioned light models and would need to be custom made for this facility.
7.1 Baseline Design 7.1.1 Gutter System, Lettuce, Cultivation The lights in the gutter system, lettuce, cultivation rack should provide optimal lighting conditions without disturbing the optimal climatic conditions of the plant; a rise in temperature near the plant canopy due to heat from the lighting system needs to be avoided. The light selected as a model for these features is the Heliospectra LightBar V101G-L (see Figure 7-1). It is optimized for water cooling and specifically developed for VF applications. It produces a light spectrum specially designed to optimize photosynthesis. Its dimensions are 1235 x 56 x 62 mm and its power consumption is ap-proximately 125 W at normal operation.
Figure 7-1: Heliospectra LightBar V101G-L
The lamps should be placed at 0,25 m from the top of the plant canopy. For the first section (see green bar in Chapter 5 Figure 5-1) of the growth level, where the plants are in the early development stage (day 0-10), the lighting system should provide 200 μmol m-2 s-1 of Photosynthetically Active Radiation (PAR), defined as light available for photosynthesis between the wavelengths of 400-700 nm, and 30 μmol m-2 s-1 of Far Infrared Radiation (FIR). Throughout the middle section of the growth levels (see red bar in Chapter 5 Figure 5-1), where the plants are in the second phase of development (day 10-19), the lighting system should provide 225 μmol m-2 s-1 PAR and 34 μmol m-2 s-1 FIR. For the final section (see blue bar in Chapter 5 Figure 5-1) of the growth levels, where the plants reach ma-turity (day 19-28), the lighting system should provide 250 μmol m-2 s-1 PAR only.
The lighting system layout is designed with sets of four light bars mounted end to end, perpendicular to the length of the growth rack Each level of the growth rack contains 70 sets of lights, thus there is a set of lights every 0,71 m. Each set is powered by an Artesyn ™ LCC 600 watt conduction cooled AC-DC power supply (see Figure 7-3 & 7-3).

Vertical Farming 2.0 - Designing an Economically Feasible Vertical Farm – A combined European Endeavor for Sustainable Urban Agriculture
Page: 41
Figure 7-3: Top view of the lighting system in one level of the cultivation rack
Each light set is supplied with 500 W to power the lights, which adds to 35000 W per level in each growth rack. Each growth rack has four grow levels with lights; the total power demand for each cultivation rack is 140 kW. The total power needed for the whole cultivation area is 704 kW. Ap-proximately 40% of the heat is dissipated by the liquid cooling (282 kW), the rest is radiated to the surrounding air (422 kW).
The nurseries use a separate lighting system which provides 150 μmol m-2 s-1 PAR, with a power con-sumption of 30 kW. This brings the total power consumption for the lettuce production module to 734 kW.
7.1.2 High Wire, Tomato, Cultivation System For the tomato cultivation module, top lighting and intra-canopy lighting systems are needed. Top lighting is modeled on the Heliospectra LX602 (see Figure 7-4). It has an air force convection cooling system, provided by a variable speed fan. Its dimensions are 425 x 219 x 199 mm and its power con-sumption is approximately 600 W at normal operation. This light would allow for real-time spectrum and intensity adjustment to continually optimize the lighting recipe as the crop develops. This light needs a specialized optics plate to achieve a broad and uniform distribution of the light spectrum.
Figure 7-2: Figure showing the LightBar set up in the Lettuce module growth racks

Vertical Farming 2.0 - Designing an Economically Feasible Vertical Farm – A combined European Endeavor for Sustainable Urban Agriculture
Page: 42
Figure 7-4: Heliospectra LX602
The top lights will be maintained at 1 m from the top of the crop, which allows the crop to reach a maximum height of 4 m. The top lighting system should provide 150 μmol m-2 s-1 PAR and 30 μmol m-2 s-1 FIR. 190 top lights will be placed in each tomato cultivation module, this results in 112 kW of power to be supplied to each module for the top lights. To provide the high light intensities that are required later on in the growth and fruiting of the tomato plants there are two levels of intra-canopy lights positioned within the double rows (see Figure 7-5). These lights provide 221 μmol m-2 s-1 PAR and will be switched on once the crop is sufficiently tall enough. Total energy consumption of the module is 195 kW, which includes 6,6 kW of the nurseries located in the work area and 76 kW of intra-canopy lighting (consumption per light is 105 W).
Figure 7-5: High wire cultivation module with a diagram showing the arrangement of the two levels of Intra-canopy lights (yellow bars)
7.2 Options and Trades As stated at the beginning of this chapter, the lights named in this section would not be used as they are currently advertised. This study represent future advances in the LED lighting industry as well as custom designs for VF 2.0 specific needs and characteristics. This is an area which significant savings can be found depending on the in-house consultation on the illumination system during VF 2.0 con-struction.

Vertical Farming 2.0 - Designing an Economically Feasible Vertical Farm – A combined European Endeavor for Sustainable Urban Agriculture
Page: 43
7.3 List of Equipment - Key Values The key values involving the illumination subsystem are presented in the Tables 7-1 & 7-2. The amount of energy, mass and price was obtained from the official website of Heliospectra. The infor-mation is presented per module.
Table 7-1: Key Values of Illumination Subsystem: Lettuce
Units Peak power
[W/unit] Total peak power [W]
Price [€ /unit]
Total Cost [K€]
Heliospectra LightBar V101G-L Racks
5.600,00 125 239,00 1.338
Artesyn ™ LCC 600 Power Supply 1.400,00 240,00 336
Water Cooling System Lettuce* 5.000 5,45,00 27
Heliospectra LightBar V101G-L Nursery Lettuce
240 125 239,00 57
Water Cooling System Nursery Lettuce*
312 5,45 1
Spares, Consumables, Tools n.a. n.a.
-
Total Lettuce Module
- 1.760
Margin [%] 10
Total Cost Lettuce Module 1.936
* Values per square meter
Table 7-2: Key Values of Illumination Subsystem: Tomato
Units Peak power
[W/unit] Total peak power [W]
Price [€ /unit]
Total Cost [K€]
Heliospectra LX602 187 600 2.000,00 374
Intra-canopy Lighting System 724 105 239 173
Heliospectra LightBar V101G-L Nursery Tomato
53 125 239 12
Water Cooling System Nursery Tomato*
312 5,45 1
Spares, Consumables, Tools n.a. n.a.
-
Total Tomato Module
- 561
Margin [%] 10
Total Cost Tomato Module 617
*values per square meter

Vertical Farming 2.0 - Designing an Economically Feasible Vertical Farm – A combined European Endeavor for Sustainable Urban Agriculture
Page: 44
8 Air Management & Thermal Control System
The air management and thermal system are required to maintain the optimal conditions for crop growth. Its design can impact the cost of a VF due to its effects on energy consumption. It relates to several other subsystems, e.g., nutrient delivery and illumination, water and heat recovery. A de-tailed description of the energy consumption of the system and estimations of the flow rate are giv-en in this section. The goals of the design are to optimize the energy balance between energy gener-ators and energy users to ensure optimal growing conditions for each crop.
In a normal Heat Ventilation and Air-Conditioning (HVAC) system, the air is provided by air handling equipment which receives air from outside the building, and air recirculated from the inner space. The outside and return air are mixed in the mixing chamber, filtered, treated, and delivered to inner areas through metal ducts. These metal ducts discharge the air into the inner space, usually through supply air diffusers located at the end of the ducts. In VF 2.0, the air handling equipment located in the core of each module is a heat pump, which cold buffer for storage can transport the thermal energy removed from the growing compartment to a hot or (see Figure 8-1). This will allow for the reuse of energy obtained from the removed heat from the plant compartments to be used as heating for the ground floor or core areas. The buffer also contains the energy from the cooling lines of the LED cooling system.
Figure 8-1: Diagram of energy transport in the vertical farm AMS system
As mentioned above the cultivation area air will have two major sources of thermal energy: sensible energy from the LED lighting system and latent energy from transpiration of the crops. The air man-agement and thermal control systems primary goal is to remove this extra energy to maintain opti-mal growing conditions. Warm and moist air from the plant compartment is transported to the air management and thermal control system room, located in the core of the module, where it is mixed with CO2 to obtain optimal CO2 levels. This air is then moved to the first stage of the heat pump where it is cooled, allowing it to decrease its humidity content by means of condensation. This re-claimed water is transported to buffer tanks, filtered through a UV filter, and used later by the nutri-ent delivery system. The cooled air (with high relative humidity) then passes to the second stage of the heat pump where it is heated again to deliver air that will provide the target conditions inside the growth compartment. Extra heat will dissipate through heat exchanger units mounted on the side wall of the core structure in each module.
The design of the system is based on the capacity to dehumidify the warm moist air coming from the cultivation areas to maintain optimal conditions. The ventilation rate needed to remove the extra humidity content from the growth compartment air can be calculated using the following equation:

Vertical Farming 2.0 - Designing an Economically Feasible Vertical Farm – A combined European Endeavor for Sustainable Urban Agriculture
Page: 45
where is the required ventilation rate in m3/m2/h, is the evapotranspiration rate of the crop in g/m2/h, is the absolute air humidity inside the compartment in g/kg, is the absolute air humidity of the air at the outlet of the air management system in g/kg and is the density of the air in kg/m3. It is assumed that 100 % of the water vapor in the treated air is recovered. The total ener-gy removed from the ventilated air is obtained from the following equation:
Where is the energy removed in kW/m2, is the evaporation heat of water at 0°C in kJ/kg, is the enthalpy inside the compartment in kJ/kg, and is the enthalpy of the air from the
outlet of the air management system in kJ/kg.
8.1 Baseline Design 8.1.1 Gutter System, Lettuce, Cultivation The desired conditions inside the lettuce production area are 23°C and 80 % relative humidity (RH) (Jasper den Besten, HAS university). It is assumed that most of the evapotranspiration of the plants occurs during lighting hours, the photoperiod for this crop is 18 hours of light per day. Evapotranspi-ration of the crop was only considered for the photoperiod of 18 h (Jasper den Besten, HAS universi-ty). Using a maximum evapotranspiration value of 3 l/m2 per day (18 h), it results in 167 g/m2 per hour of water vaper added to the air by the plants.
In order to achieve a de-humidification of 167 g/m2 per hour and assuming the air management sys-tem provides cooling conditions of 10°C and 100 % relative humidity, a ventilation rate of 21,9 m³/h is needed for each square meter of cultivation surface. The latent energy removed at this stage is 0,116 kW per square meter of cultivation space and the removed sensible heat is 0,210 kW/m2, which results in a total energy removal of 0,326 kW/m2. The total recirculation ventilation rate of a single 5.000 m2 lettuce module cultivation area is 109.686 m3/h. It is assumed that the module needs 8 refreshments of outdoor air per day, which adds 3.500 m3/h. This addition of environmental air will add to the final amount of CO2 which needs to be added to the growth compartment. The CO2 requirements were calculating assuming an average assimilation rate of the crop inside the leafy greens module of 4 g/m2 h and in the high wire cultivation module of 5 g/m2. External CO2 concen-tration was assume constant at 400 ppm.
It is assumed that the air is reheated to 21°C before reintroducing it to the plant compartment. The temperature at the outlet of the ventilation ducts is 21°C and the absolute humidity of 7,6 gH2O/kgair, which results in a relative humidity of 49,5%. The air management process represented in the psy-chrometric chart of the closed loop is shown in Figure 8-2.
A total of 0,084 kW/m2 is needed to reheat the air to 21°C. The total recovered heat from the pro-cess is 0,242 kW/m2. Power consumption for this processes are estimated in hot and cold cases. In the hot case, the energy consumption for the HVAC system is 400 kWh per year, with a peak day of 1,85 kWh with a coefficient of performance (COP) of 2,6. In the cold case, the energy consumption for the HVAC system is 160 kWh per year, with a peak day of 1,10 kWh with a COP of 4,5.

Vertical Farming 2.0 - Designing an Economically Feasible Vertical Farm – A combined European Endeavor for Sustainable Urban Agriculture
Page: 46
The supply of air to each layer of the cultivation rack is done using a 500 mm round duct, this duct keeps allowable air speeds below 8 m/s. 90°angles should not be used in the pipe to avoid pressure loss. Distribution of air inside the levels of the racks is achieved using 5 channels of 500 mm x 200 mm which results in air speeds of approximately 0,3 m/s. The logical layout is one channel for every meter of layer width (see Figure 8-3).
Figure 8-3: Segment of the gutter cultivation rack and location of the air ducts
8.1.2 High Wire, Tomato, Cultivation System The desired conditions inside the tomato compartment are 23°C and 80% of relative humidity. Using a maximum evapotranspiration value of 4 l/m2 per day, it results in 223 g/m2 per hour of water vapor added by the plants (Jasper den Besten, HAS university).
In order to achieve a de-humidification of 223 g/m2 per hour and assuming the air management sys-tem provides cooling conditions of 10°C and 100 % relative humidity, 27,5 m³/h is needed for each square meter of cultivation surface. The latent energy removed at this stage is 0,154 kW per square meter of cultivation and the sensible energy is 0,280 kW/m2, which results in 0,435 kW/m2. The total recirculation ventilation rate of a single 1700 m2 cultivation area module is approximately 43.875 m3/h. The same refreshment rate as the lettuce module is assumed to ease calculations.
It is assumed that the air is reheated to 21°C before reintroducing it to the growth compartment. The temperature at the outlet of the ventilation ducts is 21°C and relative humidity of 49,5 %. The same amount of power is needed to heat the air as in the lettuce module. Additionally the hot and cold cases remain the same as stated above in section 8.1.1.
Figure 8-2: Closed-loop air dehumidification and heating

Vertical Farming 2.0 - Designing an Economically Feasible Vertical Farm – A combined European Endeavor for Sustainable Urban Agriculture
Page: 47
8.1.3 Redistribution of Heat Energy To perform theoretical calculations, the city of Berlin was chosen, due to its spatial characteristics and availability of climatic data. A yearly analysis was made to assess if this energy redistribution was a possibility. A value for temperature and relative humidity from the coldest and warmest year in a time series of 50 years was used. Climatic data was obtained from the Berlin Tegel climatic sta-tion from the Hourly Values Archive of the German Weather Services. An average value for the solar irradiance from a reference climate of Germany according to the DIN V 18599 series of pre standards Energy efficiency of buildings was also obtained.
The energy balance was modeled as two compartments per module, separating the cultivation area and the core area of each module. The ground floor area was separated into work area and core area. The heat sinks and sources for each compartment were stated as follows (according to the DIN V 18599 series of pre standards):
: Solar heat gains from transparent building elements,
: Solar heat gains from opaque building elements,
: Transmission to external zones,
: Transmission to unheated zones,
: Transmission to control zones,
: Transmission to the ground,
: Ventilation due to infiltration,
: Uncontrolled mechanical ventilation and
: Internal heat sources
The definition of a heat sink or source depends whether transmission of energy is from the building or to the building. Calculation procedures for the heat sinks and sources are stated in DIN V 18599-2.
The energy needed for heating the building zone is stated with the following equation:
Where is the energy needed for heating the building zone in kWh, is the sum total of all heat sinks in the building zone in kWh, is the sum total of all heat sources in the building zone in kWh, and is the utilization factor of the heat sources,
The energy needed for cooling the building zone is stated with the following equation:
Where is the energy needed for cooling the building zone in kWh. The calculation of the utiliza-tion factors ( is stated in DIN V 18599-2.
The calculation was done first for a simple building with the characteristics of VF 2.0. Then, the addi-tion of the heat by the lights in the cultivation room and the transpiration of the crops were taken into account.

Vertical Farming 2.0 - Designing an Economically Feasible Vertical Farm – A combined European Endeavor for Sustainable Urban Agriculture
Page: 48
The results are expressed in estimated kWh of energy needed to be added or removed, that is the average rate of energy transfer for that month. The results for single lettuce and tomato modules are shown below see Figures 8-4 and 8-5. Negative values indicate the need for thermal energy re-moval (cooling) and positive values indicate the need for the addition of thermal energy (heating). The results show that in each month the need to remove energy in the overall building is higher than the heating requirements. Which means that a buffer or storage of thermal energy is needed. A heat pump, will transport the energy to other parts of the building thus reducing the overall need for heating in each module to zero.
Figure 8-4: Average hourly energy needs for the lettuce level
Figure 8-5: Average hourly energy needs for the tomato level

Vertical Farming 2.0 - Designing an Economically Feasible Vertical Farm – A combined European Endeavor for Sustainable Urban Agriculture
Page: 49
Figure 8-6: Average hourly energy needs for ground floor
In the figure 8-6 above, the energy needs for the ground floor area are shown. For the winter months, direct exchange of heat energy from the cultivation modules to the ground floor area can be achieved. In the summer months excess energy has to be stored for alternative uses.
8.2 Options and Trades One solution to use the excess heat is to create heat distribution groups (see Figure 8-7) with the surrounding buildings. In this situation excess heat energy produced by VF 2.0 could be transferred to other structures either directly or to the city similar to the current feed in tariffs for solar energy.
Figure 8-7: Yearly energy management sketch for heating distribution around VF 2.0

Vertical Farming 2.0 - Designing an Economically Feasible Vertical Farm – A combined European Endeavor for Sustainable Urban Agriculture
Page: 50
This could further reduce the overall thermal management cost and increase efficiency. This is a concept that was outside the scope of this study; however it would be useful to further explore this system.
Another concept discussed but not developed was the cooling of the air using a mixture of recircu-lated air and cool outside air. The concept is valid only for cold climates like the one analysed in Ber-lin. Addition of air is taken into account in the baseline design of VF 2.0, but it is only used to refresh the inside air at a minimal rate. This system would use the outside air to cool the air coming from the growth compartments thus reducing energy costs. This system was not further developed but could be used in the future to reduce the costs of VF 2.0.
8.2.1 Centralised and Decentralised Air Distribution The distribution of the air inside the lettuce cultivation area should be consistent with the rest of the subsystems of VF 2.0. Several options of air distribution systems were considered. The centralized system involving side pipes allows easy access to the crop at the harvest point (see Figure 8-10). This system also allows the vertical movement of the gutters during planting and harvesting, discussed in chapter 5. Further analysis of the dimensions of the pipes resulted in a blocked corridor between the growth racks. The actual air distribution across the five meters of the gutter rack needs to be as-sessed. A possible solution for insufficient pressure to push the air through the racks is the addition of a negative pressure duct system to allow for the correct flow of air.
Figure 8-10: Centralized air management system with side ducts.
A decentralized air management system for the rack cultivation was also considered. The systems working principle is a transversal movement of air from one air management unit to the other; these units are located on each side of a growth rack, spaced 5 meters apart. Each unit handles the air for those 5 meters using a duct system (see Figure 8-). There are also big ducts at the top of the room to transport the moist, hot air to the initial air management unit. Each of the air management units has a drain pipe in which the condensate is transported to the return tanks. This scheme was thought to decrease the amount of ducts needed for air management. This concept also causes space problems in the corridors between the racks.

Vertical Farming 2.0 - Designing an Economically Feasible Vertical Farm – A combined European Endeavor for Sustainable Urban Agriculture
Page: 51
Figure 8-11: Decentralized air management system with a side supply and return ducts.
A centralized system with rectangular ducts, which run the length of the growth rack above the crop, poses some difficulties (see Figure 8-12). The connection between the main ducts (circular) and the ducts of the cultivation area (square) is not optimal due to space restrictions. Additionally this design limits the space at the end of the growth rack which would be used to harvest the crop
Figure 8-12: Centralized air management system with rectangular ducts over the crop.

Vertical Farming 2.0 - Designing an Economically Feasible Vertical Farm – A combined European Endeavor for Sustainable Urban Agriculture
Page: 52
8.3 List of Equipment - Key Values The key values involving the air management and thermal subsystem are presented in Tables 8-1 & 8-2.The price of the components of the HVAC system are listed and based on the cooling or heating requirements calculated before for each module.
Table 8-1: Key values of air management and thermal subsystem: leafy greens module
Area [m2] Price [€ /m2] Total Cost [€]
Heat Pump System* 1 240.000 240.000,00
Main Distribution Groups 5.000 5,45 27.250,00
Duct System 5.000 0,34 1.700,00
CO2 Tanks [Pure Supply 50kg/ha h]* 1 3210 3.210,00
CO2 Supply System 5.000 0,34 1.700,00
Spares, Consumables, Tools -
Cost Lettuce Module 273.860,00
Margin [%] 20,00
Total Cost Lettuce Module 328.632,00
*price per unit
Table 8-2: Key values of air management and thermal subsystem: high wire module
Area [m2] Price [€ /m2] Total Cost [€]
Heat Pump System 1 240.000 240.000,00
Main Distribution Groups 1.700 5,45 9.265,00
Duct System 1.700 0,34 578,00
CO2 Tanks [Pure Supply 100 kg/ha h] 1 3120 3.120,00
CO2 Supply System 1.700 0,34 578,00
Spares, Consumables, Tools -
Cost Tomato Module 253.541,00
Margin [%] 20,00
Total Cost Tomato Module 304.249,20
*price per unit

Vertical Farming 2.0 - Designing an Economically Feasible Vertical Farm – A combined European Endeavor for Sustainable Urban Agriculture
Page: 53
9 Plant Health Monitoring & Control Architecture
Controlling and monitoring the climate and status of the plants are essential elements in any agricul-tural production. It allows taking corrective measures in time to avoid a decrease in yield and a po-tential loss of marketable product. The automatic control of climate variables enables optimum con-ditions inside the cultivation modules, helps to reduce energy consumption and delivers the best product possible. In this section, monitoring and control elements of each of the modules are ad-dressed. Brief requirements for assuring a clean environment inside the plant cultivation modules are also described. Very similar monitoring and control methods are used in both the lettuce and the tomato module, for this reason, they will be discussed together.
9.1 Baseline Design To create a healthy growing environment, temperature, relative humidity (RH) and CO2 have to be carefully controlled. For optimum control, a climate controller located in the core of each module is installed to measure temperature, RH and CO2 sensors. Environmental conditions are constantly monitored and are electronically maintained (see Chapter 5 for detailed description). The amount of fresh air allowed into the building along with the recycled air is carefully controlled to keep the con-ditions stable and optimal
The climate controller receives constant measurements from several Priva E-Measuring boxes, or similar sensor, (see Figure 9-1) located in each cultivation area. The box contains sensors for tem-perature, RH and CO2. Nurseries are also equipped with these sensor boxes for climate monitoring. For the leafy greens module, 6 boxes are distributed in the cultivation area, and 2 for the vine crop module. The climate controller responds to these sensors to keep the optimal climactic conditions inside each cultivation module.
Figure 9-1: Priva E-Measuring box
Clean conditions inside the production modules are maintained through the use of an airlock decon-tamination system to ensure the growing environment remains clear of any plant pathogens or fun-gal and bacterial infections. In the airlock chamber, workers disinfect their hands using soap and water as well as put on sterile over suits with hairnets and shoe covers. In case of a contamination event, the responsible contaminant/pathogen will be identified and treated with hand held pump sprayers. To prevent insect and fly infestations, in case they are brought into the clean growth area, 50 Sticky cards are equally distributed inside the cultivation modules. Regular inspections by the head grower of the facility will help to identify any negative factors quickly and timely decisions can be made with regards to the required solution.

Vertical Farming 2.0 - Designing an Economically Feasible Vertical Farm – A combined European Endeavor for Sustainable Urban Agriculture
Page: 54
9.2 List of Equipment - Key Values The key values involving the plant health monitoring and control architecture subsystem are pre-sented in Table 9-1. They comprise the system sensors and monitoring equipment of each module. It also shows the elements involving decontamination.
Table 9-1: Key values of the plant health monitoring and control architecture subsystem
Units Total mass
[kg] Total peak pow-
er [W] Price [€ /unit] Total Cost [€]
Priva Box 8 24 2.400 500 4.000,00
Climate Computer 1 500 8.000 8.000,00
Sticky Cards 108 5,4
0,85 91,80
Cable [1m] 300 60
0,33 99,00
Manual Sprayer 1 5
40 40,00
Special Sensor 20 60 1.000 250 5.000,00
TOTAL Lettuce Module
154,40 3.900,00
17.230,80
Units Total mass
[kg] Total peak pow-
er [W] Price [€ /unit] Total Cost [€]
Priva Box 3 9 900 500 1.500,00
Climate Computer 1 500 8.000 8.000,00
Sticky Cards 104 5,2 0,85 88,40
Cable [1m] 100 50 0,33 33,00
Manual Sprayer 1 5 40 40,00
TOTAL Tomato Module 69,20 1.400,00
9.661,40
Decontamination airlock Units Total mass
[kg] Total peak pow-
er [W] Price [€ /unit] Total Cost [€]
Suits 100 50 6 600,00
Decontaminant 3 15 35 105,00
Desk for Control Room 1 30 170 170,00
Walkie Talkies [4 Per Module] 1 1 30 50 50,00
TOTAL Per Module 96 30
925,00
Control room per module Units Total mass
[kg] Total peak pow-
er [W] Price [€ /unit] Total Cost [€]
Workstation PC 1 11 300 950 950,00
Screen 2 11,4 70 270 540,00
Spares, Consumables, Tools
TOTAL Per Module 22,40 370,00
1.490,00
Cost Lettuce Module 272,80 4.300,00
19.645,80
Margin [%] 10
Total Cost of Lettuce Module 21.610,38
Cost Tomato Module 187,60 1.800,00 12.076,40
Margin [%] 10
Total Cost of Tomato Module 13.284,04

Vertical Farming 2.0 - Designing an Economically Feasible Vertical Farm – A combined European Endeavor for Sustainable Urban Agriculture
Page: 55
10 Labor Analysis & Schedule
A description of the labor requirements for VF 2.0 is given in this chapter. Labor requirements are based on the amount of produce the building needs to handle. Horticulture procedures as well as expertise needed to operate the facilities are taken into account. Some cost distribution examples from active VF facilities are presented.
10.3 Baseline Design While energy usage from artificial lighting is widely accepted as the limiting factor to the widespread adoption of VF, labor costs are arguably the second most challenging economic consideration. Japa-nese Plant Factories have been leading the development of commercial VF with over 196 (Kozai, 2015) in operation today. Mirai Co., a frontrunner in the vertical farming industry in Japan offers some insight into the costs of labor as a percentage of total operational costs, see figure 10-1.
Figure 10-1: Operational Costs of Plant Factories, Kozai, 2015
For this DLR study we chose to stack indoor cultivation using hydroponics and artificial light. As there is little information available on labor requirements per square meter for VF, the question first had to be answered in regards to the more established hydroponic greenhouse industry. Labor require-ments vary widely depending on the region and largely depend on the technologies and techniques used. For example, a small-scale 800 m2 greenhouse in Bronx, (NYC, USA) needed a greenhouse man-ager, grower, and 5 laborers to operate. In contrast, a 10,000 m2 greenhouse in the Netherlands re-quires a greenhouse manager and 6 laborers according to Jasper den Besten (HAS University) and Martin Veestra (Certhon).
This divergence in approaches led the labor analysis team for this study to lean towards the more experienced operations in the Netherlands as the source of the per square meter labor requirements per layer of indoor cultivation. Furthermore, the systems used in the proposed DLR study VF are mostly Certhon-based NFT gutter systems, which align with the source of the labor numbers because

Vertical Farming 2.0 - Designing an Economically Feasible Vertical Farm – A combined European Endeavor for Sustainable Urban Agriculture
Page: 56
many of the greenhouses utilize this same method for cultivating leafy greens. For the tomato mod-ule, a lower labor per square meter number was used because although indoor, it would only be a single layer of cultivation.
There are eight working hours in the day for each employee, and it was assumed 251 working days per year. This adds up to 2.008 hours per employee per year. As an initial assumption, the hours dedicated per year to a square meter of growth area in the gutter cultivation system module is 1,61 hours. For the high wire cultivation system, a value of 1,2 hours per square meter was used (in-person discussion). For the 5000 m2 cultivation area of the gutter cultivation, leafy greens module, there is a total of 8.032 hours of work needed. The total amount of workers needed for a single leafy greens cultivation module is 4, see Table 10-1.
Table 10-1: Results of labour requirements according to each crop
Crop Cultivation Area [m2]
Hours/Module/Year Hours/Employee/Year Number of Employees
Leafy Greens 5.000 8.032 2.008 4
Tomato 1.500 1.800 2.008 1
Despite its “high-tech” label, VF is still a form of agriculture and utilizes standard labor models of minimum wage. In Berlin Germany, minimum wage was estimated at 10 €/hour with added costs to the employer increasing that cost to 13,5 €/hour. Senior laborers could cost 15-17 €/hour (http://www.agri-info.eu/english/t_wages.php#de).
The proposed labor model for the DLR study VF is a General Manger, Part-time plant expert with a range of Senior and Junior laborers to support them. For cultivation of other types of crops, the la-bor requirements changes, for example, using the high wire cultivation system for cucumber will decrease the personnel in one. A snapshot of the labor model can be found in the Table 10-2.
Table 10-2: Labor costs depending on the type of crop
Employee Type Number Labor Costs per year [K€]
General Manager 1 58
Arborist 1 43
Agriculture Laborer (Leafy greens) 4 103
Agriculture Laborer (Vine Crop Module) 2 52
10.4 Schedule Before starting the activities, basic food safety protocols for VF employees should be followed. See Chapter 9. The following schedules are separated by crop and are based on in-person discussions with horticulture experts present at the study.
Lettuce Module Daily Schedule
Harvest NFT channels of leafy greens,
Place plants on conveyor,
Pack into boxes,
Send boxes down to logistics module,
Transplant from nursery into channels and
Clean channels and equipment

Vertical Farming 2.0 - Designing an Economically Feasible Vertical Farm – A combined European Endeavor for Sustainable Urban Agriculture
Page: 57
Tomato Module Daily Schedule
Harvest tomato fruits,
Place in crates for transport to logistics module,
Pack into boxes,
Weigh boxes,
Transplant from nursery into buckets/cubes,
Prune tomato plants and
Encourage plant growth and balance
10.5 List of personnel - Key Values The baseline design for the VF involves two modules of leafy greens and two modules of tomato. The yearly costs of such design are shown in Table 10-3.
Table 10-3: Key values of Labor needed for the VF 2.0 base line scenario (2 leafy greens modules and 2 vine crop modules).
Employee Type Number of Em-
ployees Labor Costs [K€ / year]
General Manager 1 75
Administrative and Support Service Activities 1 58
Marketing & Sales 2 111
Arborist (Part-Time) 1 86
Indoor and Maintenance Cleaning Activities 1 28
Agriculture Laborer (Tomato) 3 81
Agriculture Laborer (Leafy Greens) 8 215
Wage Cost Annual 658
Monthly 54
Margin [%] 30,00
Total Wage Cost Annual 856
Monthly 71

Vertical Farming 2.0 - Designing an Economically Feasible Vertical Farm – A combined European Endeavor for Sustainable Urban Agriculture
Page: 58
11 Power and Energy Consumption
The power consumption of the building is presented on this section. The peak power demand of the components presented in each subsystem section was used for the calculation of the total demand. It was assumed that the incoming power is processed on the ground floor and directed to control units located on each module. The lighting requirements for the core and ground floor area are cal-culated according to the DIN V 18599 series of pre-standards Energy efficiency of buildings. The de-tails of the energy balance for the thermal system can be found in Chapter 8.1.3.
In Table 11-1, the operation hours of each subsystem is shown. The nutrient delivery system opera-tion hours are calculated based on the irrigation time per hour; this allows an estimation of the prob-able time at peak consumption. The operation of the gutter system rack for the lettuce module is based on harvesting time per day. The illumination system was based on the photoperiod for the crops. Air management and Thermal subsystems as well as the plant health monitoring run continu-ously. The core areas in each module and the ground floor calculations were based on an eight hour work day. The calculation was done for constant peak power consumption in the hours of opera-tion.
Table 11-1: Hours of operation of each subsystem and relevant areas
Subsystem/relevant area Hours of operation per day
illumination Cultivation Area 18
Air Management 24
Nutrient Delivery 4,8
Plant Health Monitoring 24
Horticulture Operations 5
Core Area 8
Ground Floor Working Area 8
11.1 Baseline Design Each of the following tables gives the monthly energy consumption for the lettuce module and the tomato module separately. Additionally each table has a baseline scenario energy consumption, which is two lettuce modules and two tomato modules excluding the core and the ground floor which are calculated separately.
11.1.1 Illumination System The calculation of the energy consumption of the illumination systems was performed taking into account the daily peak power consumption of the lights used in a cultivation area and nurseries of a module. Calculations were performed with values from Chapter 7, Tables 7-1 and 7-2, together with the illumination period of 18 hours. The monthly energy consumption of the illumination system is shown in Table 11-2.

Vertical Farming 2.0 - Designing an Economically Feasible Vertical Farm – A combined European Endeavor for Sustainable Urban Agriculture
Page: 59
Table 11-2: Illumination system energy consumption
Lettuce [single module]
Tomato [single module]
Vertical farm energy consump-tion for baseline
scenario
Ene
rgy
Co
nsu
mp
tio
n [
KW
h]
JAN 407.340,00 108.723,51 1.032.127,02
FEB 367.920,00 98.201,88 932.243,76
MAR 407.340,00 108.723,51 1.032.127,02
APR 394.200,00 105.216,30 998.832,60
MAI 407.340,00 108.723,51 1.032.127,02
JUN 394.200,00 105.216,30 998.832,60
JUL 407.340,00 108.723,51 1.032.127,02
AUG 407.340,00 108.723,51 1.032.127,02
SEP 394.200,00 105.216,30 998.832,60
OCT 407.340,00 108.723,51 1.032.127,02
NOV 394.200,00 105.216,30 998.832,60
DEC 407.340,00 108.723,51 1.032.127,02
YEARLY 4.796.100,00 1.280.131,65 12.152.463,30
11.1.2 Air Management and Thermal System The power consumption of the air management and thermal system was calculated as described in Chapter 8, the air management system and thermal system run 24 hours a day.
The remaining or “free” heat from the cooling process was transported throughout the building areas, from the cultivation, to the core, to the ground floor areas. The cooling needs for those areas were also taken into account. The monthly energy consumption of the air management and thermal system is shown in Table 11-3.
Table 11-3: Air management and thermal system energy consumption
Lettuce [single
module] Tomato [single
module]
Vertical farm energy con-sumption for baseline
scenario
Ene
rgy
Co
nsu
mp
tio
n [
kWh
]
JAN 154.763,69 15.421,07 340.369,53
FEB 143.485,12 19.515,91 326.002,06
MAR 165.561,51 26.218,89 383.560,79
APR 168.848,50 35.134,17 407.965,34
MAI 177.449,93 38.107,31 431.114,47
JUN 175.037,20 41.529,16 433.191,64
JUL 181.106,77 41.764,15 446.102,23
AUG 201.557,65 62.215,04 528.135,92
SEP 173.833,90 40.285,75 428.239,29
OCT 172.632,35 33.289,74 411.844,18
NOV 156.858,44 22.744,44 359.205,75
DEC 158.997,92 19.655,30 357.306,44
YEARLY 2.030.132,97 395.880,92 4.853.037,64

Vertical Farming 2.0 - Designing an Economically Feasible Vertical Farm – A combined European Endeavor for Sustainable Urban Agriculture
Page: 60
11.1.3 Nutrient Delivery System The nutrient delivery system energy consumption calculation was performed using the peak power values found in Chapter 6, Tables 6-2 and 6-3. The running time was calculated based on a cycle of 10 minute on and 5 minute off leading to a daily run time of 4,8 hours. The monthly energy con-sumption of the nutrient delivery system is shown in Table 11-4.
Table 11-4: Nutrition delivery system energy consumption
Single module
Vertical farm energy consump-tion for baseline
scenario
Ene
rgy
Co
nsu
mp
tio
n [
kWh
]
JAN 1.473,12 5.892,48
FEB 1.330,56 5.322,24
MAR 1.473,12 5.892,48
APR 1.425,60 5.702,40
MAI 1.473,12 5.892,48
JUN 1.425,60 5.702,40
JUL 1.473,12 5.892,48
AUG 1.473,12 5.892,48
SEP 1.425,60 5.702,40
OCT 1.473,12 5.892,48
NOV 1.425,60 5.702,40
DEC 1.473,12 5.892,48
YEARLY 17.344,80 69.379,20
11.1.4 Plant Monitoring and Control Architecture System The calculation of the plant monitoring and control architecture system power consumption was performed taking into account the daily peak power values found in Chapter 9, Table 9-1. A running time of 24 hours was taken for the plant health monitoring system. The monthly energy consump-tion for plant health monitoring together with the control system is shown in Table 11-5.
Table 11-5: Plant monitoring and control architecture system energy consumption
Lettuce [single module]
Tomato [single module]
Vertical farm energy consump-tion for baseline
scenario
Ene
rgy
Co
nsu
mp
tio
n [
kWh
]
JAN 3.199,20 1.339,20 9.076,80
FEB 2.889,60 1.209,60 8.198,40
MAR 3.199,20 1.339,20 9.076,80
APR 3.096,00 1.296,00 8.784,00
MAI 3.199,20 1.339,20 9.076,80
JUN 3.096,00 1.296,00 8.784,00
JUL 3.199,20 1.339,20 9.076,80
AUG 3.199,20 1.339,20 9.076,80
SEP 3.096,00 1.296,00 8.784,00
OCT 3.199,20 1.339,20 9.076,80
NOV 3.096,00 1.296,00 8.784,00
DEC 3.199,20 1.339,20 9.076,80
YEARLY 37.668,00 15.768,00 106.872,00

Vertical Farming 2.0 - Designing an Economically Feasible Vertical Farm – A combined European Endeavor for Sustainable Urban Agriculture
Page: 61
11.1.5 Horticulture Procedures System The calculation of the horticulture procedures system energy consumption uses the values found in Chapter 5, Table 5-3. The duration of power demands was taken at five hours which is the proposed harvesting time for the lettuce module. No electrical energy input is needed for harvesting opera-tions of the high wire module. The monthly energy consumption of the horticulture procedures sys-tem is shown in Table 11-6.
Table 11-6: Horticulture procedures system energy consumption
lettuce [single module]
Vertical farm energy consump-tion for baseline
scenario
Ene
rgy
Co
nsu
mp
tio
n [
kWh
]
JAN 1.550,00 3.100,00
FEB 1.400,00 2.800,00
MAR 1.550,00 3.100,00
APR 1.500,00 3.000,00
MAI 1.550,00 3.100,00
JUN 1.500,00 3.000,00
JUL 1.550,00 3.100,00
AUG 1.550,00 3.100,00
SEP 1.500,00 3.000,00
OCT 1.550,00 3.100,00
NOV 1.500,00 3.000,00
DEC 1.550,00 3.100,00
YEARLY 18.250,00 36.500,00
11.1.6 Core and Ground Floor Area This calculation was performed on three different sections of the building, the core which is located on each growth module, the core on the ground floor and the ground floor working area. The energy consumption of subsystems which are located in the core of the cultivation modules where factored in with their respective subsystem calculations. The calculation of the core and the ground floor core area energy consumption takes into account the peak power consumption of the electrical equip-ment of the offices, the lights and the operation time. The air management system calculation of these areas was taken into account in the air management calculation done in Chapter 8. The ener-gy needed by the cold storage rooms on the ground floor working area were also taken into account. The total cold storage peak power was assumed as 327,5 kW in a day. The monthly energy consump-tion of the core and ground floor areas is shown in Table 11-7.

Vertical Farming 2.0 - Designing an Economically Feasible Vertical Farm – A combined European Endeavor for Sustainable Urban Agriculture
Page: 62
Table 11-7: Core and ground floor area energy consumption
Core [single module]
Core [ground floor]
Ground Floor working area for baseline scenario
Ene
rgy
Co
nsu
mp
tio
n [
kWh
]
JAN 511,59 1.279,70 10.617,12
FEB 462,08 1.155,86 9.589,65
MAR 511,59 1.279,70 10.617,12
APR 495,09 1.238,42 10.274,63
MAI 511,59 1.279,70 10.617,12
JUN 495,09 1.238,42 10.274,63
JUL 511,59 1.279,70 10.617,12
AUG 511,59 1.279,70 10.617,12
SEP 495,09 1.238,42 10.274,63
OCT 511,59 1.279,70 10.617,12
NOV 495,09 1.238,42 10.274,63
DEC 511,59 1.279,70 10.617,12
YEARLY 6.023,60 15.067,42 125.007,97
In Table 11-8, the estimation of the average yearly energy demand of each subsystem for the refer-ence year is shown for VF 2.0
Table 11-8: Total yearly energy consumption per subsystem
Subsystem/relevant area Yearly Energy demand
[kWh]
Illumination Cultivation Area 12.152.463,3
Air Management 4.853.037,6
Nutrient Delivery 69.379,2
Plant Health Monitoring 106.872,0
Horticulture Operations 36.500,0
Plant Cultivation Core Areas [x4] 24.094,4
Ground Floor Core 15.067,4
Ground Floor Working Area 125.008,0
TOTAL 17.382.421,9
The illumination system and the air management system make up close to 98% of the energy de-mand. The highest average daily demand occurs in August, with 51.308 kWh this is due to the cool-ing needed during the warmer months. Lowest average consumption is 45.210 kWh per day and it corresponds to the month of January see Figure 11-1.

Vertical Farming 2.0 - Designing an Economically Feasible Vertical Farm – A combined European Endeavor for Sustainable Urban Agriculture
Page: 63
Figure 11-1: Average daily energy consumption for the baseline scenario, illumination subsystem and air management subsystem of a reference year in Berlin Germany
In the Figure 11-2, the monthly average energy consumption per square meter cultivation area for a single lettuce module and a single tomato cultivation module is shown. The lettuce module requires more energy every month due to the large lighting requirements. Smaller differences are recorded during the warmer months due to the tomato module needing less cooling than the lettuce module during this time.
Figure 11-2: Comparison total energy consumption per square meter of cultivation area of the different modules
11.2 Options and Trades
Renewable Energy Sources There is a possibility to save money on electricity by connecting a renewable energy source to VF 2.0. This energy would come from either solar panels or wind turbines, and would be sold to the city grid for a feed-in tariff. The panels would be placed on the roof and take up an area of 200 m2.
In this report, only the solar panels option will be investigated. This will be done for two locations; Germany (Munich) and Egypt (Aswan). The two cities were chosen for their optimum solar irradianc-es.

Vertical Farming 2.0 - Designing an Economically Feasible Vertical Farm – A combined European Endeavor for Sustainable Urban Agriculture
Page: 64
The best place to build a Vertical Farm would be in in the south of Germany, around Munich, where a yearly average of 1.181-1.200 kWh/m2 can be expected (Wirth, 2015).
According to Wirth, (2015), a commercial wafer-based solar-panel having an inflicting angle perpen-dicular to its surface will throughout its lifetime have an average efficiency of 16 % and a rated capac-ity of nearly 160 W/m2. In order to maximize the power output, the solar-panel can be tilted 30-40° to the horizontal surface, giving a power increase of 15 %.
Each year the average power produced by each meter square under solar panels is:
On the rooftop of the farm it is possible to allocate 200 m2 for the solar panels. This would give a total rated capacity of:
The cost of buying and installing a solar-panel rooftop system of this size, assuming a lifetime of 25 years, in Germany is about 1.300 € per kilowatt of rated capacity (FISES, 2016). This will give a total system cost of:
According to Lang (2016), the feed-in tariffs for roof mounted solar-panels, with a rated capacity between 10- and 40 kWh, in Germany is 0,1225 € per kWh. This would give a yearly income of:
Assuming that the farm will have a lifetime of 25 years, the money gained per year by installing solar-panels would be approx.:
In the case of Egypt, a system with optimal static oriented silicon solar panels would have an average energy of 2,2 megawatt-hours per rated kilowatt per year. This gives a total energy per year of:
The total cost of buying and installing a solar-panel rooftop system, assuming a lifetime of 25 years, in Egypt is between 8 and 12 EGP (1,2039 €) per watt. Since the system will be small and therefore the price per watt higher, the highest value will be used. This gives the system a total cost of:
The feed-in tariffs for roof mounted solar-panels, with a rated capacity under 200 kW, in Egypt is 0,0904 € per kWh (Meza, 2014). This gives a yearly income of:

Vertical Farming 2.0 - Designing an Economically Feasible Vertical Farm – A combined European Endeavor for Sustainable Urban Agriculture
Page: 65
Assuming that the farm will have a lifetime of 25 years the money gained by installing solar-panels would be:
It was concluded that it would not be feasible installing solar-panels on the roof of the Vertical Farm. The economic gain would be a few thousand euros per year, and compared to the energy expenses of a few million euros per year it only becomes a marginal change.

Vertical Farming 2.0 - Designing an Economically Feasible Vertical Farm – A combined European Endeavor for Sustainable Urban Agriculture
Page: 66
12 Cost Analyses:
This chapter will summarize and tally up the final costs incurred in the building of VF 2.0. Costs de-scribed in this section are taken from the various subsystem chapters. The total cost for the leafy greens, lettuce, module and the high wire, tomato, module will be calculated separately to give a perspective on the cost of the various components making up VF 2.0. The cost of the structure will be calculated per module, all the modules were considered equal in terms of building costs.
The chapter will conclude with the baseline scenario and final cost estimation. This will be used to calculate the break-even sale price for produced in VF 2.0. Additionally, different VF 2.0 setups will be considered such as mono crop farms as well as changing the number of production modules to assess the impact on the break-even price. The final goal of this chapter is to find a scenario which best allows VF 2.0 to sell its produce at a competitive market price while still remaining attractive as an investment opportunity.
12.1 Cost Analyses assumptions With respect to the phase-A accuracy, margins will vary on each cost item of between 10% and 30% in order to reflect a certain risk due to intricacies, implementation of new technology and uncertain-ties. In Table 12-1, the values of the margins used for the analyses are shown.
Table 12-1: Margins for each subsystem or relevant area investment cost (%)
Subsystem/relevant area Lettuce [%]
Tomato [%]
Structure/Construction 20
Labor 30
Core 10
Illumination 10 10
Air management and thermal 20 20
Nutrient Delivery 20 10
Plant Health Monitoring 10 10
Horticulture 20 15
Total system 10
It is assumed that the investment costs for construction and subsystem components will be amor-tized over a period, of 30 years, with no residual value to have the possibility to add them to the operational costs. For that reason the annuity, of the total non-recurring costs ( ) to be calculated by using the following annuity equation with a payout at the beginning of every year with an interest rate of 3% (Zeidler, 2013):
The water use is estimated assuming the transpiration is 90 % of the total consumption. It is as-sumed that the nutrient solution needs to be replaced every 26 weeks to avoid imbalances in the nutrient makeup of the nutrient solution. The price for the water was assumed 0,00185 €/L based on previous studies (swb Wasser). The plant costs element includes the amount of nutrients needed and the production elements of the horticulture procedures.
In Chapter 11 the power and energy demands are outlined for the various subsystems of VF 2.0. These energy demands where converted into costs using a value of 0,16 €/kWh. This figure includes

Vertical Farming 2.0 - Designing an Economically Feasible Vertical Farm – A combined European Endeavor for Sustainable Urban Agriculture
Page: 67
all taxes, charges and miscellaneous charges, it also factors in margin to account for rises in the price in subsequent years.
12.2 Leafy Greens Module Cost Summary Table 12-2 gives an outline of the yearly fixed and variable costs for the leafy greens module. Fixed costs represent hardware investments to be amortized over the 30 year period giving the yearly cost listed in table 12-2. Variable costs represent the costs associated with each subsystem which varies from month to month. Variable cost would include the electricity usage of the various subsystems as well as the water and CO2 costs. Labor was calculated by taking the labor only related to the leafy green module and adding it to the labor costs which would be needed to make VF 2.0 run smoothly e.g. general manager, sales and marketing and administrative and support staff.
Table 12-2: Yearly cost summary of the a single Lettuce module
Fixed Costs
[€/year] Variable Costs
[€/year] Total cost
[€/year] Chapter Ref-
erence
Structure 244.790,80 € - € 244.790,80 € 3.3
Illumination 95.935,10 € 767.376,00 € 863.311,10 € 0
Air Management and thermal
16.278,21 € 340.637,89 € 356.916,11 € 8.3
Nutrient Delivery 8.291,87 € 159.403,92 € 167.695,79 € 6.3
Plant Health Monitoring
1.070,43 € 6.026,88 € 7.097,31 € 9.2
Horticulture Pro-cedures
41.367,17 € 260.378,40 € 301.745,57 € 5.4
Core 120,96 € 1.262,82 € 1.383,78 € DIN V 18599
Labor - € 609.165,02 € 609.165,02 € 10.5
Total 407.854,55 € 2.144.250,93 € 2.552.105,48 €
Predictably the highest yearly fixed cost is the structure itself. High construction costs are justified by having a custom designed building which is ideally suited to the subsystems designed for the VF 2.0. Other high yearly fixed costs are the illumination, air management, thermal system and the horticul-ture systems. These are all characterized by large initial investments in hardware such as LED lights, heat exchangers and gutter mobility systems.
Yearly variable costs are also high for the previously mentioned three systems mainly due to the en-ergy consumption. Additionally, the yearly variable cost of the nutrient delivery system is relatively high due to energy consumption and water consumption for the nutrient solution. Labor costs seem to be disproportionally high for the leafy green module. However, due to the factoring in of the per-sonnel that would be common to a multiple module VF 2.0, this cost would dilute out as more mod-ules are added.
12.3 High Wire Module Cost Summary Table 12-3 gives an outline of the yearly fixed and variable costs for the high wire module. Fixed costs represent hardware investments which will be amortized over the 30 year period giving the yearly cost listed in Table 12-3. Variable costs represent the costs which are associated with each subsystem, varying from month to month. Variable cost include the electricity usage of the various subsystems as well as water and CO2 costs. Labor was calculated by taking the labor only related to the leafy green module and adding it to the labor costs needed to make VF 2.0 run smoothly e.g. general manager, sales and marketing and administrative and support staff.

Vertical Farming 2.0 - Designing an Economically Feasible Vertical Farm – A combined European Endeavor for Sustainable Urban Agriculture
Page: 68
Table 12-3: Yearly cost summary of the a single tomato cultivation module
Fixed Costs
[€/year] Variable Costs
[€/year] Total cost
[€/year] Reference Chap-
ter
Structure 244.790,80 - 244.790,80 3.3
Illumination 21.160,81 204.821,06 225.981,88 0
Air Management and Thermal
15.070,46 784.585,56 799.656,02 8.3
Nutrient Delivery 4.594,85 81.618,34 86.213,19 6.3
Plant Health Monitoring
658,00 2.522,88 3.180,88 9.2
Horticulture Pro-cedures
1.822,82 45.025,38 46.848,20 5.4
Core 120,96 1.075,92 1.196,88 DIN V 18599
Labor - 541.763,04 541.763,04 10.5
Total 288.218,71 1.661.412,17 1.949.630,89
Similar trends can be identified in the high wire module costs as outlined in the leafy greens module. The yearly fixed structure cost remains the same due to the modular nature of the building, each module costs the same. Overall, the yearly fixed costs are lower due to the high wire module being less densely occupied by growing activities. The initial investment costs of the illumination and air management and thermal systems are high, however the horticulture system is simpler than the leafy greens module therefore, this aspect is not as expensive.
The yearly variable costs include electricity costs for illumination and air management and thermal systems, resulting in high yearly variable costs for these two items. The nutrient delivery systems yearly variable cost is also significant due to electricity usage as well as water usage. Labor costs seem to be disproportionally high for the high wire module. However, due to the factoring in of the personnel that would be common to a multiple module VF 2.0, this cost would dilute out as more modules are added.
12.4 Baseline Scenario and Break-Even Analyses The baseline scenario for VF 2.0 consisted of a total of five modules. The ground floor is the dedicat-ed processing center and above that are two modules which contain leafy green, lettuce, cultivation modules and two modules which contain high wire, tomato, vine crop cultivation modules. The break-even analyses for the baseline scenario involved calculating the yearly costs of the baseline scenario. Because one can calculate the total produce grown in the baseline scenario, it is possible to calculate the price at which 1 kg of produce would have to be sold for VF 2.0 to break even. Figure 12-1 and 12-2 show the fixed and variable costs of VF 2.0 baseline scenario.

Vertical Farming 2.0 - Designing an Economically Feasible Vertical Farm – A combined European Endeavor for Sustainable Urban Agriculture
Page: 69
Figure 12-2: Total fixed costs of VF 2.0 with the yearly 30 year annuity cost in K€
Figure 12-1: Yearly variable costs involved in VF 2.0 baseline scenario in K€

Vertical Farming 2.0 - Designing an Economically Feasible Vertical Farm – A combined European Endeavor for Sustainable Urban Agriculture
Page: 70
The fixed costs of VF 2.0 involve the initial investment in the structure and all the equipment for the different subsystems. The structure is the biggest investment with just over 28.000 K€. Following his building cost the illumination, air management and thermal and horticultural procedures systems represent the highest initial investment costs. See Figure 12-2 for the variable cost of VF 2.0.
Yearly variable costs for VF 2.0 consist mainly of labor, horticulture and energy expenses. These high energy expenses are a result of the extensive lighting and the high energy demands associated with constant air and thermal management. High horticulture costs are associated with nutrient purchas-es for the nutrient solution as well as seed purchases.
The baseline scenario VF 2.0 would produce 810 tons of lettuce and 215 tons of tomato annually. Taking the total amount of produce produced per year and the total yearly cost of VF 2.0, 1 Kg of produce would have to sell for 6.06 €/kg for VF 2.0 to break even. Looking at the break even prices for the 2 crops separately the lettuce would need to sell for 5.81 €/kg and the tomato would need to sell for 9.94 €/kg. These prices represent the break-even point at which VF 2.0 would need to price the produce.
12.5 VF 2.0 Variations from Baseline The baseline scenario of two leafy green modules and two high wire modules is not the only possible scenario for this Vertical Farm. Due to the modular nature of the building it would be possible to make a Vertical Farm with different layouts. For example, a four module Vertical Farm growing just lettuce or just tomato for this analyses. To analyze the cost implication of these scenarios, mono culture Vertical Farms were modeled and their price per kilogram of produce grown was calculated.
Monoculture cost analyses were carried out by using the single module cost structure together with the costs involved in the ground floor processing center and then adding growth modules on top. The break-even price was determined for monoculture Vertical Farms of up to 6 cultivation modules stacked on top of the ground floor processing center. See Figure 12-3 for the break-even price calcu-lation for a lettuce monocrop Vertical Farm.
It is clearly evident from Figure 12-3 the effect of vertically stacking growth modules. The biggest gains are too be had with the addition of the first four modules. Adding additional modules further reduces the break-even price but the percentage drop for every subsequent floor becomes smaller.
Figure 12-3: Lettuce break-even prices per kilogram for a mono culture lettuce Vertical Farm with one through to six production levels plus the ground floor processing level. Percentage drop in break-even
price is indicated as a new level is added

Vertical Farming 2.0 - Designing an Economically Feasible Vertical Farm – A combined European Endeavor for Sustainable Urban Agriculture
Page: 71
A similar trend is seen when looking at the high wire module, see Figure 12-4
As can be seen in Figure 12-4 the same trend applies for the high wire tomato module. The biggest drop in break-even price comes with the addition of two cultivation modules on top of the ground floor processing center. It is however clear that the addition of cultivation modules will decrease the break-even price of a kilogram of produce.
Before the most optimized combination of cultivation modules can be selected, a comprehensive market analyses will need to be conducted to determine the demand for each type of crop and the amount that can be sold in any one area. These factors will significantly influence the final choice in determining how many modules of each cultivation module to stack on top of the ground floor pro-cessing module.
Figure 12-4: Tomato break-even prices per kilogram for a mono culture tomato Vertical Farm with one through to six production levels plus the ground floor processing level. Percentage drop in break-even price
is indicated as a new level is added

Vertical Farming 2.0 - Designing an Economically Feasible Vertical Farm – A combined European Endeavor for Sustainable Urban Agriculture
Page: 72
13 Report Discussion and Review
This report discussion investigates and highlights all the objectives targeted, addressed and com-piled. The resulting report review is offered as an informed opinion, to start a healthy discussion and hopefully create a dialog with the audience and the members. Overall, the report objectives targets to contribute towards the development of innovative solutions in food production, by creating a the-oretical design for a Vertical Farm 2.0, to cope with the anticipated effects of climate change and to deliver improved resource efficiencies sought in agriculture.
The original report was written with material and information available over 22 months ago. Certain important information has since become outdated, some prices are no longer valid and several gen-erations of technology solutions may have since improved, in terms of efficiencies. In response to this rapid development, the prolonged delay in publication and because of the aforementioned shortcomings, the final chapter was designed to add new value to the report. The author attempted to focus on different viewpoints and enlarge the review into a bigger discussion regarding the indus-try sector as such, but particularly from the view of the commercial viability that is readily applied today in controlled environment agriculture (CEA).
This review of the attempted objectives should highlight additional questions in terms of agricultural evaluation like the risk management, product selection and overall labor situations. The review is leading up to a benefit/shortcoming section, with the goal of the open discussion. That is initiated by taking some of the items in the proposals and highlighting the value for the audience, based on the pragmatic critical analyses of the actual objectives of the study, as well as measuring potential suc-cesses and pitfalls alongside. As with a lot of pioneer work, this report will achieve a brave push into perhaps wider recognition, when viewed as the careful evaluation of successful achievements and identification of shortcomings, to promote learnings and lessons within the topic.
13.1 Identified Needs The claim by the report, that 2016 was the hottest year on average ever recorded by NASA, coupled with the dramatic prediction in the rise of the overall world population and the anticipated urbaniza-tion of that population, prompted many experts to start questioning the world’s food security. The goal of consistently growing fresh produce, sufficient to meet this demand from rapidly growing mega-city populations, is challenged by the increase of climate change induced crop failure in open field production, and by overall resource problems with water, energy and labor. Various consumer demands for fresh healthy foods, coupled with the introduction of controlled environment agricul-ture as a more efficient and consistent production method, have triggered increasing attention to the advent of novel agricultural technologies and methods.
In particular, with the introduction of LED artificial lighting, the potential of technology to compen-sate for climate-and-season induced shortcomings has led to a widespread experimentation, espe-cially by highly motivated and technology driven young entrepreneurs. An ongoing shortage of lab driven research space, combined with the motivation of conventional growers to increase yield per m2, may also have contributed to the desire to implement multilayer growing systems. Within the last 10 years of tinkering with lights and multilayer systems, the initial “grass roots movement” has spawned a global mega trend gathering up attention by the mass media and lately even the com-mercial ag-tech companies.
Generally, in situations with space constraints and a seasonal shortage of natural lights and/or cli-mate induced disadvantages for growing in open fields, new type of solutions with innovation are sought to solve these shortcomings. This is calling for technical solutions like the development of efficient system configurations, which can optimize and protect the phenology of plant grown for food and thus optimize the yield per m2. Vertically stacking growing space with artificial lights in a controlled environment should theoretically allow the optimizing of the available land and overall

Vertical Farming 2.0 - Designing an Economically Feasible Vertical Farm – A combined European Endeavor for Sustainable Urban Agriculture
Page: 73
resources, claiming both more sustainability and greater crop production in a given area, compared to the conventional one layer grow systems in open fields and greenhouses.
Today, with all information available, this author is trying to evaluate if there is a possibility to move commercial food production into dense urban settings for the sake of producing as close as possible to the point of consumption. However, land prices in urban settings may not favor commercial via-bility in food production unless the efforts are in part combined with other objectives and revenue streams. Education is one example of this; classes and tours for information seeking consumers and programs to introduce food production to children, as part of an overall nutritional and more general knowledge improvement, are certainly a valid approach and can make a difference in improving fun-damental understanding of food production. Another viable approach may also be to combine pro-duction with a retail site, becoming a showcase for consumers on site, to harvest their produce themselves.
13.2 Aim to meet Objective 13.2.1 DO-01: VF design shall be based on a new design and shall therefore be optimized
for all processes of advanced crop cultivation processes. Modular design may have strong potential for reducing the cost of construction, insofar as unit prices will fall with economies of scale for standardized products. Challenges are ongoing, which design objectives could possibly deviate from the standards in regular architecture, such as the modules in this report are proposed to be designed to grow fresh produce in variable location- and climatic re-quirements. Multiple time consuming infrastructure scenarios in addition will demote the modular approach and can easily let the modular design slip back into customized applications with increases in cost per unit that will render this objective too expensive for a modular approach.
This is caused by the simple fact that just climate for each individual site within the European metro-politan space is exceedingly variable, even in close geographic proximity. Additionally, when dealing with site requirements from a regulatory point of view, there is no clear uniform adopted zoning planning tool or building codes for Vertical Farming that will make the building permit application process standardized. Further, actual system development (food production license) is unchartered waters for all municipal bodies that are charged with deciding about this new type of activity. One positive aspect should be mentioned here in reference to building permits – the desire to modularize this activity will make it easier to create standards that could become the model for uniform zoning adoptions, creating momentum for a more rapid approval process.
Most important on the technical side are the heating and cooling requirements, which could dictate individual adaptations and render modular strategy less effective. The existing greenhouse construc-tion industry has pushed hard to standardize and modularize the whole planning and implementa-tion process. Yet one can see that, whilst there are certain aspects on the construction side that have been standardized for certain unit specifications, there seems to be no true modular approach at all possible when analyzing the overall success in modularizing the greenhouse building industry. The very same obstacles that have been hounding the greenhouse industry should be anticipated in hampering the development of modular design propositions for the VF industry sector.
Greenhouses construction is a highly dynamic yet volatile global industry that sometimes seems to grow countercyclical to the mainstream economic trends. This has to do with a basic increase in de-mand for fresh produce during difficult economic times, when people are forced to reduce expendi-tures and are cooking more at home versus going out to eat. Greenhouses have evolved over the years into high tech buildings controlled with highly innovative technology, and are optimized con-tinuously for advances in cultivation processes, particularly in the efficient use of resources, including waste energy. As a result, greenhouses today are extremely smart and highly productive.
When used as a benchmark against the proposed VF system in this design proposal, it is quite diffi-cult for VF 2.0 to achieve the same level of commercial viability across many climates and markets.

Vertical Farming 2.0 - Designing an Economically Feasible Vertical Farm – A combined European Endeavor for Sustainable Urban Agriculture
Page: 74
One clear difference to the modular VF 2.0 proposal is the fact that one needs a certain minimum size of a greenhouse to break even and start making money growing food plant products. Depending in which market, this starts at around ½ hectare (5,000 m2). This has also to do of course with the value and availability of land and the distance to infrastructure such as highways, distribution centers and cold chains. Today, in certain unique northern European regions like the Benelux, we find an enormous amount of food plant products such as tomatoes and salads grown under glass, primarily sold in overseas markets as export products but also providing the majority of produce sold to local consumers in and around large metropolitan spaces.
In a product-by-product comparison, it is unfortunately apparent that even when considering the potential of (theoretical) reductions in energy prices and the increase in efficiency in VF systems, the single layer greenhouse with perhaps additional supply of artificial lights in the winter months repre-sents the most efficient way to achieve commercially viability in many markets as we know it today. It is of course a distinct strength of this report to aim for a brave new modular design experiment and to calculate with hard numbers the commercial viability, to reach a conclusive answer (and generate learnings) for the future of modular vertical farming systems.
The results in the report are quite sobering and provide no distinct economic advantage to speak of in VF 2.0 versus conventional growing under glass. Except for truly hostile climates where natural lights and other environmental conditions do not allow the efficient use of greenhouse technology there is no plausible reason for growers to actually adopt the VF 2.0 technology. It could be conceiv-able, that in the future, new developments are successful by integrating a lot of energy and waste streams from other industries.
For example, the automotive industry implemented standard software (SAP) and a great deal of standard automation processes that resulted in them being able to leapfrog labor and technology shortcomings. Also, observing the whole car industry reeling today from a new challenge, triggered by a new type of disruption, namely the electric car from TESLA. Not only being a car company but a company that has started in earnest to address the entire energy equation in post fossil fuel indus-tries.
With that fundamental breach in regular product design, TESLA has been really successful in redefin-ing cars with an even more modular concept, including the main energy dilemma. Integrating several industries, including the solar rooftop power collection and in-house storage facility decentralized at the vehicles and charging stations, this modular design is truly radical and disrupting existing models in a fundamental and successful way. Comparing TESLA to the modular VF approach, one could point to the positive potential disruption VF 2.0 could bring. The need to solve the energy dilemma in food production across the industry means that growers may follow the product, once market penetration is achieved by disruption replacing existing products at the same price, with a VF 3.0 product that is radically different in efficient production technology.
13.2.2 DO-02: VF height shall demonstrate the key principle of stacking of several cultiva-tion floors (incl. several cultivation modules) in order to demonstrate the VF princi-ple.
Stacking modules are an interesting proposition from an architectural perspective but there is an economical decision to be made regarding the creation of value on land, in comparison and competi-tion with other uses. Today it is difficult to justify the investment and operations cost to create a multilayer VF building, producing essentially identical food plant products, which are currently pro-duced most efficiently and economically in a standard greenhouse with one layer of production. In general, food production currently cannot compete with other commercial use cases in dense urban spaces that have high land prices, due to demand and competition for space with other industries that are able to compete successfully with high land values.
Vertical Farming 2.0 - Designing an Economically Feasible Vertical Farm – A combined European Endeavor for Sustainable Urban Agriculture
Page: 75
The horizontal one-layer food production system under glass seems currently the most efficient and economical way to grow plant products in the vicinity of larger metropolitan areas, including the cold chain and the distribution distance it takes to reach consumers. The report objective aims to demon-strate that stacking cultivation floors seems unrealistic overall in the current economic situation, not least by the cost calculation employed in this report based on these common conventionally grown products. Vertical Farms with multiple layers have, however, demonstrated economic success in Ja-pan and Singapore for example, where the products are sold in a separate retail category at a signifi-cantly higher price, compared to EU or US markets. Notable here also, is that neither of these mar-kets have greenhouse production on a scale like that in the Northern EU, and are thus forced to im-port “expensive” produce from growers on other continents.
13.2.3 DO-03: The VF maximum footprint shall not exceed 50m x 50m. It has been a longstanding goal by the growers in general to increase output per m2 – and thus reve-nue per m2 - since economic growth cannot be met by expansion due to spatial limitations. From the perspective of the grower, the competition for land close to infrastructure and urban centers is most-ly won by other industries that are able to pay higher prices for the land, pushing food production into rural or suburban low-price low value locations. The exercise in reduction to a smaller footprint could also be desirable in theory, generating increased efficiency per m2 with novel technology while costing a lot more in investment cost per m2.
The killer criteria in this equation is not the technology itself, but the limitations in reduction of ener-gy and labor costs, that make up the majority of operating costs, likely increasing this cost multifold per m2 as well. At the same time, VF 2.0 requires additional investments without any difference in the pure economic value creation, compared to a standard food plant product. Certainly this attempt reveals the fragmented proposal in solving key challenges in food production today, making the im-plementation of available technology a risky undertaking at the current market price in the EU or the US, when not reducing operational costs or adding value to the product.
The case could be made for specific land in an urban setting that is under-used or no longer useable for other commercial or residential purposes. Contaminated spaces are such a category along with other “dead” architectural spaces in densely populated areas. If these can be made available at a reduced rate significantly below that commonly charged for similar spaces, then the economic calcu-lation for the multilayer, high-rise small footprint VF 2.0 could become more favorable. Multiple benefits for multilayer systems could also be found in farms integrated into the overall infrastructure of urban dwelling, which will be discussed later in the review.
13.2.4 DO-04: The VF shall demonstrate the full spectrum of Controlled Environment Agri-culture (CEA) technologies, - the implementation of closed-loop principles.
Comparing the technical proposal report with the existing full spectrum of Controlled Environment Agriculture, a call for further investigation should be warranted since the technology has evolved considerably. A thorough review of a minimum of existing conventional CEA technologies would make this objective more cohesive and reflective, and would ultimately reduce uncertainty in the speculative exploration of the multilayer system development. In particular, the suggested HVAC technology is based on standard greenhouse technology and has shown considerable limitations in smaller spaces like the multilayer grow system, in comparison to large scale thermal air masses in greenhouses.
There are a number of HVAC solutions from the “building control” application perspective, which were available even at the time this report was initiated. These advanced systems can control more accurately, by generating overlapping sensor technologies to create a multitude of data points in the space. Additionally, the movement of air combined with the accurate control of air quality in these building control systems is much more advanced, and gives the VF grower a distinct advantage in optimizing the environmental parameters. The suggestion that the proposed technical system was

Vertical Farming 2.0 - Designing an Economically Feasible Vertical Farm – A combined European Endeavor for Sustainable Urban Agriculture
Page: 76
adequate in the light of all economic factors at the time 22 months ago should be open for discus-sion. This author would encourage additional studies, focusing on the full spectrum of technologies that still need to be further investigated, which would probably influence the economic outcome considerably.
The popular claim for closing the loop in agriculture provides a desirable exercise, but this pursuit can lead to unintended outcomes that may also contradict the initial attempts.
With a number of approaches pursuing increased efficiency in controlled environmental agriculture, some actual important contributions toward sustainability have been achieved. In order to close a loop, for instance in fertility, intensive agricultural systems will have to be investigated rigorously to evaluate the benefits of output and input balances.
Scientific studies seem to indicate that altering the goal from growing for maximum yield, to a more conscious environmental goal with lower quantity but greater ethical impact is likely to cause eco-nomic stress to increase considerably. It may offer ethical comfort to the (niche) consumer, but simp-ly it will be challenging for the average growers, because the cost per unit will go up and increase pressure on economic viability, by reducing the overall yield of food and perhaps also compromising the quality in exchange for a desirable closed loop system. This topic is fodder for the discussion and a polarized difficult opinion, so it needs wider and further investigation as well. The aim of both in-creasing efficiency and achieving a smaller environmental footprint by closing loops is naturally in the interest of the grower. They have continuously progressed in this direction and have achieved signifi-cant success, when comparing inefficient field production with efficient production in controlled environment agriculture. A lot more can and will be done of course.
13.2.5 DO-05: The VF shall strive for reduced power consumption. The energy equation in food production is one decisive factor in the cost per unit calculation and looking at figures in this report, there has to be some drastic reduction on the kw/unit and/or cost subsidies to achieve a realistic commercial viability. Puzzling is the fact, that by excluding natural light in the case of the novel vertical farming system, the declared aim of creating optimized light recipes for the plant products should increase yield numbers. In reality however, the yield numbers cannot confirm this. Adjustments in energy consumption levels may need to be considered based on the evolution in efficiency for LED technology since 2015.
Perhaps it is still an open question, whether eliminating the variable of natural sun by harnessing man-made energy not only duplicates, but also optimizes plant growth and creates more efficiency in yield, quality and flavor. The report objective was aimed correctly along with the promises in future VF technology. However, it would make sense to review some common agricultural strategies that also currently have an impact in the reduction of energy costs in conventional large-scale greenhouse farms. This concept involves basically integrated co-generative power plants to produce not only the heat for the greenhouse, but also the CO2 (extracted from the flue gases) and simultaneously gener-ate electricity that is sold back to the grid or is used in-house.
In the case of the VF 2.0, this type of co-generating electricity could potentially then be used to feed into the LED system at a much lower cost than standard electricity from the grid. The report de-scribes in a short paragraph an option for potential to install solar and possible wind generation to produce onsite electric energy. Both options, either together or individually, do not offer the neces-sary reliable electricity on demand for the system, and therefore would only make sense when pow-er from these systems would achieve a bigger margin above the current feed price in KwH offered for example in Germany. In the case of Germany, subsidies have recently evaporated after the initial period of market penetration (as a tool of market manipulation).
This estimated price difference in renewable energy will not allow the return on investment for the solar system on top of the farm, not to mention the probable public protest (not in my backyard syn-drome) in obtaining permits for substantial windmills in any urban or suburban places, would limit

Vertical Farming 2.0 - Designing an Economically Feasible Vertical Farm – A combined European Endeavor for Sustainable Urban Agriculture
Page: 77
any satisfactory proposal in the aim of reduced power consumption. The potential for a reduced en-ergy footprint is again currently demonstrated by examples of commercial greenhouse technology combining natural light with added LED lights to compensate for deficiencies in climate and region, plus potentially providing optimized conditions for improved plant growth and increases in yields. Or to come back to the example of TESLA, the energy equation needs to be addressed with a clear dis-ruptive new technology, that will allow the VF 2.0 technology to not only sustain higher land prices and investments but also product yields and perhaps a different plant product range that can only be produced in these efficient systems.
13.2.6 DO-06: The VF shall be combined with regenerative power conversion system(s) in order to minimize or eliminate power demand from the grid.
Similar to above discussion, the integration of co-generative power systems as mentioned is a bene-ficial standard solution already applied in larger conventional greenhouse operations, essentially securing redundancies needed in grid power failures. Further, integration into larger energy process-es like we find in high tech infrastructure such as datacenters and telecommunication hubs, and sig-nificant metropolitan energy flows like water/waste treatment plants, conventional manufacturing and chemical processes would provide opportunities for analysis. Like any other old-fashioned fossil fuel based industry, agriculture overall continuous to wrestle with the energy equation. VF 2.0 with the design objectives can certainly offer the premise for consideration and developing mature pro-posals.
This could be exciting to explore and could form the basis for a path towards a disruptive, resilient multi-use case of a number of human activities in and around population’s centers. The border belt region of dense urban centers especially would have diverse large scale spaces and energy flows that could benefit from each other and become more efficient and resilient. Clearly, in this report the main wrestling point is with the high input costs of energy for the LED, triggering serious exploitation of the above discussion in a wider context of imbedding and integrating VF 2.0 into overall infrastruc-ture design planning.
13.2.7 DO-07: The VF design shall allow for an adequate solution for waste processing (sol-id/ liquid) under the restriction of economic considerations.
Most important, scalability needs to be considered in any additional proposition like waste treatment and upcycling of materials and energy waste flows. Additional complexities deviating from the main purpose may end up become economically challenging. High land prices may also push for integrat-ed flows of different industries, benefiting from each other’s sharing of the neighborhood.
There is potential to be considered in existing commercial activities at the edge of metropolitan spaces, such as waste water treatment plants and garbage incinerators and other existing industrial processes that generate waste heat and/or cooling facilities. All these and more could be considered for integration into a VF 2.0 system, utilizing the exchange of waste streams solid/liquid in an eco-nomical and efficient manner. In order to clarify the economic feasibility of this attempt to design VF 2.0, with an ecological footprint beyond just growing food plants, this objective should consider loca-tion first and identify masterplans with new construction overall in urban planning. This is because the vertical integration of waste streams is far more economical in complete new infrastructure de-velopments.
13.2.8 DO-08: The VF operation scenario shall be optimized with respect to minimal labor work deployment.
The second most difficult point in the design is the deployment of labor and the retention of knowledge in operative VF technology, in respect of cost, scale and implementation. Demand for manual labor is surprisingly high per m2 of multilayer systems and has turned out to be seriously challenging. The reasons are clear in most cases, with VF operations in the pioneer role driving novel

Vertical Farming 2.0 - Designing an Economically Feasible Vertical Farm – A combined European Endeavor for Sustainable Urban Agriculture
Page: 78
experiments, and still a long way away from reaching the level of professional standards one would find in commercial operations.
Automation with technology would be the most logical direction of development for reduction of labor costs. Additionally, the implementation of mostly boring manual labor in VF causes what this author calls the “disenchanting” factor, whereby the enthusiastic young entrepreneurs and employ-ees end up being quickly fatigued by this low-wage draining hard job. It turns out to be a major issue in retaining labor over extended periods to have people show up and do menial physical farm work, which is generally a common dilemma in agriculture anywhere. Additionally, the training and level of expert knowledge by the VF entrepreneur at this stage is still far from the level of professional expe-rience needed in advanced food production.
It will be no surprise if this sector has to undergo challenging periods after the initial positive devel-opment period of success and good news. This is only normal; as in any new disruption there needs to be a period of failure where entrepreneurs will have an opportunity (though a painful one) to learn hard lessons and leverage this experience for their own benefit. The moment these entrepre-neurs reach an adequate level of professional experience they will start penetrating the market in earnest, and will know much better all the risks and all the weaknesses of the new system.
Overall, seeking automation to contain labor cost is highly debated today (the design report is simply too outdated in this), not just in agriculture but across a lot of industries. This has the making of a serious proposal to reckon with; that automation with Artificial Intelligence (AI) could have a major role in agriculture in general, but specifically in CEA by disrupting the process of learning/training to rapidly advance to reach the level of an informed expert, without having to spend years on the topic. Perhaps one could aim, under the objective, for an even more radical proposition towards integrat-ing autopilots for VF, specifically for these high-tech food plant grow systems, utilizing the help of informed data (data evaluation by plant specialists) and machine learning processes.
For this report, this author would recommend focusing on and exploring advanced control systems that would allow them to integrate significant expert knowledge (with an open source reward sys-tem) and advanced plant science based on data, collected via the integration of intensive monitoring and employing sensors and cameras in the system. The VF entrepreneur is generally technology ori-ented but lacks the experience and understanding in growing food plants for a living. With the help of AI an opportunity arises to cover these challenges with a new type of an exciting bridge that could offer interesting solutions for this major shortcoming. The potential for machine learning and opti-mized feedback from sensors is significant and could further contribute towards an optimized VF 2.0.
In addition, it is quite conceivable that major improvements in labor retention and the deployment of this technology could be achieved in the near future, by integrating AI and AR in these processes. Automation is additional cost of course and will be measured with the increase in yield, so only with clear improvements is this additional investment feasible. The issue of labor in agriculture is a much larger one and has some geopolitical and regulatory implications, since in industrialized countries most native labor will never engage in jobs under such harsh conditions (long hours, exposure to weather, physically taxing) resulting in lower labor costs that are held by employing desperate le-gal/illegal and/or workers that migrate into the developed world to escape civil war, climate disasters and dire economic means in their home country.
The fact the VF sector has attracted young highly educated people is a highly interesting infusion of talent and interest for the industry as a whole, but it is also an illusion to think that these young fu-ture farmers will go into careers of unrealistic risk mitigation that is inherently always plaguing food production. Observed by this author, when these new farmers encounter a system that is in great need of technological improvement their strength in technology knowledge is coming into play from an unexpected direction and help push the wagon of innovation into a future that may address

Vertical Farming 2.0 - Designing an Economically Feasible Vertical Farm – A combined European Endeavor for Sustainable Urban Agriculture
Page: 79
shortcomings in the labor issue as well. This can be considered a highly interesting phenomenon and will impact the industry with lasting changes.
A good example for the lack of commercial knowledge is the fact that in the design proposition there is significant amount of space and resources dedicated to the in-house seedling production. This in-tegration is of course possible, but can lead to a diversion from core activities, add additional risks and will create further demands of experts and manual labor deployment, in a system that is highly vulnerable due to lack of knowledge and experience. The advantages of indoor seedling production are superficial (specialized companies supply this in commercial growing) and will not help the com-mercial viability case – except if there are no available seed propagating growers available, for exam-ple in extreme climates and in outer space.
13.2.9 DO-09: The VF shall strive for reduced cost (Capex and Opex). Comparing the proposition for VF 2.0 with the existing marketplace of the very same food plant products, the goal of offering attractive reduction in capex and opex per m2 is not achievable with this design. Nevertheless, from the point of view of market demand, there is a fair amount of salads and tomatoes produced in the industrialized world that are still grown in conventional field produc-tion, far from the actual point of consumption. This outdated technology to grow these products is dependent on large field areas, cheap fossil fuel, cheap labor and intensive chemical inputs, as well as a disproportionally high level of water consumption.
Today, in retail, consumers cannot distinguish the technology behind these products. One way to make sure that the same products are recognized by the interested consumer is to inform by means of transparent certification that these products can be grown more efficiently, fresher and closer to the point of consumption. This should be rewarded in the form of added value, reflected in the fact that products with such quality will need to be sold at a higher price. This in return would intensify the produce sector to move from inefficient field production into CEA under glass and/or with VF2.0.
Smart economical calculation including all externalities in food plant products demonstrate over and over again, that it is simply not conceivable to strive for an ever lower-cost production via economies of scale and global trade, cutting cost by means of externalizing the environmental food print, labor standards and high food safety standards. The history of food scandals in produce in recent years, have proven beyond the doubt, that food plant products have a clear benefit to society when valued at the true cost. Today we are seemingly subsidizing cheap food products with expensive healthcare, leading to negative geopolitical, environmental and economic consequences, as well as an ever-increasing health crisis in the industrial world and beyond.
13.3 Benefits Vertical farming has the making of a global mega trend, and can offer transformation potential by utilizing a technology based disruption in a small but important market segment of agricultural food production. The market penetration for products grown by vertical farms is supported by consumer demand for more locally produced transparent food. The implication of vertical farming, in providing educational - and nutritional support, is in high demand for greater adoption of responsibilities by the regulatory bodies. Simply allowing dedicated new forms of subsidies for the sector will not pro-vide the right kind of support for that entrepreneurial momentum in the marketplace. Regulators and policymakers will be called upon to review and redefine zoning definitions, permit application processes and food safety standards outside of the standard definition of agricultural production in mostly rural areas and in nontraditional times and spaces.
13.4 Shortcomings
Missing the overall objective in this report by failing to demonstrate general commercial viability for food plant products in the design for VF 2.0, the initiative reveals not surprisingly the immaturity and weakness of this new sector. Nevertheless, in an industry that is seemingly moving towards im-

Vertical Farming 2.0 - Designing an Economically Feasible Vertical Farm – A combined European Endeavor for Sustainable Urban Agriculture
Page: 80
provement in efficiency by means of technology, the breakthrough sought in finding a business case that makes actual sense for a farmer to grow plants for a living, will probably come with differentiat-ed products in the marketplace that are produced efficiently and locally and not yet with staking layers of production in high price urban settings. A product that can adequately claim and satisfy the demand with a unique value proposition will most likely succeed, delivering on the demand for local, efficient and transparent claim. Additionally, it is anticipated that the sector will undergo a natural evolution (like any other industry) by learning hard lessons from failures, and will overcome the ini-tial shortcomings and help move the focus towards the design of an end product that will hold up in the marketplace and provide the foundation for an better economic basis with spearheading the focus on the best technology..
13.5 Take home message
In the end, the aims in the objectives may never truly check all the boxes with a yes for multilayer systems, since the evolution of one layer growing under glass with supplemental lighting is also de-veloping into high tech systems These single layer systems could, for a lot of locations, offer major advantages in commercial viability, for simple reasons such as the fact that sunlight is available for free. However, the attempt to disrupt inefficient food production in the small segment of produce production, for example, may leverage adjustment of the industry as a whole towards a more effi-cient outcome. These consequences, and more, need to be further studied and perhaps also inte-grated in the next report for the design VF 3.0.
It is also remarkable to note that today an entire industry sector is undergoing a tremendous trans-formation, and has attracted all important players in CEA to the table to become part of this move-ment. This report is one of the important testaments to this, the collaboration between young entre-preneurs and innovative international companies, whose core competencies are brought into the experiment and are - in this author’s opinion - a crucial act of signaling a common direction for all involved to work on solutions together. The creations of such collaborative undertakings are com-pletely new to this industry.
Naturally, agricultural companies are used to working with science in the development of new mod-els. But only with support and collaboration from the membership of the Association for Vertical Farming (AVF), can the implementation of these types of unique project be facilitated and realized. This idea for a project to explore the design for VF 2.0 is quite remarkable and has not been done before on such a comprehensive level, with such a combination of experts from the field together with young entrepreneurs. The AVF is in this way, a significant new representation of this new novel type of innovation in food production and as such extremely important, because in agriculture there are no international associations that represent this type of activity and membership.
Existing conventional agricultural associations are, in general, focused either on rural regional repre-sentation of growers, or on the manufacture type of organizations that are mostly focused on na-tional topics or certain supply chains at best. Searching for equivalents new types of organizations or platforms specialized on innovation at this scale, currently the AVF seems the only such internation-al-spanning vehicle with 300 members from all sides of CEA and beyond. As such, the AVF needs to be strongly credited with this spearheading of pushing development for innovative solutions in food production.
This is the strength of the main task carried out in this report, in that it tries to answer a lot of perti-nent interesting questions that are generally not found in mainstream media and/or discussed in the open by all the participants. This effort has the distinct character of AVF, supporting on a broad scale and with high energy in this nascent sector of novel food production. Based on this effort, the groundwork is successfully laid out for the next step to start working on the design for VF 3.0.

Vertical Farming 2.0 - Designing an Economically Feasible Vertical Farm – A combined European Endeavor for Sustainable Urban Agriculture
Page: 81
14 References
1. Anonymous, 2016. Photovoltaic Report, Fraunhofer Institute for Solar Energy Systems, Freig-burg, Germany
2. BKI Baukosteninformationszentrum, BKI Baukosten Gebäude 2010: Statistische Kostenkenn-werte Teil 1, Stuttgart: BKI, 2010.
3. Deutsches Institut für Normung (DIN), 2008. Energy efficiency of buildings — Calculation of the energy needs, delivered energy and primary energy for heating, cooling, ventilation, do-mestic hot water and lighting. DIN V 18599 series of prestandards, Germany.
4. German wages: http://www.agri-info.eu/english/t_wages.php#de 5. Kozai, T. (2007). Propagation, Grafting and transplant production in closed systems with arti-
ficial lighting for commercialization in Japan. Propagation of ornamental plants. 6. Kozai, T., Niu, G., & Takagaki, M. (Eds.). (2015). Plant Factory: An Indoor Vertical Farming Sys-
tem for Efficient Quality Food Production. Academic Press. 7. Lang, M. 2016. German Energy Blog: German Feed in Tariffs 2014.
http://www.germanenergyblog.de/?page_id=16379, retrieved Apr. 5, 2016 8. Meza, E. 2014. Pv magazine. “Egypt announces renewable energy feed-in tariffs”
http://www.pv-magazine.com/news/details/beitrag/egypt-announces-renewable-energy-feed-in-tariffs_100016525/#axzz46pGKem3j, retrieved Apr. 5, 2016
9. Ooster, A. van 't; Heuvelink, E., Stanghellini, C, Henten, E.J. van. (2015). Greenhouse Technol-ogy FTE 31306 course reader. Wageningen University. 367p.
10. Stanghellini, C. (1987). Transpiration of greenhouse crops: an aid to climate management. PhD thesis, Wageningen University, The Netherlands.
11. Sabzalian, M.R., Heydarizadeh, P., Zahedi, M., Boroomand, A., Agharokh, M., Sahba, M.R., Schoefs, B. (2014). High performance of vegetables, flowers and medicinal plants in a red-blue LED incubator for indoor plant production. Agronomy for sustainable development.
12. Swb Wasser https://www.swb-gruppe.de/geschaeftskunden/bremen/produkte/swb-wasser-basis.php
13. Vanthoor, B. (2011). A model-based greenhouse design method. PhD thesis, Wageningen University, The Netherlands.
14. Wirth, H. 2015. Recent Facts about Photovoltaics in Germany, Photovoltaic Modules, Systems and Reliability, Fraunhofer Institute for Solar Energy Systems, Freigburg, Germany.
15. Zeidler, C., Schubert, D., Vrakking, V. (2013). Feasibility Study: Vertical Farm EDEN. Institute of Space Systems, German Aerospace Center. Bremen, Germany.