Embed Size (px)
Citation preview
Membrane Reactors and Three-Phase Hydrogenation P a g e | 1
Levulinic Acid Hydrogenation Reaction using a
Polymeric Catalytic Membrane Reactor
By
Michelle C. Soto Hernández
NSF REU Program in Sustainable Bioenergy 2015
Department of Chemical Engineering
Kansas State University
Final Research Report
This material is based upon work supported by National Science Foundation Grant: REU Site: Summer Academy
in Sustainable Bioenergy; NSF Award No.: SMA-1359082, awarded to Kansas State University.
Membrane Reactors and Three-Phase Hydrogenation P a g e | 2
Abstract
The environmental degradation caused by the consumption of fossil and the increasing energy
demand is of great concern when taking in account social welfare. It is forecast that fossil fuel will not
be able to defray society’s demands. Efforts are being placed in the study of lignocellulose-biomass
conversion, which represents a possible solution to this problem since platform molecules can be
obtained from it. These type of molecules can be used to produce fuels and fuels additive.
Hydrogenation reactions are industrially relevant in petrochemical and petroleum refining and in
emerging biorefining. The reaction that was studied was the hydrogenation of levulinic acid (LA) to
produce gamma-valerolactone (GVL), a chemical platform. Previous studies had conducted this reaction
in a packed bed reactor. One of the problems presented in this kind of reactor is the mass transfer
limitation, hydrogen delivery to the catalyst sites. Membrane reactors can lessen the mass transfer
limitations by supplying hydrogen to the catalytic sites on the membrane surface. The main objective of
this project was to develop a polymeric membrane for the hydrogenation of LA.
Polytetrafluoroethylene (PTFE) was used as the support of the polymer Matrimid. Among the different
types of membranes developed, we focus on the reaction conducted with a membrane that consisted of
0.25wt% and 1.0wt% Matrimid dissolved in methylene chloride (DCM) and spin-coated onto the PTFE
membrane. Also, different types of solvents for the LA hydrogenation were evaluated such as glycerol,
water and gamma-butyrolactone (GBL). At constant temperature of 70oC, glycerol did not show any
yield of GVL after13-15 hours of reaction. When GBL was used as solvent for LA, a bronze colored
liquid was obtained. Since this chemical has similar properties to GBL, it was not able to be analyzed by
simple means. Water showed to be the most efficient solvent to produce GVL. Also, the PTFE
permeability for water and GBL was evaluated. GBL has a lower vapor pressure in comparison to water,
therefore allowing the reaction to be conducted at higher temperature without extreme permeability of
the liquid phase, as expected due to its high boiling point. In the case of water, 70C was chosen as
reaction temperature for further experiments, because produced a manageable water permeance through
the PTFE membrane.
The hydrogenation of LA was conducted supplying hydrogen from the lower side of the
membrane and from the upper side (in a continuous loop flow). Results have shown that the most
Membrane Reactors and Three-Phase Hydrogenation P a g e | 3
efficient way to supply hydrogen is from below the membrane surface since supplying it from the upper
side resembles a more traditional three-phase reactor such as a packed bed reactor.
Comparing the PTFE layer that was coated with 0.2wt% RuCl3 dissolved in ethanol (catalyst
solution) with the one that consisted of PTFE with a polymeric layer of Matrimid, greater GVL results
were obtained with the one that consisted of unmodified PTFE with catalyst. The presence of a
polymeric layer on the PTFE lowered the GVL yield due to the inefficiency of delivery of hydrogen to
the catalyst sites. An increase in pressure and temperature helped to lessen this effect.
Membrane Reactors and Three-Phase Hydrogenation P a g e | 4
Table of Content Abstract………………………………………………………………………………….…………..1
1. Background………………………………………………………………………….……………4
1.1 Research justification
1.2 Lignocellulose to produce levulinic acid and GVL
1.3 Utilizing membranes as phase contactors for three-phase hydrogenation
1.4 Research objective and goals summarize
2. Research methodology…………………………………………………………………...............10
2.1 Membrane fabrication
2.2 Calibration samples
2.3 Catalyst solution
2.4 GBL and water permeability
2.5Levulinic acid solution
3. Results and discussion……………………………………………………………………………12
4. Conclusion………………………………………………………………………….…………….16
5. Supporting information…………………………………………………………….…………….18
6. References………………………………………………………………………………………..21
Membrane Reactors and Three-Phase Hydrogenation P a g e | 5
1. Background
1.1 Research Justification
The fast growing population, rapid modernization and industrialization have increased the
demand in energy and this demand is mostly met from a non-renewable resource such as fossil fuel. The
dependence on fossil fuel has serious implications in the economy and in the environment. We are
entering an era of diminish availability of petrochemical resources used to produce energy and chemical
materials needed by society [1].
The growing environmental degradation is observed locally, nationwide and globally, and has
attracted the attention and concern in the scientific environment. Policies for reducing energy use may
not ensure the desired level environmental quality along with the desired level of economic growth and
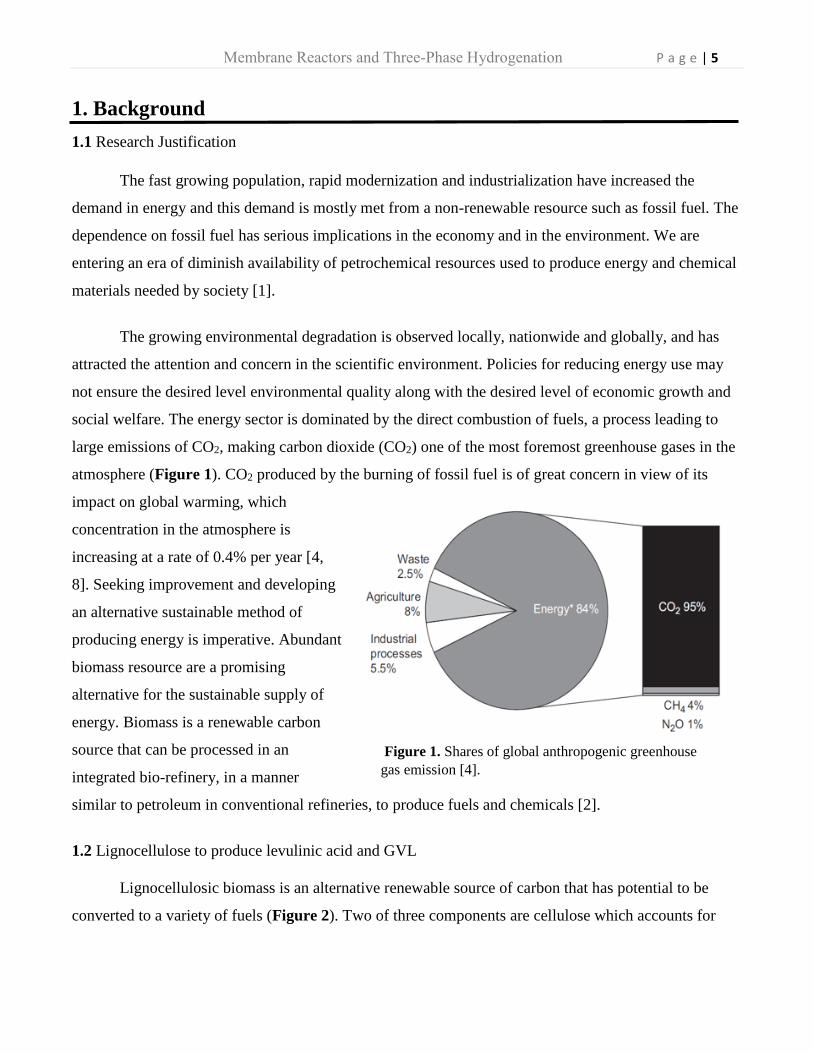
social welfare. The energy sector is dominated by the direct combustion of fuels, a process leading to
large emissions of CO2, making carbon dioxide (CO2) one of the most foremost greenhouse gases in the
atmosphere (Figure 1). CO2 produced by the burning of fossil fuel is of great concern in view of its
impact on global warming, which
concentration in the atmosphere is
increasing at a rate of 0.4% per year [4,
8]. Seeking improvement and developing
an alternative sustainable method of
producing energy is imperative. Abundant
biomass resource are a promising
alternative for the sustainable supply of
energy. Biomass is a renewable carbon
source that can be processed in an
integrated bio-refinery, in a manner
similar to petroleum in conventional refineries, to produce fuels and chemicals [2].
1.2 Lignocellulose to produce levulinic acid and GVL
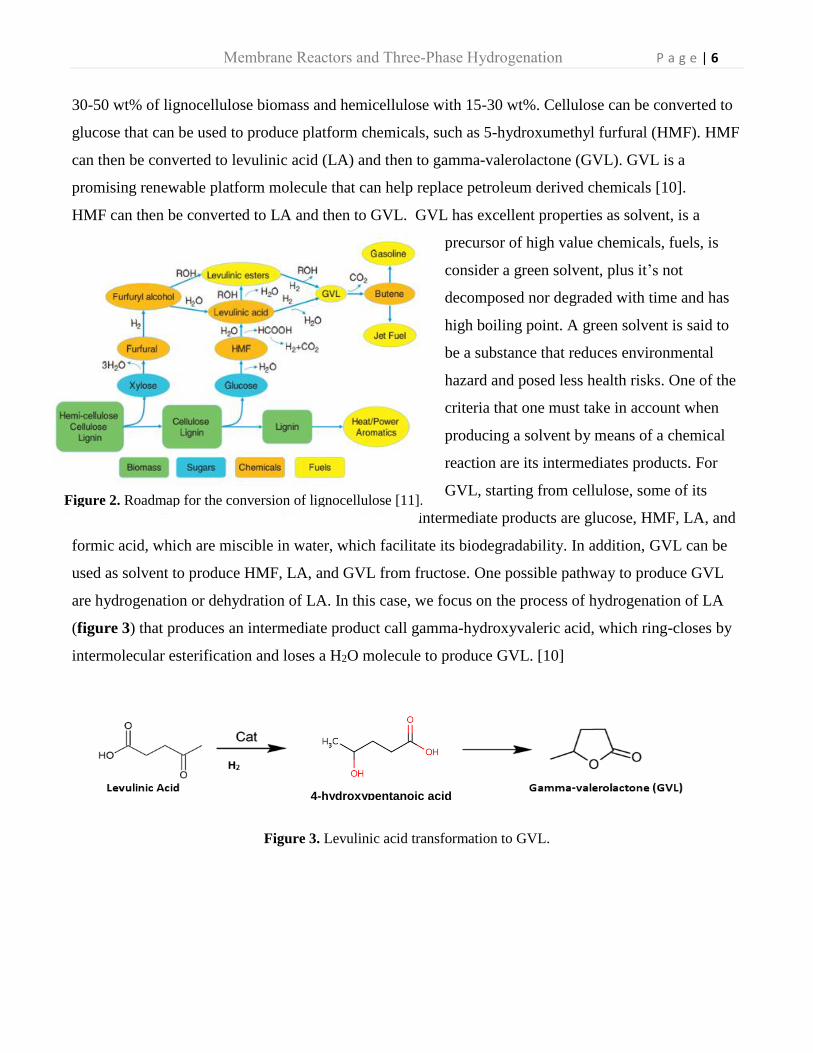
Lignocellulosic biomass is an alternative renewable source of carbon that has potential to be
converted to a variety of fuels (Figure 2). Two of three components are cellulose which accounts for
Figure 1. Shares of global anthropogenic greenhouse
gas emission [4].
Membrane Reactors and Three-Phase Hydrogenation P a g e | 6
30-50 wt% of lignocellulose biomass and hemicellulose with 15-30 wt%. Cellulose can be converted to
glucose that can be used to produce platform chemicals, such as 5-hydroxumethyl furfural (HMF). HMF
can then be converted to levulinic acid (LA) and then to gamma-valerolactone (GVL). GVL is a
promising renewable platform molecule that can help replace petroleum derived chemicals [10].
HMF can then be converted to LA and then to GVL. GVL has excellent properties as solvent, is a
precursor of high value chemicals, fuels, is
consider a green solvent, plus it’s not
decomposed nor degraded with time and has
high boiling point. A green solvent is said to
be a substance that reduces environmental
hazard and posed less health risks. One of the
criteria that one must take in account when
producing a solvent by means of a chemical
reaction are its intermediates products. For
GVL, starting from cellulose, some of its
intermediate products are glucose, HMF, LA, and
formic acid, which are miscible in water, which facilitate its biodegradability. In addition, GVL can be
used as solvent to produce HMF, LA, and GVL from fructose. One possible pathway to produce GVL
are hydrogenation or dehydration of LA. In this case, we focus on the process of hydrogenation of LA
(figure 3) that produces an intermediate product call gamma-hydroxyvaleric acid, which ring-closes by
intermolecular esterification and loses a H2O molecule to produce GVL. [10]
Figure 3. Levulinic acid transformation to GVL.
Figure 2. Roadmap for the conversion of lignocellulose [11].
4-hydroxypentanoic acid
Membrane Reactors and Three-Phase Hydrogenation P a g e | 7
In order for this reaction to proceed, a catalyst must be used. It’s important to take in account the
nature of the solvent, and the support of the catalyst. Many catalyst have been used to produce GVL, but
the one that achieve the highest yield was Ru-based catalyst [10, 11]. As mentioned before, considering
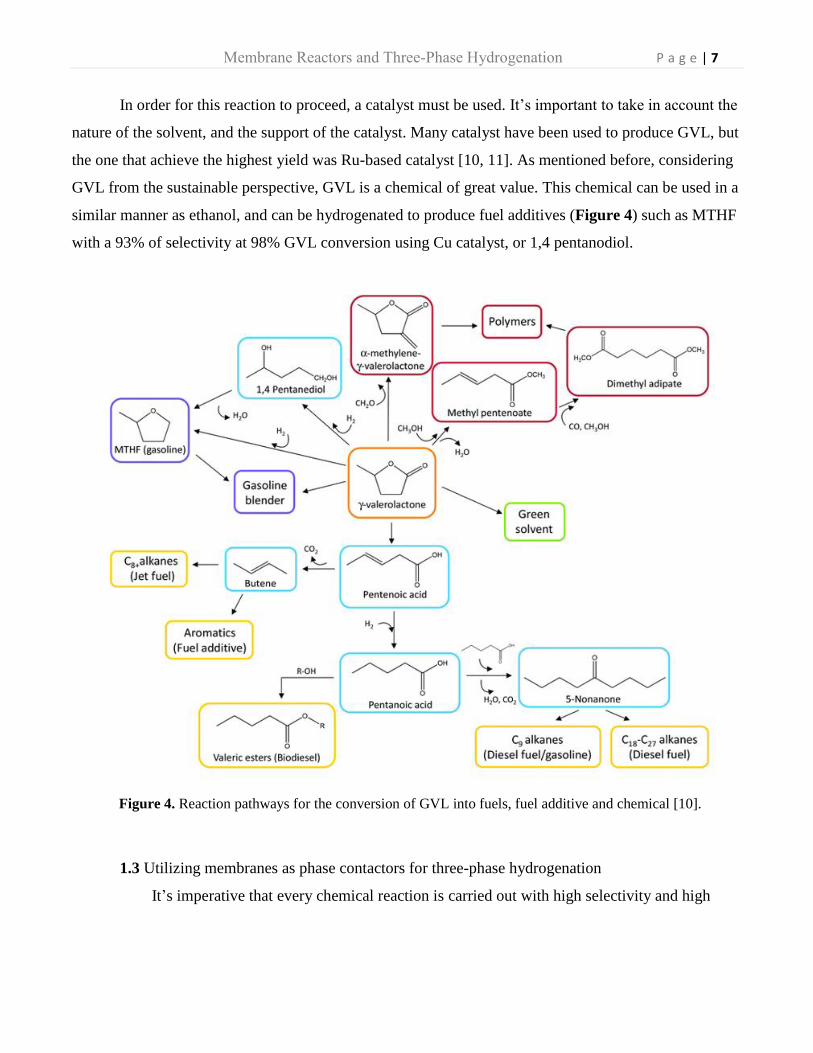
GVL from the sustainable perspective, GVL is a chemical of great value. This chemical can be used in a
similar manner as ethanol, and can be hydrogenated to produce fuel additives (Figure 4) such as MTHF
with a 93% of selectivity at 98% GVL conversion using Cu catalyst, or 1,4 pentanodiol.
1.3 Utilizing membranes as phase contactors for three-phase hydrogenation
It’s imperative that every chemical reaction is carried out with high selectivity and high
Figure 4. Reaction pathways for the conversion of GVL into fuels, fuel additive and chemicals [10]. Figure 4. Reaction pathways for the conversion of GVL into fuels, fuel additive and chemical [10].
Membrane Reactors and Three-Phase Hydrogenation P a g e | 8
Polymer
Layer Membrane
Cell
conversion towards the desired product. In order for this to happen, we seek our reaction to be selective
towards
Figure 5. Matrimid chemical structure [12].
hydrogen, and that also removes selectively H2O. To accomplish such task, it was proposed the
development of a polymeric membrane based on the polymide polymer Matrimid (Figure 5). The
Matrimid solution was made and poured on a thin layer of polytetrafluoroethylene (PTFE) with pores of
a size of 0.05 micrometers. PTFE serves as the support for the polymer. The PTFE helps the membrane
be selective toward gas and liquid separation, which is one of the properties that we seek in our
membrane to have.
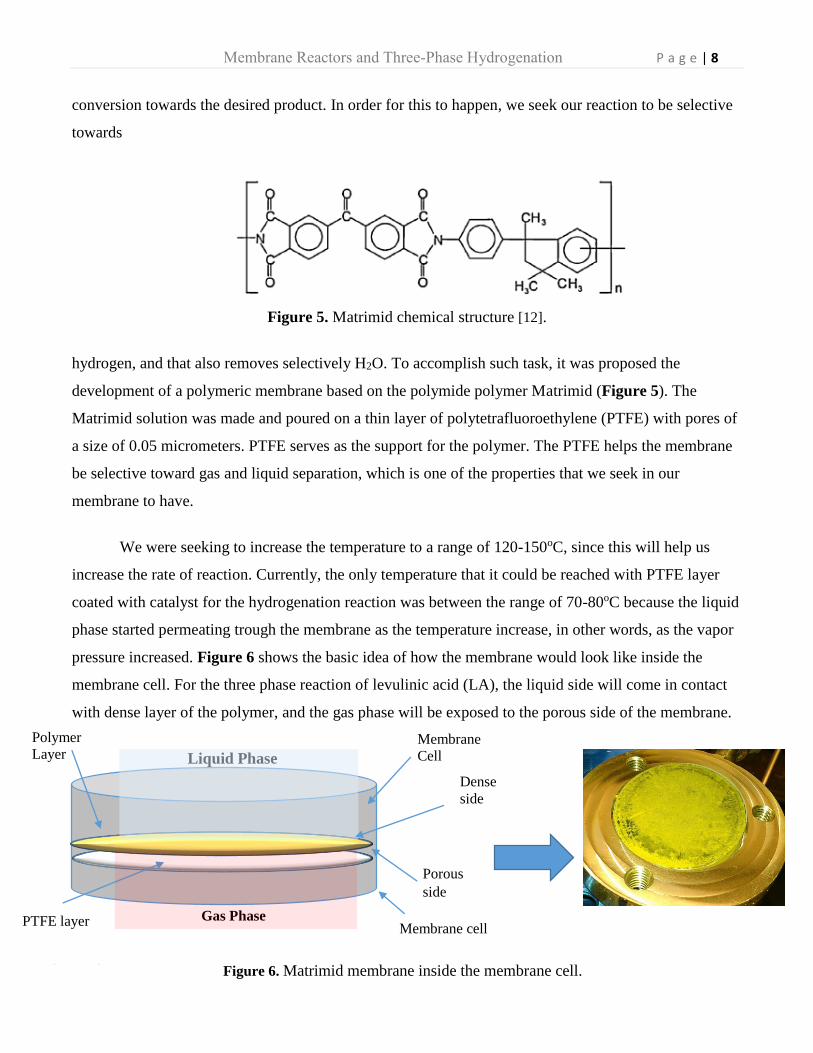
We were seeking to increase the temperature to a range of 120-150oC, since this will help us
increase the rate of reaction. Currently, the only temperature that it could be reached with PTFE layer
coated with catalyst for the hydrogenation reaction was between the range of 70-80oC because the liquid
phase started permeating trough the membrane as the temperature increase, in other words, as the vapor
pressure increased. Figure 6 shows the basic idea of how the membrane would look like inside the
membrane cell. For the three phase reaction of levulinic acid (LA), the liquid side will come in contact
with dense layer of the polymer, and the gas phase will be exposed to the porous side of the membrane.
Liquid Phase
Gas Phase
Porous
side
Polymer layer
PTFE layer
Dense
side
Figure 6. Matrimid membrane inside the membrane cell.
Membrane cell
Membrane Reactors and Three-Phase Hydrogenation P a g e | 9
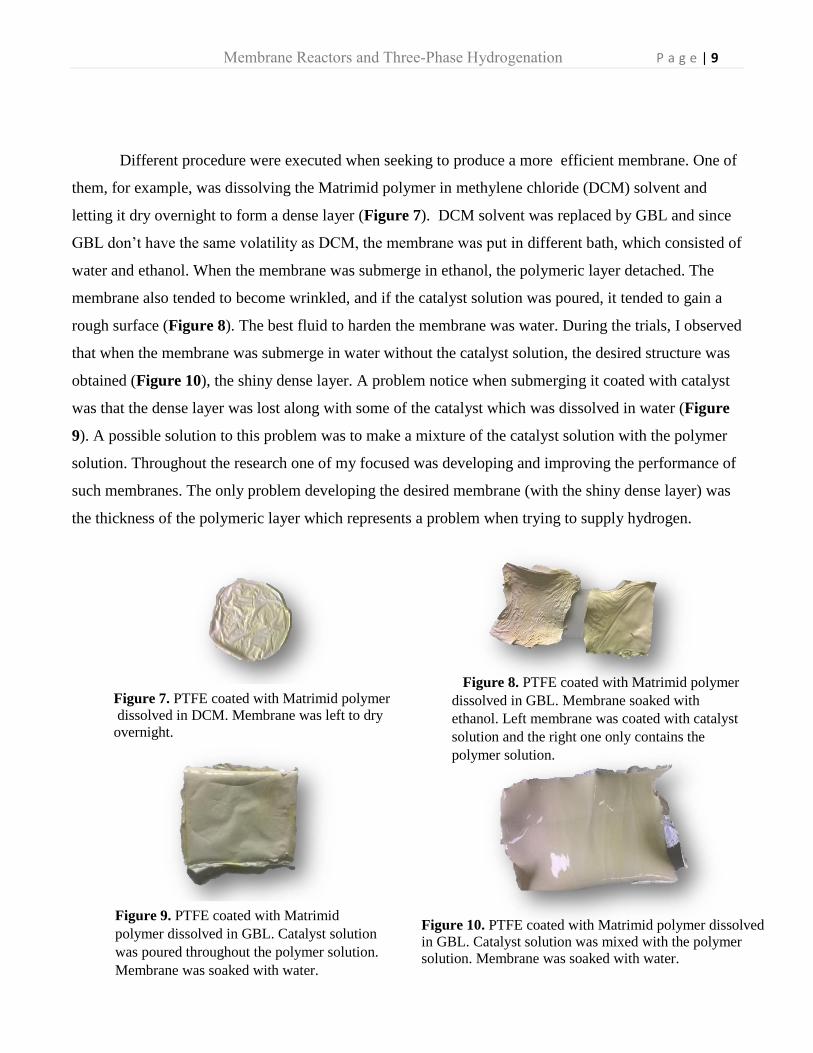
Different procedure were executed when seeking to produce a more efficient membrane. One of
them, for example, was dissolving the Matrimid polymer in methylene chloride (DCM) solvent and
letting it dry overnight to form a dense layer (Figure 7). DCM solvent was replaced by GBL and since
GBL don’t have the same volatility as DCM, the membrane was put in different bath, which consisted of
water and ethanol. When the membrane was submerge in ethanol, the polymeric layer detached. The
membrane also tended to become wrinkled, and if the catalyst solution was poured, it tended to gain a
rough surface (Figure 8). The best fluid to harden the membrane was water. During the trials, I observed
that when the membrane was submerge in water without the catalyst solution, the desired structure was
obtained (Figure 10), the shiny dense layer. A problem notice when submerging it coated with catalyst
was that the dense layer was lost along with some of the catalyst which was dissolved in water (Figure
9). A possible solution to this problem was to make a mixture of the catalyst solution with the polymer
solution. Throughout the research one of my focused was developing and improving the performance of
such membranes. The only problem developing the desired membrane (with the shiny dense layer) was
the thickness of the polymeric layer which represents a problem when trying to supply hydrogen.
Figure 8. PTFE coated with Matrimid polymer
dissolved in GBL. Membrane soaked with
ethanol. Left membrane was coated with catalyst
solution and the right one only contains the
polymer solution.
Figure 10. PTFE coated with Matrimid polymer dissolved
in GBL. Catalyst solution was mixed with the polymer
solution. Membrane was soaked with water.
Figure 7. PTFE coated with Matrimid polymer
dissolved in DCM. Membrane was left to dry
overnight.
Figure 9. PTFE coated with Matrimid
polymer dissolved in GBL. Catalyst solution
was poured throughout the polymer solution.
Membrane was soaked with water.
Membrane Reactors and Three-Phase Hydrogenation P a g e | 10
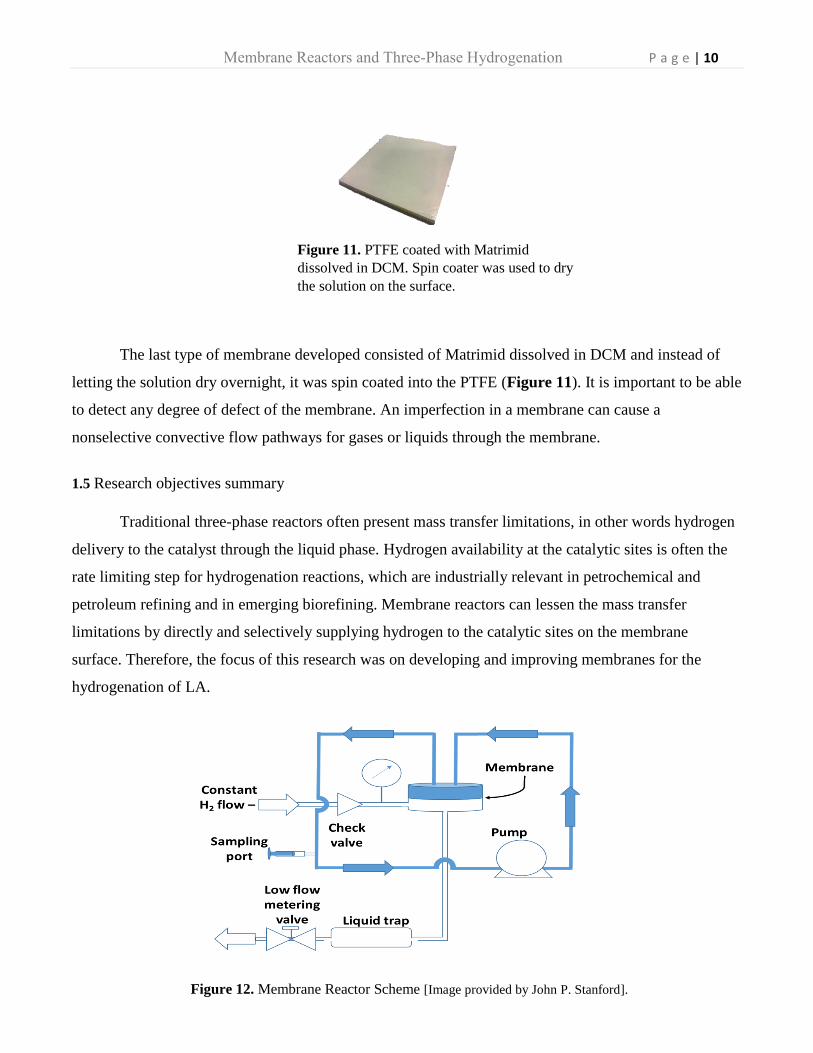
The last type of membrane developed consisted of Matrimid dissolved in DCM and instead of
letting the solution dry overnight, it was spin coated into the PTFE (Figure 11). It is important to be able
to detect any degree of defect of the membrane. An imperfection in a membrane can cause a
nonselective convective flow pathways for gases or liquids through the membrane.
1.5 Research objectives summary
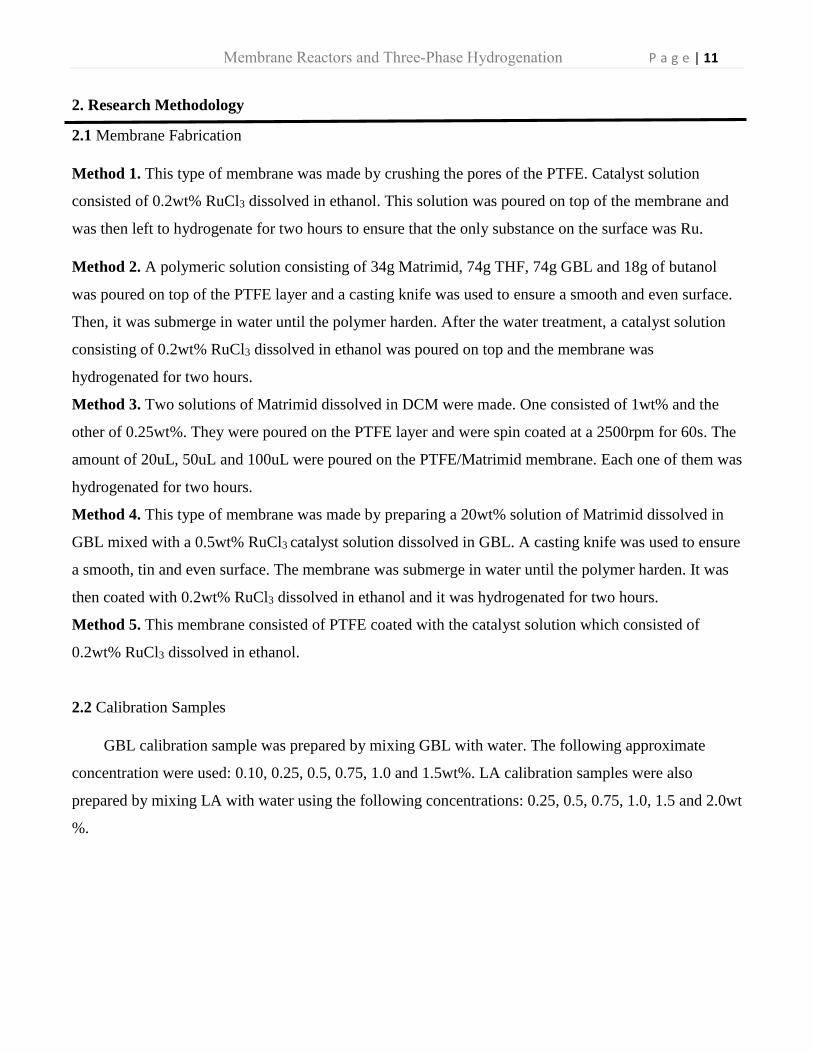
Traditional three-phase reactors often present mass transfer limitations, in other words hydrogen
delivery to the catalyst through the liquid phase. Hydrogen availability at the catalytic sites is often the
rate limiting step for hydrogenation reactions, which are industrially relevant in petrochemical and
petroleum refining and in emerging biorefining. Membrane reactors can lessen the mass transfer
limitations by directly and selectively supplying hydrogen to the catalytic sites on the membrane
surface. Therefore, the focus of this research was on developing and improving membranes for the
hydrogenation of LA.
Figure 11. PTFE coated with Matrimid
dissolved in DCM. Spin coater was used to dry
the solution on the surface.
Figure 12. Membrane Reactor Scheme [Image provided by John P. Stanford].
Membrane Reactors and Three-Phase Hydrogenation P a g e | 11
2. Research Methodology
2.1 Membrane Fabrication
Method 1. This type of membrane was made by crushing the pores of the PTFE. Catalyst solution
consisted of 0.2wt% RuCl3 dissolved in ethanol. This solution was poured on top of the membrane and
was then left to hydrogenate for two hours to ensure that the only substance on the surface was Ru.
Method 2. A polymeric solution consisting of 34g Matrimid, 74g THF, 74g GBL and 18g of butanol
was poured on top of the PTFE layer and a casting knife was used to ensure a smooth and even surface.
Then, it was submerge in water until the polymer harden. After the water treatment, a catalyst solution
consisting of 0.2wt% RuCl3 dissolved in ethanol was poured on top and the membrane was
hydrogenated for two hours.
Method 3. Two solutions of Matrimid dissolved in DCM were made. One consisted of 1wt% and the
other of 0.25wt%. They were poured on the PTFE layer and were spin coated at a 2500rpm for 60s. The
amount of 20uL, 50uL and 100uL were poured on the PTFE/Matrimid membrane. Each one of them was
hydrogenated for two hours.
Method 4. This type of membrane was made by preparing a 20wt% solution of Matrimid dissolved in
GBL mixed with a 0.5wt% RuCl3 catalyst solution dissolved in GBL. A casting knife was used to ensure
a smooth, tin and even surface. The membrane was submerge in water until the polymer harden. It was
then coated with 0.2wt% RuCl3 dissolved in ethanol and it was hydrogenated for two hours.
Method 5. This membrane consisted of PTFE coated with the catalyst solution which consisted of
0.2wt% RuCl3 dissolved in ethanol.
2.2 Calibration Samples
GBL calibration sample was prepared by mixing GBL with water. The following approximate
concentration were used: 0.10, 0.25, 0.5, 0.75, 1.0 and 1.5wt%. LA calibration samples were also
prepared by mixing LA with water using the following concentrations: 0.25, 0.5, 0.75, 1.0, 1.5 and 2.0wt
%.
Membrane Reactors and Three-Phase Hydrogenation P a g e | 12
2.3 Catalyst solution
The catalyst solution consisted of 0.2wt% RuCl3 dissolved in ethanol. The other catalyst solution
consisted of 0.5wt% RuCl3 dissolved in GBL.
2.4 GBL and water permeability
GBL and water permeability was tested in the membrane reactor to determine which fluid is
more convenient to use for the reaction. PTFE layer was placed in the membrane cell and was exposed
to the liquid for approximately 12 hours. Different temperature were tested, such as 60o, 70o and 80oC.
2.5 Solvent solutions
2.1g of Levulinic acid was dissolved in 70g of the following solvents: water, GBL and glycerol.
2.6 Levulinic acid hydrogenation reaction procedure
PTFE layer was coated with the catalyst solution (or the PTFE covered with the polymer was
coated with catalyst) and hydrogen was supplied constantly for approximately 2 hours, until the
following reaction was completed:
2RuCl3(s) + 3H2 (g) 6HCl (g) + 2Ru(s)
Once Ru was the only element deposit on the PTFE layer, it was placed on the membrane cell. The
reaction was carried out at 70oC for approximately 22-24 hours. Samples were collected at different
hours in order to fallow the rate of the progress at which GVL was formed. Membranes developed in
methods 1, 2, 3, 4 and 5 were analyzed in the reactor using the same procedure.
Membrane Reactors and Three-Phase Hydrogenation P a g e | 13
3. Results and Discussion
Different types of membranes described in methods 1, 2, and 4 are going to be briefly discussed
but the main focus will be on the one developed in method 3 and 5. The first type of membrane that is
going to be discuss is the one described in method 1. The idea was that this method would allow the
catalyst to have a greater exposure to the liquid face because the crushed pores wouldn’t allow the
catalyst to deeply penetrate the PTFE pores.
The membrane did not yield good
results. A possible cause for this could
have been that the crushed pores
prohibited the gas phase from
penetrating the membrane, therefore,
reaching the catalyst. The second type of
membrane analyzed was the one
described in method 2. This membrane
did not yield good results even though
the membrane layer was made thin as
possible in order to diminish the
difficulty in which the hydrogen
passes through the pores. An
explanation for this result is that the
thickness of polymer on the PTFE diminish the ability in which the hydrogen gas pass through the
membrane.
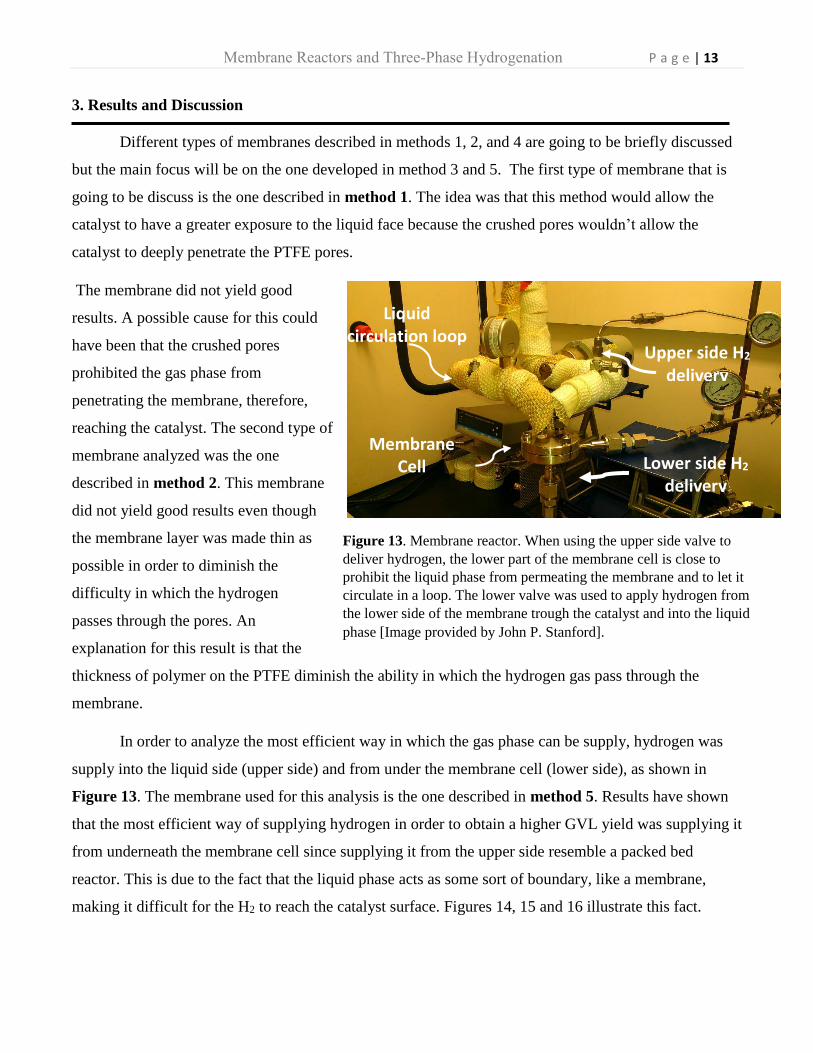
In order to analyze the most efficient way in which the gas phase can be supply, hydrogen was
supply into the liquid side (upper side) and from under the membrane cell (lower side), as shown in
Figure 13. The membrane used for this analysis is the one described in method 5. Results have shown
that the most efficient way of supplying hydrogen in order to obtain a higher GVL yield was supplying it
from underneath the membrane cell since supplying it from the upper side resemble a packed bed
reactor. This is due to the fact that the liquid phase acts as some sort of boundary, like a membrane,
making it difficult for the H2 to reach the catalyst surface. Figures 14, 15 and 16 illustrate this fact.
Liquid circulation loop
Lower side H2 delivery
Upper side H2 delivery
Membrane Cell
Figure 13. Membrane reactor. When using the upper side valve to
deliver hydrogen, the lower part of the membrane cell is close to
prohibit the liquid phase from permeating the membrane and to let it
circulate in a loop. The lower valve was used to apply hydrogen from
the lower side of the membrane trough the catalyst and into the liquid
phase [Image provided by John P. Stanford].
Membrane Reactors and Three-Phase Hydrogenation P a g e | 14
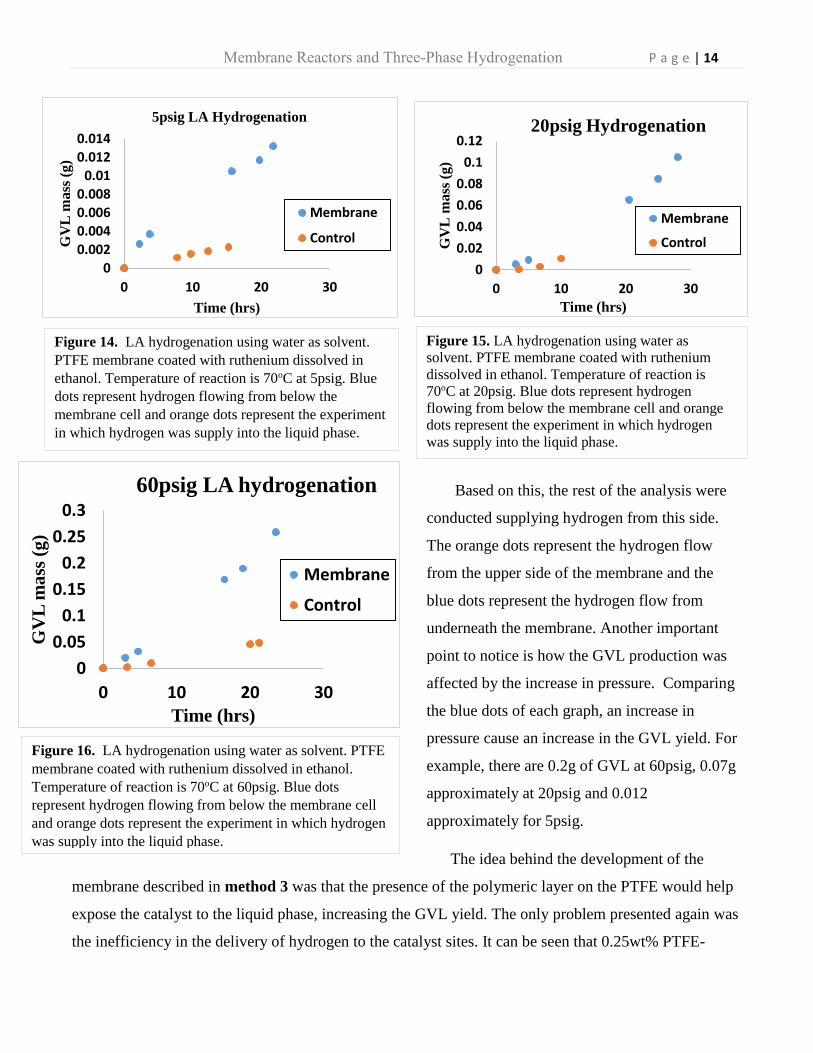
Based on this, the rest of the analysis were
conducted supplying hydrogen from this side.
The orange dots represent the hydrogen flow
from the upper side of the membrane and the
blue dots represent the hydrogen flow from
underneath the membrane. Another important
point to notice is how the GVL production was
affected by the increase in pressure. Comparing
the blue dots of each graph, an increase in
pressure cause an increase in the GVL yield. For
example, there are 0.2g of GVL at 60psig, 0.07g
approximately at 20psig and 0.012
approximately for 5psig.
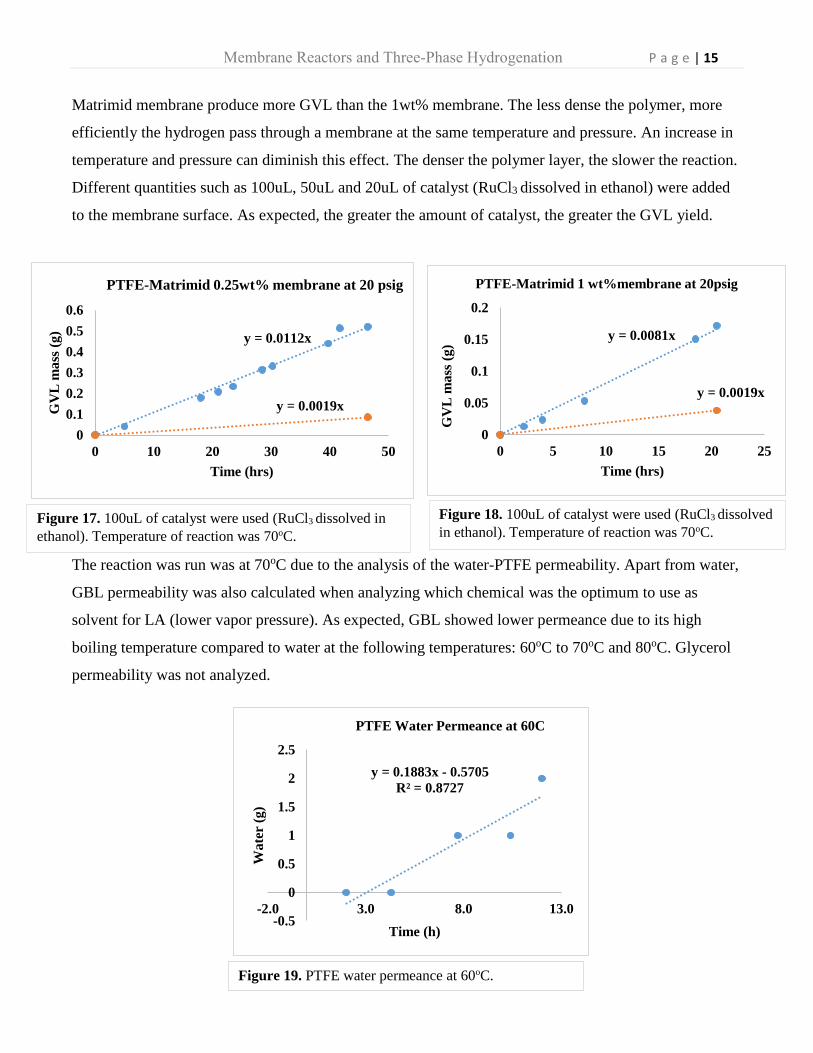
The idea behind the development of the
membrane described in method 3 was that the presence of the polymeric layer on the PTFE would help
expose the catalyst to the liquid phase, increasing the GVL yield. The only problem presented again was
the inefficiency in the delivery of hydrogen to the catalyst sites. It can be seen that 0.25wt% PTFE-
Figure 15. LA hydrogenation using water as
solvent. PTFE membrane coated with ruthenium
dissolved in ethanol. Temperature of reaction is
70oC at 20psig. Blue dots represent hydrogen
flowing from below the membrane cell and orange
dots represent the experiment in which hydrogen
was supply into the liquid phase.
Figure 14. LA hydrogenation using water as solvent.
PTFE membrane coated with ruthenium dissolved in
ethanol. Temperature of reaction is 70oC at 5psig. Blue
dots represent hydrogen flowing from below the
membrane cell and orange dots represent the experiment
in which hydrogen was supply into the liquid phase.
Figure 16. LA hydrogenation using water as solvent. PTFE
membrane coated with ruthenium dissolved in ethanol.
Temperature of reaction is 70oC at 60psig. Blue dots
represent hydrogen flowing from below the membrane cell
and orange dots represent the experiment in which hydrogen
was supply into the liquid phase.
0
0.05
0.1
0.15
0.2
0.25
0.3
0 10 20 30
GV
L m
ass
(g
)
Time (hrs)
60psig LA hydrogenation
Membrane
Control
0
0.002
0.004
0.006
0.008
0.01
0.012
0.014
0 10 20 30
GV
L m
ass
(g
)
Time (hrs)
5psig LA Hydrogenation
Membrane
Control
0
0.02
0.04
0.06
0.08
0.1
0.12
0 10 20 30
GV
L m
ass
(g
)
Time (hrs)
20psig Hydrogenation
Membrane
Control
Membrane Reactors and Three-Phase Hydrogenation P a g e | 15
Matrimid membrane produce more GVL than the 1wt% membrane. The less dense the polymer, more
efficiently the hydrogen pass through a membrane at the same temperature and pressure. An increase in
temperature and pressure can diminish this effect. The denser the polymer layer, the slower the reaction.
Different quantities such as 100uL, 50uL and 20uL of catalyst (RuCl3 dissolved in ethanol) were added
to the membrane surface. As expected, the greater the amount of catalyst, the greater the GVL yield.
The optimum temperature in which this
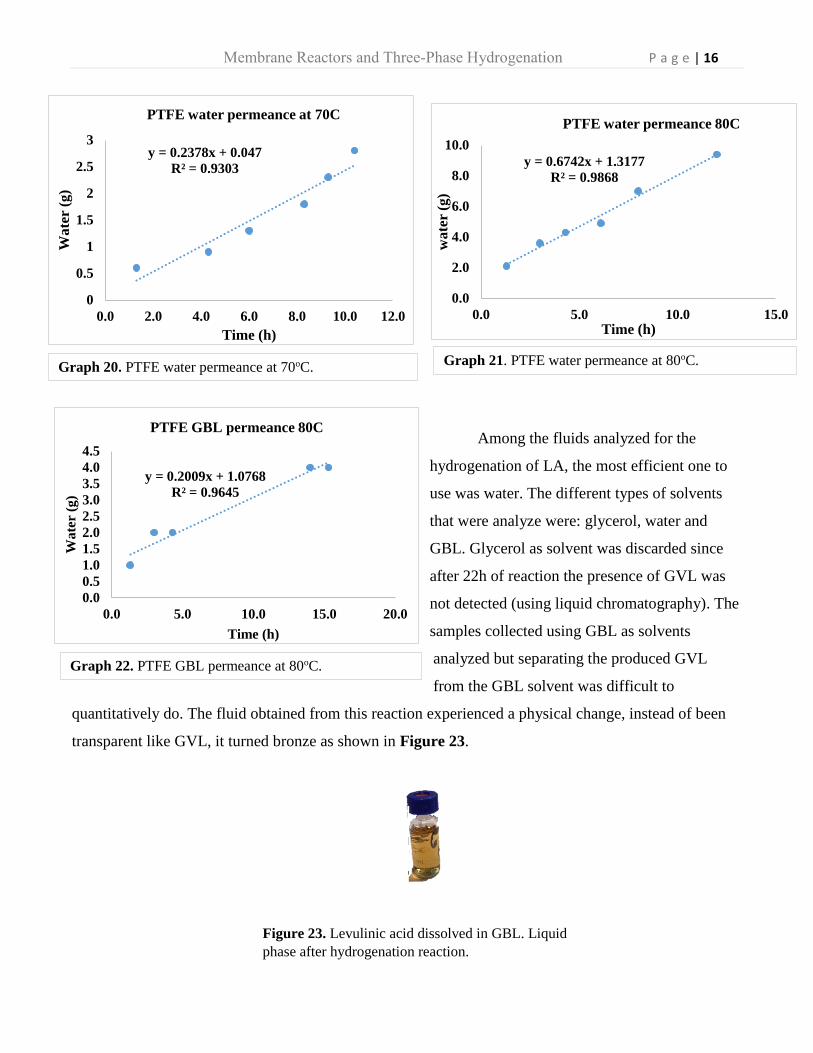
The reaction was run was at 70oC due to the analysis of the water-PTFE permeability. Apart from water,
GBL permeability was also calculated when analyzing which chemical was the optimum to use as
solvent for LA (lower vapor pressure). As expected, GBL showed lower permeance due to its high
boiling temperature compared to water at the following temperatures: 60oC to 70oC and 80oC. Glycerol
permeability was not analyzed.
Figure 17. 100uL of catalyst were used (RuCl3 dissolved in
ethanol). Temperature of reaction was 70oC.
y = 0.0112x
y = 0.0019x
0
0.1
0.2
0.3
0.4
0.5
0.6
0 10 20 30 40 50
GV
L m
ass
(g)
Time (hrs)
PTFE-Matrimid 0.25wt% membrane at 20 psig
y = 0.1883x - 0.5705
R² = 0.8727
-0.5
0
0.5
1
1.5
2
2.5
-2.0 3.0 8.0 13.0
Wate
r (g
)
Time (h)
PTFE Water Permeance at 60C
Figure 19. PTFE water permeance at 60oC.
y = 0.0081x
y = 0.0019x
0
0.05
0.1
0.15
0.2
0 5 10 15 20 25G
VL
mass
(g
)
Time (hrs)
PTFE-Matrimid 1 wt%membrane at 20psig
Figure 18. 100uL of catalyst were used (RuCl3 dissolved
in ethanol). Temperature of reaction was 70oC.
Membrane Reactors and Three-Phase Hydrogenation P a g e | 16
Among the fluids analyzed for the
hydrogenation of LA, the most efficient one to
use was water. The different types of solvents
that were analyze were: glycerol, water and
GBL. Glycerol as solvent was discarded since
after 22h of reaction the presence of GVL was
not detected (using liquid chromatography). The
samples collected using GBL as solvents
analyzed but separating the produced GVL
from the GBL solvent was difficult to
quantitatively do. The fluid obtained from this reaction experienced a physical change, instead of been
transparent like GVL, it turned bronze as shown in Figure 23.
Figure 23. Levulinic acid dissolved in GBL. Liquid
phase after hydrogenation reaction.
y = 0.2009x + 1.0768
R² = 0.9645
0.0
0.5
1.0
1.5
2.0
2.5
3.0
3.5
4.0
4.5
0.0 5.0 10.0 15.0 20.0
Wate
r (g
)
Time (h)
PTFE GBL permeance 80C
y = 0.6742x + 1.3177
R² = 0.9868
0.0
2.0
4.0
6.0
8.0
10.0
0.0 5.0 10.0 15.0
wa
ter
(g)
Time (h)
PTFE water permeance 80C
Graph 22. PTFE GBL permeance at 80oC.
Graph 21. PTFE water permeance at 80oC.
y = 0.2378x + 0.047
R² = 0.9303
0
0.5
1
1.5
2
2.5
3
0.0 2.0 4.0 6.0 8.0 10.0 12.0
Wa
ter
(g)
Time (h)
PTFE water permeance at 70C
Graph 20. PTFE water permeance at 70oC.
Membrane Reactors and Three-Phase Hydrogenation P a g e | 17
4. Conclusion & Future Scope
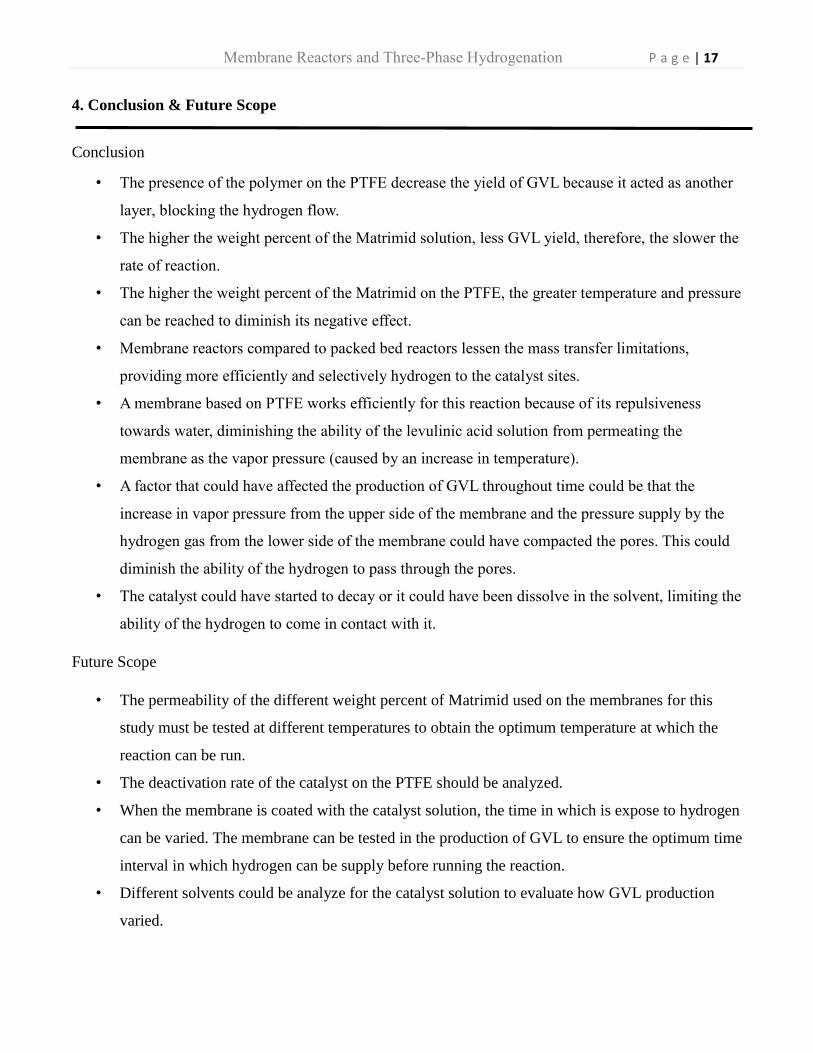
Conclusion
• The presence of the polymer on the PTFE decrease the yield of GVL because it acted as another
layer, blocking the hydrogen flow.
• The higher the weight percent of the Matrimid solution, less GVL yield, therefore, the slower the
rate of reaction.
• The higher the weight percent of the Matrimid on the PTFE, the greater temperature and pressure
can be reached to diminish its negative effect.
• Membrane reactors compared to packed bed reactors lessen the mass transfer limitations,
providing more efficiently and selectively hydrogen to the catalyst sites.
• A membrane based on PTFE works efficiently for this reaction because of its repulsiveness
towards water, diminishing the ability of the levulinic acid solution from permeating the
membrane as the vapor pressure (caused by an increase in temperature).
• A factor that could have affected the production of GVL throughout time could be that the
increase in vapor pressure from the upper side of the membrane and the pressure supply by the
hydrogen gas from the lower side of the membrane could have compacted the pores. This could
diminish the ability of the hydrogen to pass through the pores.
• The catalyst could have started to decay or it could have been dissolve in the solvent, limiting the
ability of the hydrogen to come in contact with it.
Future Scope
• The permeability of the different weight percent of Matrimid used on the membranes for this
study must be tested at different temperatures to obtain the optimum temperature at which the
reaction can be run.
• The deactivation rate of the catalyst on the PTFE should be analyzed.
• When the membrane is coated with the catalyst solution, the time in which is expose to hydrogen
can be varied. The membrane can be tested in the production of GVL to ensure the optimum time
interval in which hydrogen can be supply before running the reaction.
• Different solvents could be analyze for the catalyst solution to evaluate how GVL production
varied.
Membrane Reactors and Three-Phase Hydrogenation P a g e | 18
• The bronze colored fluid obtained when GBL was used as solvent for levulinic acid must be
more fully analyzed.
Membrane Reactors and Three-Phase Hydrogenation P a g e | 19
5. Supporting Information
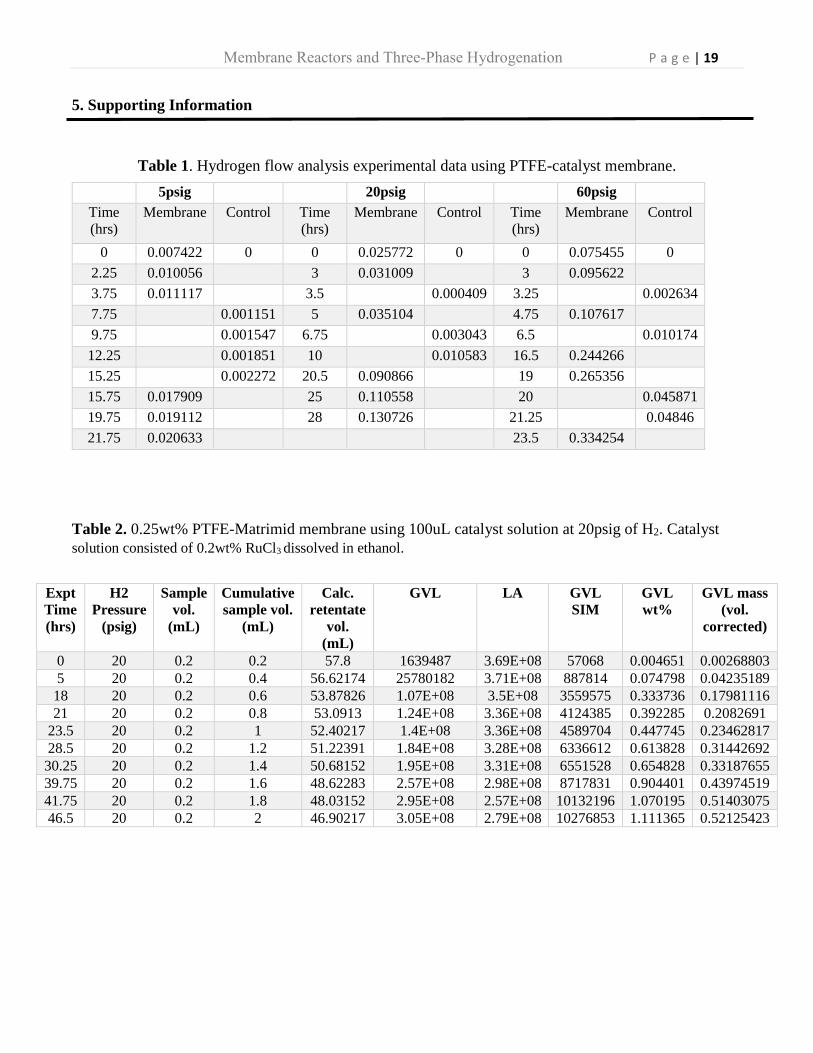
Table 1. Hydrogen flow analysis experimental data using PTFE-catalyst membrane.
Table 2. 0.25wt% PTFE-Matrimid membrane using 100uL catalyst solution at 20psig of H2. Catalyst
solution consisted of 0.2wt% RuCl3 dissolved in ethanol.
5psig 20psig 60psig
Time
(hrs)
Membrane Control Time
(hrs)
Membrane Control Time
(hrs)
Membrane Control
0 0.007422 0 0 0.025772 0 0 0.075455 0
2.25 0.010056 3 0.031009 3 0.095622
3.75 0.011117 3.5 0.000409 3.25 0.002634
7.75 0.001151 5 0.035104 4.75 0.107617
9.75 0.001547 6.75 0.003043 6.5 0.010174
12.25 0.001851 10 0.010583 16.5 0.244266
15.25 0.002272 20.5 0.090866 19 0.265356
15.75 0.017909 25 0.110558 20 0.045871
19.75 0.019112 28 0.130726 21.25 0.04846
21.75 0.020633 23.5 0.334254
Expt
Time
(hrs)
H2
Pressure
(psig)
Sample
vol.
(mL)
Cumulative
sample vol.
(mL)
Calc.
retentate
vol.
(mL)
GVL LA GVL
SIM
GVL
wt%
GVL mass
(vol.
corrected)
0 20 0.2 0.2 57.8 1639487 3.69E+08 57068 0.004651 0.00268803
5 20 0.2 0.4 56.62174 25780182 3.71E+08 887814 0.074798 0.04235189
18 20 0.2 0.6 53.87826 1.07E+08 3.5E+08 3559575 0.333736 0.17981116
21 20 0.2 0.8 53.0913 1.24E+08 3.36E+08 4124385 0.392285 0.2082691
23.5 20 0.2 1 52.40217 1.4E+08 3.36E+08 4589704 0.447745 0.23462817
28.5 20 0.2 1.2 51.22391 1.84E+08 3.28E+08 6336612 0.613828 0.31442692
30.25 20 0.2 1.4 50.68152 1.95E+08 3.31E+08 6551528 0.654828 0.33187655
39.75 20 0.2 1.6 48.62283 2.57E+08 2.98E+08 8717831 0.904401 0.43974519
41.75 20 0.2 1.8 48.03152 2.95E+08 2.57E+08 10132196 1.070195 0.51403075
46.5 20 0.2 2 46.90217 3.05E+08 2.79E+08 10276853 1.111365 0.52125423
Membrane Reactors and Three-Phase Hydrogenation P a g e | 20
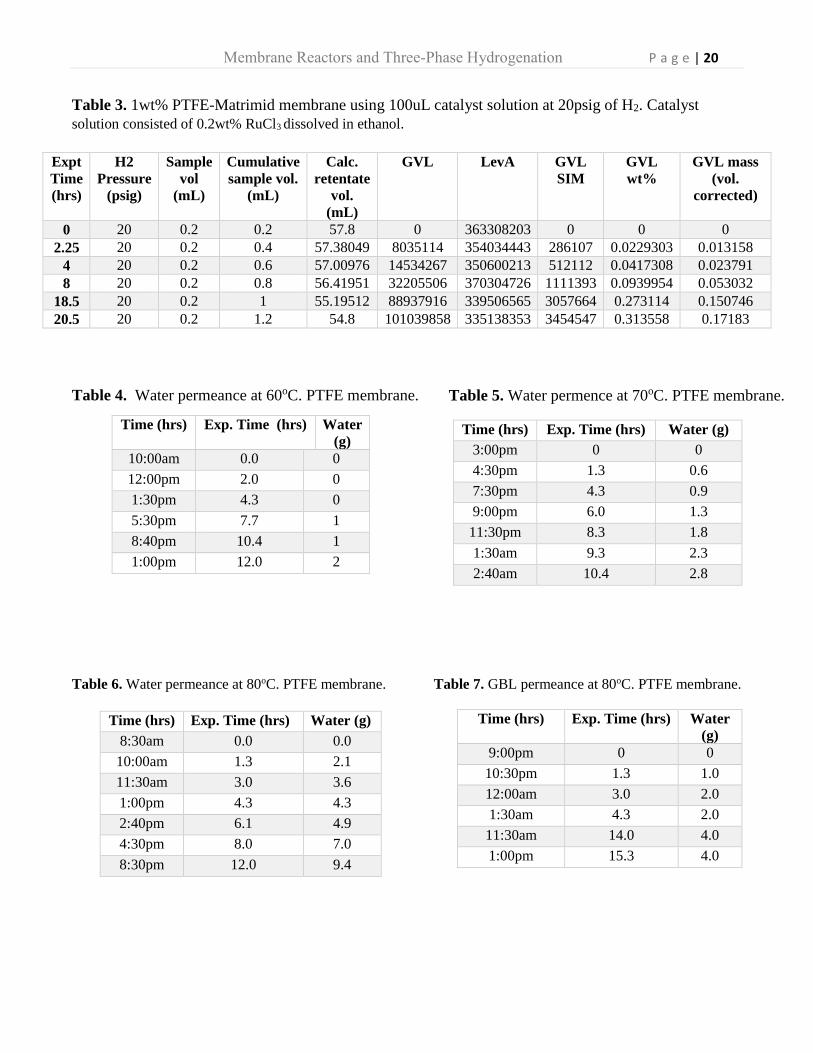
Table 3. 1wt% PTFE-Matrimid membrane using 100uL catalyst solution at 20psig of H2. Catalyst
solution consisted of 0.2wt% RuCl3 dissolved in ethanol.
Table 4. Water permeance at 60oC. PTFE membrane.
Table 6. Water permeance at 80oC. PTFE membrane. Table 7. GBL permeance at 80oC. PTFE membrane.
Expt
Time
(hrs)
H2
Pressure
(psig)
Sample
vol
(mL)
Cumulative
sample vol.
(mL)
Calc.
retentate
vol.
(mL)
GVL LevA GVL
SIM
GVL
wt%
GVL mass
(vol.
corrected)
0 20 0.2 0.2 57.8 0 363308203 0 0 0
2.25 20 0.2 0.4 57.38049 8035114 354034443 286107 0.0229303 0.013158
4 20 0.2 0.6 57.00976 14534267 350600213 512112 0.0417308 0.023791
8 20 0.2 0.8 56.41951 32205506 370304726 1111393 0.0939954 0.053032
18.5 20 0.2 1 55.19512 88937916 339506565 3057664 0.273114 0.150746
20.5 20 0.2 1.2 54.8 101039858 335138353 3454547 0.313558 0.17183
Time (hrs) Exp. Time (hrs) Water
(g)
10:00am 0.0 0
12:00pm 2.0 0
1:30pm 4.3 0
5:30pm 7.7 1
8:40pm 10.4 1
1:00pm 12.0 2
Time (hrs) Exp. Time (hrs) Water (g)
3:00pm 0 0
4:30pm 1.3 0.6
7:30pm 4.3 0.9
9:00pm 6.0 1.3
11:30pm 8.3 1.8
1:30am 9.3 2.3
2:40am 10.4 2.8
Time (hrs) Exp. Time (hrs) Water (g)
8:30am 0.0 0.0
10:00am 1.3 2.1
11:30am 3.0 3.6
1:00pm 4.3 4.3
2:40pm 6.1 4.9
4:30pm 8.0 7.0
8:30pm 12.0 9.4
Time (hrs) Exp. Time (hrs) Water
(g)
9:00pm 0 0
10:30pm 1.3 1.0
12:00am 3.0 2.0
1:30am 4.3 2.0
11:30am 14.0 4.0
1:00pm 15.3 4.0
Table 5. Water permence at 70oC. PTFE membrane.
memranemembrane.
Membrane Reactors and Three-Phase Hydrogenation P a g e | 21
6. References
[1] Roman-Leshkov, Y., Chheda, J. N., & Dumesic, J. A. (2006) Phase modifiers promote efficient
production of hydroxymethylfurfural from fructose. Science (New York, N. Y.), 312(5782), 1933-
1937.Doi:10.1126/science.112337
[2] David Martin A. D., Bond J. Q., & Dumesic J. A. (2010) Catalytic conversion of biomass to
biofuels. pp. 1493–1513. DOI: 10.1039/C004654J
[3] D. K. S. Ng, V. Pham, M. M. El-halwagi, A. Jiménez-gutiérrez, and H. D. Spriggs, “A Hierarchical
Approach to the Synthesis and Analysis of Integrated Biorefineries,” pp. 425–432.
Available:http://pubs.rsc.org/en/content/articlehtml/2010/gc/c004654j
[4] Granados J. Ta , , Lonides E. L., , Carpintero O. (2012)., Climate change and the world economy:
short-run determinants of atmospheric CO2. DOI:10.1016/j.envsci.2012.03.008
[5] L. Hu, Y. Sun, and L. Lin, “Efficient Conversion of Glucose into 5-Hydroxymethylfurfural by
Chromium(III) Chloride in Inexpensive Ionic Liquid,” Industrial & Engineering Chemistry Research,
vol. 51, no. 3, pp. 1099–1104, Jan. 2012.
[6]R. L. de Souza, H. Yu, F. Rataboul, and N. Essayem, “5-Hydroxymethylfurfural (5-HMF)
Production from Hexoses: Limits of Heterogeneous Catalysis in Hydrothermal Conditions
and Potential of Concentrated Aqueous Organic Acids as Reactive Solvent System,”
Challenges, vol. 3, no. 2, pp. 212–232, Sep. 2012.
[7]T. Wang, Y. J. Pagán-Torres, E. J. Combs, J. a. Dumesic, and B. H. Shanks, “Water-Compatible
Lewis Acid-CatalyzedConversion of Carbohydrates to 5-Hydroxymethylfurfural in a Biphasic Solvent
System,” Topics in Catalysis, vol. 55, no.7–10, pp. 657–662, Jun. 2012.
[8] I. E. A. (IEA), “2012 Key World Energy Statistics,” 2012. [Online]. Available:
https://www.iea.org/publications/freepublications/publication/kwes.pdf.
[9] D. M. Alonso, J. Q. Bond, and J. a. Dumesic, “Catalytic conversion of biomass to biofuels,”
Green Chemistry, vol. 12, no. 9, p. 1493, 2010.
[10] Dumesic J. A., Wettstein A. G., Alonso D. M. (2013). Gamma-valerolactone, a sustainable
platform molecule derived from lignocellulosic biomass. Green Chem., 2013, 15,584-595. DOI:
10.1039/c3gc37065h.
[11] Wettstein S. G., Alonso D. M., Gurbuz E. I., Dumesic J. A. (2012) A roadmap for conversion of
lignocellulose biomass to chemicals and fuels.1:218–224. Available:
http://www.sciencedirect.com/science/article/pii/S2211339812000342
[12]Loloei M., Omidkhah M., Moghadassi A., Amooghin A. E. (2015) “Preparation and
characterization of Matrimid® 5218 based binary and ternary mixed matrix membranes for CO2
separation.” DOI:10.1016/j.ijggc.2015.04.016