Embed Size (px)
Citation preview


Disclaimer
This study has been carried out for the European Aviation Safety Agency by an external organization and expresses the opinion of the organization undertaking the study. It is provided for information purposes only and the views expressed in the study have not been adopted, endorsed or in any way approved by the European Aviation Safety Agency. Consequently it should not be relied upon as a statement, as any form of warranty, representation, undertaking, contractual, or other commitment binding in law upon the European Aviation Safety Agency.
Ownership of all copyright and other intellectual property rights in this material including any documentation, data and technical information, remains vested to the European Aviation Safety Agency. All logo, copyrights, trademarks, and registered trademarks that may be contained within are the property of their respective owners.
Reproduction of this study, in whole or in part, is permitted under the condition that the full body of this Disclaimer remains clearly and visibly affixed at all times with such reproduced part.
SAFETY IMPLICATION
OF BIOFUELS IN AVIATION
Thomas EschHarald FunkePeter Roosen
Aachen University of Applied Sciences
EASA Report No. EASA.2008.C51
compilation date July 7, 2010
Keywords
General Aviation, safety, gasoline, petrol, ethanol, blending, biofuels, MOGAS, AVGAS, E-0, E-5,
E-10, E-15, aircraft airworthiness, water, solved water detection, gasoline mixing, volatility, vapour
pressure, vapour locking, long-term storage, material compatibility, carburettor icing, gasoline
turbidity, phase separation, life-cycle analysis

2

Contents
Acknowledgements 11
1 Introduction and Outline of Work 12
2 Summary and Recommendations 14
3 Operating Existing Engines with Ethanol-Admixed Fuels 17
3.1 Definition of an “Old” Engine . . . . . . . . . . . . . . . . . . . . . . . . . . . . . 17
3.2 Survey of Aircraft Frames and Engines Authorized for MOGAS Operation . . . . . 17
3.3 Legislative and Practical Boundary Conditions for Biogenic Components Admixing 21
3.3.1 Usage Statistics of Various Fuel Types . . . . . . . . . . . . . . . . . . . . 23
3.4 Aircraft Fitness for Ethanol Admixtures . . . . . . . . . . . . . . . . . . . . . . . . 25
4 Determination of the Status Quo in General Aviation 26
4.1 Gasoline Types . . . . . . . . . . . . . . . . . . . . . . . . . . . . . . . . . . . . . 26
4.1.1 Historic Development of Gasolines and their Alcohol Admixtures . . . . . 26
4.1.2 Prevailing Legal Boundary Conditions and Norms for Vehicle Gasolines . . 28
4.1.3 Assessment of Knocking Properties for Gasolines by Octane Numbers . . . 32
4.2 Synoptical Statistical Data on General Aviation (T 1) . . . . . . . . . . . . . . . . 35
5 Scientific and Technical Boundary Conditions for Ethanol-Admixed Gasoline Usage inAviation (T 1) 38
5.1 Water-Induced Phase Separation in Gasoline-Ethanol Mixtures . . . . . . . . . . . 38
5.2 Vapour Locking Potential of Mixtures of Ethanol-Admixed Gasolines . . . . . . . . 43
5.3 Evaporation Enthalpy Effects . . . . . . . . . . . . . . . . . . . . . . . . . . . . . . 47
5.4 Compatibility of Fuel System and Engine Materials with Ethanol Content in Fuel . 48
5.4.1 Metallic components . . . . . . . . . . . . . . . . . . . . . . . . . . . . . . 49
5.4.2 Plastics, Elastomers and Glues . . . . . . . . . . . . . . . . . . . . . . . . . 50
6 Assessment of Danger Potentials Attributed to Gasoline Ethanol Admixtures 51
6.1 Failure Mode and Effects Analysis (T 7) . . . . . . . . . . . . . . . . . . . . . . . 51
6.1.1 Methodology and Approach . . . . . . . . . . . . . . . . . . . . . . . . . . 51
6.1.2 Overall Results of the Failure Mode and Effects Analysis . . . . . . . . . . 53
6.1.3 FMEA Conclusions . . . . . . . . . . . . . . . . . . . . . . . . . . . . . . 61
6.2 Task Spanning Activities for Experimentation . . . . . . . . . . . . . . . . . . . . . 63
3

6.3 Analysis of Phase Separation Hazard (T 2a, 2c) . . . . . . . . . . . . . . . . . . . 64
6.3.1 Methodology and Approach . . . . . . . . . . . . . . . . . . . . . . . . . . 64
6.3.2 High-Altitude Flight Experiments for Cool-Down Experiments Boundary
Conditions Determination (T 2a) . . . . . . . . . . . . . . . . . . . . . . . 64
6.3.3 Tank Air Throughput During a Flight (T 2a) . . . . . . . . . . . . . . . . . 66
6.3.4 Determination of Compositional Changes in Gasolines Stored in Aircraft
Tanks for Prolonged Periods (T 2c) . . . . . . . . . . . . . . . . . . . . . . 67
6.3.5 Onset of Hazing in Custom Mixed Ethanol-Containing Gasolines (T 2a) . . 72
6.3.6 Phase Separation: Conclusion (T 2a) . . . . . . . . . . . . . . . . . . . . . 74
6.4 Analysis of Carburettor Icing Hazard (T 2b) . . . . . . . . . . . . . . . . . . . . . 76
6.4.1 Methodology and Approach . . . . . . . . . . . . . . . . . . . . . . . . . . 76
6.4.2 Temperature Drop Determination in a ROTAX Engine . . . . . . . . . . . . 76
6.4.3 Temperature Drop Determination in a Lycoming O 360 A1A Engine . . . . 77
6.4.4 Icing: Conclusions . . . . . . . . . . . . . . . . . . . . . . . . . . . . . . . 79
6.5 Analysis of Intensified Vapour Locking Hazard Caused by Gasoline Mixing . . . . 80
6.5.1 Fuel Heat-Up Experiments with a MORANE MS 893 E-D Aircraft (T 3) . . 81
6.5.2 Investigation of Pressure Drops in the MORANE Fuel System Under Oper-
ating Conditions (T 3) . . . . . . . . . . . . . . . . . . . . . . . . . . . . . 84
6.5.3 Vibration Measurements in the MORANE Fuel System (T 3) . . . . . . . . 85
6.5.4 Vapour Locking Experiments on a Custom Test Rig (T 3) . . . . . . . . . . 86
6.5.5 Assessment of a Common Gasoline Volatility Test Device (T 3) . . . . . . 92
6.5.6 Vapour Lock: Conclusions . . . . . . . . . . . . . . . . . . . . . . . . . . . 93
6.6 Material Compatibility of Common Constructive Materials for Aircraft Parts (T 4) . 93
6.6.1 Approach / Methodology . . . . . . . . . . . . . . . . . . . . . . . . . . . 93
6.6.2 Report on Plastic Materials Compatibility with Ethanol-Admixed Gasolines 94
6.6.3 Survey on Deployed Materials for Fuel Systems . . . . . . . . . . . . . . . 120
6.6.4 Conclusions . . . . . . . . . . . . . . . . . . . . . . . . . . . . . . . . . . . 125
7 Metrological Aids for Gasoline Composition Assessment (T 6) 126
7.1 Determination of an Ethanol Share in Gasoline . . . . . . . . . . . . . . . . . . . . 126
7.1.1 Colour Indicator Method . . . . . . . . . . . . . . . . . . . . . . . . . . . . 126
7.1.2 Ethanol Extraction by Water . . . . . . . . . . . . . . . . . . . . . . . . . . 127
7.2 Detection of Solved Water . . . . . . . . . . . . . . . . . . . . . . . . . . . . . . . 128
7.2.1 Chemical Water Detection . . . . . . . . . . . . . . . . . . . . . . . . . . . 129
7.2.2 Optical Water Detection . . . . . . . . . . . . . . . . . . . . . . . . . . . . 131
4

7.2.3 Electrical Water Detection . . . . . . . . . . . . . . . . . . . . . . . . . . . 132
7.2.4 Water detection by molecule-specific adsorption . . . . . . . . . . . . . . . 133
7.3 Detection of Solved Water: Conclusion . . . . . . . . . . . . . . . . . . . . . . . . 135
8 Life-Cycle Analysis of Ethanol-Admixed Gasolines (T 5) 137
8.1 Approach / Methodology . . . . . . . . . . . . . . . . . . . . . . . . . . . . . . . . 137
8.2 Experimental Investigation of Exhaust Gas Emissions for a ROTAX 912 ULS Engine 138
8.3 Life Cycle Analysis of Measured Exhaust Gas Emissions of the ROTAX 912 Engine 140
8.4 Conclusions . . . . . . . . . . . . . . . . . . . . . . . . . . . . . . . . . . . . . . . 143
References 144
A Engines and Cells Certified by the United States FAA 146
B Statistical Data on General Aviation and Ultralight Aircraft (T 1) 154
C Tabulated FMEA Results 160
D Task Spanning Activities for Experimentation 196
D.1 Acquisition and Handling of Test Fuels . . . . . . . . . . . . . . . . . . . . . . . . 196
D.2 Instrumentation of ACUAS’s flying lab, a MORANE MS 893 E-D . . . . . . . . . . 200
D.3 Setup, Instrumentation and Test Matrix of a Test-Rigged ROTAX 912 ULS Engine
in Propeller Operation . . . . . . . . . . . . . . . . . . . . . . . . . . . . . . . . . 203
D.4 Custom Designed Test Rig for Vapour Locking and Water Detection Experimentation205
D.4.1 Rig Control . . . . . . . . . . . . . . . . . . . . . . . . . . . . . . . . . . . 208
D.4.2 Procedures of Test Rig Operation for Nucleation Assessment . . . . . . . . 208
D.4.3 Functions . . . . . . . . . . . . . . . . . . . . . . . . . . . . . . . . . . . . 209
D.4.4 Measurement Options . . . . . . . . . . . . . . . . . . . . . . . . . . . . . 210
D.4.5 Environment Protection and Safety Arrangements . . . . . . . . . . . . . . 210
D.4.6 Bubble Sensor Design . . . . . . . . . . . . . . . . . . . . . . . . . . . . . 210
D.4.7 Calibration of the Test Rig . . . . . . . . . . . . . . . . . . . . . . . . . . . 211
E Life-Cycle Analysis of Ethanol-Admixed Gasolines — Report by LUDWIG BÖLKOW SYS-
TEMTECHNIK 213
F Keywords and Abbreviations Index 277
5

List of Figures
1 Development of biogenic fuel shares from 2007 to 2009 in Germany . . . . . . . . 23
2 Ethanol content in random German Super Plus gasoline probes taken in June 2009 24
3 Shares of different fuel types (Diesel fuel excluded) for 2008 in Germany. The
share titled “Automotive Petrol Fuel” also contains the amount of gasoline taken for
aviation purposes, which is smaller than the AVGAS share (see Sect. B). Source:
Mineralölwirtschaftsverband Deutschland . . . . . . . . . . . . . . . . . . . . . . . 24
4 Ratio of Super Plus RON 100 to Super RON 98 gasolines . . . . . . . . . . . . . . 25
5 Qualitative evaporation curves for various gasoline types and two jet fuels. . . . . . 30
6 DVPE values of random test samples, June 2009 . . . . . . . . . . . . . . . . . . . 32
7 Octane numbers of 21 gasoline test samples and SIOBIA standard gasoline . . . . 34
8 German and United Kingdom numbers for the aircraft categories of interest. No
distinction is made with respect to used fuel type. . . . . . . . . . . . . . . . . . . 36
9 Estimated European total numbers for the aircraft categories of interest . . . . . . . 36
10 Graphical display of the distribution of small aircraft in Europe . . . . . . . . . . . 37
11 Ternary diagram for the substances gasoline, water and ethanol . . . . . . . . . . . 39
12 Maximum water concentrations in different gasoline/ethanol mixtures . . . . . . . . 40
13 Measured water concentrations in different commercially offered gasolines . . . . . 41
14 Binodal and spinodal limit curves in a ternary GEW diagram . . . . . . . . . . . . 42
15 Dependence of static vapour pressure on the amount of admixed ethanol . . . . . . 44
16 Dependence of dynamic vapour pressure on the amount of admixed ethanol . . . . 45
17 Mixing gasoline types with differing ethanol admixtures . . . . . . . . . . . . . . . 46
18 DVPE values of 21 test samples taken at different gasoline stations . . . . . . . . . 46
19 Enthalpy of vaporization for ethanol admixed gasoline blends . . . . . . . . . . . . 48
20 Temperature/humidity domains for increased danger of carburettor icing . . . . . . 49
21 Hard plastics typology pyramid . . . . . . . . . . . . . . . . . . . . . . . . . . . . 51
22 FMEA objectives overview . . . . . . . . . . . . . . . . . . . . . . . . . . . . . . . 52
23 FMEA risk attribution classes overview . . . . . . . . . . . . . . . . . . . . . . . . 53
24 FMEA issues categories overview . . . . . . . . . . . . . . . . . . . . . . . . . . . 54
25 Principal experimentation objects . . . . . . . . . . . . . . . . . . . . . . . . . . . 63
26 Flight test card for tank heat drain experiments . . . . . . . . . . . . . . . . . . . . 65
27 Temperature developments at different positions on a MORANEfuel tank surface . . 65
28 Temperature developments inside a MORANEfuel tank . . . . . . . . . . . . . . . . 66
29 Temperature crossover point inside a MORANEfuel tank . . . . . . . . . . . . . . . 67
6
30 Air ingestion by tank ventilation . . . . . . . . . . . . . . . . . . . . . . . . . . . . 68
31 Storage tank design . . . . . . . . . . . . . . . . . . . . . . . . . . . . . . . . . . . 69
32 Normalized residual gasoline masses observed for the different storage tanks. . . . 70
33 Development of water contents for gasoline tanks stored under differing ambient
conditions . . . . . . . . . . . . . . . . . . . . . . . . . . . . . . . . . . . . . . . . 71
34 Ambient humidity and temperature conditions for the gasoline storage experiment . 72
35 Onset of phase separation hazing in water admixture and cool-down experiments . 73
36 Three-dimensional approximation plane of turbidity onset . . . . . . . . . . . . . . 74
37 ROTAX 912 ULS temperature drop in the intake manifold, full load . . . . . . . . . 76
38 ROTAX 912 ULS temperature drop in the intake manifold, zero load . . . . . . . . 77
39 Morane icing test setup for operation with ethanol admixed fuels. . . . . . . . . . . 78
40 Temperature drop in a Lycoming O 360 A1A engine . . . . . . . . . . . . . . . . . 79
41 Flight Test Card for a heavy load circuit heat-up experiment . . . . . . . . . . . . . 82
42 Development of fuel hose temperatures near to the engine for consecutive starts
and fast touch-downs . . . . . . . . . . . . . . . . . . . . . . . . . . . . . . . . . . 82
43 Fuel hose temperatures near to engine for low service ceiling starts and touch-downs 83
44 Dynamic pressure drops in the MORANE fuel system . . . . . . . . . . . . . . . . 84
45 Vibration frequencies and strengths in the MORANE fuel system . . . . . . . . . . 86
46 Viewport bubble images in test rig experiments . . . . . . . . . . . . . . . . . . . . 87
47 Bubble nascence of pure substances compared to calibration curves . . . . . . . . . 87
48 Bubble sensor readout field for AVGAS . . . . . . . . . . . . . . . . . . . . . . . . 88
49 Bubble sensor readout field for E-0 and E-5 . . . . . . . . . . . . . . . . . . . . . 89
50 Bubble sensor readout field for E-10 and E-15 . . . . . . . . . . . . . . . . . . . . 90
51 Pressure / Temperature limits for low bubble incidence limits . . . . . . . . . . . . 91
52 Pressure / Temperature limits for high bubble incidence limits . . . . . . . . . . . . 91
53 Hodges tester for gasoline volatility assessment. . . . . . . . . . . . . . . . . . . . 92
54 Temperature resistance of elastomers . . . . . . . . . . . . . . . . . . . . . . . . . 101
55 Oil resistance of elastomers . . . . . . . . . . . . . . . . . . . . . . . . . . . . . . 101
56 Gasoline and ethanol resistance of elastomers . . . . . . . . . . . . . . . . . . . . . 102
57 Classification of thermoplastics . . . . . . . . . . . . . . . . . . . . . . . . . . . . 103
58 Temperature resistance of thermoplastics . . . . . . . . . . . . . . . . . . . . . . . 113
59 Resistance of thermoplastics against gasoline and alcohol / ethanol . . . . . . . . . 114
60 Resistance of thermosettings against gasoline and alcohol / ethanol . . . . . . . . . 116
61 Results of compabitility tests of a fluorocarbon elastomer . . . . . . . . . . . . . . 118
7
62 Realisation of a test for environmental stress cracking . . . . . . . . . . . . . . . . 119
63 Materials questionnaire tree (partial) . . . . . . . . . . . . . . . . . . . . . . . . . . 121
64 Decrease of materials general questionnaire participation . . . . . . . . . . . . . . . 122
65 Production areas of questionnaire participants . . . . . . . . . . . . . . . . . . . . . 123
66 Distribution of materials for aviation parts . . . . . . . . . . . . . . . . . . . . . . 123
67 Estimate of ethanol admixture effect on aviation affairs . . . . . . . . . . . . . . . 124
68 Valuation of potential consequences of ethanol admixture on aviation parts . . . . . 124
69 Sensitivity determination schema for an ethanol detection kit working on colour
change reaction. . . . . . . . . . . . . . . . . . . . . . . . . . . . . . . . . . . . . . 126
70 Water/ethanol mix excess volume . . . . . . . . . . . . . . . . . . . . . . . . . . . 127
71 Maul’s Fuel-Alk Tester . . . . . . . . . . . . . . . . . . . . . . . . . . . . . . . . . 128
72 Karl-Fischer water titration . . . . . . . . . . . . . . . . . . . . . . . . . . . . . . . 130
73 Electrical water detection in E-0 . . . . . . . . . . . . . . . . . . . . . . . . . . . . 132
74 Zeolite water absorption experiment . . . . . . . . . . . . . . . . . . . . . . . . . . 134
75 Zeolite water absorption evaluation . . . . . . . . . . . . . . . . . . . . . . . . . . 135
76 Flight profile for comparative LCA studies . . . . . . . . . . . . . . . . . . . . . . 138
77 ROTAX exhaust temperatures with ethanol admixed fuels . . . . . . . . . . . . . . 139
78 ROTAX NOx emissions with ethanol admixed fuels . . . . . . . . . . . . . . . . . . 140
79 Pathways and by-effects for biogenic ethanol production . . . . . . . . . . . . . . . 140
80 Well to tank greenhouse gas emission analysis results . . . . . . . . . . . . . . . . 141
81 Well to propeller greenhouse gas emission analysis results . . . . . . . . . . . . . . 142
82 Graphical compilation of European General Aviation aircraft numbers . . . . . . . 155
83 Comparison of realized vs. potential MOGAS aircraft (Germany) . . . . . . . . . . 155
84 German and United Kingdom numbers for the aircraft categories of interest. No
distinction is made with respect to used fuel type. . . . . . . . . . . . . . . . . . . 157
85 Estimated European total numbers for the aircraft categories of interest . . . . . . . 157
86 German MOGAS operated aircraft engines . . . . . . . . . . . . . . . . . . . . . . 158
87 Graphical display of the distribution of small aircraft in Europe . . . . . . . . . . . 159
88 Ethanol contents of 23 random commercial vehicle gasoline samples . . . . . . . . 198
89 AcUAS’ flying laboratory MORANE MS 893 E-D . . . . . . . . . . . . . . . . . . 200
90 Schematic of the MORANE fuel system . . . . . . . . . . . . . . . . . . . . . . . . 201
91 ROTAX 912 ULS on test rig . . . . . . . . . . . . . . . . . . . . . . . . . . . . . . 203
92 ROTAX 912 ULS measurement points for temperature drop and exhaust gas com-
position determination . . . . . . . . . . . . . . . . . . . . . . . . . . . . . . . . . 204
8

93 Schematic of the vapour lock test rig with its fuel conditioning instrumentation . . 205
94 Actual vapour lock test rig with its fuel conditioning elements in place . . . . . . . 207
95 Example screen for the parameter setting of automatized test runs of the test rig . . 209
96 Bubble nascence of pure substances compared to calibration curves . . . . . . . . . 211
9

List of Tables
1 National targets for renewable sources utilization in 2020 . . . . . . . . . . . . . . 22
2 German quotas for biogenic fuel admixtures for the years 2007 — 2015 . . . . . . 22
3 Properties of DIN EN 228 “Super lead-free” and “Super Plus lead-free” gasolines . 28
4 Physical and chemical properties of usual gasolines and frequent additives (Data
compiled from various sources). . . . . . . . . . . . . . . . . . . . . . . . . . . . . 29
5 Volatility classes according to DIN EN 228 . . . . . . . . . . . . . . . . . . . . . . 31
6 Fugacity classes effective in the course of the year in Germany . . . . . . . . . . . 31
7 Typical densities of vehicle gasolines . . . . . . . . . . . . . . . . . . . . . . . . . 32
8 Octane numbers and densities of typical gasolines and other pure substances . . . . 34
9 Octane number of various pure substances or mixtures relevant to gasolines . . . . 35
10 Different polymer classes . . . . . . . . . . . . . . . . . . . . . . . . . . . . . . . . 95
11 Common Elastomers . . . . . . . . . . . . . . . . . . . . . . . . . . . . . . . . . . 96
12 Exemplary Trade Marks of Elastomers . . . . . . . . . . . . . . . . . . . . . . . . 97
13 Exemplary Trade Marks of Elastomers (continued) . . . . . . . . . . . . . . . . . . 98
14 Properties of elastomers . . . . . . . . . . . . . . . . . . . . . . . . . . . . . . . . 99
15 Properties of elastomers (continued) . . . . . . . . . . . . . . . . . . . . . . . . . . 100
16 Common thermoplastics . . . . . . . . . . . . . . . . . . . . . . . . . . . . . . . . 104
17 Exemplary trade marks of thermoplastics . . . . . . . . . . . . . . . . . . . . . . . 105
18 Exemplary trade marks of thermoplastics (continued) . . . . . . . . . . . . . . . . 106
19 Exemplary trade marks of thermoplastics (continued) . . . . . . . . . . . . . . . . 107
20 Exemplary trade marks of thermoplastics (continued) . . . . . . . . . . . . . . . . 108
21 Properties of thermoplastics . . . . . . . . . . . . . . . . . . . . . . . . . . . . . . 109
22 Properties of thermoplastics (continued) . . . . . . . . . . . . . . . . . . . . . . . . 110
23 Properties of thermoplastics (continued) . . . . . . . . . . . . . . . . . . . . . . . . 111
24 Properties of thermoplastics (continued) . . . . . . . . . . . . . . . . . . . . . . . . 112
25 Common thermosettings . . . . . . . . . . . . . . . . . . . . . . . . . . . . . . . . 115
26 Abundancy matrix for zeolite water absorption tests . . . . . . . . . . . . . . . . . 133
27 Tabular compilation of European aircraft numbers . . . . . . . . . . . . . . . . . . 156
28 Fuel certificate values for the SIOBIA experimentation base fuel . . . . . . . . . . 197
29 Physical and chemical composition of custom mixed Exx gasolines . . . . . . . . . 199
30 Locations and types of sensor instrumentation as applied to the MORANE . . . . . 202
31 Boiling pressures of test rig calibration substances . . . . . . . . . . . . . . . . . . 211
10

Acknowledgements
This report was compiled by a consortium of cooperation partners headed by Aachen Institute
of Applied Sciences, consisting of Aachen University of Applied Sciences, Bosch General
Aviation Technology GmbH, BRP-Rotax GmbH & Co KG, g.o.e.the, ISP GmbH, Ludwig Bölkow
Systemtechnik GmbH, PetroLab GmbH, SGS Institut Fresenius GmbH, and Total Deutschland
GmbH.
The work was supervised by an international project steering committee headed by Mr. Kleine-Beek
(EASA). Further committee participants were Clément Audard (EASA), Stefan Ebert (EASA), Erika
Herms (EASA), Werner Hoermann (EASA), Barry Plumb (Historic Aircraft Association, Light
Aircraft Association, United Kingdom), Henk Pruis (EASA), Walter Schiller (Luftfahrtbundesamt,
Germany), Rudi Schuegraf (Europe Air Sports and Deutscher Aero Club e.V.), and John Thorpe
(General Aviation Safety Council, United Kingdom).
In addition, an advisory circle of EASA supported the information collection for some of this
report’s topics.
Many cooperation partners contributed material necessary for the experimentation documented
in this report: Total Deutschland GmbH supplied the experimenters with a sufficient amount
of MOGAS (principally vehicle gasoline of Super Plus specification, but stringently certified for
aviation purposes, see also Appendix F) as well as statistical data free of charge and supported
the FMEA with fuel and lubrication experts. Crop Energies provided the required amount of pure
bioethanol necessary for custom admixing, also free of charge. Experts of Robert Bosch GmbH
cross-checked the study of SGS on fuel system material properties and suggestions. The German
Mineralöl-Wirtschaftsverband provided valuable up-to-date statistical data on the consumption of
gasoline sorts. W. Maul contributed an gasoline ethanol admixture test box free of charge.
The Chair for Technical Thermodynamics, RWTH Aachen, supported the work by providing
experimental facilities and support for the zeolite experiments on water absorption from gasoline.
11
1 Introduction and Outline of Work
Biofuels potentially interesting also for aviation purposes are predominantly liquid fuels produced
from biomass. The most common biofuels today are biodiesel and bioethanol. Since diesel engines
are rather rare in aviation this survey is focusing on ethanol admixed to gasoline products.
The Directive 2003/30/EC of the European Parliament and the Council of May 8th 2003 on the
promotion of the use of biofuels or other renewable fuels for transport encourage a growing
admixture of biogenic fuel components to fossil automotive gasoline. Some aircraft models
equipped with spark ignited piston engines are approved for operation with automotive gasoline,
frequently called “MOGAS” (motor gasoline). The majority of those approvals is limited to MOGAS
compositions that do not contain methanol or ethanol beyond negligible amounts. In the past years
(bio-)MTBE or (bio-)ETBE have been widely used as blending component of automotive gasoline
whilst the usage of low-molecular alcohols like methanol or ethanol has been avoided due to the
handling problems especially with regard to the strong affinity for water. With rising mandatory
bio-admixtures the conversion of the basic biogenic ethanol to ETBE, causing a reduction of
energetic payoff, becomes more and more unattractive. Therefore the direct ethanol admixture is
accordingly favoured.
Due to the national enforcements of the directive 2003/30/EC more oxygenates produced from
organic materials like bioethanol have started to appear in automotive gasolines already. The
current fuel specification EN 228 already allows up to 3 % volume per volume (v/v) (bio-)methanol
or up to 5 % v/v (bio-)ethanol as fuel components. This is also roughly the amount of biogenic
components to comply with the legal requirements to avoid monetary penalties for producers and
distributors of fuels.
Since automotive fuel is cheaper than the common aviation gasoline (AVGAS), creates less problems
with lead deposits in the engine, and in general produces less pollutants it is strongly favoured
by pilots. But being designed for a different set of usage scenarios the use of automotive fuel
with low molecular alcohols for aircraft operation may have adverse effects in aviation operation.
Increasing amounts of ethanol admixtures impose various changes in the gasoline’s chemical and
physical properties, some of them rather unexpected and not within the range of flight experiences
even of long-term pilots.
After a frame-setting failure mode and effects analysis (FMEA) that highlighted the predominant
threats of ethanol present in future MOGAS sorts the most problematic objectives have been
investigated in further detail, both by theoretical investigations and practical exemplary flight
and test rig experiments. Even if the general level of pollutant emissions is usually reduced
by utilization of biogenic components in the fuel it cannot be excluded straight away that also
undesired side-effects, both on a local and global scale, may be incurred, e.g. by super- or
sub-stoichiometric combustion typical in aviation operation. Accordingly, another aspect under
investigation is the life cycle analysis of the usage of ethanol admixed gasoline for aviation
purposes.
Lastly, prior reports identified water as one of the most problematic substances for fuel handling
and utilization in the area of aviation. There is no simple, practical measurement tool for the
assessment of solved water content in gasoline so far, however. Accordingly it is one of the aims
of this report to identify potential respective measurement procedures that deem promising for a
development of such instrumentation.
The EASA call for tenders, based on previous information gathering, already collected most of
these issues and formulated several basic objectives. The results of this report necessitated a
12

slightly different internal logical structure to adequately organize the acquired knowledge, though.
Therefore the referencing of the tender’s topics is included in the individual section headings:
T 1: Literature scan and statistical data gathering
T 2a: Phase separation
T 2b: Icing
T 2c: Long term storaging of gasoline
T 3: Vapour locking
T 4: Compatibility of materials
T 5: Life cycle analysis of ethanol admixed gasolines
T 6: Potential methods of water in gasoline detection
T 7: FMEA on functions and parts
The sections have been assembled in a different order that is more oriented towards easier reading
and logical interconnection of topics. The main part of the report is followed by a series of
annexes documenting the immediate work of cooperation partners, and additional tabulated results
referenced in the main part.
13

2 Summary and Recommendations
In its effort to introduce regenerating and hence sustainable energy resources into the existing
combustibles mix, recent European legislation enforces the admixture of biogenic fuels into
conventional fossil gasoline. For economic reasons this is, as of today, mainly ethanol. Compared
to the fossil gasoline ingredients ethanol has a different chemical structure, leading to a potentially
dangerous physico-chemical behaviour, especially in the presence of water. As there is a stronger
economically driven tendency to use vehicle gasolines as aviation fuel this may lead to potentially
dangerous scenarios especially in the operation of the smaller General Aviation aircraft.
The SIOBIA study addresses these scenarios by an in-depth study on the various potential threats
imposed by ethanol admixtures up to 15 % v/v.
First, a failure mode and effects analysis has been performed. For the current fleet of General
Aviation aircraft the associated individual threats (phase separation, vapour locking, icing, material
compatibility) were confirmed on the parts and functional levels by an expert group. The span of
risks covers the range of “just a nuisance” to “deadly dangerous if not adequately and pro-actively
handled”. For the major threats a clustering of recommendations for a further treatment of the
identified issues has been given.
A statistical analysis of European aircraft numbers and types, reconciling several base data sets on
European General Aviation, lead to an assessment of the number of potentially affected aircraft.
About 20,000 aircraft (≈ 10%) throughout Europe are either directly or potentially endangered by
the various negative effects of an ethanol admixture in the nearer future.
The consecuting theoretical and practical work highlighted the most prominent threats in parallel
tasks, namely water-induced phase separation, carburettor icing, vapour locking by gasoline brand
mixing, construction material compatibility, and proactive water detection in the fuel system. These
threat investigations were flanked by a life cycle analysis on the environmental impacts of ethanol
addition to aircraft fuels.
Especially for the vast majority of existing carburettor engines there are various general threats
stemming from ethanol-admixed gasolines, potentially leading to disrupted engine operation. Some
of them are readily encountered by sensitive operation and increased maintenance efforts, while
others may occur rather unexpectedly during a flight mission, even to the point that the engine(s)
will stall and not start again, so an unmotored emergency landing has to be performed.
Main issues are
• the material compatibility of hitherto only gasoline-exposed fuel system parts, especially
elastomers and sealants,
• the danger of phase separation in water containing gasoline if the fuel is stored for prolonged
periods in vented aircraft tanks, and if it is inevitably cooled down during a flight,
• the increased likelihood of a vapour lock due to increased vapour pressure of gasolines
mixtures of different ethanol abundancies if the first fuel pressure raising pump is not in a
cold section of the fuel system, and the
• carburettor icing due to raised enthalpy of evaporation for ethanol-admixed gasolines if there
is no additional heat input into the intake air,
The experiences from vehicle technology may, to a rather great extent, be transferred to the
operating conditions of ultralights. Here rather modern engine technology prevails, and the usually
14

low service ceiling keeps temperature change effects below an acceptable bound. Other types
of General Aviation aircraft are more prone to run into difficulties due to their markedly higher
service ceiling and the resulting major differences in temperature and ambient pressure, as well as
their longer conceptual histories, leading predominantly to material compatibility problems. For
those major threats intensive studies and results, as well as respective guidelines, are given in this
report. Further recommended activities are listed below.
Material incompabilities should be explicitly addressed in airworthiness qualification and certifi-
cation processes, even for replacement parts. A comprehensive study of all materials used in the
past 50 years for certified aircraft construction is not feasible. Only general guidelines for future
material selection or replacement can be given in this report.
A crucial point in phase separation avoidance is a strict proactive control on the occurrence of
solved water in the gasoline. Unluckily there is no practical and affordable test procedure at hand
as of today even though some measurement principles indicate the potential of creating a respective
tool.
Life cycle analysis showed that substantial green-house gas (GHG) savings are possible if ethanol
is admixed to conventional gasoline in the amounts discussed in this report. This effect is mostly
related to the old, but reliable technology and the non-existence of exhaust gas catalyzers in
aviation: While the savings through replacing fossil fuel by biogenically produced ethanol are at
least detectable the major effect stems from the combustion process itself, as it is cleaner and
produces less GHG emissions in the presence of ethanol.
Most of the endangering issues would presumably vanish if butanol would be deployed as biogenic
supplement of the fossil fuels as its longer hydrocarbon tail provides much more affinity to the
non-polar gasoline majority ingredients. Butanol would exhibit other advantages as well: Compared
to ethanol its energy content is larger, and it would presumably have less effect on the vapour
pressure if gasolines of different admixture levels are mixed. Presently there is no commercially
viable biogenic supply path, even though some promising exploratory efforts exist [16]. Should
this alternative of biogenic admixing be pursued in future its effects should be studied in detail in
a follow-up project as there is no practical experience on butanol-admixed gasolines deployment in
aviation as of today.
The SIOBIA study sheds light on the present status of the most problematic issues with respect to
ethanol admixtures in aviation gasoline, but partially only up to the point that further investigations
and research should be undertaken to get in-depth and directly practical information. The following
topics are suggested for further activities:
• Investigations on the bubble creation behaviour (threat of vapour locking) of a largernumber of commercially sold gasolines and their potential mixtures. Different composi-
tions of gasolines are likely to affect the vapour bubble creation, especially so if encountering
unforeseen amounts of ethanol due to a mixing of residues in the aircraft’s tank. As a
result a matrix of potential mixing scenarios should be collected and progressively filled
over time as new brands with differing ethanol content appear on the market. The tests
should be performed especially with raised temperatures in an dynamic manner, simulating
those of common aircraft fuel systems. If possible, a maximum operation temperature and/or
maximum service ceiling should be identified and published on a work-in-progress basis on
a freely accessible web site.
• Determination of the temperature-depending maximum solved water abundancies for alarger number of commercially sold gasolines, potentially in combination with random
15
sampling results on water content. The outcome of these investigation could yield a
definition of a conservative envelope of tolerable water in gasoline contents. This value
is becoming more and more of interest as the bearing capability increases with increasing
amount of ethanol there is no normative numerical upper limit of water content in gasolines
as of today.
• Quantitative determination of water absorbed out of the tank venting air. Temperature
inversion in the tank of a descending aircraft may lead to a significant absorption of
humidity due to the rather large air volume throughput rates of venting. Here experiments
for temperature and humidity niveau determination, in combination with a theoretical study
taking into account knowledge of the atmospheric states and compositions, should be
performed to determine quantitative water balances.
• Research and/or development of a practical sensor for water solved in gasoline. The water
content of present gasolines is reportedly well above zero and a potential object of future
economical optimization with respect to gasoline price fixations as there is no normative
quantified upper limit in the gasoline composition definitions. Reported field tests with
hydrous E-15 [21], saving the expenses of providing super-azeotropic ethanol provision
for gasoline admixing, already point in this direction. As this will foreseeably not create
a problem for ground based locomotion, contrary to aviative purposes with its strong
temperature decrease in the gasoline tanks, the pilot should be equipped with a practical
method of solved water determination.
16

3 Operating Existing Engines with Ethanol-Admixed Fuels
3.1 Definition of an “Old” Engine
Compared to the vehicle fleet the various types of operated aircraft are typically much older. While
in Western Europe the average age of passenger cars is about 7 – 8 years [3] small aircraft are
usually much older: Wastinage [33] reports an average age of 31 years for the USA, and the
European fleet is not much younger.
Even many younger aircraft do not profit from recent development of vehicle engine technology,
as even for rather recently sold gasoline operated models old designs are still maintained [33].
The market volume is quite small so expensive investments into research and development of
modernized designs are economically usually not perceived as appropriate.
Accordingly, the design of currently running engines and fuel systems lags substantially behind
those of vehicles. The vast majority is not equipped with modern control systems like a FADEC,
let alone any observation or concern of fuel quality like adaptive knock sensors.
Nevertheless some engines are able to run at least on vehicle gasoline (“motor gasoline”, or
MOGAS) after some more or less heavy modifications on the fuel system and potentially the
engine. Apart from rather recent engine designs that are by definition capable of operating on DIN
EN 228 compliant gasoline with up to 5 % ethanol, most supplementary type certificates (STC) that
grant MOGAS operation limit the ethanol content to 1 %. Experiences from the last years show
that this setting did not cause any perceivable additional numbers of accidents or casualties.
Nevertheless it is to be feared that an unreflecting extension of the allowed limit to the 5 % value
— or even beyond that, keeping the recent policies for road transport in view — may create
problems hitherto not encountered. There are several issues founded in the system concept and
parts design of older engines in combination with their fuel systems that can be expected to cause
potentially severe dangers. The consecutive sections of this report will scrutinize these in detail.
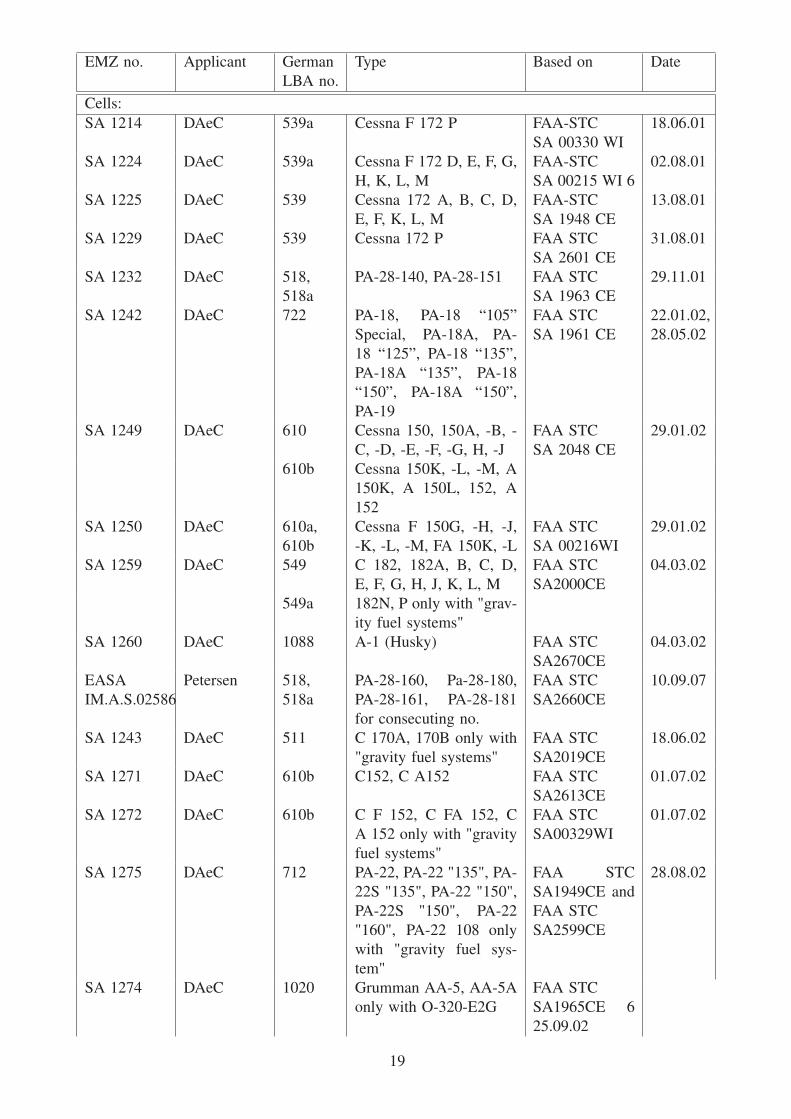
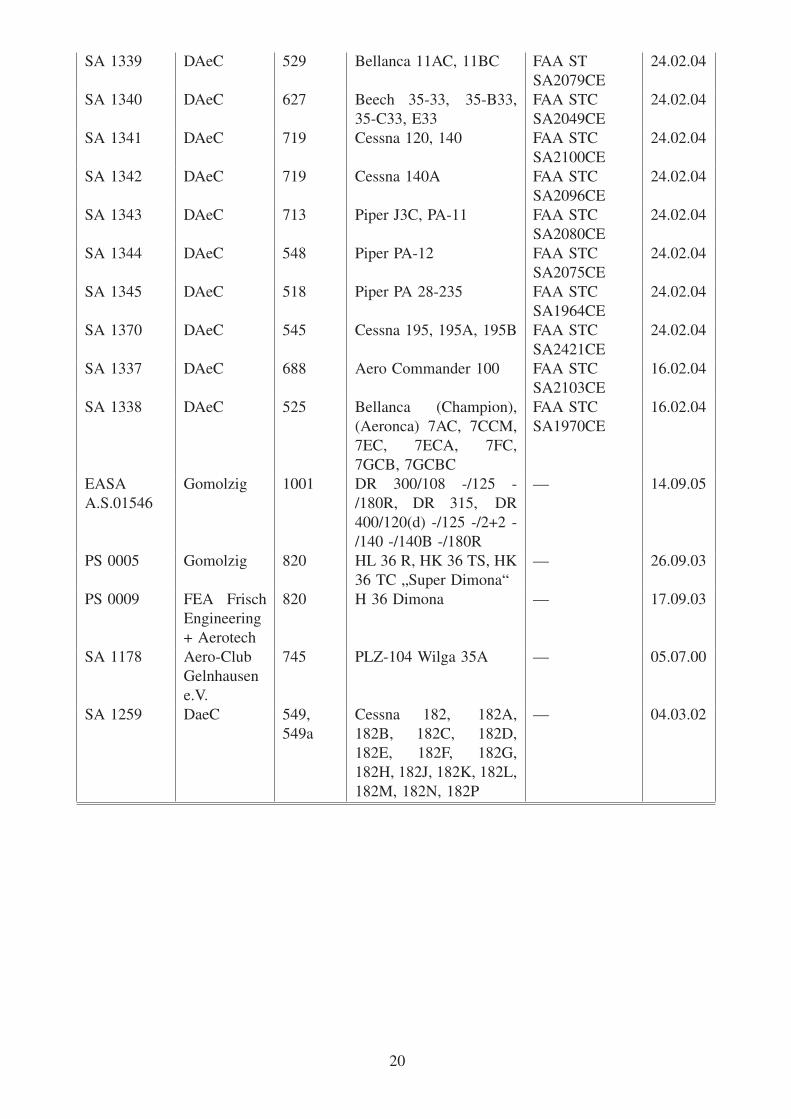
3.2 Survey of Aircraft Frames and Engines Authorized for MOGAS Operation
The usage of MOGAS (gasoline fuel for vehicles, complying with the aviation guidelines for
MOGAS, though) requires a certification for both aircraft cell and engine. As of today EASA
provided supplementary type certificates for the consecuting types of engines and cells. The
European STCs are in many cases derived from respectively given FAA STCs. By far the mosts
STCs are issued by DAeC (see e.g. their web page http://www.daec.de/te/erteillte_emz.php), but
some other institutions contributed others, too. A full list of FAA-STCs is reported in Appendix A.
17
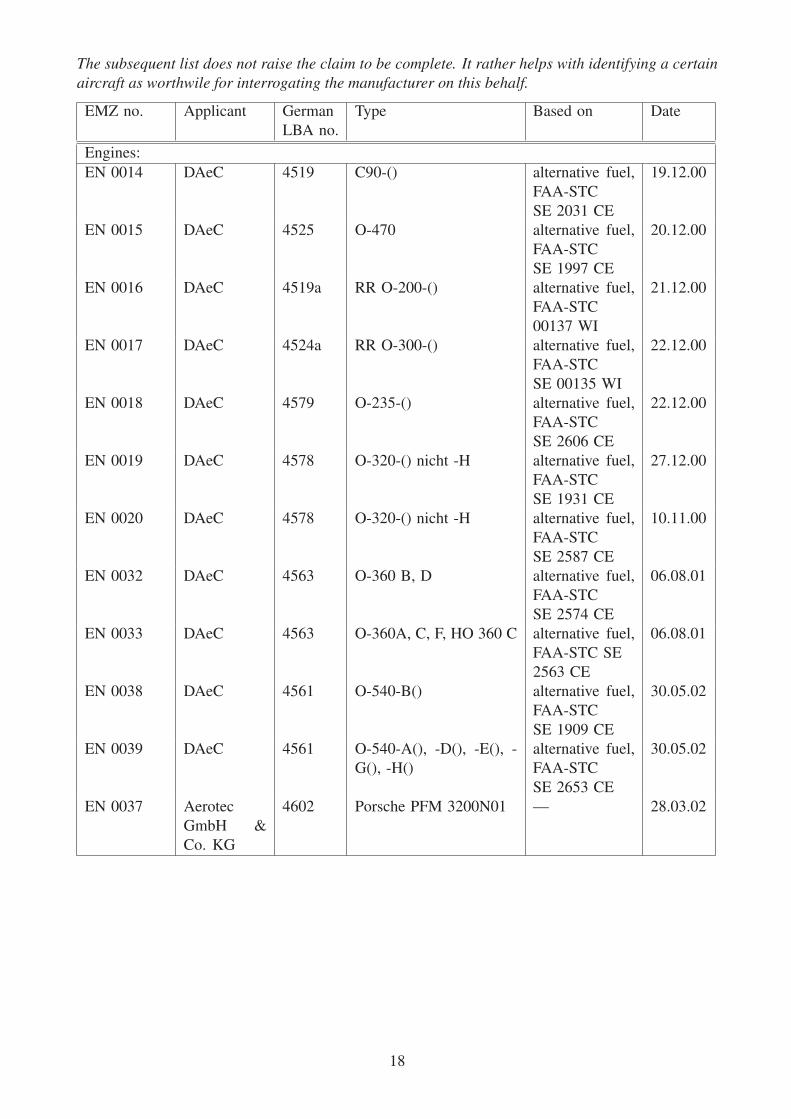
The subsequent list does not raise the claim to be complete. It rather helps with identifying a certainaircraft as worthwile for interrogating the manufacturer on this behalf.
EMZ no. Applicant German
LBA no.
Type Based on Date
Engines:
EN 0014 DAeC 4519 C90-() alternative fuel,
FAA-STC
SE 2031 CE
19.12.00
EN 0015 DAeC 4525 O-470 alternative fuel,
FAA-STC
SE 1997 CE
20.12.00
EN 0016 DAeC 4519a RR O-200-() alternative fuel,
FAA-STC
00137 WI
21.12.00
EN 0017 DAeC 4524a RR O-300-() alternative fuel,
FAA-STC
SE 00135 WI
22.12.00
EN 0018 DAeC 4579 O-235-() alternative fuel,
FAA-STC
SE 2606 CE
22.12.00
EN 0019 DAeC 4578 O-320-() nicht -H alternative fuel,
FAA-STC
SE 1931 CE
27.12.00
EN 0020 DAeC 4578 O-320-() nicht -H alternative fuel,
FAA-STC
SE 2587 CE
10.11.00
EN 0032 DAeC 4563 O-360 B, D alternative fuel,
FAA-STC
SE 2574 CE
06.08.01
EN 0033 DAeC 4563 O-360A, C, F, HO 360 C alternative fuel,
FAA-STC SE
2563 CE
06.08.01
EN 0038 DAeC 4561 O-540-B() alternative fuel,
FAA-STC
SE 1909 CE
30.05.02
EN 0039 DAeC 4561 O-540-A(), -D(), -E(), -
G(), -H()
alternative fuel,
FAA-STC
SE 2653 CE
30.05.02
EN 0037 Aerotec
GmbH &
Co. KG
4602 Porsche PFM 3200N01 — 28.03.02
18
EMZ no. Applicant German
LBA no.
Type Based on Date
Cells:
SA 1214 DAeC 539a Cessna F 172 P FAA-STC
SA 00330 WI
18.06.01
SA 1224 DAeC 539a Cessna F 172 D, E, F, G,
H, K, L, M
FAA-STC
SA 00215 WI 6
02.08.01
SA 1225 DAeC 539 Cessna 172 A, B, C, D,
E, F, K, L, M
FAA-STC
SA 1948 CE
13.08.01
SA 1229 DAeC 539 Cessna 172 P FAA STC
SA 2601 CE
31.08.01
SA 1232 DAeC 518,
518a
PA-28-140, PA-28-151 FAA STC
SA 1963 CE
29.11.01
SA 1242 DAeC 722 PA-18, PA-18 “105”
Special, PA-18A, PA-
18 “125”, PA-18 “135”,
PA-18A “135”, PA-18
“150”, PA-18A “150”,
PA-19
FAA STC
SA 1961 CE
22.01.02,
28.05.02
SA 1249 DAeC 610 Cessna 150, 150A, -B, -
C, -D, -E, -F, -G, H, -J
FAA STC
SA 2048 CE
29.01.02
610b Cessna 150K, -L, -M, A
150K, A 150L, 152, A
152
SA 1250 DAeC 610a,
610b
Cessna F 150G, -H, -J,
-K, -L, -M, FA 150K, -L
FAA STC
SA 00216WI
29.01.02
SA 1259 DAeC 549 C 182, 182A, B, C, D,
E, F, G, H, J, K, L, M
FAA STC
SA2000CE
04.03.02
549a 182N, P only with "grav-
ity fuel systems"
SA 1260 DAeC 1088 A-1 (Husky) FAA STC
SA2670CE
04.03.02
EASA
IM.A.S.02586
Petersen 518,
518a
PA-28-160, Pa-28-180,
PA-28-161, PA-28-181
for consecuting no.
FAA STC
SA2660CE
10.09.07
SA 1243 DAeC 511 C 170A, 170B only with
"gravity fuel systems"
FAA STC
SA2019CE
18.06.02
SA 1271 DAeC 610b C152, C A152 FAA STC
SA2613CE
01.07.02
SA 1272 DAeC 610b C F 152, C FA 152, C
A 152 only with "gravity
fuel systems"
FAA STC
SA00329WI
01.07.02
SA 1275 DAeC 712 PA-22, PA-22 "135", PA-
22S "135", PA-22 "150",
PA-22S "150", PA-22
"160", PA-22 108 only
with "gravity fuel sys-
tem"
FAA STC
SA1949CE and
FAA STC
SA2599CE
28.08.02
SA 1274 DAeC 1020 Grumman AA-5, AA-5A
only with O-320-E2G
FAA STC
SA1965CE 6
25.09.02
19
SA 1339 DAeC 529 Bellanca 11AC, 11BC FAA ST
SA2079CE
24.02.04
SA 1340 DAeC 627 Beech 35-33, 35-B33,
35-C33, E33
FAA STC
SA2049CE
24.02.04
SA 1341 DAeC 719 Cessna 120, 140 FAA STC
SA2100CE
24.02.04
SA 1342 DAeC 719 Cessna 140A FAA STC
SA2096CE
24.02.04
SA 1343 DAeC 713 Piper J3C, PA-11 FAA STC
SA2080CE
24.02.04
SA 1344 DAeC 548 Piper PA-12 FAA STC
SA2075CE
24.02.04
SA 1345 DAeC 518 Piper PA 28-235 FAA STC
SA1964CE
24.02.04
SA 1370 DAeC 545 Cessna 195, 195A, 195B FAA STC
SA2421CE
24.02.04
SA 1337 DAeC 688 Aero Commander 100 FAA STC
SA2103CE
16.02.04
SA 1338 DAeC 525 Bellanca (Champion),
(Aeronca) 7AC, 7CCM,
7EC, 7ECA, 7FC,
7GCB, 7GCBC
FAA STC
SA1970CE
16.02.04
EASA
A.S.01546
Gomolzig 1001 DR 300/108 -/125 -
/180R, DR 315, DR
400/120(d) -/125 -/2+2 -
/140 -/140B -/180R
— 14.09.05
PS 0005 Gomolzig 820 HL 36 R, HK 36 TS, HK
36 TC „Super Dimona“
— 26.09.03
PS 0009 FEA Frisch
Engineering
+ Aerotech
820 H 36 Dimona — 17.09.03
SA 1178 Aero-Club
Gelnhausen
e.V.
745 PLZ-104 Wilga 35A — 05.07.00
SA 1259 DaeC 549,
549a
Cessna 182, 182A,
182B, 182C, 182D,
182E, 182F, 182G,
182H, 182J, 182K, 182L,
182M, 182N, 182P
— 04.03.02
20
3.3 Legislative and Practical Boundary Conditions for Biogenic ComponentsAdmixing
The European Union officially adopted a 20-20-20 Renewable Energy Directive on Dec. 17th 2008
to redefine its climate change reduction goals for the next decade. The catchphrase “20-20-20” is
an abbreviation for a triple goal definition:
• 20 % reduction in greenhouse gas (GHG) emissions by 2020 compared with 1990 levels,
• 20 % cut in energy consumption through improved energy efficiency by 2020,
• and a 20 % increase in the use of renewable energy by 2020.
In 2005 renewable energies from hydro power, solar, wind, biomass, or geothermal sources
accounted for less than seven percent of the EU’s total energy consumption. To achieve the
20 percent target, the new directive defines mandatory national targets for its member states
by promotion of the use of renewable energy for electricity generation, transport, and heating
/ air conditioning. Targets for GHG emission reductions include all locomotion fuels — fossil
fuels as well as biofuels, blends, electricity and hydrogen. The directive requires fuel suppliers
to reduce GHG emission caused by any action taken in the whole processing chain, including
land use changes, transportation and distribution, processing and combustion of locomotion fuels.
Reductions in GHG emissions could be achieved by using more biofuels, alternative fuels, or by
reducing gas wasting at oil wells or refineries.
The Directive 2009/28/EC of the European Parliament and of the Council [26], repealing the former
valid Directives 2001/77/EC and 2003/30/EC, concretized these goals by also defining a mandatory
share of 10 % energy input for the locomotion oriented fuel consumption as a subdivision of the
general energy consumption.
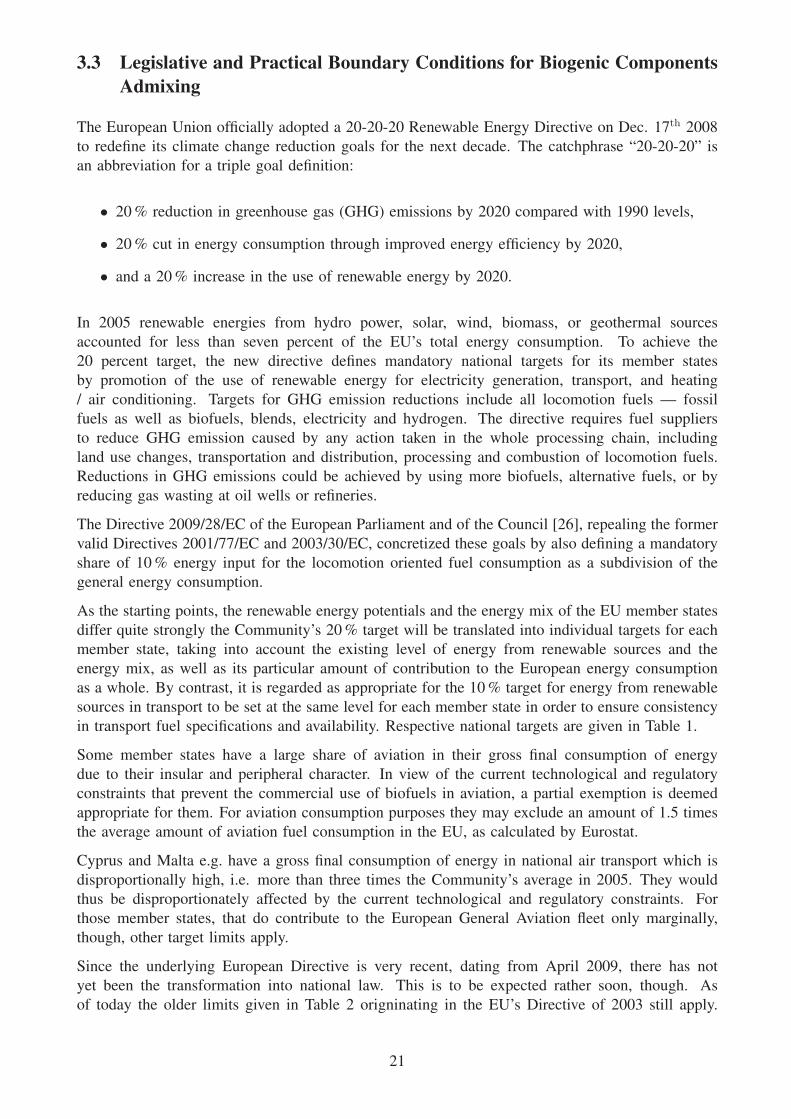
As the starting points, the renewable energy potentials and the energy mix of the EU member states
differ quite strongly the Community’s 20 % target will be translated into individual targets for each
member state, taking into account the existing level of energy from renewable sources and the
energy mix, as well as its particular amount of contribution to the European energy consumption
as a whole. By contrast, it is regarded as appropriate for the 10 % target for energy from renewable
sources in transport to be set at the same level for each member state in order to ensure consistency
in transport fuel specifications and availability. Respective national targets are given in Table 1.
Some member states have a large share of aviation in their gross final consumption of energy
due to their insular and peripheral character. In view of the current technological and regulatory
constraints that prevent the commercial use of biofuels in aviation, a partial exemption is deemed
appropriate for them. For aviation consumption purposes they may exclude an amount of 1.5 times
the average amount of aviation fuel consumption in the EU, as calculated by Eurostat.
Cyprus and Malta e.g. have a gross final consumption of energy in national air transport which is
disproportionally high, i.e. more than three times the Community’s average in 2005. They would
thus be disproportionately affected by the current technological and regulatory constraints. For
those member states, that do contribute to the European General Aviation fleet only marginally,
though, other target limits apply.
Since the underlying European Directive is very recent, dating from April 2009, there has not
yet been the transformation into national law. This is to be expected rather soon, though. As
of today the older limits given in Table 2 origninating in the EU’s Directive of 2003 still apply.
21
Share of energy from renewable Target for share of energy from
sources in gross final consumption renewable sources in gross final
of energy, 2005 consumption ofenergy, 2020
Belgium 2.2 % 13 %
Bulgaria 9.4 % 16 %
Czech Republic 6.1 % 13 %
Denmark 17.0 % 30 %
Germany 5.8 % 18 %
Estonia 18.0 % 25 %
Ireland 3.1 % 16 %
Greece 6.9 % 18 %
Spain 8.7 % 20 %
France 10.3 % 23 %
Italy 5.2 % 17 %
Cyprus 2.9 % 13 %
Latvia 32.6 % 40 %
Lithuania 15.0 % 23 %
Luxembourg 0.9 % 11 %
Hungary 4.3 % 13 %
Malta 0.0 % 10 %
Netherlands 2.4 % 14 %
Austria 23.3 % 34 %
Poland 7.2 % 15 %
Portugal 20.5 % 31 %
Romania 17.8 % 24 %
Slovenia 16.0 % 25 %
Slovak Republic 6.7 % 14 %
Finland 28.5 % 38 %
Sweden 39.8 % 49 %
United Kingdom 1.3 % 15 %
Table 1: National overall targets for the share of energy from renewable sources in gross final con-sumption of energy in 2020 [26].
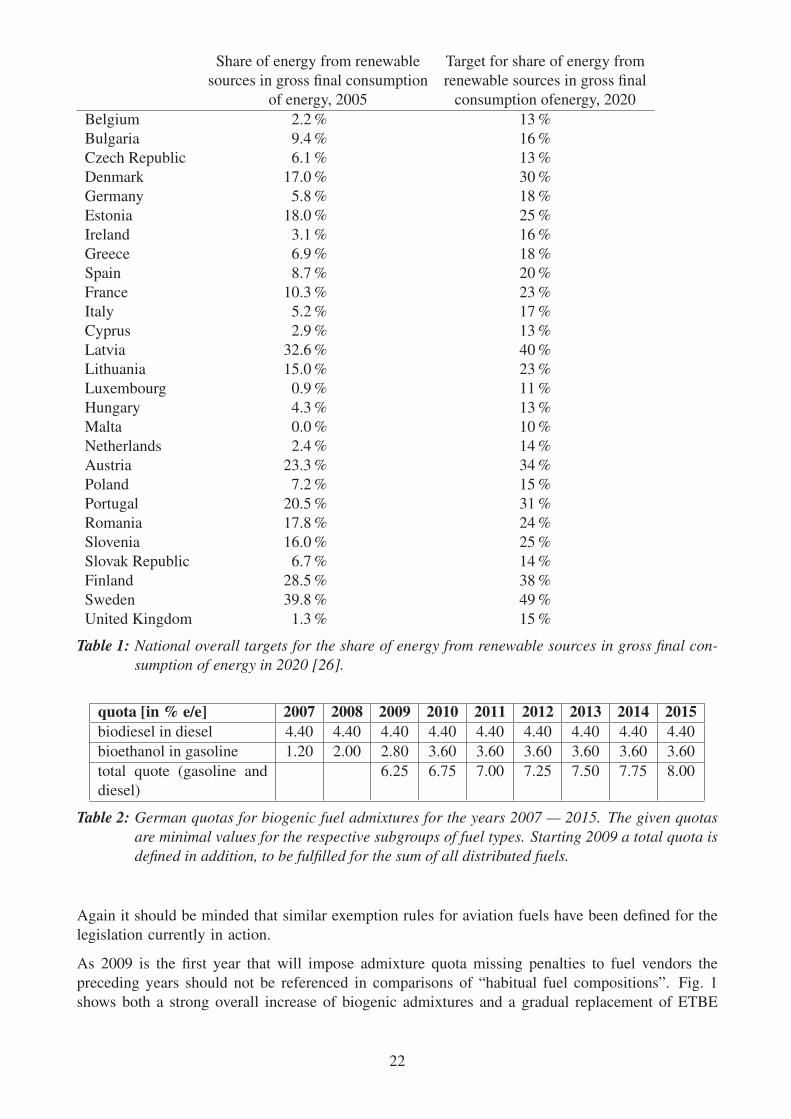
quota [in % e/e] 2007 2008 2009 2010 2011 2012 2013 2014 2015biodiesel in diesel 4.40 4.40 4.40 4.40 4.40 4.40 4.40 4.40 4.40
bioethanol in gasoline 1.20 2.00 2.80 3.60 3.60 3.60 3.60 3.60 3.60
total quote (gasoline and
diesel)
6.25 6.75 7.00 7.25 7.50 7.75 8.00
Table 2: German quotas for biogenic fuel admixtures for the years 2007 — 2015. The given quotasare minimal values for the respective subgroups of fuel types. Starting 2009 a total quota isdefined in addition, to be fulfilled for the sum of all distributed fuels.
Again it should be minded that similar exemption rules for aviation fuels have been defined for the
legislation currently in action.
As 2009 is the first year that will impose admixture quota missing penalties to fuel vendors the
preceding years should not be referenced in comparisons of “habitual fuel compositions”. Fig. 1
shows both a strong overall increase of biogenic admixtures and a gradual replacement of ETBE
22

by crude ethanol admixing in the years 2007 to 2009. The looming penalties for underfulfillment
of legally requested biogenic shares, to be imposed to the manufacturers and vendors of fuels first
time 2009, make the overall biogenic gasoline admixtures grow to about 4.6 %.
��������
��������
��������
�������
�������
�������
�������
������
��������
��������
��������
�
�
�
�
�
������
��
����������������
��������� ���!�"��������#$%&"
Figure 1: Development of biogenic fuel shares from 2007 to 2009 in Germany. For ETBE only thepart of its complete amount is shown that originates in biogenic sources. Source: Miner-alölwirtschaftsverband Deutschland
Since the biogenic share seems not to be accomplishable by ETBE alone, as only 47 % of its
amount may be calculated as of biogenic origin, ethanol admixture is mandatory to fulfill the
quota. But after necessarily introducing the latter as a fuel component it seems even more practical
to even replace ETBE by ethanol.
As of the time this report was written (Dec. 2009) the majority of Super Plus quality fuels seems
to usually incorporate only minor amounts of ethanol (see Fig. 2 for statistical probes taken in June
2009, and Fig. 88, p. 198, for such taken in Jan. 2009).
3.3.1 Usage Statistics of Various Fuel Types
The relative share of gasoline/petrol type and/or aviation-oriented fuels sold in Europe is depicted
in Fig. 3. The comparison shows impressively how small the share of AVGAS is compared to
its larger rivals Jet Fuel and vehicle gasoline. MOGAS, being thought of as the share of vehicle
gasoline deployed for aviation usage, is included in the large vehicle gasoline share in this graphic.
Since the amount of MOGAS flown in General Aviation is even much smaller than that of AVGAS it
is immediately clear that there is no market pressure at all to maintain a distinct supply of aviation
dedicated, less ethanol admixed gasoline brands, at least in the long run.
23

� � � � � � � �������������������������
���
�
���
�
���
�
���
�
���
�
��'��(�'
���'
�(�'
���'�
����'����������)�����(�� �(!��'�'����"#(�$�����%��(����*
+�,-,��'����!��������(�
'�.�/�!��01�!�$�'
��.(���!��
Figure 2: Ethanol content in random German Super Plus gasoline probes taken in June 2009. Source:Total Deutschland GmbH
Figure 3: Shares of different fuel types (Diesel fuel excluded) for 2008 in Germany. The share titled“Automotive Petrol Fuel” also contains the amount of gasoline taken for aviation purposes,which is smaller than the AVGAS share (see Sect. B). Source: MineralölwirtschaftsverbandDeutschland
24
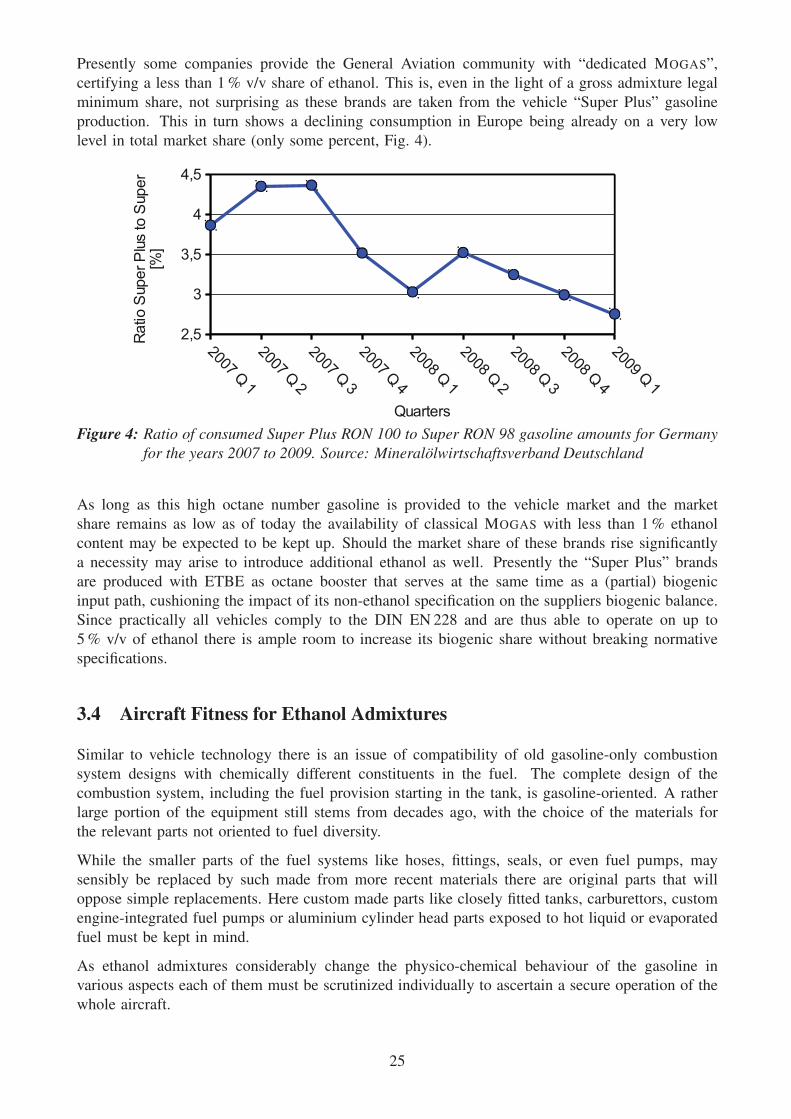
Presently some companies provide the General Aviation community with “dedicated MOGAS”,
certifying a less than 1 % v/v share of ethanol. This is, even in the light of a gross admixture legal
minimum share, not surprising as these brands are taken from the vehicle “Super Plus” gasoline
production. This in turn shows a declining consumption in Europe being already on a very low
level in total market share (only some percent, Fig. 4).
��������
��������
��������
�������
�������
�������
�������
������
��������
���
�
���
��
�������
����� ������������ ����
���
Figure 4: Ratio of consumed Super Plus RON 100 to Super RON 98 gasoline amounts for Germanyfor the years 2007 to 2009. Source: Mineralölwirtschaftsverband Deutschland
As long as this high octane number gasoline is provided to the vehicle market and the market
share remains as low as of today the availability of classical MOGAS with less than 1 % ethanol
content may be expected to be kept up. Should the market share of these brands rise significantly
a necessity may arise to introduce additional ethanol as well. Presently the “Super Plus” brands
are produced with ETBE as octane booster that serves at the same time as a (partial) biogenic
input path, cushioning the impact of its non-ethanol specification on the suppliers biogenic balance.
Since practically all vehicles comply to the DIN EN 228 and are thus able to operate on up to
5 % v/v of ethanol there is ample room to increase its biogenic share without breaking normative
specifications.
3.4 Aircraft Fitness for Ethanol Admixtures
Similar to vehicle technology there is an issue of compatibility of old gasoline-only combustion
system designs with chemically different constituents in the fuel. The complete design of the
combustion system, including the fuel provision starting in the tank, is gasoline-oriented. A rather
large portion of the equipment still stems from decades ago, with the choice of the materials for
the relevant parts not oriented to fuel diversity.
While the smaller parts of the fuel systems like hoses, fittings, seals, or even fuel pumps, may
sensibly be replaced by such made from more recent materials there are original parts that will
oppose simple replacements. Here custom made parts like closely fitted tanks, carburettors, custom
engine-integrated fuel pumps or aluminium cylinder head parts exposed to hot liquid or evaporated
fuel must be kept in mind.
As ethanol admixtures considerably change the physico-chemical behaviour of the gasoline in
various aspects each of them must be scrutinized individually to ascertain a secure operation of the
whole aircraft.
25
Modern flex-fuel engines and fuel systems of recent vehicles are able to operate on a wide range
of combustibles since they incorporate a quite complex adaptive fuel conditioning. Would aircraft
engines be supplied with a similar conditioning system they should, in case of a phase separation
(see section 5.1) taking place in the fuel, at least be able to operate on the low-octane gasoline
portion. Without an adaptive conditioning this is at least very questionable.
Even though modern engines, like those presently built into the majority of ultra-light aircraft, are
certified for vehicle gasoline usage and therefore principally compatible with respective ethanol
admixtures they are not equipped with flex-fuel instrumentation. As long as the gasoline does not
exhibit a phase separation those engines will behave as they should, with all other vehicle gasoline
technical shortcomings relative to AVGAS properties being taken care of. Should a phase separation
occur even these most recent engines are not to be expected to cope with that.
Since ethanol admixed fuels feature a larger enthalpy of evaporation the temperature drop of the
ingested air together with the evaporating gasoline in the carburettor is some degrees centigrade
larger, leading faster to ice deposits. Accordingly a stronger pre-heat of the air is required. If an
aircraft is already known to be prone to carburettor icing the utilization of ethanol admixed fuels
will presumably add to the threat.
Mixing unintentionally ethanol containing gasolines may lead to elevated vapour pressures. This
reduces the margin of acceptable heat-up of fuel system parts relative to the conventional non-
admixed MOGAS before an engine stifling vapour lock may take place. Again, if an aircraft is
known to be susceptible to vapour locking with former MOGAS qualities already a vapour pressure
exceeding this typical level could be detrimental.
4 Determination of the Status Quo in General Aviation
4.1 Gasoline Types
Carburettor fuels (gasoline, petrol, MOGAS) are multi-component mineral oil based products
with a boiling range between 30 ◦C and 210 ◦C. They consist of various hydrocarbons that are
predominantly distilled from fossil oil. A base gasoline is mixed from crack benzines, olefins,
pyrolysis gasolines, iso-parafins, butane alcylates and replacement components like alcohols and
ethers. Various admixtures improve certain properties relevant for the distribution, the intermediate
storage and the subsequent combustion process.
One of the most relevant properties of an internal combustion engine fuel is the knocking behaviour,
characterized by its octane number (see section 4.1.3). Without additives the octane number is
rather poor for pure gasolines. Historically it was boosted by introducing organic lead compounds
for a long time until their toxicity and the availability of less or non toxic alternatives became
available. Being forbidden in vehicle gasolines, lead compounds are still prevalent in aviation
gasolines and a matter of increasing concern.
4.1.1 Historic Development of Gasolines and their Alcohol Admixtures
1861 Invention of the Lenoir engine, being the first stationary operated engine following an
Otto-like combustion management. The typical fuel was coal gas.
1862 Nikolaus Otto develops a spiritus carburettor for his engine, so it could be used for vehicles.
An excerpt from the patent text: “The engine is of utmost ease and simplicity! It may be put to
26
operation or standstill at liberty. A quart of spiritus suffices to keep it running for three hours atan output of one horsepower. The material is easily acquired and does not require mentionablespace.”
1900 Broad availability of vehicle oriented light gasoline with ethanol admixture. The latter
presumably led to its german name “Sprit”, derived from the everyday language “spiritus”
for concentrated ethanol.
1908 Henry Ford develops his “Modell T” and the assembly belt. He prognosticated great returns
for the american agronomy as cars were constructed for bio-ethanol usage: “The fuel ofthe future is going to come from fruit like that sumach out by the road, or from apples, weeds,sawdust — almost anything.” (Henry Ford).
1924 Engine knock is explored and leads to the development of high octane numbered fuels
consisting of a mixture of aromats and aliphats (“Aral”). In the USA, TEL admixing is
started.
1925 In Germany the “Reichskraftsprit” is founded to improve the fuel supply situation by ethanol
admixtures distilled from potato schnaps.
195x Ethanol admixing is stopped in Germany and most European and northern American countries
since the cheap fossil oil rendered the production and conditioning of ethanol as uneconomic.
1970 Additives are entered into gasoline to prevent carburettor icing. For healthcare reasons a
reduction of the lead content is requested and a maximum value is defined.
1980 Introduction of the catalyzer to reduce pollutant emissions into the atmosphere. In conjunction
with the catalyzer lead-free gasoline is provided and legaly requested. Volatility is enhanced
by adding certain additives.
198x Due to a broad availability of cane based production methods ethanol becomes the default
fuel for Otto engines in brasil. More than 90 % of the local vehicle production is built to run
on ethanol. In the mid-eighties a complete turnover happens, though, as the food product
market promises more returns. Nevertheless the fuel contains 25 % v/v ethanol in Brasil by
default [19].
1985 Wide-spread market introduction of lead-free high octane gasoline (Superbenzin, RON 95) in
Europe, facilitating higher compression ratios and hence higher engine powers and efficiency
levels.
1990 Gasoline quality “Super Plus” (RON 98) is introduced, yielding again a rise in specific
power, efficiency and enabling smaller engines.
2000 Regulations of the European Council and the European Parliament define boundary conditions
for pollutant emissions into air. In subsequent national regulations these are transferred into
national legislation, defining among others the pollutant emission of vehicles.
2006 The German “Biokraftstoffquotengesetz” rules the minimal admixture of biogenic compo-
nents and their continuous increase into standard fuels. In conjunction penalties are defined
for lower amounts.
27

Properties Units min max Test MethodResarch octane number
RON
95(1)
98(2)
- prEN ISO5164
Motor octane number
MON
85(1)
88(2)
- prEN ISO5163
Lead content mg/l - 5 prEN 237
Density at 15 ◦C kg/m3 720 775 EN ISO 3675, EN ISO 12185
Sulphur content mg/kg 10 EN ISO 20846, EN ISO 20884
Oxidation stability Min 360 - EN ISO 7536
Involatile residues (mass) mg/100ml - 5 EN ISO 6246
Corrosion effect on copper corr.
grade
cl. 1 cl. 1 EN ISO 2160
Appearing clear and free of haze visual
Content of olefines % (v/v) - 18 ASTMD1319, prEN 14517
Content of aromates % (v/v) - 35 ASTMD1319, prEN 14517
Content of benzol % (v/v) - 1 EN 12177,EN 238, prEN 14517
Oxygen content % (m/m) - 2,7 EN 1601, EN 13132
Methanol content % (v/v) - 3 EN 1601, EN 13132
Ethanol content % (v/v) - 5 EN 1601, EN 13132
Isopropyle alcohol content % (v/v) - 10 EN 1601, EN 13132
Isobutyle alcohol content % (v/v) - 10 EN 1601, EN 13132
Tert-butyle alcohol con-
tent
% (v/v) - 7 EN 1601, EN 13132
Ether content (< 5 C
atoms)
% (v/v) - 15 EN 1601, EN 13132
Content of other oxy-
genates
% (v/v) - 10 EN 1601, EN 13132
Table 3: Properties of DIN EN 228 “Super lead-free” (1) and “Super Plus lead-free” (2) gasolines.
4.1.2 Prevailing Legal Boundary Conditions and Norms for Vehicle Gasolines
The European norm EN 228 fixates numerous minimal and maximal values for gasolines. For the
ubiquitous quality “Super lead-free” the conditions summarized in Table 3 are defined.
Due to its inherently high octane number benzol is a technically sensible means to boost the knock
resistance of gasolines. Benzol is, with respect to human health, as a carcinogene a very dangerous
substance, though. Accordingly the EU EN 228 limits its abundance in gasolines to a maximum of
5 % v/v. In recent years its usage strongly dropped, and market levels of 2 % were hardly reached.
As of today the benzol content is limited to max. 1 % v/v.
For some years, another octane number defined gasoline quality, the “Super Plus”, is widely offered
besides the ordinary “Super” quality. Its octane values are ≥ 98 octane (RON) and ≥ 88 octane
(RON), respectively.
Sulphur Content
In crude oil sulphur is found bound as di-sulfide and mercaptane sulphur, in quantities in the range
of 0.01 . . . 7 % m/m. If the sulphur remains in the distilled products its oxidation compounds
28

Para-meter
Unit Me-thanol
Etha-nol
TBA MTBE ETBE SuperRON95
Av-Gas100LL
Av-Gas80
RON - 112 106 - 116 118 95 81
MON - 91 89 - 98 102 85 100 80
RVP Psi 4.6 2.5 3.4 7.8 4.4
PVP kPa 0.32 0.17 0.23 0.54 0.3 0.45...
0.90
0.38...
0.49
0.38...
0,49
Boiling
pt.
◦C 64.7 78.3 82 55 70 (210) (170) (170)
Freezing
pt.
◦C -98 -117 27 -108 - -58 -58
Density kg/m3 0.79 0.789 - 0.745 0.751 0.75 0.718
Calorific
value
kJ/kg 22676 29710 35560 36010 36810 435001 47000 43500
Enthalpy kJ/kg 1100 910 544 322 - 335
Flash pt. ◦C 11 13 11 -26 -
Lead
content
g/l - - - - - 0.005 0.56 0.13
Table 4: Physical and chemical properties of usual gasolines and frequent additives (Data compiledfrom various sources).
are formed in the combustion process, leading to undesired by-effects: Besides SO2 emissions,
malodorous H2S is formed in unregulated catalyzers and the catalyzer efficiency decreases. In the
EN 228 the maximum sulphur concentration was limited to 150 mg/kg. Since 2005 it was further
reduced voluntarily to less than 10 mg/kg.
The process of desulphurization extracts further surface active substances from the fuel needed for
lubrication in the fuel pumps. Accordingly increased wear may be encountered.
Additives
Additives and further organic compounds are admixed to fuels to ameliorate certain properties.
Their exact mixture varies from brand to brand and is mostly unknown as this cocktail is subject to
corporate secrecy. Gasoline producers watch out for interchangeability of different brands, though,
and accordingly guarantee arbitrary mixability. Phosphorous compounds depositing as films on
the carburettor inner surfaces help to repell water attaching. They are not allowed in unleaded
gasolines, though. The acid content in ethanol admixed fuels must not exceed 0.007 %.
Table 4 shows a comparison of physical and chemical properties of typical Otto gasolines and
auxiliary additives. (For explanation of abbreviations see glossary, Appendix F, p. 277)
For the different classes of ethanol admixture a general nomenclature is frequently used: A
denomination of the kind of Exx points to the volumetric ethanol content. Usual admixture classes
are E-5 (i.e. 5 % v/v ethanol in gasoline) and E-85. For quite a period the wide-spread introduction
of E-10 has been discussed but was dropped in spring 2008, for the time being, due to apprehended
1There is no fixed/mandatory calorific value for vehicle gasoline. The given value, to be interpreted as a typical one,
will presumably decrease in the forthcoming years due to the increasing admixture of ethanol with its smaller calorific
value both per volume and per mass.
29

Figure 5: Qualitative evaporation curves for various gasoline types and two jet fuels. Adapted from[35]
incompatibilities of the fuel systems of older cars. Frequently intermediate values like E-20, E-50
or even E-100 (pure ethanol) are found in literature which are to be interpreted accordingly.
Boiling behaviour
Coarsly the boiling behaviour can be described by a single, global value for a given fuel: the vapour
pressure that builds up in a closed vessel over a respective liquid. For any given substance it is a
function of temperature. For gasoline its value is mainly dependent on the light-off components.
The vapour pressure of gasoline products is usually determined and specified as RVP (Reid Vapour
Pressure) according to the Norm EN 12. In 2000 this norm has been replaced by the so called
Dry Vapour Pressure Equivalent (DVPE) as defined by the norm pr EN 13016-1, mostly to take
into account methanol–hydrocarbon azeotropes. Both values differ from the so-called “true vapour
pressure” (physical vapour pressure), but its measurement procedure is schematized world-wide
and therefore comparable.
A more detailed judgement of the boiling properties resp. the volatility of a fuel is possible
on the base of the boiling curve. For the determination of the boiling curve according to
DIN EN ISO 3405 a fuel sample is heated with a fixed heating rate of 1 ◦C/min and hereby
evaporated. The temperature at which a certain part of the liquid volume has been boiled away is
plotted, see Fig. 5 for a qualitative comparison of different fuel types.
In general it may be noticed that too low a vapour pressure leads to cold start problems while to
high a vapour pressure results in poor hot start and hot operation qualities, and in problems in
transport and storaging. The low-boiling fractions are important for an easy cold start but may
30
lead to the creation of vapour bubbles and hence vapour locking in hot conditions, as well as to
carburettor icing in high humidity conditions.
A too large a fraction of high-boiling substances in the fuel may induce a fuel condensation at
the cylinder walls in cold running conditions and thereby an oil dilution. A too low share of
medium-boiling components is known to cause a lumpy running of the engine and acceleration
cogging.
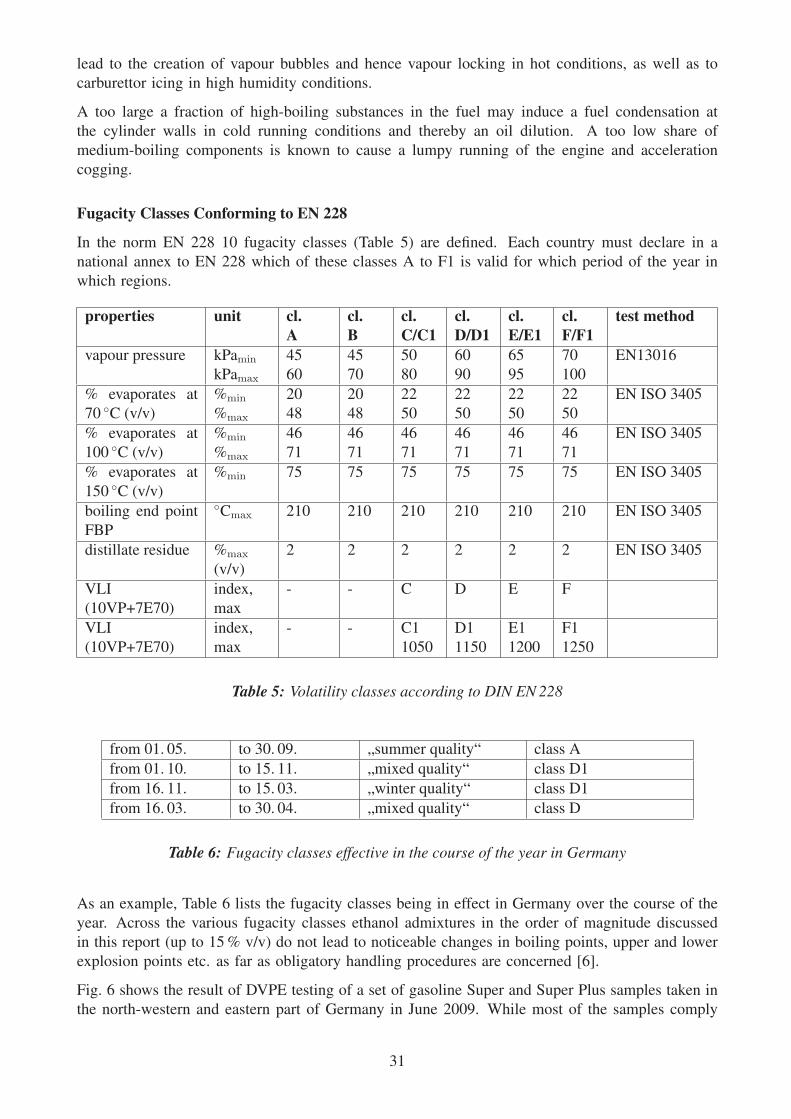
Fugacity Classes Conforming to EN 228
In the norm EN 228 10 fugacity classes (Table 5) are defined. Each country must declare in a
national annex to EN 228 which of these classes A to F1 is valid for which period of the year in
which regions.
properties unit cl.A
cl.B
cl.C/C1
cl.D/D1
cl.E/E1
cl.F/F1
test method
vapour pressure kPamin
kPamax
45
60
45
70
50
80
60
90
65
95
70
100
EN13016
% evaporates at
70 ◦C (v/v)
%min
%max
20
48
20
48
22
50
22
50
22
50
22
50
EN ISO 3405
% evaporates at
100 ◦C (v/v)
%min
%max
46
71
46
71
46
71
46
71
46
71
46
71
EN ISO 3405
% evaporates at
150 ◦C (v/v)
%min 75 75 75 75 75 75 EN ISO 3405
boiling end point
FBP
◦Cmax 210 210 210 210 210 210 EN ISO 3405
distillate residue %max
(v/v)
2 2 2 2 2 2 EN ISO 3405
VLI
(10VP+7E70)
index,
max
- - C D E F
VLI
(10VP+7E70)
index,
max
- - C1
1050
D1
1150
E1
1200
F1
1250
Table 5: Volatility classes according to DIN EN 228
from 01. 05. to 30. 09. „summer quality“ class A
from 01. 10. to 15. 11. „mixed quality“ class D1
from 16. 11. to 15. 03. „winter quality“ class D1
from 16. 03. to 30. 04. „mixed quality“ class D
Table 6: Fugacity classes effective in the course of the year in Germany
As an example, Table 6 lists the fugacity classes being in effect in Germany over the course of the
year. Across the various fugacity classes ethanol admixtures in the order of magnitude discussed
in this report (up to 15 % v/v) do not lead to noticeable changes in boiling points, upper and lower
explosion points etc. as far as obligatory handling procedures are concerned [6].
Fig. 6 shows the result of DVPE testing of a set of gasoline Super and Super Plus samples taken in
the north-western and eastern part of Germany in June 2009. While most of the samples comply
31

Figure 6: DVPE values of random test samples taken at different gasoline stations in north-western(NW) and eastern (E) Germany during June 2009. The shaded area represents the rangeconforming to DIN EN 228 summer quality (curtesy Total Deutschland GmbH)
with the vapour pressure limits there are some samples definitely exceeding them. For pilots this
may result in hot running vapour lock conditions (cf. Sect. 6.5.1).
density [kg / m3] Super Plus Super Normalaverage summer gasoline 753 751 745
average winter gasoline 745 743 735
Table 7: Typical densities of vehicle gasolines
As a general information typical densities of vehicle gasolines are given. They usually lie in the
range between 720 and 775 kg/m3. The differences originate from varying ratios of heavier to
lighter hydrocarbons (Table 7).
Since for vehicles the fuel is priced on a volumetric basis and the consumption is calculated on
the basis of liters per distance generally the fuel with higher density offers advantages with respect
to consumption. Fuel distributors have to ensure that no water detachment by phase separation
takes place for any climatic condition typical for the respective country. If there is a risk of water
detachment anti-corrosion additives have to be put to use.
4.1.3 Assessment of Knocking Properties for Gasolines by Octane Numbers
The knock resistance is an important parameter of gasolines. It limits the possibility to compress
and heat up the fuel air mixture inside the combustion chamber of an engine without a self-ignition
and detonation of the mixture taking place. If the limit is transgressed detonation waves are prone
32

to damage cylinder head gaskets, valves and spark plugs rendering a dysfunct engine in the midst
of operation.
On the other side the highest possible compression ratio is desired as this determines major quality
parameters of the engine like a high power to weight ratio, a high efficiency and a low fuel
consumption.
Modern gasoline operated vehicle engines are equipped with knock sensor systems to automatically
adapt the operating conditions (mainly the ignition timing, the manifold pressure and the throttle
flap setting) to a rather wide range of fuel qualities in the range of ROZ 91 to 98. This facilitates
the gentle engine operation even with low-quality fuels, even though with reduced power output,
while at the same time exploiting the most efficient and economical combustion for high-quality
gasoline brands. Due to some engine specific conditions (compression ratio, piston geometry, valve
position) a lower quality limit must be obeyed.
The predominant parameter determining the combustive fuel quality is the octane number. It
describes the (lack of) tendency to spontaneous inflamation and hence limitation of the fuel air
mixture compression. Depending on the operational state of an engine different octane numbers
have been defined and are taken for assessment purposes.
For vehicle operation the following octane number definitions are frequently found:
Research Octane Number (RON) characterizes the knock resistance at low engine load and
rotational speed. Too low a RON leads to a tinkling knock of the engine.
Motor Octane Number (MON) describes the knock resistance at high (thermic) load conditions
and high rotational speeds. Too low a MON leads to heavy load knocking which is quite
destructive for the engine and frequently is not perceived due to elevated other engine noises.
The MON nowadays is the most important octane number.
The octane number scale is defined by combustion of well-defined reference fuels: A value of 0
is defined for the knock-prone pure heptane, while a value of 100 is set for the knock-resistant
iso-octane. Mixture ratios of these substances define intermediate values. Practial octane numbers
for arbitrary fuels are determined in a well-defined CFR test engine in comparison to respective
heptane/octane ratios by means of a compression ratio variation. Octane numbers surpassing the
value of 100 are assessed according to the guidelines of the ASTM specifications (e.g. D910 for
AVGAS).
For aviation gasolines octane number ratings deviate from the vehicle definitions in order to better
approximate the specific operating conditions. The following should be mentioned:
• AVGAS octane number according to ASTM D909, “supercharge method”
• Lean run assessment according to ASTM D2700, IP 236 “engine method”
As this report addresses the potential use of vehicle gasolines for aviation purposes, an aviation
related assessment of the vehicle gasolines would be most desirable. No sources of such
assessments could be found, though.
Table 8 summarizes octane numbers and densities of typical gasoline brands and related pure
substances, determined by the vehicle-centered methods.
33
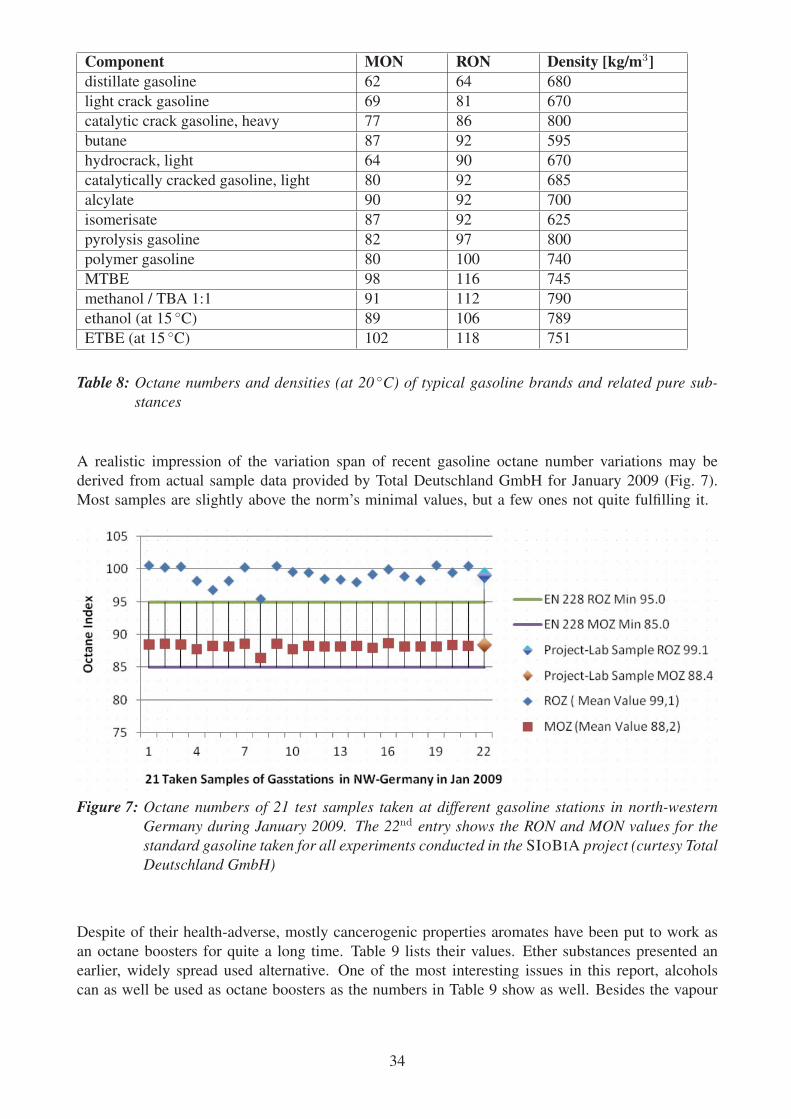
Component MON RON Density [kg/m3]distillate gasoline 62 64 680
light crack gasoline 69 81 670
catalytic crack gasoline, heavy 77 86 800
butane 87 92 595
hydrocrack, light 64 90 670
catalytically cracked gasoline, light 80 92 685
alcylate 90 92 700
isomerisate 87 92 625
pyrolysis gasoline 82 97 800
polymer gasoline 80 100 740
MTBE 98 116 745
methanol / TBA 1:1 91 112 790
ethanol (at 15 ◦C) 89 106 789
ETBE (at 15 ◦C) 102 118 751
Table 8: Octane numbers and densities (at 20 ◦C) of typical gasoline brands and related pure sub-stances
A realistic impression of the variation span of recent gasoline octane number variations may be
derived from actual sample data provided by Total Deutschland GmbH for January 2009 (Fig. 7).
Most samples are slightly above the norm’s minimal values, but a few ones not quite fulfilling it.
Figure 7: Octane numbers of 21 test samples taken at different gasoline stations in north-westernGermany during January 2009. The 22nd entry shows the RON and MON values for thestandard gasoline taken for all experiments conducted in the SIOBIA project (curtesy TotalDeutschland GmbH)
Despite of their health-adverse, mostly cancerogenic properties aromates have been put to work as
an octane boosters for quite a long time. Table 9 lists their values. Ether substances presented an
earlier, widely spread used alternative. One of the most interesting issues in this report, alcohols
can as well be used as octane boosters as the numbers in Table 9 show as well. Besides the vapour
34

Substance (aromate in gasoline) MixtureMON
MixtureRON
Evaporation rangeor boiling point[◦C]
toluol 112 124 110
ethylene benzol 107 124 136
xylol 103. . . 127 120. . . 146 138. . . 144
C9 aromates 105. . . 138 118. . . 171 152. . . 176
C10 Aromates 117. . . 144 114. . . 155 169. . . 210
Ethers:methyle-tertiary-butyle-ether (MTBE) 98 116 55
ethyle-tertiary-butyle-ether (ETBE) 102 118 70
di-iso-propyle-ether (DIPE) 100 110 68
tertiary-amyle-methyle-ether (TAME) 98 111 85
Alcohols:methanol 91 112 64.7
ethanol 89 106 78.3
iso-propanol 101 118 82.3
iso-butyle alcohol 90 110 107.7
Table 9: Octane number of various pure substances or mixtures relevant to gasolines
pressure rise this fact has a major importance for the potential dangers of using alcohol-admixed
gasolines in aviation as is detailed in Sect. 5.1.
4.2 Synoptical Statistical Data on General Aviation (T 1)
A statistical evaluation of available cell, engine and flight data was performed to assess the potential
danger of incorrect ethanol admixed MOGAS usage. As discussed with EASA available statistical
base data are rather distributed for the different countries and, due to slightly differing boundary
settings of individual aircraft classes, not well adapted to comparison purposes. Cell and engine
resolved lists of operated aircraft and/or flying hours could only be obtained for Germany and the
United Kingdom. Accordingly, an extrapolation for the whole European Union can be given only
on some assumptions of an approximate equi-popularity of the different aircraft types throughout.
The full resulting workflow of statistical evaluation and the sources used for the derivation of
the comprehensive results is detailed out in Appendix B. Here, only some synoptical results are
presented in short.
Main source of quantitative data were United Kingdom and German Aerospace Authorities. Their
evaluation lead to the categorization results shown in Fig. 8. Even though the shares of the various
classes differ strongly there are comparable amounts of potentially affected aircraft.
Combined with additional information this leads to an estimate of the total count of potentially
affected aircraft for the whole of Europe, as shown in Fig. 9. The derived complete European
statistics on small aircraft distribution is shown in a map in Fig. 10. Local habits differing from
those in the United Kingdom and Germany, e.g. caused by deviating pricing policies for the
different types of gasoline, can not be taken into account, though. Since the UK and Germany
together already form about 60 % of the total European small aircraft count the effect to be
expected by respective deviations should be rather minor.
35

Figure 8: German and United Kingdom numbers for the aircraft categories of interest. No distinctionis made with respect to used fuel type.
Figure 9: Estimated European total numbers for the aircraft categories of interest
Additionally, the German statistics on operating hours [11] allow a rough estimate on the popularity
of MOGAS operation. While only 48 % of all General Aviation aircraft fall into the category of
being principally MOGAS capable, 57 % of flight hours are delivered by the respective types if the
comparison is performed on the basis of German data for flown hours since last check.
36

Figure 10: Graphical display of the distribution of small aircraft (less than 2.25 t) in Europe. Thethree largest cakes (UK, D, F) are reduced to 70 % of their correct size whereas very smallcontributions (Malta, Estonia, ...) are disproportionally large to be able to display themat all. For comparative numerical data see Table 27, page 156.
37
5 Scientific and Technical Boundary Conditions for Ethanol-Admixed Gasoline Usage in Aviation (T 1)
5.1 Water-Induced Phase Separation in Gasoline-Ethanol Mixtures
Many liquid substances are miscible only within certain relative concentration ranges. If other
concentrations prevail the liquid as a whole unmixes and thereby creates at least two physically
and chemically discernible phases. Due to their typically different densities gravity separates them
vertically. The concentration ranges that exhibit this behaviour are called a miscibility gap. It is
dependent, apart from the chemical structure of the involved substances, also from temperature and
potential further (minority) admixtures that may interfere with the basic molecular interactions of
the main substances involved.
For mixtures of two well-known pure substances (binary mixtures) their miscibility gaps are usually
well known or relatively simple to investigate. As soon as three substances (or even more) are
involved things usually change: The amount of required measurement data to characterize such
ternary (quaternary, quinternary ...) mixtures dramatically increases with rising number of the
substances involved.
For typical gasolines things are even worse: As they consist of quite different molecularly structured
substances (aliphates, aromates, and various not so rare additives that do not fit into this simple
categorization, even solid, non-evaporative residues) they would have to be described as kind of
multi-nary mixtures for which no stringent description is usually at hand.
As long as the mixed substances stem from chemically similar structure classes (like homeopolar
substances, e.g. aliphates and aromates) only few surprises may be expected. A different thing
is a mixture of stronger bipolar and homeopolar substances, like water and “gasoline”. In this
case very large miscibility gaps prevail usually. In combination with water and gasoline, ethanol
presents a special case: Ethanol is, as a single substance miscible with both water and gasoline in
arbitrary concentrations. In the presence of a bit water ethanol acts like a detergent: On a molecular
view water molecules get surrounded by ethanol ones and their polar behaviour is catched by the
polar heads of the ethanol, at the same time pointing the homeopolar tails towards the gasoline
environment.
If (base) gasoline is regarded as a homogeneous molecular substance a ternary diagram can be
taken to describe the miscibility behaviour of the three substances “gasoline”, ethanol and water
(Fig. 11). Since in the presence of just three components in a mixture there are only two degrees of
freedom a planar drawing is suitable to describe all possible concentration possibilities. Usually the
typical ternary diagram is chosen, displaying an equilateral triangle with respective concentration
axes at every side. In Fig. 11 the vertical axis, and in accordance with that the horizontal level
lines inside the diagram, describe the percentage of ethanol present in the mixture. The gasoline
axis is pointing downwards to the right, in accordance with the respective level lines perpendicular
to it.
The left side of the triangle describes the possible mixtures of water (lower left corner point) and
ethanol (top corner). The right side of the triangle shows the more interesting mixtures of gasoline
(lower right corner) and ethanol, also possible on the whole range of the scale. The greyed area
below the red border line is the miscibility gap, i.e. the range of concentrations that will eventually
produce at least two distinct liquid phases.
Deliberate mixing processes can be displayed in the diagram as well: If we e.g. take an initially
“dry” mixture of 90 % gasoline and 10 % ethanol (E-10, Point A in Fig. 11) and add water we
38
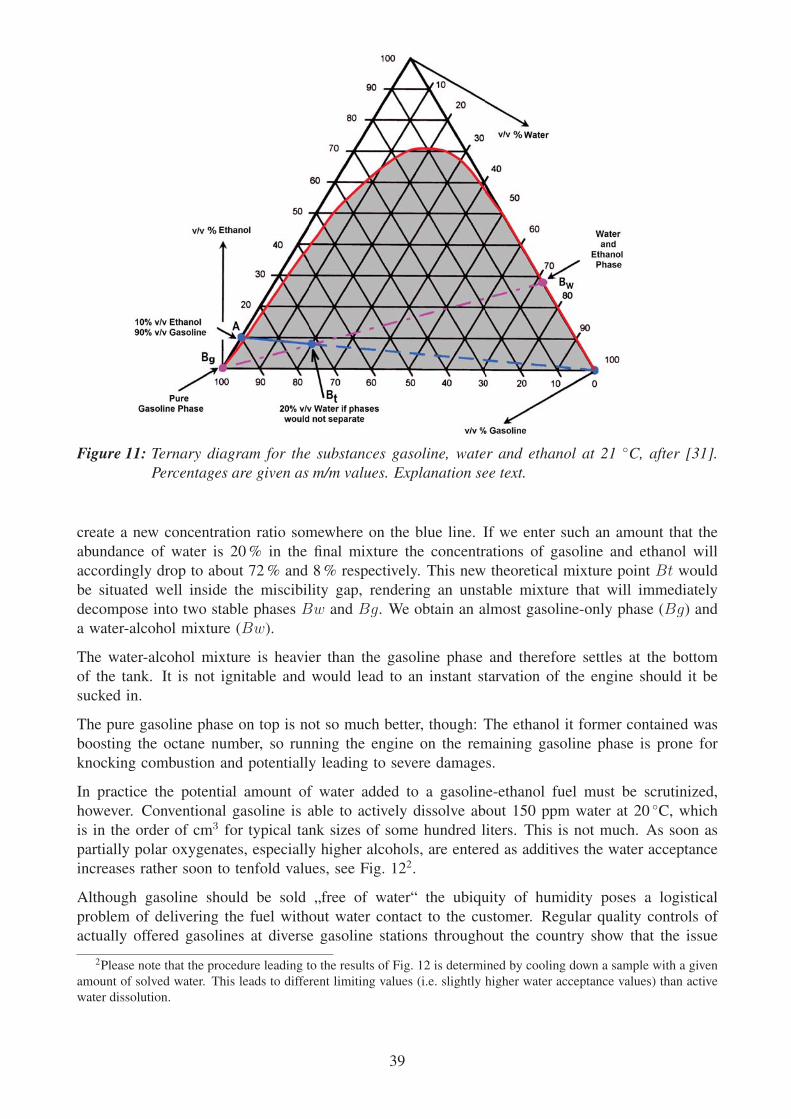
Figure 11: Ternary diagram for the substances gasoline, water and ethanol at 21 ◦C, after [31].Percentages are given as m/m values. Explanation see text.
create a new concentration ratio somewhere on the blue line. If we enter such an amount that the
abundance of water is 20 % in the final mixture the concentrations of gasoline and ethanol will
accordingly drop to about 72 % and 8 % respectively. This new theoretical mixture point Bt would
be situated well inside the miscibility gap, rendering an unstable mixture that will immediately
decompose into two stable phases Bw and Bg. We obtain an almost gasoline-only phase (Bg) and
a water-alcohol mixture (Bw).
The water-alcohol mixture is heavier than the gasoline phase and therefore settles at the bottom
of the tank. It is not ignitable and would lead to an instant starvation of the engine should it be
sucked in.
The pure gasoline phase on top is not so much better, though: The ethanol it former contained was
boosting the octane number, so running the engine on the remaining gasoline phase is prone for
knocking combustion and potentially leading to severe damages.
In practice the potential amount of water added to a gasoline-ethanol fuel must be scrutinized,
however. Conventional gasoline is able to actively dissolve about 150 ppm water at 20 ◦C, which
is in the order of cm3 for typical tank sizes of some hundred liters. This is not much. As soon as
partially polar oxygenates, especially higher alcohols, are entered as additives the water acceptance
increases rather soon to tenfold values, see Fig. 122.
Although gasoline should be sold „free of water“ the ubiquity of humidity poses a logistical
problem of delivering the fuel without water contact to the customer. Regular quality controls of
actually offered gasolines at diverse gasoline stations throughout the country show that the issue
2Please note that the procedure leading to the results of Fig. 12 is determined by cooling down a sample with a given
amount of solved water. This leads to different limiting values (i.e. slightly higher water acceptance values) than active
water dissolution.
39
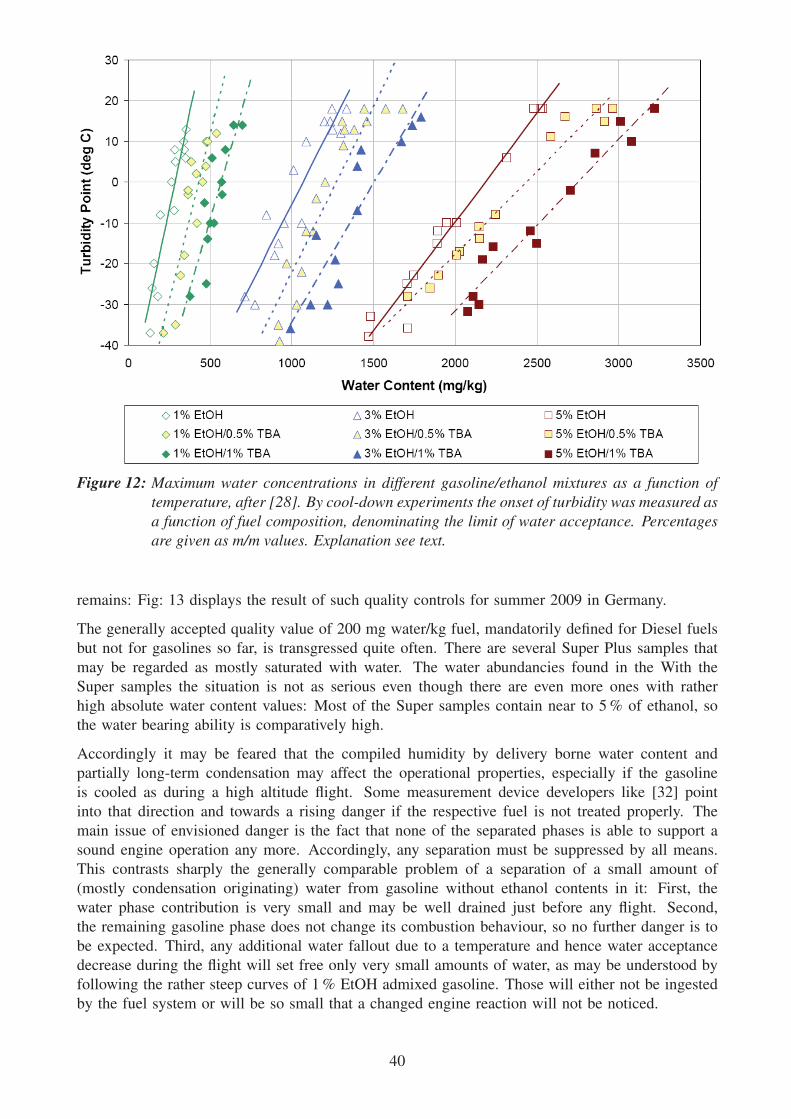
Figure 12: Maximum water concentrations in different gasoline/ethanol mixtures as a function oftemperature, after [28]. By cool-down experiments the onset of turbidity was measured asa function of fuel composition, denominating the limit of water acceptance. Percentagesare given as m/m values. Explanation see text.
remains: Fig: 13 displays the result of such quality controls for summer 2009 in Germany.
The generally accepted quality value of 200 mg water/kg fuel, mandatorily defined for Diesel fuels
but not for gasolines so far, is transgressed quite often. There are several Super Plus samples that
may be regarded as mostly saturated with water. The water abundancies found in the With the
Super samples the situation is not as serious even though there are even more ones with rather
high absolute water content values: Most of the Super samples contain near to 5 % of ethanol, so
the water bearing ability is comparatively high.
Accordingly it may be feared that the compiled humidity by delivery borne water content and
partially long-term condensation may affect the operational properties, especially if the gasoline
is cooled as during a high altitude flight. Some measurement device developers like [32] point
into that direction and towards a rising danger if the respective fuel is not treated properly. The
main issue of envisioned danger is the fact that none of the separated phases is able to support a
sound engine operation any more. Accordingly, any separation must be suppressed by all means.
This contrasts sharply the generally comparable problem of a separation of a small amount of
(mostly condensation originating) water from gasoline without ethanol contents in it: First, the
water phase contribution is very small and may be well drained just before any flight. Second,
the remaining gasoline phase does not change its combustion behaviour, so no further danger is to
be expected. Third, any additional water fallout due to a temperature and hence water acceptance
decrease during the flight will set free only very small amounts of water, as may be understood by
following the rather steep curves of 1 % EtOH admixed gasoline. Those will either not be ingested
by the fuel system or will be so small that a changed engine reaction will not be noticed.
40
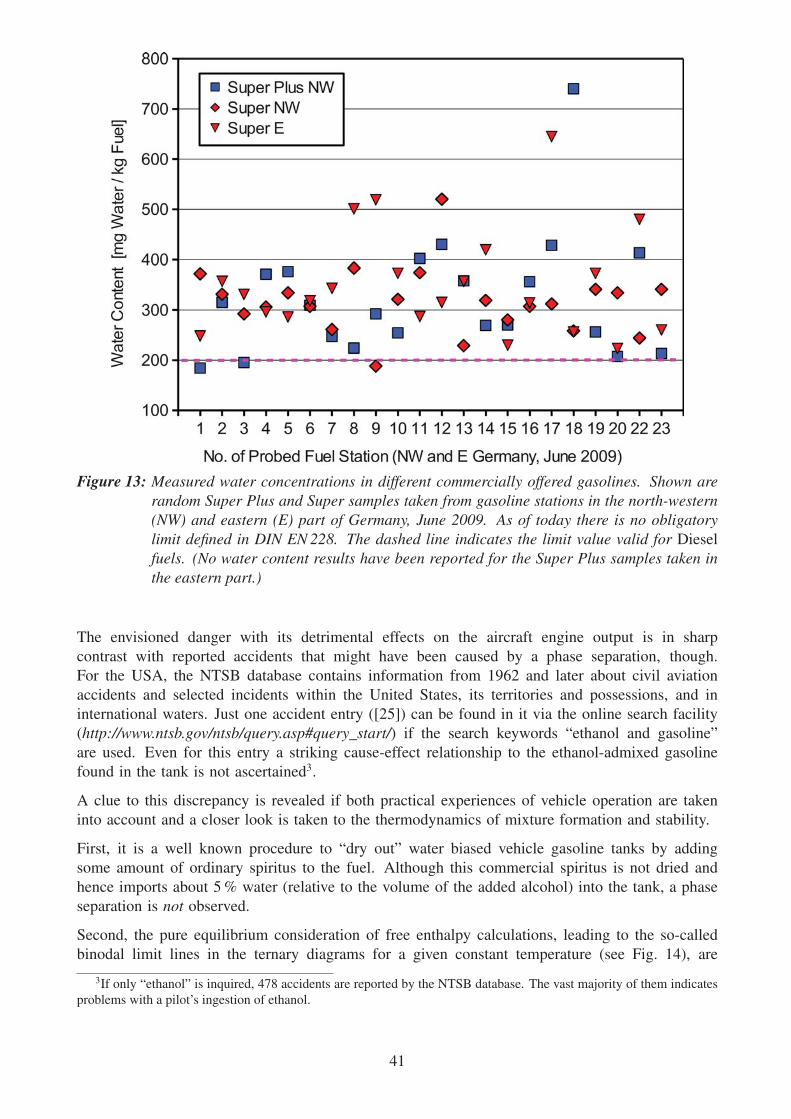
Figure 13: Measured water concentrations in different commercially offered gasolines. Shown arerandom Super Plus and Super samples taken from gasoline stations in the north-western(NW) and eastern (E) part of Germany, June 2009. As of today there is no obligatorylimit defined in DIN EN 228. The dashed line indicates the limit value valid for Diesel
fuels. (No water content results have been reported for the Super Plus samples taken inthe eastern part.)
The envisioned danger with its detrimental effects on the aircraft engine output is in sharp
contrast with reported accidents that might have been caused by a phase separation, though.
For the USA, the NTSB database contains information from 1962 and later about civil aviation
accidents and selected incidents within the United States, its territories and possessions, and in
international waters. Just one accident entry ([25]) can be found in it via the online search facility
(http://www.ntsb.gov/ntsb/query.asp#query_start/) if the search keywords “ethanol and gasoline”
are used. Even for this entry a striking cause-effect relationship to the ethanol-admixed gasoline
found in the tank is not ascertained3.
A clue to this discrepancy is revealed if both practical experiences of vehicle operation are taken
into account and a closer look is taken to the thermodynamics of mixture formation and stability.
First, it is a well known procedure to “dry out” water biased vehicle gasoline tanks by adding
some amount of ordinary spiritus to the fuel. Although this commercial spiritus is not dried and
hence imports about 5 % water (relative to the volume of the added alcohol) into the tank, a phase
separation is not observed.
Second, the pure equilibrium consideration of free enthalpy calculations, leading to the so-called
binodal limit lines in the ternary diagrams for a given constant temperature (see Fig. 14), are
3If only “ethanol” is inquired, 478 accidents are reported by the NTSB database. The vast majority of them indicates
problems with a pilot’s ingestion of ethanol.
41

Figure 14: Position of the binodal and spinodal limit curves in a ternary GEW diagram for a certaintemperature [21].
misleading: The condition that the free enthalpy of a GEW mixture is larger than that of a split
state with separate phases is not sufficient for the generation of such phases. The creation of
distinct phases consumes additional energy that must be taken somewhere from. In the immediate
neighbourhood of the binodal limit line the gain of free enthalpy is too small to support such a
creation of phase interfaces. Accordingly the incident region of the miscibility gap is governed by
a meta-stability that reaches non-neglectably into the gap. If gasoline is in this state there is still
no danger of a macroscopical distinct phase creation in a relevant time interval.
Since the required surface generation energy is coupled to the surface tension, and the surface
tension is a function of material interfaces, e.g. at the tank surface, the region of meta-stability
may be dependent on the tank material.
Even though a spontaneous disintegration of a formerly homogeneous phase into two distinct ones
will usually occur in the form of cloudiness of the fuel, i.e. the small alcohol/water droplets
will mostly remain wavering in the gasoline without aggregating to a macroscopically distinctive
phase, such a condition should be avoided by all means as there is no guarantee how long this
physically meta-stable suspension will remain in existence. In addition, this suspension does not
exhibit the same physical properties as the homogeneous combined phase as the microscopically
distinct phases may behave differently at surfaces of small bores and in filters and thus create new
problems.
With increasing ethanol admixture to the base gasoline the emergent alcohol/water phase will
occupy a respective share in the tank if a phase separation has taken place and the heavier hydrous
42
phase is settling: For an E-5 gasoline this would yield already about 5 % of volumetric occupancy,
so any low-positioned tank outlet would fall into this range, delivering predominantly the alcohol
phase to the engine which will choke on it.
This situation is even aggravated by the fact that the miscibility gap is rather strongly temperature
dependent. Fig. 12 illustrates the dependency of water tolerance as a function of temperature
for various mixtures of gasoline with ethanol and an additional alcoholic solubilizer. The large
temperature differences between ground and cruise height, frequently some ten degrees Centigrade,
will lead to a cool-out of the fuel tank. This in turn may lead to the situation that a homogeneous
fuel at pre-flight conditions may not show any peculiarities when being drained in the usual manner
but may separate during the flight.
Unfortunately there is no simple means to extract solved water from the fuel. A micro-filter that
may well separate even emulgated water will not do. Accordingly the companies manufacturing
and trading ethanol-admixed gasoline fuels are well aware of the necessity to keep any kind of
water (liquid and gaseous) from entering the fuel storage vessels. Respective venting systems with
water traps are applied throughout. Ethanol or ethanol admixed fuel must not be transported by
ship or through pipelines.
While this care to prevent water intrusion may well be positively assumed for the production and
distribution phases it cannot be ruled out with the same stringency afterwards. FMEA results (see
section 6.1) pointed to potentially dangerous settings both for the end consumer supply step in
European regions with less stringent control structures and for the partially casual pilot’s handling
of fuel in the individual aircraft. Especially the latter case should be scrutinized thoroughly as
it is frequent use to leave smaller aircraft with filled tanks in the hangars and not fly them for
prolonged periods of time (see section 6.3.4). Here gaseous water may enter the tank unnoticed
via the breathers or by porous tank fill cap sealings and the like.
Both general but conflicting recommendations — to keep the aircraft’s gasoline tank well filled
to prevent larger amount of breathings, and to always freshly fuel the aircraft to be certain about
the fuel quality — are valid furtheron. Without custom safeguarding measures the danger of a
dangerous deterioration of ethanol containing gasolines appears definitely higher, especially so for
E-10 and higher EtOH admixture shares. The breather originating hazard can be countered by
installing custom air dryers that take away the largest part of the air humidity before its contact
with the gasoline.
Besides constructive materials incompatibilities and accidental vapour locking increases due to
gasoline brand mixings the problem of phase separation is supposed to be of major importance
to EtOH admixed fuels for aviation purposes, as it is the least known and the most difficult to
understand effect for laymen, while at the same time being the most hidden one as there are no
practically available measurement procedures for danger assessment — see also Section 7.
5.2 Vapour Locking Potential of Mixtures of Ethanol-Admixed Gasolines
The threat of vapour locking, i.e. the creation of vapour bubbles in the fuel system leading to a
stagnation of fuel flow to the engine, is well known within the aviation community, especially so
to those pilots operating their aircraft on MOGAS since its comparatively high vapour pressure,
compared to AVGAS, is prone to show this effect. Ethanol blended gasolines add a new dimension
to this threat as they display a non-linear vapour pressure increment effect in a case of mixing.
As a chemically pure substance ethanol has a temperature-dependent, but clearly defined vapour
pressure, contrary to gasoline mixtures that can, as multi-component mixtures, only sensibly be
43

described by boiling curves. During engine operation thermal transients of varying time scales are
observed, though. The fuel evaporation in the engine, substantially influencing the ignitability of
the fuel air mixture, is a very short-timed process that is mainly governed by the total evaporation
enthalpy (see section 5.3). The fuel supply to the carburator or the fuel injectors is, on the other
hand, a rather slow process that leads the liquid through various potentially heated aggregates
(tubing, pumps, mixers) with extended exposition times. Here the vapour pressure of the light fuel
components plays a major role with respect to the danger of spontaneous and fuel flow choking
vapour bubble creation.
As a pure substance ethanol shows a rather low vapour pressure unusual for such a small organic
molecule. Accordingly, it is a liquid under normal conditions. The low vapour pressure is mainly
caused by a rather high polarity, combined with the relatively strong hydrogen bonds of the OH
part of the CH3CH2OH molecule. In this respect it is somewhat comparable to water. If smaller
ethanol amounts are dissolved in less polar media like gasoline this vapour pressure damping
effect is strongly reduced as far less partners are available for the retaining hydrogen bonding.
Accordingly, a considerably higher vapour pressure is observed in deviation from Raoult’s Law for
ideal mixing. Interestingly, the maximum vapour pressure is found for a mixture of about 2 % v/v
ethanol in a constant gasoline basestock, see Fig. 15.
Figure 15: Dependence of vapour pressure of the same base gasoline on the amount of admixedEtOH, after [28].
This result represents the behaviour of “cold” gasoline/ethanol mixtures. Another source investigates
the vapour pressure at raised temperatures [20]. According to this source, at 60 ◦C the rise of the
vapour pressure with ethanol abundancy proceeds up to an E20 ratio (Fig. 16).
As a consequence for fuel system parts adjacent to the hot engine there is still an increasing effect
to be expected with raised ethanol content for the admixture range considered in this report (up to
E-15). Fig. 16 shows these dynamically determined vapour pressure results for raised temperatures.
(For further discussion with respect to vaporization enthalpy, see also Sect. 5.3).
44

Figure 16: Dependence of vapour pressure of the same base gasoline on the amount of admixedEtOH, measured dynamically [20].
The admixture of ethanol to gasoline therefore much more increases the volatility than the presently
mostly used methyle- resp. ethyle-tert-butyle-ethers (MTBE, ETBE). Fig. 15 does not represent
actual different vapour pressures of commercial gasoline brands as the vapour pressure of the
respective base gasoline is deliberately adjusted to the pressure increase induced by the intended
EtOH admixture: When preparing ethanol blended gasolines the formulation of the basic gasoline
is suitably chosen so as to comply with the normative evaporation requirements for the final
product. Here certain so-called BOBs (basestocks for oxygenated blending) are put to work that
take the described vapour pressure increasing effect into consideration by providing a less volatile
base gasolines.
Problems may arise if different gasoline blends meet (fig. 17, based on static vapour pressure
results): Due to the non-Raoultian mixing properties a mixture may be created that exhibits an up
to 8 % increased vapour pressure relative to the individual anteceding qualities. As long as identical
ethanol concentrations are mixed it is not likely that the resulting vapour pressure will change
significantly at all. It cannot be logistically ruled out, though, that residual amounts of E-5 or E-10
fuel blends are mixed with ethanol-free MOGAS or AVGAS gasoline in winter quality, yielding an
unlucky mixture with about 1 . . . 2 % EtOH content. In that case the raised volatility effect is
strongest and may lead to an out-of-bounds REID vapour pressure and hence to the induction of
vapour bubbles at fuel system components with elevated temperatures or sharp dynamic pressure
drop, especially so if the original gasolines were already top-rated with respect to their vapour
pressures. Fig. 18 shows a sample taken from 21 north-western German fuel stations. It should be
noticed that some of the probes definitely approach the upper level of normative DVPE values for
winter quality gasoline.
Due to the non-trivial dependencies of the vapour pressure on the fuel ingredient abundances it still
remains to be investigated in detail which conditions may lead to substantial dangers. Accordingly
the scope of the SIOBIA work package is the investigation of partially ethanol-admixed mixtures
45
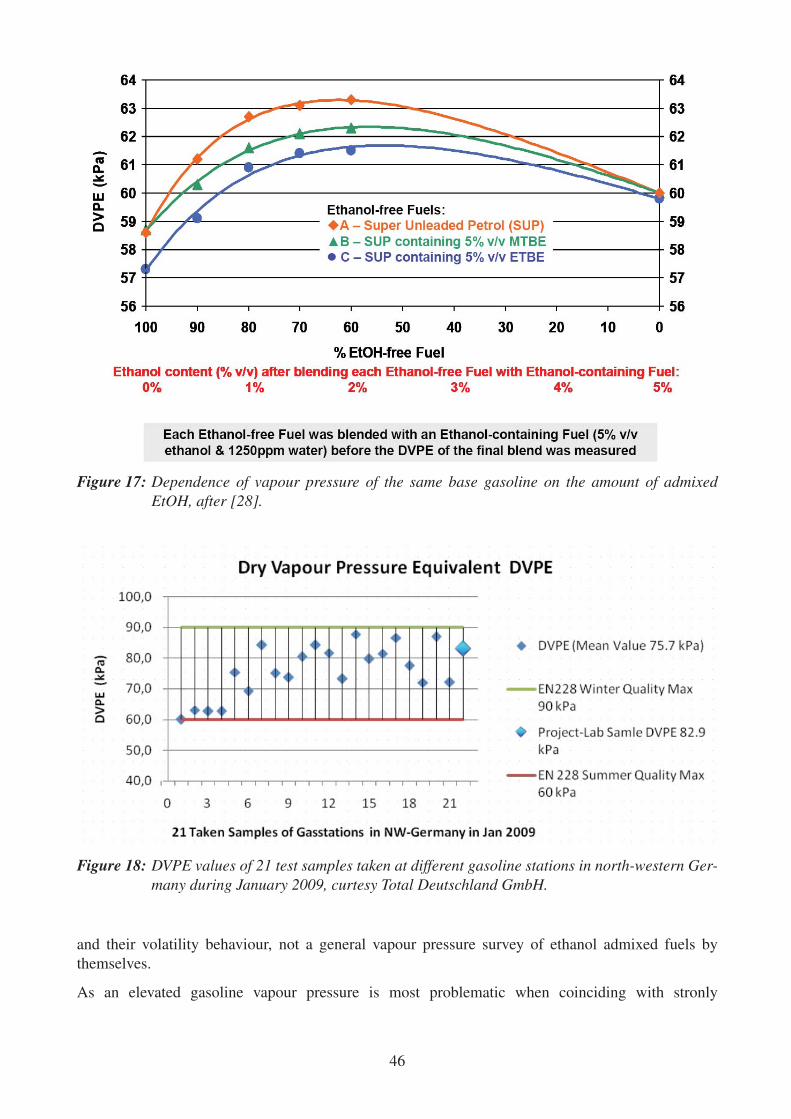
Figure 17: Dependence of vapour pressure of the same base gasoline on the amount of admixedEtOH, after [28].
Figure 18: DVPE values of 21 test samples taken at different gasoline stations in north-western Ger-many during January 2009, curtesy Total Deutschland GmbH.
and their volatility behaviour, not a general vapour pressure survey of ethanol admixed fuels by
themselves.
As an elevated gasoline vapour pressure is most problematic when coinciding with stronly
46
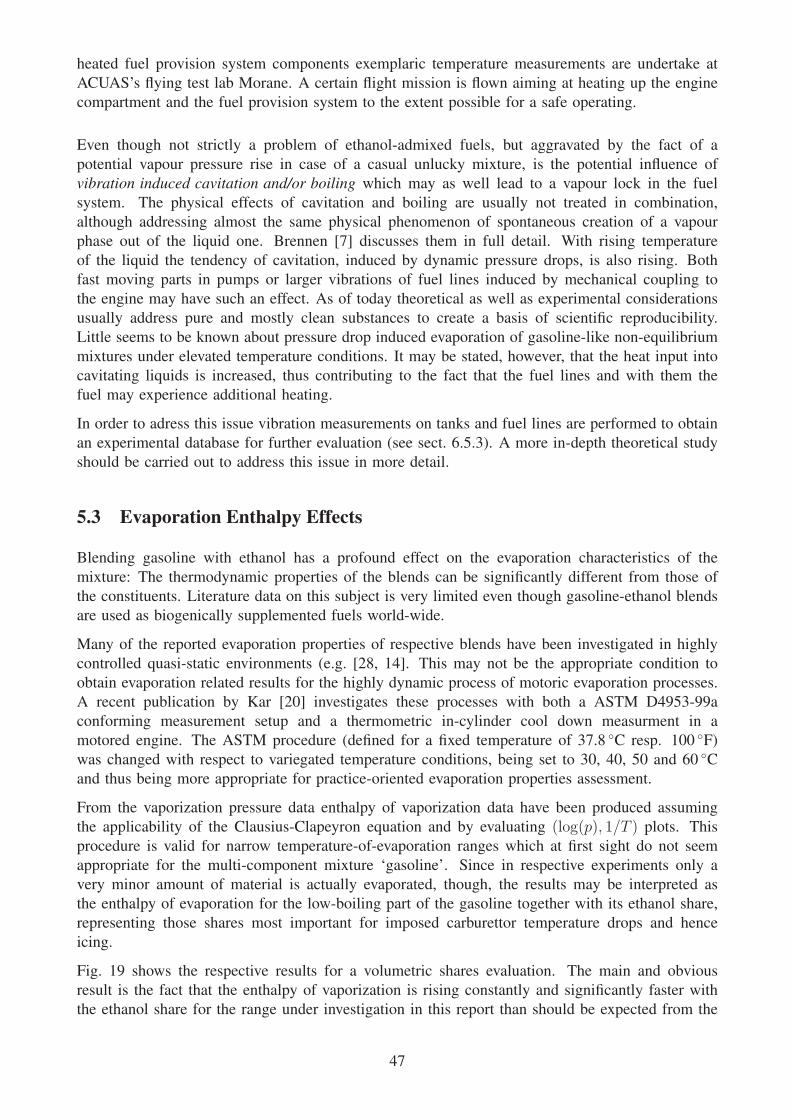
heated fuel provision system components exemplaric temperature measurements are undertake at
ACUAS’s flying test lab Morane. A certain flight mission is flown aiming at heating up the engine
compartment and the fuel provision system to the extent possible for a safe operating.
Even though not strictly a problem of ethanol-admixed fuels, but aggravated by the fact of a
potential vapour pressure rise in case of a casual unlucky mixture, is the potential influence of
vibration induced cavitation and/or boiling which may as well lead to a vapour lock in the fuel
system. The physical effects of cavitation and boiling are usually not treated in combination,
although addressing almost the same physical phenomenon of spontaneous creation of a vapour
phase out of the liquid one. Brennen [7] discusses them in full detail. With rising temperature
of the liquid the tendency of cavitation, induced by dynamic pressure drops, is also rising. Both
fast moving parts in pumps or larger vibrations of fuel lines induced by mechanical coupling to
the engine may have such an effect. As of today theoretical as well as experimental considerations
usually address pure and mostly clean substances to create a basis of scientific reproducibility.
Little seems to be known about pressure drop induced evaporation of gasoline-like non-equilibrium
mixtures under elevated temperature conditions. It may be stated, however, that the heat input into
cavitating liquids is increased, thus contributing to the fact that the fuel lines and with them the
fuel may experience additional heating.
In order to adress this issue vibration measurements on tanks and fuel lines are performed to obtain
an experimental database for further evaluation (see sect. 6.5.3). A more in-depth theoretical study
should be carried out to address this issue in more detail.
5.3 Evaporation Enthalpy Effects
Blending gasoline with ethanol has a profound effect on the evaporation characteristics of the
mixture: The thermodynamic properties of the blends can be significantly different from those of
the constituents. Literature data on this subject is very limited even though gasoline-ethanol blends
are used as biogenically supplemented fuels world-wide.
Many of the reported evaporation properties of respective blends have been investigated in highly
controlled quasi-static environments (e.g. [28, 14]. This may not be the appropriate condition to
obtain evaporation related results for the highly dynamic process of motoric evaporation processes.
A recent publication by Kar [20] investigates these processes with both a ASTM D4953-99a
conforming measurement setup and a thermometric in-cylinder cool down measurment in a
motored engine. The ASTM procedure (defined for a fixed temperature of 37.8 ◦C resp. 100 ◦F)
was changed with respect to variegated temperature conditions, being set to 30, 40, 50 and 60 ◦C
and thus being more appropriate for practice-oriented evaporation properties assessment.
From the vaporization pressure data enthalpy of vaporization data have been produced assuming
the applicability of the Clausius-Clapeyron equation and by evaluating (log(p), 1/T ) plots. This
procedure is valid for narrow temperature-of-evaporation ranges which at first sight do not seem
appropriate for the multi-component mixture ‘gasoline’. Since in respective experiments only a
very minor amount of material is actually evaporated, though, the results may be interpreted as
the enthalpy of evaporation for the low-boiling part of the gasoline together with its ethanol share,
representing those shares most important for imposed carburettor temperature drops and hence
icing.
Fig. 19 shows the respective results for a volumetric shares evaluation. The main and obvious
result is the fact that the enthalpy of vaporization is rising constantly and significantly faster with
the ethanol share for the range under investigation in this report than should be expected from the
47

Figure 19: Enthalpy of vaporization for ethanol admixed gasoline blends, valid for gasoline/ethanolmixtures in the temperature range of 30 – 60 ◦C, after [20]
pure substances’ data. For E-15 relative to E-0 the value is rising from about 25 kJ/kmol to ca. 32
kJ/kmol, i.e. by about 35 %.
Ambient temperature and humidity in combination with the ethanol fuel blend having a higher
enthalpy of vaporization may lead to a pronounced threat of icing. Icing is the condition where
water vapour in the air condenses as ice precipitation within the engine inlet system or on
carburettor surfaces. This in turn may result in a loss of performance or even engine stalling.
Fig. 20 illustrates the combination of ambient temperature and humidity at ground level pressure.
For lower service ceilings these results may be conferred to aircraft carburettor engine operation.
Since Fig. 20 relates to ordinary fuel without admixed ethanol and the anticipated additional
temperature drop can be proven in air intake manifolds of carburettor aircraft engines (see
Sect. 6.4) the icing threat may be regarded as aggravated under these circumstances. The critical
icing-prone region depends on two effects: i) the existence of liquid water in the atmosphere,
and ii) a temperature drop in the carburettor sufficiently large to cool down the tiny droplets
below freezing temperature. Keeping these potential factors in mind it may be expected that the
critical region will expand to (slightly) lower humidities and to higher ambient temperatures. The
endangering conditions are quite frequent if cloud layers have to be crossed during a flight.
Fuel injection virtually eliminates icing, though, since fuel is delivered into the rather hot inlet port
rather than vaporized into the cold intake air at the carburettor.
5.4 Compatibility of Fuel System and Engine Materials with Ethanol Contentin Fuel
Quite a lot of different materials are exposed to the fuel of an combustion engine system. Beginning
with the tank and its built-in fitments (breathers, tank caps, level indicators, sealers), proceding
48

Figure 20: Temperature / humidity domains for increased danger of carburettor icing at ground at-mospheric pressure, after [1]
fuel hoses, filters, fuel pumps etc., and finally reaching cylinder heads and combustion chamber
valves, both individual materials as well as material combinations are subject to fuel interaction.
In the past these materials and material combination have been chosen with the best possible
resistance and material properties for pure gasoline in mind and hence complying in full with
AVGAS. Previous MOGAS gasoline brands, with their EtOH contents limited usually to less than
1 % for aviation purposes, do not deviate substantially from this behaviour. Even though larger
amounts of alcohol admixtures to the gasoline (up to 5 % v/v, see section 3.3) are admitted already
for a while this upper boundary value has not been touched due to economical reasons. With the
onset of compulsory biogenic admixtures this will change, however, and it may well be assumed
that at least a larger share of commercial gasolines will contain abundancies up to the legally
defined value.
The chemical resistance table from Gates Corp. [10] already points to the fact that materials
typically selected for previous non-ethanolic fuels may create problems as the simultaneous
coverage of resistance to both gasoline and ethanol is rather small. Accordingly a major inquiry on
the compatibility of different material classes with ethanol-admixed fuel is undertaken as a separate
task within this report.
5.4.1 Metallic components
Beyond the general problem of increased corrosion induced by a slightly increased electrical
conductivity of ethanol-admixed gasolines in combination with a slightly increased water content
([8, 9]) the formation of aluminium alcoholate is a major issue. If liquid ethanol is interacting
with unprotected aluminium under hot conditions such a specific corrosion is likely to happen.
The situation is worsened by the fact that the corrosion can already be induced by just one faulty
fueling and will not stop even if the engine is operated on standard non-alcoholic fuel afterwards
[2]. The pits eroded by the the ethanol fuel will continue to dig into the affected surface and
slowly destroy it.
49

It should be noted, however, that these corrosion effects are only likely for certain aluminium
alloys, and only at temperatures well beyound 100 ◦C [30]. Accordingly the local pressure must be
raised significantly to create respective conditions. As these conditions will only be met in cylinder
heads and intake manifolds the potential damage risk related to this cause can be narrowed down
to those fuel system / engine zones.
5.4.2 Plastics, Elastomers and Glues
A lot of parts of the fuel system consist of non-metal components. Typical elements are tubings,
filters, reservoirs, fittings, tanks, etc. . Depending on the material they consist of they are affected
by the fuel constituents in different ways. The utilization and hence the required properties of
the respective part determines, to a certain extent, the choice of the available materials. Glues
are frequently found in composite expendable items where different material types must be joined.
Especially fuel and oil filters are affected as the usual properties of them, like mechanical stability,
permeability to a liquid, and retainment of undesired contents, are obtained by different functional
constituents.
Accordingly this problem is a subject of recent and ongoing investigations. First results of a
work in progress has been reported in [5] where, besides other targets, the stability of typical
non-metallic fuel system materials for ethanol admixed fuels is scrutinized for realistic ambient
engine conditions like elevated temperatures.
An in-depth analysis of organic materials commonly applied in automotive and aviation oriented
applications has been performed by the project’s sub-contractor SGS Institut Fresenius, Dortmund,
Germany — see Sect. 6.6.2. For a larger number of organic constructive materials (all frequently
used ones in automotive and combustion technology applications are covered) their practical
properties (temperature range of applicability, compatibility with different solvents, mechanical
properties, ...) are detailed. In agreement with recent results from automotive industrial devel-
opments and researches appropriate materials are available to comply with ethanol admixtures of
arbitrary abundancies. The material issue arises from the fact, though, that as of today aviation parts
never had to expect to become exposed to larger amounts of (partially hot) ethanol. Accordingly
the materials chosen for aviation-certified parts did not take this requirement into account.
Especially for the field of organic materials there is another aspect that strongly influences the
applicability of respective products for ethanol admixed gasolines. Production parts are frequently
manufactured from material mixes or layered materials, providing them with changed chemical
and physical properties. This effect, as desired as it may be, complicates the assessment of ethanol
compatibility significantly. A respective compatibility table assemebled by SGS Institute Fresenius,
Dortmund, for SIOBIA (Sect. 6.6.2) indicates respective differences even for base materials if it
comes to a comparison of properties directly related to certain trade names. While some base
materials are not considered as reasonably robust for ethanol/gasoline mixtures some manufacturers
claim a compatibility nevertheless. According to material experts this may originate in custom
material mixes, surface treatments and the like.
A major issue is the ethanol admixture compatibility of elastomers. Most of the aviation oriented
elastic hoses are produced from aviation certified Nitrile Rubbers of the various kinds, usually
abbreviated with NBR. For pure gasolines or such with only small amounts of admixed ethanol
(less than E-5) they are considered appropriate with respect to their material longevity. Exposed to
raised ethanol contents they tend to brittle or swell, depending on the individual kind of elastomer.
A solution to this general problem would be the alternative deployment of fluorinated rubbers
(FFKM/FFPM et.al., see compatibility table in Sect. 6.6.2, p. 101). Since their price is about
50
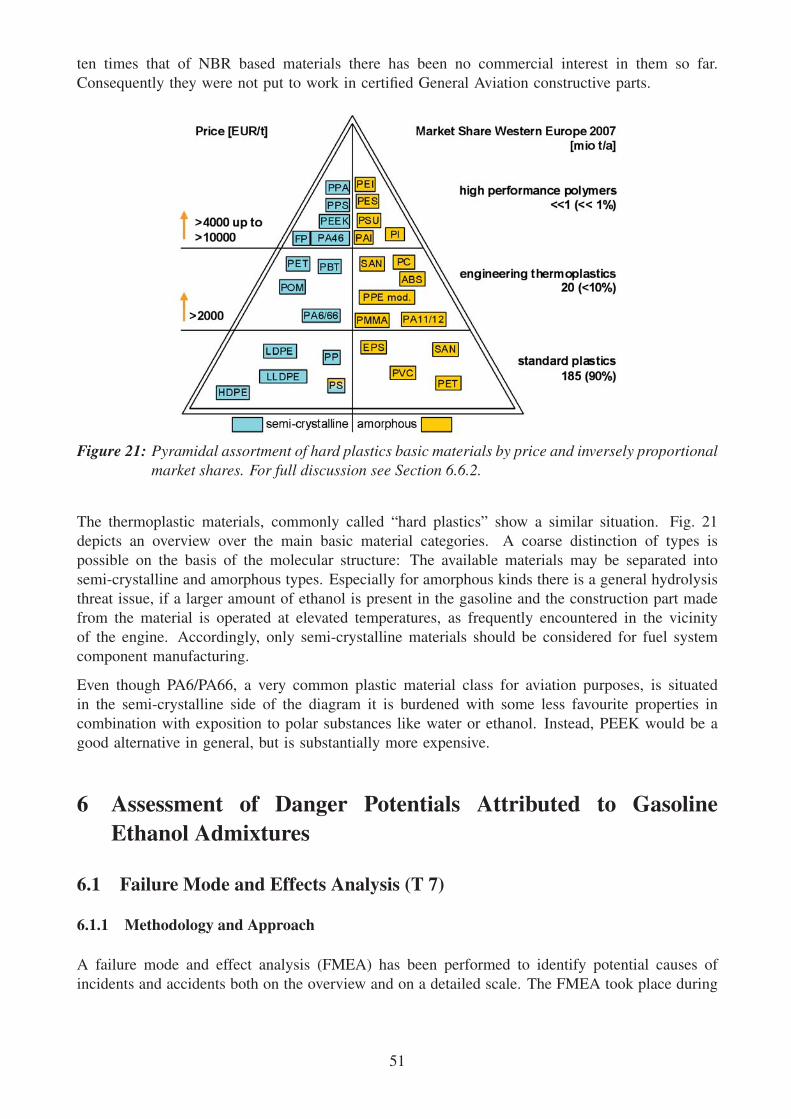
ten times that of NBR based materials there has been no commercial interest in them so far.
Consequently they were not put to work in certified General Aviation constructive parts.
Figure 21: Pyramidal assortment of hard plastics basic materials by price and inversely proportionalmarket shares. For full discussion see Section 6.6.2.
The thermoplastic materials, commonly called “hard plastics” show a similar situation. Fig. 21
depicts an overview over the main basic material categories. A coarse distinction of types is
possible on the basis of the molecular structure: The available materials may be separated into
semi-crystalline and amorphous types. Especially for amorphous kinds there is a general hydrolysis
threat issue, if a larger amount of ethanol is present in the gasoline and the construction part made
from the material is operated at elevated temperatures, as frequently encountered in the vicinity
of the engine. Accordingly, only semi-crystalline materials should be considered for fuel system
component manufacturing.
Even though PA6/PA66, a very common plastic material class for aviation purposes, is situated
in the semi-crystalline side of the diagram it is burdened with some less favourite properties in
combination with exposition to polar substances like water or ethanol. Instead, PEEK would be a
good alternative in general, but is substantially more expensive.
6 Assessment of Danger Potentials Attributed to GasolineEthanol Admixtures
6.1 Failure Mode and Effects Analysis (T 7)
6.1.1 Methodology and Approach
A failure mode and effect analysis (FMEA) has been performed to identify potential causes of
incidents and accidents both on the overview and on a detailed scale. The FMEA took place during
51

two times two days and included both a functional and a component view.The following aspects
were treated in detail (Fig. 22):
• Gasoline provision chain from refinery to aircraft tank
• Impact of ethanol-admixed gasoline on individual parts of the fuel system of small two-stroke
and four-stroke gasoline-operated engines
• Potential effects of flight boundary conditions on the behaviour of the fuel in the system
A group of experts was invited to participate in the respective discussions. The organizing company,
BRP-ROTAX, selected them with the aim of a sincere mix of theoretical and practical application
expertise in mind (cf. Appendix C), with some backup experts for remote consultation in case of
necessity.
As organizing software tool Plato’s SCIOTM FMEA system, being a specialized spreadsheet
application, (http://www.plato-ag.com/platohp/scio-fmea.html) was used. It helps to structure the
potential failure scenarios on the basis of a chain consideration:
element
function⇒ potential failure mode ⇒
⎧⎪⎨⎪⎩
potential failure effect + severity (S)potential cause + occurrence probability (O)prevention measure + detection probability (D)
A failure mode is defined as how a system, product, or process may fail. A constructive part or
a process can have hundreds of different failure modes based on this definition, most of which
are highly correlated to each other because of a common failure mechanism behind them. A
failure mechanism is defined as the physical phenomenon behind the failure mode(s) observed, e.g.
disintegration of constructive parts, corrosion, degradation of fuel, engine stoppage, etc. .
Severity, occurrence probability and detection probability values are individually assessed by the
experts team, whose members assign respective values in the range 1 . . . 10 to each variable. The
value to be assigned is determined by the assessment rules as detailed out in Appendix C. If a
value cannot be sensibly determined a value of 0 is assigned.
The main goal of the procedure is the quantification of the risk priority number (RPN) for each
failure mode considered. It is simply the product of the failure mode severity (S), the failure cause
occurrence probability (O), and the detection effectiveness (D) ratings:
Figure 22: Overview on the objectives treated by the FMEA. Aircraft behaviour and fuel system com-ponents issues are both regarded in functional and parts views.
52

RPN = S ∗O ∗D
The individual attributions of S, O and D were a matter of open discussion within the expert team.
In all treated cases an agreement could be reached with respect to the individual valuations. As a
general consent in the group the worst possible effect has been assumed.
The focus of the FMEA was on functions & parts, with a rather large number of potential effects
having been considered. Even though a very diverse group of experts covering as many fields as
possible has been discussing the effects, many of them had to remain untreated at the early stage
of the project when the FMEA took place since no scientific expertise was available. The S, O, Dvalues, and hence the resulting RPN value, have been set under these boundary conditions. The
FMEA has been taken as an initialization only and has not been persecuted along with the SIOBIA
project.
6.1.2 Overall Results of the Failure Mode and Effects Analysis
In the FMEA process a total of about 330 potential failures have been assorted, each of them being
attributed with respective S, O, and D values. As was expected and is summarized in Fig. 23 the
vast majority of potential issues are of minor importance. Most of them fall into the range of
100 < RPN < 200 and below.
�������
���������
���������
���������
��������
�������
��������
���������
� � ��� ��
����������
������������������
Figure 23: FMEA risk attribution overview, grouped by classes of severity.
This led to an identification of 61 issues of major importance, i.e. with RPN values above 200,
detailed in Appendix C. They can be assorted to some categories relevant for an internal EASA
assessment. As categories the following appear as relevant to distinguish. They do not mutually
exclude each other, so some issues may appear in more than one category:
Covered by SIOBIA activities. The respective issues are treated by at least one of the practical
work actions of the SIOBIA project. This does not mean that a solution or a full
53
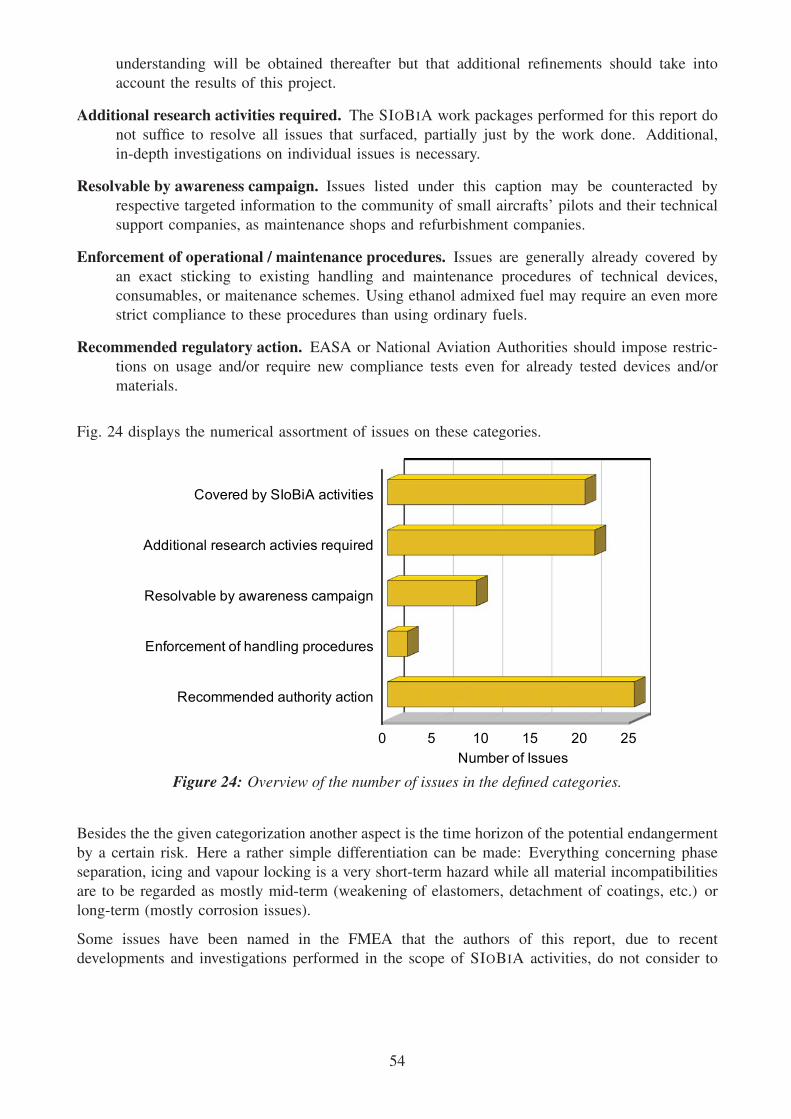
understanding will be obtained thereafter but that additional refinements should take into
account the results of this project.
Additional research activities required. The SIOBIA work packages performed for this report do
not suffice to resolve all issues that surfaced, partially just by the work done. Additional,
in-depth investigations on individual issues is necessary.
Resolvable by awareness campaign. Issues listed under this caption may be counteracted by
respective targeted information to the community of small aircrafts’ pilots and their technical
support companies, as maintenance shops and refurbishment companies.
Enforcement of operational / maintenance procedures. Issues are generally already covered by
an exact sticking to existing handling and maintenance procedures of technical devices,
consumables, or maitenance schemes. Using ethanol admixed fuel may require an even more
strict compliance to these procedures than using ordinary fuels.
Recommended regulatory action. EASA or National Aviation Authorities should impose restric-
tions on usage and/or require new compliance tests even for already tested devices and/or
materials.
Fig. 24 displays the numerical assortment of issues on these categories.
�������������������� �������
!�"����������"��������#�$���������
�����%������ ��&�����������$��#�
'�����������������������%������(�����
)�%������ �*+�,�'�����%�����
� �� � �� �
��������"�+�����
Figure 24: Overview of the number of issues in the defined categories.
Besides the the given categorization another aspect is the time horizon of the potential endangerment
by a certain risk. Here a rather simple differentiation can be made: Everything concerning phase
separation, icing and vapour locking is a very short-term hazard while all material incompatibilities
are to be regarded as mostly mid-term (weakening of elastomers, detachment of coatings, etc.) or
long-term (mostly corrosion issues).
Some issues have been named in the FMEA that the authors of this report, due to recent
developments and investigations performed in the scope of SIOBIA activities, do not consider to
54

be critical. These are issues no. 12, 13, 30, 364. As the FMEA has been executed in an early
stage of the project when results had not been aquired yet this should be considered as a normal
intelligence acquisition process.
The following collation of important issues is proposed:
• Covered by SIOBIA activities
– Issue 11: Engine operation with phase separated E-10 biofuel (RPN 168)
Risk: By the increased affinity for water, particularly with longer aircraft storage times,
a phase separation of the alcohol fuel may occur. This can lead in consequence to an
influence of the engine operational behavior up to engine shut down.
– Issue 15: Insufficient pre-heating of the intake air (RPN 189)
Risk: Due to the increased evaporation enthalpy of E-10 a too low intake air temperature
may be encountered, which could result in carburettor icing and consequentially lead to
an engine shut down.
– Issue 18: Incompatibility of composite material (CFK/GFK) (RPN 168)
Risk: The solvent characteristics of E-10 in connection with mechanical load or caused
by water in connection with high temperature may lead to a decomposition of resins
and synthetic material. This on the one hand can result in leakages and on the other
hand deposits rinsed out and probably blocking fuel filters.
– Issue 19: Embrittlement of fuselage tanks made of blown PE-HD or PE-LD (RPN 168)
Risk: Due to the special characteristics of E-10 a material embrittlement may occur,
particular in PE fuselage tanks, which can lead in consequence to leakages. The exact
effect currently is unknown.
– Issue 20: Swelling of NBR rubber material used for tanks (RPN 126)
Risk: Presumably due to diffusion processes a penetration of E-10 fuel into the rubber
material may occur, which can lead in consequence to leakage and/or to the decrease
of the mechanical strength of the tank.
– Issue 21: Difficult draining at NBR tanks (RPN 240)
Risk: Phase separation of E-10, particularly within NBR tanks, leads to accumulations
of the water/ethanol mixture in bulges on the bottom of the tank. On the one hand this
bulges filled with water/ethanol mixture could not be drained completely, on the other
hand the quantity of the water/ethanol mixture to be drained is much larger than the
proportion of water with MOGAS. Further, the remaining fuel after the draining has a
very low octane rating and leads in further consequence to a knocking combustion.
– Issue 23: Decomposition of the tank sealing material (RPN 192)
Risk: Due to the solvent characteristics of E-10 the tank seal material may be
decomposed. According to experts assumptions cork seals are deemed noncritical.
Pro-seal, NBR and PRC (e.g. Company Desoto) are classified as critical. Note: Pro-seal
consists of components (polysulphide rubber and a further component).
4Most of the issues considered as non-critical within the scope of this report are concerned about a potential freeze-
out of water drawn into the gasoline by its raised hygroscopy due to its ethanol content. Freezing of such water must
always be accompanied by a prior phase separation. But this phase separation would not produce pure water (as would
indeed happen in non-alcohol admixed AVGAS or MOGAS). Instead, the second phase would consist mainly of ethanol
containing some water. Such a mixture is well-known as anti-freeze liquid frequently used in cooler devices, though.
As the FMEA should highlight increased potential hazards caused by ethanol admixtures relative to the contemporary
MOGAS definition, the respective issues may be securely downgraded, if not even dropped completely.
55

– Issue 24: Chemical influence on the tank ventilation (aluminium, plastic or steel pipe
placed into the air flow) (RPN 192)
Risk: Especially larger temperature variations may lead to a leaking of fuel via the tank
ventilation. Material incompatibilities could consequently lead to an embrittlement or
to pouring. Possibly the tank ventilation may become dysfunct which would have an
effect on the engine behavior.
– Issue 25: Chemical influence on filler caps including sealing, e.g. NBR gasket, NBR
O-rings, cork gasket, Viton (RPN 120)
Risk: The chemical influence on filler cap materials can lead to leakage (inward and/or
outward) whereby inward is deemed to be more critical to evaluate.
– Issue 26: Chemical influence on fuel filler neck (NBR rubber material) (RPN 126)
Risk: The chemical influence on fuel filler necks made from NBR material (aluminium
is deemed to be noncritical in that context) can lead to leakage of fuel into the airframe.
– Issue 27: Chemical influence on hoses and pipes (PTFE, NBR, Viton, BR, CR-
Chloropren rubber) (RPN 378)
Risk: If there is an undesirable influence on hoses (also vacuum tubings), this possibly
leads to pouring, embrittling or shrinking the material (CR and NBR rather most
critically). The consequences are, dependent on the material and on the design,
leakages, cross-section contractions and/or wall thickness reductions. The effect could
be that the hoses detach from the fittings.
Note: Similar risk potentials also apply to PE and PA fittings and/or to very flexible
hoses made of silicone for aerobatics tanks.
– Issue 29: Chemical influence on sealing materials (O-rings, cork, paper, metal, copper,
aluminium, ...) (RPN 200)
Risk: Possible risks are embrittlement, swelling or decomposition of the basic seal
material. The consequence of those would be a leakage and/or air ingress.
– Issue 33: Influence on the operational behavior of the engine (RPN 392)
Risk: By operating the engine with phase separated fuel impairments of the engine
operational behavior may occur. This reaches from rough engine operation up to the
stop of the engine. By operating the engine with undeteriorated E-10 fuel its smaller
energy content possibly leads to impairments of the engine characteristics. Further on,
an increased burn temperature of E-10 could result in a knocking combustion.
– Issue 35: Carburettor icing (RPN 216)
Risk: Particular in case of adverse weather conditions such as very low temperatures
and/or high humidity, carburettor icing due to the increased evaporation enthalpy of
E-10 may occur.
– Issue 41: Malfunction of the turbo charger (RPN 120)
Risk: The slightly increased combustion temperature of E-10 could lead to malfunctions
of the turbocharger and consequentially to a loss of engine power.
– Issue 42: Chemical influence on sealing materials (e.g. NBR gasket, NBR O-rings,
cork gasket, Viton) within oil and fuel system (RPN 225)
Risk: Due to the characteristics of E-10 seal materials within the oil or fuel system
may be disintegrated. After longer periods of time this could lead to leakages and the
danger of fire.
– Issue 43: Incompatibility of rubber pipes (RPN 192)
Risk: If rubber hoses are not E-10 resistant enough, this possibly leads to embrittling,
swelling, or to base material decomposition. The consequences depend on the material,
56

leakages and cross-section contractions. Leakage air may enter a porous fuel system.
Cross-section contractions can impair the fuel flow, in the worst case leading to an
engine stop.
– Issue 44: Incompatibility of aluminum, steel, copper pipes (RPN 224)
Risk: By corrosion (and/or surface corrosion) and rinsed out deposits (due to solvent
characteristic of E-10) filters can be jammed. Base material decomposition, pitting
corrosion and increased corrosion within the range of welding seams lead to leakages.
– Issue 51: Incompatibility of (carburettor) rubber flanges (RPN 126)
Risk: Rubber flanges (at carburettors) can become leaky by corrosion and/or base
material decomposition. Leakage in rubber flanges lead to power loss with turbo
engines, to undefined idle speeds with suction engines. By swelling the air intake hose
could be loosened from the connecting parts.
Note: Similar risk potentials apply to air intake hoses.
– Issue 52: Incompatibility of intake manifold (RPN 210)
Risk: Corrosion can affect the engine operation in two ways. There is a sensitivity
to fuel mixture distribution, or detached particles can be carried into the combustion
chamber. Also, the intake manifold can become leaky by corrosion/ base material
decomposition, or by swelling/embrittlement of gaskets. Leakage in the intake manifold
leads to power loss with turbo engines, to undefined idle speeds with suction engines.
• Additional research activities required
– Issue 7: Corrosion of parts or materials during aircraft storage for longer periods (RPN
360)
Risk: Due to the increased affinity for water, the probability of a phase separation and
consequential contact corrosion (local cell), is larger with E-10 than with MOGAS.
With leakages of the fuel system additionally the danger of the chemical attack of
surfaces exists (e.g. wood, lacquers, Aerodux 185 glues, covering, tire ...)
– Issue 10: Blocking filters (RPN 144)
Risk: Due to the solvent characteristics of E-10 a potential danger consists in the
separation of material used in tanks or fuel pipes, which contaminate the fuel. In further
consequence it can result in blocking fuel filters.
– Issue 16: Increased risk for corrosion with aluminum and/or steel tanks. (RPN 189)
Risk: By contact corrosion (local cell) or by electro-chemical corrosion caused by
electrical level sensors surface corrosion may be induced, corrosion of the welding
seams (if available) up to decomposition of the base material and/or to the pitting
corrosion.
– Issue 28: Chemical influence on electrical fuel pumps and check valves (RPN 160)
Risk: Due to the undesired chemical influence on different materials (metals and/or
synthetics) fuel leakage may occur, leading to functional deficiencies of the electrical
fuel pump.
– Issue 31: Chemical influence on aluminium fuel coolers (required mainly for (RPN
224)
Risk: Due to the electro-chemical corrosion or oxide film decomposition a base material
decomposition could occur at aluminum fuel coolers. Consequentially this could lead
to fuel leakage.
– Issue 37: Reduced lubrication of the fuel pump (RPN 315)
Risk: The probably worse lubrication characteristics of E-10 (both in the normal
57

condition and in phase separated condition) may lead to an insufficient lubrication of
the fuel pump, potentially causing a loss of its function.
– Issue 38: Insufficient lubrication particularly at 2-Stroke engines (RPN 270)
Risk: Particularly with 2-stroke engines with oil-in-gasoline lubrication, the more
unfavorable lubrication characteristics from E-10 may lead to a lack of lubrication,
which can cause an engine shut down and damage.
– Issue 39: Insufficient lubrication of the engine including auxiliary drives (RPN 180)
Risk: A blow-by of E-10 may reduce the lubrication of the engine and the associated
auxiliary drives (e.g. governor, vacuum pump, hydraulic pump, starter, fuel pump, oil
pump, alternator, magneto) too strongly.
– Issue 41: Malfunction of the turbo charger (RPN 120, see above)
– Issue 45: Incompatibility of electrical fuel pumps (RPN 210)
Risk: The higher conductivity of E-10 can lead to an increased wear of the carbon brush
conductors. The (partial) degradation of different materials (metals and/or plastics) may
lead to fuel leakages. Rinsed out deposits can block moving parts up to the loss of
function of the fuel pump.
– Issue 46: Incompatibility of mechanical fuel pumps (RPN 280)
Risk: Worse lubrication characteristic of E-10, corrosion, base material decomposition,
frozen water in “dead end areas”, can result in a pump outage. Deposits rinsed out
by E-10 can block moving parts. Different degraded materials may cause leakages.
Especially in the case of diaphragm pumps this may lead to the loss of function.
– Issue 50: Material incompatibility of the fuel return pipe check valve (RPN 126)
Risk: Corrosion leads to a cross section enlargement in the check valve. This may
cause a too low fuel pressure.
– Issue 53: Influence of E-10 on combustion chamber parts (RPN 256)
Risk: E-10 could lead to increased valve seat wear. E-10 could have negative influence
on the engine oil. Bad oil can cause deposits in the valve guide. Malfunctioning of the
valve guides results in loss of engine power.
– Issue 54: Inappropriate spark plugs (RPN 144)
Risk: Increased electrode consumption, inapplicable heat rating, leakage on sealing
ring, inapplicable isolator.
– Issue 55: Incompatibility of fuel injectors (RPN 280)
Risk: Corrosion on the injection nozzle causes ill defined injection volumes. Further
corrosion, base material decomposition, swelling or embrittlement can block moving
parts, which causes a malfunction of the fuel injector.
– Issue 56: Incompatibility of fuel rails (RPN 240)
Risk: Corrosion on the fuel rail causes cracks or leakage. This can entail fuel loss.
Note: Similar risk potentials apply to fuel distributors (in fuel injection systems).
– Issue 57: Incompatibility of fuel pressure regulator (RPN 168)
Risk: Electro-chemical corrosion can cause base material decomposition. Leakages can
result on the one hand from surface corrosion (at aluminum or steel components), on
the other hand by swelling or embrittlement of seals.
– Issue 58: Incompatibility of quantity distributor (RPN 144)
Risk: A malfunctioning of the quantity distributor can be caused by a leaky diaphragm
or from base material decomposition/corrosion. Causes for a leaky diaphragm can be
embrittlement, swelling or attack on base material.
58

– Issue 59: Incompatibility of diaphragm (carburettor, pressure regulator, ...) (RPN 168)
Risk: Possible risks exist in embrittling, sources or base material decomposition of the
diaphragm material, which would entail leakages and/or malfunctioning (e.g. supply
pressure of the fuel pump cannot be held anymore, ...).
– Issue 60: Incompatibility of sensors (RPN 140)
Risk: Probably sensor lines and/or sensors are not compatible with E-10. Additionally
there is a potential risk in “dead end lines” where the fuel always remains the same. If
there is an accumulation of water (due to the affinity of E-10 for water) inside those
"dead end hoses" the danger of freezing or even corrosion exists which consequentially
could lead to wrong set values for the engine management system. Note: Similar risk
potentials apply to fuel totalizers
– Issue 61: Influence of E-10 on engine oil (RPN 160)
Risk: An ethanol share in the engine oil could probably extract certain components out
of it. Also, due to the affinity of E-10 for water, water can intrude. Thus the engine
oil lubrication characteristics could deteriorate up to the point of malfunction. Reduced
cooling characteristics or corrosion prevention properties (for combustion chamber parts,
crankshaft drive, valve train) are possible. Note: Particularly at 2-stroke engines with
oil-in-gas lubrication the influence of E-10 is deemed to be most critical.
• Resolvable by awareness campaign
– Issue 3: Aircraft fuelling by using fuel from cans refilled at petrol stations (RPN 720)
Risk: The risk is to use fuel that is either contaminated by the can itself or has a poor
quality because of mixed or long stored fuel. Longer stored E-10 bio fuel can be phase
separated and influence the operation of the aircraft.
– Issue 4: Mixing fuel products during fuelling of the aircraft (RPN 729)
Risk: Potential risk is to have a remaining quantity of fuel within the aircraft tank and
to refill with another product (e.g. mix AVGAS or E-0 with E-10) that could lead to
operational problems of the engine. Effects of ethanol admixtures (especially boiling
properties) do not behave linearly and thus unexpectedly.
– Issue 5: Insertion of water during fuelling of the aircraft (RPN 729)
Risk: The potential risk is to insert water before or during the fuelling process by e.g.
counter-sunk filler caps or damaged gaskets. Due to the water affinity of E-10 a phase
separated fuel influencing the operation of the engine is likely.
– Issue 6 : Sparking at refuelling (RPN 180)
Risk: The potential risk consists of the fact that due to the assumed smaller danger
of the sparking with E-10 the pilots probably abstain from electrical grounding during
refuelling despite existing regulations. In consequence the danger of sparking is higher
than by fuelling MOGAS.
– Issue 14: Higher vapour pressure due to mixing of different fuels (Avgas and Exx)
(RPN 378)
Risk: Due to non-linear mixing effects the vapour pressure of a mixture of E-10 and
a non-alcohol-admixed gasoline may surpass that of any single mixture component,
leading to a reduced boiling point of the fuel. This can induce an unexpected vapour
lock at usual operational temperatures.
– Issue 17: Deposits at the tank bottom may get rinsed out (RPN 168)
Risk: Due to the increased solvent characteristics of E-10 a potential danger consists in
material deposits at the tank bottom that could be rinsed out and contaminate the fuel
system. In further consequence it may result in blocking fuel filters.
59

– Issue 32: Incompatibility of covering material and lacquering of skin of wing/body of
aircrafts (RPN 112)
Risk: During the refuelling procedure a decomposition of material coverings or lacquer
may be induced by overflowing E-10 fuel. This can lead to aircraft strength problems.
– Issue 34: Increased fuel consumption (RPN 192)
Risk: Due to the smaller energy content of E-10 or because of inappropriate ignition
timing an increased fuel consumption may be observed which consequentially leads to
a reduced range of the aircraft.
– Issue 35: Carburettor icing (RPN 216, see above)
• Enforcement of operational / maintenance procedures
– Issue 1: Storage of fuel within tank top after production (RPN 108)
Risk: The potential risk is to insert water during storage caused by potentially lacking
operational management. Due to the chemical affinity of E-10 to water this could lead
to a phase separated fuel that could influence the operation of the aircraft.
– Issue 2: Mixing fuel products during filling the tank top (RPN 108)
Risk: The potential risk is to mix different fuels in tank tops caused by human failures,
especially at older tank tops that are not equipped with modern detection methods and
do not comply with quality assurance processes.
• Recommended regulatory action
– Issue 8: Cross-section diminution in fuel pipes (RPN 378)
Risk: By the characteristics respectively the consequences of phase separated E-10
fuel, perhaps the danger of inward expanding rubber pipes exists, which can lead to
a cross-section contraction and in further consequence to an influence of the engine
operation.
– Issue 9: Leakages within the fuel system (RPN 160)
Risk: Probably the solvent characteristics of E-10 lead to decomposition of the base
material, which could result in fuel system leakages and in further consequence to a
potential fire risk.
– Issue 15: Insufficient pre-heating of the intake air (RPN 189)
Risk: Due to the increased evaporation enthalpy of E-10 a too low intake air temperature
may be encountered, which could result in carburettor icing and consequentially lead to
an engine shut down.
– Issue 18: Incompatibility of composite material (CFK/GFK) (RPN 168, see above)
– Issue 19: Embrittlement of fuselage tanks made of blown PE-HD or PE-LD (RPN 168,
see above)
– Issue 20: Swelling of NBR rubber material used for tanks (RPN 126, see above)
– Issue 21: Difficult draining at NBR tanks (RPN 240, see above)
– Issue 22: Damage of tank interior coatings (RPN 216)
Risk: The solvent characteristics of E-10 in connection with mechanical load may
induce a damage of the tank interior coatings. This could lead to a decomposition of
the base material up to structural disruptions especially for GFK integral tanks.
– Issue 23: Decomposition of the tank sealing material (RPN 192, see above) Issue 24:
Chemical influence on the tank ventilation (aluminum, plastic or steel pipe placed into
the air flow) (RPN 192, see above)
60

– Issue 25: Chemical influence on filler caps including sealing (e.g. NBR gasket, NBR
O-rings, cork gasket, Viton) (RPN 120, see above)
– Issue 26: Chemical influence on fuel filler neck (NBR rubber material) (RPN 126, see
above)
– Issue 27: Chemical influence on hoses and pipes (PTFE, NBR, Viton, BR, CR-
Chloropren rubber) (RPN 378, see above)
– Issue 28: Chemical influence on electrical fuel pumps and check valves (RPN 160, see
above)
– Issue 29: Chemical influence on sealing materials (O-rings, cork, paper, metal, copper,
aluminium, ...) (RPN 200, see above)
– Issue 33: Influence on the operational behavior of the engine (RPN 392, see above)
– Issue 42: Chemical influence on sealing materials (e.g. NBR gasket, NBR O-rings, cork
gasket, Viton) within oil and fuel system (RPN 225, see above) Issue 43: Incompatibility
of rubber pipes (RPN 192, see above) Issue 44: Incompatibility of aluminum, steel,
copper pipes (RPN 224, see above)
– Issue 47: Incompatibility of carburettor (RPN 240)
Risk: By corrosion (and/or surface corrosion) and rinsed out deposits (due to solvent
properties of E-10) filters can be blocked. Base material decomposition, embrittlement
and/or swelling lead to leakages. In particular, leakages at the diaphragm or at the float
needle valve may cause a malfunctioning of the carburettor.
– Issue 51: Incompatibility of (carburettor) rubber flanges (RPN 126, see above)
– Issue 52: Incompatibility of intake manifold (RPN 210, see above)
– Issue 55: Incompatibility of fuel injectors (RPN 280, see above)
– Issue 56: Incompatibility of fuel rails (RPN 240, see above)
– Issue 57: Incompatibility of fuel pressure regulator (RPN 168, see above)
– Issue 58: Incompatibility of quantity distributor (RPN 144, see above)
– Issue 59: Incompatibility of diaphragm (carburettor, pressure regulator, ...) (RPN 168,
see above)
– Issue 60: Incompatibility of sensors (RPN 140, see above)
6.1.3 FMEA Conclusions
The FMEA has lead to a reassessment of the importance and fault potential of the gasoline delivery
path. While the logistics of established distribution paths from refineries to individual gasoline
stations seem mostly uncritical the individual, unreflected handling of the comparatively small
amounts of gasoline needed for aircraft operation creates new threats when using ethanol-admixed
fuels. Due to the altered properties of the new ethanol-admixed gasolines a differentiated view
is required on potential non-conforming individual handling procedures, caused by lack of threat
awareness.
The associated individual threats (phase separation, vapour locking, icing, material compatibility)
were confirmed on the parts and functional levels by an expert group. The span of risks covers the
range of “just a nuisance” to “deadly dangerous if not adequately and pro-actively handled”.
61

For the major threats a clustering of recommendations for a further treatment of the identified issues
has been given. Some issues should be resolvable by raising public and professional awareness by
respectively launched information campaigns after creating appropriate sets of information material.
Additional authority actions are recommended especially for the field of the compatibility of the
aircraft’s constructive materials. A general reassessment of fuel compatibility is suggested for all
materials potentially coming into contact with new ethanol-admixed gasoline types. This process
may be alleviated if respective choices of materials are backed by comparable choices in the
automotive industry but should in general be mandatory.
The physico-chemical property changes of ethanol-admixed gasolines relative to former
hydrocarbon-only types are rather intricate in the special light of usage in aircraft. Therefore
not all experiences gathered from vehicle usage can be transferred to aviation. Accordingly, new
research activities have been identified that should pinpoint qualitatively known threats in a more
quantitative manner.
62
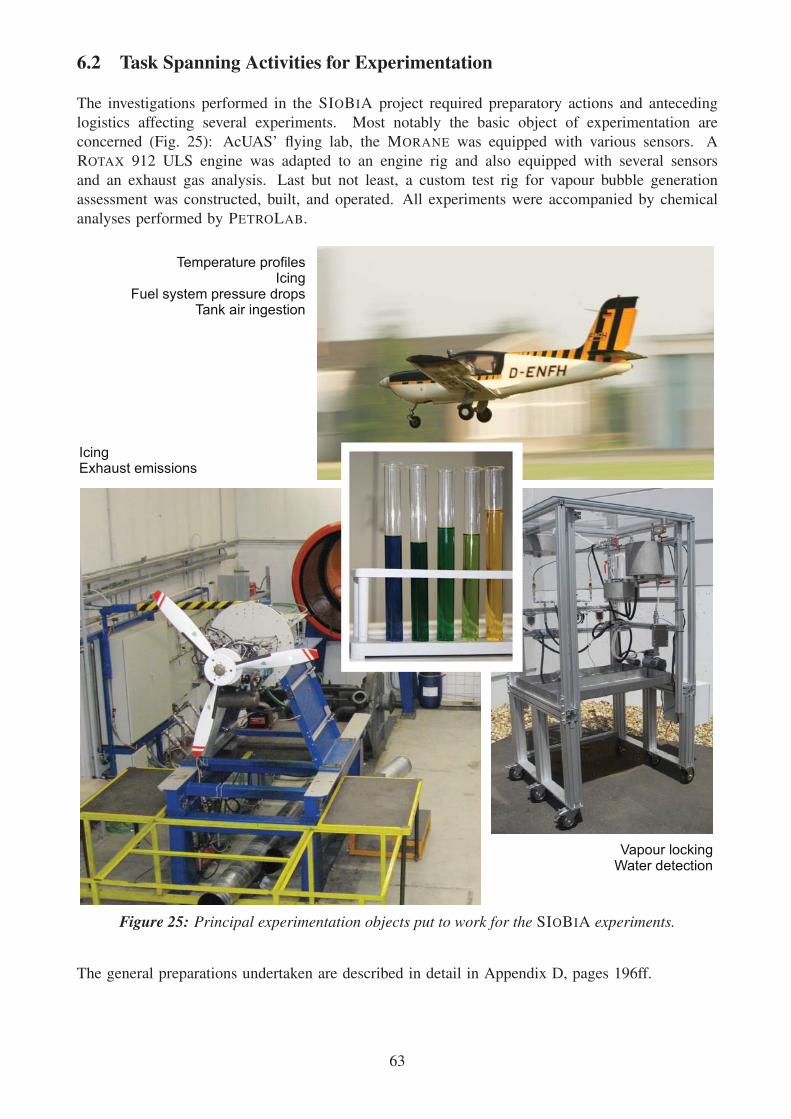
6.2 Task Spanning Activities for Experimentation
The investigations performed in the SIOBIA project required preparatory actions and anteceding
logistics affecting several experiments. Most notably the basic object of experimentation are
concerned (Fig. 25): AcUAS’ flying lab, the MORANE was equipped with various sensors. A
ROTAX 912 ULS engine was adapted to an engine rig and also equipped with several sensors
and an exhaust gas analysis. Last but not least, a custom test rig for vapour bubble generation
assessment was constructed, built, and operated. All experiments were accompanied by chemical
analyses performed by PETROLAB.
������������������� ��
����������������������������������������
� �����������������
�������� ������������� ���
Figure 25: Principal experimentation objects put to work for the SIOBIA experiments.
The general preparations undertaken are described in detail in Appendix D, pages 196ff.
63

6.3 Analysis of Phase Separation Hazard (T 2a, 2c)
6.3.1 Methodology and Approach
The threat of a gasoline phase separation, even though always based on the presence of water in
the fuel, is a multi-facetted one. As long as the water content is not surpassing certain limits it is
tolerable. The limit depends on several boundary conditions that are investigated with respect to
their importance in several experiments, each of them highlighting a single of those facettes.
If an aircraft ascends to its service ceiling the fuel becomes cold. As shown in Sect. 5.1 the water
carrying ability is strongly dependent on the fuel temperature. Therefore the cool-down effect is
experimentally investigated in a flight experiment (Sect. 6.3.2).
Even if at the start of a flight there is not enough water in the tank to cause a phase separation the
aircraft might collect additional liquid water during the mission if it is flown through condensing
water vapour, i.e. fog, clouds, or rain. It may even, when climbing down from a cold service
height, condense water vapour out of the ingested tank air into the fuel. Therefore a throughput
measurement has been performed (Sect. 6.3.3).
If an aircraft is put away for a prolonged time the usual habit is to fill its tanks to prevent corrosion.
As ethanol-admixed gasoline is at least slightly hygroscopic this may lead to a slow but steady
intake of environmental water and lead to raised solved water contents that only appear at a tank
cool-down, or to an actual incident of phase separation even before the start. The composition
change for differently stored tanks is therefore investigated in Sect. 6.3.4.
6.3.2 High-Altitude Flight Experiments for Cool-Down Experiments Boundary ConditionsDetermination (T 2a)
The cool-down experiment performed withe AcUAS’s MORANE aims at a quantitative determina-
tion of the amount of heat drained from the fuel tanks into the atmosphere during a flight as long
as possible under coldest conditions, at the same time striving for the largest possible temperature
gradient between hot airfield and cold service condition.
The monitoring instrumentation (see section D.2, page 200) is used for the assessment of this
purpose again. The respective flight test card (fig. 26) describes the foreseen operation.
The desired boundary conditions should ensure that the fuel in the tank experiences the largest
possible cool-out during a flight mission. Therefore the aircraft is parked on the apron in the bright
sunlight of a warmest possible day for some hours before the mission itself is flown. Fig. 27 shows
the temperature development during this flight for the sensors positioned at the tank surface.
The temperatures measured at the bottom and the side of the tank (see sensor positions, Fig. 90)
always are in good agreement until about the start of the descent. In the beginning until about
4000 sec they are well above the ambient tropospheric temperature derived from the standard
temperature vs. elevation model. During the stay at service ceiling (4000 sec to about 5800 sec)
the tank surface temperatures approach the ambient conditions but do not completely equilibrate.
It is assumed that this effect is caused by the rather low exposition of the MORANE’s tank to
the surrounding air, opposite e.g. to aircraft equipped with wet wings. The thermo-element at the
lower side of the tank exhibits a different behaviour. Up to 2400 sec its temperature readout is
very much the same as that of the other sensors. After this time it separates and remains clearly
above the others. Apart from the period 2400 to 3800 sec (see below) the cool-out follows its own
64
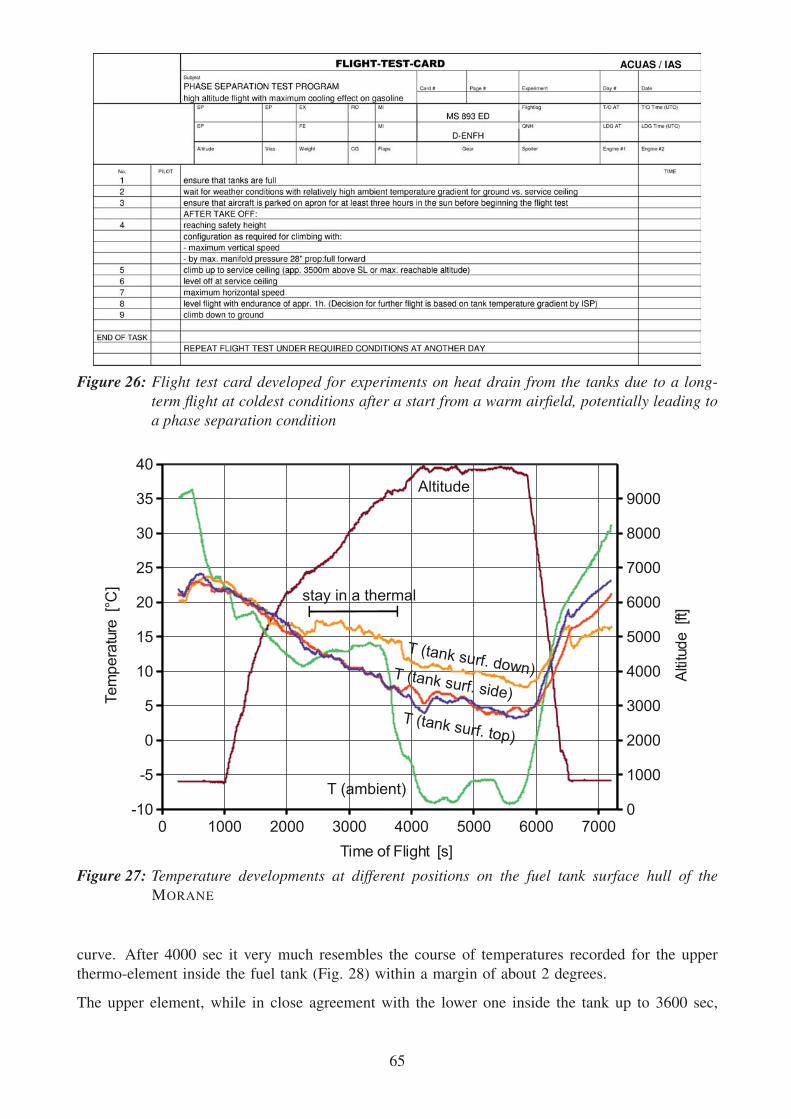
Figure 26: Flight test card developed for experiments on heat drain from the tanks due to a long-term flight at coldest conditions after a start from a warm airfield, potentially leading toa phase separation condition
� ���� ���� ���� ���� ���� ���� �����
�
�
�
��
��
��
��
��
��
��
�
����
����
����
����
����
����
���
����
����
������������������
��������� ����� �
!�����"�������
�#��$��%�&
!�����"�
�#��%'�����(����&
�#��%'�����(�"�)%& �#��%'�����(���"�&
���*��%����������
Figure 27: Temperature developments at different positions on the fuel tank surface hull of theMORANE
curve. After 4000 sec it very much resembles the course of temperatures recorded for the upper
thermo-element inside the fuel tank (Fig. 28) within a margin of about 2 degrees.
The upper element, while in close agreement with the lower one inside the tank up to 3600 sec,
65

� ���� ���� ���� ���� ���� ���� �����
�
�
�
��
��
��
��
��
��
��
�
����
����
����
����
����
����
���
����
����
������������������
��������� ����� �
!�����"�������
�#��%'��%��"�����&
�#��%'��%��"��"�)%&
�#��$��%�&
!�����"�
���*��%����������
Figure 28: Temperature developments at different positions inside the fuel tank of the MORANE
separates for the later stage of the flight and drops below the latter’s readout until some time point
during the descent. This effect may well be interpreted as the upper thermo element surfacing for
the state of being immersed in fuel up to about 3600 sec. Starting at that time it experiences no
longer the warmth of the remaining fuel but mainly the temperature of the air slowly passing the
fuel tank by its venting system.
During the descent the MORANE enters consecutively warmer atmospheric strata. Accordingly
the relative temperature readouts of the two inner thermocouples change to the opposite direction,
starting at the crossover point at about 6200 sec. While the lower thermocouple, still immersed in
liquid fuel, heats up only slowly even when the aircraft is already on the ground the upper air-borne
thermocouple inside the tanks shows a distinct temperature peak while ingesting the warm air at
the airfield, before dropping again to a heat-up curve comparable to the lower thermocouple, but at
an about two degrees higher level.
The ambient temperature given in the two diagrams is measured at the wing, hence far away from
the engine. It shows that the aircraft stayed in a thermal for a while (2400 sec to 3800 sec) to
support its ascend to service ceiling. Accordingly the other temperature profiles are affected as
well. There is no decisive explanation, though, why this effect is predominantly visible in the
temperature data taken for “fuel tank surface down”.
6.3.3 Tank Air Throughput During a Flight (T 2a)
The humidity in an aircraft tank may stem from different sources. Both the water already present
at the start of an aircraft and that picked up during the flight by condensation of atmospheric
humidity may contribute. As the temperature of the fuel, the temperature of the air, the humidity of
the air (clear air, clouds), the pressure depending on altitude and the fill grade of the tank change
66
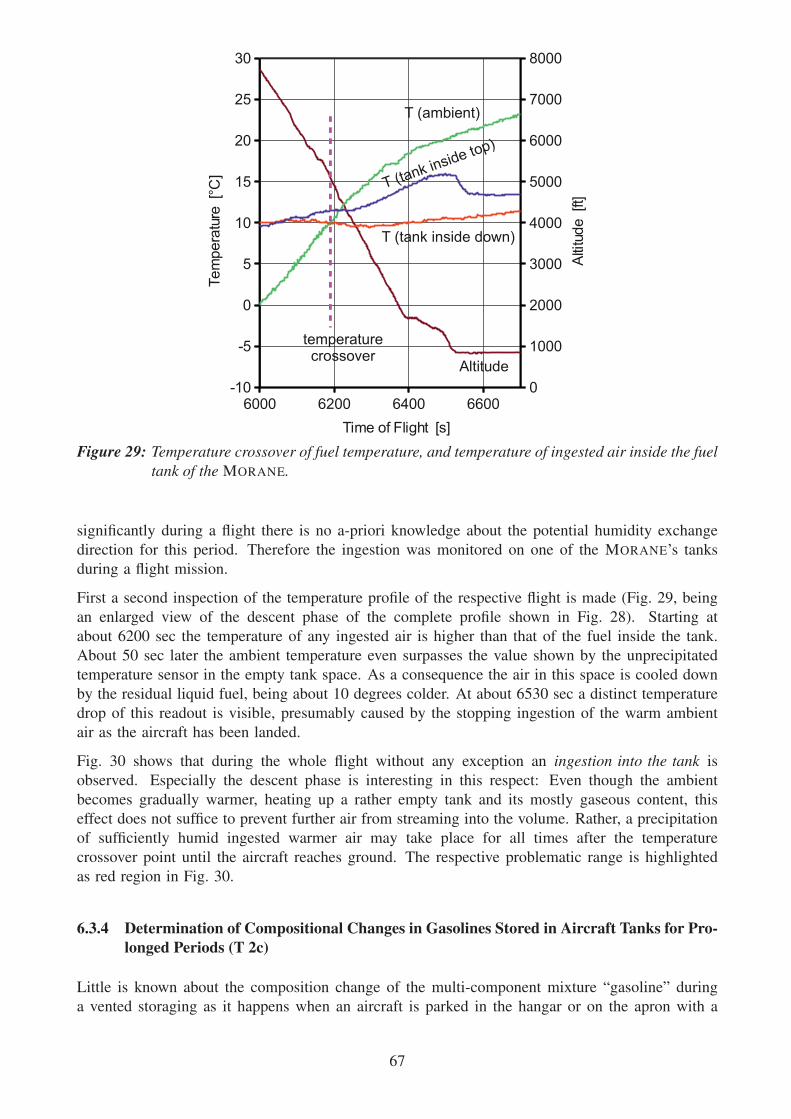
���� ���� ���� ������
�
�
�
��
��
��
��
��
�
����
����
����
����
����
����
���
����
������������������
��������� ����� �
!�����"�������
!�����"�
�#��$��%�&
�#��%'
��%��"��
���&
�#��%'��%��"��"�)%&
������������+�����,��
Figure 29: Temperature crossover of fuel temperature, and temperature of ingested air inside the fueltank of the MORANE.
significantly during a flight there is no a-priori knowledge about the potential humidity exchange
direction for this period. Therefore the ingestion was monitored on one of the MORANE’s tanks
during a flight mission.
First a second inspection of the temperature profile of the respective flight is made (Fig. 29, being
an enlarged view of the descent phase of the complete profile shown in Fig. 28). Starting at
about 6200 sec the temperature of any ingested air is higher than that of the fuel inside the tank.
About 50 sec later the ambient temperature even surpasses the value shown by the unprecipitated
temperature sensor in the empty tank space. As a consequence the air in this space is cooled down
by the residual liquid fuel, being about 10 degrees colder. At about 6530 sec a distinct temperature
drop of this readout is visible, presumably caused by the stopping ingestion of the warm ambient
air as the aircraft has been landed.
Fig. 30 shows that during the whole flight without any exception an ingestion into the tank is
observed. Especially the descent phase is interesting in this respect: Even though the ambient
becomes gradually warmer, heating up a rather empty tank and its mostly gaseous content, this
effect does not suffice to prevent further air from streaming into the volume. Rather, a precipitation
of sufficiently humid ingested warmer air may take place for all times after the temperature
crossover point until the aircraft reaches ground. The respective problematic range is highlighted
as red region in Fig. 30.
6.3.4 Determination of Compositional Changes in Gasolines Stored in Aircraft Tanks for Pro-longed Periods (T 2c)
Little is known about the composition change of the multi-component mixture “gasoline” during
a vented storaging as it happens when an aircraft is parked in the hangar or on the apron with a
67

Figure 30: Air ingestion by tank ventilation, measured during a long-distance flight in one ofMORANE’s tank venting inlets. A positive value of the difference pressure indicates aflow into the tank. Humidity absorption endangered interval is painted red. For discus-sion see text.
filled fuel tank. Even in the mineral oil industry such investigations are not usual as the handling
procedures aim at relatively fast consumption of always freshly produced fuel.
With respect to ethanol admixed fuels several possible additional effects may happen:
• The hygroscopic behaviour of the ethanol content may draw in humidity from the air vented
into the tank by temperature changes.
• The relatively low vapour pressure of the pure ethanol may lead to an increase of its share
in the mixture due to an evaporation of the lighter gasoline components, or, on the contrary,
• the non-Raoultian behaviour of the sparse ethanol molecules in the gasoline environment
may lead to their purge-out from the solution, resulting in decrease of the ethanol content.
To gain information on this process rather relevant for the General Aviation fleet an experimental
long-time storaging is performed. In cooperation with Gomolzig Flugzeug und Maschinenbau
GmbH, Schwelm, custom example tanks are fabricated exhibiting a surface/volume ratio comparable
to the usual tanks encountered in smaller aircraft (fig. 31).
These tanks, sized approx. 30 l each, are filled and stored with Gomolzig in different ways, with
the severest possible imposed change in mind. As the tank venting is supposed to be predominantly
responsible for the composition change effect all tanks are filled to about 50 % of their volumes.
The following table summarizes the boundary conditions:
68

Figure 31: Custom made aircraft wing tank simulation vessels with comparative volume/surface ra-tio, used for long-term storaging experiments. Tanks were donated and stored by Go-molzig Flugzeug und Maschinenbau GmbH, Schwelm. Shown are the three exposed tanksstored on the roof.
protected storage in hangar stored on building roof
black finish bright finish
E-10 E-10 E-10
E-0 E-0
Tanks have been filled and positioned at their locations on July, 8th 2009. Until the due date of
this report (the storage experiment is continued beyond) three weighings of contents have taken
place. The results are shown in Fig. 32.
Clearly, the storage inside the hangar results in the least loss of weight. Here the difference
between E-0 and E-10 gasoline is negligible. The picture changes significantly for the tanks
stored on the building roof that are exposed to the usual changing temperatures, bright sunlight,
precipitation, etc. . Here the bright tank filled with E-10 is the least influenced, in good agreement
with the assumption that imposed temperature changes should play the main role with respect to
69

�������� �������� �������� �������� ���������
��
�
��
�
���
���� �� ����� ���
��� �� ����� ���
�������� ����� ���
������� ���������
�������� ��������
������ ����������� ��
��� ����� ���� ���!�����"#$
Figure 32: Normalized residual gasoline masses observed for the different storage tanks.
evaporation losses. After the storage period the black E-10 filled tank has lost much more of its
former content.
In direct comparison of identical outside storage conditions the E-0 proves to be less volatile than
the custom mixed E-10 gasoline. It should be kept in mind, though, that the custom mixing itself
may have caused the volatility increase, as the non-adapted gasoline basestock (see Sect. 5.2) may
have contributed to the effect.
Probes of the various stored gasolines, taken at intervals during the storage period were analyzed
by PETROLAB, Speyer, with respect to their compositional changes. The following tests were
performed:
• density at 15 ◦C, according to EN ISO 12185
• sulphur content, according to EN ISO 20884
• bromium no., according to DIN 51774-1
• water content, according to EN ISO 12937
• distillation curve, according to ISO 3405
• composition by gas chromatography, according to DIN 51413 (aromats) and EN 1601
(oxygenates)
As a general observation no dramatic and indicative general compositional changes depending
on ethanol content could be observed in this comparison. Slight changes in the evaporation
characteristic and the densities are observed but vary inconclusively with storage manner and
basic composition. A very slight tendency of the evaporation onset to higher temperatures with
70
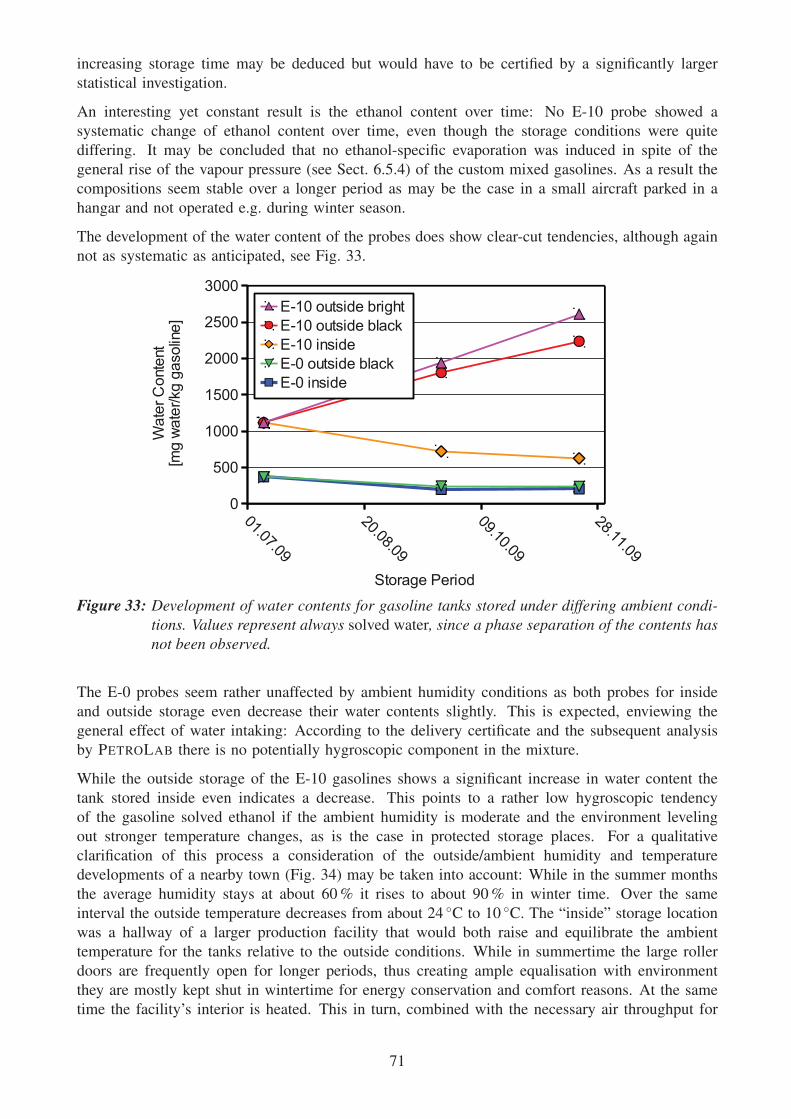
increasing storage time may be deduced but would have to be certified by a significantly larger
statistical investigation.
An interesting yet constant result is the ethanol content over time: No E-10 probe showed a
systematic change of ethanol content over time, even though the storage conditions were quite
differing. It may be concluded that no ethanol-specific evaporation was induced in spite of the
general rise of the vapour pressure (see Sect. 6.5.4) of the custom mixed gasolines. As a result the
compositions seem stable over a longer period as may be the case in a small aircraft parked in a
hangar and not operated e.g. during winter season.
The development of the water content of the probes does show clear-cut tendencies, although again
not as systematic as anticipated, see Fig. 33.
��������
��������
��������
��������
�
���
����
����
����
����
���
���� �'����������'
���� �'����������
����������
��� �'����������
���������
�' ��������� �
��'�
���
�' �
�'
�����
�'�
� ��
���� ���
�!
Figure 33: Development of water contents for gasoline tanks stored under differing ambient condi-tions. Values represent always solved water, since a phase separation of the contents hasnot been observed.
The E-0 probes seem rather unaffected by ambient humidity conditions as both probes for inside
and outside storage even decrease their water contents slightly. This is expected, enviewing the
general effect of water intaking: According to the delivery certificate and the subsequent analysis
by PETROLAB there is no potentially hygroscopic component in the mixture.
While the outside storage of the E-10 gasolines shows a significant increase in water content the
tank stored inside even indicates a decrease. This points to a rather low hygroscopic tendency
of the gasoline solved ethanol if the ambient humidity is moderate and the environment leveling
out stronger temperature changes, as is the case in protected storage places. For a qualitative
clarification of this process a consideration of the outside/ambient humidity and temperature
developments of a nearby town (Fig. 34) may be taken into account: While in the summer months
the average humidity stays at about 60 % it rises to about 90 % in winter time. Over the same
interval the outside temperature decreases from about 24 ◦C to 10 ◦C. The “inside” storage location
was a hallway of a larger production facility that would both raise and equilibrate the ambient
temperature for the tanks relative to the outside conditions. While in summertime the large roller
doors are frequently open for longer periods, thus creating ample equalisation with environment
they are mostly kept shut in wintertime for energy conservation and comfort reasons. At the same
time the facility’s interior is heated. This in turn, combined with the necessary air throughput for
71

Figure 34: Humidity (rel. humidity in %, left) and temperature (in ◦C, right) development for thestorage time period in Dortmund, a town in the vicinity of the storage location in Schwelm.Source: Historic data provided by WETTERONLINE.DE
an active production facility reduces the ambient humidity significantly. It may be assumed that
the relatively low humidity at the storage place is kept about at a more or less constant level of
some 50 % or even less.
Different results have been reported for tanks of boats not operated in winter season. Here phase
separated gasolines have frequently been observed [23] and form even an objective of novel, yet
not very effective, remedy product designs. In comparison to the SIOBIA storage experiment the
tanks of such boats are both unheated and subject to a near to 100 % relative humidity due to their
immediate vicinity to open water.
6.3.5 Onset of Hazing in Custom Mixed Ethanol-Containing Gasolines (T 2a)
If too much water is present in the gasoline used in an aircraft the temperature dependency of
the ternary mixing gap (see Sect. 5.1) may cause a phase separation in the aircraft tank cooling
down. A first sign of immediate danger is the onset of a haze in the fuel, indicating a microscopic
separation of a second water/ethanol phase, still spread out as a suspension in the beginning but
likely to coalesce to a heavier bulk phase which can not be burnt in the engine.
PETROLAB investigated the onset of hazing depending on ethanol content, water content, and
temperature of the fuel. These measurements were carried out for E-0 to E-15 probes with
temperature ranges down to -70 ◦C. Starting at higher temperatures a given probe with a fixed
water content is cooled down until the point of a non-evanescent hazing is reached. This procedure
resembles the practical case of an aircraft performing a high-altitude flight that cools down its fuel
in the wing tanks with an constant amount of previously ingested water.
In parallel a very limited hazing control experiment was carried out by ACUAS. Here the
methodology was chosen differently from the PETROLAB experiment: Thermally equilibrated
probes at 21 ◦C were subject to increasing amounts of admixed water, while again observing the
onset of a non-disappearing hazing. This procedure resembles the practical case of an aircraft
accumulating additional water during a flight at roughly constant temperature, e.g. by tank air
ingestion condensation or intrusion of liquid water through a leaky filler cap.
The results of both experiments are shown both in Fig. 35 in a representation resembling the one
of DGMK (p. 40). The onset of hazing in the water admixture experiment at 21 ◦C is rendered as
unconnected orange symbols for the individual samples (E-0 to E-15) tested. The results of the
cool-down tests are given as series of connected symbols for the different ethanol admixture levels.
72

� ���� ����� ��������
���
���
��
�
�
�� ����� � ��'�����
����� � ��'�����
������ � ��'�����
������ � ��'�����
����������������'�
��'������'��'���� ���'�����! �"���#
$��%&'&'(�)���'�$��*���'������+�#
Figure 35: Onset of phase separation hazing in water admixture (orange symbols, ACUAS measure-ments) and cool-down (connected symbols, PETROLAB measurements) experiments.
First it may be concluded that the independently performed experiments agree surprisingly well
with respect to the reported onset of the phase separation originating hazing. They almost meet
for every ethanol content at the 21 ◦C temperature level. This points to a rather small hysteresis
with respect to the differing separation schemas already discussed in Sect. 5.1. Accordingly, the
same limits may be taken as valid for both lack of potential to absorb additionally ingested water
and the danger of spontaneous disintegration into two phases in case of a temperature drop in an
aircraft tank.
There is a certain discrepancy when comparing the experimental results with those reported in
the literature [28], also shown in Sect. 5.1, p. 40: the DGMK numbers reported for water
bearing are significantly lower. They reach roughly half the values obtained in the SIOBIA
experiments, with deviations from this value over the investigated temperature range. Several
causes for this difference may be sought. First, the base gasoline may be different from the one
taken for the SIOBIA experiments. As there is no otherwise reported systematic survey of base
gasoline composition influence this difference must be regarded as an open question. Second, the
determination procedure reported in [28, p. 38] may not exclude a thermal non-equilibrium, with
a certain gradient in the used test vessels. As the test vessels are cooled down by heat extraction
through their walls the centrally positioned thermometer may not represent the correct readout, and
a hazing near the walls may have been interpreted as an earlier disintegration.
While the AcUAS experiments on water admixture should share the same level of limited precision,
although the constant temperature should rule out a thermal non-equilibrium, the systematic
experiments by PETROLAB were performed in a custom circulatory thermally equilibrated device
with a defined objective readout procedure. Thus potential non-equilibrium effects should have
been ruled out as effectively as possible.
The acquired data allow a joint three-dimensional representation and the derivation of a bended
interpolation plane (Fig. 36). The plane was computed for an assumed functional dependence of
73

�������������
���������� ������
����������������������������
���������������������
Figure 36: Derivation of a three-dimensional approximation plane for the water bearing capabil-ity, taking into account the different ethanol admixture levels and gasoline temperatures.Combined display of PETROLAB (red lines, “+”) and ACUAS (green line, “x”) results,together with derived plane (blue).
the limit water bearing capacity wl(T, xethanol) = c1+ c2(T + c4)+ c3(T + c4)2+ c5(xethanol+ c7)+
c6(xethanol+ c7)2+ c8(T + c4)(xethanol+ c7). If a more detailed cross-correlation of temperature and
ethanol content is assumed by introducing further product terms in T and xethanol the interpolation
would approximate the measurement data even better. Since the scope of the experimentation
was rather limited and does not take into account further potentially important factors as base
fuel composition and tank surface influence the current approximation should not be taken as a
reference for a safety limit setting, though.
6.3.6 Phase Separation: Conclusion (T 2a)
Although the tank of the MORANE is thermally rather insulated, compared e.g. to a wet wing
system, it cools down significantly during a longer flight. Accordingly, there is an actual threat
of phase separation if the gasoline contains a significant amount of water. This water, even if not
already present at the time of start, may enter the fuel tank by its venting opening. This danger
exists despite the fact that low rates of water ingestion are observed in rain conditions, even if the
aircraft traverses clouds or stronger rain. The amount of potential humidity condensation during the
descent phase from cold and dry heights to humid warm air in lower strata should be scrutinized
more thoroughly still. It will depend on the amount of air ingested by the tank venting system, the
specific crossover temperature gap encountered during the last phase of descent, and the humidity
of the air.
A tendency to an accumulation of water even in stronger ethanol-admixed gasolines (E-10) is only
recognizable if the storage container (i.e. filled tank of the aircraft) is left in the open. If it is
parked in a temperature change equilibrating hangar this effect is expected to be strongly reduced.
74

Experimentally determined water bearing capacities are larger than anticipated from former liter-
ature, although no principal clearance can be given, and the issue by itself remains critical. A
phase separation in a water charged gasoline may occur during the cool-down of the tank content
in mid-flight. Here another potential problem may arise, especially in future years, if automotive
gasoline should be used uncritically and without at least an immediate pre-flight water content
control: Since at present there is no normative upper limit of water content for the increasingly
ethanol-admixed gasolines — only the absence of haze is required — some very competitive
vendors may be tempted to deliberately exploit this boundary condition to a point where vehicles
with their almost constant gasoline tank temperature will not experience any obvious disadvantage.
Reported field tests with hydrous E-15 [21], saving the expenses of manufacturing super-azeotropic
ethanol prior to gasoline admixing, already point in this direction. If such a gasoline with relatively
high water content would be taken as aviation fuel the strong cool-down in exposed aircraft
tanks may induce the phase separation effect. Since the absolute temperature dependence of the
water tolerance increases significantly with a rising ethanol content (Fig. 35) this thread will grow
significantly if a “non-disturbing water content” should be exploited commercially.
Consequently, both a static water content assessment of the tank contents of individual aircraft at
the airfield and a monitoring of additional water input during the flight seem sensible to reduce the
phase separation threat in case of ethanol-admixed gasoline usage. The presently available methods
for such a determination are rather discouraging, though, as there is no immediate test procedure
at hand — see Sect. 7.2.
75
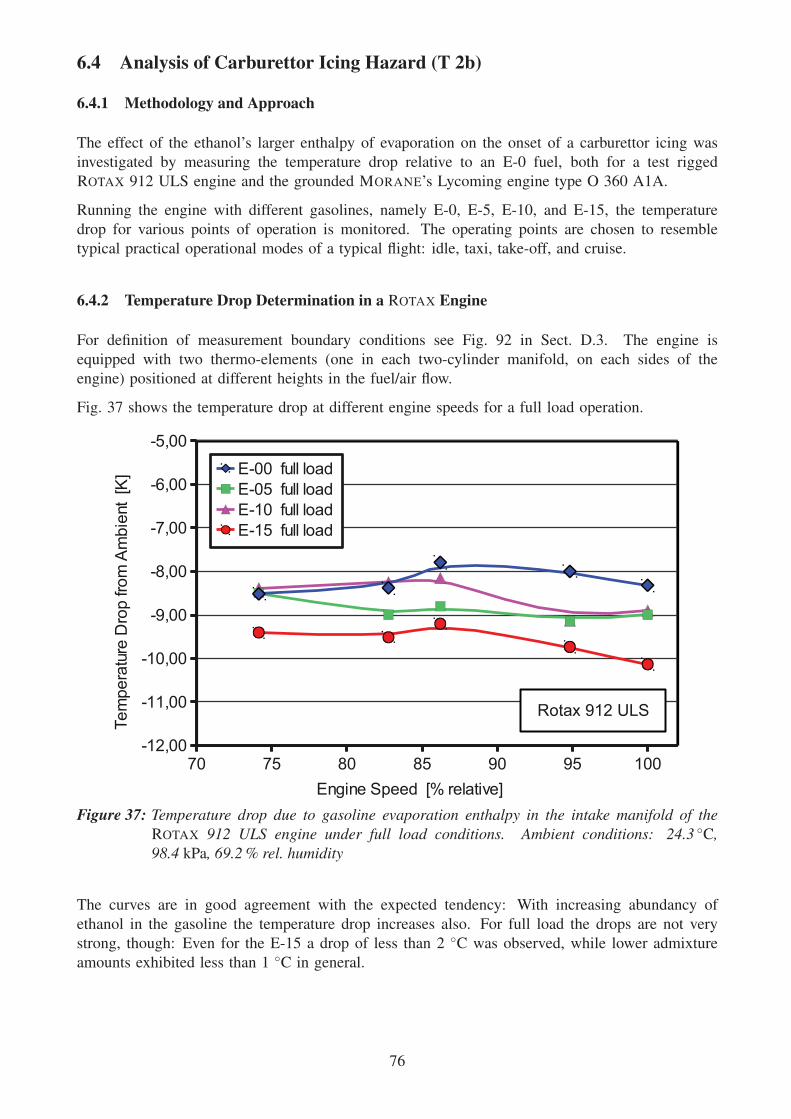
6.4 Analysis of Carburettor Icing Hazard (T 2b)
6.4.1 Methodology and Approach
The effect of the ethanol’s larger enthalpy of evaporation on the onset of a carburettor icing was
investigated by measuring the temperature drop relative to an E-0 fuel, both for a test rigged
ROTAX 912 ULS engine and the grounded MORANE’s Lycoming engine type O 360 A1A.
Running the engine with different gasolines, namely E-0, E-5, E-10, and E-15, the temperature
drop for various points of operation is monitored. The operating points are chosen to resemble
typical practical operational modes of a typical flight: idle, taxi, take-off, and cruise.
6.4.2 Temperature Drop Determination in a ROTAX Engine
For definition of measurement boundary conditions see Fig. 92 in Sect. D.3. The engine is
equipped with two thermo-elements (one in each two-cylinder manifold, on each sides of the
engine) positioned at different heights in the fuel/air flow.
Fig. 37 shows the temperature drop at different engine speeds for a full load operation.
�� �� �� �� �� �� ���������
������
������
�����
�����
�����
����
�����
������ �������
������ �������
������ �������
������ �������
�������������������������
�������� � �� ���������!�"�������#�
$���%�����&'�
Figure 37: Temperature drop due to gasoline evaporation enthalpy in the intake manifold of theROTAX 912 ULS engine under full load conditions. Ambient conditions: 24.3 ◦C,98.4 kPa, 69.2 % rel. humidity
The curves are in good agreement with the expected tendency: With increasing abundancy of
ethanol in the gasoline the temperature drop increases also. For full load the drops are not very
strong, though: Even for the E-15 a drop of less than 2 ◦C was observed, while lower admixture
amounts exhibited less than 1 ◦C in general.
76
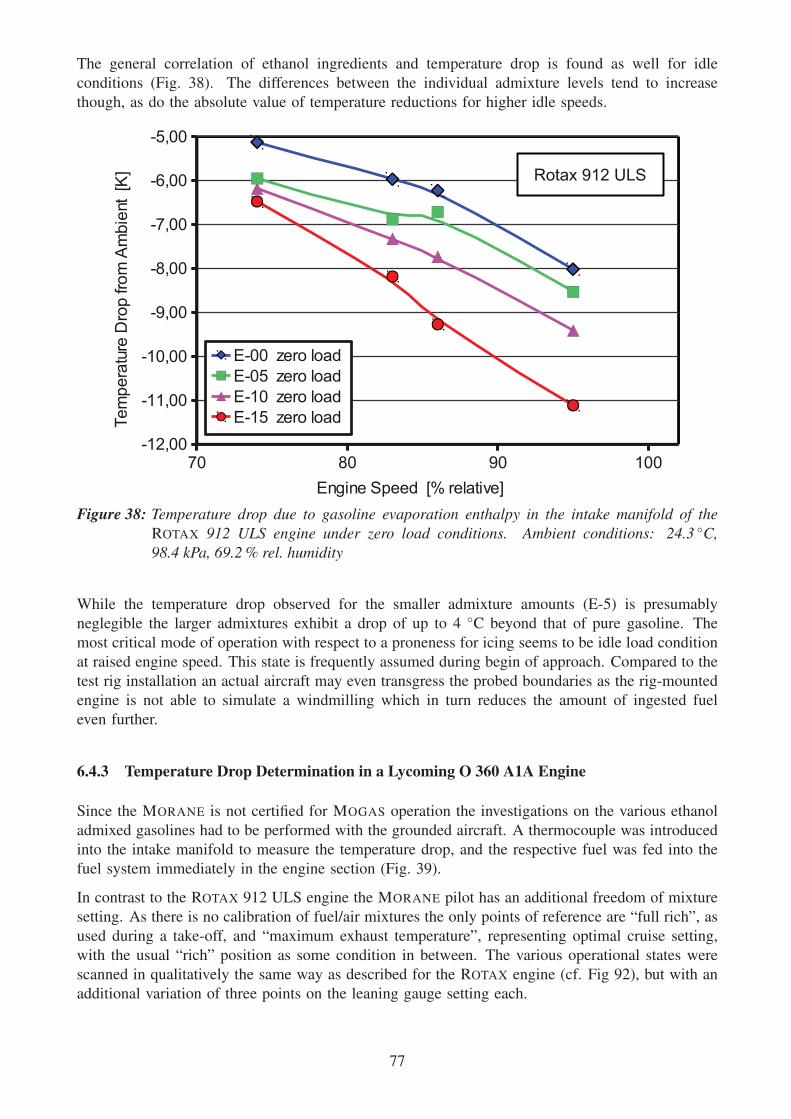
The general correlation of ethanol ingredients and temperature drop is found as well for idle
conditions (Fig. 38). The differences between the individual admixture levels tend to increase
though, as do the absolute value of temperature reductions for higher idle speeds.
�� �� �� ���������
������
������
�����
�����
�����
����
�����
�����(��������
�����(��������
�����(��������
�����(��������
�������������������������
�������� � �� ���������!�"�������#� $���%�����&'�
Figure 38: Temperature drop due to gasoline evaporation enthalpy in the intake manifold of theROTAX 912 ULS engine under zero load conditions. Ambient conditions: 24.3 ◦C,98.4 kPa, 69.2 % rel. humidity
While the temperature drop observed for the smaller admixture amounts (E-5) is presumably
neglegible the larger admixtures exhibit a drop of up to 4 ◦C beyond that of pure gasoline. The
most critical mode of operation with respect to a proneness for icing seems to be idle load condition
at raised engine speed. This state is frequently assumed during begin of approach. Compared to the
test rig installation an actual aircraft may even transgress the probed boundaries as the rig-mounted
engine is not able to simulate a windmilling which in turn reduces the amount of ingested fuel
even further.
6.4.3 Temperature Drop Determination in a Lycoming O 360 A1A Engine
Since the MORANE is not certified for MOGAS operation the investigations on the various ethanol
admixed gasolines had to be performed with the grounded aircraft. A thermocouple was introduced
into the intake manifold to measure the temperature drop, and the respective fuel was fed into the
fuel system immediately in the engine section (Fig. 39).
In contrast to the ROTAX 912 ULS engine the MORANE pilot has an additional freedom of mixture
setting. As there is no calibration of fuel/air mixtures the only points of reference are “full rich”, as
used during a take-off, and “maximum exhaust temperature”, representing optimal cruise setting,
with the usual “rich” position as some condition in between. The various operational states were
scanned in qualitatively the same way as described for the ROTAX engine (cf. Fig 92), but with an
additional variation of three points on the leaning gauge setting each.
77

Figure 39: Morane icing test setup for operation with ethanol admixed fuels. The different gasolinecompositions are taken from respective auxiliary tanks (red, left). They are fed by a by-pass hose directly into the carburettor feed line. The aircraft is tied down to the groundwith a strong rammed-in pole that is capable of supporting the full-power thrust of theengine.
Presumably due to the additional freedom of mixture definition by the pilot and its differing
absolute effects on the different load states the overall picture of influence is not so clear-cut as
with the ROTAX engine with its self-adapting air-fuel ratio settings. Nevertheless there is a clear
effect of icing tendency if the monitored temperature readouts for possible air-fuel ratio settings
are compared at fixed intake manifold pressure levels for a given engine speed, as shown in Fig 40.
While the effect of a 5 % ethanol admixture in comparison to the approximately ethanol-free
MOGAS is only marginal there is a distinct effect of higher admixture levels on the temperature
drop. Both 10 % and 15 % admixtures create an additional drop of several degrees throughout,
with their respective results quite near to each other but in the expected order. Similar results
were obtained for direct injection engines operated with non-stoichiometric mixture compositions:
Kar [20] reports disproportionate in-cylinder temperature drops especially for rich mixtures. As a
potential cause high-temperature azeotropes of gasoline components and alcohols are suspected.
Always the richer compositions show a larger temperature drop effect which creates a remarkable
effect on its dangerousness for aircraft operation: If the habitual modes of operation during a flight
are envisioned the pilot usually approaches its destination still in cruise setting, so remaining on
the EGT-max setting for some while. In the final stages of the descent the mixture gauge is reset
to “full rich” in order to be able to obtain the full thrust if a critical situation should occur during
78

������� �� ���������
���
���
���
���
��
��
��
��
������
��
�����
�� �
�!�"
��#�"
��$
���
%
&���'�()*��+�����
������� �� ���������
���
���
���
���
��
��
��
��
������
���
����
�� �
�!�"
��#�"
��$
���
%
&���'�()*��+�����
������� �� ���������
���
���
���
���
��
��
��
��
����
���+
����
���+
������
��
�����
�� �
�!�"
��#�"
��$
���
%
&���'�()*��+�����
������� �� ���������
���
���
���
���
��
��
��
��
������
���
����
�� �
�!�"
��#�"
��$
���
%
&���'�()*��+�����
Figure 40: Temperature drop due to gasoline evaporation enthalpy in the intake manifold of theMORANE’s Lycoming engine type O 360 A1A for various load conditions. The threestates of air/fuel mixture settings can only be defined qualitatively and are likely to differfor the different admixture types due to slightly differing stoichiometric mass balances.
touch-down. At the same time the aircraft traverses the typically more humid lower strata of the
atmosphere, thus being subject to additional water input into the intake manifold. At the same time
the heat output of the engine is reduced due to its low power output during this phase of approach.
All these partial effects may collaborate and lead to a sudden occurrence of a carburettor icing in
the most critical stage of the flight, obstructing the possibility of requesting a sudden larger power
output from the engine if required, e.g. for a touch-and-go operation.
6.4.4 Icing: Conclusions
The absolute value of the measured temperature drops are significant for all gasoline types,
including E-0, and confirm the well-known general threat of carburettor icing. Additional effects of
ethanol admixture appear insignificant for up to 5 % (v/v) ethanol, but become decisively stronger
79

for larger admixtures. As the practical implications on the individual aircraft’s operation strongly
depend on further factors, like the fuel system and the engine integration design into the cell,
it is near to impossible to define a limiting value for an ethanol admixture on a general basis.
If a given aircraft has had any tendency to show an icing effect in the past when operated on
AVGAS or MOGAS an urgent recommendation is given to install, or increase the power of, an air
preheater to reduce the probability of icing prior to any try to operate on ethanol-admixed fuels.
Here certification specifications CS-23 (especially the Induction System chapters — CS 23.1093
Induction System Icing protection and following paras CS 23.1095, CS 23.1097, CS 23.1099, CS
23.1101) should be revisited as a basis for design rules: If the aircraft is already equipped with a
preheater its power should be increased at least by the factor that is numerically derived from the
increased enthalpy of evaporation of the maximally ethanol-admixed gasoline to be used. Due to
the fact that the effect to be expected is not a linearly superimposing one (cf. Sect. 5.3) the exact
amount of additional heat required is still a matter of scientific investigation and can not be sharply
defined yet. If the cited results are take as a basis the preheater power output shoudl be increase
by a third of its original one.
If the icing prevention is attained by another method than a defined preheating additional tests
will have to be made on the effectivity of this method on behalf of the additional heat demand in
ethanol-admixed operation.
Even if an aircraft never has experienced icing and has been checked for further CS-23 compliance
additional testing for the usage of ethanol admixed types should start with low admixture levels
and only after due time advance to higher levels if no adverse icing effect has been noticed in the
field.
6.5 Analysis of Intensified Vapour Locking Hazard Caused by Gasoline Mix-ing
As detailed in Sect. 5.2 a mixing of differently ethanol-admixed gasolines may result in an increased
vapour pressure which in turn increases the danger of vapour-locking in general. Whether a certain
aircraft is prone to be affected depends to a large part on its individual construction, especially
with respect to its fuel system.
Several aspects of engine operation principally contribute to such a threat:
• If the fuel becomes too hot on its way from the tank to the engine bubbles of boiling gasoline
may spontaneously emerge.
• If obstacles (reduced cross sections of fuel leading parts, clogged filters, etc.) impede the
flow respective pressure drops may be imposed leading to local drops of pressure with similar
results.
• Strong vibrations in combination with elevated temperatures may lead to bubble creation by
a mixture of boiling and cavitation effects that have not been subjected to a more intensive
theoretical scientific investigation.
Last but not least it should be kept in mind that the fuel system of a flying aircraft is operated in a
highly unsteady mode: The fuel traverses its components (hoses, filters, switches, pumps, . . .) with
their specific heat transfer interaction surfaces with a certain velocity that limits both the time and
the driving force for heat input.
80

In the actual specific aircraft these various conditions interact in a mostly non-replicable and
abstractable manner. Therefore their effects can only be investigated exemplarically by monitoring
temperature and pressure distributions in well-defined settings. Such experiments are performed
with AcUAS’s MORANE and by the application of a custom-built test rig with well-defined fuel
flows under conditions of reduced ambient pressure. They are discussed in the subsequent sections.
Since no commercial defined E-10 and E-15 brands — that would have shown a reduced vapour
pressure of the fossil basestock — are obtainable during the time of experimentation the admixed
gasolines were created by custom mixing of pure ethanol with the Total Deutschland GmbH
basestock (cf. D.1, p. 196). Due to the lacking consideration of the non-Raoultian vapour pressure
increase relative to the original E-0 fuel this can be regarded as an intentional creation of a
worst-case scenario.
6.5.1 Fuel Heat-Up Experiments with a MORANE MS 893 E-D Aircraft (T 3)
The effect of a heavy load operation with smallest possible cool-down possibilities on the fuel
provision system is studied in an exemplaric manner by flight experiments with ACUAS’s MORANE
MS 893 E-D. The instrumentation for this task is described in full detail in sect. D.2.
The MORANE is put on the apron before the flight for several hours, and the wings parts containing
the fuel tanks are covered with dark cloths to get the temperature up.
The goal of a maximum load condition with minimal cool-down is created by a sequence of
consecutive starts, fast rises, fast descends, landings, and immediate consecutive starts. The aircraft
is freighted to its maximum MTOM weight thus requiring the maximum take-off and climb power
available.
The actual execution of the respective test flights must take the statistical behaviour of the weather
into accout. For the largest effect weather conditions should be as hot as possible. Apart from the
really hot summer of 2006 weather statistics from the last years for the region of Aachen show just
a few really hot days with temperatures exceeding 30 ◦C.
Therefore the flight mission was flown at a summer day at about 28 ◦C ground temperature with
the option to repeat should some higher temperatures be forecasted. In the period available for test
flights no hotter day has been met.
With respect to the vapour lock threat the main observation objective is the gasoline temperature
as it approaches the carburettor. In order to assess the effect of heavy load operation on the
temperature management of the MORANE a respective flight test card was defined (Fig. 41).
The result of this heavy load circuit operation is shown in Fig. 42. Starting at Merzbrück, an
altitude of 3000 feet is repeatedly attained whereupon a steep descent and a landing follows. The
aircraft is taxied to start position and takes off again.
The initially already quite warm gasoline (starting temperature about 31 ◦C due to anteceding
parking on apron) is heating up fast already in the pre-flight check phase. At the time of take-off
the fuel hoses at the electrical pump already show temperatures of 45 to 50 ◦C depending on the
spatial position of the hose. Even though each climb is performed with maximum possible power
the descent phases suffice to keep the hoses (and thereby assumedly the gasoline temperatures) in
the range of 45 to 60 ◦C, depending on the hoses’ position. It is worth noting that usually the
highest temperatures are observed during the taxi operations on ground, not during the maximum
load conditions during the climb. A maximum of slightly more than 60 ◦C is observed. As
81
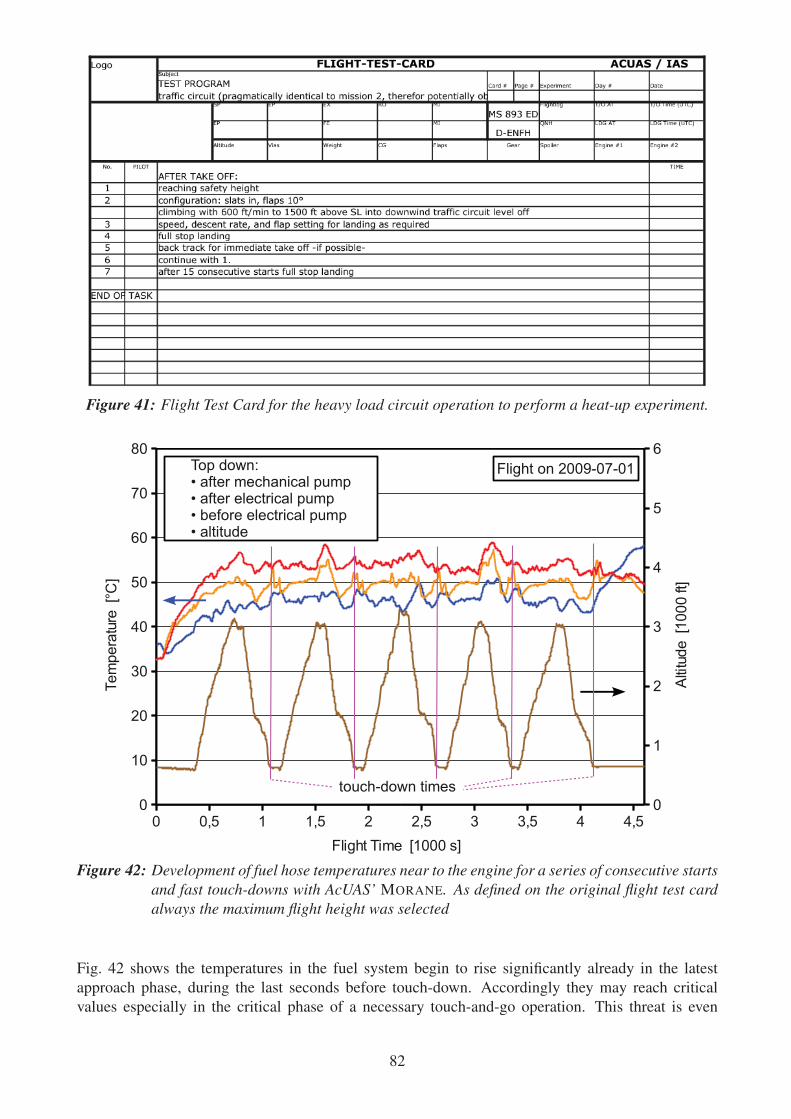
Figure 41: Flight Test Card for the heavy load circuit operation to perform a heat-up experiment.
� �)� " ")� � ��� � ��� � ����
��
��
��
��
��
�
�
��
�
�
�
�
�
�
� �������������������
���������� �������
� ���� ���������)��
�!�� !"#$%��)������&��#�&� �����%��)����� �&���&� �����%�'�)!���� �&���&� �����%�� ���� �
�!�&�( !"#������
� �����!#����)(�(��
Figure 42: Development of fuel hose temperatures near to the engine for a series of consecutive startsand fast touch-downs with AcUAS’ MORANE. As defined on the original flight test cardalways the maximum flight height was selected
Fig. 42 shows the temperatures in the fuel system begin to rise significantly already in the latest
approach phase, during the last seconds before touch-down. Accordingly they may reach critical
values especially in the critical phase of a necessary touch-and-go operation. This threat is even
82
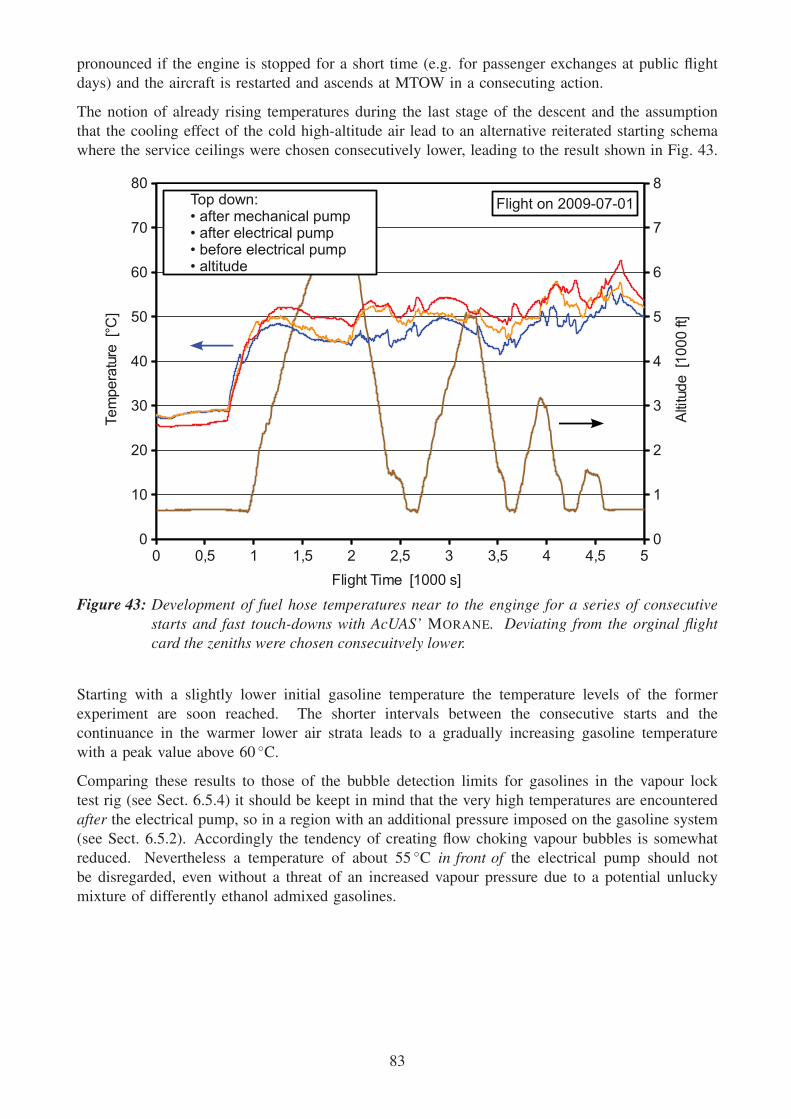
pronounced if the engine is stopped for a short time (e.g. for passenger exchanges at public flight
days) and the aircraft is restarted and ascends at MTOW in a consecuting action.
The notion of already rising temperatures during the last stage of the descent and the assumption
that the cooling effect of the cold high-altitude air lead to an alternative reiterated starting schema
where the service ceilings were chosen consecutively lower, leading to the result shown in Fig. 43.
� ��� � ��� � ��� � ��� � ��� ��
��
��
��
��
��
�
�
��
�
�
�
�
�
�
�
� �������������������
���������� �������
� ���� ���������)��
�!�� !"#$%��)������&��#�&� �����%��)����� �&���&� �����%�'�)!���� �&���&� �����%�� ���� �
� �����!#����)(�(��
Figure 43: Development of fuel hose temperatures near to the enginge for a series of consecutivestarts and fast touch-downs with AcUAS’ MORANE. Deviating from the orginal flightcard the zeniths were chosen consecuitvely lower.
Starting with a slightly lower initial gasoline temperature the temperature levels of the former
experiment are soon reached. The shorter intervals between the consecutive starts and the
continuance in the warmer lower air strata leads to a gradually increasing gasoline temperature
with a peak value above 60 ◦C.
Comparing these results to those of the bubble detection limits for gasolines in the vapour lock
test rig (see Sect. 6.5.4) it should be keept in mind that the very high temperatures are encountered
after the electrical pump, so in a region with an additional pressure imposed on the gasoline system
(see Sect. 6.5.2). Accordingly the tendency of creating flow choking vapour bubbles is somewhat
reduced. Nevertheless a temperature of about 55 ◦C in front of the electrical pump should not
be disregarded, even without a threat of an increased vapour pressure due to a potential unlucky
mixture of differently ethanol admixed gasolines.
83
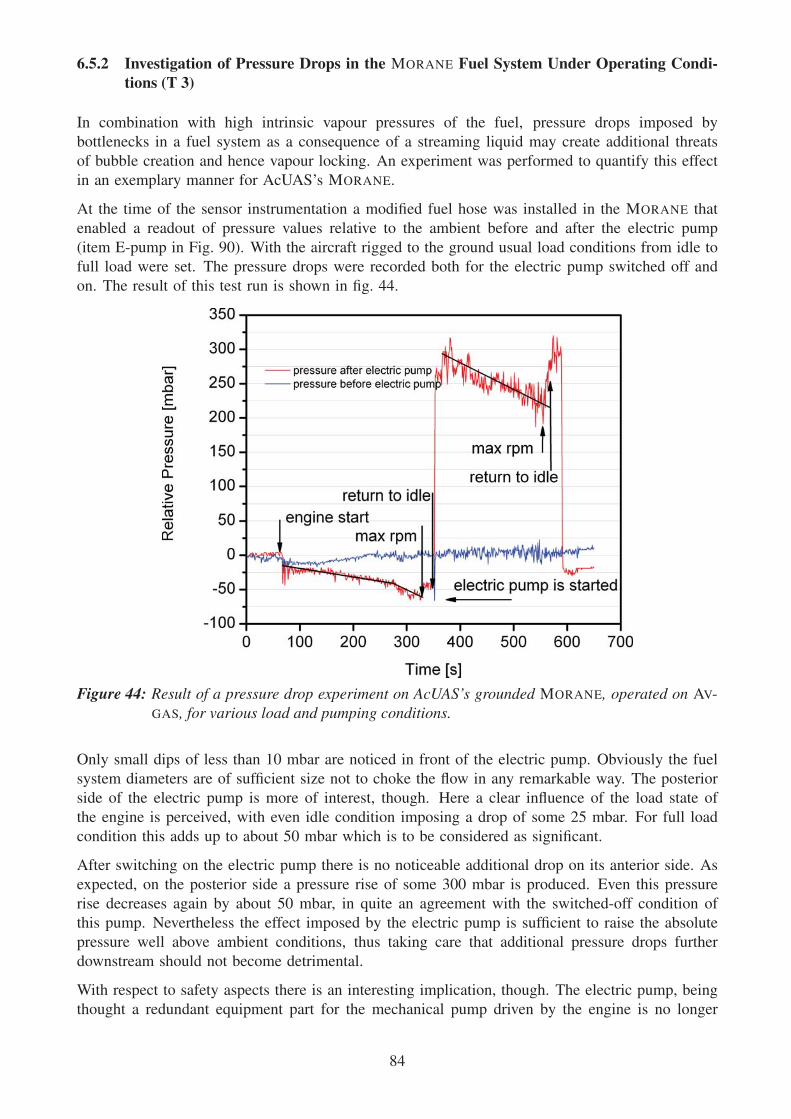
6.5.2 Investigation of Pressure Drops in the MORANE Fuel System Under Operating Condi-tions (T 3)
In combination with high intrinsic vapour pressures of the fuel, pressure drops imposed by
bottlenecks in a fuel system as a consequence of a streaming liquid may create additional threats
of bubble creation and hence vapour locking. An experiment was performed to quantify this effect
in an exemplary manner for AcUAS’s MORANE.
At the time of the sensor instrumentation a modified fuel hose was installed in the MORANE that
enabled a readout of pressure values relative to the ambient before and after the electric pump
(item E-pump in Fig. 90). With the aircraft rigged to the ground usual load conditions from idle to
full load were set. The pressure drops were recorded both for the electric pump switched off and
on. The result of this test run is shown in fig. 44.
Figure 44: Result of a pressure drop experiment on AcUAS’s grounded MORANE, operated on AV-
GAS, for various load and pumping conditions.
Only small dips of less than 10 mbar are noticed in front of the electric pump. Obviously the fuel
system diameters are of sufficient size not to choke the flow in any remarkable way. The posterior
side of the electric pump is more of interest, though. Here a clear influence of the load state of
the engine is perceived, with even idle condition imposing a drop of some 25 mbar. For full load
condition this adds up to about 50 mbar which is to be considered as significant.
After switching on the electric pump there is no noticeable additional drop on its anterior side. As
expected, on the posterior side a pressure rise of some 300 mbar is produced. Even this pressure
rise decreases again by about 50 mbar, in quite an agreement with the switched-off condition of
this pump. Nevertheless the effect imposed by the electric pump is sufficient to raise the absolute
pressure well above ambient conditions, thus taking care that additional pressure drops further
downstream should not become detrimental.
With respect to safety aspects there is an interesting implication, though. The electric pump, being
thought a redundant equipment part for the mechanical pump driven by the engine is no longer
84

one in case of a vapour pressure rise caused by an accidental mixing of ethanol-free and ethanol
containing fuel leading to an elevated vapour pressure value (see section 5.2). If such a mixing
cannot be ruled out — and as a mishap it cannot, as long as AVGAS and ethanol-admixed MOGAS
may be accidentally mixed — an additional electrical shunt pump would be required to provide
the originally intended redundancy for fuel delivery to the carburettor.
6.5.3 Vibration Measurements in the MORANE Fuel System (T 3)
Dynamic pressure drops may be imposed on the liquid fuel by fast moving active parts like
pumps, but also by orifices or vibrating fuel lines. Even though theoretical considerations for
non-equilibrium liquid mixtures like gasoline are somewhat scarce experimental tests of vibration
strengths were performed in some MORANE test flights. The respective instrumentation is shortly
described in sect. D.2.
Since no theoretical evaluation and assessment of vibrational data for multi-component mixtures
could be identified the consecuting data acquisition is reported here for further elucidation.
In the fuel a vibration, i.e. an acceleration of enclosing surfaces, acts as a bubble creating or at
least promoting cause if the velocities of walls, imposing respective accelerations to the adjacent
liquid volumina, become so strong that they tear apart the liquid. A well-known effect is the
ultrasonically induced cavitation in cleaning baths. From basic physical theory it may be expected
that
• for higher frequencies a smaller amplitude is sufficient to induce this effect (hence the choice
of ultrasonic frequencies for the cleaner devices),
• for warmer liquids a lower tensile strength is required to tear the liquid apart.
As a first qualitative implication heated-up parts (e.g. in the engine compartment in front of the
firewall) should not be exposed to too large vibrations, especially so, if the local system pressure
is low at the same time.
The MORANE was equipped with acceleration sensors at the tank and at the electric pump (see
Sect. D.2, page 201). Acceleration values were recorded for different directions. Since there
was only one high temporal resolution data acquisition unit available respective measurements
only could be performed as a sequence. Accordingly, the measurement results reported in the
next figures are not recorded simultaneously but one shortly after the other from the same ascend
interval of the same test flight. Due to changes in engine speed during this ascent the characteristic
resonance frequencies of the individual measurement intervals are not immediately comparable.
An overview of typical frequency domain acceleration measurement results is shown in Fig.45. It
should be minded that the ordinate scaling is logarithmic.
At the tank surface the recorded accelerations are quite high and reach values of up to 18 g (with
g being the unit of the earth’s gravity force). It should be noted, however, that the sensor is placed
on the free surface of the tank, being able to vibrate without much hindrance and to respond
to excitation frequencies coupled into the wing by the cell body. The gasoline in contact with
respective surfaces is relatively cool and becomes even more so during a flight, so a vapour locking
effect is not to be expected. Even if bubbles should be created they would collapse again before
the fuel is ingested into the narrower parts of the fuel system.
85

Figure 45: Vibration frequencies and strengths at various positions of the MORANE fuel system, take-off condition.
Vibrations at the tank outled stud are much smaller than those registered at the free tank surface,
with the general layout of the spectrum quite similar. The governing (resonance) frequencies and
their harmonics are slightly shifted, presumably due to a accordingly shifted engine speed.
Proceeding towards the warmer regions of the fuel system, the vibrations of the electrical fuel
pump as a potential place of an additional pressure drop (see Sect. 6.5.2) are monitored both in
vertical and horizontal direction. Again the acceleration amplitudes are decreasing compared to
the tank recordings. While in vertical direction at least the lower frequencies, mainly representing
the body vibrations of the cell, show amplitudes comparable to the tank stud ones, the horizontal
vibrations are only marginal.
In conclusion it may be stated that in these measurements no extraordinary magnitudes of vibration
have been found. The amplitudes tend to get smaller the nearer the location of the monitored spot
is located towards the engine with its heat input. A in-depth evaluation of the vibration strengths
would require a more detailed basic research of the material properties of the fuel, which is not
yet available.
6.5.4 Vapour Locking Experiments on a Custom Test Rig (T 3)
At the time of the SIOBIA experiments taking place there were no certified commercial gasoline
brands available that would guarantee a fixed ethanol content other than “less than 1 percent”.
Accordingly, the investigators were not able to obtain a respective BOB that would yield commer-
cially compliant ethanol gasolines. The mixtures to be investigated had to be custom-mixed from
a certified winter quality E-0 gasoline provided by Total Deutschland GmbH, and from a stock
supply of 100 % bio-ethanol provided by Crop Energies.
As a consequence it may be expected that the vapour pressures observed in these custom-mixed
gasolines tend to be too high compared to a future commercial respective gasoline type obeying
DIN EN 228. Nevertheless the custom mix can be taken as a conservative guess with respect to
vapour locking threats.
The tendency of creating a vapour lock is investigated with the custom test rig described in
86

Appendix D.4. The imitated fuel system was kept as simple as possible, consisting only of a piece
of fuel hose, an optical port for bubble determination by a straylight sensor, a viewing port for
direct inspection and the system pump representing the suction pump of an aircraft.
Figure 46: Collection of bubble strength images seen through the viewport, relating to respectivesensor readout values. The arrows in the first image show the flow direction
Fig. 46 displays the optical impression of respective bubble sensor signal strengths, given as
electrical voltage readouts that should be interpreted as arbitrary units, though. At 0.1 V only
seldomly a bubble is observed. The gauge glass remains filled with liquid most of the time. At
a signal level of 0.3 V bubbles appear quite frequent already. At 0.7 V there is an almost steady
presence of a smaller bubble veil in the upper portion of the gauge glass. Finally, at 0.9 V the
whole gauge glass is mostly filled with expanding rather than collapsing bubbles.
�� �� �� �� �� �� �� �� �����
���
���
���
���
���
���
��
�� ����
�� �������
�������
����������� ���
!��
�����
��
���
"�#�$��%&����
�� �� �� �� �� �� �� �� �����
���
���
���
���
���
���
��
�� ����
�� �������
�������
����������� ���
!��
�����
��
���
$'(�)�$�
Figure 47: Bubble measurement observations for n-hexane (left) and an azeotropic ethanol/watermixture (right) in combination with the governing theoretical evaporation curve for therespective substance [17].
There is no clear indication what bubble sensor signal strength should be taken as a sign of
immediate danger indication. For the pure calibration substances (see Fig. 47) a value of 0.3 V
gave the best concordance with theoretical data. For multi-component mixtures this needs not be
the same. Therefore a range of increasing danger is proposed, defined by the limits of 0.3 V
and 0.7 V. It may be assumed that the actual point of imminent affection of engine operation is
somewhere in between.
87

For comparison reasons the bubble signal diagram for AVGAS is included (Fig. 48). The field of
sensible {p,T} points is automatically scanned and the sensor readout registered. According to
�� �� �� �� �� �� �����
���
���
���
���
����
��������
� �������
������������
���������������
��������������
���� ���������
��������� �� ��� ���
�����
Figure 48: Bubble sensor readouts for a {p,T} scan of AVGAS. Blue diamonds indicate a readout S< 0.3 V, orange triangles a value 0.3 V < S < 0.7 V, red squares indicate S > 0.7 V.
the boundaries given above two lines in the resulting diagram of bubble strengths delineate the
area where vapour locking is expected to start. Even for an assumed pressure drop of 0.3 bar,
comparable to an altitude of about 10,000 ft, the gasoline may have a temperature of about 45 ◦C
before a danger of vapour locking is to be expected. On the ground even a gasoline temperature of
55 ◦C does not seem to pose any problem.
The picture changes for the various MOGAS types under investigation. Fig. 49 and 50 depict the
respective results.
Already for the E-0 quality (current MOGAS) the region of onsetting bubble creation moves further
to the upper left of the diagram compared to AVGAS. Accordingly, the fuel may be safely
operated only at lower service heights and/or lower temperatures. This is not astonishing and a
commonplace experience with MOGAS using pilots. Proceeding to increasing ethanol admixtures
this characteristic is pronounced further as shown in Figures 49 (bottom) and 50 for E-5 to E-15.
For a given service height, defined by the respective ambient atmospheric pressure, is gradually
declining when switching to higher admixture rates.
As already stated the practically endangering signal strength threshold cannot be sharply defined.
Therefore the result data were evaluated for the limiting signal strengths of S = 0.3 V and
S = 0.7 V with respect to a confidence temperature decrease for the different service heights.
Fig. 51 and 52 display this evaluation as a pragmatic conclusion of the bubble generation
experiments. The exact onset of practical vapour locking with respect to observed bubble strengths
cannot be defined — and it may even be different between different aircrafts. But it may be
assumed that a dangerous state is reached somewhere in between the limits of 0.3 and 0.7.
Regardless of the exact value a reduction of the temperatures for same bubble signal strengths is
88
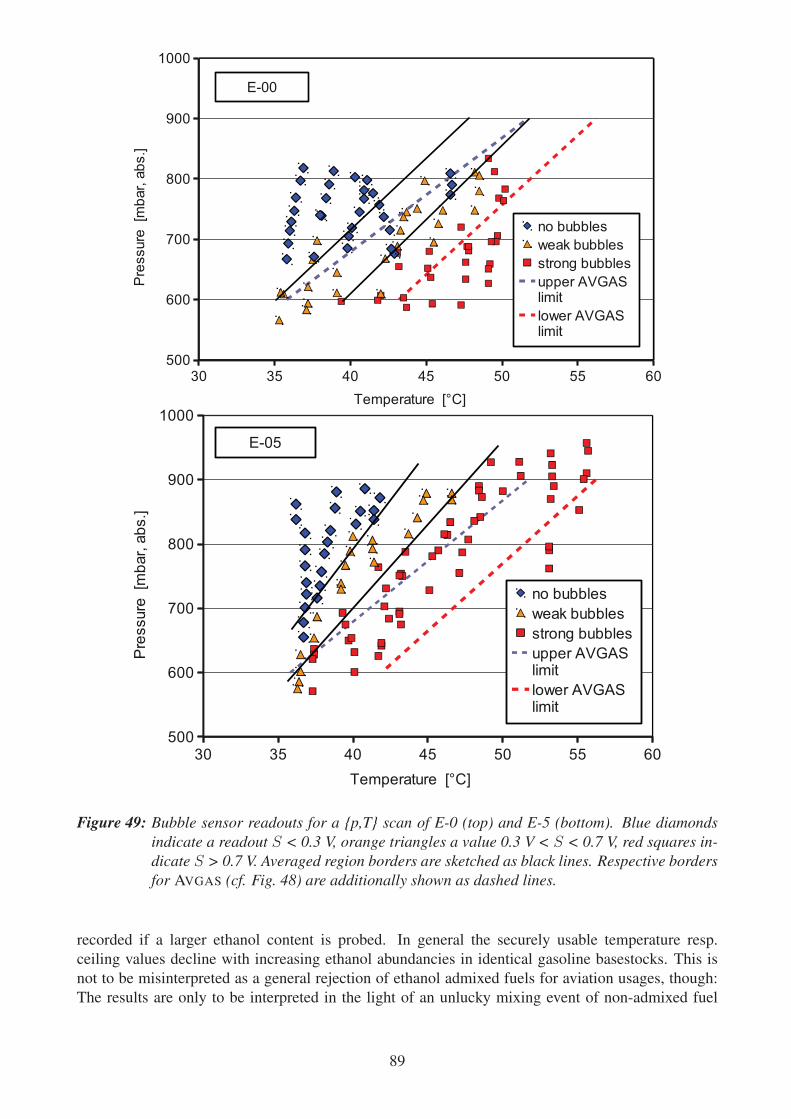
�� � !� ! � "� ��
"��
#��
$��
���
����
��������
� �������
������������
���������������
��������������
���� ���������
��������� �� ��� ��%�
&'��
�� � !� ! � "� ��
"��
#��
$��
���
����
��������
� �������
������������
���������������
��������������
���� ���������
��������� �� ��� ��%�
&'�
Figure 49: Bubble sensor readouts for a {p,T} scan of E-0 (top) and E-5 (bottom). Blue diamondsindicate a readout S < 0.3 V, orange triangles a value 0.3 V < S < 0.7 V, red squares in-dicate S > 0.7 V. Averaged region borders are sketched as black lines. Respective bordersfor AVGAS (cf. Fig. 48) are additionally shown as dashed lines.
recorded if a larger ethanol content is probed. In general the securely usable temperature resp.
ceiling values decline with increasing ethanol abundancies in identical gasoline basestocks. This is
not to be misinterpreted as a general rejection of ethanol admixed fuels for aviation usages, though:
The results are only to be interpreted in the light of an unlucky mixing event of non-admixed fuel
89

�� � !� ! � "� ��
"��
#��
$��
���
����
��������
� �������
������������
���������������
��������������
���� ���������
��������� �� ��� ��%�
&'��
�� � !� ! � "� ��
"��
#��
$��
���
����
��������
� �������
������������
���������������
��������������
���� ���������
��������� �� ��� ��%�
&'�
Figure 50: Bubble sensor readouts for a {p,T} scan of custom mixed E-10 (top) and E-15 (bottom).Blue diamonds indicate a readout S < 0.3 V, orange triangles a value 0.3 V < S < 0.7 V,red squares indicate S > 0.7 V. Averaged region borders are sketched as black lines.Respective borders for AVGAS (cf. Fig. 48) are additionally shown as dashed lines.
with an admixed one.
The reported results create a discrepancy to DGMK’s results (see Sect. 5.2, page 46) for “cold”
90

Figure 51: Temperature limits derived for the investigated ethanol abundancies and ambient pressurelevels for the lower bubble intensity level of 0.3 V sensor readout.
Figure 52: Temperature limits derived for the investigated ethanol abundancies and ambient pressurelevels for the higher bubble intensity level of 0.7 V sensor readout.
gasoline where a share of larger than about 3 % of ethanol in gasoline should again decrease the
tendendy of evaporation slightly. The DGMK reported vapour pressures are (kind of) equilibrium
ones, though, not taking into account the faster heat transfer mechanisms experienced in perfused
systems. In addition, DGMK’s reported vapour pressure values almost form a kind of plateau
91

in the scrutinized region. For elevated temperatures another source [20] reported a steadily
increasing vapour pressure for increasing ethanol abundancies of up to 20 % in accordance with
the measurements reported here. Therefore the authors of this report consider it likely that this
report’s results come closer to the reality of potential problems in flight operation.
It should be kept in mind, though, that the absolute volatilities of the tested custom mixed
fuel qualities must not be taken as expected ones of commercial ethanol-admixed gasolines
(see Sect. 5.2, p. 43). Nevertheless, they may resemble those after an accidental mixing of
ethanol-containing and not containing brands.
6.5.5 Assessment of a Common Gasoline Volatility Test Device (T 3)
Depending on season MOGAS is distributed in different volatility classes (cf. Sect. 4.1.2, p. 31).
As a sufficiently low volatility may be crucial for vapour lock suppression in aviation applications
its control is already important without ethanol admixtures. Among others the so-called “Hodges
Tester” (Fig. 53) is widely used for this purpose. It operates on the basis of a direct vapour pressure
measurement.
Figure 53: Hodges tester for gasoline volatility assessment.
A small amount (about 1 ml) of gasoline is sucked into an otherwise empty syringe. The inlet
port is shut up by screwing a pressure gauge on it. Consecutively the syringe is drawn out further,
creating a vacuum space that is filled with the spontaneously evaporated lighter constituents of the
gasoline. These constituents determine the pressure drop observed by the gauge readout. It is a
measure for the vapour pressure of the gasoline.
In the framework of SIOBIA the Hodges Tester was used on E-0, E-5, E-10 and E-15 consecutively,
in ascending order, as theory would suggest a step by step increasing or at least stagnating vapour
pressure. Between each individual measurement the syringe was rinsed out with E-0.
All experiments produced an identical vapour pressure value of -45 kPa relative to ambient pressure
at a temperature condition of 21 ◦C (in the chemical laboratory). Some slight variations in the order
of the width of the indicator needle were superimposed by typical handling dependent alterations:
Gripping the syringe firmly with a warm hand obviously instead of touching just the orange
92
handlebar added heat to the systme taken up by the liquid and leading to a slightly less pressure
drop relative to ambient conditions.
These findings have to be compared to the results gathered with the vapour lock test rig (cf.
Sect. 6.5.4) where clear differences in the bubble onset have been observed for the different
admixture levels. As a result it must be stated that the device has proven too insensitive to identify
the differences in the Exx levels.
6.5.6 Vapour Lock: Conclusions
The issue of vapour locking is an effect of various boundary conditions coinciding unluckily in a
given flight situation. Respective temperature readout experiments performed with the MORANE
showed fuel system peak temperatures around 60 ◦C in the proximity of the engine. First boiling
bubbles observed in a test rig emerged at significantly lower temperatures for comparable ambient
pressures for higher ethanol admixture values compared to both AVGAS and ethanol-free MOGAS.
Accordingly it is to be expected that unlucky mixtures of different gasolines, especially one
ethanol-free and one with shares of more than 5 % ethanol, will create a significantly higher vapour
pressure compared to the initial components and are thus prone to vapour locks caused by gasoline
boiling. This potential effect is to be seen in conjunction with a partially lacking compliance
of actual gasoline vapour pressures with agreed-on maximum values — see Fig. 6 — that adds
to the threat. Critical temperature conditions were experienced especially at the time of descent
immediately before a touch-and-go restart.
Even though typical handheld devices are available to the pilots for vapour pressure assessment a
frequently applied device did not exhibit the necessary sensitivity to detect the differences observed
in the test rig experiments.
Should ethanol-containing gasolines be approved for aviation purposes in future it would be wise
to define a “hot fuel testing” procedure that would take into account the worst possible boundary
conditions that might be encountered in practice. As of today this worst condition is given if
ethanol is directly admixed to a commercial ethanol-free gasoline in winter quality. For ambient
conditions in which the aircraft will operate correctly with such a fuel, any future ethanol-admixed
commercial gasoline should impose no stronger risk. This very conservative limit may be somewhat
excessive, though, as commercial gasolines with noteworthy ethanol contents will feature lower
base volatilities to meet the fugacity norms. Accordingly, any mixture of an ethanol-free gasoline
with an ethanol-containing one will exhibit a higher boiling curve and hence less tendency of
bubble creation.
So, with defined ethanol-containing gasolines appearing on the market, a number of tests should
be performed to identify the worst potential practical bubble threat that may originate in mixing
different brands. At the same time it should be communicated to all pilots never to prepare
mixtures of gasoline and pure ethanol by themselves.
6.6 Material Compatibility of Common Constructive Materials for AircraftParts (T 4)
6.6.1 Approach / Methodology
The range of different materials lending themselves for the construction of aircraft parts is very
large. Even though quite a lot of constructive elements of an aircraft may have contact with fuel
93
and show a variety of reactions to its compositional change (see Sect. 6.1 and Appendix C) the
main focus of the reported investigations lies on the elements of the fuel system. For an in-depth
analysis the expertise of a cooperation partner, SGS Institut Fresenius, Dortmund, has been sought.
Its report is reproduced in the consecuting section.
Since until recently the admixture of ethanol to vehicle gasolines was of minor concern and
ethanol-free gasoline brands ubiquitous the manufacturers of General Aviation parts did not need
to bother about this issue. A first bottom-up approach, to identify the materials used in a larger
number of fuel system constructive parts researched from respective aircraft spare parts catalogues
and contacting their manufacturers with targeted questions, had to get abandoned due to the
prohibitively large number of individual parts in question.
Instead a top-down approach was chosen. In order to scrutinize the awareness of a changing
fuel situation, at least for potentially MOGAS capable aircrafts, an internet questionnaire was
created. About 550 companies busy in the aircraft parts domain were invited to participate in
this interrogation. EASA assisted this approach with a Letter of Support that accompanied every
invitation. The structure of the questionnaire and the obtained results are detailed in Sect. 6.6.3.
6.6.2 SGS Report on Plastic Materials Compatibility with Ethanol-Admixed Gasolines5
Smaller aircraft and engine-driven microlights are fuelled to some extent with gasoline. Both
AVGAS and MOGAS are generally used. Due to the increased content of bioethanol in gasoline
in the future, problems will arise especially concerning the material compatibility of polymers,
elastomers and sealing material of aircraft which are in direct contact with the gasoline.
Polymers in the Aviation Industry
Polymers emerge from the interlinking of molecular chains. The single components of the
molecular chains are called monomers and the interlinking process polymerisation. Polymers can
be sub-divided into three classes depending on their type, structure and position of the molecular
chains: Thermoplastics (amorphous and semi-crystalline), thermosetting plastics and elastomers.
Table 10 summarises the different criteria of the polymer classes.
Elastomers
Elastomers are established in the aviation industry as follows:
• Hoses, partially as metal-plastic bonds (e.g. fuel hose, hydraulic hose)
• Seals and profiles (e.g. o-rings, tank sealing)
• Driving belts
• Flexible fuel tanks (e.g. in gliders)
• Tyres
Table 11 summarises the common elastomers with their German, English and French names. Tables
12 and 13 list exemplary trade names with their corresponding manufacturer.
Both tables are the basis for the identification of the elastomers used in the aviation industry.
If there is no identification mark on the sample, identification is only possible with the help of
suitable chemical analyses (e.g. infrared spectroscopy (ATR FT-IR)).
94
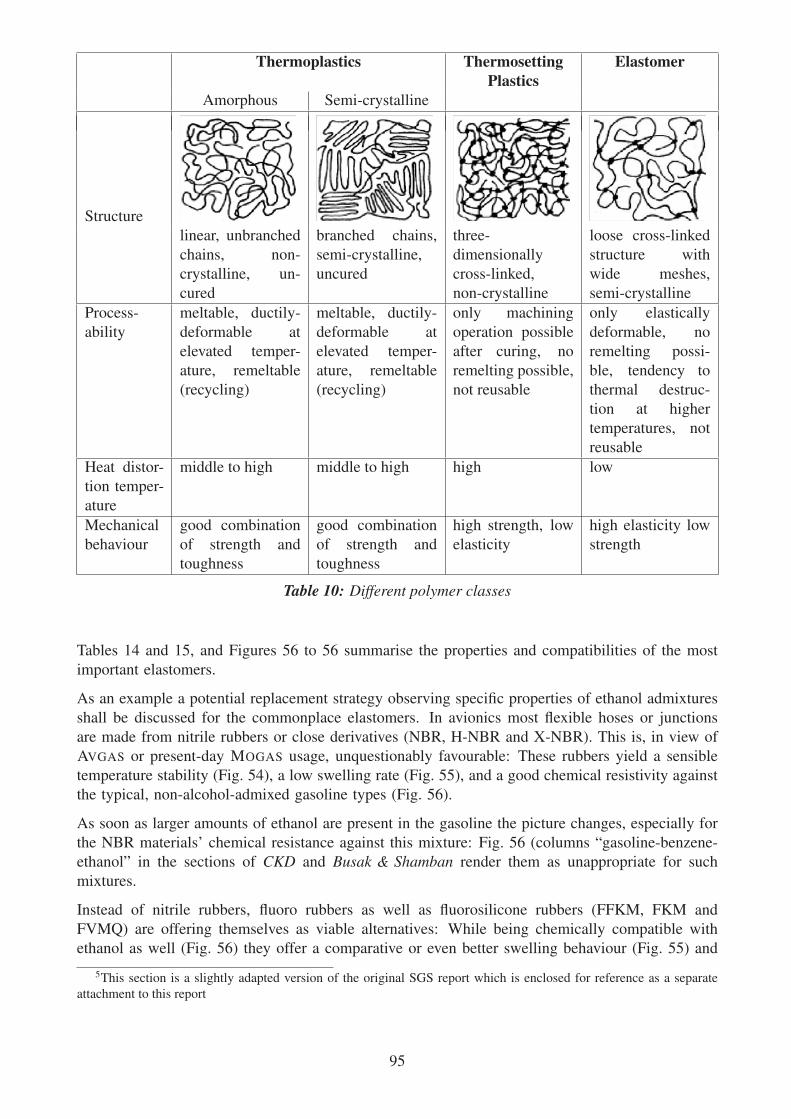
Thermoplastics ThermosettingPlastics
Elastomer
Amorphous Semi-crystalline
Structure
linear, unbranched
chains, non-
crystalline, un-
cured
branched chains,
semi-crystalline,
uncured
three-
dimensionally
cross-linked,
non-crystalline
loose cross-linked
structure with
wide meshes,
semi-crystalline
Process-
ability
meltable, ductily-
deformable at
elevated temper-
ature, remeltable
(recycling)
meltable, ductily-
deformable at
elevated temper-
ature, remeltable
(recycling)
only machining
operation possible
after curing, no
remelting possible,
not reusable
only elastically
deformable, no
remelting possi-
ble, tendency to
thermal destruc-
tion at higher
temperatures, not
reusable
Heat distor-
tion temper-
ature
middle to high middle to high high low
Mechanical
behaviour
good combination
of strength and
toughness
good combination
of strength and
toughness
high strength, low
elasticity
high elasticity low
strength
Table 10: Different polymer classes
Tables 14 and 15, and Figures 56 to 56 summarise the properties and compatibilities of the most
important elastomers.
As an example a potential replacement strategy observing specific properties of ethanol admixtures
shall be discussed for the commonplace elastomers. In avionics most flexible hoses or junctions
are made from nitrile rubbers or close derivatives (NBR, H-NBR and X-NBR). This is, in view of
AVGAS or present-day MOGAS usage, unquestionably favourable: These rubbers yield a sensible
temperature stability (Fig. 54), a low swelling rate (Fig. 55), and a good chemical resistivity against
the typical, non-alcohol-admixed gasoline types (Fig. 56).
As soon as larger amounts of ethanol are present in the gasoline the picture changes, especially for
the NBR materials’ chemical resistance against this mixture: Fig. 56 (columns “gasoline-benzene-
ethanol” in the sections of CKD and Busak & Shamban render them as unappropriate for such
mixtures.
Instead of nitrile rubbers, fluoro rubbers as well as fluorosilicone rubbers (FFKM, FKM and
FVMQ) are offering themselves as viable alternatives: While being chemically compatible with
ethanol as well (Fig. 56) they offer a comparative or even better swelling behaviour (Fig. 55) and
5This section is a slightly adapted version of the original SGS report which is enclosed for reference as a separate
attachment to this report
95

Elastomer Chemical name German Chemical name English Chemical name FrenchACM Polyacrylat-Kautschuk polyacrylate rubber caoutchouc polyacrylique
AEM Ethylen-Acrylat-
Kautschuk
ethylen-acrylate rubber caoutchouc
déthylèneacrylate
AU EU Polyurethan-Kautschuk:
Polyesterurethan
Polyetherurethan
polyurethane rubber caoutchouc de
polyuréthane
BIIR Brombutyl-Kautschuk
(Brom-Isobuten-Isopren
Kautschuk)
bromobutyl rubber caoutchouc butyl-
bromique
CIIR Chlorbutyl-Kautschuk
(Chlor-Isobuten-Isopren-
Kautschuk)
bromchloride rubber caoutchouc butylchlo-
rique
CO Epichlorhydrin-Kautschuk epichlorohydrine rubber caoutchouc épichlorhy-
drine
CSM Chlorsulfonyl-
Polyethylen-Katuschuk
hypalon hypalon
ECO Epichlorhydrin-
Copolymer-Kautschuk
epichlorhydrine-
copolymere rubber
EPR /
EPDM
Ethylen-Propylen-Dien-
Kautschuk Ethylen-
Propylen-Copolymer
(EPR)
ethylene-propylene-diene
rubber
caoutchouc éthylène
propylène diène
monomère
FFKM /
FFPM
Perfluor-Kautschuk perfluoro rubber caoutchouc perfluoré
FKM Fluor-Kautschuk fluoro rubber caoutchouc fluoré
FVMQ Fluorsilikonkautschuk fluorsilicone rubber caoutchouc fluorosilicone
MQ Silikon-Kautschuk Methyl-
Polysiloxan
silicone rubber caoutchouc silicone
VMQ Methyl-Vinyl-Silikon-
Kautschuk
methyl-vinyl silicone rub-
ber
caoutchouc méthyl-vinyl-
silicone
IIR Butyl-Kautschuk
(Isobuten-Isopren-
Kautschuk)
butylene rubber caoutchouc butylène
NBR Nitril-Kautschuk
(Acrylnitril-Butadien-
Kautschuk)
nitrile rubber caoutchouc nitrile
X-NBR Carboxylierter Nitril-
Kautschuk
carboxilited nitrile rubber caoutchouc nitrile car-
boxylique
HNBR Hydrierter Nitril-Butadien-
Kautschuk
hydrogenated nitrile-
butadiene rubber
caoutchouc nitrile hy-
drogénique
NR Natur-Kautschuk natural rubber caoutchouc naturel
SBR Styrol-Butadien-
Kautschuk
styrene-butadiene rubber caoutchouc styrène-
butadiène
Table 11: Common Elastomers
the same appropriateness for cold ambient conditions. With respect to hot conditions they usually
outperform the nitrile rubber variants (Fig. 54).
96
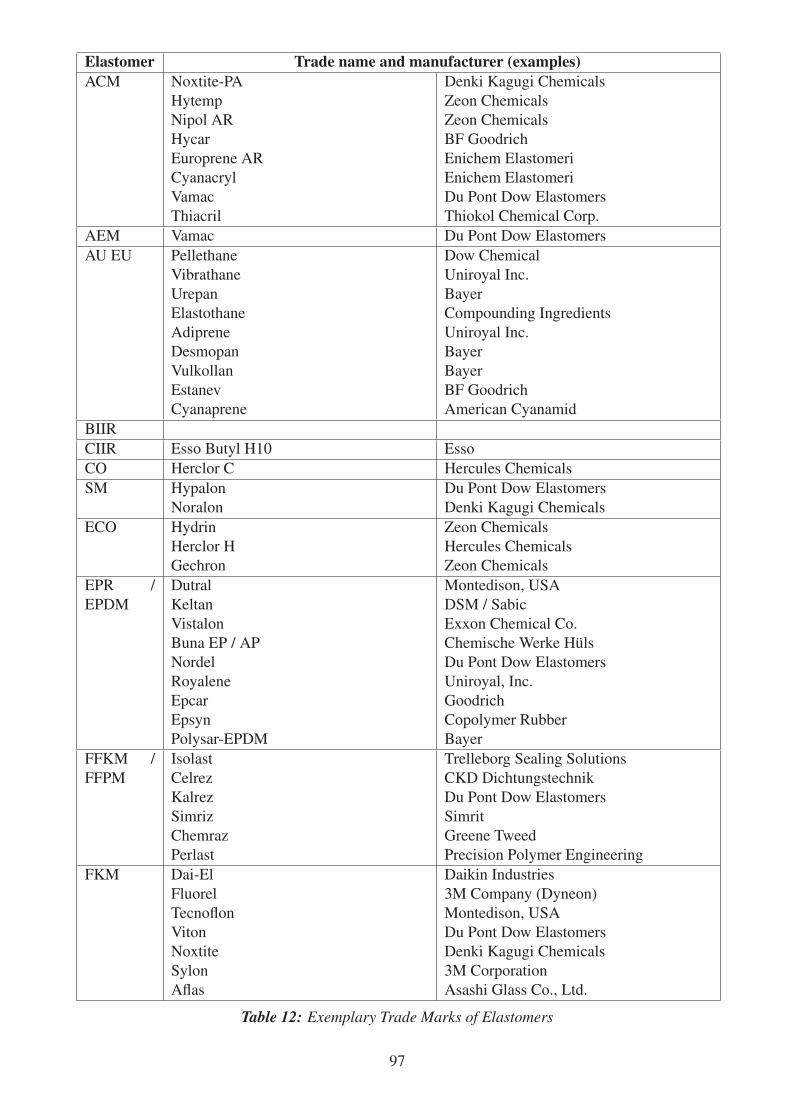
Elastomer Trade name and manufacturer (examples)ACM Noxtite-PA
Hytemp
Nipol AR
Hycar
Europrene AR
Cyanacryl
Vamac
Thiacril
Denki Kagugi Chemicals
Zeon Chemicals
Zeon Chemicals
BF Goodrich
Enichem Elastomeri
Enichem Elastomeri
Du Pont Dow Elastomers
Thiokol Chemical Corp.
AEM Vamac Du Pont Dow Elastomers
AU EU Pellethane
Vibrathane
Urepan
Elastothane
Adiprene
Desmopan
Vulkollan
Estanev
Cyanaprene
Dow Chemical
Uniroyal Inc.
Bayer
Compounding Ingredients
Uniroyal Inc.
Bayer
Bayer
BF Goodrich
American Cyanamid
BIIR
CIIR Esso Butyl H10 Esso
CO Herclor C Hercules Chemicals
SM Hypalon
Noralon
Du Pont Dow Elastomers
Denki Kagugi Chemicals
ECO Hydrin
Herclor H
Gechron
Zeon Chemicals
Hercules Chemicals
Zeon Chemicals
EPR /
EPDM
Dutral
Keltan
Vistalon
Buna EP / AP
Nordel
Royalene
Epcar
Epsyn
Polysar-EPDM
Montedison, USA
DSM / Sabic
Exxon Chemical Co.
Chemische Werke Hüls
Du Pont Dow Elastomers
Uniroyal, Inc.
Goodrich
Copolymer Rubber
Bayer
FFKM /
FFPM
Isolast
Celrez
Kalrez
Simriz
Chemraz
Perlast
Trelleborg Sealing Solutions
CKD Dichtungstechnik
Du Pont Dow Elastomers
Simrit
Greene Tweed
Precision Polymer Engineering
FKM Dai-El
Fluorel
Tecnoflon
Viton
Noxtite
Sylon
Aflas
Daikin Industries
3M Company (Dyneon)
Montedison, USA
Du Pont Dow Elastomers
Denki Kagugi Chemicals
3M Corporation
Asashi Glass Co., Ltd.
Table 12: Exemplary Trade Marks of Elastomers
97

Elastomer Trade name and manufacturer (examples)FVMQ Silastic LS
FSE
Dow Corning
General Electric
MQ
VMQ Rhodorsil
Silastic
Silopren
Silplus
Rhone Poulenc
Dow Corning
Bayer
General Electric
IIR Esso Butyl
Exxon Butyl
Polysar Butyl
Enjay Butyl
Bucar Butal
Petro-Tex Butyl
Esso
Exxon Chemical Co.
Bayer
Enjay
Columbia Carbon Co.
Petro-Tex Chemical Co.
NBR Breon
Chemigum
Elaprim
Hycar
Nysyn
Butakon
BP Chemicals
Goodyear
BF Goodrich
DSM Copolymer, Inc.
Revertex
X-NBR Butacril
Buna N
Perbunan N / NT
Paracril
Krynac
Europrene N
Nipol N
Was Ugine Kuhlmann
Chemische Werke Hüls
Bayer
Uniroyal
Bayer
Enichem Elastomeri
Zeon Chemicals
HNBR Therban
Zetpol
Tornac
Bayer
Zeon Chemicals
Bayer
NR Crepe
SMR
SIR
Natsyn Goodyear
SBR Buna Hüls
Buna S
Europrene
Polysar S
Phioflex
Phiolite
Stereon
Solprene
Rhodorsil
Clariflex S
Plioflex
Carom
Chemische Werke Hüls
Chemische Werke Hüls
Enichem Elastomeri
Bayer
Goodyear
Fina Chemicals
Rhone Poulenc
Goodyear
Chemisches Kombinat
Table 13: Exemplary Trade Marks of Elastomers (continued)
98

Elastomer PropertiesACM • only medium strength, low elasticity, disadvantageous low-temperature per-
formance
• (very) good ageing, oxidation and ozone resistance
• excellent resistance against heat and hot oil
• application in automotive industry due to its very good heat resistance and its
resistance against highly addivated lubricants
AEM • good resistance against mineral oils, water and cooling agents, good weather
and ozone resistance
AU
EU• very high tear strength, notch and friction resistance, high tensile strength,
high breaking elongation, low compression set
• EU has better hydrolysis resistance
• good resistance against mineral oils, water and cooling agents, very good
ageing- and ozone resistance
• low expansion when exposed to e.g. alcohol
BIIR • good resistance against acids, glycol brake fluids and hot water
CIIR • good resistance against acids, glycol brake fluids and hot water
CO • good high temperature properties
• good weather and ozone resistance
• good resistance against gasoline and mineral oils and mineral oil greases
CSM Properties depending on chlorine content:
• low chlorine content: best heat resistance and low-temperature flexibility, fair
oil resistance
• high chlorine content: better resistance against oils, less heat resistance and
low-temperature flexibility
• abrasion-resistant
• good chemical, ageing and ozone resistance
ECO • good low-temperature flexibility, good high temperature properties
• good resistance against gasoline and mineral oils and mineral oil greases
EPR /
EPDM• high elasticity, good low-temperature behaviour
• good resistance against hot water, very good ageing, weather and ozone re-
sistance
FFKM /
FFPM• combines the high temperature toughness of a fluorocarbon elastomer with
the chemi-cal inertness of Teflon
• very good mechanical properties even at high temperatures, high tearing
strength
• mechanical properties depend strongly on composition
• excellent resistance against almost all chemicals
FKM • very good mechanical properties even at high temperatures, high tearing
strength
• very good resistance against oils and chemicals, heat resistant
Table 14: Properties of elastomers
99

Elastomer PropertiesFVMQ
MQ
VMQ
• good compression set, low strength, bad abrasion properties, good - very good
low-temperature flexibility
• FVMQ combine the good temperature properties of the silicones with the
good chemical resistance of the fluorocarbones [F0E0?] advanced resistance
against fuels and oils
• high thermical resistance, ageing, ozone and weather resistant
IIR • good resistance against acids, glycol brake fluids and hot water as well as
good oxygen, chemicals, ozone and solvent resistance
NBR
X-NBR
HNBR
• good combination of low compression set, high tensile strength and good
abrasion resistance, high shock resistance, low-temperature flexibility, how-
ever, properties depend on ratio butadiene:acrylonitrile (e.g. increasing buta-
diene content: resistance increases but low temperature flexibility decreases)
• X-NBR is more abrasion resistant than NBR
• HNBR: advanced mechanical properties (better abrasion resistance, low tem-
perature flexibility, high impact resilience)
• bad ozone, weather and ageing resistance for NBR, no direct exposure to
sunlight, avoid contact with high-polar solvents
• HNBR: advanced resistance against heat, oil, oil additives and ozone
NR • good mechanical strength and elasticity, high flexural fatigue strength, very
good abrasion resistance, low compression set, high tensile strength, high
abrasion resistance and tear resistance
• good resistance against organic acids, alcohol and brake fluids, bad resistance
against e.g. sunlight, ozone and gasoline
• flammable
SBR • advanced abrasion and ageing resistance, good low and high temperature re-
sistance
• good resistance against brake fluids
Table 15: Properties of elastomers (continued)
As a conclusion it is recommendable to exchange nitrile rubbers as not being sufficiently qualified
for their usage in the aviation industry if in contact with ethanol-admixed gasolines, against more
resistant materials. Even though for most material changes recourses may be made to experiences
gathered in automotive industries all newly introduced elastomers should generally undergo a
sufficient qualification before they are assembled in aircraft, to exclude any potentially overlooked
effects distinguishing avionics from automotive applications.
Not only the components of the fuel system but also those with an indirect contact with fuels
(gaseous or liquid phase) should be critically inspected. All kind of sealings in the engine
compartement as well as tyres are to be mentioned which can come into contact with fuels due to
leakage or fuel-filling.
100
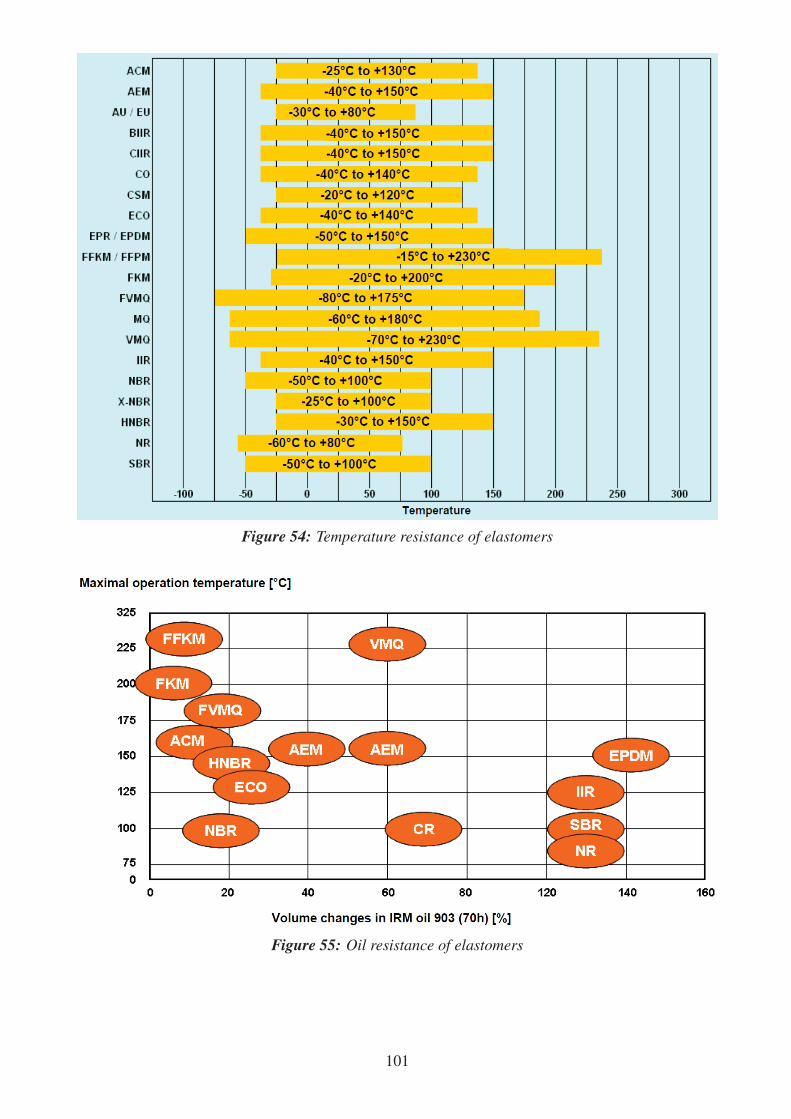
Figure 54: Temperature resistance of elastomers
Figure 55: Oil resistance of elastomers
101

Figure 56: Gasoline and ethanol resistance of elastomers
102

Thermoplastics
Thermoplastics are materials which are soft or stiff at operation temperature. A transition area
lies above the operation temperature where the thermoplastic starts to melt. Formed parts can be
produced by e.g. compression moulding, extrusion, injection moulding in the softened condition.
Fig. 57 illustrates the classification of the common thermoplastics.
Figure 57: Classification of thermoplastics
Thermoplastics are used in the aviation industry for example as:
• Tank material (particularly in microlight aircrafts),
• Material / component in the fuel system (e.g. tank cap, tank ventilation valve, tank opening,
filling-level meter, fuel pump, transfer pump, check valve, fuel filter),
• Material for housings of several electrical and electronical components in the motor com-
partment (e.g. engine control, sensors / actuator),
• Polymer pipe or fitting for different media,
• Fuselage material.
Table 16 summarises the common thermoplastics with their German, English and French names.
Tables 17 to 20 list exemplary trade names with their corresponding manufacturers.
Tables 21 to 24 summarise the properties and resistances of the most important thermoplastics.
The use of amorphous polymers, such as PC, PVC, PS, PPO and PMMA, should be avoided in
contact with gasoline due to the potential effect of environmental stress cracking. Furthermore, the
use of blend materials could be critical and is not included in the study.
It can be assumed that the mass product polyethylene (PE), the technical polymers polyamide (PA),
polyethylene terephthalate (PET), polyacetal (POM), polybutylen terephthalate (PBT), polyvinyl
chloride (PVC) and acrylonitrile butadiene styrene (ABS) as well as the special polymers poly-
tetrafluoroethylene (PTFE), polyetheretherketone (PEEK), and polyphenylene sulfide (PPS) are
assembled in systems with direct gasoline contact as these materials are resistant against conven-
tional gasoline.
103

Elastomer Chemical name German Chemical name English Chemical name FrenchPE Polyethylen polyethylene polyéthylène
PA Polyamid polyamide polyamide
PC Polycarbonat polycarbonate polycarbonate
PVDF Polyvinylchlorid polyvinylidene fluoride polyfluorure de
vinylidène
PVC Polyvinylchlorid polyvinyle chloride polychlorure de vinyle
PTFE Polytetrafluorethylen polytetrafluorethylene polytétrafluoroéthylène
PU Polyurethan polyurethane polyuréthane
PS Polystyrol polystyrene polystyrène
SB Styrol-Butadien styrene-butadien styrène-butadiène
PP Polypropylen polypropylene polypropylène
PPS Polyphenylensulfid polyphenylensulfide polyphenylene Sulfide
PPTA Poly-p-
phenylenterephthalamid
poly-p-
phenylenterephthalamide
poly-para-phénylène
téréphtalamide
PMIA Poly-m-phenylene-
isophthalamid
poly-m-phenylene-
isophthalamide
poly-m-phénylène isoph-
talamide
PPO Polyphenylenoxid polyphenylenoxid polyoxide de phénylène
PMMA Polymethylmethacrylat polymethylmethacrylate polyméthacrylate de
méthyle
PMP Polymethylpenten polymethylpentene polyméthylpentène
PI Polyimid polyimide polyimide
PIB Polyisobutylen polyisobutylene polyisobutylène
POM Polyoxymethylen polyoxymethylene polyoxyméthylène
PET Polyethylenterephthalat polyethylenterephthalate polyéthylène téréphtalate
PEEK Polyetheretherketon polyetheretherketone polyétheréthercétone
PEI Polyetherimid polyetherimide polyéther imide
PBT Polybutylenterephthalat polybutylenterephthalate polybutylène Téréphtha-
late
PB Poly(ethylen-co-1-buten) poly-ethylen-co-1-butene polybutadièn de éthylène-
co-1
PES Polyethersulfon polyethersulfone polysulfone d’éther
PEO /
PEG
Polyethylenoxid /
Polyethylenglykol
polyethylenoxide polyoxide d’éthylène
PMMS Poly(methyl-
stilbenmethacrylat)
polymethyl-
stilbenemethacrylate
polyméthacrylate de
méthyle-stilbène
PPMS Poly(p-methylstyrol) poly-p-methylstyrene poly-p-methylstyrène
PAN Polyacrylnitril polyacrylonitrile polyacrylonitrile
PBD Polybutadien polybutadiene Polybutadièn
ABS Acrylnitril-Butadien-
Styrol
acrylonitrile butadiene
styrene
acrylonitrile butadiène
styrène
PSU Polysulfon polysulfone polysulfone
Table 16: Common thermoplastics
Except for acrylonitrile-butadiene-styrene (ABS) and amorphous polyamide, all thermoplastics are
resistant to ethanol as well. However, their suitability should be tested individually at any rate.
All thermoplastics should generally undergo a sufficient qualification before they are assembled in
104

Thermoplastic Trade name and manufacturer (examples)PE LDPE
LDPE
LDPE
LDPE
LDPE
LDPE
LLDPE
MDPE
HDPE
HDPE
HDPE
HDPE
HDPE
HDPE
HDPE
HDPE
HDPE
HDPE
HDPE
HDPE
UHMW
UHMW
UHMW
Flexirene
Ipethene
Trolen H
Lacqtene LD
Mirathen
Baylon
Neo-zex
Eltex
Finathene
Fortiflex
G_Flex
Hival
Hostalen
Microthene
Ertalen HD
Lupolen HD
Ripolen HD
Lacqtene HD
Trovidur HDPE
Chirulen
Hostalen GUR
Stamylan UH
EniChem S.p.A. Italy
Carmel Olefins Israel
Dynamit Nobel (1960)
Atofina GmbH
Dow Plastics
Bayer AG
Prime Polymer Co. Ltd.
Solvay & Cie S.A.
Petrofina SA
Soltex Polymer (Solvay)
General Corp. Polymers
Basell Polyolefin GmbH
USI Chemicals (USA)
Basell Polyolefin GmbH
Atofina GmbH
Metzeler
Poly Hi Solidur Deutschland
Basell Polyolefin GmbH
Sabic Deutschland
PA PA6
PA6
PA6
PA6
PA6
PA6
PA6
PA6
PA6
PA6
PA6
PA6
PA6
PA66
PA66
PA66
PA66
PA610
PA12
PA612
Durethan B od. BP
Akulon K
Sustamid 6 (G)
Technyl C
Miramid
Ertalon 6 (SA od. PLA)
Maranyl 6
Grilon A
Tecamid 6
Nylatron 6 od. M
Ultralon
Capron (today: Ultramid)
Ultramid B
Zytel
Maranyl
Ultramid A
Tecamid 66
Edgetek NI-10GF/000
Lauramid
Vestamid
Bayer
DSM
Sustaplast
Rhone-Poulenc Rhodia AG
Leuna Polymer GmbH
Quadrant
ICI America
EMS Grivory
Ensinger
Polytron GmbH
?
BASF
BASF
DuPont
ICI America
BASF
Ensinger
PolyOne
Evonik Degussa
Evonik Degussa
Table 17: Exemplary trade marks of thermoplastics
aircraft (see end of this section, p. 6.6.2).
105

Thermoplastic Trade name and manufacturer (examples)PC Astalon
Anjalon
Calibre
Lexan
Makrolon
Marplex Australia
J&A Plastics
Dow Plastics
G.E.
Bayer AG
PVDF Dyflor
Kynar
Solef
Foraflon
Hylar
Lutonal M
Evonik Degussa
Arkema
Solvay Solexis
Atochem
Solvay
BASF
PVC Apex
Apiflex
Boltaron
Kömacel (PVC-panels)
Simocell
Teknor
API SpA Italy
Boltaron
Kömmerling etc.
Simona etc.
PTFE Teflon
Fluon
Duraflon (Coating?)
Dyneon
Fulton
Hostaflon TF
DuPont
Asahi Glass
3M
LNP Sabic
Ticona
PU Elastollan Desmodur Desmophen
Desmorapid
Elastogran GmbH Bayer Mate-
rialscience Bayer Materialscience
Bayer Materialscience
PS Avantra
Cosden
Daicel Styrol
BASF Polystyrol
Styrodur
Ineos Styrenics
BASF
PlastxWorld
BASF
BASF
SB BASF Polystyrol
Styrolux
BASF
BASF
PP Adflex
Addilene
Adpro
LyondelBasell
Addiplast
Eastman
PPS Ceramer
Fortron
Tecatron VF
Bearec
Ceramer
Ticona
Ensinger (Fortron PPS)
PPTA Kevlar
Twaron
DuPont
Teijin Ltd.
PMIA Nomex DuPont
Table 18: Exemplary trade marks of thermoplastics (continued)
106
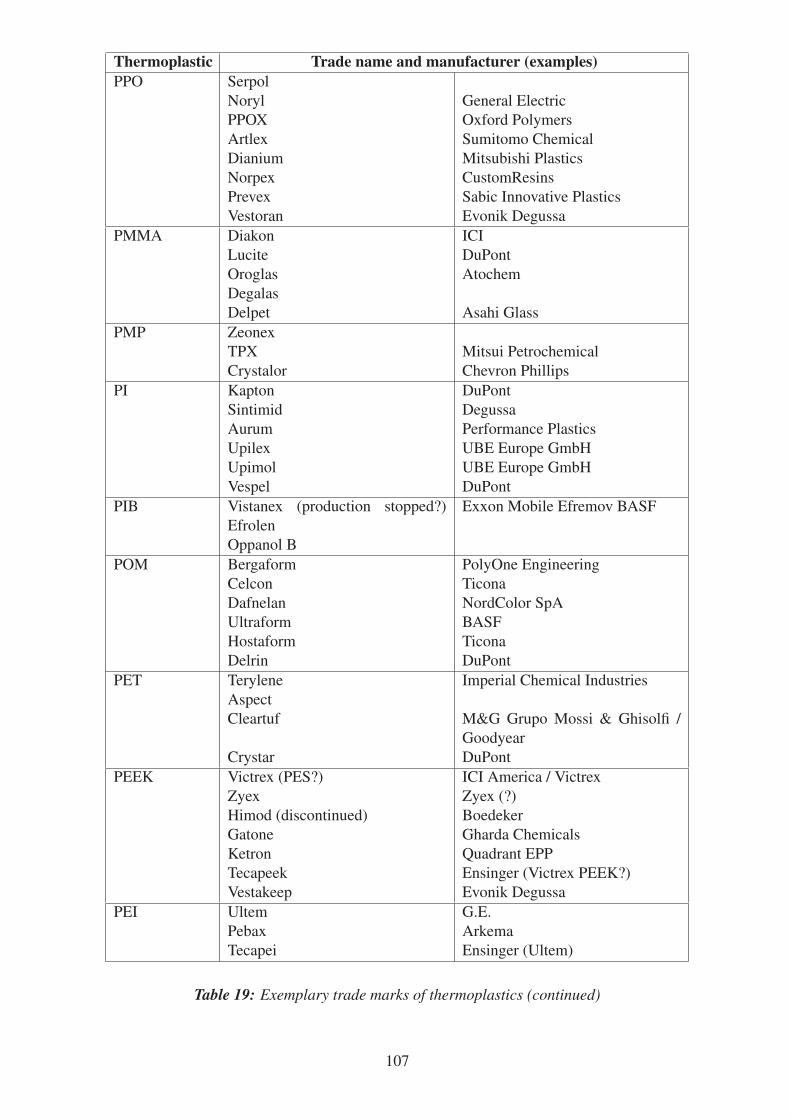
Thermoplastic Trade name and manufacturer (examples)PPO Serpol
Noryl
PPOX
Artlex
Dianium
Norpex
Prevex
Vestoran
General Electric
Oxford Polymers
Sumitomo Chemical
Mitsubishi Plastics
CustomResins
Sabic Innovative Plastics
Evonik Degussa
PMMA Diakon
Lucite
Oroglas
Degalas
Delpet
ICI
DuPont
Atochem
Asahi Glass
PMP Zeonex
TPX
Crystalor
Mitsui Petrochemical
Chevron Phillips
PI Kapton
Sintimid
Aurum
Upilex
Upimol
Vespel
DuPont
Degussa
Performance Plastics
UBE Europe GmbH
UBE Europe GmbH
DuPont
PIB Vistanex (production stopped?)
Efrolen
Oppanol B
Exxon Mobile Efremov BASF
POM Bergaform
Celcon
Dafnelan
Ultraform
Hostaform
Delrin
PolyOne Engineering
Ticona
NordColor SpA
BASF
Ticona
DuPont
PET Terylene
Aspect
Cleartuf
Crystar
Imperial Chemical Industries
M&G Grupo Mossi & Ghisolfi /
Goodyear
DuPont
PEEK Victrex (PES?)
Zyex
Himod (discontinued)
Gatone
Ketron
Tecapeek
Vestakeep
ICI America / Victrex
Zyex (?)
Boedeker
Gharda Chemicals
Quadrant EPP
Ensinger (Victrex PEEK?)
Evonik Degussa
PEI Ultem
Pebax
Tecapei
G.E.
Arkema
Ensinger (Ultem)
Table 19: Exemplary trade marks of thermoplastics (continued)
107

Thermoplastic Trade name and manufacturer (examples)PBT Duranex
Durlex
Deniter
Celanex
Ultradur
Vestodur
PolyPlastics Co.
ChemPolymer Corporation
VampTech SpA
Ticona
BASF
Evonik Degussa
PB Duraflex Shell (?)
PES Sumikaexcel
Talpa
Ultrason E
Sumitomo Chemical
Mitsui Toatsu Chemicals
BASF
PEO / PEG Polyox Dow
PMMS
PPMS
PAN Acrilan Monsanto
PBD SEETEC BR 1208 Hyundai Petrochemicals
ABS Retain
Terulan
Terlux
Tecaron
Satran
Tarodur
Lustran ABS
Blendex
Dow Plastics
BASF
BASF
Ensinger
MRC Polymers
Taro Plast
Bayer MaterialScience
GE Specialty Chemicals
PSU Ultrason S BASF
Table 20: Exemplary trade marks of thermoplastics (continued)
108
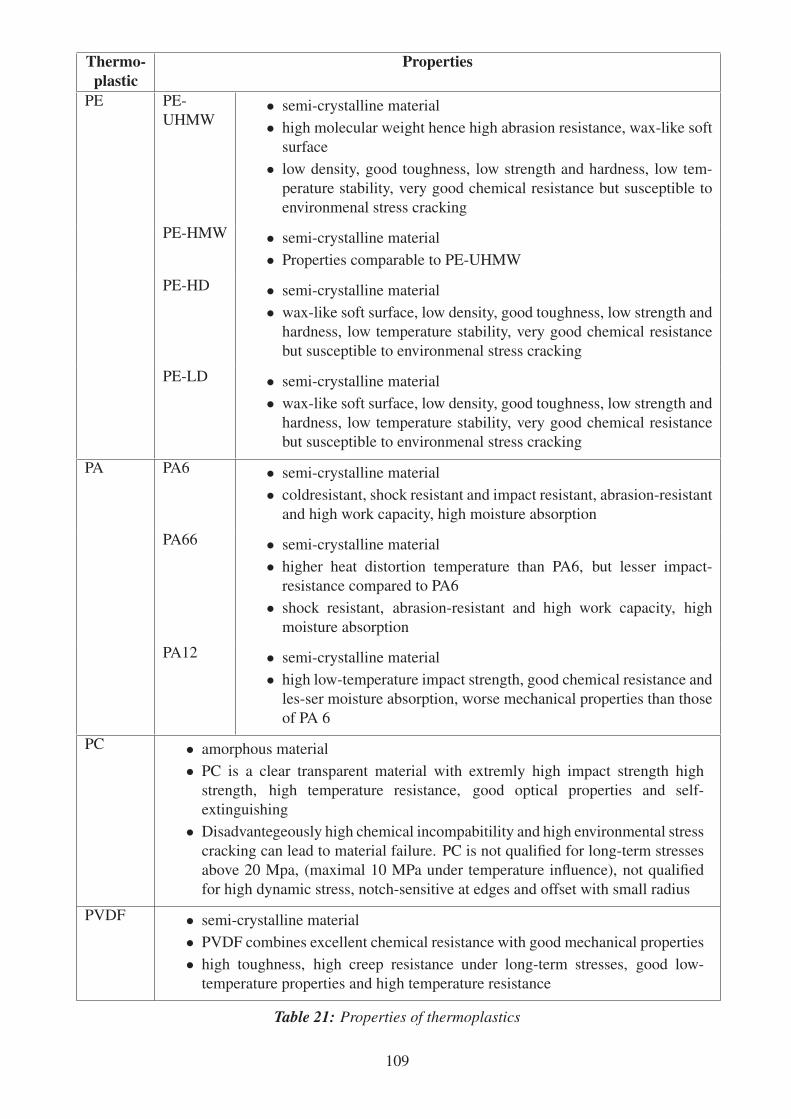
Thermo-plastic
Properties
PE PE-
UHMW• semi-crystalline material
• high molecular weight hence high abrasion resistance, wax-like soft
surface
• low density, good toughness, low strength and hardness, low tem-
perature stability, very good chemical resistance but susceptible to
environmenal stress cracking
PE-HMW • semi-crystalline material
• Properties comparable to PE-UHMW
PE-HD • semi-crystalline material
• wax-like soft surface, low density, good toughness, low strength and
hardness, low temperature stability, very good chemical resistance
but susceptible to environmenal stress cracking
PE-LD • semi-crystalline material
• wax-like soft surface, low density, good toughness, low strength and
hardness, low temperature stability, very good chemical resistance
but susceptible to environmenal stress cracking
PA PA6 • semi-crystalline material
• coldresistant, shock resistant and impact resistant, abrasion-resistant
and high work capacity, high moisture absorption
PA66 • semi-crystalline material
• higher heat distortion temperature than PA6, but lesser impact-
resistance compared to PA6
• shock resistant, abrasion-resistant and high work capacity, high
moisture absorption
PA12 • semi-crystalline material
• high low-temperature impact strength, good chemical resistance and
les-ser moisture absorption, worse mechanical properties than those
of PA 6
PC • amorphous material
• PC is a clear transparent material with extremly high impact strength high
strength, high temperature resistance, good optical properties and self-
extinguishing
• Disadvantegeously high chemical incompabitility and high environmental stress
cracking can lead to material failure. PC is not qualified for long-term stresses
above 20 Mpa, (maximal 10 MPa under temperature influence), not qualified
for high dynamic stress, notch-sensitive at edges and offset with small radius
PVDF • semi-crystalline material
• PVDF combines excellent chemical resistance with good mechanical properties
• high toughness, high creep resistance under long-term stresses, good low-
temperature properties and high temperature resistance
Table 21: Properties of thermoplastics
109

Thermo-plastic
Properties
PVC PVC-U
Hard
PVC
• amorphous material
• Hard-PVC is a clear transparent polymer. It is hard and brittle at
low temperatures. Operation temperature: up to ˜ 65◦C, soluble in
acetone and esters, resistant against acids, bases, alcoholes and oils
PVC-P
Soft PVC• amorphous material
• Soft-PVC is a rubber-like, flexible, scratch-resistant polymer. Not
brittle at low temperatures when suitable plasticisers are added,
weldable and glueable, soluble in acetone and esters, resistant
against acids, bases, alcoholes and oils, low moisture absorption
PVC-C
post-
chlorinated
• amorphous material
• highest stiffness and toughness of all PVC-types, very high chem-
ical resistance, operation temperatures up to 90◦C, low coefficient
of thermal expansion, good electrical isolating properties and low
moisture absorption
PTFE • semi-crystalline material
• Polymer with the highest chemical resistance and extremely low adhesion, soft
sintered material with low mechanical properties
• Resistance against almost all chemicals, very high temperature resistance, non-
flammability, low friction coefficient
PU • This material class comprises the area from rubber-elasticity to polyamide-
hardness. Good resistance against weather as well as many solvents, fuels and
lubricants. High elasticity and hardly any plastic deformation also at low tem-
peratures. High damping and abrasion resistance.
PS • amorphous material
• clear transparent material with high stiffness and hardness
• only low toughness hence fracture to impact stress, clear transparent with a
brilliant surface
SB • amorphous material
• Mostly manufactured with injection moulding and foamed thermoplastic
moulding (TSG).
• extremely shock resistant and hence suitable for shock proof components, well
suitable for low temperatures, not sensitive to notches , good electrical proper-
ties
PP • semi-crystalline material
• Offers averaged strength, stiffness and impact resistance at a low price, low
density, very good chemical resistance, very good environmental stress cracking
resistance (better than PE) but very bad low temperature properties.
Table 22: Properties of thermoplastics (continued)
110
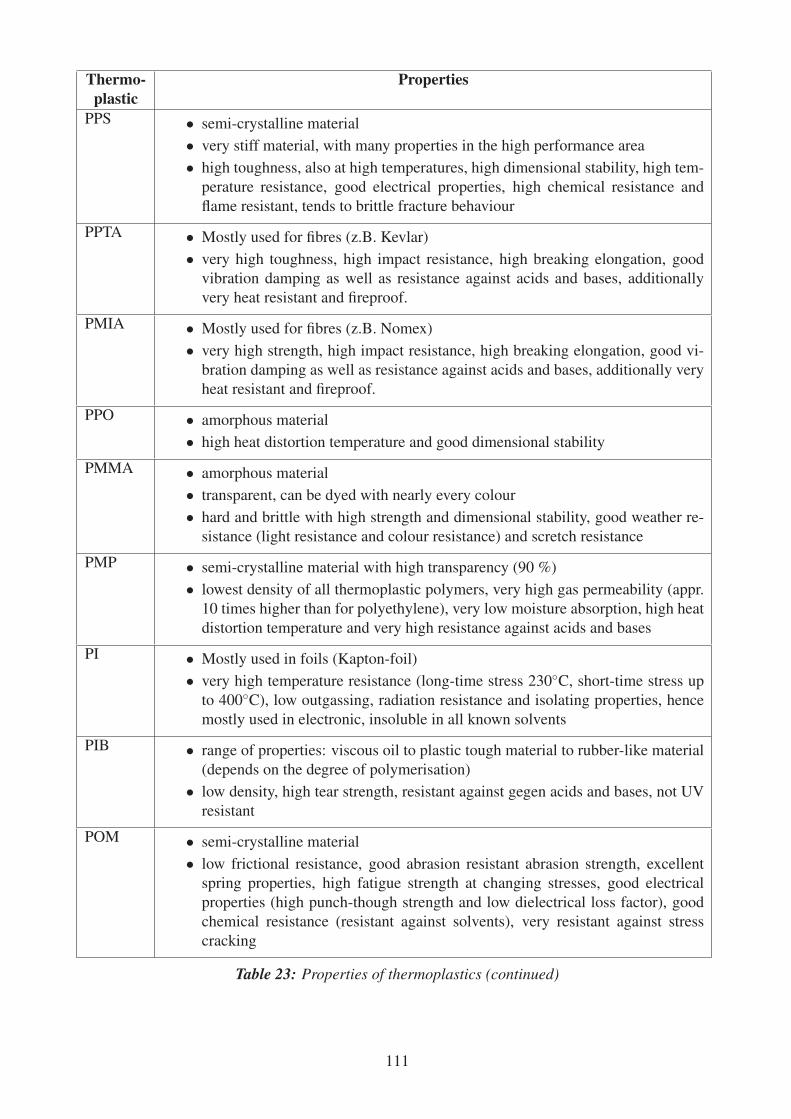
Thermo-plastic
Properties
PPS • semi-crystalline material
• very stiff material, with many properties in the high performance area
• high toughness, also at high temperatures, high dimensional stability, high tem-
perature resistance, good electrical properties, high chemical resistance and
flame resistant, tends to brittle fracture behaviour
PPTA • Mostly used for fibres (z.B. Kevlar)
• very high toughness, high impact resistance, high breaking elongation, good
vibration damping as well as resistance against acids and bases, additionally
very heat resistant and fireproof.
PMIA • Mostly used for fibres (z.B. Nomex)
• very high strength, high impact resistance, high breaking elongation, good vi-
bration damping as well as resistance against acids and bases, additionally very
heat resistant and fireproof.
PPO • amorphous material
• high heat distortion temperature and good dimensional stability
PMMA • amorphous material
• transparent, can be dyed with nearly every colour
• hard and brittle with high strength and dimensional stability, good weather re-
sistance (light resistance and colour resistance) and scretch resistance
PMP • semi-crystalline material with high transparency (90 %)
• lowest density of all thermoplastic polymers, very high gas permeability (appr.
10 times higher than for polyethylene), very low moisture absorption, high heat
distortion temperature and very high resistance against acids and bases
PI • Mostly used in foils (Kapton-foil)
• very high temperature resistance (long-time stress 230◦C, short-time stress up
to 400◦C), low outgassing, radiation resistance and isolating properties, hence
mostly used in electronic, insoluble in all known solvents
PIB • range of properties: viscous oil to plastic tough material to rubber-like material
(depends on the degree of polymerisation)
• low density, high tear strength, resistant against gegen acids and bases, not UV
resistant
POM • semi-crystalline material
• low frictional resistance, good abrasion resistant abrasion strength, excellent
spring properties, high fatigue strength at changing stresses, good electrical
properties (high punch-though strength and low dielectrical loss factor), good
chemical resistance (resistant against solvents), very resistant against stress
cracking
Table 23: Properties of thermoplastics (continued)
111

Thermo-plastic
Properties
PET • semi-crystalline material, alternative to polyacetal (POM)
• very high dimensional stability, significantly better than those of POM, high
strength and stiffness, but here worse than POM
• low slip resistance, very abrasion resistant
PEEK • semi-crystalline material
• Properties comparable to those of POM or PET, but better mechanical properties
and very good temperature strength
• high strength, high stiffness, good chemical resistance, high radiation strength,
hardly flammable, advantageous slip and abrasion behaviour
PEI • amorphous material with amber-like transparency
• unique combination of extraordinary tensile strength and high flexural modu-
lus, also at maximal temperatures, high stiffness, dimensional stability and heat
distortation temperture
PBT • semi-crystalline material, alternative for polyacetal (POM)
• comparable properties to PET, advantegous cooling behaviour and therewith
better suited for injection moulding
• very high dimensional stability, significantly better than POM, high strength
and stiffness, but here worser than POM
• low slip resistance, very abrasion resistant, advantageous electrical properties
PES • amorphous material
• PES is a transparent material with slight brownish colouration. Due to ist low
smoke gas density and its good fire protection equipment preferable use in the
interior of the aircraft.
PPMS • semi-crystalline material
ABS • amorphous material
• Preferable used as housing material due to its high quality, matt-finished and
scratch resistant surfaces, resistant against chemicals.
PSU • amorphous material
• PSU is a transparent material with brownish colouration.
• Typical application: sterilisable components in the medical and food industry
or as cask for hot water treatment (due to its low migration).
Table 24: Properties of thermoplastics (continued)
112
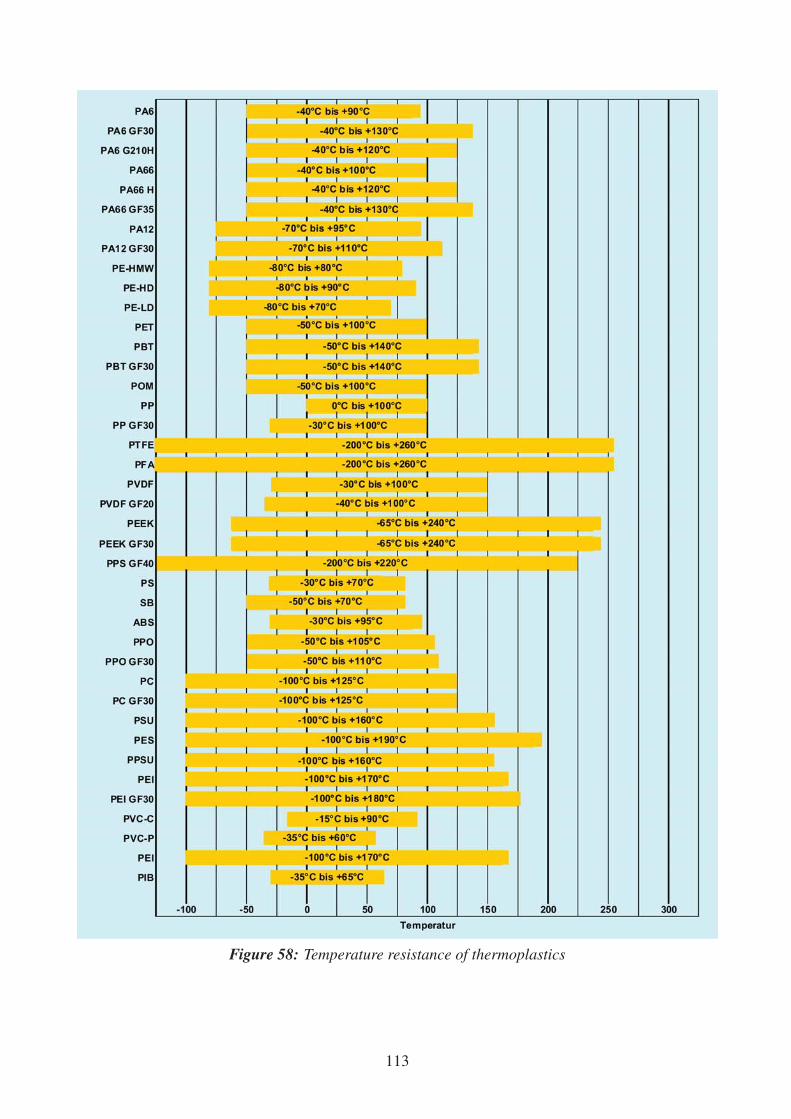
Figure 58: Temperature resistance of thermoplastics
113
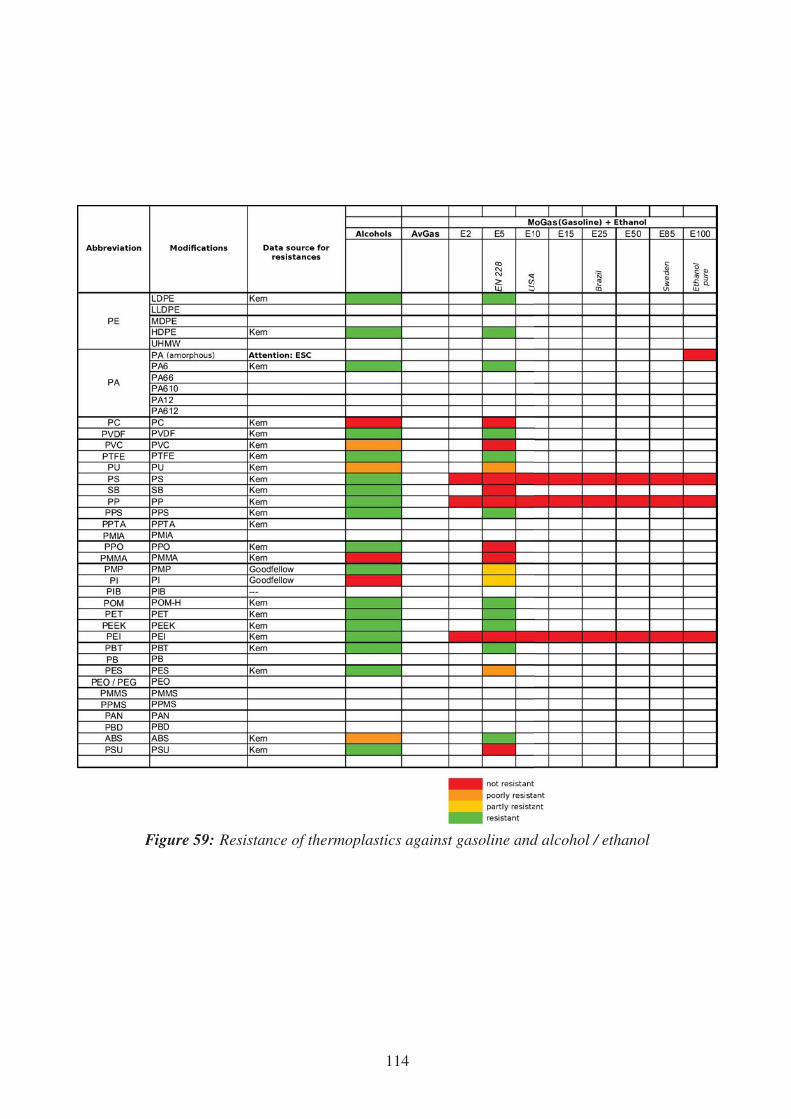
Figure 59: Resistance of thermoplastics against gasoline and alcohol / ethanol
114

Thermosettings and Sealants
Resins are the most important thermosettings used in the aviation industry. Among these, the most
common materials are the following: epoxy, phenol, melamine-phenol and polyester resins, which
are also used as adhesives for carbon fibre reinforced and fibre-glass reinforced plastics (CFK /
GFK).
Thermosettings are used in the aviation industry as e.g.
• Tank material (GFK tanks) and fuselage tanks respectively,
• Fuselage material,
• Material for wings,
• Material for panelings.
Table 25 shows examples of thermosettings together with trade name and manufacturer. The
chemical names are again given in German, English and French.
Duroplast Chemical name Trade name ManufacturerEP Epoxidharz
(en: epoxy resins
fr: résines époxy)
Araldite
Epikote
Epon
Eponex
Epi-Rez
Epoxin
Epilox
Lekutherm
Hysol 3450
Hysol 9492
Hysol 3425
Huntsman
Hexion Specialty Chemicals
Hexion Specialty Chemicals
Hexion Specialty Chemicals
Hexion Specialty Chemicals
Leuna Harze
Henkel
Henkel
Henkel
PF Phenolharz
(en: phenolic resins,
fr: phenoplastes)
Bakelite PF31
Bakelite PF31.5
Bakelite PF51
Hexion Specialty Chemicals
Hexion Specialty Chemicals
Hexion Specialty Chemicals
MPF Melamin / Phenolharz
(en: melamine phenol
formaldehyde resins,
fr: résines de
mélamine-phénol-
formaldéhyde)
Melopas MP183 Raschig
UP Polyesterharz
(en: polyester resins,
fr: résines polyester)
Ralupol UP4385
Atlac
Palatal
Synolite
Raschig
DSM
DSM
DSM
Table 25: Common thermosettings
The resistances of the resins against different gasoline and ethanol mixtures are given in Fig. 60.
They depend on the product variant which can be particularly seen for the epoxy resins Hysol of
the Henkel company: Whereas Hysol 3450 and 9492 are resistant against gasoline E-5, type 3425
has only a limited resistance. Additionally the epoxy resins exhibit partially an incompatibility
with water, especially at high temperatures and pressures.
115

The phenol and phenol-melamine resins are to a large extent resistant against alcohol and
gasoline E-5. The polyester resins are clearly not resistant against these chemicals. Analogous
to the elastomers and thermoplastics, the thermosettings should generally undergo a sufficient
qualification before they are assembled in aircraft as well.
Figure 60: Resistance of thermosettings against gasoline and alcohol / ethanol
116
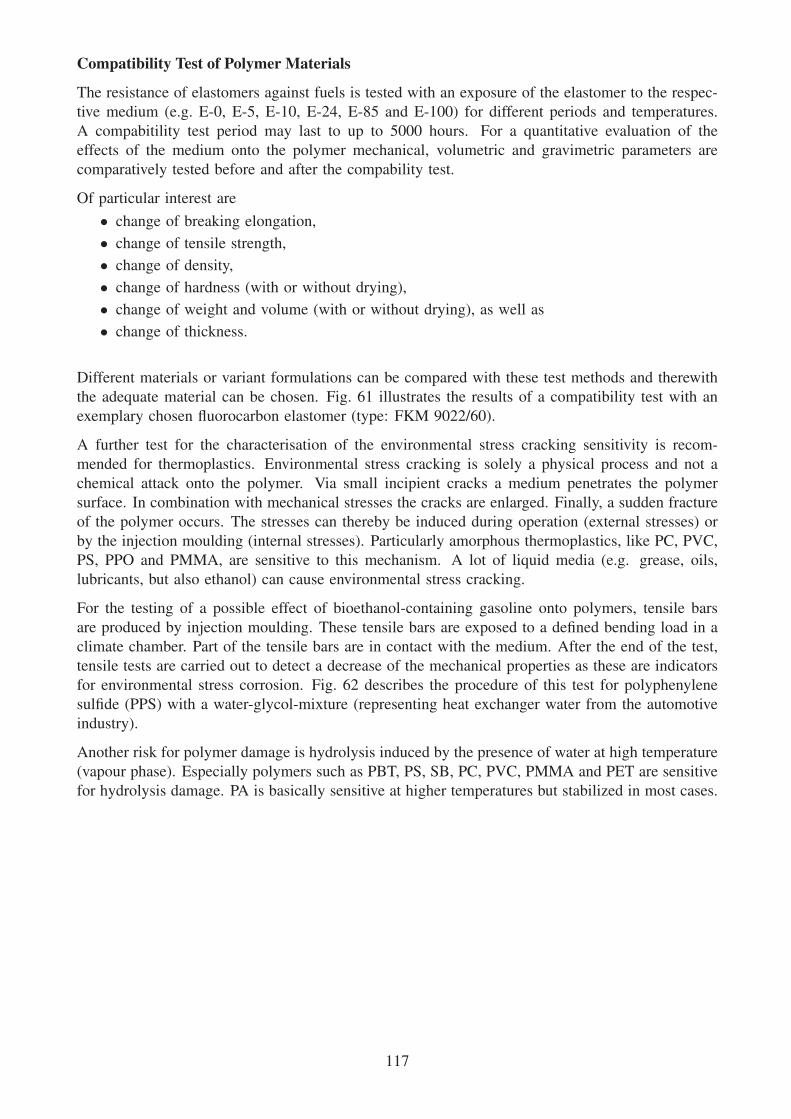
Compatibility Test of Polymer Materials
The resistance of elastomers against fuels is tested with an exposure of the elastomer to the respec-
tive medium (e.g. E-0, E-5, E-10, E-24, E-85 and E-100) for different periods and temperatures.
A compabitility test period may last to up to 5000 hours. For a quantitative evaluation of the
effects of the medium onto the polymer mechanical, volumetric and gravimetric parameters are
comparatively tested before and after the compability test.
Of particular interest are
• change of breaking elongation,
• change of tensile strength,
• change of density,
• change of hardness (with or without drying),
• change of weight and volume (with or without drying), as well as
• change of thickness.
Different materials or variant formulations can be compared with these test methods and therewith
the adequate material can be chosen. Fig. 61 illustrates the results of a compatibility test with an
exemplary chosen fluorocarbon elastomer (type: FKM 9022/60).
A further test for the characterisation of the environmental stress cracking sensitivity is recom-
mended for thermoplastics. Environmental stress cracking is solely a physical process and not a
chemical attack onto the polymer. Via small incipient cracks a medium penetrates the polymer
surface. In combination with mechanical stresses the cracks are enlarged. Finally, a sudden fracture
of the polymer occurs. The stresses can thereby be induced during operation (external stresses) or
by the injection moulding (internal stresses). Particularly amorphous thermoplastics, like PC, PVC,
PS, PPO and PMMA, are sensitive to this mechanism. A lot of liquid media (e.g. grease, oils,
lubricants, but also ethanol) can cause environmental stress cracking.
For the testing of a possible effect of bioethanol-containing gasoline onto polymers, tensile bars
are produced by injection moulding. These tensile bars are exposed to a defined bending load in a
climate chamber. Part of the tensile bars are in contact with the medium. After the end of the test,
tensile tests are carried out to detect a decrease of the mechanical properties as these are indicators
for environmental stress corrosion. Fig. 62 describes the procedure of this test for polyphenylene
sulfide (PPS) with a water-glycol-mixture (representing heat exchanger water from the automotive
industry).
Another risk for polymer damage is hydrolysis induced by the presence of water at high temperature
(vapour phase). Especially polymers such as PBT, PS, SB, PC, PVC, PMMA and PET are sensitive
for hydrolysis damage. PA is basically sensitive at higher temperatures but stabilized in most cases.
117

Figure 61: Results of compabitility tests of a fluorocarbon elastomer in contact with different fuels(E-10, E-24, E-85, and E-100).
118
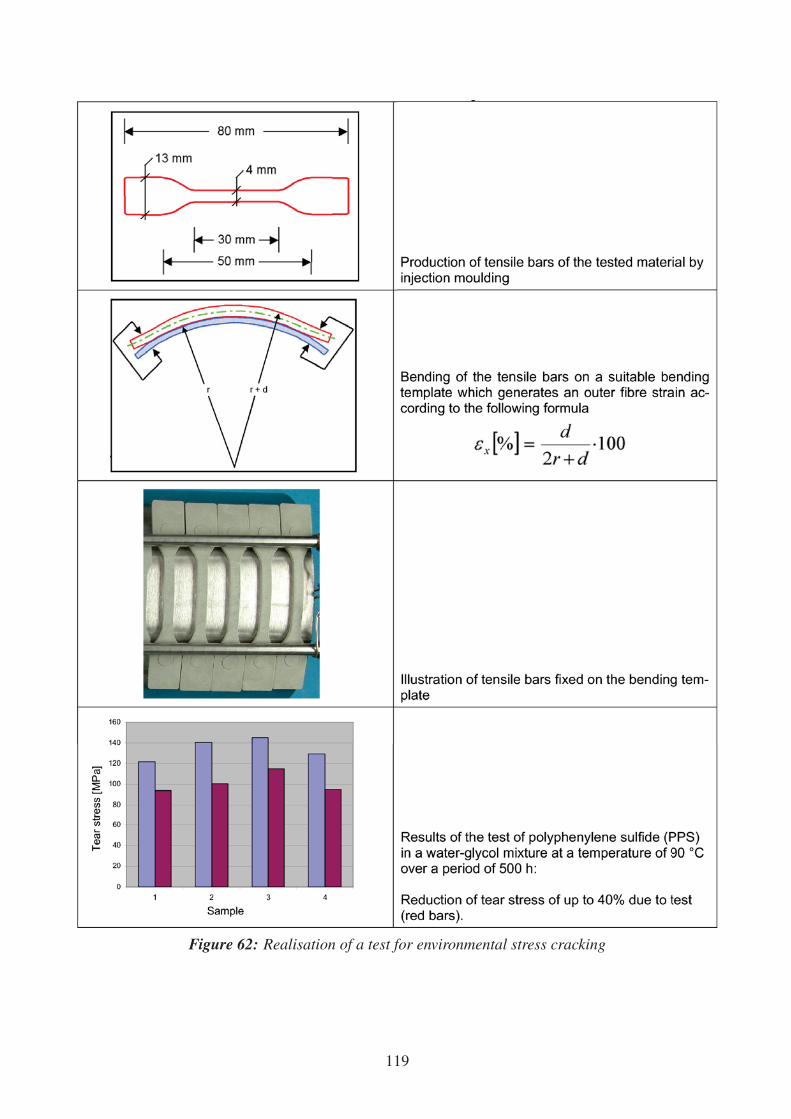
Figure 62: Realisation of a test for environmental stress cracking
119

6.6.3 Survey on Deployed Materials for Fuel Systems
The assessment of material-originating hazards was undertaken by interrogating GA parts man-
ufacturers and aviation OEMs with the help of a respective custom-built questionnaire. The
questionnaire was set up as a web application to which potential respondents are directed via an
individualized invitation letter. This letter was accompanied by a letter of support issued by EASA.
Questionnaire Outline
Addressing the issue of material compatibility and the assessing the awareness of aircraft and parts
producers is somewhat difficult:
• At the time being there is a clear-cut difference between AVGAS and DIN EN 228 based
MOGAS, with the latter being identified mainly as the quality “Super Plus, 98 RON”. As until
early 2009 no significant amount of ethanol was input into this gasoline quality, no practical
experience could be gained with respect to adverse effects of elevated ethanol shares. With
very few exceptions the ethanol content remained below the 1 % limit that all MOGAS
capable aircraft would accept. Accordingly there was no issue of materials deterioration so
far, and producers of aviation parts simply did not have to care about that.
• Even today the AVGAS oriented GA mainstream does not have to cope with ethanol as it
is forbidden as an admixture therein, and there will be neither technical nor economical a
necessity in the foreseeable future to put it in. In the respective EU regulations and their
national ratifications fuels not dedicated to vehicle usage are explicitly unburdened from the
admixing quota necessities, otherwise leading to financial penalties for the fuel producers
(see Sect.3.3).
Accordingly no parts manufacturer can be regarded as negligent if it did not yet care about the
ethanol issue at all. Nevertheless, with the time horizon of aircraft utilization periods it is quite
certain that the issue will arise sooner or later, so it is interesting to check if manufacturers are
already aware of it and if they actively work and develop with this future topic in mind. Such
a survey has been undertaken by publishing a publicly accessible web-based questionnaire and
addressing the respective companies by a dedicated direct letter to draw attention to it.
In Fig. 63 the structure of this questionnaire is detailed out. As the structure is organized as a
hyperlinked system it is very likely that no respondent will see every branch of it. He will rather
meet the questions suitable for his respective range of products. Accordingly is the number of
answerers to each questions strongly differing.
The questionnaire is structured as follows: A first section of questions interrogates about the
general awareness towards the issue “ethanol as a gasoline admixture”. Only if the respondent
has indicated at least a basic familiarity with the issue direct questions about compatibility of the
materials utilized in his parts are asked. Each question has been carefully worded so as not to
brusque the respondent in case of not knowing about the respective detail. The order of directly
material related questions has been chosen in a way that anticipates the reception of the invitation
letter in the individual companies: The questions tree spans out from the rather few practical items
the companies manufacture or assemble (tanks, hoses, sensors, pumps, . . .) and goes down into the
details of selected construction materials (see fig. 63).
For each question a statistical evaluation can be performed. The questionnaire tree shows the
direction of the answer analyses in the boxes with the lighted bulbs for each question.
120

Figure 63: Materials question tree, expanded for hoses made from elastomeres to its full depth as anexample clip from the whole materials questions tree.
121
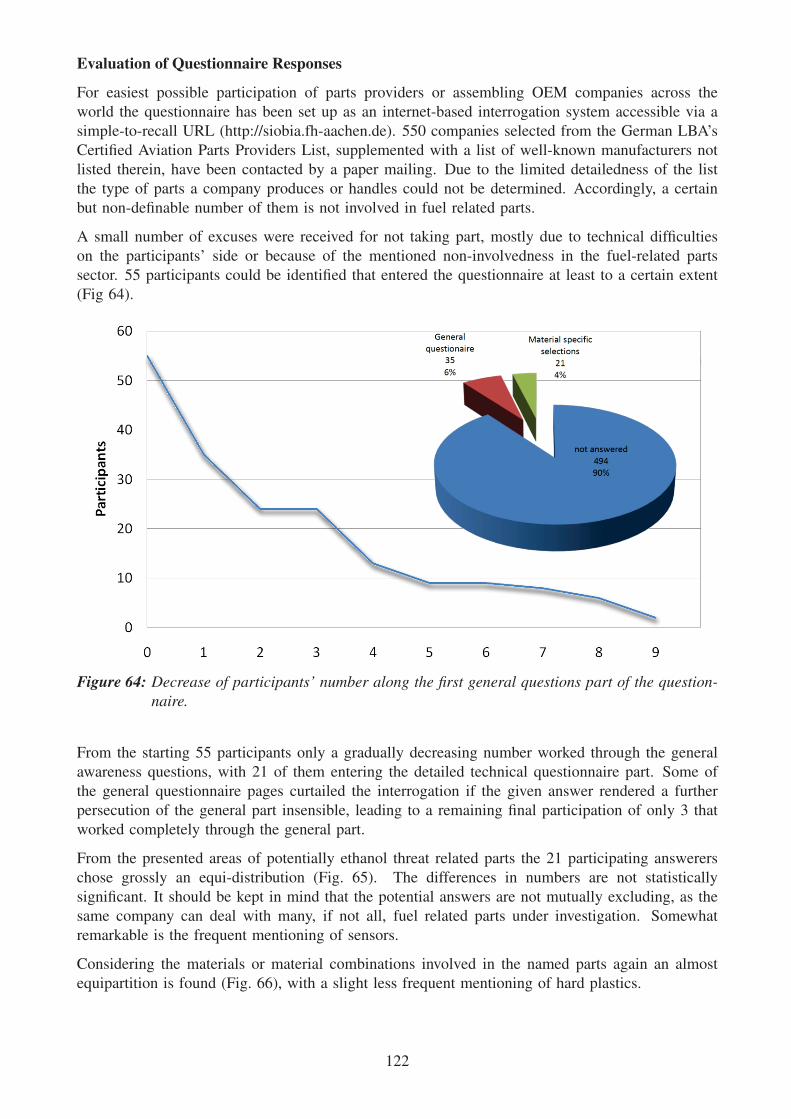
Evaluation of Questionnaire Responses
For easiest possible participation of parts providers or assembling OEM companies across the
world the questionnaire has been set up as an internet-based interrogation system accessible via a
simple-to-recall URL (http://siobia.fh-aachen.de). 550 companies selected from the German LBA’s
Certified Aviation Parts Providers List, supplemented with a list of well-known manufacturers not
listed therein, have been contacted by a paper mailing. Due to the limited detailedness of the list
the type of parts a company produces or handles could not be determined. Accordingly, a certain
but non-definable number of them is not involved in fuel related parts.
A small number of excuses were received for not taking part, mostly due to technical difficulties
on the participants’ side or because of the mentioned non-involvedness in the fuel-related parts
sector. 55 participants could be identified that entered the questionnaire at least to a certain extent
(Fig 64).
Figure 64: Decrease of participants’ number along the first general questions part of the question-naire.
From the starting 55 participants only a gradually decreasing number worked through the general
awareness questions, with 21 of them entering the detailed technical questionnaire part. Some of
the general questionnaire pages curtailed the interrogation if the given answer rendered a further
persecution of the general part insensible, leading to a remaining final participation of only 3 that
worked completely through the general part.
From the presented areas of potentially ethanol threat related parts the 21 participating answerers
chose grossly an equi-distribution (Fig. 65). The differences in numbers are not statistically
significant. It should be kept in mind that the potential answers are not mutually excluding, as the
same company can deal with many, if not all, fuel related parts under investigation. Somewhat
remarkable is the frequent mentioning of sensors.
Considering the materials or material combinations involved in the named parts again an almost
equipartition is found (Fig. 66), with a slight less frequent mentioning of hard plastics.
122

Figure 65: Mentioned areas of parts production or application (not mutually excluding).
Figure 66: Distribution of materials for aviation parts production or application (not mutually ex-cluding).
The main problem in further evaluating the detailed questionnaire part is the low number of
mentioning of respective materials or material combinations. Again a wide-spread utilisation of
materials is observed, leading to the fact that no listed material has been multiply named to a
significant statistical level. Accordingly a further evaluation of individual material classes and their
anticipated pontential threat impact is not possible for the data acquired.
Back to the general awareness questions, quite a large portion of the participants (more than 80 %
of those that pondered on the question) indeed expects effects of biogenic admixtures in vehicle
gasolines also for aviation matters (Fig. 67). In spite of this large fraction the time horizon for
dealing with these potential problems is rather wide: the vast majority expects respective effects no
sooner than about 5 years in the future or at least foresees a commercial involvement at that time
(Fig. 68). This reflects quite well the present situation for the majority of aircraft, usually oriented
towards operating on AVGAS on a more global point of view.
123

Figure 67: Estimate of an effect of ethanol admixture in vehicle gasolines on aviation affairs.
Figure 68: Valuation of potential consequences of ethanol admixture in vehicle gasolines on the prod-ucts of the individual company.
124

6.6.4 Conclusions
The field of material compatibility is very complex and becomes even more so by the tendency
of modern product design, to integrate different basic materials in so-called blends. This increases
the amount of principally available construction materials immensely. The intention to combine
the positive properties of the different materials has certainly been achieved in many cases. But
the ultimate features of blended composites are very hard to anticipate, especially so if the
material is exposed to hitherto unforeseen environmental influences like changed liquid solvents,
other temperature ranges, increased radiation etc. . Accordingly materials, having proven their
applicability in similar environments like the automobile industry, need not necessarily withstand
the boundary conditions in aeronautical applications with the same sovereignty.
Special attention should be given to the ubiquitous rubbers. Here the state-of-the-art utilization of
NBR and its derivatives for flexible hoses, sealings and similar fuel contacting construction parts
could prove itself dangerous, especially for heat radiation exposed parts in the immediate vicinity
of the engine.
The aviation part manufacturers’ questionnaire did not reveal a new aspect in the general discussion
of ethanol admixture utilization in the area of General Aviation. It may be concluded that the topic
itself is noticed in general but not being worked upon besides companies presumably involved
in designing and selling ultralight aircraft for low service ceiling operation with rather modern
engine and fuel system designs. With respect to the large fleet of older aircraft with engine designs
originating from several decades ago there is neither a sensitization nor an impulse detectable
from the questionnaire results to consider future ethanol admixtures in gasolines potentially used
in aviation as well.
Nevertheless the international awareness may have been raised by the existence of the questionnaire
and especially its official backing by the regulatory authorities. It would be interesting if such an
effect could be perceived by repeating such a survey after a certain period.
125

7 Metrological Aids for Gasoline Composition Assessment (T 6)
7.1 Determination of an Ethanol Share in Gasoline
The quantitative detection of the ethanol content is a growing issue for MOGAS users: While
traditionally STC’ed MOGAS engines must obey the 1 % maximum ethanol content limit already
today, some of the presently DIN EN 228 certified engines (especially in the Ultralights class) may
have to check in future if the present 5 % limit on ethanol might be raised in the years to come.
Even if an engine is suitable for arbitrary ethanol admixtures, concerns about the solved water
issue (see sect. 5.1) will demand an at least semi-quantitative ethanol share determination as the
water acceptance is strongly dependent on it.
There are primarily two very practical methods at hand for the pilot: i) colour indicator substances
sensitive to the ethanol concentration in the gasoline, and ii) ethanol extraction by deliberately
admixed water.
7.1.1 Colour Indicator Method
There are several colour indicator techniques that are sensitive for ethanol contents in gasolines.
For demonstration purposes we investigated the discriminatory power of the “Bluebottle Ethanol
Test” donated by B. Plumb. According to the accompanying leaflet it should detect any alcohol
present in the gasoline. In a personal communication with a distributor a limiting value of 1 % was
stated. The presence of ethanol is displayed as a discoloration of a small amount of gasoline in
contact with a (solid) stain of blue colour at the bottom of a small (10 ml) bottle. For comparison
purposes another empty bottle of same size has to be filled with another portion of the same
gasoline. Starting with a value of 0.8 % ethanol in gasoline the tests were performed according to
the schema defined in Fig. 69.
Figure 69: Sensitivity determination schema for an ethanol detection kit working on colour changereaction.
By consecutive narrowing of testing steps and comparison to the colourless gasoline the point of
an emerging haze of blue colour in the gasoline could be fixed at about 2 %, with a confidence
126

range of about 0.2 %. The investigated method works very quick and is, by the special chemical
reaction to ethanol alone, selective for the required purpose.
The method is not applicable if a quantitative readout of an arbitrary ethanol share in a certain
range is required, as may be the case for dielectrical sensoring based water detection systems that
need ethanol abundancy values as correcting inputs.
7.1.2 Ethanol Extraction by Water
Various test methods are described that work principally on the phase separation effect described
in detail in Sect. 5.1: As soon as a sufficiently large quantity of water is added to the gasoline to
be investigated the contained ethanol is washed out and adds to the volume of the water. As the
phase interface of ethanol/water vs. gasoline is quite well visible there is a possibility of directly
assessing the volume increase of the former pure water.
The volumes of water and extracted gasoline do not exactly add up: The thermodynamic effect
of the “excess volume” — in the case of a water/ethanol mixing being negative — reduces the
appearent volume slightly (Fig. 70). Since the effect is less than 2 % for the complete range of
possible mixing ratios an almost linear dependency may be assumed as a good approximation.
Figure 70: Negative excess volume of a mixture of water and ethanol [34].
There are methodological ethanol detection descriptions in circulation that base on rather similar
amounts of gasoline and water being shaken vigorously in a chemical test tube for the ethanol
extraction to take place. While they do basically work, they are much too insensitive to detect
minor differences in ethanol abundancy as their readouts would differ in fractions of a millimeter
only even for substantial changes. A secure control whether the ethanol share is less then 1 % or
e.g. an already illegal 1.3 %, is not possible.
A better method is implemented in Maul’s “Fuel-Alk Tester” (Fig. 71). Based on the same principle
127

Figure 71: Maul’s Fuel-Alk Tester (after http://www.daec.de/te/downfiles/Fuel-AlkTester.pdf).
the amount of gasoline taken as a probe is much larger, and the test tube placed on top of the test
containment comparatively small. This yields a much larger readout sensitivity in the critical range
around 1 % ethanol content. With a reduced absolute sensitivity the method is as well applicable
to extended range of up to 5 % as presently allowed for EN 228 compliant vehicle gasolines.
While the purely mechanical readout resolution for a careful applicant should be about 1 mm,
yielding a ethanol concentration resolution of about 0.02 %, the concentration determination
repeatability in practical experiments a standard deviation of about 0.05 % for several identical
samples of gasolines containing less than 1 % ethanol6. These tests were performed with identical
samples of base gasoline. Accordingly, the method’s repeatability would have to be qualified by
larger test variations, especially taking into account compositional variations of the base gasoline.
7.2 Detection of Solved Water
Already for conventional gasolines the water content in the fuel system may exist both as an
already separated and drainable water phase and/or as solved water in the gasoline phase. The
separated water content must be drained prior to any flight as it may seriously affect the engine
operation if the water phase is ingested while flying. Since the separated water is heavier than the
gasoline and every small aircraft provides a respective tank drain opening this procedure is easy to
perform.
The water solved in the gasoline creates no problem for the engine operation as long as it stays
this way. Ethanol-admixed gasoline is even capable to dissolve significantly more water than an
alcohol-free one, as is detailed in Sect. 5.1 and especially so in Fig. 12, p. 40. The main problem,
however, is the fact that the amount of dissolvable water strongly depends on the gasoline’s
temperature (see e.g. Fig 12 on page 40), with a decreasing amount at decreasing temperatures.
6Personal communication with vendor of Fuel-Alk test method
128

The problem is aggravated by the fact that in case of an emerging phase separation not only the
water is purged. The water also drains the majority of the alcohol ingredients from the gasoline,
yielding both an octane number reduced gasoline phase and a larger volumetric fraction of an
uncombustible water/ethanol mixture. Accordingly, the detection of potentially dangerous solvedwater is relevant.
Compared to the drainage of already separated water from a tank system the detection of solved
water is significantly more difficult. There are predominantly three general classes of water
detection methods that lend themselves to further investigation:
• Chemical reactions that bind and display water contents of respective test probes. Chemical
methods are favorable if static detection methods are sufficient.
• Optical analyses that rely on spectral differences between the usual gasoline components and
water. Optical methods may be applied “in situ”, i.e. they may probe small amounts of
fuel as it is sucked into the smaller compartments located between tank and carburettor or
injection nozzle.
• Measurements of electrical properties, like capacitive resistance at different alternating current
frequencies, or Ohmic resistance. A main obstacle for these methods is the electric similarity
of water and ethanol and the fact that rather small amounts of water must be detectable in
the presence of rather large, even not exactly specifiable abundancies of ethanol.
A further mainly electrically based class of methods, relying on additional electrical properties
of the gasoline [22], may be ruled out by the fact that the measurable values vary to strongly in
technical gasoline qualities for a sensible quantitative detection limit in the region of < 0.1 % .
Various commercial “water in gasoline” detectors are offered that operate on the so-called water
activity and claim to detect water down to some ppm. Typical representatives are Vaisala’s MMT-
330 or EESiFLo’s EASZ-1. At least one of the manufacturers claim that these sensors should
be applicable even in the presence of alcohols if their operating values are adapted accordingly.
Within the scope of SIOBIA one of these detectors is tested in the vapour lock test rig (see
Appendix D.4).
The following sections investigate these different methodologies of water detection in more detail.
7.2.1 Chemical Water Detection
MLR Quik-Check Solution & Test Kit. MLR Solution (http://www.fueltestkit.com/) offers the
“Quik-Check Solution & Test Kit”. It claims to check alcohol and water content at the same time.
According to direct information from the vendors [27] the colour creating solution reacts identical
to alcohol and water, so the sum of abundancies is “measured”. As the threatening water content
is about one order of magnitude smaller than the potential ethanol content there is no sensitivity
for water detection, and the result has no significance with respect to danger assessment.
Macherey-Nagel “Watesmo” indicator paper. According to the manufacturer the test paper
allows the quick and easy detection of liquid water and (condensing) water vapour, even if solved
in other substances. On contact with water the paper changes its colour. Besides other targets
the test paper is intended to control the water content in solvents like aliphatic and aromatic
hydrocarbons (gasoline, oil). If the paper remains uncoloured after evaporation of the solvent, the
129
solvent is anhydrous. A false positive reaction is anticipated if methanol is present in the probed
mixture. The test should be unsensible against higher alcohols.
A discussion contact with the manufacturer lead to a quick cross-check of ethanol sensitivity in
their laboratories: Ethanol will create a false positive reaction, quite similar to the one reported
for methanol. Again, the strong difference in ethanol vs. water abundance in typical gasolines
impedes a direct application of the indicator paper. According to the discussion partnere there is
no foreseeable chance to suppress this cross-sensitivity, so this indicator system is and will be not
appropriate for the task.
Chromatographic tests. When discussing the Watesmo paper the Macherey-Nagel chemical
analysis specialists also considered alternative methods, e.g. a chromatographic analysis. Again the
molecular similarity of ethanol and water is considered as prohibitive for an application.
Karl-Fischer titration. A somewhat complex approach is a titration with special subtances. The
method relies on the effect that iodine and sulphur dioxide react to iodide and sulphate only in the
presence and by consumption of water [29]. It may be used to extract solved water quantitatively
from solvents and at the same obtain a respective readout. This method requires several custom
Figure 72: Setup for a water detection by a Karl-Fischer titration. (Image source: Wikipedia)
chemical reactands (Fig. 72) part of which require to be freshly prepared before the titration takes
place. Within the scope of the present inquiry this methods seems to be the only practicable one to
reliably probe solved water. It is by no means applicable as a “quick pre-flight check” for a pilot,
though.
130
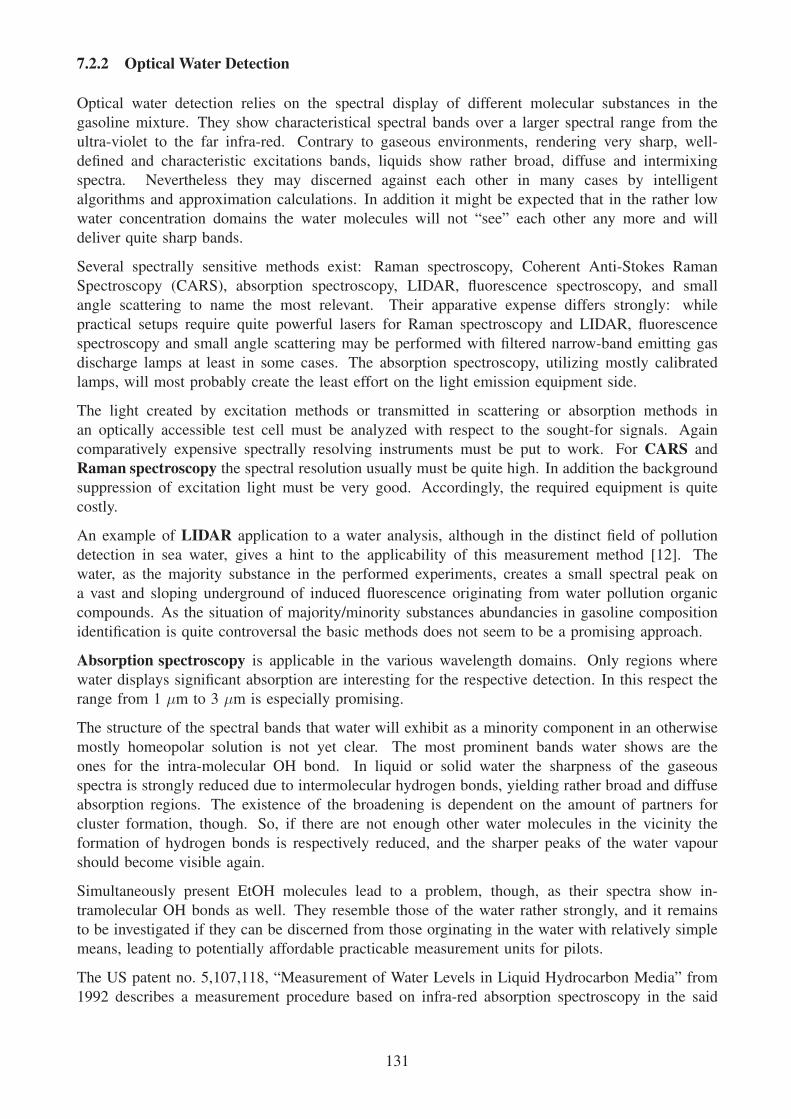
7.2.2 Optical Water Detection
Optical water detection relies on the spectral display of different molecular substances in the
gasoline mixture. They show characteristical spectral bands over a larger spectral range from the
ultra-violet to the far infra-red. Contrary to gaseous environments, rendering very sharp, well-
defined and characteristic excitations bands, liquids show rather broad, diffuse and intermixing
spectra. Nevertheless they may discerned against each other in many cases by intelligent
algorithms and approximation calculations. In addition it might be expected that in the rather low
water concentration domains the water molecules will not “see” each other any more and will
deliver quite sharp bands.
Several spectrally sensitive methods exist: Raman spectroscopy, Coherent Anti-Stokes Raman
Spectroscopy (CARS), absorption spectroscopy, LIDAR, fluorescence spectroscopy, and small
angle scattering to name the most relevant. Their apparative expense differs strongly: while
practical setups require quite powerful lasers for Raman spectroscopy and LIDAR, fluorescence
spectroscopy and small angle scattering may be performed with filtered narrow-band emitting gas
discharge lamps at least in some cases. The absorption spectroscopy, utilizing mostly calibrated
lamps, will most probably create the least effort on the light emission equipment side.
The light created by excitation methods or transmitted in scattering or absorption methods in
an optically accessible test cell must be analyzed with respect to the sought-for signals. Again
comparatively expensive spectrally resolving instruments must be put to work. For CARS and
Raman spectroscopy the spectral resolution usually must be quite high. In addition the background
suppression of excitation light must be very good. Accordingly, the required equipment is quite
costly.
An example of LIDAR application to a water analysis, although in the distinct field of pollution
detection in sea water, gives a hint to the applicability of this measurement method [12]. The
water, as the majority substance in the performed experiments, creates a small spectral peak on
a vast and sloping underground of induced fluorescence originating from water pollution organic
compounds. As the situation of majority/minority substances abundancies in gasoline composition
identification is quite controversal the basic methods does not seem to be a promising approach.
Absorption spectroscopy is applicable in the various wavelength domains. Only regions where
water displays significant absorption are interesting for the respective detection. In this respect the
range from 1 μm to 3 μm is especially promising.
The structure of the spectral bands that water will exhibit as a minority component in an otherwise
mostly homeopolar solution is not yet clear. The most prominent bands water shows are the
ones for the intra-molecular OH bond. In liquid or solid water the sharpness of the gaseous
spectra is strongly reduced due to intermolecular hydrogen bonds, yielding rather broad and diffuse
absorption regions. The existence of the broadening is dependent on the amount of partners for
cluster formation, though. So, if there are not enough other water molecules in the vicinity the
formation of hydrogen bonds is respectively reduced, and the sharper peaks of the water vapour
should become visible again.
Simultaneously present EtOH molecules lead to a problem, though, as their spectra show in-
tramolecular OH bonds as well. They resemble those of the water rather strongly, and it remains
to be investigated if they can be discerned from those orginating in the water with relatively simple
means, leading to potentially affordable practicable measurement units for pilots.
The US patent no. 5,107,118, “Measurement of Water Levels in Liquid Hydrocarbon Media” from
1992 describes a measurement procedure based on infra-red absorption spectroscopy in the said
131

region from 1 μm to 3 μm. A sensitivity of about 10 to 1000 ppm is achieved by applying rather
simple narrow-band transmission filters. The evaluation is based on a ratio building of absorption
band strengths determined with (scalar) integrating sensors. Contributions originating from EtOH
are not considered.
Evaluating the relative intensities over a larger spectral region acquired by a line camera instead
of single intensity peaks should yield the possibility of substracting even a sloping underground
created by other gasoline components or potentially EtOH. In recent years the prices of the
necessary electro-optic components (small form factor spectroscopes, line cameras, computerized
evaluation kits) significantly decreased, so a measurement kit development seems probable.
As of today no such tests have been reported for the domain of ethanol admixed gasolines, though.
7.2.3 Electrical Water Detection
The distinction of water from gasoline components may be performed electrically by monitoring the
dielectric constant of the medium under scrutiny, together with its ohmic resistance. Interrogation
of different manufacturers of respective devices yielded a mixed resonance. Some dismissed the
possibility of quantitative water assessment due to interferences with alcoholic ingredients of the
liquid under investigation: The OH group coupled to an aliphatic rest acts electrically in mostly the
same way as pure water does. Therefore some contacted distributors of respective measurement
system outright declined any application in the desired direction.
Another manufacturer was in turn rather convinced that his device would be able to meet the
challenge and sent an example device for custom tests. These were performed in the custom test
rig (see Appendix D.4, page 205).
�( �� �� �� �� �� �� �� �� �� ����
��
��
��
��
�
�
�
�
�������
��� ���
�������
�������
�� ����
�(��(�����(����
��������������
(!�"�#$(!�#�!( ���
�%�!(!(������#�&(�('�(&
Figure 73: Water detection with a dielectric monitoring device. Solvent: E-0 with increasing amountsof admixed water
132

Results for E-0 are shown in Fig. 73. Clearly, for a given fixed temperature the electrical readout is
strictly monotone with water abundance. There are reproducible deviations from linearity, though.
Also, the signal readout for the same water content changes significantly with temperature in a
range that may well be assumed by typical avionic boundary conditions.
The signal behaviour in the presence of ethanol is even worse7. As ethanol exhibits qualitatively the
same dielectric properties, though at a weaker signal level, there is no secure means of discerning
the water generated from the ethanol generated signal part. If there would be a quantitative
measurement device for ethanol concentration assessment, working with an error margin roughly
in the order of the required water amount distinction sensitivity, the setup of a respectively based
water sensor would appear feasible. From the present state of experimental tests this is not to be
expected.
7.2.4 Water detection by molecule-specific adsorption
Some chemical substances exhibit a strong tendency to adsorb water in their molecular or crystal
structures like a molecular sieve. This effect may be utilized to quantitatively extract the water
from the gasoline. One of those substances is zeolite. As a first test, the SIOBIA custom E-0
gasoline was mixed with ethanol and water to form a design-of-experiment inspired set of different
probes. Table 26 shows the chosen combinations.
Probo no. ethanol content water added
[% v/v] [ml]
1 5 0.6
2 10 0.3
3 10 1.3
4 15 1.0
5 15 2.0
6 0 0.0
Table 26: Abundancy matrix for zeolite water absorption tests. The respective admixtures were giveninto 200 ml of gasoline each.
Furtheron six probes of dried zeolite granules were prepared with differing masses in the range
of 10 g to 15 g and matched randomly to the six gasoline probes. The amount of zeolite was
chosen so that it would securely be able to absorb any water admixture of the gasoline probes.
At the time of the experiment the airtight kept zeolite amounts were put into the gasoline bottles
and vehemently shaken in order to provoke the largest possible absorption of water from the liquid
(Fig. 74, left).
Subsequently the gasoline is filtered out of the zeolite samples, leaving the wet granules on a
filter paper to dry out. In an exhaust hood the residual gasoline is slowly evaporating from the
granules. With decreasing gasoline wetting the very strong absorption of air humidity increases
that superimposes the water absorption from the gasoline and should be taken into account. The
evaluated weighing event took place half an hour after probe filtering.
7The tested device became dysfunctional before further measurement series with defined alcohol contents could be
performed. Unluckily, the manufacturer was not able to provide a replacement item in time before the experimentation
phase for this report had to be terminated.
133

Figure 74: Zeolite water absorption experiment: Zeolite granules are given to gasoline probes (left).After vigorous shaking the zeolite is filtered, and the filter residues are weighed aftersome time of gasoline evaporative drying. Image right shows slightly differently colouredfiltering samples with differing dry times.
Regrettably there is no simple way of evaluation, as hoped for at first: No direct relation between
probe water content and weight change of the respective filtering residue could be stated. The
causal interrelations between the various contributing effects must obviously be taken into account:
• The boiling curve of the gasoline causes a slow fractionating evaporation, visible from the
gradual change of the granules’ colour. Directly after the filtration the grits are dark brown as
is the colour in the mixture, seen also in the submerged sediments in the bottles of Fig. 74,
left side. Some minutes later they become greyish and, after about 15 to 20 minutes, they
change to a very light brown (cf. Fig. 74, right side).
• The ethanol may be absorbed differently compared to the base gasoline components, and
also compared to the water.
• With ongoing desiccation the granule surfaces open towards the air humidity which is readily
absorbed by zeolite.
• The indidivual grit does not have a well-defined surface. Instead the granules exhibit vast
areas of internal ones. Accordingly, the absorption determining interface does not need to be
proportional to the mass powered by 2/3, as is to be expected for typical ideal solid particles.
The potential effects are taken into account by defining a postulated theoretical zeolite residue mass
formula with either three or four free parameters describing the contribution of the various effects.
As approximation tool a evolutionary Pareto optimization was put to work, minimizing at the same
time but independently the mean average error for all six probes and the maximum error that (at
least) one probe would show for a given set of fitting coefficients. The result of this evalution is
shown in Fig. 75.
If all the specified influences are considered but the results are thought as independent from the
water content of the individual probes the red circle set of results apears, forming a trade-off curve
of the two considered kinds of errors. Each symbol indicates an individual set of fit parameters.
As a reading example, if we accept a mean error of 0.08 g zeolite weight for all the probes we
will at the same time have to accept 0.15 as a maximum error that is found in at least one of the
134
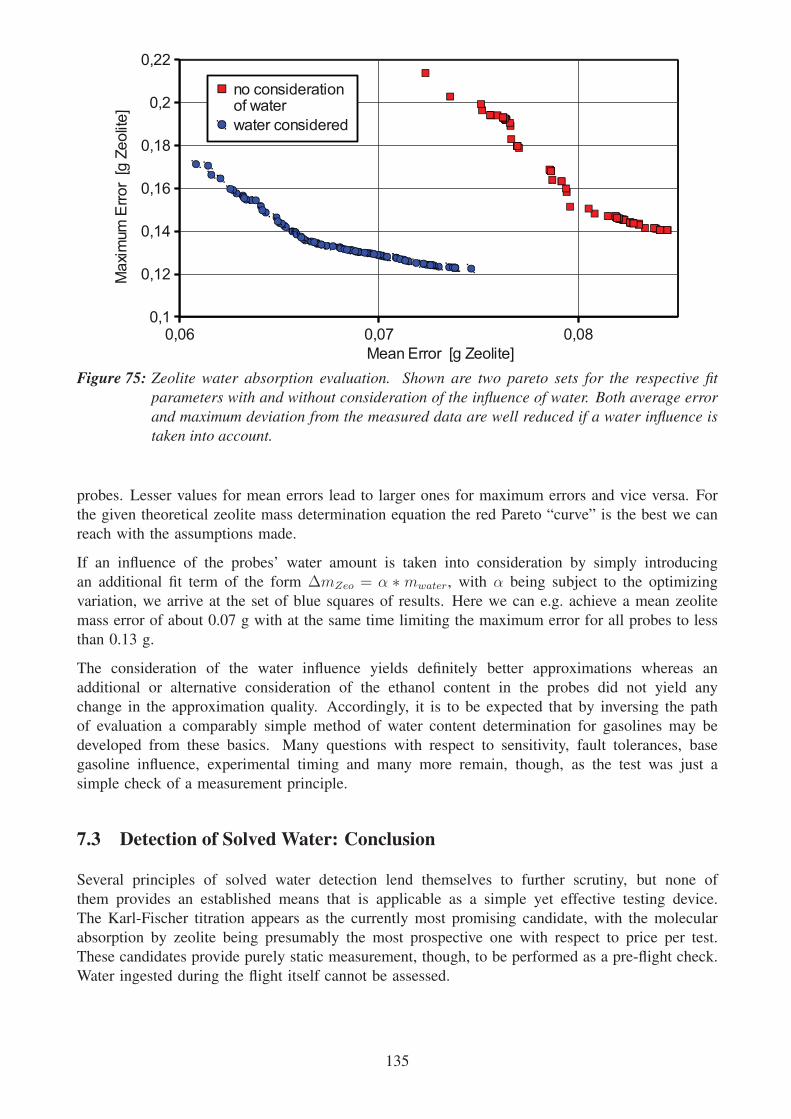
(*() (*(� (*(�(*�
(*��
(*�
(*�)
(*��
(*�
(*��
��������������� ����
�������������
�������������������
����������������������
Figure 75: Zeolite water absorption evaluation. Shown are two pareto sets for the respective fitparameters with and without consideration of the influence of water. Both average errorand maximum deviation from the measured data are well reduced if a water influence istaken into account.
probes. Lesser values for mean errors lead to larger ones for maximum errors and vice versa. For
the given theoretical zeolite mass determination equation the red Pareto “curve” is the best we can
reach with the assumptions made.
If an influence of the probes’ water amount is taken into consideration by simply introducing
an additional fit term of the form ΔmZeo = α ∗ mwater, with α being subject to the optimizing
variation, we arrive at the set of blue squares of results. Here we can e.g. achieve a mean zeolite
mass error of about 0.07 g with at the same time limiting the maximum error for all probes to less
than 0.13 g.
The consideration of the water influence yields definitely better approximations whereas an
additional or alternative consideration of the ethanol content in the probes did not yield any
change in the approximation quality. Accordingly, it is to be expected that by inversing the path
of evaluation a comparably simple method of water content determination for gasolines may be
developed from these basics. Many questions with respect to sensitivity, fault tolerances, base
gasoline influence, experimental timing and many more remain, though, as the test was just a
simple check of a measurement principle.
7.3 Detection of Solved Water: Conclusion
Several principles of solved water detection lend themselves to further scrutiny, but none of
them provides an established means that is applicable as a simple yet effective testing device.
The Karl-Fischer titration appears as the currently most promising candidate, with the molecular
absorption by zeolite being presumably the most prospective one with respect to price per test.
These candidates provide purely static measurement, though, to be performed as a pre-flight check.
Water ingested during the flight itself cannot be assessed.
135

Optical measurements of spectral properties may be developed into online testing equipment that
works continuously even during the flight. Since technical liquid media exhibit mostly broad ab-
sorption or scattering bands and are susceptible to staining, extensive theoretical and experimental
investigations will have to be performed before any reliable testing method may evolve. Even
though the necessary technical base devices (light sources, spectrometers, multidimensional detec-
tors) become more and more available the system price for a potential test device will expectedly
be rather high.
Testing procedures requiring additional input of mostly exact ethanol abundance will not alleviate
the problem as there is no qualified method of such an anteceding measurement at hand either.
136

8 Life-Cycle Analysis of Ethanol-Admixed Gasolines (T 5)
8.1 Approach / Methodology
Due to the enforcement of the EU directive 2009/28/EC more oxygenates produced from organic
materials like bioethanol will be added to the automotive gasoline. Some General Aviation aircraft
equipped with spark ignited piston enginges are approved for operation with MOGAS. However, the
majority of those approvals is limited to MOGAS containing a maximum of 1 % of ethanol while
the current fuel specification EN 228 permits already up to 5 % (bio-)ethanol as fuel admixture.
According to the longer-term policy of the European Union an increase of that number is to be
expected in the years to follow, as gradually the lifetimes of older cars requiring low ethanol
admixture shares will come to their ends.
Even though the share of gasoline used for non-automotive engine operation is explicitly excluded
from the enforced biogenic admixture requirements, the share of gasoline consumed in aviation is
so tiny that it seems economically prohibitive for the fuel provision companies to provide a custom
gasoline brand outside the usual variations of automotive fuels. Accordingly, General Aviation will
either have to adapt to the usage of ethanol admixed MOGAS in the future, or return in majority to
the leaded AVGAS 100LL which, in spite of its “low lead” specification, contains quite a lot of it.
As the future mandatory ethanol admixture is mainly focusing on the reduction of CO2 emissions
and hence aiming at the amelioration of environmental conditions it is sensible as a look-ahead
consideration to assess implications of ethanol fuel admixtures also on the various other influenced
environmental properties. The life-cycle analysis section in this report scrutinizes this objective
with a focus on the aviation related issues and peculiarities. Contrasting the focus of the whole
report which is technically safety-oriented, the objectives of this section are targeted differently:
Based on identified knowledge gaps, and within the scope of this project, investigate the potentialenvironmental benefits, using life-cycle analyses, from the production, supply and use of variousbiomass sources for biofuels.
In a subcontract to LUDWIG BÖLKOW SYSTEMTECHNIK, Ottobrunn, (furtheron called LBST) the
consecuting objectives have been investigated in further detail. The self-contained LBST report,
included as Appendix E, p. 213ff, is given as an attachment to this core part of the complete report.
The general topic of interest covers the complete lifecycle of biogenic ethanol as an admixture of
aviation gasolines, so to say from seed to propeller. In the scope of the present research activities
this admixture will only be considered for aircraft models presently already capable/permitted to
fly on MOGAS.
On its way from the biogenic source to the airfield fuel station tank assumptions on the environ-
mental impact are considered as comparable to those made for the usage of ethanol admixed fuel in
automotive utilisation. The respective premises are particularized in the full report attached. They
consider a variety of pathways (different crops and respective transport necessities) for bioethanol
procuration.
There are certain differences in vehicle and aircraft fuel combustion, however: While practically
all vehicles in the EU are equipped with catalyzers and hence produce very few exhaust emissions
apart from CO2 and H2O, this is not the case for aircraft combustion systems where no catalyzers
exist at all. In addition there are only a few load cases relevant in aviation usages (Fig. 76):
Full load (take-off operation), best efficiency (cruising operation), part load (taxi operation on the
airfield), and idle (warm-up on ground). Respective data have been recorded both for the ROTAX
and the MORANEengines and have been provided as calculational basis to LBST.
137

Figure 76: Flight profile assumption for comparative LCA studies, representing the typical loadstates as relative values. For engine related definition of the respective operation pointscf. Fig. 92, p. 204
Accordingly, the next objective is to assess the difference of vehicle and aircraft combustion
cases under the assumption of “average European gasoline” as the governing fuel for all gasoline
usage scenarios (including the ethanol-admixed cases with accordingly less gasoline amounts in
the fuel). The most prominent difference is the complete lack of catalyzers in aviation, leading to
very different finally remanent emissions due to mostly sub-stoichiometric combustion in aircraft,
different typical load scenarios.
In the light of dwindling chances to obtain STC compliant MOGAS (less than 1 % ethanol
abundancy) a lot of pilots might become forced to return to AVGAS, restarting to emit vast amounts
of lead as there is no practical alternative to the commonplace AVGAS 100LL. As a consequence
the LCA is to consider the increase of lead contamination of the atmosphere, with the worst-case
scenario being all (or most of ) the aircraft returning to AVGAS usage.
8.2 Experimental Investigation of Exhaust Gas Emissions for a ROTAX 912ULS Engine
For emission assessment the ROTAX engine is mounted on AcUAS’s test rig as shown in Sect. D.3.
The rig features a state-of-the-art measurement devices assortment for temperature, pressure, fuel
mass flow, noise and vibration. The measured values are automatically sampled by Imps of
Schlumberger and converted and indicated with an adequate post-processing system. For the
SIOBIA project an electrically heated 20 m long exhaust gas analysis tube has been built and
connected by an additional 5 m flexible hose to the exhaust gas analysis equipment in an adjacent
laboratory.
The ROTAX is equipped with a carburettor system similar to those used in cars in pre-catalyzer
times. In contrast to many larger US-American engines the mixture formation cannot be adjusted
manually. Instead, the mixture characteristic is determined by the setting of the carburettor itself.
138
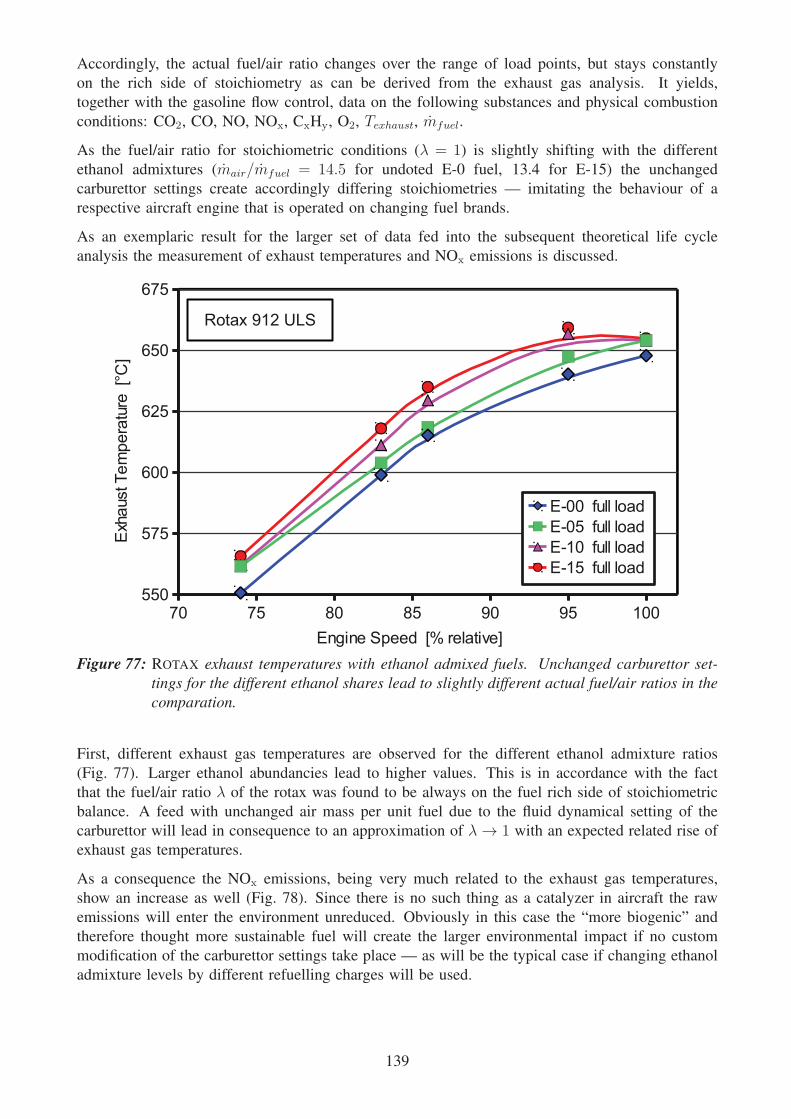
Accordingly, the actual fuel/air ratio changes over the range of load points, but stays constantly
on the rich side of stoichiometry as can be derived from the exhaust gas analysis. It yields,
together with the gasoline flow control, data on the following substances and physical combustion
conditions: CO2, CO, NO, NOx, CxHy, O2, Texhaust, mfuel.
As the fuel/air ratio for stoichiometric conditions (λ = 1) is slightly shifting with the different
ethanol admixtures (mair/mfuel = 14.5 for undoted E-0 fuel, 13.4 for E-15) the unchanged
carburettor settings create accordingly differing stoichiometries — imitating the behaviour of a
respective aircraft engine that is operated on changing fuel brands.
As an exemplaric result for the larger set of data fed into the subsequent theoretical life cycle
analysis the measurement of exhaust temperatures and NOx emissions is discussed.
�� �� �� �� �� �� ������
���
��
��
��
��
����������*
����������*
����������*
����������*
��)�������*���������)���
� ��!����"�����������#$�
%���������&'�
Figure 77: ROTAX exhaust temperatures with ethanol admixed fuels. Unchanged carburettor set-tings for the different ethanol shares lead to slightly different actual fuel/air ratios in thecomparation.
First, different exhaust gas temperatures are observed for the different ethanol admixture ratios
(Fig. 77). Larger ethanol abundancies lead to higher values. This is in accordance with the fact
that the fuel/air ratio λ of the rotax was found to be always on the fuel rich side of stoichiometric
balance. A feed with unchanged air mass per unit fuel due to the fluid dynamical setting of the
carburettor will lead in consequence to an approximation of λ → 1 with an expected related rise of
exhaust gas temperatures.
As a consequence the NOx emissions, being very much related to the exhaust gas temperatures,
show an increase as well (Fig. 78). Since there is no such thing as a catalyzer in aircraft the raw
emissions will enter the environment unreduced. Obviously in this case the “more biogenic” and
therefore thought more sustainable fuel will create the larger environmental impact if no custom
modification of the carburettor settings take place — as will be the typical case if changing ethanol
admixture levels by different refuelling charges will be used.
139
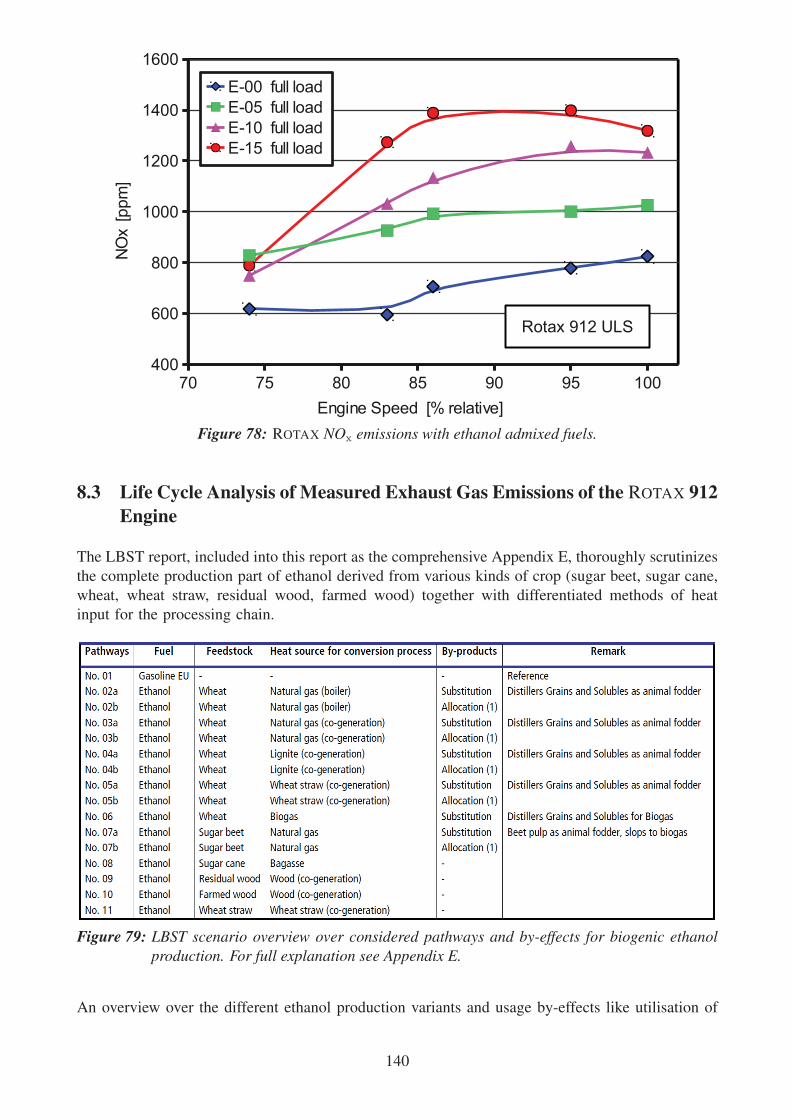
%���������&'�
�� �� �� �� �� �� ���(��
��
���
����
����
�(��
���
����������*
����������*
����������*
����������*
��)�������*���������)���
)*������"�
%���������&'�
Figure 78: ROTAX NOx emissions with ethanol admixed fuels.
8.3 Life Cycle Analysis of Measured Exhaust Gas Emissions of the ROTAX 912Engine
The LBST report, included into this report as the comprehensive Appendix E, thoroughly scrutinizes
the complete production part of ethanol derived from various kinds of crop (sugar beet, sugar cane,
wheat, wheat straw, residual wood, farmed wood) together with differentiated methods of heat
input for the processing chain.
Figure 79: LBST scenario overview over considered pathways and by-effects for biogenic ethanolproduction. For full explanation see Appendix E.
An overview over the different ethanol production variants and usage by-effects like utilisation of
140

by-products is given in Fig. 79. The resulting greenhouse gas emissions of this first part of the
ethanol utilization chain analysis, so to say the well-to-tank analysis, is summarized in Fig. 80 in
the form of CO2 equivalents by assigning respective multiplicators to N2O and CH4 as the main
climate relevant heat absorbers besides CO2.
Figure 80: LBST well to tank greenhouse gas emission analysis results, comprising a variety of vari-ants of process heat / steam generation for endothermic assisting processes (lignite crack-ing etc.). The various considered emissions (N2O, CH4) are introduced into the calcula-tion as CO2 equivalents.
The analysis shows a number of differentiated balances in comparison to the reference case of the
amount of CO2 being produced by simply bringing fossil gasoline to the tank (Fig. 80, leftmost
column). CO2 emission equivalents are sketched as positive, CO2 savings (mostly by binding the
carbon content into the ethanol and thereby reducing the entry into the atmosphere) as negative
columns. It should be stressed, though, that only the production and provisioning of the respectivefuels are balanced in these columns, not the subsequent combustion in the engine. The main result
of the well-to-tank analysis is that most (but not all) methods of ethanol production lead to a
certain reduction of greenhouse gases. Nevertheless the amount of CO2 equivalents production in
this process is non-negligible, and some methods of prepartion consume a larger part of the CO2
bound in ethanol already.
Independent from the provisioning the tank-to-propeller GHG production analysis is performed.
Changed emissions of ethanol admixed gasolines relative to ordinary fossil E-0 brands, measured
by AcUAS for the ROTAX 912 ULS engine, are taken as a calculational basis when the final GHG
reduction is calculated for the different szenarios. Fig. 81 shows the result for an E-15 gasoline,
resulting in GHG savings in the order of 16 %. It should be noted that the GHG reduction potential,
at least for some variants, is even slightly above the volumetric share of the ethanol in the gasoline
even though the energetic share of the admixed gasoline is decisively smaller. Qualitatively, this
141

Figure 81: LBST well to propeller greenhouse gas emission analysis results, shown here as an exam-ple for the analysis of E-15 combustion.
may be tracked down to the fact that the combustion of the ethanol-admixed gasoline is partially
cleaner than that of the basic MOGAS (E-0). Due to the non-existence of catalyzers this has a
significant effect on the overall GHG balances, especially if the non-CO2 pollutants are considered
as CO2 equivalents.
These further emissions, especially NOx and NMVOC, are investigated in detail. Here the tank-to-
propeller part is the by far dominating one due to the lack of catalyzer exhaust gas after-treatments
in small aircraft. While NMVOC tend to decrease slightly with rising ethanol content the NOx
production even considerably increases. Here it should be emphasized that the carburettor and the
setting of ignition timing of the ROTAX engine remained unchanged for the different E-xx gasolines
and the operating points where chosen to deliver the same effective mechanical power.
Finally a lead analysis is performed for the scenario that the present MOGAS operated aircraft
would need to return to AVGAS if the present ethanol STC restrictions cannot be met in the case of
a general drop of ethanol-free gasoline. For that case an increase of the lead dispersed by avionic
combustion of about 50 % is predicted. Taking into account the detailed flight hour data available
for Germany this leads to an increase prognosis of presently about 12 t to 18 t per year for this
country.
The full LBST report is reproduced in Appendix E on pages 213ff.
142
8.4 Conclusions
Depending on the method of biogenic ethanol admixture production quite different GHG savings
are accomplishable. While some methods, exploiting mainly fruits of plants while discarding other
plant components just about match the energetic input they still require for their production, novel
techniques exploiting non-food plants and supplying required processing heat input by biogenic
combustibles will increase the saving potential considerably.
Even for suboptimally produced biogenic fuel admixtures the overall balances indicate a substantial
reduction of GHG emissions. This is caused by a change of combustion process emissions in the
presence of ethanol in the gasoline. This effect is, to a great extent, not related to the biogenic
origin of the ethanol, but to a shift in the operating point of the engine: the fuel-air ratio is changed
slightly to a less fuel-rich setting, thus increasing the efficiency coefficient of the engine. If the
engine is re-tuned to achieve the same maximum power output for ethanol-admixed gasolines the
consumption and hence GHG emission reduction would lessen again considerably.
As the main parts of this report show, safety issues do exist if ethanol admixtures are present in
gasolines used in aviation. Accordingly even presently MOGAS operated aircraft may be forced to
revert to AVGAS utilisation if these issues cannot be overcome. In that case not only the small
but perceptible potential GHG emission reduction is lost but also an increase of lead emissions of
about 50 % relative to today’s value is to be expected.
143

References
[1] Automotive Fuels Reference Book. 1995.
[2] ADAC. Mehr bioethanol im ottokraftstoff (e 10).
http://www.adac.de/Auto_Motorrad/Tanken/Ehtanolbeimischung/default.asp?TL=2, 2008.
[3] European Environment Agency. Average age of passenger cars in the eu and in selected
countries. http://dataservice.eea.europa.eu/atlas/viewdata/viewpub.asp?id=743, 2003.
[4] Light Aircraft Association UK Barry Plumb. Share of certified and potential en 228 using
aircraft. Technical report, 2009.
[5] S. Bauer, J. Krüger-Venus, M. Kulikowski, and O. Büchner. Alternative fuels test program
plastics, elastomers and glue connections. Mineral Oil Based and Alternative Fuels, 2009.
[6] E. Brandes, D.-H. Frobese, and M. Mitu. Safety characteristics of ethanol / automotive petrol
mixtures. OIL GAS European Magazine, 4:199–202, 2006.
[7] Christopher Earls Brennen. Cavitation and Bubble Dynamics. Oxford University Press, 1995.
[8] Orbital Engine Company. Market barriers to the uptake of biofuels study i. Technical report,
2003.
[9] Orbital Engine Company. Market barriers to the uptake of biofuels study ii. Technical report,
2003.
[10] Gates Corporation. Chemical resistance table. 2008.
[11] Luftfahrtbundesamt Deutschland. Betriebszeiten von flugzeugen der general aviation. Techni-
cal report, 2008.
[12] Violetta Drozdowska, Sergey Babichenko, and Aleksey Lisin. Natural water fluorescence
characteristics based on lidar investigations of a surface water layer polluted by an oil film;
the baltic cruise. OCEANOLOGIA, 44(2):339–354, 2002.
[13] ECAC. Compilation of statistic accidents in general aviation for 2006 with a comparison with
the years 2004 and 2005. Technical report, 2006.
[14] B. Engelen. Guidelines for blending and handling motor gasoline containing up to 10% v/v
ethanol. Concawe Report, 3, 2008.
[15] Deutscher Aero Club e.V. Bereits erteilte emzs (motoren und zellen). Technical report, 2009.
[16] TC Ezeji, N. Qureshi, P. Karcher, and HP Blaschek. chapter Production of Butanol from
Corn, pages 99–118. CRC Press, 2006.
[17] Verein Deutscher Ingenieure. VDI-Wärmeatlas, 8th edition, electronic version. 1997.
[18] to be validated by EASA IRCA/ICAO. Database of registered general aviation aircraft,
national registers. Technical report, 2005.
[19] S. Kahn Ribeiro, S. Kobayashi, M. Beuthe, J. Gasca, D. Greene, D.S. Lee, Y. Muromachi, P.J.
Newton, S. Plotkin, D. Sperling, R. Wit, and P. J. Zhou. Climate Change 2007: Mitigation,
chapter Transport and its infrastructure. Contribution of Working Group III to the Fourth
Assessment Report of the Intergovernmental Panel on Climate Change. Cambridge University
Press, Cambridge, United Kingdom and New York, NY, USA, 2007.
144

[20] Kenneth Kar. Measurement of vapor pressures and enthalpies of vaporization of gasolin. SAEspecial publication, 2187:155–167, 2008.
[21] Hans Keuken, Tom MacDonald, Eric de Jager, and Jo Sijben. Hydrous ethanol for gasoline
blending. 2008.
[22] Béla G. Lipták. Process measurement and analysis. page 1486 ff, 2003.
[23] none given. Front lines on the e-gas battleground. Practical Sailor, November, 2008.
[24] International Council of Aircraft Owner and Pilot Associations (IAOPA). Statistical report on
active general aviation aircrafts, world assembly. Technical report, April 2006.
[25] National Transportation Safety Board of the USA. Factual report on an aircraft accident, no.
n6034j. Factual Report Aviation, 2006.
[26] European Parliament. Directive 2009/28/ec of the european parliament and of the council on
the promotion of the use of energy from renewable sources and amending and subsequently
repealing directives 2001/77/ec and 2003/30/ec. 2009.
[27] personal communication. Ethanol alcohol fuel test kit, 2009.
[28] Jan Ludzay Rudolf Terschek. Dgmk forschungsbericht 645. Technical report, 2005.
[29] E. Scholz. Karl-Fischer-Titration. Springer-Verlag, Berlin, 1984.
[30] M. Scholz and J. Ellermeier. Korrosionsverhalten unterschiedlicher aluminiumlegierungen in
ethanolhaltigem ottokraftstoff unter erhöhten temperaturen. 10(37):842–851, 2006.
[31] R. Sykes. The use of fuels containing ethanol in light aircraft, 2007.
[32] Fuel Testers. About ethanol fuels. http://www.fuel-testers.com/aboutethanolfuel.html, 2008.
[33] Justin Wastinage. Out with the old. Flight International, 04, 2003.
[34] Wikipedia. Ethanol. Technical report, 2009.
[35] Wikipedia.org. Siedekurven verschiedener kraftstoffe. Technical report, 2009.
145

A Engines and Cells Certified by the United States FAA
The consecuting list reports American FAA supplementary type certificates (STCs) for MOGAS
usage.
The list does not raise the claim to be complete. It rather helps with identifying a certain aircraft asworthwile for interrogating the manufacturer on this behalf.
Certified Engines
Manufacturer Continental
Series Type
A-65- 1, -3, -6, -6J, -7, -8, (O-170-3, -7)-8F, -8FJ, -8J, -9, (O-170-5), -9F, -9FJ, -9J,
-12, -12F, -12FJ, -12J, -14, -14F, -14FJ, -14J
A-75 -3, -6, -6J, -8, -8F, -8J, -8FJ, -9, -9J
C-75 -8, -8F, -8FH, -8FHJ, -8FJ, -8J, -12, -12F, -12FH, -12FHJ, -12FJ, -12J, -12B,
-12BF, -12BFH, -15, -15F,
C-75 -8, -8F, -8FH, -8FHJ, -8FJ, -8J, -12, -12F, -12FH, -12FHJ, -12FJ, -12J, -12B,
-12BF, -12BFH, -15, -15F,
C85 -8, -8F, -8FHJ, -8FJ, -8J, -12, -12F, -12FH, -12FHJ, -12FJ, -12J, -14F, -15, -15F
C-90 -8F, -8FJ, -12F, -12FH, -12FJ, -12FP, -14F, -14FH, -14FJ, -16F, C90-()
0-200 -A, O-200-B, O-200-C, RR O-200-(), RR O-300-()
C-115 -1, C-115-2, C-125-1, C-125
E-165 -2, -3, -4, E-185-1, -2, -3, (O-470-7, -7A), -5, -8, -9, (O-470-7B), -10, -11
E-225 -2, -4, -8, -9
O-300 -A, -B, -C, -D, -E, C-145-2, -2H, -2HP.
GO-300 -A, -B, -C, -D, -E, -F
O-470 -A, -E, -J, -K, -L, -R, -S. O-470-4, -11, -11B, -11-CI. -11B-CI, -13, -13◦, -15,
O-470
IO-470 -J & -K
W670 -6A, (R-670-3, -5), -6N, (R-670-4), -16 (R-670-8, -11, -11A), -23, -24, -K, -M
Manufacturer Franklin
Series Type
6A4-150-B3, B4, B31, 6A4-165-B3, B4, B6, 4AC-176-B2, B3, BA2, (0-175-1),
BA3, C2, C3, D2, D3, F2, F3
Manufacturer Jacobs
Series Type
R-755, - All models
Manufacturer Kinner
Series Type
R-5 Series 2, R-55, R-56, (R-540-1, -3)
146
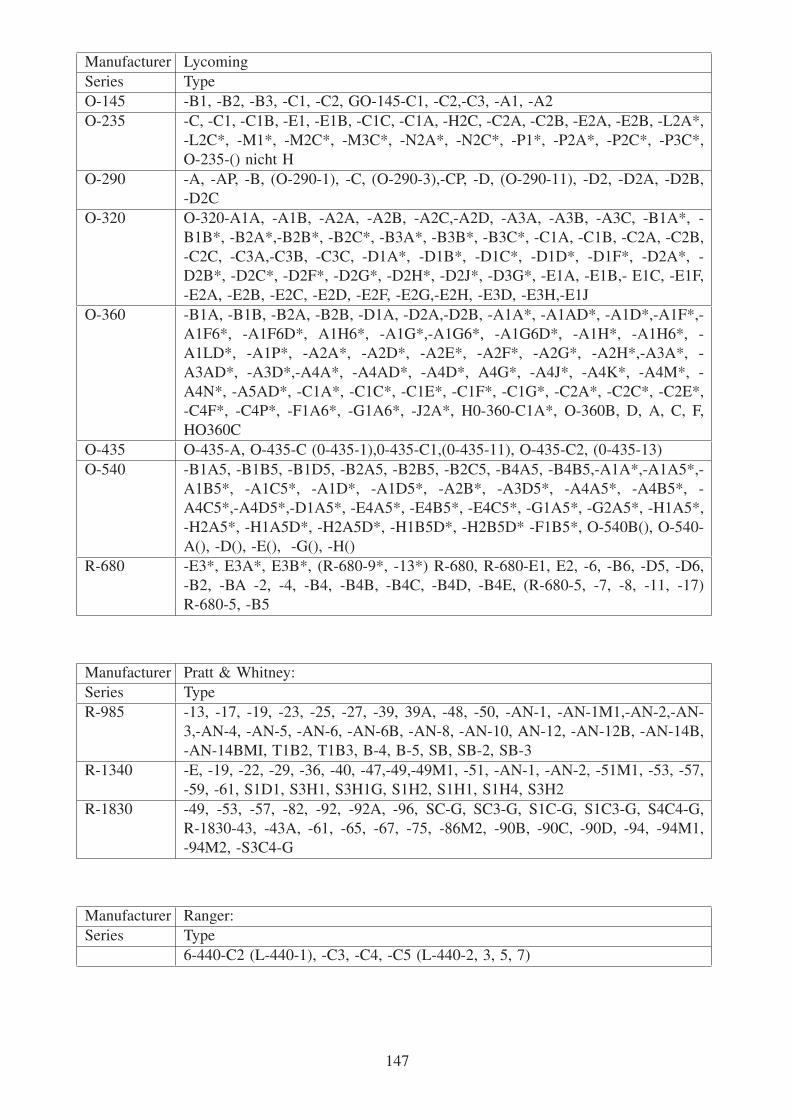
Manufacturer Lycoming
Series Type
O-145 -B1, -B2, -B3, -C1, -C2, GO-145-C1, -C2,-C3, -A1, -A2
O-235 -C, -C1, -C1B, -E1, -E1B, -C1C, -C1A, -H2C, -C2A, -C2B, -E2A, -E2B, -L2A*,
-L2C*, -M1*, -M2C*, -M3C*, -N2A*, -N2C*, -P1*, -P2A*, -P2C*, -P3C*,
O-235-() nicht H
O-290 -A, -AP, -B, (O-290-1), -C, (O-290-3),-CP, -D, (O-290-11), -D2, -D2A, -D2B,
-D2C
O-320 O-320-A1A, -A1B, -A2A, -A2B, -A2C,-A2D, -A3A, -A3B, -A3C, -B1A*, -
B1B*, -B2A*,-B2B*, -B2C*, -B3A*, -B3B*, -B3C*, -C1A, -C1B, -C2A, -C2B,
-C2C, -C3A,-C3B, -C3C, -D1A*, -D1B*, -D1C*, -D1D*, -D1F*, -D2A*, -
D2B*, -D2C*, -D2F*, -D2G*, -D2H*, -D2J*, -D3G*, -E1A, -E1B,- E1C, -E1F,
-E2A, -E2B, -E2C, -E2D, -E2F, -E2G,-E2H, -E3D, -E3H,-E1J
O-360 -B1A, -B1B, -B2A, -B2B, -D1A, -D2A,-D2B, -A1A*, -A1AD*, -A1D*,-A1F*,-
A1F6*, -A1F6D*, A1H6*, -A1G*,-A1G6*, -A1G6D*, -A1H*, -A1H6*, -
A1LD*, -A1P*, -A2A*, -A2D*, -A2E*, -A2F*, -A2G*, -A2H*,-A3A*, -
A3AD*, -A3D*,-A4A*, -A4AD*, -A4D*, A4G*, -A4J*, -A4K*, -A4M*, -
A4N*, -A5AD*, -C1A*, -C1C*, -C1E*, -C1F*, -C1G*, -C2A*, -C2C*, -C2E*,
-C4F*, -C4P*, -F1A6*, -G1A6*, -J2A*, H0-360-C1A*, O-360B, D, A, C, F,
HO360C
O-435 O-435-A, O-435-C (0-435-1),0-435-C1,(0-435-11), O-435-C2, (0-435-13)
O-540 -B1A5, -B1B5, -B1D5, -B2A5, -B2B5, -B2C5, -B4A5, -B4B5,-A1A*,-A1A5*,-
A1B5*, -A1C5*, -A1D*, -A1D5*, -A2B*, -A3D5*, -A4A5*, -A4B5*, -
A4C5*,-A4D5*,-D1A5*, -E4A5*, -E4B5*, -E4C5*, -G1A5*, -G2A5*, -H1A5*,
-H2A5*, -H1A5D*, -H2A5D*, -H1B5D*, -H2B5D* -F1B5*, O-540B(), O-540-
A(), -D(), -E(), -G(), -H()
R-680 -E3*, E3A*, E3B*, (R-680-9*, -13*) R-680, R-680-E1, E2, -6, -B6, -D5, -D6,
-B2, -BA -2, -4, -B4, -B4B, -B4C, -B4D, -B4E, (R-680-5, -7, -8, -11, -17)
R-680-5, -B5
Manufacturer Pratt & Whitney:
Series Type
R-985 -13, -17, -19, -23, -25, -27, -39, 39A, -48, -50, -AN-1, -AN-1M1,-AN-2,-AN-
3,-AN-4, -AN-5, -AN-6, -AN-6B, -AN-8, -AN-10, AN-12, -AN-12B, -AN-14B,
-AN-14BMI, T1B2, T1B3, B-4, B-5, SB, SB-2, SB-3
R-1340 -E, -19, -22, -29, -36, -40, -47,-49,-49M1, -51, -AN-1, -AN-2, -51M1, -53, -57,
-59, -61, S1D1, S3H1, S3H1G, S1H2, S1H1, S1H4, S3H2
R-1830 -49, -53, -57, -82, -92, -92A, -96, SC-G, SC3-G, S1C-G, S1C3-G, S4C4-G,
R-1830-43, -43A, -61, -65, -67, -75, -86M2, -90B, -90C, -90D, -94, -94M1,
-94M2, -S3C4-G
Manufacturer Ranger:
Series Type
6-440-C2 (L-440-1), -C3, -C4, -C5 (L-440-2, 3, 5, 7)
147

Manufacturer Warner
Series Type
Super Scarab 40, 50 (R-500-2), 50A (R-500-4, -6)
Scarab Series 28, 29, 30, 40, 50, Super Scarab 165 (R-500-1, -7), 165-A, 165-B,
165-D, 185, 185J (R-550-1, -3), 185K
Certified Cells
Manufacturer Aeronca
Series Type
15AC, S15AC, 65-TC, YO-58, 65-TAC
Manufacturer Aero Commander
Series Type
10, 100, 10A, 100A
Manufacturer Air Tractor
Series Type
AT-300, AT-300
Manufacturer Ayres Thrush
Series Type
S-2C and 600 S-2C, Serial Nos. 1163C & 600-1163C thru 1526C or 600-1526C
only 600-S2D, S-2R, S2R-R1340
Manufacturer Beech
Series Type
AT-11, SNB-1, D18S, E18S, C45G, TC-45G, C-45H, TC-45H, TC45J, UC-45J,
(SNB-5), RC45J (SNB-5P), E-18S-9700, G-18S, H-18, URB-6, 3N, 3NM, 3TM,
D17S, 35, A35, B35, C35, D35, E35, F35, G35, 35R, 35-33, 35-A33, 35-B33,
35-C33, E33, F33,
Manufacturer Boeing
Series Type
75 (PT-13), A75 (PT-13A, -13B, -13C), B75 (N2S-2), E75 (PT-13D, NS2-5,
PT-13D/N2S-5), A75J1 (PT-18), A75L300, A75N1 (PT-17, -17A, N2S-1, -4)
B75N1 (N2S-3), D75N1 (PT-27), IB75A, E75N1, A75L3
148

Manufacturer Bellanca
Series Type
7AC,7CCM,7EC,7ECA,7FC,7GCB,7GCBC, 11AC, S11AC, 11BC, S11BC,
11CC, S11CC
Manufacturer Brewster
Series Type
Fleet7
Manufacturer Callair
Series Type
A-9,A-9A
Manufacturer Champion
Series Type
7GCAA, 7GCBC, 7AC, S7AC, 7BCM, 7CCM, 7DC, S7DC, S7CCM, 7EC,
S7EC, 7FC, 7GC, (Aeronca) 7HC, 7GCA, 7JC, 7GCB, 7KC, 7GCBA, 7ECA,
8GCBC
Manufacturer Cessna
Series Type
O-1D, O-1E, O-1F, O-1G, 120, 140, 140A, 150, 150A thru 150M, 152, A152,
170A, 170B, 172, 172A ... 172N, 172P, 175,175A, 175B, 175C, 177, 180, 180A,
180B, 180C, 180D, 180E, 180F, 180G,180H, 180J, 182, 182A, 182B, 182C,
182D, 182E, 182F, 182G, 182H, 182J, 182K, 182L, 182M, 182N, 182P, 188,
188A, 188B, 190,195, 195A, 195B, 305A, 305C, 305D, 305F, A150K, A150L,
A150M, 305B, 305E, F172P, P172D, TO-1D, USAFO-1A
Manufacturer Christen
Series Type
Husky A-1
Manufacturer De Havilland
Series Type
DHC-2MKI
149

Manufacturer Douglas
Series Type
DC3A-SCG, -SC3G, -S1CG, -S1C3G & -S4C4G, DC3C-SC3G, -S1C3G, -
S4C4G, DC3C-R-1830-90C, DC3D-R-1830-90C
Manufacturer Fairchild
Series Type
24R, 24W, 24C8C & 24C8CS
Manufacturer Funk
Series Type
B, B75L, UC-92, B85C
Manufacturer Grumman
Series Type
G-164, G-164A, G-164B, [G-21 (Goose), must have Pesco P/N 2E608 electric
fuel pumps], AA-5, AA-5A (nur mitO-320-E2G)
Manufacturer Gulfstream American
Series Type
AA-5, AA-5A
Manufacturer Globe (Temco)
Series Type
GC-1A & GC-1B
Manufacturer Gomolzig
Series Type
DR 300/108 -/125 -/180R, DR315, DR400/120(d) -/125 -/2+2 -/140 -/140B,
-/180R
Manufacturer Great Lakes
Series Type
2T-1A-1
150
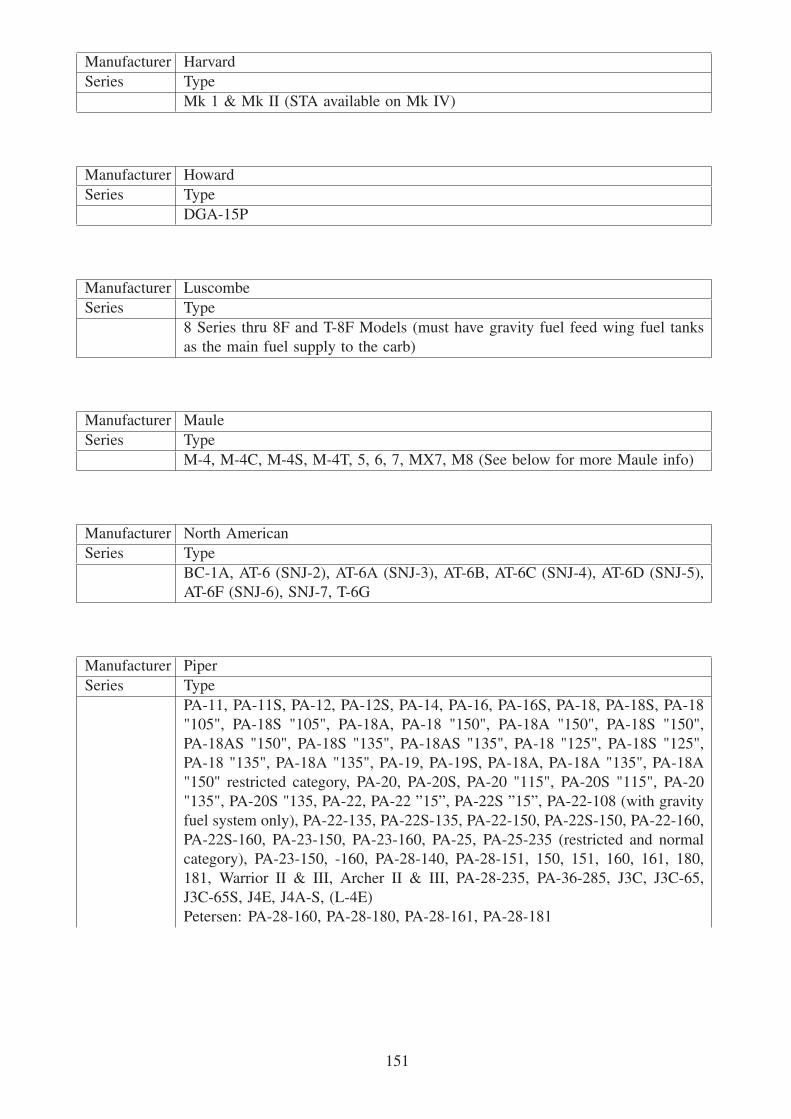
Manufacturer Harvard
Series Type
Mk 1 & Mk II (STA available on Mk IV)
Manufacturer Howard
Series Type
DGA-15P
Manufacturer Luscombe
Series Type
8 Series thru 8F and T-8F Models (must have gravity fuel feed wing fuel tanks
as the main fuel supply to the carb)
Manufacturer Maule
Series Type
M-4, M-4C, M-4S, M-4T, 5, 6, 7, MX7, M8 (See below for more Maule info)
Manufacturer North American
Series Type
BC-1A, AT-6 (SNJ-2), AT-6A (SNJ-3), AT-6B, AT-6C (SNJ-4), AT-6D (SNJ-5),
AT-6F (SNJ-6), SNJ-7, T-6G
Manufacturer Piper
Series Type
PA-11, PA-11S, PA-12, PA-12S, PA-14, PA-16, PA-16S, PA-18, PA-18S, PA-18
"105", PA-18S "105", PA-18A, PA-18 "150", PA-18A "150", PA-18S "150",
PA-18AS "150", PA-18S "135", PA-18AS "135", PA-18 "125", PA-18S "125",
PA-18 "135", PA-18A "135", PA-19, PA-19S, PA-18A, PA-18A "135", PA-18A
"150" restricted category, PA-20, PA-20S, PA-20 "115", PA-20S "115", PA-20
"135", PA-20S "135, PA-22, PA-22 ”15”, PA-22S ”15”, PA-22-108 (with gravity
fuel system only), PA-22-135, PA-22S-135, PA-22-150, PA-22S-150, PA-22-160,
PA-22S-160, PA-23-150, PA-23-160, PA-25, PA-25-235 (restricted and normal
category), PA-23-150, -160, PA-28-140, PA-28-151, 150, 151, 160, 161, 180,
181, Warrior II & III, Archer II & III, PA-28-235, PA-36-285, J3C, J3C-65,
J3C-65S, J4E, J4A-S, (L-4E)
Petersen: PA-28-160, PA-28-180, PA-28-161, PA-28-181
151

Manufacturer Robinson
Series Type
R-22 (See below)
Manufacturer Ryan
Series Type
ST-3KR (PT-22, PT-22A)
Manufacturer Stinson
Series Type
108, 108-1, 108-2, 108-3, L-5, -5B, -5C, -5D, -5E, -5E-1, -5G, SR-5, -5◦, L-12,
-5B, -5C, -5E.
Manufacturer Spartan
Series Type
7W
Manufacturer Taylorcraft
Series Type
BC-65, BCS-65, BC12-65, (ARMY L-2H) BCS12-65, BC12-D, BCS12-D,
BC12-D1, BCS12-D1, BC12D-65, BC12-D, BCS12-D, BC12-D1, BCS12-D1,
BC12D-85, BCS12D-85, BC12D-4-85, BCS12D-4-85, 19, F-19, DC-65 &
DCO-65
Manufacturer Varga
Series Type
2150◦
Manufacturer Waco
Series Type
UPF-7 & VPF-7, YKC, YKC-S, YKS-6, ZKS-6, YMF
Manufacturer Weatherly
Series Type
620, 201, 201A, 201B, 201C
152

Manufacturer Reims Cessa
Series Type
150G, H, J, K, L, M; FA150K, L, FA152, F152. F172D, E, F, G, H, K, L, & M,
F172P, F182P
153
B Statistical Data on General Aviation and Ultralight Aircraft(T 1)
A statistical evaluation of available cell, engine and flight data was performed to assess the potential
danger of faulty ethanol admixed MOGAS usage. As discussed with EASA available statistical
base data are rather distributed for the different countries and, due to slightly differing boundary
settings of individual aircraft classes, not well adapted to comparison purposes. Cell and engine
resolved lists of operated aircraft and/or flying hours could only be obtained for Germany and the
United Kingdom. Accordingly, an extrapolation for the whole European Union can be given only
on some assumptions of an approximate equi-popularity of the different aircraft types throughout.
Only those aircraft types being presently able to fly on MOGAS are considered as potentially
threatened by future ethanol admixtures. This assumption holds for the present state of affairs
where there is a clear-cut difference between well-defined AVGAS with strict compositional
restrictions and quality conformance processes throughout the delivery chain up into the individual
aircraft, and rather arbitrary MOGAS qualities which may or may not contain certain amounts of
alcohol. It cannot be ruled out that in the years to come some ethanol-containing AVGAS derivative
may spring into existence, should the lead content of the standard AVGAS 100 LL be increasingly
incriminated. As some adverse mixed fuel properties originate directly from the thermophysical
behaviour of the gasoline the according threats would affect present AVGAS-only aircraft as well,
even if the strict delivery rules for today’s AVGAS would be analogously applied. Respective
delivery rules would not eliminate hazards consecutive to a deteriorated technical state of the
individual aircraft (e.g. porous filler cap sealings permitting water penetration into the tank).
The resulting workflow of statistical evaluation, to arrive at an at least educated guess, has been
performed as follows:
(1) The number of GA aircraft for (most of the) European countries is taken from the IRCA/ICAO
national registers worldwide (originating from 2005) [18].
(2) From the ECAC accident report for the European countries [13], determine the number of
GA aircraft, subdivided into number of aircraft < 2.25 t and gliders.
(3) From (1) and (2) calculate the number of aircraft with MTOM < 2.25 t (“other A/C”) for the
countries given in (1).
(4) Estimate shares for the countries additionally found in (2), from the data calculated in (3).
This yields an estimate of the total number of aircraft in Europe, subdivided into aircraft <
2.25 t, gliders and other aircraft by countries.
The resulting numbers, reported in Table 27 and Fig. 87 as a graphical representation of aircraft
numbers throughout Europe, are definitely more realistic than those taken from other statistical
database [24].
Now calculate the share of operative and potential EN 228 aircraft:
(5) For Germany: Reconciliation of the European type approvals [15] and the operating hours
survey of the German LBA on the basis of engines and cells [11]. As a by-product, obtain
statistics on widely used EN 228 aircraft types and engines in Germany. This leads to the
numbers shown in Fig. 83 and Fig. 84, left side.
154
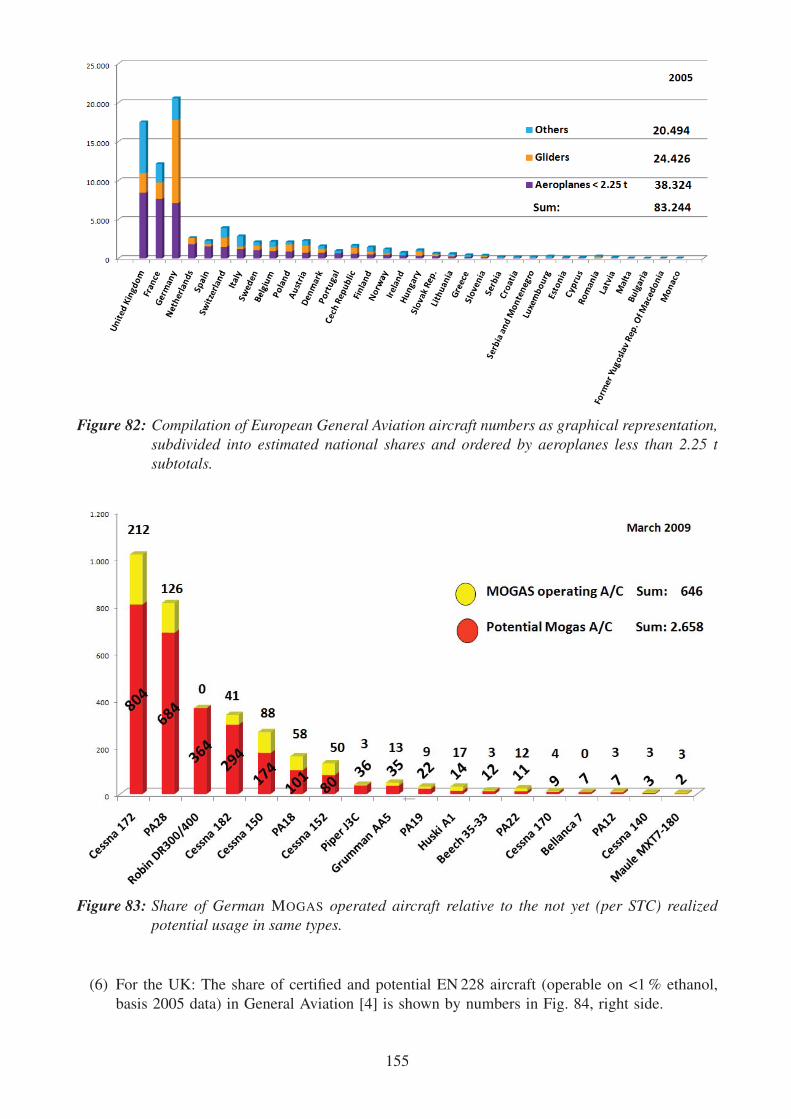
Figure 82: Compilation of European General Aviation aircraft numbers as graphical representation,subdivided into estimated national shares and ordered by aeroplanes less than 2.25 tsubtotals.
Figure 83: Share of German MOGAS operated aircraft relative to the not yet (per STC) realizedpotential usage in same types.
(6) For the UK: The share of certified and potential EN 228 aircraft (operable on <1 % ethanol,
basis 2005 data) in General Aviation [4] is shown by numbers in Fig. 84, right side.
155
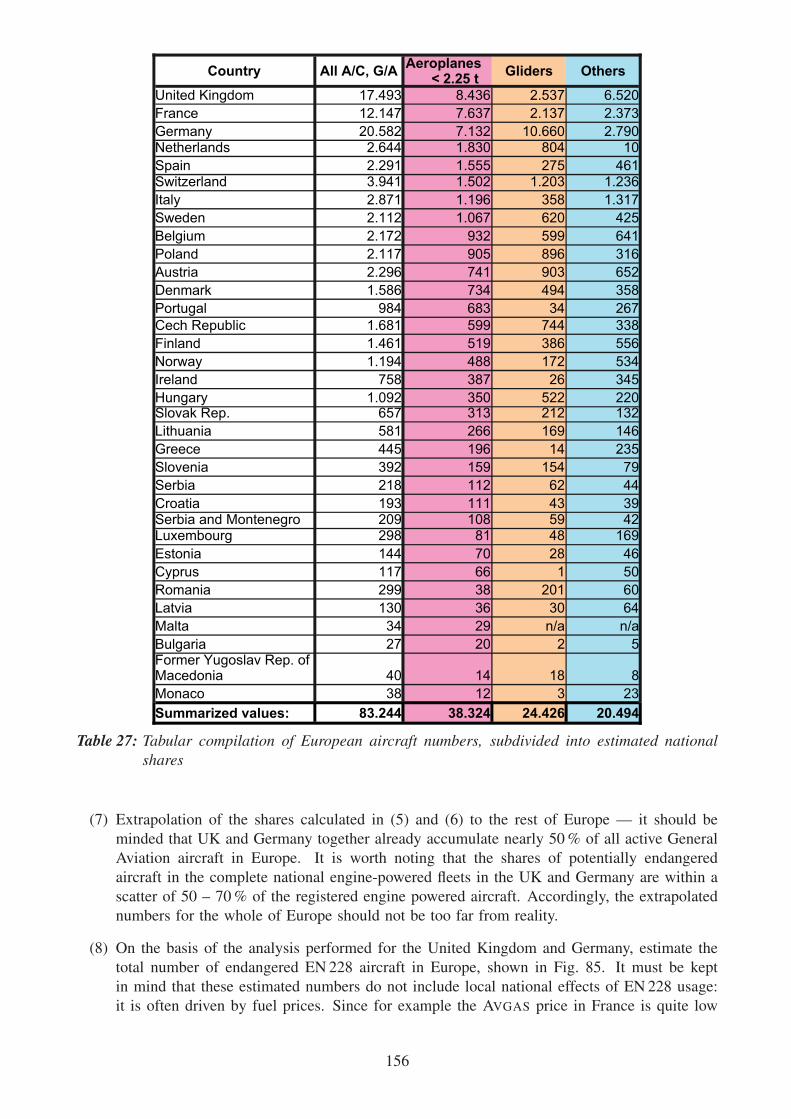
������������
�+�!�, $�!, ����� �����
��� ����� ���� �����
������ ���� ����� �������� ���� �� �
���� ���� ��� ���� ���� ���� ����
���� ��� ��� ���
��� ���� ��� ��
���� ��� ��� �
��� ��� ��� ��
����� � ��� ���
���� �� � ���
��'���� �� ��� � ���
��� ��� � ���
�� �� ��� ���
�� �� �� ��
��� ��� �� ��
���� ��� ��� ������ �� �� ��
�� ��� �� �
� �� ���
��� �� � ��
�� � ��
�� � ����� �� �� ���� � � ��
�� �� �
� �� ��
��� �� �� ��
�� �� �� �
���'� � �� ��� ���
�� �� � �
� � �
������ �� � � ��
�� �� � � �� ��� �
��������������������������������
������� �� ���
���'����������
������
�����!"�'#������$
%&���%'�'(������
)'��!
%'����
*������
�����
+�$'���
,�����-
.��#�/�&�0���
�������
"��'�!
)������
2�����!%��3�-�/�&�
4�'#�����
�����
%��3����
%��0��
.���'��%��0����������'������4�5��0����
6$'����
.!&��$
/������
4�'3��
*��������������7���$��3�/�&���8����������
!�""���#���$�����%
Table 27: Tabular compilation of European aircraft numbers, subdivided into estimated nationalshares
(7) Extrapolation of the shares calculated in (5) and (6) to the rest of Europe — it should be
minded that UK and Germany together already accumulate nearly 50 % of all active General
Aviation aircraft in Europe. It is worth noting that the shares of potentially endangered
aircraft in the complete national engine-powered fleets in the UK and Germany are within a
scatter of 50 – 70 % of the registered engine powered aircraft. Accordingly, the extrapolated
numbers for the whole of Europe should not be too far from reality.
(8) On the basis of the analysis performed for the United Kingdom and Germany, estimate the
total number of endangered EN 228 aircraft in Europe, shown in Fig. 85. It must be kept
in mind that these estimated numbers do not include local national effects of EN 228 usage:
it is often driven by fuel prices. Since for example the AVGAS price in France is quite low
156

and comparable to EN 228 gasoline the potential number of EN 228 aircraft is overestimated.
This may as well happen in other European countries.
Figure 84: German and United Kingdom numbers for the aircraft categories of interest. No distinc-tion is made with respect to used fuel type.
Figure 85: Estimated European total numbers for the aircraft categories of interest
The statistical basis also allows to attribute the actual utilization share of generally MOGAS capable
engines for Germany. Fig. 86 shows that 18 % of the potential MOGAS engines are already
operated on EN 228 fuel.
Additionally, the German statistics on operating hours [11] allow a rough estimate on the popularity
of MOGAS operation: A comparison on the basis of “flown hours since last check” reveals that
the actually EN 228 certified aircraft collect significantly more operating hours: While only 48 %
of all General Aviation aircraft fall into the category of being principally MOGAS capable, 57 %
of flight hours are delivered by the respective types if the comparison is performed on the basis
of German data for flown hours since last check. This is not surprising since in Germany MOGAS
is roughly only half the price of AVGAS, so even the costs of partial refurbishment to get an STC
will be cost-effective for regularly operated aircraft.
157

Figure 86: Share of German MOGAS operated aircraft engines relative to the not yet (per STC)realized potential usage in same types. Existence of respective cell certificates is nottaken into account.
It should be kept in mind, though, that the existence of an STC for a given aircraft does notalways imply that all flight hours are actually flown on MOGAS. There are occasions when thisfuel type is not available, so pilots have to revert to AVGAS at least for some fillings.
158
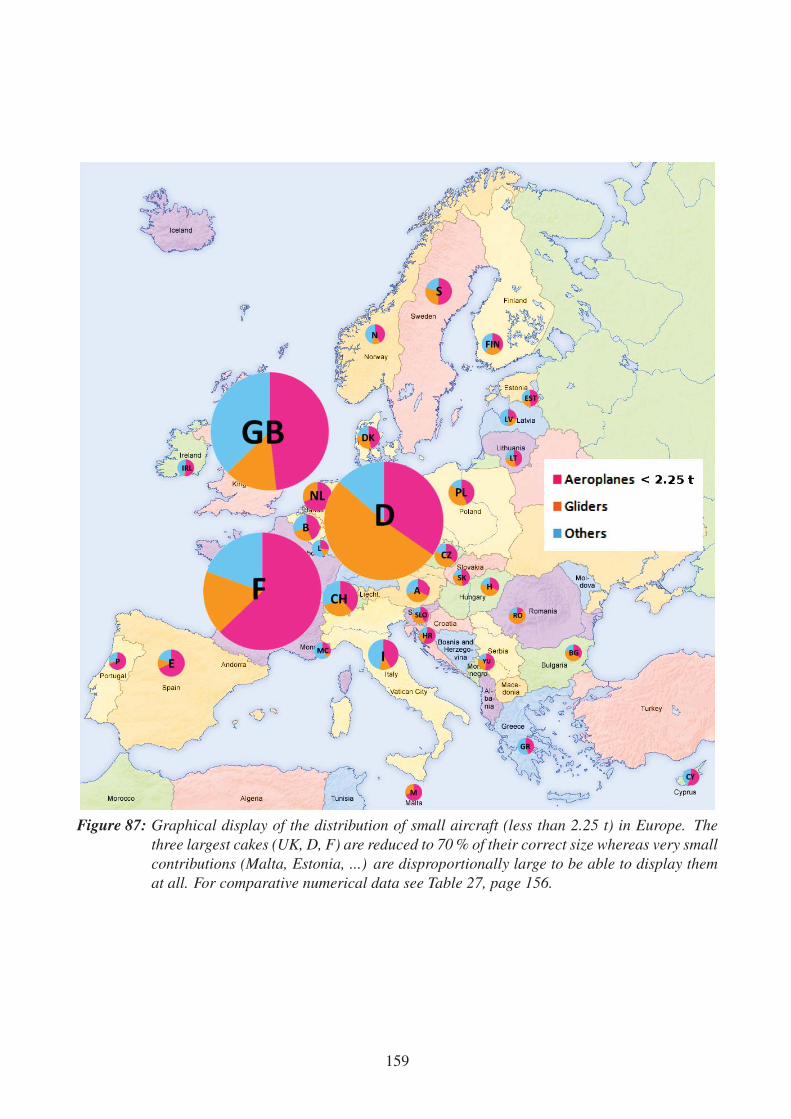
Figure 87: Graphical display of the distribution of small aircraft (less than 2.25 t) in Europe. Thethree largest cakes (UK, D, F) are reduced to 70 % of their correct size whereas very smallcontributions (Malta, Estonia, ...) are disproportionally large to be able to display themat all. For comparative numerical data see Table 27, page 156.
159

C Tabulated FMEA Results
On the subsequent pages the overview results of the FMEA are given. From the basic FMEA
collection tables 63 issues with RPN values above 100 have been identified. The RPN is listed in
the top right corner of every issue box there. Additionally the line numbers of the FMEA collection
tables of the individual failure modes are given as line references for each issue.
As all participants of the workshops had German as their native language the practical FMEA
fact collection was performed in German. Accordingly the raw FMEA tables (not included in
this report, but obtainable as a separate appendix package) are given in this language. They can
be obtained as a separate appendix and are not included in this report. The interpretation of the
resulting issues is given in this report’s section 6.1.
160

���������� ���������
���������������������������������� ������
������
������ �
������ �
����� ����
��� ����� ����������
������������ �������������� � ������������
����������������������� ��� ��������
�������
������������������������������������������� ������
��� ���������� �
���� !�"#$��&$����'(��&��)�����"��������� **��� ��������� ����������+ ������
������� ��� ����
161

���������� ���������
���������������������������������� ������
������
������ �
������ �
����� ����
��� ����� ����������
(�,��#�'#&(�&(��-���(#��"�&$"�&(�-----------------------------------------------------------------------------------------------------------.
/-�,,!�0��(�#&�----------------------------------------------------------------------------------------------------------------------.
.-#0�!0��1--------------------------------------------------------------------------------------------------------------------------------2
���������� �!� �"# $%�& �����������������������������������������������������������������������������������������������������������������������"�� ���# $%��������������������������������������������������������������������������������������������������������������������������
2-�"��3!#'���4"�(5#$#�#�)---------------------------------------------------------------------------------------2
����'( � % �( � ) $%��!���������������������������������������������������������������������������������������������������������������������%�( �$* ��) ����������������������������������������������������������������������������������������������������������������������������+������ � '( � ��'%,�� ��������������������������������������������������������������������������������������������������������������-��+�'( � '��( � �$���%��! �!� ��%�!. %�") ������������������������������������������������������������������������������������-
6-�(�"�#��&0��(���(�#&7��&�!��------------------------------------------------------------------------------��
��-�. ! ��)��������������������������������������������������������������������������������������������������������������������������������������/��$�� �' �!& �%�.�%��!�����������������������������������������������������������������������������������������������������������������/���'��00�� �1���2���������������������������������������������������������������������������������������������������������������������������������������������������/����343�5������������������������������������������������������������������������������������������������������������������������������������������������������������������/��� �������������������������������������������������������������������������������������������������������������������������������������������������������������������
8-�(�"�4� &'(�#&�$��'!�3(�#&-------------------------------------------------------------------------------------��
����'� ))�!. �6�% (������������������������������������������������������������������������������������������������������������������������������.���3�0 �1���2 7��438�����������������������������������������������������������������������������������������������������������������������������������
����%�%�)��������������������������������������������������������������������������������������������������������������������������������������������$��'%����������������������������������������������������������������������������������������������������������������������������������������.���3�0 �1���2 7��438�������������������������������������������������������������������������������������������������������������������������������������������2� � 5��4���������������������������������������������������������������������������������������������������������������������������������������������������
����� !.�! ������������������������������������������������������������������������������������������������������������������������������������������.���3�0 �1���2 7��438�������������������������������������������������������������������������������������������������������������������������������������������2� � 5��4��������������������������������������������������������������������������������������������������������������������������������������������������+
9-!�� �(�---------------------------------------------------------------------------------------------------------------------------------�9
������ '�!�%��!������������������������������������������������������������������������������������������������������������������������������-��������9��� ��8�3������������������������������������������������������������������������������������������������������������������������������������������������-�������)��0� �5 3�: 8������0� ;3�7< 1�00�=< �3���>���������������������������������������������������������������������������������������������������-
����� ? $�%�& ��((��6 �' ��% !%��) ���@����������������������������������������������������������������������������������������/�������'( � ��22�31 � '��00�� ;83�7�4��� �00 �343�5� 5��00��>������������������������������������������������������������������������������/�������'( � ��22�31 A �343�5� ����00���� 5��4����������������������������������������������������������������������������������������������������������'( � ��22�31 � �343�5� ����00���� 8�3���������������������������������������������������������������������������������������������������������������'( � ��22�31 A ���� 5��4��������������������������������������������������������������������������������������������������������������������/�������'( � ��22�31 A ���� 8�3�������������������������������������������������������������������������������������������������������������������������
162
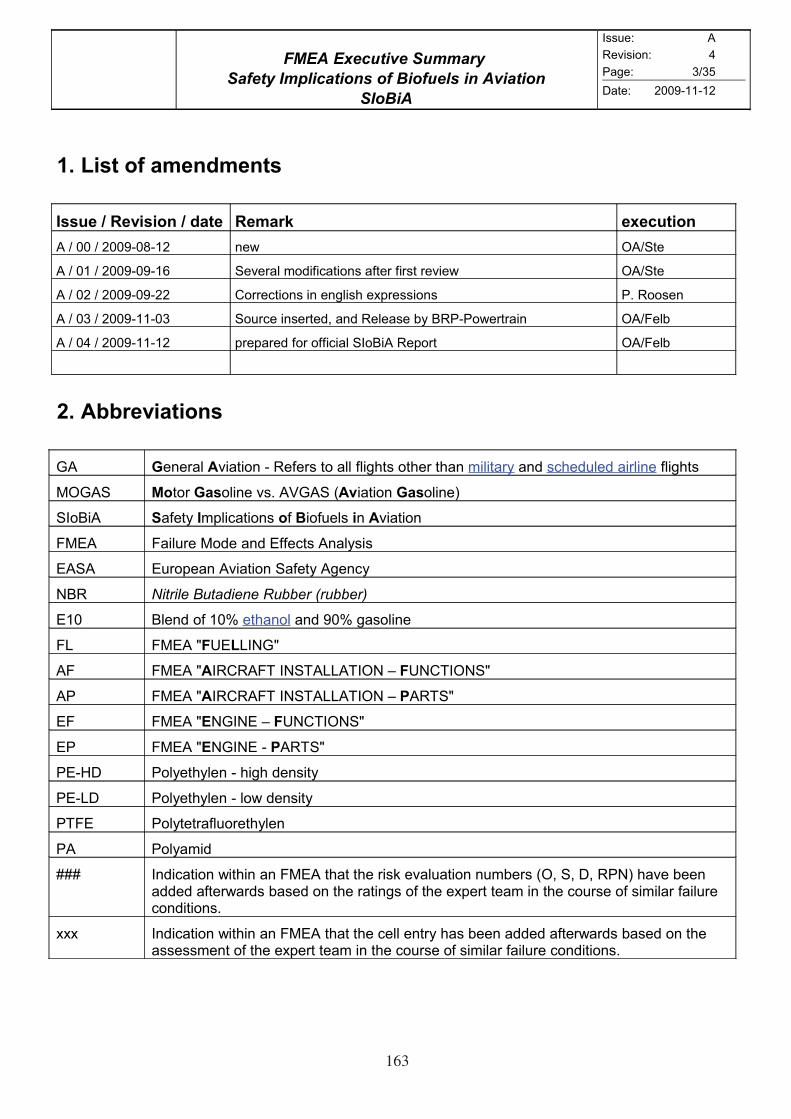
���������� ���������
���������������������������������� ������
������
������ �
������ �
����� ����
����� ����������
�- ������ ���������
�����4!������4� �� !�� �: ���������
� � �� � ������/��� ��= ������
� � �� � ���������+ ���3�0 2�754����� �5��3 53�� 3��= ������
� � �� � ���������� $�33�4���� � ���0�9 �B83������ �� ������
� � �� � ���������� ���34� ���3��7< ��7 ��0���� C1 "�����=�3�3�� ���'�0C
� � �� � ���������� 83�8�3�7 5�3 �554�0 ���"� ��8�3� ���'�0C
/- ������ �����
.� ����3�0 ����� � ��5�3� �� �00 50�9�� ��9�3 �9�� 20��31 ��7 �49�7�0�7 �30�� 50�9��
(�.�� "���3 � ��0�� �� �&.�� ;����� � ��0��>
���"� ��5��1 �2804����� �5 ,�5��0� �� �����
'( � '�0�3� (�7� ��7 55�4�� ���01��
��� �3�8��� ����� ��5��1 ����41
!"� ������������� ���������������
�� "0��7 �5 ��D ��9���0 ��7 ��D ����0��
') '( � E�� �)�!.E
�' '( � E���$��'% �!�%�))�%��! A ��!$%��!�E
�� '( � E���$��'% �!�%�))�%��! A 3��%�E
' '( � E�!.�! A ��!$%��!�E
� '( � E�!.�! � 3��%�E
� �*� ��01��910�� � 9�9 7����1
� �)� ��01��910�� � 0�= 7����1
�%' ��01���3�50��3��910��
�� ��01�27
FFF ��74���� =�9� �� '( � �9�� �9� 3�: ��0����� ��2C�3� ;�< �< �< ��!> 9�� C��� �77�7 �5��3=�37� C���7 �� �9� 3����� �5 �9� �B8�3� ���2 � �9� 4��3�� �5 �20�3 5�0�3� 4��7�����
BBB ��74���� =�9� �� '( � �9�� �9� 4�00 ���31 9�� C��� �77�7 �5��3=�37� C���7 �� �9� ������2��� �5 �9� �B8�3� ���2 � �9� 4��3�� �5 �20�3 5�0�3� 4��7�����
163
���������� ���������
���������������������������������� ������
������
������ �
������ �
����� ����
����� ����������
.- #����;
! ! ���������"������� ��
%9� 8�38��� �5 �9� ���������������������� � �� 8�8��� �9� 3���0�� �5 � ������������� ����������� ������ ;'( �> =9��� �CG�4�� =�� �� 7���51 8������0 9�H�37�< 5�0�3� 4��7���� ��7 �9� ��5��1 2804����� �� �343�5� ��7 ����� �8�3���� =9�� ���� C����9���0 C0��7�7 5��0 ;�8 �� ��D ��9���0 A ��> � 4�28�3��� �� (�.�� ;I�D ��9���0>� �� �9� 4��3�� �5 �9� '( � �9� ��32 �� � ���7 3�83������� �9� ���3� 3���� �5 ��9���0 C0��7�7 5��0� �8 �� ���
%9� 3�8�3� 3�83������ � 4�283�9���� �C��3�4� �5 �9� 8������0 3�:� 7���5�7 C1 �9� '( � ���01�� ��7 ��22�3H�� ��7�8�9 �B80������� 5�3 ��49 5�0�3� 4��7��� 5 �883�83����
�� ��:�� ��� �44���� �343�5� ��7 ����� 5��4���� �� =�00 �� �������0 4�28������ ��7 �1���2� �� �1���2��4�001 7���32�� �9� 8������0 �55�4�� �� 2���3�0� ��7 5��4���� 4����7 C1 �9� �8�454 49�3�4��3��4� �5 5��0 4������� C����9���0�
'�3�9�32�3� � ���8 C1 ���8 ���01�� �5 �9� 5��00�� 83�4��� ���3��� 53�2 �9� 5��0 83�7�4��� �00 �9� �343�5� 500�� 83�4��� 9�� C��� �44�280�9�7 �� 7���51 8������0 5�0�3�� ��7 �� 4������ %9� 2804����� �5 5�0�3�� 7�3�� �9��� 83�4����� 4��07 5��001 0��7 �� �8�3�����0 33���0�3��� �7�4�7 C1 2���3�0 �4�28��C0����
"��7�� �9� ��22�31 �5 �9� 5�0�3� 4��7���� �9� 3�8�3� 4������ �9� ����3�0 4��7���� �5 �9� '( � ��49 �� 83�G�4� 7��438���< �B8�3�� ���2 ��0�4���< 2��9�7�0��1< '( � 5�32 7��438���< ��7 �9� 83�G�4� �2� 53�2��
!#! �������������
�� �37�3 �� �� �883�83��� 3�4�22��7����� �� �9� ����� �5 C����9���0 C0��7�7 5��0 �9� ��� 3���7 � 83�G�4� ��32�7 E��5��1 �2804����� �5 "�5��0� � �����E ;�CC3������ ���"�>�
��� �CG�4�� � �� �������� �9� ��5��1 2804����� �� �343�5������� �8�3���� ��7 �� ���:�< 5��0 88��< ���0� ��7 5��0 �1���2� �5 �8�3: ����7 8���� ����� 8�=�3�7 �343�5� ��7 ������ C1 ���� 5��0 4������� C����9���0�
�� �� ����3���7 8�3� �5 �9� ���"� 83�G�4� �2����� ��9�3 ��3�1� ��7 ���7�� � '�0�3� (�7� ��7 55�4�� ���01�� �9��07 7���32�� C����2��8 8������0 9�H�37 4��7���� � �37�3 �� �� �� 0���� 3�4�22��7����� 5�3 �9� ����� �5 C����9���0 C0��7�7 5��0� � �8�3: ����7 8���� ����� 8�=�3�7 �343�5���
2- �"��3������4���������+�
�� '( � � � �1���2��4< C����2��8 �883��49 �� 7���51 �9� 5�0�3� 2�7�� �5 � �1���2< 8�4��8�3� �3 5��4��� ��7 7���32��� �9� �55�4�� �� �9� ��B� 9�9�3 0��0�
�� ��0H�� � ��C�0�3 2��9�7 �� �7 �9� �9���9� 83�4����� �44�280�9�7 C1 �B8�3�� ��7 �8�4�0��� �� 7���32�� 8������0 5�0�3� 2�7�� ��7 �9�3 �55�4��� �� '( � � � ���0 �� 83���� 3�:� C1 ��:�� �883�83��� �4����� �� 2�1 C� 8�35�32�7 �� ��1 0��0 =�9� �9� �1���2 ;���� 8�4��8�3�< 5��4���< 83�4���< ��4�>�
%184�001< �� '( � � ���7 �� �773��� 5�0�3� �55�4�� 3���0��� 53�2 ���0� 5�0�3�� ��7 4�22�� 2�7� 5�0�3���
164

���������� ���������
���������������������������������� ������
������
������ �
������ �
����� ����
����� ����������
!$! ������������������
�7��001 �9� ��0�4��� �5 �8�4�0��� �9��07 4��3 �9� =7��� 3���� �5 �:00 ��7 �B8�3��4�� %9� �B8�3�J� ��0�4��� 83�4��� 9�� C��� 8�35�32�7 � 4��37����� C��=��� � !���"� ��7 �#!#�$������ � %9� ��0�4��� 43��3� 5�3 �9�� 3���� �5 �B8�3�� �9��07 4��3 �9� 5�00�=�� 7�2��� ��7 �:00��
• (���3�0 83�8�3��� ��7 4�28��C0���
• �8�454���� ��7 49�3�4��3��4� �5 5��0� ���7 � �����
• '��00�� 83�4��� ;83�7�4��� �00 �343�5� 5��00��>
• �343�5� ����00����� 3���37�� 5��0 �1���2�
• ���� 5��4����0�1 ��7 ����� �1���2�
• ���� ��7 �343�5� 2�������4�
• �� �343�5� ������ ;)14�2��< $��������0 K��>
• �4��4� 5�3 �����
• ��35�32��4� �5 ��5��1 ������2���� ��7 2�7�3���� ;'( � 2��9�7�0��1>
"1 ��:�� ��� �44���� �9� 7���5�7 ��0�4��� 43��3� �9� 3��8���C0� 83�G�4� 0��7�3� �5 � !���"� ��7 �#!#�$������ 9�� 49���� � ���2 �5 �8�4�0��� �9�� 8�3�48���7 �9� '( � ��������
(����<& ��<���� �� �:�����+ ����+�"��*��=���
"�����=�3�3���3�G�4� 0��7�3 '( � ;����� �8�4�0��>
"�����=�3�3��'( ���8�4�0��< (�7�3����< ����� �B8�3��4�< �B�4��� ��22�31
"�����=�3�3�� ���� B8�3�< �343�5� ����00�����< 83��� 80�� 04��4�
����3� ����� ���� �8�4�0��
��2��7 �343�5� ��7���3�� .2C*
�343�5� ����00�����
��2��7 �343�5� ��7���3�� .2C*
�343�5� ����00�����
)�5�5�93H��� ,�3�����C��3�C @3�2� .2C*
�343�5� (�������4� �8�4�0�� � �� ������
%�%�) �����490��7 .2C*
'��0 �B8�3�< 5��00��
�.� ������� '3������ .2C*
(���3�0 �8�4�0��< 2���3�0 4�28��C0���
�.� ������� '3������ .2C*
(���3�0 �8�4�0��< 2���3�0 4�28��C0���
165
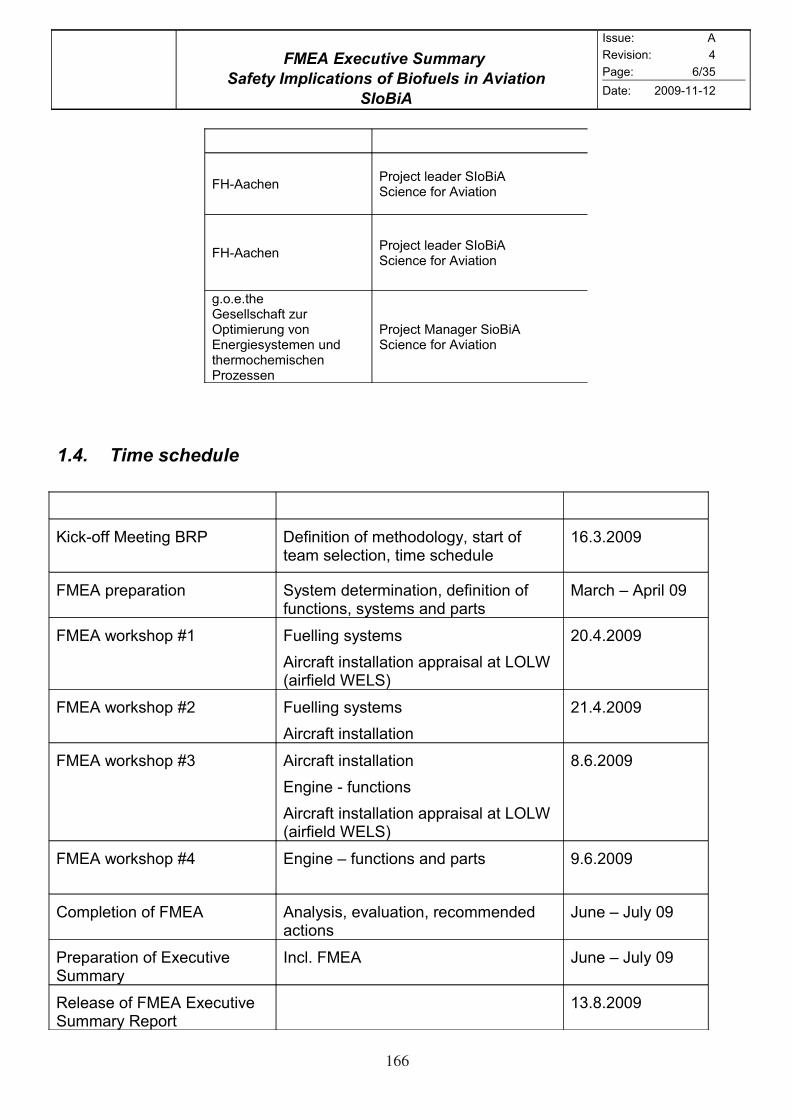
���������� ���������
���������������������������������� ������
������
������ �
������ �
����� +���
����� ����������
(����<& ��<���� �� �:�����+ ����+�"��*��=���
'*���49���3�G�4� 0��7�3 ���"��4��4� 5�3 �����
'*���49���3�G�4� 0��7�3 ���"��4��4� 5�3 �����
�������9� .���00�49�5� H�3 �8�2�3��� �� ��3���1���2�� ��7 �9�32�49�2�49�� �3�H�����
�3�G�4� (�����3 ��"��4��4� 5�3 �����
!%! &�����'�"��
����� !�� �: $ ��
@4:��55 (����� "�� ��5���� �5 2��9�7�0��1< ���3� �5 ���2 ��0�4���< �2� �49�7�0�
�+�������
'( � 83�8�3���� �1���2 7���32�����< 7�5���� �5 5��4����< �1���2� ��7 8�3��
(�349 A �830 ��
'( � =�3:�9�8 F� '��00�� �1���2�
�343�5� ����00���� �883���0 �� )�), ;�35�07 , )�>
���������
'( � =�3:�9�8 F� '��00�� �1���2�
�343�5� ����00����
���������
'( � =�3:�9�8 F� �343�5� ����00����
���� � 5��4����
�343�5� ����00���� �883���0 �� )�), ;�35�07 , )�>
/�+�����
'( � =�3:�9�8 F� ���� A 5��4���� ��7 8�3�� ��+�����
$�280���� �5 '( � ���01��< ��0�����< 3�4�22��7�7 �4����
#��� A #�01 ��
�3�8�3���� �5 B�4��� ��22�31
��40� '( � #��� A #�01 ��
��0���� �5 '( � B�4��� ��22�31 ��8�3�
���/�����
166

���������� ���������
���������������������������������� ������
������
������ �
������ �
����� -���
����� ����������
!(! )��"����������*���
'�3 �9� 83�8�3���� �5 �9� '( � ���01�� � 7��� C���7 ��5�=�3� ���0 ��32�7 �+�,�������������#!- ;�0��� �.< ===�80�������4�2> =�� ���7�
!.! ����������"������������"������/�������
�40���7 �9� 7��438��� �5 �9� 8�3�4�0�3 4�0�2�� =�9� �9� '( � 5�32 ;53�2 0�5� �� 3�9�>�
&�-$����4��� ��2C�3 �5 0��� 4������� 8������0 5�0�3� �4���3�� 5�3 8�3��< 5��4���� �3 83�4��� ���8�� �9�=� �3� '( � 0�� 3�5�3��4� �� 7�5����� =�9� 49�8��3 - E B�4�����22�31 �5 8������0 3�:�E� !���� %9� 4�0�2� � ��01 �C0� =�9� �9� '( � ��5�=�3� ���0 �$���'( ��
�������4��������!�2� �5 �9� 4�28����� ��7��3 �9�3� 7��438��� �5 �9� ����7�7 5��4���< � 8�3� �3 � �1���2 9�� �� 8�35�32 ;5�3 8�4��8�3� �3 5��4����0 '( �>����438��� �5 �9� ���8� =�9� � 4�3��� 83�4��� ;83�4��� '( �>!���� � ��2� 4���� � �8�454 7��438��� �5 �9� 8�3� ��7 �� 5��4��� �3 �9� 83�4��� ���8 � �������0� %9��� 4�22���� �3� 2�3:�7 =�9 E)@E ;0�4�0 4�22���>�
3������ �� ���������%9� 4�0�2� 0��� 8������0 5�0�3� 2�7�� 5�3 ��49 ��2< 5��4��� �3 83�4��� ���8 �� �9�� �9� ����7�7 5��4��� �9� 8�3� 9�� �� 5�050 4��07 ��� C� 8�35�32�7 ��1 0����3�
3������ ����������� ��������438��� �5 �9� �55�4� �5 �9� �8�454 5�0�3� 2�7� 7���5�7 ��7�3 E8������0 5�0�3� 2�7�E �� �9� ��B� 9�9�3 ��C�1���2 ��7��3 �� �9� �88�32��� �1���2 ;���� ����� �3 �343�5�>�
3������ �� �����������0 4���� 5�3 �9� �8�454 5�0�3� 2�7��
'������ ������;�> $�33��� 49�4:�� �4���� �9�� �3� �03��71 � 80�4� =949 9�08 �� 7���4� �9� 5�0�3� C�5�3� � �44�3�� ���4���� �43���� �9� 7���4��� 83�C�C0�1 ;�>� ;&> ����� 83����� �9�� �3� �03��71 � 80�4� �� ��7 �9� 7��43C�7 5�0�3�� &��4���� 7�43���� �9� �44�33��4� 83�C�C0�1�
167

���������� ���������
���������������������������������� ������
������
������ �
������ �
����� /���
����� ����������
#���� ����#�!�2C�3 53�2 � �� �� ����7� 5�3 �� ���2���7 83�C�C0�1 3���� �8�45�7 5�3 ��49 5�0�3� 4���7�3�� 8������0 4����� ��7 5�0�3� 2�7���
3��� ��������#����������#� #�#���������������� 3������ �� ������ ��
0�����+�
'�0�3� �02��� ����7�C0�
�� ≥ � �5 �
> � �5 �
5�+�
'3�L���� 3��8�4��01 3�8����7 �44�33��4�
? � �5 /
9 � �5 ��
"���� ��
$����0 �44�33��4�
8 � �5 /�
6 � �5 ���
2 � �5 �����
��;
��53�L���� �44�33��4�
. � �5 ������
/ � �5 �������
0�����;
�44�33��4� �5 5�0�3� ��0:�01 � ≤ � �5 �<� 200��
%9� �44�3��4� 3����� � �9� 49�3� �3� �3���5�33�7 53�2 �9� ����2�C0� ����7�37� %9� ������2��� 4�� �8801 �� ���3�0 L������� ;���� ��2C�3 �5 7�5�4�� ������< 7�5�4�� 7�4�� �3 �� 501�� 9��3�> 7�8��7�� �� �9� �18� �5 5�0�3�� %9� �0��� 83�7� �� ��88�3� �� 5�7 �9� ���2���7 �44��3��4��
�����������������0���3�1 �5 �9� �55�4� �5 �9� 5�0�3� 2�7� �� �9� ��B� 9�9�3 ��C�1���2 ��7��3 �� �9� �88�32��� �1���2 ;���� ����� �3 �343�5�>�
���������� ���������������� '�����������*����
0�����+��5 @ �������� � ����*���� ���������������
)�3�� 3�7�4��� � 5��4����0 4�8�C0��� �3 ��5��1 2�3���� ��5��1 3�: 5�3 �9� 43�=� ��� &�940� C3��:7�=�< 53� 9�H�37< ��3�4��3�0 53�4��3��
�� �22�7��� �44�33��4� =�9��� =�3���
> �22�7��� �44�33��4� =�9 =�3���
5�+��"�A#!� ���������������
���54��� 3�7�4��� � 5��4����0 4�8�C0��� �3 ��5��1 2�3���� �91�4�0 7�4�25�3� �3 � ���54��� �43���� � =�3:0��7� ��� ���� �9�� 7�=�
? �22�7��� �44�33��4� =�9��� =�3���
9 �44�33��4� =�9 =�3���
"���� ���"�&#!�
�0�9� 3�7�4��� � 5��4����0 4�8�C0��� �3 ��5��1 2�3���� �0�9� �43���� � =�3:0��7 �3 ��� �5 �2�3���41 83�4�7�3�����8�3 3�L�3�7�
8
6
2
��;�"�&#!� �0�9� 3�7�4��� �5 5��4����0 4�8�C0���� ��8�3 � .
168
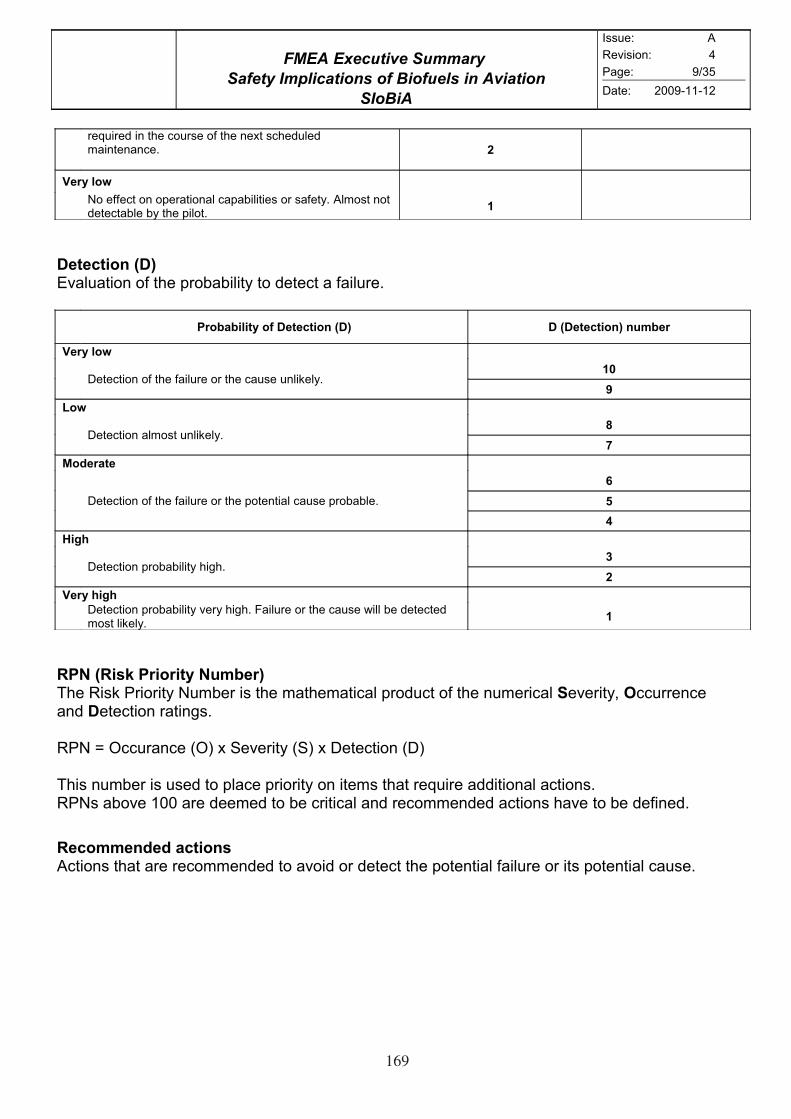
���������� ���������
���������������������������������� ������
������
������ �
������ �
����� ����
����� ����������
3�L�3�7 � �9� 4��3�� �5 �9� ��B� �49�7�0�7 2�������4�� /
0�����;
!� �55�4� �� �8�3�����0 4�8�C0��� �3 ��5��1� �02��� ��� 7���4��C0� C1 �9� 80���
�
$���������$� �0����� �5 �9� 83�C�C0�1 �� 7���4� � 5�0�3��
3��� ��������$���������$� $�$���������������
0�����;
����4��� �5 �9� 5�0�3� �3 �9� 4���� ��0:�01�
��
>
��;
����4��� �02��� ��0:�01�
?
9
"���� ��
����4��� �5 �9� 5�0�3� �3 �9� 8������0 4���� 83�C�C0��
8
6
2
5�+�
����4��� 83�C�C0�1 9�9�
.
/
0�����+�
����4��� 83�C�C0�1 �31 9�9� '�0�3� �3 �9� 4���� =00 C� 7���4��7 2��� 0:�01�
�
!3&�!��:3�������&������%9� ��: �3�3�1 !�2C�3 � �9� 2��9�2��4�0 83�7�4� �5 �9� ��2�34�0 ���3�1< #44�33��4� ��7 $���4��� 3������
��! M �44�3��4� ;�> B ���3�1 ;�> B ����4��� ;�>
%9� ��2C�3 � ���7 �� 80�4� 83�3�1 �� ��2� �9�� 3�L�3� �77����0 �4�������!� �C�� ��� �3� 7��2�7 �� C� 43�4�0 ��7 3�4�22��7�7 �4���� 9�� �� C� 7�5��7�
!���������� �������4���� �9�� �3� 3�4�22��7�7 �� ��7 �3 7���4� �9� 8������0 5�0�3� �3 �� 8������0 4�����
169

���������� ���������
���������������������������������� ������
������
������ �
������ �
����� �����
����� ����������
6- �������������+ ����7+���� �
!0! 1������
�� �37�3 �� 7���32�� �9� �4�8� �5 �9� ������������� ����������� ������ � � �������0 �� 7�5�� �9� ��2� �5 ���������� %9��� ��2� 4��07 ��9�3 C� � 83�4�����< �1���2� �3 ���0� 4�28������< =9�3��� ��49 ��� �5 �9��� :�7� =00 5�32 � 7�74���7 ��7 4�280��� '( � ���01���
%9� 8�3�48���� �8�4�0��� 9�� C��� ��0�4��7 �� 8�35�32 '( � ������� �� �9� 4����4��� 0�� �5 ��������� ��84��
!2! ���������� ����/�����
�-?-�- �������+�������
%9� 5��00�� 83�4��� � �� C� �43���H�7 53�2 �9� 5��0 83�7�4��� �00 �9� �343�5� 500�� 83�4���< =�9 �9� �2 �� 7���51 8������0 83�4��� 5�0�3�� ��7 �� 4������
�-?-/- ����� ���
%9� �343�5� ���01�� �9��07 4��3 � 83�5�33�C01 =7� 3���� �5 755�3��� �343�5� �18�� � .���3�0 ����� �9�� 4��07 ��� C����9���0 C0��7�7 5��0� � 5���3��
�2����� ��9�3 4�28������ �������7 7�3�� �9� '( � �9� ���01�� �9��07 4��3 755�3��� :�7 �5 ���:�< 9���� ��7 88��< 73�����< 0��0 �����3� ��7 5��0 8�28��
�-?-.- ��+����
%9� ����� ������2��� �9��07 4��3 � 83�5�33�C01 =7� 3���� �5 755�3��� ����� �18�� � .���3�0 ����� �9�� 4��07 ��� C� ��9���0 C0��7�7 5��0� � 5���3�� '�00�=�� 755�3��� :�7� �5 ������ �9��07 C� 4���7�3�7�
• $�3C�3����3 5�7 8���� ������ ;� ��7 ����3�:��>
• 0�4�3��4 ���:��2��5�07 5��0 �G�4���
• (�49��4�0 ���:��2��5�07 5��0 �G�4���
• ,��:�0 3���31 �����
170
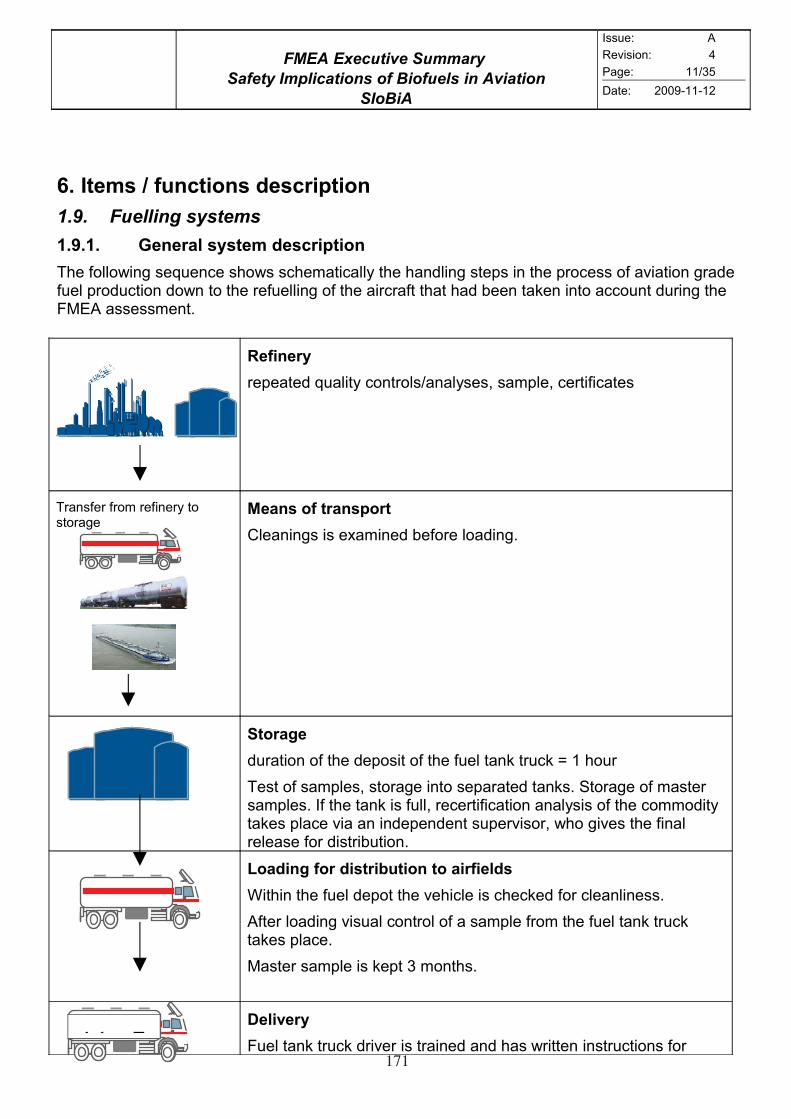
���������� ���������
���������������������������������� ������
������
������ �
������ �
����� �����
����� ����������
8- �����4���������������*����
!3! ������/��������
�->-�- ����� �������������*����
%9� 5�00�=�� ��L���4� �9�=� �49�2��4�001 �9� 9��70�� ���8� � �9� 83�4��� �5 ����� �3�7� 5��0 83�7�4��� 7�=� �� �9� 3�5��00�� �5 �9� �343�5� �9�� 9�7 C��� ��:�� ��� �44���� 7�3�� �9� '( � ������2����
!�������
3�8����7 L��0�1 4���3�0�����01���< ��280�< 4�3�54����
%3���5�3 53�2 3�5��31 �� ���3���
"� ������ ��*���
$0������ � �B�2��7 C�5�3� 0��7���
���� +�
7�3���� �5 �9� 7�8��� �5 �9� 5��0 ���: �3�4: M � 9��3
%��� �5 ��280��< ���3��� ��� ��8�3���7 ���:�� ���3��� �5 2����3 ��280��� �5 �9� ���: � 5�00< 3�4�3�54���� ���01�� �5 �9� 4�22�7�1 ��:�� 80�4� � �� �7�8��7��� ��8�3��3< =9� ��� �9� 5��0 3�0���� 5�3 7��3C�����
�� ���+����������������� ��������
,�9� �9� 5��0 7�8�� �9� �940� � 49�4:�7 5�3 40���0�����
�5��3 0��7�� ���0 4���3�0 �5 � ��280� 53�2 �9� 5��0 ���: �3�4: ��:�� 80�4��
(����3 ��280� � :�8� � 2���9��
$������
'��0 ���: �3�4: 73�3 � �3���7 ��7 9�� =3���� ���3�4���� 5�3 &171

���������� ���������
���������������������������������� ������
������
������ �
������ �
����� �����
����� ����������
83�4�7�3� �5 %�� %9� 4����4���� =�9 �9� 4����2�3 ���:� �3� ��8�3���01 49�3�4��3H�7� $����2�3 � �C0����7 �� �9� 2����3�� �5 �9� 7�0�31 83�4�7�3�� $����2�3 � �3���7 ��7 ���3�4��7 �5 %�� %� 9�7 ���05 �4:��=0�7��7 �9� �3����� '������ 3�4��31 ��49 1��3� %� 8�� � 2����0 �� 4����2�3� �� �9� 7�8���0� %9� 4����2�3 �4:��=0�7��7�
$����2�3 ��7 73�3� 8�00 ��280�� 53�2 �9� %@,< C�5�3� ��0��7��� �8�70�� �9� 7����1< 4���3�0 5�3 =���3< ��72���� ��7 4�0��3 ��:�� 80�4�� $����2�3 3�4��� ���01�� 4�3�54��� =�9 7�0�31 7�4�2�����
���34�� 83�7�7 C1 %�%�) �����490��7 .2C*
%9� ��L���4� �C�� 7��43C�� �9� �3���8�3����� �5 ����� �3�7� 5��0 ;(����> 53�2 �9� 3�5��31 �� �9� �3�73�2�< ��7 �� 0���� �� �9� �343�5� 5��0 ���:�(��1 �343�5� �8�3���3� �3� �37�3�� 5��0 53�2 ����2�C0� 500�� �������� %9�1 �3� 3�5��0�� �9�3� �343�5� 5��0 ���:� =�9 4���� %9� 5�32 �5 ��L���4� � ��� 7�80�1�7 9�3�� *�=��3 �9� 5�32 �5 3�5��0�� � 7�4����7 ��7 �������7 � �9� '( � ;49�8��3 -����< ���� �>�
172

���������� ���������
���������������������������������� ������
������
������ �
������ �
����� �����
����� ����������
! -! �������
�-��-�- ����� �������������*����
'�00�=�� 84��3�� �3� 3�83������� �184�0 �343�5� 3�0���7 5��0 �1���2� �9�� 9�� C��� ��������7 � �9� 4��3�� �5 �9� '( � ���01��� %9�1 �9��07 C� 3���37�7 �� �B�280�� ��7 7� ��� �B40�7� ��1 ��9�3 5��0 �1���2 5�3 �343�5� �������
���34�� %�4��2 ������#' A '0�9� (����0< 53�� �7��� �� (�349 ����< 8��� -�-
���34�� �3�5�B (�������4� 2����0< ���� ��2C�3 ������/< 8��� ���+
173

���������� ���������
���������������������������������� ������
������
������ �
������ �
����� �����
����� ����������
�-��-/- �����4���������
'�00�=�� �184�0 ��7 3�83�������� ��2� ��7 8�3�� �5 �9� �343�5� 5��0 3�0���7 ����00���� 9�� C��� ��:�� ��� �44���� 7�3�� �9� '( � ������2����
• �55�3��� :�7 �5 ���:� �40�7�� �44����3�� ;�����< ���0��< 500�3 4�8�< K�>
• *����< ��C��< 5�����
• &�0�� ��7 49�4: �0��
• 0�4�34�0 5��0 8�28�
• �����3�
• .��:���
• �3����3� �74����� �40� �0�� 9����
• '��0 ��0�4��3 �0��
• '��0 4��0�3
• '��0 50��3�
• �:� �5 5�C34 ��7 8�����
• B9���� �1���2
'�00�=�� �184�0 ��7 3�83�������� 5��4���� �5 �9� �343�5� 5��0 3�0���7 ����00���� 9�� C��� ��:�� ��� �44���� 7�3�� �9� '( � ������2����
• �3�7�� ��5� 5��00�� �5 �9� �343�5�
• %� �00�= 0����3 ��������� 8�3�7� �5 �9� �343�5�
• %� 83�7� ��554��� 5��0 5�3 ����� �8�3����
• %� ��7 ��7�3���� 7�49�3�� �5 5��0
• %� 83�7� 5��0 =�9 ��554��� L��0�1 5�3 �9� �����
• �C0�1 �� 4��3 �9� ���3� 50�9� ���0�8�
• %� �44�8� 2B�7 5��0�
• %� :��8 5��0 � 0L�7 4��7���
• �3��9����� �5 �9� ���:� �3
174

���������� ���������
���������������������������������� ������
������
������ �
������ �
����� �����
��� ����� ����������
! ! ��/����
�-��-�- ����� �������������*����
'�00�=�� 84��3� 3�83������ � �184�0 ����� 3�0���7 5��0 �1���2 5�3 4�3C�3����3 �L�88�7 8���� ������ �9�� 9�� C��� ��������7 � �9� 4��3�� �5 �9� '( � ���01��� %9� �9��07 C� ���� �� �� �B�280� ��7 7��� ��� �B40�7� ��1 ��9�3 5��0 �1���2 5�3 �343�5� �������
���34�� �8�3���3� (����0 5�3 ��%�? ����� �18� ��� ��3��
�9�3� 7��438���� %9� 5��0 50�=� 53�2 �9� ���: ;�> � � 4��3�� 50��3 ;�> �9� ��5��1 4�4: ;�>< =���3 73�� 4�4: ;�> ��7 5�� 50��3 ;�> �� �9� 2�49��4�0 5��0 8�28 ;+>� '3�2 �9� 8�28 5��0 8����� �� �� �9� �=� 4�3C�3����3� ;->� &� �9� 3���3� 0�� ;/> ��380�� 5��0 50�=� C�4: �� �9� 5��0 ���:�
175
���������� ���������
���������������������������������� ������
������
������ �
������ �
����� �+���
��� ����� ����������
�-��-/- �����4���������
'�00�=�� �184�0 ��7 3�83�������� ��2� ��7 8�3�� �5 �9� ����� 3�0���7 5��0 ����00���� 9�7 C��� ��:�� ��� �44���� 7�3�� �9� '( � ������2����
• *����< ��C��< 5�����
• &�0�� ��7 49�4: �0��
• (�49��4�0 ��7 �0�4�34�0 5��0 8�28�
• $�3C�3����3�
• �3C�B�� ��7 �350��3�
• �32�3
• $�2C����� 49�2C�3 �40�7�� �8�3: 80��� ��7 ���3��� �8�3: 80���
• �8�3: 80���
• ��G�4��3�
• '��0 3�0
• '��0 83����3� 3���0���3
• �55�3��� 7�893��2 2���3�0�
• �����3�
• .��:���
• '��0����0H�3
• ���� �0 ;� ��7 � ��3�:�>
'�00�=�� �184�0 ��7 3�83�������� 5��4���� �5 �9� ����� 3�0���7 5��0 ����00���� 9�7 C��� ��:�� ��� �44���� 7�3�� �9� '( � ������2����
• $�07 ���3�< =�32 ���3� ��7 3����3�
• ���� =�32��8
• $3����
• (�B� ��:���55 8�=�3 ;5�00 0��7>
• ��2�� =�9� �9� 02�� �44�37�� �8�3���� 2����0 ;����� 5��0 4����28���< .%< $*%< %�%K>
• (����0 2B��3� �7G���2���
• (B��3� �72���� =�9� 4�3C�3����3
• �9��7�=�
• $��3 �9� ���3� 50�9� ���0�8�
176

���������� ���������
���������������������������������� ������
������
������ �
������ �
����� �-���
��� ����� ����������
• %� �00�= ��4��� �5 5��0
• '3��9 �0 0�C34����
• �0�������0�� 0�C34����
• %� ����3� 0�C34���� �5 ����3�:� �����
• ��=�3�� ��7 0�C34���� ��B0�31 73��
• ���3� 5��4��� �5 �9� ��3C� 49�3��3
• ���3� 0��:���9�����
9- !������
! #! 4����������
�-�/-�- 3� ����* � ����
��� �5 �9� ��C������0 3�: 8������0� =9�� ���� ��9���0 �72B��3�� � �9� ��8�3���� �5 �9� 89���� ��� �� �04�9�0�=���3 2B��3� ��7 � 0�=��4���� 5��0 �� �9� �88�3 89���� ,9�� 8�3�4�0�3 4��7���� 0��7 �� 89��� ��8�3���� ��7 =9�� �� 83�C�C0�1 �< 9�� �� C� 7���32��7 C1 ���� ��7��3 ���01���
%9� ��0����� �5 �9� �44�33��4� 83�C�C0�1 � 4�33���01 �� ��4�3��� ��2C�3 ��7 5�3 �9� 2�2��� �������7 =�9 3��9�3 9�9 ��0����� 49�3�4��3��4 ��2C�3��
*�=��3< 89��� ��8�3���� 2��� C� �03��71 83�����7 �3 7���4��7 �� ���� �� � �44�3� ��1=9�3� � �9� �343�5� 5��0 �1���2� �� 8�3�4�0�3< ��4���� �5 �9� 5��0 �1���2 =9�3� 0�3��3 �0�2�� �5 5��0 �3� �44�2�0���7 �3� 2��� �0��3�C0� �� ��8�3���� �55�4�� ;��8�4�001 �9� ���:>�
�-�/-/- ����������:*������ ������<�����;<+�����
"��4�001 �9� 5�6 ��0����� �5 �9� 8������0 5�0�3� 4��7���� �3� 9�90�9��7 =�9 �93�� 755�3��� 4�0��3� 7�8��7��� �� �9�3 3�: 8������0< ��:�� ��� �44���� ������7��� ����� ��7 "��������
!�$� '�0�3� 4��7���� =�9� �� ��! 3���� �C�� ��� �8 �� ���� �3� 7��2�7 43�4�0 =�9 3��8�4� �� 50�9� ��5��1 4���7�3�� ������7��� ����� ��7 "�������� �� �883�83��� 4�����3 2����3� � 3�L�3�7 �� ��7 �3 �� 0���� �� 7���4� �9� 5�0�3� ��7��3 �� 4�����
)���#1� '�0�3� 4��7���� =�9� � 3���� �5 /� ��7 ��� �3� 7��2�7 ��43�4�0 C�� � �9��07 C� �C��3�7 ��� �� �43���� �� � 9�9�3 0��0 �3 ��:�� �883�83��� �4���� �� C3�� � �� � ��! 3���� C�0�= /��
�!��&B '�0�3� 4��7���� =�9� � ��! 3���� C�0�= /� �3� 7��2�7 ��43�4�0� !��3�9�0��� �� �4��� 4��07 3�7�4� �9� 3�: �� � 0�=�3 0��0�
177

���������� ���������
���������������������������������� ������
������
������ �
������ �
����� �/���
��� ����� ����������
! $! ����� �������������������������8�
%9� 5�00�=�� 0�� �5 ����� 4������ ��01 �9� 2�� 5�0�3� 4��7���� �5 3�: 8������0� 40���5�7 �� � � �9�� 9�7 C��� 7���5�7 C1 �9� '( �� .3��� ��7 1�00�= 2�3:�7 3�: 8������0� �3� 8�3� �5 �9� '( � ���05 ;3�5�3 �� ��� !��? �� > ��7 =00 ��� C� ���0��7 � �9� �B�4��� ��22�31 3�8�3��
���3�0 ��84� �3� �����7 ��01 ��4� �3 ��22�3H�7 � �9� 5�00�=�� 0���� ��� 5 �9��� �3� 5���7 3�8����701 � �9� '( �� '�3 7���0� 3�5�3 �� �9� '( ��
%9� ������������������ ��2C�3� 3�5�3 �� �9� 4�33��8��7�� 3����� � �9� 3��8�4�� '( � ;��01 =�9� �9� '( � ��5�=�3�>< =90� �9� 53�� �=� 0����3� 7���51 �9� '( � 8�3� � =949 �9� 0��� =00 C� 5���7�
��������
')�� � ')��� 0�� ����� =�9� '( � E�� �)�!.E
�'�� � �'��� 0�� ����� =�9� '( � E���$��'% �!�%�))�%��! A ��!$%��!�E
'�3 5�3�9�3 �CC3������< 3�5�3 �� �"������%�&����������� �&
�-�.-�- �"������ ��C�������+�*������������� ���� ���������+�
����� � ���3��� �5 5��0 =�9� ���: ��8 �5��3 83�7�4��� ��! ��/
������������������� ')�� A ')��
5��8� %9� 8������0 3�: � �� ���3� =���3 7�3�� ���3��� 4����7 C1 8������001 0�4:�� �8�3�����0 2�����2���� ��� �� �9� 49�24�0 �55��1 �5 �� �� =���3 �9� 4��07 0��7 �� � 89��� ��8�3���7 5��0 �9�� 4��07 �50���4� �9� �8�3���� �5 �9� �343�5��
5������"�"������� ���5�34�7 �74� �� 4�2801 =�9 �8�3�����0 83�4����� ;���� #�. �>
�����#� (B�� 5��0 83�7�4�� 7�3�� 500�� �9� ���: ��8 ��! ��/
������������������� ')�� A ')��
5��8� %9� 8������0 3�: � �� 2B 755�3��� 5��0� � ���: ��8� 4����7 C1 9�2�� 5�0�3��< ��8�4�001 �� �07�3 ���: ��8� �9�� �3� ��� �L�88�7 =�9 2�7�3� 7���4��� 2��9�7� ��7 7� ��� 4�2801 =�9 L��0�1 ����3��4� 83�4������
5������"�"������� ���5�34�7 �74� �� 4�2801 =�9 �B���� L��0�1 ����3��4� 3�L�3�2���� ��7 280�2������� �5 83�4����� �0�� 5�3 �07�3 ���: ��8 �1���2��
178

���������� ���������
���������������������������������� ������
������
������ �
������ �
����� �����
��� ����� ����������
�����$� �343�5� 5��00�� C1 ���� 5��0 53�2 4��� 3�500�7 �� 8��3�0 �������� ��! -��
������������������� ')�� A ')��
5��8� %9� 3�: � �� ��� 5��0 �9�� � ��9�3 4����2����7 C1 �9� 4�� ���05 �3 9�� � 8��3 L��0�1 C�4���� �5 2B�7 �3 0��� ���3�7 5��0� )����3 ���3�7 �� C� 5��0 4�� C� 89��� ��8�3���7 ��7 �50���4� �9� �8�3���� �5 �9� �343�5��
5������"�"������� �554�0 3�4�22��7���� C1 ���� ��0���� �5 � 4����31 �8�454 5��0 ��0���
�����%� (B�� 5��0 83�7�4�� 7�3�� 5��00�� �5 �9� �343�5� ��! -��
������������������� ')�� A ')�+< �'�� A �'��
5��8� �������0 3�: � �� 9�� � 3�2���� L�����1 �5 5��0 =�9� �9� �343�5� ���: ��7 �� 3�500 =�9 ����9�3 83�7�4� ;���� 2B �&.�� �3 � =�9 ��> �9�� 4��07 0��7 �� �8�3�����0 83�C0�2� �5 �9� ������
5������"�"������� ��0���� �5 4�3��� 3�L�3�2���� 5�3 2B�� 5��0� C���7 �� �B8�32����0 ��C���������
�����(� ����3��� �5 =���3 7�3�� 5��00�� �5 �9� �343�5� ��! -��
������������������� ')�- A ')+�
5��8� %9� 8������0 3�: � �� ���3� =���3 C�5�3� �3 7�3�� �9� 5��00�� 83�4��� C1 ���� 4�����3����: 500�3 4�8� �3 7�2���7 ���:���� ��� �� �9� =���3 �55��1 �5 �� � 89��� ��8�3���7 5��0 �50���4�� �9� �8�3���� �5 �9� ����� � 0:�01�
5������"�"������� ����0����� 3���37�� �9� 7���� �5 �9� 500�3 4�8� ��7 �� ���:��� � �37�3 �� ��7 ���3��� �5 =���3 ��� �9� 5��0 �1���2�
179

���������� ���������
���������������������������������� ������
������
������ �
������ �
����� �����
��� ����� ����������
�-�.-/- �"������ ��7����� ������ �� �������������
�����.�� �8�3:�� �� 3�5��00�� ��! �/�
������������������� �'� A �'+< ')�� A ')��
5��8� %9� 8������0 3�: 4������ �5 �9� 5�4� �9�� 7�� �� �9� ����2�7 �2�00�3 7����3 �5 �9� �8�3:�� =�9 �� �9� 80��� 83�C�C01 �C���� 53�2 �3���7�� 7�3�� 3�5��00�� 7��8�� �B���� 3���0������ �� 4����L���4� �9� 7����3 �5 �8�3:�� � 9�9�3 �9�� C1 5��00�� (�.���
5������"�"������� ����3�4���� 3���37�� �44�3��� �3���7�� =9�� 3�5��00�� ��� �554�0 ��� ��7�0�� 2��� C� 4�280�7�
�����0� $�33���� �5 8�3�� �3 2���3�0� 7�3�� �343�5� ���3��� 5�3 0����3 8�3�7� ��! �+�
������������������� �'- A �'�-
5��8� ��� �� �9� �43����7 �55��1 5�3 =���3< �9� 83�C�C0�1 �5 � 89��� ��8�3���� ��7 4����L�����0 4����4� 4�33���� ;0�4�0 4�00>< � 0�3��3 =�9 �� �9�� =�9 (�.��� ,�9 0��:���� �5 �9� 5��0 �1���2 �77����001 �9� 7����3 �5 �9� 49�24�0 ����4: �5 ��35�4�� �B��� ;���� =��7< 0�4L��3�< ��3�7�B �/� �0���< 4��3��< �3�K>
5������"�"������� ��3�4�0�301 � �9� =���3 2���9� ����� 2��� C� 8�35�32�7 �B�2��� �9� 7����3 8������0 ��7 �� �55�4��� �77����001 �9� 4�28��C0�1 �5 �9� 0���7 2���3�0� �� �� 2��� C� ����3�7�
�����2� $3������4��� 72����� � 5��0 88�� ��! �-/
������������������� �'�/ A �'��
5��8� "1 �9� 49�3�4��3��4� 3��8�4��01 �9� 4����L���4�� �5 89��� ��8�3���7 �� 5��0< 8�39�8� �9� 7����3 �5 �=�37 �B8��7�� 3�CC�3 88�� �B���< =949 4�� 0��7 �� � 43������4��� 4���3�4��� ��7 � 5�3�9�3 4����L���4� �� �� �50���4� �5 �9� ����� �8�3�����
5������"�"������� (���3�0 4�28��C0�1 �����
�����3� )��:���� =�9� �9� 5��0 �1���2 ��! �+�
������������������� �'�+ A �'�-
5��8� �3�C�C01 �9� ��0��� 49�3�4��3��4� �5 �� 0��7 �� 7�4�28����� �5 �9� C��� 2���3�0< =949 4��07 3���0� � 5��0 �1���2 0��:���� ��7 � 5�3�9�3 4����L���4� �� � 8������0 53� 3�:�
5������"�"������� (���3�0 4�28��C0�1 �����
180

���������� ���������
���������������������������������� ������
������
������ �
������ �
����� �����
��� ����� ����������
����� -� "0�4:�� 50��3� ��! ���
������������������� �'�/ A �'��
5��8� ��� �� �9� ��0��� 49�3�4��3��4� �5 �� � 8������0 7����3 4������ � �9� ��8�3���� �5 2���3�0 ���7 � ���:� �3 5��0 88��< =949 4����2���� �9� 5��0� �� 5�3�9�3 4����L���4� � 4�� 3���0� � C0�4:�� 5��0 50��3��
5������"�"������� ����������� �9��07 C� 8�35�32�7 9�= L�4:01 ��7 ������01 2���3�0 ��8�3����� =�9� �9� 5��0 �1���2 2�1 �44�3� '�3�9�3 �� �9� ���7��41 ��7 �8��7 �5 50��3 C0�4:�� � �� C� �43���H�7�
����� � ���� �8�3���� =�9 89��� ��8�3���7 �� C�5��0 ��! �+/
������������������� �'�� A �'��
5��8� "1 �9� �43����7 �55��1 5�3 =���3< 8�3�4�0�301 =�9 0����3 �343�5� ���3��� �2��< � 89��� ��8�3���� �5 �9� �04�9�0 5��0 2�1 �44�3� %9� 4�� 0��7 � 4����L���4� �� �� �50���4� �5 �9� ����� �8�3�����0 C�9��3 �8 �� ����� �9�� 7�=��
5������"�"������� ����������� 2��� C� 8�35�32�7 4��4�3��� �9� 83�C�C0�1 �5 �44�33��4� �5 89��� ��8�3���� 3��8�4��01 �9�3 �55�4� �� �9� ����� C�9��3�
����� #� *�9�3 �8�3 83����3� �5 �� ��! +�/
������������������� �'�+ A �'�/
5��8� ��3�4�0�301 �� 0�= �2C��� 83����3� �� ��8�3���� �5 =�32 5��0 2�1 �44�3< 50�=�� C�4: �� �9� ���:� %9� 4�� 0��7 �� � :��4:�� 4�2C������
5������"�"������� $�������� ���������� �8�4�001 � 9�9 �0���7��
����� $� 550�3��4��4� 3��8�4��01 9�37�� 53�2 =���3 � �9� 5��0 �� 0�= ��! �-/��28�3���3��
������������������� �'�+ A �'�/
5��8� ��� �� � 8������001 �43����7 �9�3� �5 =���3 � �� �� 4� 83�48����� 2�1 �44�3< 8�3�4�0�301 �� 0�= ��28�3���3��� %9� 4��07 0��7 � 5�3�9�3 4����L���4� �� � C0�4:�� �5 5��0 50��3��
5������"�"������� $�������� ���������� 8�3�4�0�301 �� 0�= ��28�3���3���
181
���������� ���������
���������������������������������� ������
������
������ �
������ �
����� �����
��� ����� ����������
����� %� *�9�3 �8��3 83����3� 7�� �� 2B�� �5 755�3��� 5��0� ;���� ��7 BB> ��! �-/
������������������� �'�� A �'��
5��8� ��� �� ����0���3 2B�� �55�4�� �9� �8��3 83����3� �5 � 2B��3� �5 �� ��7 � �����04�9�0��72B�7 ����0�� 2�1 ��38��� �9�� �5 ��1 ���0� 2B��3� 4�28�����< 0��7�� �� � 3�7�4�7 C�0�� 8��� �5 �9� 5��0� %9� 4�� 49���� �9� �8�3�����0 C�9��3 �5 �9� ������
5������"�"������� $�������� ����������
����� (� ����554��� 83��9����� �5 �9� ���:� �3 ��! �/�
������������������� �'�� A �'��
5��8� ��� �� �9� �43����7 ��8�3���� ���9�081 �5 �� � ��� 0�= ���:� �3 ��28�3���3� 2�1 C� ��4�����3�7< =949 4��07 3���0� � 4�3C�3����3 4�� ��7 4����L�����001 0��7 �� �� ����� �9�� 7�=��
5������"�"������� $�������� ���������� 8�3�4�0�301 =�9 3���37 �� 4�3C�3����3 4��
182
���������� ���������
���������������������������������� ������
������
������ �
������ �
����� �����
��� ����� ����������
�-�.-.- �"������ ��C����� ������ �� ����* ���
����� .� ��43����7 3�: 5�3 4�33���� =�9 �0�2��2 ��7��3 ����0 ���:�� ��! �/�!���� �20�3 3�: 8������0� �8801 �0�� �� �0�2��2< 4�88�3 ��7 ����0 0��� ��7 2���0 5������
������������������� ��+ A ����< ����� � �����< ����+ � ����+
5��8� "1 4����4� 4�33���� ;0�4�0 4�00> �3 C1 �0�4�3��49�24�0 4�33���� 4����7 C1 �0�4�34�0 0��0 �����3� ��35�4� 4�33���� 2�1 C� �7�4�7< 4�33���� �5 �9� =�07�� ���2� ;5 ��0�C0�> �8 �� 7�4�28����� �5 �9� C��� 2���3�0 ��7��3 �� �9� 8���� 4�33�����
5������"�"������� $�������� ���������� 3���37�� �9� 755�3��4� �5 �9� �B7� 502 7�4�28����� 49�3�4��3��4 =�9 �� ��7 (�.�� ;2���0 ���:�< 0��� ��7 5�����>�
����� 0� ��8���� �� �9� ���: C����2 2�1 ��� 3���7 ��� ��! �+/
������������������� ��� A ���
5��8� ��� �� �9� �43����7 ��0��� 49�3�4��3��4� �5 �� � 8������0 7����3 4������ � 2���3�0 7�8���� �� �9� ���: C����2 �9�� 4��07 C� 3���7 ��� ��7 4����2���� �9� 5��0 �1���2� �� 5�3�9�3 4����L���4� � 2�1 3���0� � C0�4:�� 5��0 50��3��
5������"�"������� ����������� �9��07 C� �44�280�9�7< 9�= L�4:01 ��7 ������01 2���3�0 ��8�3����� =�9� �9� 5��0 �1���2 �44�3� '�3�9�3 � 9�� �� C� �35�7 9�= 5��� �9� 0��7� �� C0�4:�7 5��0 50��3��
����� 2� ��4�28��C0�1 �5 4�28���� 2���3�0 ;$'@�.'@> ��! �+/
������������������� ���� A ����
5��8� %9� ��0��� 49�3�4��3��4� �5 �� � 4����4��� =�9 2�49��4�0 0��7 �3 4����7 C1 =���3 � 4����4��� =�9 9�9 ��28�3���3� 2�1 0��7 �� � 7�4�28����� �5 3���� ��7 �1��9��4 2���3�0� %9� �� �9� ��� 9��7 4�� 3���0� � 0��:���� ��7 �� �9� ��9�3 9��7 7�8���� 3���7 ��� ��7 83�C�C01 C0�4:�� 5��0 50��3��
5������"�"������� ����������� �9��07 C� 8�35�32�7 9�= L�4:01 ��7 ������01 2���3�0 ��8�3����� 7�� �� �9� ��0��� 49�3�4��3��4� �5 �� �44�3� '�3�9�3 � 9�� �� C� �35�7 9�= 5��� �9� 0��7� �� C0�4:�7 5��0 50��3��
183

���������� ���������
���������������������������������� ������
������
������ �
������ �
����� �����
��� ����� ����������
����� 3� 2C3��0�2��� �5 5���0��� ���:� 2�7� �5 C0�=� � �*� �3 � �)� ��! �+/
������������������� ���� A ����
5��8� ��� �� �9� �8�4�0 49�3�4��3��4� �5 �� � 2���3�0 �2C3��0�2��� 2�1 �44�3< 8�3�4�0�3 � � 5���0��� ���:�< =949 4�� 0��7 � 4����L���4� �� 0��:����� %9� �B�4� �55�4� 4�33���01 � ��:��=��
5������"�"������� $�������� ���������� 3���37�� �9� �50���4� �5 �� �� 8�01���910��� ;���� ���7 5�3 5���0��� ���:�>�
�����#-� �=�00�� �5 !"� 3�CC�3 2���3�0 ���7 5�3 ���:� ��! ��+
������������������� ���� A ���-
5��8� �3���2�C01 7�� �� 755���� 83�4����� � 8����3���� �5 �� 5��0 ��� �9� 3�CC�3 2���3�0 2�1 �44�3< =949 4�� 0��7 � 4����L���4� �� 0��:��� ��7��3 �� �9� 7�43���� �5 �9� 2�49��4�0 ��3����9 �5 �9� ���:�
5������"�"������� ����������� 3���37�� �9� �=�00�� �5 3�CC�3 2���3�0��
�����# � �554�0� 73���� �� !"� ���:� ��! ���
������������������� ���/ A ����
5��8� �9��� ��8�3���� �5 ��< 8�3�4�0�301 =�9� !"� ���:�< 0��7� �� �44�2�0����� �5 �9� =���3���9���0 2B��3� � C�0��� �� �9� C����2 �5 �9� ���:� �� �9� ��� 9��7 �9� C�0��� 500�7 =�9 =���3���9���0 2B��3� 4��07 ��� C� 73���7 4�280���01< �� �9� ��9�3 9��7 �9� L�����1 �5 �9� =���3���9���0 2B��3� �� C� 73���7 � 2�49 0�3��3 �9�� �9� 83�8�3��� �5 =���3 =�9 (�.��� '�3�9�3< �9� 3�2���� 5��0 �5��3 �9� 73���� 9�� � �31 0�= �4���� 3���� ��7 0��7� � 5�3�9�3 4����L���4� �� � :��4:�� 4�2C������
5������"�"������� $�������� ���������� 3���37�� 2���3�0 4�28��C0�1 ��7 7554�0� 73���� �5 3�CC�3 ���:��
�����##� ��2��� �5 ���: ���3�3 4������ ��! ��+
������������������� ���� A ����
5��8� %9� ��0��� 49�3�4��3��4� �5 �� � 4����4��� =�9 2�49��4�0 0��7 2�1 �7�4� � 7�2��� �5 �9� ���: ���3�3 4������� %9� 4��07 0��7 �� � 7�4�28����� �5 �9� C��� 2���3�0 �8 �� ��3�4��3�0 7�3�8���� ��8�4�001 5�3 .'@ ����3�0 ���:��
5������"�"������� $�28��C0�1 ����� =�9 ���: ���3�3 4�������
184

���������� ���������
���������������������������������� ������
������
������ �
������ �
����� �����
��� ����� ����������
�����#$� ��4�28����� �5 �9� ���: ���0�� 2���3�0 ��! ���
������������������� ���� A ����
5��8� ��� �� �9� ��0��� 49�3�4��3��4� �5 �� �9� ���: ���0 2���3�0 2�1 C� 7�4�28���7� �44�37�� �� �B8�3�� ����28���� 4�3: ���0� �3� 7��2�7 ���43�4�0� �3�����0< !"� ��7 ��$ ;���� $�28��1 ������> �3� 40���5�7 �� 43�4�0� !���� �3�����0 4������ �5 4�28������ ;8�01��0897� 3�CC�3 ��7 � 5�3�9�3 4�28�����>�
5������"�"������� $�������� ���������� =�9 3���37 �� �9� 4�28��C0�1 �5 ���: ���0�� 2���3�0�
�����#%� $9�24�0 �50���4� �� �9� ���: ���0���� ;�0�2��2< ��! ���80���4 �3 ����0 88� 80�4�7 ��� �9� �3 50�=>
������������������� ���� A ����
5��8� �8�4�001 0�3��3 ��28�3���3� �3����� 2�1 0��7 �� � 0��:�� �5 5��0 � �9� ���: ���0����� (���3�0 �4�28��C0��� 4��07 4����L����01 0��7 �� �� �2C3��0�2��� �3 �� 8��3��� ����C01 �9� ���: ���0���� 2�1 C�4�2� 71�5��4� =949 =��07 9�� �� �55�4� �� �9� ����� C�9��3�
5������"�"������� $�������� ���������� =�9 3���37 �� 4�28��C0�1 �5 ���: ���0���� ��7 ���
�����#(� $9�24�0 �50���4� �� 500�3 4�8� �40�7�� ���0�� ��! ���;���� !"� ���:��< !"� ��3���< 4�3: ���:��< &���>
������������������� ��+� A ��+�
5��8� %9� 49�24�0 �50���4� �� 500�3 4�8 2���3�0� 4�� 0��7 �� 0��:��� ;�=�37 ��7��3 ���=�37> =9�3�C1 �=�37 � 7��2�7 �� C� 2�3� 43�4�0 �� ��0�����
5������"�"������� $�������� ���������� =�9 3���37 �� �9� 4�28��C0�1 �5 500�3 4�8 2���3�0� ;�40� ���0��>�
�����#.� $9�24�0 �50���4� �� 5��0 500�3 ��4: ;!"� 3�CC�3 2���3�0> ��! ��+
������������������� ��+� A ��++
5��8� %9� 49�24�0 �50���4� �� 5��0 500�3 ��4:� 2�7� 53�2 !"� 2���3�0 ;�0�2��2 � 7��2�7 �� C� ���43�4�0 � �9�� 4����B�> 4�� 0��7 �� 0��:��� �5 5��0 ��� �9� �353�2��
5������"�"������� $�������� ���������� =�9 3���37 �� �9� 4�28��C0�1 �5 5��0 500�3 ��4:�� ����0����� 3���37�� �9� �B49���� ���3�0 5�3 3�CC�3 8�3�� 9�� �� C� 7���32��7�
185

���������� ���������
���������������������������������� ������
������
������ �
������ �
����� �+���
��� ����� ����������
�����#0� $9�24�0 �50���4� �� 9���� ��7 88�� ;�%' < !"�< &���< ��! �-/"�< $��$90�3�83�� 3�CC�3>� !���� �20�3 3�: 8������0� �0�� �8801 �� � ��7 �� 5����� ��7��3 �� �31 50�BC0� 9���� 2�7� �5 �04��� 5�3 ��3�C��4� ���:��
������������������� ����������< ����-������< �� A ��
5��8� �5 �9�3� � �� ��7��3�C0� �50���4� �� 9���� ;�0�� �4��2 ��C���>< �9� 8���C01 0��7� �� 8��3��< �2C3��0�� �3 �93�:�� �9� 2���3�0 ;$� ��7 !"� 3��9�3 2��� 43�4�001>� %9� 4����L���4�� �3�< 7�8��7��� �� �9� 2���3�0 ��7 �� �9� 7����< 0��:����< 43������4��� 4���3�4���� ��7��3 =�00 �94:���� 3�7�4����� %9� �55�4� 4��07 C� �9�� �9� 9���� 7���49 53�2 �9� 5������
5������"�"������� $�������� ���������� =�9 3���37 �� �9� �� 4�28��C0�1 �5 88� ��7 5���� 2���3�0��
�����#2� $9�24�0 �50���4� �� �0�4�34�0 5��0 8�28� ��7 49�4: �0�� ��! �+�
������������������� �����������< ���+�����-�
5��8� ��� �� �9� ��7��3�7 49�24�0 �50���4� �� 755�3��� 2���3�0� ;2���0� ��7��3 �1��9��4�> 5��0 0��:��� 2�1 �44�3< 0��7�� �� 5��4����0 7�54��4�� �5 �9� �0�4�34�0 5��0 8�28�
5������"�"������� ����������� �� �� 4�28��C0�1 �5 �0�4�34�0 5��0 8�28��
�����#3� $9�24�0 �50���4� �� ���0�� 2���3�0� ;��3���< 4�3:< 8�8�3< ��! ���2���0< 4�88�3< �0�2��2K>
������������������� ���/�����/-< ���� A ����
5��8� ����C0� 3�:� �3� �2C3��0�2���< �=�00�� �3 7�4�28����� �5 �9� C��4 ���0 2���3�0� %9� 4����L���4� �5 �9��� =��07 C� � 0��:��� ��7��3 �3 ��3����
5������"�"������� ����������� �� �9� �� 4�28��C0�1 �5 ���0�� 2���3�0�
�����$-� �� 5��0 =�9� �����3 9���� ;E7��7 ��7 9����E> ��! ���
������������������� ���+/�����-
5��8� "1 �9� ��0��� 49�3�4��3��4� �5 �� ��7��3 89��� ��8�3���7 C� 5��0 �9�3� � � 8�3�4�0�3 3�: =�9 N7��7 ��7 9����O =9�3� �9� 5��0 �0=�1� 3�2��� �9� ��2�� �5 �9�3� � �� �44�2�0���� �5 =���3 ;7�� �� �9� �55��1 �5 �� 5�3 =���3> ��7� �9��� E7��7 ��7 9����E �9� 7����3 �5 53��H�� �B��� =949 4����L�����001 0��7 �� =3��� �74������
5������"�"������� ����������� 3���37�� �� � E7��7 ��7 �����3 9����E ��8�4�001 �� ��5���3�C0� 402��4 4��7�����
186

���������� ���������
���������������������������������� ������
������
������ �
������ �
����� �-���
��� ����� ����������
�����$ � $9�24�0 �50���4� �� �0�2��2 5��0 4��0�3� ;3�L�3�7 2��01 5�3 ��! ���5��0 �G�4��7 ������>� !���� �20�3 3�: 8������0� �0�� �8801 �� 5���3 50��3� �3 5���2��9�7 ����0 50��3�
������������������� �����������
5��8� ��� �� �9� �0�4�3��49�24�0 4�33���� �3 �B7� 502 7�4�28����� � C��� 2���3�0 7�4�28����� 4��07 �44�3 �� �0�2��2 5��0 4��0�3�� $����L�����001 �9� 4��07 0��7 �� 5��0 0��:����
5������"�"������� $�������� ���������� =�9 3���37 �� �9� �� 4�28��C0�1 �5 �0�2��2 5��0 4��0�3��
�����$#� ��4�28��C0�1 �5 4��3�� 2���3�0 ��7 0�4L��3�� �5 �:� �5 =���C�71 ��! ��� �5 �343�5��
������������������� �����������
5��8� ��3�� �9� 3�5��00�� 83�4�7�3� � 7�4�28����� �5 2���3�0 4��3��� �3 0�4L��3 2�1 C� �7�4�7 C1 ��350�=�� �� 5��0� %9� 4�� 0��7 �� �343�5� ��3����9 83�C0�2��
5������"�"������� $�������� ���������� =�9 3���37 �� �9� �� 4�28��C0�1 �5 4��3�� 2���3�0 ��7 0�4L��3�� �5 �:� �5 =���C�71 �5 �343�5���
187

���������� ���������
���������������������������������� ������
������
������ �
������ �
����� �/���
��� ����� ����������
�-�.-2- �"������ ��7��+������������
��01 ��49 ��84� �3� �����7 9�3� �9�� =�3� ��� �3����7 � �9� 4����B� �5 ����9�3 '( � 1��� �������0 3�:� ���� �� �9� ��84� N9����< 88��< 5����� ��4�O =�3� �773����7 �03��71 ��7 =00 ��� C� 3����3���7 3���37�� �9� ������
�����$$� ��50���4� �� �9� �8�3�����0 C�9��3 �5 �9� ����� ��! ���
������������������� '� A '��< '+�� '-�
5��8� "1 �8�3���� �9� ����� =�9 89��� ��8�3���7 5��0 28�32���� �5 �9� ����� �8�3�����0 C�9��3 2�1 �44�3� %9� 3��49�� 53�2 3���9 ����� �8�3���� �8 �� �9� ���8 �5 �9� ������ "1 �8�3���� �9� ����� =�9 ��7���3�3���7 �� 5��0 �� �2�00�3 ���3�1 4������ 8���C01 0��7� �� 28�32���� �5 �9� ����� 49�3�4��3��4�� '�3�9�3 ��< �� �43����7 C�3� ��28�3���3� �5 �� 4��07 3���0� � � :��4:�� 4�2C������
5������"�"������� �9��� ��8�3���� 2��� C� 83�����7 �3 7���4��7 C1 �00 2���� � �9� �343�5� 3�0���7 ����00���� �5 �9� 5��0 �1���2� %9��� �880�� 8�3�4�0�301 �� 5��0 �1���2 ��4���� =9�3� 0�3��3 4�������� �0�2�� �5 5��0 �3� 0�4���7 ;���� � �9� ���:>� ,�9 3���37 �� �9� ���3�1 4������ �5 5��0 �9� 755�3��4� C��=��� �� C�5��0 ��7 (�.�� 9�� �� C� 7���32��7� %� ��7 :��4:�� 7�� �� �9� 9�9�3 4�2C����� ��28�3���3�� �5 �� �9� 2B��3� 4�0C3���� 9�� �� C� �7G����7� .���3�001 � � �������0 �� �8801 4�����3 2����3�� �� ��7 :��4:�� ;���� 3�7�4��� �5 �9� 4�283�����< �����< ����� 4��0��< �8�3: 80��� K>�
�����$%� ��43����7 5��0 4����28��� ��! ���
������������������� '�� � '�/
5��8� ��� �� �9� �2�00�3 ���3�1 4������ �5 �� �3 C�4���� �5 ��883�83��� ����� �2�� �� �43����7 5��0 4����28��� 2�1 C� �C��3�7 =949 4����L�����001 0��7� �� � 3�7�4�7 3���� �5 �9� �343�5��
5������"�"������� �0��� 2��� :��8 � 2�7 �9�� C1 ���� �� �9� 5��0 4����28��� 4��07 C� �0�9�01 9�9�3 �9�� C1 �8�3���� =�9 (�.��� %9� 755�3��4�� 9�� �� C� 7���32��7 �8�454�001 5�3 ��49 �18� �5 ������
�����$(� $�3C�3����3 4�� ��! ��+
������������������� '-/ � '/�
5��8� ��3�4�0�3 � 4��� �5 �7�3�� =���9�3 4��7���� ��49 �� �31 0�= ��28�3���3�� ��7��3 9�9 9�27�1< 4�3C�3����3 4�� 7�� �� �9� �43����7 ��8�3���� ���9�081 �5 �� 2�1 �44�3�
5������"�"������� ����32��� �9� 755�3��4�� C��=��� (�.�� ��7 �� ��7 ��� �883�83��� 3�4�22��7������
188

���������� ���������
���������������������������������� ������
������
������ �
������ �
����� �����
��� ����� ����������
�����$.� ��7�3 4�3��� 4��7���� 4����7 C1 �9� 49�3�4��3��4� �5 �� 5��0 ��! �+�4�� 8���C01 ��� C� ������7
������������������� '/- � '�-
5��8� $����7 C1 53�H�� =���3 � �9� 5��0< 4�33�7�7 ��7��3 3���7 ��� 2���3�0 ��7��3 �9�3�C1 C0�4:�7 50��3�< �9� 5��0 4�� 8���C01 ��� �3 ��� � ��554��� L�����1 C� ������7 C1 �9� �����< =949 4�� 0��7 � 0��� 4����L���4� �� �� ����� �9�� 7�=�� � 5�3�9�3 3�: �B��� 7�3�� �=�49�� �9� ���:�� �� 9���� 2�1 9�� 0��� ���C0�1 �9� 7�83����� 4����7 C1 �9� �=�49�� 83�4��� ���05 2�1 0��7 �� � 9��� 4���3�4���< 0��7�� �� � C0�4:�� �5 �9� 5��0 50�=�
5������"�"������� ����������� 2��� C� 8�35�32�7 �� 9�= L�4:01 ��7 ������01 2���3�0 ��8�3����� ��7��3 7���0�� 2�1 �44�3< 8������001 0��7�� �� � C0�4:�� �5 5��0 50��3�� ����0����� 3���37�� �9� �B49���� ��7 ��8�4��� ���3�0 5�3 50��3� 9�� �� C� 7���32��7�
�����$0� ��7�4�7 0�C34���� �5 �9� 5��0 8�28 ��! ���
������������������� '�+ A '�-
5��8� %9� 83�C�C01 =�3�� 0�C34���� 49�3�4��3��4� �5 �� ;C��9 � �9� ��32�0 4��7��� ��7 � 89��� ��8�3���7 4��7���> 2�1 0��7 �� �� ���554��� 0�C34���� �5 �9� 5��0 8�28< 8������001 4����� � 0��� �5 �� 5��4����
5������"�"������� $�������� ���������� =�9 3���37 �� �9� 0�C34���� 49�3�4��3��4� �5 �� 5��0�
�����$2� ����554��� 0�C34���� 8�3�4�0�301 �� ����3�:� ������ ��! �-�
������������������� '�/ A '���
5��8� ��3�4�0�301 =�9 ����3�:� ������ =�9 �0�������0�� 0�C34����< �9� 2�3� ��5��3�C0� 0�C34���� 49�3�4��3��4� 53�2 �� 2�1 0��7 �� � 0�4: �5 0�C34����< =949 4�� 4���� �� ����� �9�� 7�=� ��7 7�2����
5������"�"������� $�������� ���������� =�9 3���37 �� �9� ���3�4��� �5 5��0 ��7 �0 ��8�4�001 �� ����3�:� �������
�����$3� ����554��� 0�C34���� �5 �9� ����� �40�7�� ��B0�31 73�� ��! �/�8�3�4�0�301 �� ����3�:� �������
������������������� '��� A '���
5��8� � C0�=�C1 �5 �� 2�1 3�7�4� �9� 0�C34���� �5 �9� ����� ��7 �9� ����4���7 ��B0�31 73�� ;���� ���3��3< �4��2 8�28< 9173��04 8�28< ���3��3< 5��0 8�28< �0 8�28< �0��3����3< 2������> ��� ��3���01�
5������"�"������� $�������� ���������� =�9 3���37 �� �9� ���3�4��� �5 �� 5��0 ��7 �0 ��8�4�001 �� ����3�:� ������
189

���������� ���������
���������������������������������� ������
������
������ �
������ �
����� �����
��� ����� ����������
�����%-� $9�24�0 �50���4� �� �������0 ����� 8�3�� ;���� 4�2C����� ��! ���49�2C�3> ��8�4�001 �� �343�5� ���3���
������������������� '��� A '��-
5��8� ��� �� �9� �43����7 =���3 �55��1 �5 ��< �4�38�3���7 =���3 2�1 0��7 �� 4�33���� ��7��3 C��� 2���3�0 7�4�28����� �5 4�2C����� 49�2C�3 8�3�� ��49 �� 43��: ���3 �3 �0� �3�� 8�3��< 3���0��� � �� ����� 7�2���< 8�3�4�0�301 �� 0����3 �343�5� ���3��� ���3�0��
5������"�"������� ����������� 3���37�� 4�33���� �5 �������0 ����� 8�3�� ;���� 4�2C����� 49�2C�3< 43��: 73�< �0� �3��K> 7�3�� �343�5� ���3����
�����% � (�05��4��� �5 �9� ��3C� 49�3��3 ��! ���
������������������� '��/ A '���
5��8� %9� �0�9�01 �43����7 4�2C����� ��28�3���3� �5 �� 4��07 0��7 �� 2�05��4���� �5 �9� ��3C�49�3��3 ��7 4����L�����001 �� � 0��� �5 ����� 8�=�3�
5������"�"������� ����32�� �9� 755�3��4�� �5 �9� 4�2C����� ��28�3���3�� C��=��� (�.�� ��7 ���
�����%#� $9�24�0 �50���4� �� ���0�� 2���3�0� ;���� !"� ���:��< ��! ���!"� ��3���< 4�3: ���:��< &���> =�9� �0 ��7 5��0 �1���2
������������������� '��+ A '���
5��8� ��� �� �9� 49�3�4��3��4� �5 �� ���0 2���3�0� =�9� �9� �0 �3 5��0 �1���2 2�1 C� 7�����3���7� �5��3 0����3 8�3�7� �5 �2� �9� 4��07 0��7 �� 0��:���� ��7 �9� 7����3 �5 53��
5������"�"������� ����3�4���� 5�3 8�3�74�0 2�������4� ���3�0 5�3 ���0��� ��7 4�������� ���������� =�9 3���37 �� �9� �� 4�28��C0�1 �5 ���0�� 2���3�0��
190

���������� ���������
���������������������������������� ������
������
������ �
������ �
����� �����
��� ����� ����������
�-�.-6- �"������ ��7��+���* ���
�����%$� ��4�28��C0�1 �5 3�CC�3 88�� ��! ���
������������������� ��� � ��-
5��8� �5 3�CC�3 9���� �3� ��� �� 3������� �����9< �9� 8���C01 0��7� �� �2C3��0��< �=�00��< �3 �� C��� 2���3�0 7�4�28������ %9� 4����L���4�� 7�8��7 �� �9� 2���3�0< 0��:���� ��7 43������4��� 4���3�4����� )��:��� �3 2�1 ����3 � 8�3��� 5��0 �1���2� $3������4��� 4���3�4���� 4�� 28�3 �9� 5��0 50�=< � �9� =�3�� 4��� 0��7�� �� �� ����� ���8�
5������"�"������� '�3�9�3 ���������� �� �9� �� 4�28��C0�1 �5 3�CC�3 2���3�0��
�����%%� ��4�28��C0�1 �5 �0�2��2< ����0< 4�88�3 88�� ��! ���
!���� �20�3 3�: 8������0� �8801 �� 5����� 2�7� �5 2��� 7�3�� 2���0�< 49�4: �0��< 5��0 7��3C���3�
������������������� ��/ A ��/< ��� � ���< �-� A �/�< ��� A ���
5��8� "1 4�33���� ;��7��3 ��35�4� 4�33����> ��7 3���7 ��� 7�8���� ;7�� �� ��0��� 49�3�4��3��4 �5 ��> 50��3� 4�� C� G�22�7� "��� 2���3�0 7�4�28�����< 8���� 4�33���� ��7 �43����7 4�33���� =�9� �9� 3���� �5 =�07�� ���2� 0��7 �� 0��:�����
5������"�"������� '�3�9�3 ���������� �� �9� �� 4�28��C0�1 �5 ;=�07�7> �0�2��2< ����0< 4�88�3 88��< �� =�00 �� 5������
�����%(� ��4�28��C0�1 �5 �0�4�34�0 5��0 8�28� ��! ���
������������������� ��� � ��+
5��8� %9� 9�9�3 4��7�4��1 �5 �� 4�� 0��7 �� �� �43����7 =��3 �5 �9� 4�3C�� C3��9 4��7�4��3�� %9� ;8�3��0> 7��3�7���� �5 755�3��� 2���3�0� ;2���0� ��7��3 80���4�> 2�1 0��7 �� 5��0 0��:����� ����7 ��� 7�8���� 4�� C0�4: 2��� 8�3�� �8 �� �9� 0��� �5 5��4��� �5 �9� 5��0 8�28�
5������"�"������� ����������� 4��4�3��� �� 4�28��C0�1 �5 �0�4�34�0 5��0 8�28��
�����%.� ��4�28��C0�1 �5 2�49��4�0 5��0 8�28� ��! �/�
������������������� ��- � �-�
5��8� ,�3�� 0�C34���� 49�3�4��3��4 �5 ��< 4�33����< C��� 2���3�0 7�4�28�����< 53�H�� =���3 � N7��7 ��7 �3���O< 4�� 3���0� � � 8�28 ������� ��8���� 3���7 ��� C1 �� 4�� C0�4: 2��� 8�3��� �55�3��� 7��3�7�7 2���3�0� 2�1 4���� 0��:����� �8�4�001 � �9� 4��� �5 7�893��2 8�28� �9� 2�1 0��7 �� �9� 0��� �5 5��4����
5������"�"������� ����������� 4��4�3��� �� 4�28��C0�1 �5 2�49��4�0 5��0 8�28��
191

���������� ���������
���������������������������������� ������
������
������ �
������ �
����� �����
��� ����� ����������
�����%0� ��4�28��C0�1 �5 4�3C�3����3 ��! ���
������������������� ���� A ����
5��8��"1 4�33���� ;��7��3 ��35�4� 4�33����> ��7 3���7 ��� 7�8���� ;7�� �� ��0��� 83�8�3��� �5 ��> 50��3� 4�� C� C0�4:�7� "��� 2���3�0 7�4�28�����< �2C3��0�2��� ��7��3 �=�00�� 0��7 �� 0��:����� �� 8�3�4�0�3< 0��:���� �� �9� 7�893��2 �3 �� �9� 50��� ���70� �0� 2�1 4���� � 2�05��4����� �5 �9� 4�3C�3����3�
5������"�"������� ����������� 4��4�3��� �� 4�28��C0�1 �5 4�3C�3����3�
�����%2� (���3�0 �4�28��C0�1 =�9 �3 C�B�� 53�2 4�28���� 2���3�0 ��! ���;$'@�.'@< K>
������������������� ���� � ���-
5��8� %9� ��0��� 83�8�3��� �5 �� � 4��G��4��� =�9 2�49��4�0 0��7< �3 =���3 � 4��G��4��� =�9 9�9 ��28�3���3� 2�1 0��7 �� � 7���0���� ��7��3 � ��8�3���� �5 3���� ��7 5C�3�� %9� 4�� 4���� 0��:����� ����49�7 3���� �3 5C�3� 2�1 ��7 �8 � �9� 4�2C����� 49�2C�3< =9�3�C1 7�2��� �� �9� ����� 4�� C� 4����7�
5������"�"������� '�3�9�3 ���������� 4��4�3��� �9� ��0��� 49�3�4��3��4� �5 �� ��7��3 ���C0�1 �5 4�28���� 2���3�0�
�����%3� (���3�0 �4�28��C0�1 =�9 �3 C�B�� 2�7� �5 2���0 ��! ���
������������������� ���/ A ����
5��8� %9� �3 C�B 4�� C�4�2� 0��:1 C1 4�33����� )��:��� � �9� �3 C�B 0��7� �� 8�=�3 0��� =�9 ��3C� ������< �� ��7�5��7 70� �8��7� =�9 ��83���7 �������
5������"�"������� '�3�9�3 ���������� 4��4�3��� �� ���C0�1 �5 �3 C�B 2���3�0� ;2���0�>
�����(-� (���3�0 �4�28��C0�1 �5 �9� 5��0 3���3� 88� 49�4: �0� ��! ��+
������������������� ���� A ���+
5��8� $�33���� 0��7� �� � 43��� ��4��� ��0�3��2��� � �9� 49�4: �0�� %9� 2�1 4���� � ��� 0�= 5��0 83����3��
5������"�"������� '�3�9�3 ���������� 4��4�3��� �� ���C0�1 �5 5��0 3���3� 88� 49�4: �0� 2���3�0��
192
���������� ���������
���������������������������������� ������
������
������ �
������ �
����� �����
��� ����� ����������
�����( � ��4�28��C0�1 �5 ;4�3C�3����3> 3�CC�3 50���� ��! ��+
!���� �20�3 3�: 8������0� �8801 �� �3 ���:� 9�����
������������������� ���- � ����< ���� A ����
5��8��%9� 3�CC�3 50���� 4�� C�4�2� 0��:1 C1 4�33���� ��7��3 C��� 2���3�0 7�4�28������ )��:��� � �9� 3�CC�3 50����< 0��7� �� 8�=�3 0��� =�9 ��3C� ������< �� ��7�5��7 70� �8��7� =�9 ��4��� ������� "1 �=�00�� �9� �3 ���:� 9��� 4��07 C� 0������7 53�2 �9� 4����4��� 8�3���
5������"�"������� '�3�9�3 ���������� 4��4�3��� �� ���C0�1 �5 3�CC�3 50���� 2���3�0�
�����(#� ��4�28��C0�1 �5 ���:� 2��5�07 ��! ���
������������������� ���� � ����
5��8� $�33���� 4�� �55�4� �9� ����� �8�3���� � �=� =�1�� %9�3� � � ������1 �� 5��0 2B��3� 7��3C����< �3 7���49�7 8�3�40�� 4�� C� 4�33�7 ��� �9� 4�2C����� 49�2C�3� �0��< �9� ���:� 2��5�07 4�� C�4�2� 0��:1 C1 4�33����� C��� 2���3�0 7�4�28�����< �3 C1 �=�00����2C3��0�2��� �5 ���:���� )��:��� � �9� ���:� 2��5�07 0��7� �� 8�=�3 0��� =�9 ��3C� ������< �� ��7�5��7 70� �8��7� =�9 ��4��� �������
5������"�"������� '�3�9�3 ���������� 4��4�3��� �� ���C0�1 �5 ���:� 2��5�07 2���3�0�
�����($� ��50���4� �5 �� �� 4�2C����� 49�2C�3 8�3�� ��! ��+
������������������� ��+� � ��+-
5��8� �� 4��07 0��7 �� �43����7 �0� ���� =��3� �� 4��07 9�� ������ �50���4� �� �9� ����� �0� "�7 �0 4�� 4���� 7�8���� � �9� �0� ��7�� (�05��4����� �5 �9� �0� ��7�� 3���0�� � 0��� �5 ����� 8�=�3�
5������"�"������� '�3�9�3 ���������� �5 �9� �0� ���� =��3 ��7 �9� �0� ��7�< � 3��0 ����� �8�3����� ��3�4�0�301 =�9 �3�4��0�7 ������ ;=�3�� 4���4���>
�����(%� ���883�83��� �8�3: 80��� ��! ���
������������������� ��+/ � ��-�
5��8� ��43����7 �0�4�3�7� 4����28���< ��8804�C0� 9��� 3����< 0��:��� �� ���0�� 3��< ��8804�C0� ��0���3�
5������"�"������� ����32�� ����C0� �8�3: 80��� 5�3 �� � 3��0 ����� �8�3����
193
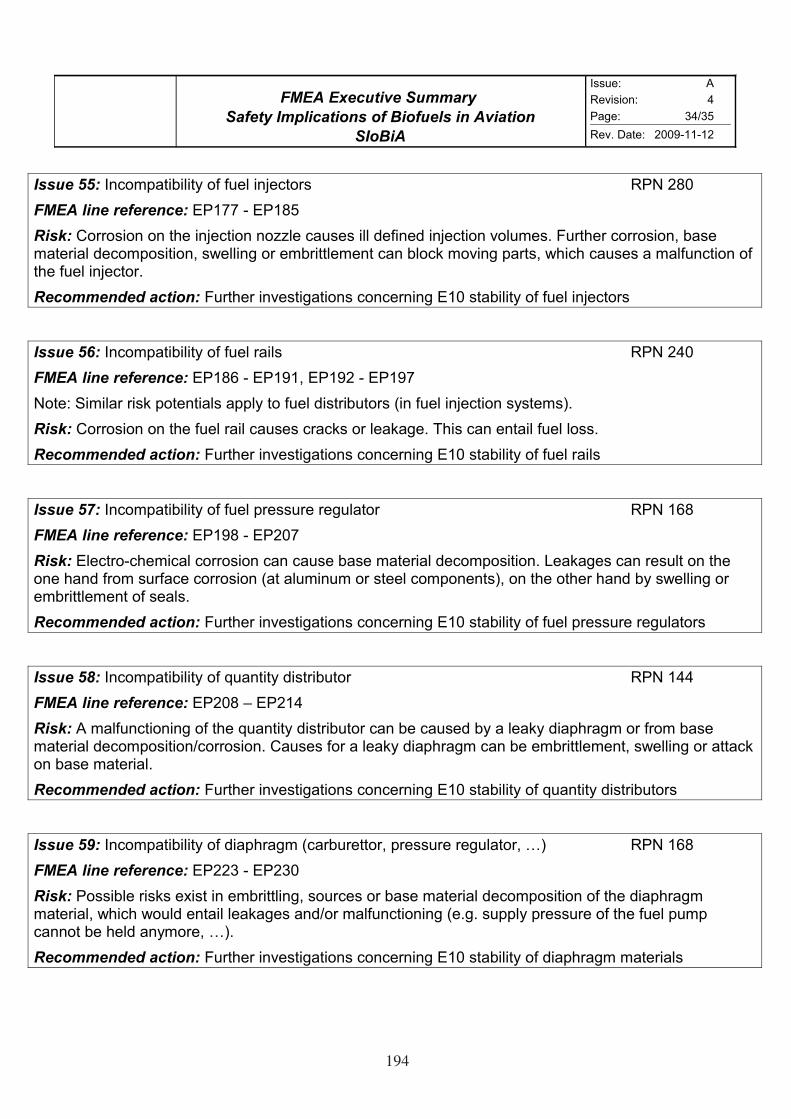
���������� ���������
���������������������������������� ������
������
������ �
������ �
����� �����
��� ����� ����������
�����((� ��4�28��C0�1 �5 5��0 �G�4��3� ��! �/�
������������������� ��-- � ��/�
5��8� $�33���� �� �9� �G�4��� ��HH0� 4����� 00 7�5��7 �G�4��� �0�2��� '�3�9�3 4�33����< C��� 2���3�0 7�4�28�����< �=�00�� �3 �2C3��0�2��� 4�� C0�4: 2��� 8�3��< =949 4����� � 2�05��4��� �5 �9� 5��0 �G�4��3�
5������"�"������� '�3�9�3 ���������� 4��4�3��� �� ���C0�1 �5 5��0 �G�4��3�
�����(.� ��4�28��C0�1 �5 5��0 3�0� ��! ���
������������������� ��/+ � ����< ���� � ���-
!���� �20�3 3�: 8������0� �8801 �� 5��0 7��3C���3� ;� 5��0 �G�4��� �1���2�>�
5��8� $�33���� �� �9� 5��0 3�0 4����� 43�4:� �3 0��:���� %9� 4�� ����0 5��0 0����
5������"�"������� '�3�9�3 ���������� 4��4�3��� �� ���C0�1 �5 5��0 3�0�
�����(0� ��4�28��C0�1 �5 5��0 83����3� 3���0���3 ��! �+/
������������������� ���/ � ���-
5��8� 0�4�3��49�24�0 4�33���� 4�� 4���� C��� 2���3�0 7�4�28������ )��:���� 4�� 3���0� �� �9� ��� 9��7 53�2 ��35�4� 4�33���� ;�� �0�2��2 �3 ����0 4�28������>< �� �9� ��9�3 9��7 C1 �=�00�� �3 �2C3��0�2��� �5 ���0��
5������"�"������� '�3�9�3 ���������� 4��4�3��� �� ���C0�1 �5 5��0 83����3� 3���0���3�
�����(2� ��4�28��C0�1 �5 L�����1 7��3C���3 ��! ���
������������������� ���/ A ����
5��8� � 2�05��4����� �5 �9� L�����1 7��3C���3 4�� C� 4����7 C1 � 0��:1 7�893��2 �3 53�2 C��� 2���3�0 7�4�28������4�33����� $����� 5�3 � 0��:1 7�893��2 4�� C� �2C3��0�2���< �=�00�� �3 ����4: �� C��� 2���3�0�
5������"�"������� '�3�9�3 ���������� 4��4�3��� �� ���C0�1 �5 L�����1 7��3C���3�
�����(3� ��4�28��C0�1 �5 7�893��2 ;4�3C�3����3< 83����3� 3���0���3< K> ��! �+/
������������������� ���� � ����
5��8� ����C0� 3�:� �B�� � �2C3��0��< ���34�� �3 C��� 2���3�0 7�4�28����� �5 �9� 7�893��2 2���3�0< =949 =��07 ����0 0��:���� ��7��3 2�05��4����� ;���� ��8801 83����3� �5 �9� 5��0 8�28 4����� C� 9�07 ��12�3�< K>�
5������"�"������� '�3�9�3 ���������� 4��4�3��� �� ���C0�1 �5 7�893��2 2���3�0�
194
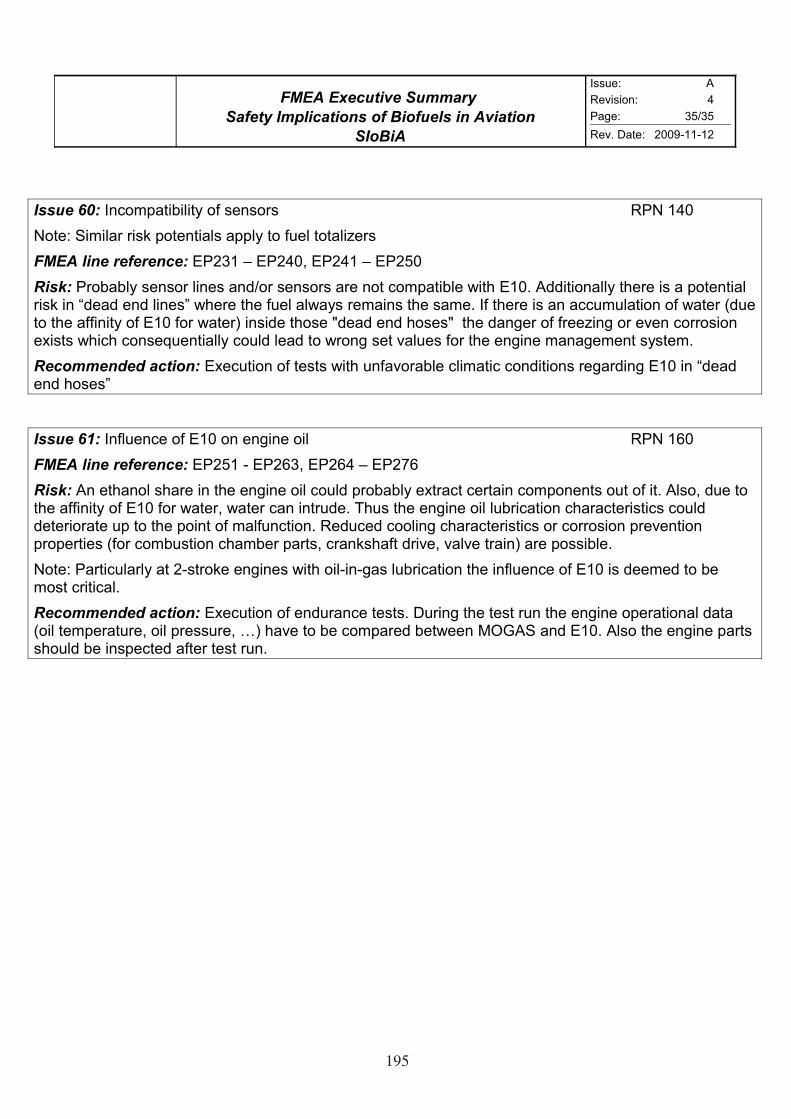
���������� ���������
���������������������������������� ������
������
������ �
������ �
����� �����
��� ����� ����������
�����.-� ��4�28��C0�1 �5 �����3� ��! ���
!���� �20�3 3�: 8������0� �8801 �� 5��0 ����0H�3�
������������������� ���� A ����< ���� A ����
5��8� �3�C�C01 �����3 0��� ��7��3 �����3� �3� ��� 4�28��C0� =�9 ��� �77����001 �9�3� � � 8������0 3�: � N7��7 ��7 0���O =9�3� �9� 5��0 �0=�1� 3�2��� �9� ��2�� �5 �9�3� � �� �44�2�0���� �5 =���3 ;7�� �� �9� �55��1 �5 �� 5�3 =���3> ��7� �9��� E7��7 ��7 9����E �9� 7����3 �5 53��H�� �3 ��� 4�33���� �B��� =949 4����L�����001 4��07 0��7 �� =3��� ��� �0��� 5�3 �9� ����� 2�����2��� �1���2�
5������"�"������� B�4���� �5 ����� =�9 ��5��3�C0� 402��4 4��7���� 3���37�� �� � N7��7 ��7 9����O
�����. � ��50���4� �5 �� �� ����� �0 ��! �+�
������������������� ���� � ��+�< ��+� A ��-+
5��8� �� ��9���0 �9�3� � �9� ����� �0 4��07 83�C�C01 �B�3�4� 4�3��� 4�28������ ��� �5 �� �0��< 7�� �� �9� �55��1 �5 �� 5�3 =���3< =���3 4�� ��3�7�� %9�� �9� ����� �0 0�C34���� 49�3�4��3��4� 4��07 7���3�3��� �8 �� �9� 8��� �5 2�05��4���� ��7�4�7 4��0�� 49�3�4��3��4� �3 4�33���� 83������ 83�8�3��� ;5�3 4�2C����� 49�2C�3 8�3��< 43��:�9�5� 73�< �0� �3��> �3� 8���C0��
!���� ��3�4�0�301 �� ����3�:� ������ =�9 �0������ 0�C34���� �9� �50���4� �5 �� � 7��2�7 �� C� 2��� 43�4�0�
5������"�"������� B�4���� �5 ��7�3��4� ������ ��3�� �9� ���� 3�� �9� ����� �8�3�����0 7��� ;�0 ��28�3���3�< �0 83����3�< K> 9�� �� C� 4�28�3�7 C��=��� (�.�� ��7 ��� �0�� �9� ����� 8�3�� �9��07 C� ��8�4��7 �5��3 ���� 3���
195
D Task Spanning Activities for Experimentation
In the consecuting sections actions specifically taken for the SIOBIA project are reported. Some
of these relate to more than one specific practical task, like the instrumentation of the MORANE.
Therefore they are discussed here before the targeted experimentation and results are given.
Experimental setups and details specifically set just for a single objective measurement are described
with the individual results as they do not create implications for other tasks.
D.1 Acquisition and Handling of Test Fuels
According to the FMEA discussions and further sources of information MOGAS types delivered
to airports and airfields are not limited to summer quality, as is considered usual for Austria for
vapour lock reasons in mountainous regions. Accordingly a stock of winter quality gasoline was
storaged which all experiments on volatility and vapour locking experiments are based on.
The certified delivery (see Table 28) of 680 l “Super Plus” winter ware was obtained from Total
Deutschland GmbH and is stored in closed tanks without ventilation in a custom-acquired fuel
cabinet. This gasoline is taken as a basestock for bio-ethanol mixing even though commercial Exxmixtures will usually be different in order to conform to the DIN EN 228 vapour pressure limits.
The experimenters would have liked to obtain such direct commercial Exx certified brands with
defined ethanol concentrations but were not able to obtain them: As the spot checks on commercial
qualities (see fig. 88) show the vast majority is exhibiting an ethanol content of well less than 1 %
at the time being.
With respect to the main thermodynamical experiments on the problem of vapour locking this
choice of winter quality as a basestock for admixing (Fig. 28) can be regarded as a conservative
approach, as the rise in vapour pressure will surpass that of a commercially mixed gasoline and
hence be more prone to the spontaneous creation of gasoline bubbles.
For admixture a delivery of 100 l of bio-ethanol was donated by Crop.Energies
(http://www.cropenergies.com). The test gasolines for all experiments undertaken within the
scope of SIOBIA (vapour locking in fuel system simulation test rig, icing on rotax test rig,
long-time storaging in exposed simulation tanks, phase separation cool-down experiments) are
performed with respective mixtures of the base gasoline and the bio-ethanol.
Table 29 shows the results of a chemical analysis of the custom mixed Exx gasolines.
196

���
��������
��������
���� ��� ��� ���������
����� ��� ����
����� �� ��� ������� ��� �����
����� �� ����� �����
����� ��� ��� ������
����� ��� ����������
��� ����������
����� ����
����� ����
����� ��
����� ����
�� ���
����� �
���� ��� ����������
���� ��� ����������
��� ����� ��� ��� ������
�� ����� �� ��� �������
��� ��� �����������
���� ��� ������� �
�!"#$� %&"'()$#*+�,�-.���()/"0%*'"1������������%1$2*
������������ ����
31!+&("4�3%"1!$��&5%1�3$&'�(!*6�� ��� �����
7&%$�+%5!"4� &2'-&1�
�#*��*!�4
#"%�!6�51!-2*�4
#"%�!6�#*#$8'2'4
�������� ���� ���� �����
%*'2"8�9������
:%#+�(!*"%*" ���$
�%*0%*%�(!*"%*"
�1!�#"2('�(!*"%*"
")#*!$�(!*"%*"
;%'2+&% ��������$
�!2$2*��(&1�%
-%$!<�����
-%$!<�������
-%$!<�������
-%$!<�������
�!2$2*��%*+�5!2*"
;%'2+&%
;���!11
����!11
�&$5)&1�(!*"%*" �����
=#5!&1�51%''&1% �3#
Table 28: Fuel certificate values of the gasoline delivery by Total Deutschland GmbH, taken as cus-tom basestock for oxygenated blending (BOB) for the vapour lock, storage and icing exper-iments
197
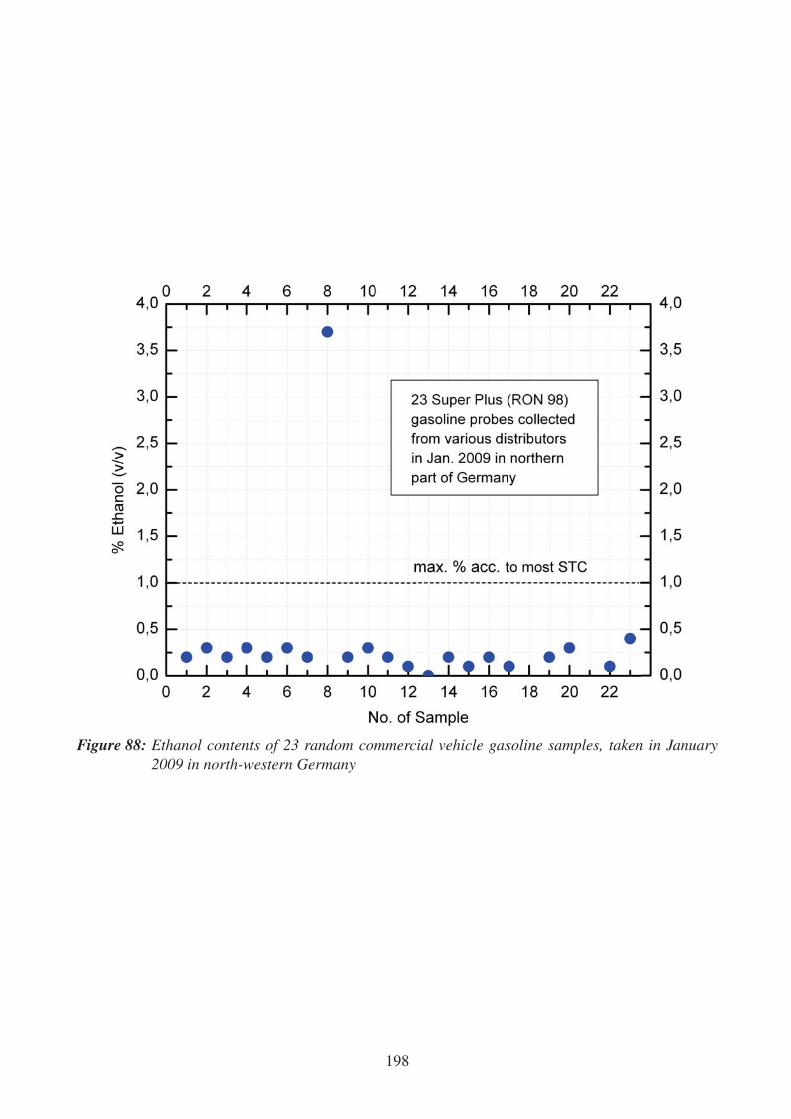
Figure 88: Ethanol contents of 23 random commercial vehicle gasoline samples, taken in January2009 in north-western Germany
198
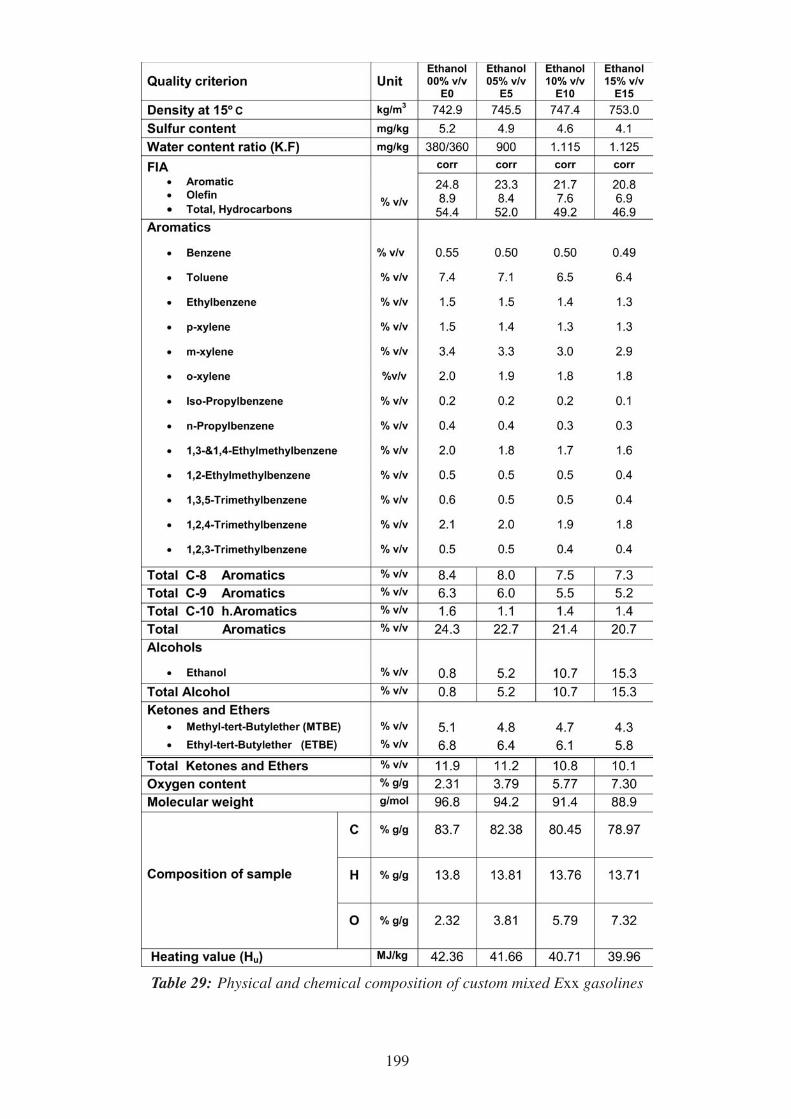
Table 29: Physical and chemical composition of custom mixed Exx gasolines
199
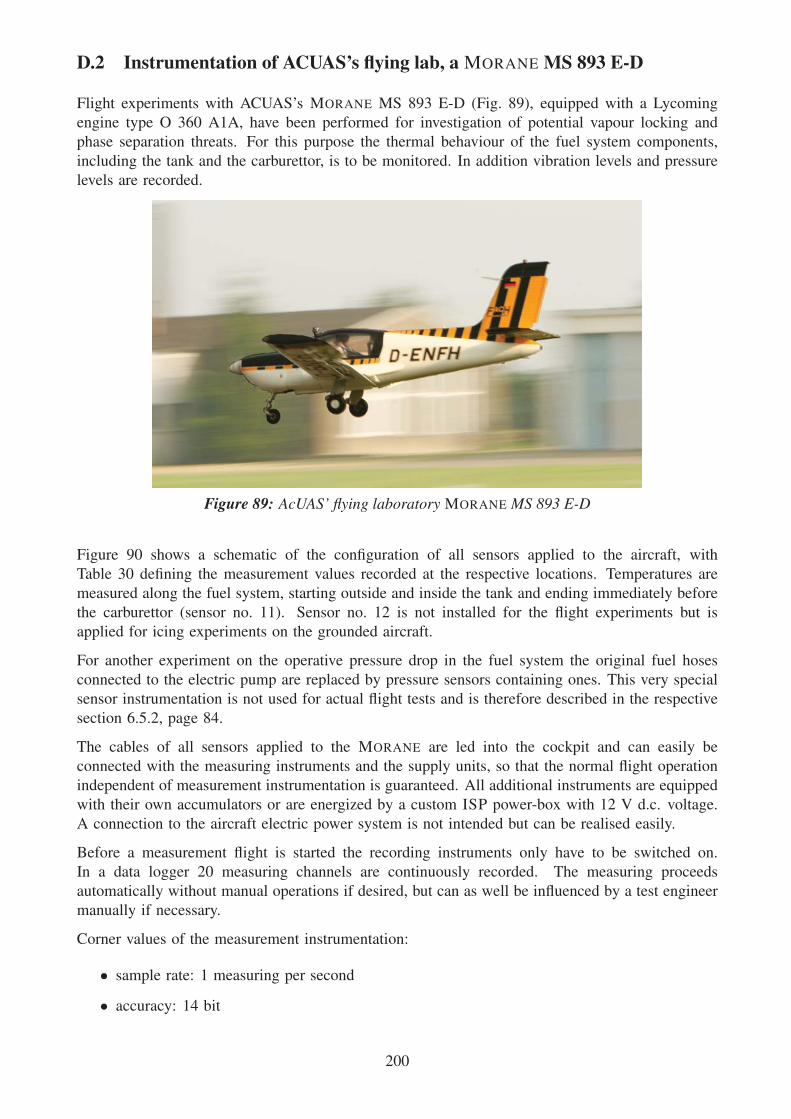
D.2 Instrumentation of ACUAS’s flying lab, a MORANE MS 893 E-D
Flight experiments with ACUAS’s MORANE MS 893 E-D (Fig. 89), equipped with a Lycoming
engine type O 360 A1A, have been performed for investigation of potential vapour locking and
phase separation threats. For this purpose the thermal behaviour of the fuel system components,
including the tank and the carburettor, is to be monitored. In addition vibration levels and pressure
levels are recorded.
Figure 89: AcUAS’ flying laboratory MORANE MS 893 E-D
Figure 90 shows a schematic of the configuration of all sensors applied to the aircraft, with
Table 30 defining the measurement values recorded at the respective locations. Temperatures are
measured along the fuel system, starting outside and inside the tank and ending immediately before
the carburettor (sensor no. 11). Sensor no. 12 is not installed for the flight experiments but is
applied for icing experiments on the grounded aircraft.
For another experiment on the operative pressure drop in the fuel system the original fuel hoses
connected to the electric pump are replaced by pressure sensors containing ones. This very special
sensor instrumentation is not used for actual flight tests and is therefore described in the respective
section 6.5.2, page 84.
The cables of all sensors applied to the MORANE are led into the cockpit and can easily be
connected with the measuring instruments and the supply units, so that the normal flight operation
independent of measurement instrumentation is guaranteed. All additional instruments are equipped
with their own accumulators or are energized by a custom ISP power-box with 12 V d.c. voltage.
A connection to the aircraft electric power system is not intended but can be realised easily.
Before a measurement flight is started the recording instruments only have to be switched on.
In a data logger 20 measuring channels are continuously recorded. The measuring proceeds
automatically without manual operations if desired, but can as well be influenced by a test engineer
manually if necessary.
Corner values of the measurement instrumentation:
• sample rate: 1 measuring per second
• accuracy: 14 bit
200

Figure 90: Schematic of the fuel system of the MORANE MS 893 E-D. Locations and types of sensorsare given. For the technical specification of the sensors see table 30.
• measurement period: max. 4 hours
During the measurement the correct operation of the additional instrumentation can be controlled
on the display of the data logger.
In addition to the low-frequency data acquisition of temperatures and pressures the high-frequency
read-out of vibration data is sampled for shorter periods of interest.
201

No. Sensor-Type Position Compartment1 Temperature fuel tank top wing tip
2 Temperature fuel tank side wing tip
3 Temperature fuel tank bottom wing tip
4 Temperature fuel tank inside, top wing tip
5 Temperature fuel tank inside, bottom wing tip
6 Temperature fuel tank outlet wing root
7 Temperature before switch valve wing root
8 Temperature before electrical pump engine
9 Temperature after electrical pump engine
10 Temperature after mechanical pump engine
11 Temperature before carburettor engine
12 Temperature in carburettor (icing test) engine
13 ΔP- Sensor fuel tank air ventilation wing
14 Vibration fuel tank top wing
15 Vibration fuel pipe wing root
16 Vibration fuel pump vertical engine
17 Vibration fuel pump horizontal engine
18 T ambient inside fresh-air tube to cockpit
19 P ambient cockpit cockpit
20 Relative humidity cockpit cockpit
Table 30: Locations and types of sensor instrumentation as applied to the MORANE
202

D.3 Setup, Instrumentation and Test Matrix of a Test-Rigged ROTAX 912 ULSEngine in Propeller Operation
The AcUAS piston engine test bed was built in 1996 for ground testing and certification of
propellered piston engines (Fig. 91). It is also possible to determine the propeller characteristic
map. The test bed is designed for piston engines up to 300 kW and propeller diameters up to
2.1 m.
Figure 91: ROTAX 912 ULS on test rig
A multi fuel supply allows an alternating operation of one engine on different fuels with short
switching intervals. For the SIOBIA project an additional fuel supply system has been installed
being capable of providing ethanol admixed fuel types. The basic rack is variable and can be used
for different kinds of piston engines and their peripheral aggregates. It is build as a plate profile to
203

minimize the aerodynamic drag caused by the rotating propeller. At the assembly plate which is
constructively similar to the firewall in an aircraft the engine itself is mounted.
Four independent linear bearings and two load cells allow the measurement of the thrust up
to 20 kN and indirectly the propeller torque up to 1500 Nm. The rig features a state-of-the-art
measurement devices assortment for temperature, pressure, fuel mass flow, noise and vibration. The
measured values are automatically sampled by Imps of Schlumberger and converted and indicated
with an adequate postprocessing system. For the SIOBIA project an electrically heated 20 m
long exhaust gas analysis tube has been built and connected by an additional 5 m flexible hose
to the exhaust gas analysis equipment in an adjacent laboratory. Gas analyses can be performed
continuously during the engine operation.
Figure 92: Measurement points for temperature drop (icing) and exhaust gas composition (LCA) de-termination in the ROTAX 912 ULS operating diagram. The named operating conditionsdenominate the respective engine states in the LCA flight profile (see Fig. 76, p. 138).
Fig. 92 shows the test matrix for the icing experiments and for LCA exhaust gas data aquisition.
As detailed in Sect. 8, Fig. 76 some standard comparison points have been defined representing
typical engine load states. Besides the idle operation, keeping the engine alive, the taxi operation
mode represents the typical load state when the aircraft is moving on the ground by its own power.
At take-off the maximum power output is requested for a limited time, followed by a longer lasting
period of maximal continuous power output that makes the aircraft climb to the service ceiling.
Arriving there the engine is operated typically in the best economy mode, in order to make the
most mileage from the available amount of fuel. Descending to touch-down the engine is throttled
to the approach setting before another taxi-ing operation brings the aircraft back to the hangar.
204
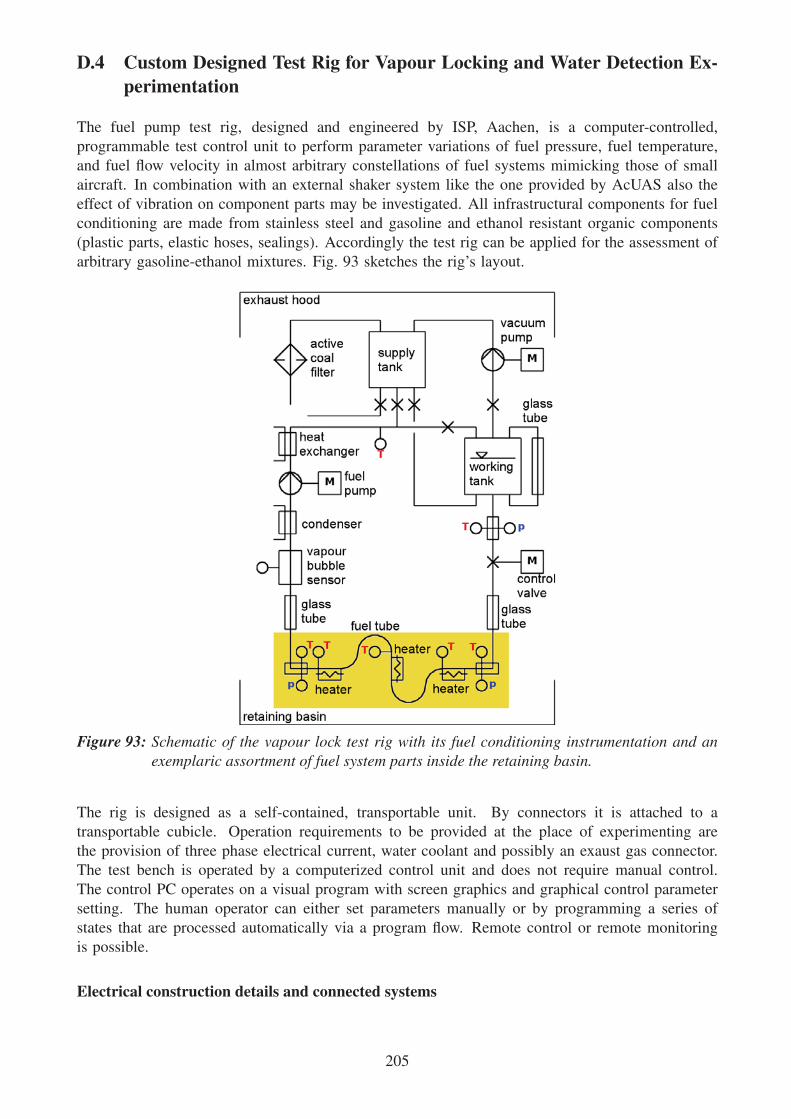
D.4 Custom Designed Test Rig for Vapour Locking and Water Detection Ex-perimentation
The fuel pump test rig, designed and engineered by ISP, Aachen, is a computer-controlled,
programmable test control unit to perform parameter variations of fuel pressure, fuel temperature,
and fuel flow velocity in almost arbitrary constellations of fuel systems mimicking those of small
aircraft. In combination with an external shaker system like the one provided by AcUAS also the
effect of vibration on component parts may be investigated. All infrastructural components for fuel
conditioning are made from stainless steel and gasoline and ethanol resistant organic components
(plastic parts, elastic hoses, sealings). Accordingly the test rig can be applied for the assessment of
arbitrary gasoline-ethanol mixtures. Fig. 93 sketches the rig’s layout.
Figure 93: Schematic of the vapour lock test rig with its fuel conditioning instrumentation and anexemplaric assortment of fuel system parts inside the retaining basin.
The rig is designed as a self-contained, transportable unit. By connectors it is attached to a
transportable cubicle. Operation requirements to be provided at the place of experimenting are
the provision of three phase electrical current, water coolant and possibly an exaust gas connector.
The test bench is operated by a computerized control unit and does not require manual control.
The control PC operates on a visual program with screen graphics and graphical control parameter
setting. The human operator can either set parameters manually or by programming a series of
states that are processed automatically via a program flow. Remote control or remote monitoring
is possible.
Electrical construction details and connected systems
205
The state of the fuel, especially with respect to the existence of vapour bubbles, may be determined
by optical and capacitive sensors at the entry and the end of the fuel system test line. Arbitrary
additional sensors can be applied and monitored by the data aquisition system connected to the
control system.
• Rittal cubicle TS RAL 7035 800x1800x500 mm, with mobile base
• one main three-phase AC line 380 VAC, 32A, approx. 8 m
• Harting connectors to the test bench
• thermocouple connectors in the cubicle
• circuit breaker in the cubicle (VDE)
• emergency stop (VDE)
• gate and switch components for silicon oil heating
• frequency converter for silicon oil circulating pump
• Phoenix bus system
• Shuttle PC with Phoenix PCI card, monitor, keyboard and mouse
Mechanical Construction
The transportable test rig is constructed with frame and basic elements built of extruded aluminium
sheaths with the maximum dimensions 900 mm × 1000 mm × 1850 mm, movable through a
door and with pivoting and lockable wheels. The roof and three sides of the construction are
covered with panes of Makrolon, the undercarriage with anodized aluminium plates. The interior
is accessible by a swing door. Airtight collection pans underneath serve to absorb all liquids in
case of spillage. A lid with a receptacle for an extraction hose closes off the test rig at the top.
The interior features cross-ties and beams to attach all components to be investigated, such as
fittings, filters, tubes, switches, pumps, and the like. An oil conditioning unit is integrated into the
undercarriage which can be detached to the sides in a userfriendly manner. The is designed to be
operated in conjunction with the large shaker of AcUAS, so the fuel system components can be
vibrated/accelerated during test runs. Fig. 94 shows the actual realisation of the rig.
Hydraulic Construction
The fuel-loop consists of the following components:
• 10 liters feeder tank (stainless steel) with activated carbon filter (stainless steel)
• 5 liters work tank (stainless steel)
• fittings and armatures, nickel-plated, cables VA D10
• main pressure control valve
• arbitrary (typically three) stainless steel heaters to heat fuel lines
206

Figure 94: Actual vapour lock test rig with its fuel conditioning elements in place
• condenser (stainless steel)
• controllable fuel pump
• controllable vacuum pump
• high quality fuel hoses
207

• 2 pcs. fuel-proof and compression-proof inspection glasses
• ISP capacitive vapour bubble sensors
• receptacles to integrate airplane components
D.4.1 Rig Control
The control system consists of the following single control units, each with selectable accesses:
• temperature control (PWM, single-point-method or PID)
• pressure control (PID)
• flow control (PID)
All controller parameters are adjustable. Range parameters can be used. A cascading of controllers
is possible. The control systems are optimized for adjustment speed and, in second preference, for
controller oscillation minimization. Ranges of tolerance can be edited. Accordingly it is possible
to first run a test series with high ranges of tolerance quickly, and afterwards perform a test run
with adjusted controller parameters and a decreased range of tolerance for more precision, but also
of longer duration.
The test rig is controlled by a visual basic program. Input elements and notifications on the the
screen enable the user to control all functions of the test bench and to meter the data. There
is the possibility to steer the test bench manually or automatically, at which different inspection
procedures can be loaded and completed.
The parameters of the inspection procedures, which are available as spreadsheet data, can be freely
edited. Temperatures, compression, percolation and all other actuating variables can be set as
parameters. Moreover, parameters can be defined as control variable.
A skip of certain check points can be timed or based on advanced tolerance range definitions. If a
tolerance range cannot be reached, the check routine automatically jumps to another program step,
which has been defined by the user. This schema permits a complete skip of the check routine
after their initial loop is carried out once.
The pre-determined program flow is run automatically and does not require input of the user. All
relevant input and data are saved as spreadsheet data in the course of the test run. A duration
optimization of the test procedure is possible through a clever choice of check program ordering.
During the entire test procedure, security relevant parameters are continuously monitored. If the
the maximum permissible value is exceeded, an immediate emergency stop os triggered and the
test bench is lead to a defined security status.
D.4.2 Procedures of Test Rig Operation for Nucleation Assessment
First the test rig is checked for all functions without any fuel system components: All control unit
settings with its parameters and their specific reactions upon changes are checked. Subsequently the
components specific to the fuel system under observation are inserted into the measuring circuit.
208

A layout change of the hydraulic system or a change of fuel composition consumes more time
than for example a scan of various pressures or temperatures in the test loop. Self-defined testing
schedules should take these dependencies into account (fig. 95).
Accordingly, pressure and temperatures, are specified in a matrix while the fuel composition is not
changed. If steam bubbles occur, the part of the test (further reduction of pressure or increase
of temperature) is skipped. In doing so, a limiting curve for nucleation is established. With the
results won from this, a test run with a finer resolution is edited, so that the limiting curve can be
collected more precisly (± 2 ◦C; ± 2 mbar).
Figure 95: Example screen for the parameter setting of automatized test runs of the test rig
New test runs are performed for changed fuel compositions. Likewise the mechanic and hydraulic
construction is changed and tested with varying fuel mixes in an outer loop.
D.4.3 Functions
The components to be checked are fixated at the test rig. Their tightness is tested with compressed
air. The fuel to be tested is poured into the feeder tank (approx. 10 l).
The fuel system can now be evacuated and possibly be filled with inert gas. The working tank
(approx. 5 l) is fed from the feeder tank via a ball cock. After visual check of the flow loop with
respect to its tightness the test rig is operable. The doors are monitored for their closed position.
209
Operating pressure (mimicking flight altitude), fuel percolation and temperature can now be
preselected and tuned. Settings and results can be saved via keystrokes. Now the test bench does
not require manual operation anymore and can be switched to automatic operation. The automatic
test run can be started.
The existence of vapour bubbles is monitored by optic turbidity sensors. The substances escaping
the liquid loop as vapour in the testing section is liquified in a reconditioning condenser and refed
into the fuel.
D.4.4 Measurement Options
Pressure sensors: Stainless steel, accuracy 0,5 %, measurement range 0 . . . 1 bar, current output 4
. . . 20 mA. The entire measuring chain can be calibrated.
Temperature sensor: 3 mm mineral isolated thermocouple type K NiCr–Ni, accuracy of measure-
ment conforming to DIN or better. The entire measuring chain can be calibrated.
Coriolis flow rate sensor: Provided by AcUAS to measure the percolation. The test rig incorpo-
rates interfaces to import all relevant data of this sensor (mass flow, density, temperature).
This data can be converted online and utilized by the control circuits.
Gear-wheel flowrate sensor for discharge measurement.
ISP laser scatter light sensor: A laser driven scatter light unit measures the turbidity at two parts
in the fuel system. With bridge-balancing measurements the exact onset of turbidity and the
first appearance of vapour bubbles can be detected.
D.4.5 Environment Protection and Safety Arrangements
For a retainment of bad smell and potential air contamination, the work tank is drained through
an activated carbon filter. Airtight collection pans underneath serve to absorb all liquids in case
of a spillage. The lid of the test rig can be connected to an exhaust fan via an air separator vent
pipe. The test bench is barred on all sides with Makrolon- panes or aluminium plates. A bursting
of tubes of a leackage of fuel can therefore not lead to injuries or scaldings. These protection are
adequate as no fast moving engines or oscillating weights are present in operation.
In case of fire, an extinguishing agent can be directly injected into the rig through a security
opening in the side panel. The doors can stay shut.
D.4.6 Bubble Sensor Design
The bubble sensor custom-designed by ISP operates on the principle of straylight detection caused
by liquid/vapour interfaces. It consists of a stainless steel cube with bores at right angles,
perpendicular to the flow direction. Optical access to the probe volume is provided by two
borosilicate glass windows closing the bores. Light originating from a solid state laser is shone at
a right angle into the liquid material. On the opposite side an absorber catches the remaining light
not deflected or absorbed. Vertical to the laser beam a photo diode collects the light reflected or
scattered by obstacles in measurement volume.
If a clear liquid or gas is streaming through the sensor only a minimal amount of parasitic light
enters the photo diode. If there is a fluid with scattering interior interfaces in the sensor volume,
210

like a liquid with bubbles, a measurable amount of light is scattered and detected by the diode,
depending on bubble size and number. After amplification and low-pass filtering the signal is fed
into the test rig processing unit. If a certain limiting value is transgressed the control program
changes to the next probe cycle by either reducing the temperature or increasing the system
pressure, to reduce the bubble generation.
D.4.7 Calibration of the Test Rig
For calibration the test rig without attached aircraft components is filled and actuated on substances
with well-defined characteristics. First the imposed pressure is measured. Thereafter the fuel
conditioning system is heated until the onset of vaporization can be registered. The recorded
operating points are checked against the well-defined thermodynamic characteristics of the test
fluid. The various sensors will be tested on a periodical basis with certified calibration standards to
guarantee continuous high measuring accuracy.
temperaturessubstance 20 ◦C 30 ◦C 50 ◦C
n-pentane(boiling point 36 ◦C @ 1 bar; d = 0,63 kg/l)
562 mbar 820 mbar 1585 mbar
n-hexane(boiling point 96 ◦C @ 1 bar; d = 0,66 kg/l)
162 mbar 248 mbar 540 mbar
ethanol, azeotropic 94 %
(boiling point 78,4 ◦C @ 1 bar; d = 0,79 kg/l)
58 mbar 100 mbar 293 mbar
Table 31: Boiling pressures of test rig calibration substances. Reference: GESTIS table of properties(http://www.dguv.de/bgia/de/gestis/stoffdb/index.jsp#)
As calibration substances, n-hexane, and azeotropic ethanol are be used (Table 31, lines in Fig. 96).
Their boiling pressure dependencies on the prevalent temperature resemble the ones of the more
volatile gasoline components.
�� �� � � �� �� "� "� >����
���
��
���
"��
>��
���
��
�� ����
�� ?�??���
��??���
����������� ���
-��
�����
��
?��
.�#�/��%&����
�� �� � � �� �� "� "� >����
���
��
���
"��
>��
���
��
�� ����
�� ?�??���
��??���
����������� ���
-��
�����
��
?��
/'(�0�/�
Figure 96: Bubble measurement observations for n-hexane (left) and an azeotropic ethanol/watermixture (right) in combination with the governing theoretical evaporation curve for therespective substance [17].
211

For calibration purposes the test rig is operated automatically in the same way as afterwards for
the gasoline measurements. For the given calibration substance (T, p) pairs are scanned until a
certain amount of bubbles, represented by a respective readout value, appears in the optical bubble
sensor. Fig. 96 shows these results for a bubble value of 0.3 (in sensor specific units).
212

E Life-Cycle Analysis of Ethanol-Admixed Gasolines — Reportby LUDWIG BÖLKOW SYSTEMTECHNIK
The consecuting pages include the self-contained LBST report as provided. Parts of this report,
together with additional interpretations and subsumptions, are integrated in the main report body
in Section 8, page 137.
213
FRAMEWORK PROJECT OF THE EUROPEAN AVIATION SAFETY AGENCY (EASA)
�SIOBIA: SAFETY IMPLICATIONS OF BIOFUELS IN AVIATION�.
LIFE CYCLE ANALYSIS FROM THE PRODUCTION, SUPPLY AND USE OF VARIOUS BIOMASS SOURCES FOR ETHANOL AS AN
AVIATION FUEL
STUDY COMMISSIONED BY
ACIAS � AACHEN INSTITUTE OF APPLIED SCIENCES E. V.
FINAL REPORT
Werner Weindorf
Zsolt Matra
Dr. Uwe Albrecht
December 2009
www.lbst.de
214

R E P O R T
Disclaimer
The staff of Ludwig�Bölkow�Systemtechnik GmbH prepared this report.
The views and conclusions expressed in this document are those of the staff of Ludwig�Bölkow�Systemtechnik GmbH. Neither Ludwig�Bölkow�Systemtechnik GmbH, nor any of their employees, contractors or subcontractors, makes any warranty, expressed or implied, or assumes any legal liability or responsibility for the accuracy, completeness, or usefulness of any information, product, or process enclosed, or represents that its use would not infringe on privately owned rights.
215

LCA for Bioethanol in Aviation
Report
i
CONTENTS
TABLES ...................................................................................................................... IV
FIGURES .....................................................................................................................VI
ACRONYMS AND ABBREVIATIONS ................................................................................... VII
EXECUTIVE SUMMARY ................................................................................................... IX
1 SCOPE AND METHODOLOGY ................................................................................ 10
1.1 Scope .............................................................................................................10
1.2 Methodology .................................................................................................11
1.2.1 Pathways considered ......................................................................11
1.2.2 CO2 equivalents...............................................................................12
1.2.3 Methodology for the accounting of by�products .............................13
1.2.4 Other emissions ..............................................................................15
1.2.5 Calculation tool...............................................................................15
2 FUEL PROPERTIES .............................................................................................. 16
3 REFERENCE GASOLINE PATHWAY.......................................................................... 17
3.1 Crude oil extraction and transport to refinery................................................17
3.2 Crude oil refining ...........................................................................................17
3.3 Distribution of final fuel .................................................................................18
3.4 End use ..........................................................................................................19
3.5 Results ...........................................................................................................19
4 ETHANOL PATHWAYS ......................................................................................... 20
4.1 Ethanol from wheat .......................................................................................20
4.1.1 Biomass supply ...............................................................................20
4.1.2 Transport to the ethanol plant ........................................................22
4.1.3 Ethanol plant...................................................................................22
4.1.4 Distribution of final fuel ..................................................................24
4.1.5 End use ...........................................................................................25
4.2 Ethanol from sugar beet ................................................................................25
216
LCA for Bioethanol in Aviation
Report
ii
4.2.1 Biomass supply ...............................................................................25
4.2.2 Transport to the ethanol plant ........................................................26
4.2.3 Ethanol plant...................................................................................26
4.2.4 Distribution of the final fuel ............................................................27
4.2.5 End use ...........................................................................................27
4.3 Ethanol from sugar cane................................................................................27
4.3.1 Biomass supply ...............................................................................27
4.3.2 Transport to the ethanol plant ........................................................28
4.3.3 Ethanol plant...................................................................................28
4.3.4 Transport of the ethanol to the EU..................................................29
4.3.5 Distribution of final fuel ..................................................................30
4.3.6 End use ...........................................................................................30
4.4 Ethanol from wood ........................................................................................30
4.4.1 Biomass supply ...............................................................................30
4.4.2 Transport to the ethanol plant ........................................................31
4.4.3 Ethanol plant...................................................................................31
4.4.4 Distribution of final fuel ..................................................................31
4.4.5 End use ...........................................................................................31
4.5 Ethanol from straw ........................................................................................32
4.5.1 Biomass supply ...............................................................................32
4.5.2 Transport to the ethanol plant ........................................................32
4.5.3 Ethanol plant...................................................................................32
4.5.4 Distribution of the final fuel ............................................................33
4.5.5 End use ...........................................................................................33
4.6 Supply of fertilisers, pesticides and seeding material.....................................33
5 WTT RESULTS .................................................................................................. 37
6 TTP RESULTS.................................................................................................... 39
7 WTP RESULTS .................................................................................................. 42
8 OTHER EMISSIONS WTP ..................................................................................... 46
217

LCA for Bioethanol in Aviation
Report
iii
9 WTP EMISSIONS EXPRESSED IN E0 EQUIVALENTS .................................................... 52
10 LEAD EMISSIONS ............................................................................................... 56
11 LITERATURE ..................................................................................................... 57
218

LCA for Bioethanol in Aviation
Report
iv
TABLES
Table 1: Global warming potential of various GHGs [IPCC 2007]............................... 12 Table 2: Fuel properties .............................................................................................. 16 Table 3: ROZ (research octane number) and LHV of fuels........................................... 16 Table 4: Energy input and GHG emissions from crude oil extraction.......................... 17 Table 5: Energy input and GHG emissions from crude oil transport ........................... 17 Table 6: Technical and economic data for gasoline from crude oil refining................ 17 Table 7: Fuel consumption and GHG emissions of the barge ..................................... 18 Table 8: Technical and economic data for gasoline dispensing .................................. 18 Table 9: GHG emissions for the supply and use of gasoline ....................................... 19 Table 10: Input and output data for the cultivation of wheat (per kWh of
wheat grain) ................................................................................................. 21 Table 11: Input and output data for the conversion of wheat to ethanol ..................... 22 Table 12: Input and output data for steam generation via a natural gas
fuelled boiler................................................................................................. 23 Table 13: Input and output data for the combined heat and power (CHP)
plants............................................................................................................ 23 Table 14: Input and output data for the power stations............................................... 24 Table 15: Technical and economic data for ethanol dispensing ................................... 25 Table 16: Input and output data for the cultivation of sugar beet................................ 26 Table 17: Input and output data for the conversion of sugar beet to ethanol .............. 27 Table 18: Input and output data for the plantation of sugar cane................................ 28 Table 19: Input and output data for the conversion of sugar cane to
ethanol ......................................................................................................... 29 Table 20: Input and output data for the product tanker ............................................... 29 Table 21: Input and output data for the plantation of fast growing trees
(short rotation forestry.................................................................................. 30 Table 22: Input and output data for the conversion of wood chips to
ethanol ......................................................................................................... 31 Table 23: Fertiliser debit ............................................................................................... 32 Table 24: Input and output data for the conversion of straw to ethanol ...................... 33 Table 25: Energy requirements and GHG emissions for the supply of N�
fertiliser [Kaltschmitt 1997] .......................................................................... 34 Table 26: Energy requirements and GHG emissions for the supply of CaO�
fertiliser [Kaltschmitt 1997] .......................................................................... 34 Table 27: Energy requirements and GHG emissions for the supply of K2O�
fertiliser [Kaltschmitt 1997] .......................................................................... 35
219
LCA for Bioethanol in Aviation
Report
v
Table 28: Energy requirements and GHG emissions for the supply of P2O5�fertiliser [Kaltschmitt 1997] .......................................................................... 35
Table 29: Energy requirements and GHG emissions for the supply of pesticides [Kaltschmitt 1997]........................................................................ 36
Table 30: Energy requirements and GHG emissions for the supply of seeding material for winter wheat [Kaltschmitt 1997].................................. 36
Table 31: Detailed GHG emissions of pathway 02a...................................................... 37 Table 32: TtP fuel consumption, GHG emissions and air pollutant emissions
(the SO2 and PM emissions are approximately zero)..................................... 41 Table 33: WtP GHG emissions [g CO2 equivalent/kWhmech] ........................................... 43 Table 34: TtP emissions of lead (Pb)............................................................................. 56
220

LCA for Bioethanol in Aviation
Report
vi
FIGURES
Figure 1: Calculation of a credit for the by�product DDGS for the production of ethanol from wheat ................................................................ 13
Figure 2: Bioethanol life�cycle...................................................................................... 20 Figure 3: WtT GHG emissions ...................................................................................... 38 Figure 4: Piston engine test stand at FH Aachen ......................................................... 39 Figure 5: LTO cycle for engine emission measurements............................................... 40 Figure 6: TtP GHG emissions from FH Aachen measurements (LTO cycle) ................... 40 Figure 7: GHG emissions WtP E05 ............................................................................... 44 Figure 8: GHG emissions WtP E10 ............................................................................... 44 Figure 9: GHG emissions and emission reduction compared to reference
WtP E15........................................................................................................ 45 Figure 10: NOx and NMVOC WtT emissions for E05 ...................................................... 46 Figure 11: NOx and NMVOC TtP emissions .................................................................... 47 Figure 12: NOx and NMVOC WtP emissions for E05 ...................................................... 47 Figure 13: NOx and NMVOC WtP emissions for E10 ...................................................... 48 Figure 14: NOx and NMVOC WtP emissions for E15 ...................................................... 48 Figure 15: SO2 and dust/PM WtT emissions for E05....................................................... 50 Figure 16: SO2 and dust/PM WtT emissions for E10....................................................... 50 Figure 17: SO2 and dust/PM WtT emissions for E15....................................................... 51 Figure 18: GHG emissions of E5 compared to reference WtP expressed in E0
equivalents ................................................................................................... 52 Figure 19: GHG emissions of E10 compared to reference WtP expressed in
E0 equivalents .............................................................................................. 53 Figure 20: GHG emissions of E15 compared to reference WtP expressed in
E0 equivalents .............................................................................................. 53 Figure 21: Air pollutant emissions of E5 compared to reference WtP
expressed in E0 equivalents.......................................................................... 54 Figure 22: Air pollutant emissions of E10 compared to reference WtP
expressed in E0 equivalents.......................................................................... 54 Figure 23: Air pollutant emissions of E15 compared to reference WtP
expressed in E0 equivalents.......................................................................... 55
221

LCA for Bioethanol in Aviation
Report
vii
ACRONYMS AND ABBREVIATIONS
AcIAS Aachen Institute of Applied Sciences e. V. AVGAS Aviation gas CaO Calcium oxide (commonly known as burnt lime, lime, or quicklime) CCGT Combined cycle gas turbine CFCs Chlorofluorocarbons CH4 Methane CHP Combined heat and power CxHy Hydrocarbons CO Carbon monoxide CO2 Carbon dioxide DCA Dichloroethane DDGS Dried distillers grains with solubles DGS Distiller�s grain and solubles ( EASA European Aviation Safety Agency EDB Dibromoethane EtOH Ethyl alcohol, (Bio)Ethanol, C2H5OH FFB Fresh fruit bunches GHG Greenhouse gases HFC Hydrofluorocarbons ICE Internal combustion engine IPCC Intergovernmental Panel on Climate Change K2O Potassium oxide LBST Ludwig�Bölkow�Systemtechnik GmbH LCA Life�cycle analysis LHV Lower heating value LL Low lead LTO Landing and take�off LUC Land use change MOGAS automotive gasoline MSF Multi�stage flash distillation MWV Mineralölwirtschaftsverband N Nitrogen N2O Nitrous oxide NG Natural gas NH3 Ammonia NMVOC Non�methane volatile organic compounds NOx Nitrogen oxides
222

LCA for Bioethanol in Aviation
Report
viii
P2O5 Phosphorus oxide Pb Lead PM Particulate matter ROZ Research Oktan Zahl (German: research octane number) SF6 Sulfur hexafluoride SO2 Solfur dioxide TCDD Tetrachlorodibenzodioxin TEPb Tetra�ethyl�lead TtP Tank to propeller VOC Volatile organic compounds WtP Well to propeller WtT Well to tank
223
LCA for Bioethanol in Aviation
Report
ix
EXECUTIVE SUMMARY This study investigates the potential environmental impacts, using life�cycle analyses (LCA), from the production, supply and use of various biomass sources for ethanol used as a gasoline admixture in general aviation aircraft equipped with spark ignited piston engines.
The analyses includes well�to�tank (WtT) greenhouse gas (GHG) and other air pollutant emissions for various bioethanol pathways, tank�to�propeller (TtP) emission values based on actual aircraft engine combustion data. Well�to�tank and tank�to�propeller data are combined in to a comprehensive well�to�propeller (WtP) LCA data set. Additional to GHG emissions, NOx, NMVOC, SO2, and dust/particulate matter are covered, and the emission impact of the use of lead containing aviation fuel on the environment is considered.
Using bioethanol admixtures generally leads to a reduction in GHG emissions, but to higher NOx emissions.
224

LCA for Bioethanol in Aviation
Scope and Methodology
1�10
1 SCOPE AND METHODOLOGY
1.1 Scope Due to the enforcement of the EU directive 2003/30/EC more biomass derived fuels like bioethanol will be added to automotive gasoline. Some general aviation aircraft equipped with spark ignited piston engines are approved for operation with automotive gasoline (MOGAS). However, the majority of those approvals are limited to MOGAS that does not contain more than 1% volume per volume (v/v) ethanol. The current fuel specification EN 228 allows already up to 3% v/v (bio�)methanol or up to 5% v/v (bio�)ethanol as fuel component. Several refineries have already started the supply of E5 (gasoline containing 5% v/v ethanol) and B5 or B7 (diesel containing 5% or 7% v/v biodiesel, respectively) fuels. A further increase of the amount of ethanol is expected, e.g. E10 or E15 gasoline blends.
This report contributes to a research project by the European Aviation Safety Agency (EASA) aimed at investigating possible safety implications on aircraft/engine operation and on tanks, fuel pipes, seals, and fuels systems of spark ignited piston engine powered aircraft and engines by using fuel containing bioethanol. In addition, the potential environmental impacts (positive and negative) are considered. This work supports Task 5 of the project: �Based on identified knowledge gaps, and within the scope of this project, investigate the potential environmental benefits, using life�cycle analyses (LCA), from the production, supply and use of various biomass sources for biofuels.�
The analyses are structured as follows:
� Well�to�tank: greenhouse gas (GHG) emissions and other air pollutant emissions are given for various bioethanol pathways from wheat, sugar beet, sugar cane (ethanol imported from Brazil), from lignocellulosic waste (waste wood, residual straw) and from lignocellulosic biomass from short rotation forestry.
� Tank�to�propeller: based on actual aircraft engine combustion data, tank�to�propeller emissions are estimated where accurate data is lacking.
� Well�to�propeller: well�to�tank and tank�to�propeller data are combined in to a comprehensive well�to�propeller LCA data set.
� Other emissions: additional to GHG emissions, NOx, NMVOC, SO2, and dust/particulate matter are covered.
� Impact of the use of lead containing aviation fuel on the environment: lead emissions are estimated, and the effect of returning from MOGAS to AVGAS is considered.
225

LCA for Bioethanol in Aviation
Scope and Methodology
1�11
1.2 Methodology This report evaluates gasoline�(bio)ethanol blends and their production pathways together with the fuel use in the general aviation aircraft equipped with spark ignited piston engines, comparing it to conventional MOGAS in a well�to�wheel�type �well�to�propeller� analysis. The evaluation comprises the emissions of greenhouse gases (GHG) and air pollutants of fuel supply and use.
The energy requirements and GHG emissions resulting from the construction and decommissioning of the fuel production plants are not considered. Also not considered are the energy requirements and emissions resulting from the manufacturing and decommissioning of the aircraft.
1.2.1 Pathways considered The set of pathways considered in this report has been chosen to cover all relevant (bio)ethanol production sources and technologies including (bio)ethanol produced in the European Union or bought in the European Union and produced in exporting countries. This same set of ethanol pathways is also covered in the European Renewable Energy Directive [RED 2009]. Starting point for the evaluation are assumptions regarding individual processes and chains made in the CONCAWE/EUCAR/JRC well�to�wheel study [CONCAWE 2007], [CONCAWE 2009]. For this present study many of the original pathways defined in [CONCAWE 2007] and [CONCAWE 2009] are modified and additional pathways not considered in the cited study are newly modelled based on data from the aircraft industry and data provided by AcIAS � Aachen Institute of Applied Sciences e. V.
Pathways have been modelled and calculated using LBST�s E3database tool.
The study covers the following groups of pathways:
� Gasoline pathway (MOGAS) (Reference, based on [CONCAWE 2007])
� (bio)ethanol production pathways
� Ethanol from wheat (process heat demand covered by natural gas fuelled boiler)
� Ethanol from wheat (process heat demand covered by combined heat and power production fuelled by natural gas)
� Ethanol from wheat (process heat demand covered by combined heat and power production fuelled by lignite)
� Ethanol from wheat (process heat demand covered by combined heat and power production fuelled by wheat straw)
� Ethanol from wheat (process heat demand covered by biogas from distillers grains and solubles )
� Ethanol from sugar beet (process heat demand covered by biogas from slops )
226

LCA for Bioethanol in Aviation
Scope and Methodology
1�12
� Ethanol from sugarcane (process heat demand covered by bagasse)
� Ethanol from residual wood (process heat demand covered by combined heat and power production fuelled by the ligneous residue)
� Ethanol from farmed wood (process heat demand covered by combined heat and power production fuelled by the ligneous residue)
� Ethanol from wheat straw (process heat demand covered by combined heat and power production fuelled by the ligneous residue)
Any by�products in the pathways listed above are balanced by using the substitution method and allocation by energy method. Therefore each pathway has two variants (a) for substitution and (b) for allocation by energy. In the case when substitution is not applicable only allocation was used.
This report documents the assumptions used in modelling the fuel pathways and also the calculated results.
The calculations of energy use and GHG emissions are based on the lower heating value (LHV).
1.2.2 CO2 equivalents Greenhouse gases considered in this study are carbon dioxide (CO2), methane (CH4), and nitrous oxide (N2O)1. The global warming potential of the various greenhouse gases is expressed in CO2 equivalents. Table 1 shows the global warming potential for a time period of 100 years according to the Intergovernmental Panel on Climate Change (IPCC).
Table 1: Global warming potential of various GHGs [IPCC 2007]
GHG CO2 equivalents
CO2 1CH4 25 N2O 298
In the evaluation only CO2 generated by the combustion of fossil fuels is considered. The combustion of biomass is CO2 neutral because the amount of CO2 emitted during the combustion of the biomass is the same as the amount of CO2 which has been removed from the atmosphere during the growth of the plants.
1 Other greenhouse gases are CFCs, HFCs, and SF6; these are not relevant in the context of this study.
227

LCA for Bioethanol in Aviation
Scope and Methodology
1�13
1.2.3 Methodology for the accounting of by�products Many processes produce not only the desired product but also �by�products�. This is the case for biofuels from traditional crops such as FAME from rapeseed or ethanol from wheat. Two different methods are widely used to account for these by�products, the substitution method, and the allocation method.
Substitution method
For the calculation of a credit the energy requirements and GHG emission values are used from the production of the product which realistically is replaced by the by�product. This method is called �substitution method�. The substitution method has also been used in [GM 2002], [CONCAWE 2007] and [CONCAWE 2009].
A typical by�product in ethanol production from wheat is DDGS (Dried Distillers Grains with Solubles), the dried residue remaining after the starch fraction of wheat is fermented, which is generally used in livestock feeds.
Figure 1 shows an example for the calculation of the credit (DDGS replaces animal fodder from wheat and imported soybeans).
Ethanolproduction
Soybeanprocessing
Wheatsupply Ethanol
Plant oil(food)
Soyameal
DDGS
Soyameal
Ethanol
Soybeansupply
Etha
nols
uppl
y(e
nerg
ycar
rier)
Soya
mea
land
whea
tsup
ply
(ani
mal
fodd
er)
Main
prod
uct:
Etha
nol
By-p
rodu
ct:D
DGS
Main
prod
uct:
soya
mea
lBy
-pro
duct
:plan
toil
Sunflowerseed
processing
Sunflowerseed
supply
Sunflowerseed meal
Wheatsupply
Feedwheat
Figure 1: Calculation of a credit for the by�product DDGS for the production of ethanol from wheat
228
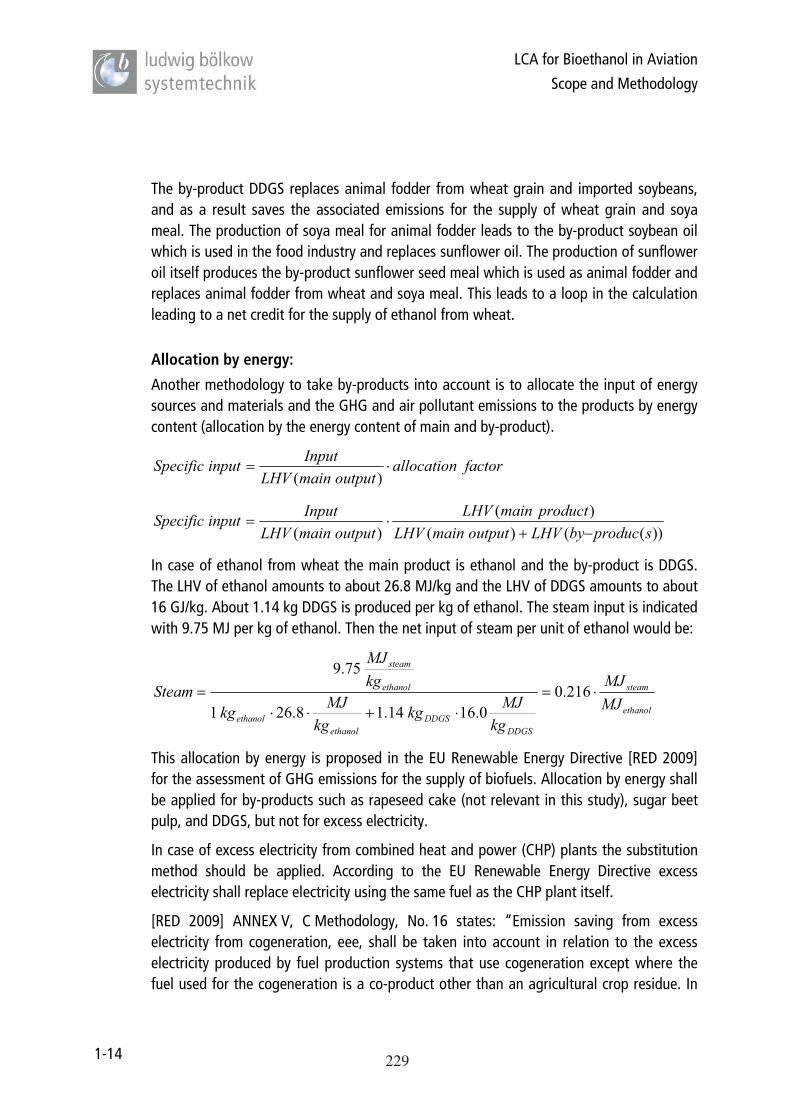
LCA for Bioethanol in Aviation
Scope and Methodology
1�14
The by�product DDGS replaces animal fodder from wheat grain and imported soybeans, and as a result saves the associated emissions for the supply of wheat grain and soya meal. The production of soya meal for animal fodder leads to the by�product soybean oil which is used in the food industry and replaces sunflower oil. The production of sunflower oil itself produces the by�product sunflower seed meal which is used as animal fodder and replaces animal fodder from wheat and soya meal. This leads to a loop in the calculation leading to a net credit for the supply of ethanol from wheat.
Allocation by energy:
Another methodology to take by�products into account is to allocate the input of energy sources and materials and the GHG and air pollutant emissions to the products by energy content (allocation by the energy content of main and by�product).
factorallocationoutputmainLHV
InputinputSpecific ⋅=)(
))(()()(
)( sproducbyLHVoutputmainLHVproductmainLHV
outputmainLHVInputinputSpecific
−+⋅=
In case of ethanol from wheat the main product is ethanol and the by�product is DDGS. The LHV of ethanol amounts to about 26.8 MJ/kg and the LHV of DDGS amounts to about 16 GJ/kg. About 1.14 kg DDGS is produced per kg of ethanol. The steam input is indicated with 9.75 MJ per kg of ethanol. Then the net input of steam per unit of ethanol would be:
ethanol
steam
DDGSDDGS
ethanolethanol
ethanol
steam
MJMJ
kgMJkg
kgMJkg
kgMJ
Steam ⋅=⋅+⋅⋅
= 216.00.1614.18.261
75.9
This allocation by energy is proposed in the EU Renewable Energy Directive [RED 2009] for the assessment of GHG emissions for the supply of biofuels. Allocation by energy shall be applied for by�products such as rapeseed cake (not relevant in this study), sugar beet pulp, and DDGS, but not for excess electricity.
In case of excess electricity from combined heat and power (CHP) plants the substitution method should be applied. According to the EU Renewable Energy Directive excess electricity shall replace electricity using the same fuel as the CHP plant itself.
[RED 2009] ANNEX V, C Methodology, No. 16 states: �Emission saving from excess electricity from cogeneration, eee, shall be taken into account in relation to the excess electricity produced by fuel production systems that use cogeneration except where the fuel used for the cogeneration is a co�product other than an agricultural crop residue. In
229

LCA for Bioethanol in Aviation
Scope and Methodology
1�15
accounting for that excess electricity, the size of the cogeneration unit shall be assumed to be the minimum necessary for the cogeneration unit to supply the heat that is needed to produce the fuel. The greenhouse gas emission saving associated with that excess electricity shall be taken to be equal to the amount of greenhouse gas that would be emitted when an equal amount of electricity was generated in a power plant using the same fuel as the cogeneration unit�.
1.2.4 Other emissions In this study the emission of the following other air pollutants is investigated:
� NOx
� PM (particle matter)
� NMVOC (non�methane volatile organic compounds)
� SO2
1.2.5 Calculation tool For the calculations the E3database tool developed by LBST is used. This tool was also used in the CONCAWE/EUCAR/JRC study [CONCAWE 2007], [CONCAWE 2009].
230

LCA for Bioethanol in Aviation
Fuel properties
2�16
2 FUEL PROPERTIES Table 2 shows the properties of the investigated fuels regarding energy content and CO2
emissions.
Table 2: Fuel properties
LHV CO2
Fuel [kWh/l] [MJ/l] [kWh/kg] [MJ/kg] [g/kWh] [g/MJ]
Gasoline 8.9 32.2 12.0 (11.77)
43.2 (42.36)
264 73.3
Ethanol 5.9 21.2 7.45 26.8 257 71.3
The data for the lower heating value (LHV) and CO2 emissions of gasoline and ethanol shown in Table 2 also have been used as in the CONCAWE/EUCAR/JRC study [CONCAWE 2007], [CONCAWE 2009]. The CO2 values represent complete stoichiometric combustion. The numbers for the lower heating value of gasoline in () are based on data from [Esch 2009] and have been used to convert the gasoline consumption of the aircraft engine expressed in kg into kWh.
The influence of the octane number on the lower heating value and the carbon content of the gasoline are negligible, see Table 3.
Table 3: ROZ (research octane number) and LHV of fuels
MOGAS Normal unleaded Super unleaded AVGAS 100 LL
ROZ 95 � 98 91 � 94 95 � 98 n. d. a.
LHV (kWh/kg) 12.00
(11.77) 12.20 12.00 12,14
Source: http://www.schmidtler.de/html/ht_technik/kraft.htm ; () [Esch 2009]
The combustion of biomass is CO2 neutral because the carbon is removed from the atmosphere during growth of the plants and emitted as CO2 during aircraft operation. In case of biomass derived fuels, the CO2 emissions are subtracted at the WtT stage.
231
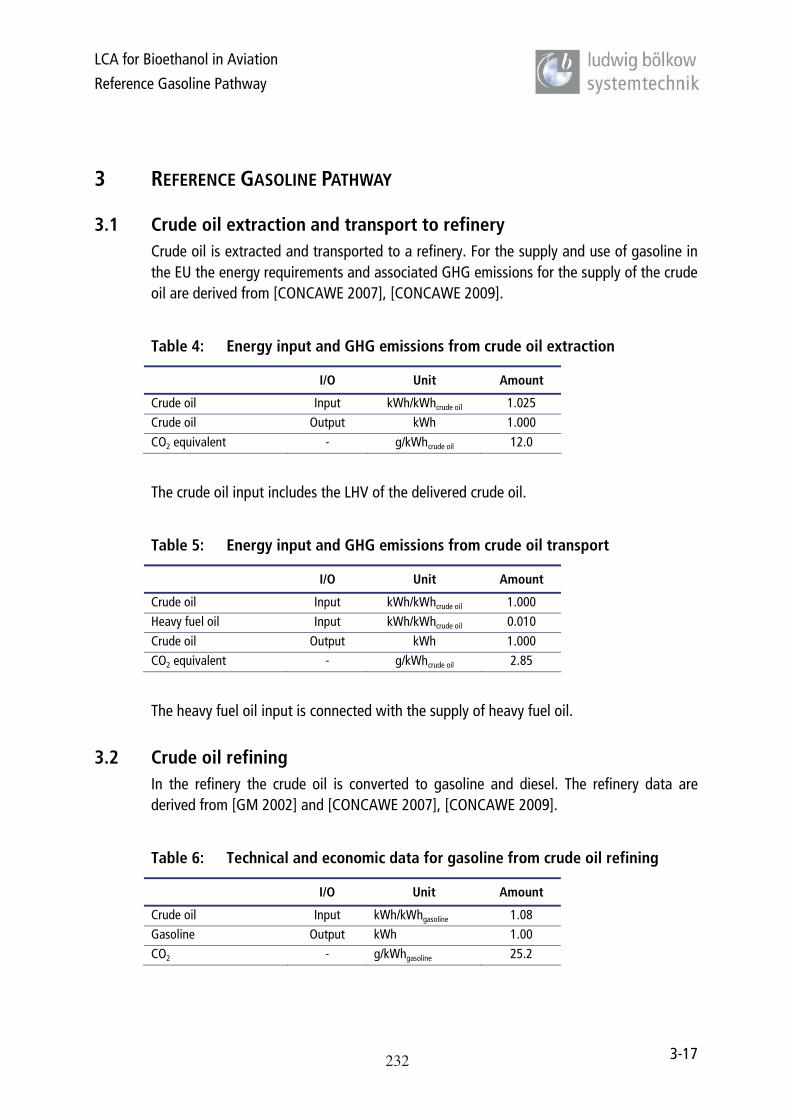
LCA for Bioethanol in Aviation
Reference Gasoline Pathway
3�17
3 REFERENCE GASOLINE PATHWAY
3.1 Crude oil extraction and transport to refinery Crude oil is extracted and transported to a refinery. For the supply and use of gasoline in the EU the energy requirements and associated GHG emissions for the supply of the crude oil are derived from [CONCAWE 2007], [CONCAWE 2009].
Table 4: Energy input and GHG emissions from crude oil extraction
I/O Unit Amount
Crude oil Input kWh/kWhcrude oil 1.025 Crude oil Output kWh 1.000
CO2 equivalent � g/kWhcrude oil 12.0
The crude oil input includes the LHV of the delivered crude oil.
Table 5: Energy input and GHG emissions from crude oil transport
I/O Unit Amount
Crude oil Input kWh/kWhcrude oil 1.000 Heavy fuel oil Input kWh/kWhcrude oil 0.010
Crude oil Output kWh 1.000 CO2 equivalent � g/kWhcrude oil 2.85
The heavy fuel oil input is connected with the supply of heavy fuel oil.
3.2 Crude oil refining In the refinery the crude oil is converted to gasoline and diesel. The refinery data are derived from [GM 2002] and [CONCAWE 2007], [CONCAWE 2009].
Table 6: Technical and economic data for gasoline from crude oil refining
I/O Unit Amount
Crude oil Input kWh/kWhgasoline 1.08 Gasoline Output kWh 1.00 CO2 � g/kWhgasoline 25.2
232

LCA for Bioethanol in Aviation
Reference Gasoline Pathway
3�18
3.3 Distribution of final fuel The gasoline is transported to a depot via pipeline, barge (distance: 500 km) and rail (distance: 250 km). The share of gasoline transport via pipeline is 60%, the share of inland navigation is 20% and the share of rail is 20%. The same assumptions have been made in [CONCAWE 2007] and [CONCAWE 2009].
The electricity consumption for the transport of gasoline via pipeline is about 0.0002 kWh/kWh of gasoline.
About 0.042 tkm/kWh of gasoline are required for the transport of gasoline via barge over a distance of 500 km. Table 7 shows the fuel consumption and the GHG emissions of a typical barge. The return voyage (empty) is considered for the fuel consumption of the barge.
Table 7: Fuel consumption and GHG emissions of the barge
I/O Unit Amount
Diesel Input kWh/tkm 0.140 Distance Output tkm 1.000
CO2 � g/tkm 38.0 CH4 � g/tkm 0.03
For rail transport of gasoline over a distance of 250 km about 0.021 tkm/kWh of gasoline are required. The electricity consumption of the train is ca. 0.058 kWh/tkm. The electricity requirement of the train is met by the EU electricity mix.
The electricity consumption of the depot is about 0.0008 kWh/kWh of gasoline. From there the gasoline is distributed to the filling stations via truck over an average distance of 150 km. The electricity for the depot and the filling station (0.4 kV level) is derived from the EU electricity mix.
Table 8: Technical and economic data for gasoline dispensing
I/O Unit Amount
Gasoline Input kWh/kWhgasoline 1.0008 Electricity Input kWh/kWhgasoline 0.0034 Gasoline Output kWh 1.0000
233

LCA for Bioethanol in Aviation
Reference Gasoline Pathway
3�19
3.4 End use The gasoline is used in piston engine aircrafts. The combustion of gasoline leads to about 264 g CO2 per kWh of gasoline.
3.5 Results Table 9 shows the overall WtP GHG emissions for the gasoline pathway. It has to be noted that Table 9 shows the GHG emissions per kWh of the final product (gasoline). Therefore, the GHG emissions of the different process steps presented in Table 9 are not necessarily the same as the GHG emissions of the single processes presented above.
The emission values of the processes are multiplied by the input/output ratios (including all inputs, outputs, by�products) trough all processes starting at the end of the chain calculating upstream to the first link. Therefore, energy requirement and emissions of a process step shown in the results table (e.g. crude oil extraction) strongly depend on the processes downstream in the chain. In this pathway the energy requirement and the emissions of all upstream processes such as the crude oil transport and the supply of crude oil has to be multiplied by the crude oil requirement of the refinery (1.06 kWh per kWh of gasoline).
Table 9: GHG emissions for the supply and use of gasoline
CO2�Equivalent/kWhgasoline
Crude oil extraction 13.0 Crude oil transport system 3.3
Crude oil refinery 25.2 Gasoline distribution 0.9
Filling station 2.7
Total emissions gasoline supply 445.2
Combustion 2264
Total emissions supply and combustion 3309
234

LCA for Bioethanol in Aviation
Ethanol Pathways
4�20
4 ETHANOL PATHWAYS The elements of a bioethanol life�cycle are shown in the Figure below.
Ethanolproduction
Fuel blending /Distribution
Fillingstation
Electricity (EU mix)
Feedstock transport EtOH transport
Diesel oil
Fuel transport
Cropcultivation
Fertilisers
Pesticides
HeatIn some
cases CHP
Figure 2: Bioethanol life�cycle
In the following sections, the life�cycle elements are described quantitatively for each individual bioethanol pathway.
4.1 Ethanol from wheat
4.1.1 Biomass supply According the European Fertiliser Manufacturer Association (EFMA) the average yield for wheat grain in the EU amounts to about 5.2 t per ha and year based on a water content of 13.5% [EFMA 2008]. The LHV of wheat grain is 17.0 kg/kg of dry substance [Kaltschmitt 2001]. For the operation of farming machines 3,590 MJ [Crop Energies 2008] to 3843 MJ [ADEME 2002] diesel per ha and year are required. The average value of 3717 MJ per ha and year leads to a specific diesel requirement of about 0.0486 MJ/MJ of wheat grain.
235

LCA for Bioethanol in Aviation
Ethanol Pathways
4�21
The emissions of N2O from the plantation of energy crops consist of the direct N2Oemissions, indirect N2O emissions from emitted NH3 and NOx, and indirect N2O emissions from leaching/runoff (soil N2O emissions). The soil N2O emissions are calculated using the European Soil Model in [CONCAWE 2009].
The input of nitrogen fertiliser is indicated with 109 kg N per ha and year based on the fertiliser use in 2005/2006 [EFMA 2008]. Furthermore, about 16 kg K2O fertiliser [EFMA 2008], 22 kg P2O5 fertiliser [EFMA 2008], 2.3 kg pesticides [Crop Energies 2008], and 120 kg seeding material [ETSU 1996] are required per ha and year.
Additionally, there are N2O emissions from the production of synthetic nitrogen fertiliser. The N2O emissions from the production of synthetic nitrogen fertiliser are accounted for in the upstream process (see chapter 4.6 for data).
Table 10 shows the input and output data for the cultivation of wheat.
Table 10: Input and output data for the cultivation of wheat (per kWh of wheat grain)
I/O Unit Amount
Diesel Input kWh/kWhwheat 0.0486
N fertiliser Input kg N/kWhwheat 0.00514
K2O fertiliser Input kg K2O/kWhwheat 0.00077
P2O5 fertiliser Input kg P2O5/kWhwheat 0.00102
Pesticides Input kg/kWhwheat 0.00011
Seeding material Input kg/kWhwheat 0.00565
Wheat Output kWh 1.0000
Emissions
CO2 � g/kWhwheat 12.8
CH4 � g/kWhwheat 0.005
N2O � g/kWhwheat 0.085
NOx � g/kWhwheat 0.187
SO2 � g/kWhwheat 0.000
NMVOC � g/kWhwheat 0.029
Dust/PM � g/kWhwheat 0.028
The energy requirements, GHG emissions and air pollutant emissions for the supply of fertilisers, pesticides, seeding material and diesel are accounted for in the upstream processes (see chapter 4.6 for data).
236
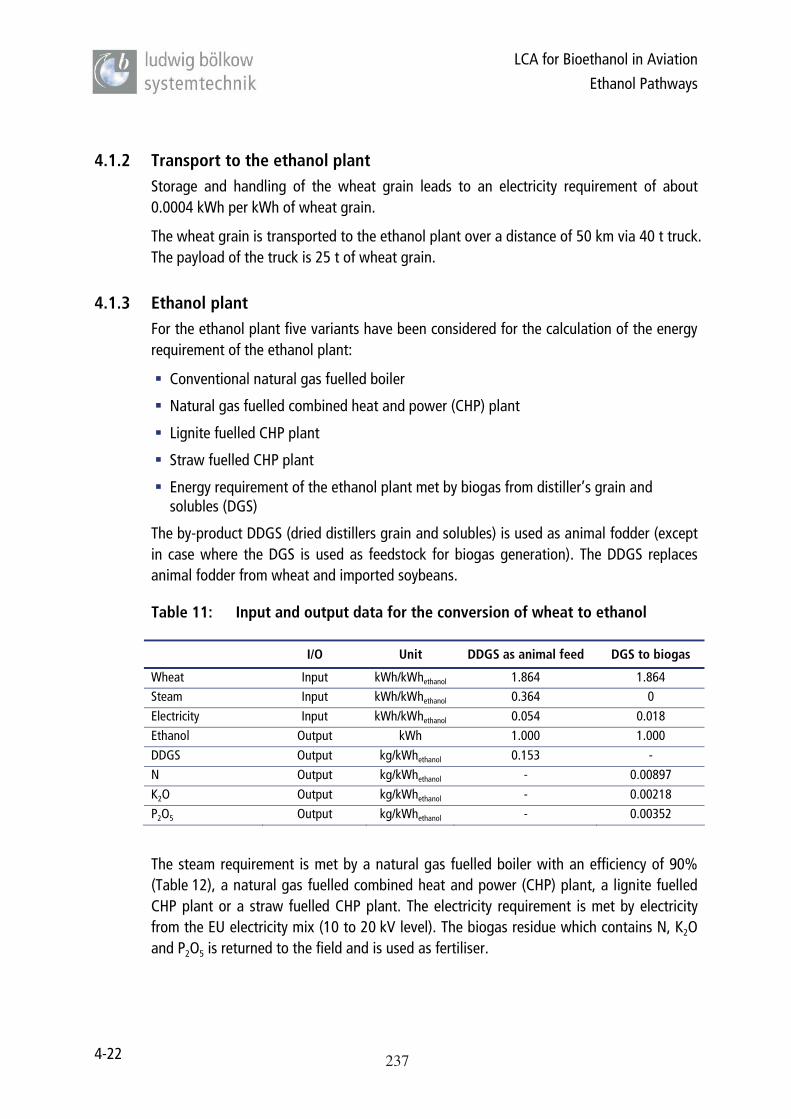
LCA for Bioethanol in Aviation
Ethanol Pathways
4�22
4.1.2 Transport to the ethanol plant Storage and handling of the wheat grain leads to an electricity requirement of about 0.0004 kWh per kWh of wheat grain.
The wheat grain is transported to the ethanol plant over a distance of 50 km via 40 t truck. The payload of the truck is 25 t of wheat grain.
4.1.3 Ethanol plant For the ethanol plant five variants have been considered for the calculation of the energy requirement of the ethanol plant:
� Conventional natural gas fuelled boiler
� Natural gas fuelled combined heat and power (CHP) plant
� Lignite fuelled CHP plant
� Straw fuelled CHP plant
� Energy requirement of the ethanol plant met by biogas from distiller�s grain and solubles (DGS)
The by�product DDGS (dried distillers grain and solubles) is used as animal fodder (except in case where the DGS is used as feedstock for biogas generation). The DDGS replaces animal fodder from wheat and imported soybeans.
Table 11: Input and output data for the conversion of wheat to ethanol
I/O Unit DDGS as animal feed DGS to biogas
Wheat Input kWh/kWhethanol 1.864 1.864 Steam Input kWh/kWhethanol 0.364 0
Electricity Input kWh/kWhethanol 0.054 0.018 Ethanol Output kWh 1.000 1.000
DDGS Output kg/kWhethanol 0.153 �N Output kg/kWhethanol � 0.00897
K2O Output kg/kWhethanol � 0.00218 P2O5 Output kg/kWhethanol � 0.00352
The steam requirement is met by a natural gas fuelled boiler with an efficiency of 90% (Table 12), a natural gas fuelled combined heat and power (CHP) plant, a lignite fuelled CHP plant or a straw fuelled CHP plant. The electricity requirement is met by electricity from the EU electricity mix (10 to 20 kV level). The biogas residue which contains N, K2Oand P2O5 is returned to the field and is used as fertiliser.
237

LCA for Bioethanol in Aviation
Ethanol Pathways
4�23
Table 12: Input and output data for steam generation via a natural gas fuelled boiler
I/O Unit Amount
NG Input kWh/kWhsteam 1.111 Electricity Input kWh/kWhsteam 0.020
Steam Output kWh 1.000
Emissions
CO2 � g/kWhsteam 226 CH4 � g/kWhsteam 0.010
N2O � g/kWhsteam 0.004 NOx � g/kWhsteam 0.224
SO2 � g/kWhsteam 0.002 NMVOC � g/kWhsteam 0.010
Dust/PM � g/kWhsteam 0.001
According to the assumptions in [CONCAWE 2007] and [CONCAWE 2009] for the calculation of the energy requirements and GHG emissions from the supply of natural gas, a distance of 4000 km is assumed for the transport of natural gas from the natural gas fields to the EU via pipeline.
Table 13: Input and output data for the combined heat and power (CHP) plants
I/O Unit NG CHP [Punter 2004]
Lignite CHP [CONCAWE 2009]
Straw CHP [Punter 2004]
Fuel Input kWh/kWhsteam 1.866 1.405 2.132 Steam Output kWh 1.000 1.000 1.000 Electricity Output kWh 0.662 0.222 0.361
Emissions
CO2 � g/kWhsteam 379 582 �
CH4 � g/kWhsteam 0.056 0.008 0.021 N2O � g/kWhsteam 0.017 0.045 0.004
NOx � g/kWhsteam 1.128 0.543 0.819 SO2 � g/kWhsteam 0.003 0.388 0.264
NMVOC � g/kWhsteam 0.282 0.008 0.082 Dust/PM � g/kWhsteam 0.028 0.050 0.067
The (excess) electricity replaces electricity from a power plant using the same fuel. In case of the natural gas fuelled CHP the excess electricity replaces electricity from a natural gas fuelled combined cycle power plant (CCGT) with an efficiency of 55%. In case of the
238

LCA for Bioethanol in Aviation
Ethanol Pathways
4�24
lignite fuelled CHP the excess electricity replaces electricity from a lignite fuelled steam turbine power station with an efficiency of 41%. In case of the straw fuelled CHP the excess electricity replaces electricity from a straw fuelled power station with an efficiency of 31.5%.
Table 14 shows the input and output data for the power stations used to take into account excess electricity from CHP plants. The input and output data for the straw power station is based on a straw fuelled steam turbine power station in Sangüesa in Navarra, Spain with a capacity of 25 MWe.
Table 14: Input and output data for the power stations
I/O Unit NG Lignite Straw
Fuel Input kWh/kWhelectricity 1.818 2.439 3.175 Electricity Output kWh 1.000 1.000 1.000
Emissions
CO2 � g/kWhelectricity 369 1004 �
CH4 � g/kWhelectricity 0.027 0.016 0.031 N2O � g/kWhelectricity 0.016 0.028 0.006
NOx � g/kWhelectricity 0.550 0.706 1.219 SO2 � g/kWhelectricity 0.003 0.710 0.393
NMVOC � g/kWhelectricity 0.027 0.014 0.122 Dust/PM � g/kWhelectricity 0.003 0.089 0.100
According to the assumptions in [CONCAWE 2007] and [CONCAWE 2009] for the calculation of the energy requirements and GHG emissions from the supply of natural gas, a distance of 4000 km is assumed for the transport of natural gas from the natural gas fields to the EU via pipeline. The lignite is derived from lignite mines in Lausitz region in Germany.
4.1.4 Distribution of final fuel The ethanol is transported to a depot over a distance of 150 km via truck. At the depot the ethanol can be mixed with gasoline. The electricity consumption of the depot is about 0.0008 kWh/kWh of ethanol. From there it is transported to the filling stations over a distance of 150 km. The electricity consumption of the filling station is 0.0034 kWh/kWh of ethanol. The electricity is derived from the EU electricity mix (0.4 kV level).
239

LCA for Bioethanol in Aviation
Ethanol Pathways
4�25
Table 15: Technical and economic data for ethanol dispensing
I/O Unit Amount
Ethanol Input kWh/kWhethanol 1.0000 Electricity Input kWh/kWhethanol 0.0034 Ethanol Output kWh 1.0000
4.1.5 End use The ethanol is used in a piston engine aircraft.
4.2 Ethanol from sugar beet
4.2.1 Biomass supply According the European Fertiliser Manufacturer Association (EFMA) the average yield for sugar beet in the EU amounts to about 68.9 t per ha and year based on a water content of 75% [EFMA 2008]. The LHV of sugar beet is 16.3 kg/kg of dry substance [Dreier 1998]. For the operation of farming machines 6,330 MJ of diesel per ha and year are required [Dreier 1998].
The emissions of N2O from the plantation of energy crops consist of the direct N2Oemissions, indirect N2O emissions from emitted NH3 and NOx, and indirect N2O emissions from leaching/runoff (soil N2O emissions). The soil N2O emissions are calculated using the European Soil Model in [CONCAWE 2009].
The input of nitrogen fertiliser is indicated with 120 kg N per ha and year based on the fertiliser use in 2005/2006 [EFMA 2008]. Furthermore, about 400 kg CaO [Dreier 1998], 138 kg K2O fertiliser [EFMA 2008], 60 kg P2O5 fertiliser [EFMA 2008], 1.3 kg pesticides [Kaltschmitt 1997], and 6 kg seeding material [Dreier 1998] are required per ha and year.
Additionally, there are N2O emissions from the production of synthetic nitrogen fertiliser. The N2O emissions from the production of synthetic nitrogen fertiliser are accounted for in the upstream process (see chapter 4.6 for data).
Table 16 shows the input and output data for the cultivation of sugar beet.
240

LCA for Bioethanol in Aviation
Ethanol Pathways
4�26
Table 16: Input and output data for the cultivation of sugar beet
I/O Unit Amount
Diesel Input kWh/kWhbeet 0.0226
N fertiliser Input kg N/kWhbeet 0.00154
CaO fertiliser Input kg CaO/kWhbeet 0.00513
K2O fertiliser Input kg K2O/kWhbeet 0.00173
P2O5 fertiliser Input kg P2O5/kWhbeet 0.00077
Pesticides Input kg/kWhbeet 0.000017
Seeding material Input kg/kWhbeet 0.000077
Sugar beet Output kWh 1.0000
Emissions
CO2 � g/kWhbeet 6.0
CH4 � g/kWhbeet 0.002
N2O � g/kWhbeet 0.042
NOx � g/kWhbeet 0.087
SO2 � g/kWhbeet 0.000
NMVOC � g/kWhbeet 0.014
Dust/PM � g/kWhbeet 0.013
The energy requirements, GHG emissions, and air pollutant emissions for the supply of fertilisers, pesticides, seeding material, and diesel are accounted for in the upstream processes (see chapter 4.6 for data).
4.2.2 Transport to the ethanol plant The sugar beet is transported to the ethanol plant over a distance of 30 km via 40 t truck. The payload of the truck is 26 t of sugar beet.
4.2.3 Ethanol plant The ethanol plant generates ethanol as main product and sugar beet pulp as by�product (the by�product slop is converted to biogas which is used for heat supply for the ethanol plant). The by�product sugar beet pulp is used as animal fodder. The sugar beet pulp replaces animal fodder from wheat and imported soybeans. The plant data have been derived from [Kaltschmitt 1997].
241

LCA for Bioethanol in Aviation
Ethanol Pathways
4�27
Table 17: Input and output data for the conversion of sugar beet to ethanol
I/O Unit
Sugar beet Input kWh/kWhethanol 1.840 Steam Input kWh/kWhethanol 0.104 Electricity Input kWh/kWhethanol 0.040
Ethanol Output kWh 1.000 Sugar beet pulp Output kg/kWhethanol 0.100
The steam requirement is met by a natural gas fuelled boiler with an efficiency of 90% (Table 12). The electricity requirement is met by electricity from the EU electricity mix (10 to 20 kV level).
4.2.4 Distribution of the final fuel See chapter 4.1.4.
4.2.5 End use The ethanol is used in a piston engine aircraft.
4.3 Ethanol from sugar cane
4.3.1 Biomass supply The sugar cane yield amounts to about 68.7 t per ha and year within a six year cycle (82.4 t per ha and year within five years, in one year after a five year cycle no sugar cane is harvested) [Macedo 2004]. The water content of sugar cane is 72.5% [Kaltschmitt 2001]. The LHV is 19.6 MJ/kg of dry substance [Dreier 2000].
The use of synthetic nitrogen fertiliser amounts to about 75 kg nitrogen per ha and year in years where sugar cane is harvested (or 62.5 kg per year within a six year cycle). Furthermore, within a six year cycle about 367 kg CaO fertiliser, 74 kg K2O fertiliser, 28 kg P2O5 fertiliser, 2 kg pesticides, and 2 kg seeding material are required per ha and year.
Table 18 shows the requirements of diesel, fertilisers, pesticides and the GHG emissions from the plantation of sugar cane e.g. in Brazil.
242

LCA for Bioethanol in Aviation
Ethanol Pathways
4�28
Table 18: Input and output data for the plantation of sugar cane
I/O Unit Amount
Diesel Input kWh/kWhsugar cane 0.0053 N fertiliser Input kg/kWhsugar cane 0.000608 CaO fertiliser Input kg/kWhsugar cane 0.003565
K2O fertiliser Input kg/kWhsugar cane 0.000719 P2O5 fertiliser Input kg/kWhsugar cane 0.000274
Pesticides Input kg/kWhsugar cane 0.000019 Seeding material Input kg/kWhsugar cane 0.000019
Fiter mud cake Input kg/kWhsugar cane 0.005833 Vinasse Input kg/kWhsugar cane 0.256968
Sugar cane Output kWh 1.0000
Emissions
CO2 � g/kWhsugar cane 1.4 CH4 � g/kWhsugar cane 0.19
N2O � g/kWhsugar cane 0.0198
Filter mud cake and vinasse are residues. The energy requirement for the supply of seeding material, filter mud cake, and vinasse consists of the diesel requirement for the transport and distribution to the sugar cane fields.
4.3.2 Transport to the ethanol plant The sugar cane is transported to the ethanol plant over a distance of 20 km via truck [Macedo 2004}.
4.3.3 Ethanol plant Table 19 shows the input and output data for the conversion of sugar cane to ethanol. The energy requirement is fully met by the residues from the ethanol production. There is even some excess heat which can be exported. About 91.8 l ethanol is generated per t of sugar cane [Macedo 2004]. The water content of the sugar cane is 72.5% [Kaltschmitt 2001]. The LHV of the sugar cane is 19.6 MJ/kg of dry substance [Dreier 2000]. The LHV of ethanol is 26.8 MJ/kg and the density of ethanol is 0.79 kg/l.
243

LCA for Bioethanol in Aviation
Ethanol Pathways
4�29
Table 19: Input and output data for the conversion of sugar cane to ethanol
I/O Unit Amount
Sugar cane Input kWh/kWhethanol 2.772 CaO Input kg/kWhethanol 0.0017 Cyclehexane Input kg/kWhethanol 0.000102
H2SO4 Input kg/kWhethanol 0.0015 Lubricants Input kg/kWhethanol 0.000025
Ethanol Output kWh 1.000 Heat Output kWh/kWhethanol 0.115
The excess heat replaces heat from a diesel oil fuelled boiler as assumed in [CONCAWE 2007] and [CONCAWE 2009].
4.3.4 Transport of the ethanol to the EU The ethanol is transported to the export terminal via truck over a distance of 700 km. At the export terminal the ethanol is stored at a depot (electricity consumption: 0.0008 kWh/kWh of ethanol).
From there the ethanol is transported via ship over a distance of 5,500 nm (10,186 km) to the EU. The ship is fuelled with heavy fuel oil with a sulphur content of 3.5%. The ship used for ethanol transport (Table 20) is a product tanker with a payload of 50,000 t.
Table 20: Input and output data for the product tanker
I/O Unit Amount
Heavy fuel oil Input kWh/tkm 0.0344 Distance Output tkm 1.0000
Emissions
CO2 � g/tkm 9.9 CH4 � g/tkm 0.000
N2O � g/tkm 0.000 NOx � g/tkm 0.188
SO2 � g/tkm 0.188 NMVOC � g/tkm 0.007
Dust/PM � g/tkm 0.008
The fuel consumption of the ship is calculated for the roundtrip (return voyage included). At the import terminal in the EU the ethanol is stored in a depot.
244
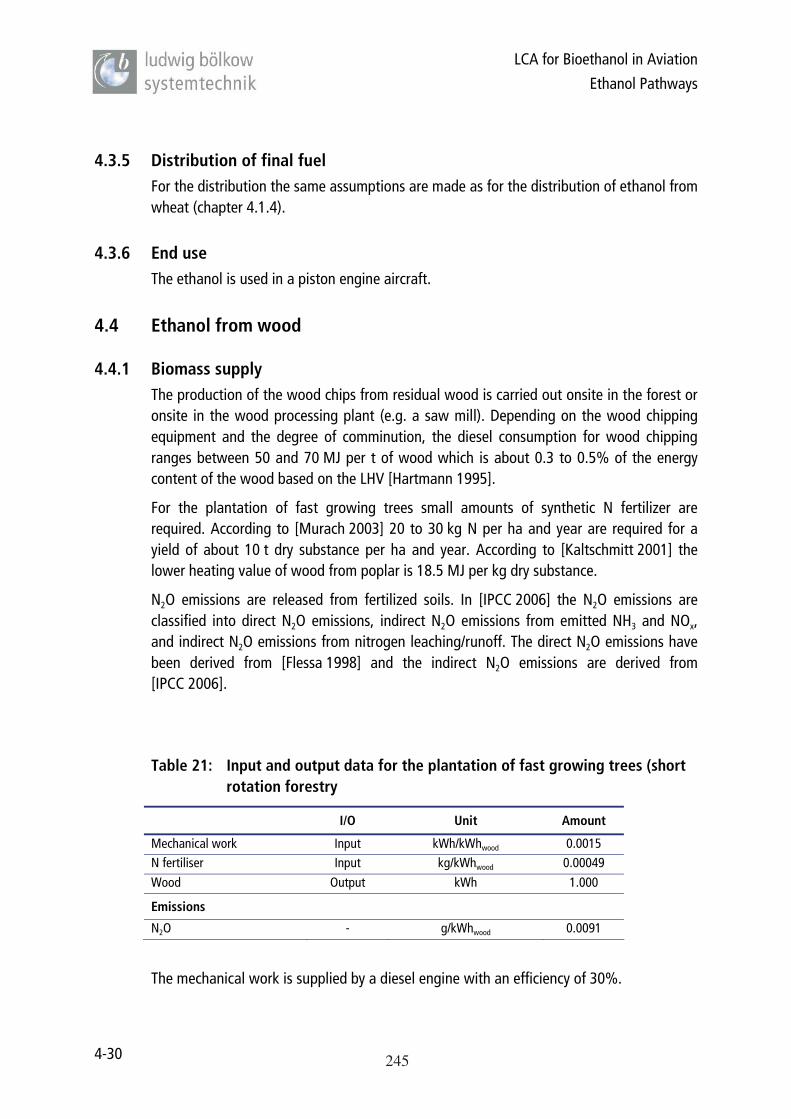
LCA for Bioethanol in Aviation
Ethanol Pathways
4�30
4.3.5 Distribution of final fuel For the distribution the same assumptions are made as for the distribution of ethanol from wheat (chapter 4.1.4).
4.3.6 End use The ethanol is used in a piston engine aircraft.
4.4 Ethanol from wood
4.4.1 Biomass supply The production of the wood chips from residual wood is carried out onsite in the forest or onsite in the wood processing plant (e.g. a saw mill). Depending on the wood chipping equipment and the degree of comminution, the diesel consumption for wood chipping ranges between 50 and 70 MJ per t of wood which is about 0.3 to 0.5% of the energy content of the wood based on the LHV [Hartmann 1995].
For the plantation of fast growing trees small amounts of synthetic N fertilizer are required. According to [Murach 2003] 20 to 30 kg N per ha and year are required for a yield of about 10 t dry substance per ha and year. According to [Kaltschmitt 2001] the lower heating value of wood from poplar is 18.5 MJ per kg dry substance.
N2O emissions are released from fertilized soils. In [IPCC 2006] the N2O emissions are classified into direct N2O emissions, indirect N2O emissions from emitted NH3 and NOx,and indirect N2O emissions from nitrogen leaching/runoff. The direct N2O emissions have been derived from [Flessa 1998] and the indirect N2O emissions are derived from [IPCC 2006].
Table 21: Input and output data for the plantation of fast growing trees (short rotation forestry
I/O Unit Amount
Mechanical work Input kWh/kWhwood 0.0015 N fertiliser Input kg/kWhwood 0.00049
Wood Output kWh 1.000
Emissions
N2O � g/kWhwood 0.0091
The mechanical work is supplied by a diesel engine with an efficiency of 30%.
245

LCA for Bioethanol in Aviation
Ethanol Pathways
4�31
4.4.2 Transport to the ethanol plant Lignocellulosic ethanol plants are relatively large plants requiring a large amount of biomass. In [CONCAWE 2007] and [CONCAWE 2009] for residual wood a longer transport distance has been assumed than for woody biomass from short rotation forestry. In case of residual wood the wood chips are transported to a midland port via truck over a distance of 50 km. From the midland port the wood chips are transported via ship to a gasification plant over a distance of 400 km. The ethanol plant is located nearby a river. In case of wood from short rotation forestry the wood chips are transported via truck directly to the ethanol plant over a distance of 50 km.
4.4.3 Ethanol plant The wood chips are converted via a lignocellulosic ethanol plant. The input and output data for the conversion of wood to ethanol via hydrolysis and fermentation have been derived from [Wooley 1999]. Table 22 shows the input and output data for the conversion of wood to ethanol.
Table 22: Input and output data for the conversion of wood chips to ethanol
I/O Unit Amount
Wood chips Input kWh/kWhethanol 2.909
(NH4)2SO4 Input kg/kWhethanol 0.0025
CaO Input kg/kWhethanol 0.0047
H2SO4 Input kg/kWhethanol 0.0126
NH3 Input kg/kWhethanol 0.0097
Diesel Input kWh/kWhethanol 0.0360
Ethanol Output kWh 1.000
Electricity Output kWh/kWhethanol 0.099
The electricity replaces electricity from a wood chips fuelled steam turbine power station with an efficiency of 32%.
4.4.4 Distribution of final fuel For the distribution the same assumptions are made as for the distribution of ethanol from wheat (chapter 4.1.4).
4.4.5 End use The ethanol is used in a piston engine aircraft.
246
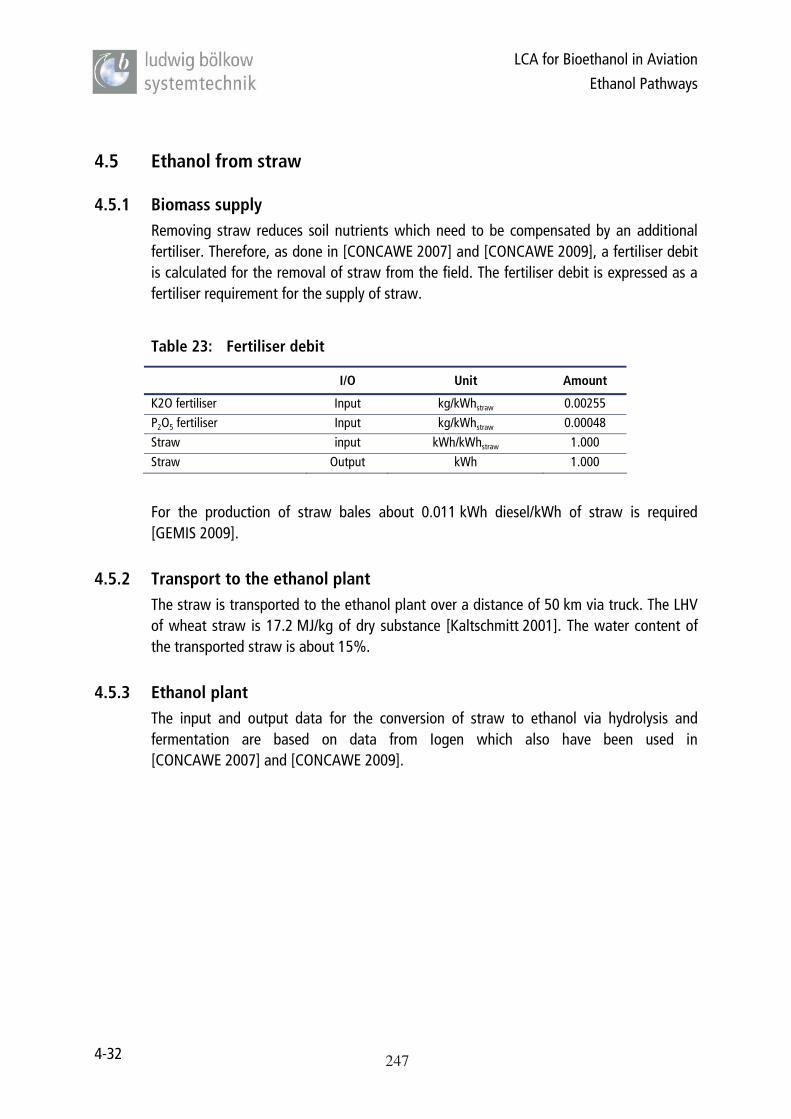
LCA for Bioethanol in Aviation
Ethanol Pathways
4�32
4.5 Ethanol from straw
4.5.1 Biomass supply Removing straw reduces soil nutrients which need to be compensated by an additional fertiliser. Therefore, as done in [CONCAWE 2007] and [CONCAWE 2009], a fertiliser debit is calculated for the removal of straw from the field. The fertiliser debit is expressed as a fertiliser requirement for the supply of straw.
Table 23: Fertiliser debit
I/O Unit Amount
K2O fertiliser Input kg/kWhstraw 0.00255 P2O5 fertiliser Input kg/kWhstraw 0.00048 Straw input kWh/kWhstraw 1.000
Straw Output kWh 1.000
For the production of straw bales about 0.011 kWh diesel/kWh of straw is required [GEMIS 2009].
4.5.2 Transport to the ethanol plant The straw is transported to the ethanol plant over a distance of 50 km via truck. The LHV of wheat straw is 17.2 MJ/kg of dry substance [Kaltschmitt 2001]. The water content of the transported straw is about 15%.
4.5.3 Ethanol plant The input and output data for the conversion of straw to ethanol via hydrolysis and fermentation are based on data from Iogen which also have been used in [CONCAWE 2007] and [CONCAWE 2009].
247
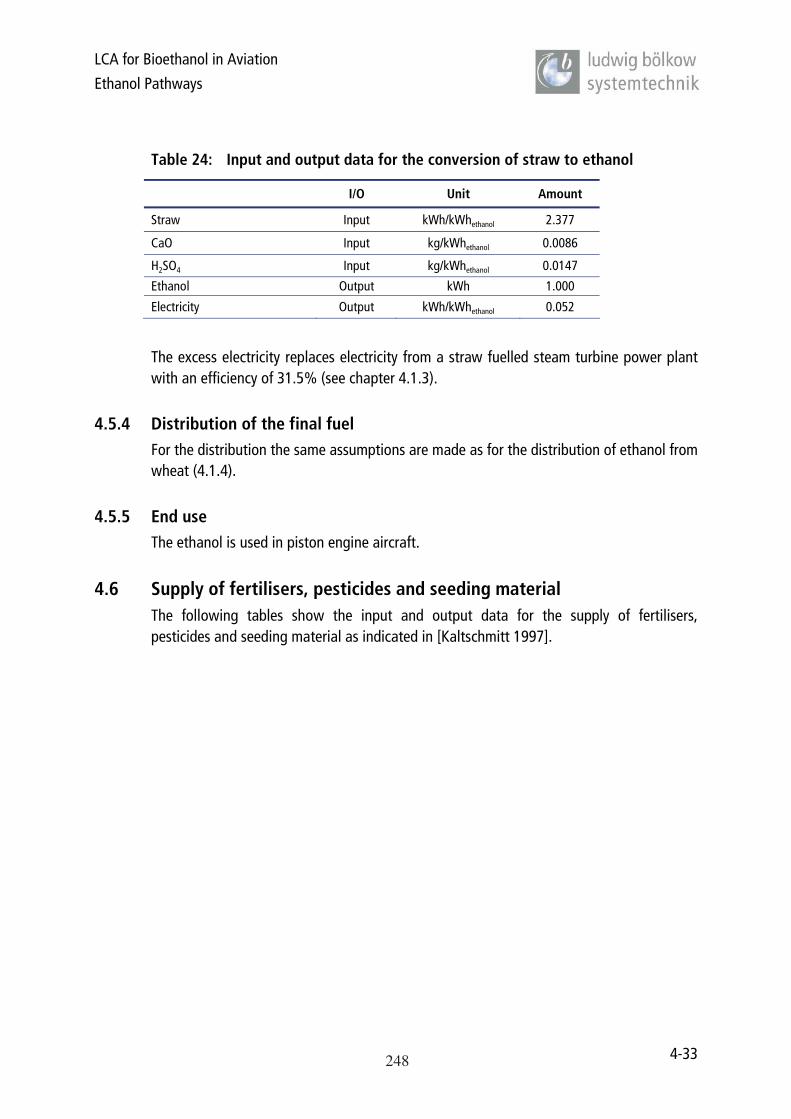
LCA for Bioethanol in Aviation
Ethanol Pathways
4�33
Table 24: Input and output data for the conversion of straw to ethanol
I/O Unit Amount
Straw Input kWh/kWhethanol 2.377
CaO Input kg/kWhethanol 0.0086
H2SO4 Input kg/kWhethanol 0.0147
Ethanol Output kWh 1.000
Electricity Output kWh/kWhethanol 0.052
The excess electricity replaces electricity from a straw fuelled steam turbine power plant with an efficiency of 31.5% (see chapter 4.1.3).
4.5.4 Distribution of the final fuel For the distribution the same assumptions are made as for the distribution of ethanol from wheat ( 4.1.4).
4.5.5 End use The ethanol is used in piston engine aircraft.
4.6 Supply of fertilisers, pesticides and seeding material The following tables show the input and output data for the supply of fertilisers, pesticides and seeding material as indicated in [Kaltschmitt 1997].
248
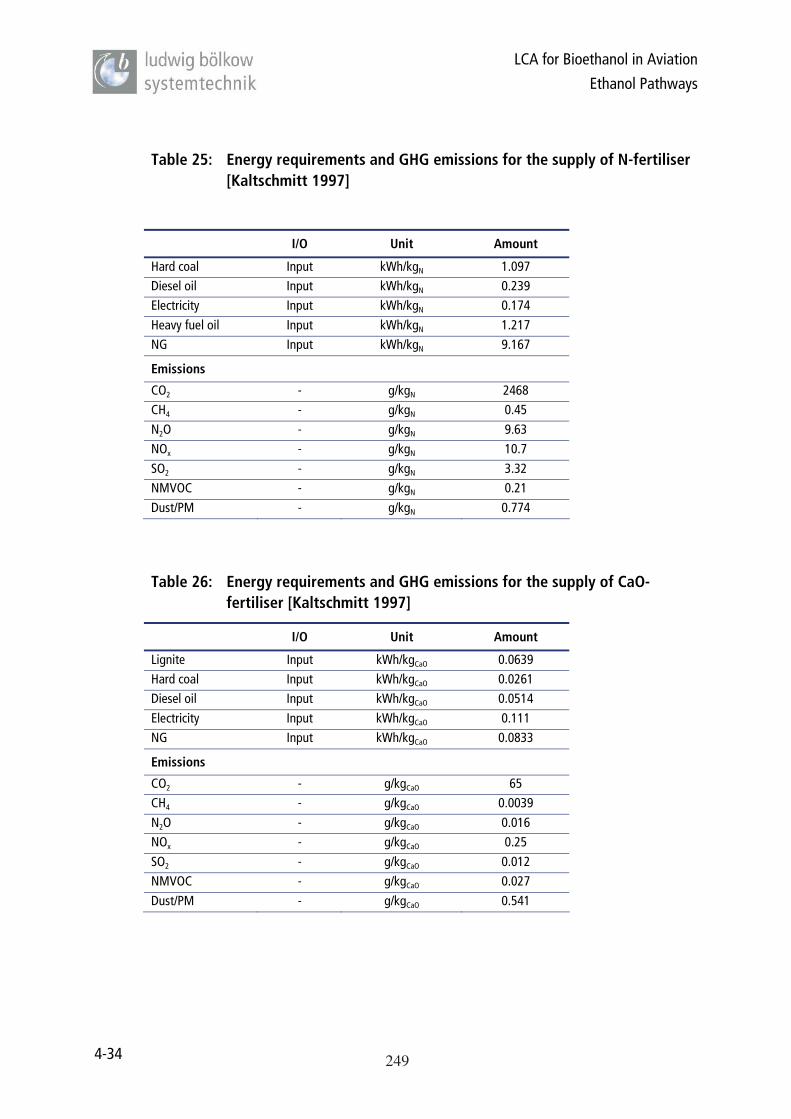
LCA for Bioethanol in Aviation
Ethanol Pathways
4�34
Table 25: Energy requirements and GHG emissions for the supply of N�fertiliser [Kaltschmitt 1997]
I/O Unit Amount
Hard coal Input kWh/kgN 1.097 Diesel oil Input kWh/kgN 0.239 Electricity Input kWh/kgN 0.174
Heavy fuel oil Input kWh/kgN 1.217 NG Input kWh/kgN 9.167
Emissions
CO2 � g/kgN 2468 CH4 � g/kgN 0.45
N2O � g/kgN 9.63 NOx � g/kgN 10.7
SO2 � g/kgN 3.32 NMVOC � g/kgN 0.21
Dust/PM � g/kgN 0.774
Table 26: Energy requirements and GHG emissions for the supply of CaO�fertiliser [Kaltschmitt 1997]
I/O Unit Amount
Lignite Input kWh/kgCaO 0.0639 Hard coal Input kWh/kgCaO 0.0261 Diesel oil Input kWh/kgCaO 0.0514
Electricity Input kWh/kgCaO 0.111 NG Input kWh/kgCaO 0.0833
Emissions
CO2 � g/kgCaO 65 CH4 � g/kgCaO 0.0039
N2O � g/kgCaO 0.016 NOx � g/kgCaO 0.25
SO2 � g/kgCaO 0.012 NMVOC � g/kgCaO 0.027
Dust/PM � g/kgCaO 0.541
249
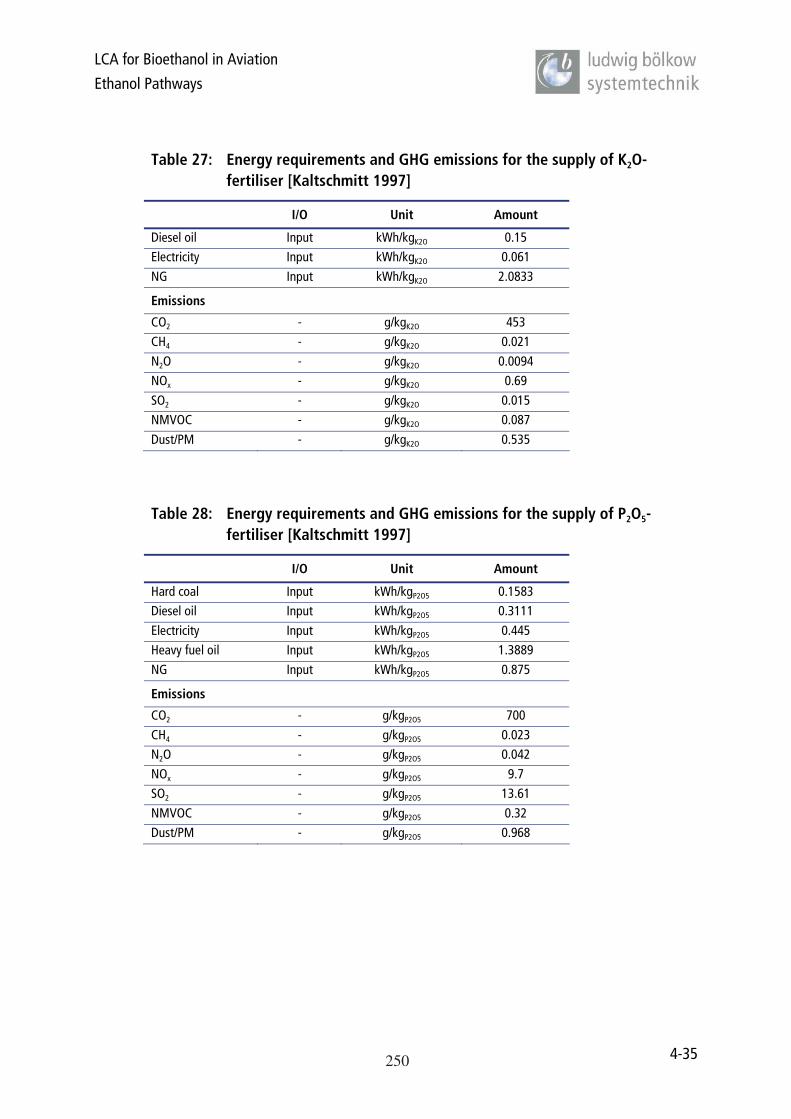
LCA for Bioethanol in Aviation
Ethanol Pathways
4�35
Table 27: Energy requirements and GHG emissions for the supply of K2O�fertiliser [Kaltschmitt 1997]
I/O Unit Amount
Diesel oil Input kWh/kgK2O 0.15 Electricity Input kWh/kgK2O 0.061
NG Input kWh/kgK2O 2.0833
Emissions
CO2 � g/kgK2O 453 CH4 � g/kgK2O 0.021
N2O � g/kgK2O 0.0094 NOx � g/kgK2O 0.69
SO2 � g/kgK2O 0.015 NMVOC � g/kgK2O 0.087
Dust/PM � g/kgK2O 0.535
Table 28: Energy requirements and GHG emissions for the supply of P2O5�fertiliser [Kaltschmitt 1997]
I/O Unit Amount
Hard coal Input kWh/kgP2O5 0.1583 Diesel oil Input kWh/kgP2O5 0.3111
Electricity Input kWh/kgP2O5 0.445 Heavy fuel oil Input kWh/kgP2O5 1.3889
NG Input kWh/kgP2O5 0.875
Emissions
CO2 � g/kgP2O5 700
CH4 � g/kgP2O5 0.023 N2O � g/kgP2O5 0.042
NOx � g/kgP2O5 9.7 SO2 � g/kgP2O5 13.61
NMVOC � g/kgP2O5 0.32 Dust/PM � g/kgP2O5 0.968
250

LCA for Bioethanol in Aviation
Ethanol Pathways
4�36
Table 29: Energy requirements and GHG emissions for the supply of pesticides [Kaltschmitt 1997]
I/O Unit Amount
Hard coal Input kWh/kgpesticides 2.12 Diesel oil Input kWh/kgpesticides 16.14
Electricity Input kWh/kgpesticides 7.91 Heavy fuel oil Input kWh/kgpesticides 9.03
NG Input kWh/kgpesticides 19.83
Emissions
CO2 � g/kgpesticides 4921 CH4 � g/kgpesticides 0.18
N2O � g/kgpesticides 1.51 NOx � g/kgpesticides 6.92
SO2 � g/kgpesticides 17.4 NMVOC � g/kgpesticides 0.29
Dust/PM � g/kgpesticides 0.983
Table 30: Energy requirements and GHG emissions for the supply of seeding material for winter wheat [Kaltschmitt 1997]
I/O Unit Amount
Hard coal Input kWh/kgseeds 0.028 Diesel oil Input kWh/kgseeds 0.194
Heavy fuel oil Input kWh/kgseeds 0.083 NG Input kWh/kgseeds 0.333
Emissions
CO2 � g/kgseeds 130.1 CH4 � g/kgseeds 0.0
N2O � g/kgseeds 0.4 NOx � g/kgseeds 0.9
SO2 � g/kgseeds 0.3 NMVOC � g/kgseeds 0.1
Dust/PM � g/kgseeds 0.0
251

LCA for Bioethanol in Aviation
WtT Results
5�37
5 WTT RESULTS Table shows Well�to�Tank the main GHG emissions components of the selected bio�ethanol pathway 02a.
Table 31: Detailed GHG emissions of pathway 02a
Well-to-Tank CO2-EquivalentChain name g/kWh02a Ethanol from wheat (NG fueled boiler) - Substitution methodWheat cultivation 142.0Wheat transport system (50km) 2.3Ethanol production 60.1Ethanol transport (1) 4.0Filling station 1.6CO2 bound in ethanol -256.5Total emissions -46.6
(1) Transport to a depot via truck: 150 km; depot; transport from the depot to the filling station via truck: 150 km
For all pathways the same lifecycle�stages have been used. Figure 3 shows the WtT GHG emissions for the supply of the most common bio�ethanol blends as well as for the gasoline reference. WtT data show the GHG emissions associated with producing the fuel � GHG released into the atmosphere during production shows up as positive emissions resulting from feedstock production and handling (see e.g. chapter 4.3.1), feedstock transport (see e.g. chapter 4.3.2), ethanol production (see e.g. chapter 4.3.3; use of by�products for energy supply may lead to negative emission values), ethanol transport (see e.g. chapter 4.3.4 and 4.3.5), and from the filling station (see e.g. chapter 4.1.4); any CO2
bound in the plants used as feedstock or any by�products used as energy supply in the production process show up as negative, as it was previously removed by the plants from the atmosphere through photosynthesis.
Contributions from production and transport of feedstock and for the production and transport of ethanol are colour coded for each path as well as the biogenic CO2 bound in the fuel.
The total emission results from the sum of positive (production, distribution, use) and negative emissions (biogenic CO2 bound in fuel, use of by�products in ethanol production).
Consequently, the carbon emitted as CO2 during combustion of the fuel (as per Table 2) is not accounted for in these WtT data. It would be released upon burning the fuel, and shown in TtP and WtP results.
252

LCA for Bioethanol in Aviation
WtT Results
5�38
-400
-300
-200
-100
0
100
200
300
40001
Ref
eren
ce 02a
02b
03a
03b
04a
04b
05a
05b 6
07a
07b 8 09 10 11
Scenario
CO
2-Eq
uiva
lent
(g/k
Wh)
CO2 bound in fuelFilling stationEthanol transportEthanol productionFeedstock transport systemFeedstock production and handling
01 Gasoline - Reference02a Ethanol wheat (NG boiler) - Substitution02b Ethanol wheat(NG boiler) - Allocation03a Ethanol wheat (NG CHP) - Substitution03b Ethanol wheat (NG CHP) - Allocation04a Ethanol wheat (lignite CHP) - Substitution04b Ethanol wheat (lignite CHP) - Allocation05a Ethanol wheat (straw CHP) - Substitution
05b Ethanol wheat (straw CHP) - Allocation06a Ethanol wheat (DGS for biogas) - Substitution07a Ethanol suger beet (animal fodder export) - Substitution07b Ethanol suger beet - Allocation08 Ethanol suger cane 09 Ethanol residual wood10 Ethanol farmed wood11 Ethanol wheat straw
Figure 3: WtT GHG emissions
253

LCA for Bioethanol in Aviation
TtP Results
6�39
6 TTP RESULTS Emission measurement data from a Rotax 912ULS piston engine on a test stand (see Figure 4) have been supplied by Prof. Dr.�Ing. Thomas Esch, Aachen University of Applied Sciences (FH Aachen), Institute for Applied Thermodynamics and Combustion Technology.
Figure 4: Piston engine test stand at FH Aachen
Figure 5 shows the LTO (landing and take�off) cycle used during the emission measurements. Six different operation modes have been used: idle, taxi, take�off, maximum continuous power, best economy cruising, and approach. Emission results for the cycles have been weighted by their respective duration and averaged for the TtP results. Resulting emissions are shown in Figure 6.
254
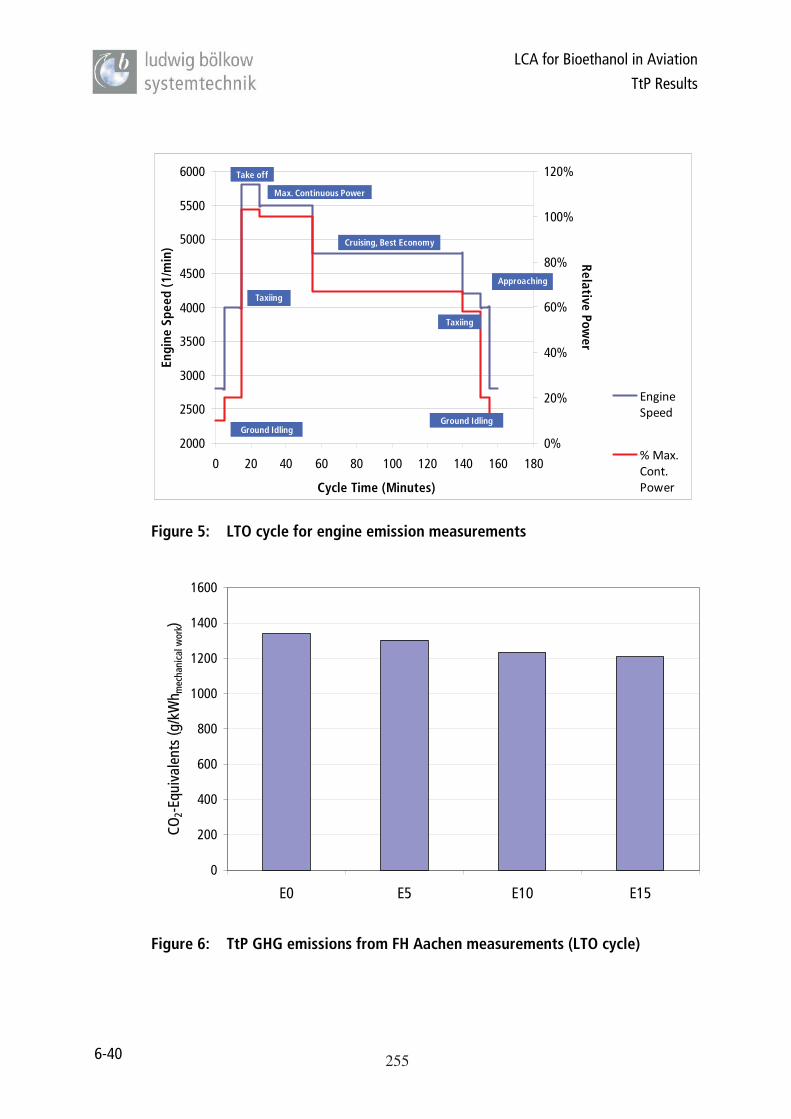
LCA for Bioethanol in Aviation
TtP Results
6�40
2000
2500
3000
3500
4000
4500
5000
5500
6000
0 20 40 60 80 100 120 140 160 180
Cycle Time (Minutes)
Engi
neSp
eed
(1/m
in)
0%
20%
40%
60%
80%
100%
120%
RelativePow
er
����������
�� �����������
Ground Idling
Taxiing
Take off
Max. Continuous Power
Cruising, Best Economy
Approaching
Ground Idling
Taxiing
Figure 5: LTO cycle for engine emission measurements
0
200
400
600
800
1000
1200
1400
1600
E0 E5 E10 E15
CO2�
Equi
vale
nts
(g/k
Wh m
echa
nica
lwor
k)
Figure 6: TtP GHG emissions from FH Aachen measurements (LTO cycle)
255
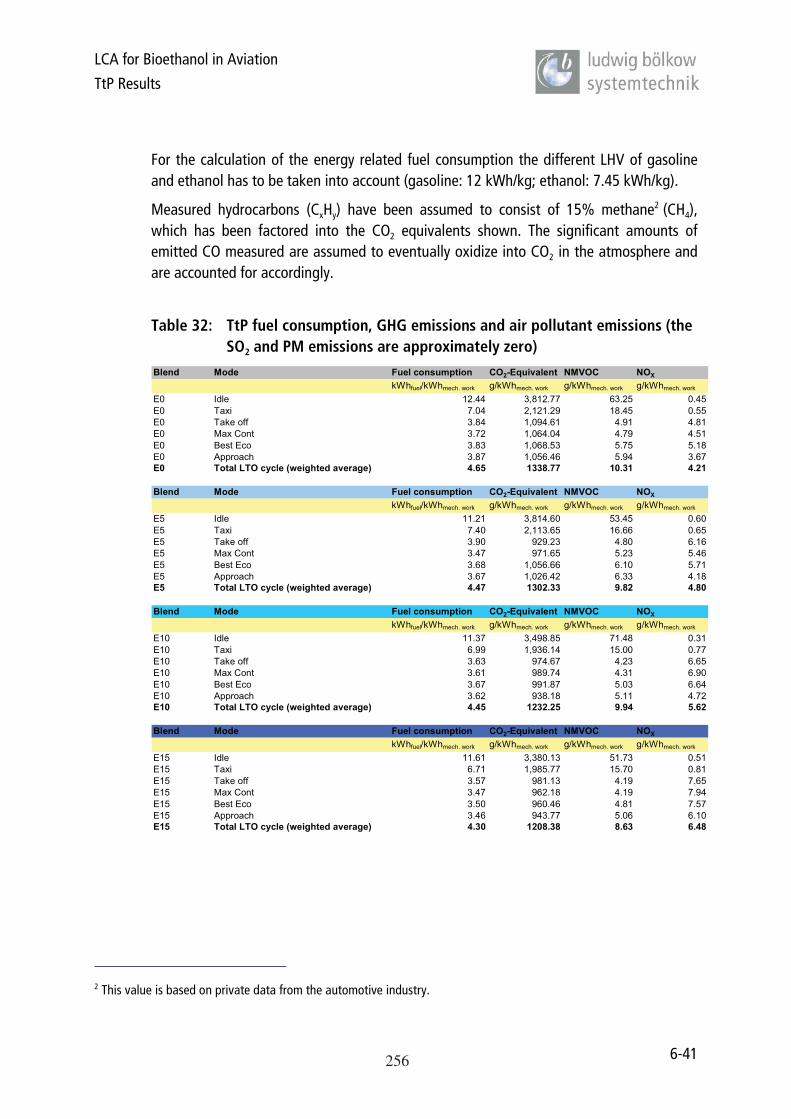
LCA for Bioethanol in Aviation
TtP Results
6�41
For the calculation of the energy related fuel consumption the different LHV of gasoline and ethanol has to be taken into account (gasoline: 12 kWh/kg; ethanol: 7.45 kWh/kg).
Measured hydrocarbons (CxHy) have been assumed to consist of 15% methane2 (CH4), which has been factored into the CO2 equivalents shown. The significant amounts of emitted CO measured are assumed to eventually oxidize into CO2 in the atmosphere and are accounted for accordingly.
Table 32: TtP fuel consumption, GHG emissions and air pollutant emissions (the SO2 and PM emissions are approximately zero)
Blend Mode Fuel consumption CO2-Equivalent NMVOC NOX
kWhfuel/kWhmech. work g/kWhmech. work g/kWhmech. work g/kWhmech. work
E0 Idle 12.44 3,812.77 63.25 0.45E0 Taxi 7.04 2,121.29 18.45 0.55E0 Take off 3.84 1,094.61 4.91 4.81E0 Max Cont 3.72 1,064.04 4.79 4.51E0 Best Eco 3.83 1,068.53 5.75 5.18E0 Approach 3.87 1,056.46 5.94 3.67E0 Total LTO cycle (weighted average) 4.65 1338.77 10.31 4.21
Blend Mode Fuel consumption CO2-Equivalent NMVOC NOX
kWhfuel/kWhmech. work g/kWhmech. work g/kWhmech. work g/kWhmech. work
E5 Idle 11.21 3,814.60 53.45 0.60E5 Taxi 7.40 2,113.65 16.66 0.65E5 Take off 3.90 929.23 4.80 6.16E5 Max Cont 3.47 971.65 5.23 5.46E5 Best Eco 3.68 1,056.66 6.10 5.71E5 Approach 3.67 1,026.42 6.33 4.18E5 Total LTO cycle (weighted average) 4.47 1302.33 9.82 4.80
Blend Mode Fuel consumption CO2-Equivalent NMVOC NOX
kWhfuel/kWhmech. work g/kWhmech. work g/kWhmech. work g/kWhmech. work
E10 Idle 11.37 3,498.85 71.48 0.31E10 Taxi 6.99 1,936.14 15.00 0.77E10 Take off 3.63 974.67 4.23 6.65E10 Max Cont 3.61 989.74 4.31 6.90E10 Best Eco 3.67 991.87 5.03 6.64E10 Approach 3.62 938.18 5.11 4.72E10 Total LTO cycle (weighted average) 4.45 1232.25 9.94 5.62
Blend Mode Fuel consumption CO2-Equivalent NMVOC NOX
kWhfuel/kWhmech. work g/kWhmech. work g/kWhmech. work g/kWhmech. work
E15 Idle 11.61 3,380.13 51.73 0.51E15 Taxi 6.71 1,985.77 15.70 0.81E15 Take off 3.57 981.13 4.19 7.65E15 Max Cont 3.47 962.18 4.19 7.94E15 Best Eco 3.50 960.46 4.81 7.57E15 Approach 3.46 943.77 5.06 6.10E15 Total LTO cycle (weighted average) 4.30 1208.38 8.63 6.48
2 This value is based on private data from the automotive industry.
256

LCA for Bioethanol in Aviation
WtP Results
7�42
7 WTP RESULTS WtT and TtP results are combined for WtP data in the following way:
� WtT data are calculated for each ethanol admixture by appropriately combining gasoline and ethanol WtT values (45.2 g CO2 equiv per kWh for gasoline, respectively the appropriate negative value for the bio�ethanol path chosen) weighted with their respective shares (e.g. for
� The average fuel consumption (kWhfuel/kWhmechanical work) is derived from the measured piston engine data by averaging consumption over the different LTO cycles, weighed by cycle duration (see Table 32).
� Multiplying these average fuel consumptions (kWhfuel/kWhmechanical work) by the WtT emission values yields specific WtT GHG emissions per kWh of mechanical work.
� TtP GHG emissions are added.
Results are shown in the table and figures below.
257
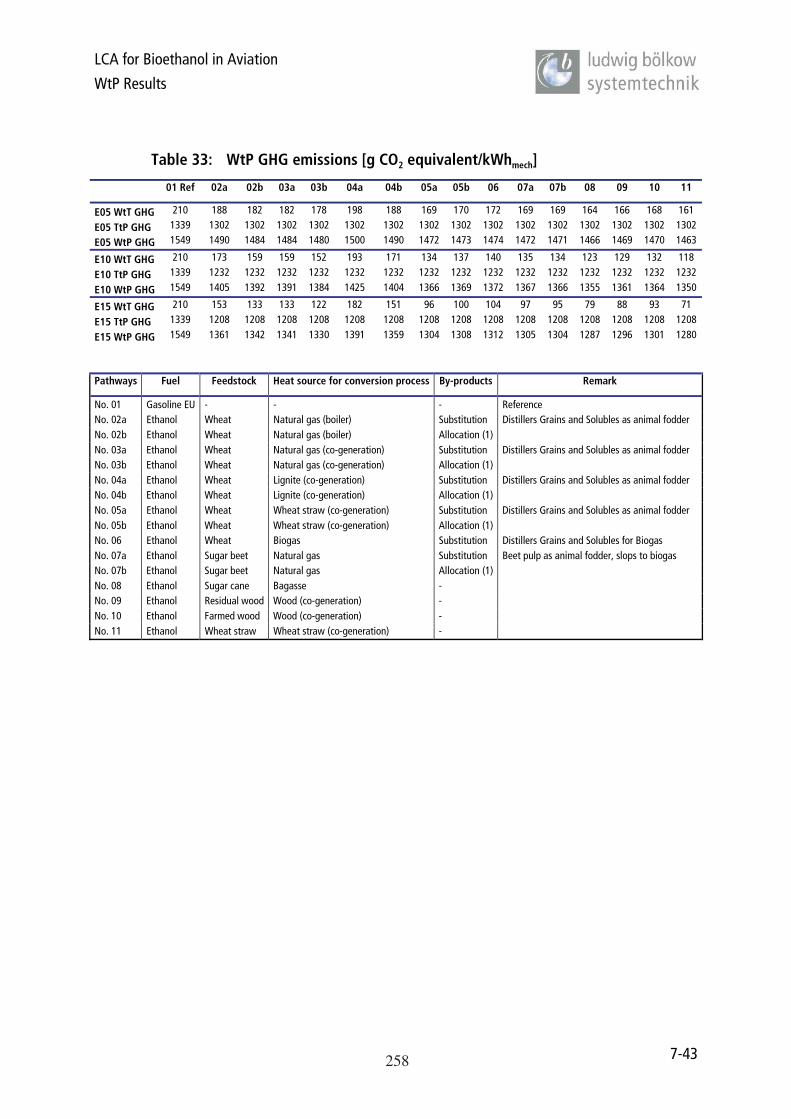
LCA for Bioethanol in Aviation
WtP Results
7�43
Table 33: WtP GHG emissions [g CO2 equivalent/kWhmech]
01 Ref 02a 02b 03a 03b 04a 04b 05a 05b 06 07a 07b 08 09 10 11
E05 WtT GHG 210 188 182 182 178 198 188 169 170 172 169 169 164 166 168 161
E05 TtP GHG 1339 1302 1302 1302 1302 1302 1302 1302 1302 1302 1302 1302 1302 1302 1302 1302
E05 WtP GHG 1549 1490 1484 1484 1480 1500 1490 1472 1473 1474 1472 1471 1466 1469 1470 1463
E10 WtT GHG 210 173 159 159 152 193 171 134 137 140 135 134 123 129 132 118
E10 TtP GHG 1339 1232 1232 1232 1232 1232 1232 1232 1232 1232 1232 1232 1232 1232 1232 1232
E10 WtP GHG 1549 1405 1392 1391 1384 1425 1404 1366 1369 1372 1367 1366 1355 1361 1364 1350
E15 WtT GHG 210 153 133 133 122 182 151 96 100 104 97 95 79 88 93 71
E15 TtP GHG 1339 1208 1208 1208 1208 1208 1208 1208 1208 1208 1208 1208 1208 1208 1208 1208
E15 WtP GHG 1549 1361 1342 1341 1330 1391 1359 1304 1308 1312 1305 1304 1287 1296 1301 1280
Pathways Fuel Feedstock Heat source for conversion process By�products Remark
No. 01 Gasoline EU � � � Reference No. 02a Ethanol Wheat Natural gas (boiler) Substitution Distillers Grains and Solubles as animal fodder No. 02b Ethanol Wheat Natural gas (boiler) Allocation (1)No. 03a Ethanol Wheat Natural gas (co�generation) Substitution Distillers Grains and Solubles as animal fodder No. 03b Ethanol Wheat Natural gas (co�generation) Allocation (1)No. 04a Ethanol Wheat Lignite (co�generation) Substitution Distillers Grains and Solubles as animal fodder No. 04b Ethanol Wheat Lignite (co�generation) Allocation (1)No. 05a Ethanol Wheat Wheat straw (co�generation) Substitution Distillers Grains and Solubles as animal fodder No. 05b Ethanol Wheat Wheat straw (co�generation) Allocation (1)No. 06 Ethanol Wheat Biogas Substitution Distillers Grains and Solubles for Biogas No. 07a Ethanol Sugar beet Natural gas Substitution Beet pulp as animal fodder, slops to biogas No. 07b Ethanol Sugar beet Natural gas Allocation (1)No. 08 Ethanol Sugar cane Bagasse �No. 09 Ethanol Residual wood Wood (co�generation) �No. 10 Ethanol Farmed wood Wood (co�generation) �No. 11 Ethanol Wheat straw Wheat straw (co�generation) �
258

LCA for Bioethanol in Aviation
WtP Results
7�44
0
200
400
600
800
1,000
1,200
1,400
1,600
1,800
01 Ref 02a 02b 03a 03b 04a 04b 05a 05b 6 07a 07b 8 09 10 11
CO2�
equi
vale
nts
(g/k
Wh m
echa
nica
lwor
k)WtT GHG TtP GHG
Figure 7: GHG emissions WtP E05
0
200
400
600
800
1,000
1,200
1,400
1,600
1,800
01 Ref 02a 02b 03a 03b 04a 04b 05a 05b 6 07a 07b 8 09 10 11
CO2�
equi
vale
nts
(g/k
Wh m
echa
nica
lwor
k)
WtT GHG TtP GHG
Figure 8: GHG emissions WtP E10
259

LCA for Bioethanol in Aviation
WtP Results
7�45
0%
12% 13% 13% 14%10%
12%16% 16% 15% 16% 16% 17% 16% 16% 17%
0
200
400
600
800
1,000
1,200
1,400
1,600
1,800
01 Ref 02a 02b 03a 03b 04a 04b 05a 05b 6 07a 07b 8 09 10 11
CO2�
equi
vale
nts
(g/k
Wh m
echa
nica
lwor
k)0%
10%
20%
30%
40%
50%
60%
70%
80%
90%
100%
GH
Gre
duct
ion
WtT GHG TtP GHG E15 WTP GHG Reduction
Figure 9: GHG emissions and emission reduction compared to reference WtP E15
260

LCA for Bioethanol in Aviation
Other Emissions WtP
8�46
8 OTHER EMISSIONS WTPVolatile Organic Compounds (VOC) and Nitrogen Oxides (NOX) have been measured by FH Aachen, and are also accounted for in the WtT data. Resulting emissions are calculated in the same way as described in Chapter 7. Measured CxHy results have been reduced by 15% assumed CH4 (as Chapter 6) content to get the amount of Non�Methane Volatile Organic Compounds (NMVOC). Results are given below; pathway numbering according to the same scheme as above (see Table 33 ).
Figure 10 and Figure 11 show NMVOC and NOx emissions separately for the WtT and TtP paths on the same scale (WtT emissions are shown exemplarily for E05; they do look very similar for E10 and E15). Clearly, NMVOC and NOx emissions are dominated by the TtP emissions.
0.000
1.000
2.000
3.000
4.000
5.000
6.000
7.000
8.000
9.000
10.000
11.000
12.000
01Refe
rence 02
a02
b03
a03
b04
a04
b05
a05
b 607
a07
b 8 09 10 11
Emis
sion
s(g
/kW
h mec
hani
calw
ork)
NMVOC NOX
Figure 10: NOx and NMVOC WtT emissions for E05
261
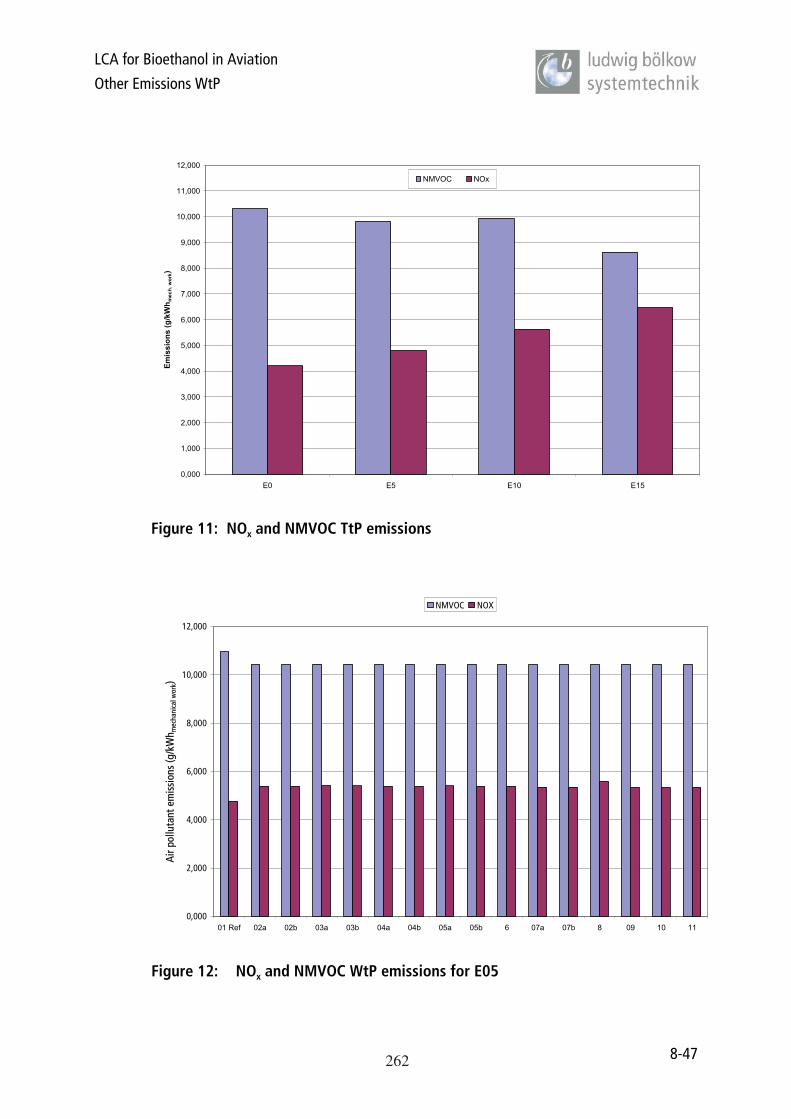
LCA for Bioethanol in Aviation
Other Emissions WtP
8�47
0,000
1,000
2,000
3,000
4,000
5,000
6,000
7,000
8,000
9,000
10,000
11,000
12,000
E0 E5 E10 E15
Emis
sion
s(g
/kW
h mec
h.w
ork)
NMVOC NOx
Figure 11: NOx and NMVOC TtP emissions
0,000
2,000
4,000
6,000
8,000
10,000
12,000
01 Ref 02a 02b 03a 03b 04a 04b 05a 05b 6 07a 07b 8 09 10 11
Airp
ollu
tant
emis
sion
s(g
/kW
h mec
hani
calw
ork)
NMVOC NOX
Figure 12: NOx and NMVOC WtP emissions for E05
262
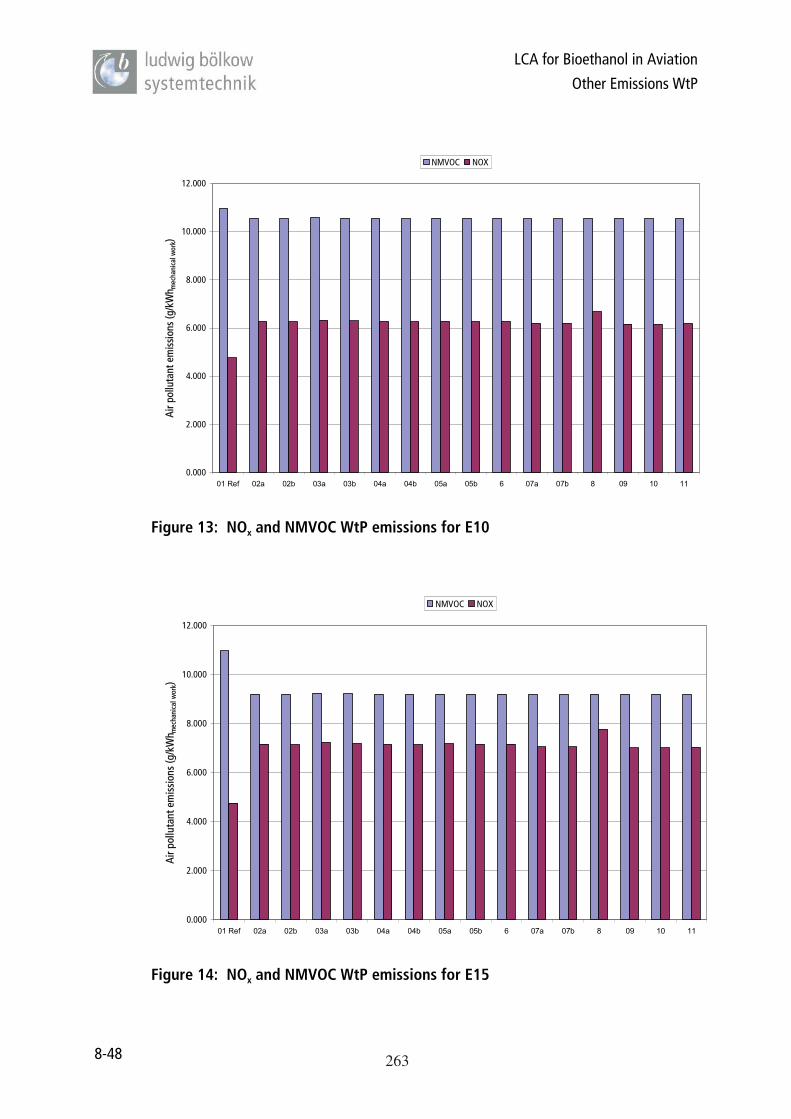
LCA for Bioethanol in Aviation
Other Emissions WtP
8�48
0.000
2.000
4.000
6.000
8.000
10.000
12.000
01 Ref 02a 02b 03a 03b 04a 04b 05a 05b 6 07a 07b 8 09 10 11
Airp
ollu
tant
emis
sion
s(g
/kW
h mec
hani
calw
ork)
NMVOC NOX
Figure 13: NOx and NMVOC WtP emissions for E10
0.000
2.000
4.000
6.000
8.000
10.000
12.000
01 Ref 02a 02b 03a 03b 04a 04b 05a 05b 6 07a 07b 8 09 10 11
Airp
ollu
tant
emis
sion
s(g
/kW
h mec
hani
calw
ork)
NMVOC NOX
Figure 14: NOx and NMVOC WtP emissions for E15
263
LCA for Bioethanol in Aviation
Other Emissions WtP
8�49
For Sulphur Dioxide (SO2), and dust/particulate matter (PM), only WtT data are available. Sulphur Dioxide content in European MOGAS is very low (<50ppm)3, and most SO2
emissions occur WtT, with significant amounts mainly resulting from heavy fuel oil used in tankers for long range transport.
Dust/particulate matter (PM) emissions are fairly well known WtT; however, few data for aircraft piston engines are available. [Rindlisbacher 2007] have made measurements, exhibiting a significant deviation between different MOGAS fuels used and between different engines. However, absolute particulate emissions are low, and higher emission data being caused by lead containing fuels (the use of aviation gas with 0.7 g Pb per kg fuel leads to about 58 mg Pb emissions per kWh of fuel or about 276 g per kWh of mechanical work over the LTO cycle). The Rotax 951 has only shown emissions between 1 and 3 mg/kg fuel (ca. 4 to 12 mg/kWhmech), being the best engine in the field. Most other engines had values around 30 mg/kWhmech emissions, and only the Rotax 582 DCDI was an outlier with up to 400 mg/kWhmech. Hence, we can assume that in most cases, from a WtP perspective, the lion�s share of particulate emissions is expected to result from the WtT path.
WtT results for Sulphur Dioxide (SO2) and dust & particles (PM) are shown in below. The only point of note is the higher emission in the sugarcane path 08. The source of SO2 and PM emissions occur in the conversion process of sugarcane�ethanol by burning bagasse4
for process heat production.
3 Measured sulphur content of the fuels used in the TtP measurements is actually below 5ppm. 4 Bagasse: fibre remaining after the extraction of the sugar�bearing juice from sugarcane.
264

LCA for Bioethanol in Aviation
Other Emissions WtP
8�50
0.000
0.100
0.200
0.300
0.400
0.500
0.600
01 Ref 02a 02b 03a 03b 04a 04b 05a 05b 6 07a 07b 8 09 10 11
Airp
ollu
tant
emis
sion
s(g
/kW
h mec
hani
calw
ork)
SO2 Dust&Particles
Figure 15: SO2 and dust/PM WtT emissions for E05
0.000
0.100
0.200
0.300
0.400
0.500
0.600
01 Ref 02a 02b 03a 03b 04a 04b 05a 05b 6 07a 07b 8 09 10 11
Airp
ollu
tant
emis
sion
s(g
/kW
h mec
hani
calw
ork)
SO2 Dust&Particles
Figure 16: SO2 and dust/PM WtT emissions for E10
265

LCA for Bioethanol in Aviation
Other Emissions WtP
8�51
0.000
0.050
0.100
0.150
0.200
0.250
0.300
0.350
0.400
0.450
01 Ref 02a 02b 03a 03b 04a 04b 05a 05b 6 07a 07b 8 09 10 11
Airp
ollu
tant
emis
sion
s(g
/kW
h mec
hani
calw
ork)
SO2 Dust&Particles
Figure 17: SO2 and dust/PM WtT emissions for E15
266

LCA for Bioethanol in Aviation
WtP Emissions Expressed in E0 Equivalents
9�52
9 WTP EMISSIONS EXPRESSED IN E0 EQUIVALENTS In this chapter the WtP emission results are presented converted to E0 equivalents i.e. in kilograms of MOGAS based on the LHV of the blends.
0
2,000
4,000
6,000
8,000
10,000
12,000
14,000
16,000
18,000
20,000
01 Ref 02a 02b 03a 03b 04a 04b 05a 05b 6 07a 07b 8 09 10 11
CO2�
equi
vale
nts
(g/k
g E0
eqiv
alen
t)
WtT GHG TtP GHG
Figure 18: GHG emissions of E5 compared to reference WtP expressed in E0 equivalents
267

LCA for Bioethanol in Aviation
WtP Emissions Expressed in E0 Equivalents
9�53
0
2,000
4,000
6,000
8,000
10,000
12,000
14,000
16,000
18,000
20,000
01 Ref 02a 02b 03a 03b 04a 04b 05a 05b 6 07a 07b 8 09 10 11
CO2�
equi
vale
nts
(g/k
g E0
eqiv
alen
t)WtT GHG TtP GHG
Figure 19: GHG emissions of E10 compared to reference WtP expressed in E0 equivalents
0
2,000
4,000
6,000
8,000
10,000
12,000
14,000
16,000
18,000
20,000
01 Ref 02a 02b 03a 03b 04a 04b 05a 05b 6 07a 07b 8 09 10 11
CO2�
equi
vale
nts
(g/k
g E0
eqiv
alen
t)
WtT GHG TtP GHG
Figure 20: GHG emissions of E15 compared to reference WtP expressed in E0 equivalents
268

LCA for Bioethanol in Aviation
WtP Emissions Expressed in E0 Equivalents
9�54
0.00
20.00
40.00
60.00
80.00
100.00
120.00
140.00
01 Ref 02a 02b 03a 03b 04a 04b 05a 05b 6 07a 07b 8 09 10 11
Airp
ollu
tant
emis
sion
s(g
/kg E
0eq
ival
ent)
NMVOC NOX
Figure 21: Air pollutant emissions of E5 compared to reference WtP expressed in E0 equivalents
0.00
20.00
40.00
60.00
80.00
100.00
120.00
140.00
01 Ref 02a 02b 03a 03b 04a 04b 05a 05b 6 07a 07b 8 09 10 11
Airp
ollu
tant
emis
sion
s(g
/kg E
0eq
ival
ent)
NMVOC NOX
Figure 22: Air pollutant emissions of E10 compared to reference WtP expressed in E0 equivalents
269
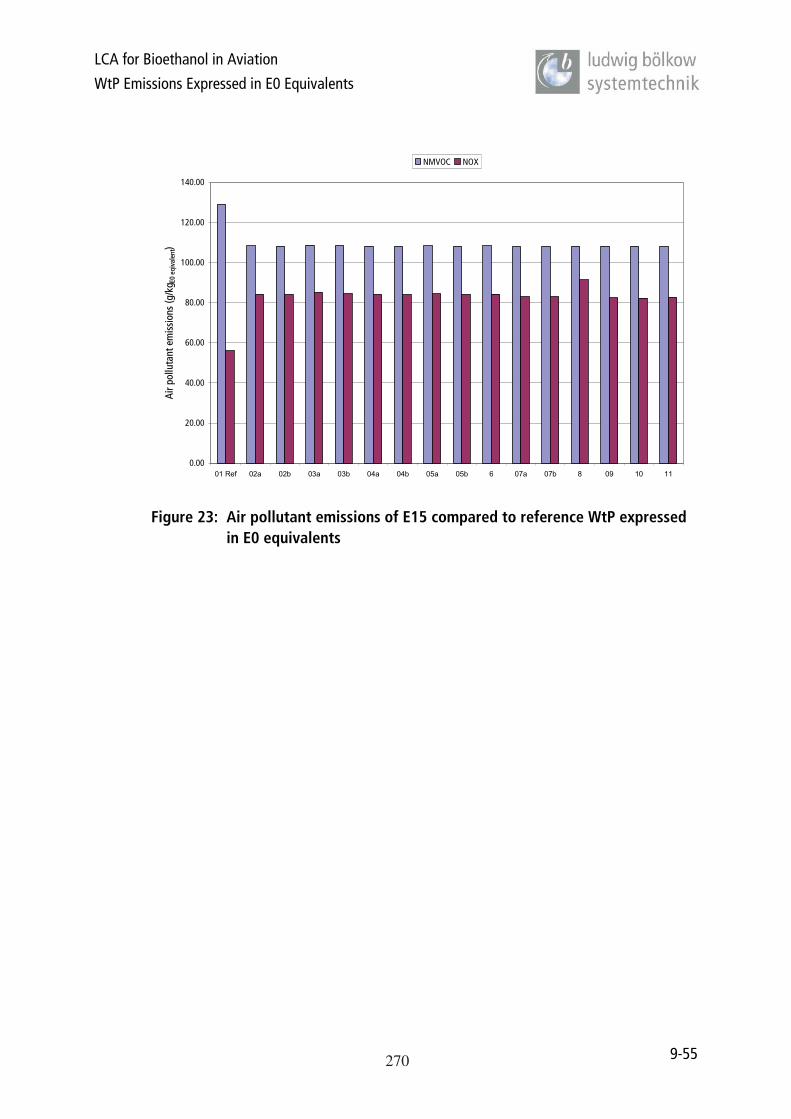
LCA for Bioethanol in Aviation
WtP Emissions Expressed in E0 Equivalents
9�55
0.00
20.00
40.00
60.00
80.00
100.00
120.00
140.00
01 Ref 02a 02b 03a 03b 04a 04b 05a 05b 6 07a 07b 8 09 10 11
Air
pollu
tant
emis
sion
s(g
/kg E
0eq
ival
ent)
NMVOC NOX
Figure 23: Air pollutant emissions of E15 compared to reference WtP expressed in E0 equivalents
270
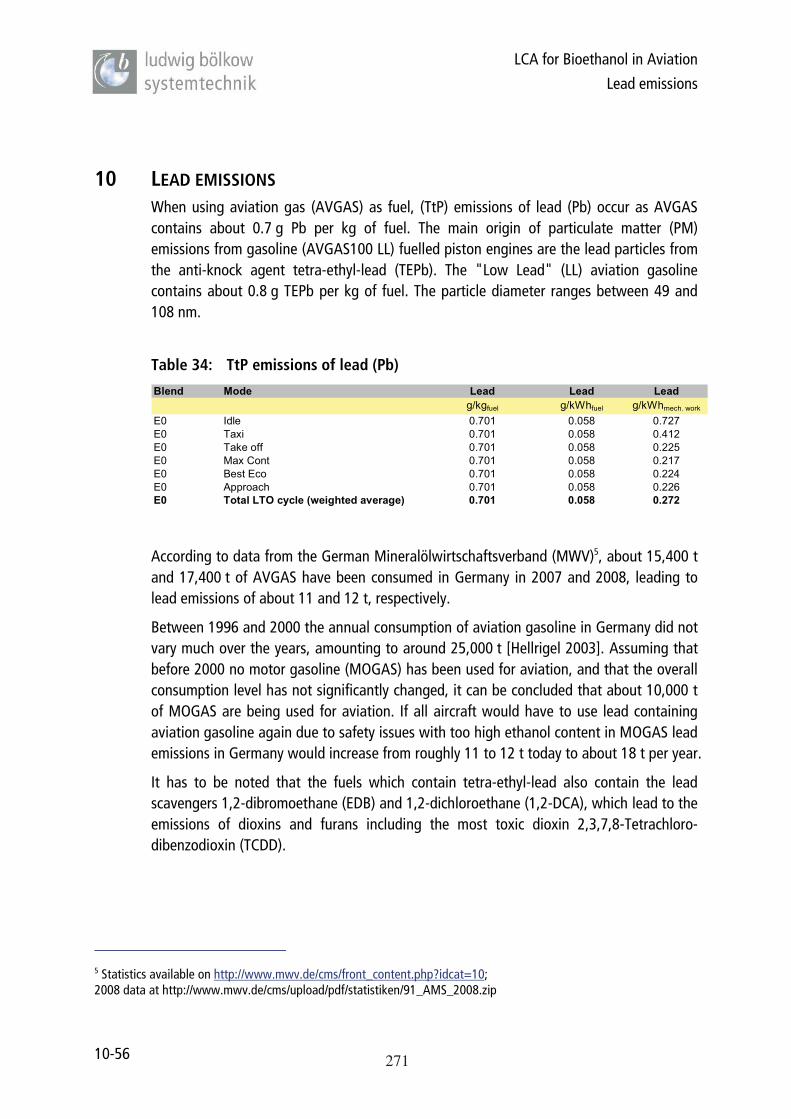
LCA for Bioethanol in Aviation
Lead emissions
10�56
10 LEAD EMISSIONS When using aviation gas (AVGAS) as fuel, (TtP) emissions of lead (Pb) occur as AVGAS contains about 0.7 g Pb per kg of fuel. The main origin of particulate matter (PM) emissions from gasoline (AVGAS100 LL) fuelled piston engines are the lead particles from the anti�knock agent tetra�ethyl�lead (TEPb). The "Low Lead" (LL) aviation gasoline contains about 0.8 g TEPb per kg of fuel. The particle diameter ranges between 49 and 108 nm.
Table 34: TtP emissions of lead (Pb)
Blend Mode Lead Lead Leadg/kgfuel g/kWhfuel g/kWhmech. work
E0 Idle 0.701 0.058 0.727E0 Taxi 0.701 0.058 0.412E0 Take off 0.701 0.058 0.225E0 Max Cont 0.701 0.058 0.217E0 Best Eco 0.701 0.058 0.224E0 Approach 0.701 0.058 0.226E0 Total LTO cycle (weighted average) 0.701 0.058 0.272
According to data from the German Mineralölwirtschaftsverband (MWV)5, about 15,400 t and 17,400 t of AVGAS have been consumed in Germany in 2007 and 2008, leading to lead emissions of about 11 and 12 t, respectively.
Between 1996 and 2000 the annual consumption of aviation gasoline in Germany did not vary much over the years, amounting to around 25,000 t [Hellrigel 2003]. Assuming that before 2000 no motor gasoline (MOGAS) has been used for aviation, and that the overall consumption level has not significantly changed, it can be concluded that about 10,000 t of MOGAS are being used for aviation. If all aircraft would have to use lead containing aviation gasoline again due to safety issues with too high ethanol content in MOGAS lead emissions in Germany would increase from roughly 11 to 12 t today to about 18 t per year.
It has to be noted that the fuels which contain tetra�ethyl�lead also contain the lead scavengers 1,2�dibromoethane (EDB) and 1,2�dichloroethane (1,2�DCA), which lead to the emissions of dioxins and furans including the most toxic dioxin 2,3,7,8�Tetrachloro�dibenzodioxin (TCDD).
5 Statistics available on http://www.mwv.de/cms/front_content.php?idcat=10;2008 data at http://www.mwv.de/cms/upload/pdf/statistiken/91_AMS_2008.zip
271
LCA for Bioethanol in Aviation
Literature
11�57
11 LITERATURE [ADEME 2002] Ecobilan; PricewaterhouseCoopers: Bilans énergétiques et
gaz à effet de serre des filières de production de biocarburants; Rappoert technique; la Direction de l'Agriculture et des Bioénergies de l'Agence de l'Environnement et de la Maîtrise de l'Energie (ADEME) d'une part, et la Direction des Ressources Energétiques et Minérales (DIREM) du Ministère de l'Economie, des Finances et de l'Industrie; Version définitive Novembre 2002;
[CONCAWE 2007] CONCAWE, European Council for Automotive R&D (EUCAR), European Commission Directorate General, Joint Research Center (JRC): Well�to�Wheels Analysis of Future Automotive Fuels and Powertrains in the European Context; March 2007; http://ies.jrc.ec.europa.eu/WTW
[CONCAWE 2009] CONCAWE, European Council for Automotive R&D (EUCAR), European Commission Directorate General, Joint Research Center (JRC): Well�to�Wheels Analysis of Future Automotive Fuels and Powertrains in the European Context; June 2009 � report not yet published (only excel files)
[Crop Energies 2008] Crop Energies, Südzucker, Cristal Union, 5 February 2008
[Dreier 1998] Dreier, T.; Geiger, B.; Lehrstuhl für Energiewirtschaft und Kraftwerkstechnik, TU München (IfE); Saller, A., Forschungsstelle für Energiewirtschaft (FfE): Ganzheitliche Prozeßkettenanalyse für die Erzeugung und Anwendung von biogenen Kraftstoffen; Studie im Auftrag der Daimler Benz AG, Stuttgart und des Bayerischen Zentrums für Angewandte Energieforschung e.V. (ZAE); Mai 1998
[Dreier 2000] Dreier, Th.: Ganzheitliche Systemanalyse und Potenziale biogener Kraftstoffe; IfE Schriftenreihe, Heft 42; herausgegeben von: Lehrstuhl für Energiewirtschaft und Anwendungstechnik (IfE), Technische Universität München, Ordinarius: Prof. Dr.�Ing. Ulrich Wagner; 2000; ISBN 3 �933283 � 18 � 3
[EFMA 2008] European Fertiliser Manufacturer Association (EFMA), 2008
272
LCA for Bioethanol in Aviation
Literature
11�58
[Esch 2009] Esch, Th., Aachen University of Applied Sciences, 8 December 2009
[ETSU 1996] Gover, M. P.; Collings, S. A.; Hitchcock, G. S.; Moon, D. P.; Wilkins, G. T.: Alternative Road Transport Fuels � APreliminary Life�cycle Study for the UK, Volume 2; A study co�funded by the Department of Trade and Industry and the Department of Transport; ETSU, Harwell March 1996
[Flessa 1998] Flessa, H.:, Beese, F.; Brumme, R.; Priesack, E.; Przemeck, E.; Lay, J., P. (Hrsg.): Freisetzung und Verbrauch der klimarelevanten Spurengase N2O und CH4 beim Anbau nachwachsender Rohstoffe; Deutsche Bundesstiftung Umwelt; Zeller Verlag 1998
[GEMIS 2009] Globales Emissions�Modell Integrierter Systeme (GEMIS), version 4.5.0.0; 2009; http://www.oeko�institut.org/service/gemis/index.htm
[GM 2002] Well�to�Wheel Analysis of Energy Use and Greenhouse Gas Emissions of Advanced Fuel/Vehicle Systems � A European Study; 27 September 2002; www.lbst.de
[Hartmann 1995] Hartmann, H.: Energie aus Biomasse; Teil IX der Reihe Regenerative Energien; VDI GET 1995
[Hellrigel 2003] Hellrigel, H., U.; Schuegraf, R.; Hüls., R.: Flugzeugbetankung mit MOGAS Problematik aus Nutzersicht; Eine Präsentation mit Unterstützung der Technischen Kommission des DAeC; Deutscher Aero Club e. V; 25.04.2003
[IPCC 2006] Paustian, K., et al: 2006 IPCC Guidelines for National Greenhouse Gas Inventories; IPCC National Greenhouse Inventories Programme; published by the Institute for Global Environmental Strategies (IGES), Hayama, Japan on behalf of the Intergovernmental Panel on Climate Change (IPCC), 2006; http://www.ipcc�nggip.iges.or.jp/public/2006gl/pdf/4_Volume4
[IPCC 2007] Solomon, S., IPCC et al.: Climate Change 2007 � The Scientific Basis; 2007
[Kaltschmitt 1997] Kaltschmitt, M.; Reinhardt, G., A.: Nachwachsende Energieträger: Grundlagen, Verfahren, ökologische Bilanzierung; Vieweg 1997; ISBN 3�528�06778�0
273
LCA for Bioethanol in Aviation
Literature
11�59
[Kaltschmitt 2001] Kaltschmitt, M; Hartmann, H. (Hrsg.): Energie aus Biomasse � Grundlagen, Techniken und Verfahren; Springer�Verlag Berlin Heidelberg New York; 2001; ISBN 3�540�64853�4
[Macedo 2004] Isaias de Carvalho Macedo, Núcleo Interdisciplinar de Planajamento Energético da Universidade Estadual d Campinas � NIPE/UNICAMP; Manoel Regis Lima Verde Leal, Centro de Tecnologiea Copersucar (CTC/Copersucar), Piracicaba; Joao Eduardo Azevedo Ramos da Silva � Centro de Tecnologia Copersucar (CTC/Copersucar), Piracicaba: Assesment of greenhouse gas emissions in the production and use of fuel ethanol in Brazil; Gorverment of the State of Sao Paulo; Geraldo Alckmin � Governor; Secretariat of the Environment José Goldemberg � Secretary; April 2004
[Murach 2003] Murach, D., Fachhochschule Eberswalde, Eberswalde, Germany; 27 August 2003
[Punter 2004] Punter, G., British Sugar; Rickeard, D., ExxonMobil/CONCAWE; Larivé, J�F., CONCAWE; Edwards, R., JRC Ispra; Mortimer, N.; North Energy Associates Ltd; Horne, R., Sheffield Hallam University; Bauen, A., ICEPT; Woods, J., ICEPT: Well�to�Wheel Evaluation for Production of Ethanol from Wheat; A Report by the LowCVP Fuels Working Group, WTW Sub�Group; FWG�P�04�024; October 2004
[RED 2009] Directive 2009/28/EC of the European Parliament and of the Council of 23 April 2009 on the promotion of the use of energy from renewable sources and amending and subsequently repealing Directive 2001/77/EC and 2003/30/EC
[Rindlisbacher 2007] Rindlisbacher. T.: Aircraft Piston Engine Emissions � Summary Report, Swiss Federal Office of Civil Aviation FOCA; June 13, 2007
[Wooley 1999] Wooley, R.; Ruth, M.; Sheehan, J.; Ibsen, K.; Biotechnology Center for Fuels and Chermicals; Majdeski, H.; Galvaz, A.; Delta�T Corporation: Lignocellulosic Biomass to Ethanol Process Design and Economics Utilizing Co�Current Dilute Acid Predhydrolysis and Enzymatic Hydrolysis Current and
274

LCA for Bioethanol in Aviation
Literature
11�60
Futuristic Scenarios; National Renewable Energy Laboratory (NREL); July 1999
275

COMPANY PROFILE OF LBST
Ludwig�Bölkow�Systemtechnik GmbH (LBST) is an expert consultant for energy and environment, supporting international clients from industry, finance, politics and non�governmental organisations in strategy, technology and sustainability.
Its cutting edge competence is based on over two decades of continuous experience, and on its interdisciplinary team of leading experts, bridging policy, economy, and technology.
LBST supports its clients with
� System & technology studies technology assessment and due diligence;energy and infrastructure concepts; feasibility studies;
� Strategy consulting product portfolio analysis, identifying new products and services; market analysis, decision support, and policy support;
� Sustainability consulting life cycle and carbon footprint analysis; natural resources assessment (energy, minerals, water); sustainability due diligence;
� Coordination project management, monitoring and assessment; and
� Capacity building studies, briefings, expert workshops, trainings.
Particular expertise exists in energy (renewables, energy storage, hydrogen and fuel cells) and mobility (fuels and drives, infrastructure, mobility concepts), with our work in sustainability cutting across all sectors.
A key common denominator of all activities is the rigorous system approach, making sure all relevant elements of a tightly networked system are taken into account, providing our customers with a comprehensive and complete basis for their decisions.
With its deep understanding of developments and technologies and its truly independent advice, LBST helps its clients to secure their future.
Ludwig�Bölkow�Systemtechnik GmbH (LBST) Daimlerstr. 15 · 85521 Ottobrunn (Munich) · Germany Phone: +49 (0)89 6081100 · [email protected] · http://www.lbst.de
276
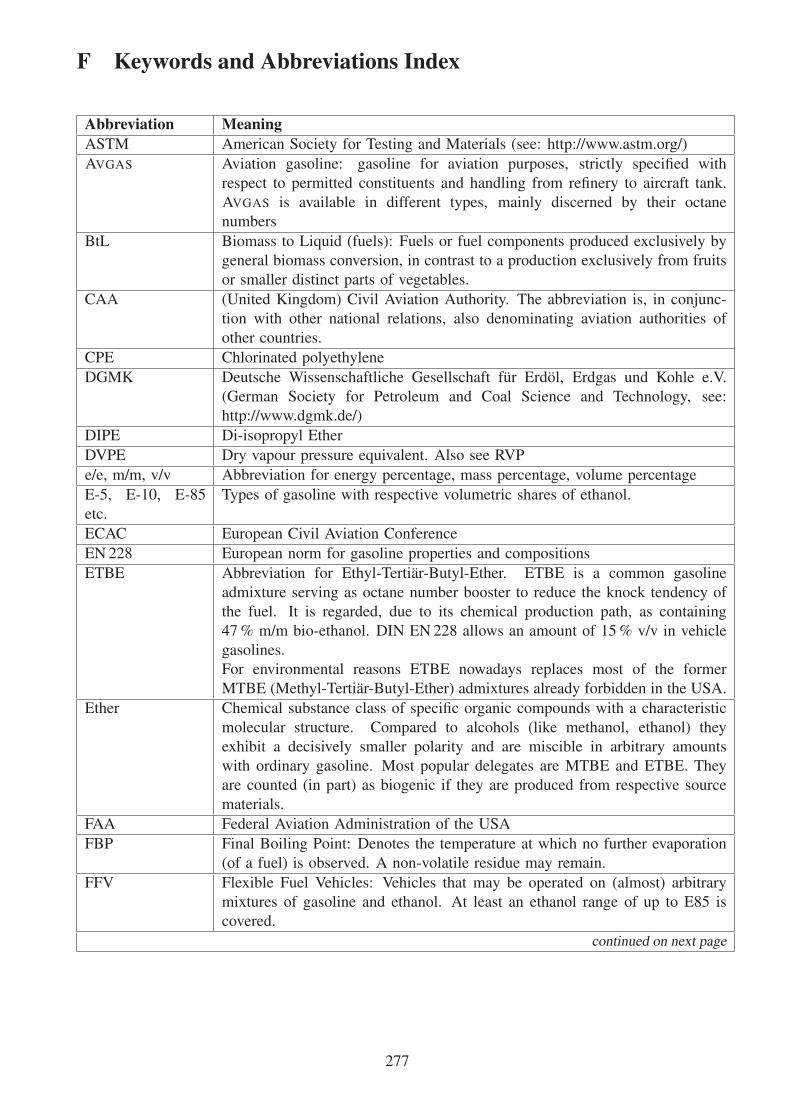
F Keywords and Abbreviations Index
Abbreviation MeaningASTM American Society for Testing and Materials (see: http://www.astm.org/)
AVGAS Aviation gasoline: gasoline for aviation purposes, strictly specified with
respect to permitted constituents and handling from refinery to aircraft tank.
AVGAS is available in different types, mainly discerned by their octane
numbers
BtL Biomass to Liquid (fuels): Fuels or fuel components produced exclusively by
general biomass conversion, in contrast to a production exclusively from fruits
or smaller distinct parts of vegetables.
CAA (United Kingdom) Civil Aviation Authority. The abbreviation is, in conjunc-
tion with other national relations, also denominating aviation authorities of
other countries.
CPE Chlorinated polyethylene
DGMK Deutsche Wissenschaftliche Gesellschaft für Erdöl, Erdgas und Kohle e.V.
(German Society for Petroleum and Coal Science and Technology, see:
http://www.dgmk.de/)
DIPE Di-isopropyl Ether
DVPE Dry vapour pressure equivalent. Also see RVP
e/e, m/m, v/v Abbreviation for energy percentage, mass percentage, volume percentage
E-5, E-10, E-85
etc.
Types of gasoline with respective volumetric shares of ethanol.
ECAC European Civil Aviation Conference
EN 228 European norm for gasoline properties and compositions
ETBE Abbreviation for Ethyl-Tertiär-Butyl-Ether. ETBE is a common gasoline
admixture serving as octane number booster to reduce the knock tendency of
the fuel. It is regarded, due to its chemical production path, as containing
47 % m/m bio-ethanol. DIN EN 228 allows an amount of 15 % v/v in vehicle
gasolines.
For environmental reasons ETBE nowadays replaces most of the former
MTBE (Methyl-Tertiär-Butyl-Ether) admixtures already forbidden in the USA.
Ether Chemical substance class of specific organic compounds with a characteristic
molecular structure. Compared to alcohols (like methanol, ethanol) they
exhibit a decisively smaller polarity and are miscible in arbitrary amounts
with ordinary gasoline. Most popular delegates are MTBE and ETBE. They
are counted (in part) as biogenic if they are produced from respective source
materials.
FAA Federal Aviation Administration of the USA
FBP Final Boiling Point: Denotes the temperature at which no further evaporation
(of a fuel) is observed. A non-volatile residue may remain.
FFV Flexible Fuel Vehicles: Vehicles that may be operated on (almost) arbitrary
mixtures of gasoline and ethanol. At least an ethanol range of up to E85 is
covered.
continued on next page
277

FMEA Failure Mode and Effects Analysis
GA General Aviation
GEW diagram Ternary diagram for the mixture gasoline – ethanol – water
GHG [Emissions of] Greenhouse Gases, substances that affect the re-radiation of
infra-red wavelengths from earth into space, the most common being CO2 and
CH4.
LBA Luftfahrtbundesamt Deutschland (German Aviation Authority)
LCA Life Cycle Analysis
m/m, v/v, e/e Abbreviation for mass percentage, volume percentage, energy percentage
MOGAS Motor gasoline: Officially not sharply defined appellation of vehicle gasoline
that is intended for aviation usage. Within this report “mogas” denominates
vehicle gasoline conforming to the requirements of most european STC,
especially a limitation of its ethanol content to 1 % v/v. Please note that this
upper ethanol limit is not specified / valid for the majority of recent aircraft
that may explicitly be operated on EN 228 specified vehicle fuel.
MON Motor octane number: measure of engine knock resistance for a fuel under
heavy load conditions. For a comprehensive discussion, see page 32.
MTBE Abbreviation for Methyl-Tertiär-Butylether, a colourless volatile liquid with
a characteristic ether smell. It is highly inflammable and explosive. MTBE
was predominantly used for octane number boosting in vehicle gasolines.
Being quite toxic, it was replaced by ETBE especially in the USA due to
environmental reasons.
MTOM Maximum take off mass
NBR Nitrile rubber: a very frequently used synthetic elastomer for fuel leading
elastic hoses
NTSB National Transportation Safety Board (an independent U.S. Federal Govern-
ment Agency, see http://www.ntsb.gov/)
Octane numbers Measure of engine knock resistance for a fuel. For a comprehensive discus-
sion, see page 32.
Oxygenate Oxygen-containing fuel additives that reduce the caloric value of the fuel.
As examples, the computational mass-related oxygen content is 50 % for
methanol, 34.7 % for ethanol, 18.2 % for MTBE, and 15.7 % for ETBE.
RON Research octane number: measure of engine knock resistance under low load
conditions. For a comprehensive discussion, see page 32.
RPN Risc priority number, see FMEA section, pp. 6.1ff
RVP The Reid Vapour Pressure is the result of a volatility measurement that has
been performed according to internationally standardized procedures. Due to
the complex multi-component evaporation properties of common fuel compo-
sitions the RVP cannot be identified with a concrete physically interpretable
equilibrium vapour pressure, but is recognized as valuable measure for the
evaporative properties of aviation gasolines. RVP is frequently used as
synonymous for DVPE.
continued on next page
278

SIoBiA Safety Implication of Biofuels in Aviation
STC Supplementary Type Certificate
TAME Tertiary amyl methyl ether
TBA Tertiary butyl alcohol
TEL Tetra-ethyl-lead. An organic lead compound frequently used for octane
number boosting in former times, but incompatible with vehicle catalyzers
and therefore banned from ordinary vehicle gasoline. It is still in use for most
aviation gasolines.
v/v, e/e, m/m Abbreviation for volume percentage, energy percentage, mass percentage
VLI Vapour Lock Index, a number representing the proneness of a fuel to produce
dangerous vapour bubbles in the fuel supply system of aircraft.
279