Embed Size (px)
Citation preview
FINAL REPORT
Increasing Efficiency by Maximizing Electrical Output
ESTCP Project EW-201250
AUGUST 2016
Edward Eveleth Scott Gold Ener-G-Rotors, Inc.
Distribution Statement A
This document has been cleared for public release

Page Intentionally Left Blank

This report was prepared under contract to the Department of Defense Environmental Security Technology Certification Program (ESTCP). The publication of this report does not indicate endorsement by the Department of Defense, nor should the contents be construed as reflecting the official policy or position of the Department of Defense. Reference herein to any specific commercial product, process, or service by trade name, trademark, manufacturer, or otherwise, does not necessarily constitute or imply its endorsement, recommendation, or favoring by the Department of Defense.

Page Intentionally Left Blank

REPORT DOCUMENTATION PAGE
Standard Form 298 (Rev. 8/98) Prescribed by ANSI Std. Z39.18
Form Approved OMB No. 0704-0188
The public reporting burden for this collection of information is estimated to average 1 hour per response, including the time for reviewing instructions, searching existing data
sources, gathering and maintaining the data needed, and completing and reviewing the collection of information. Send comments regarding this burden estimate or any other
aspect of this collection of information, including suggestions for reducing the burden, to Department of Defense, Washington Headquarters Services, Directorate for Information
Operations and Reports (0704-0188), 1215 Jefferson Davis Highway, Suite 1204, Arlington, VA 22202-4302. Respondents should be aware that notwithstanding any other
provision of law, no person shall be subject to any penalty for failing to comply with a collection of information if it does not display a currently valid OMB control number.
PLEASE DO NOT RETURN YOUR FORM TO THE ABOVE ADDRESS.
1. REPORT DATE (DD-MM-YYYY) 2. REPORT TYPE 3. DATES COVERED (From - To)
4. TITLE AND SUBTITLE 5a. CONTRACT NUMBER
5b. GRANT NUMBER
5c. PROGRAM ELEMENT NUMBER
5d. PROJECT NUMBER
5e. TASK NUMBER
5f. WORK UNIT NUMBER
6. AUTHOR(S)
7. PERFORMING ORGANIZATION NAME(S) AND ADDRESS(ES) 8. PERFORMING ORGANIZATION
REPORT NUMBER
10. SPONSOR/MONITOR'S ACRONYM(S)
11. SPONSOR/MONITOR'S REPORT
NUMBER(S)
9. SPONSORING/MONITORING AGENCY NAME(S) AND ADDRESS(ES)
12. DISTRIBUTION/AVAILABILITY STATEMENT
13. SUPPLEMENTARY NOTES
14. ABSTRACT
15. SUBJECT TERMS
16. SECURITY CLASSIFICATION OF:
a. REPORT b. ABSTRACT c. THIS PAGE
17. LIMITATION OF
ABSTRACT
18. NUMBER
OF
PAGES
19a. NAME OF RESPONSIBLE PERSON
19b. TELEPHONE NUMBER (Include area code)
27-07-2016 Final Report April 2012 - July 2016
Increasing Efficiency by Maximizing Electrical Output
Ted Eveleth, COO, Ener-G-Rotors, Inc. / Scott Gold, Senior Engineer, Ener-
GRotors,
Inc.
Ener-G-Rotors, Inc. 17 Fern
Avenue, Rotterdam, NY 12306
Environmental Security Technology Certification Program Program Office
4800 Mark Center Drive
Suite 17D03
Alexandria, VA 22350-3605
W912HQ-12-C-0048
EW-201250
ESTCP
Approved for public release; distribution is unlimited.
N/A
Our objective was to demonstrate the economic conversion of low temperature heat into electricity. For this project, we
repurposed heat from a boiler stack from a helicopter hangar on U.S. Army Ft. Drum base and used data from a related
installation at a biomass facility at the same location. This demonstration project evaluated the performance, economic
model and efficiency implications of using Ener-G-Rotors’ flagship product, the ORCA™ and ancillary systems needed to
support the heating and cooling needs of the ORCA system.
ORCA, waste heat recovery, condensing economizer, heat to power.
Unclassified Unclassified UU UL 44
Ted Eveleth
518-372-2608

Page Intentionally Left Blank

iv
Contents List of Figures ................................................................................................................................ vi
List of Tables .................................................................................................................................. vi
List of Acronyms............................................................................................................................ vi
1.0 INTRODUCTION .................................................................................................................... 1
1.1 BACKGROUND .............................................................................................................. 1
1.2 OBJECTIVE OF THE DEMONSTRATION .................................................................. 2
1.3 REGULATORY DRIVERS.............................................................................................. 3
2.0 TECHNOLOGY DESCRIPTION ............................................................................................ 4
2.1 TECHNOLOGY OVERVIEW ............................................................................................. 4
2.2 TECHNOLOGY DEVELOPMENT ..................................................................................... 6
2.3 ADVANTAGES AND LIMITATIONS OF THE TECHNOLOGY ...................................... 7
3.0 PERFORMANCE OBJECTIVES ............................................................................................ 9
3.1 “TABLE 1” SUMMARY OF PERFORMANCE OBJECTIVES ......................................... 9
3.2 PERFORMANCE OBJECTIVES DESCRIPTIONS ........................................................... 9
4.0 FACILITY/SITE DESCRIPTION .......................................................................................... 13
4.1 FACILITY/SITE LOCATION ............................................................................................ 13
4.2 FACILITY/SITE CONDITIONS ........................................................................................ 14
5.0 TEST DESIGN ....................................................................................................................... 15
5.1 CONCEPTUAL TEST DESIGN ........................................................................................ 15
5.2 BASELINE CHARACTERIZATION ................................................................................ 16
5.3 DESIGN AND LAYOUT OF SYSTEM COMPONENTS ................................................ 16
5.4 OPERATIONAL TESTING................................................................................................ 16
5.5 SAMPLING PROTOCOL .................................................................................................. 17
5.6 SAMPLING RESULTS ...................................................................................................... 17
6.0 PERFORMANCE ASSESSMENT ......................................................................................... 23
6.1 PERFORMANCE – OUTPUT ........................................................................................... 23
6.2 PERFORMANCE – SYSTEM EFFICIENCY ................................................................... 23
6.3 COST – COMPONENTS ................................................................................................... 23
6.4 CARBON BENEFIT .......................................................................................................... 24
6.5 RELIABILITY .................................................................................................................... 24
6.6 NON-DISRUPTIVE ........................................................................................................... 24
7.0 COST ASSESSMENT ............................................................................................................ 25

v
7.1 COST MODEL ................................................................................................................... 25
7.2 COST DRIVERS ................................................................................................................ 27
7.3 COST ANALYSIS AND COMPARISON .......................................................................... 29
8.0 IMPLENTATION ISSUES ..................................................................................................... 31
9.0 REFERENCES ....................................................................................................................... 35
APPENDICES .............................................................................................................................. 36
Appendix A: Points of Contact ................................................................................................. 36
Additional Appendices .............................................................................................................. 36

vi
List of Figures
Figure 1. The Organic Rankine Cycle ............................................................................................ 4
Figure 2. Schematic of the TGE expander ...................................................................................... 4
Figure 3. Comparing Expander Efficiency [3,4,5].......................................................................... 5
Figure 4. The ORCA Prototype ...................................................................................................... 6
Figure 5. TGE-5LB in 5kW ORC System ...................................................................................... 6
Figure 6. TGE-5LB at Harbec Plastics ........................................................................................... 6
Figure 7. Turbine Expander Efficiency Cost Tradeoff .................................................................... 7
Figure 8. Competitive Comparison ................................................................................................. 7
Figure 9. Building P-19710 at Ft. Drum ....................................................................................... 13
Figure 10. Close of Installation Area ............................................................................................ 13
Figure 11. The Smith Boilers ........................................................................................................ 13
Figure 12. RE Energy Facility on Ft. Drum .................................................................................. 14
Figure 13. Installation Schematic ................................................................................................. 16
Figure 14. Heat Flows and Run Cycle of Boilers ......................................................................... 18
Figure 15. RE Energy Efficiencies and Electrical Power over Time ............................................ 19
Figure 16. RE Energy Heat Fluctuations ...................................................................................... 20
Figure 17. RE Energy Cool Side Fluctuations .............................................................................. 20
Figure 18. Cost Breakdown for Systems and Installation............................................................. 22
Figure 19. Cost Inputs for Model .................................................................................................. 26
Figure 20. Heat Versus Power ....................................................................................................... 29
Figure 21. System Costs ............................................................................................................... 30
Figure 22. AIRR for Different Configurations and Sizes ............................................................. 30
List of Tables
Table 1. Summary of Performance Objectives .............................................................................. 9
Table 2. Cost Model for an Energy Efficiency Technology ......................................................... 25
List of Acronyms
DoD Department of Defense
ORC Organic Rankine Cycle
NYSERDA New York State Energy Research and Development Authority
DA tank De-aeration tank
AIRR Adjusted Internal Rate of Return

vii
Acknowledgments
Ener-G-Rotors, Inc.
Michael Newell, CEO
Edward Eveleth, CFO
Scott Gold, Senior Engineer
Ft. Drum Army Base
Stephen Rowley

viii
Executive Summary
Our objective was to demonstrate the economic conversion of low temperature heat into electricity.
For this project, we repurposed heat from a boiler stack from a helicopter hangar on U.S. Army Ft.
Drum base and used data from a related installation at a biomass facility at the same location.
Extracting value from stack heat in this manner is consistent with the Army’s Net Zero installation
strategy of “repurposing” waste energy as well as compliant with existing Federal mandates to
reduce the energy intensity of installations.
This demonstration project evaluated the performance, economic model and efficiency
implications of using Ener-G-Rotors’ flagship product, the ORCA™ and ancillary systems needed
to support the heating and cooling needs of the ORCA system. The ORCA basically contains an
Organic Rankine Cycle with the necessary controls to interface to the grid. A condensing
economizer was needed to convert the boiler stack gas into a usable heat source and an air cooler
was necessary to provide a cold sink at the hangar. Different installations of an ORCA system will
require different needs for ancillary systems, for example, the biomass facility did not need either
an economizer or air cooler.
Because of the unusual arrangement of the boiler systems at the hangar, reliable, consistent
performance data could not be generated. However, installation costs were acquired for both
installations and performance data was generated at the biomass site. The original plan was to
have a 235F heat source which would provide 6% efficiency. We only had about 215F on the heat
source, so the efficiency was lower than expected, at ~5%, although we were able to achieve the
output goal of ~20kW. On the cost side, the long term goal of <$2/W capital cost for the ORCA
system was achievable. Installation costs for the two sites varied dramatically for a variety of
reasons discussed later, but were within the $0.60/W goal. Clearly, the installation costs and need
for ancillary systems (economizer and air cooler) will have a large impact on the economics of any
installation. We did not have a long enough test to determine maintenance costs. The carbon
savings are based on kilowatts generated and a diminished testing schedule made achieving a
carbon saving goal difficult and affected our ability to assess reliability.
Using all the data collected we were able to build a model that shows the Adjusted Internal Rate
of Return for different configurations of systems at different sized. Assuming a 7.5% AIRR is
required, then a 50kW system using an economizer and air cooler or a 40kW system using one or
the other ancillary systems, or a 30kW ORCA only system are all economical. As waste heat
sources are evaluated, this simple model, and the lessons learned from the effort, will aid in
deciding upon the economics of any future installation.

1
1.0 INTRODUCTION
1.1 BACKGROUND
Generally, experts agree the easiest path to energy
savings is to use what we have more efficiently. First,
reduce use, then be more efficient, and only then find
ways to generate more power. The second law of
thermodynamics says that any conversion of fuel to
work, particularly in the production of electricity, will
be inefficient and result in the loss of heat. Getting
more out of the existing fuel we burn by taking
advantage of that heat is clearly then a priority.
Sometimes, that heat can be reused as a thermal
source in certain applications, but often there is no
practical use for that heat and it is usually expelled
into the atmosphere. This is the case for all types of
combustion engines/generators that burn liquid fuel
and exhaust heat into the atmosphere. This is energy
in the form of heat that has already been paid for, and
is allowed to go to waste.
Extracting value from that heat should be a top priority. Unfortunately, the current methods of
converting that heat into electricity are limited. Generally, that conversion is only efficient at
large sizes and when the heat source is a high temperature, say above 500F. Ener-G-Rotors
believes we have developed a device that changes the economic equation and makes converting
low temperature and small heat flows into electricity a great investment.
This project demonstrated that technology. We used heat from both a boiler stack exhaust and
leftover heat from electricity generation to create electricity using biomass. Essentially, the fuel
was free and the only expense is the cost of the system and its installation. Performance data
from this project enabled Ener-G-Rotors to forecast the performance and economic benefit for a
variety of other applications.
The DoD is only using heat to electricity technology in a few limited areas, one being a
geothermal flash plant at Naval Air Weapons Station China Lake. But, there are few other heat
to electricity products on the market that are less than several megawatts. This is a result of the
inefficiency of this type of conversion using existing technology.
DoD Applications: Possible applications within the Department of Defense (DoD) for such a
technology include:
a) Combined heat and power sites that could increase electrical output
b) Stack heat recovery from ships and other vehicles to increase electrical generation
c) Increasing the efficiency of portable generators to reduce fuel needs.
d) Bottom cycling on a geothermal flash plant like the one at Naval Air Weapons Station
China Lake, California to increase the electrical output without changing the existing
infrastructure.
“Fundamentally, we know that
saving energy saves lives…”
Army Gen. Martin E. Dempsey,
Chairman of the Joint Chiefs of
Staff
“The next step is to utilize
waste energy – that is, to
‘repurpose’ energy. Boiler
stack exhaust, building
exhausts or other thermal
energy streams….”
Katherine Hammack, Asst. Sec.
of the Army for IEE

2
e) Portable solar thermal collectors that provide hot water, heating and electricity to remote
sites.
f) Recovering condensate and steam that is otherwise thrown away from central steam
plants
We believe the opportunity within the DoD becomes larger with more development on different
sized heat to electricity systems and integration of our technology into other systems. The real
benefit of this project to the DoD is in demonstrating the basics of our technology and then
developing devices of different sizes specifically for different applications. The goal for this
project was to create a model to calculate the performance and economics for a number of
different sized systems.
1.2 OBJECTIVE OF THE DEMONSTRATION
Validate: This demonstration project evaluated the performance, economic model and efficiency
implications of using Ener-G-Rotors’ flagship product, the ORCA™. This project generated data
from a real-world environment and gave important feedback on capital and installation cost for
the unit, and performance in terms of electricity generation that determine operating costs.
The overarching objective was to assess the overall economic benefit of converting waste heat to
electricity. There are two components to this assessment:
1) Output – how much electricity is generated (and carbon emissions saved)
2) Cost – how much did the system cost to buy, install and operate
In order to make this assessment, the project plan originally called for installing a condensing
economizer which turned boiler stack heat into hot water to supply an ORCA unit. We measured
performance by monitoring the overall kWh output and the percentage uptime of the system over
the testing timeframe. We used the electrical production to determine the reduction in carbon
footprint of the facility. We estimated costs for commercial volume units, tracked installation
costs, and developed a metric for maintenance costs from actual performance. With these
metrics, we were able to analyze the performance of the ORCA system and its performance when
integrated with a condensing economizer.
Findings and Guidelines: The end result of this demonstration is a model that can be used to
evaluate other sites and opportunities for the economic value of turning waste heat into
electricity. This model forecasts the benefits from any installation without the need for further
demonstration. This project both (1) allows us to roll out this solution to other installations, and
(2) demonstrates a cost effective method to turn heat into electricity that could be put to use in
other Department of Defense (DoD) applications including increasing the efficiency of portable
generators, ships and vehicles while also reducing the carbon footprint of the DoD.
Technology Transfer: There are 381 boilers on Army bases in North America that produce
enough waste heat to power an ORCA.[2] Some of them are large enough that an estimated 450
units for 30kW ORCAs could be installed. By replicating this effort at all those sites, there is a
potential for 13.5MW of capacity to generate carbon free electricity. We are not aware of any
other technology that can provide these sorts of paybacks from turning waste heat into electricity.
In addition, validating the TGE technology in the size range from 20kW to 60kW opens up
numerous possibilities for alternative uses.

3
Additional Benefits: Every successful installation adds credibility to Ener-G-Rotors and helps
propel our commercialization forward. We have a unique opportunity to reduce costs of US
manufacturers while simultaneously reducing carbon emissions. Propelling our
commercialization will only speed up that process.
1.3 REGULATORY DRIVERS
For this project, we used heat from a boiler stack that is part of the heating system for the
Chinook and Blackhawk Hangars at Fort Drum. Extracting value from stack heat in this manner
is consistent with the Army’s Net Zero installation strategy of “repurposing” waste energy [1] as
well as compliant with existing Federal mandates to reduce the energy intensity of installations.
In the Spring 2011 edition of the U.S. Army Journal of Installation Management, the Honorable
Katherine Hammack, Assistant Secretary of the Army for Installations, Energy and Environment
targets extracting value from waste heat as part of the Army’s Net Zero strategy. She stated the
second step to achieving a net zero installation “is to utilize waste energy – that is, to ‘repurpose’
energy. Boiler stack exhaust, building exhausts or other thermal energy streams can all be
utilized for a secondary purpose.” Clearly, there is a broad need within DoD for a technology to
economically extract value from waste heat.
In addition to being consistent with the Army’s Net Zero energy installation initiative, the ORCA
could also help the DoD with the following requirements:
Executive Order 13423 requires Federal agencies to reduce energy intensity by 3% per
year
Energy Independence and Security Act of 2007 mandates reduction in energy
consumption per gross square foot of Federal building
Executive Order 13514 directs the management of existing building systems to reduce the
consumption of energy as well as manage greenhouse gas emissions.

4
2.0 TECHNOLOGY DESCRIPTION
This project demonstrated the economics of waste heat to electricity conversion. The installation
was composed of three major systems: a condensing economizer to extract heat from a boiler
stack, an ORCA system from Ener-G-Rotors to turn that heat into electricity, and an air cooling
system to provide the necessary cold component. The condensing economizer and air cooling
system are standard and readily available from multiple vendors. The novel technology is the
ORCA system.
2.1 TECHNOLOGY OVERVIEW
The ORCA basically contains an Organic Rankine Cycle with the necessary controls to interface
to the grid. The Rankine Cycle, largely in the form of steam engines, generates about 90% of all
electric power used throughout the world, including virtually all biomass, coal, solar thermal and
nuclear power plants. The Organic Rankine Cycle replaces the steam with an organic refrigerant
and is usually used for lower temperature (<700°F) and smaller sized applications.
Organic Rankine Cycle - This
“appliance” will contain all of the
hardware and controls necessary to convert
low grade heat into electricity using an
Organic Rankine Cycle. In that cycle,
shown in Figure 1, the heat input to the
system can be hot liquid or steam that
passes through a hot heat exchanger. A
portion of the input energy is transferred to
the working fluid, an environmentally
friendly, non-toxic, organic high molecular
mass fluid. It is the energy of the working
fluid vapor that drives an expander which in turn rotates a generator. The working fluid is then
condensed into a liquid in a cold heat exchanger and pumped back to the hot heat exchanger
where it is vaporized. All the components except the expander are commercially available. The
expander is the heart of the system, and the core of our technology.
TGE - Our TGE™ expander, shown in
Figure 2, is a relatively simple positive
displacement device. In essence, the
mechanism is a modified gerotor running as
an expander. The invention is to hold the
inner and outer rotor each on two sets of pre-
loaded roller element bearings controlling
radial and axial tolerances. This innovative
approach to the control of tolerances allows
the working fluid to effectively extract the
maximum amount of work from the expanding
vapor while minimizing friction and gear
wear. Mathias, et. al.,[3] demonstrated 86% isentropic efficiency of the expander at Ohio State
Hot Heat
Exchanger (HHE)
Generator
Cold Heat
Exchanger (CHE)
Expander
Pump
Heat In
Electricity
Out
Heat Out
Figure 1. The Organic Rankine Cycle
Figure 2. Schematic of the TGE expander

5
University with the very first TGE produced. We have reproduced those results in-house
achieving that level of efficiency while producing 2kWe-4kWe. We expect better efficiency as
the TGE grows in size, as is true of turbines and other types of expanders.
Turbine Comparison – In general, turbine expanders that are less than 1MW in size struggle to
achieve over 70% isentropic efficiency.[3-5] There are two reasons that turbines become
inefficient at small sizes. First, the tip speed of the turbine blade is important and it needs to
move quickly. Large turbine blades spin at 40,000 rpm. To get the tip of short turbine blades to
move at the same speed as large blades is very difficult without extreme rotational speeds.[6]
Secondly, the surface area where leakage can occur gets larger in proportion to the volume in the
expander at smaller sizes.[7] Imagine a pinwheel spinning in a tube. Air can leak around the tips
of the pinwheel. A smaller tube and pinwheel means a larger relative area between the pinwheel
and tube. More leakage means less efficiency or more cost to compensate. While it may be
technically possible to achieve high efficiencies with small turbines, it has not proved
commercially viable because of the costs. Small turbine-based systems, defined as 50kW-
100kW, cost between $3 and $4/kW, which makes them too expensive for the vast majority
of applications. [8]
In contrast, the TGE operates without a
continuous flow through the expander, and with
very tight tolerances around the chambers that
minimize leakage. The TGE operates at either
1800 or 3600rpm, which is the speed of
induction generators, making grid connection
inexpensive and easy. The resulting efficiency
of the TGE is superior to turbines at smaller
sizes as shown in Figure 3. It should be noted
that the first data point for turbines is taken from
a demonstration of the PureCycle 250kW United
Technologies turbine-based system.[4]
Expander efficiency is a force multiplier because it determines both the output of the
system and the cost of the system. The majority of the cost of an ORC system is the heat
exchangers. More efficient conversion means smaller heat exchangers can be used dropping the
cost of the overall system. That is why the TGE is so important and remarkable.
ORCA - The ORCA (shown in Figure 4) is a complete, modular, drop-in Organic Rankine Cycle
(ORC) system which can generate 25kW-60kW with 50kW as the target design point. The
ORCA:
will run using 190-240F hot water or steam as a heat source
Figure 3. Comparing Expander Efficiency [3,4,5]
50%
60%
70%
80%
90%
100%
1 10 100 1,000 10,000
Isentropic
Efficiency
Size (log kW)
TGE
Turbines
Efficiency at Low Temperatures

6
uses an environmentally safe, non-flammable,
off-the-shelf refrigerant
uses an induction generator with a grid
interface device to generate grid compatible 3
phase 480V electricity
We expect to achieve breakthrough economics as
well. Working in conjunction with the Center for
Automation Technologies and Systems at Rensselaer
Polytechnic Institute in Troy, NY and other external
consultants, we have projected our long term
manufacturing costs for the ORCA to be $40,000 or
$0.8/kW. The increased efficiency and reduced
costs of the expander and system creates a new opportunity for small scale, low
temperature heat to electricity conversion at manufacturing costs of lower than $1/watt.
Development history: Ener-G-Rotors has successfully produced
eleven expanders and two 5kW prototype systems. The first TGE
ever made would produce about 0.6kW. We scaled up the size to
5kW which was tested with input temperatures between 200°F and
270°F.
One particular expander, the TGE-5LB, shown in an ORC system
in Figure 5, has operated for the last five years. The system was
tested using three different working fluids and had over 2,000 hours
of use at our facility. That system, shown in Figure 6, was tested at
Harbec Plastics in Ontario NY. During the trial, that device
produced 4.3kWe AC that was delivered directly to the grid by
bottom cycling on two 30kW Capstone micro turbines each running
at 24kW, thereby increasing electrical output by 10%. The input
hot water was only 220F and left the system at 210F because 210F
was the input temperature required for another process. This
demonstration illustrates the potential to increase electrical output
and/or reduce fuel consumption for combined heat and power
systems.
2.2 TECHNOLOGY DEVELOPMENT
ORCA Development: Building upon our work to manufacture
5kW prototype systems, we ran a $800,000 project partially
funded by the New York State Energy Research and
Development Authority (NYSERDA) to make a prototype of
the ORCA. We built that prototype (shown in Figure 4),
installed the necessary heating and cooling capacity for testing,
and achieved 70% of design specifications generating 36kW in
output.
We recently finished a $1.3MM project with NYSERDA to finish bringing the prototype to
specification and then built and tested a beta unit at Harbec Plastics. That unit was installed and
tested for over 500 hours with performance commensurate with performance in our facilities.
Figure 5. TGE-5LB in 5kW
ORC System
5kW expander
5kW System
Figure 6. TGE-5LB at Harbec Plastics
Figure 4. The ORCA Prototype

7
Since then we have installed three additional ORCA units throughout New York State and are
pleased with these deployments. An additional five deployments are expected during 2016.
Future Potential for DoD Applications: Possible applications within the DoD for such a
technology include:
a) Combined heat and power installations to increase the amount of electrical output
b) Stack heat recovery from ships to convert some of the waste heat to electricity
c) Increasing the efficiency of portable generators to reduce fuel needs.
d) Bottom cycling on a geothermal flash plant like the one at Naval Air Weapons Station
China Lake, California to increase the electrical output without changing the existing
infrastructure.
e) Portable solar thermal collectors that provide hot water, heating and electricity to remote
sites.
f) Taking advantage of temperature differentials in ocean currents, known as Ocean
Thermal Energy Conversion.
g) Recovering condensate and steam that is otherwise thrown away from central steam
plants
h) Portable electricity generation from the evaporative energy of water in dry, hot climates.
We believe the opportunity within the DoD becomes larger with more development on different
sized heat to electricity systems and integration of the TGE technology into other systems. The
real benefit of this project to the DoD was in demonstrating the basics of our technology and
then developing devices of different sizes specifically for specific applications. With data from
this demonstration, we were able to calculate the expected performance and economics for a
number of different sized systems. For example, we have estimated that we could create an
additional 8kW on average from the exhaust of an MEP-805B 30kW diesel engine generator set,
raising output over 25% and lowering fuel needs commensurately. This would have immense
value to the DoD’s operational energy demand at Forward Operating Bases. This reduction in
fuel translates to lives saved from moving less fuel in dangerous combat areas, a problem area
that continues to plague our deployed forces in Afghanistan especially. Clearly, demonstrating
cost-effective conversion of heat to electricity has immense value to the DoD.
2.3 ADVANTAGES AND LIMITATIONS OF THE
TECHNOLOGY
Performance/Cost Advantages: The link between
performance and cost of a heat to electricity system was
discussed earlier. In short, efficiency of the expander, the
main difference between ORC systems, directly relates to
system cost because a more efficient expander can generate
more power for the same heat input. Conceptually, this is
shown in Figure 7 for turbines whose efficiency decreases
with system size driving up costs. The cost in $/W for our
system is substantially less than other competitive systems
as shown in Figure 8. While installation at any particular site
would be similar across competitive products, and
maintenance may be comparable, the initial system cost is a
Figure 7. Turbine Expander Efficiency
Cost Tradeoff
Figure 8. Competitive Comparison

8
significant portion of upfront investment and the difference between our cost and competitors’
costs can be dramatic.
Performance Limitations: There are performance limitations inherent to an ORC system, but
there are not any performance limitations specific to our system. All the components of an ORC
system can be purchased from commercial vendors except the expander. We expect our
expander to be durable and require no more attention and maintenance than other ORC
expanders.
There are some performance limitations of the ORC that will need to be recognized before any
ORC systems can be used economically. The biggest issue with ORC systems is the need for a
cold side. Electricity is generated by a differential between the waste heat and a cold source.
The larger the differential, the more efficient is the ORC. The cold source can often be the
atmosphere, or a flow of water from a river, pond, or other source. Not having an easily
available cold source will drive up the costs of some installations.
Any ORC will also be optimized for a specific temperature range, mainly on the hot side. The
refrigerant choice dictates the optimal operating range for the ORC. While our system is
capable of operating in a reasonably large range of operating conditions, and is well within
optimal range for this demonstration, some installations may not be optimal at all times.
Cost Limitations: We expect to be able to manufacture ORCA systems in a controlled
environment and have stable costs and prices once we get to volume manufacturing. Installation
expense at any particular site is the biggest variable that will need to be considered on a site by
site basis for widespread application. While the requirements of our system are not that
demanding, i.e. we have 4 hoses and a wire that connect to the outside world, the ease with
which those input and outputs can be connected into an existing facility is completely dependent
upon the facility. Mostly, the issue is having a space for the ORCA to fit that is close to the
resources needed, namely the hot and cold sources.
This demonstration had higher actual system costs for the ORCA than future installations
because we have not reached volume manufacturing of the ORCA. Projections for commercial
costs versus commercial pricing will be part of the model developed. The condensing
economizer and the air cooling system also represent capital expenses that may not be necessary
at every site, but increased the capital cost for this particular installation. Having data on those
systems however allowed us to generate a complete model for any future installation under
consideration.
Installation and maintenance costs for each of the components, ORCA, economizer, and air
cooler, should be the same as later applications.
Social Acceptance: We foresee no barriers to social acceptance of the system. We are able to
operate remotely from EGRI minimizing the efforts of local staff. The low maintenance needs
and the lack of an adverse effect if our system is not operating, i.e. the building is still heated
whether our system works or not, should also make acceptance easy.

9
3.0 PERFORMANCE OBJECTIVES
3.1 “TABLE 1” SUMMARY OF PERFORMANCE OBJECTIVES
Performance
Objective Metric Data Requirements Success Criteria Result
Performance
Output Net electricity produced
- projected kWh
produced annually
assuming 85% uptime
Electrical output in kWh
produced during test
period on daily basis
> 80% of
anticipated
system
efficiency;
>20kW average
annual
80% of
anticipated
system
efficiency given
conditions;
~20kW average
annualized
System
Efficiency
% of Carnot and actual
System thermal
efficiency
Electrical Output and
energy content of the
temperature sources (hot
and cold) broken down by
monthly average
>40% of Carnot;
>6% system
efficiency
~20% of Carnot
and ~5% system
efficiency
Cost
System Actual build cost;
projected unit price
ORCA bill of materials;
manufacturing cost study
Long term
capital costs in
<$2/W;
Long term costs
expected at
$2/W
Installation Actual installation cost;
projected installation
costs
Installation report and bill
of materials; installation
cost study
Long term
installation costs
<$0.60/W
Installation costs
of device
consistent with
$0.60/W
Maintenance Actual maintenance
costs; projected
maintenance costs
Actual maintenance
expenditures;
maintenance cost study
Long term
maintenance
costs <$0.50 per
hour of operation
Undetermined
Carbon benefit Carbon savings of non-
fossil fuel based
electrical generation
Electrical output; standard
CO2 emission from
average electricity
generation activity using
fossil fuels
>100 tons of
carbon emissions
avoided annually
Achievable
carbon reduction
on par with
output
High reliability Up-time as percentage
of test duration
Hourly operating
performance
> 85% uptime
when heat and
cold flows in
operational range
Notional results
Other Qualitative System Objectives
Non-disruptive No interruptions of
normal operations
outside of the ORCA
Feedback from on-site
personnel
No impact on
boiler operation
from use of the
ORCA
Achieved
3.2 PERFORMANCE OBJECTIVES DESCRIPTIONS
• Name and Definition: Performance – Output

10
• Purpose: The output defines the benefits of the system and is a key determinant of the
economics
• Metric: Net electricity produced and/or projected kWh produced annually assuming 85%
uptime
• Data: Electrical output in kWh produced during test period on daily basis.
• Analytical Methodology: We will keep our output data and average as necessary; correlations
between heat available to the system, i.e. number of boilers running, and electrical output will be
analyzed.
• Results: The performance was 80% of calculated for the actual temperature and flow
conditions and output averaged ~20kW.
• Discussion: The heat source produced on the low end of original expectations for BTUs/hr, but
we were able to achieve the output goal.
• Name and Definition: Performance – System Efficiency
• Purpose: The system efficiency determines how much electricity can be generated from a
particular heat source. It is an indirect measure of economics.
• Metric: % of Carnot and actual System thermal efficiency.
• Data: Electrical Output and energy content of the temperature sources (hot and cold) broken
down by monthly average
• Analytical Methodology: Carnot ideal conversion figures will be generated from the available
heat and cold sources and compared to actual performance. System efficiency will be calculated
from heat input and actual output figures.
• Success Criteria: >40% of Carnot; >6% system efficiency
• Results: System efficiency of ~5% were achieved, but Carnot was only 20%
• Discussion: A critical component of Carnot and system efficiency is that temperature of the
heat source. The hotter the heat source, the greater possible system efficiency. The original plan
was to have a 235F heat source which would provide 6% efficiency. We only had about 215F on
the heat source, so the efficiency was lower.
• Name and Definition: Cost – three components – system, installation and maintenance
• Purpose: The two fixed costs, system and installation, and one ongoing cost, maintenance are
key metrics in determining the economics. We will keep tabs on the system costs versus the
installation since installation costs are likely to vary by site and particular application.
• Metric: Actual maintenance costs; projected maintenance costs.
• Data: ORCA bill of materials; manufacturing cost study; Installation report and bill of
materials; installation cost study; Actual maintenance expenditures; maintenance cost study.

11
• Analytical Methodology: We will keep track of actual costs and then make some forecasts
regarding long term capital costs for the ORCA system. Installation costs are unlikely to change
much, but the capital cost of the ORCA system needs to be in line with long term commercial
pricing predictions.
• Success Criteria: Long term capital costs in <$2/W; Long term installation costs <$0.60/kW;
Long term maintenance costs <$0.50 per hour of operation
• Results: Long term capital costs, and installation costs appear to be achievable, but long term
maintenance costs were not able to be determined.
• Discussion: Systems are still being built on a custom basis by unit. Significant economies of
scale can be achieved and forecasts allow for pricing to be in the $100,000 range for an ORCA
capable of 50kW. Installation costs for the two sites varied dramatically for a variety of reasons
discussed later. Clearly, the installation costs and need for ancillary systems (economizer and air
cooler) will have a large impact on the economics of any installation. We did not have a long
enough test to determine maintenance costs.
• Name and Definition: Carbon benefit
• Purpose: Since no additional fuel will be used to generate electricity, in addition to other
economic benefits, this installation will save carbon emissions that would otherwise have been
necessary to create the comparable amount of electricity.
• Metric: Carbon savings of non-fossil fuel based electrical generation.
• Data: Electrical output; standard CO2 emission from average electricity generation activity
using fossil fuels
• Analytical Methodology: The calculations are relatively simple given the electrical output and
emission rate using fossil fuels.
• Success Criteria: >100 tons of carbon emissions avoided annually.
• Results: The cumulative output of the systems was not sufficient to reduce carbon emissions
by 100 tons.
• Discussion: The carbon savings are based on kilowatts generated. The fact that the criteria was
not achieved does not represent a failing of the concept, just a diminished testing schedule based
on a variety of factors. A larger and more continuous operation would have achieved the goal.
• Name and Definition: Reliability
• Purpose: Reliability is an important factor as it will relate directly to utilization.
• Metric: Up-time as percentage of test duration.
• Data: Hourly operating performance.
• Analytical Methodology: Time periods in terms of hours will be generated for both ORCA in
operational mode and times when the boilers were running, but the ORCA was not.
• Success Criteria: > 85% uptime when heat and cold flows in operational range

12
• Results: Insufficient data was gathered to calculate this metric.
• Discussion: With a shortened testing period, reliability was not able to be measured with any
accuracy. Qualitatively, the systems were running when the conditions were in operational
range.
• Name and Definition: Non-disruptive
• Purpose: This catch-all performance objective should add qualitative flavor to the project to
detect any issues that could make the replication of this technology difficult.
• Metric: Anecdotal.
• Data: Feedback from on-site personnel.
• Analytical Methodology: None.
• Success Criteria: No impact on boiler operation from use of the ORCA
• Results: There was no disruption of any kind for either installation.
• Discussion: The system was designed to be non-disruptive and these installations demonstrated
that fact. Additionally, the operation of the system at the hangar revealed inefficient boiler firing
protocol which was subsequently fixed.

13
4.0 FACILITY/SITE DESCRIPTION
4.1 FACILITY/SITE LOCATION
Facility Criteria: The first criteria for a facility for this project was a source of heat large
enough to generate at least 30kW of electricity. We estimated that a 350hp boiler should exhaust
sufficient heat from a single exhaust to allow for 1.2MM BTUs/hour to be removed from the
stack via a condensing economizer. Boilers larger than 350hp would also suffice. At some
point, boilers become large enough that they are likely to have economizers and reuse the heat
for thermal purposes. In those cases, some of the sites we reviewed were still likely candidates
because we could use heat from the De-Aeration tank, where oxygen is removed from the water
by heating it before it becomes steam. We reviewed list of 381 boilers at various Army bases
that would be large enough for a demonstration.
Our preference was for boiler systems that generate steam
and/or hot water year round for both heating and cooling
purposes because that year round use would increase our
utilization rate. Those system are often larger and built
for campuses rather than single buildings.
Another consideration was a convenient space to put the
ORCA unit and availability of a cold source.
Geographic Criteria: The source of heat was not
sufficient alone, because of the need for a cold sink.
Because of the application, boilers are mainly installed
in a cold temperature climates and are only operational
when the outside air is sufficiently cold. This means
the facility criteria and geographic criteria were likely
to match in terms of acceptability.
Larger installations reviewed had cooling ponds or
sources of cold water that would have served our needs.
But, cold outside air temperatures are sufficient to be
used for cooling with the installation of an air cooling
system.
Facility Representativeness: We ended up performing two
installations at Ft. Drum Army Base in Ft. Drum, NY. Initially, we
chose a helicopter hangar building that (Figures 10 and 11) met our
criteria since each of the five 28A-16 RTS Series Smith cast iron
boilers (Figure 11) is 122hp and they all share a single exhaust
meaning only three boilers need to be operating for use to reach our
maximum output.
Also, the variable nature of the heat flow will allow us to assess the
system under different operating conditions, something that would not have been possible at a
larger facility. In addition, the lack of a cold source required an air cooling system which
allowed us to demonstrate that technology as well. The main drawback was that utilization is
Figure 9. Building P-19710 at Ft. Drum
Figure 10. Close of Installation Area
Figure 11. The Smith Boilers

14
low since the boiler will only operate continuously during the colder months of the year, i.e.
September through May.
Additionally, during our initial work at Ft. Drum, we
were introduced to the company who managed a
biomass generator on site at the base. That facility had
originally been a co-gen facility for the base, but the
infrastructure for central heating did not work well. As
a result, that facility is now operated by RE Energy
burning biomass to make electricity which is mainly
sold to the base, but also on the grid. This location was
and ideal implementation of the ORCA system alone
with the potential for high utilization.
Demonstration Site Description: The project occurred
at the Ft. Drum US Army base in both Building P-19710 which is a hangar for Blackhawk and
Chinook helicopters and the biomass facility.
4.2 FACILITY/SITE CONDITIONS
Regulations: There were no specific regulations that adversely affected this project. There were
some site specific regulations regarding construction, but, they were not in any way burdensome.
Environmental Permits: There were no necessary environmental permits. Our system does not
create any exhaust and is designed to not change the exhaust stream coming from the boilers.
The only permits we needed related to installing a concrete slab to support our system.
Agreements: We did not need an interconnect agreement with National Grid, who is the utility
supplying Ft. Drum. Given the complexity of the Ft. Drum electrical grid, the fact that we would
not be pushing electricity outside of that grid, and the fact that we would most likely be
producing less than 25kW, National Grid told us that no interconnect was necessary. Similarly,
the biomass installation was within a grid that already had an interconnect agreement regarding
putting out electricity and we were just included in that existing agreement.
Figure 12. RE Energy Facility on Ft. Drum

15
5.0 TEST DESIGN
This demonstration project took waste heat energy and repurpose it into electricity. The question
we answered with this demonstration is as follows: can waste heat be repurposed and used in an
efficient method to make the costs of implementing such a system economical?
5.1 CONCEPTUAL TEST DESIGN
The investigator can change one major item, and that is the amount of heat energy lost to the
atmosphere through the stack. This heat is converted into electricity by the ORCA system,
thereby reducing the amount of heat exiting either the top of a stack or discarded into the
environment. The amount of heat removed is controllable by the parameters the ORCA system
runs, namely pump speed in the heating and cooling loops, refrigerant pump speed, and number
of fans operating in the air-cooler.
During the investigation test, a number of items are variable over a long period of time, but over
a short period (i.e. a few hours) should be constant enough to provide good before and after data.
The five boilers on-site delivered output heat to the stack. The amount of heat exhausted to the
stack is variable based on either the number of boilers running and the heat load required from
each boiler or the waste heat flow from burning biomass. A final variable that affects the
investigation is the ambient temperature experienced by the air cooling unit or the cooling water
supplied. Changes in ambient temperature affect the amount of cooling the air unit can perform,
which then affects the power capability and efficiency of the ORCA system.
The ORCA system decreased the electricity usage proportional to the amount of heat that it
extracts. Ancillary to this reduction in external electricity usage was a corresponding reduction
in carbon emissions that are avoided from traditional electricity generation methods.
Corresponding total energy costs are reduced proportional to the amount of electrical power
delivered by the ORCA unit.
Variable costs for running the ORCA system are the two pumps for the water glycol loops and
the number of fans operating in the air-cooler. The pumps and fans will be adjusted to provide
the most efficient ORCA system performance.
We hypothesized that the ORCA will fulfill the following metrics:
o Can produce an average of >20kW over an annual operating period
o Long term capital costs are < $2/W
o Long term installation costs are <$0.60 /W
o Long term maintenance costs are <$0.50 per hour of operation
To test this hypothesis, we installed an ORCA system alone at one site and with a condensing
economizer and air cooling unit. We monitored the power produced by the ORCA system. We
also took stack temperature readings before and after the ORCA system is running for a change
in heat exited to atmosphere.

16
5.2 BASELINE CHARACTERIZATION
Baseline characterization is essentially no system installed to convert heat to electricity. The
baseline is using the amount of electricity from the grid that equals the amount of electricity
produced by the system.
5.3 DESIGN AND LAYOUT OF SYSTEM COMPONENTS
A schematic of the planned installation at the hangar is as shown:
Figure 13. Installation Schematic
The major components are:
ORCA: The ORCA (shown in Figure 4) is a complete, modular, drop-in Organic Rankine
Cycle (ORC) system which can generate 25kW-60kW. The ORCA:
Condensing Stack Economizer: An off-shelf purchased component that is installed within
the stack and transfers the heat energy from the flue gas into a closed-loop glycol/water feed for
the ORCA system.
Air Cooler: An off-shelf purchased component that uses ambient cold air to passively
cool warm water.
For the RE Energy installation, the installation only covered the ORCA system.
5.4 OPERATIONAL TESTING
The ORCA system has self-contained measurement devices and data collection capability.
Relevant temperatures, pressures, and electrical output parameters are monitored and recorded.
The ORCA provides real-time output of all this data as well as capturing data periodically for
local or remote download and analysis. Once powered on, the ORCA is constantly collecting
ORCA

17
this data. Therefore, no additional measurements need to be taken to record data from the ORCA
system.
The only measurements that needed to be taken manually were the stack temperature, and the
facility energy consumption.
5.5 SAMPLING PROTOCOL
The ORCA monitors and collects over 20 measurements twice a second. The key parameters for
determining the investigation’s success are:
o Heat Loop inlet and outlet temperatures, and flow rate
o Cold Loop inlet and outlet temperatures and flow rate
o Power Output
This data is stored within the machine and can be downloaded remotely at any time for backup
and analysis purposes. During the initial stages of the investigation, it will be downloaded at
least twice a day. Up to 3 weeks of data can be stored on the machine before old data will be
overwritten with new data.
All of the ORCA on-board measurement devices are either factory calibrated by the
manufacturer or calibrated by Ener-G-Rotors during Ener-G-Rotors factory test after assembly.
Once the ORCA is located on-site, checks of temperature sensors and pressure gages are done
while the system is under vacuum. This ensures all sensors read the same value relative to each
other and no off-calibration has occurred.
For analysis of the ORCA data, measurements are collected and averaged over time. Typically, a
minimum of 60 data points (30 seconds) are used.
5.6 SAMPLING RESULTS
The operations of each installation were very different. The hangar turned out to be an imperfect
location because of the unusual boiler configuration and initial boiler control protocol, but
provided valuable information about installation costs and efforts. The biomass installation
provided better performance data, but was almost a best case installation.
We will review performance data from each site first and then cost data.
Performance results
For the hangar, because of the limited heat available from the stack there was limited run time.
This precluded any steady state running that allows for more reliable efficiency results. The
ORCA system draws more power and generates slightly less than optimal power prior to steady
state. With the limited available heat power (181 kW), the ORCA generated 9.0 kW gross of
electricity. The limited heat was the result of two issues. First, we had expected that when 2 or 3
boilers were running, it would be the equivalent of a 350HP boiler and produce meaningful data.
However, with five separate boilers, the exhaust stack was sized for 5 boilers running (even
though the hangar did not have the gas supply to run all 5 at the same time). That meant that
with two boilers running, they were exhausting into a stack 2.5 times larger than necessary. This
diluted the heat output from those two boilers making heat capture more difficult.
Secondly, the operating protocol was for boilers to cycle on every 15 minutes as can be seen in
Figure 14. With all boilers cycling on every 15 minutes a continuous heat flow was impossible,
while also being incredibly inefficient for the overall heating need. Even after a change that left

18
a single boiler running at all times, the flow was still not close to continuous. Efforts to correct
the protocol were made, but did not create a good operating environment.
Figure 14. Heat Flows and Run Cycle of Boilers
The ORCA system power usage at this level was 1.85 kW for a net result of 7.12 kW. The air
cooler is estimated to use only 40% (181 / 453 kW) of its available cooling capacity for a
constant power usage of 3.49 hp or 2.62 kW. This results in a 4.49 kW net energy production by
the ORCA.
Regarding air cooling at the Ft. Drum unit, it should be noted that because of the short run-time,
the air cooler did not operate at the same time as the ORCA. There is a delay before the heat
reaches and turns on the air cooler at the predefined levels. The energy consumption is an
estimate of the ratio of heat dissipation required vs. the total available heat dissipation against the
total power consumption capable.
Parasitic losses from the other systems were measured. For example, the economizer needed a
pump to circulate a water/glycol mix through the stack and back to the ORCA. That pump used
about 2.25kW to perform that work. In an overall system design, that parasitic load needs to be
considered. In addition, the parasitic load of the air cooler was estimated at 4.85kW. That
19
number may be higher depending upon the outside temperature and cooling conditions, but
experimental testing was not feasible.
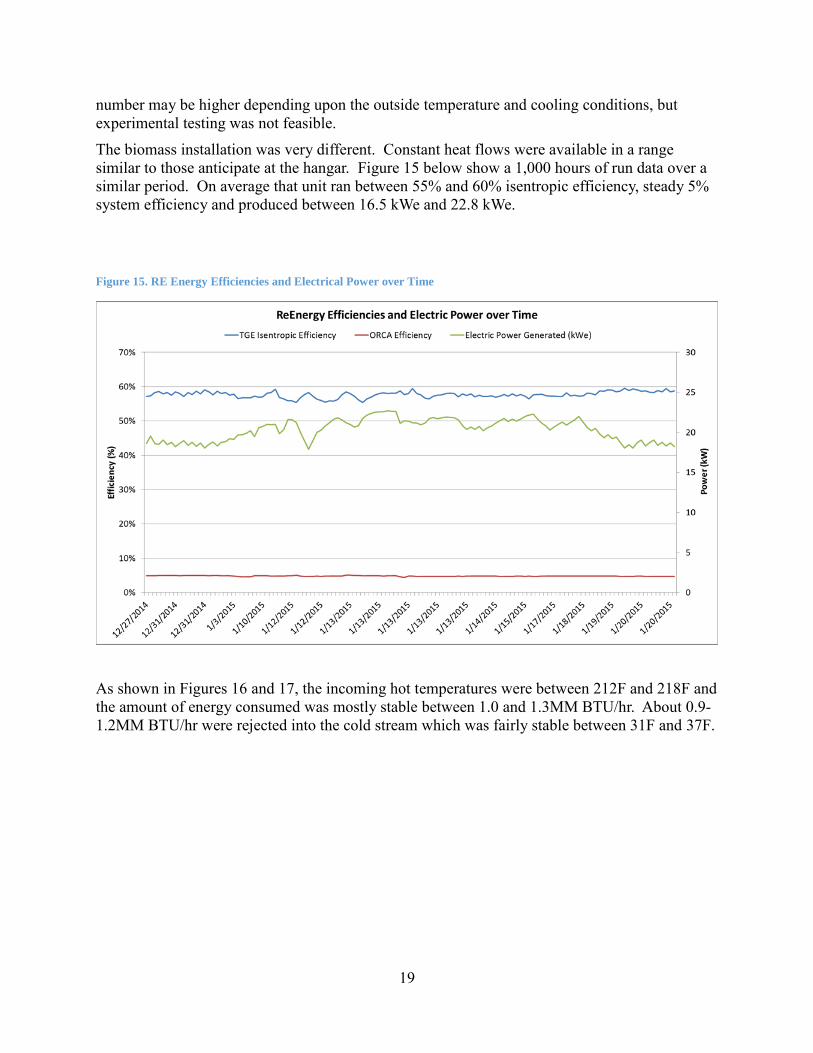
The biomass installation was very different. Constant heat flows were available in a range
similar to those anticipate at the hangar. Figure 15 below show a 1,000 hours of run data over a
similar period. On average that unit ran between 55% and 60% isentropic efficiency, steady 5%
system efficiency and produced between 16.5 kWe and 22.8 kWe.
Figure 15. RE Energy Efficiencies and Electrical Power over Time
As shown in Figures 16 and 17, the incoming hot temperatures were between 212F and 218F and
the amount of energy consumed was mostly stable between 1.0 and 1.3MM BTU/hr. About 0.9-
1.2MM BTU/hr were rejected into the cold stream which was fairly stable between 31F and 37F.

20
Figure 16. RE Energy Heat Fluctuations
Figure 17. RE Energy Cool Side Fluctuations

21
Cost Results
Cost Results - Equipment
Because the fuel is free, the initial capital and installation costs are critical to the overall
economic performance of the project. The capital equipment costs of the project include the
ORCA system, condensing economizer, and air cooling unit as follows:
$105,500 for the ORCA system as determined by the Bill of Materials when both systems
were built
$45,240 for a condensing economizer purchased from Condex
$24,873 for an air cooler unit (1,546,412 BTU/hr capacity) purchased from Trane
Cost Results - Installation
Biomass - Installation costs were very different for the two installations. The biomass
installation was paid for by RE Energy, so exact costs cannot be determined. That installation
however had many features that reduced the cost including: proximity to the hot and cold sources
to reduce piping needs, as well as an electrical box, having a concrete floor to sit on, and not
requiring additional systems (air cooler and condensing economizer) to operate. We estimate
that RE Energy spent less than $15,000 on the installation.
The hangar - For the hangar installation, the total installation costs were equivalent to the
capital costs, or $175,814. In order to assist in the discussion to follow and serve as a template
for other possible installations, we tried to break down these costs into two categories: system
specific costs and site specific costs. System specific costs refer to installation costs that will be
required to install any of the three major systems in any installation (or the cost to install under
the best possible, hence cheapest, circumstances). Site specific costs are costs specific to the
installation that may not translate to other sites. For example, because of the position of the gas
line and the regulation that concrete pads could not be placed over gas lines (in case they need to
be dug up), we needed to dig up and move the gas line next to the hangar. Another example is
the need to bury the electrical lines from the installation to the electrical room where the
connections were made. Additional structure was also needed to support the exhaust stack with
the addition of the weight of the economizer. We also spent development, capital and installation
dollars on an expansion tank and other plumbing to accommodate refrigerant when the system
needed to be shut down quickly and stay dormant – these expenditures turned out to be
unnecessary, but were overprotective to ensure that was not interruption in boiler use.
The figure below shows the item and cost breakdown and allocation effort that we performed.
The electrical and piping were more expensive for the economizer and air cooler because in
addition to those units a pump and valves needs to be installed for their operation.

22
Figure 18. Cost Breakdown for Systems and Installation
Trying to parse all those costs into different buckets results in the following:
$15,682 for installing the ORCA system
$34,993 for installing the condensing economizer
$31,121 for installing the air cooler
$94,018 for other site specific costs
In the analysis later, we will allocate some of those site specific costs to the different units as
costs for connecting the units to each other.
Other costs
Because of the lack of steady run, no maintenance costs could be determined. However, we
expect the ORCA to require the same maintenance as industrial chillers. This equates to about
$2,311 per year. [9]
There was not enough run time to make an assessment on equipment degradation. The ORCA is
built to last 20 years, and the other components in the project are typical industrial components
with similar life expectations provided proper preventative maintenance is performed.
Site specific
Item ORCA Economizer Air cooler
Engineering Drawings 3,942 986 986 986 986
Structural engineering costs 1,875 469 469 469 469
Sensors 1,848 462 462 462 462
Electric 13,520 2,104 4,208 4,208 3,000
Piping 62,077 9,815 19,631 19,631 13,000
Placing economizer 7,392 7,392
Placing Condensing Unit 3,520 3,520
Commissioning 7,384 1,846 1,846 1,846 1,846
Lifts 5,620 5,620
Chimney modifications 7,600 7,600
Support structure for economizer 12,620 12,620
Unnecessary backup storage 17,000 17,000
Underground electrical conduit 4,500 4,500
Gas line relocation 4,600 4,600
Concrete slab 11,778 11,778
Miscellaneous site related 8,008 8,008
Draft testing prelim. 1,265 1,265
Draft testing final 1,265 1,265
TOTAL $175,814 $15,682 $34,993 $31,121 $94,018
System Specific

23
6.0 PERFORMANCE ASSESSMENT
6.1 PERFORMANCE – OUTPUT
The output defines the benefits of the system and is a key determinant of the economics. The
performance target was 80% of calculated output given the actual temperature and flow
conditions. Another performance target was an average output of ~20kW.
• Results: The performance was >80% of calculated for the actual temperature and flow
conditions and output averaged ~20kW.
• Discussion: The heat source produced on the low end of original expectations for BTUs/hr, but
we were able to achieve the output goal at the biomass site. About one million BTUs were
passed through the system to produce that 20kW of electricity.
It should also be noted that the ORCA was built to be able to output as much as 60kW at peak,
but with a nominal nameplate capacity of 50kW. That means that at 20kW the ORCA is not fully
utilized which will affect the economics in the model later.
6.2 PERFORMANCE – SYSTEM EFFICIENCY
The system efficiency determines how much electricity can be generated from a particular heat
source. It is an indirect measure of economics of the system. All organic Rankine cycles have
distressing low system efficiencies. For a state of the art electricity generating facility, numbers
like 50% to 60% efficiency may be possible to obtain. The organic Rankine cycle is governed by
the Carnot efficiency calculation which uses the hot source and cold source temperatures (in
Kelvin) to calculate the optimal efficiency possible. This makes the calculation highly
dependent upon the hot source temperature. Good organic Rankine cycles get between 5% and
15% efficiency. While this seems low, in comparison with other electricity generation cycles,
using waste heat means the fuel is free make them comparable economically to other forms of
electricity generation.
Our goals were 40% of the maximum Carnot efficiency and 6% system efficiency. A critical
component of Carnot and system efficiency is that temperature of the heat source. The hotter the
heat source, the greater possible system efficiency. The original plan was to have a 235F heat
source which would provide 6% efficiency. We only had about 215F on the heat source, so the
efficiency was lower. The change in operating conditions also affected our ability to achieve a
high percentage of Carnot, because small efficiency losses are magnified under challenging
operating conditions.
While the performance metrics are interesting, the real evaluation is the output in terms of the
economic model.
6.3 COST – COMPONENTS
The two fixed costs, system and installation, and one ongoing cost, maintenance are key metrics
in determining the economics. We have accumulated data on actual costs and have made some
forecasts regarding long term capital costs for the ORCA system. We did not generate enough
data to assess actual maintenance costs.

24
Those forecasts are necessary because the goals were defined in the long term with the
expectation that costs for this project might not represent the expected future cost. For example,
a goal was long term capital costs in <$2/W for the ORCA system. Current production level do
not allow achievement of many economies of scale. It was previously mentioned that the bill of
materials for the ORCAs used in the project was $105,500. At <$2/W, that means a sales price
of less than $100,000 for a 50kW system. Given our detailed bill of material forecast (which is
proprietary) and the general engineering rule of thumb that a prototype (our original bill of
materials for the first prototype was $150,000) is three to five times the costs of production, we
seem to be able to achieve the goal of selling with a reasonable margin at $2/W.
The long term goal for installation costs was <$0.60/W. At the biomass site, the costs was on the
order of $0.15/W, although the installation costs for all three systems at the hangar was a total of
$1.0/W, though that number drops to $0.42/W if the more expensive site specific costs are
factored out.
Because of the lack of steady run, no maintenance costs could be determined. However, we
expect the ORCA to require the same maintenance as industrial chillers. This equates to about
$2,311 per year, or about $0.30 per hour of operation. [9]
6.4 CARBON BENEFIT
Since no additional fuel will be used to generate electricity, in addition to other economic
benefits, this installation will save carbon emissions that would otherwise have been necessary to
create the comparable amount of electricity.
The goal for this project, when we expect to run for most of a year, was >100 tons of carbon
emissions avoided annually. The cumulative output of the systems was not sufficient to reduce
carbon emissions by 100 tons, although the metric for carbon saved for each kilowatt generated
remains the same. The fact that the criteria was not achieved does not represent a failing of the
concept, just a diminished testing schedule based on a variety of factors. A larger and more
continuous operation would have achieved the goal.
6.5 RELIABILITY
Our goal for reliability was > 85% uptime when heat and cold flows in operational range. With a
shortened testing period, reliability was not able to be measured with any accuracy.
Qualitatively, the systems were running when the conditions were in operational range.
6.6 NON-DISRUPTIVE
There was not disruptive impact from either installation worthy of mention. The system was
designed to be non-disruptive and these installations demonstrated that fact. Additionally, the
operation of the system at the hangar revealed inefficient boiler firing protocol which was
subsequently fixed.

25
7.0 COST ASSESSMENT
7.1 COST MODEL
Waste heat recovery systems have a very simple cost model. Fixed costs to implement the system,
both capital costs for system acquisition and installation costs, dominate the expense line since
there is not ongoing fuel or other operational costs. The electrical output and its value represents
the benefits.
Hardware capital costs
There are three components to the hardware capital costs, the ORCA system, an economizer and
an air cooler. Of the three, only the ORCA is required to produce electricity.
Table 2. Cost Model for an Energy Efficiency Technology
Cost Element Data Tracked During the
Demonstration Estimated Costs
Hardware capital
costs
$105,500 for the
ORCA
$45,240 for a
condensing
economizer purchased
from Condex
$24,873 for an air
cooler unit from Trane
$100,000 for the
ORCA
$45,000 for a
condensing
economizer
$25,000 for an air
cooler
Installation costs
$12,487 for installing
the ORCA system
$43,240 for installing
the condensing
economizer
$17,269 for installing
the air cooler
$102,138 for other site
specific costs
$15,000 for installing
the ORCA system
$45,000 for installing
the condensing
economizer
$20,000 for installing
the air cooler
$?? Other site
specific costs
Consumables None $0
Facility operational
costs Not relevant $0
Maintenance Not available $2,300/year
Hardware lifetime Not available 20 years
Operator training None $0

26
ORCA – The ORCA is the fully functional system that turns a heat differential into electrical
power and is required for any implementation. The costs of this system were recorded as the bill
of materials as the system was assembled, and the actual costs shown include all components. An
equally important figure is the forecast for the sales price of the ORCA when production is on a
higher volume commercial basis. That forecast of a $100,000 sales price is based on a detailed
analysis of anticipated bill of materials costs when manufacturing and purchasing gains some
economies of scale. That forecast is also consistent with the general engineering rule of thumb
that a prototype (our original bill of materials for the first prototype was $150,000) is three to five
times the costs of production. The resulting cost estimate from either analysis will provide Ener-
G-Rotors with a sufficient margin to profitably sell ORCAs for $100,000 or $2/W for nameplate
capacity. That $2/W figure should be kept in mind for larger scale implementations as a reasonable
heuristic for cost estimate. Although some economies of scale may be recognized with a larger
system, $2/W for a waste heat recovery system is still very economical.
Economizer – A condensing economizer is only needed if the hot source that will supply the
ORCA is a gas, typically exhaust from combustion. (The cost of the economizer includes the
material necessary to withstand chemical attack from combustion residuals – air exchange would
be cheaper) The invoiced cost for the economizer was $45,240. That device was sufficient to
channel enough heat to the ORCA to reach nameplate capacity. Our understanding is that
economies of scale are reasonably good for economizers, twice as a large a system would not cost
twice as much.
Air cooler – An air cooling unit is only necessary if there is no cold water source for cold side of
the ORCA system. The actual invoiced cost was $24,873. This unit might be undersized to allow
an ORCA to reach 50kW of capacity, but we did not do enough testing to determine that. Other
options for other air cooling approaches, including evaporative cooling, could change the
economic equation. For our cost model however, we assumed a cost of $25,000 for an air cooling
unit. We believe economies of scale are present as air cooling units increase in size, but we don’t
have an estimate for those benefits.
Installation costs
Likewise, there are three
components to the installation
costs, the ORCA system, an
economizer and an air cooler.
ORCA – the ORCA only requires
plumbing to four outlets (2 hot and 2 cold) and a single wire to an electrical box. The installation
costs for the biomass site were an estimate as RE Energy considered the installation so simple
that they paid for it themselves and did not provide us with a breakdown on costs. We estimate it
still cost on the order of $5,000 to $15,000. The details on installing the ORCA were reviewed
earlier and determined to be $15,682. We are using an estimate of $15,000 for our model. Scale
here does not matter as the size of the plumbing is the same and the electrical is the same
regardless of size. Likewise, multiple units would not bring any economies of scale.
Economizer – the economizer itself needs to be inserted into stack and plumb to and from
ORCA with a pump in the loop to keep circulation. A rule of thumb we were given by the
economizer vendor was that installation is at least 60% of cost of unit. Although a number of
Unit cost Installation Unit cost Installation
ORCA 105,500 15,682 100,000 15,000
Economizer 45,240 34,993 45,000 30,000
Air cooler 24,873 31,121 25,000 30,000
Site specific installation 94,018
TOTAL $175,613 $175,814 $170,000 $75,000
Actual ForecastFigure 19. Cost Inputs for Model

27
site specific requirements added to the cost, namely the need for structural support of the weight
of the unit, as well as lifts for the difficult placement, we are estimating $30,000 for the generic
cost of economizer installation.
Air cooler – the air cooler needs to be placed near the ORCA system and then connected to the
ORCA with a pump in the circuit somewhere to keep the flow between the two systems. The
only data point we have for that system is the $31,121 estimated in installation expense for the
hangar installation. As a result, we are estimating a $30,000 installation expense for an air
cooler. We think there will be economies of scale on that expense for a larger air cooling system,
but probably not much savings within the 30kW to 50kW sized systems we are estimating.
Other site specific – clearly there were a number of additional installation expenses that were,
not unique to this site, but specific to this site. By that we mean, other sites may have the
identical issues, but other sites may have other issues or no issues at all. Since there is no real
average, we have not tried to model other site specific costs. That issue will dampen economic
returns, but need to be addressed site by site.
Maintenance costs
Because of the lack of steady run, no maintenance costs could be determined. However, we
expect the ORCA to require the same maintenance as industrial chillers. This equates to about
$2,311 per year. [9]
There will be additional expenses for the other two systems as necessary. Likely the economizer
is less expensive due to fewer moving parts and the air cooler is equally as expensive.
7.2 COST DRIVERS
There are three real variables that have a disproportionate effect on the economics of any given
installation: (1) quality of heat source, (2) availability of hot and cold source, (3) utilization
expectations, and (4) site specific installation costs.
Heat Source Quality – The quality of the heat source can be defined in several ways. First and
foremost, there needs to be enough heat to generate 20kW to 60kW at a minimum. That
calculation is relatively simple, but can get more complicated in practice. Secondary
considerations include consistency of the heat flow. Brief staccato like bursts of heat, such as
were evident at the hangar installation, make steady state operation difficult. Additionally, while
three boilers at the hangar were producing enough heat to run our system, we had difficulty
extracting it because of the exhaust piping layout which was oversized for less than five boilers
running simultaneously.
Source availability – By availability, we mean whether the hot and cold sources are in a
condition that can be readily input into an ORCA. This variable affects the cost of installation by
defining the number of ancillary systems necessary. If the hot source is exhaust gas, an
economizer is necessary. If the cold source is cold air, an air cooler is necessary. Preferable, the
hot source is hot water or oil, and the cold source is cold water.

28
Utilization – Overall utilization is a critical factor in determining economics. Given most of the
cost of the system is fixed, rather than variable if fuel costs were involved, the more the system is
utilized the more economical it will be. Each installation has a potentially different value
proposition, so there is not set utilization rate. Utilization and other economics parameters must
be analyzed on a case by case basis.
Site specific installation – Different sites will have different requirements regarding installation.
At another site, Ener-G-Rotors installed a 5kW device at, it was necessary to dig up the parking
lot to lay down a cold water source to reach the device. That one installation requirement was
almost twice the cost of our system. However, sites like the biomass site have minimal
requirements except for the plumbing and electrical into our system.
Discussion
The two installations showed the variation in possible fixed costs. The biomass site was most
economical with a consistent year round heat and cold source in hot water and with no difficult
installation needs. The hangar was cold weather dependent heat and cold source both in gaseous
form with several specific and expensive installation requirements.
Most installations will probably be somewhere in between. It was previously note that a 350hp
boiler would be sufficient to produce enough hot exhaust gas to power a 30+kW device. There
are 381 such boiler on Army bases in North America. These each need to be evaluated for the
quality of their heat source.
In our search for a new location for the demonstration, we encounter another opportunity both at
West Point and New London, CT. Larger boilers use a de-aeration tank (DA tank) where makeup
water is heated and the oxygen is removed. Steam was used to heat the water lowering the
efficiency of the boilers. Our system would fit nicely into that process by using the hot water
coming out of the DA tank as our hot source and the makeup water as the cold source. The
efficiency would be remarkably high since we would be heating up the makeup water and
producing electricity, so no energy was lost. Since the boilers were run both for heating and
cooling needs, utilization would also be high. An indoor installation where a concrete pad was
not necessary was also a bonus. In the case of New London, demand charges were high because
the submarine fleet would occasionally dock with each submarine requiring an additional
megawatt of electricity to run while at dock. Essentially, New London was paying year round
for that 5-10MW spike in electricity demand once or twice a year – any way to lower the demand
charge was a money saver.
Beyond boilers, any CHP installation would also be a good fit. Our system can take advantage
of the need to cool jacket water, which provides a year round source of heat in the form of hot
water, and the possibility of piggy backing on air cooling systems that are already in place.

29
7.3 COST ANALYSIS AND COMPARISON
With the analysis of the cost structure and the estimated costs of each system and installation
expense of each system we can create a model for different installations. The model compares
the expense of buying electricity on the open market versus the installation of a heat to electricity
system. We will model a range of producing 30kW, 40kW and 50kW and determine the
economics of using different combinations of systems with only the ORCA system being used in
every combination as follows: ORCA only, ORCA and economizer, ORCA and air cooler, all
three systems.
For a variety of reasons, focusing on a given output, i.e. 30kW, 40kW and 50kW, was easier to
explain. However, we had already determined that 1.0MM BTU would produce about 20kW out
of an ORCA system. Doubling the heat flow, will double the output. However, adding other
systems, i.e. the economizer and the air cooler, will add parasitic load to the overall system
because of the need to run pumps and fans. Therefore, the heat input should be considered as
follows:
Figure 20. Heat Versus Power
There are two main elements to the model: (1) the cost of the electricity purchases that were
avoided, and (2) cost of the system both initial and ongoing.
Electricity purchases - For the cost of the electricity, we assume our standard $0.10/kWh. While
costs vary throughout the US and the world, we have find general agreement that modeling using
that figure is acceptable to most representatives of commercial and industrial organizations we
have spoken with and is in line with average costs reported to the US Energy Information
Administration for most geographic regions. [10] Often local utilities will contribute to demand
reduction even in regions with low electricity cost. And, for the DoD, some installations have
very high electricity costs.
The other variable in electricity cost is utilization. For this iteration of the model, we will
assume 90% utilization which is in line with other base load power generation sources (but,
closest to geothermal because of the lack of combustion and the maintenance issues involved
with combustion). [11] Clearly, a boiler that is only used for winter heating needs will have a
lower utilization. Given the complexity of the model, we will start assuming year round usage
and then discuss different utilization rates.
30kW 40kW 50kW
ORCA 1.50 2.00 2.50
ORCA and economizer 1.61 2.11 2.61
ORCA and air cooler 1.74 2.24 2.74
All systems 1.86 2.36 2.86
MM BTU Needed to Power Different Systems and Sizes

30
System costs – the costs we will use for our model
were previously discussed and are shown in the
figure on the right. Maintenance costs are
modeled as $2,311 for the ORCA system, the
same for the air cooler and half that amount for
the economizer given the nature of those systems.
Analysis
Using these assumptions, we used the BLCC 5.3 application to model the economics and
determine the comparative economics. The resulting Adjusted Internal Rate of Return (AIRR)
for each scenario are shown in the figure below:
Figure 22. AIRR for Different Configurations and Sizes
Industrial electricity producers generally consider a project that has under a seven-year payback
given their average return in invested capital of between 4%-8% with a 6% average. [12] The
simple paybacks ranged from four years to thirteen, but generally anything above a 7.5% AIRR
had better than a seven-year payback.
Other lessons to note include the need for air cooling or an economizer seem to affect the
economics in similar ways, the ORCA system alone seems to meet the criteria for power
generation return across all size ranges and even smaller than 30kW, and incorporating all system
will only be economically feasible at the largest system size.
0
2
4
6
8
10
12
14
30kW 40kW 50kW
AIR
R (
%)
System Output
AIRR For Different Configurations and Sizes
ORCA ORCA+economizer ORCA+aircooler All systems
Unit cost Installation TOTAL
ORCA 100,000 15,000 115,000
Economizer 45,000 30,000 75,000
Air cooler 25,000 30,000 55,000
TOTAL $170,000 $75,000 $245,000
Figure 21. System Costs

31
8.0 IMPLENTATION ISSUES
Ener-G-Rotors was able to utilize this project installation to gain a vast amount of knowledge
about customer installations and how the ORCA system could work within the boundaries of that
installation. This was the first installation for Ener-G-Rotors that utilized each of the following
components:
1. Economizing off of an exhaust stack
2. Air Cooling the ORCA
3. Outside Installation
4. Site preparation – In this case, digging and pouring a slab for installation
5. Provisions for excess hot glycol temperatures and pressures with a drain-back
system
6. Different manufacturers for Variable Frequency Drives
7. Lack of direct internet communication back to Ener-G-Rotors factory
Below are some detailed lessons for each of the above items:
1. Economizer
a. Identifying and managing the stack structure requirements because of the
economizer size and weight
b. Understanding the stack draft and temperatures.
i. The very first test must be temperature and airflow testing. These cannot
be ignored. They are necessary to know the amount of heat available. And it is
best if they can be logged for at least 48 hours during typical run-time for the
system. Unfortunately, they are expensive tests to run (~$4,000) and not readily
available from all contractors. However, it is likely that every geographic area
has at least one consulting firms that can perform those tests.
ii. We brought in an expert to measure the draft because of concerns for the
effect of the economizer. While in hindsight this is not necessarily warranted. If
the economizer supplier had provided pressure drop over a range of conditions
and not just the maximum, this could have resolved the issue without testing. But,
draft testing is a good idea and should be done when a site is identified. In the
case of Ft. Drum, this test is only good during the beginning or end of the heating
season when the air temperature is just borderline of the heating system being
required.
iii. Furthermore, there are damper plates on the back of some boilers that
affect how much flue gas is allowed into the stack. This can have a great effect
both on boiler efficiency and any economizer capability. Flow rate and
temperature measurements are used to determine the best location for this damper.

32
iv. Barometric dampers are on some systems to aid draft by bringing in
ambient air to the stack just after the boilers. They were found to have a profound
effect on the stack temperature. Attention should be paid to these dampers on any
future installations when since they can affect the available heat. Adjustments
should be made to maintain minimum draft while not unnecessarily lowering
stack temperature.
c. Even though there is a lack of heat in the Ft. Drum stack, we did learn that we can
transfer that heat and utilize it to run the ORCA. We also recognized that processes may
be cyclical and we should move to have provisions for auto-start of the ORCA to
maximize runtime.
d. Having temperature probes in the stack was a last-minute decision and turned out
to be crucial to understand the situation.
e. It is better to have as much stack after the economizer as possible to aid in the
draft of the system. This also prevents stack temperature loss prior to the economizer that
diminishes the available heat.
f. If the space and resources are available for the project, using an insulated holding
tank between the economizer and ORCA would steady the transient nature of the
economizer flow. Some heat would be lost, but allowing the ORCA to run steady is better
for efficiencies of the ORCA. It would be recommended to get assistance from a Process
Engineer to aid with the sizing of the tank.
2. Air Cooler
a. The air cooler could have been mounted on top of the container to decrease the
footprint of the overall installation.
b. This manufacturer uses a surface mount temperature probe. This is unreliable and
causes a delay for controlling the air cooler. Future installations should require a wetted
temperature probe.
c. The controls did not allow for the ORCA to turn on and off the air cooler. This
would be a requirement for future installations. If the ORCA is not running and is not in
an automatic start-up mode, we would not want to waste energy cooling the fluid.
d. The air cooler came disassembled without warning from the manufacturer. The
contractor was not prepared to handle the equipment in this state.
e. The ORCA can run on an air cooler, and the air cooler did a great job of running.
It was so quiet; we could not hear it running at times.
f. If the space and resources are available, using a holding tank (uninsulated,
depending on location) between the Air Cooler and ORCA will reduce the transient
nature of the air cooling process. The steadier the temperature changes to the ORCA, the
better the ORCA is at maximizing the energy available. It would be recommended to get
assistance from a Process Engineer to aid with the sizing.
3. Outside Installation

33
a. The outside installation required the use of a container to place the ORCA into to
protect it from the elements. The container presented a number of lessons learned from
space requirements to challenges to obtaining a proper container.
b. Delivering and loading into the container was very simple and would be done
again.
c. Heating the container during the very cold weather was necessary for safety of the
workers preparing the ORCA installation and the Ener-G-Rotors employees performing
the commissioning.
d. Providing for access to an outside installation is important when winter weather is
involved, as snow and ice removal become a large factor at Ft. Drum.
e. All provisions must be thought of ahead of time from auxiliary 120V power to
internet access from within the container.
f. A security camera was installed inside the container.
4. Site Preparation
Because a concrete slab was required, we had to move a gas line away from the installation
location. This required additional approvals and a digging permit. Coordination of these efforts
was handled by our Ft. Drum liaison, but the effort and time was not trivial. This needs to be
accounted for in any schedule.
5. Glycol boiling provisions
a. Many months were spent to determine a course of action. In retrospect two of the
solutions should be done.
i. First, is the drain-back system that was installed to allow the glycol to go
into a holding tank if the pressure or temperature reached a maximum set point
(boiling) in the economizer. This would happen only if the ORCA was not
running and the temperature in the stack was too high.
ii. Second is a manual valve between the hot and cold loop that would allow
someone on-site to move hot fluid into the air cooler for cooling. This would be
advantageous during testing and commissioning or during service.
b. The drain-back system did not arrive from the supplier properly, and was
subsequently damaged by the supplier’s commissioning engineer. Fortunately, the fluid
never reaches a temperature where the drain-back is required. In addition, the contractor
didn’t pipe the system correctly, twice. As a result is has never been used by the ORCA’s
automatic controls or even tested manually.
6. Different VFD Manufacturer
The VFD’s supplied utilized a large disconnect box. This required placement in a very
inconvenient location in the container for clearance requirements. We would recommend
avoiding the GE devices used and only recommend ABB devices. But more so, be sure that when
VFD’s are specified, they don’t have disconnect boxes. They are redundant when the VFD are
wired into a nearby breaker panel.
7. Lack of wired internet connection
34
a. The location was considered remote, and as a result no internet communication
was available. Both cable and hardwire connections were considered. The result was to
hire a firm to install a Cellular 3G/4G modem. This allowed the ORCA to be present on
the internet for remote access.
b. In hindsight, it is imperative the modem contain features for VPN access. Tasks
for testing and maintenance of the PLC and Touchscreen could not be performed because
of the lack of VPN access.
c. For better security, though more costly, install tunneling devices that place the
ORCA onto the Ener-G-Rotors factory network. This eliminates the need for VPN and
greatly simplifies the communications to the unit.

35
9.0 REFERENCES
[1] Energy and Sustainability Priorities and Opportunities, Hon. Katherine Hammack, Assistant
Secretary of the Army, IE&E, U.S. Army Journal of Installation Management, Spring 2011, pg 1
[2] http://www.militaryinstallations.dod.mil
[3] Mathias, James A., et. al., “Experimental Testing of Gerotor and Scroll Expanders Used in,
and Energetic and Exergetic Modeling of, an Organic Rankine Cycle”, Journal of Energy
Resources Technology, March 2009, Vol. 131
[4] “The Chena Hot Springs 400kW Geothermal Power Plant: Experience Gained During the
First Year of Operation”, Prepared for the SMU Geothermal Energy Utilization Associated with
Oil & Gas Development, June 12-13th, 2007 in support of presentation by Bernie Karl
[5] Marcuccilli, Frédéric and Zouaghi, Samuel, “Radial Inflow Turbines for Kalina and Organic
Rankine Cycles”, Proceedings European Geothermal Congress 2007, Unterhaching, Germany,
30 May-1 June 2007
[6] “Kalina & Organic Rankine Cycles: How to Choose the Best Expansion Turbine?”, Dr.
Frederic Marcuccilli, Senior Process Engineer, Electricity Generation from Enhanced
Geothermal Systems, Strasbourg, September, 2006
[7] “Technology Characterization: Steam Turbines”, Environmental Protection Agency Climate
Protection Partnership Division, Prepared by Energy Nexus Group, Arlington, Virginia , March
2002
[8] C. Invernizzi, P. Iora, and P. Silva, “Bottoming micro-Rankine cycles for micro-gas turbines,”
Appl. Therm. Eng. 27, 100 (2007)
[9] http://www.alabamapower.com/business/save-money-energy/energy-know-how/compare-
costs/chiller-maintenance.asp
[10] https://www.eia.gov/electricity/monthly/epm_table_grapher.cfm?t=epmt_5_6_a
[11] https://www.eia.gov/forecasts/aeo/electricity_generation.cfm
[12] The Future of Electricity, Attracting investment to build tomorrow’s electricity sector. World
Economic Forum. January 2015
http://www3.weforum.org/docs/WEFUSA_FutureOfElectricity_Report2015.pdf

36
APPENDICES
Appendix A: Points of Contact
Point of
Contact
Organization Phone & E-mail
Role in Project
Ted Eveleth Ener-G-Rotors 518-372-2608 x103
Principal
investigator
Michael Newell Ener-G-Rotors 518-372-2608 x102
Project
management
Scott Gold Ener-G-Rotors 518-372-2608
Project engineer
Steven Rowley Ft. Drum 315-772-5433
Site representative
Additional Appendices
No additional appendices