Embed Size (px)
Citation preview

Final Report CRC Project #40
Formwork pressures for Self Consolidating Concrete.
N.J. Gardner October 7, 2010
Effectively this project has been on hold since 2008. The project depended upon access to
construction projects of the co-investigators (Ellis-Don Construction) using Self Consolidating
Concrete. Unfortunately the current construction situation has not resulted in any suitable
projects.
The results to date were summarized in a presentation at Los Angeles (spring 2008). A
pdf of the presentation, titled LosAngeles4, is attached. All figures in this report are taken from
the Los Angeles presentation.
The major, labor intensive and expensive part of the project involved measuring form
pressures at 4 sites operated by Ellis-Don Construction in Charleston, London Ontario,
Peterborough Ontario and Toronto. Obviously industry is most interested in the maximum form
pressures for formwork design; which are determined by the rate of concrete placement versus
the rate/development of concrete stiffness/strength. Unfortunately the term ―Self Consolidating
Concrete‖ is a non-unique, generic description. Indentifying and characterizing the
flow/stiffening properties of the concrete relevant to the magnitude of the lateral pressure
envelope would be very useful. Material characterization evolved over the course of the project.
Mix design and qualification should be done prior to start of construction. However on-site
quality control is required to ensure mix compliance and consistency.
Preconstruction mix testing is usually limited to ensuring that specified strength and
slump flow can be achieved using the available materials and admixtures. Slump flow loss and
rheometer tests can be done conveniently, in the luxury of a laboratory environment, at this time.
Lessons learned
Discontinuous placement, by bucket or programmed interruptions of pumping, allows the
concrete to gain shear strength, reducing the maximum form pressures. For formwork pressure
purposes, the ideal admixture combination would produce a concrete that flows under agitation
and immediately stiffens when agitation ceases. The SCC mixture design has to be done with
care and admixtures can not be changed or substituted without diligent consideration. In addition
changes to the water content of the aggregates can significantly affect the stability of the mixture
and strict control for moisture compensation needs to be instituted at the ready-mix plant.
Testing for production, mixture selection/qualification and formwork selection must be done in
concert and concrete control parameters must be established to ensure compliance.
Rheometer Studies
Flow behaviors are measured by devices called a rheometers. Measurements can be
taken using linear movement (falling ball),or axisymetric, planetary or annular rotational
movement.
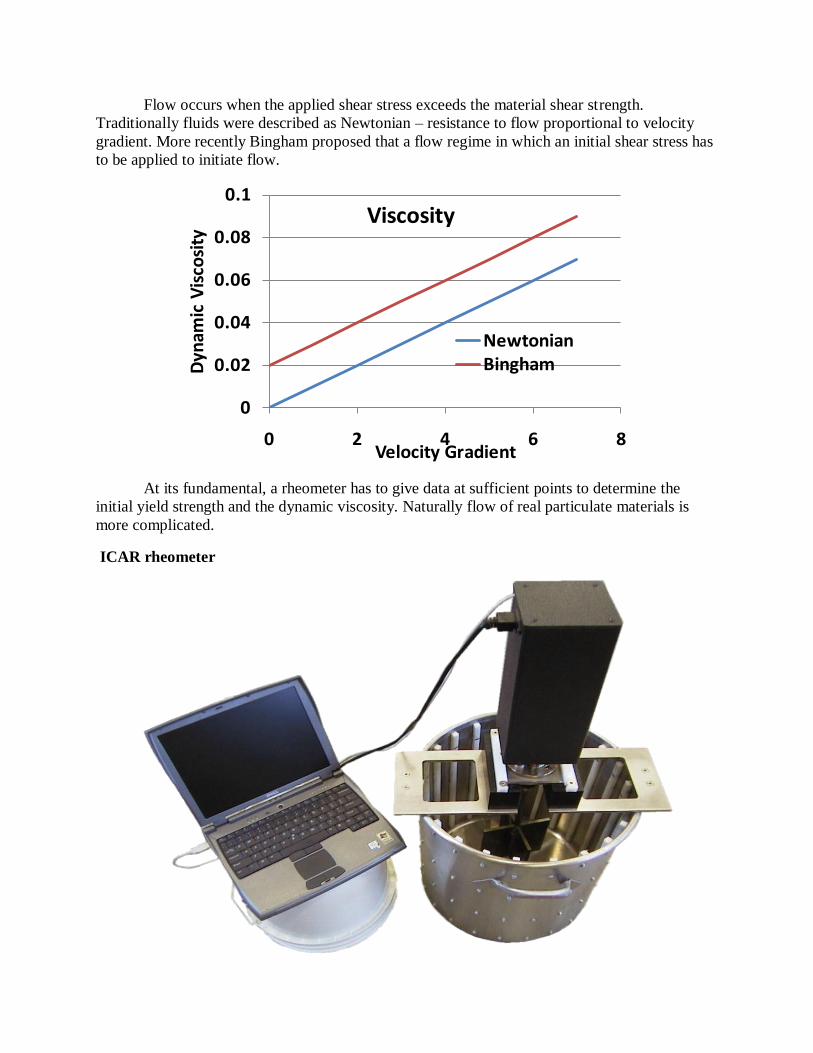
Flow occurs when the applied shear stress exceeds the material shear strength.
Traditionally fluids were described as Newtonian – resistance to flow proportional to velocity
gradient. More recently Bingham proposed that a flow regime in which an initial shear stress has
to be applied to initiate flow.
At its fundamental, a rheometer has to give data at sufficient points to determine the
initial yield strength and the dynamic viscosity. Naturally flow of real particulate materials is
more complicated.
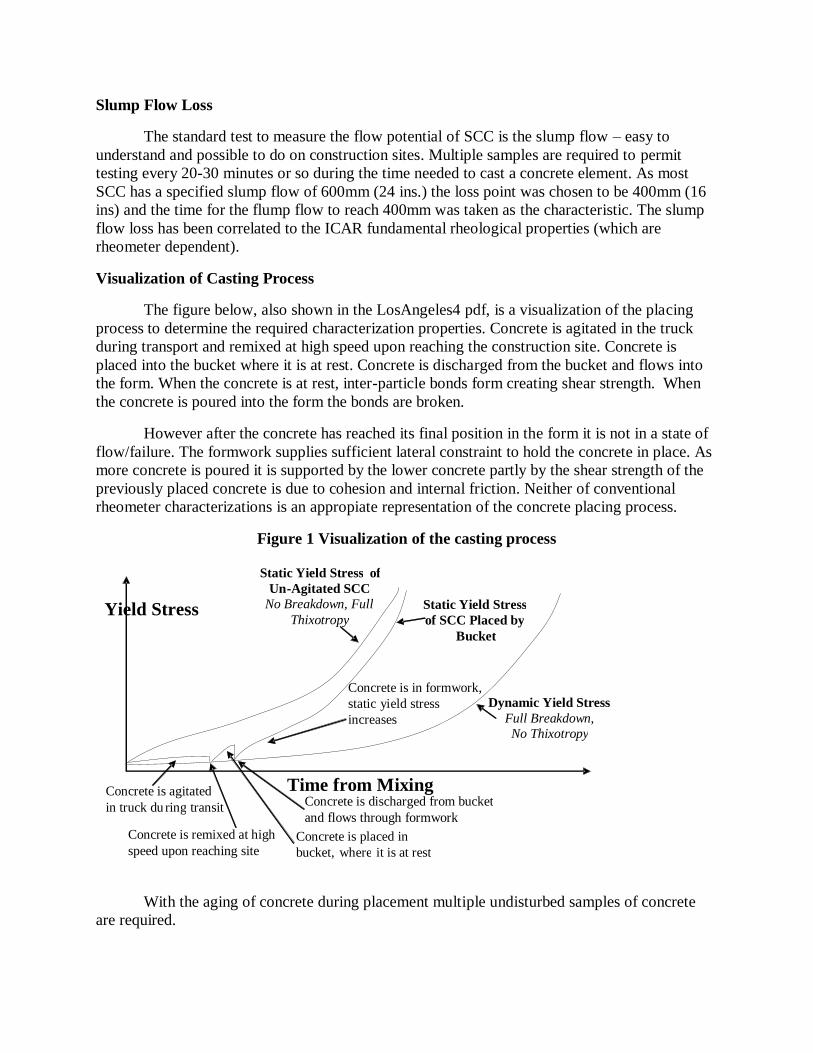
ICAR rheometer
0
0.02
0.04
0.06
0.08
0.1
0 2 4 6 8
Dyn
amic
Vis
cosi
ty
Velocity Gradient
Viscosity
NewtonianBingham

The ICAR rheometer uses a paddle rotating in the test material. The motor applies a chosen
rotational speed and measures the torque required. The process is repeated at different angular
velocities. Concrete is conditioned, to remove initial perturbations in the sample, by applying a
low angular velocity for several seconds, the velocity is then increased to a chosen higher
velocity and then the velocities are decreased to zero. Torque measurements are taken at pre-
selected velocities. The figure below shows measured results for a trial SCC taken at different
ages after mixing. The angular velocity was increased in steps, to enable the torque to be
measured, from 0.05 rotations/second to 0.55 rotations/second and then decreased with torque
measurements also taken at the same rotations. The increasing rotation speed torques are higher
than the decreasing speed torques. The decreasing torque speed curves approximate a straight
line (Bingham) with an intercept (yield strength) and a slope (dynamic viscosity).
As concrete in a form is at rest the zero rotation behavior is of most of interest – initial
conditioning of the concrete is a complication. Using different control settings the ICAR
rheometer can also measure the minimum displacement (yield) stress growth during
conditioning.
Mix 3, Lab: Stress Growth Data, Non-Agitated Samples
0.0
0.5
1.0
1.5
2.0
2.5
3.0
3.5
0 0.1 0.2 0.3 0.4 0.5 0.6
Rotation Speed (rev/s)
To
rqu
e (N
m)
End Mixing20 Minutes40 Minutes80 Minutes
Flow Curve Tests
Mix 3, Lab: Stress Growth Data, Non-Agitated Samples
0.0
0.5
1.0
1.5
2.0
2.5
0 2 4 6 8 10
Time (s)
Torq
ue
(Nm
)
End Mixing20 Minutes40 Minutes80 Minutes
Stress Growth Tests
Slump Flow Loss
The standard test to measure the flow potential of SCC is the slump flow – easy to
understand and possible to do on construction sites. Multiple samples are required to permit
testing every 20-30 minutes or so during the time needed to cast a concrete element. As most
SCC has a specified slump flow of 600mm (24 ins.) the loss point was chosen to be 400mm (16
ins) and the time for the flump flow to reach 400mm was taken as the characteristic. The slump
flow loss has been correlated to the ICAR fundamental rheological properties (which are
rheometer dependent).
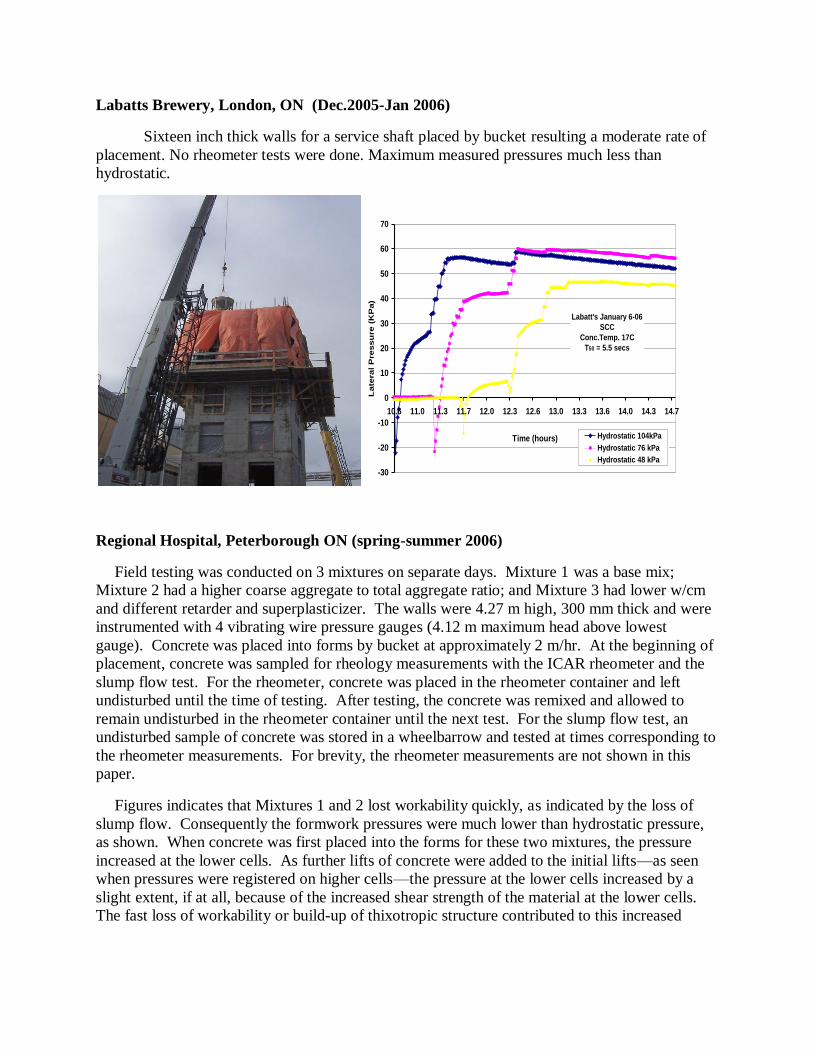
Visualization of Casting Process
The figure below, also shown in the LosAngeles4 pdf, is a visualization of the placing
process to determine the required characterization properties. Concrete is agitated in the truck
during transport and remixed at high speed upon reaching the construction site. Concrete is
placed into the bucket where it is at rest. Concrete is discharged from the bucket and flows into
the form. When the concrete is at rest, inter-particle bonds form creating shear strength. When
the concrete is poured into the form the bonds are broken.
However after the concrete has reached its final position in the form it is not in a state of
flow/failure. The formwork supplies sufficient lateral constraint to hold the concrete in place. As
more concrete is poured it is supported by the lower concrete partly by the shear strength of the
previously placed concrete is due to cohesion and internal friction. Neither of conventional
rheometer characterizations is an appropiate representation of the concrete placing process.
Figure 1 Visualization of the casting process
With the aging of concrete during placement multiple undisturbed samples of concrete
are required.
Dynamic Yield Stress Full Breakdown, No Thixotropy
Static Yield Stress of Un - Agitated SCC
No Breakdown, Full Thixotropy
Static Yield Stress of SCC Placed by
Bucket
Time from Mixing
Yield Stress
Concrete is agitated in truck du ring transit
Concrete is remixed at high speed upon reaching site
Concrete is placed in bucket, where it is at rest
Concrete is discharged from bucket and flows through formwork
Concrete is in formwork, static yield stress increases

As an alternative measure of flow behavior the slump flow loss test was devised – also
requiring multiple undisturbed samples.
Field Program
Field measurements of form pressures were taken at four sites pressures at 4 sites
operated by Ellis-Don Construction in Charleston, London Ontario, Peterborough Ontario and
Toronto.
Citadel, Charleston SC 2005-2006.
Base mix design, including use of an IBB rheometer, was completed before the PI got
involved with Ellis-Don. A base mix, a reduced w/cm, a reduced paste mix and an increased
coarse aggregate mixes were chosen. As the project progressed modified mixes were added and
others abandoned without field use. The project was a university residence with 6ins. and 16 ins.
thick shear walls. A single residence unit required about 6 cubic yards of concrete placed by
pump. With SCC the concrete placement could be completed in as few as 10 minutes – the form
pressure envelope was hydrostatic. With time the placement sequence was modified to place half
the height of concrete in successive residence units and the placing the second lift some time (20
minutes) later.
Most of the measured pressures were close to hydrostatic. Mix proportions did not seem
to have much effect. Splitting the pouring into lifts with a rest period between lifts did reduce the
maximum pressures.
Feb 2, 2006
Mix 40SAF000
Conc. Temp. 18C
-20
-10
0
10
20
30
40
50
60
70
9 9.25 9.5 9.75 10 10.25 10.5 10.75
Time (Hours)
Pre
ssu
re (
kP
a)
Cell 14 Cell 15 Cell 16
Cell 10 Cell 11 Cell 12
Labatts Brewery, London, ON (Dec.2005-Jan 2006)
Sixteen inch thick walls for a service shaft placed by bucket resulting a moderate rate of
placement. No rheometer tests were done. Maximum measured pressures much less than
hydrostatic.
Regional Hospital, Peterborough ON (spring-summer 2006)
Field testing was conducted on 3 mixtures on separate days. Mixture 1 was a base mix;
Mixture 2 had a higher coarse aggregate to total aggregate ratio; and Mixture 3 had lower w/cm
and different retarder and superplasticizer. The walls were 4.27 m high, 300 mm thick and were
instrumented with 4 vibrating wire pressure gauges (4.12 m maximum head above lowest
gauge). Concrete was placed into forms by bucket at approximately 2 m/hr. At the beginning of
placement, concrete was sampled for rheology measurements with the ICAR rheometer and the
slump flow test. For the rheometer, concrete was placed in the rheometer container and left
undisturbed until the time of testing. After testing, the concrete was remixed and allowed to
remain undisturbed in the rheometer container until the next test. For the slump flow test, an
undisturbed sample of concrete was stored in a wheelbarrow and tested at times corresponding to
the rheometer measurements. For brevity, the rheometer measurements are not shown in this
paper.
Figures indicates that Mixtures 1 and 2 lost workability quickly, as indicated by the loss of
slump flow. Consequently the formwork pressures were much lower than hydrostatic pressure,
as shown. When concrete was first placed into the forms for these two mixtures, the pressure
increased at the lower cells. As further lifts of concrete were added to the initial lifts—as seen
when pressures were registered on higher cells—the pressure at the lower cells increased by a
slight extent, if at all, because of the increased shear strength of the material at the lower cells.
The fast loss of workability or build-up of thixotropic structure contributed to this increased
Labatt's January 6-06
SCC
Conc.Temp. 17C
T50 = 5.5 secs
-30
-20
-10
0
10
20
30
40
50
60
70
10.6 11.0 11.3 11.7 12.0 12.3 12.6 13.0 13.3 13.6 14.0 14.3 14.7
Time (hours)
Late
ral
Pre
ssu
re (
KP
a)
Hydrostatic 104kPa
Hydrostatic 76 kPa
Hydrostatic 48 kPa

shear strength. (The results for Mixture 1 were compromised by the long delay in arrival
between the first and second trucks, illustrating the problems of field research.)
Figure 4: Formwork Pressure Measurements for Peterborough Mixture 1
Second concrete truck got lost allowing earlier concrete to set up.
Figure 5: Formwork Pressure Measurements for Mixture 2
0
100
200
300
400
500
600
700
800
0 10 20 30 40 50 60 70 80 90 100
Slu
mp
Flo
w (
mm
)
Time (mins)
May5,06Peterborough Trial 1 - May 5, 2006
Concrete temperature 18C
-10
-5
0
5
10
15
20
25
30
12 12.5 13 13.5 14 14.5 15 15.5 16
Time (Hour + Decimal)
Late
ral
Pre
ssu
re (
kP
a)
Cell 13 (Hyd.Pres. 36.1 kPa)
Cell 14 (Hyd.Pres. 63.5 kPa)
Cell 15 (Hyd.Pres. 91.1 kPa)
Cell 16 (Hyd.Pres. 98.7kPa)
200
300
400
500
600
700
0 20 40 60
Slu
mp
Flo
w (
mm
)
TIME (mins)
July12/06
Peterborough Trial 2 - July 12, 2006
Concrete temperature 20C
-10
-5
0
5
10
15
20
25
30
35
40
11.0 11.5 12.0 12.5 13.0
Time (Hour + Decimal)
Lat
eral
Pre
ssu
re (
kP
a)
Cell 13 (Hyd.Pres. 36.1 kPa)
Cell 14 (Hyd.Pres. 63.5 kPa)
Cell 15 (Hyd.Pres. 91.1 kPa)
Cell 16 (Hyd.Pres. 98.7 kPa)

Figure 6: Formwork Pressure Measurements for Mixture 3
The different retarder and superplasticizer used in Mixture 3 extended the workability
retention. As a result, the formwork pressures were much higher than in the first two mixtures
and nearly approached hydrostatic pressure. As further lifts of concrete were added to the lower
lifts, the pressures at the lower cells continued to increase significantly because the lower
concrete had not gained shear strength.
The formwork pressure data for the 3 mixtures clearly confirm the diversity of pressure
distributions reported in the literature for SCC.
Bay-Adelaide, Toronto
Measurements were carried out on several floors of the core structure of the 50 storey
Bay Adelaide tower.
Large jump (self climbing) form for the core structure. Outside core dimensions 33m x
20m (100 feet x 65 feet). Various wall thicknesses but pressures measured on 350 mm (14 ins)
and 600 mm (24 ins.) walls. Height of lift 4 metres (13 feet).
Very large pour of some 380 cubic metres (42 x 9 cubic metre trucks) lasting 4 or 5
hours. South wall concrete placed by pumping and north wall by bucket
550
600
650
700
0 50 100 150
Slu
mp
Flo
w (
mm
)
Time (mins)
Slump Flow Sept20/06 Peterborough Trial 3 - Sept 20, 2006,
Concrete temperature 21C
-20
0
20
40
60
80
100
10.0 10.5 11.0 11.5 12.0 12.5 13.0
Time (Hour + Decimal)
Lat
eral
Pre
ssu
re (
kP
a)
Cell 13 (Hyd.Pres. 36.1 kPa)
Cell 14 (Hyd.Pres. 63.5 kPa)
Cell 15 (Hyd.Pres. 91.1 kPa)
Cell 16 (Hyd.Pres. 98.7 kPa)

Typical results for the two instrumented wall forms are given below. Some small effect
of wall thickness – providing the rate of placements are the same logic would indicate the form
pressure for thicker wall should be slightly larger.
Bay Adelaide -- Decmber 10, 2007
North Wall
-20
-10
0
10
20
30
40
50
60
70
17 17.5 18 18.5 19 19.5 20 20.5 21 21.5
Time (Hours + Decimal)La
tera
l P
res
su
re (
kP
a)
Cell 6 - Bottom Cell 7 - Middle Cell 8 - Top
Bay Adelaide -- December 10, 2007
South Wall
-20
-10
0
10
20
30
40
50
60
70
18 18.5 19 19.5 20 20.5
Time (Hours + Decimal)
La
tera
l P
res
su
re (
kP
a)
Cell 9 - Top Cell 10 - Middle Cell 11 - Bottom

Lessons learned
Discontinuous placement, by bucket or programmed interruptions of pumping, allows the
concrete to gain shear strength, reducing the maximum form pressures. For formwork pressure
purposes, the ideal admixture combination would produce a concrete that flows under agitation
and immediately stiffens when agitation ceases. The SCC mixture design has to be done with
care and admixtures can not be changed or substituted without diligent consideration. In addition
changes to the water content of the aggregates can significantly affect the stability of the mixture
and strict control for moisture compensation needs to be instituted at the ready-mix plant.
Testing for production, mixture selection/qualification and formwork selection must be done in
concert and concrete control parameters must be established to ensure compliance.
Suggested lateral Pressure Equation
The following equation was developed to fit the field measured lateral pressures. Note the
experimental results were limited in that the maximum concrete head was 4 metres (14 feet).
SI units
2/14/1
400
8/1
max18
50
60*
5002
cT
tR
dwP
Pmax = limiting lateral pressure (kPa)
w = unit weight of concrete (kN/m3)
d = minimum lateral form dimension (mm)
R = rate of placement (m/hour)
Tc = concrete temperature (Celcius)
t400 = time for slump flow to drop to 400 mm
US units
2/14/1
400
8/1
max
90
60*
205
FT
tR
dwP
Pmax = limiting lateral pressure (psf)
w = unit weight of concrete (lbs/ft3)
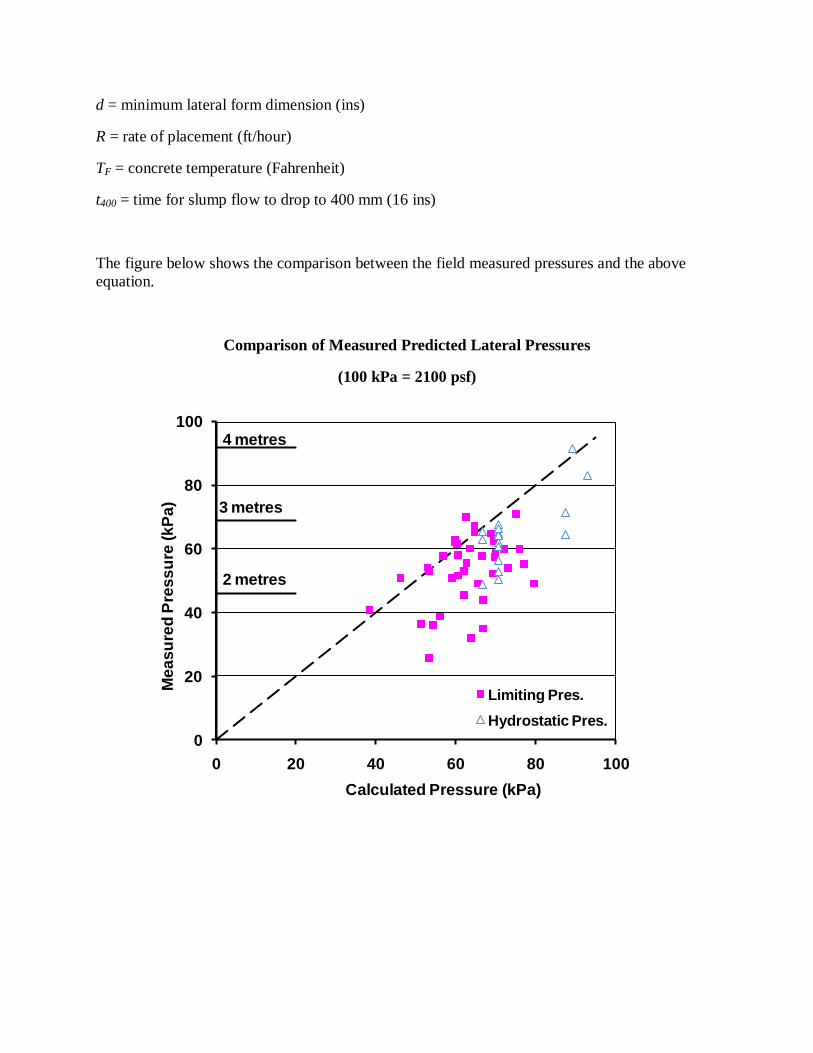
d = minimum lateral form dimension (ins)
R = rate of placement (ft/hour)
TF = concrete temperature (Fahrenheit)
t400 = time for slump flow to drop to 400 mm (16 ins)
The figure below shows the comparison between the field measured pressures and the above
equation.
Comparison of Measured Predicted Lateral Pressures
(100 kPa = 2100 psf)
0
20
40
60
80
100
0 20 40 60 80 100
Me
as
ure
d P
res
su
re (
kP
a)
Calculated Pressure (kPa)
Limiting Pres.
Hydrostatic Pres.
4 metres
3 metres
2 metres