Embed Size (px)
Citation preview
Final Report International Stormwater BMP Database 2016 Summary Statistics

| Title and relating text
i
International Stormwater BMP Database
2016 SUMMARY STATISTICS
by
Jane Clary and Jonathan Jones Wright Water Engineers, Inc.
Marc Leisenring, Paul Hobson and Eric Strecker
Geosyntec Consultants
2017

ii Water Environment & Reuse Foundation
The Water Environment & Reuse Foundation (WE&RF) is a nonprofit (501c3) organization officially formed in July 2016 as the result of the merger of Water Environment Research Foundation and the WateReuse Research Foundation. The merged research foundation, with a combined research portfolio representing over $200 million, conducts research to treat and recover beneficial materials from wastewater, stormwater, and seawater including water, nutrients, energy, and biosolids. The Foundation also plays an important role in the translation and dissemination of applied research, technology demonstration, and education, through creation of research-based educational tools and technology exchange opportunities. WE&RF materials can be used to inform policymakers and the public on the science, economic value, and environmental benefits of wastewater and recovering its resources, as well as the feasibility of new technologies.
For more information, contact: The Water Environment & Reuse Foundation 1199 North Fairfax Street, Suite 900 Alexandria, VA 22314 Tel: (571) 384-2100 www.werf.org [email protected]
© Copyright 2017 by the Water Environment & Reuse Foundation. All rights reserved. Permission to copy must be obtained from the Water Environment & Reuse Foundation. WE&RF ISBN: 978-1-94124-285-8
This report was prepared by the organization(s) named below as an account of work sponsored by the Water Environment & Reuse Foundation (WE&RF). Neither WE&RF, members of WE&RF, the organization(s) named below, nor any person acting on their behalf: (a) makes any warranty, express or implied, with respect to the use of any information, apparatus, method, or process disclosed in this report or that such use may not infringe on privately owned rights; or (b) assumes any liabilities with respect to the use of, or for damages resulting from the use of, any information, apparatus, method, or process disclosed in this report.
Wright Water Engineers, Inc., Geosyntec Consultants, City and County of Denver, and Urban Drainage and Flood Control District, Denver, CO. This document was reviewed by a panel of independent experts selected by WE&RF. Mention of trade names or commercial products or services does not constitute endorsement or recommendations for use. Similarly, omission of products or trade names indicates nothing concerning WE&RF's positions regarding product effectiveness or applicability.

BMP Database 2016 Summary Statistics iii
About WE&RF The Water Environment & Reuse Foundation (WE&RF) is a 501c3 charitable corporation which conducts research to treat and recover beneficial materials from wastewater, stormwater, and seawater including water, nutrients, energy, and biosolids while facilitating interaction among practitioners, educators, researchers, decision makers, and the public. Our research represents a portfolio of more than $200 million in water quality research.
WE&RF operates with funding from subscribers, donors, state agencies, and the federal government. Our supporters include wastewater treatment facilities, stormwater utilities, state and federal government agencies, technology vendors and equipment companies, engineers, and environmental consultants. WE&RF takes a progressive approach to research, stressing collaboration among teams of researchers, environmental professionals, scientists, and staff. All research is peer reviewed by leading experts.
WE&RF is driven by one overarching theme – To provide exceptional water research to advance science and technology. Our research, both relevant and impartial, and of the highest quality, forms a critical foundation for the adoption of sound policies and regulations to protect our natural resources and public health. We build that foundation through four core program elements:
• Applied research in water and the environment – Providing greater value to the industry by linking research with practical applications in the field.
• Accelerating innovation and adoption of technology – Through engagement, evaluation, and sharing of new technologies and solutions to complex problems to create impact.
• Transferring knowledge – The rapid and cohesive dissemination of research results to our subscribers and the water community to facilitate positive action.
• Setting an industry research agenda – As an accelerator for launching new research initiatives that will be needed to address future challenges for our industry.
WE&RF’s mission is to catalyze innovation through actionable research in water and the environment. WE&RF accomplishes this mission by seeking to achieve four principal goals:
• Establish water research and innovation priorities to address current and future needs. • Initiate transformative, integrated, and collaborative research and demonstrations. • Fund and conduct independent and unbiased, actionable water research. • Effectively communicate the results and progress of our research and innovation activities in a
timely manner. Interwoven in WE&RF’s mission and goals is the need to provide industry leadership, to collaborate with interested parties and our partners, to uphold the integrity of the scientific process to ensure research is unbiased and is credible, and to do so in a transparent and accountable fashion that provides value to our subscribers and partners.
For the most current updates on WE&RF research, sign up to receive Laterals, our bi-weekly electronic newsletter.
Learn more about the benefits of becoming a WE&RF supporter by visiting www.werf.org.

iv Water Environment & Reuse Foundation
Acknowledgments This report was funded by the City and County of Denver and the Urban Drainage and Flood Control District in Denver, CO.
Research Team Principal Investigators: Jonathan Jones, P.E. Wright Water Engineers, Inc.
Eric Strecker, P.E. Geosyntec Consultants, Inc.
Project Team: Jane Clary, M.S., Project Manager Wright Water Engineers, Inc.
Marc Leisenring, P.E. Paul Hobson, P.E. Geosyntec Consultants, Inc.
WE&RF Project Subcommittee Henry Barbaro Massachusetts Highway Department
Michael E. Barrett, Ph.D., P.E., D. WRE University of Texas
Gregory E. Granato U.S. Geological Survey
Jesse Pritts, P.E. Jason T. Berner U.S. Environmental Protection Agency
Advisory Committee Holly Piza, P.E. Urban Drainage and Flood Control District
Sarah Anderson Darren Mollendor, P.E. Jon Novick City and County of Denver
Water Environment & Reuse Foundation Staff Chief Research Officer: Jeffrey J. Mosher Program Director: Harry Zhang, Ph.D., P.E.
BMP Database 2016 Summary Statistics v
Abstract and Benefits Abstract:
The International Stormwater BMP Database is a publically accessible repository for BMP performance, design, and cost information. The overall purpose of the project is to provide scientifically sound information to improve the design, selection and performance of BMPs. Continued population of the database and assessment of its data supports improved understanding of the factors influencing BMP performance and supports improvements in BMP design, selection, and implementation.
This report provides a summary of BMP performance for total suspended solids, nutrients, metals, and bacteria for the most commonly monitored and reported BMP types available in the 2016 release of the BMP Database, updating previous performance summary reports. BMPs include grass strips, bioretention, bioswales, composite/treatment train BMPs, extended detention basins, media filters (mostly sand filters), porous pavement, retention ponds (wet ponds), wetland basins, and wetland channels. Data summaries include basic summary statistics for influent and effluent concentrations, graphical summaries, and hypothesis test results for various pollutant-BMP combinations.
Benefits:
• Provides consolidated summary statistics for the 2016 version of the International Stormwater BMP Database.
• Provides hypothesis testing results to indicate which BMPs demonstrate statistically significant differences in influent and effluent concentrations.
• Helps researchers identify potential data gaps for BMPs and pollutant types that warrant additional research.
• Synthesizes national BMP performance research that can be used for comparative purposes for local BMP studies or to support local planning efforts.
Keywords: Performance evaluation, best management practice, stormwater control measure, green infrastructure, nutrients, bacteria, metals, sediment, water quality.
vi Water Environment & Reuse Foundation
Contents Acknowledgments ......................................................................................................................................... v Abstract and Benefits .................................................................................................................................... v Tables ........................................................................................................................................................... vii Figures ......................................................................................................................................................... viii Acronyms and Abbreviations ........................................................................................................................ix Executive Summary .................................................................................................................................. ES-1
Introduction ............................................................................................................................. 1-1 Data Summary Approach ................................................................................................. 1-3 BMPs Analyzed and Data Screening Approach ................................................................ 1-3 Graphical Summaries ....................................................................................................... 1-4 Tabular Summaries .......................................................................................................... 1-4
BMP Performance Summary Statistics ................................................................................... 2-1 Total Suspended Solids .................................................................................................... 2-1 Bacteria ............................................................................................................................ 2-2
2.2.1 Enterococcus ....................................................................................................... 2-2 2.2.2 Escherichia coli .................................................................................................... 2-3 2.2.3 Fecal Coliform ..................................................................................................... 2-4
Metals ............................................................................................................................ 2-5 2.3.1 Arsenic ................................................................................................................ 2-5 2.3.2 Cadmium ............................................................................................................. 2-7 2.3.3 Chromium ........................................................................................................... 2-9 2.3.4 Copper............................................................................................................... 2-11 2.3.5 Iron .................................................................................................................... 2-13 2.3.6 Lead ................................................................................................................... 2-15 2.3.7 Nickel ................................................................................................................ 2-17 2.3.8 Zinc .................................................................................................................... 2-19
Nutrients ........................................................................................................................ 2-21 2.4.1 Phosphorus ....................................................................................................... 2-21 2.4.2 Nitrogen ............................................................................................................ 2-24
Conclusions and Research Needs ........................................................................................... 3-1 Conclusions ...................................................................................................................... 3-1 Research Needs ............................................................................................................... 3-2
References ................................................................................................................................................. R-1
BMP Database 2016 Summary Statistics vii
Tables 1-1 Constituents Summarized by Pollutant Category ......................................................................... 1-2 1-2 Legend for Interpretation of Hypothesis Test Results .................................................................. 1-5 2-1 Influent/Effluent Summary Statistics for TSS (mg/L) .................................................................... 2-1 2-2 Influent/Effluent Summary Statistics for Enterococcus (MPN/100 mL) ....................................... 2-2 2-3 Influent/Effluent Summary Statistics for E. coli (MPN/100 mL) ................................................... 2-3 2-4 Influent/Effluent Summary Statistics for Fecal Coliform (MPN/100 mL) ..................................... 2-4 2-5 Influent/Effluent Summary Statistics for Dissolved Arsenic (µg/L) .............................................. 2-5 2-6 Influent/Effluent Summary Statistics for Total Arsenic (µg/L) ...................................................... 2-6 2-7 Influent/Effluent Summary Statistics for Dissolved Cadmium (µg/L) ........................................... 2-7 2-8 Influent/Effluent Summary Statistics for Total Cadmium (µg/L) .................................................. 2-8 2-9 Influent/Effluent Summary Statistics for Dissolved Chromium (µg/L) ......................................... 2-9 2-10 Influent/Effluent Summary Statistics for Total Chromium (µg/L) .............................................. 2-10 2-11 Influent/Effluent Summary Statistics for Dissolved Copper (µg/L) ............................................. 2-11 2-12 Influent/Effluent Summary Statistics for Total Copper (µg/L) .................................................... 2-12 2-13 Influent/Effluent Summary Statistics for Dissolved Iron (µg/L) .................................................. 2-13 2-14 Influent/Effluent Summary Statistics for Total Iron (µg/L) ......................................................... 2-14 2-15 Influent/Effluent Summary Statistics for Dissolved Lead (µg/L) ................................................. 2-15 2-16 Influent/Effluent Summary Statistics for Total Lead (µg/L) ........................................................ 2-16 2-17 Influent/Effluent Summary Statistics for Dissolved Nickel (µg/L) .............................................. 2-17 2-18 Influent/Effluent Summary Statistics for Total Nickel (µg/L) ...................................................... 2-18 2-19 Influent/Effluent Summary Statistics for Dissolved Zinc (µg/L) .................................................. 2-19 2-20 Influent/Effluent Summary Statistics for Total Zinc (µg/L) ......................................................... 2-20 2-21 Influent/Effluent Summary Statistics for Total Phosphorus (mg/L) ........................................... 2-21 2-22 Influent/Effluent Summary Statistics for Orthophosphate (mg/L) ............................................. 2-22 2-23 Influent/Effluent Summary Statistics for Dissolved Phosphorus (mg/L) .................................... 2-23 2-24 Influent/Effluent Summary Statistics for Total Nitrogen (mg/L) ................................................ 2-24 2-25 Influent/Effluent Summary Statistics for Total Kjeldahl Nitrogen (mg/L) .................................. 2-25 2-26 Influent/Effluent Summary Statistics for NO3 as Nitrogen (mg/L) .............................................. 2-26 2-27 Influent/Effluent Summary Statistics for NO2 + NO3 as Nitrogen (mg/L) ................................... 2-27 2-28 Influent/Effluent Summary Statistics for NOx as Nitrogen (mg/L) .............................................. 2-28
viii Water Environment & Reuse Foundation
Figures 1-1 Overview of BMP database ........................................................................................................... 1-1 1-2 Box plot key ................................................................................................................................... 1-4 2-1 Box plots of influent/effluent TSS concentrations ........................................................................ 2-1 2-2 Box plots of influent/effluent enterococcus concentrations ........................................................ 2-2 2-3 Box plots of influent/effluent E. coli concentrations .................................................................... 2-3 2-4 Box plots of influent/effluent fecal coliform concentrations ....................................................... 2-4 2-5 Box plots of influent/effluent dissolved arsenic concentrations .................................................. 2-5 2-6 Box plots of influent/effluent total arsenic concentrations ......................................................... 2-6 2-7 Box plots of influent/effluent dissolved cadmium concentrations .............................................. 2-7 2-8 Box plots of influent/effluent total cadmium concentrations ...................................................... 2-8 2-9 Box plots of influent/effluent dissolved chromium concentrations ............................................. 2-9 2-10 Box plots of influent/effluent total chromium concentrations .................................................. 2-10 2-11 Box plots of influent/effluent dissolved copper concentrations ................................................ 2-11 2-12 Box plots of influent/effluent total copper concentrations ....................................................... 2-12 2-13 Box plots of influent/effluent dissolved Iron concentrations ..................................................... 2-13 2-14 Box plots of influent/effluent total Iron concentrations ............................................................ 2-14 2-15 Box plots of influent/effluent dissolved Lead concentrations .................................................... 2-15 2-16 Box plots of influent/effluent total Lead concentrations ........................................................... 2-16 2-17 Box plots of influent/effluent dissolved nickel concentrations .................................................. 2-17 2-18 Box plots of influent/effluent total nickel concentrations ......................................................... 2-18 2-19 Box plots of influent/effluent dissolved zinc concentrations ..................................................... 2-19 2-20 Box plots of influent/effluent total zinc concentrations............................................................. 2-20 2-21 Box plots of influent/effluent total phosphorus concentrations ................................................ 2-21 2-22 Box plots of influent/effluent orthophosphate concentrations ................................................. 2-22 2-23 Box plots of influent/effluent dissolved phosphorus concentrations ........................................ 2-23 2-24 Box plots of influent/effluent total nitrogen concentrations ..................................................... 2-24 2-25 Box plots of influent/effluent total Kjeldahl nitrogen concentrations ....................................... 2-25 2-26 Box plots of influent/effluent NO3 as nitrogen concentrations .................................................. 2-26 2-27 Box plots of influent/effluent NO2 + NO3 as nitrogen concentrations ....................................... 2-27 2-28 Box plots of influent/effluent NOx as nitrogen concentrations .................................................. 2-28
BMP Database 2016 Summary Statistics ix
Acronyms and Abbreviations APWA American Public Works Association BMP Best Management Practice EPA U.S. Environmental Protection Agency EWRI-ASCE Environmental and Water Resources Institute of the American Society of Civil
Engineers FHWA Federal Highway Administration GI Green Infrastructure LID Low Impact Development mg/L milligrams per liter MPN/100 mL Most Probable Number per 100 milliters N Nitrogen NOx Nitrate+Nitrite and Nitrate NSQD National Stormwater Quality Database P Phosphorus ROS Regression on Statistics SRP Soluble Reactive Phosphorus TKN Total Kjeldahl Nitrogen TSS Total Suspended Solids µg/L micrograms per liter WE&RF Water Environment & Reuse Foundation

x Water Environment & Reuse Foundation
BMP Database 2016 Summary Statistics ES-1
Executive Summary The International Stormwater BMP Database is a publically accessible repository for BMP performance, design, and cost information. The overall purpose of the project is to provide scientifically sound information to improve the design, selection and performance of BMPs. Continued population of the database and assessment of its data supports improved understanding of the factors influencing BMP performance and supports improvements in BMP design, selection, and implementation.
Since the initial development of the BMP Database in 1996, the Water Environment and Reuse Foundation (WE&RF) and various funding partners, including the Federal Highway Administration (FHWA), the Environmental and Water Resources Institute (EWRI), the U.S. Environmental Protection Agency (EPA), and American Public Works Association (APWA) have contributed to its continued development and growth. As of the most recent release in November 2016, the BMP Database contains data sets from nearly 650 BMP studies through the U.S. and several other countries that are publicly accessible on the project website (www.bmpdatabase.org).
The BMP Database project website provides consolidated access to a variety of guidance and interpretive reports related to BMP performance, in addition to access to the BMP Database itself. For example, monitoring guidance, recommendations for statistically sound approaches for performance analysis, reporting protocols (e.g., data entry spreadsheets and user’s guide), on-line statistical analysis tools, presentations, and summary reports are freely available and accessible to the public on the website. BMP performance summary reports focus on solids, nutrients, metals, and bacteria for the most commonly monitored and reported BMP types. These include grass strips, bioretention, bioswales, composite/treatment train BMPs, extended detention basins, media filters (mostly sand filters), porous pavement, retention ponds (wet ponds), wetland basins, and wetland channels.
This 2016 report summarizes influent and effluent concentrations for various pollutant-BMP combinations utilizing basic summary statistics, graphical summaries and hypothesis test results. The performance data sets selected for this report include total suspended solids, nutrients, bacteria, and metals based on data in the 2016 release of the BMP Database. This report serves as a data summary and does not provide detailed discussion or interpretation of findings.

ES-2 Water Environment & Reuse Foundation

BMP Database 2016 Summary Statistics 1-1
Introduction The International Stormwater Best Management Practice (BMP) Database is a long-term project that has grown and evolved over the past 20 years to help document the performance of urban stormwater BMPs (www.bmpdatabase.org). The database has recently expanded to include performance modules for agricultural practices and for stream restoration practices. The project now also houses the National Stormwater Quality Database (NSQD) which provides runoff characterization data for urban land uses. With this expansion, the BMP Database has become an integrated repository of available data on the efficacy of BMPs from a variety of sectors for reducing pollutant loading and improving water quality (Figure 11-1). This BMP performance report provides statistical characterization of urban stormwater BMP performance data, updating similar previously completed reports (Geosyntec and WWE 2012b & 2014).
Figure 1-1. Overview of BMP database.
Clean Water Act Goals
Fishable & Swimmable
Agricultural BMPs
Urban Stormwater BMPs (Source Controls,
Structural, GI/LID)
Stream Restoration
Urban Stormwater Runoff
Characterization (NSQD)
1-2 Water Environment & Reuse Foundation
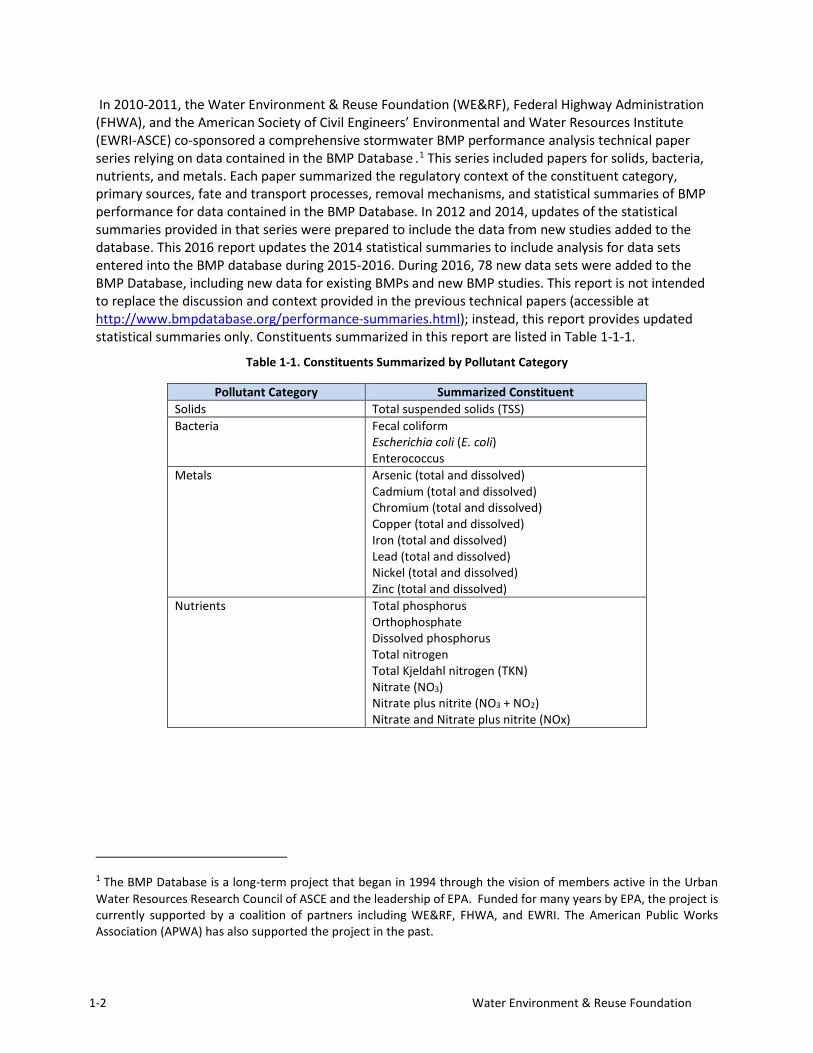
In 2010-2011, the Water Environment & Reuse Foundation (WE&RF), Federal Highway Administration (FHWA), and the American Society of Civil Engineers’ Environmental and Water Resources Institute (EWRI-ASCE) co-sponsored a comprehensive stormwater BMP performance analysis technical paper series relying on data contained in the BMP Database .1 This series included papers for solids, bacteria, nutrients, and metals. Each paper summarized the regulatory context of the constituent category, primary sources, fate and transport processes, removal mechanisms, and statistical summaries of BMP performance for data contained in the BMP Database. In 2012 and 2014, updates of the statistical summaries provided in that series were prepared to include the data from new studies added to the database. This 2016 report updates the 2014 statistical summaries to include analysis for data sets entered into the BMP database during 2015-2016. During 2016, 78 new data sets were added to the BMP Database, including new data for existing BMPs and new BMP studies. This report is not intended to replace the discussion and context provided in the previous technical papers (accessible at http://www.bmpdatabase.org/performance-summaries.html); instead, this report provides updated statistical summaries only. Constituents summarized in this report are listed in Table 1-1-1.
Table 1-1. Constituents Summarized by Pollutant Category
Pollutant Category Summarized Constituent Solids Total suspended solids (TSS) Bacteria Fecal coliform
Escherichia coli (E. coli) Enterococcus
Metals Arsenic (total and dissolved) Cadmium (total and dissolved) Chromium (total and dissolved) Copper (total and dissolved) Iron (total and dissolved) Lead (total and dissolved) Nickel (total and dissolved) Zinc (total and dissolved)
Nutrients Total phosphorus Orthophosphate Dissolved phosphorus Total nitrogen Total Kjeldahl nitrogen (TKN) Nitrate (NO3) Nitrate plus nitrite (NO3 + NO2) Nitrate and Nitrate plus nitrite (NOx)
1 The BMP Database is a long-term project that began in 1994 through the vision of members active in the Urban Water Resources Research Council of ASCE and the leadership of EPA. Funded for many years by EPA, the project is currently supported by a coalition of partners including WE&RF, FHWA, and EWRI. The American Public Works Association (APWA) has also supported the project in the past.
BMP Database 2016 Summary Statistics 1-3
Data Summary Approach The BMP performance analyses provided in this report are based on the BMP performance data in the BMP Database as of November 2016. The analyses are based upon the distributions of influent and effluent water quality sample data for individual events by BMP category, thereby providing greater weight to those BMPs for which there are a larger number of data points reported. In other words, the performance analysis presented in this technical summary is “storm-weighted,” as opposed to “BMP weighted.”2
A summary of the BMPs analyzed and data screening approach is provided below followed by descriptions of the graphical and tabular summaries provided in this report. The statistical analysis is organized by constituent and BMP type for three main constituent categories: Solids, Bacteria, Metals, and Nutrients.
BMPs Analyzed and Data Screening Approach The BMP categories included in this analysis are grass strips, bioretention, bioswales, composite/treatment train BMPs, detention basins (surface/grass-lined), media filters (mostly sand filters), porous pavement, retention ponds (surface pond with a permanent pool), wetland basins (basins with open water surface), a combined category including both retention ponds and wetland basins, and wetland channels (swales and channels with wetland vegetation). The effectiveness and range of unit treatment processes present in a particular BMP may vary depending on the BMP design. Several other BMP categories and sub-classes are included in the database, but these have been excluded from this analysis due to limited data sets available for meaningful categorical comparisons. Additionally, the BMP Database contains approximately 100 manufactured devices, which are no longer provided as a general BMP category for analysis in this report because of the wide range of unit treatment processes present among various manufactured devices. Green roof data sets have also been excluded from this report due to relatively small numbers of comparable data sets and significant variation in monitoring program designs. Individual BMP performance analysis reports can be viewed and downloaded from www.bmpdatabase.org for manufactured devices, green roofs, and other BMP types not included in this summary report. For example, see http://www.bmpdatabase.org/map.html to view monitoring locations with other BMP types not included in this report.
To be included in this category-level summary, at least three BMP studies must be included in the BMP category, with each BMP study having influent and effluent data for at least three storms. A variety of additional screening criteria are applied for purposes of category-level analysis to make sure that the data sets and BMP designs are reasonably representative, as documented in the “Monitoring Station” table of the BMP Database, which can be downloaded from www.bmpdatabase.org. Poor performance of a BMP is not a reason for data exclusion.
2 There are several viable approaches to evaluating data in the BMP Database. Two general approaches that have been presented in the past (Geosyntec Consultants and Wright Water Engineers, 2008) are the “BMP-weighted” and “storm-weighted” approaches. The BMP-weighted approach represents each BMP with one value representing the central tendency and variability of each individual BMP study, whereas the storm-weighted approach combines all of the storm events for the BMPs in each category and analyzes the overall storm-based data set. The storm-weighted approach has been selected for this report because it provides a much larger data set for analysis.
1-4 Water Environment & Reuse Foundation
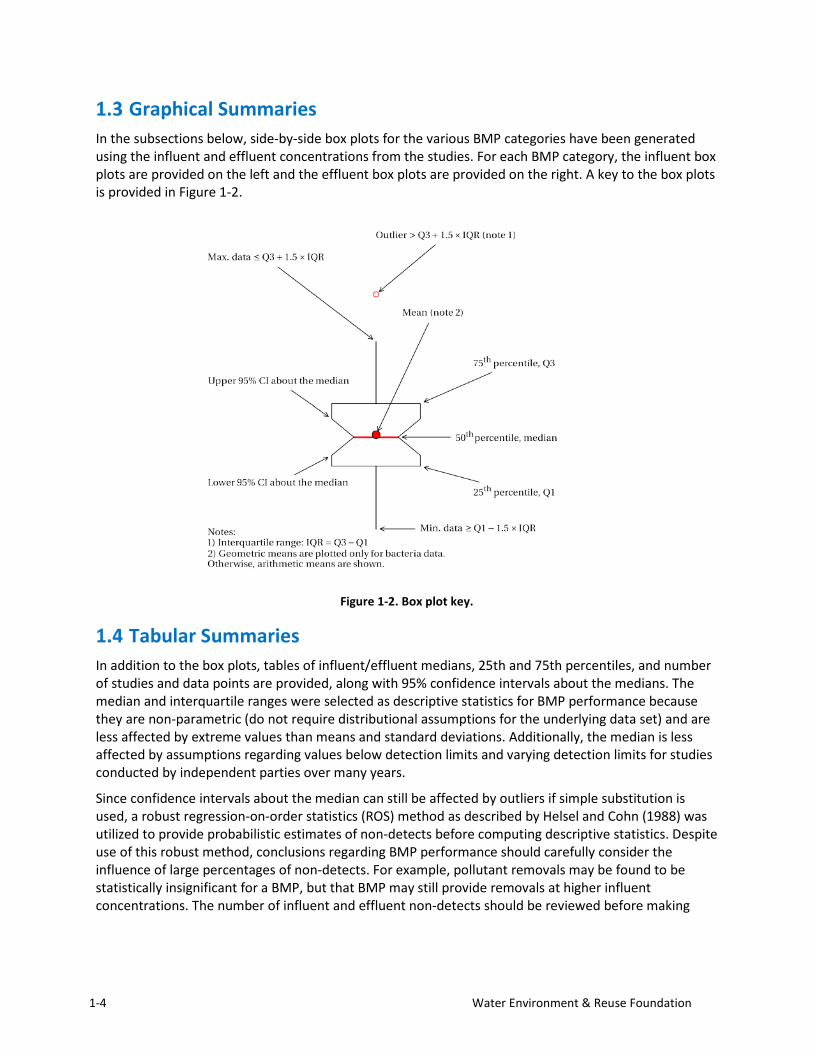
Graphical Summaries In the subsections below, side-by-side box plots for the various BMP categories have been generated using the influent and effluent concentrations from the studies. For each BMP category, the influent box plots are provided on the left and the effluent box plots are provided on the right. A key to the box plots is provided in Figure 1-2.
Figure 1-2. Box plot key.
Tabular Summaries In addition to the box plots, tables of influent/effluent medians, 25th and 75th percentiles, and number of studies and data points are provided, along with 95% confidence intervals about the medians. The median and interquartile ranges were selected as descriptive statistics for BMP performance because they are non-parametric (do not require distributional assumptions for the underlying data set) and are less affected by extreme values than means and standard deviations. Additionally, the median is less affected by assumptions regarding values below detection limits and varying detection limits for studies conducted by independent parties over many years.
Since confidence intervals about the median can still be affected by outliers if simple substitution is used, a robust regression-on-order statistics (ROS) method as described by Helsel and Cohn (1988) was utilized to provide probabilistic estimates of non-detects before computing descriptive statistics. Despite use of this robust method, conclusions regarding BMP performance should carefully consider the influence of large percentages of non-detects. For example, pollutant removals may be found to be statistically insignificant for a BMP, but that BMP may still provide removals at higher influent concentrations. The number of influent and effluent non-detects should be reviewed before making
BMP Database 2016 Summary Statistics 1-5
conclusions, particularly for dissolved metals where non-detects are most prevalent. Footnotes have been added to summary tables where greater than 50% non-detects were present for the influent data set. For more information on the influence of non-detects on dissolved metals data in the BMP Database, see the discussion in the Metals Technical Summary (Wright Water Engineers and Geosyntec, 2011), accessible at www.bmpdatabase.org).
Confidence intervals in the boxplots and tables were generated using the bias corrected and accelerated (BCa) bootstrap method described by Efron and Tibishirani (1993). This method is a robust approach for computing confidence intervals that is resistant to outliers and does not require any restrictive distributional assumptions. Comparison of the confidence intervals about the influent and effluent medians can be used to roughly identify statistically significant differences between the central tendencies of the data. However, non-parametric hypothesis tests, such as the Mann-Whitney rank sum test or the Wilcoxon signed-rank test, can provide additional and more robust results for evaluating significant differences between medians. The Mann-Whitney test applies to independent data sets, whereas the Wilcoxon test applies to paired data sets (Helsel and Hirsch, 1992). Results of these tests are summarized in Chapter 2 for solids, bacteria, metals, and nutrients. In some cases, the Mann-Whitney and Wilcoxon hypothesis test results produce conflicting conclusions regarding statistically significant differences. Such cases are more likely to occur where there are imbalances in the number of influent and effluent samples for a particular data set because the Mann-Whitney test operates on the entire data set whereas the Wilcoxon test only operates on data pairs. For BMPs with long residence times and/or permanent pools (e.g., wet ponds), the paired storm event hypothesis test results relying on the Wilcoxon test may be less representative than the Mann-Whitney test because of variations in sampling program designs for collection of influent and effluent samples that may not enable event-based pairing of monitoring data. For example, inflow for a storm event on a particular date may mix with water from a previous event that has been stored since the previous storm. Thus, in cases where the Mann-Whitney and Wilcoxon test results conflict for BMPs with permanent pools, the Mann-Whitney results may provide a better indicator of pollutant removal performance.
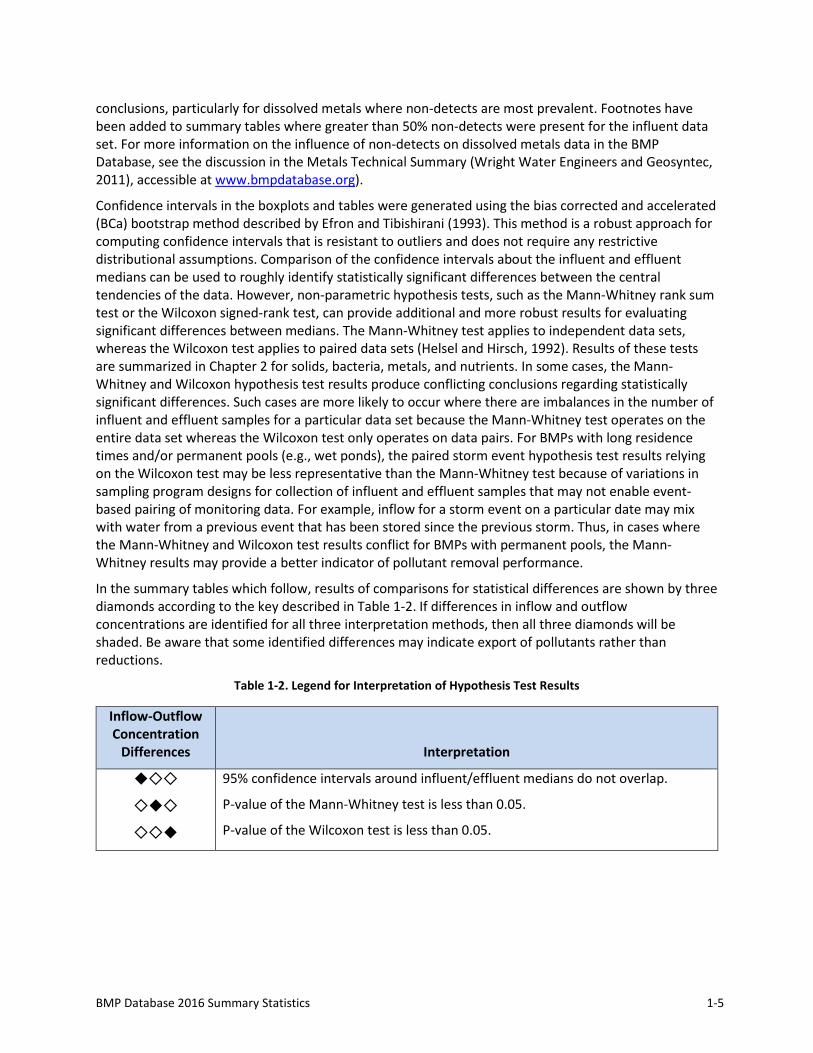
In the summary tables which follow, results of comparisons for statistical differences are shown by three diamonds according to the key described in Table 1-2. If differences in inflow and outflow concentrations are identified for all three interpretation methods, then all three diamonds will be shaded. Be aware that some identified differences may indicate export of pollutants rather than reductions.
Table 1-2. Legend for Interpretation of Hypothesis Test Results
Inflow-Outflow Concentration
Differences Interpretation
◆◇◇
◇◆◇
◇◇◆
95% confidence intervals around influent/effluent medians do not overlap.
P-value of the Mann-Whitney test is less than 0.05.
P-value of the Wilcoxon test is less than 0.05.
1-6 Water Environment & Reuse Foundation
Be aware that for some BMP types, a statistically significant difference between influent and effluent concentrations may not be present, but the effluent concentrations achieved by the BMP are relatively low and may be comparable to the performance of other BMPs that have statistically significant differences between inflow and outflow. For example, data sets that have low influent concentrations and similarly low effluent concentration (i.e., clean water in = clean water out) may not show statistically significant differences. However this does not necessarily imply that the BMP would not have been effective at higher influent concentrations.
Lastly, this report focuses solely on influent and effluent concentrations and does not characterize influent and effluent loads. For BMPs that provide significant volume reduction, load reductions may still occur in the absence of concentration reductions. Volume-related data can also be retrieved from the BMP Database and have been evaluated in detail for some BMP categories. For example, see International Stormwater Best Management Practices (BMP) Database Addendum 1 to Volume Reduction Technical Summary (January 2011) Expanded Analysis of Volume Reduction in Bioretention BMPs (Geosyntec and Wright Water Engineers 2012a), accessible at www.bmpdatabase.org.
BMP Database 2016 Summary Statistics 2-1
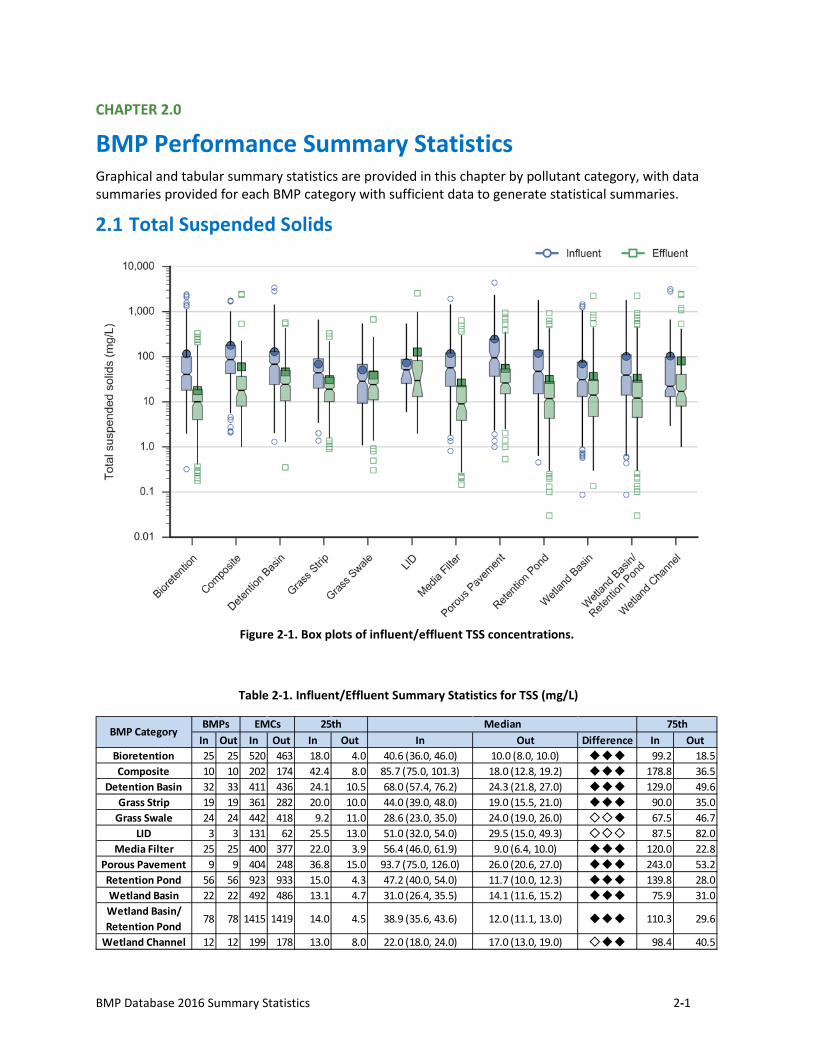
BMP Performance Summary Statistics Graphical and tabular summary statistics are provided in this chapter by pollutant category, with data summaries provided for each BMP category with sufficient data to generate statistical summaries.
Total Suspended Solids
Figure 2-1. Box plots of influent/effluent TSS concentrations.
Table 2-1. Influent/Effluent Summary Statistics for TSS (mg/L)
In Out In Out In Out In Out Difference In OutBioretention 25 25 520 463 18.0 4.0 40.6 (36.0, 46.0) 10.0 (8.0, 10.0) ◆◆◆ 99.2 18.5Composite 10 10 202 174 42.4 8.0 85.7 (75.0, 101.3) 18.0 (12.8, 19.2) ◆◆◆ 178.8 36.5
Detention Basin 32 33 411 436 24.1 10.5 68.0 (57.4, 76.2) 24.3 (21.8, 27.0) ◆◆◆ 129.0 49.6Grass Strip 19 19 361 282 20.0 10.0 44.0 (39.0, 48.0) 19.0 (15.5, 21.0) ◆◆◆ 90.0 35.0
Grass Swale 24 24 442 418 9.2 11.0 28.6 (23.0, 35.0) 24.0 (19.0, 26.0) ◇◇◆ 67.5 46.7LID 3 3 131 62 25.5 13.0 51.0 (32.0, 54.0) 29.5 (15.0, 49.3) ◇◇◇ 87.5 82.0
Media Filter 25 25 400 377 22.0 3.9 56.4 (46.0, 61.9) 9.0 (6.4, 10.0) ◆◆◆ 120.0 22.8Porous Pavement 9 9 404 248 36.8 15.0 93.7 (75.0, 126.0) 26.0 (20.6, 27.0) ◆◆◆ 243.0 53.2Retention Pond 56 56 923 933 15.0 4.3 47.2 (40.0, 54.0) 11.7 (10.0, 12.3) ◆◆◆ 139.8 28.0Wetland Basin 22 22 492 486 13.1 4.7 31.0 (26.4, 35.5) 14.1 (11.6, 15.2) ◆◆◆ 75.9 31.0Wetland Basin/ Retention Pond
78 78 1415 1419 14.0 4.5 38.9 (35.6, 43.6) 12.0 (11.1, 13.0) ◆◆◆ 110.3 29.6
Wetland Channel 12 12 199 178 13.0 8.0 22.0 (18.0, 24.0) 17.0 (13.0, 19.0) ◇◆◆ 98.4 40.5
BMPs 75thEMCs 25th MedianBMP Category
2-2 Water Environment & Reuse Foundation
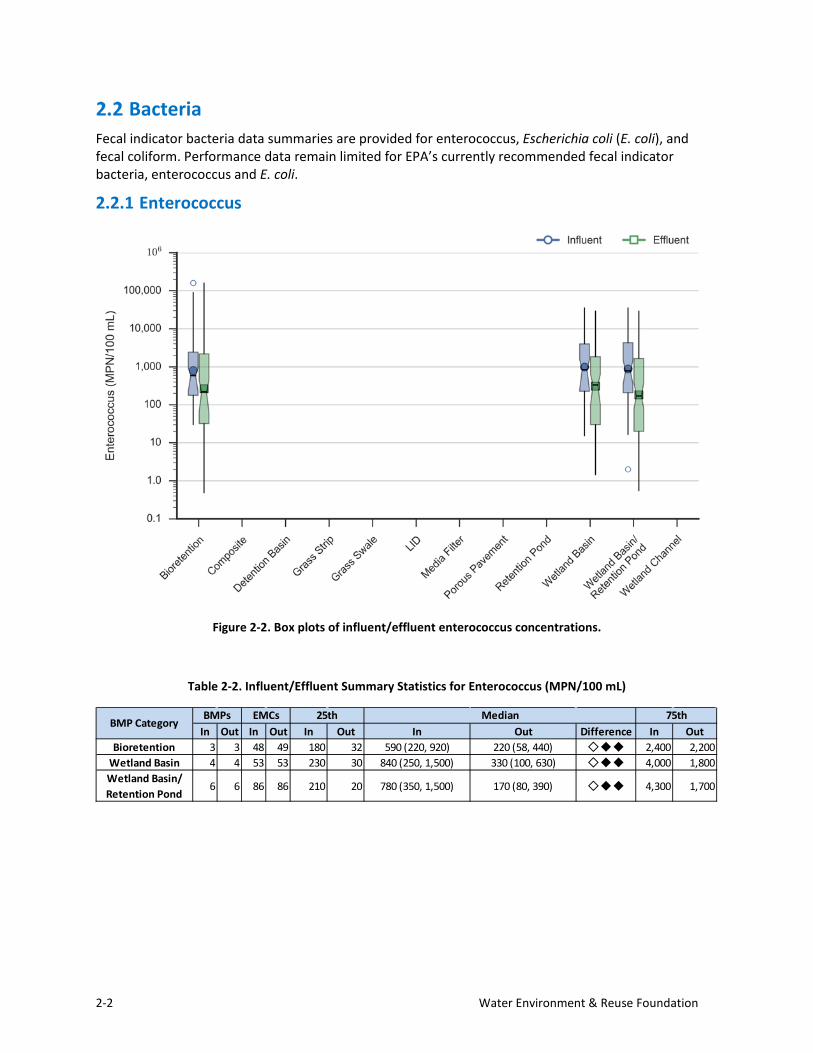
Bacteria Fecal indicator bacteria data summaries are provided for enterococcus, Escherichia coli (E. coli), and fecal coliform. Performance data remain limited for EPA’s currently recommended fecal indicator bacteria, enterococcus and E. coli.
2.2.1 Enterococcus
Figure 2-2. Box plots of influent/effluent enterococcus concentrations.
Table 2-2. Influent/Effluent Summary Statistics for Enterococcus (MPN/100 mL)
In Out In Out In Out In Out Difference In OutBioretention 3 3 48 49 180 32 590 (220, 920) 220 (58, 440) ◇◆◆ 2,400 2,200
Wetland Basin 4 4 53 53 230 30 840 (250, 1,500) 330 (100, 630) ◇◆◆ 4,000 1,800Wetland Basin/ Retention Pond
6 6 86 86 210 20 780 (350, 1,500) 170 (80, 390) ◇◆◆ 4,300 1,700
BMPs 75thEMCs 25th MedianBMP Category
BMP Database 2016 Summary Statistics 2-3
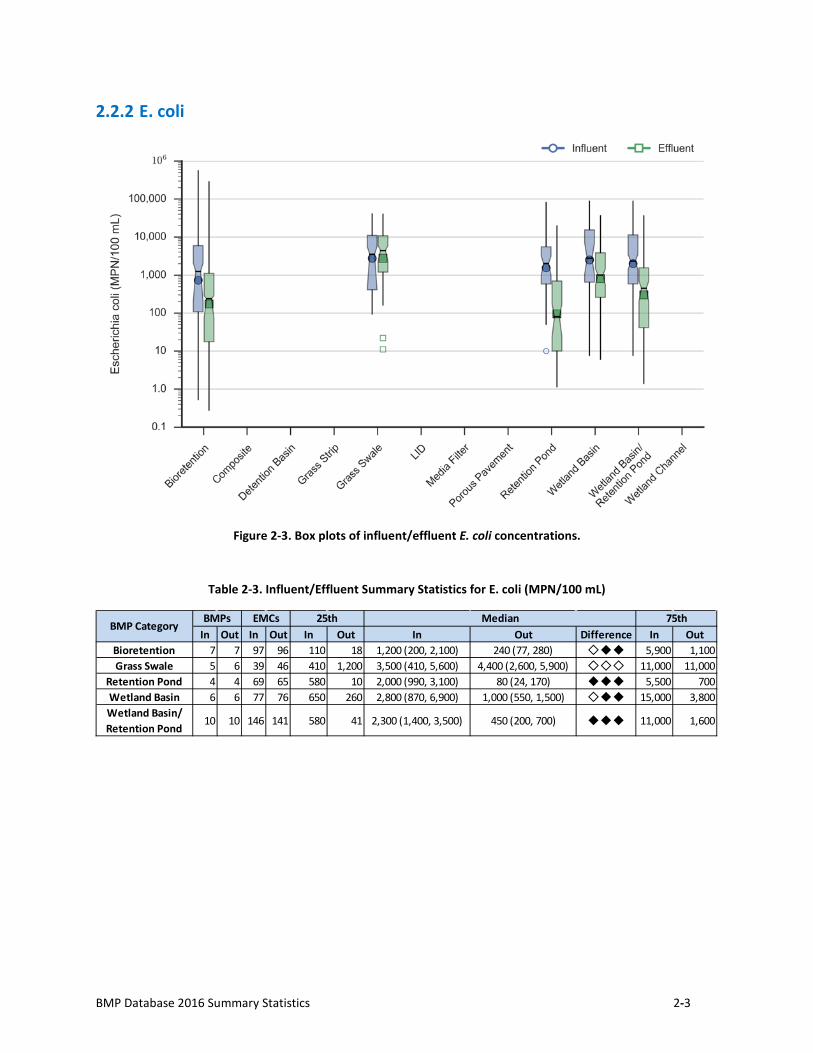
2.2.2 E. coli
Figure 2-3. Box plots of influent/effluent E. coli concentrations.
Table 2-3. Influent/Effluent Summary Statistics for E. coli (MPN/100 mL)
In Out In Out In Out In Out Difference In OutBioretention 7 7 97 96 110 18 1,200 (200, 2,100) 240 (77, 280) ◇◆◆ 5,900 1,100Grass Swale 5 6 39 46 410 1,200 3,500 (410, 5,600) 4,400 (2,600, 5,900) ◇◇◇ 11,000 11,000
Retention Pond 4 4 69 65 580 10 2,000 (990, 3,100) 80 (24, 170) ◆◆◆ 5,500 700Wetland Basin 6 6 77 76 650 260 2,800 (870, 6,900) 1,000 (550, 1,500) ◇◆◆ 15,000 3,800Wetland Basin/ Retention Pond
10 10 146 141 580 41 2,300 (1,400, 3,500) 450 (200, 700) ◆◆◆ 11,000 1,600
BMPs 75thEMCs 25th MedianBMP Category
2-4 Water Environment & Reuse Foundation
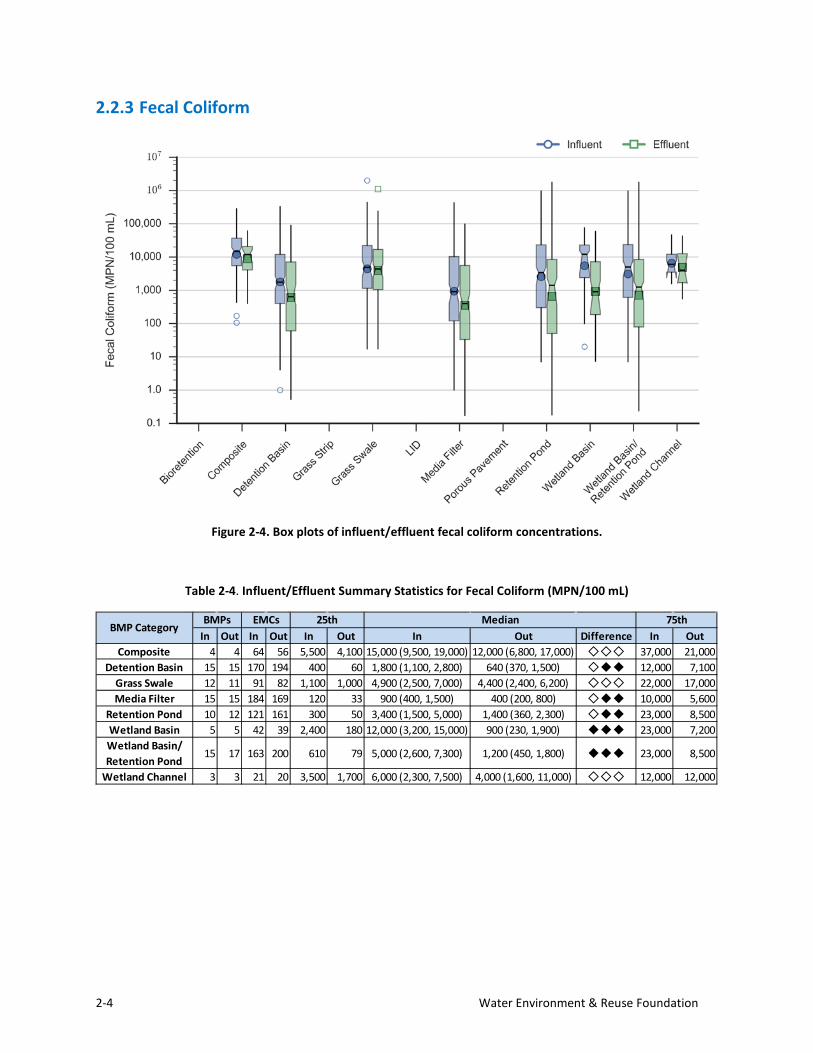
2.2.3 Fecal Coliform
Figure 2-4. Box plots of influent/effluent fecal coliform concentrations.
Table 2-4. Influent/Effluent Summary Statistics for Fecal Coliform (MPN/100 mL)
In Out In Out In Out In Out Difference In OutComposite 4 4 64 56 5,500 4,100 15,000 (9,500, 19,000) 12,000 (6,800, 17,000) ◇◇◇ 37,000 21,000
Detention Basin 15 15 170 194 400 60 1,800 (1,100, 2,800) 640 (370, 1,500) ◇◆◆ 12,000 7,100Grass Swale 12 11 91 82 1,100 1,000 4,900 (2,500, 7,000) 4,400 (2,400, 6,200) ◇◇◇ 22,000 17,000Media Filter 15 15 184 169 120 33 900 (400, 1,500) 400 (200, 800) ◇◆◆ 10,000 5,600
Retention Pond 10 12 121 161 300 50 3,400 (1,500, 5,000) 1,400 (360, 2,300) ◇◆◆ 23,000 8,500Wetland Basin 5 5 42 39 2,400 180 12,000 (3,200, 15,000) 900 (230, 1,900) ◆◆◆ 23,000 7,200Wetland Basin/ Retention Pond
15 17 163 200 610 79 5,000 (2,600, 7,300) 1,200 (450, 1,800) ◆◆◆ 23,000 8,500
Wetland Channel 3 3 21 20 3,500 1,700 6,000 (2,300, 7,500) 4,000 (1,600, 11,000) ◇◇◇ 12,000 12,000
BMPs 75thEMCs 25th MedianBMP Category
BMP Database 2016 Summary Statistics 2-5
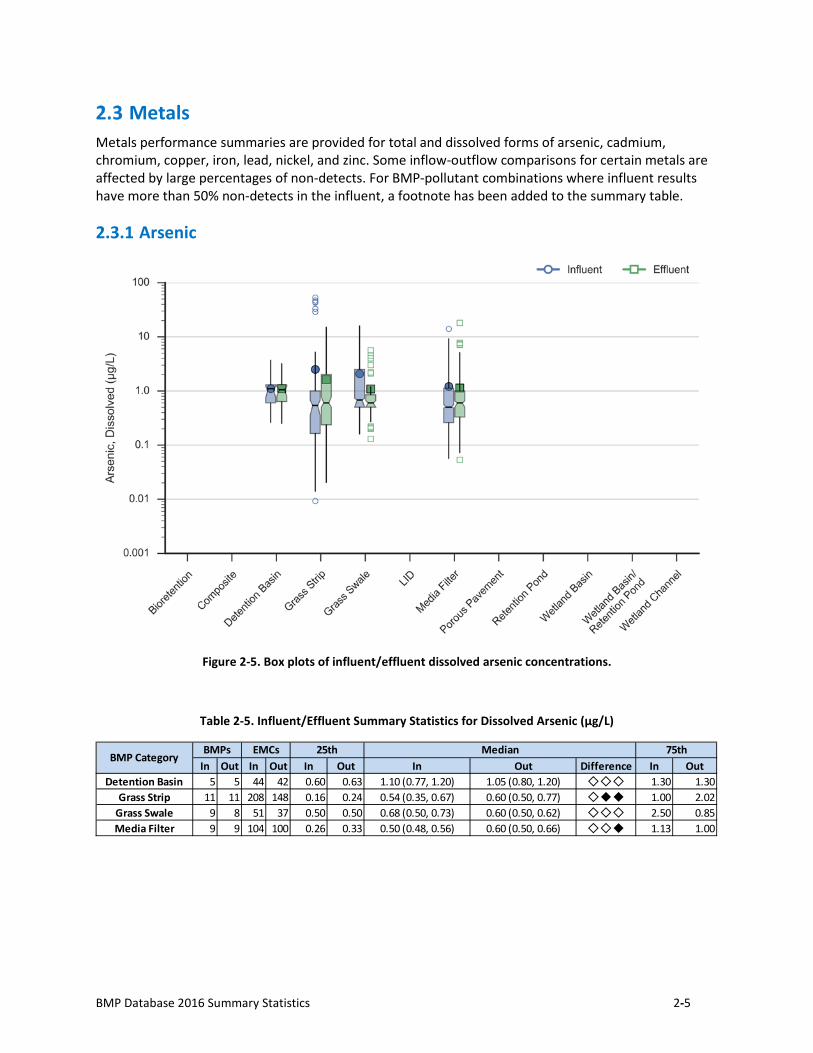
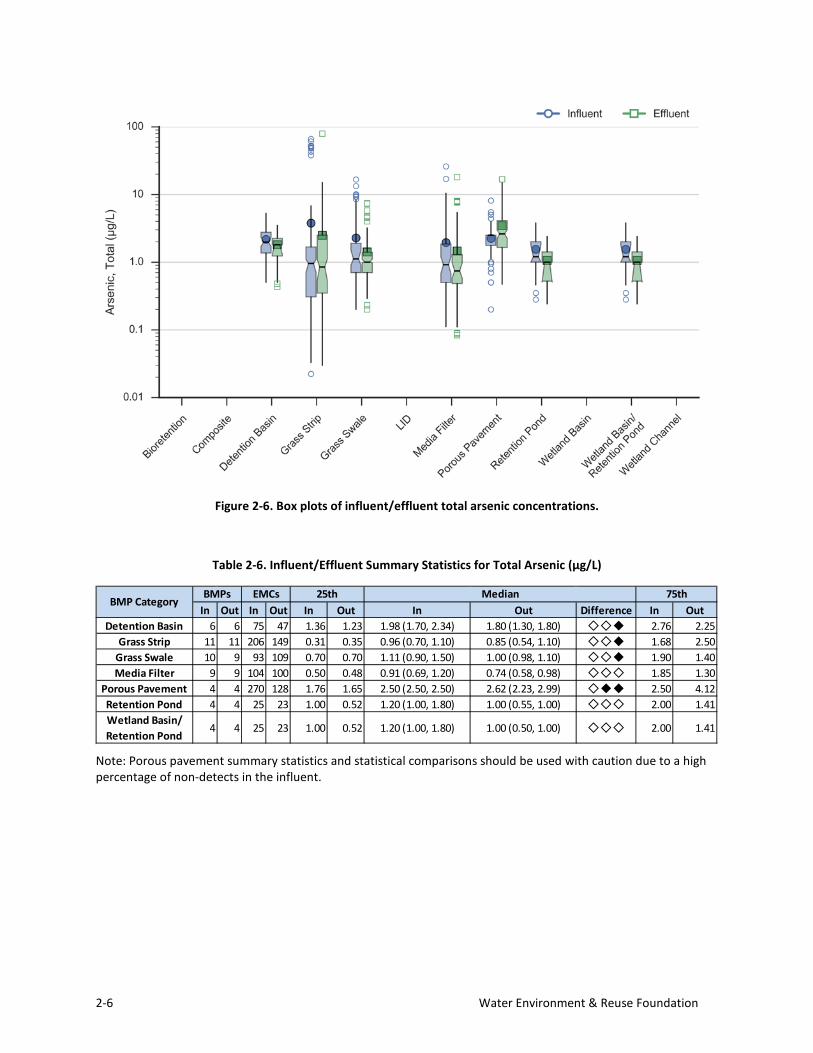
Metals Metals performance summaries are provided for total and dissolved forms of arsenic, cadmium, chromium, copper, iron, lead, nickel, and zinc. Some inflow-outflow comparisons for certain metals are affected by large percentages of non-detects. For BMP-pollutant combinations where influent results have more than 50% non-detects in the influent, a footnote has been added to the summary table.
2.3.1 Arsenic
Figure 2-5. Box plots of influent/effluent dissolved arsenic concentrations.
Table 2-5. Influent/Effluent Summary Statistics for Dissolved Arsenic (µg/L)
In Out In Out In Out In Out Difference In OutDetention Basin 5 5 44 42 0.60 0.63 1.10 (0.77, 1.20) 1.05 (0.80, 1.20) ◇◇◇ 1.30 1.30
Grass Strip 11 11 208 148 0.16 0.24 0.54 (0.35, 0.67) 0.60 (0.50, 0.77) ◇◆◆ 1.00 2.02Grass Swale 9 8 51 37 0.50 0.50 0.68 (0.50, 0.73) 0.60 (0.50, 0.62) ◇◇◇ 2.50 0.85Media Filter 9 9 104 100 0.26 0.33 0.50 (0.48, 0.56) 0.60 (0.50, 0.66) ◇◇◆ 1.13 1.00
BMPs 75thEMCs 25th MedianBMP Category
2-6 Water Environment & Reuse Foundation
Figure 2-6. Box plots of influent/effluent total arsenic concentrations.
Table 2-6. Influent/Effluent Summary Statistics for Total Arsenic (µg/L)
Note: Porous pavement summary statistics and statistical comparisons should be used with caution due to a high percentage of non-detects in the influent.
In Out In Out In Out In Out Difference In OutDetention Basin 6 6 75 47 1.36 1.23 1.98 (1.70, 2.34) 1.80 (1.30, 1.80) ◇◇◆ 2.76 2.25
Grass Strip 11 11 206 149 0.31 0.35 0.96 (0.70, 1.10) 0.85 (0.54, 1.10) ◇◇◆ 1.68 2.50Grass Swale 10 9 93 109 0.70 0.70 1.11 (0.90, 1.50) 1.00 (0.98, 1.10) ◇◇◆ 1.90 1.40Media Filter 9 9 104 100 0.50 0.48 0.91 (0.69, 1.20) 0.74 (0.58, 0.98) ◇◇◇ 1.85 1.30
Porous Pavement 4 4 270 128 1.76 1.65 2.50 (2.50, 2.50) 2.62 (2.23, 2.99) ◇◆◆ 2.50 4.12Retention Pond 4 4 25 23 1.00 0.52 1.20 (1.00, 1.80) 1.00 (0.55, 1.00) ◇◇◇ 2.00 1.41Wetland Basin/ Retention Pond
4 4 25 23 1.00 0.52 1.20 (1.00, 1.80) 1.00 (0.50, 1.00) ◇◇◇ 2.00 1.41
BMPs 75thEMCs 25th MedianBMP Category
BMP Database 2016 Summary Statistics 2-7
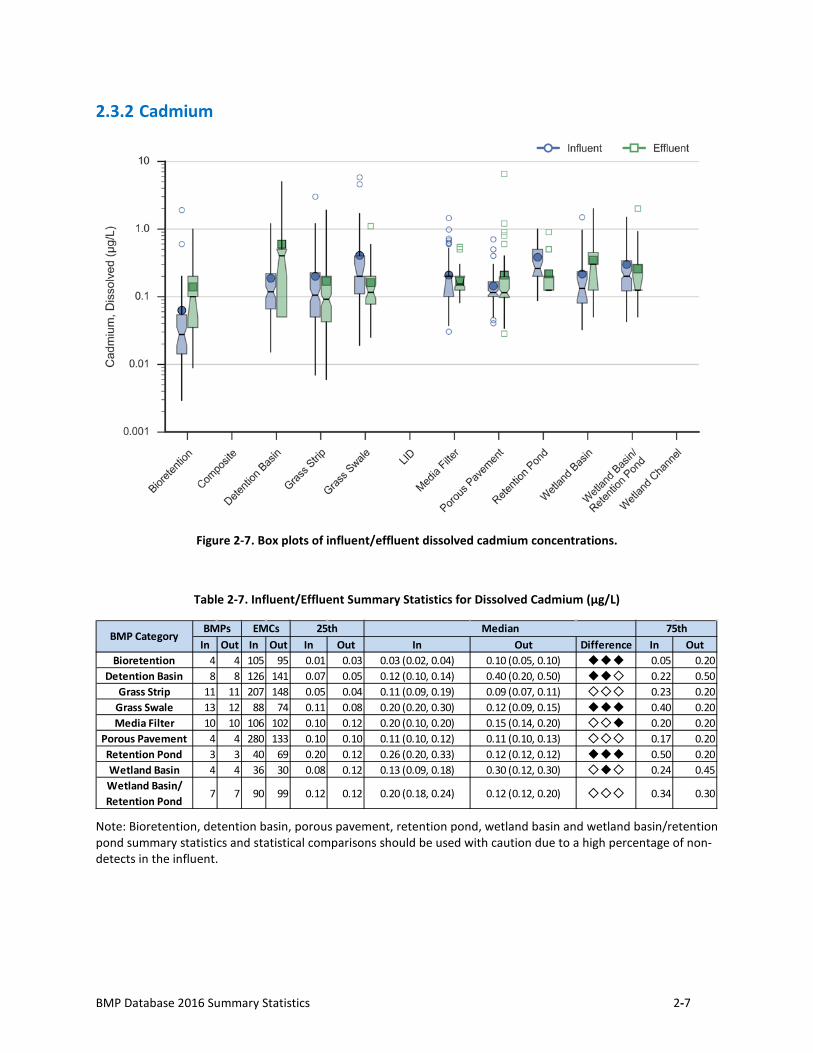
2.3.2 Cadmium
Figure 2-7. Box plots of influent/effluent dissolved cadmium concentrations.
Table 2-7. Influent/Effluent Summary Statistics for Dissolved Cadmium (µg/L)
Note: Bioretention, detention basin, porous pavement, retention pond, wetland basin and wetland basin/retention pond summary statistics and statistical comparisons should be used with caution due to a high percentage of non-detects in the influent.
In Out In Out In Out In Out Difference In OutBioretention 4 4 105 95 0.01 0.03 0.03 (0.02, 0.04) 0.10 (0.05, 0.10) ◆◆◆ 0.05 0.20
Detention Basin 8 8 126 141 0.07 0.05 0.12 (0.10, 0.14) 0.40 (0.20, 0.50) ◆◆◇ 0.22 0.50Grass Strip 11 11 207 148 0.05 0.04 0.11 (0.09, 0.19) 0.09 (0.07, 0.11) ◇◇◇ 0.23 0.20
Grass Swale 13 12 88 74 0.11 0.08 0.20 (0.20, 0.30) 0.12 (0.09, 0.15) ◆◆◆ 0.40 0.20Media Filter 10 10 106 102 0.10 0.12 0.20 (0.10, 0.20) 0.15 (0.14, 0.20) ◇◇◆ 0.20 0.20
Porous Pavement 4 4 280 133 0.10 0.10 0.11 (0.10, 0.12) 0.11 (0.10, 0.13) ◇◇◇ 0.17 0.20Retention Pond 3 3 40 69 0.20 0.12 0.26 (0.20, 0.33) 0.12 (0.12, 0.12) ◆◆◆ 0.50 0.20Wetland Basin 4 4 36 30 0.08 0.12 0.13 (0.09, 0.18) 0.30 (0.12, 0.30) ◇◆◇ 0.24 0.45Wetland Basin/ Retention Pond
7 7 90 99 0.12 0.12 0.20 (0.18, 0.24) 0.12 (0.12, 0.20) ◇◇◇ 0.34 0.30
BMPs 75thEMCs 25th MedianBMP Category
2-8 Water Environment & Reuse Foundation
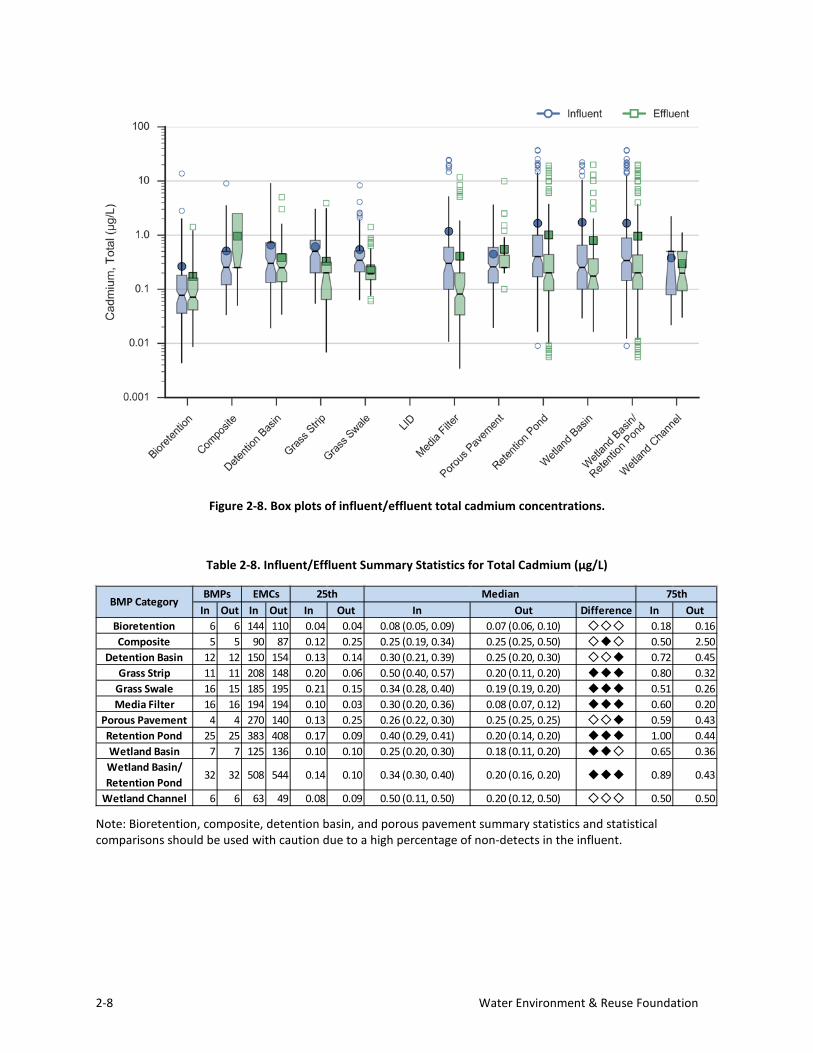
Figure 2-8. Box plots of influent/effluent total cadmium concentrations.
Table 2-8. Influent/Effluent Summary Statistics for Total Cadmium (µg/L)
Note: Bioretention, composite, detention basin, and porous pavement summary statistics and statistical comparisons should be used with caution due to a high percentage of non-detects in the influent.
In Out In Out In Out In Out Difference In OutBioretention 6 6 144 110 0.04 0.04 0.08 (0.05, 0.09) 0.07 (0.06, 0.10) ◇◇◇ 0.18 0.16Composite 5 5 90 87 0.12 0.25 0.25 (0.19, 0.34) 0.25 (0.25, 0.50) ◇◆◇ 0.50 2.50
Detention Basin 12 12 150 154 0.13 0.14 0.30 (0.21, 0.39) 0.25 (0.20, 0.30) ◇◇◆ 0.72 0.45Grass Strip 11 11 208 148 0.20 0.06 0.50 (0.40, 0.57) 0.20 (0.11, 0.20) ◆◆◆ 0.80 0.32
Grass Swale 16 15 185 195 0.21 0.15 0.34 (0.28, 0.40) 0.19 (0.19, 0.20) ◆◆◆ 0.51 0.26Media Filter 16 16 194 194 0.10 0.03 0.30 (0.20, 0.36) 0.08 (0.07, 0.12) ◆◆◆ 0.60 0.20
Porous Pavement 4 4 270 140 0.13 0.25 0.26 (0.22, 0.30) 0.25 (0.25, 0.25) ◇◇◆ 0.59 0.43Retention Pond 25 25 383 408 0.17 0.09 0.40 (0.29, 0.41) 0.20 (0.14, 0.20) ◆◆◆ 1.00 0.44Wetland Basin 7 7 125 136 0.10 0.10 0.25 (0.20, 0.30) 0.18 (0.11, 0.20) ◆◆◇ 0.65 0.36Wetland Basin/ Retention Pond
32 32 508 544 0.14 0.10 0.34 (0.30, 0.40) 0.20 (0.16, 0.20) ◆◆◆ 0.89 0.43
Wetland Channel 6 6 63 49 0.08 0.09 0.50 (0.11, 0.50) 0.20 (0.12, 0.50) ◇◇◇ 0.50 0.50
BMPs 75thEMCs 25th MedianBMP Category
BMP Database 2016 Summary Statistics 2-9
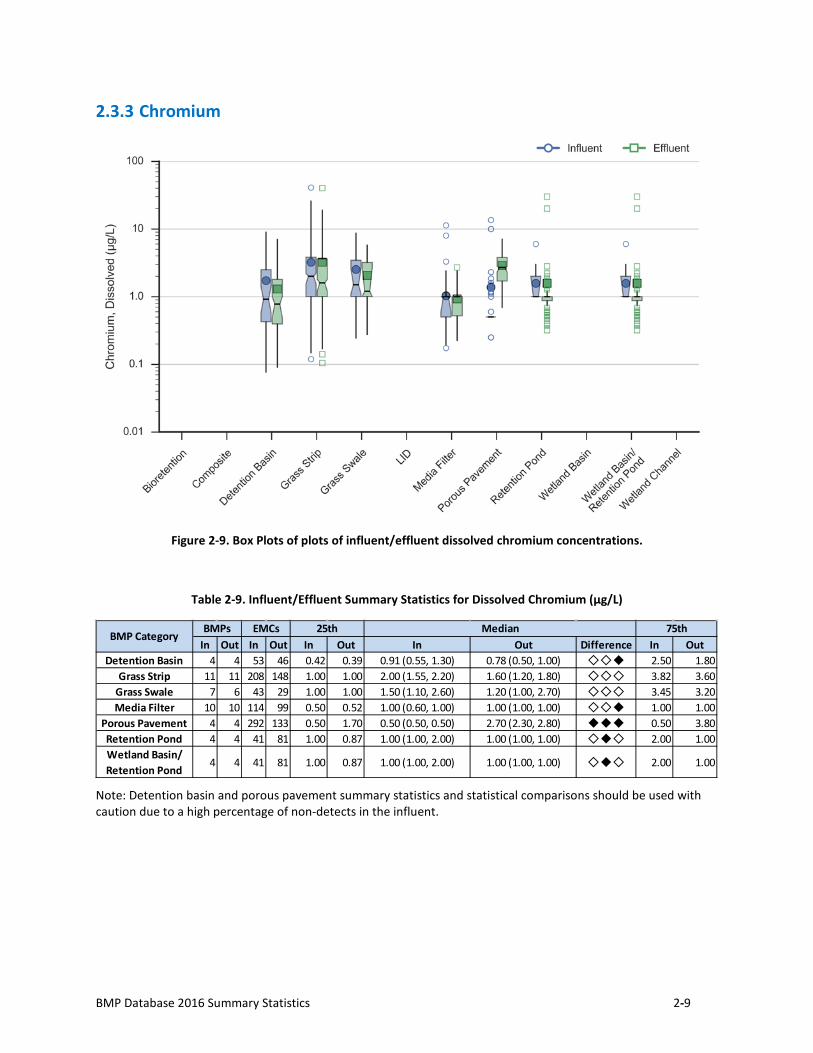
2.3.3 Chromium
Figure 2-9. Box Plots of plots of influent/effluent dissolved chromium concentrations.
Table 2-9. Influent/Effluent Summary Statistics for Dissolved Chromium (µg/L)
Note: Detention basin and porous pavement summary statistics and statistical comparisons should be used with caution due to a high percentage of non-detects in the influent.
In Out In Out In Out In Out Difference In OutDetention Basin 4 4 53 46 0.42 0.39 0.91 (0.55, 1.30) 0.78 (0.50, 1.00) ◇◇◆ 2.50 1.80
Grass Strip 11 11 208 148 1.00 1.00 2.00 (1.55, 2.20) 1.60 (1.20, 1.80) ◇◇◇ 3.82 3.60Grass Swale 7 6 43 29 1.00 1.00 1.50 (1.10, 2.60) 1.20 (1.00, 2.70) ◇◇◇ 3.45 3.20Media Filter 10 10 114 99 0.50 0.52 1.00 (0.60, 1.00) 1.00 (1.00, 1.00) ◇◇◆ 1.00 1.00
Porous Pavement 4 4 292 133 0.50 1.70 0.50 (0.50, 0.50) 2.70 (2.30, 2.80) ◆◆◆ 0.50 3.80Retention Pond 4 4 41 81 1.00 0.87 1.00 (1.00, 2.00) 1.00 (1.00, 1.00) ◇◆◇ 2.00 1.00Wetland Basin/ Retention Pond
4 4 41 81 1.00 0.87 1.00 (1.00, 2.00) 1.00 (1.00, 1.00) ◇◆◇ 2.00 1.00
BMPs 75thEMCs 25th MedianBMP Category
2-10 Water Environment & Reuse Foundation
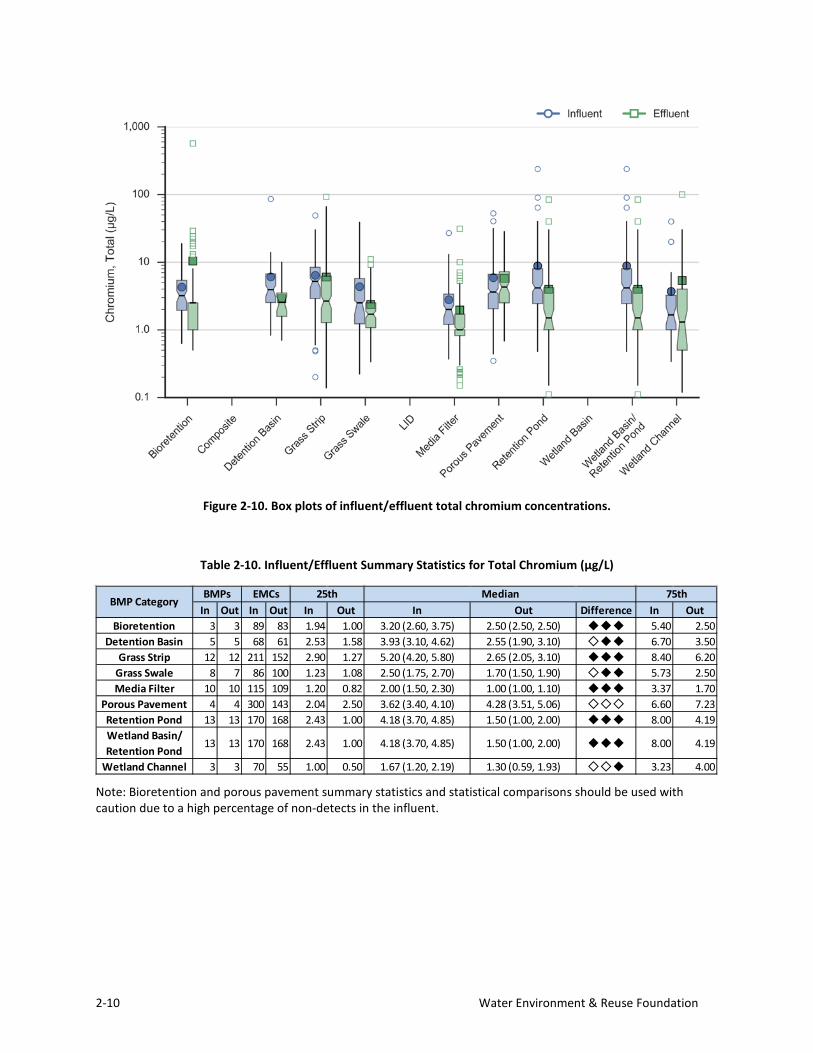
Figure 2-10. Box plots of influent/effluent total chromium concentrations.
Table 2-10. Influent/Effluent Summary Statistics for Total Chromium (µg/L)
Note: Bioretention and porous pavement summary statistics and statistical comparisons should be used with caution due to a high percentage of non-detects in the influent.
In Out In Out In Out In Out Difference In OutBioretention 3 3 89 83 1.94 1.00 3.20 (2.60, 3.75) 2.50 (2.50, 2.50) ◆◆◆ 5.40 2.50
Detention Basin 5 5 68 61 2.53 1.58 3.93 (3.10, 4.62) 2.55 (1.90, 3.10) ◇◆◆ 6.70 3.50Grass Strip 12 12 211 152 2.90 1.27 5.20 (4.20, 5.80) 2.65 (2.05, 3.10) ◆◆◆ 8.40 6.20
Grass Swale 8 7 86 100 1.23 1.08 2.50 (1.75, 2.70) 1.70 (1.50, 1.90) ◇◆◆ 5.73 2.50Media Filter 10 10 115 109 1.20 0.82 2.00 (1.50, 2.30) 1.00 (1.00, 1.10) ◆◆◆ 3.37 1.70
Porous Pavement 4 4 300 143 2.04 2.50 3.62 (3.40, 4.10) 4.28 (3.51, 5.06) ◇◇◇ 6.60 7.23Retention Pond 13 13 170 168 2.43 1.00 4.18 (3.70, 4.85) 1.50 (1.00, 2.00) ◆◆◆ 8.00 4.19Wetland Basin/ Retention Pond
13 13 170 168 2.43 1.00 4.18 (3.70, 4.85) 1.50 (1.00, 2.00) ◆◆◆ 8.00 4.19
Wetland Channel 3 3 70 55 1.00 0.50 1.67 (1.20, 2.19) 1.30 (0.59, 1.93) ◇◇◆ 3.23 4.00
BMPs 75thEMCs 25th MedianBMP Category
BMP Database 2016 Summary Statistics 2-11
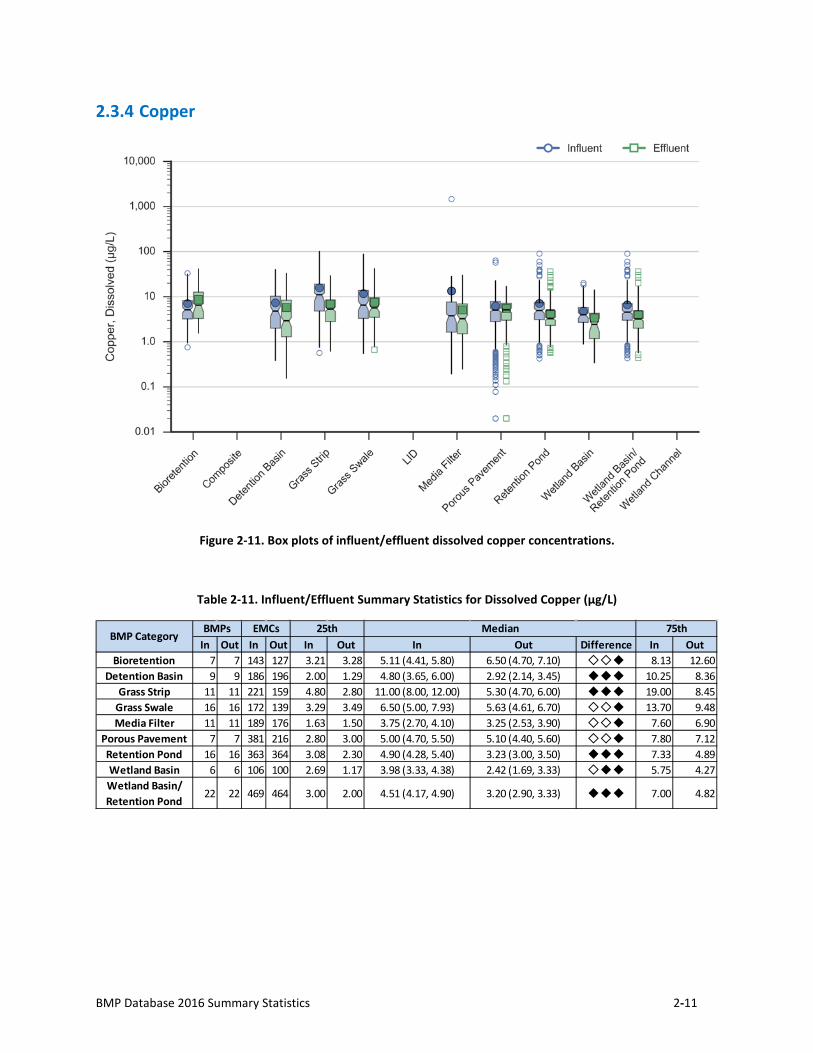
2.3.4 Copper
Figure 2-11. Box plots of influent/effluent dissolved copper concentrations.
Table 2-11. Influent/Effluent Summary Statistics for Dissolved Copper (µg/L)
In Out In Out In Out In Out Difference In OutBioretention 7 7 143 127 3.21 3.28 5.11 (4.41, 5.80) 6.50 (4.70, 7.10) ◇◇◆ 8.13 12.60
Detention Basin 9 9 186 196 2.00 1.29 4.80 (3.65, 6.00) 2.92 (2.14, 3.45) ◆◆◆ 10.25 8.36Grass Strip 11 11 221 159 4.80 2.80 11.00 (8.00, 12.00) 5.30 (4.70, 6.00) ◆◆◆ 19.00 8.45
Grass Swale 16 16 172 139 3.29 3.49 6.50 (5.00, 7.93) 5.63 (4.61, 6.70) ◇◇◆ 13.70 9.48Media Filter 11 11 189 176 1.63 1.50 3.75 (2.70, 4.10) 3.25 (2.53, 3.90) ◇◇◆ 7.60 6.90
Porous Pavement 7 7 381 216 2.80 3.00 5.00 (4.70, 5.50) 5.10 (4.40, 5.60) ◇◇◆ 7.80 7.12Retention Pond 16 16 363 364 3.08 2.30 4.90 (4.28, 5.40) 3.23 (3.00, 3.50) ◆◆◆ 7.33 4.89Wetland Basin 6 6 106 100 2.69 1.17 3.98 (3.33, 4.38) 2.42 (1.69, 3.33) ◇◆◆ 5.75 4.27Wetland Basin/ Retention Pond
22 22 469 464 3.00 2.00 4.51 (4.17, 4.90) 3.20 (2.90, 3.33) ◆◆◆ 7.00 4.82
BMPs 75thEMCs 25th MedianBMP Category
2-12 Water Environment & Reuse Foundation
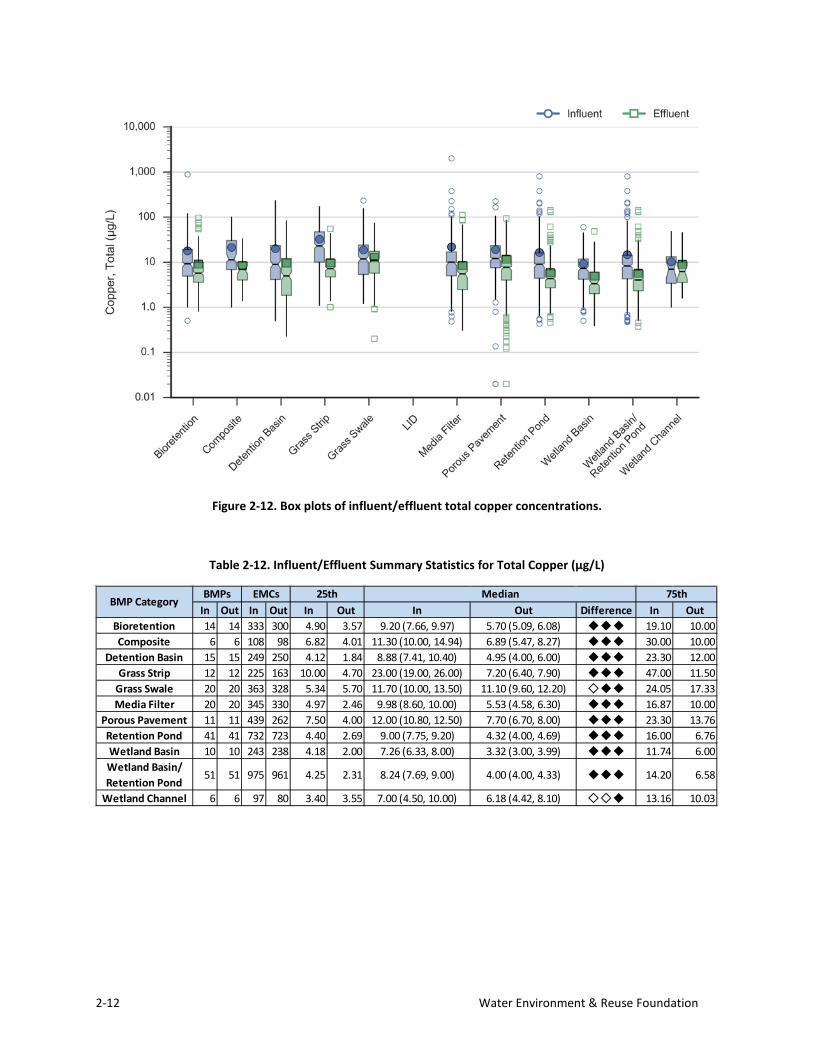
Figure 2-12. Box plots of influent/effluent total copper concentrations.
Table 2-12. Influent/Effluent Summary Statistics for Total Copper (µg/L)
In Out In Out In Out In Out Difference In OutBioretention 14 14 333 300 4.90 3.57 9.20 (7.66, 9.97) 5.70 (5.09, 6.08) ◆◆◆ 19.10 10.00Composite 6 6 108 98 6.82 4.01 11.30 (10.00, 14.94) 6.89 (5.47, 8.27) ◆◆◆ 30.00 10.00
Detention Basin 15 15 249 250 4.12 1.84 8.88 (7.41, 10.40) 4.95 (4.00, 6.00) ◆◆◆ 23.30 12.00Grass Strip 12 12 225 163 10.00 4.70 23.00 (19.00, 26.00) 7.20 (6.40, 7.90) ◆◆◆ 47.00 11.50
Grass Swale 20 20 363 328 5.34 5.70 11.70 (10.00, 13.50) 11.10 (9.60, 12.20) ◇◆◆ 24.05 17.33Media Filter 20 20 345 330 4.97 2.46 9.98 (8.60, 10.00) 5.53 (4.58, 6.30) ◆◆◆ 16.87 10.00
Porous Pavement 11 11 439 262 7.50 4.00 12.00 (10.80, 12.50) 7.70 (6.70, 8.00) ◆◆◆ 23.30 13.76Retention Pond 41 41 732 723 4.40 2.69 9.00 (7.75, 9.20) 4.32 (4.00, 4.69) ◆◆◆ 16.00 6.76Wetland Basin 10 10 243 238 4.18 2.00 7.26 (6.33, 8.00) 3.32 (3.00, 3.99) ◆◆◆ 11.74 6.00Wetland Basin/ Retention Pond
51 51 975 961 4.25 2.31 8.24 (7.69, 9.00) 4.00 (4.00, 4.33) ◆◆◆ 14.20 6.58
Wetland Channel 6 6 97 80 3.40 3.55 7.00 (4.50, 10.00) 6.18 (4.42, 8.10) ◇◇◆ 13.16 10.03
BMPs 75thEMCs 25th MedianBMP Category
BMP Database 2016 Summary Statistics 2-13
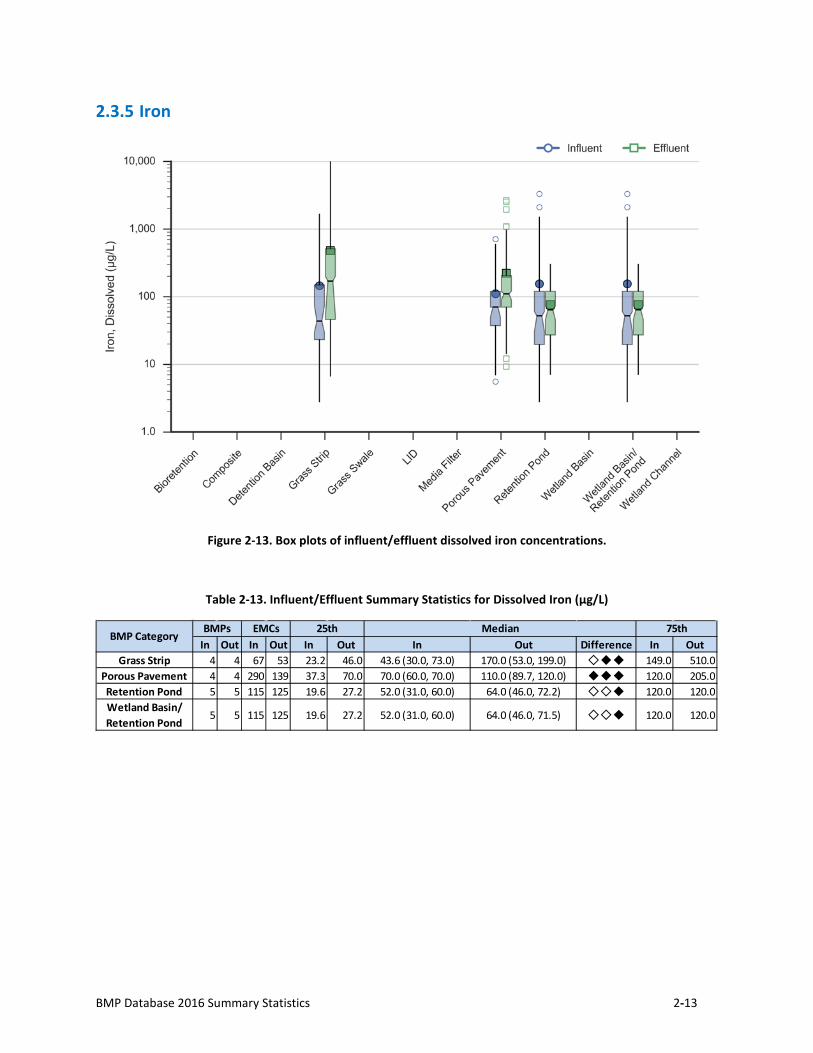
2.3.5 Iron
Figure 2-13. Box plots of influent/effluent dissolved iron concentrations.
Table 2-13. Influent/Effluent Summary Statistics for Dissolved Iron (µg/L)
In Out In Out In Out In Out Difference In OutGrass Strip 4 4 67 53 23.2 46.0 43.6 (30.0, 73.0) 170.0 (53.0, 199.0) ◇◆◆ 149.0 510.0
Porous Pavement 4 4 290 139 37.3 70.0 70.0 (60.0, 70.0) 110.0 (89.7, 120.0) ◆◆◆ 120.0 205.0Retention Pond 5 5 115 125 19.6 27.2 52.0 (31.0, 60.0) 64.0 (46.0, 72.2) ◇◇◆ 120.0 120.0Wetland Basin/ Retention Pond
5 5 115 125 19.6 27.2 52.0 (31.0, 60.0) 64.0 (46.0, 71.5) ◇◇◆ 120.0 120.0
BMPs 75thEMCs 25th MedianBMP Category
2-14 Water Environment & Reuse Foundation
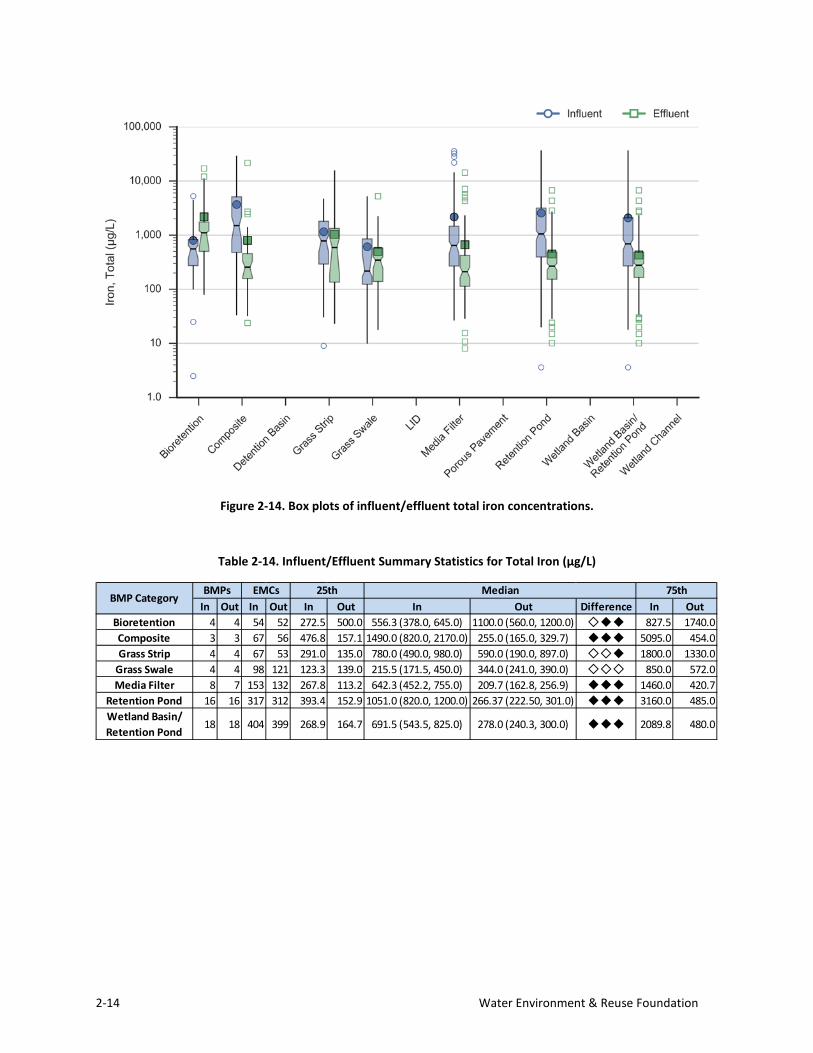
Figure 2-14. Box plots of influent/effluent total iron concentrations.
Table 2-14. Influent/Effluent Summary Statistics for Total Iron (µg/L)
In Out In Out In Out In Out Difference In OutBioretention 4 4 54 52 272.5 500.0 556.3 (378.0, 645.0) 1100.0 (560.0, 1200.0) ◇◆◆ 827.5 1740.0Composite 3 3 67 56 476.8 157.1 1490.0 (820.0, 2170.0) 255.0 (165.0, 329.7) ◆◆◆ 5095.0 454.0Grass Strip 4 4 67 53 291.0 135.0 780.0 (490.0, 980.0) 590.0 (190.0, 897.0) ◇◇◆ 1800.0 1330.0
Grass Swale 4 4 98 121 123.3 139.0 215.5 (171.5, 450.0) 344.0 (241.0, 390.0) ◇◇◇ 850.0 572.0Media Filter 8 7 153 132 267.8 113.2 642.3 (452.2, 755.0) 209.7 (162.8, 256.9) ◆◆◆ 1460.0 420.7
Retention Pond 16 16 317 312 393.4 152.9 1051.0 (820.0, 1200.0) 266.37 (222.50, 301.0) ◆◆◆ 3160.0 485.0Wetland Basin/ Retention Pond
18 18 404 399 268.9 164.7 691.5 (543.5, 825.0) 278.0 (240.3, 300.0) ◆◆◆ 2089.8 480.0
BMPs 75thEMCs 25th MedianBMP Category
BMP Database 2016 Summary Statistics 2-15
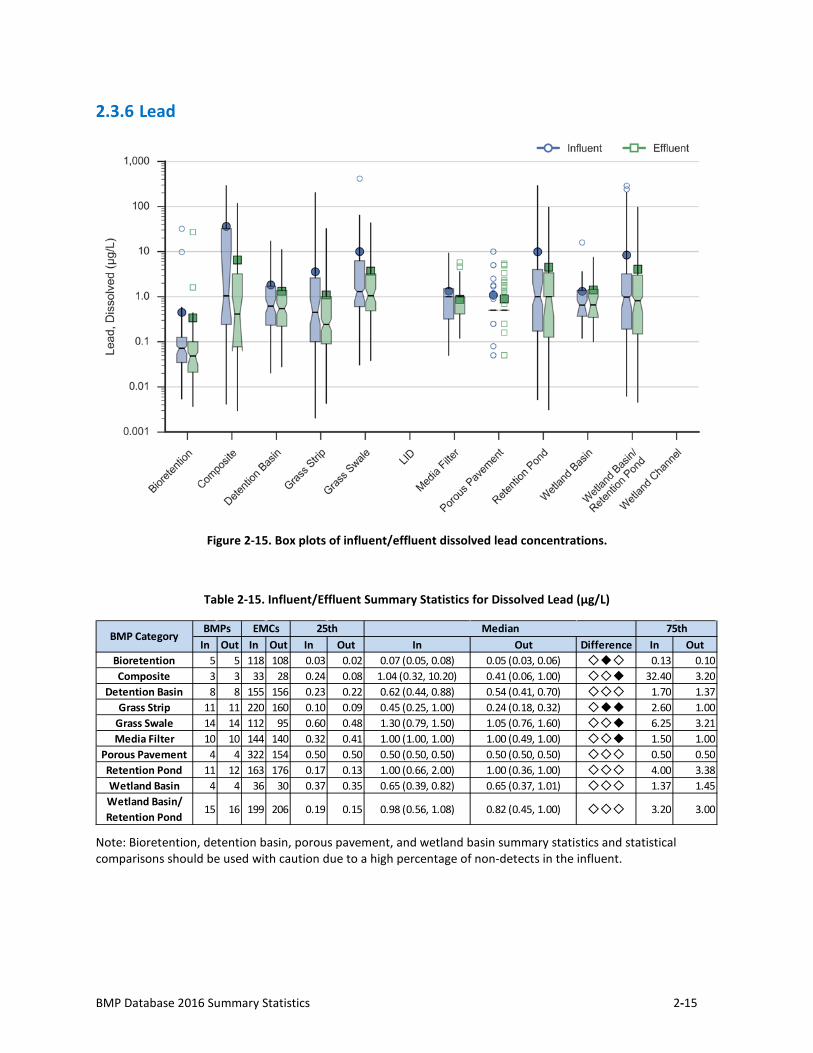
2.3.6 Lead
Figure 2-15. Box plots of influent/effluent dissolved lead concentrations.
Table 2-15. Influent/Effluent Summary Statistics for Dissolved Lead (µg/L)
Note: Bioretention, detention basin, porous pavement, and wetland basin summary statistics and statistical comparisons should be used with caution due to a high percentage of non-detects in the influent.
In Out In Out In Out In Out Difference In OutBioretention 5 5 118 108 0.03 0.02 0.07 (0.05, 0.08) 0.05 (0.03, 0.06) ◇◆◇ 0.13 0.10Composite 3 3 33 28 0.24 0.08 1.04 (0.32, 10.20) 0.41 (0.06, 1.00) ◇◇◆ 32.40 3.20
Detention Basin 8 8 155 156 0.23 0.22 0.62 (0.44, 0.88) 0.54 (0.41, 0.70) ◇◇◇ 1.70 1.37Grass Strip 11 11 220 160 0.10 0.09 0.45 (0.25, 1.00) 0.24 (0.18, 0.32) ◇◆◆ 2.60 1.00
Grass Swale 14 14 112 95 0.60 0.48 1.30 (0.79, 1.50) 1.05 (0.76, 1.60) ◇◇◆ 6.25 3.21Media Filter 10 10 144 140 0.32 0.41 1.00 (1.00, 1.00) 1.00 (0.49, 1.00) ◇◇◆ 1.50 1.00
Porous Pavement 4 4 322 154 0.50 0.50 0.50 (0.50, 0.50) 0.50 (0.50, 0.50) ◇◇◇ 0.50 0.50Retention Pond 11 12 163 176 0.17 0.13 1.00 (0.66, 2.00) 1.00 (0.36, 1.00) ◇◇◇ 4.00 3.38Wetland Basin 4 4 36 30 0.37 0.35 0.65 (0.39, 0.82) 0.65 (0.37, 1.01) ◇◇◇ 1.37 1.45Wetland Basin/ Retention Pond
15 16 199 206 0.19 0.15 0.98 (0.56, 1.08) 0.82 (0.45, 1.00) ◇◇◇ 3.20 3.00
BMPs 75thEMCs 25th MedianBMP Category
2-16 Water Environment & Reuse Foundation
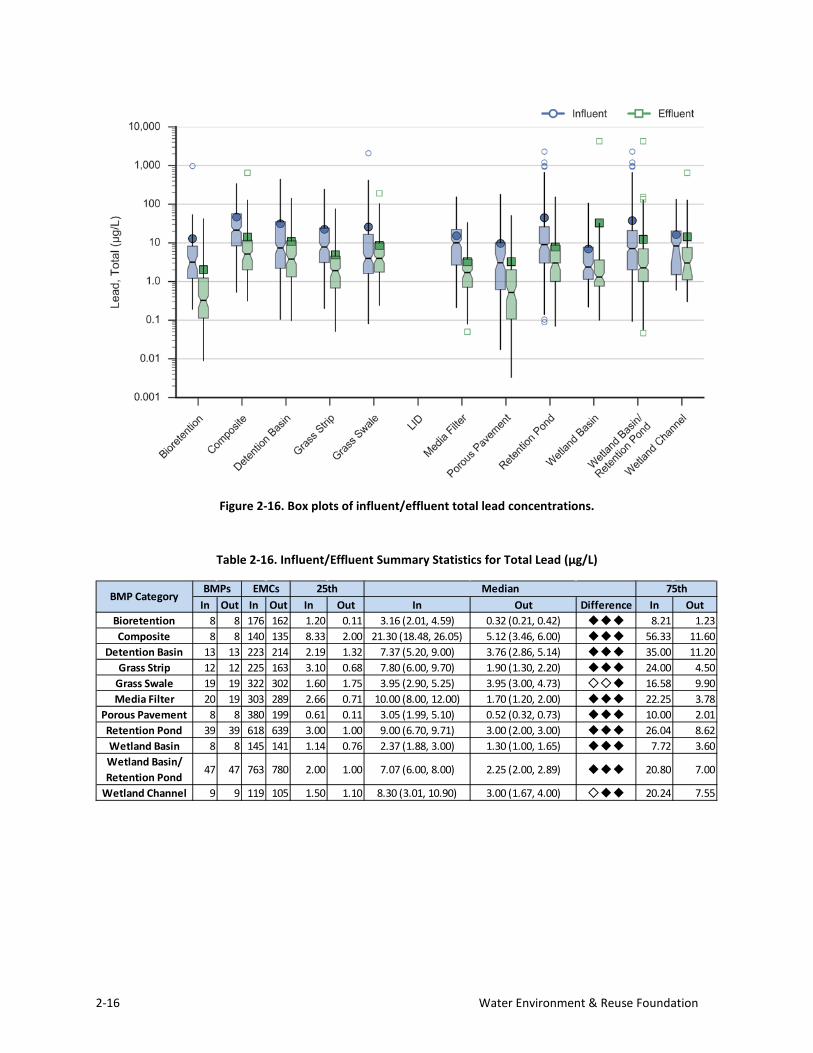
Figure 2-16. Box plots of influent/effluent total lead concentrations.
Table 2-16. Influent/Effluent Summary Statistics for Total Lead (µg/L)
In Out In Out In Out In Out Difference In OutBioretention 8 8 176 162 1.20 0.11 3.16 (2.01, 4.59) 0.32 (0.21, 0.42) ◆◆◆ 8.21 1.23Composite 8 8 140 135 8.33 2.00 21.30 (18.48, 26.05) 5.12 (3.46, 6.00) ◆◆◆ 56.33 11.60
Detention Basin 13 13 223 214 2.19 1.32 7.37 (5.20, 9.00) 3.76 (2.86, 5.14) ◆◆◆ 35.00 11.20Grass Strip 12 12 225 163 3.10 0.68 7.80 (6.00, 9.70) 1.90 (1.30, 2.20) ◆◆◆ 24.00 4.50
Grass Swale 19 19 322 302 1.60 1.75 3.95 (2.90, 5.25) 3.95 (3.00, 4.73) ◇◇◆ 16.58 9.90Media Filter 20 19 303 289 2.66 0.71 10.00 (8.00, 12.00) 1.70 (1.20, 2.00) ◆◆◆ 22.25 3.78
Porous Pavement 8 8 380 199 0.61 0.11 3.05 (1.99, 5.10) 0.52 (0.32, 0.73) ◆◆◆ 10.00 2.01Retention Pond 39 39 618 639 3.00 1.00 9.00 (6.70, 9.71) 3.00 (2.00, 3.00) ◆◆◆ 26.04 8.62Wetland Basin 8 8 145 141 1.14 0.76 2.37 (1.88, 3.00) 1.30 (1.00, 1.65) ◆◆◆ 7.72 3.60Wetland Basin/ Retention Pond
47 47 763 780 2.00 1.00 7.07 (6.00, 8.00) 2.25 (2.00, 2.89) ◆◆◆ 20.80 7.00
Wetland Channel 9 9 119 105 1.50 1.10 8.30 (3.01, 10.90) 3.00 (1.67, 4.00) ◇◆◆ 20.24 7.55
BMPs 75thEMCs 25th MedianBMP Category
BMP Database 2016 Summary Statistics 2-17
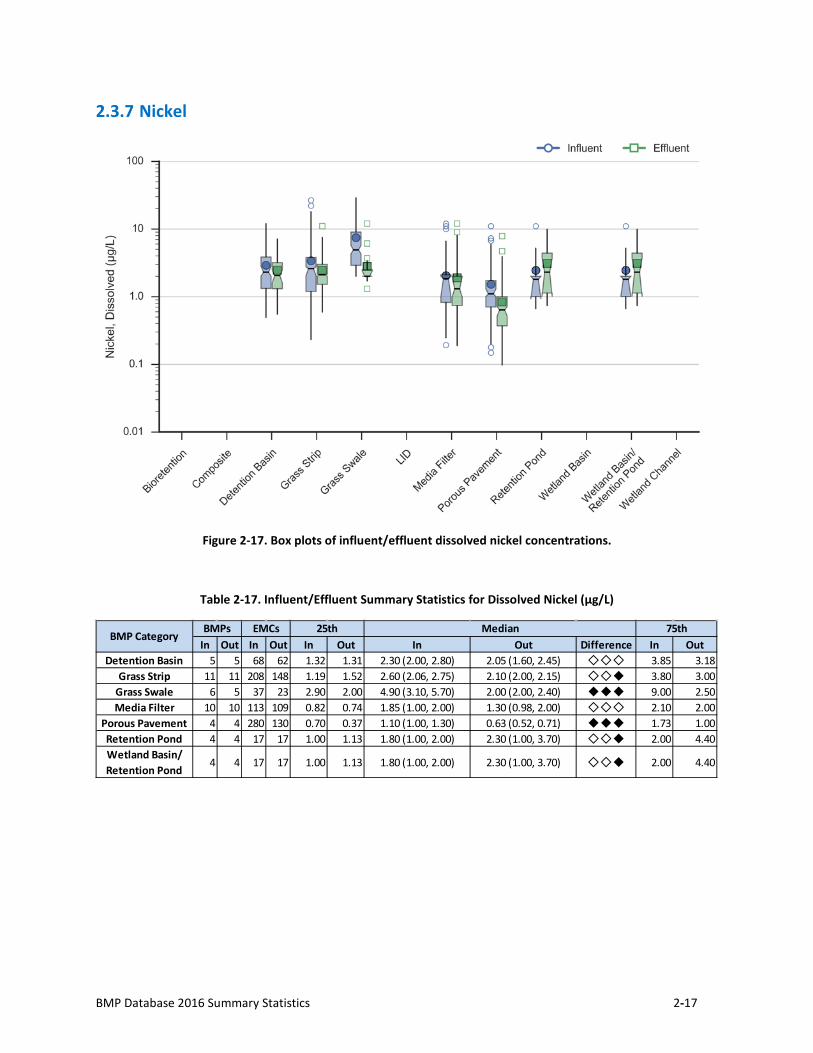
2.3.7 Nickel
Figure 2-17. Box plots of influent/effluent dissolved nickel concentrations.
Table 2-17. Influent/Effluent Summary Statistics for Dissolved Nickel (µg/L)
In Out In Out In Out In Out Difference In OutDetention Basin 5 5 68 62 1.32 1.31 2.30 (2.00, 2.80) 2.05 (1.60, 2.45) ◇◇◇ 3.85 3.18
Grass Strip 11 11 208 148 1.19 1.52 2.60 (2.06, 2.75) 2.10 (2.00, 2.15) ◇◇◆ 3.80 3.00Grass Swale 6 5 37 23 2.90 2.00 4.90 (3.10, 5.70) 2.00 (2.00, 2.40) ◆◆◆ 9.00 2.50Media Filter 10 10 113 109 0.82 0.74 1.85 (1.00, 2.00) 1.30 (0.98, 2.00) ◇◇◇ 2.10 2.00
Porous Pavement 4 4 280 130 0.70 0.37 1.10 (1.00, 1.30) 0.63 (0.52, 0.71) ◆◆◆ 1.73 1.00Retention Pond 4 4 17 17 1.00 1.13 1.80 (1.00, 2.00) 2.30 (1.00, 3.70) ◇◇◆ 2.00 4.40Wetland Basin/ Retention Pond
4 4 17 17 1.00 1.13 1.80 (1.00, 2.00) 2.30 (1.00, 3.70) ◇◇◆ 2.00 4.40
BMPs 75thEMCs 25th MedianBMP Category
2-18 Water Environment & Reuse Foundation
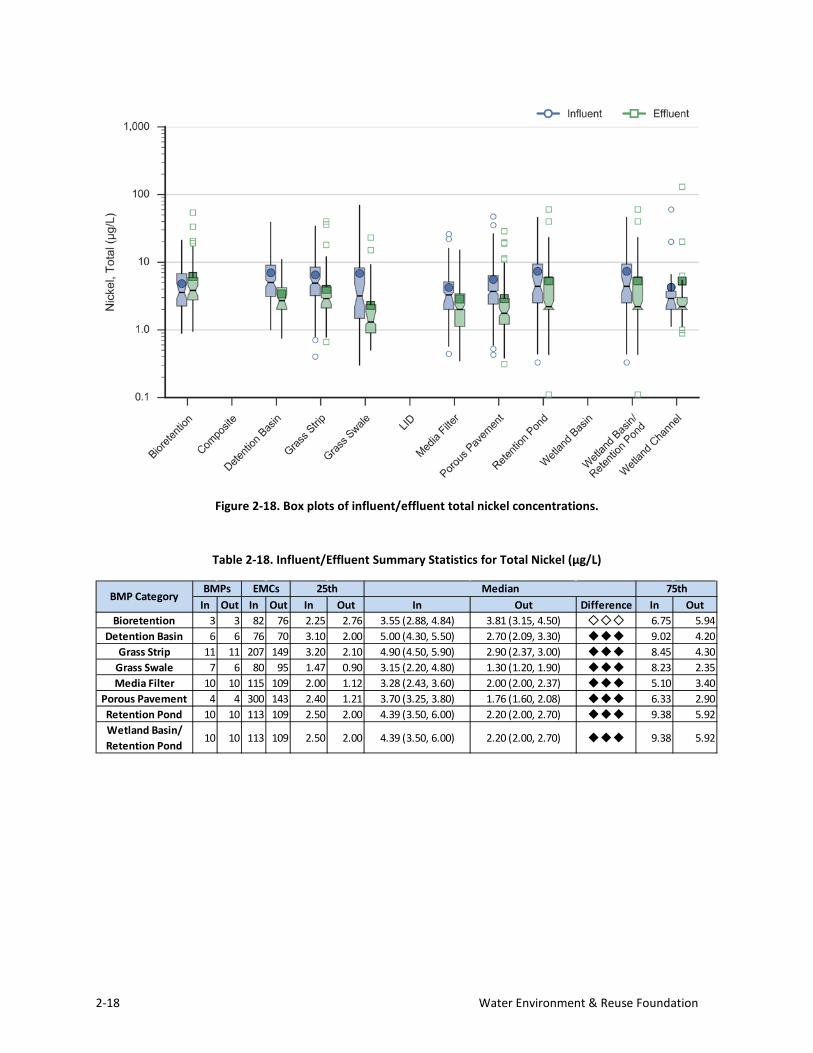
Figure 2-18. Box plots of influent/effluent total nickel concentrations.
Table 2-18. Influent/Effluent Summary Statistics for Total Nickel (µg/L)
In Out In Out In Out In Out Difference In OutBioretention 3 3 82 76 2.25 2.76 3.55 (2.88, 4.84) 3.81 (3.15, 4.50) ◇◇◇ 6.75 5.94
Detention Basin 6 6 76 70 3.10 2.00 5.00 (4.30, 5.50) 2.70 (2.09, 3.30) ◆◆◆ 9.02 4.20Grass Strip 11 11 207 149 3.20 2.10 4.90 (4.50, 5.90) 2.90 (2.37, 3.00) ◆◆◆ 8.45 4.30
Grass Swale 7 6 80 95 1.47 0.90 3.15 (2.20, 4.80) 1.30 (1.20, 1.90) ◆◆◆ 8.23 2.35Media Filter 10 10 115 109 2.00 1.12 3.28 (2.43, 3.60) 2.00 (2.00, 2.37) ◆◆◆ 5.10 3.40
Porous Pavement 4 4 300 143 2.40 1.21 3.70 (3.25, 3.80) 1.76 (1.60, 2.08) ◆◆◆ 6.33 2.90Retention Pond 10 10 113 109 2.50 2.00 4.39 (3.50, 6.00) 2.20 (2.00, 2.70) ◆◆◆ 9.38 5.92Wetland Basin/ Retention Pond
10 10 113 109 2.50 2.00 4.39 (3.50, 6.00) 2.20 (2.00, 2.70) ◆◆◆ 9.38 5.92
BMPs 75thEMCs 25th MedianBMP Category
BMP Database 2016 Summary Statistics 2-19
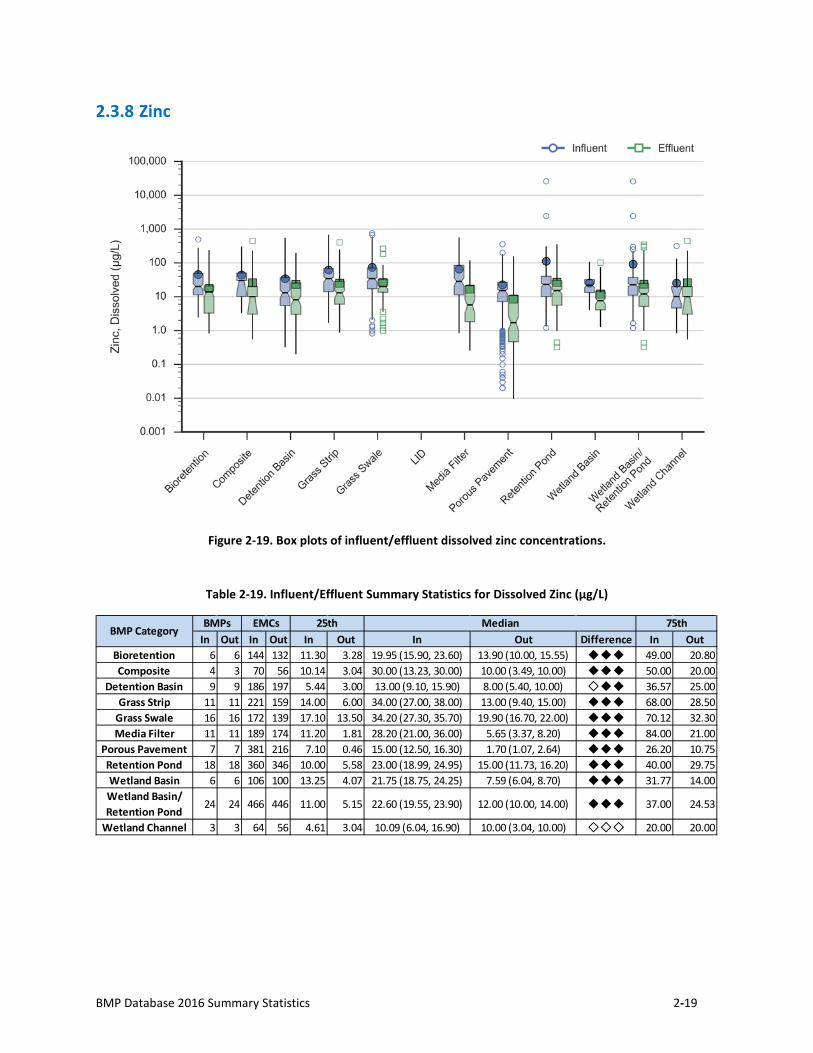
2.3.8 Zinc
Figure 2-19. Box plots of influent/effluent dissolved zinc concentrations.
Table 2-19. Influent/Effluent Summary Statistics for Dissolved Zinc (µg/L)
In Out In Out In Out In Out Difference In OutBioretention 6 6 144 132 11.30 3.28 19.95 (15.90, 23.60) 13.90 (10.00, 15.55) ◆◆◆ 49.00 20.80Composite 4 3 70 56 10.14 3.04 30.00 (13.23, 30.00) 10.00 (3.49, 10.00) ◆◆◆ 50.00 20.00
Detention Basin 9 9 186 197 5.44 3.00 13.00 (9.10, 15.90) 8.00 (5.40, 10.00) ◇◆◆ 36.57 25.00Grass Strip 11 11 221 159 14.00 6.00 34.00 (27.00, 38.00) 13.00 (9.40, 15.00) ◆◆◆ 68.00 28.50
Grass Swale 16 16 172 139 17.10 13.50 34.20 (27.30, 35.70) 19.90 (16.70, 22.00) ◆◆◆ 70.12 32.30Media Filter 11 11 189 174 11.20 1.81 28.20 (21.00, 36.00) 5.65 (3.37, 8.20) ◆◆◆ 84.00 21.00
Porous Pavement 7 7 381 216 7.10 0.46 15.00 (12.50, 16.30) 1.70 (1.07, 2.64) ◆◆◆ 26.20 10.75Retention Pond 18 18 360 346 10.00 5.58 23.00 (18.99, 24.95) 15.00 (11.73, 16.20) ◆◆◆ 40.00 29.75Wetland Basin 6 6 106 100 13.25 4.07 21.75 (18.75, 24.25) 7.59 (6.04, 8.70) ◆◆◆ 31.77 14.00Wetland Basin/ Retention Pond
24 24 466 446 11.00 5.15 22.60 (19.55, 23.90) 12.00 (10.00, 14.00) ◆◆◆ 37.00 24.53
Wetland Channel 3 3 64 56 4.61 3.04 10.09 (6.04, 16.90) 10.00 (3.04, 10.00) ◇◇◇ 20.00 20.00
BMPs 75thEMCs 25th MedianBMP Category
2-20 Water Environment & Reuse Foundation
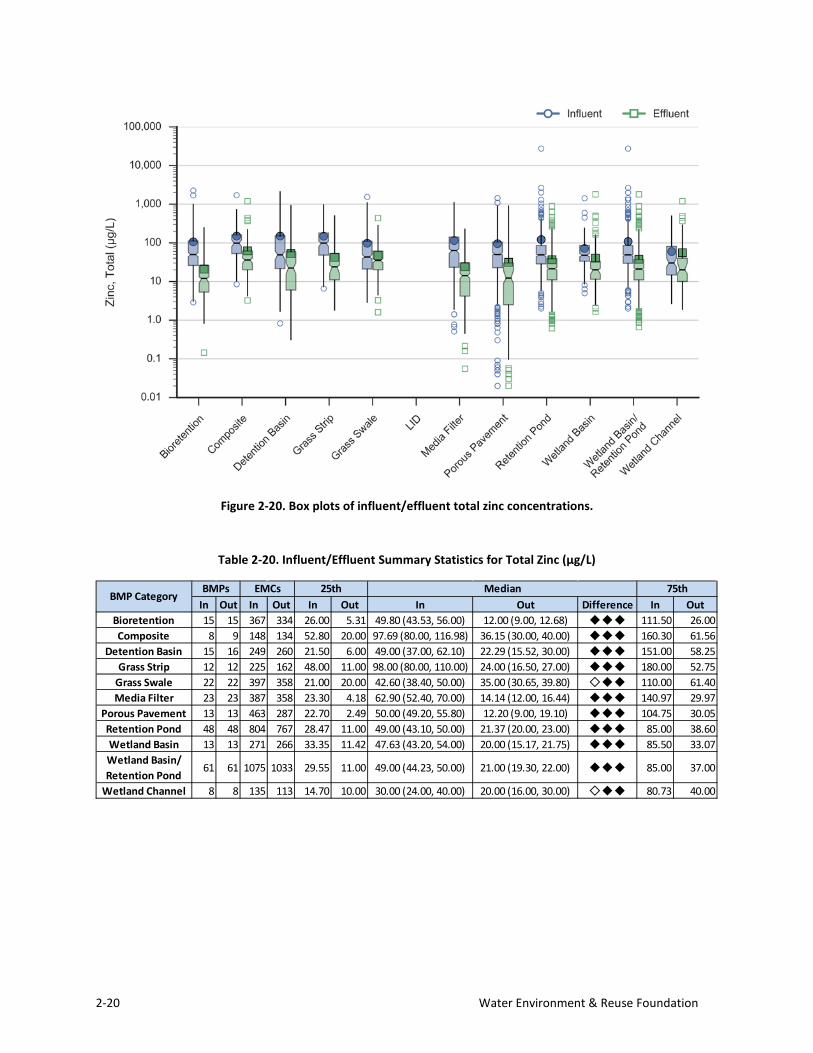
Figure 2-20. Box plots of influent/effluent total zinc concentrations.
Table 2-20. Influent/Effluent Summary Statistics for Total Zinc (µg/L)
In Out In Out In Out In Out Difference In OutBioretention 15 15 367 334 26.00 5.31 49.80 (43.53, 56.00) 12.00 (9.00, 12.68) ◆◆◆ 111.50 26.00Composite 8 9 148 134 52.80 20.00 97.69 (80.00, 116.98) 36.15 (30.00, 40.00) ◆◆◆ 160.30 61.56
Detention Basin 15 16 249 260 21.50 6.00 49.00 (37.00, 62.10) 22.29 (15.52, 30.00) ◆◆◆ 151.00 58.25Grass Strip 12 12 225 162 48.00 11.00 98.00 (80.00, 110.00) 24.00 (16.50, 27.00) ◆◆◆ 180.00 52.75
Grass Swale 22 22 397 358 21.00 20.00 42.60 (38.40, 50.00) 35.00 (30.65, 39.80) ◇◆◆ 110.00 61.40Media Filter 23 23 387 358 23.30 4.18 62.90 (52.40, 70.00) 14.14 (12.00, 16.44) ◆◆◆ 140.97 29.97
Porous Pavement 13 13 463 287 22.70 2.49 50.00 (49.20, 55.80) 12.20 (9.00, 19.10) ◆◆◆ 104.75 30.05Retention Pond 48 48 804 767 28.47 11.00 49.00 (43.10, 50.00) 21.37 (20.00, 23.00) ◆◆◆ 85.00 38.60Wetland Basin 13 13 271 266 33.35 11.42 47.63 (43.20, 54.00) 20.00 (15.17, 21.75) ◆◆◆ 85.50 33.07Wetland Basin/ Retention Pond
61 61 1075 1033 29.55 11.00 49.00 (44.23, 50.00) 21.00 (19.30, 22.00) ◆◆◆ 85.00 37.00
Wetland Channel 8 8 135 113 14.70 10.00 30.00 (24.00, 40.00) 20.00 (16.00, 30.00) ◇◆◆ 80.73 40.00
BMPs 75thEMCs 25th MedianBMP Category
BMP Database 2016 Summary Statistics 2-21
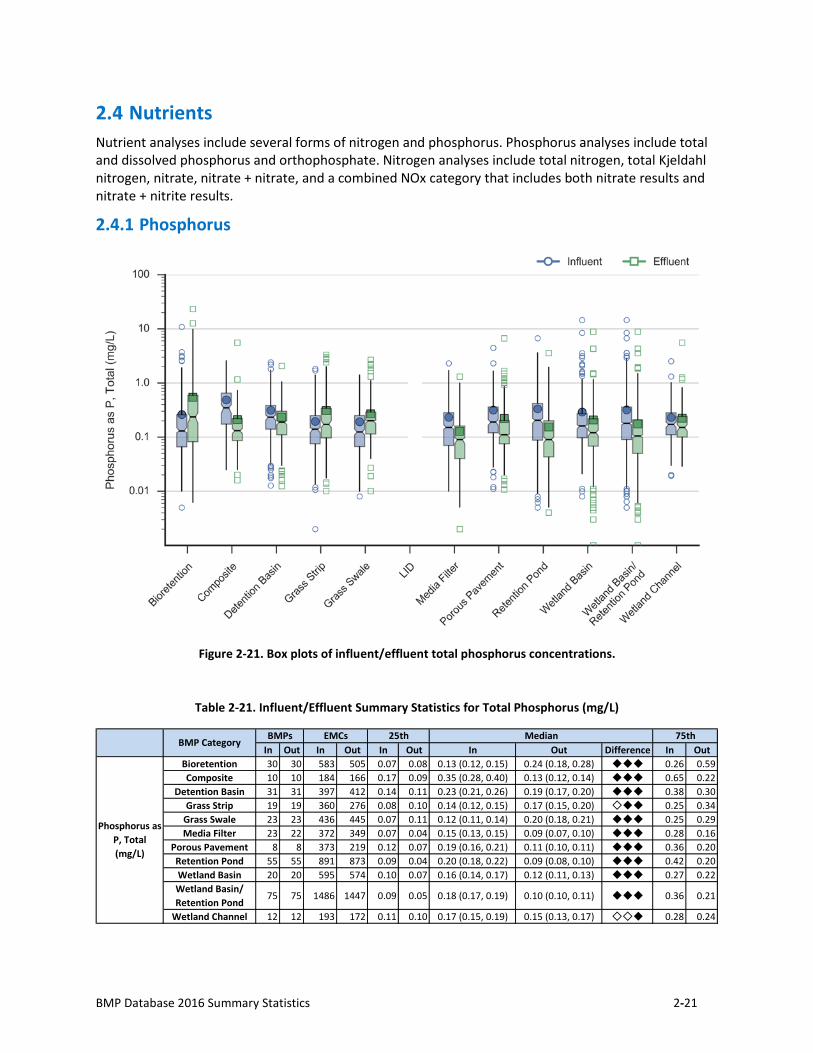
Nutrients Nutrient analyses include several forms of nitrogen and phosphorus. Phosphorus analyses include total and dissolved phosphorus and orthophosphate. Nitrogen analyses include total nitrogen, total Kjeldahl nitrogen, nitrate, nitrate + nitrate, and a combined NOx category that includes both nitrate results and nitrate + nitrite results.
2.4.1 Phosphorus
Figure 2-21. Box plots of influent/effluent total phosphorus concentrations.
Table 2-21. Influent/Effluent Summary Statistics for Total Phosphorus (mg/L)
In Out In Out In Out In Out Difference In OutBioretention 30 30 583 505 0.07 0.08 0.13 (0.12, 0.15) 0.24 (0.18, 0.28) ◆◆◆ 0.26 0.59Composite 10 10 184 166 0.17 0.09 0.35 (0.28, 0.40) 0.13 (0.12, 0.14) ◆◆◆ 0.65 0.22
Detention Basin 31 31 397 412 0.14 0.11 0.23 (0.21, 0.26) 0.19 (0.17, 0.20) ◆◆◆ 0.38 0.30Grass Strip 19 19 360 276 0.08 0.10 0.14 (0.12, 0.15) 0.17 (0.15, 0.20) ◇◆◆ 0.25 0.34
Grass Swale 23 23 436 445 0.07 0.11 0.12 (0.11, 0.14) 0.20 (0.18, 0.21) ◆◆◆ 0.25 0.29Media Filter 23 22 372 349 0.07 0.04 0.15 (0.13, 0.15) 0.09 (0.07, 0.10) ◆◆◆ 0.28 0.16
Porous Pavement 8 8 373 219 0.12 0.07 0.19 (0.16, 0.21) 0.11 (0.10, 0.11) ◆◆◆ 0.36 0.20Retention Pond 55 55 891 873 0.09 0.04 0.20 (0.18, 0.22) 0.09 (0.08, 0.10) ◆◆◆ 0.42 0.20Wetland Basin 20 20 595 574 0.10 0.07 0.16 (0.14, 0.17) 0.12 (0.11, 0.13) ◆◆◆ 0.27 0.22Wetland Basin/ Retention Pond
75 75 1486 1447 0.09 0.05 0.18 (0.17, 0.19) 0.10 (0.10, 0.11) ◆◆◆ 0.36 0.21
Wetland Channel 12 12 193 172 0.11 0.10 0.17 (0.15, 0.19) 0.15 (0.13, 0.17) ◇◇◆ 0.28 0.24
25th Median 75thBMP Category
BMPs EMCs
Phosphorus as P, Total (mg/L)
2-22 Water Environment & Reuse Foundation
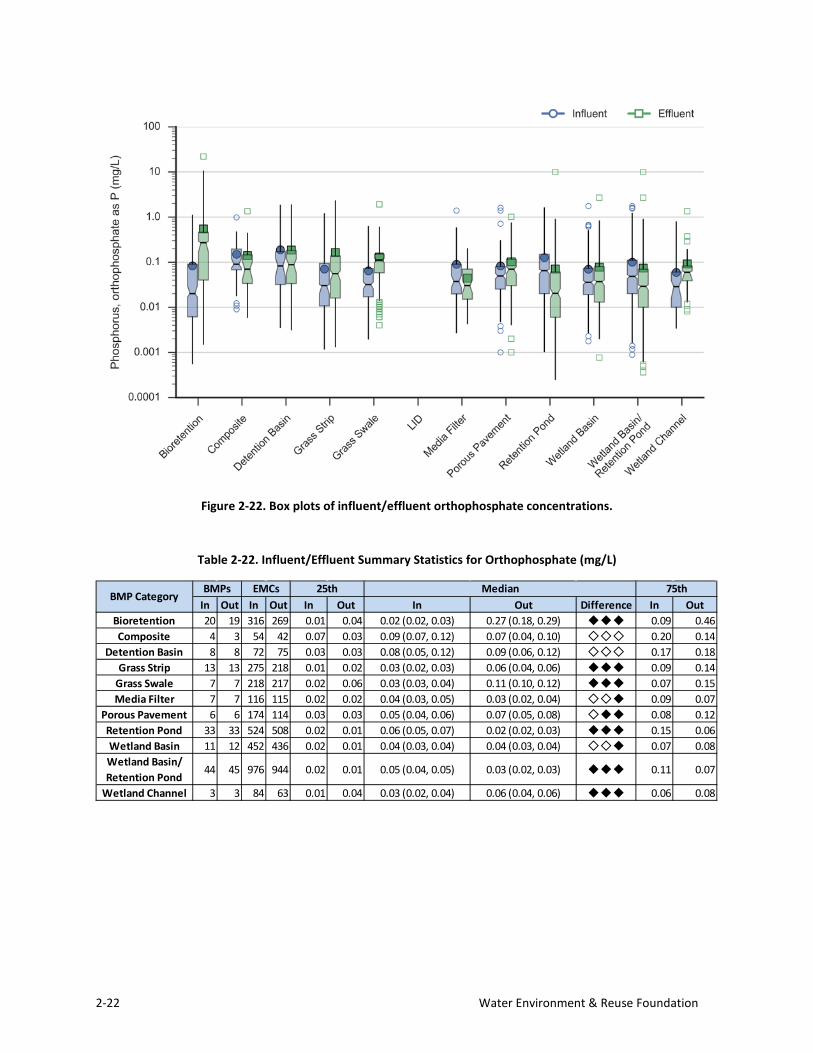
Figure 2-22. Box plots of influent/effluent orthophosphate concentrations.
Table 2-22. Influent/Effluent Summary Statistics for Orthophosphate (mg/L)
In Out In Out In Out In Out Difference In OutBioretention 20 19 316 269 0.01 0.04 0.02 (0.02, 0.03) 0.27 (0.18, 0.29) ◆◆◆ 0.09 0.46Composite 4 3 54 42 0.07 0.03 0.09 (0.07, 0.12) 0.07 (0.04, 0.10) ◇◇◇ 0.20 0.14
Detention Basin 8 8 72 75 0.03 0.03 0.08 (0.05, 0.12) 0.09 (0.06, 0.12) ◇◇◇ 0.17 0.18Grass Strip 13 13 275 218 0.01 0.02 0.03 (0.02, 0.03) 0.06 (0.04, 0.06) ◆◆◆ 0.09 0.14
Grass Swale 7 7 218 217 0.02 0.06 0.03 (0.03, 0.04) 0.11 (0.10, 0.12) ◆◆◆ 0.07 0.15Media Filter 7 7 116 115 0.02 0.02 0.04 (0.03, 0.05) 0.03 (0.02, 0.04) ◇◇◆ 0.09 0.07
Porous Pavement 6 6 174 114 0.03 0.03 0.05 (0.04, 0.06) 0.07 (0.05, 0.08) ◇◆◆ 0.08 0.12Retention Pond 33 33 524 508 0.02 0.01 0.06 (0.05, 0.07) 0.02 (0.02, 0.03) ◆◆◆ 0.15 0.06Wetland Basin 11 12 452 436 0.02 0.01 0.04 (0.03, 0.04) 0.04 (0.03, 0.04) ◇◇◆ 0.07 0.08Wetland Basin/ Retention Pond
44 45 976 944 0.02 0.01 0.05 (0.04, 0.05) 0.03 (0.02, 0.03) ◆◆◆ 0.11 0.07
Wetland Channel 3 3 84 63 0.01 0.04 0.03 (0.02, 0.04) 0.06 (0.04, 0.06) ◆◆◆ 0.06 0.08
BMPs 75thEMCs 25th MedianBMP Category
BMP Database 2016 Summary Statistics 2-23
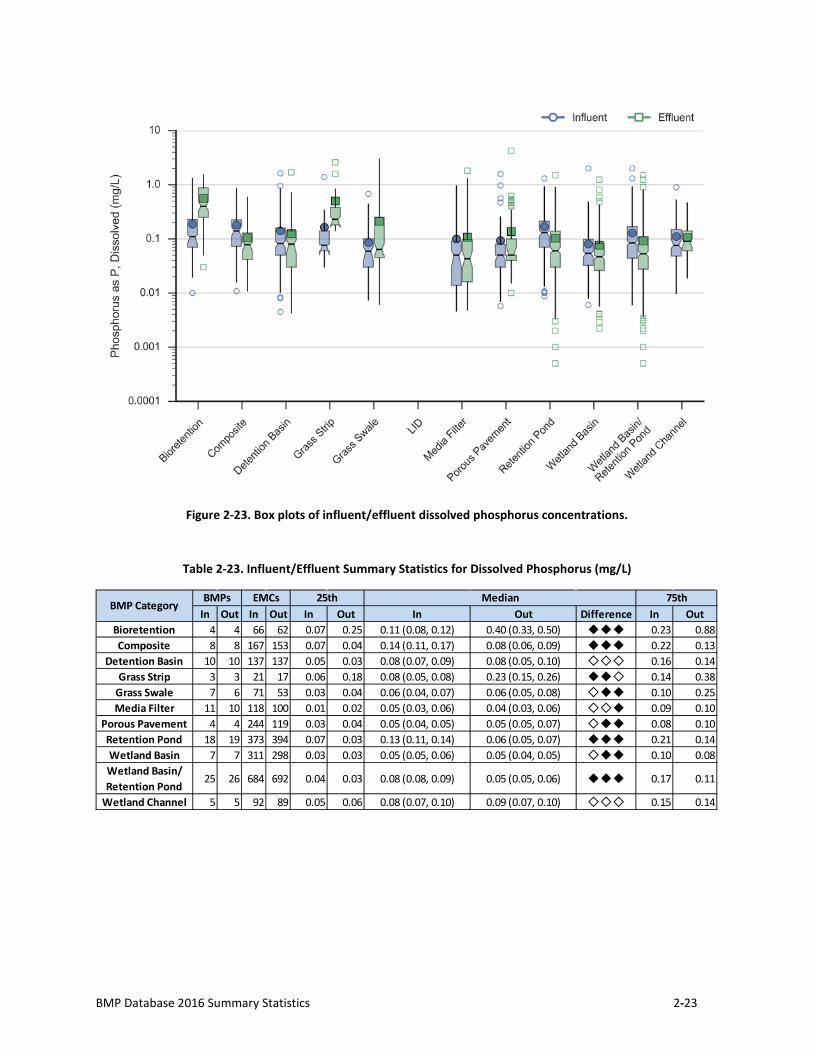
Figure 2-23. Box plots of influent/effluent dissolved phosphorus concentrations.
Table 2-23. Influent/Effluent Summary Statistics for Dissolved Phosphorus (mg/L)
In Out In Out In Out In Out Difference In OutBioretention 4 4 66 62 0.07 0.25 0.11 (0.08, 0.12) 0.40 (0.33, 0.50) ◆◆◆ 0.23 0.88Composite 8 8 167 153 0.07 0.04 0.14 (0.11, 0.17) 0.08 (0.06, 0.09) ◆◆◆ 0.22 0.13
Detention Basin 10 10 137 137 0.05 0.03 0.08 (0.07, 0.09) 0.08 (0.05, 0.10) ◇◇◇ 0.16 0.14Grass Strip 3 3 21 17 0.06 0.18 0.08 (0.05, 0.08) 0.23 (0.15, 0.26) ◆◆◇ 0.14 0.38
Grass Swale 7 6 71 53 0.03 0.04 0.06 (0.04, 0.07) 0.06 (0.05, 0.08) ◇◆◆ 0.10 0.25Media Filter 11 10 118 100 0.01 0.02 0.05 (0.03, 0.06) 0.04 (0.03, 0.06) ◇◇◆ 0.09 0.10
Porous Pavement 4 4 244 119 0.03 0.04 0.05 (0.04, 0.05) 0.05 (0.05, 0.07) ◇◆◆ 0.08 0.10Retention Pond 18 19 373 394 0.07 0.03 0.13 (0.11, 0.14) 0.06 (0.05, 0.07) ◆◆◆ 0.21 0.14Wetland Basin 7 7 311 298 0.03 0.03 0.05 (0.05, 0.06) 0.05 (0.04, 0.05) ◇◆◆ 0.10 0.08Wetland Basin/ Retention Pond
25 26 684 692 0.04 0.03 0.08 (0.08, 0.09) 0.05 (0.05, 0.06) ◆◆◆ 0.17 0.11
Wetland Channel 5 5 92 89 0.05 0.06 0.08 (0.07, 0.10) 0.09 (0.07, 0.10) ◇◇◇ 0.15 0.14
BMPs 75thEMCs 25th MedianBMP Category
2-24 Water Environment & Reuse Foundation
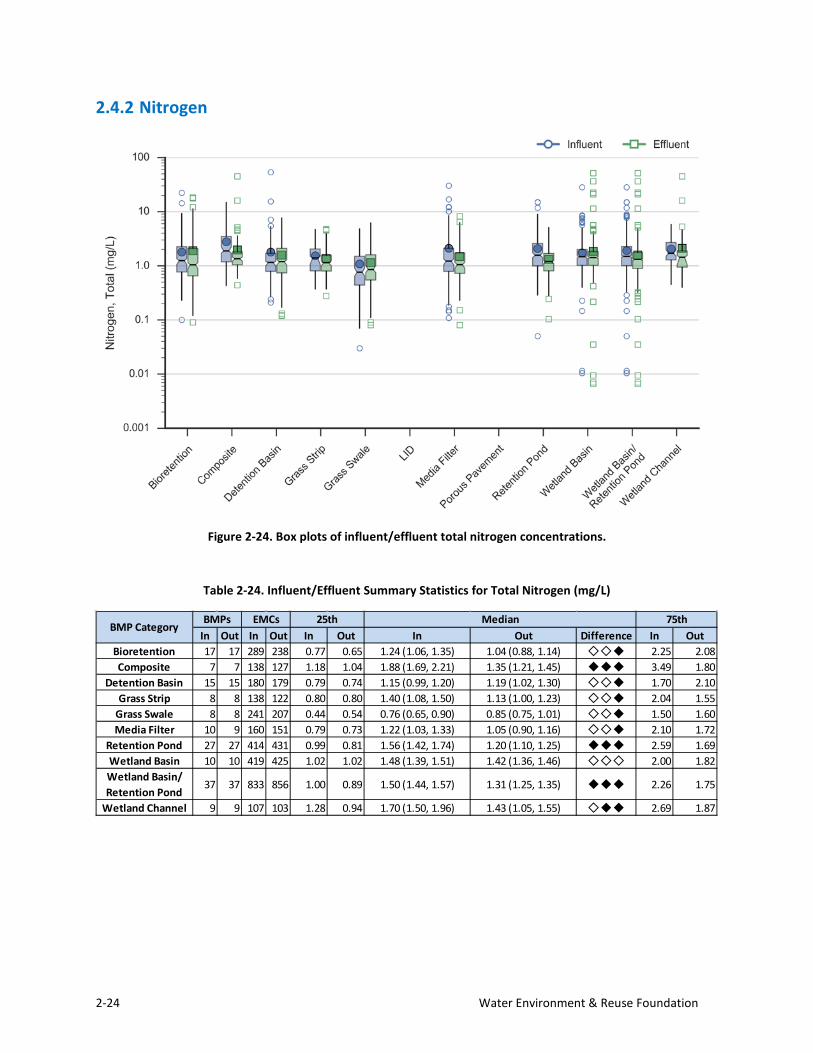
2.4.2 Nitrogen
Figure 2-24. Box plots of influent/effluent total nitrogen concentrations.
Table 2-24. Influent/Effluent Summary Statistics for Total Nitrogen (mg/L)
In Out In Out In Out In Out Difference In OutBioretention 17 17 289 238 0.77 0.65 1.24 (1.06, 1.35) 1.04 (0.88, 1.14) ◇◇◆ 2.25 2.08Composite 7 7 138 127 1.18 1.04 1.88 (1.69, 2.21) 1.35 (1.21, 1.45) ◆◆◆ 3.49 1.80
Detention Basin 15 15 180 179 0.79 0.74 1.15 (0.99, 1.20) 1.19 (1.02, 1.30) ◇◇◆ 1.70 2.10Grass Strip 8 8 138 122 0.80 0.80 1.40 (1.08, 1.50) 1.13 (1.00, 1.23) ◇◇◆ 2.04 1.55
Grass Swale 8 8 241 207 0.44 0.54 0.76 (0.65, 0.90) 0.85 (0.75, 1.01) ◇◇◆ 1.50 1.60Media Filter 10 9 160 151 0.79 0.73 1.22 (1.03, 1.33) 1.05 (0.90, 1.16) ◇◇◆ 2.10 1.72
Retention Pond 27 27 414 431 0.99 0.81 1.56 (1.42, 1.74) 1.20 (1.10, 1.25) ◆◆◆ 2.59 1.69Wetland Basin 10 10 419 425 1.02 1.02 1.48 (1.39, 1.51) 1.42 (1.36, 1.46) ◇◇◇ 2.00 1.82Wetland Basin/ Retention Pond
37 37 833 856 1.00 0.89 1.50 (1.44, 1.57) 1.31 (1.25, 1.35) ◆◆◆ 2.26 1.75
Wetland Channel 9 9 107 103 1.28 0.94 1.70 (1.50, 1.96) 1.43 (1.05, 1.55) ◇◆◆ 2.69 1.87
BMPs 75thEMCs 25th MedianBMP Category
BMP Database 2016 Summary Statistics 2-25
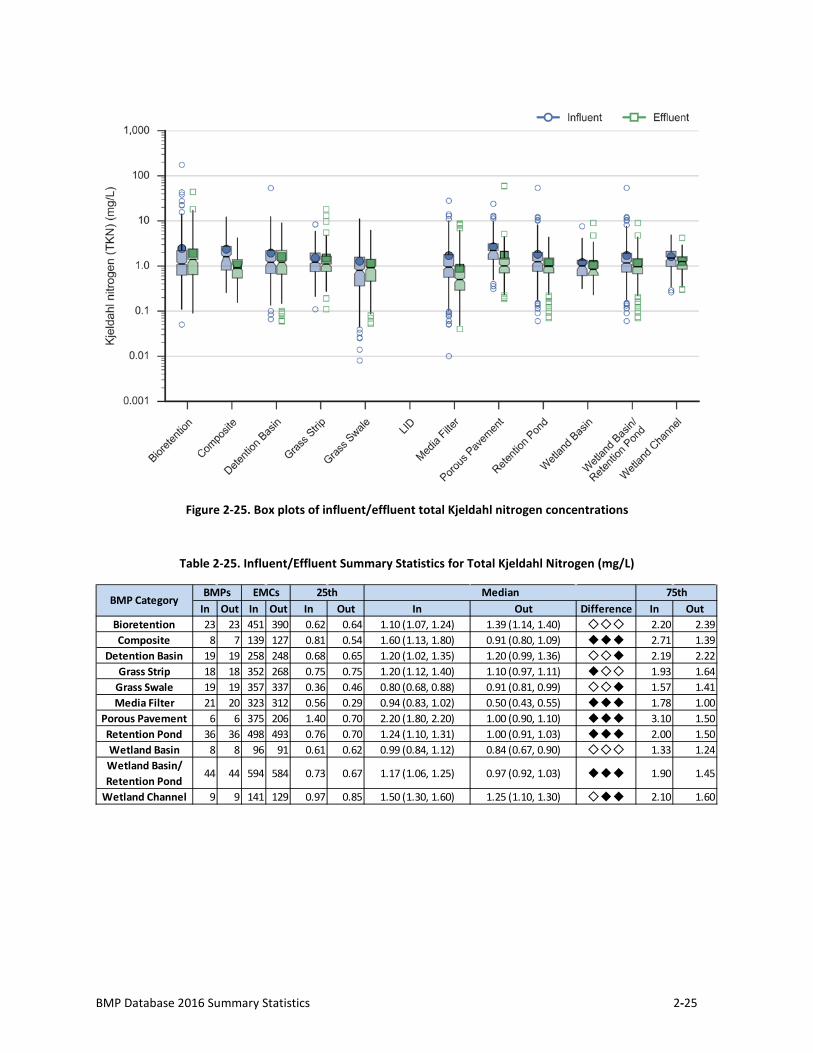
Figure 2-25. Box plots of influent/effluent total Kjeldahl nitrogen concentrations
Table 2-25. Influent/Effluent Summary Statistics for Total Kjeldahl Nitrogen (mg/L)
In Out In Out In Out In Out Difference In OutBioretention 23 23 451 390 0.62 0.64 1.10 (1.07, 1.24) 1.39 (1.14, 1.40) ◇◇◇ 2.20 2.39Composite 8 7 139 127 0.81 0.54 1.60 (1.13, 1.80) 0.91 (0.80, 1.09) ◆◆◆ 2.71 1.39
Detention Basin 19 19 258 248 0.68 0.65 1.20 (1.02, 1.35) 1.20 (0.99, 1.36) ◇◇◆ 2.19 2.22Grass Strip 18 18 352 268 0.75 0.75 1.20 (1.12, 1.40) 1.10 (0.97, 1.11) ◆◇◇ 1.93 1.64
Grass Swale 19 19 357 337 0.36 0.46 0.80 (0.68, 0.88) 0.91 (0.81, 0.99) ◇◇◆ 1.57 1.41Media Filter 21 20 323 312 0.56 0.29 0.94 (0.83, 1.02) 0.50 (0.43, 0.55) ◆◆◆ 1.78 1.00
Porous Pavement 6 6 375 206 1.40 0.70 2.20 (1.80, 2.20) 1.00 (0.90, 1.10) ◆◆◆ 3.10 1.50Retention Pond 36 36 498 493 0.76 0.70 1.24 (1.10, 1.31) 1.00 (0.91, 1.03) ◆◆◆ 2.00 1.50Wetland Basin 8 8 96 91 0.61 0.62 0.99 (0.84, 1.12) 0.84 (0.67, 0.90) ◇◇◇ 1.33 1.24Wetland Basin/ Retention Pond
44 44 594 584 0.73 0.67 1.17 (1.06, 1.25) 0.97 (0.92, 1.03) ◆◆◆ 1.90 1.45
Wetland Channel 9 9 141 129 0.97 0.85 1.50 (1.30, 1.60) 1.25 (1.10, 1.30) ◇◆◆ 2.10 1.60
BMPs 75thEMCs 25th MedianBMP Category
2-26 Water Environment & Reuse Foundation
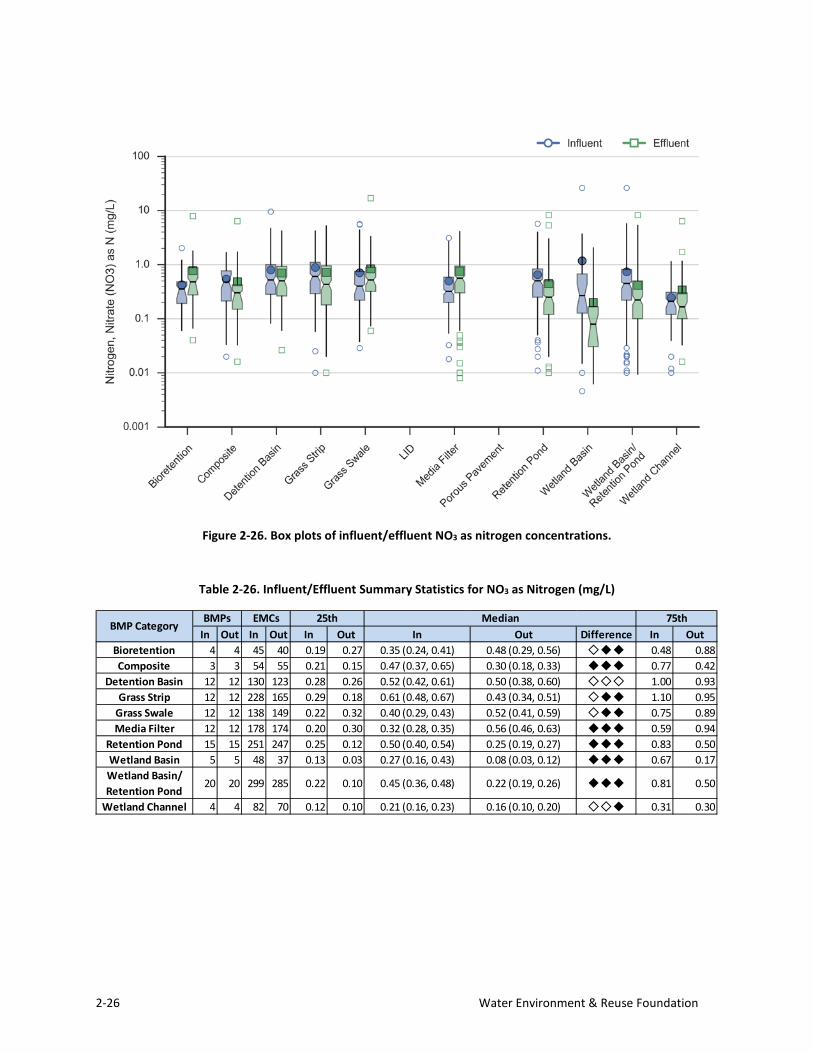
Figure 2-26. Box plots of influent/effluent NO3 as nitrogen concentrations.
Table 2-26. Influent/Effluent Summary Statistics for NO3 as Nitrogen (mg/L)
In Out In Out In Out In Out Difference In OutBioretention 4 4 45 40 0.19 0.27 0.35 (0.24, 0.41) 0.48 (0.29, 0.56) ◇◆◆ 0.48 0.88Composite 3 3 54 55 0.21 0.15 0.47 (0.37, 0.65) 0.30 (0.18, 0.33) ◆◆◆ 0.77 0.42
Detention Basin 12 12 130 123 0.28 0.26 0.52 (0.42, 0.61) 0.50 (0.38, 0.60) ◇◇◇ 1.00 0.93Grass Strip 12 12 228 165 0.29 0.18 0.61 (0.48, 0.67) 0.43 (0.34, 0.51) ◇◆◆ 1.10 0.95
Grass Swale 12 12 138 149 0.22 0.32 0.40 (0.29, 0.43) 0.52 (0.41, 0.59) ◇◆◆ 0.75 0.89Media Filter 12 12 178 174 0.20 0.30 0.32 (0.28, 0.35) 0.56 (0.46, 0.63) ◆◆◆ 0.59 0.94
Retention Pond 15 15 251 247 0.25 0.12 0.50 (0.40, 0.54) 0.25 (0.19, 0.27) ◆◆◆ 0.83 0.50Wetland Basin 5 5 48 37 0.13 0.03 0.27 (0.16, 0.43) 0.08 (0.03, 0.12) ◆◆◆ 0.67 0.17Wetland Basin/ Retention Pond
20 20 299 285 0.22 0.10 0.45 (0.36, 0.48) 0.22 (0.19, 0.26) ◆◆◆ 0.81 0.50
Wetland Channel 4 4 82 70 0.12 0.10 0.21 (0.16, 0.23) 0.16 (0.10, 0.20) ◇◇◆ 0.31 0.30
BMPs 75thEMCs 25th MedianBMP Category
BMP Database 2016 Summary Statistics 2-27
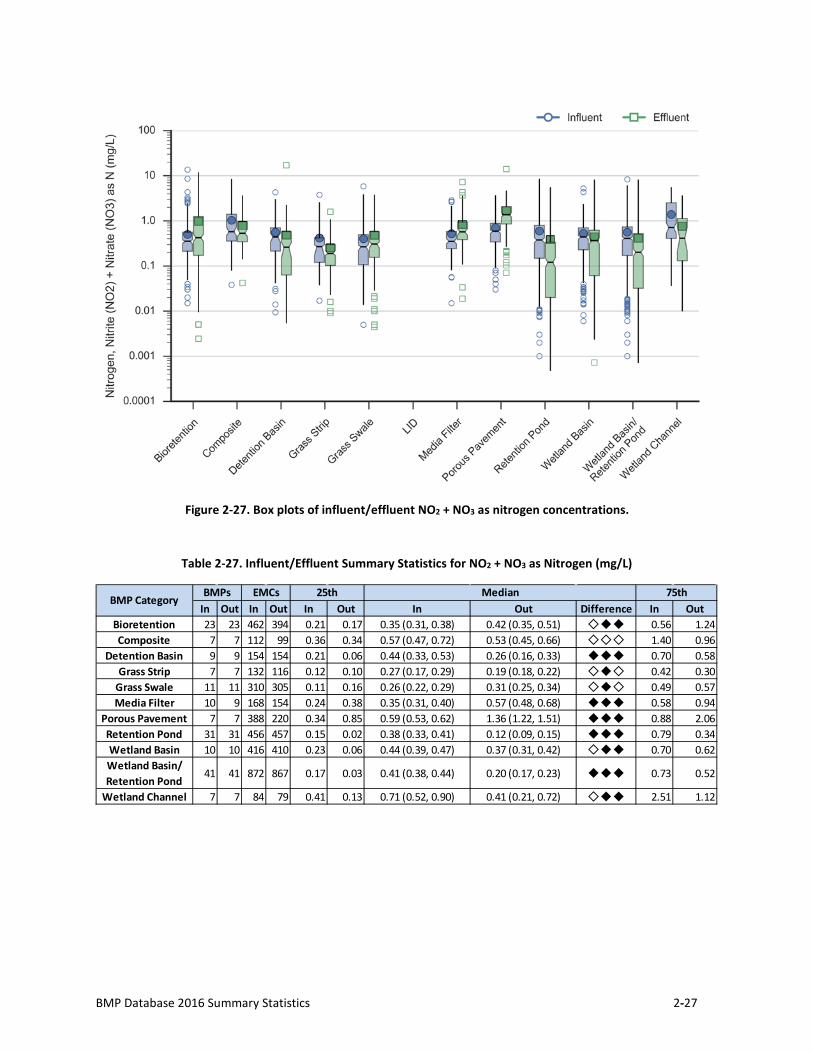
Figure 2-27. Box plots of influent/effluent NO2 + NO3 as nitrogen concentrations.
Table 2-27. Influent/Effluent Summary Statistics for NO2 + NO3 as Nitrogen (mg/L)
In Out In Out In Out In Out Difference In OutBioretention 23 23 462 394 0.21 0.17 0.35 (0.31, 0.38) 0.42 (0.35, 0.51) ◇◆◆ 0.56 1.24Composite 7 7 112 99 0.36 0.34 0.57 (0.47, 0.72) 0.53 (0.45, 0.66) ◇◇◇ 1.40 0.96
Detention Basin 9 9 154 154 0.21 0.06 0.44 (0.33, 0.53) 0.26 (0.16, 0.33) ◆◆◆ 0.70 0.58Grass Strip 7 7 132 116 0.12 0.10 0.27 (0.17, 0.29) 0.19 (0.18, 0.22) ◇◆◇ 0.42 0.30
Grass Swale 11 11 310 305 0.11 0.16 0.26 (0.22, 0.29) 0.31 (0.25, 0.34) ◇◆◇ 0.49 0.57Media Filter 10 9 168 154 0.24 0.38 0.35 (0.31, 0.40) 0.57 (0.48, 0.68) ◆◆◆ 0.58 0.94
Porous Pavement 7 7 388 220 0.34 0.85 0.59 (0.53, 0.62) 1.36 (1.22, 1.51) ◆◆◆ 0.88 2.06Retention Pond 31 31 456 457 0.15 0.02 0.38 (0.33, 0.41) 0.12 (0.09, 0.15) ◆◆◆ 0.79 0.34Wetland Basin 10 10 416 410 0.23 0.06 0.44 (0.39, 0.47) 0.37 (0.31, 0.42) ◇◆◆ 0.70 0.62Wetland Basin/ Retention Pond
41 41 872 867 0.17 0.03 0.41 (0.38, 0.44) 0.20 (0.17, 0.23) ◆◆◆ 0.73 0.52
Wetland Channel 7 7 84 79 0.41 0.13 0.71 (0.52, 0.90) 0.41 (0.21, 0.72) ◇◆◆ 2.51 1.12
BMPs 75thEMCs 25th MedianBMP Category
2-28 Water Environment & Reuse Foundation
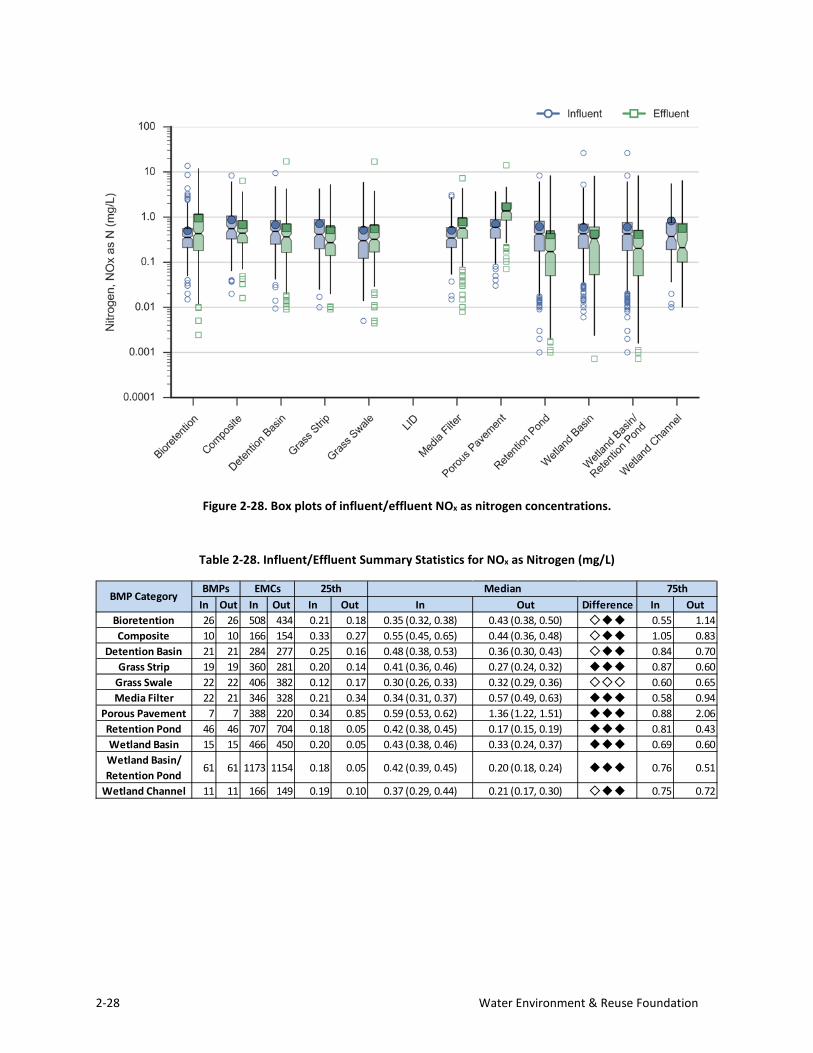
Figure 2-28. Box plots of influent/effluent NOx as nitrogen concentrations.
Table 2-28. Influent/Effluent Summary Statistics for NOx as Nitrogen (mg/L)
In Out In Out In Out In Out Difference In OutBioretention 26 26 508 434 0.21 0.18 0.35 (0.32, 0.38) 0.43 (0.38, 0.50) ◇◆◆ 0.55 1.14Composite 10 10 166 154 0.33 0.27 0.55 (0.45, 0.65) 0.44 (0.36, 0.48) ◇◆◆ 1.05 0.83
Detention Basin 21 21 284 277 0.25 0.16 0.48 (0.38, 0.53) 0.36 (0.30, 0.43) ◇◆◆ 0.84 0.70Grass Strip 19 19 360 281 0.20 0.14 0.41 (0.36, 0.46) 0.27 (0.24, 0.32) ◆◆◆ 0.87 0.60
Grass Swale 22 22 406 382 0.12 0.17 0.30 (0.26, 0.33) 0.32 (0.29, 0.36) ◇◇◇ 0.60 0.65Media Filter 22 21 346 328 0.21 0.34 0.34 (0.31, 0.37) 0.57 (0.49, 0.63) ◆◆◆ 0.58 0.94
Porous Pavement 7 7 388 220 0.34 0.85 0.59 (0.53, 0.62) 1.36 (1.22, 1.51) ◆◆◆ 0.88 2.06Retention Pond 46 46 707 704 0.18 0.05 0.42 (0.38, 0.45) 0.17 (0.15, 0.19) ◆◆◆ 0.81 0.43Wetland Basin 15 15 466 450 0.20 0.05 0.43 (0.38, 0.46) 0.33 (0.24, 0.37) ◆◆◆ 0.69 0.60Wetland Basin/ Retention Pond
61 61 1173 1154 0.18 0.05 0.42 (0.39, 0.45) 0.20 (0.18, 0.24) ◆◆◆ 0.76 0.51
Wetland Channel 11 11 166 149 0.19 0.10 0.37 (0.29, 0.44) 0.21 (0.17, 0.30) ◇◆◆ 0.75 0.72
BMPs 75thEMCs 25th MedianBMP Category
BMP Database 2016 Summary Statistics 3-1
Conclusions and Research Needs Conclusions
The International Stormwater BMP Database is an evidence-based resource for characterizing BMP performance. This summary report provides statistics useful for estimating effluent concentrations achievable by various BMP types for various pollutants and for identifying BMP types that have demonstrated ability to reduce pollutant concentrations. Although detailed interpretation of these summary statistics is beyond the scope of this data summary, basic observations from this analysis include:
1. Total Suspended Solids: All of the BMP types evaluated discharged median effluent concentrations below 30 mg/L, which is a common benchmark for TSS performance. All of the BMP types evaluated demonstrated statistically significant reduction in TSS, with the exception of LID sites. However, the number of discharging events monitored for LID facilities was approximately half of the measured inflows; therefore, comparison of influent-effluent concentration at LID sites likely underestimates the water quality benefits of these sites in terms of load reductions. The lowest effluent concentrations observed for TSS include bioretention, media filters, retention basins and wetland basins. These BMPs enable sedimentation and filtration, which are effective treatment processes for sediment removal.
2. Bacteria: The fecal indicator bacteria data set for EPA-recommended fecal indicators remains limited. Nonetheless, several observations can be made from the available data. Most BMP types analyzed are not able to reduce bacteria concentrations to primary contact recreation receiving water standards, with the possible exception of retention ponds for E. coli. However, several BMP types show the ability to reduce currently recommended fecal indicator bacteria concentrations, including bioretention, wetland basins, retention ponds, and media filters. Dry extended detention basins provided statistically significant reduction for fecal coliform, although it is no longer recommended for use by EPA as a fecal indicator bacteria for recreational use. Nonetheless, bacteria load reductions may be significant due to volume reduction provided by BMPs that provide infiltration. (Volume reduction is not evaluated in this report.)
3. Nutrients: Nutrients in the particulate form can be removed from a variety of BMP types; however, removal of soluble forms is more challenging. Statistically significant reductions of total phosphorus were identified for composite (treatment train) BMPs, detention basins, media filters, porous pavement, retention ponds and wetland basins. Bioretention, grass swales and grass strips tended to export phosphorus, suggesting that bioretention media mixes, fertilization practices and erosion control are important considerations for BMP design, installation and maintenance. BMPs with permanent pools (i.e., retention ponds and wetlands) appear to be able to reduce nitrate (and NOx) concentrations. As indicated by the relatively high TKN removal and lack of NOx removal for media filters, inert filtration appears capable of capturing nitrogenous solids, but the conditions are not as conducive for significant denitrification or nitrogen uptake as compared to BMPs with permanent pools (retention ponds and wetland basins). Therefore, a BMP designed for permanently reducing nitrogen may include a permanent wet pool followed by a vegetated swale or media filter. Bioretention as an overall category did not perform well for nitrogen removal; however, it may be worthwhile to evaluate bioretention
3-2 Water Environment & Reuse Foundation
designs with internal water storage zones (e.g., pore storage above and below the underdrain providing nitrification/denitrification processes) as a separate subcategory in the future.
4. Metals: As was the case for nutrients, total forms of metals are more easily removed than dissolved forms. For example, all of the BMPs evaluated showed statistically significant reduction of total copper, lead and zinc. Performance for individual BMP-pollutant concentration varies. When evaluating metals performance, it is particularly important to be cognizant of influent concentrations – in cases where influent concentrations are already very low, then additional reductions of metals concentrations may not be feasible. See the summary tables provided in this report to assess expected performance for various BMP-metal combinations.
For more detailed discussions of unit treatment processes expected to be effective at removing various pollutants, see the BMP Database Pollutant Technical Summary paper series completed during 2010-2012 (Geosyntec and WWE 2010 & 2011; WWE and Geosyntec 2010 & 2011) and accessible at http://www.bmpdatabase.org/performance-summaries.html.
Research Needs This report serves primarily as a statistical summary and is not intended to provide a detailed evaluation of research needs; however, several research needs are readily apparent.
1. More BMP performance data sets are needed for fecal indicator bacteria for multiple BMP types, particularly for EPA-recommended fecal indicator bacteria, enterococcus and E. coli.
2. More robust design information in BMP performance study submittals would be valuable for all BMP categories. This information is important for identifying the factors that lead to the best performance for various BMP types.
3. Although the 2016 data upload included more site-scale LID studies, this data set continues to be limited and would benefit from additional performance data. It is essential that runoff volume-related data be reported with these studies so that load reductions can be determined in future analyses.
4. Permeable pavement studies are relatively limited and would benefit from additional performance reporting. Permeable pavement is a BMP type that is well suited for ultra-urban retrofits, so additional performance data would be helpful for local governments considering inclusion of permeable pavement in capital improvement programs.
5. The BMP Database contains a substantial manufactured device data set that has evolved over the past 20 years. These data sets have not been included in this analysis due to the need for additional characterization of the unit treatment processes in these data sets. A stand-alone manufactured device performance analysis report is recommended as a future priority for WE&RF and the project co-sponsors.
BMP Database 2016 Summary Statistics R-1
References Efron, B. and Tibishirani, R. (1993). An Introduction to the Bootstrap. Chapman & Hall, New York.
Geosyntec Consultants and Wright Water Engineers (2010). International Stormwater Best Management Practices (BMP) Database Technical Summary: Nutrients. Prepared under Support from WERF, FHWA, EWRI/ASCE and EPA. December.
Geosyntec Consultants and Wright Water Engineers (2011). International Stormwater Best Management Practices (BMP) Database Technical Summary: Solids (TSS, TDS and Turbidity). Prepared under Support from WERF, FHWA, EWRI/ASCE and EPA. May.
Geosyntec Consultants and Wright Water Engineers (2012a). International Stormwater Best Management Practices (BMP) Database Addendum 1 to Volume Reduction Technical Summary (January 2011) Expanded Analysis of Volume Reduction in Bioretention BMPs. Prepared under Support from WERF, FHWA, EWRI/ASCE and EPA.
Geosyntec Consultants and Wright Water Engineers (2012b). International Stormwater Best Management Practices (BMP) Database International Stormwater Best Management Practices (BMP) Database Pollutant Category Statistical Summary Report: Solids, Bacteria, Nutrients, and Metals. Prepared under Support from WERF, FHWA, EWRI/ASCE and EPA.
Geosyntec Consultants and Wright Water Engineers (2014). International Stormwater Best Management Practices (BMP) Database International Stormwater Best Management Practices (BMP) Database Pollutant Category Statistical Summary Report: Solids, Bacteria, Nutrients, and Metals. Prepared under Support from WERF, FHWA, EWRI/ASCE and EPA.
Geosyntec Consultants and Wright Water Engineers, Inc. (2009). Urban Stormwater BMP Performance Monitoring. Prepared for WERF and EPA. Accessible at: http://www.bmpdatabase.org/Docs/2009%20Stormwater%20BMP%20Monitoring%20Manual.pdf
Helsel, D.R. and Cohn, T.A. (1988). “Estimation of Descriptive Statistics for Multiply Censored Water Quality Data.” Wat. Res. Research, 24(12): 1997-2004.
Helsel, D.R. and Hirsch, R.M. (1992). Statistical Methods in Water Resources. Studies in Environmental Science. Elsevier, NY.
Wright Water Engineers and Geosyntec and (2010). International Stormwater Best Management Practices (BMP) Database Technical Summary: Pollutant Category Summary: Fecal Indicator Bacteria. Prepared under Support from WERF, FHWA, EWRI/ASCE and EPA. December.
Wright Water Engineers and Geosyntec and (2011). International Stormwater Best Management Practices (BMP) Database Technical Summary: Metals. Prepared under Support from WERF, FHWA, EWRI/ASCE and EPA. August.

Water Environment & Reuse Foundation 1199 North Fairfax Street, Suite 900 Alexandria, VA 22314-1177
Phone: 571-384-2100 Email: [email protected] www.werf.org
WE&RF Stock No. 03-SW-1COh WE&RF ISBN: 978-1-94124-285-8
May 2017