Embed Size (px)
Citation preview

FINAL REPORT
CCEM-K2.2012 Key Comparison of Resistance Standards at 10 M and
1 G
Carlos Sanchez and Kai Wendler
National Research Council Canada
1200 Montreal Road, Ottawa K1A 0R6, Ontario
Canada
February 2020

2
CCEM-K2.2012 Comparison of Resistance Standards at 10 M and 1 G
Carlos Sanchez and Kai Wendler
Abstract. An international comparison of dc resistance at 10 M and 1 G was carried out
under the framework of the Mutual Recognition Arrangement (MRA) of the Comité Consultatif
d’Électricité et Magnétisme (CCEM). The comparison was piloted by the National Research
Council of Canada (NRC) with the participation of 12 National Metrology Institutes (NMIs). Two
10 M resistors (Measurements International, model 9331) and two 1 G resistors
(Measurements International, model 9331S) were used as travelling standards. Although the
uncertainty at 10 M was limited by the stability of the travelling standards, the comparison
achieved a reduction in the uncertainties of the degrees of equivalence relative to the 2002
CCEM-K2 comparison, especially at 1 G where the improvement was quite significant.
1. Introduction
The MRA states that its technical basis is a set of results obtained in the course of time through
key comparisons carried out by the Consultative Committees (CCs) of the Comité International
des Poids et Mesures (CIPM), the Bureau International des Poids et Mesures (BIPM) and the
Regional Metrology Organizations (RMOs). As part of this process, the Consultative Committee
on Electricity and Magnetism (CCEM) carried out the key comparison CCEM-K2 of resistance
standards at 10 M and 1 G. This comparison was piloted by the National Institute for
Standards and Technology and approved by the CCEM for full equivalence in January 2002 [1].
In subsequent years SIM [2], EURAMET [3] and APMP have each carried out a similar
comparison, and the published results are linked in the KCDB of the BIPM. Since the original
CCEM-K2 of 2002 many laboratories have enhanced their measurement capabilities in the
ranges in question. At the meeting in 2009 the CCEM decided to repeat the CCEM-K2
comparison to improve the precision of the link between RMOs. The National Research Council
of Canada agreed to pilot this comparison.
2. Travelling Standards
The 10 Mstandards are manufactured by Measurements International Ltd. (CA), model 9331.
The resistance elements are hermetically sealed in metal containers. The four resistor
terminations of the standards are tellurium copper binding posts. A separate ground terminal is
included for screening.
The 1 Gstandards are manufactured by Measurements International Ltd. (CA), model 9331S.
The resistance elements are housed in a double shielded enclosure. The two resistor
terminations of the standards are BPO coaxial connectors mounted directly on the outer

3
enclosure. The inner enclosure containing the resistive element is isolated from the external
enclosure. It is connected to the guard terminal and may be operated either in floating mode, a
grounded mode, or driven at a guard potential.
3. Participants
Since the principal aim of this comparison was to provide a link between RMOs at the smallest
possible level of uncertainty, the participating laboratories were chosen only from those
maintaining an independent realization of impedance or resistance units with a small uncertainty
(e.g. calculable capacitor, quantized Hall resistance/cryogenic current comparator). The
participating institutes are listed in chronological order in table 1.
Table 1. List of participants and measurement dates
Acronym National Metrology Institute Mean date of
measurements
NRC National Research Council, Canada (pilot) 2012-08-25
NIST National Institute for Standards and Technology, U.S.A. 2012-10-03
CENAM Centro Nacional de Metrologia, Mexico 2012-11-12
INTI Instituto Nacional de Tecnologia Industrial, Argentina 2013-03-05
NRC National Research Council, Canada (pilot) 2013-08-02
NRC National Research Council, Canada (pilot) 2014-02-05
PTB Physikalisch-Technische Bundesanstalt, Germany 2014-03-12
NPL National Physical Laboratory, United Kingdom 2014-04-12
METAS Federal Institute of Metrology METAS 2014-05-25
VSL VSL Dutch Metrology Institute, Netherlands 2014-06-26
NRC National Research Council, Canada (pilot) 2014-10-27
NMISA National Metrology Institute of South Africa, South Africa 2014-12-04
NRC National Research Council, Canada (pilot) 2015-10-01
NIM National Institute of Metrology, China 2015-12-23
VNIIM D.I. Mendeleyev Research Institute for Metrology, Russian Federation
2016-03-28
KRISS Korea Research Institute of Standards and Science, The Republic of Korea
2016-09-02
NRC National Research Council, Canada (pilot) 2016-12-08

4
4. Measurement procedure
The nominal conditions specified for the comparison were a temperature of 23 °C and a
measurement voltage of 10 V for the 10 M resistors and 100 V for the 1 G resistors.
Whenever the actual measurement conditions reported by the participants departed from the
nominal conditions, corrections were applied using the temperature, voltage and pressure
coefficients determined by the pilot laboratory.
The participants were asked to report the following:
Description of the measuring set-up including the ground/guard configuration.
Traceability scheme.
Brief description of the measurement procedure.
The measurement results: mean resistance value, with uncertainty, for each standard
and the corresponding mean date of measurement.
The test voltages chosen for the measurements.
The ambient conditions of the measurement: the temperature and humidity with limits of
variation.
A complete uncertainty budget in accordance with the principles of the ISO Guide to the
Expression of Uncertainty in Measurement.
Except for NMISA, which had traceability to 1 resistors calibrated at BIPM, all the participants
obtained traceability through their Quantum Hall Resistance standard (QHR). The protocol did
not specify the measurement method. It was assumed that the participants would use the
normal measurement procedures. The participants reported using the following measurement
systems:
Cryogenic Current Comparator (CCC): NRC (QHR – 100 k), NIST (QHR – 10 M),
CENAM (10 k – 100 M), INTI (1 M – 10 M), NPL (QHR – 1 G), METAS (QHR –
1 M), NIM (QHR – 10 k) and KRISS (QHR – 1 M).
Hamon standards: NIST, CENAM, METAS, VSL, NIM and VNIIM.
Binary divider resistance bridge: NRC, CENAM, PTB, METAS, VSL, NMISA and NIM.
Dual source bridge: NRC, NIST, CENAM, METAS, VSL, NIM and KRISS.
Potentiometric method: INTI.
Wheatstone bridge: VNIIM.
The comparison had been planned to take place within a time frame of a little more than one
year, between September 2012 and December 2013. This required a measurement time of five
weeks for each participant, including transportation time. The comparison ended up being
delayed significantly due to a number of problems:
The first loop proceeded with a few minor delays related to shipping and customs.
However, upon return of the package from the SIM loop the 1 G resistors seemed to
be unstable, possibly due to mishandling during shipping, and it was decided to allow a
period of several months for them to stabilize before continuing with the comparison.

5
Fortunately there is no evidence of a change in the value of the resistors once they
reached stability.
The second loop of the comparison was carried out without any problems and was
completed in July, 2014. The third loop started in November 2014 with the shipment of
the resistors to NMISA. This loop included the participation of KRISS, Korea but their
technical expert was on extended leave and they were unable to measure the resistors
for at least one year. At the informal meeting of the CCEM Working group on DC and
Low Frequency Quantities at the 2014 Conference on Precision Electromagnetic
Measurements (CPEM) in Rio de Janeiro, Brazil, it was decided to add another NMI
from the Asia Pacific Metrology Programme (APMP) to replace KRISS. The Measurement
Standards Laboratory (MSL) of New Zealand kindly agreed to participate in the
comparison. The traveling standards were scheduled to be sent to VNIIM after being
measured at NMISA but the documentation and the Carnet were not adequate to clear
Russian customs. After a couple of months, in February 2015, the problem with the
documentation could not be resolved and it was decided to modify the schedule and
send the resistors to MSL. This was during the summer vacations in New Zealand and it
was understood that they wouldn’t be able to measure the resistors right away but they
agreed to receive the package then because no other NMI was available at that time to
continue with the comparison.
An additional delay occurred at MSL due to some difficulties while doing the
measurements. The resistors were received back at NRC at the end of June, 2015.
The last loop of the comparison proceeded very slowly. The standards were sent to NIM
at the end of October, 2015, then to VNIIM in February, 2016 and finally to KRISS at the
end of June, 2016. The eventual re-inclusion of KRISS meant that the MSL participation
in the comparison was not deemed necessary and, due to a heavy workload, they
decided not to report their results.
The effect of atmospheric pressure was not anticipated to affect the comparison.
However, tests made after all the legs of the comparison were completed indicated that
the pressure coefficient of the resistors was significant and it was decided to make
careful measurements to evaluate this effect and correct for it. The pressure chamber
needed for this had a leak and it took a few months for the repair and the measurements
to be completed.
Finally, it is acknowledged that there were periods of time throughout the comparison
when the pilot laboratory was overwhelmed with a heavy workload and this also
contributed to the slow completion of the measurements and the analysis.
5. Measurement results at 10 M.
The results reported by the participants were corrected to nominal conditions (T=23 °C, V=10
V) using the parameters shown in table 2. These parameters were determined by the pilot
laboratory in the temperature range between 19 °C and 27 °C and for voltages between 10 V
and 100 V. For both resistors, a linear model with a simple temperature coefficient T and a
voltage coefficient V was deemed adequate.

6
Additionally, the pressure coefficient P was found to be significant for laboratories at high
altitude and the data were corrected to the nominal atmospheric pressure of the pilot laboratory
(101.4 kPa). The atmospheric pressure was either reported by the participants or it was
obtained from the data logger which was included with the travelling standards. The reported
and corrected data are summarized in tables 3 (S/N 1100405) and 4 (S/N 1101333).
Table 2. Temperature, voltage and pressure coefficients for the 10 M resistors. The reported
uncertainties are standard uncertainties.
Resistor T
(ppm / °C) u (T)
(ppm / °C) V
(ppm / V) u (V)
(ppm / V) P
(ppm/kPa) u (P)
(ppm/kPa)
1100405 0.01 0.02 -0.0023 0.0018 -0.041 0.009
1101333 0.73 0.02 -0.0036 0.0017 -0.044 0.011
Table 3. Reported results, measurement conditions and corrected values for resistor 1100405.
X05 =R/R is the relative resistance deviation from the nominal value expressed in parts in 106
(ppm). Uncertainties have a coverage factor k = 2.
Reported data Corrected data
Lab Date X05
(ppm) u TOTAL (ppm)
U A (ppm)
T
(°C) U (T ) (°C)
V (V)
P
(kPa) X05
(ppm) U TOTAL (ppm)
NRC 16-Feb-12 -0.12 0.58 0.31 23.05 0.06 10 101.4 -0.12 0.58
NRC 10-May-12 -0.29 0.68 0.15 22.95 0.06 10 101.4 -0.29 0.68
NRC 26-Aug-12 0.06 0.49 0.13 23.02 0.06 10 101.4 0.06 0.49
NIST 3-Oct-12 0.83 0.50 0.22 23.00 0.10 10 99.96 0.77 0.50
CENAM 25-Nov-12 2.50 0.82 0.36 23.00 0.02 9.1 81.08 1.66 0.84
INTI 4-Mar-13 3.00 0.60 0.16 23.00 0.10 9.954 101.4 3.00 0.60
NRC 2-Aug-13 3.32 0.71 0.14 22.88 0.08 10 101.4 3.32 0.71
NRC 5-Feb-14 3.94 0.42 0.11 22.92 0.06 10 101.4 3.94 0.42
PTB 12-Mar-14 3.40 1.00 0.58 23.02 0.10 10 101.38 3.40 1.00
NPL 11-Apr-14 4.06 0.15 0.02 23.01 0.20 10 101.73 4.08 0.15
METAS 25-May-14 4.32 0.48 0.1 23.00 0.10 10 95.26 4.07 0.48
VSL 29-Jun-14 6.35 0.42 0.08 23.00 0.02 9.09 101.70 6.36 0.42
NRC 25-Oct-14 5.73 0.50 0.13 22.98 0.08 10 101.4 5.73 0.50
NMISA 4-Dec-14 4.00 5.00 0.66 22.90 0.60 91 86.62 3.58 5.00
NRC 9-Oct-15 10.69 0.51 0.14 22.99 0.12 10 101.4 10.69 0.51
NIM 23-Dec-15 10.90 1.50 0.09 23.00 0.01 10 102.0 10.92 1.50
VNIIM 28-Mar-16 11.40 1.56 1.16 19.98 0.02 61.6 100.61 11.52 1.56
KRISS 2-Sep-16 9.00 0.58 0.26 23.00 0.04 50 100.2 9.04 0.58
NRC 29-Nov-16 13.03 0.46 0.23 23.03 0.06 10 101.4 13.03 0.46

7
Table 4. Reported results, measurement conditions and corrected values for resistor 1101333.
X33 =R/R is the relative resistance deviation from the nominal value expressed in parts in 106
(ppm). Uncertainties have a coverage factor k = 2.
Reported data Corrected data
Lab Date X33
(ppm) U TOTAL (ppm)
U A (ppm)
T
(°C) u (T ) (°C)
V (V)
P
(kPa) X33
(ppm) U TOTAL (ppm)
NRC 22-Feb-12 1.04 0.46 0.08 22.97 0.06 10 101.4 1.06 0.46
NRC 8-May-12 1.08 0.59 0.24 22.93 0.06 10 101.4 1.13 0.59
NRC 25-Aug-12 2.33 0.64 0.10 23.02 0.06 10 101.4 2.32 0.64
NIST 3-Oct-12 2.79 0.50 0.22 23.00 0.1 10 99.96 2.73 0.51
CENAM 25-Nov-12 4.94 0.80 0.28 23.00 0.028 9.1 81.08 4.05 0.83
INTI 5-Mar-13 5.70 0.60 0.16 23.00 0.1 9.954 101.4 5.70 0.60
NRC 2-Aug-13 5.56 0.73 0.21 22.90 0.06 10 101.4 5.63 0.73
NRC 5-Feb-14 5.61 0.54 0.38 22.92 0.06 10 101.4 5.67 0.54
PTB 12-Mar-14 5.40 1.00 0.58 23.02 0.1 10 101.38 5.38 1.00
NPL 12-Apr-14 6.19 0.16 0.03 22.99 0.2 10 101.73 6.21 0.21
METAS 25-May-14 6.52 0.48 0.10 23.00 0.1 10 95.26 6.25 0.49
VSL 26-Jun-14 8.67 0.42 0.08 23.00 0.018 9.09 101.70 8.68 0.42
NRC 27-Oct-14 7.94 0.48 0.06 22.94 0.06 10 101.4 7.98 0.48
NMISA 4-Dec-14 7.00 5.00 1.09 22.90 0.6 91 86.62 6.72 5.03
NRC 1-Oct-15 13.54 0.49 0.08 22.99 0.06 10 101.4 13.55 0.49
NIM 23-Dec-15 13.20 1.50 0.08 23.00 0.012 10 102.0 13.22 1.50
VNIIM 28-Mar-16 11.70 1.68 1.16 19.98 0.02 61.6 100.61 14.05 1.69
KRISS 2-Sep-16 12.40 0.58 0.26 23.00 0.04 50 100.2 12.49 0.60
NRC 8-Dec-16 15.41 0.48 0.08 22.98 0.06 10 101.4 15.42 0.48
UA and UB stand for type A and type B uncertainty components. Figures 1 and 2 show the
corrected measurements for resistors 1100405 and 1101333 respectively. The plots also show
a linear fit to the pilot laboratory data and the regression parameters are summarized in table 5.
It seems clear that the measurements show significant departures with respect to a linear trend
over the full time of the comparison but it’s difficult to know if or when the resistors suffered
abrupt changes over relatively short periods of time. After considering several types of analysis,
it was decided to analyze the data in three separate segments, as shown in figure 3. This
approach is thought to minimize the impact of the instability of the resistors and yield the best
estimate of the differences between laboratories.
First the measurements from the two travelling standards were combined to obtain a single
result Xi for each NMI. This was done by taking the weighted mean:
𝑋𝑖 = 𝑣05 𝑋05 + 𝑣33 𝑋33 , (1)

8
Figure 1. Corrected measurements of the 10 M resistor, S/N 1100405. The pilot laboratory
measurements are shown in blue circles, all other measurements shown as red squares. The
uncertainty bars are the k=2 uncertainties reported by the laboratories. The vertical scale is the
deviation from the nominal value, expressed in ppm.
Figure 2. Corrected measurements of the 10 M resistor, S/N 1101333. The pilot laboratory
measurements are shown in blue circles, all other measurements shown as red squares. The
uncertainty bars are the k=2 uncertainties reported by the laboratories. The vertical scale is the
deviation from the nominal value, expressed in ppm.

9
Table 5. Fit parameters for the 10 M resistors.
Resistor (ppm) Slope
(ppm/year) Correlation coefficient
1100405 0.82 2.91 0.87
1101333 0.95 3.15
Combined 0.85 3.02
Figure 3. Combined measurement results calculated from the weighted mean of the corrected
values of the two travelling standards. Error bars are the k=2 uncertainties.
with the weights v05 and v33 given by:
𝑣05 =
1𝜎05
2
1𝜎05
2 + 1
𝜎332
= 0.56 (2)
𝑣33 =
1𝜎33
2
1𝜎05
2 + 1
𝜎332
= 0.44 (3)

10
where 05 and 33 are the regression standard deviations shown in table 5.
The uncertainty of the combined result was calculated as:
𝑈2(𝑋𝑖) = 𝑈𝐵2(𝑋𝑖) + 𝑣05
2 𝑈𝐴−052 + 𝑣33
2 𝑈𝐴−332 (4)
The combined results and uncertainties are shown in table 6.
Table 6. Combined measurement results and uncertainties expressed in ppm. The uncertainty
has a coverage factor of k=2.
Lab Date Xi
(ppm)
U(Xi)
(ppm)
NRC 25-Aug-12 1.04 0.56
NIST 3-Oct-12 1.62 0.48
CENAM 25-Nov-12 2.70 0.78
INTI 4-Mar-13 4.18 0.59
NRC 2-Aug-13 4.33 0.71
NRC 5-Feb-14 4.69 0.43
PTB 12-Mar-14 4.26 0.92
NPL 11-Apr-14 5.01 0.15
METAS 25-May-14 5.02 0.48
VSL 27-Jun-14 7.37 0.42
NRC 26-Oct-14 6.71 0.49
NMISA 4-Dec-14 4.95 4.97
NRC 5-Oct-15 11.93 0.50
NIM 23-Dec-15 11.92 1.50
VNIIM 28-Mar-16 12.64 1.41
KRISS 2-Sep-16 10.54 0.56
NRC 3-Dec-16 14.07 0.46
Next, for each of the three subgroups, the difference between each NMI and the pilot lab Di - NRC
was obtained by interpolating the pilot lab results (blue line in figure 3) to the time of the NMI
measurements. The k=2 uncertainties of these differences were calculated as:
𝑈2(𝐷𝑖−𝑁𝑅𝐶) = 𝑈𝑖2 + (2𝜎10𝑀)2 , (5)
where 10M = 0.85 ppm is the standard deviation of the regression of the combined pilot
laboratory data, shown on table 5. The use of 10M in equation 5 tends to overestimate the
uncertainty of the comparison for several laboratories but its use was deemed appropriate to
account for the possibility of abrupt changes in the resistors at various times. Note that 10M is
not smaller than both individual standard deviations in table 5 due to the high degree of

11
correlation between the two resistors. The differences between each NMI and the pilot lab and
the corresponding uncertainties are shown in table 7. The uncertainty entry for NRC in table 7
was calculated as:
𝑈2(𝐷1−𝑁𝑅𝐶) = 𝑈𝑁𝑅𝐶2 + (2𝜎10𝑀)2, (6)
where UNRC is the pooled standard deviation of all the NRC measurements shown in table 6,
assuming equal degrees of freedom.
Table 7. Difference between each NMI and the pilot lab and the corresponding uncertainty,
expressed in ppm. The uncertainty has a coverage factor of k=2.
Lab Di-NRC (ppm)
U(Di-NRC) (ppm)
NRC 0.00 1.78
NIST 0.21 1.76
CENAM 0.78 1.87
INTI 1.30 1.80
PTB -0.70 1.93
NPL -0.19 1.70
METAS -0.51 1.76
VSL 1.58 1.75
NMISA -2.06 5.25
NIM -0.41 2.26
VNIIM -0.17 2.21
KRISS -3.07 1.79
The reference value XKCRV was calculated as:
𝑋𝐾𝐶𝑅𝑉 = ∑ 𝑤𝑖𝐷𝑖−𝑁𝑅𝐶
𝑖
= −0.11 𝑝𝑝𝑚, (7)
with the weights wi given by:
𝑤𝑖 =
1[𝑈(𝐷𝑖−𝑁𝑅𝐶)]2
∑1
[𝑈(𝐷𝑗−𝑁𝑅𝐶)]2𝑗
. (8)
The observed value of chi-squared,
𝜒𝑜𝑏𝑠2 = ∑
(𝐷𝑖−𝑁𝑅𝐶 − 𝑋𝐾𝐶𝑅𝑉)2
[𝑢(𝐷𝑖−𝑁𝑅𝐶)]2
𝑖
= 19.4 , (9)

12
yields a probability of 𝜒2(𝜈) > 𝜒𝑜𝑏𝑠2 of 5.4 % ( = 11) and hence, the consistency check is
passed. The uncertainty in equation 9 is the standard uncertainty.
The uncertainty of XKCRV was calculated as:
𝑈𝐾𝐶𝑅𝑉2 =
1
∑1
𝑈𝑖,12
= (0.55 𝑝𝑝𝑚)2. (10)
The degrees of equivalence
𝐷𝑖 = 𝐷𝑖−𝑁𝑅𝐶 − 𝑋𝐾𝐶𝑅𝑉 (11)
and corresponding uncertainties
𝑈2(𝐷𝑖) = 𝑈2(𝐷𝑖−𝑁𝑅𝐶) − 𝑈2(𝑋𝐾𝐶𝑅𝑉), (12)
are shown in table 8 and figure 4.
Table 8. Degrees of equivalence and corresponding expanded uncertainty (k=2), expressed in
ppm.
Lab Di (ppm) U(D i) (ppm)
NRC 0.1 1.7
NIST 0.3 1.7
CENAM 0.9 1.8
INTI 1.4 1.7
PTB -0.6 1.8
NPL -0.1 1.6
METAS -0.4 1.7
VSL 1.7 1.7
NMISA -2.0 5.2
NIM -0.3 2.2
VNIIM -0.1 2.1
KRISS -3.0 1.7
The degrees of equivalence between pairs of laboratories
𝐷𝑖,𝑗 = 𝐷𝑖 − 𝐷𝑗 (13)
and the corresponding uncertainty
𝑈2(𝐷𝑖,𝑗) = 𝑈2(𝑋𝑖) + 𝑈2(𝑋𝑗) + (2𝜎10𝑀)2, (14)
are shown in tables 9 and 10 respectively.

13
Figure 4. Degrees of equivalence at 10 M and corresponding uncertainty (k=2), expressed in
ppm.
Table 9. Degrees of equivalence Di,j between pairs of laboratories, expressed in ppm.
j i
NRC NIST CENAM INTI PTB NPL METAS VSL NMISA NIM VNIIM KRISS
NRC -0.2 -0.8 -1.3 0.7 0.2 0.5 -1.6 2.1 0.4 0.2 3.1
NIST 0.2 -0.6 -1.1 0.9 0.4 0.7 -1.4 2.3 0.6 0.4 3.3
CENAM 0.8 0.6 -0.5 1.5 1.0 1.3 -0.8 2.8 1.2 1.0 3.8
INTI 1.3 1.1 0.5 2.0 1.5 1.8 -0.3 3.4 1.7 1.5 4.4
PTB -0.7 -0.9 -1.5 -2.0 -0.5 -0.2 -2.3 1.4 -0.3 -0.5 2.4
NPL -0.2 -0.4 -1.0 -1.5 0.5 0.3 -1.8 1.9 0.2 0.0 2.9
METAS -0.5 -0.7 -1.3 -1.8 0.2 -0.3 -2.1 1.6 -0.1 -0.3 2.6
VSL 1.6 1.4 0.8 0.3 2.3 1.8 2.1 3.6 2.0 1.8 4.6
NMISA -2.1 -2.3 -2.8 -3.4 -1.4 -1.9 -1.6 -3.6 -1.7 -1.9 1.0
NIM -0.4 -0.6 -1.2 -1.7 0.3 -0.2 0.1 -2.0 1.7 -0.2 2.7
VNIIM -0.2 -0.4 -1.0 -1.5 0.5 0.0 0.3 -1.8 1.9 0.2 2.9
KRISS -3.1 -3.3 -3.8 -4.4 -2.4 -2.9 -2.6 -4.6 -1.0 -2.7 -2.9

14
Table 10. Uncertainty of the degrees of equivalence between pairs of laboratories, k=2,
expressed in ppm.
j i
NRC NIST CENAM INTI PTB NPL METAS VSL NMISA NIM VNIIM KRISS
NRC 1.8 1.9 1.9 2.0 1.8 1.8 1.8 5.3 2.3 2.3 1.9
NIST 1.8 1.9 1.9 2.0 1.8 1.8 1.8 5.3 2.3 2.3 1.9
CENAM 1.9 1.9 2.0 2.1 1.9 1.9 1.9 5.3 2.4 2.3 2.0
INTI 1.9 1.9 2.0 2.0 1.8 1.9 1.8 5.3 2.3 2.3 1.9
PTB 2.0 2.0 2.1 2.0 1.9 2.0 2.0 5.3 2.4 2.4 2.0
NPL 1.8 1.8 1.9 1.8 1.9 1.8 1.8 5.3 2.3 2.2 1.8
METAS 1.8 1.8 1.9 1.9 2.0 1.8 1.8 5.3 2.3 2.3 1.9
VSL 1.8 1.8 1.9 1.8 2.0 1.8 1.8 5.3 2.3 2.2 1.8
NMISA 5.3 5.3 5.3 5.3 5.3 5.3 5.3 5.3 5.5 5.4 5.3
NIM 2.3 2.3 2.4 2.3 2.4 2.3 2.3 2.3 5.5 2.7 2.3
VNIIM 2.3 2.3 2.3 2.3 2.4 2.2 2.3 2.2 5.4 2.7 2.3
KRISS 1.9 1.9 2.0 1.9 2.0 1.8 1.9 1.8 5.3 2.3 2.3
6. Measurement results at 1 G.
For the 1 G measurements the specified nominal conditions were a V=100 V and T=23 °C.
The parameters shown in table 11, which were determined by the pilot laboratory in the
temperature range between 19 °C and 27 °C and for voltages between 50 V and 150 V, were
used to correct the results to nominal conditions. A simple voltage coefficient V and a quadratic
temperature dependence, expressed as
𝑅(𝑇) = 𝑅(23) + 𝛼𝑇(𝑇 − 23) + 𝛽𝑇(𝑇 − 23)2, (15)
were deemed adequate.
Additionally, as with the 10 M resistors, the pressure dependence of the resistors was
evaluated by the pilot laboratory between 78 kPa and 109 kPa and the measurement results
reported by the participants were corrected to the nominal pressure of the pilot laboratory (101.4
kPa). Resistor 1100037 was well described by a linear pressure coefficient, P, while 1101485
showed a quadratic dependence which was modelled as:
𝑅(𝑃) = 𝑅(101.4) + 𝛼𝑃(𝑃 − 101.4) + 𝛽𝑃(𝑃 − 101.4)2, (16)
The reported and corrected data are summarized in tables 12 (S/N 1100037) and 13 (S/N
1101485).

15
Table 11. Temperature, Voltage and Pressure coefficients for the 1 G resistors. The reported
uncertainties are standard uncertainties.
Resistor T u (T) T u (T) V u (V) P u (P) P u (P)
(ppm/°C) (ppm/°C2) (ppm/V) (ppm/kPa) (ppm/kPa2)
1100037 3.805 0.028 -0.076 0.011 -0.003 0.006 0.038 0.012 - -
1101485 3.782 0.036 -0.017 0.014 -0.011 0.007 0.193 0.010 0.0041 0.0006
Table 12. Reported results, measurement conditions and corrected values for resistor 1100037.
X37 =R/R is the relative resistance difference from the nominal value expressed in parts in 106
(ppm). Uncertainties have a coverage factor k = 2.
Reported data Corrected data
Lab Date X37
(ppm) UTOTAL (ppm)
UA (ppm)
T (°C)
U(T) (°C)
V (V)
P (kPa)
X37 (ppm)
UTOTAL (ppm)
NRC 3-Apr-12 -5.07 3.90 0.57 22.99 0.03 100 101.4 -5.03 3.91
NIST 1-Oct-12 -2.76 1.90 1.62 23.00 0.05 100 99.96 -2.71 1.94
CENAM 26-Nov-12 1.80 7.60 0.20 22.97 0.04 100 81.08 2.68 7.65
INTI 9-Mar-13 9.80 6.00 2.76 23.00 0.05 99.9992 101.4 9.80 6.01
NRC 11-Aug-13 0.58 3.83 0.15 23.04 0.03 100 101.4 0.43 3.84
NRC 6-Feb-14 -1.40 3.80 0.07 22.99 0.03 100 101.4 -1.36 3.81
PTB 8-Mar-14 -4.00 5.00 1.12 23.01 0.05 100 101.38 -4.04 5.01
NPL 14-Apr-14 0.47 0.64 0.46 23.03 0.10 100 101.73 0.35 0.99
METAS 22-May-14 -0.30 5.30 0.80 23.00 0.05 100 95.26 -0.07 5.32
VSL 29-Jun-14 6.30 2.00 0.62 22.91 0.01 99.5 101.70 6.64 2.00
NRC 22-Sep-14 1.13 3.90 0.74 23.02 0.03 100 101.4 1.05 3.91
NMISA 30-Nov-14 -7.00 10.00 7.64 22.90 0.30 91 86.62 -6.08 10.27
NRC 23-Sep-15 2.44 3.90 0.72 22.99 0.03 100 101.4 2.48 3.91
NIM 25-Dec-15 -0.40 4.30 0.31 23.00 0.00 100 102.0 -0.42 4.30
VNIIM 5-Apr-16 -7.40 5.60 4.20 20.02 0.01 58.5 100.61 4.53 5.61
KRISS 27-Aug-16 7.90 3.20 1.60 23.00 0.02 100 100.2 7.95 3.20
NRC 9-Mar-17 3.37 4.00 1.02 22.99 0.03 100 101.4 3.41 4.01

16
Table 13. Reported results, measurement conditions and corrected values for resistor 1101485.
X85 =R/R is the relative resistance difference from the nominal value expressed in parts in 106
(ppm). Uncertainties have a coverage factor k = 2.
Reported data Corrected data
Lab Date X85
(ppm) UTOTAL (ppm)
UA (ppm)
T (°C)
U(T) (°C)
V (V)
P (kPa)
X85 (ppm)
UTOTAL (ppm)
NRC 3-Apr-12 -11.72 4.20 1.86 22.97 0.03 100 101.4 -11.61 4.21
NIST 1-Oct-12 -10.91 1.40 1.00 23.00 0.05 100 99.96 -10.64 1.48
CENAM 26-Nov-12 -8.10 7.60 0.40 22.99 0.08 100 81.08 -5.83 8.74
INTI 9-Mar-13 -3.00 5.60 2.76 23.00 0.05 99.9992 101.4 -2.99 5.61
NRC 11-Aug-13 -9.56 3.87 0.29 23.07 0.03 100 101.4 -9.82 3.88
NRC 6-Feb-14 -9.82 3.90 0.97 22.99 0.03 100 101.4 -9.78 3.91
PTB 8-Mar-14 -13.00 5.00 1.12 23.01 0.05 100 101.38 -13.03 5.01
NPL 14-Apr-14 -8.65 0.87 0.75 23.03 0.10 100 101.73 -8.84 1.15
METAS 22-May-14 -10.00 5.30 0.80 23.00 0.05 100 95.26 -8.97 5.45
VSL 29-Jun-14 -4.60 2.00 0.62 22.90 0.01 99.5 101.70 -4.27 2.00
NRC 22-Sep-14 -7.32 4.30 1.71 23.03 0.03 100 101.4 -7.43 4.31
NMISA 30-Nov-14 -24.00 10.00 7.72 22.90 0.30 91 86.62 -21.77 10.68
NRC 23-Sep-15 -5.68 3.80 0.55 22.99 0.03 100 101.4 -5.64 3.81
NIM 25-Dec-15 -10.20 4.30 0.16 23.00 0.00 100 102.0 -10.32 4.30
VNIIM 5-Apr-16 -17.90 4.60 2.60 20.01 0.01 58.5 100.61 -6.74 4.62
KRISS 27-Aug-16 16.80 3.20 1.60 23.00 0.02 100 100.2 17.03 3.21
NRC 9-Mar-17 -6.13 4.10 1.66 23.01 0.03 100 101.4 -6.17 4.11
Figures 5 and 6 show the corrected measurements for resistors 1100037 and 1101485
respectively and a linear fit to the pilot laboratory data.
Both resistors showed a very predictable linear trend. As with the 10 M case, the first step of
the analysis was to combine the measurements from the two travelling standards to obtain a
single result Xi for each NMI by taking the weighted mean:
𝑋𝑖( 𝑡𝑖) = 𝑣37 𝑋37 + 𝑣85 𝑋85 , (17)
with the weights v37 and v85 given by:
𝑣37 =
1𝜎37
2
1𝜎37
2 + 1
𝜎852
= 0.35 (18)

17
Figure 5. Corrected measurements of the 1 G resistor, S/N 1100037. The pilot laboratory
measurements are shown in blue circles, all other laboratories shown as red squares. The
uncertainty bars are the k=2 uncertainties reported by the laboratories. The vertical scale is the
deviation from the nominal value, expressed in ppm.
Figure 6. Corrected measurements of the 1 G resistor, S/N 1101485. The pilot laboratory
measurements are shown in blue circles, all other laboratories shown as red squares. The
uncertainty bars are the k=2 uncertainties reported by the laboratories. The vertical scale is the
deviation from the nominal value, expressed in ppm.

18
and
𝑣85 =
1𝜎85
2
1𝜎37
2 + 1
𝜎852
= 0.65 (19)
37 and 85 are the regression standard deviations shown in table 14 which were calculated
using the pilot laboratory data.
The uncertainty of the combined result was calculated as:
𝑈𝑖2[𝑋𝑖( 𝑡𝑖)] = 𝑈𝑖𝐵
2 [𝑋𝑖( 𝑡𝑖)] + 𝑣372 𝑈𝑖𝐴−37
2 + 𝑣852 𝑈𝑖𝐴−85
2 (20)
A linear regression was calculated using the six combined results of the pilot laboratory. The
standard deviation 1G and slope m1G of the combined data regression are also shown in table
14.
Table 14. Fit parameters for the 1 G resistors.
Resistor (ppm) Slope
(ppm/year) Correlation coefficient
1100037 1.38 1.62 0.49
1101485 1.02 1.27
Combined 0.99 1.40
The slope m1G was used to correct the NMI combined results to the average time ( t=0) of the
pilot laboratory:
𝑋𝑖(𝑡 = 0) = 𝑋𝑖(𝑡𝑖) − 𝑚1𝐺 𝑡𝑖 (21)
The uncertainty ui(0) of the drift-corrected values Xi( t=0) was calculated as:
𝑈𝑖2[𝑋𝑖( 0)] = 𝑈2[𝑋𝑖( 𝑡𝑖)] + (2𝜎1𝐺)2 + [2𝑢(𝑚1𝐺)𝑡𝑖] 2 (22)
where u(m1G) = 0.26 ppm/year is the standard uncertainty of the slope on the regression of the
combined pilot laboratory data. For the pilot laboratory, the value shown in table 15 at t=0 is
given by the intercept parameter of the regression and the uncertainty was calculated as:
𝑈2[𝑋𝑖(0)] = 𝑈1𝐵2 + (2𝜎1𝐺)2 (1 +
1
𝐾) , (23)
where K is the number of measurements made by the pilot laboratory and is equal to 6.
19
Table 15. Combined measurement results and uncertainties at t=ti and t=0.
Lab Date Xi(ti)
(ppm) U [Xi(ti)] (k=2)
(ppm) Xi(0)
(ppm) U [Xi(0)] (k=2)
(ppm)
NRC 9-Aug-14 -5.38 3.91 -5.38 4.31
NIST 1-Oct-12 -7.84 1.38 -5.25 2.60
CENAM 25-Nov-12 -2.83 8.19 -0.45 8.48
INTI 9-Mar-13 1.52 5.50 3.51 5.90
PTB 8-Mar-14 -9.86 4.96 -9.26 5.34
NPL 13-Apr-14 -5.60 1.02 -5.14 2.24
METAS 22-May-14 -5.83 5.36 -5.52 5.71
VSL 29-Jun-14 -0.42 1.96 -0.26 2.79
NMISA 30-Nov-14 -16.23 9.11 -16.66 9.33
NIM 25-Dec-15 -6.82 4.30 -8.74 4.79
VNIIM 5-Apr-16 -2.76 4.39 -5.07 4.89
KRISS 3-Sep-16 13.82 3.02 10.93 3.77
The last point in figure 7 was considered an outlier (with an offset of more than 7). Excluding
this point, the reference value XKCRV was calculated as:
𝑋𝐾𝐶𝑅𝑉 = ∑ 𝑤𝑖𝑋𝑖(0) = −4.5 𝑝𝑝𝑚
𝑖≠12
, (24)
with the weights wi given by:
𝑤𝑖 =
1𝑈𝑖
2[𝑋𝑖( 0)]
∑1
𝑈𝑗2[𝑋𝑗( 0)]
𝑗
. (25)
The uncertainty of XKCRV (k=2) was calculated as:
𝑢𝐾𝐶𝑅𝑉2 =
1
∑[𝑈(𝑋𝑖(0))]−2 = (1.2 𝑝𝑝𝑚)2. (26)
The degrees of equivalence
𝐷𝑖 = 𝑋𝑖(0) − 𝑋𝐾𝐶𝑅𝑉 (27)
and corresponding uncertainties
𝑈2(𝐷𝑖) = 𝑈2[𝑋𝑖( 0)] ∓ 𝑈2(𝑋𝐾𝐶𝑅𝑉), (28)
are shown in table 16 and figure 7. The plus sign in equation 28 was used for the laboratory that
was excluded from the calculation of the KCRV and the minus sign applies to all other
laboratories.

20
Table 16. Degrees of equivalence and corresponding uncertainty (k=2), expressed in ppm.
Lab Di U(D i), (k=2)
NRC -0.9 4.2
NIST -0.8 2.3
CENAM 4.1 8.4
INTI 8.0 5.8
PTB -4.8 5.2
NPL -0.6 1.9
METAS -1.0 5.6
VSL 4.2 2.5
NMISA -12.2 9.3
NIM -4.2 4.6
VNIIM -0.6 4.8
KRISS 15.4 4.0
Figure 7. Degrees of equivalence and corresponding uncertainty at 1 G (k=2).
This analysis failed a chi-squared consistency check with 𝜒𝑜𝑏𝑠2 = 31.7, = 10, and P [ 𝜒2(𝜈) >
𝜒𝑜𝑏𝑠2 ] = 0.05 % and therefore XKCRV should be regarded as an arbitrary reference. The degrees
of equivalence between pairs of laboratories
𝐷𝑖,𝑗 = 𝐷𝑖 − 𝐷𝑗 (29)
and the corresponding uncertainty
𝑈2[𝐷𝑖 − 𝐷𝑗] = 𝑈2[𝑋𝑖( 𝑡𝑖)] + 𝑈2[𝑋𝑗( 𝑡𝑗)] + (2𝜎1𝐺)2 + [2𝑈(𝑚1𝐺)(𝑡𝑖 − 𝑡𝑗)] 2 (30)

21
are shown in tables 17 and 18 respectively.
Table 17. Degrees of equivalence Di,j between pairs of laboratories, expressed in ppm.
j i
NRC NIST CENAM INTI PTB NPL METAS VSL NMISA NIM VNIIM KRISS
NRC -0.1 -4.9 -8.9 3.9 -0.2 0.1 -5.1 11.3 3.4 -0.3 -16.3
NIST 0.1 -4.8 -8.8 4.0 -0.1 0.3 -5.0 11.4 3.5 -0.2 -16.2
CENAM 4.9 4.8 -4.0 8.8 4.7 5.1 -0.2 16.2 8.3 4.6 -11.4
INTI 8.9 8.8 4.0 12.8 8.7 9.0 3.8 20.2 12.3 8.6 -7.4
PTB -3.9 -4.0 -8.8 -12.8 -4.1 -3.7 -9.0 7.4 -0.5 -4.2 -20.2
NPL 0.2 0.1 -4.7 -8.7 4.1 0.4 -4.9 11.5 3.6 -0.1 -16.1
METAS -0.1 -0.3 -5.1 -9.0 3.7 -0.4 -5.3 11.1 3.2 -0.4 -16.5
VSL 5.1 5.0 0.2 -3.8 9.0 4.9 5.3 16.4 8.5 4.8 -11.2
NMISA -11.3 -11.4 -16.2 -20.2 -7.4 -11.5 -11.1 -16.4 -7.9 -11.6 -27.6
NIM -3.4 -3.5 -8.3 -12.3 0.5 -3.6 -3.2 -8.5 7.9 -3.7 -19.7
VNIIM 0.3 0.2 -4.6 -8.6 4.2 0.1 0.4 -4.8 11.6 3.7 -16.0
KRISS 16.3 16.2 11.4 7.4 20.2 16.1 16.5 11.2 27.6 19.7 16.0
Table 18. Uncertainty of the degrees of equivalence between pairs of laboratories, U(Di,j),
expressed in ppm, k=2.
j i
NRC NIST CENAM INTI PTB NPL METAS VSL NMISA NIM VNIIM KRISS
NRC 4.7 9.3 7.1 6.6 4.5 6.9 4.8 10.1 6.2 6.3 5.4
NIST 4.7 8.5 6.0 5.6 2.7 5.9 3.2 9.5 5.2 5.3 4.4
CENAM 9.3 8.5 10.1 9.8 8.5 10.0 8.7 12.5 9.6 9.7 9.2
INTI 7.1 6.0 10.1 7.7 6.0 8.0 6.2 10.9 7.4 7.5 6.8
PTB 6.6 5.6 9.8 7.7 5.4 7.6 5.7 10.6 6.9 7.0 6.3
NPL 4.5 2.7 8.5 6.0 5.4 5.8 3.0 9.4 4.9 5.0 4.0
METAS 6.9 5.9 10.0 8.0 7.6 5.8 6.0 10.8 7.2 7.3 6.6
VSL 4.8 3.2 8.7 6.2 5.7 3.0 6.0 9.5 5.2 5.3 4.3
NMISA 10.1 9.5 12.5 10.9 10.6 9.4 10.8 9.5 10.3 10.3 9.8
NIM 6.2 5.2 9.6 7.4 6.9 4.9 7.2 5.2 10.3 6.5 5.6
VNIIM 6.3 5.3 9.7 7.5 7.0 5.0 7.3 5.3 10.3 6.5 5.7
KRISS 5.4 4.4 9.2 6.8 6.3 4.0 6.6 4.3 9.8 5.6 5.7

22
7. Comments on specific NMI results
The comments in sections 7.1 and 7.2 were provided by VSL and KRISS respectively.
7.1 VSL results
Following the distribution of the Draft A report to the participants, VSL has performed an
extensive evaluation of its comparison results. At the time of the comparison measurements, the
VSL results showed good agreement with an independent verification using Hamon devices, so
the VSL comparison DoE values were not as expected.
In the evaluation of the 10 MΩ comparison results, it was finally found that the self-calibration of
the binary divider of the VSL measurement bridge used for scaling from 10 kΩ to 10 MΩ was
performed with too short settling times. This resulted in a +0.5 ppm error per 1:10 scaling step,
culminating in a +1.5 µΩ/Ω deviation at 10 MΩ. This very well explains the +1.7 µΩ/Ω DoE of
VSL at 10 MΩ. Verification of the 10 x 100 kΩ Hamon device used during the 2014 comparison
measurements with the now correctly functioning measurement bridge reveals a -1.1 ppm error
in the 1:100 ratio of this Hamon device. Apparently, the VSL measurement bridge and the
verification Hamon device had exactly compensating errors in the 1:100 scaling during the
comparison measurements.
No deviations were found in the evaluation of the 1:100 scaling from 10 MΩ to 1 GΩ level.
However, during the 2014 comparison measurements, one of the voltage sources in the VSL
dual source voltage bridge started showing unexpected behaviour; it was finally replaced after
the comparison measurements. With the present VSL system, the 1:100 scaling ratio measured
with the VSL dual source measurement bridge agrees within (0.2 ± 0.4) ppm with that of a 10 x
100 MΩ Hamon device. Before the comparison start, a similar verification was performed with
(+0.9 ± 1.5) ppm (k = 2) as result. So likely, the additional VSL deviation in the 1 GΩ
comparison results is caused by a voltage source that started to malfunction during the
comparison measurements.
The above evaluation of the VSL comparison results was verified by measurements early 2019
of a 10 MΩ and 1 GΩ resistor by both VSL and NPL. This bilateral verification showed excellent
results. The respective differences between the VSL and NPL results are (k = 2 uncertainties):
• 10 M resistance: (+0.3 ± 0.5) µΩ/Ω,
• 1:100 scaling from 10 MΩ to 1 GΩ: (-0.4 ± 1.0) µΩ/Ω,
• 1 GΩ resistance: (-0.1 ± 1.1) µΩ/Ω.
It is noted that this bilateral exercise allowed verification of NMI measurement capabilities to a
significantly better level than the formal comparison. This may be a good motivation to move to
23
a star-type comparison for future resistance comparisons, similar to the recent CCEM-K4
capacitance comparison.
7.2 KRISS results
When the travelling standards of the CCEM Key Comparison were measured at KRISS, the
ground noise from the outside was severe. Thus, in order to reduce the noise, we tried a new
ground connection, different from the old one, which is proven to be ok by APMP.EM-K2 and
2017 peer review. This new ground connection resulted in the discrepancy of the measurement
from the reference value. We later confirmed this by comparing two measurements with old and
new ground connection of standard resistors which have similar internal structures as the ones
used in the Key Comparison. We are now using the old ground connection.
8. Conclusions
The CCEM-K2.2012 key comparison has partially satisfied the stated purpose of assessing the
improved measurement capabilities of the participating NMIs since the original CCEM-K2
comparison in 2002.
For the 10 M results the measurement uncertainties reported by most laboratories are smaller
than the uncertainty due to the long term variability of the resistors. It is worth noting that the
variability of the resistors in this comparison was comparable to that of the standards used in
2002 and that resistors with significantly better long term behavior would be necessary to yield
better results under the same circumstances. Nevertheless, the comparison achieved a
reduction in the uncertainties in the degrees of equivalency relative to those of the 2002
comparison and, for some laboratories, the reduction is quite significant. The uncertainty of
future comparisons could be reduced, for example, by a star design where the participating
NMIs send their own standards to the pilot laboratory to be measured within a short timeframe.
At 1 G the behavior of the travelling standards was satisfactory since their variability was
smaller than the reported measurement uncertainties (with the exception of two laboratories).
For most participants, these results provides strong support for their measurement capabilities
while the uncertainties of the degrees of equivalency are significantly smaller than those
reported in 2002. However, it should be noted that the failed chi-squared test at 1 G suggests
that some laboratories are underestimating their uncertainty.
Finally, this comparison also provides a better KCRV link for the RMO comparison
EURAMET.EM-K2 at 1 G although, this was not achieved at 10 M.
Acknowledgements
We would like to express our sincere gratitude to Beat Jeckelmann of METAS for meticulously
reading this report, checking the analysis, providing corrections and offering very insightful
comments.
24
References
[1] R.F. Dziuba and D. G. Jarrett, Final report on key comparison CCEM-K2 of resistance
standards at 10 M and 1 G, Metrologia, vol. 39, Tech. Suppl., 01001, 2002.
[2] R.E. Elmquist, D. G. Jarrett and N. F. Zhang, RMO Comparison final report: 2006-2007
Resistance standards comparison between SIM laboratories, Metrologia, vol. 46, Tech. Suppl.,
01001, 2009.
[3] Beat Jeckelmann and Markus Zeier, RMO Key Comparison EUROMET.EM-K2 Comparison
of Resistance Standards at 10 M and 1 G, Metrologia, vol. 47, Tech. Suppl., 01006, 2010.

25
Appendix A
NRC uncertainty budget – 10 MS/N 1100405
Source of Uncertainty Type Relative Standard uncertainty / 10-6
Measurement scatter A 0.15
Value of the 1 Mstandard resistor B 0.13
Leakage on the 6000B bridge B 0.1
Bridge 10:1 ratio calibration B 0.07
Bridge linearity B 0.01
Combined standard uncertainty 0.23
Expanded relative uncertainty (k=2) 0.46
Reported uncertainty 0.46
NRC uncertainty budget – 1 GS/N 1100037
Source of Uncertainty Type Relative Standard uncertainty / 10-6
Measurement scatter A 0.51
Value of the 10 Mstandard resistor B 1.37
Bridge source 1 (100 V) B 0.58
Bridge source 2 (10 V) B 0.29
Current meter accuracy B 0.01
3458 temperature coefficient B 0.08
3458 linearity (100 V range) B 0.60
Leakage B 1.00
Combined standard uncertainty 1.98
Expanded relative uncertainty (k=2) 3.96
Reported uncertainty 3.96

26
NIST uncertainty budget – 10 MS/N 1101333
Source of Uncertainty Type Relative Standard uncertainty / 10-6
Standard deviation A 0.11
Scaling / Traceability B 0.09
Reference standards B 0.07
Measuring apparatus B 0.02
Leakage effects B 0.01
Ambient temperature B 0.10
Repeatability B 0.14
Combined standard uncertainty 0.23
Expanded relative uncertainty (k=2) 0.47
Reported uncertainty 0.47
NIST uncertainty budget – 1 GS/N 1101485
Source of Uncertainty Type Relative Standard uncertainty / 10-6
Standard deviation A 0.50
Scaling / Traceability B 0.27
Reference standards B 0.07
Measuring apparatus B 0.40
Leakage effects B 0.10
Ambient temperature B 0.11
Repeatability B 0.02
Combined standard uncertainty 0.7
Expanded relative uncertainty (k=2) 1.4
Reported uncertainty 1.4

27
CENAM uncertainty budget – 10 MS/N 1101333
Source of Uncertainty Type Relative Standard uncertainty / 10-6
Scaling from the QHR to 1 M B 0.34
Drift of reference resistor B 0.10
Reference resistor temperature stability B 0.02
Bridge 10:1 ratio error B 0.06
Leakage in the measurement system B 0.10
Repeatibility A 0.14
Combined standard uncertainty 0.40
Expanded relative uncertainty (k=2) 0.80
Reported uncertainty 0.80
CENAM uncertainty budget – 1 GS/N 1100037
Source of Uncertainty Type Relative Standard uncertainty / 10-6
Scaling from the QHR to 100 M B 0.8
Drift of reference resistor B 0.2
Reference resistor temperature stability B 1.0
Calibration of source Vx B 2.0
Drift of source Vx B 0.2
Calibration of source Vs B 2.0
Drift of source Vs B 0.2
Detector resolution B 0.6
Leakage in the measurement system B 2.0
Repeatibility A 0.1
Combined standard uncertainty 3.8
Expanded relative uncertainty (k=2) 7.6
Reported uncertainty 7.6

28
INTI uncertainty budget – 10 MS/N 1101333
Source of Uncertainty Type Relative Standard uncertainty / 10-6
Scaling / traceability B 0.28
Reference standard B 0.03
Measuring apparatus B 0.02
Standard deviation A 0.08
Combined standard uncertainty 0.29
Expanded relative uncertainty (k=2) 0.58
Reported uncertainty 0.58
INTI uncertainty budget – 1 GS/N 1100037
Source of Uncertainty Type Relative Standard uncertainty / 10-6
Scaling / traceability B 0.28
Reference standard B 0.03
Measuring apparatus B 2.65
Standard deviation A 1.38
Combined standard uncertainty 3.01
Expanded relative uncertainty (k=2) 6.02
Reported uncertainty 6.02

29
PTB uncertainty budget – 10 M
Source of Uncertainty Type Relative Standard uncertainty / 10-6
Reference resistor B 0.05
Bridge ratio A 0.02
Ratio correction B 0.054
Temperature correction for standard resistor B 0.029
Drift correction for standard resistor B 0.12
Repeatibility A 0.29
Combined standard uncertainty 0.32
Expanded relative uncertainty (k=2) 0.65
Reported uncertainty 1.0
PTB uncertainty budget – 1 G
Source of Uncertainty Type Relative Standard uncertainty / 10-6
Reference resistor B 0.78
Bridge ratio A 0.019
Ratio correction B 0.054
Temperature correction for standard resistor B 0.029
Drift correction for standard resistor B 0.12
Repeatibility A 0.56
Combined standard uncertainty 0.969
Expanded relative uncertainty (k=2) 1.938
Reported uncertainty 5.0

30
NPL uncertainty budget – 10 M
Source of Uncertainty Type Relative Standard uncertainty / 10-6
CCC B < 0.001
Leakage B < 0.001
Standard resistor type A A 0.027
Standard resistor type B B 0.052
Temperature of the standard B 0.050
Standard power coefficient B 0.005
Unknown resistor A 0.063
Combined standard uncertainty 0.100
Expanded relative uncertainty (k=2) 0.200
Reported uncertainty 0.2
NPL uncertainty budget – 1 G
Source of Uncertainty Type Relative Standard uncertainty / 10-6
CCC B < 0.012
Leakage B < 0.001
SQUID linearity B 0.2
Series resistance B 0.02
Standard resistor type A A 0.027
Standard resistor type B B 0.052
Temperature of the standard B 0.050
Standard power coefficient B 0.050
Unknown resistor A 0.141
Combined standard uncertainty 0.26
Expanded relative uncertainty (k=2) 0.52
Reported uncertainty 0.52

31
METAS uncertainty budget – 10 M
Source of Uncertainty Type Relative Standard uncertainty / 10-6
Step-up QHR to 10 M A 0.11
10 M reference: stability temperature and loading A 0.11
1:1 bridge ratio: accuracy, interchange effects A 0.09
Leakage effects B 0.10
Temperature dependence of the device under test B 0.11
Reproducibility, measurement of unknown resistor A 0.05
Combined standard uncertainty 0.24
Expanded relative uncertainty (k=2) 0.48
Reported uncertainty 0.48
METAS uncertainty budget – 1 G
Source of Uncertainty Type Relative Standard uncertainty / 10-6
Step-up QHR to 100 M A 1.40
100 M reference: stability temperature and loading A 0.44
Reference voltage dependence A 1.00
Bridge: 10:1 voltage ratio calibration A 050
Bridge: 10:1 voltage ratio stability B 1.75
Uncompensated offset; burden voltage B 0.50
Temperature dependence of the device under test B 0.22
Reproducibility, measurement of unknown resistor A 0.40
Combined standard uncertainty 2.63
Expanded relative uncertainty (k=2) 5.3
Reported uncertainty 5.3

32
VSL uncertainty budget – 10 MS/N 1100405
Source of Uncertainty Type Relative Standard uncertainty / 10-6
10 M to 1 M ratio measurement A 0.04
Uncertainty of the 10 M to 1 M ratio B 0.12
Power / voltage effect in the 1 M transfer resistor B 0.029
Leakage effects (bridge, cables, reference and DUT) B 0.12
10 k to 1 M ratio measurement A 0.1
Uncertainty of the 10 k to 1 M ratio B 0.069
Temperature effect on the unknown 10 M resistor B 0.006
10 k reference resistor B 0.025
Temperature effect on the reference resistor B 0.006
Drift of the temperature resistor A 0.01
Power effect in the 10 k reference resistor B 0.006
Combined standard uncertainty 0.21
Expanded relative uncertainty (k=2) 0.42
Reported uncertainty 0.42

33
VSL uncertainty budget – 1 GS/N 1100037
Source of Uncertainty Type Relative Standard uncertainty / 10-6
Value of the 10 M reference resistor A 0.200
Power and/or voltage effect of reference resistor B 0.029
Temperature effect of reference resistor B 0.023
Measured ratio in 10 M - 1 G measurement A 0.003
3458A DVM voltage ratio calibration A 0.310
Drift in the voltage sources since last calibration B 0.400
3458A DVM non-linearity B 0.520
Linearity of the Rs voltage source B 0.290
Null detector gain error B 0.012
Effect of bridge sensitivity B 0.012
Difference in values measured with +V or -V B 0.020
Insufficient waiting time B 0.017
Leakage (bridge, cables, reference resistor, DUT) B 0.580
Combined standard uncertainty 1.0
Expanded relative uncertainty (k=2) 2.0
Reported uncertainty 2.0

34
NMISA uncertainty budget – 10 MS/N 1100405
Source of Uncertainty Type Relative Standard uncertainty / 10-6
Accuracy of the 6000B bridge B 0.05
Linearity of the 6000B bridge B 0.005
Short term drift of the 6000B bridge B 0.1
Thermal emf of the 4220A scanner B 0.0005
Contact resistance error of the 4220A scanner B 0.0025
Leakage resistance error of measurement system B 0.6
Reference standard calibration uncertainty B 2.0
Reference standard drift since last calibration B 0.033
Standard deviation of measurement results A 0.332
Combined standard uncertainty 2.12
Expanded relative uncertainty (k=2) 4.24
Reported uncertainty 5.0
NMISA uncertainty budget – 1 GS/N 1100037
Source of Uncertainty Type Relative Standard uncertainty / 10-6
Accuracy of the 6000B bridge B 0.05
Linearity of the 6000B bridge B 0.005
Short term drift of the 6000B bridge B 0.1
Thermal emf of the 4220A scanner B 0.0005
Contact resistance error of the 4220A scanner B 0.0025
Leakage resistance error of measurement system B 0.6
Reference standard calibration uncertainty B 3.0
Reference standard drift since last calibration B 0.0495
Reference standard voltage coefficient B 0.05
Standard deviation of measurement results A 3.82
Combined standard uncertainty 4.9
Expanded relative uncertainty (k=2) 9.8
Reported uncertainty 10.0

35
NIM uncertainty budget – 10 MS/N 1100405
Source of Uncertainty Type Relative Standard uncertainty / 10-6
Repeatability A 0.046
Standard resistors B 0.532
Leakage B 0.058
Nonlinearity B 0.005
Bridge calibration B 0.050
Voltage source stability (8 hours) B 0.500
Null detector (noise, drift and offset) B 0.115
Hamon resistors negligible
Temperature coefficient B 0.017
Combined standard uncertainty 0.74
Expanded relative uncertainty (k=2) 1.48
Reported uncertainty 1.5

36
NIM uncertainty budget – 1 GS/N 1100037Binary Voltage Divider Bridge
Source of Uncertainty Type Relative Standard uncertainty / 10-6
Repeatability A 0.37
Standard resistors B 1.44
Leakage B 0.005
Nonlinearity B 2.5
Bridge calibration B 0.5
Voltage source stability (8 hours) B 0.115
Null detector (noise, drift and offset) B 0.017
Temperature coefficient B 1.44
Combined standard uncertainty 3.15
Expanded relative uncertainty (k=2) 6.3
NIM uncertainty budget – 1 GS/N 1100037 Dual Source Bridge
Source of Uncertainty Type Relative Standard uncertainty / 10-6
Repeatability A 0.117
Standard resistors B 1.085
Voltage ratio accuracy B 2.71
Null detector (noise, drift and offset) B 0.115
Temperature coefficient B 0.017
Combined standard uncertainty 2.93
Expanded relative uncertainty (k=2) 5.9
NIM combined uncertainty– 1 GS/N 1100037
Reported uncertainty 4.3
37
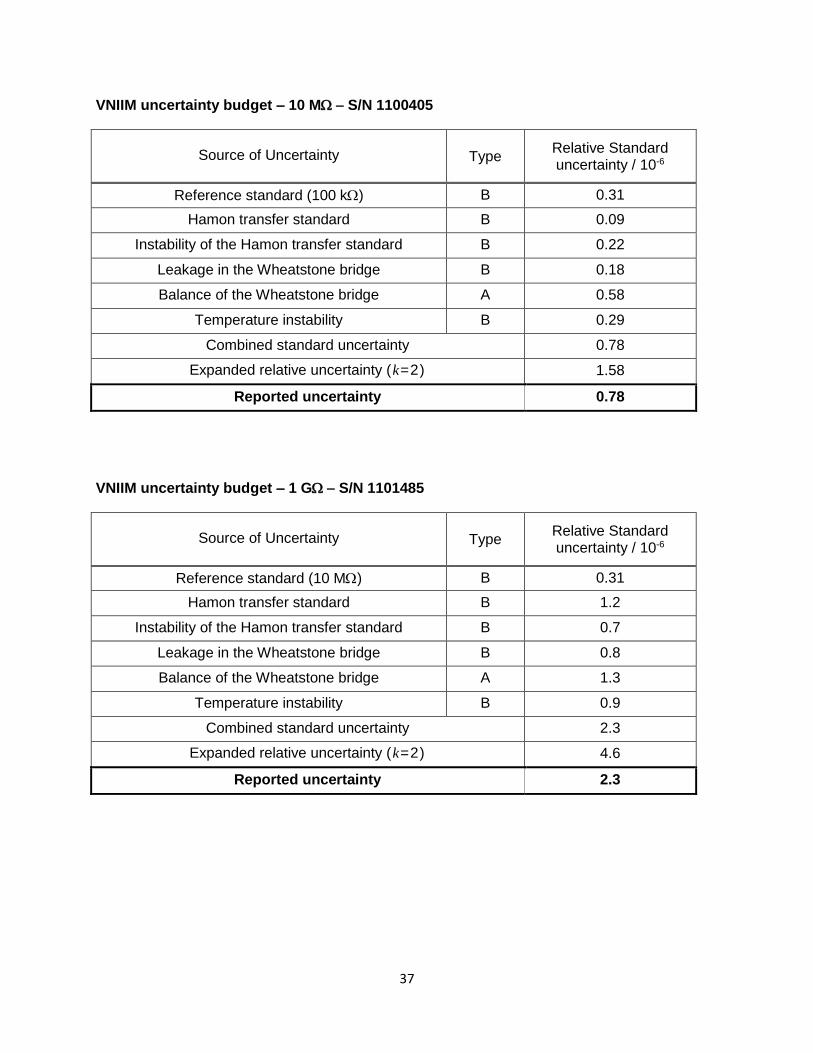
VNIIM uncertainty budget – 10 MS/N 1100405
Source of Uncertainty Type Relative Standard uncertainty / 10-6
Reference standard (100 k) B 0.31
Hamon transfer standard B 0.09
Instability of the Hamon transfer standard B 0.22
Leakage in the Wheatstone bridge B 0.18
Balance of the Wheatstone bridge A 0.58
Temperature instability B 0.29
Combined standard uncertainty 0.78
Expanded relative uncertainty (k=2) 1.58
Reported uncertainty 0.78
VNIIM uncertainty budget – 1 GS/N 1101485
Source of Uncertainty Type Relative Standard uncertainty / 10-6
Reference standard (10 M) B 0.31
Hamon transfer standard B 1.2
Instability of the Hamon transfer standard B 0.7
Leakage in the Wheatstone bridge B 0.8
Balance of the Wheatstone bridge A 1.3
Temperature instability B 0.9
Combined standard uncertainty 2.3
Expanded relative uncertainty (k=2) 4.6
Reported uncertainty 2.3

38
KRISS uncertainty budget – 10 M
Source of Uncertainty Type Relative Standard uncertainty / 10-6
Voltage ratio (linearity, stability) A 0.25
Detector stability B 0.06
Leakage effects B 0.01
Temperature effects B 0.02
1 M reference resistor B 0.05
Repeatability A 0.13
Combined standard uncertainty 0.29
Expanded relative uncertainty (k=2) 0.58
Reported uncertainty 0.29
KRISS uncertainty budget – 1 G
Source of Uncertainty Type Relative Standard uncertainty / 10-6
Voltage ratio (linearity, stability) A 0.25
Detector stability B 0.58
Leakage effects B 0.58
Temperature effects B 0.11
1 G reference resistor B 1.02
Repeatability A 0.8
Combined standard uncertainty 1.56
Expanded relative uncertainty (k=2) 3.1
Reported uncertainty 1.6