Embed Size (px)
Citation preview

FINAL REPORT
ASSESSMENT OF STATUS OF RIVERINE WETLANDS IN THE SANTA ANA AND SAN JACINTO RIVER WATERSHEDS
Prepared by:
Antonia Wijte, Ph.D. Department of Biology and
Institute for Integrated Research in Materials, Environments, and Society (IIRMES) California State University Long Beach – Long Beach, CA 90840
Suzanne P. Wechsler, Ph.D. Department of Geography and
Institute for Integrated Research in Materials, Environments, and Society (IIRMES) California State University Long Beach – Long Beach, CA 90840
Mark G. Adelson
Senior Environmental Scientist Regional Water Quality Control Board - Santa Ana Region 3737 Main Street, Ste. 500
Riverside, CA 92501
Talitha I. Sweaney Environmental Scientist III Regional Water Quality Control Board – Santa Ana Region
3737 Main Street, Ste. 500 Riverside, CA 92501
Submitted for Review November 30, 2006
US EPA Funding No. 05-101-180-0 Santa Ana Regional Water Quality Control Board

Final Report – SWRCB No. 05-101-180-1 2
Table of Contents 1 PROJECT BACKGROUND AND PROBLEM STATEMENT.................................................................4
2 STUDY AREA.........................................................................................................................................4
4 LEVEL 1 LANDSCAPE ASSESSMENT OF WETLANDS.....................................................................5 4.1 METHODOLOGY .................................................................................................................................5 4.2 LANDSCAPE PROFILES.......................................................................................................................6
5 LEVEL 2 ASSESSMENT OF WETLAND CONDITION .........................................................................6 5.1 DATA FRAME.....................................................................................................................................6 5.2 SAMPLING DESIGN.............................................................................................................................6 5.3 GROUND TRUTH OF SAMPLE SITES ....................................................................................................7
6 CRAM FIELD ASSESSMENT .................................................................................................................7 6.1 CRAM PROCEDURE – DATA VALIDATION AND VERIFICATION ...............................................................7 6.2 CRAM METRICS ...............................................................................................................................8
7 SUMMARY ANALYSIS AND INTERPRETATION OF CRAM ASSESSMENT DATA.......................... 8 7.1 ANALYSIS METHODOLOGY..................................................................................................................8 7.2 CRAM RESULTS ...............................................................................................................................8
8 DISCUSSION .........................................................................................................................................9 8.1 INVENTORY ASSESSMENT – DATA GAPS.............................................................................................9 8.2 IMPLEMENTATION ............................................................................................................................10 8.3 TECHNICAL VIABILITY OF CRAM.......................................................................................................10
8.3.1 Usefulness of CRAM assessments ....................................................................................10 8.3.2 Use of CRAM data in guiding decisions regarding BPAs ....................................................11 8.3.3 Additional language protection in the Basin Plan ................................................................11 8.3.4 Discuss recommendations for potential Basin Plan Amendments ......................................12
9 CONCLUSIONS....................................................................................................................................12
10 REFERENCES....................................................................................................................................14
TABLES .......................................................................................................................................15 TABLE 1: USGS 7.5 MINUTE QUADRANGLES IN REGION 8 AND NWI AVAILABILITY .......................................15 TABLE 2: WETLANDS IN REGION 8 BASED ON AVAILABLE NWI DATA ............................................................16 TABLE 3: AVAILABLE NWI WETLAND DISTRIBUTION AND ACREAGE...............................................................17 TABLE 4: TERRAIN PARAMETERS FOR RIVERINE WETLANDS ..........................................................................18 TABLE 5: LANDUSE CATEGORIES FOR RIVERINE WETLANDS ..........................................................................19 TABLE 6: SITES SELECTED FOR CRAM ANALYSIS........................................................................................20 TABLE 7: CRAM METRICS FOR PRELIMINARY SCORES PRIOR TO THE SITE VISIT .............................................21 TABLE 8: CRAM SITE ATTRIBUTES AND METRICS .......................................................................................22 TABLE 9: CRAM DATA STRESSORS – HYDROLOGY .....................................................................................23 TABLE 10: CRAM DATA STRESSORS – PHYSICAL STRUCTURE ....................................................................24 TABLE 11: CRAM DATA STRESSORS – BIOTIC STRUCTURE.........................................................................25 TABLE 12: CRAM DATA STRESSORS – ADJACENT LAND USE ......................................................................26

Final Report – SWRCB No. 05-101-180-1 3
FIGURES .......................................................................................................................................27 FIGURE 1: MAP OF THE SARWQCB REGION 8 ...........................................................................................27 FIGURE 2: HYDROLOGIC UNITS (A) AND ELEVATION RANGES (B) IN REGION 8 ...............................................28 FIGURE 3: STRATIFICATION BY HYDROLOGIC UNIT AND ELEVATION RANGE.....................................................29 FIGURE 4: NWI WETLAND DATA AVAILABILITY.............................................................................................30 FIGURE 5: NWI WETLAND RESOURCES AND INDEX FOR ZOOM AREAS ............................................................31 FIGURE 6: NWI WETLAND DISTRIBUTION IN REGION 8 BASED ON AVAILABLE DATA .......................................32 FIGURE 7: RIVERINE WETLANDS BY HYDROLOGIC UNIT AND ELEVATION RANGE ..............................................33 FIGURE 8: DATA FRAME AND CRAM SAMPLE SITE LOCATIONS......................................................................34 FIGURE 9: SANTA ANA AND SAN JACINTO WETLAND CRAM SCORES ..........................................................35 FIGURE 10: HISTOGRAM OF SANTA ANA/SAN JACINTO WETLAND CRAM SCORES.........................................36 FIGURE 11: PROBABILITY PLOT OF CRAM SCORES WITH 2006 QUALITY LIMITS. ..........................................37 FIGURE 13: DISTRIBUTION OF CRAM SCORES OVER CRAM WETLAND QUALITY RANGES...............................38 FIGURE 12: PROBABILITY PLOT OF CRAM SCORES WITH 2004 QUALITY LIMITS. ..........................................39 FIGURE 14: DISTRIBUTION OF CRAM SCORES OVER CRAM WETLAND QUALITY RANGES...............................40 FIGURE 15: SANTA ANA/SAN JACINTO RIVERINE SITE CRAM SCORES VS. SITE ELEVATION. ...........................41
APPENDIX A: REGIONAL MAPS OF WETLAND RESOURCES AND CRAM LOCATIONS.............42 MAP 1: INDEX MAP OF WETLAND RESOURCES IN THE REGION 8 STUDY AREA ..............................................43 MAP 2: WETLAND RESOURCES IN INDEX AREA NUMBER 1 ...........................................................................44 MAP 3: WETLAND RESOURCES IN INDEX AREA NUMBER 2 ...........................................................................45 MAP 4: WETLAND RESOURCES IN INDEX AREA NUMBER 3 ...........................................................................46 MAP 5: WETLAND RESOURCES IN INDEX AREA NUMBER 4 ...........................................................................47 MAP 6: WETLAND RESOURCES IN INDEX AREA NUMBER 5 ...........................................................................48 MAP 7: WETLAND RESOURCES IN INDEX AREA NUMBER 6 ...........................................................................49 MAP 8: WETLAND RESOURCES IN INDEX AREA NUMBER 7 ...........................................................................50 MAP 9: REGION 8 STUDY AREA AND CRAM SITES ......................................................................................51 TABLE A1: WETLAND RESOURCES BY INDEX AREA IN REGION 8...................................................................52
APPENDIX B: SAMPLE DATA FRAME AND RECONNAISSANCE FOR SITE SELECTION............53
APPENDIX C: CRAM OFFICE ASSESSMENT ....................................................................................75 C1. NAVIGATION TO CRAM SITE ................................................................................................................75 C2. INITIAL OFFICE ASSESSMENT OF CONDITION METRICS AND STRESSORS ................................................75 TABLE C1: CRAM METRICS PRIOR TO THE SITE VISIT...................................................................................76 FIGURE C1: SITE 71, FREEWAY VIEW ..........................................................................................................77 FIGURE C2: SITE 71, STREET VIEW.............................................................................................................78 FIGURE C3: SITE 71, CLOSE-UP VIEW, WITH RULER AND ASSESSMENT AREA. ................................................79 FIGURE C4: SITE 71, STREET VIEW IN MAP FORMAT (THOMAS BROS (1999)) ...............................................80
APPENDIX D: CRAM FIELD DATA ENTRY SHEET............................................................................81
APPENDIX E: COMPILED CRAM DATA IN A USER FRIENDLY FORMAT ......................................93 TABLE E1: STRATA, SITES AND CRAM SCORES ..........................................................................................93 TABLE E2: CRAM ATTRIBUTES FOR DETERMINING CRAM SCORES..............................................................94 TABLE E3: CRAM ATTRIBUTES: BUFFER & HYDROLOGY METRICS ................................................................95 TABLE E4: CRAM ATTRIBUTES: PHYSICAL & BIOLOGICAL STRUCTURE METRICS............................................96

Final Report – SWRCB No. 05-101-180-1 4
1 PROJECT BACKGROUND AND PROBLEM STATEMENT California is one of the four most ecologically degraded states in the United States and contains some of the country’s most endangered ecosystems. More than 90% of California’s wetlands and riparian areas have been lost. A full 25 percent of plants and 55 percent of animals listed as threatened or endangered by the State of California depend on wetland habitats. One of the main documents that define wetland protection and regulation within a region is the Regional Board’s Water Quality Control Plan for the Santa Ana River Basin, or Basin Plan (SARWQCB, 1995). The Basin Plan recognizes the importance of wetlands as part of the aquatic environment, but falls short of providing a comprehensive, up-to-date regulatory strategy for wetlands management. The Basin Plan also recognizes that additional protection for, and more comprehensive listing of, wetlands resources will occur as part of the ongoing Basin Planning process. Updating the Basin Plan’s consideration of wetlands, and developing criteria for wetlands protection, was identified as the No. 6 priority (out of 29 priority issues) in the Regional Board’s 2002 Basin Plan triennial review and work plan for addressing priority basin planning issues. The 2006 Basin Plan triennial review includes this issue as the No. 9 priority, out of 36 priority basin planning issues. This project provides support for future promulgation of Basin Plan Amendments by assessing the status of riverine wetlands. The purpose of this project was to assess the extent and condition of Region 8’s riverine wetland resources by providing (1) a landscape assessment of wetland status within the basin that describes the extent and geographic position and (2) a probability-based survey of wetland condition using the California Rapid Assessment Method (CRAM) on a selected set of riverine wetlands. The project was completed in accordance with the projects’ Quality Assurance Project Plan (QAPP, 2006). 2 STUDY AREA The study area for this project is Region 8 of the California Regional Water Quality Control Board (Figure 1). Region 8 includes the entire watershed of Santa Ana River, coastal watersheds of parts of Orange County, and a small part of the San Gabriel River watershed. Together, the geographic scope of these watersheds encompasses 2800 sq miles of land. In general this region is characterized by a mild semi-arid climate with an average rainfall of 15 inches per year. The region is highly urbanized, with land uses ranging from residential, commercial and industrial, recreational, agriculture, and open space. Region 8 spans three counties: Orange, Riverside and San Bernardino. Approximately 19.2% of the watershed falls in Orange County, 44.5% in Riverside and 36.3% in San Bernardino County. The watershed contains three major hydrologic units: The San Gabriel, Santa Ana and San Jacinto (Figure 2a). The majority of the watershed falls within the Santa Ana (69.5%) and San Jacinto hydrologic (27.4%) units; thus these areas are the focus for this study1. The study area can also be disaggregated into three elevation ranges: 0-350 meters (30.5%), 350-700 meters (35.4%) and greater than 700 meters (34.1%) (Figure 2b). The combination of elevation ranges and hydrologic units characterize variability within the watershed. The Region 8 watershed was therefore stratified based on hydrologic unit and elevation. This stratification resulted in five strata as follows: • Santa Ana 0-350 m (SA 0-250) 30.5% of the watershed area, • Santa Ana 350-700m (SA 350-700) 18.8% of the watershed area, • Santa Ana 700+ m (SA 700+) 23.3% of the watershed area, • San Jacinto 350-700m (SJ 350-700), 16.6% of the watershed area; and • San Jacinto 700+ m (SJ 4700+) 10.8% of the watershed area. There are no elevations in the San Jacinto hydrologic unit that fall below 350 meters, hence this strata was eliminated (Figure 3).

Final Report – SWRCB No. 05-101-180-1 5
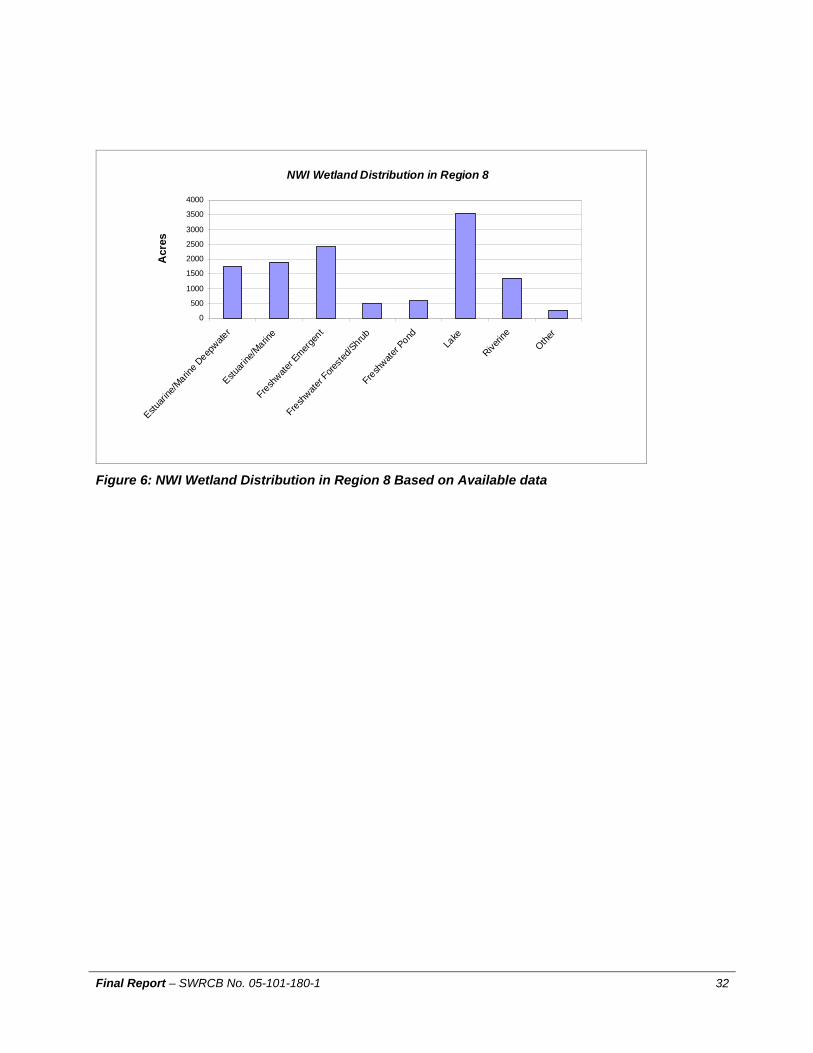
3 PROJECT DESCRIPTION The purpose of this project was to assess the extent and condition of riverine wetlands in the Santa Ana and San Jacinto River watersheds. The selection of riverine wetlands as the scope of this project was determined in consultation with Region 8 personnel, the Southern California Coastal Water Research Project (SCCWRP), and personnel from the United States Environmental Protection Agency (USEPA). The rationale for addressing riverine wetlands is as follows: (a) CRAM has been calibrated for riverine wetlands; (b) CRAM analysis of estuaries/tidal wetlands will be conducted by SCCWRP at a later date; and (c) a sample frame for riverine wetlands already exists. The measurement of wetland extent and condition was conducted using a Level 1 and Level 2 tiered assessment of wetlands in a manner consistent with the US EPA Region 9‘s tiered assessment of wetlands (USEPA 2006). This method defines three tiers of assessment. A Level 1 assessment is based on a “landscape assessment” that includes resource inventories and landscape profiles. A Level 2 assessment is defined as a “rapid assessment” which focuses on ambient condition and initial diagnosis of project status relative to ambient condition. A Level 3 assessment is an intensive site assessment that uses quantitative methods such as Index of Biotic Integrity (IBIs) or Hydrogeomorphic (HGM) indicators to assess site condition and calibrate the Level 2 assessment. A level 3 assessment is beyond the scope of this project. In this project, we conducted LeveI 1 (landscape assessment) and Level 2 (rapid assessment) assessments of riverine wetlands within the Santa Ana and San Jacinto River hydrologic units of Region 8. This project represents a collaboration coordinated between Region 8, the Southern California Coastal Water Research Project (SCCWRP) and faculty and students from California State University Long Beach. 4 LEVEL 1 LANDSCAPE ASSESSMENT OF WETLANDS Measurement of wetland extent and condition was conducted in a manner that is consistent with the US EPA Region 9's tiered assessment of wetlands (USEPA, 2006) within the constraints of available National Wetland Inventory (NWI) wetland maps and additional data sources to be consulted as part of the landscape assessment. The landscape assessment was conducted in accordance with limitations identified in the QAPP. 4.1 Methodology The landscape assessment used existing US Fish and Wildlife Service National Wetland Inventory (NWI) wetlands data in the study area to develop landscape profiles that describe the extent and geographic distribution of riverine wetlands within the region. The study area contains 70 USGS 1:24,000 7.5 minute (1:24,000 scale) quadrangles. Digital maps of NWI wetland data currently exist for 28 of these quadrangles, or 40% of the area (Table 1; Figure 4). Wetland data for these available quadrangles were obtained from the US Fish and Wildlife Service’s Wetland Mapper download site (USFWS, 2006). The lack of NWI coverage for 60% of the Region 8 study area constitutes a substantial data gap for the Level 1 landscape assessment. Available digital NWI wetland data for the 28 quadrangles was downloaded and merged in a GIS. Landscape profiles were developed to describe and summarize the distribution of wetlands across Region 8. Tables 2 and 3 and Figures 5 and 6 identify the types and extent of wetland coverage in the region. Riverine wetlands constitute 11% of the wetlands in the data available for the study area. Appendix A contains detailed maps of the Region’s wetland resources.

Final Report – SWRCB No. 05-101-180-1 6
4.2 Landscape Profiles Landscape profiles describe the pattern of the diversity of wetlands in the region and can be used to characterize the wetland resources. Landscape profiles and the wetland inventory data sets can establish a baseline from which future assessments of net change in acreage can be assessed. The applicability of these profiles is limited by the availability of NWI data upon which they are based. For the purposes of this analysis landscape profiles were constructed from the available NWI wetlands data. Riverine wetlands were selected from the dataset and evaluated using various geomorphic parameters (Figure 7 and Tables 4 and 5). The majority of riverine wetlands represented in the dataset (57%) fall in the San Jacinto 350-700 strata (Figure 6). Landuse data from the Southern California Association of Governments (SCAG) was obtained to evaluate the types of classified land uses upon which riverine wetlands occur (Table 5). As expected the majority of riverine wetlands occur on vacant parcels. 5 LEVEL 2 ASSESSMENT OF WETLAND CONDITION
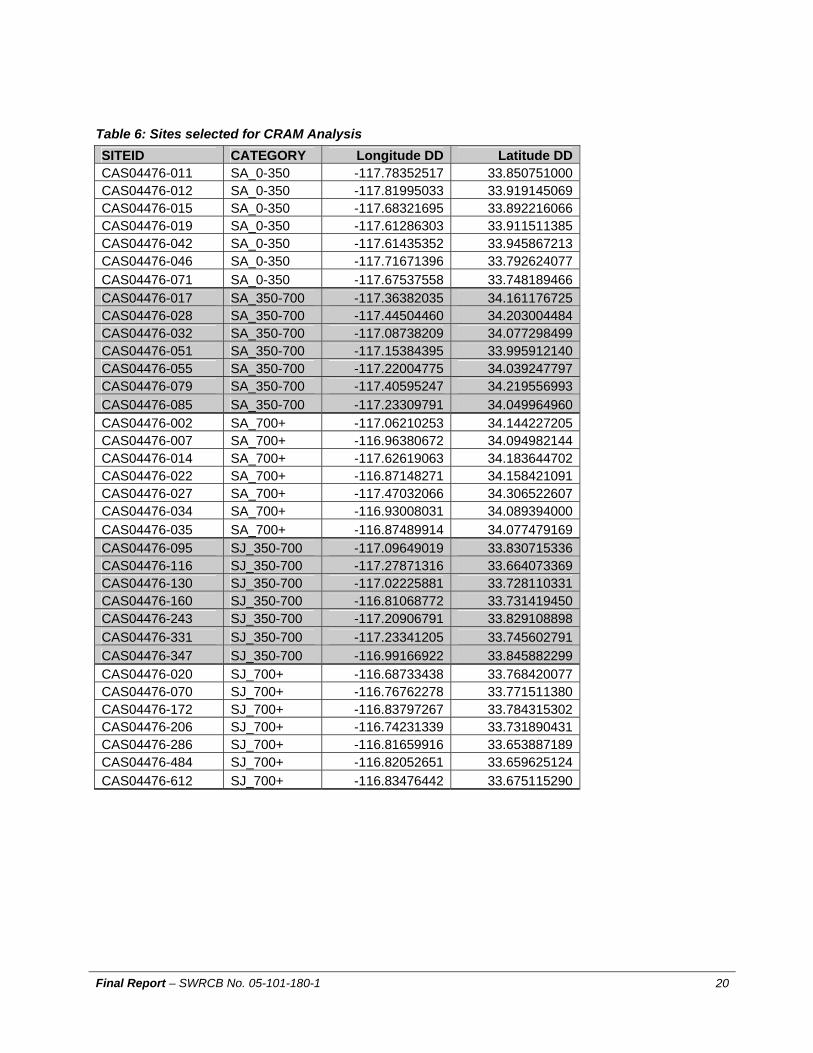
NWI datasets are currently not up to date, represent only 40% of the region, and therefore cannot reflect the current status of wetlands within the region. A Level 2 probability-based survey of the condition of wetlands was therefore required. This survey applied the field-based California Rapid Assessment Method (CRAM) (Collins et al., 2006) to a selected set of riverine wetlands. The objective of the data collection was to provide comparable rapid assessments of wetland condition at thirty five (35) different locations across the Santa Ana River Basin of Southern California. 5.1 Data Frame A probabilistic sample of 750 stream sites was previously generated for the SARWQCB Region 8 by US EPA Environmental Monitoring and Assessment Program (EMAP; Anthony Olsen, USEPA, Western Ecology Division, Corvallis, OR) for ambient water quality assessment in the Region’s streams and rivers. The target population for this sample set consists of all streams within the Santa Ana Regional Water Board regional area, as represented by the National Hydrography Dataset (HND), and thus is consistent with the targeted sample population in this study. A Generalized Random Tessellation Stratified (GRTS) survey design for a linear stream resource was used. The GRTS design includes reverse hierarchical ordering of the selected sites (Olsen, 2004). The GRTS survey design was deemed the most appropriate for probability-based assessments of linear systems such as streams and rivers by EPA/EMAP statistical staff. The data frame provides statistically sampled stream site locations that are correlated with and can serve as surrogate information for riverine wetland locations, the focus of this study. The 750 sites contained in this sample frame are depicted in Figure 8. 5.2 Sampling Design Thirty five (35) riverine wetland sites were selected for CRAM assessment. Seven (7) sites were visited within each of the five (5) strata. According to the QAPP, thirty (30) sites were originally designated for CRAM field assessment; thus an additional 5 sites above the original project scope were included in this analysis. The rationale for evaluating a minimum of 30 sites was based on a statistical power analysis of the sample size required to determine if the sample population exceeds a certain threshold (i.e. CRAM score of 70) with a 10% confidence level. The 35 sites selected for CRAM assessment were selected from the 750 sites contained in the data frame. Limited funding available to conduct CRAM investigations served to restrict sample size. The base EMAP sample frame for the Region 8 study area contains 750 sequentially ordered sites in the five strata (please refer to Figure 3). These strata are based on hydrologic unit and elevation (please refer to section 2: Study Area). Sampling occurred within each of these strata to ensure that CRAM analyses were conducted in areas representative of the region. A total of seven (7) sites per strata were sampled.

Final Report – SWRCB No. 05-101-180-1 7
The probabilistic sampling design assigned each site with a numerical site ID. The statistical integrity of the sample required that sites be sampled in numerical order, from lowest to highest, based on this designated site ID. The seven (7) sites per strata were selected sequentially, with all efforts made to sample the low numbered sites. If it was necessary to replace a site (due to non viability of a site), sampling at the next sequential site was attempted until seven (7) sites were sampled within each stratum. Please see Appendix B for details on the data fame. 5.3 Ground Truth of Sample Sites Prior to the field CRAM analyses a detailed site reconnaissance of the EMAP-generated sites was required to determine site viability for CRAM analyses. Site viability was assessed by an in depth field reconnaissance effort undertaken by the CSULB Geography Department’s Geography 481 (GIS for Natural Sciences) course. Students used handheld Garmin Global Positioning Systems (GPS) units to locate each field site based on their designated latitude and longitude. Site viability was assessed by determining if access to the site is allowed and if site could be safely assessed. The reconnaissance effort attempted to visit sites in numerical order based on their site ID in accordance with the EMAP probabilistic sampling design. Details on the sample frame and comments from the ground truth reconnaissance can be found in Appendix B. The field inventory included CRAM analyses of 30 sites selected from the 750 sample frame (Table 6). 6 CRAM FIELD ASSESSMENT General condition of the wetland habitat was assessed using the California Rapid Assessment Method (Collins et al., 2006, CRAM, Version 4.1). This section provides results of the CRAM assessments and an evaluation of riverine wetland condition based on the CRAM assessments, fieldwork, and their analysis. 6.1 CRAM Procedure – Data Validation and Verification The implementation of CRAM sampling activities followed the CRAM SOP Version 4.1 (Collins et al. 2006) and the implementation plan outlined in the QAPP (Wijte, Wechsler and Adelson, 2006). Site reconnaissance occurred prior to the field CRAM assessment to ensure that the site visited was viable for CRAM assessment. Once sites were selected based on the results of student field reconnaissance efforts, a CRAM office assessment was performed. This consisted of collecting background documentation on the site (such as DOQQs, existing digital geospatial data using Google Earth technology, and other resources such as Thomas Guides and USGS quadrangles). Please see Appendix C for examples of this material. This information was used to develop an initial assessment of the CRAM assessment area, metrics and stressors. Using this information, the characteristics listed in Table 7 were examined for each site prior to the site visits. In most instances two-person field crews conducted the field sampling. Teams included a designated field crew “captain” and a field technician. Field crews then drove to each site using the sites’ designated GPS coordinates. Once a site was located, field crews verified the assessment area and conducted the CRAM assessment. Field crews completed hard copy field data sheets for CRAM assessment (please see Appendix D for a sample data sheet). All field data sheets were labeled with the unique site ID code and dated. Prior to departing the site the in-field site supervisor of the fieldwork verified that all datasheets were accounted for and complete. Site CRAM data sheets were then entered into an excel spreadsheet developed for use in this project1 and provided in Appendix E.
1 The data entry methodology differed from that outlined in the QAPP. The QAPP indicated that an access database would be made available by SCCWRP for entry of field CRAM data sheets. This database was not available at the time field surveys were undertaken.
Final Report – SWRCB No. 05-101-180-1 8
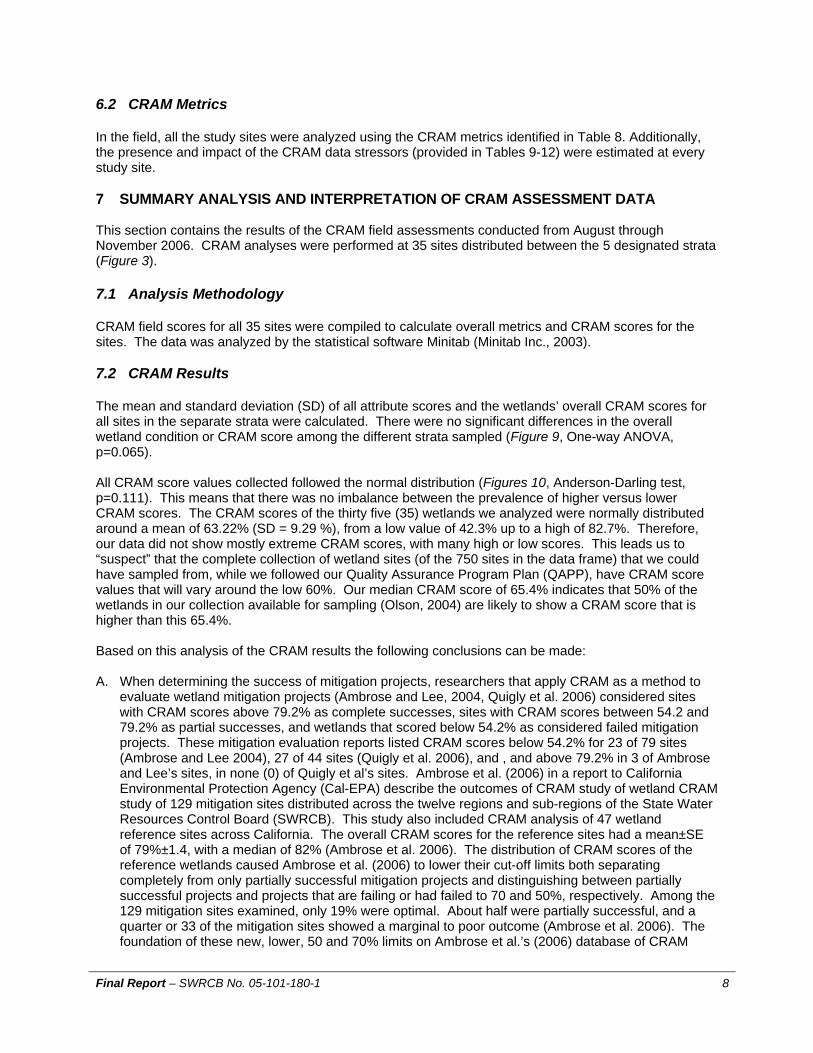
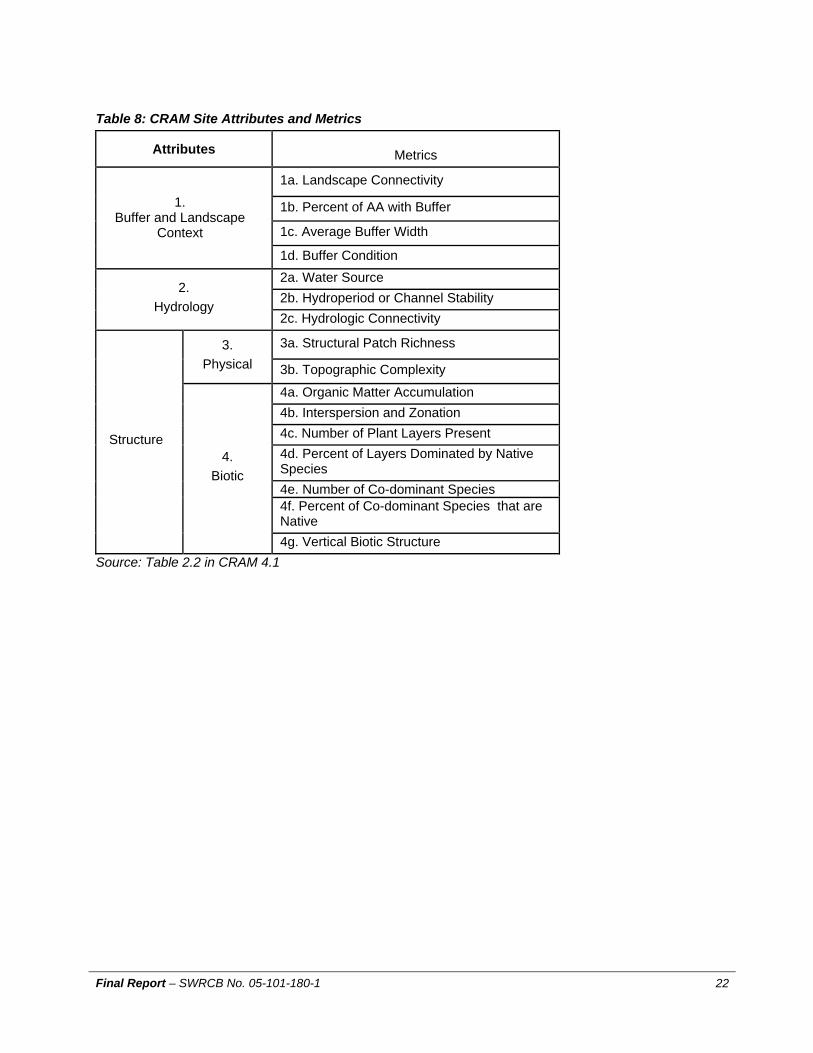
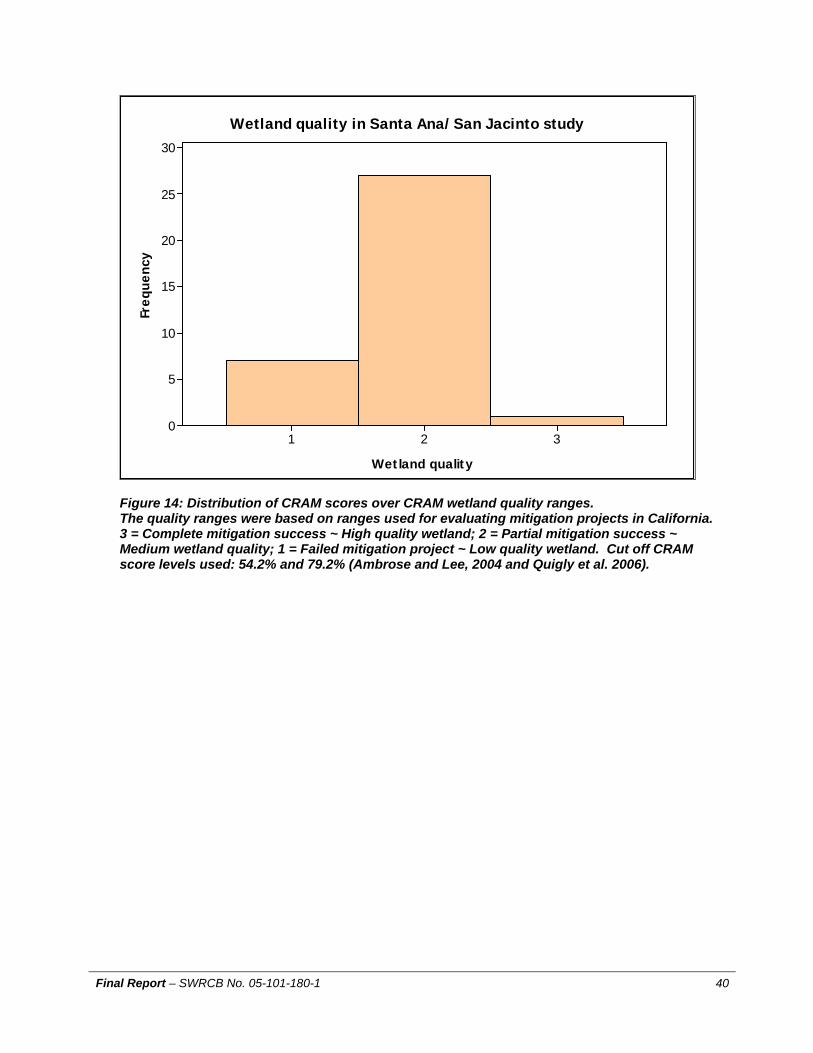
6.2 CRAM Metrics In the field, all the study sites were analyzed using the CRAM metrics identified in Table 8. Additionally, the presence and impact of the CRAM data stressors (provided in Tables 9-12) were estimated at every study site. 7 SUMMARY ANALYSIS AND INTERPRETATION OF CRAM ASSESSMENT DATA This section contains the results of the CRAM field assessments conducted from August through November 2006. CRAM analyses were performed at 35 sites distributed between the 5 designated strata (Figure 3). 7.1 Analysis Methodology CRAM field scores for all 35 sites were compiled to calculate overall metrics and CRAM scores for the sites. The data was analyzed by the statistical software Minitab (Minitab Inc., 2003). 7.2 CRAM Results The mean and standard deviation (SD) of all attribute scores and the wetlands’ overall CRAM scores for all sites in the separate strata were calculated. There were no significant differences in the overall wetland condition or CRAM score among the different strata sampled (Figure 9, One-way ANOVA, p=0.065). All CRAM score values collected followed the normal distribution (Figures 10, Anderson-Darling test, p=0.111). This means that there was no imbalance between the prevalence of higher versus lower CRAM scores. The CRAM scores of the thirty five (35) wetlands we analyzed were normally distributed around a mean of 63.22% (SD = 9.29 %), from a low value of 42.3% up to a high of 82.7%. Therefore, our data did not show mostly extreme CRAM scores, with many high or low scores. This leads us to “suspect” that the complete collection of wetland sites (of the 750 sites in the data frame) that we could have sampled from, while we followed our Quality Assurance Program Plan (QAPP), have CRAM score values that will vary around the low 60%. Our median CRAM score of 65.4% indicates that 50% of the wetlands in our collection available for sampling (Olson, 2004) are likely to show a CRAM score that is higher than this 65.4%. Based on this analysis of the CRAM results the following conclusions can be made: A. When determining the success of mitigation projects, researchers that apply CRAM as a method to
evaluate wetland mitigation projects (Ambrose and Lee, 2004, Quigly et al. 2006) considered sites with CRAM scores above 79.2% as complete successes, sites with CRAM scores between 54.2 and 79.2% as partial successes, and wetlands that scored below 54.2% as considered failed mitigation projects. These mitigation evaluation reports listed CRAM scores below 54.2% for 23 of 79 sites (Ambrose and Lee 2004), 27 of 44 sites (Quigly et al. 2006), and , and above 79.2% in 3 of Ambrose and Lee’s sites, in none (0) of Quigly et al’s sites. Ambrose et al. (2006) in a report to California Environmental Protection Agency (Cal-EPA) describe the outcomes of CRAM study of wetland CRAM study of 129 mitigation sites distributed across the twelve regions and sub-regions of the State Water Resources Control Board (SWRCB). This study also included CRAM analysis of 47 wetland reference sites across California. The overall CRAM scores for the reference sites had a mean±SE of 79%±1.4, with a median of 82% (Ambrose et al. 2006). The distribution of CRAM scores of the reference wetlands caused Ambrose et al. (2006) to lower their cut-off limits both separating completely from only partially successful mitigation projects and distinguishing between partially successful projects and projects that are failing or had failed to 70 and 50%, respectively. Among the 129 mitigation sites examined, only 19% were optimal. About half were partially successful, and a quarter or 33 of the mitigation sites showed a marginal to poor outcome (Ambrose et al. 2006). The foundation of these new, lower, 50 and 70% limits on Ambrose et al.’s (2006) database of CRAM

Final Report – SWRCB No. 05-101-180-1 9
scores for California non-mitigation related, reference wetlands may increase the chance of these lower values to be accepted as CA standards in the near future. In order to ease comparison with CRAM datasets from other regions, in this current report we provide our Santa Ana/San Jacinto CRAM results relative to both sets of previously reported mitigation success markers; the earlier 54.2 and 79.2% markers (Ambrose and Lee, 2004, Quigly et al. 2006) and these newer 50 and 70% markers (Ambrose et al. 2006). In our collection of our randomly selected sites (Olsen 2004), twenty percent (6 sites) of 35 sites had a CRAM score over 70% and only ten percent (3 sites) scored below 50% (Figures 11 and 12), while only 2.5% (1 site) scored above 79.2%, but twenty percent (7 sites) of the 35 sites had CRAM scores below 54.2% (Figures 13 and 14).
B. If our Santa Ana/San Jacinto sites’ condition would have been the result of mitigation efforts the
remaining 26 (based on the Ambrose et al. 2006 markers) or 27 (based on earlier markers) sites would have been considered partial mitigation successes.
C. The literature currently provides the three examples of reports on riverine environmental resource
related projects that have used CRAM analysis to evaluate wetland condition following mitigation (Ambrose and Lee 2004, Quigly et al. 2006, Ambrose et al. 2006). These are the only three project reports currently available. This project is therefore among the first to have used the CRAM method to evaluate riverine wetlands. We did not focus on so away from post-mitigation wetland sites, and our study, though smaller in sample size, will be comparable to that of Ambrose et al. (2006).
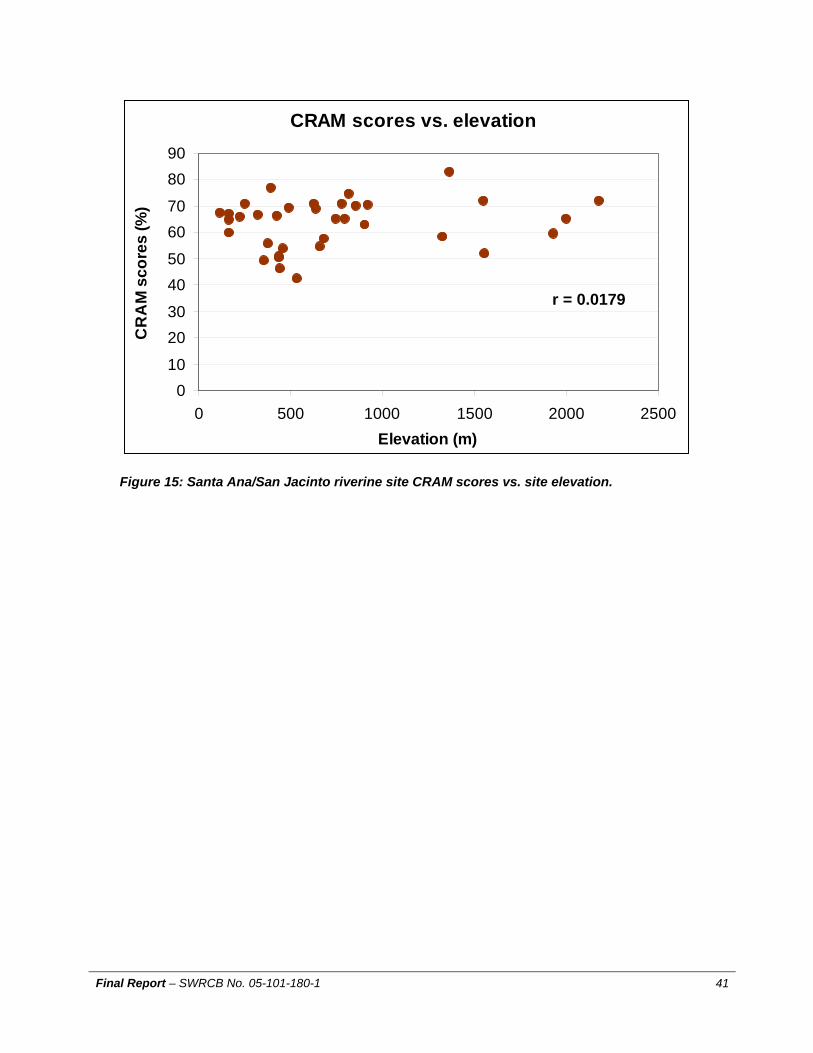
D. There was no relationship between the site elevation and its CRAM score in this Santa Ana/San
Jacinto study (Figures 15, Correlation test, r =0.0179; p=0.22). Thus, it was obvious that wetland site elevation cannot be useful in identifying wetland sites that may be in need of restoration, and that full CRAM analysis should be used for this purpose.
8 DISCUSSION The subsections in this portion of the report are derived from Task 4 of the project deliverables. This specific task requested a “Discussion Paper” which includes the elements contained herein. 8.1 Inventory Assessment – Data Gaps The Level 1 landscape assessment of wetland resources within the region was conducted using available NWI data. This descriptive assessment was performed on only 40% of the region which is currently covered by the NWI. USGS quadrangle maps of the region that have not yet been included in the NWI coverage, shown in Table 1 and Figure 4, were reviewed by Regional Board staff familiar with the region’s geography. This review shows that major portions of valley and mountain reaches of the Santa Ana River and its principle tributaries are under-represented in the NWI coverage. Portions of these stream reaches are known to support significant riverine wetland resources, including some that are, or closely approximate, pristine conditions. Because the NWI under-represents the regions’ riverine wetlands, the Level 1 Landscape Assessment similarly under-represents these wetlands. Consequently, while the landscape assessment can be relied upon to report on the condition of wetlands within the available quadrangles, the assessment does not adequately represent riverine wetlands throughout the region. As NWI data becomes available for the data gaps identified in Table 1 and Figure 4, a subsequent NWI-based Level 1 landscape assessment will improve our understanding of the Regions’ wetland resources. The landscape assessment provided in Section 4 and Appendix A provides a descriptive summary of the current status of wetlands in the Region based on existing NWI data. Sample site locations for the Level 2 CRAM Assessment of riverine wetland condition was based on a probabilistic sample design, per USEPA and utilized per the approved QAPP. The data frame from which the sample site locations were derived was based on a USEPA EMAP data frame that was statistically derived from data as represented in the National Hydrography Dataset (NHD) river reach files. Sample points in the data frame were expected to correspond geographically to stream water bodies within the region and therefore serve as a surrogate for riverine wetlands. Therefore CRAM site locations selected

Final Report – SWRCB No. 05-101-180-1 10
for analysis in this project should correspond to riverine wetlands within the region. The QAPP provided for an assessment of thirty (30) sites, six (6) within each of the five strata. Ultimately CRAM analyses were performed on thirty five (35) sites within the region, seven (7) within each stratum. The sample size of 30 sites intrinsically recognizes that there are gaps in the data, but that the gaps in the data should be statistically insignificant. Therefore CRAM results for these thirty five (35) sites provide a statistical representation of the status of riverine wetlands within the region. The sample frame for the Level 2 rapid assessment was not based on NWI data and did not take into account the locations of existing riverine wetlands within the region. The statistical power of subsequent CRAM studies in the region could perhaps be improved by revising the EPA’s EMAP probabilistic sample design to include NWI information in the sample data frame. 8.2 Implementation The sites evaluated under this contract serve as a baseline assessment of the riverine wetlands in Region 8. Santa Ana Regional Water Quality Control Board (Region 8) personnel will crosscheck the landscape assessment and CRAM assessment work completed under this contract with the Region’s wetland inventory work that is expected in the near future. As part of each triennial Basin Plan review, Region 8 personnel will continue to perform CRAM assessments. These will include assessments of some of the sites included under this contract as well as others in the region that have not yet been evaluated. These periodic assessments will provide a continuing evaluation of the Regions’ riverine wetland resources. 8.3 Technical viability of CRAM This section of the report discusses the technical viability of the use of the California Rapid Assessment Method (CRAM) with respect to the Region’s Basin Plan Amendment efforts. CRAM was applied as a tool to gain an understanding of the quality and quantity of riverine wetland resources in the region. CRAM provides a quick, low-cost, peer-reviewed, reliable, simple, repeatable, and easily taught method of assessing wetland quality. The outcome we were expecting was an improved understanding of how much of the resource exists and the condition of that resource. Because CRAM is an easily used assessment tool, it has high potential value for ongoing monitoring of the condition of wetlands. Regular monitoring of selected sites for compliance with water quality standards establishes benchmarks for trend analyses and provides an important check on the effectiveness of Basin Plan implementation. This assessment demonstrates that CRAM can be used as a regular monitoring tool in a program to determine the effectiveness of Basin Plan amendments that implement policies intended to protect wetlands resources.
This assessment has shown that CRAM is well suited for characterizing both the condition of a wetland and the factors that affect the condition of the wetland in its immediate drainage-shed, and for comparing wetlands within a hydrologic region, such as Region 8. The CRAM approach provides data that appears sufficiently robust to support complex spatial analysis of wetland resources, while also being useful for simple comparisons between wetlands. 8.3.1 Usefulness of CRAM assessments
This project provides baseline CRAM assessments of the sites sampled per USEPA guidance. CRAM is a reliable, quick, and simple assessment tool. It therefore can and should be used for future monitoring of riverine sample sites for trend monitoring purposes. The application of CRAM in this assessment shows that CRAM can be a useful tool as part of a regional monitoring program to determine the overall condition and ecological stability of a hydrologic area’s riverine wetlands resources. However, since the concept of wetland size does not apply to riverine wetlands, due to their linear and bifurcated forms (see CRAM Version 4.0, Section 3.3), data collected through the use of CRAM may not be directly useful to assess gain or loss of riverine wetlands resource acreage.

Final Report – SWRCB No. 05-101-180-1 11
8.3.2 Use of CRAM data in guiding decisions regarding BPAs CRAM can provide information to Regional Board staff and others needed as part of decision making processes to determine where and whether to place restrictions, prohibitions, mitigation guidelines, restoration goals, or other regulatory controls needed in water quality control plans to protect wetland resources. This same information may provide insights that lead to creation of alternate quasi-regulatory, cooperative and/or voluntary approaches for protection of wetland resources, such as establishment of conservancies, mitigation banks, restricted land uses, general plan amendments, etc. Should this occur, Basin Plans may be amended to recognize that stakeholders have identified a variety of management practices that can be used to compliment the Board’s regulatory authority to protect wetland resources. This assessment has also shown that CRAM has proven to be a valuable tool for conducting numerous assessments of wetland resources in an area for the purpose of creating large scale wetland resource management plans, should there be the impetus to do so. The USACE’s San Diego Creek, Orange County, Special Area Management Plan is an example of a plan that relies on data that assesses quality of wetlands in a hydrologic area to lead to management decisions. This plan identifies high-value aquatic resources within the San Diego Creek watershed that are designated for enhancement, restoration and long-term protection as the watershed develops. These aquatic resources include riverine wetlands. The SAMP also recognizes that certain aquatic resources without high potential for enhancement, restoration or protection may be substantially modified as development occurs. The wetlands inventory is vital to inform the Basin Planning process to support wetlands protection initiatives. Without detailed knowledge of the quantity, quality and condition of the region’s wetlands, it is not possible to make informed decisions about how those resources should be protected. The CRAM assessment performed under this contract has helped to determine locations of high value riverine wetland resources. This identification could lead to regulatory protections should they be subject to urban encroachment. In the Basin Plan, the “tributary rule” refers only to water quality objectives rather than to the entire water quality standard. The implication is that if there are waters tributary to a wetland that the same standards that apply to the wetland can and should apply to the tributary waters. Subsequent Basin Plan amendments could make it very clear that the tributary rule applies to waters tributary to wetlands in the same manner the objectives of a river apply to its tributary streams. In the 2006 Basin Plan triennial review, Regional Board staff has identified as priority No. 22 the need to revise Basin Plan beneficial use tables to incorporate the tributary rule. This revision could easily be expanded to also clearly apply the tributary rule to wetlands and their tributary watersheds, and to wetlands that are tributary to waters with established water quality standards. . By having a detailed wetlands condition inventory, the Board will be better able to establish meaningful water quality standards (using narrative objectives) for wetlands throughout the region. 8.3.3 Additional language protection in the Basin Plan
One of the tasks outlined as a deliverable for this project included an exploration of additional language protection in Basin Plan with, at least the following programs in mind – a water quality standards program, 401 program, ambient monitoring program, and the 305(b)/303(d) programs. In the 2006 Basin Plan triennial review, priority issue No. 9 (out of 36 priorities) was to develop criteria for wetlands mitigation, to revise the Plan’s narrative to expand the plan’s definition of wetlands, and to describe the Clean Water Act (CWA) Section 401 water quality standards certification process. Region 8 Staff propose to develop regional criteria for determining appropriate mitigation when wetlands and other Waters of the State are impacted by various construction activities, primarily those involving dredging and filling. Dredging and filling activities are subject to: • Permits issued by the U.S. Army Corps of Engineers, pursuant to CWA Section 404; and, • Water quality standards certifications issued by the SWRCB or Regional Board pursuant to CWA
Section 401.

Final Report – SWRCB No. 05-101-180-1 12
In some cases, waste discharge requirements are adopted by the Board for dredge and fill projects. These regulatory actions implement federal and state requirements for “no net loss of wetlands” as a result of land use practices, and state and federal policies encouraging the expansion of existing wetlands and creation of new ones. Successful mitigation of the loss of wetlands and other Waters of the State depends on a number of factors, including consideration of the condition of the area impacted, and the location of the proposed mitigation (within or outside of the impacted watershed), among others. To develop information needed to further investigate this issue, a comprehensive inventory and assessment of the quality of all wetland resources in Region is needed. This assessment is providing information needed to understand the condition of riverine wetlands in the region, subject to the limitations imposed by the data gaps identified in this report. Additional work will be needed to more fully populate an inventory of all regional wetland resources and assess the condition of these resources. This project demonstrates that CRAM can be effective to assess riverine wetland condition, at a landscape scale. In Region 8, CRAM should be utilized for all subsequent wetlands assessments. The use of a consistent assessment methodology over time will help to assure that the riverine wetland condition assessments conducted in 2006 can be confidently compared with future wetlands assessments. This is an important consideration if wetland condition assessment data is to be used for monitoring trends in changes in wetland condition. 8.3.4 Discuss recommendations for potential Basin Plan Amendments Regional Board staff recommend updating the Basin Plan table 3.1 (which lists beneficial uses) and table 4.1 (which lists numeric water quality objectives) to reflect the partially updated inventory of wetlands in the region provided by this project. This is already captured in the 2006 Basin Plan triennial review. Regional Board staff recommends that the assessment results from this project be utilized by staff to provide information to decision makers to help them understand why change is needed in the manner in which the region’s wetlands resources are managed. This should lead to a process to amend the Basin Plan to comprehensively catalogue the region’s wetland resources, and establish water quality standards for them. These water quality standards could then be utilized in setting effluent limitations for NPDES permits. Wetlands Basin Plan amendments could also be used in a process to identify appropriate mitigation for proposed impacts to wetland resources. This mitigation can then be incorporated into CWA Section 401 water quality standards certifications for projects proposing to dredge, or discharge dredged material into, or to discharge fill into waters of the United States and waters of the state. Wetlands mitigation specifications derived from the Basin Plan wetlands amendments could also be incorporated into waste discharge requirements, as appropriate. These amendments could also support development of regional policy initiatives directed toward minimizing impacts to existing wetland resources. These amendments might also spawn policies that result in restoration or enhancement of previously degraded wetlands that have the potential to achieve the ecological functionality and value associated with healthy wetlands. Creating a regulatory incentive for restoring degraded wetland resources is another idea that we would like to explore further once all scientific information is digested. 9 CONCLUSIONS NWI landscape assessments and CRAM condition assessments conducted through this project will be used as a basis for representative characterization of the condition of riverine wetlands in the Santa Ana Region. Future Basin Plan amendments that broaden the Plan’s recognition of the wetland resources of the SAR and SJR Watersheds will include an inventory and discussion of the condition of these wetlands, using the most current data available, including that from this project. This information, along with wetland protection policy in place throughout the state and data concerning other wetland types present in the region, will help to form the background and regional context for possible wetlands Basin Plan

Final Report – SWRCB No. 05-101-180-1 13
amendments. These amendments will be crafted with language to improve the Regional Board’s ability to protect the water quality standards of wetlands within the region, and may include measures focused on preserving, restoring and enhancing wetlands in the region. Since all Basin Plan amendments are subject to review by stakeholders and approving authorities, the data used for them needs to be developed with an appropriately high level of quality control, such that the a data can withstand rigorous scrutiny. It is expected that upon future work and promulgation of Basin Plan Amendments, that the results obtained from this project will prove useful during the public process. It is anticipated that the Technical Advisory Committee will use this information for commenting on and/or approving the future draft Basin Plan Amendments. In addition to narrative Basin Plan amendments, examples for future wetlands protection amendments might include establishment of a wetland beneficial use (WETL), and assignment of this use to appropriate waters of the region. CRAM data from this project will likely be used to inform the process of developing a definition for this use. The NWI-based landscape assessment data sets will likely be used for determining waters that WETL will be assigned to. CRAM condition assessments conducted through this project may be appended to the Basin Plan. Other suggestions for how the data could be used for Basin Plan amendments are likely to come from the project’s proposed Technical Advisory Committee (TAC). The quality and quantity of wetlands data available to the TAC will be a limiting factor in what guidance the TAC can provide. While the project is expected to provide high quality data assessing the condition of representative riverine wetlands that the TAC can consider, the TAC will not have similar contemporaneous assessment condition data for some of the other wetland types known to be present in the region, such as lacustrine and depressional wetlands. Region 8 plans to use the information resulting from this assessment to support promulgation of wetland Basin Plan Amendments (BPAs). This project will support future promulgation of Basin Plan wetlands amendments that will create an up-to-date regulatory framework for more effective protection of water quality standards of wetlands within the Santa Ana Region. Once adopted, application of these amendments should lead to reduced loss of wetlands and ecologically effective compensatory mitigation for unavoidable impacts to wetlands resources.

Final Report – SWRCB No. 05-101-180-1 14
10 REFERENCES Ambrose, R.F. and Lee, S.F. (2004). An evaluation of compensatory evaluation projects permitted under
Clean Water Act, section 401 by the Los Angeles Regional Quality Control Board, 1991-2002. California Environmental Protection Agency, Los Angeles, CA.
Collins, J.N., Stein, E.S., Sutula, M., Clarck, R., Fetscher, A.E., Grenier, L., Grosso, G, and Wiskind, A.
(2006). California Rapid Assessment Method (CRAM) for wetlands and riparian areas, v. 4.2.0 – User manual and scoring forms.
Quigly, M, Ranke, K and Miller, D. (2006). Evaluation of federal Clean Water Act, section 401 water
quality certification wetland and stream mitigation sites in the Santa Margarita watershed. California Regional Water Quality Control Board, Sand Diego region, San Diego, CA.
Minitab Inc., (2003), Minitab Release 14 for Windows. Olsen, 2004, California Santa Ana Region Survey Design, US EPA USEPA, Western Ecology Division,
Corvallis, OR. US Fish and Wildlife Service, National Wetlands Inventory, 2006,
http://wetlandswms.er.usgs.gov/imf/imf.jsp?site=extract_tool&stateDD=CA&areaDD=Lower%2048%20USGS%20100K%20Quads&resultsDD=BIG%20BEAR%20LAKE&doExtract=true, last accessed 10/26/06.
Wijte, A., Wechsler, S., Adelson, M. (2006). Quality Assurance Project Plan (QAPP), Assessment of
Status of Riverine Wetlands in the Santa Ana and San Jacinto River Watersheds, Approved July 2006.

Final Report – SWRCB No. 05-101-180-1 15
TABLES Table 1: USGS 7.5 Minute Quadrangles IN Region 8 and NWI Availability Quadrangle Name NWI* Quadrangle Name NWI* ALBERHILL MOUNT SAN ANTONIO ANAHEIM Y MT BALDY ANZA Y MURRIETA BEAUMONT Y NEWPORT BEACH Y BIG BEAR CITY Y ONTARIO Y BIG BEAR LAKE ONYX PEAK Y BLACK STAR CANYON ORANGE BLACKBURN CANYON Y PALM VIEW PEAK Y BUTLER PEAK PERRIS BUTTERFLY PEAK Y PHELAN CABAZON PRADO DAM Y CAHUILLA MOUNTAIN Y REDLANDS CAJON Y RIVERSIDE EAST CORONA NORTH Y RIVERSIDE WEST CORONA SOUTH ROMOLAND CUCAMONGA PEAK SAGE DEVORE SAN BERNARDINO NORTH EL CASCO SAN BERNARDINO SOUTH EL TORO SAN DIMAS ELSINORE SAN GORGONIO MTN FAWNSKIN Y SAN JACINTO Y FONTANA Y SAN JACINTO PEAK Y FOREST FALLS SAN JUAN CAPISTRANO GUASTI Y SANTIAGO PEAK HARRISON MTN SEAL BEACH Y HEMET Y SILVERWOOD LAKE IDYLLWILD Y STEELE PEAK KELLER PEAK SUNNYMEAD LA HABRA TELEGRAPH PEAK LAGUNA BEACH Y TUSTIN Y LAKE FULMOR Y WHITTIER LAKE MATHEWS WILDOMAR Y LAKEVIEW Y WINCHESTER LOS ALAMITOS Y YORBA LINDA MOONRIDGE YUCAIPA * A Y in the NWI column indicates that NWI is available for that quadrangle. A blank value in the NWI column indicates a data gap.

Final Report – SWRCB No. 05-101-180-1 16
Table 2: Wetlands in Region 8 Based on Available NWI Data
Wetland Type Number of Wetlands Acres km^2 %
Estuarine and Marine Deepwater 8 1748.0 7.1 14.2% Estuarine and Marine Wetland 40 1898.4 7.7 15.4% Freshwater Emergent Wetland 188 2408.5 9.7 19.6% Freshwater Forested/Shrub Wetland 83 500.2 2.0 4.1% Freshwater Pond 340 603.4 2.4 4.9% Lake 36 3545.7 14.3 28.8% Other 88 263.8 1.1 2.1% Riverine 23 1348.7 5.5 11.0% Total 806 12316.9 49.8 100.0%

Final Report – SWRCB No. 05-101-180-1 17
Table 3: Available NWI Wetland Distribution and Acreage
Quadrangle Name
Number of Wetland
Polygons* AcresANAHEIM 1 0.01ANZA 16 93.92BEAUMONT 27 79.10BIG BEAR CITY 44 1185.53BLACKBURN CANYON 23 12.30BUTTERFLY PEAK 18 56.72CAHUILLA MOUNTAIN 9 16.58CAJON 1 0.41CORONA NORTH 1 0.00FAWNSKIN 42 1882.59FONTANA 1 0.01GUASTI 120 343.65HEMET 24 51.59IDYLLWILD 80 988.79LAGUNA BEACH 19 161.70LAKE FULMOR 21 30.44LAKEVIEW 5 0.03LOS ALAMITOS 37 226.36NEWPORT BEACH 74 2447.64ONTARIO 72 82.96ONYX PEAK 15 32.59PALM VIEW PEAK 13 11.55PRADO DAM 2 0.01SAN JACINTO 60 1032.19SAN JACINTO PEAK 10 11.20SEAL BEACH 52 2770.20TUSTIN 43 794.24WILDOMAR 4 4.58Total 834 12316.89
* There are currently 806 wetlands in Region 8 (per Table 2). Some wetland polygons share adjacent quadrangles and are therefore counted in both quadrangles, hence the discrepancy between the totals in this table and Table 2.

Final Report – SWRCB No. 05-101-180-1 18
Table 4: Terrain parameters for riverine wetlands Elevation (ft) Slope (degrees)Minimum 0.80 0.00Maximum 2150.42 46.33Mean 197.38 3.03Stdev 248.15 5.14

Final Report – SWRCB No. 05-101-180-1 19
Table 5: Landuse categories for riverine wetlands
Landuse Count* Acres %
Vacant Undifferentiated 32 897.3271 66.56% Improved Flood Waterways and Structures 28 304.7382 22.60% Water, Undifferentiated 4 37.1225 2.75% Undeveloped Regional Parks & Recreation 2 26.4053 1.96% Mineral Extraction - Other Than Oil and Gas 5 18.8193 1.40% Mineral Extraction - Oil and Gas 4 18.7922 1.39% Nurseries 5 8.4482 0.63% Golf Courses 3 5.1911 0.39% Freeways and Major Roads 4 4.1208 0.31% Manufacturing, Assembly, & Industrial 11 3.4054 0.25% Wholesaling and Warehousing 2 3.1704 0.24% Liquid Waste Disposal Facilities 1 2.8378 0.21% Irrigated Cropland and Improved Pasture 4 2.4262 0.18% Vacant Area 2 2.3297 0.17% High-Density Single Family Residential 12 1.9301 0.14% Low-Rise Apartments, Condos, Townhouses 6 1.7136 0.13% Developed Local Parks and Recreation 4 1.5370 0.11% Non-Irrigated Cropland & Improved Pasture 3 1.2573 0.09% Under Construction 1 1.1686 0.09% Cemeteries 1 1.0306 0.08% Electrical Power Facilities 3 0.7957 0.06% Mixed Commercial and Industrial 1 0.5936 0.04% Retail Centers 1 0.5586 0.04% Low- and Medium-Rise Major Office Use 3 0.4192 0.03% Trailer Parks & Mobile Homes High-Density 2 0.4066 0.03% Senior High Schools 1 0.3603 0.03% Commercial Recreation 1 0.3566 0.03% Orchards and Vineyards 3 0.2514 0.02% Modern Strip Development 1 0.1657 0.01% Other Open Space and Recreation 1 0.1616 0.01% Commercial Storage 1 0.1322 0.01% Open Storage 1 0.0796 0.01% Medium-Rise Apartments & Condominiums 1 0.0748 0.01% Low-Density Single Family Residential 1 0.0025 0.00% *Count refers to the number of wetland polygons contained in that particular Landuse category.
Final Report – SWRCB No. 05-101-180-1 20
Table 6: Sites selected for CRAM Analysis SITEID CATEGORY Longitude DD Latitude DD CAS04476-011 SA_0-350 -117.78352517 33.850751000 CAS04476-012 SA_0-350 -117.81995033 33.919145069 CAS04476-015 SA_0-350 -117.68321695 33.892216066 CAS04476-019 SA_0-350 -117.61286303 33.911511385 CAS04476-042 SA_0-350 -117.61435352 33.945867213 CAS04476-046 SA_0-350 -117.71671396 33.792624077 CAS04476-071 SA_0-350 -117.67537558 33.748189466 CAS04476-017 SA_350-700 -117.36382035 34.161176725 CAS04476-028 SA_350-700 -117.44504460 34.203004484 CAS04476-032 SA_350-700 -117.08738209 34.077298499 CAS04476-051 SA_350-700 -117.15384395 33.995912140 CAS04476-055 SA_350-700 -117.22004775 34.039247797 CAS04476-079 SA_350-700 -117.40595247 34.219556993 CAS04476-085 SA_350-700 -117.23309791 34.049964960 CAS04476-002 SA_700+ -117.06210253 34.144227205 CAS04476-007 SA_700+ -116.96380672 34.094982144 CAS04476-014 SA_700+ -117.62619063 34.183644702 CAS04476-022 SA_700+ -116.87148271 34.158421091 CAS04476-027 SA_700+ -117.47032066 34.306522607 CAS04476-034 SA_700+ -116.93008031 34.089394000 CAS04476-035 SA_700+ -116.87489914 34.077479169 CAS04476-095 SJ_350-700 -117.09649019 33.830715336 CAS04476-116 SJ_350-700 -117.27871316 33.664073369 CAS04476-130 SJ_350-700 -117.02225881 33.728110331 CAS04476-160 SJ_350-700 -116.81068772 33.731419450 CAS04476-243 SJ_350-700 -117.20906791 33.829108898 CAS04476-331 SJ_350-700 -117.23341205 33.745602791 CAS04476-347 SJ_350-700 -116.99166922 33.845882299 CAS04476-020 SJ_700+ -116.68733438 33.768420077 CAS04476-070 SJ_700+ -116.76762278 33.771511380 CAS04476-172 SJ_700+ -116.83797267 33.784315302 CAS04476-206 SJ_700+ -116.74231339 33.731890431 CAS04476-286 SJ_700+ -116.81659916 33.653887189 CAS04476-484 SJ_700+ -116.82052651 33.659625124 CAS04476-612 SJ_700+ -116.83476442 33.675115290

Final Report – SWRCB No. 05-101-180-1 21
Table 7: CRAM metrics for preliminary scores prior to the site visit
Background Information to Assemble Prior to the Site Visit • 1m -3m pixel resolution digital geo-rectified site imagery • Site-specific and neighboring reports on hydrology, ecology, chemistry, etc. • Access permission if needed • Preliminary map of the Assessment Area • Maps to the site, access points, and other logistical information
Metrics Suitable for Preliminary Scoring Prior to Site Visit
Attributes Metrics Suitable? Landscape Connectivity Yes Percent of Wetland with
Buffer Yes Buffer and Landscape Context
Average Buffer Width Yes Sources of Water Yes Hydrology
Hydrologic Connectivity Yes Source: Partial Table 3.7 from CRAM Manual, v. 4.2.0 – Collins, et al. 2006
Final Report – SWRCB No. 05-101-180-1 22
Table 8: CRAM Site Attributes and Metrics
Attributes Metrics
1a. Landscape Connectivity
1b. Percent of AA with Buffer
1c. Average Buffer Width
1. Buffer and Landscape
Context
1d. Buffer Condition 2a. Water Source 2b. Hydroperiod or Channel Stability
2. Hydrology
2c. Hydrologic Connectivity
3a. Structural Patch Richness 3. Physical 3b. Topographic Complexity
4a. Organic Matter Accumulation 4b. Interspersion and Zonation 4c. Number of Plant Layers Present 4d. Percent of Layers Dominated by Native Species 4e. Number of Co-dominant Species 4f. Percent of Co-dominant Species that are Native
Structure 4.
Biotic
4g. Vertical Biotic Structure Source: Table 2.2 in CRAM 4.1

Final Report – SWRCB No. 05-101-180-1 23
Table 9: CRAM Data Stressors – Hydrology HYDROLOGY Point Source (PS) Discharges (POTW, other non-stormwater discharge) Non-point Source (Non-PS) Discharges (urban runoff, farm drainage) Flow diversions or unnatural inflows Dams (reservoirs, detention basins, recharge basins) Flow obstructions (culverts, paved stream crossings) Weir/drop structure, tide gates Dredged inlet/channel Engineered channel (riprap, armored channel bank, bed) Dike/levees Groundwater extraction Ditches (borrow, agricultural drainage, mosquito control, etc.)

Final Report – SWRCB No. 05-101-180-1 24
Table 10: CRAM Data Stressors – Physical Structure PHYSICAL STRUCTURE Filling or dumping of sediment or soils (N/A for restoration areas) Grading/ compaction (N/A for restoration areas) Plowing/Discing (N/A for restoration areas) Resource extraction (sediment, gravel, oil and/or gas) Vegetation management Excessive sediment or organic debris from watershed Excessive runoff from watershed Nutrient impaired (PS or Non-PS pollution) Heavy metal impaired (PS or Non-PS pollution) Pesticides or trace organics impaired (PS or Non-PS pollution) Bacteria and pathogens impaired (PS or Non-PS pollution) Trash or refuse

Final Report – SWRCB No. 05-101-180-1 25
Table 11: CRAM Data Stressors – Biotic Structure BIOTIC STRUCTURE Mowing, grazing, excessive herbivory (within AA) Excessive human visitation Predation and habitat destruction by non-native vertebrates (e.g., Virginia opossum and domestic predators (e.g., feral pets) Tree cutting/sapling removal Removal of woody debris Treatment of non-native and nuisance plant species Pesticide application or vector control Evidence of fire Evidence of flood Biological resource extraction or stocking (fisheries, aquaculture) Excessive organic debris in matrix (for vernal pools) Lack of vegetation management to conserve natural resources Lack of appropriate treatment of invasive plant species adjacent to AA or buffer

Final Report – SWRCB No. 05-101-180-1 26
Table 12: CRAM Data Stressors – Adjacent Land Use ADJACENT LAND USE Urban residential Industrial/commercial Military training/Air traffic Dryland farming Intensive row-crop agriculture Orchards/nurseries Commercial feedlots Dairies Ranching (enclosed livestock grazing or horse paddock or feedlot) Transportation corridor Rangeland (livestock rangeland also managed for native vegetation) Sports fields and urban parklands (golf courses, soccer fields, etc.) Passive recreation (bird-watching, hiking, etc.) Active recreation (off-road vehicles, mountain biking, hunting, fishing) Physical resource extraction (rock, sediment, oil/gas) Biological resource extraction (aquaculture, commercial fisheries)

Final Report – SWRCB No. 05-101-180-1 27
FIGURES
Figure 1: Map of the SARWQCB Region 8

Final Report – SWRCB No. 05-101-180-1 28
a.
b.
Figure 2: Hydrologic Units (a) and Elevation Ranges (b) in Region 8

Final Report – SWRCB No. 05-101-180-1 29
Figure 3: Stratification by hydrologic unit and elevation range

Final Report – SWRCB No. 05-101-180-1 30
Figure 4: NWI Wetland Data Availability

Final Report – SWRCB No. 05-101-180-1 31
Figure 5: NWI wetland resources and index for zoom areas
Final Report – SWRCB No. 05-101-180-1 32
NWI Wetland Distribution in Region 8
0
500
1000
1500
2000
2500
3000
3500
4000
Estuari
ne/M
arine D
eepwate
rEstu
arine
/Marin
eFresh
water E
mergen
t
Freshwate
r Fore
sted/S
hrubFre
shwate
r Pond
Lake
Riverin
e
Other
Acr
es
Figure 6: NWI Wetland Distribution in Region 8 Based on Available data

Final Report – SWRCB No. 05-101-180-1 33
Riverine Wetlands By Strata
1.9% 5.1%
13.4%
56.7%
22.8%
0.0%
10.0%
20.0%
30.0%
40.0%
50.0%
60.0%
SA 0-350 SA 700+ SG 0-350 SJ 350-700 SJ 700+
Figure 7: Riverine wetlands by hydrologic unit and elevation range

Final Report – SWRCB No. 05-101-180-1 34
Figure 8: Data frame and CRAM sample site locations

Final Report – SWRCB No. 05-101-180-1 35
SA 0-350 SA 350-700 SA 700+ SJ 350-700 SJ 700+0%
10%
20%
30%
40%
50%
60%
70%
80%
90%
100%
0 8 1 6 2 4 3 2 4 0
CR
AM
sco
res
SA_0-350
SA_350-700
SA_700+SJ_350-700
SJ_700+
Figure 9: Santa Ana and San Jacinto Wetland CRAM Scores

Final Report – SWRCB No. 05-101-180-1 36
CRAM scores
Freq
uenc
y
8070605040
10
8
6
4
2
0
Mean 63.22StDev 9.283N 35
Normal Histogram of Santa Ana/San Jacinto CRAM scores
Figure 10: Histogram of Santa Ana/San Jacinto wetland CRAM Scores

Final Report – SWRCB No. 05-101-180-1 37
CRAM SCORES, incl. Ambrose et al. 2006 limits
Perc
ent
10090807060504030
99
95
90
80
7060504030
20
10
5
1
50 70
10
80
Normal - 95% CI
Probability Plot of Santa Ana/San Jacinto CRAM scores
Figure 11: Probability Plot of CRAM Scores with 2006 Quality Limits. Quality CRAM ranges were based on ranges used for evaluating mitigation projects in California. Cut off CRAM score levels used: 50% and 70% (Ambrose et al. 2006).

Final Report – SWRCB No. 05-101-180-1 38
Wetland quality - Ambrose et al. 2006
Freq
uenc
y
321
25
20
15
10
5
0
Histogram of Wetland quality - Ambrose et al. 2006
Figure 13: Distribution of CRAM scores over CRAM wetland quality ranges. The quality ranges were based on ranges used for evaluating mitigation projects in California. 3 = Complete mitigation success ~ High quality wetland; 2 = Partial mitigation success ~ Medium wetland quality; 1 = Failed mitigation project ~ Low quality wetland. Cut off CRAM score levels used: 50% and 70% (Ambrose et al. 2006).

Final Report – SWRCB No. 05-101-180-1 39
CRAM SCORES, incl. 2004 limits
Per
cent
90807060504030
99
95
90
80
70605040
30
20
10
5
1
79.254.2
20
97.5
Normal - 95% CI
Probability Plot of Santa Ana/San Jacinto CRAM scores
Figure 12: Probability Plot of CRAM Scores with 2004 Quality Limits. Quality CRAM ranges were based on ranges used for evaluating mitigation projects in California. Cut off CRAM score levels used: 54.2% and 79.2% (Ambrose and Lee, 2004 and Quigly et al. 2006).
Final Report – SWRCB No. 05-101-180-1 40
Wetland quality
Freq
uenc
y
321
30
25
20
15
10
5
0
Wetland quality in Santa Ana/San Jacinto study
Figure 14: Distribution of CRAM scores over CRAM wetland quality ranges. The quality ranges were based on ranges used for evaluating mitigation projects in California. 3 = Complete mitigation success ~ High quality wetland; 2 = Partial mitigation success ~ Medium wetland quality; 1 = Failed mitigation project ~ Low quality wetland. Cut off CRAM score levels used: 54.2% and 79.2% (Ambrose and Lee, 2004 and Quigly et al. 2006).
Final Report – SWRCB No. 05-101-180-1 41
CRAM scores vs. elevation
010
2030
4050
6070
8090
0 500 1000 1500 2000 2500Elevation (m)
CR
AM
sco
res
(%)
Figure 15: Santa Ana/San Jacinto riverine site CRAM scores vs. site elevation.
r = 0.0179

Final Report – SWRCB No. 05-101-180-1 42
APPENDICES Appendix A: Regional Maps of wetland resources and CRAM locations The maps contained in this Appendix are based on available NWI data as detailed in this Report (please refer to Section 4, Table 1 and Figure 4). The wetland resources concentrate in seven areas. Each of these areas was identified by a “box” and are outlined on and Index Map (Map 1). The subsequent seven maps zoom in to each of the seven zoom areas to further detail the wetland resources in those parts of Region 8. The final map provides an overall view of the study area and CRAM site locations. Map 1: Index Map of Wetland Resources in the Region 8 Study Area Map 2: Wetland Resources in Index Area Number 1 Map 3: Wetland Resources in Index Area Number 2 Map 4: Wetland Resources in Index Area Number 3 Map 5: Wetland Resources in Index Area Number 4 Map 6: Wetland Resources in Index Area Number 5 Map 7: Wetland Resources in Index Area Number 6 Map 8: Wetland Resources in Index Area Number 7 Map 9: Region 8 Study Area and CRAM Sites Table A1 breaks down the wetland resources in each of these Index areas (Map 1). The index designed for these maps covers almost all of the wetlands in the region. However, four (4) wetland polygons were excluded from the indexed areas (approximately 9.8 acres).

Final Report – SWRCB No. 05-101-180-1 43
Map 1: Index Map of Wetland Resources in the Region 8 Study Area

Final Report – SWRCB No. 05-101-180-1 44
Map 2: Wetland Resources in Index Area Number 1
Final Report – SWRCB No. 05-101-180-1 45
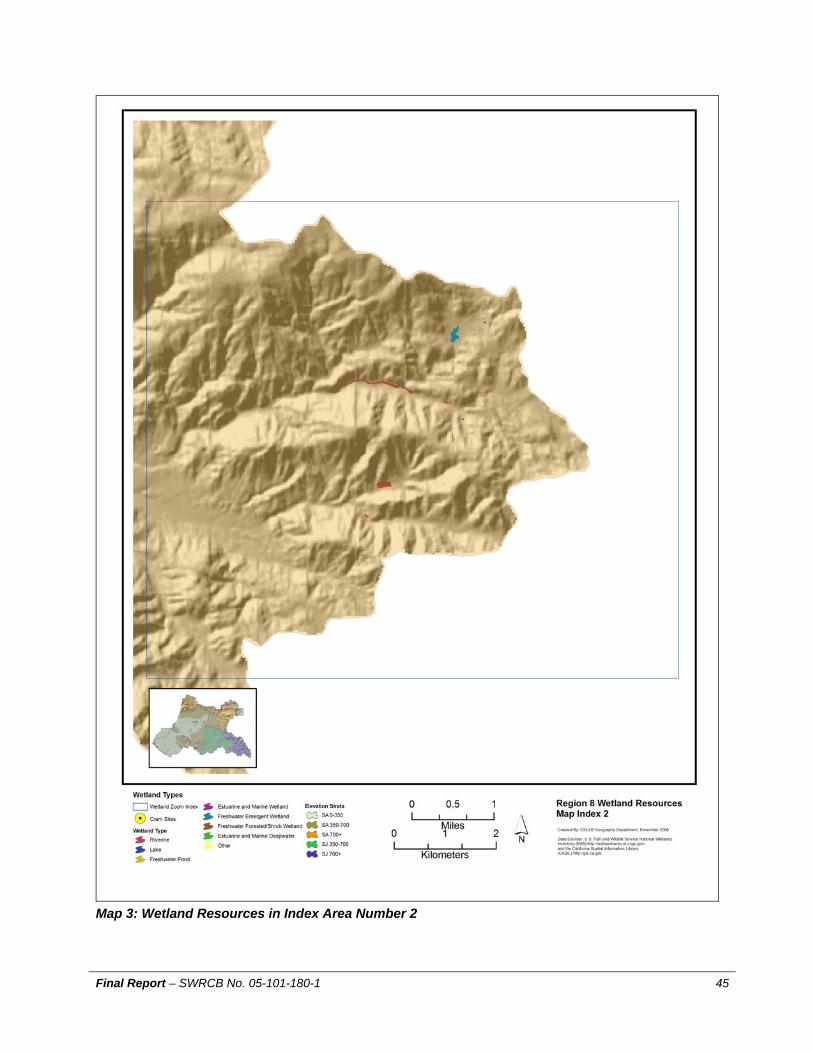
Map 3: Wetland Resources in Index Area Number 2

Final Report – SWRCB No. 05-101-180-1 46
Map 4: Wetland Resources in Index Area Number 3

Final Report – SWRCB No. 05-101-180-1 47
Map 5: Wetland Resources in Index Area Number 4

Final Report – SWRCB No. 05-101-180-1 48
Map 6: Wetland Resources in Index Area Number 5
Final Report – SWRCB No. 05-101-180-1 49
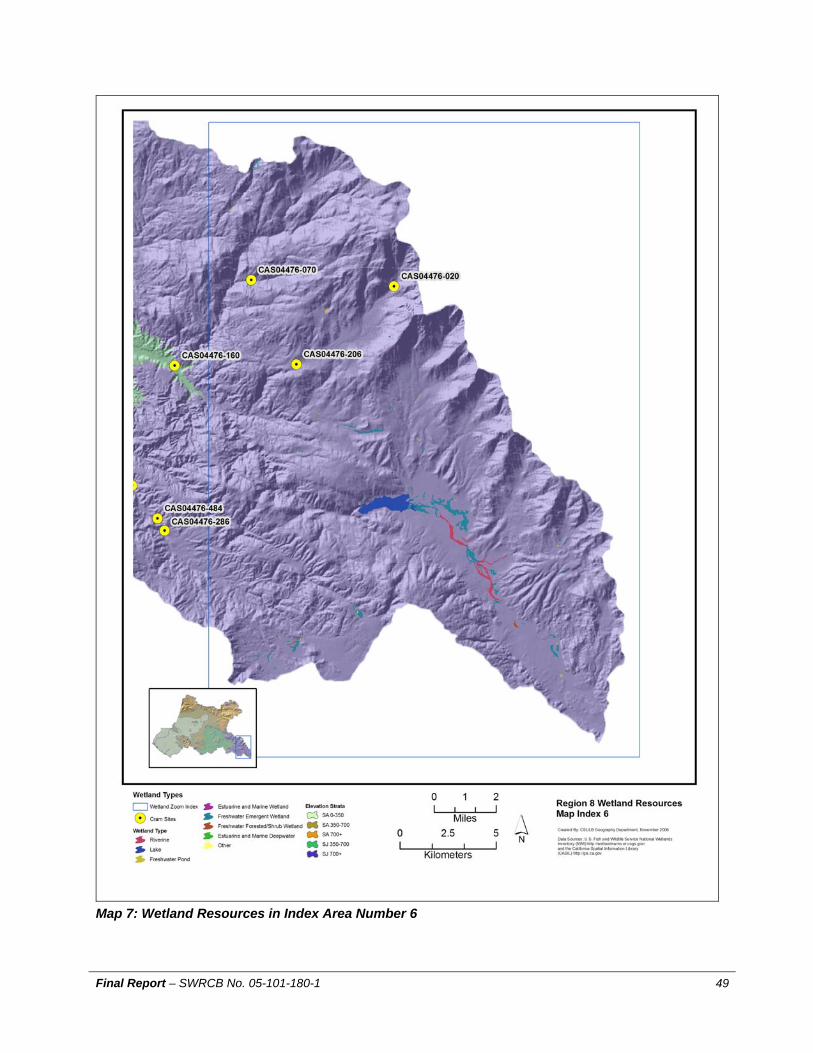
Map 7: Wetland Resources in Index Area Number 6

Final Report – SWRCB No. 05-101-180-1 50
Map 8: Wetland Resources in Index Area Number 7
Final Report – SWRCB No. 05-101-180-1 51
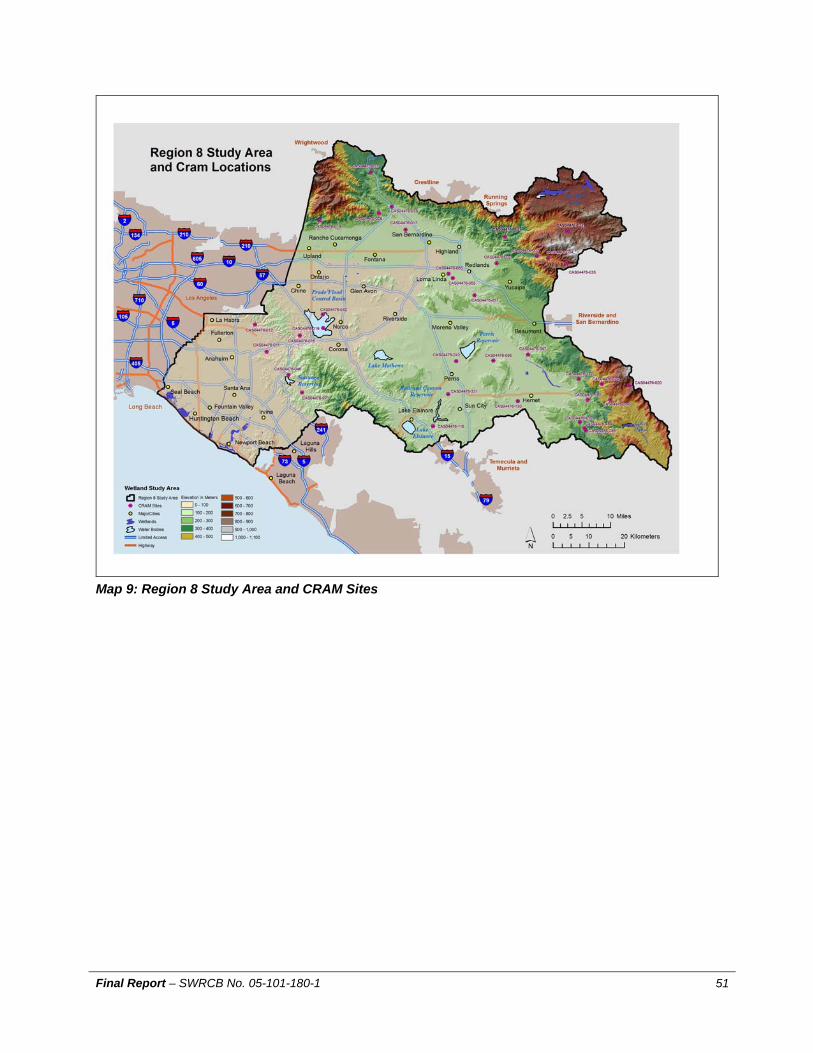
Map 9: Region 8 Study Area and CRAM Sites

Final Report – SWRCB No. 05-101-180-1 52
Table A1: Wetland Resources by Index Area in Region 8 Index 1: Wetland Type Count AcresFreshwater Emergent Wetland 43 310.92Freshwater Forested/Shrub Wetland 7 8.93Freshwater Pond 13 11.35Lake 10 2728.22Other 8 4.90Riverine 1 2.49Index 2: Wetland Type Count AcresFreshwater Emergent Wetland 5 9.50Freshwater Forested/Shrub Wetla 9 23.02Freshwater Pond 1 0.05Index 3: Wetland Type Count AcresFreshwater Emergent Wetland 7 3.39Freshwater Forested/Shrub Wetla 3 2.52Freshwater Pond 99 95.69Lake 10 124.68Other 69 199.80Riverine 1 0.38Index 4: Wetland Type Count AcresEstuarine and Marine Deepwater 8 1747.22Estuarine and Marine Wetland 40 1897.62Freshwater Emergent Wetland 43 1493.55Freshwater Forested/Shrub Wetland 28 352.47Freshwater Pond 88 383.46Lake 6 147.18Riverine 7 375.92Index 5: Wetland Type Count AcresFreshwater Emergent Wetland 12 23.79Freshwater Forested/Shrub Wetla 22 93.42Freshwater Pond 87 71.18Lake 1 149.77Other 11 59.04Riverine 10 790.19Index 6: Wetland Type Count AcresFreshwater Emergent Wetland 77 564.45Freshwater Forested/Shrub Wetla 13 19.21Freshwater Pond 49 38.80Lake 9 394.35Riverine 4 179.19Index 7: Wetland Type Count AcresFreshwater Forested/Shrub Wetland 1 0.41 TOTAL 802 12307.06
Table A1 breaks down the wetland resources in each of these Index areas (Map 1). The index designed for these maps covers almost all of the wetlands in the region. However, four (4) wetland polygons were excluded from the indexed areas (approximately 9.8 acres).

Final Report – SWRCB No. 05-101-180-1 53
Appendix B: Sample Data Frame and Reconnaissance for Site Selection Status Code: 1=sampled; 2=viable; 3=permission required; 4=additional recon required; 5=no recon; 6=non-viable
SITEID CATEGORY LONDD LATDD CRAM Status COMMENTS CAS04476-001 SA_0-350 -117.91973161 33.716066364 6 Only several inches of water outside of the low flow channel CAS04476-003 SA_0-350 -117.73206159 33.658501846 6 Site unreachable due to Amtrak station. CAS04476-004 SA_0-350 -117.81463072 33.595863286 6 Dense Vegetation on Steep Slopes, Not Accessible. See report classproject_F04. CAS04476-005 SA_0-350 -117.48160940 33.829122041 6 Stagnent pond CAS04476-006 SA_0-350 -117.89104922 33.643373767 6 Brackish (Newport Beach backbay) CAS04476-011 SA_0-350 -117.78352517 33.850751000 Y 1 bridge at imperial highway over santa ana river, gated access road on northeast side (Atl GPS CAS04476-012 SA_0-350 -117.81995033 33.919145069 Y 1 Sampled 31 May 06 CAS04476-013 SA_0-350 -117.76353735 33.722372773 6 Not Located; Housing tract (31 May 06) CAS04476-015 SA_0-350 -117.68321695 33.892216066 Y 3 Chino Hill State Park (?) Brush Canyon Trail (31 May 06) CAS04476-019 SA_0-350 -117.61286303 33.911511385 Y 1 Alt ~ -117.59751, 33.92388; Sampled 15June06 CAS04476-023 SA_0-350 -118.08366318 33.732846479 6 Salt marsh in wildlife refuge. Brackish. CAS04476-026 SA_0-350 -117.83457265 33.581391317 6 Dense Vegetation on Steep Slopes, Not Accessible. See report classproject_F04. CAS04476-029 SA_0-350 -117.86533228 33.863403618 6 Not located; Housing tract CAS04476-037 SA_0-350 -117.70886109 33.661376915 6 Not located; Housing tract CAS04476-040 SA_0-350 -117.69309905 33.804471368 5
CAS04476-042 SA_0-350 -117.61435352 33.945867213 Y 1 Sampled 31 May 06 by bioassessment group (not CRAM) CAS04476-046 SA_0-350 -117.71671396 33.792624077 Y 3 Irvine co Land (949-936-8026); CAS04476-048 SA_0-350 -117.78566472 33.717517871 6 No water F05 CAS04476-052 SA_0-350 -117.68683278 33.693517789 3 Irvine Co land (949-936-8026); Portolo Gate/Irvine Ranch; Operated by Nature Conserv (714-8CAS04476-056 SA_0-350 -117.85449077 33.581784741 6 No water F05 CAS04476-059 SA_0-350 -117.82185260 33.824615913 6 No apparent water from topo and aerial maps. Meats Ave. and Santiago Blvd. In Villa Park. CAS04476-060 SA_0-350 -118.03419287 33.696367975 6 Inaccessable land on Bolsa Chica ecological reserve. Brackish. CAS04476-066 SA_0-350 -117.44886942 33.757389645 6 Inaccessable canyon CAS04476-071 SA_0-350 -117.67537558 33.748189466 Y 3 great site on Irvine Co land!! See report classproject_F04 CAS04476-077 SA_0-350 -117.88772079 33.769684568 6 Dry, Rock Bottom See report classproject_F04 & S06 CAS04476-081 SA_0-350 -117.58158781 34.077769884 6 Building Located on site CAS04476-082 SA_0-350 -117.87218400 33.648799828 6 Brackish (Newport Beach backbay) CAS04476-089 SA_0-350 -117.83017893 33.589391161 6 Dense Vegetation on Steep Slopes, Not Accessible. See report classproject_F04. CAS04476-090 SA_0-350 -117.94998917 33.650818106 6 Brackish CAS04476-091 SA_0-350 -117.81007019 33.832653530 6 [topo/aerial maps] This is now a housing tract. Could be a bad point for a non-perrenial streamCAS04476-098 SA_0-350 -117.28450266 34.082653942 4 concrete flood control channel CAS04476-099 SA_0-350 -117.90226228 33.756562881 6 Brackish, influenced by the tide; F04 CAS04476-101 SA_0-350 -117.95406589 33.636798691 6 Brackish, influenced by the tide; F04

Final Report – SWRCB No. 05-101-180-1 54
SITEID CATEGORY LONDD LATDD CRAM Status COMMENTS CAS04476-102 SA_0-350 -117.69544191 33.874679190 2 *Access (Y); Water (Y); Width (15); Cell Service (Y). Fast Current, may be too deep; May haveCAS04476-104 SA_0-350 -117.75117711 33.849231548 6 *Access (?); Water (N); Width (?); Cell Service (Y). Gated access; Calvery Chapel, Yorba LindCAS04476-108 SA_0-350 -117.64380698 33.888615756 3 Prado Dam Administration; 91→Serfas Club; no recon F05 CAS04476-109 SA_0-350 -117.58358733 34.050816328 3 Private Property. Hoffer Ranch = Contact Paul Hoffer (909) 390 - 2555. See report Team_CucCAS04476-110 SA_0-350 -117.46338591 33.963529961 1 *Between SA river and a tributary. See reort BigBear_RiversideReconn. August 2005; SampleCAS04476-113 SA_0-350 -117.88971499 33.722334612 6 Not Located; Housing tract CAS04476-119 SA_0-350 -117.71971434 33.733844832 6 *No water July 2005 CAS04476-120 SA_0-350 -117.88493905 33.673218359 5 CAS04476-122 SA_0-350 -117.48805729 33.961597963 6 *Access via Santa Ana River Regional Park. May be able to drive dirt trail. Not long enough toCAS04476-129 SA_0-350 -117.64333273 33.933805235 6 Site located in reservoir 14June06 CAS04476-134 SA_0-350 -117.39095087 34.005782174 6 Dry 14June06, Rock Bottom See report classproject_F04 & S06 CAS04476-136 SA_0-350 -117.67979485 33.699873843 5 CAS04476-137 SA_0-350 -117.75747157 33.861774128 3 *Access (?); Water (N); Width (?); Cell Service (Y). Gated access; Calvery Chapel, Yorba LindCAS04476-139 SA_0-350 -117.33374300 34.045723989 4 wash, mostly sediment, probably some flow all year, 1/4 mile upstream might be bette CAS04476-140 SA_0-350 -117.74360520 33.894696260 6 *Access (Y); Water (N); Width (?); Cell Service (Y). Access gated with no sign across from corCAS04476-141 SA_0-350 -117.66298453 33.756682640 3 Irvine Co land behind access gate/need ranger escort. See report classproject_F04 CAS04476-142 SA_0-350 -117.68857594 33.773857788 3 Irvine Co land behind access gate/need ranger escort. See report classproject_F04 CAS04476-143 SA_0-350 -117.76911315 33.756478213 6 amongst gated communities. See report classproject_F04 CAS04476-145 SA_0-350 -117.32405667 34.041007296 6 subterranean aqueduct CAS04476-149 SA_0-350 -117.67941087 33.767738442 3 Irvine Co land behind access gate/need ranger escort. See report classproject_F04 CAS04476-150 SA_0-350 -117.68768184 33.911667683 3 Access road gate off of Hwy 71 (N) 33.88697Lat, 117.64509 Long. See report classproject_F0CAS04476-151 SA_0-350 -117.40591186 33.991010501 6 *Bad coordinate. No water in area. SA river approx. 1 km WSW. See BigBear_RiversideRecoCAS04476-152 SA_0-350 -117.85014861 33.651559437 6 *Black sediment, unsafe (sticky waist high mud), across from UCI. July 2005 CAS04476-153 SA_0-350 -117.49802800 33.815839983 4 Stream next to Golf course. Golf course under construction. CAS04476-154 SA_0-350 -117.76915753 33.787754525 6 Within suburban community/no visable hydrology CAS04476-157 SA_0-350 -117.60934438 34.093279054 4 CAS04476-165 SA_0-350 -117.47750360 33.963651513 5 CAS04476-166 SA_0-350 -117.76221329 33.794260848 6 near Irvine regional Park/no visable hydrology. Underground Aqueduct See report classprojecCAS04476-169 SA_0-350 -117.57735575 33.936595897 4 This site is just before the holding area behind Prado Dam. Might be a lake in 2005. CAS04476-170 SA_0-350 -117.74495582 33.888062925 6 *Access (Y); Water (N); Width (?); Cell Service (Y). Access gated with no sign across from corCAS04476-171 SA_0-350 -117.77767756 33.728097524 6 No water F05 CAS04476-175 SA_0-350 -117.88022640 33.859537481 5 CAS04476-177 SA_0-350 -117.69956025 33.797930535 5 CAS04476-178 SA_0-350 -117.81361991 33.682068359 4 Located by a shopping center. See report AdamNickJesse. CAS04476-179 SA_0-350 -117.46746722 33.769647952 3 See report AdamNickJesse. CAS04476-180 SA_0-350 -117.78710609 33.671751921 2 Alton/Jeffery near overpass. Sampled in pilot SU05; Use coordinates 33.67175; -117.78711

Final Report – SWRCB No. 05-101-180-1 55
SITEID CATEGORY LONDD LATDD CRAM Status COMMENTS CAS04476-182 SA_0-350 -117.59578995 33.926634348 4 This site is just before the holding area behind Prado Dam. Might be a lake in 2005. CAS04476-186 SA_0-350 -117.61632078 33.917341844 6 not located, roads to site not accessible due to gating on Cucamonga (arthur farms), CAS04476-190 SA_0-350 -117.32649054 34.034802592 6 subterranean aqueduct CAS04476-191 SA_0-350 -117.47871867 33.965379989 2 *Access via Santa Ana River Regional Park. May be able to drive dirt trail. See report BigBeaCAS04476-195 SA_0-350 -117.28441671 34.078293635 4 concrete flood control channel CAS04476-197 SA_0-350 -117.70095709 33.983477179 5 CAS04476-198 SA_0-350 -117.62180793 33.938081245 4 Site not located due to gate/fence/no tresspassing. Ownership: Arther Farms. See report clasCAS04476-200 SA_0-350 -117.72097562 33.656823520 4 NO access CAS04476-201 SA_0-350 -117.54069621 34.076373138 4 CAS04476-204 SA_0-350 -117.59954245 33.977408524 4 Concrete flood control channel. See report Team_Cucamanga. CAS04476-210 SA_0-350 -117.73631587 33.795416012 6 *Behind Irvine Park. Irvine Co. land (conservancy regulated?). Dries up in April. CAS04476-213 SA_0-350 -117.34057760 34.047880757 4 wash, mostly sediment, probably some flow all year, 1/4 mile upstream might be bette CAS04476-215 SA_0-350 -117.73816248 33.874171612 2 *Access (Y); Water (Y); Width (15); Cell Service (Y). Tributary off Santa Ana 8-21-05; SampledCAS04476-220 SA_0-350 -117.31576823 34.083180102 4 concrete flood control channel CAS04476-223 SA_0-350 -117.68605253 33.894326526 3 Access road gate off of Hwy 71 (N) 33.88697Lat, 117.64509 Long. See report classproject_F0CAS04476-229 SA_0-350 -117.50813479 33.832841524 4 Might not have water during normal years (precipitation). See report AdamNickJesse CAS04476-231 SA_0-350 -117.69053862 33.967795952 4 subterranean flood control surrounded by chain link fence. See report calssproject_F04 CAS04476-234 SA_0-350 -117.82329809 33.677616873 5 CAS04476-237 SA_0-350 -118.08201143 33.740466216 6 Salt marsh in wildlife refuge; Military Base. Brackish CAS04476-256 SA_0-350 -117.72485378 33.790272475 6 *Behind Irvine Park. Irvine Co. land (conservancy regulated?). Dries up in April. CAS04476-260 SA_0-350 -117.89287892 33.727815728 5 CAS04476-261 SA_0-350 -117.82108046 33.596594251 6 Dense Vegetation on Steep Slopes, Not Accessible. See report classproject_F04. CAS04476-262 SA_0-350 -117.57578700 33.893624523 3 WRCRWA south regional pumping station, part of riverside county flood control. See report claCAS04476-265 SA_0-350 -117.27964362 34.070901046 2 Good access, robust riparian habitat, good flow. Adjacent to golf course and gravel quarry. SeCAS04476-273 SA_0-350 -117.32600724 34.036594730 6 subterranean aqueduct CAS04476-275 SA_0-350 -117.88785031 33.857557606 5 CAS04476-278 SA_0-350 -117.84623996 33.603725635 4 Recheck. See report classproject_F04 CAS04476-285 SA_0-350 -117.27405879 34.064063636 4 concrete flood control channel CAS04476-287 SA_0-350 -117.71157408 33.735152513 6 *No Water July 2005 CAS04476-293 SA_0-350 -117.48842997 33.787031444 4 Dawson Canyon and Park Canyon (See report AdamNickJesse). Suspect this was just spring CAS04476-294 SA_0-350 -117.48984093 33.967151118 2 *Access via Santa Ana River Regional Park. May be able to drive dirt trail. See report BigBeaCAS04476-299 SA_0-350 -117.88258122 33.689495500 6 Business Area S06 CAS04476-303 SA_0-350 -117.83828734 33.660737450 6 *Black sediment, unsafe (sticky waist high mud), across from UCI CAS04476-305 SA_0-350 -117.79974844 33.708199946 3 Orange County Environmental Management Agency; viable with permission; F05 CAS04476-306 SA_0-350 -117.88464946 33.699054308 2 Alt GPS~ 33.70877, -117.80032; Original site of softball field; Harvard Ave in Irvine; S06 CAS04476-308 SA_0-350 -117.83940867 33.575903358 4 Must walk upstream in extreme brush. See report classproject_F04.

Final Report – SWRCB No. 05-101-180-1 56
SITEID CATEGORY LONDD LATDD CRAM Status COMMENTS CAS04476-310 SA_0-350 -117.74741680 33.875973219 2 *Coordinate is a little off but the river looks good S. of here. Some bush-whacking (Mark 2005)CAS04476-312 SA_0-350 -117.53012683 33.957181418 5 CAS04476-315 SA_0-350 -117.67325425 33.762096425 3 Irvine Co land behind access gate/need ranger escort. See report classproject_F04 CAS04476-323 SA_0-350 -117.76134168 33.734586330 5 CAS04476-324 SA_0-350 -117.91701879 33.849977153 5 CAS04476-325 SA_0-350 -117.89427297 33.766026211 3 Riverview Golf Course; viable S06 CAS04476-330 SA_0-350 -117.88960383 33.637155830 6 Brackish (Newport Beach backbay) CAS04476-337 SA_0-350 -117.62482575 33.909960226 6 Underwater (Behind Prado Dam). See report classproject_F04. *Decision based on maps andCAS04476-338 SA_0-350 -117.74654663 33.880248467 4 *Bad coordinate? Report classproject_F04 states this is behind Costco but its not. This is up oCAS04476-339 SA_0-350 -117.46598413 33.765073897 3 See report AdamNickJesse. CAS04476-340 SA_0-350 -117.74148273 33.857707522 5 CAS04476-341 SA_0-350 -117.87810889 33.786198962 4 [topo/aerial maps] Freeway offramp (Chapman). Closest water is SA river (.03 km away). BaCAS04476-343 SA_0-350 -117.52220496 33.811892896 6 Row crops F05 CAS04476-351 SA_0-350 -117.52140586 33.966810557 5 CAS04476-354 SA_0-350 -117.51380526 33.820072958 6 [topo/aerial map + physical recon]. This is an orchard. Dry CAS04476-356 SA_0-350 -117.58815341 33.931300968 4 This site is just before the holding area behind Prado Dam. Might be a lake in 2005. CAS04476-361 SA_0-350 -117.43757297 33.968736707 2 Sampled in pilot Su05; Use coordinates 33.96953; -117.43792 CAS04476-364 SA_0-350 -117.70982424 33.681977114 5 CAS04476-368 SA_0-350 -117.79425890 33.639733101 5 CAS04476-369 SA_0-350 -117.72027741 33.669316264 5 CAS04476-386 SA_0-350 -117.90558379 33.752371619 6 Brackish; influenced by the tide; S06 CAS04476-391 SA_0-350 -117.31189517 34.054982647 5 CAS04476-393 SA_0-350 -117.61456661 33.918673334 3 Probably under water this year (2005). Behind Prado Dam. See report classproject_F04. CAS04476-395 SA_0-350 -117.60104677 33.968613788 4 Concrete flood control channel. See report Team_Cucamanga CAS04476-400 SA_0-350 -117.50924706 33.830115577 4 Might not have water during normal years (precipitation). See report AdamNickJesse CAS04476-403 SA_0-350 -117.67799278 33.962903575 5 CAS04476-404 SA_0-350 -117.54088102 34.060943353 4 Concrete flood control channel. See report Team_Cucamanga. CAS04476-406 SA_0-350 -117.38873659 33.917334059 5 CAS04476-411 SA_0-350 -117.62098446 33.933880403 5 CAS04476-412 SA_0-350 -117.70560631 33.733404794 6 *No water July 2005 CAS04476-418 SA_0-350 -117.80599195 33.680522971 4 Just East of site 673. CAS04476-420 SA_0-350 -117.63123117 33.908036454 6 Underwater (Behind Prado Dam). See report classproject_F04. *Decision based on maps andCAS04476-422 SA_0-350 -117.72560720 33.873577897 2 Park on Old Village Road, run across street, down the slope (slight) to access road. See reporCAS04476-429 SA_0-350 -117.81723708 33.798690097 5 CAS04476-432 SA_0-350 -117.74092124 33.720135412 6 *No water July 2005 CAS04476-437 SA_0-350 -117.76979440 33.725741948 5

Final Report – SWRCB No. 05-101-180-1 57
SITEID CATEGORY LONDD LATDD CRAM Status COMMENTS CAS04476-439 SA_0-350 -117.53365954 33.868743823 3 See report AdamNickJesse. CAS04476-441 SA_0-350 -117.90065035 33.854232162 5 CAS04476-442 SA_0-350 -117.80695928 33.922106090 4 Need to access via Soquel Canyon Road, probably opposite Olinda Dr. off of Hwy 142. See reCAS04476-450 SA_0-350 -117.51075774 33.970879634 3 *Hidden Valley Wildlife Preserve. Fast moving water, may be too deep. See report BigBear_RCAS04476-462 SA_0-350 -117.75376040 33.650965514 4 Construciton underway close to site. CAS04476-465 SA_0-350 -117.78991487 33.810564940 5 CAS04476-467 SA_0-350 -117.47784618 33.782698852 4 Not able to reach site. To many ubstructions. See report AdamNickJesse CAS04476-468 SA_0-350 -117.37588416 34.020700240 5 CAS04476-473 SA_0-350 -117.76821520 33.786718568 5 CAS04476-475 SA_0-350 -117.42451980 33.972627118 2 *SA river wildlife area. County/State vehicle access wide enough for van. See BigBear_RiversCAS04476-480 SA_0-350 -118.08258852 33.804151050 4 Coyote Creek. See report classproject_F04 CAS04476-481 SA_0-350 -117.42036647 33.976731371 3 *Channelized Creek. Gated by Riverside County Flood Control and H20 Conservation District.CAS04476-486 SA_0-350 -117.88493860 33.647800846 6 Brackish (Newport Beach backbay) CAS04476-487 SA_0-350 -117.73250803 33.794747497 6 *Behind Irvine Park. Irvine Co. land (conservancy regulated?). Dries up in April. CAS04476-491 SA_0-350 -117.66077546 33.762325952 3 Irvine Co land behind access gate/need ranger escort. See report classproject_F04 CAS04476-493 SA_0-350 -117.88993452 33.636147588 6 Brackish (Newport Beach backbay) CAS04476-494 SA_0-350 -117.47379458 33.962925137 3 *Hidden Valley Wildlife Preserve. Probably water but thick vegetation. See report BigBear_RivCAS04476-495 SA_0-350 -117.93400580 33.694431145 6 Only several inches of water outside of the low flow channel. *Dry August 2005 (Mark). See reCAS04476-497 SA_0-350 -117.74372952 33.652986419 5 CAS04476-498 SA_0-350 -117.76593899 33.659822965 4 Laguna Canyon road. CAS04476-503 SA_0-350 -117.83017879 33.605236262 3 Irvine Co Land; no recon F05 CAS04476-504 SA_0-350 -117.75956222 33.655065133 4 Near commercial buildings. CAS04476-505 SA_0-350 -117.78427176 33.804365429 5 CAS04476-507 SA_0-350 -117.63776093 33.917348120 6 Behaind Prado Dam. This site is under a lake as of August 2005. See report AdamNickJesseCAS04476-509 SA_0-350 -117.88232534 33.693988431 6 Business Complex S06 CAS04476-511 SA_0-350 -117.65600479 33.735346083 3 looks like it could be a good site on Irvine Co land. See report classproject_F04 CAS04476-521 SA_0-350 -117.69632373 33.981691166 5 CAS04476-525 SA_0-350 -117.83005372 33.586573440 6 Dense Vegetation on Steep Slopes, Not Accessible. See report classproject_F04. CAS04476-528 SA_0-350 -117.71311322 33.874751021 2 *Pretty good access. Short hike through brush to river. Site not completely reconned. & river tCAS04476-529 SA_0-350 -117.72744856 33.787287452 3 Irvine Co land behind access gate/need ranger escort. See report classproject_F04 CAS04476-532 SA_0-350 -117.83168645 33.782829242 2 Sampled in pilot Su05; Use coordinates 33.78291; -11783181 CAS04476-541 SA_0-350 -117.87440713 33.788728920 4 [topo/aerial maps] Housing tract. Closest water is SA river (0.6 km away). Bad SA river point?CAS04476-542 SA_0-350 -117.86623701 33.591479092 6 Extreme brush, no trails and toxic water contaminents. See report classproject_F04. CAS04476-546 SA_0-350 -117.36571638 34.030739390 5 CAS04476-547 SA_0-350 -117.95260567 33.641561149 6 Only several inches of water outside of the low flow channel. See report classproject_F04; No CAS04476-548 SA_0-350 -117.51505591 34.089789138 4

Final Report – SWRCB No. 05-101-180-1 58
SITEID CATEGORY LONDD LATDD CRAM Status COMMENTS CAS04476-549 SA_0-350 -117.88128953 33.659148017 4 Extreme brush, no trails and toxic water contaminents. Must take beach access and w CAS04476-551 SA_0-350 -117.73152244 33.880385782 2 park at 22711 La Palma, run across street, down slope to river. *Coordinate is a little off but prCAS04476-557 SA_0-350 -117.73776401 33.673908362 5 CAS04476-558 SA_0-350 -117.53841869 33.871385516 4 CAS04476-561 SA_0-350 -117.64381218 33.917810695 5 CAS04476-564 SA_0-350 -117.65989281 33.744992957 2 perfect site; 241→Blackstar/Silverado Canyon F05 CAS04476-566 SA_0-350 -117.59857946 33.998699597 4 Concrete flood control channel. See report Team_Cucamanga. CAS04476-570 SA_0-350 -117.66499660 33.883281627 4 Chino Hills State Park; no recon F05 CAS04476-572 SA_0-350 -117.29098229 34.067553305 2 Good access, robust riparian habitat, good flow. Adjacent to golf course and gravel quarry. SeCAS04476-574 SA_0-350 -117.58788746 33.898427489 3 City property of Norco/Corona, near corner of Rincon and Corydon. See report classproject_F0CAS04476-584 SA_0-350 -117.55453788 33.881722731 3 concrete flood control channel (see report AdamNickJesse); viable CAS04476-585 SA_0-350 -117.73066223 33.720150942 6 *No water July 2005 CAS04476-589 SA_0-350 -117.83691391 33.814337243 6 Housing tract. No water within 1 km of site; S06 CAS04476-591 SA_0-350 -117.94375297 33.675447911 4 Only several inches of water outside of the low flow channel. See report classproject_F04 CAS04476-592 SA_0-350 -118.06939870 33.741132647 6 Salt marsh in wildlife refuge; Military Base. Brackish CAS04476-593 SA_0-350 -117.87577044 33.698357889 5 CAS04476-594 SA_0-350 -117.55380116 33.946127852 3 *May be able to acess via River Trails Stables on Hammer Rd. (909?) 736-9800. See report BCAS04476-595 SA_0-350 -117.65285168 33.883820975 4 Chino Hills State Park; no recon F05 CAS04476-599 SA_0-350 -117.85509235 33.600084156 4 Recheck. See report classproject_F04 CAS04476-601 SA_0-350 -117.58647797 34.026308397 4 CAS04476-602 SA_0-350 -117.72641659 33.654061133 6 Concrete lined channel; no water F05 CAS04476-604 SA_0-350 -117.46842760 33.774504872 3 See report AdamNickJesse. CAS04476-606 SA_0-350 -117.67778057 33.763873110 3 Irvine Co land behind access gate/need ranger escort. See report classproject_F04 CAS04476-608 SA_0-350 -117.64299815 33.902662802 3 Prado Dam Administration; 91→Serfas Club; no recon F05 CAS04476-610 SA_0-350 -117.67897014 33.759921231 3 Irvine Co land behind access gate/need ranger escort. See report classproject_F04 CAS04476-614 SA_0-350 -117.67183427 33.955283433 5 CAS04476-616 SA_0-350 -117.45083757 33.758179353 4 Not able to reach site. To many ubstructions CAS04476-633 SA_0-350 -118.01959647 33.871814837 4 Coyote Creek. See report classproject_F04 CAS04476-636 SA_0-350 -117.83222051 33.584439849 6 Dense Vegetation on Steep Slopes, Not Accessible. See report classproject_F04. CAS04476-637 SA_0-350 -117.32712544 34.100152983 4 concrete flood control channel CAS04476-639 SA_0-350 -117.59854344 33.992782607 4 CAS04476-640 SA_0-350 -117.62972998 33.895802851 3 Prado Dam Administration; 91→Serfas Club; no recon F05 CAS04476-645 SA_0-350 -117.54087506 34.048317510 4 Concrete flood control channel. See report Team_Cucamanga. CAS04476-647 SA_0-350 -117.40207568 33.901846317 5 CAS04476-652 SA_0-350 -117.68652561 33.876349208 5 CAS04476-658 SA_0-350 -117.86004100 33.650894069 6 *Black sediment, unsafe (sticky waist high mud), across from UCI. July 2005
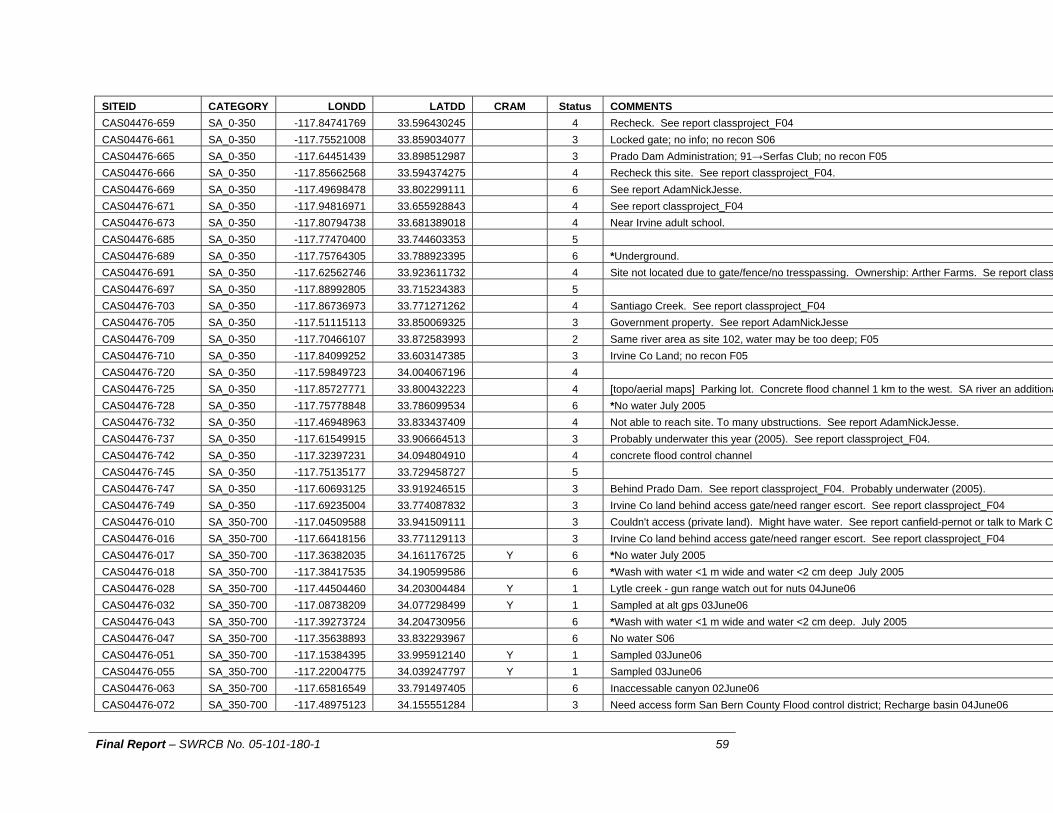
Final Report – SWRCB No. 05-101-180-1 59
SITEID CATEGORY LONDD LATDD CRAM Status COMMENTS CAS04476-659 SA_0-350 -117.84741769 33.596430245 4 Recheck. See report classproject_F04 CAS04476-661 SA_0-350 -117.75521008 33.859034077 3 Locked gate; no info; no recon S06 CAS04476-665 SA_0-350 -117.64451439 33.898512987 3 Prado Dam Administration; 91→Serfas Club; no recon F05 CAS04476-666 SA_0-350 -117.85662568 33.594374275 4 Recheck this site. See report classproject_F04. CAS04476-669 SA_0-350 -117.49698478 33.802299111 6 See report AdamNickJesse. CAS04476-671 SA_0-350 -117.94816971 33.655928843 4 See report classproject_F04 CAS04476-673 SA_0-350 -117.80794738 33.681389018 4 Near Irvine adult school. CAS04476-685 SA_0-350 -117.77470400 33.744603353 5 CAS04476-689 SA_0-350 -117.75764305 33.788923395 6 *Underground. CAS04476-691 SA_0-350 -117.62562746 33.923611732 4 Site not located due to gate/fence/no tresspassing. Ownership: Arther Farms. Se report classCAS04476-697 SA_0-350 -117.88992805 33.715234383 5 CAS04476-703 SA_0-350 -117.86736973 33.771271262 4 Santiago Creek. See report classproject_F04 CAS04476-705 SA_0-350 -117.51115113 33.850069325 3 Government property. See report AdamNickJesse CAS04476-709 SA_0-350 -117.70466107 33.872583993 2 Same river area as site 102, water may be too deep; F05 CAS04476-710 SA_0-350 -117.84099252 33.603147385 3 Irvine Co Land; no recon F05 CAS04476-720 SA_0-350 -117.59849723 34.004067196 4 CAS04476-725 SA_0-350 -117.85727771 33.800432223 4 [topo/aerial maps] Parking lot. Concrete flood channel 1 km to the west. SA river an additionaCAS04476-728 SA_0-350 -117.75778848 33.786099534 6 *No water July 2005 CAS04476-732 SA_0-350 -117.46948963 33.833437409 4 Not able to reach site. To many ubstructions. See report AdamNickJesse. CAS04476-737 SA_0-350 -117.61549915 33.906664513 3 Probably underwater this year (2005). See report classproject_F04. CAS04476-742 SA_0-350 -117.32397231 34.094804910 4 concrete flood control channel CAS04476-745 SA_0-350 -117.75135177 33.729458727 5 CAS04476-747 SA_0-350 -117.60693125 33.919246515 3 Behind Prado Dam. See report classproject_F04. Probably underwater (2005). CAS04476-749 SA_0-350 -117.69235004 33.774087832 3 Irvine Co land behind access gate/need ranger escort. See report classproject_F04 CAS04476-010 SA_350-700 -117.04509588 33.941509111 3 Couldn't access (private land). Might have water. See report canfield-pernot or talk to Mark CaCAS04476-016 SA_350-700 -117.66418156 33.771129113 3 Irvine Co land behind access gate/need ranger escort. See report classproject_F04 CAS04476-017 SA_350-700 -117.36382035 34.161176725 Y 6 *No water July 2005 CAS04476-018 SA_350-700 -117.38417535 34.190599586 6 *Wash with water <1 m wide and water <2 cm deep July 2005 CAS04476-028 SA_350-700 -117.44504460 34.203004484 Y 1 Lytle creek - gun range watch out for nuts 04June06 CAS04476-032 SA_350-700 -117.08738209 34.077298499 Y 1 Sampled at alt gps 03June06 CAS04476-043 SA_350-700 -117.39273724 34.204730956 6 *Wash with water <1 m wide and water <2 cm deep. July 2005 CAS04476-047 SA_350-700 -117.35638893 33.832293967 6 No water S06 CAS04476-051 SA_350-700 -117.15384395 33.995912140 Y 1 Sampled 03June06 CAS04476-055 SA_350-700 -117.22004775 34.039247797 Y 1 Sampled 03June06 CAS04476-063 SA_350-700 -117.65816549 33.791497405 6 Inaccessable canyon 02June06 CAS04476-072 SA_350-700 -117.48975123 34.155551284 3 Need access form San Bern County Flood control district; Recharge basin 04June06

Final Report – SWRCB No. 05-101-180-1 60
SITEID CATEGORY LONDD LATDD CRAM Status COMMENTS CAS04476-076 SA_350-700 -117.17499265 34.087894709 2 Sampled in pilot Su05; Use coordinates 34.08684; -117.17420 CAS04476-079 SA_350-700 -117.40595247 34.219556993 Y 1 Sampled 04 June 06; Alt GPS CAS04476-085 SA_350-700 -117.23309791 34.049964960 Y 1 Sampled 04 June 06 CAS04476-086 SA_350-700 -117.61211764 34.109363630 4 CAS04476-092 SA_350-700 -117.06248263 33.954342058 3 No apparent water from our upstream location. This wash intersects a stream in the area of thiCAS04476-094 SA_350-700 -117.38508074 34.163531461 2 15→Sierra Ave (Right)→Riverside Ave. (Left)→Cedar (Right); May not be the best way to get tCAS04476-114 SA_350-700 -117.18422203 34.153799757 2 Stream runs through ravine along a dirt bank with trees and brush. Tough access. See report CAS04476-115 SA_350-700 -117.28632829 33.833090576 6 No water S06 CAS04476-117 SA_350-700 -117.16750191 34.086085425 2 From site 076 hike ~1/2 mile upstream to site 117. See report MasonGroup. CAS04476-121 SA_350-700 -117.19110260 34.123678563 3 No Parking on Boulder, easier access from Baseline road. No trespassing, San Bernadino FlooCAS04476-132 SA_350-700 -117.06110899 33.951177569 3 No apparent water from our upstream location. This wash intersects a stream in the area of thiCAS04476-133 SA_350-700 -117.35550343 34.169772278 6 *No water July 2005 CAS04476-138 SA_350-700 -117.55760532 34.160062607 2 210→Haven Ave (Right)→Paddock (Right)→Ranch (Right); gated community, may need permCAS04476-144 SA_350-700 -117.13546159 34.130445747 6 Could no access site. Housing development in the way. See report MasonGroup and SatphotoCAS04476-146 SA_350-700 -117.05127352 33.944266716 3 Might have water. See report canfield-pernot. CAS04476-162 SA_350-700 -117.41241589 33.730483552 4 See report AdamNickJesse. CAS04476-164 SA_350-700 -117.37959239 34.165012765 6 Inaccessable 02June06 CAS04476-167 SA_350-700 -117.18078851 34.163342944 2 *Very steep cliff. With backpacks and a long hike, might be able to access from site 274. 7-23-CAS04476-176 SA_350-700 -117.03741213 33.940253482 6 Access from site 045, very long hike. Looks to be a dry wash, not viable site. Dry. See report cCAS04476-193 SA_350-700 -117.65418548 33.797585194 6 Inaccessable canyon 02June06 CAS04476-194 SA_350-700 -117.55522309 33.785793306 6 Inaccessable canyon CAS04476-199 SA_350-700 -117.48848055 34.153248524 3 Gated area; no info; no recon F05 CAS04476-207 SA_350-700 -117.09273715 33.974684320 5 CAS04476-208 SA_350-700 -117.16340011 34.001034402 5 CAS04476-209 SA_350-700 -117.34232662 34.130677099 6 No water F05 CAS04476-216 SA_350-700 -117.68537906 33.822589539 5 CAS04476-222 SA_350-700 -117.24803045 34.195857096 3 *Campus Crusade property. 7-23-05 CAS04476-226 SA_350-700 -117.26331337 34.181432061 3 *Campus Crusade property. 7-23-05 CAS04476-227 SA_350-700 -117.69968614 33.813745717 5 CAS04476-230 SA_350-700 -117.12723060 34.102805615 6 This is not a stream site. The only water nearby is a reservoir. See report MasonGroup. CAS04476-236 SA_350-700 -117.42842144 33.745137792 6 No water S06 CAS04476-238 SA_350-700 -117.12926364 34.003375887 6 See report canfield-pernot. CAS04476-244 SA_350-700 -117.55217738 33.790996764 5 CAS04476-246 SA_350-700 -117.40713804 34.170676249 5 CAS04476-249 SA_350-700 -117.37496831 34.157171946 3 El Rancho Verde Golf Course (909-875-5346); no recon F05 CAS04476-253 SA_350-700 -117.65348093 33.801898026 3 Irvine Co land behind access gate/need ranger escort. See report classproject_F04

Final Report – SWRCB No. 05-101-180-1 61
SITEID CATEGORY LONDD LATDD CRAM Status COMMENTS CAS04476-255 SA_350-700 -117.08851727 34.020235199 6 poor sample site. See report canfield-pernot. CAS04476-258 SA_350-700 -117.17831086 34.014294990 5 CAS04476-259 SA_350-700 -117.09261683 34.077116721 4 See report MasonGroup. CAS04476-274 SA_350-700 -117.18292428 34.173193227 2 *Steep trail to creek. We can do this with backpacks 7-23-05 CAS04476-277 SA_350-700 -117.25451658 34.190055065 3 *Campus Crusade property. 7-23-05 CAS04476-283 SA_350-700 -117.33724910 34.125922204 6 No water F05 CAS04476-292 SA_350-700 -117.69772238 33.809533920 5 CAS04476-295 SA_350-700 -117.67711765 33.827399704 5 CAS04476-298 SA_350-700 -117.37891493 34.160336939 3 El Rancho Verde Golf Course (909-875-5346); no recon F05 CAS04476-300 SA_350-700 -117.56526064 34.163575385 4 CAS04476-316 SA_350-700 -117.38433372 34.184089575 6 No site F05 CAS04476-318 SA_350-700 -117.50667446 34.118490457 6 No water. No wash present, W. Liberty and S. Heritage CAS04476-319 SA_350-700 -117.15514477 34.086090378 6 No water. See report MasonGroup. CAS04476-321 SA_350-700 -117.43183022 34.190542662 3 Drive up Lytle Creek Rd, right turn at Glen Helen Pkwy. See report Guarino. Glen Helen RegioCAS04476-326 SA_350-700 -117.23785771 34.155372386 5 CAS04476-327 SA_350-700 -117.42639228 34.233250273 5 CAS04476-328 SA_350-700 -117.36373232 34.145587796 6 No water; Housing tract F05 CAS04476-332 SA_350-700 -117.31706557 33.836728215 5 CAS04476-350 SA_350-700 -117.53679848 33.800950225 6 Eagle Glen Golf Course S06 CAS04476-352 SA_350-700 -117.20087791 34.107790157 4 Original GPS#'s were right but the stream is diverted (400ft W.) due to constuction. See reportCAS04476-353 SA_350-700 -117.50306425 34.126209631 6 Concrete lined channel; no water F05 CAS04476-355 SA_350-700 -117.36601832 34.147882865 6 No water; Housing tract F05 CAS04476-366 SA_350-700 -117.14899168 33.991655513 5 CAS04476-374 SA_350-700 -117.29087090 33.824011978 5 CAS04476-387 SA_350-700 -117.16493828 34.004547466 5 CAS04476-396 SA_350-700 -117.43232478 34.236030809 5 CAS04476-398 SA_350-700 -117.18865121 34.136438227 3 This site is located near the East Valley Water District. I think this is psycho-dog site. See repoCAS04476-414 SA_350-700 -117.37669335 34.168123917 3 El Rancho Verde Golf Course (909-875-5346); no recon F05 CAS04476-421 SA_350-700 -117.20655735 34.102835490 3 Conservation Area (Santa Ana Woolly Star - 25.000$ fine). Need permission. See report MasoCAS04476-430 SA_350-700 -117.10783615 34.049390634 6 paved over; crafton community college. See report canfield-pernot. CAS04476-443 SA_350-700 -117.54977539 34.146993005 6 Dry wash; F05 CAS04476-444 SA_350-700 -117.64877893 33.783323987 3 Irvine Co land behind access gate/need ranger escort. See report classproject_F04 CAS04476-466 SA_350-700 -117.08511734 33.961256600 5 CAS04476-469 SA_350-700 -117.14588031 34.110798614 4 Access site from Greenspot Road, go L on Alta Vista, R on Santa Ana Canyon (in subur CAS04476-479 SA_350-700 -117.07923472 34.030951950 6 poor sample site. See report canfield-pernot. CAS04476-502 SA_350-700 -117.56472171 34.133026675 4
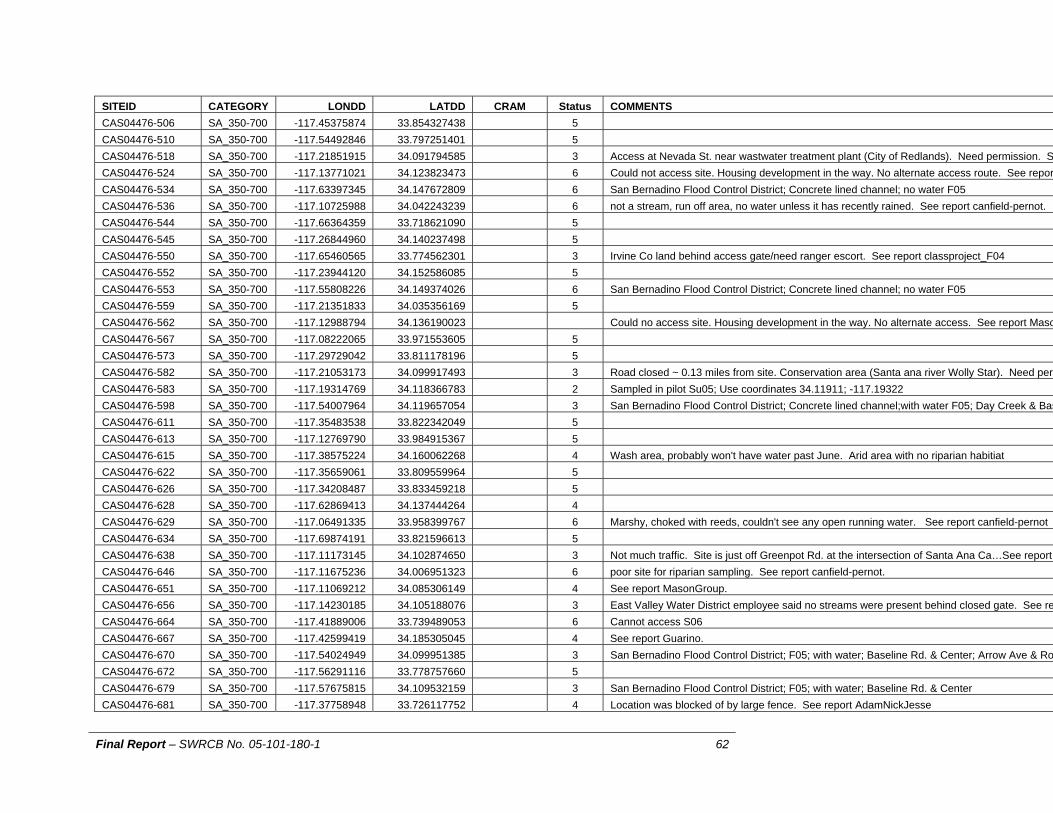
Final Report – SWRCB No. 05-101-180-1 62
SITEID CATEGORY LONDD LATDD CRAM Status COMMENTS CAS04476-506 SA_350-700 -117.45375874 33.854327438 5 CAS04476-510 SA_350-700 -117.54492846 33.797251401 5 CAS04476-518 SA_350-700 -117.21851915 34.091794585 3 Access at Nevada St. near wastwater treatment plant (City of Redlands). Need permission. SCAS04476-524 SA_350-700 -117.13771021 34.123823473 6 Could not access site. Housing development in the way. No alternate access route. See reporCAS04476-534 SA_350-700 -117.63397345 34.147672809 6 San Bernadino Flood Control District; Concrete lined channel; no water F05 CAS04476-536 SA_350-700 -117.10725988 34.042243239 6 not a stream, run off area, no water unless it has recently rained. See report canfield-pernot. CAS04476-544 SA_350-700 -117.66364359 33.718621090 5 CAS04476-545 SA_350-700 -117.26844960 34.140237498 5 CAS04476-550 SA_350-700 -117.65460565 33.774562301 3 Irvine Co land behind access gate/need ranger escort. See report classproject_F04 CAS04476-552 SA_350-700 -117.23944120 34.152586085 5 CAS04476-553 SA_350-700 -117.55808226 34.149374026 6 San Bernadino Flood Control District; Concrete lined channel; no water F05 CAS04476-559 SA_350-700 -117.21351833 34.035356169 5 CAS04476-562 SA_350-700 -117.12988794 34.136190023 Could no access site. Housing development in the way. No alternate access. See report MasoCAS04476-567 SA_350-700 -117.08222065 33.971553605 5 CAS04476-573 SA_350-700 -117.29729042 33.811178196 5 CAS04476-582 SA_350-700 -117.21053173 34.099917493 3 Road closed ~ 0.13 miles from site. Conservation area (Santa ana river Wolly Star). Need perCAS04476-583 SA_350-700 -117.19314769 34.118366783 2 Sampled in pilot Su05; Use coordinates 34.11911; -117.19322 CAS04476-598 SA_350-700 -117.54007964 34.119657054 3 San Bernadino Flood Control District; Concrete lined channel;with water F05; Day Creek & BasCAS04476-611 SA_350-700 -117.35483538 33.822342049 5 CAS04476-613 SA_350-700 -117.12769790 33.984915367 5 CAS04476-615 SA_350-700 -117.38575224 34.160062268 4 Wash area, probably won't have water past June. Arid area with no riparian habitiat CAS04476-622 SA_350-700 -117.35659061 33.809559964 5 CAS04476-626 SA_350-700 -117.34208487 33.833459218 5 CAS04476-628 SA_350-700 -117.62869413 34.137444264 4 CAS04476-629 SA_350-700 -117.06491335 33.958399767 6 Marshy, choked with reeds, couldn't see any open running water. See report canfield-pernot CAS04476-634 SA_350-700 -117.69874191 33.821596613 5 CAS04476-638 SA_350-700 -117.11173145 34.102874650 3 Not much traffic. Site is just off Greenpot Rd. at the intersection of Santa Ana Ca…See report CAS04476-646 SA_350-700 -117.11675236 34.006951323 6 poor site for riparian sampling. See report canfield-pernot. CAS04476-651 SA_350-700 -117.11069212 34.085306149 4 See report MasonGroup. CAS04476-656 SA_350-700 -117.14230185 34.105188076 3 East Valley Water District employee said no streams were present behind closed gate. See reCAS04476-664 SA_350-700 -117.41889006 33.739489053 6 Cannot access S06 CAS04476-667 SA_350-700 -117.42599419 34.185305045 4 See report Guarino. CAS04476-670 SA_350-700 -117.54024949 34.099951385 3 San Bernadino Flood Control District; F05; with water; Baseline Rd. & Center; Arrow Ave & RoCAS04476-672 SA_350-700 -117.56291116 33.778757660 5 CAS04476-679 SA_350-700 -117.57675815 34.109532159 3 San Bernadino Flood Control District; F05; with water; Baseline Rd. & Center CAS04476-681 SA_350-700 -117.37758948 33.726117752 4 Location was blocked of by large fence. See report AdamNickJesse

Final Report – SWRCB No. 05-101-180-1 63
SITEID CATEGORY LONDD LATDD CRAM Status COMMENTS CAS04476-683 SA_350-700 -117.56719874 34.126332558 4 CAS04476-696 SA_350-700 -117.64618897 33.745433501 4 awesome site right near turn off See report classproject_F04 CAS04476-708 SA_350-700 -117.35856255 34.166958142 6 *No water July 2005 CAS04476-717 SA_350-700 -117.18557478 34.102876746 4 Escort required. Near the intersection of Boulder and Orange. See report MasonGroup. CAS04476-738 SA_350-700 -117.58080582 34.100906036 6 No site; House; F05 CAS04476-743 SA_350-700 -117.32534276 33.836098157 5 CAS04476-744 SA_350-700 -117.26625089 34.173446907 3 *Campus Crusade property. 7-23-05 CAS04476-002 SA_700+ -117.06210253 34.144227205 Y 2 Access is via a dirt SUV/4X4 truck trial. See report MasonGroup. CAS04476-007 SA_700+ -116.96380672 34.094982144 Y 2 38→Vista Point; F05 CAS04476-009 SA_700+ -116.92728578 34.024254849 6 Neighbors informed us that daily civil was re-enactments occur here. Additionally, landowner aCAS04476-014 SA_700+ -117.62619063 34.183644702 Y 2 Cucamonga Canyon Day use area. See report Team_Cucamanga. CAS04476-022 SA_700+ -116.87148271 34.158421091 Y 6 *Access (Y); Water (y); Width (<1 m); Cell Servcice (N). Heavy Vegetation CAS04476-024 SA_700+ -116.97149836 34.270353360 6 *No water August 2005 See BigBear_RiversideReconn. CAS04476-025 SA_700+ -116.98365700 34.173217837 6 4wd required; Seven Oaks Rd. F05; no recon; Did not locate; private property, no information 1CAS04476-027 SA_700+ -117.47032066 34.306522607 Y 2 Off hwy 15 Cajon wash area. See report classproject_F04 CAS04476-034 SA_700+ -116.93008031 34.089394000 Y 2 Valley of the Falls; F05; Check in at Mortenson Hall (S06), will allow us access. CAS04476-035 SA_700+ -116.87489914 34.077479169 Y 2 Forest adventure pass; no recon; F05; 1.5km hike from parking in Falls day use area CAS04476-041 SA_700+ -117.45881358 34.295482569 2 Off hwy 15 Cajon wash area; Sampled in pilot Su05; Use coordinates 34.29606; -117.45789 CAS04476-044 SA_700+ -116.88597440 34.251884753 4 site located across field behind shopping center, field possibly soon to be developed. See repoCAS04476-045 SA_700+ -117.01100719 33.941822452 6 Dry wash. See report canfield-pernot. CAS04476-050 SA_700+ -116.79313821 34.156260800 3 On USFS correctional facility, Need permission to access. See report King. CAS04476-053 SA_700+ -116.96961406 34.168487611 4 4wd required; Seven Oaks Rd. F05; no recon CAS04476-057 SA_700+ -117.54807500 34.250969323 4 4wd recommended; 15→Sierra Ave (north)→Middle Fork Rd (left); no recon; upstream of 069 CAS04476-061 SA_700+ -116.89869514 34.133646395 5 CAS04476-062 SA_700+ -117.45607871 34.211291766 2 15→Sierra Ave/Lytle Creek Rd CAS04476-064 SA_700+ -116.85102849 34.076769126 5 CAS04476-065 SA_700+ -116.90646360 34.095559787 4 Forest adventure pass; no recon; F05 CAS04476-067 SA_700+ -117.04563130 34.143509392 4 Access is via a dirt SUV/4X4 truck trial. See report MasonGroup. CAS04476-068 SA_700+ -117.64659571 34.272031026 5 CAS04476-069 SA_700+ -117.51336610 34.247280852 2 15→Sierra Ave (north)→Middle Fork Rd (left); 4wd recommended;S06 CAS04476-073 SA_700+ -117.11919677 34.172023144 4 Tough access. See report MasonGroup and aerial/topo maps. CAS04476-074 SA_700+ -116.88367563 34.087671859 4 Forest adventure pass; no recon; F05 CAS04476-075 SA_700+ -117.05126295 34.160705056 4 Access is via a dirt SUV/4X4 truck trial. See report MasonGroup. CAS04476-080 SA_700+ -116.88341637 34.150702356 6 *Access (Y); Water (N); Width (?); Cell Servcice (N). Off of Forsee Creek trail CAS04476-083 SA_700+ -117.18172004 34.213177636 6 This site is not accessible by roads or hiking trials that we could find. See report MasonGroup.CAS04476-084 SA_700+ -117.63465530 34.263212356 5

Final Report – SWRCB No. 05-101-180-1 64
SITEID CATEGORY LONDD LATDD CRAM Status COMMENTS CAS04476-087 SA_700+ -116.80899232 34.162933287 3 *Access (Y); Water (y); Width (1-3 m); Cell Servcice (N). May be correctional facility property, CAS04476-088 SA_700+ -117.55276240 34.204666843 5 CAS04476-093 SA_700+ -116.88312457 34.168940029 2 *Access (Y); Water (y); Width (1-2 m); Cell Servcice (N). Barton Flats Road off of Jenks Lake RCAS04476-097 SA_700+ -116.96341929 34.065988343 3 dp says a spring feeds the lower section o this stream and it has water year round. See reportCAS04476-100 SA_700+ -116.93768278 34.226941391 5 CAS04476-103 SA_700+ -116.97502510 34.063052985 4 Area surrounded by grass road sides. Sample was taken here. Mayflies, small grubs, CAS04476-105 SA_700+ -117.49262017 34.252726286 6 No water; S06 CAS04476-106 SA_700+ -116.89198883 34.149204108 2 *Access (Y); Water (?); Width (?); Cell Servcice (N). Initially did not locate site, however, waterCAS04476-112 SA_700+ -117.46857001 34.261404860 5 CAS04476-118 SA_700+ -117.48174507 34.283653366 5 CAS04476-124 SA_700+ -117.07694005 34.127623398 6 No access found to this site. No roads or trails. See report MasonGroup. CAS04476-126 SA_700+ -116.89422285 34.174274525 2 *Access (Y); Water (y); Width (3-5 m); Cell Servcice (N). On Glass Road; Sampled n pilot Su0CAS04476-127 SA_700+ -117.57169450 34.173434996 4 CAS04476-128 SA_700+ -117.25102705 34.204878368 4 Gated area. Might be dirt roads to these sites. The area is part of San Bernardino CAS04476-131 SA_700+ -116.97463363 34.185592446 5 CAS04476-148 SA_700+ -116.80569735 34.222622649 5 CAS04476-156 SA_700+ -117.13321631 34.152483830 4 Tough access. See report MasonGroup and aerial/topo maps. CAS04476-158 SA_700+ -117.25644457 34.210028426 4 Gated area. Might be dirt roads to these sites. The area is part of San Bernardino CAS04476-161 SA_700+ -117.56533529 34.252833674 5 CAS04476-168 SA_700+ -116.84719627 34.178877627 2 *Access (Y); Water (y); Width (3-8 m); Cell Servcice (N). Across street from South Fork CampgCAS04476-174 SA_700+ -117.55002626 34.289306964 4 Paved road ends at Lytle Creek Firing Range. Inaccessable with low clearance vehicle. ProbaCAS04476-181 SA_700+ -117.25552157 34.210648364 5 CAS04476-184 SA_700+ -117.01389579 34.164730048 5 CAS04476-185 SA_700+ -117.55534566 34.207824684 5 CAS04476-192 SA_700+ -117.54357715 34.194402730 5 CAS04476-202 SA_700+ -116.88737915 34.094754480 4 Forest adventure pass; no recon; F05 CAS04476-203 SA_700+ -116.91927125 34.187306943 2 Seven Oaks Rd; F05 CAS04476-205 SA_700+ -117.45409621 34.206219556 2 15→Sierra Ave (Right) S06 CAS04476-217 SA_700+ -117.13358103 34.163362120 4 Tough access. See report MasonGroup and aerial/topo maps. CAS04476-219 SA_700+ -116.98658846 34.113040115 3 Religious retreat; no recon F05 CAS04476-221 SA_700+ -116.88977895 34.299483681 6 *No water August 2005 See BigBear_RiversideReconn. CAS04476-224 SA_700+ -116.84479496 34.094888983 5 CAS04476-225 SA_700+ -117.13315916 34.147138497 4 Tough access. See report MasonGroup and aerial/topo maps. CAS04476-232 SA_700+ -117.19963879 34.213985520 6 This site is not accessible by roads or hiking trials that we could find. See report MasonGroup.CAS04476-233 SA_700+ -117.46551605 34.269633189 5 CAS04476-240 SA_700+ -117.08667617 34.167550520 4 Access is via a dirt SUV/4X4 truck trial. See report MasonGroup.

Final Report – SWRCB No. 05-101-180-1 65
SITEID CATEGORY LONDD LATDD CRAM Status COMMENTS CAS04476-245 SA_700+ -117.03983027 34.144556360 4 Access is via a dirt SUV/4X4 truck trial. See report MasonGroup. CAS04476-247 SA_700+ -117.18275674 34.187722785 3 *This is one of the City Creek sites we reconned, just past the Forest Service station. Need peCAS04476-248 SA_700+ -116.80596977 34.253510250 6 GPS location in middle of field, no stream could be found. See report King CAS04476-250 SA_700+ -117.50305917 34.232646583 5 CAS04476-251 SA_700+ -116.93386841 34.232477261 5 CAS04476-252 SA_700+ -116.89050988 34.135897017 5 CAS04476-254 SA_700+ -116.98350932 34.174708164 4 4wd required; no recon; S06 CAS04476-264 SA_700+ -116.79951301 34.215357610 5 CAS04476-266 SA_700+ -117.00037244 34.226462739 5 CAS04476-271 SA_700+ -117.47315398 34.230050206 2 Alt GPS ~ 34.22911 N, -117.47414 W; S06 CAS04476-272 SA_700+ -116.91351594 34.087758788 2 Valley of the Falls; F05 CAS04476-276 SA_700+ -116.87325758 34.113683437 5 CAS04476-282 SA_700+ -117.16320573 34.202994755 6 This site is not accessible by roads or hiking trials that we could find. See report MasonGroup.CAS04476-284 SA_700+ -117.07144170 34.156719185 4 Access is via a dirt SUV/4X4 truck trial. See report MasonGroup. CAS04476-289 SA_700+ -117.45338167 34.286105327 6 Less than 150 m long & 1 m wide; S06 CAS04476-296 SA_700+ -116.97496591 34.164792321 4 4wd required; Seven Oaks Rd. F05; no recon CAS04476-301 SA_700+ -116.87607633 34.286860131 6 *No water August 2005 See BigBear_RiversideReconn. CAS04476-302 SA_700+ -117.56202199 34.292494801 4 See report Guarino. CAS04476-304 SA_700+ -117.14980719 34.184519465 6 *Bad access; extremely steep slope, unsafe condition CAS04476-309 SA_700+ -117.45251679 34.270518072 2 15N→Cleghorn (left)→Cajon Rd→Swarthout (left)→Dirt Parking on left CAS04476-317 SA_700+ -117.37228714 34.236827881 5 CAS04476-329 SA_700+ -117.00232529 34.047711504 2 Area surrounded by grass road sides. Sample was taken here. Mayflies, small grubs, CAS04476-333 SA_700+ -116.86494298 34.076697831 4 Forest adventure pass; no recon; F05 CAS04476-334 SA_700+ -116.87714953 34.183026198 2 *Access (Y); Water (y); Width (5-8 m); Cell Servcice (N). Across street from South Fork CampgCAS04476-335 SA_700+ -116.97944159 34.053338399 3 not long enough due to physical barriers (man made), good stream, area very altered. See repCAS04476-344 SA_700+ -116.81249470 34.167080345 6 *Access (Y); Water (N); Width (1-3); Cell Servcice (N). May have water in earlier months. F05 CAS04476-345 SA_700+ -117.06221856 34.077614289 6 No water F05 CAS04476-346 SA_700+ -117.49748156 34.234610240 6 Dry wash; S06 CAS04476-348 SA_700+ -117.19286770 34.192986436 6 This site is not accessible by roads or hiking trials that we could find. See report MasonGroup.CAS04476-349 SA_700+ -116.84446924 34.136866552 5 CAS04476-357 SA_700+ -116.97633379 34.052865213 3 park on side of road "Potato Canyon" and walk down dirt road to right. See repot canfield-pernoCAS04476-358 SA_700+ -117.06896428 34.152038460 4 Access is via a dirt SUV/4X4 truck trial. See report MasonGroup. CAS04476-359 SA_700+ -116.87808557 34.139896308 5 CAS04476-362 SA_700+ -117.49781401 34.238745931 6 Dry wash; S06 CAS04476-370 SA_700+ -117.02320237 34.100128875 4 unable to get down slope to stream, trail leads down, should be able to get to site. See report CAS04476-371 SA_700+ -116.95391171 34.046292732 5

Final Report – SWRCB No. 05-101-180-1 66
SITEID CATEGORY LONDD LATDD CRAM Status COMMENTS CAS04476-372 SA_700+ -117.00740866 34.161577871 4 4wd required; Seven Oaks Rd. F05; no recon CAS04476-376 SA_700+ -116.82663306 34.170317911 2 *Access (Y); Water (y); Width (3-5 m); Cell Servcice (N). In South Fork Campground; SampledCAS04476-377 SA_700+ -117.07302448 34.158367434 4 Access is via a dirt SUV/4X4 truck trial. See report MasonGroup. CAS04476-380 SA_700+ -116.88019068 34.165881857 2 *Access (N); Water (Y); Width (1-2); Cell Servcice (N). Access extremely restricted. Either steCAS04476-382 SA_700+ -117.51687281 34.267436958 4 ~15m from car to site. Hiked down small wash from road to site. See report Guarino. CAS04476-385 SA_700+ -116.96977180 34.239164363 6 *No water August 2005 See BigBear_RiversideReconn. CAS04476-388 SA_700+ -116.88403117 34.105241104 5 CAS04476-389 SA_700+ -117.13213526 34.164314179 4 Tough access. See report MasonGroup and aerial/topo maps. CAS04476-390 SA_700+ -116.78646466 34.140210900 5 CAS04476-397 SA_700+ -116.79825378 34.179724042 5 CAS04476-399 SA_700+ -116.87066625 34.285392379 6 *No water August 2005 See BigBear_RiversideReconn. CAS04476-401 SA_700+ -116.85592412 34.078062164 4 Forest adventure pass; no recon; F05 CAS04476-402 SA_700+ -116.80223448 34.235978139 3 Site supposed to be directly off road but could not be located. See report King. Private properCAS04476-407 SA_700+ -116.79796898 34.160730746 3 Road to access site leads to correctional facility (Camp Heart Bar). See report King. CAS04476-408 SA_700+ -117.19653595 34.199413427 4 This site is not accessible by roads or hiking trials that we could find. This site CAS04476-415 SA_700+ -117.06464644 34.075453513 6 No access F05 CAS04476-416 SA_700+ -117.63080726 34.173737765 5 CAS04476-417 SA_700+ -116.99387449 34.168628401 4 4wd required; Seven Oaks Rd. F05; no recon CAS04476-424 SA_700+ -117.51718920 34.193090486 5 CAS04476-425 SA_700+ -117.17439371 34.187958721 4 Site is straight down from the turnout to the stream - off Hwy 330. Tough access. See report MCAS04476-427 SA_700+ -116.88240841 34.289630678 6 *No water August 2005 See BigBear_RiversideReconn. CAS04476-431 SA_700+ -116.77971087 34.119948177 5 CAS04476-433 SA_700+ -116.77862554 34.131926207 5 CAS04476-434 SA_700+ -116.96983776 34.240215268 6 *No water August 2005 See BigBear_RiversideReconn. CAS04476-435 SA_700+ -116.78817393 34.155281907 4 *Access (Limited); Water (y); Width (0.5-2 m); Cell Servcice (N). Heavy Vegetation; low water CAS04476-436 SA_700+ -117.01051986 34.176437260 5 CAS04476-438 SA_700+ -116.77822295 34.167029090 6 *Access (Limited); Water (y); Width (<1 m); Cell Servcice (N). Heavy Vegetation CAS04476-445 SA_700+ -116.93402578 34.165429458 2 Call ahead to make sure gate is open (909) 794-2911; 7th Day Adventist Camp Cedar Falls. CCAS04476-446 SA_700+ -117.18467771 34.185554414 3 *This is one of the City Creek sites we reconned, just past the Forest Service station. Need peCAS04476-447 SA_700+ -117.37074527 34.230470936 5 CAS04476-448 SA_700+ -116.94653112 34.182093547 5 CAS04476-449 SA_700+ -117.05280822 34.039140634 6 urban paved city housing track. See report canfield-pernot. CAS04476-452 SA_700+ -116.93746133 34.008165827 6 Neighbors informed us that daily civil was re-enactments occur here. Additionally, landowner aCAS04476-455 SA_700+ -117.17826507 34.198810740 6 This site is not accessible by roads or hiking trials that we could find. See report MasonGroup.CAS04476-458 SA_700+ -116.89462794 34.085716852 4 Forest adventure pass; no recon; F05 CAS04476-461 SA_700+ -116.88534717 34.085749318 4 Forest adventure pass; no recon; F05

Final Report – SWRCB No. 05-101-180-1 67
SITEID CATEGORY LONDD LATDD CRAM Status COMMENTS CAS04476-463 SA_700+ -117.17698422 34.192896935 6 This site is not accessible by roads or hiking trials that we could find. See report MasonGroup.CAS04476-464 SA_700+ -117.32914766 34.255724692 5 CAS04476-470 SA_700+ -116.92900363 34.156429727 6 No water F05 CAS04476-474 SA_700+ -117.62388138 34.247698211 5 CAS04476-476 SA_700+ -117.00006856 34.227416908 5 CAS04476-477 SA_700+ -116.90273975 34.113898756 5 CAS04476-478 SA_700+ -116.94550549 34.173583752 2 Seven Oaks Rd; F05; requires permission from unknown or new GPS coordinate CAS04476-482 SA_700+ -116.99029277 34.107282862 3 Religious retreat; no recon F05 CAS04476-483 SA_700+ -117.45662048 34.251143264 5 CAS04476-485 SA_700+ -117.63267847 34.270236849 5 CAS04476-488 SA_700+ -116.96920118 34.154049258 6 Steep slope, dense vegetation; cannot access S06 CAS04476-490 SA_700+ -116.80191506 34.140521005 5 CAS04476-492 SA_700+ -116.92702434 34.152633742 6 No water F05 CAS04476-499 SA_700+ -117.22713256 34.175154091 5 CAS04476-500 SA_700+ -117.47521085 34.279128255 5 CAS04476-501 SA_700+ -116.94243245 34.091894550 2 38→Valley of the Falls (Right)→Canyon (corner); F05 CAS04476-512 SA_700+ -117.01220494 34.173085053 5 CAS04476-517 SA_700+ -117.20297727 34.219136078 6 This site is not accessible by roads or hiking trials that we could find. See report MasonGroup.CAS04476-519 SA_700+ -116.80807482 34.152129611 5 CAS04476-523 SA_700+ -117.18476127 34.202649971 6 This site is not accessible by roads or hiking trials that we could find. See report MasonGroup.CAS04476-527 SA_700+ -117.51506755 34.266105603 4 6m from road. Viable site. No offroad parking, park on side of road. Traffic=1car/10. See reportCAS04476-530 SA_700+ -116.90612836 34.177999389 2 Walking distance from 126 CAS04476-531 SA_700+ -117.19700543 34.195872672 6 This site is not accessible by roads or hiking trials that we could find. See report MasonGroup.CAS04476-533 SA_700+ -117.04279582 34.087398091 4 Road will take you past sage scrub habitat but still need to walk over rocks. See report King. CAS04476-537 SA_700+ -116.84896798 34.148918245 5 CAS04476-538 SA_700+ -116.99195734 34.125067539 5 CAS04476-554 SA_700+ -117.19146182 34.217161245 6 This site is not accessible by roads or hiking trials that we could find. See report MasonGroup.CAS04476-555 SA_700+ -116.87534778 34.101143636 4 Forest adventure pass; no recon; F05 CAS04476-556 SA_700+ -117.57095306 34.254295925 5 CAS04476-560 SA_700+ -116.90550246 34.193909582 5 CAS04476-565 SA_700+ -117.20584249 34.201636790 6 This site is not accessible by roads or hiking trials that we could find. See report MasonGroup.CAS04476-569 SA_700+ -116.77867912 34.126192023 5 CAS04476-571 SA_700+ -117.04882778 34.164592089 4 Access is via a dirt SUV/4X4 truck trial. See report MasonGroup. CAS04476-575 SA_700+ -116.99336598 34.098622127 2 Old Mill Creek Rd→Cienega; F05 CAS04476-576 SA_700+ -117.20815336 34.209098955 6 This site is not accessible by roads or hiking trials that we could find. See report MasonGroup.CAS04476-577 SA_700+ -116.84300783 34.158370539 5

Final Report – SWRCB No. 05-101-180-1 68
SITEID CATEGORY LONDD LATDD CRAM Status COMMENTS CAS04476-579 SA_700+ -117.33209920 34.216286296 5 CAS04476-581 SA_700+ -117.04367007 34.169088346 4 Access is via a dirt SUV/4X4 truck trial. See report MasonGroup. CAS04476-588 SA_700+ -117.01185224 34.200629473 5 CAS04476-590 SA_700+ -116.83405733 34.172558457 2 *Access (Y); Water (y); Width (3-5 m); Cell Servcice (N). Across street from South Fork CampgCAS04476-596 SA_700+ -116.98209641 34.239709792 4 *Bear Creek just below Bear Lake. Very steep, difficult access. August 2005 See BigBear_RCAS04476-600 SA_700+ -117.48137939 34.231646284 2 Site is located at turnout on main Lytle Creek Road - Hike 0.15 miles from road. 1 Mile upstreaCAS04476-607 SA_700+ -116.86620096 34.182687774 2 *Access (Y); Water (y); Width (5-8 m); Cell Servcice (N). Across street from South Fork CampgCAS04476-617 SA_700+ -117.58318119 34.302538731 4 See report Guarino. CAS04476-618 SA_700+ -116.80664040 34.161238996 4 *Access (Y); Water (y); Width (1-3 m); Cell Servcice (N). May be correctional facility property, CAS04476-620 SA_700+ -117.57056718 34.215784697 5 CAS04476-621 SA_700+ -116.97168590 34.203631513 5 CAS04476-623 SA_700+ -116.84293299 34.126465514 5 CAS04476-627 SA_700+ -116.93968510 34.048672570 3 could be good sampling area at higher elevation (call DP). See report canfield-pernot. CAS04476-641 SA_700+ -116.90790071 34.091972403 4 Forest adventure pass; no recon; F05 CAS04476-642 SA_700+ -117.12585391 34.180123683 4 Tough access. See report MasonGroup and aerial/topo maps. CAS04476-648 SA_700+ -116.95755874 34.165472755 5 CAS04476-653 SA_700+ -117.52595118 34.272302722 2 ~15m from car to site. 2 boulders on side of road mark trail to site (See photo). See report GuaCAS04476-654 SA_700+ -116.84558187 34.088333257 5 CAS04476-660 SA_700+ -116.99146335 34.235420105 4 *Bear Creek just below Bear Lake. Very steep, difficult access. August 2005 See BigBear_RCAS04476-663 SA_700+ -117.57099807 34.182368336 4 CAS04476-668 SA_700+ -116.97040011 34.188968319 5 CAS04476-674 SA_700+ -117.16680164 34.195891817 6 This site is not accessible by roads or hiking trials that we could find. See report MasonGroup.CAS04476-675 SA_700+ -117.17691629 34.181659533 6 *Gated private property, very little water (<.3 m wide). July 2005 CAS04476-677 SA_700+ -117.20569085 34.205460983 6 This site is not accessible by roads or hiking trials that we could find. See report MasonGroup.CAS04476-684 SA_700+ -116.91269423 34.181830744 5 CAS04476-686 SA_700+ -116.88845419 34.169199506 2 *Access (Y); Water (y); Width (1-2 m); Cell Servcice (N). Barton Flats Road off of Jenks Lake RCAS04476-687 SA_700+ -117.14271851 34.167715386 4 Could not access original site by vehicle (need an SUV, truck, or 4-wheel drive). See report MCAS04476-692 SA_700+ -117.06382047 34.169851908 4 Access is via a dirt SUV/4X4 truck trial and we were driving a car which is why we d CAS04476-693 SA_700+ -117.51938960 34.303168280 5 CAS04476-694 SA_700+ -116.94292506 34.179946667 5 CAS04476-695 SA_700+ -117.01835988 34.097615179 4 can't get over mountain to stream CAS04476-698 SA_700+ -116.94289789 34.006061815 6 Neighbors informed us that daily civil was re-enactments occur here. Additionally, landowner aCAS04476-700 SA_700+ -116.89227476 34.148064280 2 *Access (Y); Water (?); Width (?); Cell Servcice (N). Initially did not locate site, however, waterCAS04476-702 SA_700+ -117.13419498 34.158917949 4 Tough access. See report MasonGroup and aerial/topo maps. CAS04476-704 SA_700+ -117.15664061 34.213837540 6 This site is not accessible by roads or hiking trials that we could find. See report MasonGroup.CAS04476-706 SA_700+ -117.54548478 34.199318542 5

Final Report – SWRCB No. 05-101-180-1 69
SITEID CATEGORY LONDD LATDD CRAM Status COMMENTS CAS04476-707 SA_700+ -117.37259278 34.240893793 5 CAS04476-711 SA_700+ -116.98150111 34.181573651 5 CAS04476-712 SA_700+ -116.92681052 34.180224793 2 Seven Oaks Rd; F05 CAS04476-713 SA_700+ -117.63098885 34.249199816 2 Sampled in pilot Su05; Use coordinates 34.24960; -117.63424 CAS04476-716 SA_700+ -117.24962305 34.201098451 4 Gated area. Might be dirt roads to these sites. The area is part of San Bernardino CAS04476-719 SA_700+ -116.93638220 34.222364089 5 CAS04476-721 SA_700+ -116.94855231 34.269782716 2 *Grout Creek. Created alt. site 60m from original because original had no H2O. N34.26924 WCAS04476-722 SA_700+ -117.05898607 34.152385879 4 Access is via a dirt SUV/4X4 truck trial. See report MasonGroup. CAS04476-723 SA_700+ -116.99771180 34.161269456 4 4wd required; Seven Oaks Rd. F05; no recon CAS04476-727 SA_700+ -117.49392202 34.234781296 2 Site is located at bridge at Green Mountain Road bridge at Lytle Creek Road. See report GuarCAS04476-733 SA_700+ -117.12858769 34.169223192 4 Tough access. See report MasonGroup and aerial/topo maps. CAS04476-736 SA_700+ -116.95251478 34.194128944 5 CAS04476-739 SA_700+ -116.98492666 34.161502737 4 4wd required; Seven Oaks Rd. F05; no recon CAS04476-740 SA_700+ -117.35990110 34.243375184 5 CAS04476-741 SA_700+ -116.83568918 34.162378048 5 CAS04476-746 SA_700+ -116.89758261 34.176025543 4 Could not get to orginal site due to dense forest and slope. See report King. CAS04476-748 SA_700+ -117.08128092 34.163425325 4 Access is via a dirt SUV/4X4 truck trial. See report MasonGroup. CAS04476-021 SJ_350-700 -117.22126212 33.833625037 6 Manmade trench less than 150m long; CAS04476-030 SJ_350-700 -117.12836975 33.845976953 6 Agriculture/Pasture; No water in vicinity S06 CAS04476-031 SJ_350-700 -116.94005724 33.675723459 3 Private Property; Gated with Locks; No reconn (Caldwell; 40751 Grieco Way; Hemet) Need peCAS04476-033 SJ_350-700 -117.03503580 33.798361548 6 Dry concrete line channel F05 CAS04476-036 SJ_350-700 -117.39745581 33.676683307 6 Housing; no water in vicinity; S06 CAS04476-038 SJ_350-700 -117.03209094 33.775947465 6 Agriculture/Pasture; No water in vicinity (30 May 06) CAS04476-049 SJ_350-700 -117.04524655 33.817180322 6 Metropolitan Water District S06; viable with permission; We do not sample MWD CAS04476-058 SJ_350-700 -117.33163907 33.645896390 6 Located in Lake Elsinore S06 CAS04476-095 SJ_350-700 -117.09649019 33.830715336 Y 4 Road closed at time of recon (F05) CAS04476-096 SJ_350-700 -116.84360646 33.779223169 6 Inaccessable canyon 30May06 CAS04476-111 SJ_350-700 -116.96351861 33.853966290 6 Inaccessable canyon 09June06 CAS04476-116 SJ_350-700 -117.27871316 33.664073369 Y 2 Wadeable; overgrown with sedges; bushwacking required CAS04476-125 SJ_350-700 -117.23992708 33.833607467 6 Inaccessible, paved road ends at Lytle Creek Firing Range. Upstream sites not access CAS04476-130 SJ_350-700 -117.02225881 33.728110331 Y 3 Riverside County Flood Control and Water Conservation District; viable with permission S06 CAS04476-135 SJ_350-700 -116.86931693 33.761154703 6 Sabobo Indian Reservation; no water 02June06 CAS04476-159 SJ_350-700 -116.83085787 33.738773918 3 Lake Hemet Municipal Water District; viable with permission S06 CAS04476-160 SJ_350-700 -116.81068772 33.731419450 Y 1 Located off of Hwy 74 (few hundred feet); Sampled 07June06 CAS04476-173 SJ_350-700 -117.01423073 33.779932657 6 Agriculture/Pasture; No water in vicinity (30 May 06) CAS04476-183 SJ_350-700 -117.06453889 33.696816497 6 San Diego Aquaduct; Not viable 07June06

Final Report – SWRCB No. 05-101-180-1 70
SITEID CATEGORY LONDD LATDD CRAM Status COMMENTS CAS04476-187 SJ_350-700 -117.04276625 33.717964432 6 No site; Agriculture 06June06 CAS04476-211 SJ_350-700 -116.89248335 33.781359172 6 Sabobo Indian Reservation; Gated; Dries in summer months 02June06 CAS04476-214 SJ_350-700 -117.02950646 33.786909133 6 Not Riverine Wetland -- Metropolitan Water District F05; viable with permission; We do not samCAS04476-235 SJ_350-700 -117.03529309 33.734188132 6 No site; Agriculture 06June06 CAS04476-239 SJ_350-700 -117.31301887 33.656147292 6 Located on Lake Elsinore 06June06 CAS04476-241 SJ_350-700 -117.13402022 33.831959349 6 Agriculture/Pasture; No water in vicinity S06 CAS04476-242 SJ_350-700 -117.07866883 33.838174883 6 Colorado River Aquaduct; Not viable 07June06 CAS04476-243 SJ_350-700 -117.20906791 33.829108898 Y 1 Located off of Rider Street (f05); Sampled 07June06 CAS04476-263 SJ_350-700 -116.88711797 33.786232490 6 Saboba Indian Reservation; no water 02June06 CAS04476-279 SJ_350-700 -117.03324558 33.769541294 6 not riverine wetland -- Metropolitan Water District (MWD) F05; viable with permission; We do nCAS04476-280 SJ_350-700 -116.85404219 33.764701060 6 Sabobo Indian Reservation/Eastern Municipal Water District; No water 02June06 CAS04476-281 SJ_350-700 -117.18629194 33.778578663 6 No water F05 CAS04476-288 SJ_350-700 -116.93010481 33.673218103 3 Private Property; Gated with Locks; No reconn (Caldwell; 40751 Grieco Way; Hemet) Need peCAS04476-290 SJ_350-700 -117.13923319 33.834852122 6 No water F05 CAS04476-291 SJ_350-700 -117.03728609 33.804306203 6 Metropolitan Water District (MWD) F05; viable with permission; We do not sample MWD CAS04476-307 SJ_350-700 -117.24341445 33.736844523 6 No water 02June06 CAS04476-313 SJ_350-700 -117.00529067 33.791175303 6 No access F05 CAS04476-314 SJ_350-700 -117.02190112 33.866527441 6 No water 02June06 CAS04476-320 SJ_350-700 -117.04068046 33.722385590 6 San Diego Aquaduct; Not viable 07June06 CAS04476-331 SJ_350-700 -117.23341205 33.745602791 Y 6 Dry creek 07June06 CAS04476-342 SJ_350-700 -117.20608871 33.822613181 6 Located off of Rider Street (f05); Perris Valley Storm Drain; We do not Sample these CAS04476-347 SJ_350-700 -116.99166922 33.845882299 Y 2 Sanderson & Gilman Springs; 1/2 mile hike (easy trail) F05 CAS04476-360 SJ_350-700 -117.00249111 33.799270667 3 Located on Private Property (no information/no recon) F05 CAS04476-367 SJ_350-700 -117.15768774 33.812025428 6 Agriculture/Pasture; No water in vicinity S06 CAS04476-378 SJ_350-700 -117.07427480 33.837548267 5 CAS04476-381 SJ_350-700 -117.02235092 33.791113946 6 Located on Dairy farm; no water in site F05 CAS04476-392 SJ_350-700 -117.13051513 33.844300304 5 CAS04476-394 SJ_350-700 -116.88519402 33.764291945 5 CAS04476-409 SJ_350-700 -117.21220811 33.848443966 6 Off of LaSalle Rd F05; Perris Valley Storm Drain; We do not sample CAS04476-423 SJ_350-700 -117.04498086 33.703140409 5 CAS04476-426 SJ_350-700 -116.98517910 33.851916744 2 Above site 347 waterfall; further hike F05 CAS04476-428 SJ_350-700 -117.00988534 33.836878393 3 Gated entry (no information/no recon) F05 CAS04476-440 SJ_350-700 -116.84812169 33.691146885 5 CAS04476-451 SJ_350-700 -116.89733919 33.747400289 5 CAS04476-453 SJ_350-700 -116.82761685 33.738831010 5 CAS04476-454 SJ_350-700 -117.03928312 33.725729664 5

Final Report – SWRCB No. 05-101-180-1 71
SITEID CATEGORY LONDD LATDD CRAM Status COMMENTS CAS04476-456 SJ_350-700 -117.10425888 33.857270705 6 Dry Streambed S06 CAS04476-457 SJ_350-700 -116.88942628 33.731443816 5 CAS04476-459 SJ_350-700 -117.25842298 33.727578175 5 CAS04476-460 SJ_350-700 -116.87738913 33.718539331 5 CAS04476-471 SJ_350-700 -117.05173884 33.705451974 5 CAS04476-489 SJ_350-700 -117.00514446 33.721647532 5 CAS04476-514 SJ_350-700 -117.20857593 33.763992576 5 CAS04476-515 SJ_350-700 -117.32023988 33.652172389 5 CAS04476-516 SJ_350-700 -117.08833414 33.860186950 6 Dry Streambed S06 CAS04476-522 SJ_350-700 -117.08463424 33.834875284 5 CAS04476-526 SJ_350-700 -117.01700275 33.758163743 5 CAS04476-540 SJ_350-700 -116.90669375 33.758046696 5 CAS04476-587 SJ_350-700 -116.80289469 33.721674540 5 CAS04476-597 SJ_350-700 -117.03589827 33.759390953 6 Metropolitan Water District (MWD)/Access via Bonnie Acres Ranch F05; viable with permissionCAS04476-609 SJ_350-700 -117.01621526 33.729404965 3 Riverside County Flood Control and Water Conservation District; viable with permission S06 CAS04476-619 SJ_350-700 -117.38780620 33.677181154 5 CAS04476-624 SJ_350-700 -117.20529249 33.808669641 6 No water F05 CAS04476-630 SJ_350-700 -116.79505034 33.716761015 5 CAS04476-631 SJ_350-700 -117.03348201 33.791338177 6 Metropolitan Water District F05; viable with permission; We do not sample MWD CAS04476-632 SJ_350-700 -117.04664740 33.847355479 4 Road closed at time of recon (F05) CAS04476-643 SJ_350-700 -117.01991487 33.881676812 5 CAS04476-644 SJ_350-700 -116.85571496 33.747014663 5 CAS04476-649 SJ_350-700 -117.03421356 33.844864011 5 CAS04476-650 SJ_350-700 -117.11392884 33.853773799 6 Dry Streambed S06 CAS04476-655 SJ_350-700 -117.20431041 33.790351697 6 No water F05 CAS04476-657 SJ_350-700 -116.99993245 33.838543723 2 Had water in F05 CAS04476-662 SJ_350-700 -117.16809422 33.798371512 6 No water F05 CAS04476-676 SJ_350-700 -117.21218020 33.865420649 2 Off of LaSalle Rd F05 CAS04476-678 SJ_350-700 -117.24234221 33.833600162 5 CAS04476-680 SJ_350-700 -117.04963598 33.826143231 5 CAS04476-682 SJ_350-700 -117.05153828 33.695920134 5 CAS04476-701 SJ_350-700 -117.04412602 33.715266626 5 CAS04476-715 SJ_350-700 -117.06244220 33.693895614 5 CAS04476-718 SJ_350-700 -117.19661028 33.779405642 6 No water F05 CAS04476-724 SJ_350-700 -117.18021216 33.792964816 6 No water F05 CAS04476-730 SJ_350-700 -117.40699992 33.677437953 5

Final Report – SWRCB No. 05-101-180-1 72
SITEID CATEGORY LONDD LATDD CRAM Status COMMENTS CAS04476-731 SJ_350-700 -117.03098240 33.742465081 5 CAS04476-735 SJ_350-700 -117.15809662 33.811518248 6 No water F05 CAS04476-008 SJ_700+ -116.79208230 33.742664829 6 Inaccessable (slope and brush); F05 CAS04476-020 SJ_700+ -116.68733438 33.768420077 Y 1 Initial site located on private property; alt GPS; Sampled 16June06 CAS04476-039 SJ_700+ -116.67197921 33.665718885 6 No water F05 CAS04476-054 SJ_700+ -116.72340167 33.662864104 4 2-mile hike; no recon F05 CAS04476-070 SJ_700+ -116.76762278 33.771511380 Y 1 4wd required; Sampled 17June06 CAS04476-078 SJ_700+ -116.81476492 33.790420550 6 Inaccessable canyon 16June06 CAS04476-107 SJ_700+ -116.81339966 33.645986466 3 California Department of Corrections; has water F05 CAS04476-123 SJ_700+ -117.43630207 33.668855883 5 Mountaintop! CAS04476-147 SJ_700+ -116.74484714 33.792901433 6 Steep slope; cannot access 30May06 CAS04476-155 SJ_700+ -116.77368946 33.810719775 3 Ecological Study Area behind Lake Fulmor; no recon S06 CAS04476-163 SJ_700+ -116.74773747 33.793937425 6 Endangered species habitat 30May06 CAS04476-172 SJ_700+ -116.83797267 33.784315302 Y 1 4x4 required. Alt GPS required; have to access through waterway leading to contamination of sCAS04476-188 SJ_700+ -116.82917602 33.804177585 6 243→4S05→4S06; 4wd required; S06;Inaccessable canyon 16June06 CAS04476-189 SJ_700+ -116.83066048 33.838845218 6 Dry creek S06 CAS04476-196 SJ_700+ -116.72637091 33.777818159 4 Private Property; No info; no recon F05 CAS04476-206 SJ_700+ -116.74231339 33.731890431 Y 1 243→Tollgate Rd F05; Sampled 16June06 CAS04476-212 SJ_700+ -116.66060118 33.740061693 4 4wd required; did not recon F05 CAS04476-218 SJ_700+ -116.74103184 33.808421146 6 Endangered species habitat 17June06 CAS04476-228 SJ_700+ -116.81978561 33.791570162 5 CAS04476-257 SJ_700+ -116.82308568 33.789653765 5 CAS04476-267 SJ_700+ -116.67801271 33.674169837 2 Original GPS located on private property; alt GPS F05 CAS04476-268 SJ_700+ -116.75853362 33.685585127 5 CAS04476-269 SJ_700+ -116.83547908 33.791488938 4 243→4S05→4S06; 4wd required; S06; no recon CAS04476-270 SJ_700+ -116.75086338 33.728587032 4 243→Tollgate Rd F05 CAS04476-286 SJ_700+ -116.81659916 33.653887189 Y 2 74E→Fairview Ave→Bautista Rd; F05 CAS04476-297 SJ_700+ -116.81235377 33.809684475 5 CAS04476-311 SJ_700+ -116.75874747 33.706124387 6 No water F05 CAS04476-322 SJ_700+ -116.77713525 33.709454084 6 No water F05 CAS04476-336 SJ_700+ -116.75413411 33.817195103 5 CAS04476-363 SJ_700+ -116.76095529 33.619755221 4 F05; check for alternate access CAS04476-365 SJ_700+ -116.70924933 33.663736655 3 Lake Hemet Municipal Water District; no recon S06 CAS04476-373 SJ_700+ -116.77805145 33.628672096 2 74E→Fairview Ave→Bautista Rd; F05; alt GPS CAS04476-375 SJ_700+ -116.70164416 33.756564096 3 Private Property; no recon F05 CAS04476-379 SJ_700+ -116.65499090 33.662140047 4 74S→Little Thomas Mountain Rd/6S13; did not locate S06

Final Report – SWRCB No. 05-101-180-1 73
SITEID CATEGORY LONDD LATDD CRAM Status COMMENTS CAS04476-383 SJ_700+ -116.71993741 33.811026429 5 CAS04476-384 SJ_700+ -116.75915716 33.723312270 5 CAS04476-405 SJ_700+ -116.74243274 33.774076584 5 CAS04476-410 SJ_700+ -116.77024503 33.758854379 5 CAS04476-413 SJ_700+ -116.76050588 33.792056328 5 CAS04476-419 SJ_700+ -116.71210696 33.742569867 2 Possible private property; no info F05 CAS04476-472 SJ_700+ -116.75993159 33.811381455 5 CAS04476-484 SJ_700+ -116.82052651 33.659625124 Y 2 74E→Fairwiew Ave→Bautista Rd; F05 CAS04476-496 SJ_700+ -116.67953316 33.693205086 5 CAS04476-508 SJ_700+ -116.67965109 33.706462975 5 CAS04476-513 SJ_700+ -116.76078821 33.720333877 5 CAS04476-520 SJ_700+ -116.67350702 33.726089240 5 CAS04476-535 SJ_700+ -116.72252483 33.739027674 2 off of 243; F05 CAS04476-539 SJ_700+ -116.66209432 33.738597824 5 CAS04476-543 SJ_700+ -116.73215125 33.802100132 5 CAS04476-563 SJ_700+ -116.77027130 33.693607171 5 CAS04476-568 SJ_700+ -116.73811858 33.665767156 5 CAS04476-578 SJ_700+ -116.67191020 33.720352052 5 CAS04476-580 SJ_700+ -116.77644684 33.773727288 2 243→Pine Cove Rd→San Jacinto Ridge Rd; F05; alt GPS CAS04476-586 SJ_700+ -116.74129093 33.668629925 5 CAS04476-603 SJ_700+ -116.78210525 33.707601846 6 No water F05 CAS04476-605 SJ_700+ -116.72533355 33.738246156 2 243→Tollgate Rd→Delano (Right); F05; alt GPS CAS04476-612 SJ_700+ -116.83476442 33.675115290 Y 2 74E→Fairview Ave (Right)→Bautista Rd→Hixon Trail; F05 CAS04476-625 SJ_700+ -116.79008943 33.748403844 4 4wd required; did not recon F05 CAS04476-635 SJ_700+ -116.78058655 33.803294547 4 243 and is by the Dark Canyon campground; did not locate/no recon; S06 CAS04476-688 SJ_700+ -116.70499781 33.751898674 2 243→South Circle Dr→Tahquitz Drive (left)→South Circle Drive; F05 CAS04476-690 SJ_700+ -116.75849262 33.760512058 5 CAS04476-699 SJ_700+ -116.67988812 33.678650099 2 74E→Apple Canyon Rd (left)→Campsite #93; F05 CAS04476-714 SJ_700+ -116.79160675 33.740471595 6 Inaccessable (slope and brush); F05 CAS04476-726 SJ_700+ -116.74499913 33.764293240 6 No water F05 CAS04476-729 SJ_700+ -116.75272268 33.773846076 5 CAS04476-734 SJ_700+ -116.77532629 33.778135881 4 243→Pine Cove Rd→San Jacinto Ridge Rd; F05; .19 mile hike; F05 CAS04476-750 SJ_700+ -116.79509006 33.617747401 4 74E→Fairview Ave (Right)→Bautista Rd→Dirt trail; F05

Final Report – SWRCB No. 05-101-180-1 74

Appendix C: CRAM Office Assessment Office preparation of CRAM site visits. Prior to each wetland site visit, initial office work acquired site imagery used to plan navigation and logistics for the site visit, and to assemble information about the management of the site and its possible stressors. C1. Navigation to CRAM site The best, although not always available, way to navigate to the individual assessment area (AA) or CRAM site is to find someone familiar with the area. Combining a series of Google Earth aerial photographs with published roadmaps is the (second) most convenient manner to locate and navigate to the CRAM site. After locating the latitude and longitude (Lat/Lon) coordinates of each site in Google Earth, we selected and printed a “Freeway view” (Figure C1 for site 71), a “Street view” (Figure C2 for site 71), and a “Close Up view” (Figure C3 for site 71) of the CRAM site. The “Freeway view” included enough road information to get the investigators from their point of origin, or last site, to the general CRAM site area. The “Street view” showed enough information to get the investigators from the Freeway or main highway to a safe and practical parking space near the CRAM site, and the “Close up view” included details showing parking place and enough specific information for walking to the CRAM site. The specific information included man-made landmarks such as particular road shapes, railroad tracks, buildings, tanks, dams, bridges, or natural objects, such as rock formations, large trees, or the river bed itself. The ruler in Google Earth was used for assessing the terrain and hiking distance from the parked car to the CRAM site. Comparing the aerials with published roadmaps (Figure C4 for site 71) confirmed landmarks on the aerial images used, such as cross streets, trails, or other landmarks, and thus verified the fit of the navigation information against the system of the California freeways and local roads. There were sites when there was no real need for a “Freeway view”, because the investigator was already familiar with the area because another site was in close proximity. For some CRAM sites using multiple “Street views” or “Close up views” proved useful. C2. Initial Office Assessment of Condition Metrics and Stressors Preliminary scores were developed for select metrics, based on existing documentation (aerial photographs, reports, and communication with site management staff), before conducting actual fieldwork. As stated in CRAM manual v.4.2, this preliminary scoring is not completely necessary, however, and any preliminary scores determined were verified at the site. The aerial photographs were collected from GoogleEarth.com. For aerial photos the minimum pixel resolution is 3m x 3m. This provided enough resolution to perform an initial assessment of the metrics in Table C1 (see Figure C3 for Santa Ana/San Jacinto study’s site 71). Existing Digital Orthogonal Quarterly Quadrangles (DOQQs) dating from 1998 to 2004 with a pixel resolution of 3m, and georectified natural color imagery dated 2005 with a pixel resolution of 1m are available for the entire state. CRAM software is designed to work with any geo-rectified imagery. It can be loaded into the image directory and then used with a tablet computer or laptop in the field to map CRAM sites and conduct the assessment using CRAM.

Final Report – SWRCB No. 05-101-180-1 76
Table C1: CRAM metrics for which preliminary scores can be developed prior to the site visit.

Final Report – SWRCB No. 05-101-180-1 77
Figure C1: Site 71, freeway view

Final Report – SWRCB No. 05-101-180-1 78
Figure C2: Site 71, street view

Final Report – SWRCB No. 05-101-180-1 79
Figure C3: Site 71, close-up view, with ruler and assessment area.

Final Report – SWRCB No. 05-101-180-1 80
Figure C4: Site 71, street view in map format (Thomas Bros (1999))

Final Report – SWRCB No. 05-101-180-1 81
Appendix D: CRAM Field Data Entry Sheet The following data entry sheet was adapted for this project from The CRAM Manual version 4.2.0. (Collins et al., 2006) Assessment Form: Riverine - Unconfined
Basic Information
Site Name
Site No. Date (m/d/y)
Investigators
County Assessment Area Size (ha)
GPS Coordinates of center of AA (as NAD 83 lat./lon.)
□ Restoration □ Mitigation □ Impacted □ Other
Note: Shaded fields will be populated when data are uploaded via CRAM-IT software. Did the river/stream have flowing water at the time of the assessment?
□ yes □ no
What is the apparent hydrologic flow regime1 of the reach you are assessing? The hydrologic flow regime of a stream describes the frequency with which the channel conducts water. Perennial streams conduct water all year long, whereas ephemeral streams conduct water only during and immediately following precipitation events. Intermittent streams are dry for part of the year, but conduct water for periods longer than ephemeral streams, as a function of watershed size and water source. □ perennial □ ephemeral □ intermittent
Goal GPS coordinates Actual GPS coordinates Lat: Lat: Lon: Lon: Elev: Elev: Sketch of assessment area (mark GPS site with an X.)
Please see GPS entry space below…

Final Report – SWRCB No. 05-101-180-1 82
Metric Information
WETLAND CLASS: Riverine – Unconfined
BUFFER and LANDSCAPE CONTEXT
3 There is at least 500 m of riparian area extending upstream and downstream of the AA on both sides of the AA that is not interrupted by any non-buffer land covers at least 10 m wide (see Table 4.3).
2 There is at least 500 m of riparian area extending upstream and downstream of the AA on one side of the AA that is not interrupted by any non-buffer land covers at least 10 m wide (see Table 4.3).
1a. Landscape Connectivity
1 There is less that 500 m of riparian area extending upstream and downstream of the AA on both sides of the AA that is not interrupted by any non-buffer land covers at least 10 m wide (see Table 4.3).
4 Buffer is > 75 - 100% of AA perimeter. 3 Buffer is > 50 – 74% of AA perimeter. 2 Buffer is 25 – 49% of AA perimeter.
1b. Percent of AA with Buffer
1 Buffer is < 25% of AA perimeter.
Calculating average buffer width Estimate average buffer width of AA in each of its quadrants and average for scoring.
Buffer Quadrant Buffer Width in Meters Quadrant 1 A. Quadrant 2 B. Quadrant 3 C. Quadrant 4 D. Average buffer width E.
4 Average buffer width of AA is ≥ 200 m. 3 Average buffer width of AA is 100 – 199 m. 2 Average buffer width of AA is 50 – 99 m.
1c. Average Buffer Width
1 Average buffer width of AA is 0 - 49 m.
4 Buffer for AA is characterized by abundant native vegetation and little to no cover of non-native plants, with intact soils, and little or no trash or refuse.
3
Buffer for AA is characterized by moderate cover of native vegetation, moderate cover of non-native plants, intact or moderately disrupted soils, moderate or lesser amounts of trash or refuse, and minor intensity of human visitation or recreation.
2
Buffer for AA is characterized by a prevalence of non-native plants, and either moderate or extensive soil disruption, moderate or greater amounts of trash or refuse, and moderate intensity of human visitation or recreation.
1d. Buffer Condition
1
Buffer for AA is characterized by barren ground and highly compacted or otherwise disrupted soils, with moderate or greater amounts of trash or refuse, and moderate or greater intensity of human visitation or recreation; OR there is no buffer present.

Final Report – SWRCB No. 05-101-180-1 83
WETLAND CLASS: Riverine – Unconfined (cont’d)
HYDROLOGY
4
Dry-season freshwater source for AA is precipitation, groundwater, and/or natural runoff, or an adjacent freshwater body, or system naturally lacks water in the dry season. There is no indication of direct artificial water sources. Land use in the local drainage area of the AA is primarily open space or low density, passive uses. No large point sources discharge into or adjacent to the AA.
3
Dry-season freshwater source is mostly natural, but AA directly receives occasional or small amounts of inflow from anthropogenic sources. Indications of anthropogenic input include developed land or irrigated agricultural land (< 20%) in the immediate drainage area of the AA, or the presence of small stormdrains or other local discharges emptying into the AA, or the presence of scattered homes along the wetland that probably have septic systems. No large point sources discharge into or adjacent to the AA.
2
Dry-season freshwater source is primarily urban runoff, direct irrigation, pumped water, artificially impounded water, or other artificial hydrology. Indications of substantial artificial hydrology include > 20% developed or irrigated agricultural land adjacent to the AA, and the presence of major point sources that discharge into or adjacent to the AA. OR Dry season freshwater flow exists but has been substantially diminished by known diversions of water or other withdrawals directly from the AA, its encompassing wetland, or from areas adjacent to the AA or its wetland.
2a. Water Source
1
Natural, dry-season or end-of-wet-season sources of freshwater have been eliminated based on the following indicators: observable diversion of all dry-season flow, etc., and predominance of xeric vegetation (see Table 4.7b).
4 Most of the channel through the AA is characterized by equilibrium conditions, with little evidence of aggradation or degradation (based on the field indicators listed in Table 4.8).
3
Most of the channel through the AA is characterized by some aggradation or degradation, none of which is severe, and the channel seems to be approaching an equilibrium form (based on the field indicators listed in Table 4.8).
2
There is evidence of severe aggradation or degradation of most of the channel through the AA (based on the field indicators listed in Table 4.8), or the channel is artificially hardened through less than half of the AA.
2b Hydroperiod or Channel Stability
1 The channel is concrete or is otherwise artificially hardened through most of the AA.

Final Report – SWRCB No. 05-101-180-1 84
Calculating entrenchment ratio Step 1: Estimate bankfull
width.
This is a critical step requiring experience. If the stream is entrenched, the depth of bankfull flow is identified as a scour line, narrow bench, or the top of active point bars well below the top of apparent channel banks. If the stream is not entrenched, bankfull stage can correspond to the elevation of a broader floodplain with indicative riparian vegetation. Once the bankfull contour is identified, estimate the bankfull channel width.
Step 2: Estimate bankfull depth.
Once the bankfull contour is identified, estimate its maximum depth to the channel bottom.
Step 3: Estimate flood prone depth.
Double the estimate of maximum bankfull depth from Step 2, and note the location of the new depth on the channel bank.
Step 4: Estimate flood prone width.
Estimate the width of the channel at the flood prone depth.
Step 5: Calculate entrenchment ratio.
Divide the flood prone width (result of Step 4) by the maximum bankfull width (result of Step 1)
Result WETLAND CLASS: Riverine – Unconfined (cont’d)
3 Entrenchment ratio is > 7.5.
2 Entrenchment ratio is 3 – 7.4. 2c. Hydrologic Connectivity
1 Entrenchment ratio is < 2.9.
PHYSICAL STRUCTURE
4 >12 of the possible patch types are evident in the AA.
3 9 – 10 of the possible patch types are evident in the AA.
2 6 – 8 of the possible patch types are evident in the AA.
3a. Structural Patch Richness
1 ≤5 of the possible patch types are evident in the AA.
See next page

Final Report – SWRCB No. 05-101-180-1 85
3a. continued
Topographic Complexity
Structural Patch Richness Circle each type of patch that is observed in the AA and enter the total number of observed patches in table below.
STRUCTURAL PATCH TYPE (check for presence)
Riv
erin
e (U
nco
nfi
ned
)
Minimum Patch Size 3m2
Secondary channels on floodplains or along shorelines 1
Swales on floodplain or along shoreline 1 Pannes or pools on floodplain 1
Islands (exposed at high-water stage) 1 Pools in channels 1 Riffles or rapids 1
Point bars and in-channel bars 1 Debris jams 1
Abundant wrackline in channel or on floodplain 1 Hummocks and/or sediment mounds 1
Bank slumps or undercut banks in channels or along shoreline 1
Variegated foreshore overall (instead of broadly arcuate or essentially straight) 1
Standing snags 1 Macroalgae 1
Concentric or parallel high water marks 1 Cobble and/or Boulders 1
Total Possible 16 No. Observed Patch Types
4
AA as viewed along cross-sections has a variety of slopes, or elevations, that are characterized by different moisture gradients. Each sub-slope contains physical patch types or features that contribute to irregularity in height, edges, or surface of the AA and to complex topography overall.
3 AA has a variety of slopes, or elevations, that are characterized by different moisture gradients; however, each sub-slope lacks many physical patch types, such that the slopes or elevation zones tend to be regular and uniform.
2 AA has a single, uniform slope or elevation. However that slope, or elevation, has a variety of physical patch types.
3b. Topographic Complexity
1 AA has a single, uniform slope, or elevation, with few physical patch types.
4
3 2 1

Final Report – SWRCB No. 05-101-180-1 86
BIOTIC STRUCTURE
4
The AA is characterized by an abundance of fine organic matter in topographic lows, along high-water shorelines, and across vegetated plains. There is a range of kinds of organic matter representing all the visible stages of processing, from whole plant parts to fine detritus.
3
The AA is characterized by a moderate amount of fine organic matter in a patchy distribution. There is some matter of various sizes, but new materials seem much more prevalent than old materials. Litter layers, duff layers, and leaf piles in pools or topographic lows are thin.
2 The AA is characterized by occasional small amounts of coarse organic debris, such as leaf litter or thatch, with only traces of fine debris, and with little evidence of organic matter recruitment.
4a. Organic Matter Accumulation
1 The AA contains essentially no significant amounts of coarse plant debris, and only scant amounts of fine debris.
Plant Community Composition - Plant layers and their dominance by non-native species for all Non-saline Estuarine, Riverine, Slope, Lacustrine, and Depressional Wetlands
Plant Layer Aquatic/Semi-aquatic Terrestrial/Riparian Non-saline Estuarine, Riverine,
Depressional, Slope, and Lacustrine Submergent
Emergent (all)
Short (< 1 m)
Medium(1-3 m)
Tall (> 3 m)
Mark if layer present ( > 5% of suitable habitat area)
Mark if dominated by non-native species ( > 50% of the layer is represented by non-natives)
Total number of layers present
Percent of layers dominated by non-native species
4 4 – 5 layers are present.
3 3 layers are present.
2 2 layers are present.
4B.
NUMBER OF PLANT LAYERS PRESENT
1 0 – 1 layer is present.
4 0 – 24%
3 25 – 49%
2 50 – 74%
4C.
PERCENT OF LAYERS DOMINATED BY NON-NATIVE SPECIES
1 75 – 100%

Final Report – SWRCB No. 05-101-180-1 87
Plant Community Composition - Co-dominant species richness for all wetlands.
Dominant species represent ≥ 10% relative cover–Mark all non-natives based on Appendix 3
Submergent Aquatic/Semi-aquatic Tall Terrestrial/Riparian
Emergent Aquatic/Semi-aquatic Medium Terrestrial/Riparian
Short Terrestrial/Riparian
Total number of co-dominant species for all layers combined Percent of co-dominant species that are non-nativ
4 ≥ 12 co-dominant species
3 7 – 11 co-dominant species
2 4 – 6 co-dominant species
4D.
NUMBER OF CO-DOMINANT SPECIES
1 0 – 3 co-dominant species
4 0 – 39%
3 40 – 69%
2 70 – 89%
4e. Percent of Co-dominant Species that are Non-native
1 90 – 100%
4 Wetland has a high degree of plan-view interspersion. 3 Wetland has a moderate degree of plan-view interspersion. 2 Wetland has a low degree of plan-view interspersion.
4f. Interspersion and Zonation
1 Wetland has essentially no plan-view interspersion.
4 More than 50 % of vegetated area of the AA supports abundant overlap of height classes (see Figure 4.6).
3 More than 50 % of area supports at least moderate overlap of height classes.
2 25 – 50 % of the vegetated AA supports at least moderate overlap of plant layers, or three plant layers are well represented in the AA but there is little to no overlap.
4g. Vertical Biotic Structure
1 Less than 25% of vegetated AA supports moderate overlap of height classes, or two layers are well represented with little overlap, or AA is sparsely vegetated overall.

Final Report – SWRCB No. 05-101-180-1 88
CRAM Scoring Sheet Office Score
Field Score
Comments
Buffer and Landscape Context Eee eee E ee eee eeeeeeeeeeeeeeeeeeeeeeeeeeeeeeeeeeeeeeeeeee
1a. Landscape Connectivity
1b. Percent of AA with Buffer
1c. Average Buffer Width
1d. Buffer Condition
Etuetu huteuheu Eee eee E ee eeeeeeeeeeeeeeeeeeeeeeeeeeeeeeeeeeeeeeeeeeeeee
Hydrology Eee eee E ee eeeeeeeeeeeeeeeeeeeeeeeeeeeeeeeeeeeeeeeeeeeeee
2a. Water Source
2b. Hydroperiod or Channel Stability
2c. Hydrologic Connectivity
Etuetu huteuheu Eee eee E ee eeeeeeeeeeeeeeeeeeeeeeeeeeeeeeeeeeeeeeeeeeeeee
Physical Structure Eee eee E ee eeeeeeeeeeeeeeeeeeeeeeeeeeeeeeeeeeeeeeeeeeeeee
3a. Structural Patch Richness
3b. Topographic Complexity
Etuetu huteuheu Eee eee E ee eeeeeeeeeeeeeeeeeeeeeeeeeeeeeeeeeeeeeeeeeeeeee
Biotic Structure Eee eee E ee eeeeeeeeeeeeeeeeeeeeeeeeeeeeeeeeeeeeeeeeeeeeee
4a. Organic Matter Accumulation
4b. Number of Plant Layers Present
4c. Percent of Layers Dominated by Non-native Species
4d. Number Co-dominant Species
4e. Percent Co-dominant Species that are Non-native
4f. Interspersion and Zonation
4g. Vertical Biotic Structure
Photograph notes:

Final Report – SWRCB No. 05-101-180-1 89
Stressor Checklist Worksheets
HYDROLOGY Present and likely to have negative
effect on AA
Significant negative
effect on AAPoint Source (PS) Discharges (POTW, other non-stormwater discharge) Non-point Source (Non-PS) Discharges (urban runoff, farm drainage) Flow diversions or unnatural inflows Dams (reservoirs, detention basins, recharge basins) Flow obstructions (culverts, paved stream crossings) Weir/drop structure, tide gates Dredged inlet/channel Engineered channel (riprap, armored channel bank, bed) Dike/levees Groundwater extraction Ditches (borrow, agricultural drainage, mosquito control, etc.) Actively managed hydrology Comments
PHYSICAL STRUCTURE Present and likely to have negative
effect on AA
Significant negative
effect on AAFilling or dumping of sediment or soils (N/A for restoration areas) Grading/ compaction (N/A for restoration areas) Plowing/Discing (N/A for restoration areas) Resource extraction (sediment, gravel, oil and/or gas) Vegetation management Excessive sediment or organic debris from watershed Excessive runoff from watershed Nutrient impaired (PS or Non-PS pollution) Heavy metal impaired (PS or Non-PS pollution) Pesticides or trace organics impaired (PS or Non-PS pollution) Bacteria and pathogens impaired (PS or Non-PS pollution) Trash or refuse Comments

Final Report – SWRCB No. 05-101-180-1 90
Stressor Checklist Worksheets (cont’d)
BIOTIC STRUCTURE Present and likely to have negative
effect on AA
Significant negative
effect on AAMowing, grazing, excessive herbivory (within AA) Excessive human visitation Predation and habitat destruction by non-native vertebrates (e.g., Virginia opossum and domestic predators, such as feral pets)
Tree cutting/sapling removal Removal of woody debris Treatment of non-native and nuisance plant species Pesticide application or vector control Evidence of fire Evidence of flood Biological resource extraction or stocking (fisheries, aquaculture) Excessive organic debris in matrix (for vernal pools) Lack of vegetation management to conserve natural resources Lack of appropriate treatment of invasive plant species adjacent to AA or buffer
Comments
ADJACENT LAND USE Present and likely to have negative
effect on AA
Significant negative
effect on AAUrban residential Industrial/commercial Military training/Air traffic Dryland farming Intensive row-crop agriculture Orchards/nurseries Commercial feedlots Dairies Ranching (enclosed livestock grazing or horse paddock or feedlot) Transportation corridor Rangeland (livestock rangeland also managed for native vegetation) Sports fields and urban parklands (golf courses, soccer fields, etc.) Passive recreation (bird-watching, hiking, etc.) Active recreation (off-road vehicles, mountain biking, hunting, fishing) Physical resource extraction (rock, sediment, oil/gas) Biological resource extraction (aquaculture, commercial fisheries) Comments
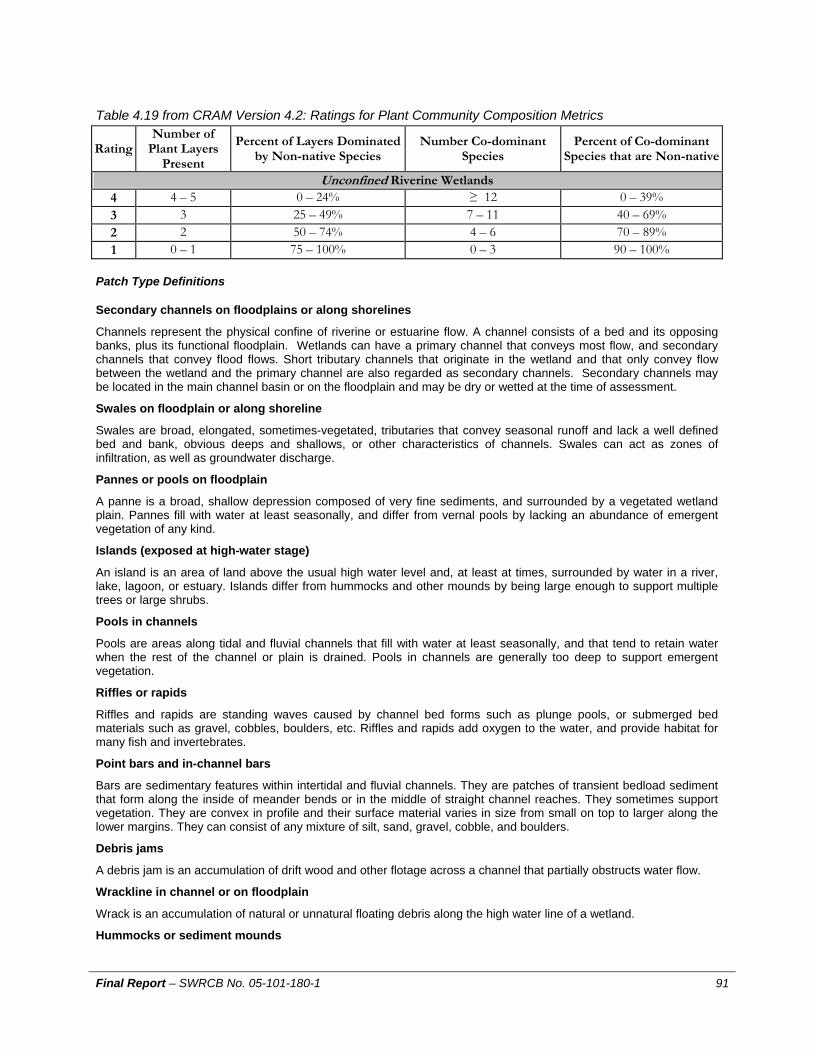
Final Report – SWRCB No. 05-101-180-1 91
Table 4.19 from CRAM Version 4.2: Ratings for Plant Community Composition Metrics
Rating Number of
Plant Layers Present
Percent of Layers Dominatedby Non-native Species
Number Co-dominant Species
Percent of Co-dominant Species that are Non-native
Unconfined Riverine Wetlands 4 4 – 5 0 – 24% ≥ 12 0 – 39% 3 3 25 – 49% 7 – 11 40 – 69% 2 2 50 – 74% 4 – 6 70 – 89% 1 0 – 1 75 – 100% 0 – 3 90 – 100%
Patch Type Definitions
Secondary channels on floodplains or along shorelines
Channels represent the physical confine of riverine or estuarine flow. A channel consists of a bed and its opposing banks, plus its functional floodplain. Wetlands can have a primary channel that conveys most flow, and secondary channels that convey flood flows. Short tributary channels that originate in the wetland and that only convey flow between the wetland and the primary channel are also regarded as secondary channels. Secondary channels may be located in the main channel basin or on the floodplain and may be dry or wetted at the time of assessment.
Swales on floodplain or along shoreline
Swales are broad, elongated, sometimes-vegetated, tributaries that convey seasonal runoff and lack a well defined bed and bank, obvious deeps and shallows, or other characteristics of channels. Swales can act as zones of infiltration, as well as groundwater discharge.
Pannes or pools on floodplain
A panne is a broad, shallow depression composed of very fine sediments, and surrounded by a vegetated wetland plain. Pannes fill with water at least seasonally, and differ from vernal pools by lacking an abundance of emergent vegetation of any kind.
Islands (exposed at high-water stage)
An island is an area of land above the usual high water level and, at least at times, surrounded by water in a river, lake, lagoon, or estuary. Islands differ from hummocks and other mounds by being large enough to support multiple trees or large shrubs.
Pools in channels
Pools are areas along tidal and fluvial channels that fill with water at least seasonally, and that tend to retain water when the rest of the channel or plain is drained. Pools in channels are generally too deep to support emergent vegetation.
Riffles or rapids
Riffles and rapids are standing waves caused by channel bed forms such as plunge pools, or submerged bed materials such as gravel, cobbles, boulders, etc. Riffles and rapids add oxygen to the water, and provide habitat for many fish and invertebrates.
Point bars and in-channel bars
Bars are sedimentary features within intertidal and fluvial channels. They are patches of transient bedload sediment that form along the inside of meander bends or in the middle of straight channel reaches. They sometimes support vegetation. They are convex in profile and their surface material varies in size from small on top to larger along the lower margins. They can consist of any mixture of silt, sand, gravel, cobble, and boulders.
Debris jams
A debris jam is an accumulation of drift wood and other flotage across a channel that partially obstructs water flow.
Wrackline in channel or on floodplain
Wrack is an accumulation of natural or unnatural floating debris along the high water line of a wetland.
Hummocks or sediment mounds

Final Report – SWRCB No. 05-101-180-1 92
Hummocks are mounds created by plants in slope wetlands, depressions, and along the banks and floodplains of fluvial and tidal systems. Hummocks are typically less than 1m high. Sediment mounds are similar to hummocks without the vegetated cover.
Bank slumps or undercut banks in channels or along shoreline
Bank slumps form when a chunk of bank material breaks off and slides into the channel in a fluvial or tidal system, where it becomes cemented in place. Both bank slumps and boulders are durable objects that are intransient except under extremely high-powered flow events. Boulders (rocks with a diameter of more than 10” (256mm)) and hardened bank slumps within the channel or along the shoreline can influence channel formation and create microhabitats. Undercut banks are concave features created when strong currents scour earthen banks. Bank erosion below the water line creates “shelves” that provide habitat for fish and other aquatic organisms.
Variegated foreshore overall
For lacustrine, riverine, lagoon, and playa wetlands, the shoreline is the boundary between the wetland and the aquatic system or open water environment, including the banks of tidal creeks. For all other wetlands, the shoreline is the boundary between the wetland and the upland. As viewed from above, the shoreline can be straight, curved, or variegated. A variegated shoreline can be sketched as a sequence of s-shaped curves of varying amplitude and asymmetry, such that the line seems to meander or wander.
Standing snags
Tall, woody vegetation, such as trees and tall shrubs, can take many years to fall to the ground after dying. As these standing “snags” decompose, they provide habitat for birds and many other organisms. Any standing, dead woody vegetation that is at least 12 feet tall is considered a snag.
Macroalgae
Benthic macroalgae attach to the bottom sediments or other substrates in fresh, brackish, and saline water bodies. Macroalgae also occur in surface layers of soils and porous rocks, on the bark and leaves of trees, and in symbiotic association with fungi to form lichens. These organisms are important primary producers, representing the base of the food chain in some wetlands. They also contribute to the fertility of the soil in providing habitat for benthic and soil organisms.
Concentric or parallel high water marks
Repeated, seasonal and interannual variation in water level in a wetland can cause concentric zones in soil moisture, topographic slope, and chemistry that translate into visible zones of different vegetation types and soils, greatly increasing overall ecological diversity.
Cobble and boulders
Cobble and boulders are rocks of different size categories. The long axis of cobble ranges from about 2.5” to 10.0”. A boulder is any rock having a long axis greater than 10”. Submerged cobbles and boulders provide abundant habitat for aquatic macroinvertebrates and small fish. Emergent or exposed cobbles and boulders provide roosting habitat for birds, shelter for amphibians, and they contribute to patterns of shade and light and air movement near the ground surface that affect soil moisture gradients, aeolian deposition of seeds and organic debris, and overall substrate complexity.

Final Report – SWRCB No. 05-101-180-1 93
Appendix E: Compiled CRAM data in a user friendly format The following information has been provided to Region 8 in Excel spreadsheet format. This data Table E1: Strata, Sites and CRAM scores
Stratum Site Lat Lon Elevation CRAM score
SA_0-350 11 33.850751000 -117.78352517 120 67.31% SA_0-350 12 33.919145069 -117.81995033 229 65.65% SA_0-350 15 33.892216066 -117.68321695 166 64.79% SA_0-350 19 33.911511385 -117.61286303 166 59.82% SA_0-350 42 33.945867213 -117.61435352 166 67.00% SA_0-350 46 33.792624077 -117.71671396 256 70.80% SA_0-350 71 33.749330000 -117.67751000 274 66.40% mean = 65.97% S.E. = 1.25% SA_350-700 17 34.161176723 -117.36382035 438 50.70% SA_350-700 28 34.203004484 -117.44504460 681 57.53% SA_350-700 32 34.077298499 -117.08738209 664 54.50% SA_350-700 51 33.995912140 -117.15384395 494 69.07% SA_350-700 55 34.039260000 -117.21973000 378 55.77% SA_350-700 79 34.219556993 -117.40595247 627 70.74% SA_350-700 85 34.049964960 -117.23309791 357 49.04% mean = 58.19% S.E. = 3.22% SA_700+ 2 34.144227205 -117.06210253 857 69.84% SA_700+ 7 34.094982144 -116.96380672 1330 58.30% SA_700+ 14 34.183644702 -117.62619063 905 62.77% SA_700+ 22 34.158427000 -116.88753000 2181 71.95% SA_700+ 27 34.306522607 -117.47032066 920 70.19% SA_700+ 34 34.089394000 -116.93008031 1555 51.62% SA_700+ 35 34.077479169 -116.87489914 2000 65.22% mean = 64.27% S.E. = 2.78% SJ_350-700 95 33.831200000 -117.09486000 447 46.15% SJ_350-700 116 33.664073369 -117.27871316 394 76.79% SJ_350-700 130 33.728154000 -117.02213000 460 53.85% SJ_350-700 160 33.731412000 -116.81070000 639 68.88% SJ_350-700 243 33.827800000 -117.20900000 438 50.18% SJ_350-700 331 33.745380000 -117.23571000 428 66.35% SJ_350-700 347 33.845882299 -116.99166922 537 0.00% mean = 51.74% S.E. = 9.57% SJ_700+ 20 33.767000000 -116.69020000 1931 59.45% SJ_700+ 70 33.771300000 -116.76800000 1368 82.69% SJ_700+ 172 33.784315302 -116.83797267 795 65.22% SJ_700+ 206 33.731904000 -116.74231300 1549 71.76% SJ_700+ 266 33.653887189 -116.81659916 818 74.47% SJ_700+ 484 33.659625124 -116.82052651 782 70.62% SJ_700+ 612 33.675115290 -116.83476442 746 70.62% mean = 70.69% S.E. = 2.74%

Final Report – SWRCB No. 05-101-180-1 94
Table E2: CRAM Attributes for determining CRAM scores
Stratum Sites Buffer + Landscape Hydrology Physical structure Biological structure
SA_0-350 11 2.000 6 5 22 SA_0-350 12 2.140 7 4 21 SA_0-350 15 2.689 9 3 19 SA_0-350 19 2.107 9 3 19 SA_0-350 42 1.841 9 5 19 SA_0-350 46 2.816 9 6 19 SA_0-350 71 2.530 10 6 16 Mean = 2.303 8.4 4.6 19.3 S.E. = 0.141 0.5 0.5 0.7 SA_350-700 17 2.366 9 2 13 SA_350-700 28 2.914 9 4 14 SA_350-700 32 2.341 9 3 15 SA_350-700 51 2.914 7 4 22 SA_350-700 55 1.000 8 4 16 SA_350-700 79 1.783 10 4 21 SA_350-700 85 1.500 9 2 13 Mean = 2.117 8.7 3.3 16.3 S.E. = 0.273 0.4 0.4 1.4 SA_700+ 2 2.316 10 4 20 SA_700+ 7 2.316 9 4 15 SA_700+ 14 2.640 11 3 16 SA_700+ 22 2.414 9 5 21 SA_700+ 27 1.500 11 3 21 SA_700+ 34 1.841 9 3 13 SA_700+ 35 2.914 10 6 15 Mean = 2.277 9.9 4.0 17.3 S.E. = 0.180 0.3 0.4 1.2 SJ_350-700 95 1.000 8 2 13 SJ_350-700 116 1.931 8 4 26 SJ_350-700 130 2.000 9 4 13 SJ_350-700 160 2.816 9 5 19 SJ_350-700 243 1.095 7 2 16 SJ_350-700 331 2.500 10 4 18 SJ_350-700 347 1.000 4 2 15 Mean = 1.763 7.9 3.3 17.1 S.E. = 0.282 0.7 0.5 1.7 SJ_700+ 20 2.914 9 5 14 SJ_700+ 70 2.000 8 8 25 SJ_700+ 172 2.914 9 5 17 SJ_700+ 206 2.316 10 4 21 SJ_700+ 286 2.725 10 6 20 SJ_700+ 484 2.725 11 4 19 SJ_700+ 612 2.816 10 3 18 Mean = 2.630 9.6 5.0 19.1 S.E. = 0.130 0.4 0.6 1.3

Final Report – SWRCB No. 05-101-180-1 95
Table E3: CRAM Attributes: buffer & hydrology metrics
Buffer metrics Hydrology metrics
Stratum Sites
1a. Landscape Connectivity
1b. Percent of
AA with Buffer
1c. Average Buffer Width
1d. Buffer Condition
2a. Water Source
2b. Hydroperiod or Channel
Stability
2c. Hydrologic
Connectivity
SA 0-350 11 3 1 1 1 2 1 3 SA 0-350 12 2 3 3 3 2 4 1 SA 0-350 15 3 4 4 2 4 4 1 SA 0-350 19 2 4 3 2 3 2 3 SA 0-350 42 2 4 2 1 3 3 3 SA 0-350 46 3 4 4 3 4 4 1 SA 0-350 71 3 3 2 3 3 4 3
Mean = 2.6 3.3 2.7 2.1 3.0 3.1 2.1 S.E. = 0.2 0.4 0.4 0.3 0.3 0.5 0.4
SA 350-700 17 3 3 1 3 4 2 1 SA 350-700 28 3 4 4 4 3 3 3 SA 350-700 32 3 2 2 2 4 4 1 SA 350-700 51 3 4 4 4 3 3 1 SA 350-700 55 1 1 1 1 2 3 3 SA 350-700 79 2 3 1 2 3 4 3 SA 350-700 85 2 1 1 1 2 4 3
Mean = 2.4 2.6 2.0 2.4 3.0 3.3 2.1 S.E. = 0.3 0.5 0.5 0.5 0.3 0.3 0.4
SA 700+ 2 2 4 4 3 4 4 2 SA 700+ 7 2 3 4 4 4 2 3 SA 700+ 14 3 3 3 3 4 4 3 SA 700+ 22 2 4 4 4 4 4 1 SA 700+ 27 2 1 1 1 4 4 3 SA 700+ 34 2 4 2 1 4 2 3 SA 700+ 35 3 4 4 4 4 4 2
Mean = 2.3 3.3 3.1 2.9 4.0 3.4 2.4 S.E. = 0.2 0.4 0.5 0.5 0.0 0.4 0.3
SJ 350-700 95 1 1 1 1 2 3 3 SJ 350-700 116 2 4 1 3 4 3 1 SJ 350-700 130 3 1 1 1 4 3 2 SJ 350-700 160 3 4 3 4 4 4 1 SJ 350-700 243 1 1 2 1 2 2 3 SJ 350-700 331 3 4 1 4 3 4 3 SJ 350-700 347 1 1 1 1 2 1 1
Mean = 2.0 2.3 1.4 2.1 3.0 2.9 2.0 S.E. = 0.4 0.6 0.3 0.6 0.4 0.4 0.4
SJ 700+ 20 3 4 4 4 4 4 1 SJ 700+ 70 2 4 1 4 4 3 1 SJ 700+ 172 3 4 4 4 4 4 1 SJ 700+ 206 2 4 3 4 4 4 2 SJ 700+ 286 3 4 3 3 4 4 2 SJ 700+ 484 3 4 3 3 4 4 3 SJ 700+ 612 3 4 3 4 4 4 2
Mean = 2.7 4.0 3.0 3.7 4.0 3.9 1.7 S.E. = 0.2 0.0 0.4 0.2 0.0 0.1 0.3

Final Report – SWRCB No. 05-101-180-1 96
Table E4: CRAM Attributes: physical & biological structure metrics
Phyical structure metrics Biological structure metrics
Stratum Sites
3a. Structural
Patch Richness
3b. Topographic Complexity
4a. Organic Matter
Accumulation
4b. # Plant Layers Present
4c. % Layers
Dominated by Non-native
Species
4d. Number of Co-
dominant Species
4e. % Co-dominant Species that are
Non-native
4f. Interspersion
and Zonation
4g. Vertical Biotic
Structure
SA 0-350 11 3 2 3 3 4 3 4 3 2 SA 0-350 12 1 3 2 3 4 3 4 3 2 SA 0-350 15 1 2 4 2 4 2 4 2 1 SA 0-350 19 3 3 2 2 4 1 4 1 1 SA 0-350 42 2 3 4 2 4 2 4 2 1 SA 0-350 46 2 4 4 2 3 3 4 2 1 SA 0-350 71 2 4 3 2 4 1 4 1 1
Mean = 2.0 3.0 3.1 2.3 3.9 2.1 4.0 2.0 1.3 S.E. = 0.3 0.3 0.3 0.2 0.1 0.3 0.0 0.3 0.2
SA 350-700 17 1 1 1 1 4 1 4 1 1
SA 350-700 28 2 2 2 1 4 1 4 1 1
SA 350-700 32 1 2 2 2 4 1 4 1 1
SA 350-700 51 1 3 1 4 4 3 4 3 3
SA 350-700 55 1 3 1 3 4 2 4 1 1
SA 350-700 79 2 2 3 3 4 3 4 3 1
SA 350-700 85 1 1 1 1 4 1 4 1 1
Mean = 1.3 2.0 1.6 2.1 4.0 1.7 4.0 1.6 1.3 S.E. = 0.2 0.3 0.3 0.5 0.0 0.4 0.0 0.4 0.3
SA 700+ 2 2 2 3 3 4 3 4 2 1 SA 700+ 7 2 2 2 2 4 1 4 1 1 SA 700+ 14 1 2 2 2 4 2 4 1 1 SA 700+ 22 2 3 2 3 4 2 4 3 3 SA 700+ 27 1 2 3 3 4 3 4 2 2 SA 700+ 34 1 2 1 1 4 1 4 1 1 SA 700+ 35 2 4 2 2 4 1 4 1 1

Final Report – SWRCB No. 05-101-180-1 97
Phyical structure metrics Biological structure metrics
Stratum Sites
3a. Structural
Patch Richness
3b. Topographic Complexity
4a. Organic Matter
Accumulation
4b. # Plant Layers Present
4c. % Layers
Dominated by Non-native
Species
4d. Number of Co-
dominant Species
4e. % Co-dominant Species that are
Non-native
4f. Interspersion
and Zonation
4g. Vertical Biotic
Structure
Mean = 1.6 2.4 2.1 2.3 4.0 1.9 4.0 1.6 1.4 S.E. = 0.2 0.3 0.3 0.3 0.0 0.3 0.0 0.3 0.3
SJ 350-700 95 1 1 1 3 1 2 4 1 1
SJ 350-700 116 2 2 4 4 4 3 4 3 4
SJ 350-700 130 1 3 1 1 4 1 4 1 1
SJ 350-700 160 3 2 1 2 4 2 4 3 3
SJ 350-700 243 1 1 1 4 4 2 2 2 1
SJ 350-700 331 1 3 1 4 4 2 4 2 1
SJ 350-700 347 1 1 2 2 4 2 3 1 1
Mean = 1.4 1.9 1.6 2.9 3.6 2.0 3.6 1.9 1.7 S.E. = 0.3 0.3 0.4 0.5 0.4 0.2 0.3 0.3 0.5
SJ 700+ 20 1 4 1 2 4 1 4 1 1 SJ 700+ 70 4 4 4 3 4 2 4 4 4 SJ 700+ 172 1 4 1 3 3 2 3 3 2 SJ 700+ 206 1 3 2 3 4 2 4 3 3 SJ 700+ 286 2 4 3 3 4 2 4 2 2 SJ 700+ 484 2 2 2 3 4 3 4 2 1 SJ 700+ 612 1 2 2 2 4 2 4 2 2
Mean = 1.7 3.3 2.1 2.7 3.9 2.0 3.9 2.4 2.1 S.E. = 0.4 0.4 0.4 0.2 0.1 0.2 0.1 0.4 0.4