Embed Size (px)
Citation preview

University of Puerto Rico Mayagüez Campus Department of Civil Engineering and Surveying
May 2002
Final Report Application of SIMAN ARENA Discrete Event Simulation Tool in the
Operational Planning of a Rail System
Submitted by:
Francisco E. Martínez Martínez 841-94-3901
Submitted to: Dr. Benjamín Colucci
Advisor [email protected]
May 31, 2001
2
Abstract:
Application of SIMAN ARENA Discrete Event Simulation Tool in the Operational Planning of a Rail System
Francisco E. Martínez [email protected],
Dr. Didier Valdés [email protected] Dr. Benjamín Colucci [email protected]
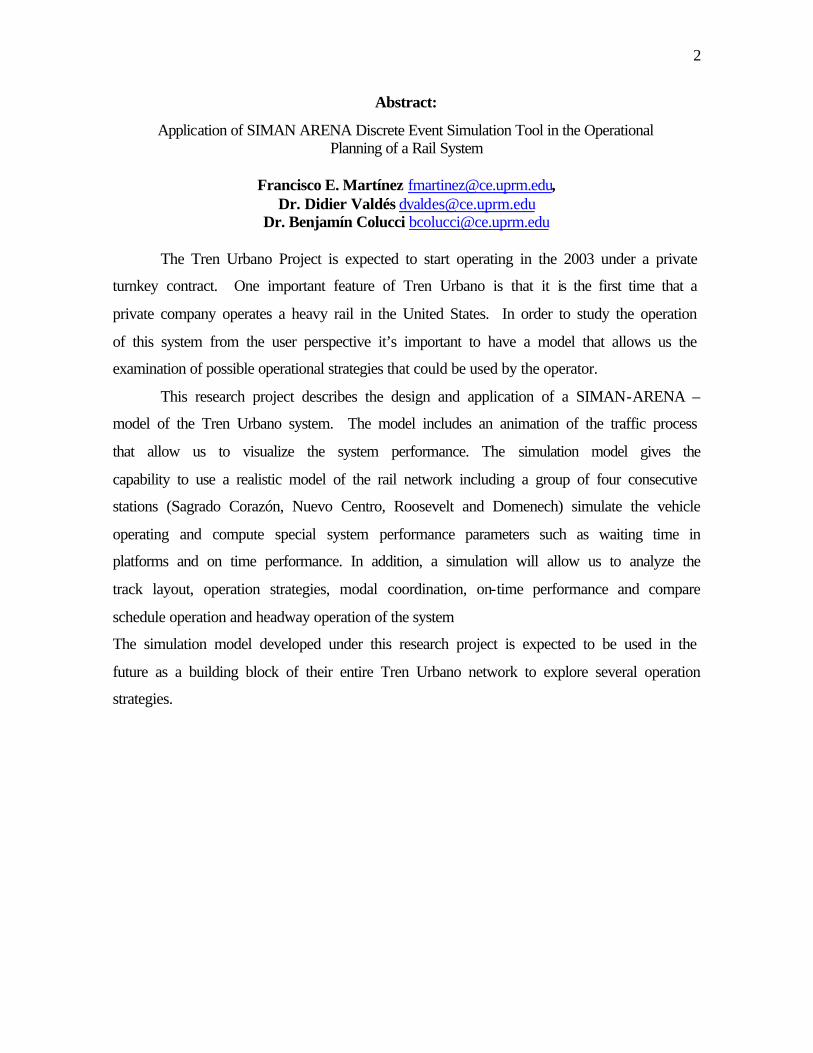
The Tren Urbano Project is expected to start operating in the 2003 under a private
turnkey contract. One important feature of Tren Urbano is that it is the first time that a
private company operates a heavy rail in the United States. In order to study the operation
of this system from the user perspective it’s important to have a model that allows us the
examination of possible operational strategies that could be used by the operator.
This research project describes the design and application of a SIMAN-ARENA –
model of the Tren Urbano system. The model includes an animation of the traffic process
that allow us to visualize the system performance. The simulation model gives the
capability to use a realistic model of the rail network including a group of four consecutive
stations (Sagrado Corazón, Nuevo Centro, Roosevelt and Domenech) simulate the vehicle
operating and compute special system performance parameters such as waiting time in
platforms and on time performance. In addition, a simulation will allow us to analyze the
track layout, operation strategies, modal coordination, on-time performance and compare
schedule operation and headway operation of the system
The simulation model developed under this research project is expected to be used in the
future as a building block of their entire Tren Urbano network to explore several operation
strategies.

3
Table of Contents
1 Introduction..................................................................................................................... 1 1.1 Motivation............................................................................................................... 1 1.2 The Tren Urbano..................................................................................................... 1 1.3 Study Methodology ................................................................................................ 2 1.4 Benefit..................................................................................................................... 3 1.5 Disadvantages ......................................................................................................... 4
2 Literature Review ........................................................................................................... 4 2.1 Description and operating system of Tren Urbano ................................................. 4 2.2 TRITAPT Software Performance Measure ............................................................ 7 2.3 Performance measure in Rail system...................................................................... 9
3 The Simulation Process ................................................................................................ 10 3.1 What is simulation: ............................................................................................... 10 3.2 Step in a Simulation Study ................................................................................... 11 3.3 Simulation Software ............................................................................................. 15 3.4 What is SIMAN Arena?........................................................................................ 16
4 Rail System Conceptual Frame Work and Modeling Variables................................... 18 4.1 Station Process ...................................................................................................... 18 4.2 Platform Process ................................................................................................... 20 4.3 Train Process ........................................................................................................ 20
5 Rail system Operation................................................................................................... 21 5.1 Schedule Based Operation:................................................................................... 21 5.2 Headway Based Operation ................................................................................... 25
6 Tren Urbano Four Station Model ................................................................................. 28 6.1. Stations to be modeled .......................................................................................... 28 6.2. Conceptual Model................................................................................................. 29 6.3. Model Assumption: .............................................................................................. 31 6.4. Data Collection..................................................................................................... 31 6.5. Model development .............................................................................................. 33
7 Model Validation.......................................................................................................... 37 7.1 The Random Incidence Theory ............................................................................ 37 7.2 Open Jackson Network Queuing Process Validation........................................... 38
8 Result and Incident Scenarios Analysis:....................................................................... 40 8.1 Ideal Operation ..................................................................................................... 41 8.2 Less than one headway Disruption....................................................................... 44 8.3 Greater than one headway but less than one headway Disruption analysis: ........ 52
9 Conclusions ................................................................................................................... 60 9.1 The importance of the simulation in the transportation and engineering ............. 60 9.2 SIMAN Arena simulation tool Benefit:................................................................ 61 9.3 The Tren Urbano Simulation Mode...................................................................... 61 9.4 Headway-Based and Schedule Based Comparison: ............................................. 61
10 Reference .................................................................................................................. 63 11 Appendix................................................................................................................... 64
Appendix 1: SIMAN Language Example ........................................................................ 64 Appendix 2: VBA Headway Based Code......................................................................... 77

4
Appendix 3: VBA Schedule Based Code ......................................................................... 79 Appendix 4: SIMAN Summary Result Sheet:.................................................................. 81
List of Tables
Table 2.1: Projected 2010 Daily Boarding and Access Mode by Station (2) .......................... 5 Table 2.2: Tren Urbano Distance and Travel Time between Stations (2)................................ 6 Table 3.1: Simulations Languages and Software ................................................................. 15 Table 6.1: Station Characteristics ......................................................................................... 28 Table 6.2: Station Passenger Inter-arrival time .................................................................... 32 Table 6.3: Tren Urbano Origin-Destine Distribution Matrix ............................................... 32 Table 6.4: Resources Service Rate and its Distribution ....................................................... 33 Table 7.1 Train Waiting Time Validations in Direction to Bayamón.................................. 37 Table 7.2 Train Waiting Time Validations in Direction to Sagrado Corazon...................... 38 Table 7.3: Model Validation for Domenech Station ............................................................ 39 Table 8.1 Studied Scenarios Description.............................................................................. 41 Table 8.2 Average Passenger Waiting and Waiting Time Ideal Operation.......................... 42 Table 8.3 Average Train Waiting Time (min) ...................................................................... 50 Table 8.4 Average Passengers Waiting in Each Station....................................................... 50 Table 8.5 Headway Indicators .............................................................................................. 51 Table 8.6 Schedule Adherence ............................................................................................. 51 Table 8.7 Average Train Waiting Time (min) ...................................................................... 58 Table 8.8 Average Passengers Waiting in Each Station....................................................... 58 Table 8.9 Headway Indicators .............................................................................................. 59 Table 8.10 Schedule Adherences.......................................................................................... 59
List of Figure
Figure 3.1: The simulation process flowchart ...................................................................... 11 Figure 3.2 Verification, Validation and Accredit process (4) ................................................ 13 Figure 3.3 SIMAN Flowcharts ............................................................................................. 16 Figure 4.1: Rail System Conceptual Framework.................................................................. 18 Figure 5.1 Schedule-Based Operation Space-Time Diagram............................................... 22 Figure 5.2 Schedule-Based Adjustment Logic ..................................................................... 23 Figure 5.3 Headway-Based Operation Space-Time Diagram .............................................. 26 Figure 5.4 Headway-Based Adjustment Logic..................................................................... 27 Figure 6.1: System Diagram................................................................................................. 29 Figure 6.2: Typical Station Diagram.................................................................................... 30 Figure 6.3: Arena Model Passenger Creation....................................................................... 34 Figure 6.3: Arena Model Station Process ............................................................................. 34 Figure 6.5: Terminal Stations platform process ................................................................... 35 Figure 7.1 System Arrival Rate Distribution Diagram......................................................... 38 Figure 8.1 Ideal Operation Time Space Diagram in Direction to Bayamón........................ 42 Figure 8.2 Ideal Operation Passenger Waiting Time............................................................ 43

5
Figure 8.3 Ideal Operation Passenger Waiting ..................................................................... 43 Figure 8.4 Three Minutes Delay Time Space Diagram in Direction to Bayamón: .............. 44 Figure 8.5 Three-Minute Delay Passenger Waiting Time Nuevo Centro:........................... 45 Figure 8.6 Three-Minute Delay Passenger Waiting Time Roosevelt:.................................. 45 Figure 8.7Three-Minute Delay Passenger Waiting Nuevo Centro:...................................... 46 Figure 8.8 Three-Minute Delay Passenger Waiting Roosevelt:........................................... 46 Figure 8.9 Three Minutes Delay Time Space Diagram in Direction to Bayamón: .............. 47 Figure 8.10 Three-Minute Delay Passenger Waiting Time Nuevo Centro:......................... 48 Figure 8.11 Three-Minute Delay Passenger Waiting Time Roosevelt:................................ 48 Figure 8.12 Three-Minute Delay Passenger Waiting Nuevo Centro:................................... 49 Figure 8.13 Three-Minute Delay Passenger Waiting Roosevelt:......................................... 49 Figure 8.14 Seven Minutes Delay Time Space Diagram in Direction to Bayamón:............ 52 Figure 8.15 Seven-Minute Delay Passenger Waiting Time Nuevo Centro:......................... 53 Figure 8.16 Seven-Minute Delay Passenger Waiting Time Roosevelt: ............................... 53 Figure 8.17 Seven-Minute Delay Passenger Waiting Nuevo Centro:.................................. 54 Figure 8.19 Seven Minutes Delay Time Space Diagram in Direction to Bayamón:............ 55 Figure 8.20 Seven-Minute Delay Passenger Waiting Time Nuevo Centro:......................... 56 Figure 8.21 Seven-Minute Delay Passenger Waiting Time Roosevelt: ............................... 56 Figure 8.22 Seven-Minute Delay Passenger Waiting Nuevo Centro:.................................. 57 Figure 8.23 Seven-Minute Delay Passenger Waiting Roosevelt:......................................... 57

1
1 Introduction
1.1 Motivation
Transit systems always are subject to disruption, this problem cause grater waiting
time, and inefficient operation of the rail system. This study is analyzing the
operational strategies necessary to recuperate the system from a disruption.
The problem under study is how the Tren Urbano system will perform under
specified conditions according to the expectations of executives and the government
involved in the Tren Urbano Project. The scope of this project is to evaluate four
stations (Domenech, Roosevelt, Nuevo Centro and Sagrado Corazón) and evaluate
how the passengers will interact in the system as well as how the train as an entities
and resource will serve the system. Our goal is to evaluate overall performance in
order to visualize if the system meets the requirements established earlier and
evaluate the system while changing several parameters in the simulation model.
1.2 The Tren Urbano
1.2.1 The Transportation Problem in the San Juan Metropolitan Area The San Juan Metropolitan Area has several traffic congestion problems and is
constantly increasing. In 1999, 50% of all inbound peak direction lane was
congested. (1) This problem result from the following conditions:
§ Concentrated population and employment density
§ High and increasing travel demand
§ Limited capacity of the highway network in the San Juan Metropolitan Area
§ Inadequate public transportation systems
§ Lack of intermodal connections
In 1994, the government of Puerto Rico decided to build the Tren Urbano to
improve in mobility in the San Juan Metropolitan Area.

2
1.3 Study Methodology
In order to study the operation of the Tren Urbano system from the user perspective, it
is important to have a model that allows the examination of possible operational
strategies that could be used by the operator.
1.3.1 Methodology This research project describes the design process of a simulation model and the
application SIMAN/Arena simulation tool to model the Tren Urbano system. This
model includes an animation of the traffic process that allow us to visualize the
systems performance. Use simulation model because this is and complex model
with multiple interaction and not exist mathematical relationship which include the
most important interaction. The Figure 1.1 present the methodology used in this
project
Figure 1.1: Methodology Flowchart
PROBLEM OVERVIEW & STATEMENT
LITERARY REVIEW
MODEL DEVELOPMENT
SCHEDULE-BASE MODEL HEADWAY -BASE MODEL
MODEL VALIDATION AND VERIFICATION
RUN INCIDENT SCENARIOS
ANALYZE OUTPUT
DOCUMENT RESULT
Tren Urbano Information

3
The model describe in this research is based in literary review of previous related
research and the Tren Urbano projection data. They are two models used to analyze
the system one model simulates the vehicle operation based on headway operation
and the other model simulate the schedule. Both models compute special system
performance parameters such as waiting time in platforms and on time performance
measure.
The model is verified and validated using Queuing Theory and Random Incidence
theory.
Minor incident scenarios are simulated in order to analyze the performance of the
Schedule Based and Headway Based system operation mode. The analyzed
incident are divided in two group according to the disruption caused.
1.3.2 Stations to be modeled The simulation model gives the capability to use a realistic model of the real
network including a group of four consecutive stations. The four Tren Urbano
stations to be modeled are: Sagrado Corazon, Hato Rey, Roosevelt, and Domenech.
These four stations are located in the most important area of San Juan because this
region has the highest concentration of the most important work facilities. The
Sagrado Corazon station is located in the gateway to Santurce; this is a significant
intermodal connection point. The Domenech station is located close to the Milla de
Oro, where are all the banks that are considered the backbone of the puertorrican
economy.
1.4 Benefit
The primary target of this research is to generate a model that gives us the capability to
use a realistic model of the rail system and its interactions between the user and the
system. The benefits of this research project are to:
§ Develop a realistic model of the Tren Urbano system
§ Visualize the traffic in the system
§ Analyze the train schedule

4
§ Compare operation strategies (Headway base, Schedule base)
§ Punctuality deviation of the train in each station
§ The number of people missing a train
§ Equipment utilization rate
§ Platform waiting time
1.5 Disadvantages
The major disadvantage of this research project is that the Tren Urbano is not currently
in operation. For this reason I do not have historical data about the operation and
performance of the system. This disadvantage can introduce errors to the model and
affect the results. In addition, the verification and validation processes are more
difficult, because they depend on the available data of expected values or similar
systems available.
2 Literature Review
2.1 Description and operating system of Tren Urbano
2.1.1 Systems Description
The Tren Urbano is expected to start operating during 2003 under a private turnkey
contract. This is the first rapid transit system to be constructed in Puerto Rico. The
first phase of the system, consists in 17.2 km of dual track heavy rail.
The Tren Urbano alignments have grade sections, elevated sections, and
underground sections at Rio Piedras. The system has 16 stations across the whole
route from Bayamón to Sagrado Corazon. The yard and the control center building
are located between the station Martínez Nadal and Las Lomas.
2.1.2 Expected ridership:
The expected ridership of the system is based on the study done for the Final
Environmental Impact Statement for the Tren Urbano Project in 1995. Based on the
1990 traffic mode data projected to 2010, the expected ridership of Tren Urbano is
113,266 trips per day (2). The expected ridership of each station is presented in the
following table:

5
Table 2.1: Projected 2010 Daily Boarding and Access Mode by Station (2)
STATION
WALK
TO
STATION
DRIVE TO
STATION
TRANSFER
AT
STATION
TOTAL
BOARDING
PERCENT
OF TOTAL
Bayamón 5823 788 16587 23198 20.5%
Deportivo 638 1030 2890 4558 4.0%
Jardines 1660 659 205 2524 2.2%
Torrimar 1115 233 378 1726 1.5%
Martínez Nadal 1699 915 3069 5683 5.0%
Las Lomas 1183 198 524 1905 1.7%
San Francisco 1333 1061 1480 3874 3.4%
Centro Medico 3732 160 6112 10400 8.8%
Cupey 3193 629 2402 6224 5.5%
Río Piedras 6498 215 5254 11967 10.6%
Universidad 1433 47 1159 2639 2.3%
Piñero 2990 20 1052 4062 3.6%
Doménech 1875 13 660 2548 2.2%
Roosevelt 5335 95 1358 6788 6.0%
Hato Rey 4684 293 6734 11711 10.3%
Sagrado
Corazón
3588 111 10156 13855 12.2%
Total 46779 6467 60020 113266 100.0%
Percentage of
Total by Mode
41.3% 5.7% 53.0% 100%
As shown in Table 2.1 the stations with more expected ridership is Bayamón, Río
Piedras, Roosevelt and Sagrado Corazón. When the system expands an increase in
ridership is expected.
2.1.3 Hours of Operation and Service schedule:

6
The system is planed to operate 20 daily hours from 5:00AM to 1:00 AM. The
planned off-peak hour headway is 12 minutes during the morning, midday, night
and weekend. During thirty minutes before the peak hour and half hour after the
peak hour the headway is 8 minutes. During peak hour, (6:30AM-8: 30AM and
3:30-6:30) the planned headway is 4 minutes.
2.1.4 Travel Times:
The travel time presented in the Operation and Maintenance plan are computed in
some simulations realized by Siemens. The travel time from Bayamón to Sagrado
Corazón and vice versa is 28 minutes. In addition, the time between the Yard and
Bayamón is 8 minutes and the time between Sagrado Corazón and the Yard is 15
minutes (without stopping at any station). Table 2.2 presents the distance and travel
time between stations.
Table 2.2: Tren Urbano Distance and Travel Time between Stations (2)
STATION
TRAVEL
TIME (SEC)
DWELL
TIME
(SEC.)
TOTAL
TIME (SEC.)
TIME
MINUTE
ACUM.
TIME
Bay. Centro 0 240 240 4 4
Bay. Depart. 93 30 113 1.883333 5.88333
Jardines 159.6 20 179.6 2.993333 8.87667
Torrimar 64.7 20 84.7 1.411667 10.2883
Martínez Nadal 102.8 20 122.8 2.046667 12.335
Las Lomas 63.3 20 83.3 1.388333 13.7233
San Francisco 77.1 20 97.1 1.618333 15.3417
Centro Medico 84.8 20 104.8 1.746667 17.0883
Cupey 94.2 20 114.2 1.903333 18.9917
Río Piedras 108.2 25 133.2 2.22 21.2117
Universidad 57.7 25 82.7 1.378333 22.59
Piñero 79.4 25 104.4 1.74 24.33

7
Domenech 63.2 25 88.2 1.47 25.8
Roosevelt 71.8 25 96.8 1.613333 27.4133
Hato Rey 58.9 25 83.9 1.398333 28.8117
Sagrado
Corazón 74 25 99 1.65 30.4617
2.1.5 Vehicles Characteristic
Siemens manufacture the Tren Urbano vehicles. The model is a steel wheeled
vehicle designed to run on steel rails on high platform boarding station. The vehicle
has Ac propulsion (IGBT) regeneration capability. Some Feature of the vehicles is:
§ Maximum Speed: 100:km/hr
§ Maximum Acceleration: 1.35 m/s2
§ Maximum deceleration: -1.35 m/s2
§ Passenger Capacity: 72 seated, 181 total
2.2 TRITAPT Software Performance Measure
2.2.1 What is TRITAPT?
TRITAPT is a software package for analyzing public transport performance (3). This
program provides:
§ Quality indicator such as speed and punctuality
§ Operational characteristic, such as running time and delay
§ Time table optimization information
§ Passenger load information
This program work in two stage the first stage generate the Trips database and the
second stage analyses the data and generate some graph and table that may help to
locate and quantify problems.
2.2.2 Analysis of Public Transport Performance developed by the software:
2.2.2.1 One day route analysis:
The program can generate a diagram for time/distance trajectories for any route.
This graph is a very useful tool to analyze the headway and the on time
performance of the system.

8
In addition the program provide the following types of graph an tables:
§ Gross and net route section time.
§ Feasibility of the time table
§ Delay between stops
§ Speed
§ Regularity
§ Punctuality Deviations
2.2.3 Punctuality Deviations:
The punctuality deviation is the difference between observed time and schedule time.
This information are presented in a graph similar to the following figure:
Figure 2.1: TRITAP Punctuality Deviation Example
The horizontal axis in the graph is labeled with two-letter abbreviations of the station. The
vertical axis shows punctuality deviation in minutes. A positive punctuality deviation
means that a vehicle is late; a negative value indicates that a vehicle is early.

9
The red fine lines indicate the earliest and latest vehicle observed. The bold black line
shows the mean punctuality deviation. The bold blue lines indicate the 15% and 85%
values.
2.3 Performance measure in Rail system
To assure the rail system success it is important to offer a good quality of service.
Transit agencies evaluate several parameters to measure the level of service for any
transit system. This section present some important parameter used in mass transit
system to measure the service reliability.
The most important parameter is the waiting time (WT). This is the time passengers
spend for waiting for a train in the platform. This parameter is important because the
passengers are very sensitive to waiting time. If the passengers spend too much time
waiting for a train, projects an inefficient operation of the system that may cause a
reduction in the ridership.
Transit agencies commonly use on-time performance to measure the reliability of the
system. In various systems, the on-time performance is measured as percentage of late
trips. In addition, several other measures are used to evaluate these parameters. For
example, the software TRITAP measures the punctuality deviation. The punctuality
deviation is the difference between schedule time and observed time. If the punctuality
deviation is greater than cero means that a vehicle is late, rather a negative value
indicates that a vehicle is early.
Other important parameter is the number of missed trip. This parameter is defines, as a
schedule trip is not completed due to one of the following reason:
§ Trip is removed for service
§ Trip is not consistent with the schedule
§ Any incident
Usually this parameter is measured as the number of missed trip or the percent of
missed trip. This parameter represents service reductions and projects an inefficient
operation and disorganization in the scheduling.
The average headway and its standard deviation is other representation of the service
consistency. The average headway represents the mean of the train headway along the

10
line in one period. The standard deviation is a measure of the headway variability. The
headway affect directly the passenger waiting time at smaller variability minor is the
passenger waiting time.
Starthman (1999) use the headway ratio as reliability measure for transit system. The
headway ratio is defined as the ratio of observed headway to schedule headway. This
reliability measure estimates the headway adherence, rather than schedule adherence.
3 The Simulation Process
3.1 What is simulation:
Simulation is the process of design a model of real system and conducting experiments
whit that model (4). A simulation model is used to describe the behavior of a process
and predict the system performance. The simulation is used before an existing system is
altered or a new system built, to reduce the chances of failure to meet specifications, to
eliminate unforeseen bottlenecks, to prevent under or over-utilization of resources, and
to optimize system performance. Simulation is used in nearly every engineering,
scientific, and technological discipline. Today, the techniques are used in the design of
new systems, the analysis of existing systems, training for all types of activities, and as
a form of interactive entertainment.
The Simulation help the engineers in several decision and analyze task and are
effectively used in:
§ Planning and analyzing several process
§ Choosing a operating strategies
§ Planning logistics system
§ Evaluating capacity and performance of existing and planed systems.
§ Predict the system performance in de future
Simulation usually is divided in two form discrete event and continuous, based on the
manner in which the state variables change. Discrete event refers to the fact that state
variables change instantaneously at distinct points in time. In a continuous simulation,
variables change continuously, usually through a function in which time is a variable.

11
3.2 Step in a Simulation Study
The essence of simulation modeling is to help the ultimate decision maker solve a
problem. The diagram in Figure 3.1 presents the different step to develop a simulation
study.
Figure 3.1: The simulation process flowchart
Formulate problem and plan the study.
Collect data
Conceptual model valid?
Construct a computer program and verify.
Make pilot runs
Validation and accredit
the model
Design experiment
Make runs
Analyze Output
Document, present, and use results
No
No
Yes
Yes
Define Conceptual Model

12
3.2.1 Formulate the problem
The first step in developing a simulation model is to define the problem that must be
addressed by the model. In this step, you define explicitly the objectives and the
scope of the project. In addition, boundaries must be defined between the problem
of interest and the surrounding environment. It is important in this step define
clearly the expected results of the simulation.
3.2.2 Conceptual Model Develop a preliminary model either graphically (e.g., block diagrams) to define the
components, descriptive variables, and interactions (logic) that constitute the
system.
This step includes the algorithms to be used to describe the system, impute required,
and output generated. The assumptions made about the system are documented in
this phase and evaluate how there assumptions affect the accuracy of the model.
The conceptual model includes a description of the amount of time, number of
personnel and equipment assets that will require to produce the model.
3.2.3 Collect Data During this phase the modeler, collect information on the system layout and
operating procedures. This information serves as input parameters, aid in the
development of the algorithm, and is used to evaluate the performance of the
simulation replications.
It is important to specify model parameters and input probability distribution as is
possible. In addition, collect data on the performance of the existing system for the
validation purposes.
3.2.4 Conceptual Model is Valid? During this step, the modeler performs a structured walk-through of the conceptual
modeling using the assumptions documented. This step helps the modeler to ensure

13
that the model’s assumptions are correct. The model is compared with the real
system until a single solution is defined that meet the objectives and requirements of
the real problem.
3.2.5 Construct a computer program.
This step consists in formulating the conceptual model in an appropriate
programming language (FORTRAN, C+++) or simulation language such as Arena,
SLAMII and others. The simulation model is constructed based on the solution
defined in the initials steps and collected data.
Before the model is created the modeler runs several pilot replication to validate the
model.
3.2.6 Verify, Validate Accredit the Model During this step confirming that the model operates the way analyst intended and
that the output of the model is believable and representative of the real system. This
is an essential step, because ensuring that the algorithm, input data, assumptions are
correct to solve the problem defined in the first step.
Figure 3.2 Verification, Validation and Accredit process (4) Validation is the process of determining that the conceptual model and the final
computer program reflect the real world situation.
Problem Space
Software Model Conceptual Model
Experimentation Analysis & Modeling
Computer Programming
Computer Model Verification
Operational Validation Conceptual Model Validity

14
By the verification step the modeler determines that the software accurately
represent the conceptual model.
3.2.7 Design Experiment
Design an experiment that will yield the desired information and determine how
each of the test runs specified in the experimental design is to be executed.
Statistical techniques may be used to design the experiment that yields the most
accurate and uncompromised data with the fewest number of simulation replicate.
3.2.8 Make runs and Collect Output Data
This is the execution of the designed and validated model according to the
experimental requirements designed in the step above. The simulation run generates
the output data required to answer the problem initially proposed.
3.2.9 Analyze Data The major objective in analyzing data are determining the performance of the
system configuration and comparing alternative system configuration. Detailed
analyses must be performed to extract long term trend and to quantify the answers
to the driving question that motivate the construction of the simulation. During this
process, statistical technique must be used to analyze the result of the model. In
Addition during this step the modeler generate some graphic, tabular information in
form that can be easily understood by diverse audience.
3.2.10 Documents Result The step are divided in the following three stages:
§ Document the assumptions, the computer program and study result for
use in the current and future projects.
§ Present study results using animation technique that can be easily
understood by diverse audience and visualize the system process.

15
§ Results are used in the decision making process if they are both valid
and credible.
3.3 Simulation Software
The simulation software can be divided in to bigger group Simulation Language and
Simulators. The simulation language is programming based using simulation software.
The simulator allows one to build a model of the desired system by using before-made
modeling constructs.
In Simulation, language software the model is developed creating a program
syntactically or graphically using language's modeling constructs. These types of
simulation software are very flexible tools but the user needs to know programming
concepts and longer modeling times.
While using simulator software in model building, little or no programming is required
to build a model, compared to simulation languages. These kinds of tools reduce the
modeling development time and are easy learning software. The disadvantage of this
software is that they are limited to modeling only those system configurations allowed
by their standard features. Flexibility in these simulators can be increased if use
programming like constructs or call external routines in any part of the model.
Some example and description of simulation tool are presented in the following table.
Table 3.1: Simulations Languages and Software
SIMULATION
LANGUAGE DESCRIPTION
GPSS H
IBM developed the original version of this langue in 1969.
This language provides iterating debugging environment
and statistical function.
SIMSCRIPT II
This complete general programming language can be used
to build discreet event simulation, continuous simulation
and combined simulation.
SIMAN/ARENA This is a combined simulation language and animation
system. This software can be used to build discreet event

16
system. This software can be used to build discreet event
simulation, continuous simulation and combined simulation.
SLAM II
This language is used for process-oriented simulation and
event oriented simulation and the combine of the two. This
language represent model in a network like structure that
include node and branches.
3.4 What is SIMAN Arena?
3.4.1 SIMAN/Arena
SIMAN is a powerful general propose simulation language for modeling discrete,
continuous and combined systems. Arena is the animation component of the
SIMAN simulation (5).
SIMAN is designed around a logical modeling framework in which the simulation
problem is divided in to a “model” component and “experiment” component. This
division is based on the theoretical concept about system developed by Zewigler
(1976). The model describes the physical element and logical element of the
systems. The experiment specifies the experimental condition under which will run
including the initial condition, running time and replications.
3.4.2 SIMAN Process.
Figure 3.3 SIMAN Flowcharts
Experiment Component
Compiler
Experiment Object File Linker
Model Object File
Compiler
Program File
Execute
Model Component
Results

17
SIMAN modeling framework is divided in two components: the model frame, and
the experimental frame, as shown in figure 3.3.
The model is a functional description of the system component and their
interactions. This framework presents the logic of the model, the creation of an
entity and the entity movement through the different queues and resources in the
system. In the framework some blocks are presented that, assign values to an
attribute or variable and other blocks, which can compute any system statistics.
The experimental framework defines the experimental condition of the model such
as run lengths and initial conditions. In this framework the modeler defines all the
resources, queues, attributes, variables, specific statistics that are used in the model.
In addition, the modeler establishes the number of repetitions and the desired results
in the report.
The system compiles the model framework and the experiment framework. When
the model and the experiment are compiled, SIMAN sends an extended listing of
the source file to the screen as each input statement is compiled. During this
process, SIMAN presents the errors, if any, in the model and the experiment.
Once the model and the experiment source files have been compiled without error
in to the object file, the next step is to link the tool resulting object in to the program
file. The link file combines the experiment and the model object file in form that
can be read and executed by the SIMAN simulation program.
When the files are successfully linked; the system is ready to execute the
simulation. To accomplish this task, run the program named SIMAN, which is
referred to ask the run processor. This program reads in the program file and
executes the simulation. In this task, SIMAN creates and writes the data to any
output files in the experiment and the result of the simulation.

18
4 Rail System Conceptual Frame Work and Modeling Variables.
The process of traveling by a rail system consists in fourth main processes, ticket
vending and validation process, the platform waiting time process, the train process and
leaves the station. Each process has many useful variable used to evaluate the efficiency
of the service. These processes are based on the user perspective. The figure 4.1 presents
the rail system conceptual framework.
Figure 4.1: Rail System Conceptual Framework
4.1 Station Process
4.1.1 The Station Process
The station process in divided in two stages: to enter the station, and to exit the
station.

19
4.1.1.1 Entering to the station
The users will arrive at the station by one of the following transportation
modes: walking, taxi, car, bus transfer, and train transfer. The arrival of
passengers is random and continuous. The exponential distribution is used
to model the arrival process because exist much variability.
The passengers arriving at the station are divided in groups according to
their destination. In addition, the passengers are divided in two groups
according to the possession of their tickets: if the passenger has the ticket or
if the passenger does not have a ticket. The user that has ticket goes directly
to the entrance line, validate the ticket and enter the station. If the user does
not have the ticket, he/she should go to a line and buy it in the ticket vending
machine. Then he/she goes directly to the entrance line, validates the ticket
and enters the station. Both groups pass to the corresponding platform.
4.1.1.2 Exit of the station
The other process that you can see in the station is the user departure of the
arrivals from other stations. Some passengers stop and go to a line and buy it
in the ticket vending machine for the next trip or use it to transfer to another
system.
4.1.2 Important Variables The important variables to model this process are:
§ Inter-arrival means time and its distribution
§ The modal distribution of the users
§ The ticket or no-ticket distribution
§ The destination distribution
§ The number of entrance gates and ticket vending machine
§ The ticket validation time and its distribution
§ The tickets buying time and its distribution
§ The arrival time of the user

20
4.2 Platform Process
4.2.1 Platform
The platform, equal to the station, has two stages: aboard the train, and the
departure of the train. When the user goes aboard the train, he/she walks to the
desired platform and waits for the arrival of the train. When a user leaves the train,
he/she goes through the platform to the exit and passes to the station.
4.3.2 Important Variables
The important variables to model this process are:
§ Arrival time of the user to the platform
§ Arrival time of the train to the station
§ The time when the user enter to the train
§ Waiting time of the user
§ Train headway
4.3 Train Process
4.3.1 The train process
The train process begins when the user aboard the train and finishes when the user
leaves the train. When the user aboard the train goes to a seat if a seat is not
available the user remain standing. Then he/she waits for the arrival of the train to
the desired station and leaves the train.
4.3.2 Important Variable to model this process: The important variables to model this process are:
§ Train speed
§ Dwell time
§ Train acceleration rate
§ Train deceleration rate
§ Train capacity
§ Train schedule
§ Travel time

21
5 Rail system Operation In the management of urban rail systems, Headway-based and Schedule-based are
the control logic used to operate a rail system according to the operational goal.
Headway-base is focuses in maintain constant headway between successive
vehicles. Schedule-based is focused in controlling the vehicles to accomplish a
desirable schedule.
In Headway-based and Schedule-based operation logic, various strategies are used
to adhere to schedule or to maintain regular headway and consistent travel time.
In practice, holding, short turning and stop-skipping control are applied to meet a
desirable headway or schedule. Holding is used usually when there is a short
preceding headway and long following headway to reduce headway variance.
Stop-skipping control are used to speedup a late vehicle.
5.1 Schedule Based Operation: Schedule-based strategies control trains so they keep the original schedule
instead of maintaining a desired headway. Therefore, the location of the previous
train is practically irrelevant in schedule-based control strategies. The direct
objective of the Schedule-based control strategy is to increase on-time performance
of train operation in order to prevent train bunching. The trains are controlled to
adhere to their own schedule regardless of how much train bunching occurs.
Nevertheless, when train movements are close to the schedule, train bunching will
be reduced.
Exist two type of Schedule-based control, the binary schedule based control
and proportional schedule based control. The Binary Schedule-Based Control
(BSBC) implies two options: full control or no control. BSBC control can be
implemented easily, because the vehicles are operated only according to the planned
schedule and the given tolerable deviation values. For schedule-based operation the
tolerable deviation parameters are composed of two bound, the early bound xH and
the late bound yH, H is the normal operation time. Moreover, proportional
Schedule-Based control holds all early train for a certain time according to the
deviation from its schedule.

22
0
50
100
150
200
250
300
350
400
450
500
550
600
650
0 240 480 720 960 1200
Time (s)
Posi
tion
(m)
Early BoundTrain 1
NormalOperationTrain 1Late BoundTrain 1
Early BoundTrain 2
NormalOperation
xH1 yH1 xH yH2
Figure 5.1 Schedule-Based Operation Space-Time Diagram
The figure 5.1 is an example of schedule-based operation Space-time Diagram.
This graph present the schedule-based operation of a two train with the respective
early bound and late bound. The factor x is the holding parameter and the factor y
is the skipping control parameter. If a train is, arrive more early than the early
bound (xH) is held to arrive inside the tolerable deviation values. If the train
arrive later than the late bound schedule it may instructed to skip this station until
return to the expected tolerance range.

23
Figure 5.2 Schedule-Based Adjustment Logic
When a system operates in “Schedule-Based Control,” the system is set to the
“Schedule Regulation Mode.” In this mode the Automatic Train Operator adjust
Dwell time and speed to correct any deviation from the planed schedule. This
adjustment occurs immediately when a train arrives at a station. The Figure 5.2
presents a flow chart of the schedule based adjustment logic.

24
When a train arrives at the station, the prediction model estimates the departure time
using the design dwell time. If the train is off-schedule, in other words the depart
time is gather or less than the normal depart time range, the systems compute how
much time the train can recover adjusting the travel speed. In the case that the train
is late the system adjust the speed in the fast mode, in the opposite situation the
system adjust the speed in the slow speed mode. For Tren Urbano specification the
speed regimen is discrete whit three modes, normal speed mode, fast mode= 1.08
normal speed and slowest mode= 0.92 normal speed.
When the speed adjustment not completely corrects the deviation, the system
corrects the dwell time. Although, if the speed adjustment result in a time
adjustment grater than the necessary the system adjust only the dwell time. The
dwell time is bounded by maximum and minimum default value. For Tren Urbano
the planed maximum dwell time is 60 sec and minimum is 15 sec, for normal
operation, the dwell time is 30 sec.
In addition to the previous mentioned adjustment, the system can also adjust the
lead train in order to adjust the time between trains and preserve the schedule. The
systems know the departure time for each station of the lead train. If the observed
headway exceed the schedule headway plus a tolerance value (For Tren Urbano 8
minute) then the lead train will be delayed. The system adjusts the lead train
because there is an increase in following headway; wish means that the trailing train
is behind schedule. The adjustment depends in the location of each train if are
entering, standing ore leaving the station. If a train is detected delayed entering to
the station the system adjust the speed and the dwell time of the train at the station
and adjust the lead train speed and dwell time at the next station. If the train is
delayed at the station, the system adjusts the speed regimen and the dwell time at
the next station. If the train is identified as delayed when leaving a station, the
speed regimen and the dwell time of the lead train are adjusted. When the headway
is minor than headway plus the tolerance value, the Automatic Train Regulator stop
adjusting the speed and dwell for the lead train, but continue adjusting the delayed
train.

25
5.2 Headway Based Operation The major objective of the headway-based control strategies is to maintain
proper train headways (that typically means equal headways) in order to reduce
bunching and passenger wait time. Headway based control correct the train
trajectory according to its location relative to the previous train. Hence, the
departure time of the previous train at the station shall be collected in order to adjust
the speed mode and the dwell time of the following train.
According to Ossuna (1972) and random incidence theory the expected value of the
waiting time is given by the following expression:
)(2)(
)(22
HEHE
WE Ht
+=
σ Equation 5.1
Where:
E (Wt) = Expected Waiting Time for Random Arriving Passenger
E (H)= Average Headway Between Trains
2Hσ = Headway Variance
The Headway-based operational logic is very helpful to reduce passengers waiting
time. This control logic trying to reduce the variance of the headway will decrease
the passengers waiting time.
The two subclasses of headway-based control are Binary Headway-Based Control
(BIH) and Proportional Headway-Based Control (PRH). "Binary" implies two
options: full control or no control. In a Proportional Headway-Based Control,
headway is proportional to the deviation from a pre-planned headway H, and no
rigid early bounds are applied.
A binary headway-based control strategy maintains the headway between
tolerable bounds x H and y H with respect to a preceding vehicle. H is the normal
headway respect to the preceding vehicle, x H is the minimum headway allowed
and y H is the maximum headway accepted.
The main objective of proportional headway is to pull the early trains
gradually to a desirable trajectory. When a train is more closer to a previous train
than the preplanned headway, the train is hold proportional to the headway

26
deviation and holding ratio x (0<x<1). At larger deviation from de expected
trajectory, more is the holding time.
050
100150200250300350400450500550600650
0 120 240 360 480 600 720 840 960 1080 1200
Tiempo (s)
Pocic
ion
(m)
xH
T2
yH
xH
T3
yH
T1
X H
Y HX H
Y H
Figure 5.3 Headway-Based Operation Space-Time Diagram The figure 5.3 presents an example of headway-based operation Space-time
Diagram. This graph present the headway-based operation of a two train with the
respective early bound and late bound. The factor x is the holding parameter and
the factor y is the skipping control parameter. If the headway between the lead train
and the preceding train is less than the early bond xH, the preceding train is held to
arrive inside the tolerable deviation values. If the headway is gather than the late
bond headway the dwell time is reduced and the speed is increased in order to adjust
the delay. In some occasion, the preceding train is instructed to skip the station.
When a system operates under headway-based strategy, the system is set to the
“Headway Regulation Mode.” In this mode the Automatic Train Operator adjust
dwell time and speed to correct any deviation from the planed headway. This
adjustment are based according to he train location relative to the previous trains.
The Figure 5.4 presents a flow chart of the headway based adjustment logic.

27
Figure 5.4 Headway-Based Adjustment Logic
When a train arrives at the station, the prediction model estimates the departure time
using the design dwell time. If the depart time is gather or less than the normal
depart time range relative to the previous train, the systems compute how much time
the train can recover adjusting the travel speed. In the case that the train is late the
system adjust the speed in the fast mode, in the opposite situation the system adjust
the speed in the slow speed mode.
If the speed adjustment not completely corrects the headway deviation, the system
corrects the dwell time. Although, if the speed adjustment result in a time
adjustment grater than the necessary the system adjust only the dwell time. If the
train is late the system reduce the dwell time moreover if the train is early the
system increase the dwell time.

28
6 Tren Urbano Four Station Model
In order to study the operation of the Tren Urbano system from the user perspective, it
is important to have a model that allows the examination of possible operational
strategies that could be used by the operator. This research project describes the design
process of a simulation model and the application SIMAN/Arena simulation tool to
model the Tren Urbano system. This model includes an animation of the traffic
processes that allow us to visualize the systems performance. The simulation model
developed under this research project is expected to be used as a building block of the
entire Tren Urbano network.
6.1. Stations to be modeled The four Tren Urbano stations to be modeled are: Sagrado Corazon, Hato Rey,
Roosevelt and Domenech.
The Sagrado Corazón Station will serve as turn back point for trains from a
northerly direction of travel to a southerly direction of travel. A crossover will be
located after the station in order to makes this change of direction. Under normal
conditions it is projected that only one train will occupy the Sagrado Corazón
station at a time, while the incoming trains will be arriving at Bayamón very close
to the same time that the outgoing train is departing.
The table 6.1 presents the most important characteristic of the modeled station.
Table 6.1: Station Characteristics
Station # gates # tellers Tvms Platform boardings (pasenger)
Domenech 3 1 3 Dual Side 2548 Roosevelt 8 2 6 Dual side 6,788 Nuevo Centro
13 3 8 Center 11,711
Sagrado Corazón
6 2 5 Center 13,855
Total 27 7 16 32354
29
6.2. Conceptual Model This section describes the preliminary model either graphically (e.g., block
diagrams) and defines the components, descriptive variables, and interactions
(logic) that constitute the system. In addition this section includes the algorithms to
be used to describe the system, impute required, and output generated. The
assumptions made about the system are presented in this section.
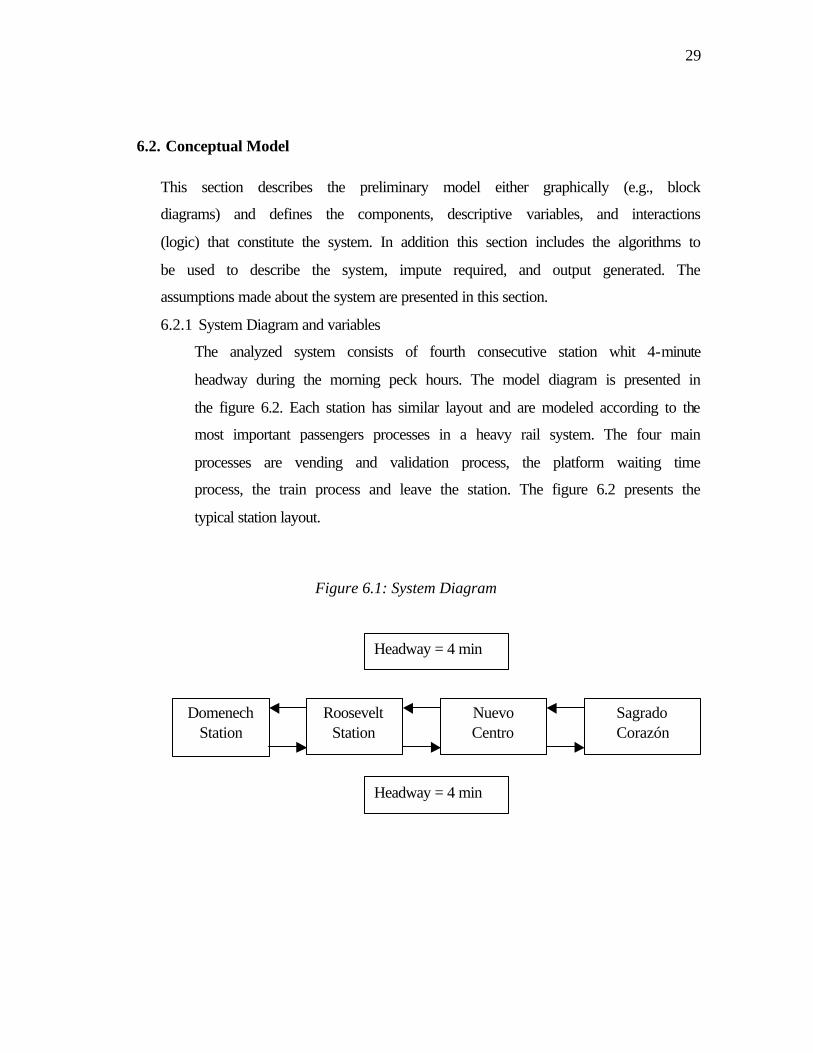
6.2.1 System Diagram and variables
The analyzed system consists of fourth consecutive station whit 4-minute
headway during the morning peck hours. The model diagram is presented in
the figure 6.2. Each station has similar layout and are modeled according to the
most important passengers processes in a heavy rail system. The four main
processes are vending and validation process, the platform waiting time
process, the train process and leave the station. The figure 6.2 presents the
typical station layout.
Figure 6.1: System Diagram
Headway = 4 min
Headway = 4 min
Roosevelt Station
Nuevo Centro
Sagrado Corazón
Domenech Station

30
Figure 6.2: Typical Station Diagram
System Variable
A. Entities
1. Dynamic Entities – users
2. Static Entities – TVM, Gates, Train and Tellers
B. Variables of state
1. TVM station # 1 (0,1,2,3,4, N y 0,1,2,3,4 S) busy or idle
2. TVM station # 2 (0-8)S and (0-4)N busy or idle
3. TVM station # 3 (0-4)N and (0-4)S busy or idle
4. Gates station #1 (0-4) N and (0-4) S busy or idle
5. Gates station #2 (0-3) N, (0-5) SA and (0-5) SB busy or idle
6. Gates station #3 (0-4) N and (0-4) S busy or idle
7. Number of people in line in station (integer variable)
8. Number of people on the platform (integer variable)
9. Teller 1,2 or 3 busy or idle
C. Events
1. Arrival of a passenger to a station
2. Transfer of a passenger to another station
3. Transfer of a passenger from a Tvm to gate.
4. Departure of a passenger
Platform: Train waiting queue Alight Passengers
Teller
30%
10% 60
TVM
Gates
Passengers Arrival (Expo.)
Passengers leave the station
31
5. Transfer of passenger from teller to platform
6. Transfer of passenger from gates to platform
D. Attributes
1. Destine
2. Have ticket? 1= have 2 = buy at TVM, buy at Teller
3. Arrival time to platform
6.3. Model Assumption:
Several assumptions are made to simplify the model because we do not have known
of several details of the system. The most important are listed below:
o The system operates in the morning peak hour.
o Assume people arrive randomly with an exponential distribution
o The Queuing discipline is FIFO.
o The service rates are adapted from similar system.
o No Train Control Strategies Restriction
o The distribution of passenger payment method is 60% have ticket, 20% buy
at TVM and 10% buy at Teller.
o The walking time between the gates and the platform discard elevator time
an mechanic escalators time.
6.4. Data Collection Data collected for this model was provided by the Tren Urbano Office, and was
used to evaluate the overall performance of the system under specified conditions
and chosen environment. The service rates are adapted from systems similar to the
Tren Urbano.

32
The passenger inter-arrival time assumed to be exponential and is based on the Tren
Urbano ridership projections. The Table 6.2 presents the inter-arrival time for each
station in the morning peak period. The passenger distributions are presented in the
Origin-Destine Matrix in Table 6.3 this matrix is based on the Cambridge
Systematic studies for Tren Urbano Project. Each value in the table represents the
percent of the arrived passenger go to the respective station.
Table 6.2: Station Passenger Inter-arrival time
STATION INTER-ARRIVAL
TIME TO SC (MIN/PSG)
INTER-ARRIVAL
TIME TO BAY (MIN/PSG)
Domenech .8571 .3821
Roosevelt 1.7143 .2222
Nuevo Centro 2.1429 .2359
Sagrado Corazon 0 .0554
Table 6.3: Tren Urbano Origin-Destine Distribution Matrix
BAY DEP RBA TOR MRN SAL SFR CME CUP RPI UPR CJU DOM HAR NCE SCO BAY 0.0 0.1 1.8 1.1 3.3 2.3 1.7 5.8 11.3 18.1 20.5 4.3 3.4 9.3 7.9 9.0 DEP 1.0 0.0 2.0 1.0 3.4 2.4 1.8 5.7 12.6 18.0 20.3 4.1 3.2 9.4 7.6 8.6 RBA 55.7 44.3 0.0 5.8 5.3 4.1 2.1 4.8 10.0 16.5 16.1 3.3 2.5 8.2 6.3 14.9 TOR 51.4 26.1 22.5 0.0 2.8 3.2 1.9 5.1 15.7 21.4 19.4 3.5 2.7 6.3 6.0 12.0 MRN 53.0 34.5 8.7 3.8 0.0 0.1 0.9 4.9 14.9 17.4 22.8 3.4 2.9 6.7 6.7 19.5 SAL 53.0 32.6 9.3 5.0 0.2 0.0 0.8 4.8 11.8 16.4 23.6 3.4 2.8 7.4 6.9 22.0 SFR 51.6 34.0 6.4 4.6 0.8 2.6 0.0 2.0 13.6 4.9 30.4 4.3 3.4 8.5 7.2 25.8 CME 51.1 30.8 4.8 4.8 2.4 5.9 0.3 0.0 8.7 5.0 30.3 4.1 3.6 9.2 7.4 31.7 CUP 41.3 26.0 3.5 7.5 2.9 5.4 8.0 5.3 0.0 0.6 20.0 4.9 4.9 16.4 11.7 41.5 RPI 43.5 28.3 3.7 6.2 2.3 5.4 9.4 1.2 0.0 0.0 0.4 0.7 3.6 17.6 24.3 53.4 UPR 35.8 21.1 2.7 3.8 1.8 5.4 8.6 6.7 13.9 0.1 0.0 0.0 5.0 21.1 16.7 57.3 CJU 42.0 25.6 3.4 3.6 1.3 4.2 6.4 4.0 7.0 1.6 0.9 0.0 0.7 19.9 25.7 53.7 DOM 27.4 16.9 2.2 2.2 1.2 2.9 4.5 3.1 12.8 13.6 13.3 0.0 0.0 7.6 11.2 81.2 HAR 24.3 14.8 1.9 1.6 1.0 2.6 3.8 2.4 13.2 18.4 14.4 1.0 0.5 0.0 0.0 100.0 NCE 23.0 14.0 1.8 1.7 1.1 2.5 3.4 1.9 13.4 20.3 14.2 1.6 1.1 0.0 0.0 100.0 SCO 12.6 6.2 1.4 1.4 1.5 3.9 6.1 5.1 19.7 20.6 16.6 3.3 1.5 0.2 0.0 0.0
The service rate is adapted of system similar to the Tren Urbano. The table 6.4
presents the service rates and its statistical distribution.

33
Table 6.4: Resources Service Rate and its Distribution
RESOURCE MEAN SERVICE TIME (MIN) DISTRIBUTION (MIN)
Teller .75 Triangular (.6,.75,1.1)
TVM .75 Triangular (.5,.75,1)
Gates .075 Triangular (.05,.075,.1)
6.5. Model development In this section is formulated the conceptual model in an appropriate simulation
language such as Arena. The simulation model is constructed based on the solution
defined in the initials steps and collected data.
The station Model:
This model represents the arrival process of people to the station, Payment method
and gates. The passenger is created and then is transported to the Station. Then
According if have ticket or no are distributed in the different station. If the
passenger has ticket go directly to the entrance gates, moreover, if the passengers do
not has ticket go to the TVM or teller and then go to the entrance gates. Then the
passengers go to the desired platform according to the travel direction.
The figure 6.3 show the Arena Interface related to passenger creation and attribute
designation. The arrival of passengers is random and continuous. The exponential
distribution is used to model the arrival process because exist much variability. The
typical station logic is presented figure 6.4. , The passengers are divided in two
groups according to the possession of their tickets: if the passenger has the ticket or
if the passenger does not have a ticket. The user that has ticket goes directly to the
entrance line, validate the ticket and enter the station. If the user does not have the
ticket he/she should go to a line and buy it in the ticket vending machine. Then
he/she goes directly to the entrance line, validates the ticket and enters the station.
Finally the passenger pass to the corresponding platform according to the
destination. The Appendix 1 has an SIMAN model example.

34
Figure 6.3: Arena Model Passenger Creation
Figure 6.3: Arena Model Station Process
Passenger Creation
Entrance Selection
Passenger Arrive to the Station
TVM
Entrance Gates Platform Selection

35
Figure 6.5: Terminal Stations platform process
Figure 6.6: Intermediate Stations platform process
Passenger Alight Platform
Arrive train to the station
Passenger exit Passenger Abord Platform
Train Creation
Headway or Schedule Logic Block
Train Depart the Station
Passenger Boarding
Headway or Schedule Logic Block
Train Arrive
Train Depart
Passenger Exit
Passenger Arrive
Passenger Abroad the Train

36
The platform and train processes are presented together and vary if the station is a
terminal station or the platform is an intermediate station. Both cases are presented
in the Figure 6.5 and Figure 6.6 respectively In this process the passenger arrive to
the platform and white for a train. When the train arrives the system check if the
passenger can hold the train. When a train arrives at the stations the passenger have
30 second to leave or pick-up passengers. If a passengers no leave the train at this
station and is added to the train group.
The headway based or Schedule based logic is implemented using Visual Basic
Application VBA in the respective VBA block. The schedule based and headway-
based logic used in the VBA is previously discussed in the Rail system operation
section. Both codes are presented in the Appendix 2 and 3 respectiveley.

37
7 Model Validation
We use Queuing Theory and Random incidence theory to validate the system queuing
process and train waiting time. Before validate the model is necessary to run a pilot
run in order to analyze the model performance. Ten replications are conducted in order
to perform the system validation.
7.1 The Random Incidence Theory The Random incidence theory is based on a random time assumption. A potential
train passenger, start observing the process at random time, and he or she wishes to
obtain the mean time she or he must wait until the next arrival occur. This expected
waiting time depend on the history of actual arrival time process. If the system has
no incident situation, the expected waiting time is nearest to a half of the headway.
For headway of 4 minutes, the expected waiting time is 2 minutes. For the system,
the average waiting time is 1.985 minute whereby the model waiting time validates.
The Table 7.1 and 7.2 presents the random incidence verification for both travel
directions.
Table 7.1 Train Waiting Time Validations in Direction to Bayamón
STATION AVERAGE
WAITING TIME
UPPER
BOND
LOWER
BOND
EXPECTED
VALUE
VALIDATE?
Domenech 1.9947 2.0212 1.9947 2 YES
Nuevo Centro 1.988 2.024 1.952 2 YES
Roosevelt 1.986 2.022 1.901 2 YES
Domenech 2.0125 2.0485 1.9465 2 YES

38
Table 7.2 Train Waiting Time Validations in Direction to Sagrado Corazon
STATION AVERAGE
WAITING TIME
UPPER
BOND
LOWER
BOND
EXPECTED
VALUE
VALIDATE?
Domenech NA NA NA NA NA Nuevo Centro 1.9675 1.7775 1.9675 2 YES Roosevelt 1.963 2.009 1.917 2 YES Domenech 1.9854 2.0414 1.9294 2 YES
7.2 Open Jackson Network Queuing Process Validation The second part of the validation is made using Queuing Theory with a M/M/1/inf
system whit parallel channels. To validate the model using queuing theory is
necessary to considerate the following:
• Its important that the parameter arrival rate divided by the service
rate( r) <1
• The probability that a server its Busy= ρ .
Domenech station is selected to analyze the validation of the model because all
station has similar characteristic.
Open Jackson Network Software is used to analyze the passenger arrival rate and
node performance for Domenech station. The diagram presented in Figure 7.1
present the passenger arrival step to each stage.
Figure 7.1 System Arrival Rate Distribution Diagram
TVM
Station Entrance Gates Platform
Teller
.30
.60
.1
1
1
1

39
Table 7.3: Model Validation for Domenech Station
Domenech AVERAGE Node Performance Measures Node LLEG TVM GATE TELLER PLAT g 2.617116 0 0 0 0 m 0.000001 1.333333 13.33333 1.333333 0.00001 Servers 10 3 3 1 1 l 2.617116 0.785135 2.355404 0.261712 2.617116 r 19.63% 5.89% 19.63% L 0.594581 0.176707 0.24422 Lq 0.00573 5.12E-05 0.047936 W 0.757298 0.075022 0.933165 Wq 0.007298 2.17E-05 0.183165 Domenech MAX Node Performance Measures Node LLEG TVM GATE TELLER PLAT g 2.617116 0 0 0 0 m 0.000001 1 10 0.909091 0.00001 Servers 10 3 3 1 1 l 2.617116 0.785135 2.355404 0.261712 2.617116 r 26.17% 7.85% 28.79% L 0.802719 0.2357 0.404263 Lq 0.017584 0.000159 0.11638 W 1.022396 0.100068 1.544689 Wq 0.022396 6.76E-05 0.444689
Domenech MIN Node Performance Measures Node LLEG TVM GATE TELLER PLAT g 2.617116 0 0 0 0 m 0.000001 1.666667 20 2 0.00001 Servers 10 3 3 1 1 l 2.617116 0.785135 2.355404 0.261712 2.617116 r 15.70% 3.93% 13.09% L 0.473483 0.117781 0.150557 Lq 0.002402 1.03E-05 0.019701 W 0.60306 0.050004 0.575279 Wq 0.00306 4.37E-06 0.075279

40
Domenech Station Validation TVM PARAMETER
MODEL AVERAGE
MAX AVERAGE MIN
r 21% 26.17% 19.63% 15.70% TRUE TRUE Validate Lq 0.010137 0.017584 0.00573 0.002402 TRUE TRUE Validate Wq 0.01 0.022396 0.007298 0.00306 TRUE TRUE Validate GATES PARAMETER
MODEL AVERAGE
MAX AVERAGE MIN
r 7.83% 7.85% 5.89% 3.93% TRUE TRUE Validate Lq 4.01E-05 0.000159 5.12E-05 1.03E-05 TRUE TRUE Validate Wq 5.30E-06 6.76E-05 2.17E-05 4.37E-06 TRUE TRUE Validate TELLER PARAMETER
MODEL AVERAGE
MAX AVERAGE MIN
r 28.76% 28.79% 19.63% 13.09% TRUE TRUE Validate Lq 0.04 0.11638 0.047936 0.019701 TRUE TRUE Validate Wq 0.2 0.444689 0.183165 0.075279 TRUE TRUE Validate
As presented in the table 7.3 the system validates for Domenech station so the
model logic validate.
8 Result and Incident Scenarios Analysis:
This section present the most relevant result related to the simulation model.
The firs result presented are related to an ideal operation of the system. These results
are used as base case scenario to compeer the system normal operation and system
incident scenarios.
The minors incident scenarios analyzed in this research project are presented in the
table 8.1. The Scenario is divided in two case by the delay time and is solved using
headway based operation and Schedule based operation.

41
Table 8.1 Studied Scenarios Description
SCENARIO DELAY RANGE DESCRIPTION
1 Less than one headway 3 minute NC direction to Bay
2 Greater than one headway but less than two headways
7 minutes delay at Roosevelt station direction to Bay.
8.1 Ideal Operation
The normal operation analyzed in this section represents the morning peak hour. The
headway is 4 minutes and no incident situation occurs during the two our modeled. The
Figure 8.1 presents the normal operation Time Space Diagram in Direction to
Bayamón. Appendix 4 presents a result summary.

42
Figure 8.1 Ideal Operation Time Space Diagram in Direction to Bayamón
The number of passenger waiting depends in the passenger arrival process to the
station and the resources performance. The table 8.2 presents the Average passenger
waiting for an Ideal operation and average waiting time. In addition the figure 8.2 and
8.3 present the ideal operation passenger waiting time and passenger waiting
respectively for station Roosevelt.
Table 8.2 Average Passenger Waiting and Waiting Time Ideal Operation
STATION LOCATION AVERAGE WAITING
WAITING TIME
SC 265.33 53.130 2.14 NC 258.21 17.73 2.05 ROS 250.85 39.32 2.02
TIME SPACE DIAGRAM
240
245
250
255
260
265
270
0 20 40 60 80 100
TIME (min)
Loc
atio
n (M
)
TRAIN 1 TRAIN 2 TRAIN 3 TRAIN 4
TRAIN 5 TRAIN 6 TRAIN 7 TRAIN 8
TRAIN 9 TRAIN 10 TRAIN 11 TRAIN 12
TRAIN 13 TRAIN 14 TRAIN 15 TRAIN 16
TRAIN 17 TRAIN 18 TRAIN 19 TRAIN 20

43
Figure 8.2 Ideal Operation Passenger Waiting Time
Figure 8.3 Ideal Operation Passenger Waiting
Passenger Waiting ROS
0
10
20
30
40
50
60
0.00 20.00 40.00 60.00 80.00 100.00 120.00
TIME (MIN)
Pas
sen
ger
Wai
tin
g (
Pas
sen
ger
)
Passenger Waiting TIME NC
Passenger Waiting TIME ROS
0.00
0.50
1.00
1.50
2.00
2.50
3.00
3.50
4.00
4.50
5.00
0.00 20.00 40.00 60.00 80.00 100.00 120.00
TIME (MIN)
WA
ITIN
G T
IME
(MIN
)
Passenger Waiting TIME NC

44
8.2 Less than one headway Disruption
The incident scenario 1 represents a minor disruption that is less than one headway.
This scenario is a failure in the system at station Nuevo Centro at 7:27 AM. The
disruption caused by this scenario is 3 minute.
8.2.1 Schedule Base Approach The results presented in this section are based on a schedule-based approach
to recuperate to the delay. Figure 8.4 p resent the time space diagram for the
established scenario. The train 14 is affected by the failure in the station NC.
The train 15 is to close to the train 14 this cause bunching in the system. The
waiting time increase at the incidents time but then return to the normal
value. Similar occurs with the passenger waiting in the platform. The figure
8.5 and 8.6 present how vary the passenger Waiting Time at NC and ROS
respectively. In addition the Figure 8.7 and 8.8 present how vary the
passenger Waiting at NC and ROS respectively.
Figure 8.4 Three Minutes Delay Time Space Diagram in Direction to Bayamón:
TIME SPACE DIAGRAM
240
245
250
255
260
265
270
0.00 10.00 20.00 30.00 40.00 50.00 60.00 70.00 80.00 90.00
TIME (min)
Loca
tion
(M)
TRAIN 1 TRAIN 2 TRAIN 3 TRAIN 4 TRAIN 5
TRAIN 6 TRAIN 7 TRAIN 8 TRAIN 9 TRAIN 10
TRAIN 11 TRAIN 12 TRAIN 13 TRAIN 14 TRAIN 15
TRAIN 16 TRAIN 17 TRAIN 18 TRAIN 19 TRAIN 20

45
Figure 8.5 Three-Minute Delay Passenger Waiting Time Nuevo Centro:
Passenger Waiting TIME NC
0.00
2.00
4.00
6.00
8.00
10.00
12.00
0.00 20.00 40.00 60.00 80.00 100.00 120.00
TIME (MIN)
WA
ITIN
G T
IME
(MIN
)
Passenger Waiting TIME NC
INCIDENT
Figure 8.6 Three-Minute Delay Passenger Waiting Time Roosevelt:
Passenger Waiting TIME ROS
0.00
5.00
10.00
15.00
20.00
25.00
0.00 20.00 40.00 60.00 80.00 100.00 120.00
TIME (MIN)
WA
ITIN
G T
IME
(MIN
)
Passenger Waiting TIME NC
Incident

46
Figure 8.7Three-Minute Delay Passenger Waiting Nuevo Centro:
Passenger Waiting NC
0
5
10
15
20
25
30
0.00 20.00 40.00 60.00 80.00 100.00 120.00
TIME (MIN)
Pas
seng
er W
aitin
g (P
asse
nger
)
Passenger Waiting TIME NC
Incident
Figure 8.8 Three-Minute Delay Passenger Waiting Roosevelt:
Passenger Waiting ROS
0
10
20
30
40
50
60
0.00 20.00 40.00 60.00 80.00 100.00 120.00
TIME (MIN)
Pas
seng
er W
aitin
g (P
asse
nger
)
Passenger Waiting TIME NC
INCIDENT

47
8.2.2 Headway Based Solution Approach The results presented in this section are based on a headway-based approach
to recuperate to the delay. Figure 8.8 present the time space diagram for the
established scenario. The train 14 is affected by the failure in the station NC.
The train 15 is to close to the train 14 this cause bunching in the system. The
waiting time increase at the incidents time but then return to the normal
value. Similar occurs with the passenger waiting in the platform. The figure
8.9 and 8.10 present how vary the passenger Waiting Time at NC and ROS
respectively. In addition the Figure 8.11 and 8.12 present how vary the
passenger Waiting at NC and ROS respectively.
Figure 8.9 Three Minutes Delay Time Space Diagram in Direction to Bayamón:
TIME SPACE DIAGRAM
240
245
250
255
260
265
270
0.00 10.00 20.00 30.00 40.00 50.00 60.00 70.00 80.00 90.00
TIME (min)
Loca
tion
(M)
TRAIN 1 TRAIN 2 TRAIN 3 TRAIN 4 TRAIN 5 TRAIN 6 TRAIN 7
TRAIN 8 TRAIN 9 TRAIN 10 TRAIN 11 TRAIN 12 TRAIN 13 TRAIN 14
TRAIN 15 TRAIN 16 TRAIN 17 TRAIN 18 TRAIN 19 TRAIN 20

48
Figure 8.10 Three-Minute Delay Passenger Waiting Time Nuevo Centro:
Figure 8.11 Three-Minute Delay Passenger Waiting Time Roosevelt:
Passenger Waiting TIME ROS
0.00
5.00
10.00
15.00
20.00
25.00
0.00 20.00 40.00 60.00 80.00 100.00 120.00
TIME (MIN)
WA
ITIN
G T
IME
(MIN
)
Passenger Waiting TIME NC
Incident
Passenger Waiting TIME NC
0.00
2.00
4.00
6.00
8.00
10.00
12.00
0.00 20.00 40.00 60.00 80.00 100.00 120.00
TIME (MIN)
WA
ITIN
G T
IME
(MIN
)
Passenger Waiting TIME NC
Incident

49
Figure 8.12 Three-Minute Delay Passenger Waiting Nuevo Centro:
Passenger Waiting NC
0
5
10
15
20
25
30
0.00 20.00 40.00 60.00 80.00 100.00 120.00
TIME (MIN)
Pas
seng
er W
aitin
g (P
asse
nger
)
Passenger Waiting TIME NC
INCIDENT
Figure 8.13 Three-Minute Delay Passenger Waiting Roosevelt:
Passenger Waiting ROS
0
10
20
30
40
50
60
0.00 20.00 40.00 60.00 80.00 100.00 120.00
TIME (MIN)
Pas
sen
ger
Wai
tin
g (
Pas
sen
ger
)
Passenger Waiting TIME NC
Incident

50
8.2.3 Result Comparison To determine where approach is better is necessary to compeer the performance of both system. The table 8.3 compares the Passenger Waiting time. The table 8.4 compares the Passengers Waiting in Each Station. Then present some important service reliability parameter to compeers both operations.
Table 8.3 Average Train Waiting Time (min)
STATION IDEAL OPERATION
SCHEDULE OPERATION
HEADWAY OPERATION
Sagrado Corazon 2.14 2.07 2.05
Nuevo Centro 2.05 2.57 2.31
Hato Rey 2.02 2.78 2.75
According to the presented in Table 8.3, the headway base operation results
in minor train waiting times in each station. Moreover, the passenger waiting
time is greatly affected by the operation mode and the disruption time.
Table 8.4 Average Passengers Waiting in Each Station
STATION IDEAL OPERATION
SCHEDULE OPERATION
HEADWAY OPERATION
Sagrado Corazon 53.13 53.65 54.7
Nuevo Centro 17.73 16.91 17.59
Hato Rey 39.32 39.95 37.68
According to the presented in Table 8.4 the schedule base operation reduce
the number of passengers waiting. Nevertheless, the headway based
operation work better after the affected station. Furthermore, the numbers of
passengers that are waiting in any station is not sever affected by any less
than one headway incident or operational strategies.

51
Table 8.5 Headway Indicators
STATION IDEAL
OPERATION
SCHEDULE
OPERATION
HEADWAY
OPERATION
Sagrado Corazon 1 1 1
Nuevo Centro 1 1 1
Roosevelt 1 1.4 1.4
Domenech 1 1.4 1
The headway indicator is a measure of headway adherence defined as the
running headway and design headway ratio. If the headway indicator is
grater than one, mean that the train is late in some station rather if the
headway indicator is less than one mean that the train is early in some
station. As presented in the table 8.5 the headway base operation work more
effectively with incident in order to maintain service regularity.
Table 8.6 Schedule Adherence
STATION IDEAL
OPERATION
SCHEDULE
OPERATION
HEADWAY
OPERATION
Sagrado Corazon 0 0 0
Nuevo Centro 0 -.11 -.11
Roosevelt 0 -.1 -.1
Domenech 0 0 -.1
The schedule adherence measure is defines as the different between the
design arrival time and the arrival time. If the schedule adherence is negative
means that the train arrives late to some station, rather mean that the train
arrives early to the station. As shown in the table 8.6 the schedule based
operation adjusts the system better to the schedule time. Furthermore, the
headway base operation also adjusts easily to the headway.

52
8.3 Greater than one headway but less than one headway Disruption analysis: The incident scenario 1 represents a minor disruption that is greater than one
headway but less than two headway. This scenario is a failure in the system at
station Roosevelt Centro at 7:33 AM. The disruption caused by this scenario is 7
minute.
8.3.1 Schedule Base Approach The results presented in this section are based on a schedule-based approach
to recuperate to the delay. Figure 8.14 presents the time space diagram for
the established scenario. The train 15 is affected by the failure in the station
NC. The trains 16,17 are affected by the delay and wait in a queue until the
station is free. Then the train runs to close to the train causing bunching in
the system and service irregularity. The waiting time increase at the
incidents time but then return to the normal value. Similar occurs with the
passenger waiting in the platform. The figure 8.15 and 8.16 present how
vary the passenger waiting time at NC and ROS respectively. In addition
the Figure 8.17 and 8.18 present how vary the passenger waiting at NC and
ROS respectively.
Figure 8.14 Seven Minutes Delay Time Space Diagram in Direction to Bayamón:
TIME SPACE DIAGRAM
240
245
250
255
260
265
270
0.00 10.00 20.00 30.00 40.00 50.00 60.00 70.00 80.00 90.00
TIME (min)
Loca
tion
(M)
TRAIN 1 TRAIN 2 TRAIN 3 TRAIN 4 TRAIN 5 TRAIN 6 TRAIN 7
TRAIN 8 TRAIN 9 TRAIN 10 TRAIN 11 TRAIN 12 TRAIN 13 TRAIN 14
TRAIN 15 TRAIN 16 TRAIN 17 TRAIN 18 TRAIN 19 TRAIN 20
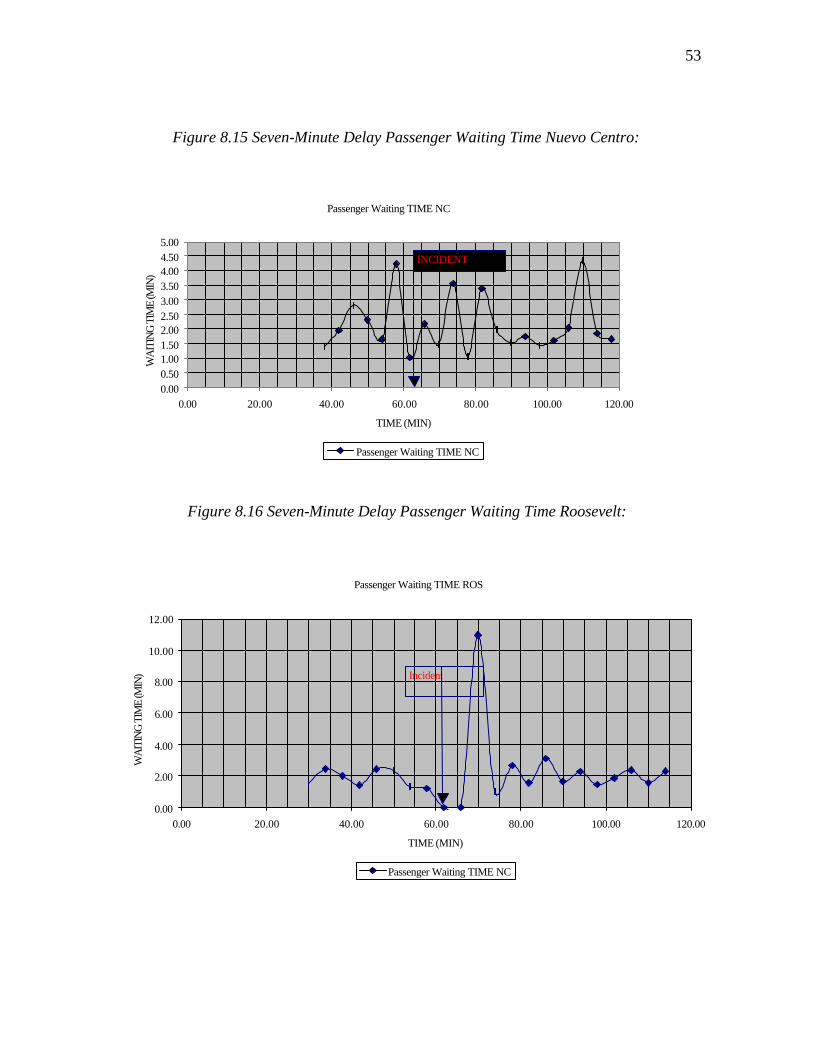
53
Figure 8.15 Seven-Minute Delay Passenger Waiting Time Nuevo Centro:
Passenger Waiting TIME NC
0.000.501.001.502.002.503.003.504.004.505.00
0.00 20.00 40.00 60.00 80.00 100.00 120.00
TIME (MIN)
WA
ITIN
G T
IME
(MIN
)
Passenger Waiting TIME NC
INCIDENT
Figure 8.16 Seven-Minute Delay Passenger Waiting Time Roosevelt:
Passenger Waiting TIME ROS
0.00
2.00
4.00
6.00
8.00
10.00
12.00
0.00 20.00 40.00 60.00 80.00 100.00 120.00
TIME (MIN)
WA
ITIN
G T
IME
(MIN
)
Passenger Waiting TIME NC
Incident

54
Figure 8.17 Seven-Minute Delay Passenger Waiting Nuevo Centro:
Passenger Waiting NC
0
5
10
15
20
25
30
0.00 20.00 40.00 60.00 80.00 100.00 120.00
TIME (MIN)
Pass
enge
r Wai
ting
(Pas
seng
er)
Passenger Waiting TIME NC
INCIDENT
Figure 8.18 Seven -Minute Delay Passenger Waiting Roosevelt:
Passenger Waiting ROS
0
20
40
60
80
100
120
0.00 20.00 40.00 60.00 80.00 100.00 120.00
TIME (MIN)
Pass
enge
r Wai
ting
(Pas
seng
er)
Passenger Waiting TIME NC
INCIDENT

55
8.3.2 Headway Based Solution Approach The results presented in this section are based on a headway-based approach
to recuperate to the delay. Figure 8.19 present the time space diagram for the
established scenario The train 15 is affected by the failure in the station NC.
The trains 16,17 are affected by the delay and wait in a queue until the
station is free. Similar to the schedule base approach the train runs to close
to the train causing bunching in the system and service irregularity and
instability. The waiting time increase at the incidents time but then return to
the normal value. Similar occurs with the passenger waiting in the platform.
The figure 8.20 and 8.21 present how vary the passenger waiting time at NC
and ROS respectively. In addition, the Figure 8.22 and 8.23 present how
vary the passenger waiting at NC and ROS respectively.
Figure 8.19 Seven Minutes Delay Time Space Diagram in Direction to Bayamón:
TIME SPACE DIAGRAM
240
245
250
255
260
265
270
0.00 10.00 20.00 30.00 40.00 50.00 60.00 70.00 80.00 90.00
TIME (min)
Loca
tion
(M)
TRAIN 1 TRAIN 2 TRAIN 3 TRAIN 4 TRAIN 5
TRAIN 6 TRAIN 7 TRAIN 8 TRAIN 9 TRAIN 10
TRAIN 11 TRAIN 12 TRAIN 13 TRAIN 14 TRAIN 15
TRAIN 16 TRAIN 17 TRAIN 18 TRAIN 19 TRAIN 20

56
Figure 8.20 Seven-Minute Delay Passenger Waiting Time Nuevo Centro:
Passenger Waiting TIME NC
0.00
0.50
1.00
1.50
2.00
2.50
3.00
3.50
4.00
4.50
0.00 20.00 40.00 60.00 80.00 100.00 120.00
TIME (MIN)
WA
ITIN
G T
IME
(MIN
)
Passenger Waiting TIME NC
INCIDENT
Figure 8.21 Seven-Minute Delay Passenger Waiting Time Roosevelt:
Passenger Waiting TIME ROS
0.00
2.00
4.00
6.00
8.00
10.00
12.00
0.00 20.00 40.00 60.00 80.00 100.00 120.00
TIME (MIN)
WA
ITIN
G T
IME
(MIN
)
Passenger Waiting TIME NC
INCIDENT

57
Figure 8.22 Seven-Minute Delay Passenger Waiting Nuevo Centro:
Passenger Waiting NC
0
5
10
15
20
25
30
0.00 20.00 40.00 60.00 80.00 100.00 120.00
TIME (MIN)
Pass
enge
r Wai
ting
(Pas
seng
er)
Passenger Waiting TIME NC
INCIDENT
Figure 8.23 Seven-Minute Delay Passenger Waiting Roosevelt:
Passenger Waiting ROS
0
20
40
60
80
100
120
0.00 20.00 40.00 60.00 80.00 100.00 120.00
TIME (MIN)
Pass
enge
r W
aitin
g (P
asse
nger
)
Passenger Waiting TIME NC
INCIDENT

58
8.3.3 Result Comparison This section compeer the performance of both system under incidents
greater than one headway but less than two headway. The table 8.3
compares the Passenger Waiting time. The table 8.4 compares the
Passengers Waiting in Each Station. Then present some important service
reliability parameter to compeers both operations.
Table 8.7 Average Train Waiting Time (min)
STATION IDEAL OPERATION
SCHEDULE OPERATION
HEADWAY OPERATION
Sagrado Corazon 2.14 2.07 2.04
Nuevo Centro 2.05 2.15 2.09
Hato Rey 2.02 2.16 2.16
According to the presented in Table 8.7, the headway base operation results
in minor train waiting times in each station. However, in the last station both
system are similar.
Table 8.8 Average Passengers Waiting in Each Station
STATION IDEAL OPERATION
SCHEDULE OPERATION
HEADWAY OPERATION
Sagrado Corazon 53.13 55 54.16
Nuevo Centro 17.73 18 17.59
Hato Rey 39.32 48.59 48.41
According to the presented in Table 8.8 the headway base operation reduce
the number of passengers waiting. Furthermore, the numbers of passengers

59
that are waiting in any station are strongly affected by any grater than one
headway incident or operational strategies.
Table 8.9 Headway Indicators
STATION IDEAL
OPERATION
SCHEDULE
OPERATION
HEADWAY
OPERATION
Sagrado Corazon 1 1 1
Nuevo Centro 1 1 1
Roosevelt 1 1.04 1.04
Domenech 1 1.04 1
As presented in the table 8.9 the headway base operation work more
effectively with incident in order to maintain service regularity.
Table 8.10 Schedule Adherences
STATION IDEAL
OPERATION
SCHEDULE
OPERATION
HEADWAY
OPERATION
Sagrado Corazon 0 0 0
Nuevo Centro 0 0 0
Roosevelt 0 -.39 -.39
Domenech 0 -.44 -.46
As shown in the table 8.10 the schedule based operation and headway-based operation tend
to be similar and has similar adherence the schedule time. The system adjust better to the
schedule when using schedule-based operation, but the headway base operation also adjusts
easily to the schedule.

60
9 Conclusions
9.1 The importance of the simulation in the transportation and engineering
Simulation will certainly play a greater role in the future development of railways
and public transportation systems. This process is very important to key
stakeholders to visualize how the system will respond in order to support the
project.
This simulation model provides a tool to demonstrate the systems capacities as well
as describing how the system will react when certain parameters are changed. This
is very useful, especially when great quantities of money are involved. It is also
important to obtain high executive support in order for a project of this magnitude
to succeed
The Simulation help us the engineers in several decision and analyze task for
transportation issues for example:
§ Planning and analyzing several process
§ Choosing a operating strategies
§ Planning logistics system
§ Evaluating capacity and performance of existing and planed systems.
§ Predict the system performance in de future
Simulation usually is divided in two form discrete event and continuous, based on the
manner in which the state variables change. Discrete event refers to the fact that state
variables change instantaneously at distinct points in time. In a continuous
simulation, variables change continuously, usually through a function in which time
is a variable.

61
9.2 SIMAN Arena simulation tool Benefit:
The all around Arena program is a powerful tool in analyzing any real system on a
smaller scale and for a fraction of the cost. The combination of the model with the
animation process helps make critical decisions in evaluating and making
recommendations on the system under study.
9.3 The Tren Urbano Simulation Mode
Not only has the Tren Urbano project provided a injection to the economy, but also
has provided a basis for several investigations and projects. In our case through the
modeling of this project, learn the importance and ease Siman/Arena provides to
reduce the complexity of analyzing a real world system.
The model presented in this research describes the full process of creating a way to
reflect the real world conditions but on a smaller scale. Through experimentation
and evaluation, we have studied the way the system reacts and have evaluated
various strategies in how it should be operated.
In this model, we have taken under consideration four stations with great economical
and social impact in Puerto Rico. This stations as mentioned before are Domenech
Roosevelt, Nuevo Centro and Sagrado Corazón. This model also can be used to
predict how the system in the future could change due to changes in demand,
resources and other parameters.
9.4 Headway-Based and Schedule Based Comparison:
The analyze made in this research allows us to understand how the system react to a
incidents situation using only travel time and dwell time adjustment based in a
schedule or a headway. In general, Comparing schedule-based operation and headway
based operation; headway results in minors waiting time and more uniform service.

62
In the case of incidents that cause disruption minor than one headway, the system can
easily recuperate the headway or schedule simply adjusting the travel time and dwell
time. For the analyzed study in this research, the headway based operation results in
minor passenger waiting time and better service regularity. Moreover, the schedule
based operation result better to adjust the system to recuperate its planed schedule.
In the case of incidents that cause disruption grater than one headway, the system can
not easily recuperate the headway or schedule simply adjusting the travel time and
dwell time. In this situation the system may need to use more strongly control
strategies to recuperate to the delay, for example the system can skip station, make
short-turning or deadheading depending of the situation severity. For the analyzed
study in this research, the headway based operation results in minor passenger waiting
time and better service regularity. Finally, the system adjust better to the schedule
when using schedule-based operation, but the headway base operation also adjusts
easily to the schedule.

63
10 Reference
1. Puerto Rico Highway Authority, Tren Urbano Final Environmental Impact
Statement, 1995
2. Siemens Transit Team, Tren Urbano Project Operation and Maintenance Plan, 4th
edition, October 2000.
3. Theo H.J. Miller and Peter Knoppers, TRITAPT-TRIp Time Analysis in Public
Transport, http://www. TRITAPT-TRIp Time Analysis in Public Transport.com
4. Roger D. Smith, Simulation Article, Encyclopedia of Computer Science, 4th edition,
July 2000, New York.
5. Pegden, Dennis C., Introduction to Simulation Using SIMAN, Mc. Graw Gill, 1990
page 3-26
6. Janice P. Li, Train Station Passenger Flow Study, Proceeding of the 2000 Winter
Simulation Conference, Pages1173-1176.
7. Thomas Schulze, Simulation of Streetcar and Bus Traffic, Proceeding of the 1993
Winter Simulation Conference, Pages1239-1243.
8. Puerto Rico Highway Authority, Tren Urbano Final Environmental Impact
Statement, 1995
9. Siemens Transit Team, Tren Urbano Project Operation and Maintenance Plan, 4th
edition, October 2000.
10. Theo H.J. Miller and Peter Knoppers, TRITAPT-TRIp Time Analysis in Public
Transport, http://www. TRITAPT-TRIp Time Analysis in Public Transport.com
11. Roger D. Smith, Simulation Article, Encyclopedia of Computer Science, 4th edition,
July 2000, New York.
12. Pegden, Dennis C., Introduction to Simulation Using SIMAN, Mc. Graw Gill, 1990
page 3-26
13. Janice P. Li, Train Station Passenger Flow Study, Proceeding of the 2000 Winter
Simulation Conference, Pages1173-1176.
14. Thomas Schulze, Simulation of Streetcar and Bus Traffic, Proceeding of the 1993
Winter Simulation Conference, Pages1239-1243.

64
11 Appendix
Appendix 1: SIMAN Language Example Experiment: PROJECT, "NODELO ESTACION","Francisco Martine",,Yes,No,No,No,No,No,No,No; ATTRIBUTES: 2,T ARRIVE: 3,Ticket: 4,plaTIME: 5,Destin: 6,traveltime: 7,ENTER: TrainDepTime: tipo: train: TrainArTime: llegada: dwellt; VARIABLES: travel 1,CLEAR(System),CATEGORY("None-None"): Travel 2,CLEAR(System),CATEGORY("None-None"): Travel 3,CLEAR(System),CATEGORY("None-None"): travel 4,CLEAR(System),CATEGORY("None-None"): Waiting ROS SC,CLEAR(System),CATEGORY("None-None"),0: Dwell 4sc,CLEAR(System),CATEGORY("None-None"): travel 28,CLEAR(System),CATEGORY("None-None"): Travel 29,CLEAR(System),CATEGORY("None-None"): Time SC BAY,CLEAR(System),CATEGORY("None-None"),0: Time ROS BAY,CLEAR(System),CATEGORY("None-None"),0: Travel 30,CLEAR(System),CATEGORY("None-None"): Time NC SC,CLEAR(System),CATEGORY("None-None"),0: ABORD_DomBAY,CLEAR(System),CATEGORY("None-None"),0: Waiting ROS BAY,CLEAR(System),CATEGORY("None-None"),0: Abord_ROS SC,CLEAR(System),CATEGORY("None-None"),0: Time DOM SC,CLEAR(System),CATEGORY("None-None"),0: Waiting NC SC,CLEAR(System),CATEGORY("None-None"),0: Waiting NC BAY,CLEAR(System),CATEGORY("None-None"),0: TIME ROS SC,CLEAR(System),CATEGORY("None-None"),0: ABORD_NCBAY,CLEAR(System),CATEGORY("None-None"),0: Dwell 1BAY,CLEAR(System),CATEGORY("None-None"): Dwell 2BAY,CLEAR(System),CATEGORY("None-None"): Dwell 3BAY,CLEAR(System),CATEGORY("None-None"): Dwell 4BAY,CLEAR(System),CATEGORY("None-None"): Waiting SC BAY,CLEAR(System),CATEGORY("None-None"),0: Dwell 2SC,CLEAR(System),CATEGORY("None-None"):

65
Abord_Dom. SC,CLEAR(System),CATEGORY("None-None"),0: Abord_Ros BAY,CLEAR(System),CATEGORY("None-None"),0: Time NC BAY,CLEAR(System),CATEGORY("None-None"),0: Abord_SC,CLEAR(System),CATEGORY("None-None"),0: Abord_NCSC,CLEAR(System),CATEGORY("None-None"),0: Dwell 3SC,CLEAR(System),CATEGORY("None-None"): Waiting DOM SC,CLEAR(System),CATEGORY("None-None"),0; QUEUES: 1,QG1_1N,FirstInFirstOut,,AUTOSTATS(Yes,,): 2,QG2_1N,FirstInFirstOut,,AUTOSTATS(Yes,,): 3,QG3_1N,FirstInFirstOut,,AUTOSTATS(Yes,,): 4,QG4_1N,FirstInFirstOut,,AUTOSTATS(Yes,,): 5,QG1_1S,FirstInFirstOut,,AUTOSTATS(Yes,,): 6,QG2_1S,FirstInFirstOut,,AUTOSTATS(Yes,,): 7,QG3_1S,FirstInFirstOut,,AUTOSTATS(Yes,,): 8,QG4_1S,FirstInFirstOut,,AUTOSTATS(Yes,,): 9,QT1_1N,FirstInFirstOut,,AUTOSTATS(Yes,,): 10,QT2_1N,FirstInFirstOut,,AUTOSTATS(Yes,,): 11,QT3_1N,FirstInFirstOut,,AUTOSTATS(Yes,,): 12,QT1_1S,FirstInFirstOut,,AUTOSTATS(Yes,,): 13,QT2_1S,FirstInFirstOut,,AUTOSTATS(Yes,,): 14,QT3_1S,FirstInFirstOut,,AUTOSTATS(Yes,,): 15,QTEL1_1N,FirstInFirstOut,,AUTOSTATS(Yes,,): 16,QTEL1_1S,FirstInFirstOut,,AUTOSTATS(Yes,,): 17,Abord Train 1 SC,FirstInFirstOut,,AUTOSTATS(Yes,,): 18,QG1_2SA,FirstInFirstOut,,AUTOSTATS(Yes,,): 19,QG2_2SA,FirstInFirstOut,,AUTOSTATS(Yes,,): 20,QG3_2SA,FirstInFirstOut,,AUTOSTATS(Yes,,): 21,QG4_2SA,FirstInFirstOut,,AUTOSTATS(Yes,,): 22,QG5_2SA,FirstInFirstOut,,AUTOSTATS(Yes,,): 23,QG1_2SB,FirstInFirstOut,,AUTOSTATS(Yes,,): 24,QG2_2SB,FirstInFirstOut,,AUTOSTATS(Yes,,): 25,QG3_2SB,FirstInFirstOut,,AUTOSTATS(Yes,,): 26,QG4_2SB,FirstInFirstOut,,AUTOSTATS(Yes,,): 27,QG5_2SB,FirstInFirstOut,,AUTOSTATS(Yes,,): 28,QG1_2N,FirstInFirstOut,,AUTOSTATS(Yes,,): 29,QG2_2N,FirstInFirstOut,,AUTOSTATS(Yes,,): 30,QG3_2N,FirstInFirstOut,,AUTOSTATS(Yes,,): 31,QT1_2SA,FirstInFirstOut,,AUTOSTATS(Yes,,): 32,QT2_2SA,FirstInFirstOut,,AUTOSTATS(Yes,,): 33,QT3_2SA,FirstInFirstOut,,AUTOSTATS(Yes,,): 34,QT1_2Sb,FirstInFirstOut,,AUTOSTATS(Yes,,): 35,QT2_2Sb,FirstInFirstOut,,AUTOSTATS(Yes,,): 36,QT3_2SB,FirstInFirstOut,,AUTOSTATS(Yes,,): 37,QT1_2N,FirstInFirstOut,,AUTOSTATS(Yes,,): 38,QT2_2N,FirstInFirstOut,,AUTOSTATS(Yes,,): 39,QTEL1_2SA,FirstInFirstOut,,AUTOSTATS(Yes,,):

66
40,QTEL1_2SB,FirstInFirstOut,,AUTOSTATS(Yes,,): 41,QTEL1_2N,FirstInFirstOut,,AUTOSTATS(Yes,,): 42,Abord train2 SC,FirstInFirstOut,,AUTOSTATS(Yes,,): 43,Abord train2 BAY,FirstInFirstOut,,AUTOSTATS(Yes,,): 44,QG1_3N,FirstInFirstOut,,AUTOSTATS(Yes,,): 45,QG2_3N,FirstInFirstOut,,AUTOSTATS(Yes,,): 46,QG3_3N,FirstInFirstOut,,AUTOSTATS(Yes,,): 47,QG1_3S,FirstInFirstOut,,AUTOSTATS(Yes,,): 48,QG2_3S,FirstInFirstOut,,AUTOSTATS(Yes,,): 49,QG3_3S,FirstInFirstOut,,AUTOSTATS(Yes,,): 50,QT1_3N,FirstInFirstOut,,AUTOSTATS(Yes,,): 51,QT2_3N,FirstInFirstOut,,AUTOSTATS(No,,): 52,QT3_3N,FirstInFirstOut,,AUTOSTATS(Yes,,): 53,QT1_3S,FirstInFirstOut,,AUTOSTATS(Yes,,): 54,QT2_3S,FirstInFirstOut,,AUTOSTATS(Yes,,): 55,QT3_3S,FirstInFirstOut,,AUTOSTATS(Yes,,): 56,QTEL1_3N,FirstInFirstOut,,AUTOSTATS(Yes,,): 57,QTEL1_3S,FirstInFirstOut,,AUTOSTATS(Yes,,): 58,Abord train3,FirstInFirstOut,,AUTOSTATS(Yes,,): 59,QG1_4N,FirstInFirstOut,,AUTOSTATS(Yes,,): 60,QG2_4N,FirstInFirstOut,,AUTOSTATS(Yes,,): 61,QG3_4N,FirstInFirstOut,,AUTOSTATS(Yes,,): 62,QT1_4N,FirstInFirstOut,,AUTOSTATS(Yes,,): 63,QT2_4N,FirstInFirstOut,,AUTOSTATS(Yes,,): 64,QT3_4N,FirstInFirstOut,,AUTOSTATS(Yes,,): 65,QTEL1_4N,FirstInFirstOut,,AUTOSTATS(Yes,,): 66,Abord Train 4 SC,FirstInFirstOut,,AUTOSTATS(Yes,,): 67,Abord Train 4 BAY,FirstInFirstOut,,AUTOSTATS(Yes,,): 68,Abord Train 1 BAY,FirstInFirstOut,,AUTOSTATS(Yes,,); PICTURES: 1,des1: 2,des2: 3,des3: 4,des4: 5,des5: 6,des6: 7,tren; FAILURES: Falla3,Time(5,0,): Falla4,Time(63,7,): Falla8,Time(6,0,): FALLA TREN5,Time(expo(700),0,): FALLA TREN6,Time(expo(700),0,): FALLA TREN 7,Time(5,0,): FALLA TREN,Time(expo(700),0,): FALLATREN2,Time(57.5,3,);

67
RESOURCES: 1,G1_1N,Capacity(1),,Stationary,COST(0.0,0.0,0.0),,AUTOSTATS(Yes,,): 2,G2_1N,Capacity(1),,Stationary,COST(0.0,0.0,0.0),,AUTOSTATS(Yes,,): 3,G3_1N,Capacity(1),,Stationary,COST(0.0,0.0,0.0),,AUTOSTATS(Yes,,): 4,G4_1N,Capacity(1),,Stationary,COST(0.0,0.0,0.0),,AUTOSTATS(Yes,,): 5,G1_1S,Capacity(1),,Stationary,COST(0.0,0.0,0.0),,AUTOSTATS(Yes,,): 6,G2_1S,Capacity(1),,Stationary,COST(0.0,0.0,0.0),,AUTOSTATS(Yes,,): 7,G3_1S,Capacity(1),,Stationary,COST(0.0,0.0,0.0),,AUTOSTATS(Yes,,): 8,G4_1S,Capacity(1),,Stationary,COST(0.0,0.0,0.0),,AUTOSTATS(Yes,,): 9,T1_1N,Capacity(1),,Stationary,COST(0.0,0.0,0.0),,AUTOSTATS(Yes,,): 10,T2_1N,Capacity(1),,Stationary,COST(0.0,0.0,0.0),,AUTOSTATS(Yes,,): 11,T3_1N,Capacity(1),,Stationary,COST(0.0,0.0,0.0),,AUTOSTATS(Yes,,): 12,T1_1S,Capacity(1),,Stationary,COST(0.0,0.0,0.0),,AUTOSTATS(Yes,,): 13,T2_1S,Capacity(1),,Stationary,COST(0.0,0.0,0.0),,AUTOSTATS(Yes,,): 14,T3_1S,Capacity(1),,Stationary,COST(0.0,0.0,0.0),,AUTOSTATS(Yes,,): 15,TEL1_1N,Capacity(1),,Stationary,COST(0.0,0.0,0.0),,AUTOSTATS(Yes,,): 16,TEL1_1S,Capacity(1),,Stationary,COST(0.0,0.0,0.0),,AUTOSTATS(Yes,,): 17,train1SC,Capacity(1),,Stationary,COST(0.0,0.0,0.0),FAILURE(FALLA TREN,Preempt),AUTOSTATS(Yes,,): 18,G1_2SA,Capacity(1),,Stationary,COST(0.0,0.0,0.0),,AUTOSTATS(Yes,,): 19,G2_2SA,Capacity(1),,Stationary,COST(0.0,0.0,0.0),,AUTOSTATS(Yes,,): 20,G3_2SA,Capacity(1),,Stationary,COST(0.0,0.0,0.0),,AUTOSTATS(Yes,,): 21,G4_2SA,Capacity(1),,Stationary,COST(0.0,0.0,0.0),,AUTOSTATS(Yes,,): 22,G5_2SA,Capacity(1),,Stationary,COST(0.0,0.0,0.0),,AUTOSTATS(Yes,,): 23,G1_2SB,Capacity(1),,Stationary,COST(0.0,0.0,0.0),,AUTOSTATS(Yes,,): 24,G2_2SB,Capacity(1),,Stationary,COST(0.0,0.0,0.0),,AUTOSTATS(Yes,,): 25,G3_2SB,Capacity(1),,Stationary,COST(0.0,0.0,0.0),,AUTOSTATS(Yes,,): 26,G4_2SB,Capacity(1),,Stationary,COST(0.0,0.0,0.0),,AUTOSTATS(Yes,,): 27,G5_2SB,Capacity(1),,Stationary,COST(0.0,0.0,0.0),,AUTOSTATS(Yes,,): 28,G1_2N,Capacity(1),,Stationary,COST(0.0,0.0,0.0),,AUTOSTATS(Yes,,): 29,G2_2N,Capacity(1),,Stationary,COST(0.0,0.0,0.0),,AUTOSTATS(Yes,,): 30,G3_2N,Capacity(1),,Stationary,COST(0.0,0.0,0.0),,AUTOSTATS(Yes,,): 31,T1_2SA,Capacity(1),,Stationary,COST(0.0,0.0,0.0),,AUTOSTATS(Yes,,): 32,T2_2SA,Capacity(1),,Stationary,COST(0.0,0.0,0.0),,AUTOSTATS(Yes,,): 33,T3_2SA,Capacity(1),,Stationary,COST(0.0,0.0,0.0),,AUTOSTATS(Yes,,): 34,T1_2SB,Capacity(1),,Stationary,COST(0.0,0.0,0.0),,AUTOSTATS(Yes,,): 35,T2_2SB,Capacity(1),,Stationary,COST(0.0,0.0,0.0),,AUTOSTATS(Yes,,): 36,T3_2SB,Capacity(1),,Stationary,COST(0.0,0.0,0.0),,AUTOSTATS(Yes,,): 37,T1_2N,Capacity(1),,Stationary,COST(0.0,0.0,0.0),,AUTOSTATS(Yes,,): 38,T2_2N,Capacity(1),,Stationary,COST(0.0,0.0,0.0),,AUTOSTATS(Yes,,): 39,TEL1_2SA,Capacity(1),,Stationary,COST(0.0,0.0,0.0),,AUTOSTATS(Yes,,): 40,TEL1_2SB,Capacity(1),,Stationary,COST(0.0,0.0,0.0),,AUTOSTATS(Yes,,): 41,TEL1_2N,Capacity(1),,Stationary,COST(0.0,0.0,0.0),,AUTOSTATS(Yes,,): 42,train2 SC,Capacity(1),,Stationary,COST(0.0,0.0,0.0),FAILURE(FALLA TREN5,Ignore),AUTOSTATS(Yes,,):

68
43,train2 BAY,Capacity(1),,Stationary,COST(0.0,0.0,0.0),FAILURE(FALLATREN2,Ignore),AUTOSTATS(Yes,,): 44,G1_3N,Capacity(1),,Stationary,COST(0.0,0.0,0.0),,AUTOSTATS(Yes,,): 45,G2_3N,Capacity(1),,Stationary,COST(0.0,0.0,0.0),,AUTOSTATS(Yes,,): 46,G3_3N,Capacity(1),,Stationary,COST(0.0,0.0,0.0),,AUTOSTATS(Yes,,): 47,G1_3S,Capacity(1),,Stationary,COST(0.0,0.0,0.0),,AUTOSTATS(Yes,,): 48,G2_3S,Capacity(1),,Stationary,COST(0.0,0.0,0.0),,AUTOSTATS(Yes,,): 49,G3_3S,Capacity(1),,Stationary,COST(0.0,0.0,0.0),,AUTOSTATS(Yes,,): 50,T1_3N,Capacity(1),,Stationary,COST(0.0,0.0,0.0),,AUTOSTATS(Yes,,): 51,T2_3N,Capacity(1),,Stationary,COST(0.0,0.0,0.0),,AUTOSTATS(Yes,,): 52,T3_3N,Capacity(1),,Stationary,COST(0.0,0.0,0.0),,AUTOSTATS(Yes,,): 53,T1_3S,Capacity(1),,Stationary,COST(0.0,0.0,0.0),,AUTOSTATS(Yes,,): 54,T2_3S,Capacity(1),,Stationary,COST(0.0,0.0,0.0),,AUTOSTATS(Yes,,): 55,T3_3S,Capacity(1),,Stationary,COST(0.0,0.0,0.0),,AUTOSTATS(Yes,,): 56,TEL1_3N,Capacity(1),,Stationary,COST(0.0,0.0,0.0),,AUTOSTATS(Yes,,): 57,TEL1_3S,Capacity(1),,Stationary,COST(0.0,0.0,0.0),,AUTOSTATS(Yes,,): 58,Train 3 BAY,Capacity(1),,Stationary,COST(0.0,0.0,0.0),,AUTOSTATS(Yes,,): 59,train1BAY,Capacity(1),,Stationary,COST(0.0,0.0,0.0),FAILURE(Falla4,Preempt),AUTOSTATS(Yes,,): 60,G1_4N,Capacity(1),,Stationary,COST(0.0,0.0,0.0),,AUTOSTATS(Yes,,): 61,G2_4N,Capacity(1),,Stationary,COST(0.0,0.0,0.0),,AUTOSTATS(Yes,,): 62,G3_4N,Capacity(1),,Stationary,COST(0.0,0.0,0.0),,AUTOSTATS(Yes,,): 63,T1_4N,Capacity(1),,Stationary,COST(0.0,0.0,0.0),,AUTOSTATS(Yes,,): 64,T2_4N,Capacity(1),,Stationary,COST(0.0,0.0,0.0),,AUTOSTATS(Yes,,): 65,T3_4N,Capacity(1),,Stationary,COST(0.0,0.0,0.0),,AUTOSTATS(Yes,,): 66,TEL1_4N,Capacity(1),,Stationary,COST(0.0,0.0,0.0),,AUTOSTATS(Yes,,): 67,train4BAY,Capacity(1),,Stationary,COST(0.0,0.0,0.0),FAILURE(Falla3,Ignore),AUTOSTATS(Yes,,): 68,train4 SC,Capacity(1),,Stationary,COST(0.0,0.0,0.0),FAILURE(FALLA TREN6,Ignore),AUTOSTATS(Yes,,): Dumy1,Capacity(1),,Stationary,COST(0.0,0.0,0.0),,AUTOSTATS(Yes,,): Dumy2,Capacity(1),,Stationary,COST(0.0,0.0,0.0),,AUTOSTATS(Yes,,): Dumy4,Capacity(1),,Stationary,COST(0.0,0.0,0.0),,AUTOSTATS(Yes,,); STATIONS: 1,Crea Ros N: 2,Crea Ros S: 3,Crea NC N: 4,Crea NC S: 5,CREA SC N: 6,CREA SC S: 7,Arrive ROS_ SC: 8,Arrive NC_BAY: 9,Arrive NC_SC: 10,Arrive SC:

69
11,entrada1 North: 12,entrada2 N: 13,Salida 2 SA: 14,SALIDA 2 SB: 15,entrada3 N: 17,salida1N: 18,salida 1S: 20,salida3N: 21,entrada3 S: 22,entrada2 SA: 23,entrada2 SB: 24,plataforma2SC: Model: 0$ CREATE, 1:expo (1.7143):NEXT(1$); Creacion Pasageros Direccion SC 1$ ASSIGN: llegada=tnow: destin=discrete(.001,2,1,1): Ticket=discrete(.6,1,.9,2,1.0,3): M=1: picture=destin; Tiket: 1= Have, 2= Buy Tiket at TVM, 3 Buy Tiket at Teller 372$ BRANCH: With,.5,271$,Yes: With,.5,371$,Yes; 271$ ROUTE: tria(1,2,3),entrada1 North; 371$ ROUTE: tria(3,4,5),entrada1 Sur; 36$ STATION, entrada1 North; 19$ DELAY: TRIA(0, 5 ,10),,Other:NEXT(2$); 2$ BRANCH, 1: If,ticket==1,Gates1N,Yes: If,Ticket == 2,205$,Yes: If,Ticket==3,20$,Yes; Gates1N PICKQ, CYC: 3$: 4$: 5$: 6$; 3$ QUEUE, QG4_1N; 16$ SEIZE, 1,Other: G4_1N,1:NEXT(17$); 17$ DELAY: tria ( .05, .075,.1 ),,Other:NEXT(18$);
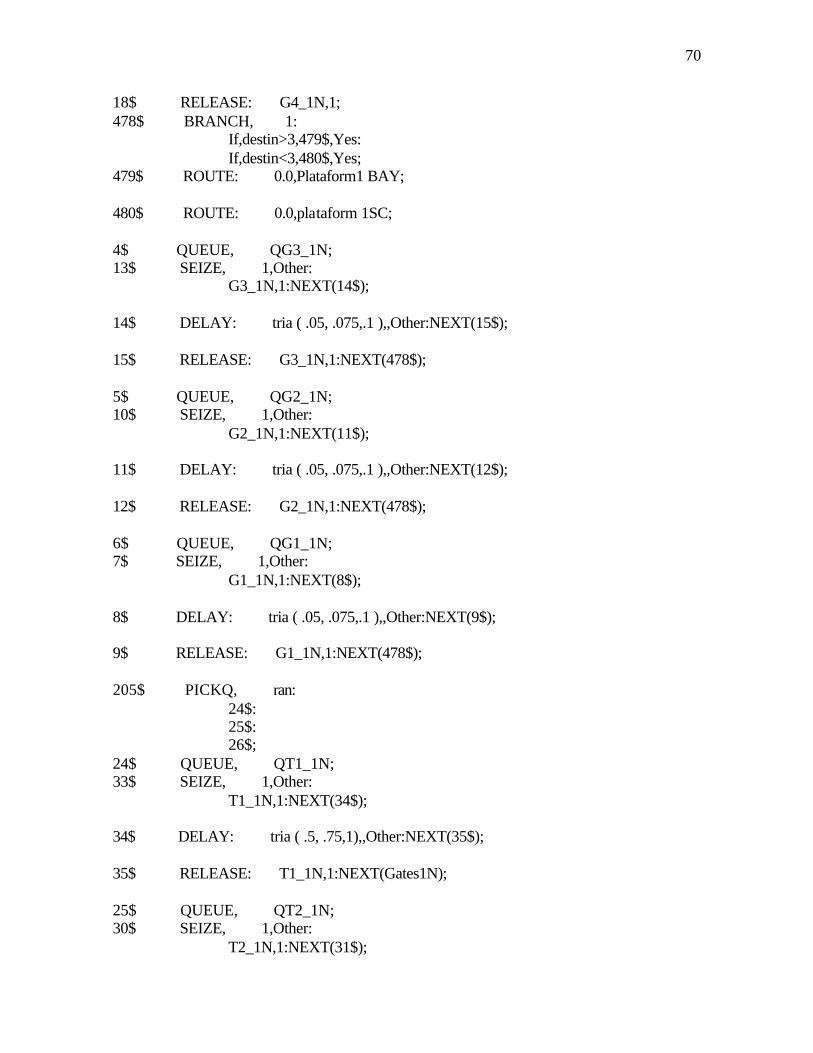
70
18$ RELEASE: G4_1N,1; 478$ BRANCH, 1: If,destin>3,479$,Yes: If,destin<3,480$,Yes; 479$ ROUTE: 0.0,Plataform1 BAY; 480$ ROUTE: 0.0,plataform 1SC; 4$ QUEUE, QG3_1N; 13$ SEIZE, 1,Other: G3_1N,1:NEXT(14$); 14$ DELAY: tria ( .05, .075,.1 ),,Other:NEXT(15$); 15$ RELEASE: G3_1N,1:NEXT(478$); 5$ QUEUE, QG2_1N; 10$ SEIZE, 1,Other: G2_1N,1:NEXT(11$); 11$ DELAY: tria ( .05, .075,.1 ),,Other:NEXT(12$); 12$ RELEASE: G2_1N,1:NEXT(478$); 6$ QUEUE, QG1_1N; 7$ SEIZE, 1,Other: G1_1N,1:NEXT(8$); 8$ DELAY: tria ( .05, .075,.1 ),,Other:NEXT(9$); 9$ RELEASE: G1_1N,1:NEXT(478$); 205$ PICKQ, ran: 24$: 25$: 26$; 24$ QUEUE, QT1_1N; 33$ SEIZE, 1,Other: T1_1N,1:NEXT(34$); 34$ DELAY: tria ( .5, .75,1),,Other:NEXT(35$); 35$ RELEASE: T1_1N,1:NEXT(Gates1N); 25$ QUEUE, QT2_1N; 30$ SEIZE, 1,Other: T2_1N,1:NEXT(31$);

71
31$ DELAY: tria ( .5, .75,1),,Other:NEXT(32$); 32$ RELEASE: T2_1N,1:NEXT(Gates1N); 26$ QUEUE, QT3_1N; 27$ SEIZE, 1,Other: T3_1N,1:NEXT(28$); 28$ DELAY: tria ( .5, .75,1),,Other:NEXT(29$); 29$ RELEASE: T3_1N,1:NEXT(Gates); Gates PICKQ, cyc: 170$: 171$: 172$: 173$; 170$ QUEUE, QG1_1S; 183$ SEIZE, 1,Other: G1_1S,1:NEXT(184$); 184$ DELAY: tria ( .05, .075,.1 ),,Other:NEXT(185$); 185$ RELEASE: G1_1S,1; 475$ BRANCH, 1: If,destin>3,476$,Yes: If,destin<3,477$,Yes; 476$ ROUTE: 0.0,Plataform1 BAY; 477$ ROUTE: 0.0,plataform 1SC; 171$ QUEUE, QG2_1S; 180$ SEIZE, 1,Other: G2_1S,1:NEXT(181$); 181$ DELAY: tria ( .05, .075,.1 ),,Other:NEXT(182$); 182$ RELEASE: G2_1S,1:NEXT(475$); 172$ QUEUE, QG3_1S; 177$ SEIZE, 1,Other: G3_1S,1:NEXT(178$); 178$ DELAY: tria ( .05, .075,.1 ),,Other:NEXT(179$); 179$ RELEASE: G3_1S,1:NEXT(475$);

72
173$ QUEUE, QG4_1S; 174$ SEIZE, 1,Other: G4_1S,1:NEXT(175$); 175$ DELAY: tria ( .05, .075,.1 ),,Other:NEXT(176$); 176$ RELEASE: G4_1S,1:NEXT(475$); 20$ QUEUE, QTEL1_1N; 21$ SEIZE, 1,Other: TEL1_1N,1:NEXT(22$); 22$ DELAY: tria(.6,.75,1.1),,Other:NEXT(23$); 23$ RELEASE: TEL1_1N,1:NEXT(478$); 72$ STATION, entrada2 SA; 54$ DELAY: TRIA(0, 5 ,10),,Other:NEXT(37$); 37$ BRANCH, 1: If,ticket==1,Gates2SA,Yes: If,Ticket == 2,59$,Yes: If,Ticket==3,55$,Yes; Gates2SA PICKQ, CYC: 38$: 39$: 40$: 41$: 273$; 38$ QUEUE, QG1_2SA; 51$ SEIZE, 1,Other: G1_2SA,1:NEXT(52$); 52$ DELAY: tria ( .05, .075,.1 ),,Other:NEXT(53$); 53$ RELEASE: G1_2SA,1; 160$ BRANCH, 1: If,destin==1,161$,Yes: Else,162$,Yes; 161$ ROUTE: tria(5,10,15),plataforma2SC; 162$ ROUTE: tria(5,10,15),plataforma2BAY; 39$ QUEUE, QG2_2SA; 48$ SEIZE, 1,Other:

73
G2_2SA,1:NEXT(49$); 49$ DELAY: tria ( .05, .075,.1 ),,Other:NEXT(50$); 50$ RELEASE: G2_2SA,1:NEXT(160$); 40$ QUEUE, QG3_2SA; 45$ SEIZE, 1,Other: G3_2SA,1:NEXT(46$); 46$ DELAY: tria ( .05, .075,.1 ),,Other:NEXT(47$); 47$ RELEASE: G3_2SA,1:NEXT(160$); 41$ QUEUE, QG4_2SA; 42$ SEIZE, 1,Other: G4_2SA,1:NEXT(43$); 43$ DELAY: tria ( .05, .075,.1 ),,Other:NEXT(44$); 44$ RELEASE: G4_2SA,1:NEXT(160$); 273$ QUEUE, QG5_2SA; 274$ SEIZE, 1,Other: G5_2SA,1:NEXT(275$); 275$ DELAY: tria ( .05, .075,.1 ),,Other:NEXT(276$); 276$ RELEASE: G5_2SA,1:NEXT(160$); 59$ PICKQ, SNQ: 60$: 61$: 62$; 60$ QUEUE, QT1_2SA; 69$ SEIZE, 1,Other: T1_2SA,1:NEXT(70$); 70$ DELAY: tria ( .5, .75,1),,Other:NEXT(71$); 71$ RELEASE: T1_2SA,1:NEXT(Gates2); Gates2 PICKQ, cyc: 207$: 208$: 209$: 210$:

74
277$; 207$ QUEUE, QG1_2SB; 220$ SEIZE, 1,Other: G1_2SB,1:NEXT(221$); 221$ DELAY: tria ( .05, .075,.1 ),,Other:NEXT(222$); 222$ RELEASE: G1_2SB,1; 242$ BRANCH, 1: If,destin==1,243$,Yes: Else,244$,Yes; 243$ ROUTE: tria(5,10,15),plataforma2SC; 244$ ROUTE: tria(5,10,15),plataforma2BAY; 208$ QUEUE, QG2_2SB; 217$ SEIZE, 1,Other: G2_2SB,1:NEXT(218$); 218$ DELAY: tria ( .05, .075,.1 ),,Other:NEXT(219$); 219$ RELEASE: G2_2SB,1:NEXT(242$); 209$ QUEUE, QG3_2SB; 214$ SEIZE, 1,Other: G3_2SB,1:NEXT(215$); 215$ DELAY: tria ( .05, .075,.1 ),,Other:NEXT(216$); 216$ RELEASE: G3_2SB,1:NEXT(242$); 210$ QUEUE, QG4_2SB; 211$ SEIZE, 1,Other: G4_2SB,1:NEXT(212$); 212$ DELAY: tria ( .05, .075,.1 ),,Other:NEXT(213$); 213$ RELEASE: G4_2SB,1:NEXT(242$); 277$ QUEUE, QG5_2SB; 278$ SEIZE, 1,Other: G5_2SB,1:NEXT(279$); 279$ DELAY: tria ( .05, .075,.1 ),,Other:NEXT(280$); 280$ RELEASE: G5_2SB,1:NEXT(242$);

75
61$ QUEUE, QT2_2SA; 66$ SEIZE, 1,Other: T2_2SA,1:NEXT(67$); 67$ DELAY: tria ( .5, .75,1),,Other:NEXT(68$); 68$ RELEASE: T2_2SA,1:NEXT(Gates2); 62$ QUEUE, QT3_2SA; 63$ SEIZE, 1,Other: T3_2SA,1:NEXT(64$); 64$ DELAY: tria ( .5, .75,1 ),,Other:NEXT(65$); 65$ RELEASE: T3_2SA,1:NEXT(Gates2); 55$ QUEUE, QTEL1_2SA; 56$ SEIZE, 1,Other: TEL1_2SA,1:NEXT(57$); 57$ DELAY: tria(.6,.75,1.1),,Other:NEXT(58$); 58$ RELEASE: TEL1_2SA,1:NEXT(160$); 103$ STATION, entrada3 N; 73$ BRANCH, 1: If,ticket==1,Gates1N,Yes: If,Ticket == 2,90$,Yes: If,Ticket==3,86$,Yes; 90$ PICKQ, SNQ: 91$: 92$: 93$; 91$ QUEUE, QT1_3N; 100$ SEIZE, 1,Other: T1_3N,1:NEXT(101$); 101$ DELAY: tria ( .5, .75,1),,Other:NEXT(102$); 102$ RELEASE: T1_3N,1:NEXT(Gates3N); Gates3N PICKQ, cyc: 74$: 75$: 76$; 74$ QUEUE, QG1_3N;

76
83$ SEIZE, 1,Other: G1_3N,1:NEXT(84$); 84$ DELAY: tria ( .05, .075,.1 ),,Other:NEXT(85$); 85$ RELEASE: G1_3N,1; 104$ ROUTE: tria(5,10,15),plataforma3; 75$ QUEUE, QG2_3N; 80$ SEIZE, 1,Other: G2_3N,1:NEXT(81$); 81$ DELAY: tria ( .05, .075,.1 ),,Other:NEXT(82$); 82$ RELEASE: G2_3N,1:NEXT(104$); 76$ QUEUE, QG3_3N; 77$ SEIZE, 1,Other: G3_3N,1:NEXT(78$); 78$ DELAY: tria ( .05, .075,.1 ),,Other:NEXT(79$); 79$ RELEASE: G3_3N,1:NEXT(104$); 92$ QUEUE, QT2_3N; 97$ SEIZE, 1,Other: T2_3N,1:NEXT(98$); 98$ DELAY: tria ( .5, .75,1),,Other:NEXT(99$); 99$ RELEASE: T2_3N,1:NEXT(Gates3N); 93$ QUEUE, QT3_3N; 94$ SEIZE, 1,Other: T3_3N,1:NEXT(95$); 95$ DELAY: tria ( .5, .75,1),,Other:NEXT(96$); 96$ RELEASE: T3_3N,1:NEXT(Gates3N); 86$ QUEUE, QTEL1_3N; 87$ SEIZE, 1,Other: TEL1_3N,1:NEXT(88$); 88$ DELAY: tria(.6,.75,1.1),,Other:NEXT(89$); 89$ RELEASE: TEL1_3N,1:NEXT(104$);

77
109$ STATION, plataform 1SC:MARK(plaTIME); 108$ QUEUE, Abord Train 1 SC; 110$ SCAN: nr(train1SC)==1;
Appendix 2: VBA Headway Based Code Private Sub VBA_Block_1_Fire() 'Retrive SC train Arrival and Depart time from siman object data direction to BAY Dim arrivet As Double, depart, WAITINGTIME, PERSON, T, TAC, TLAST As Double arrivet = g_SIMAN.EntityAttribute(g_SIMAN.ActiveEntity, g_TrainArrive) depart = g_SIMAN.EntityAttribute(g_SIMAN.ActiveEntity, g_TrainDepart) 'Write the Values to the spreadsheet If g_SIMAN.RunCurrentTime > 30 Then TAC = SMVAR.VariableArrayValue(SMVAR.SymbolNumber("Time SC BAY")) T = TAC - T1 T1 = TAC PERSON = SMVAR.VariableArrayValue(SMVAR.SymbolNumber("Waiting SC BAY")) WAITINGTIME = T / PERSON End If With g_XLDataSheetBAY .Cells(g_nextrow1BA, g_LL1) = arrivet .Cells(g_nextrow1BA, g_S1) = depart .Cells(g_nextrow1BA + 35, g_LL1) = WAITINGTIME .Cells(g_nextrow1BA + 70, g_LL1) = PERSON End With 'Increment the row variable g_nextrow1BA = g_nextrow1BA + 1 SBDEPART1BAY = depart End Sub Private Sub VBA_Block_10_Fire() 'Schedule Based logic NC station to Bayamon Dim Tarrive, Tdepart, TarriveNext, Travel, Dwell As Double Tarrive = g_SIMAN.EntityAttribute(g_SIMAN.ActiveEntity, g_TrainArrive) Tdepart = Tarrive + 0.5 'The train is more than 2 minutes late If Tdepart > 2 + SBDEPART2BAY + 4 Then Travel = 0.92 * 61 / 60 TarriveNext = Tdepart + Travel If TarriveNext > SBDEPART2BAY + 61 / 60 + 2 + 4 Or TarriveNext > SBDEPART2BAY + 61 / 60 - 1 + 4 Then Dwell = (SBDEPART2BAY + (4 + 61 / 60)) - TarriveNext + 0.5 Travel = 0.92 * 61 / 60 Else

78
Dwell = 0.5 Travel = 0.92 * 61 / 60 End If End If 'The train is more than 1 minutes early If Tdepart < SBDEPART2BAY + 4 - 1 Then Travel = 1.08 * 61 / 60 TarriveNext = Tdepart + Travel '4 es de headway,2y -1 son margenes permitido If TarriveNext > SBDEPART2BAY + 61 / 60 + 2 + 4 Or TarriveNext > SBDEPART2BAY + 61 / 60 - 1 + 4 Then Dwell = (SBDEPART2BAY + (4 + 61 / 60)) - TarriveNext + 0.5 Travel = 1.08 * 61 / 60 Else Dwell = 0.5 Travel = 1.08 * 61 / 60 End If End If 'The arrival train is in the aceptable range If Tdepart < 2 + SBDEPART2BAY + 4 And Tdepart > SBDEPART2BAY + 4 - 1 Then Travel = 61 / 60 Dwell = 0.5 End If If Dwell > 1 Then Dwell = 1 Else If Dwell < 0.25 Then Dwell = 0.25 End If End If SMVAR.VariableArrayValue(SMVAR.SymbolNumber("travel 2")) = Travel SMVAR.VariableArrayValue(SMVAR.SymbolNumber("dwell 2bay")) = Dwell End Sub

79
Appendix 3: VBA Schedule Based Code Private Sub VBA_Block_1_Fire() 'Retrive SC train Arrival and Depart time from siman object data direction to BAY Dim arrivet As Double, depart, WAITINGTIME, PERSON, T, TAC, TLAST As Double arrivet = g_SIMAN.EntityAttribute(g_SIMAN.ActiveEntity, g_TrainArrive) depart = g_SIMAN.EntityAttribute(g_SIMAN.ActiveEntity, g_TrainDepart) 'Write the Values to the spreadsheet If g_SIMAN.RunCurrentTime > 30 Then TAC = SMVAR.VariableArrayValue(SMVAR.SymbolNumber("Time SC BAY")) T = TAC - T1 T1 = TAC PERSON = SMVAR.VariableArrayValue(SMVAR.SymbolNumber("Waiting SC BAY")) WAITINGTIME = T / PERSON End If With g_XLDataSheetBAY .Cells(g_nextrow1BA, g_LL1) = arrivet .Cells(g_nextrow1BA, g_S1) = depart .Cells(g_nextrow1BA + 35, g_LL1) = WAITINGTIME .Cells(g_nextrow1BA + 70, g_LL1) = PERSON End With 'Increment the row variable g_nextrow1BA = g_nextrow1BA + 1 SBDEPART1BAY = SBDEPART1BAY + 4 End Sub Private Sub VBA_Block_10_Fire() 'Schedule Based logic NC station to Bayamon Dim Tarrive, Tdepart, TarriveNext, Travel, Dwell As Double Tarrive = g_SIMAN.EntityAttribute(g_SIMAN.ActiveEntity, g_TrainArrive) Tdepart = Tarrive + 0.5 'The train is more than 2 minutes late If Tdepart > 2 + SBDEPART2BAY + 4 Then Travel = 0.92 * 61 / 60 TarriveNext = Tdepart + Travel If TarriveNext > SBDEPART2BAY + 61 / 60 + 2 + 4 Or TarriveNext > SBDEPART2BAY + 61 / 60 - 1 + 4 Then Dwell = (SBDEPART2BAY + (4 + 61 / 60)) - TarriveNext + 0.5 Travel = 0.92 * 61 / 60 Else Dwell = 0.5 Travel = 0.92 * 61 / 60 End If
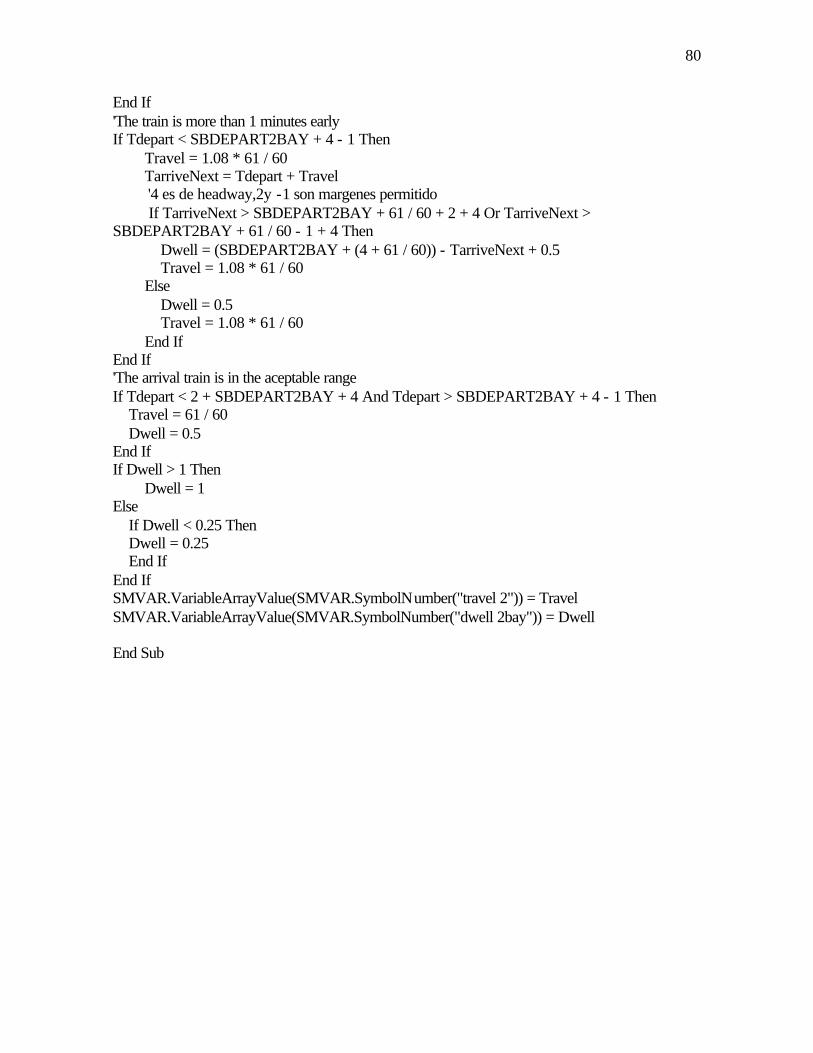
80
End If 'The train is more than 1 minutes early If Tdepart < SBDEPART2BAY + 4 - 1 Then Travel = 1.08 * 61 / 60 TarriveNext = Tdepart + Travel '4 es de headway,2y -1 son margenes permitido If TarriveNext > SBDEPART2BAY + 61 / 60 + 2 + 4 Or TarriveNext > SBDEPART2BAY + 61 / 60 - 1 + 4 Then Dwell = (SBDEPART2BAY + (4 + 61 / 60)) - TarriveNext + 0.5 Travel = 1.08 * 61 / 60 Else Dwell = 0.5 Travel = 1.08 * 61 / 60 End If End If 'The arrival train is in the aceptable range If Tdepart < 2 + SBDEPART2BAY + 4 And Tdepart > SBDEPART2BAY + 4 - 1 Then Travel = 61 / 60 Dwell = 0.5 End If If Dwell > 1 Then Dwell = 1 Else If Dwell < 0.25 Then Dwell = 0.25 End If End If SMVAR.VariableArrayValue(SMVAR.SymbolNumber("travel 2")) = Travel SMVAR.VariableArrayValue(SMVAR.SymbolNumber("dwell 2bay")) = Dwell End Sub

81
Appendix 4: SIMAN Summary Result Sheet: Beginning replication 2 of 5 Beginning replication 3 of 5 Beginning replication 4 of 5 Beginning replication 5 of 5 ARENA Simulation Results Francisco Martinez Output Summary for 5 Replications Project:NODELO ESTACION Run execution date : 5/30/2002 Analyst:Francisco Martine Model revision date: 5/30/2002 OUTPUTS Identifier Average Half-width Minimum Maximum # Replications _______________________________________________________________________________ Dom.Gate 1N Util .12476 .00270 .12254 .12711 5 Dom.Gate 2N Util .12550 .00274 .12325 .12888 5 Dom.Gate 3N Util .12580 .00260 .12424 .12943 5 Dom.Gate 4N Util .12620 .00481 .12296 .13290 5 Dom.Gate 1SUtil .04588 .00230 .04335 .04748 5 Dom.Gate 2SUtil .04555 8.1526E-04 .04484 .04629 5 Dom.Gate 3SUtil .04543 .00222 .04264 .04705 5 Dom.Gate 4 SUtil .04513 .00166 .04345 .04686 5 Dom.Q Gate 1N Util 6.0340E-05 1.2122E-04 .00000 2.2443E-04 5 Dom.Q Gate 2 N Util .00000 .00000 .00000 .00000 5 Dom.Q Gate 3N Util 1.1748E-04 1.3693E-04 .00000 2.2804E-04 5 Dom.Q Gate 4N Util 1.1476E-04 1.8260E-04 .00000 3.5040E-04 5 Dom.Q Gate 1S Util .00000 .00000 .00000 .00000 5 Dom.Q Gate 2S Util .00000 .00000 .00000 .00000 5 Dom.Q Gate 3S Util .00000 .00000 .00000 .00000 5 Dom.Q Gate 3S Util .00000 .00000 .00000 .00000 5 Dom.TVM1N Ut .18108 .02563 .15706 .20462 5 Dom.TVM2N Ut .16818 .02704 .13881 .19216 5 Dom.TVM3N Ut .21454 .04584 .16659 .27020 5 Dom.TVM1S Ut .44739 .03774 .39639 .47605 5 Dom.TVM 2S Ut .05508 .02288 .02711 .06893 5 Dom.TVM 3S Ut .00257 .00451 .00000 .00769 5 Q Dom.TVM1N Ut .02224 .01435 .01212 .04043 5 Dom.Q TVM3N .04838 .04847 .00121 .09312 5 Dom.Q TVM1S Ut .09923 .02347 .07282 .12230 5 Dom.Q TVM3S .00000 .00000 .00000 .00000 5 Dom.Teller 1N Ut .17444 .02645 .14751 .19974 5 Dom.Teller 2S Ut .18547 .03576 .15199 .21633 5 Dom.Q Teller 1N .02143 .01613 .00138 .03467 5 Dom.Q Teller 1S .02184 .02525 .00204 .05408 5

82
NC GATE 1 SA .01513 .00201 .01327 .01752 5 NC GATE 2 SA .01532 .00236 .01294 .01819 5 NC GATE 1 SA .01488 .00196 .01338 .01728 5 NC GATE 4 SA .01503 .00209 .01292 .01750 5 NC GATE 5 SA .01465 .00229 .01289 .01773 5 NC GATE 1 SB .02873 .00339 .02550 .03184 5 NC GATE 2 SB .02852 .00320 .02566 .03160 5 NC GATE 3 SB .02863 .00362 .02487 .03244 5 NC GATE 4 SB .02837 .00317 .02481 .03196 5 NC GATE 5 SB .02804 .00364 .02492 .03179 5 NC GATE 1 N .02626 .00268 .02297 .02813 5 NC GATE 2 N .02589 .00231 .02328 .02806 5 NC GATE 3 N .02574 .00202 .02342 .02773 5 NC GATE 1 SA Q .00000 .00000 .00000 .00000 5 NC GATE 2 SA Q .00000 .00000 .00000 .00000 5 NC GATE 3 SA Q .00000 .00000 .00000 .00000 5 NC GATE 4 SA Q .00000 .00000 .00000 .00000 5 NC GATE 50 SA Q .00000 .00000 .00000 .00000 5 NC GATE 1 SB Q .00000 .00000 .00000 .00000 5 NC GATE 2 SB Q .00000 .00000 .00000 .00000 5 NC GATE 3 SB Q .00000 .00000 .00000 .00000 5 NC GATE 4 SB Q .00000 .00000 .00000 .00000 5 NC GATE 5 SB Q .00000 .00000 .00000 .00000 5 NC GATE 1 N Q .00000 .00000 .00000 .00000 5 NC GATE 2 N Q .00000 .00000 .00000 .00000 5 NC GATE3 N Q .00000 .00000 .00000 .00000 5 NC TVM 1SA U .29491 .08009 .20638 .36414 5 NC TVM 2 SA U .01352 .01452 .00000 .03061 5 NC TVM 3 SA U .00000 .00000 .00000 .00000 5 NC TVM 1SB U .34757 .07900 .25385 .43083 5 NC TVM 2SB U .02184 .01450 .01036 .03979 5 NC TVM 3 SB U .00000 .00000 .00000 .00000 5 NC TVM 1 N .23854 .03388 .20632 .26767 5 NC TVM 2 N .00912 .00795 .00000 .01767 5 NC TVM 1 SA Q .03174 .02626 .00794 .06055 5 NC TVM 2 SA Q .00118 .00327 .00000 .00590 5 NC TVM 3 SA Q .00000 .00000 .00000 .00000 5 NC TVM 1 SB Q .06496 .02250 .04168 .09029 5 NC TVM 2 SB Q .00000 .00000 .00000 .00000 5 NC TVM 3 SB Q .00000 .00000 .00000 .00000 5 NC TVM 1 N Q .03074 .01174 .02070 .04216 5 NC TVM 2 N Q .00000 .00000 .00000 .00000 5 NC TEL1 SA U .12932 .02791 .10947 .16725 5 NC TEL1 SB U .14619 .01109 .13300 .15768 5 NC TEL1 N U .08782 .02931 .05470 .12040 5 NC TEL1 SB Q .01042 .00929 .00000 .01836 5 NC TEL1 N Q .00358 .00730 .00000 .01354 5 SC Gate 1N Util .06084 .00180 .05911 .06293 5 SC Gate 2N Util .06136 .00155 .06040 .06324 5 SC Gate 3N Util .06166 .00149 .06037 .06355 5 SC Gate 1SUtil .20686 .00845 .19894 .21582 5 SC Gate 2SUtil .20459 .01013 .19303 .21449 5 SC Gate 3SUtil .20385 .00953 .19154 .21193 5 SC Q Gate 1N Util .00000 .00000 .00000 .00000 5 SC Q Gate 2 N Util .00000 .00000 .00000 .00000 5 SC Q Gate 3N Util .00000 .00000 .00000 .00000 5 SC Q Gate 1S Util .00176 7.6810E-04 .00105 .00235 5
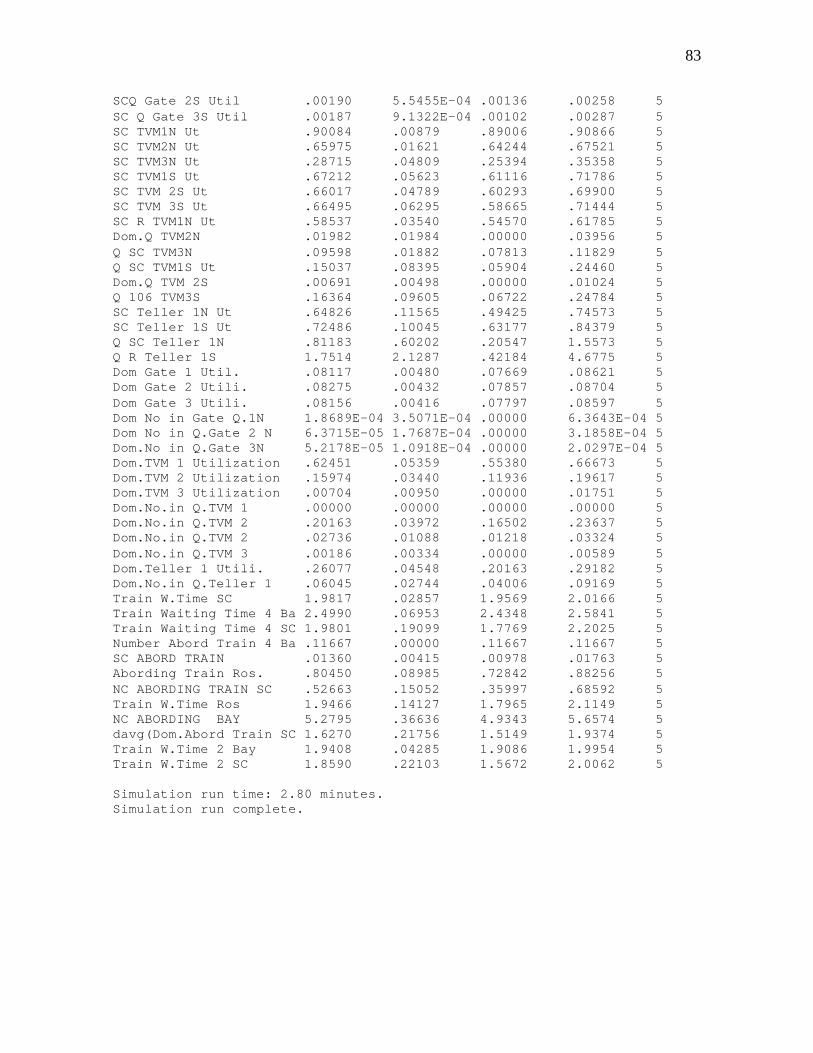
83
SCQ Gate 2S Util .00190 5.5455E-04 .00136 .00258 5 SC Q Gate 3S Util .00187 9.1322E-04 .00102 .00287 5 SC TVM1N Ut .90084 .00879 .89006 .90866 5 SC TVM2N Ut .65975 .01621 .64244 .67521 5 SC TVM3N Ut .28715 .04809 .25394 .35358 5 SC TVM1S Ut .67212 .05623 .61116 .71786 5 SC TVM 2S Ut .66017 .04789 .60293 .69900 5 SC TVM 3S Ut .66495 .06295 .58665 .71444 5 SC R TVM1N Ut .58537 .03540 .54570 .61785 5 Dom.Q TVM2N .01982 .01984 .00000 .03956 5 Q SC TVM3N .09598 .01882 .07813 .11829 5 Q SC TVM1S Ut .15037 .08395 .05904 .24460 5 Dom.Q TVM 2S .00691 .00498 .00000 .01024 5 Q 106 TVM3S .16364 .09605 .06722 .24784 5 SC Teller 1N Ut .64826 .11565 .49425 .74573 5 SC Teller 1S Ut .72486 .10045 .63177 .84379 5 Q SC Teller 1N .81183 .60202 .20547 1.5573 5 Q R Teller 1S 1.7514 2.1287 .42184 4.6775 5 Dom Gate 1 Util. .08117 .00480 .07669 .08621 5 Dom Gate 2 Utili. .08275 .00432 .07857 .08704 5 Dom Gate 3 Utili. .08156 .00416 .07797 .08597 5 Dom No in Gate Q.1N 1.8689E-04 3.5071E-04 .00000 6.3643E-04 5 Dom No in Q.Gate 2 N 6.3715E-05 1.7687E-04 .00000 3.1858E-04 5 Dom.No in Q.Gate 3N 5.2178E-05 1.0918E-04 .00000 2.0297E-04 5 Dom.TVM 1 Utilization .62451 .05359 .55380 .66673 5 Dom.TVM 2 Utilization .15974 .03440 .11936 .19617 5 Dom.TVM 3 Utilization .00704 .00950 .00000 .01751 5 Dom.No.in Q.TVM 1 .00000 .00000 .00000 .00000 5 Dom.No.in Q.TVM 2 .20163 .03972 .16502 .23637 5 Dom.No.in Q.TVM 2 .02736 .01088 .01218 .03324 5 Dom.No.in Q.TVM 3 .00186 .00334 .00000 .00589 5 Dom.Teller 1 Utili. .26077 .04548 .20163 .29182 5 Dom.No.in Q.Teller 1 .06045 .02744 .04006 .09169 5 Train W.Time SC 1.9817 .02857 1.9569 2.0166 5 Train Waiting Time 4 Ba 2.4990 .06953 2.4348 2.5841 5 Train Waiting Time 4 SC 1.9801 .19099 1.7769 2.2025 5 Number Abord Train 4 Ba .11667 .00000 .11667 .11667 5 SC ABORD TRAIN .01360 .00415 .00978 .01763 5 Abording Train Ros. .80450 .08985 .72842 .88256 5 NC ABORDING TRAIN SC .52663 .15052 .35997 .68592 5 Train W.Time Ros 1.9466 .14127 1.7965 2.1149 5 NC ABORDING BAY 5.2795 .36636 4.9343 5.6574 5 davg(Dom.Abord Train SC 1.6270 .21756 1.5149 1.9374 5 Train W.Time 2 Bay 1.9408 .04285 1.9086 1.9954 5 Train W.Time 2 SC 1.8590 .22103 1.5672 2.0062 5 Simulation run time: 2.80 minutes. Simulation run complete.