Embed Size (px)
Citation preview

April 13, 2008
Final Report: AMS Utilities Project
Presented by: Dorothy Cheung
Sam Lin Geraldine Ong Priscilla Tsang
COMM 436 Information Systems Analysis & Design

- 2 -
TABLE OF CONTENTS
Cover Letter .............................................................................................................................................. 3
Executive Summary .................................................................................................................................. 4
Purpose of Document .............................................................................................................................. 5
Description of Project .............................................................................................................................. 5
Background, Objectives and Scope ................................................................................................. 5
Main Project Activities ...................................................................................................................... 6
Information Sources ......................................................................................................................... 6
Special Considerations .................................................................................................................... 7
Description of Business ........................................................................................................................... 7
Energy Supply at UBC ..................................................................................................................... 7
The Organizational Environment ...................................................................................................... 8
Sources of energy and water usage at the SUB ............................................................................ 11
The Information System and Use of Information Technology ........................................................ 11
Analysis of Current Process and The System ....................................................................................... 13
Problems Noted ..................................................................................................................................... 15
Alternatives Considered ......................................................................................................................... 15
Recommendations and Implementation Plan ......................................................................................... 17
Appendices ............................................................................................................................................ 21

- 3 -
COVER LETTER
Sauder School of Business
University of British Columbia
2053 Main Mall
Vancouver, BC V6T 1Z2
April 11, 2008
Ms. Miriam Stein
AMS Sustainability Strategy Coordinator
University of British Columbia
6138 SUB Boulevard
Vancouver, BC V6T 1Z1
Dear Alma Mater Society Sustainability Strategy Coordinator:
As part of our course project on Information Systems Analysis and Design, we are pleased to provide
consultation to the Alma Mater Society on energy and water usage of the Student Union Building (SUB).
Given the limited timeframe for this project, we managed to gather energy and water usage data of the
SUB and provide analysis on our findings.
The following report examines the current processes and the work system, the possible options, our
recommendations and the implementation plan. We hope that our analysis, recommendation and
implementation plan will help AMS improve its current work and IT system and take another step towards
achieving sustainability at the SUB according to the AMS Lighter Footprint Strategy.
Yours truly,
Priscilla Tsang, Dorothy Cheung, Sam Lin, Geraldine Ong
AMS Utilities Project Consultants
- 4 -
EXECUTIVE SUMMARY
In 1990, the University of British Columbia signed the Talloires Declaration as its first commitment to
creating a sustainable environment. Later, the Sustainability Office was established with a vision to put
sustainability into action in campus operations, research, and teachings.
The Alma Mater Society (AMS), having a significant influence on the members of the University, also
committed themselves through adopting the Environmental Sustainability Policy in January 2007. The
Lighter Footprint Strategy (LFS) under the policy was designed to help AMS set constructive targets on
areas that will benefit the most. One of the proposed interactive targets is to reduce energy consumption
and greenhouse gas emissions at the Student Union Building (SUB) by at least 33% by 2020.
Our project is a first step towards achieving the above reduction target. According to our findings, the
problem we have identified is that currently there is no known database to the AMS that will allow them to
track energy and water usage in the SUB. In this project, our team is involved in data collection from
various sources, the analysis of the work and IT system, as well as the exploration of possible database
creation alternatives. The three alternatives examined are: 1) building a brand new database monitoring
system, 2) outsourcing to an energy management firm to build a database and generate analyses for
AMS and 3) maintaining the status quo. Given a low budget and other requirements from the client, we
arrived at our recommendation of maintaining the status quo, which is to take advantage of UBC Utilities
existing ION database and create a customized spreadsheet with Microsoft Excel.
In this report, we will first provide the background, objectives and scope of the project, an overview of the
AMS, our analysis of the current process and the system, the possible options, our recommendations and
the implementation plan. We hope that our recommendation along with the implementation plan will help
improve the existing work and IT system of the AMS and bring sustainability to the SUB.

- 5 -
PURPOSE OF DOCUMENT The following project report will:
- Define objectives and scope of the project, the main activities and information sources and the
specific limitations
- Identify relevant work system elements, business processes, existing IT technologies/
applications and provide detailed analysis
- Provide the alternatives considered and our recommendation for implementation
DESCRIPTION OF PROJECT
Background, Objectives and Scope The proposed project includes designing a database system for the AMS to record the energy (steam,
gas, electricity, water) usage for the UBC Student Union Building. The information will be analyzed to
provide solutions for energy reductions in specific areas of the building. The proposed system is set to
reduce Greenhouse Gas emissions and to lower energy consumption as mandated by the University.
It is expected that the traditional SDLC development methodology and OOEM conceptual modeling will
be used for the project. We will look into details on how energy and water is distributed and used in the
SUB during different times of the day. The collected energy and water use data will be represented on
spreadsheets that will be act as inputs for the new database for the SUB. The new database designed will
contain information on the source and usage of energy and water, the associated cost and Greenhouse
Gas emissions. The database will allow the AMS to closely monitor and review their usage in order to
meet certain reduction initiatives.
Information from multiple sources will be integrated (e.g. heating, room bookings) in order to determine
the optimal energy reduction approach. In addition, we will provide recommendations on how to extract
the information from the database and relate the energy usage information to the members of the
community, either through online portals or throughout the school’s premises. The information will be
made publicly available to increase the awareness of and advise students and other faculty members on
primary areas of improvements.

- 6 -
Main Project Activities Data Collection on SUB energy and water use
Purpose: to collect any data relevant to SUB energy and water usage and gain an understanding of the business
Outcome: to understand how energy and water is being used at the SUB and the relevant monitoring process as well as client’s requirements for a database
Deliverable: Usage Data, Spreadsheets
Responsibility: - interview with AMS Sustainability Strategy Coordinator to understand her requirements for the project/database and gather energy & water use information for businesses owned by AMS
- interview with UBC Energy manager and the Utilities Department
Data Analysis
Purpose: to analyze data collected from interviews, information sources (metering website/reports/internal documents) and to provide solutions
Outcome: - analyzed data will provide insight to the “as is” work system and processes - possible areas for improvement will be explored
Deliverable: process models of business
Responsibility: - analyze collected data - discuss problems identified and areas for improvement - suggest possible solutions to be further studied
Exploration of Alternatives and Recommendations
Purpose: to examine the possible alternatives of database creation using the data collected (metering websites and spreadsheets) for AMS to monitor and review their usage
Deliverable: a list of possible alternatives and our recommendation for implementation
Responsibility: - identify the cost of energy and water usage - identify the methods to calculate the associated Greenhouse Gas emissions
using the energy & water data - explore possible options that will allow the creation of such database o e.g. meet and discuss with Small Energy Group project manager (who
have been working on similar databases for UBC) on the possible implementation of a database specific for the SUB (the associated requirements, steps and costs)
- Provide related information on implementation for client
Information Sources
Stakeholders: Internal Documents External Information
• AMS Sustainability Strategy Coordinator (Miriam Stein)
• UBC Energy Manager (Orion Henderson)
• UBC SEEDS Project Manager (Brenda Sawada)
• AMS Facilities Manager (Jane Barry)
• AMS Designer (Michael Kingsmill)
• AMS IT Staffs
• Energy and water metering website
• UBC Sustainability website • SUB floor plan • UBC Sustainability reports • SUB Energy Assessment
Report from last year • Utilities bills for the SUB • Spreadsheets for calculating
Greenhouse gas emissions
• Details and costs of acquiring software for creating databases and automated reporting system
• Natural Resources Canada website (to identify the conversion factors for Greenhouse gas emissions)

- 7 -
Special Considerations
Below are some of the constraints to be considered in the course of this project:
• Time constraint: Due to the limited timeframe of the project, we will not be able to carry out the
implementation. Instead, we will focus on the analysis and design which will act as a guide to
implementation for the AMS.
• Scope constraint: Due to the scope and time constraint, we will not be able to expand our
project scope to look at the other alternatives for energy reduction at the SUB (e.g. the Building
Management System at the SUB)
• Constraints from related activities elsewhere: We become aware midway though the project
of the referendum in March 2008 relating to SUB Renewal, which could entail reconstruction or
renovation to the existing SUB. Therefore, we are unable to guarantee our current analysis and
design (based on the existing SUB) will be applicable the new or renovated SUB. And due to the
uncertainty and non-existence of a new SUB and the limitations in time and scope, we are unable
to provide analysis and design on energy and water use for a potential new SUB.
DESCRIPTION OF BUSINESS
Energy Supply at UBC
Electricity at high voltage is transmitted from the BC Hydro Sub Station to the UBC Utilities Department,
as illustrated in Figure 5. The high voltage electricity is then transformed into low voltage (110V) by the
UBC sub-stations’ transformers. The low voltage electricity, monitored by a central meter in each building,
is then supplied to each building on campus.
Water from the Greater Vancouver Regional District (GVRD) and gas from Terasen are fed into the
boilers in the UBC Power House, generating steam. Steam is then supplied to each building on campus
and monitored by a central meter in the individual buildings. Hot water is produced by the heat exchanger,
which uses the steam to heat up water in the building.
Greenhouse Gas is emitted where energy is produced, at the BC Hydro Sub Station and the UBC Power
House. For our project, the Greenhouse Gas that is to be evaluated is CO2, based on the amount of
energy consumed in a year using a conversion factor.

- 8 -
The Organizational Environment
A) The Organization
The Nature of Organization:
Name of work system: UBC Alma Mater Society (AMS)
Customers
• Students • Businesses • Professors • Residents • Visitors • UBC community
Products and services
• Student Clubs • Career counseling • Tutoring service • Rent service • Communications consulting and design
services • Copy service • Health/dental plan service • Non-academic courses • Exam database • Dining • Travel agency • Ticket Booking • Other businesses
Work practices
• Allow student clubs to operate • Provide career advice, counseling service, communications consulting and design services,
conference services, rent service • Provide old examinations for courses for students • Conduct non-academic courses • House a theatre for movie entertainment • Provide study rooms and auditoriums for students to interact and hold activities • Own and operate businesses - dining, travel, copy, and various services • Allow businesses to operate
Participants
• Students • Businesses • Professors • Residents • Visitors • AMS executives • AMS employees • UBC community
Information
• Databases • Advertisements • Utilities records • Financial records • Business registration
records
Technologies
• Telephones • Computers • Software tools • Internet • Email

- 9 -
Short History:
The UBC Alma Mater Society (AMS) was founded on October 15, 1915, the same year as the opening of
the University of British Columbia. Students met and adopted constitution for new student society.
Sherwood Lett was elected as the first AMS President. The first student clubs at UBC were established in
1915-16. In 1968, the current Student Union Building (SUB), also largely supported by AMS funds, was
opened September 26, 1968. The SUB consists of three levels – lower, main and second (please refer to
Figure 1 for SUB floor plan).
Important Measures:
The AMS represents more than 44,000 UBC students and students at affiliated colleges. Students own
and operate a number of businesses through the AMS. Over 400 students are employed and paid in a
total of $2 million in student wages. Student services, as illustrated in the work system snapshot above,
are supported by revenues from AMS businesses.
B) The Environment: The AMS operates student services, resource groups and clubs in an academic environment. Its mission
is to improve the quality of the educational, social, and personal lives of the students of UBC by
promoting high-quality student learning and advocating interests of the students and those of UBC and
post-secondary education.
The AMS is administered by the AMS Executive, which consists of five members who are elected
annually by UBC students. The Student Council, which comprises the Executive members and members
from all the constituent societies, governs the AMS and determines its overall direction each year and its
priorities and activities.

- 10 -
C) Important Relevant Business Processes
Operation of student clubs and provision of services
The student clubs have meeting rooms within the SUB where they conduct weekly gatherings or hold
scheduled meetings to plan for the individual club’s activities. The usage of the meeting rooms are
controlled by the student club committees, and hence the electricity usage of the meeting rooms. The
electricity usage of each room is monitored by a central meter that monitors the overall electricity usage of
the SUB.
The service groups, such as the counseling service group, design services group, and rent service group,
occupy rooms in the SUB where consultation services are rendered to the clients. These individual
groups have similar control over the usage of their individual work spaces and thus control the electricity
usage of those rooms. The electricity and energy usage is similarly monitored by the central meter the
monitors the general energy usage of the SUB.
Theatre for movie screenings
The theatre within the SUB screens movies from Mondays to Fridays from 9:30 a.m. to 5 p.m. and
Saturdays from 9:30 a.m. to 4 p.m. Its operation is controlled by the AMS, in deciding when and for how
long the theatre should operate. The electricity, energy and water usage of the theatre are monitored by
the central meters for electricity and water that are overseen by the AMS. The central meters for water
and electricity monitor the general water and energy usage of the SUB at the same time.
Provision of study rooms and auditoriums
These areas are set aside for students to do group studying or hold activities and events. The study
rooms are usually available 24 hours for students to hold study sessions late into the night, while the
auditoriums are available and open upon request by student groups or faculty members who wish to
utilize them for functions or activities. The energy and electricity usage is also monitored by the central
meter as mentioned before.

- 11 -
Operation of businesses
The dining and retail businesses operating within the SUB are mainly owned by the AMS, with some
businesses operated by students. The energy and water usage of the individual tenants are thus
monitored mainly by the AMS, using the central meters for both electricity and water as mentioned before.
Businesses usually operate from Mondays to Fridays for about 8 hours and on Saturdays for about 5 to 6
hours for certain stores like The Outpost. Food stores are usually closed on Saturdays and Sundays. All
stores are closed on Sundays and public holidays.
Sources of Energy and Water Usage in the SUB
Electricity Water Source of Usage
Food Outlets
• E.g. Subway, A&W, Koya, PitPub,
Blue Chip Cookies X X
• Cooking Equipment
• Stoves
• Dishwashers
Other SUB Businesses
• E.g. The Outpost, Copyright,
TravelCuts, Theatre X
• Depends on type of
business (some examples:
computers, cash tills)
Offices
• E.g. AMS staff offices, student
representatives offices X
• Lights
• Photocopiers and Printers
• Computers
Clubs
• approximately 90 clubs that own
offices in the SUB
• E.g. Aqua Society, Photo Society,
Table Tennis Club
X
• Lights
• Computers
Function Rooms and Study Spaces
• E.g. SUB Ballroom, Auditorium X
• Lights
• Television
• Computers and/or
Projectors
Public Washrooms and Water Fountains X X
• water sinks
• flush toilets
The Information System and Use of Information Technology
A) Main IT Applications
An Information Technology system was needed by UBC Utilities to remotely monitor the energy usage of
all core and ancillary buildings in the university. The demand for such a system was largely due to the

- 12 -
university’s commitment to the ECOTrek initiative in 2002 – to reduce the energy footprint of the campus.
The extensive manual labour needed to gather such information from all the buildings also prompted the
installation of the automated water, steam, and electrical meters.
The users of the system included building managers, classroom services, UBC Plant Operations, UBC
Utilities, students, staff/faculty members.
Power and energy meters, ION 7330, from Schneider Electric were installed in all the buildings in the
project and which is able to collect the electrical consumption, and connected to the central operations
software, ION Enterprise, via Ethernet cables on the Local Area Network. The centralized software is able
to manage the information from all the meters and display it online. Information is stored in a Sybase SQL
database server, which information can be retrieved by any user via ODBC or OPC with the appropriate
connection software.
B) Evaluation of Existing Systems
The only system that is currently fully implemented is the UBC Utilities Remote Metering Site
(http://142.103.191.161/ion/). At the moment, it contains energy meters in over 70 buildings that are on
campus. It provides 15 minute interval real-time monitoring of electricity, water, and steam. It is able to
store the information in a database 24 hours a day, 7 days a week. The information dates back to March
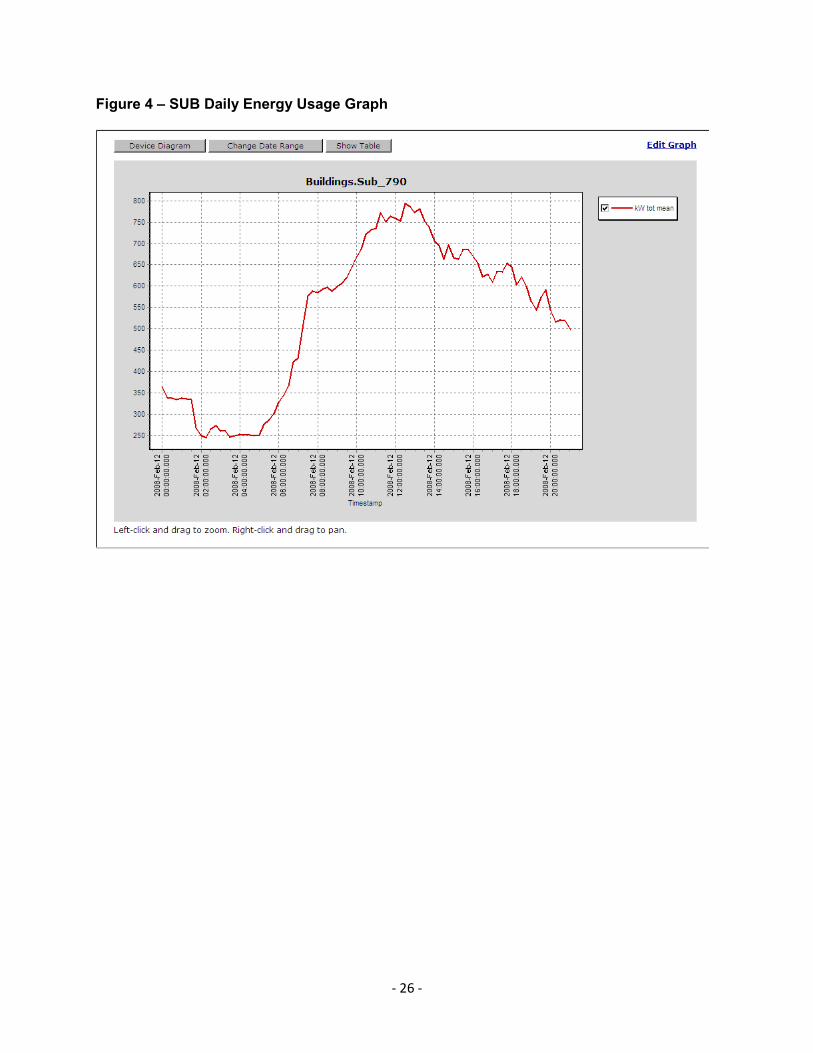
29, 2006. Any user with the website address is able to view this information, as well as plot the specified
time interval on an automatically generated graph (see figures 2 – 4).
This information is certainly valuable to the scope of our project as the data collection has already been
implemented. However, currently the meters only provide a general overview of the buildings, including
the SUB – which contains many different businesses and users of the facility. We have determined that in
order to propose any valuable and viable solutions to our customer, a more detailed level of data
collection is necessary (either by means of manually checking individual meters or intelligently estimating
the energy usage).

- 13 -
C) Constraints to be considered
The database which stores the historical remote metering information is highly secure, and only a few
members of UBC Utilities has access to read and write directly from the database. An automated method
to gather this information is not possible without the use of proprietary OPC connection, which limits our
ability to manipulate data and calculate trending values without manual intervention.
ANALYSIS OF THE CURRENT PROCESS AND THE SYSTEM Elicitation
The elicitation of requirements is carried out mainly through interviews and reviews of documentation.
Interviews with stakeholders provided us with most of the information about energy and water usage at
the SUB and how they are monitored. Interviews is our main elicitation method since we are able to
speak with the people directly involved in the process and ask them questions immediately if clarification
is needed. Although extensive time commitment is required for meetings, but this process is more
beneficial that it ensures information collected are clearly understood. This is especially crucial in systems
development as inaccurate requirements or information in early stages could be costly to fix later. Despite
carrying out interviews, we also reviewed documents to understand the background of the client’s need
for system development. In our project, we reviewed both the University’s sustainability policies and
AMS’s Lighter Footprint Strategy to give us a background to understand AMS’s need for a database to
monitor energy and water usage at the SUB for their reduction initiatives. The requirements identified for
the database are as follows:
• user-friendly and easy to use
• ability to show related cost and associated greenhouse green emissions
• ability to display usage data in the correct unit (i.e. electricity – kilowatt hours, water - cubic meter,
steam - pounds)
• ability to display graphs of usage in daily, monthly and yearly view, so that users will be able to
make usage comparisons between day and night and between summer term and winter term
• low cost of implementation (budget is approximately $20,000)

- 14 -
Analysis
According to the requirements we collected from our client, we considered the following AP (Analysis and
Possibilities) question with regards to the technology element in the work system:
AP6: How might better technology help?
Work System Principles #15: Use cost effective technology #16: Minimize effort consumed by technology
Diagrams and Methods
Performance Indicators • Training time to ensure proficiency • User-friendly programs • Compatibility with existing technologies • Maintainability • Reliability • Cost vs. performance
Strategy Decisions
• User-friendliness of technology • System cost • Maintenance
Stumbling Blocks and Risks
• Expensive software development • Lack of trained IT personnel to maintain
new technology • Limit on budget
Possibilities for Change • Develop and install a database in-house by
hiring a database developer and maintain the database by hiring a database administrator
• Outsource database development and maintenance to a specialized company
• Utilize the existing database
Specification
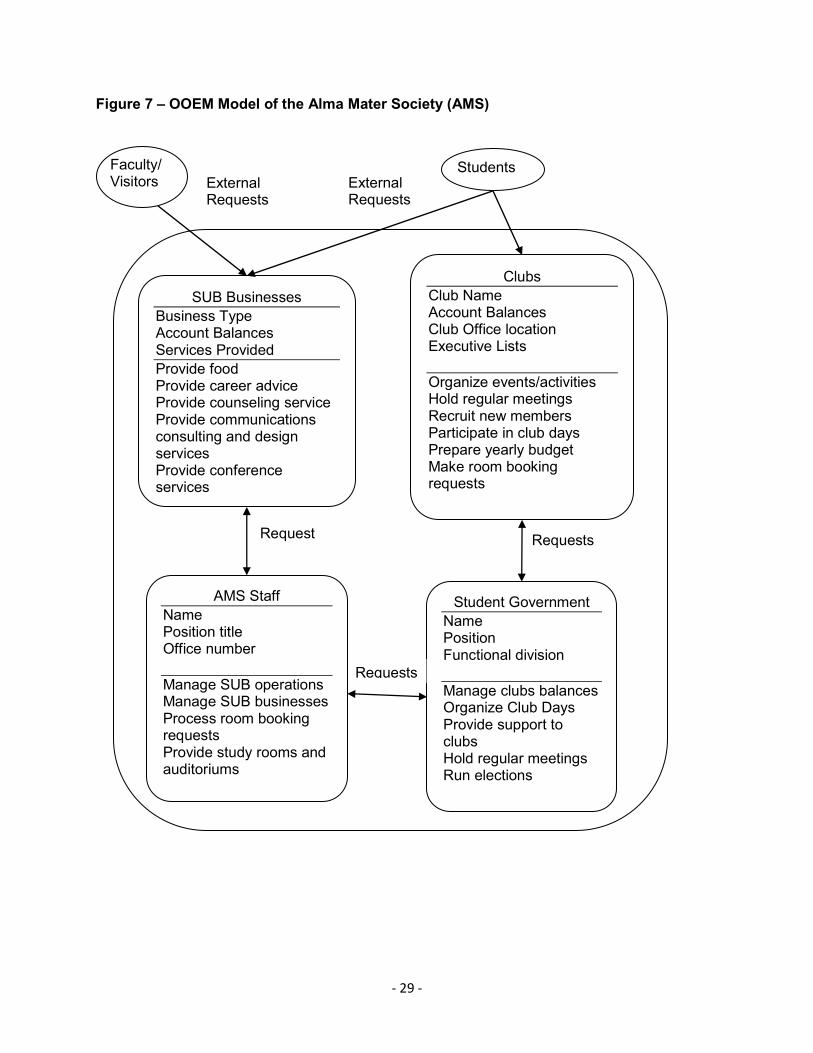
To model AMS, we used Object Oriented Enterprise Modeling since it is more important to understand
how AMS used energy and water in the SUB. It will be helpful to model the different services provided by
the AMS instead of looking into details of the various business processes. Although the AMS offers a
wide range of services to students, faculty staff and clubs, we have only listed a few examples of these
services for illustration purposes (please refer to Figure 7 for the model).

- 15 -
Validation
Throughout the project, we validated information accuracy and completeness with the client through
emails and interviews. For example, we defined the scope of our project to our client through email,
clearly stating our responsibilities and the deliverables to expect from this project.
PROBLEMS NOTED
The main problem identified for our project is that there is no known database to the AMS that allows
them to monitor and track energy and water usage in the Student Union Building.
Since the AMS does not have its own current database system in place to track the water and energy
usage of the SUB, we will be looking at the possible alternatives for database creation to include the
required features and graphs that will help facilitate monitoring in future by the AMS.
ALTERNATIVES CONSIDERED
We are proposing these 3 alternative solutions after taking into consideration the constraints to this
project and the various findings we have gathered: (Please refer to Figure 8 for details on each option)
1) Build a brand new database monitoring system
In order to build a new database for the AMS to monitor the energy and water usage at the SUB,
these factors have to be considered:
• Tight budget given to project—as such, most decisions made regarding which software
product to purchase will be based mainly on the cost of the product.
• Volume of relevant data and scale of project—this database is used to contain a smaller
volume of data sets, compared to the usual enterprises, and the scale of this project is
smaller compared to the other projects AMS is currently executing. As such, this project only
requires a database that has adequate capacity for the given volume of data sets and has
sufficient functions to perform the basic queries.

- 16 -
Hence, keeping the above factors in mind, we have decided to recommend these products and steps
to take to build this database system:
• MySQL Enterprise (Basic): $599.00 per server
o Main database software package that enables storage of data and generation of
relevant analyses as supported by available functions
• OPC Systems Windows Service: $795.00 per license
o Data logging to SQL Server, SQL Server Desktop (MSDE), Access, Oracle, mySQL,
and CSV files.
o Unique data handling from local and remote services
o Runs as a Windows Service and comes with free configuration application to allow
on-line modifications from local or remote systems
• Dell PowerEdgeTM
SC1430: starting from $949
o Server required to host database
• Hire a Database Administrator with an estimated salary of less than $33,380 per year to
maintain the database for future use and generate the relevant analyses for AMS
• Hire a SQL Database Programmer for an estimated cost of $8,000 to $10,000 for 2 to 3
months to program the database software to suit the requirements of AMS
As such, in building a brand new database for the AMS, the total estimated cost incurred would be
$45,742.
2) Hire an energy management firm to build a database and generate analyses for AMS
The proposed firm would be Small Energy Group (SEG) in this case because SEG has already been
hired by UBC to build a database for the other buildings on campus such as the libraries and the
university hospital, so it would be more convenient and cost-efficient to hire SEG for this project since
they have the relevant infrastructure in place for the database, and all they have to do is to create a
similar database for the SUB to monitor its energy and water usage as required by the AMS.
SEG is an energy management group that provides solutions to address the energy management
needs of building managers. Their approach to energy efficiency is to focus on improving energy

- 17 -
usage in a way that is not disruptive to the rest of the organization. They have advisors who have
experience in the energy sector, as well as other professional staff who have received training in
areas such as electrical engineering and business management. As such, SEG would have adequate
expertise and skills to provide the necessary advice to fulfill the requirements of the AMS.
As SEG is a consulting firm, we are not able to come up with a definite cost for hiring them unless a
concrete contract has been formed between the AMS and SEG. Thus, we have estimated the cost of
hire to be around $30,000-$35,000, and the contract would probably include meter and data logging
installations, a customized website for the AMS to broadcast its findings and data, and consultation
and maintenance services.
3) Maintain the status quo
The last solution proposed would be for AMS to utilize the existing database, which is maintained by
the utilities department, to extract the data that they need for energy and water usage, and using an
additional Excel utility, prototyped by our group, to analyze the relevant data. This approach would
not cost AMS anything as they already have the necessary software installed into their systems.
However, this approach would require an administrator to create and maintain the utility as well as to
generate the necessary analyses from the worksheets. AMS may need to hire an additional IT
assistant or administrator if they do not have the necessary human resource to manage this
additional workload. Hiring an additional personnel would cost AMS approximately $24,000 or less a
year, since the system created does not need to be handled by someone highly proficient in database
systems.
RECOMMENDATIONS AND IMPLEMENTATION PLAN
Based on the alternatives stated above, we considered the following RJ (Recommendation and
Justification) questions to arrive at our recommendation.
RJ1: What are the recommended changes to the work system?
§ Utilize the current database system (from the ION website) and extract required data from that
database instead of creating a new database for the SUB

- 18 -
§ Make use of Excel utility to generate relevant analyses
§ Lower cost alternative is preferred due to the given tight budget, hence adopting a status quo
position should be the preferred solution
RJ2: How does the preferred alternative compare to other alternatives?
§ The preferred alternative is more cost and labor efficient since the person attending to the current
database system and generating the relevant analyses in Excel does not need to be highly
proficient in IT
§ As presented in the pricing table in the appendix (Figure 8), the preferred alternative incurs the
lowest cost out of all 3 alternatives
RJ3: How well do recommended changes address the original problems and opportunities?
§ Originally, a database was required by the AMS to monitor the SUB’s energy and water usage
and to generate the relevant analyses for AMS to study the usage patterns of energy and water
so that they can find ways to reduce future usage of energy and water
§ Currently, the proposed solution includes both the database and the excel spreadsheet that helps
them to generate the analyses that they want and allows them to do so without additional cost
§ Given the tight budget and consideration for future projects that AMS may be involved in that
contribute directly towards helping them implement solutions to reduce future energy and water
usage, the solution to remain status quo would be the best approach they should adopt
Recommendation
After careful consideration of the three possible alternatives, we would recommend the status quo option
to AMS. By implementing the status quo option, we will be utilizing the current energy tracking system to
provide a snapshot energy/cost figure before efforts to reduce the energy usage in the SUB are
implemented. Information included in the generated report contains the total electricity, steam, and water
usage over a day or an entire year and the related costs. It also includes the estimated amount of
greenhouse gas emissions associated with producing the energy. This snapshot can be used as a
comparison baseline figure as more snapshots are taken throughout the course of the energy-reduction
phase, and once more at the end, when determining whether sustainability goals have been met.

- 19 -
Implementation Plan
According to our recommendation of maintaining the status quo, we will provide information on each of
the seven stages of implementation:
1) Coding
Through prototyping, we have found that most cost-saving way to design such a utility is through the use
of existing software, instead of building a completely new interface. We are recommending that the utility
be built within Microsoft Excel, with the use of macros coding. The program allows us to easily manipulate
number data, and can generate charts from a series of numbers to view trending patterns. These are
basic, but powerful features that have been used extensively by many, and allow us to save time and
money developing these features in a new program. In addition, many people have already used Excel
before and are familiar with its operation.
Visual Basic for Applications (VBA) is the language used for macros coding in Excel. It is compiled at
runtime, so the programmer is able to code on any computer (Windows or Mac) that has Microsoft Excel
installed for maximum portability. The coder will need to possess general coding knowledge, as well as a
good understanding of Excel, the object models involved, the basic functions one can perform on a
spreadsheet. The code will be written from scratch, as there are no similar tools that we know of that
currently does this type of analysis, nor is there one customized for use with the current ION website.
2) Testing
Testing of the utility will be done by the developer in Visual Basic Editor within Excel. Since the language
is compiled at runtime, the developer will need to be familiar with using the built-in debugger to step
through the code manually as it runs. The editor also automatically checks for valid coding syntax as each
line of code is written, lowering the risk of leaving syntax errors unnoticed and building up until runtime.
After all the individual functions have been tested, a small team of 1-3 beta-testers will be needed to
verify its functionality and any GUI-related or logical errors.

- 20 -
3) Installation
The final product, an Excel file, will be deployed to the end users, who are mainly the managers. It is
small enough to be distributed via CD, memory stick, or e-mail with appropriate compression software
(ZIP). It will be a direct installation, since there was not previously any energy analysis utility installed.
Also, the file is self-contained, so it will not cause any conflicts with any other software.
4) Documentation
The developer of the utility shall be required to produce the proper user documentation such that any user
of the utility will be able to use it without much assistance. It will contain step-by-step instructions on how
to generate, saving, and comparing a basic report, as well as supplemental screenshots to help the user
understand which cells are user-modifiable.
5) Training
Since the utility is very straightforward, the developer can hold a one-time tutorial session where users of
the spreadsheet utility can learn hands-on and be familiarized with the interface.
6) User support
Since one of the goals of this recommendation is also to reduce the cost as much as possible, the end-
user support will be very limited.
The existing ION website database (data) will be supported and managed by the UBC Utilities
Department.
7) Maintenance
Depending on the agreement with the developer, the code may or may not be released to the client. If it is
not, fixing any bugs not spotted before the acceptance testing or implementing new features may incur
additional costs.

- 21 -
Appendices:
Project Consultants:
Name Telephone Email Address
Priscilla Tsang (Coordinator) 604-339-3488 [email protected]
Sam Lin 604-808-5126 [email protected]
Dorothy Cheung 604-603-7892 [email protected]
Geraldine Ong 778-838-2039 [email protected]
Important Sources Name: Miriam Stein Position: AMS Sustainability Strategy Coordinator Email: [email protected] Name: Orion Henderson Position: UBC Climate Change and Energy Manager Email: [email protected] Name: Brenda Sawada Position: UBC SEEDS Project Manager Email: [email protected] Relevant Information/Support Documents (please refer to the next few pages)

- 22 -
Figure 1a: SUB Floor Plan - Lower level

- 23 -
Figure 1b: SUB Floor Plan - Main Level

- 24 -
Figure 1c: SUB Floor Plan - Second Level

- 25 -
Figure 2 – SUB Energy Usage Data
Figure 3 – SUB Historical Energy Usage from Database Website
- 26 -
Figure 4 – SUB Daily Energy Usage Graph

- 27 -
Figure 5 – Energy Supply at UBC

- 28 -
Figure 6 – “Clean-Air Cool Planet” Spreadsheet Calculator (for calculating Greenhouse gas emissions)
MODULE Input
WORKSHEET Data
UNIVERSITY
On-Campus Co-generation Plant
Fiscal Year Enter fuel use and plant efficiencies for the On-Campus Cogeneration Plant
Residual
Oil
(#5 - #6)
Distillate
Oil
(#1 - #4)
Natural
Gas Propane Coal
Electric
Output
Steam
Output
Electric
efficiency Steam Efficiency
Gallons Gallons MMBtu Gallons Tons kWh kWh % %
1990
1991
1992
1993
1994
1995
1996
1997
1998
1999
2000
2001
2002
2003
2004
2005
2006
2007
2008
2009
2010
2011
2012
2013
2014
2015
2016
2017
2018
2019
2020
- 29 -
Figure 7 – OOEM Model of the Alma Mater Society (AMS)
Requests
AMS Staff
Name Position title Office number
Manage SUB operations Manage SUB businesses Process room booking requests Provide study rooms and auditoriums
SUB Businesses
Business Type Account Balances Services Provided
Provide food Provide career advice Provide counseling service Provide communications consulting and design services Provide conference services
Clubs
Club Name Account Balances Club Office location Executive Lists
Organize events/activities Hold regular meetings Recruit new members Participate in club days Prepare yearly budget Make room booking requests
Student Government
Name Position Functional division
Manage clubs balances Organize Club Days Provide support to clubs Hold regular meetings Run elections
Requests
Students Faculty/ Visitors External
Requests External Requests
Requests

- 30 -
Figure 8 – Three possible alternatives of database creation Alternative 1 - Build a brand new database monitoring system:
Database Support (License) Price (per year) Specifications RecommendationMySQL Enterprise (Basic) $599.00 per server Monthly Rapid Updates Recommended Pdt
Quarterly Service Packs Software Updates Service
Technical Alerts
MySQL Enterprise Server
Web-based Case Mgmt Support
Knowledge Base SupportActive Lifecycle Support
Data Logging for SQL server (License) Price (per year) Specifications RecommendationOPC Systems Windows Service $795.00 per license Activates 1 OPC Systems Service
for support of local data logging
from local and remote OPC Systems Services (per license)
Recommended Pdt
Supports free connections to OPC
Servers supporting OPC Data
Access Specification 2.x or 3.0
Data source for each Tag can be
a fixed value, local or remote OPC
Item, or another local or remote
Tag ParameterImplements .NET Remoting thus
eliminating the need for DCOM
configuration by connecting all
OPC Servers locally with each
OPC Systems Service
Supports on-line modification
while the system is running
Server (to host Database) Price Specifications RecommendationDell PowerEdgeTM SC1430 Starting From $949 Dual Core Intel® Xeon® 5130;
4MB Cache, 2.0GHz, 1333MHZ
FSB
Recommended Pdt
Memory: 1GB 667Mhz(2x512),
Single Ranked DIMMs
1st Hard Drive: 80GB, SATA, 3.5-inch, 7.2K RPM Hard Drive
On-Board Single Gigabit Network
Adapter
3yr Basic Support: 5x10 HW-Only,
5x10 NBD Onsite
Database Developer / Administrator SalaryDatabase Administrator Less than $33,380 per year
(Earnings of lowest 10% based on
statistics compiled by U.S. Bureau
of Labor Statistics, 2004)
Database Programmer SalarySQL Database Programmer $40,000-$70,000 annual
About $8,000-$10,000 for 2
months
Total estimated cost of building (1st year)
Cost for subsequent years (each additional year)
Maintain storage systems
Monitor system’s performance
Run networks to maximise user efficiency
Job Scope
Build
Job Scope
$45,724.00
$34,774.00
Communicate with non-technical end-users
Develop software in C, SQL, PHP, 4GL
Write documents and user guides
Implementation training and product support

- 31 -
Alternative 2 - Hire an energy management firm to build database and generate analyses for AMS:
Buy Consulting Firm Fees
Small Energy Group About $30,000-$35,000
Meter and Data Logging installations
Customized Website
Consultation and Maintenance Fees
Monthly Hosting Fee <$100
Total estimated cost of hire $30,000-$35,000
Alternative 3 – Maintain the Status Quo:
Status Quo Database Support Price
Database on ION website (maintained by Utilities Department) $0
Excel worksheet for data analysis (created by Sam) $0
IT/Database Administrator (may or may not be required) Salary
IT Administrator/ Assistant <$24,000 per year
Total estimated cost (per year) <$24,000

- 32 -
Figure 9 – Prototype Energy Analysis Utility data worksheet

- 33 -
Figure 10 – Prototype Energy Analysis Utility analysis worksheet
Figure 11 – Prototype Energy Analysis Utility sample generated chart